Zip Codes with the Highest Percentage of Population Employed in Legal Services & Support in Conroe, TX
RELATED REPORTS & OPTIONS
Legal Services & Support
Conroe
Compare Zip Codes
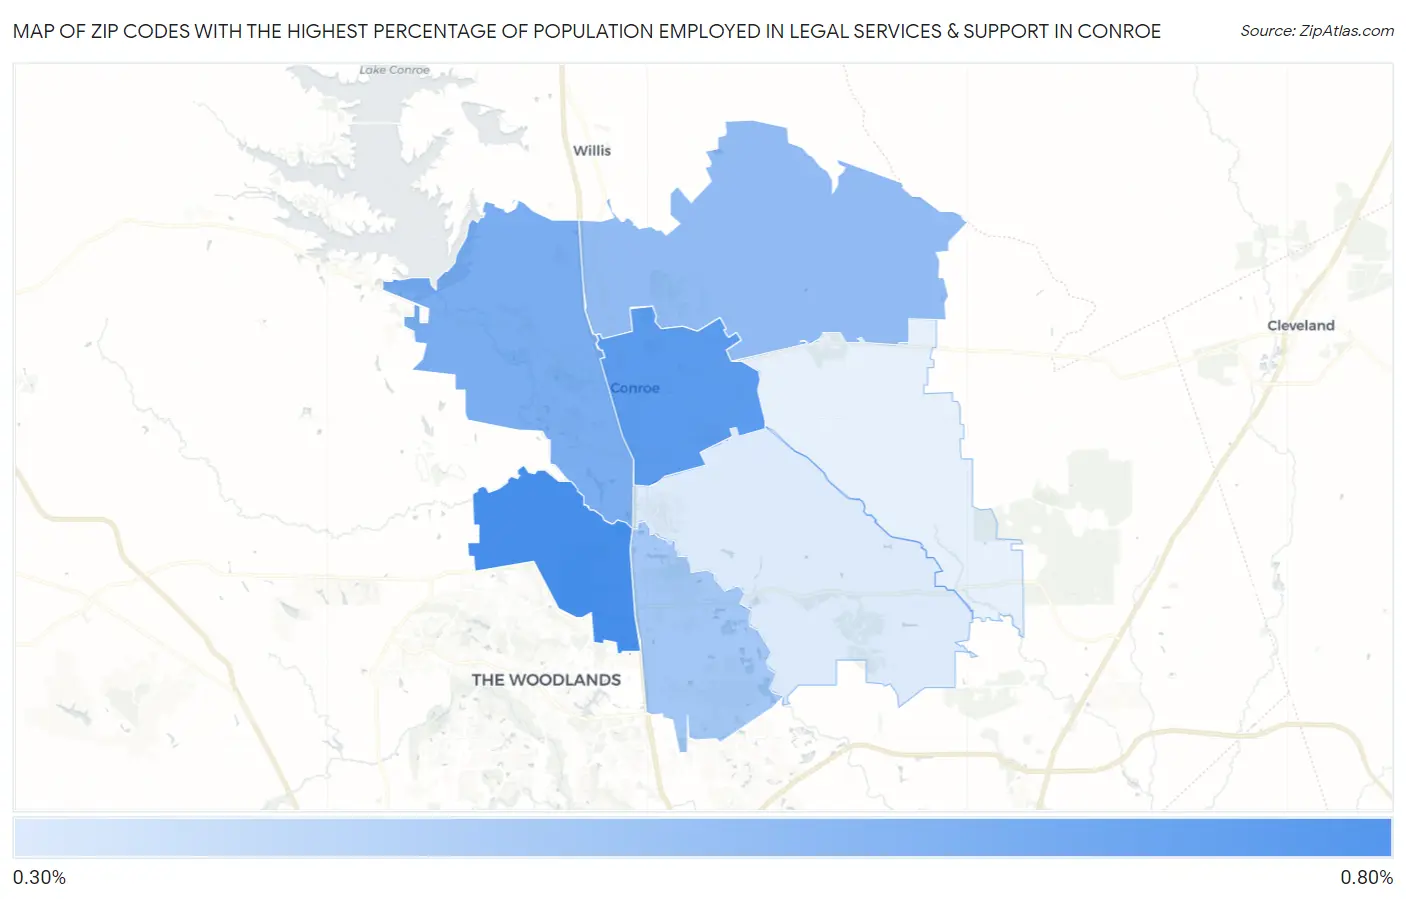
Map of Zip Codes with the Highest Percentage of Population Employed in Legal Services & Support in Conroe
0.0%
0.80%
Zip Codes with the Highest Percentage of Population Employed in Legal Services & Support in Conroe, TX
| Zip Code | % Employed | vs State | vs National | |
| 1. | 77384 | 0.76% | 1.0%(-0.245)#548 | 1.2%(-0.421)#9,792 |
| 2. | 77301 | 0.71% | 1.0%(-0.298)#588 | 1.2%(-0.473)#10,307 |
| 3. | 77304 | 0.62% | 1.0%(-0.383)#664 | 1.2%(-0.559)#11,197 |
| 4. | 77303 | 0.57% | 1.0%(-0.443)#702 | 1.2%(-0.619)#11,886 |
| 5. | 77385 | 0.52% | 1.0%(-0.490)#731 | 1.2%(-0.666)#12,392 |
| 6. | 77302 | 0.36% | 1.0%(-0.644)#875 | 1.2%(-0.820)#14,279 |
1
Common Questions
What are the Top 5 Zip Codes with the Highest Percentage of Population Employed in Legal Services & Support in Conroe, TX?
Top 5 Zip Codes with the Highest Percentage of Population Employed in Legal Services & Support in Conroe, TX are:
What zip code has the Highest Percentage of Population Employed in Legal Services & Support in Conroe, TX?
77384 has the Highest Percentage of Population Employed in Legal Services & Support in Conroe, TX with 0.76%.
What is the Percentage of Population Employed in Legal Services & Support in Conroe, TX?
Percentage of Population Employed in Legal Services & Support in Conroe is 0.58%.
What is the Percentage of Population Employed in Legal Services & Support in Texas?
Percentage of Population Employed in Legal Services & Support in Texas is 1.0%.
What is the Percentage of Population Employed in Legal Services & Support in the United States?
Percentage of Population Employed in Legal Services & Support in the United States is 1.2%.