Zip Codes with the Highest Percentage of Population with a Degree in Business in New York
RELATED REPORTS & OPTIONS
Business
New York
Compare Zip Codes
Map of Zip Codes with the Highest Percentage of Population with a Degree in Business in New York
0.0%
100.0%
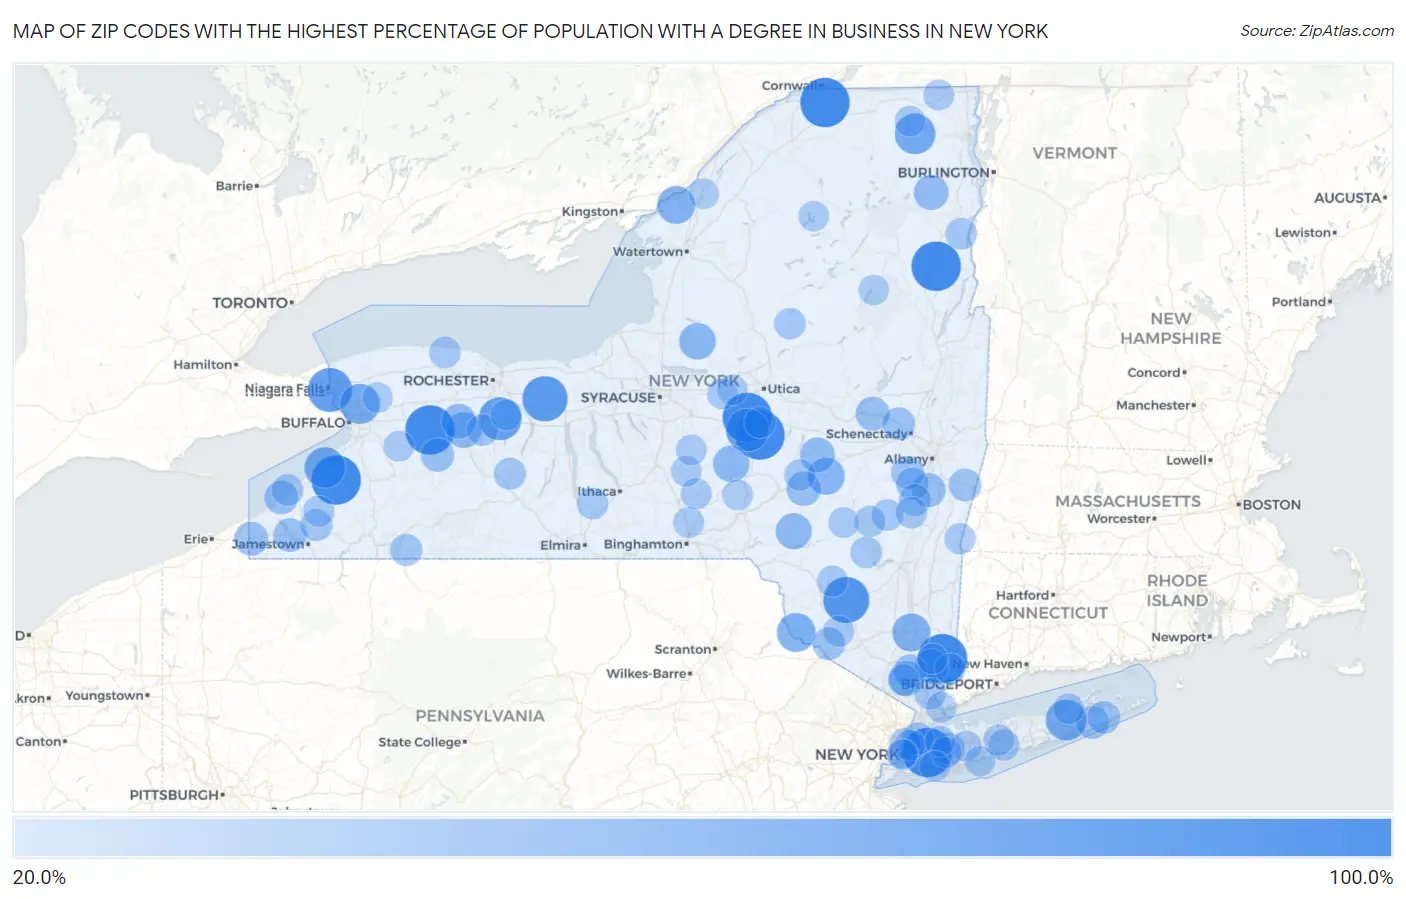
Zip Codes with the Highest Percentage of Population with a Degree in Business in New York
| Zip Code | % Graduates | vs State | vs National | |
| 1. | 11439 | 100.0% | 17.8%(+82.2)#1 | 19.5%(+80.5)#2 |
| 2. | 13364 | 100.0% | 17.8%(+82.2)#2 | 19.5%(+80.5)#70 |
| 3. | 10519 | 100.0% | 17.8%(+82.2)#3 | 19.5%(+80.5)#108 |
| 4. | 12872 | 100.0% | 17.8%(+82.2)#4 | 19.5%(+80.5)#123 |
| 5. | 14168 | 100.0% | 17.8%(+82.2)#5 | 19.5%(+80.5)#128 |
| 6. | 14039 | 100.0% | 17.8%(+82.2)#6 | 19.5%(+80.5)#134 |
| 7. | 13455 | 100.0% | 17.8%(+82.2)#7 | 19.5%(+80.5)#151 |
| 8. | 13649 | 100.0% | 17.8%(+82.2)#8 | 19.5%(+80.5)#161 |
| 9. | 12435 | 86.8% | 17.8%(+69.1)#9 | 19.5%(+67.3)#201 |
| 10. | 14537 | 83.3% | 17.8%(+65.6)#10 | 19.5%(+63.8)#215 |
| 11. | 14302 | 79.3% | 17.8%(+61.5)#11 | 19.5%(+59.8)#234 |
| 12. | 13418 | 75.0% | 17.8%(+57.2)#12 | 19.5%(+55.5)#257 |
| 13. | 14585 | 75.0% | 17.8%(+57.2)#13 | 19.5%(+55.5)#260 |
| 14. | 11970 | 67.1% | 17.8%(+49.4)#14 | 19.5%(+47.6)#322 |
| 15. | 12952 | 66.7% | 17.8%(+48.9)#15 | 19.5%(+47.2)#332 |
| 16. | 14061 | 66.7% | 17.8%(+48.9)#16 | 19.5%(+47.2)#347 |
| 17. | 14261 | 64.1% | 17.8%(+46.3)#17 | 19.5%(+44.6)#369 |
| 18. | 12792 | 58.8% | 17.8%(+41.1)#18 | 19.5%(+39.3)#448 |
| 19. | 12527 | 56.2% | 17.8%(+38.5)#19 | 19.5%(+36.8)#497 |
| 20. | 13641 | 55.6% | 17.8%(+37.8)#20 | 19.5%(+36.1)#512 |
| 21. | 12036 | 52.6% | 17.8%(+34.9)#21 | 19.5%(+33.1)#569 |
| 22. | 13483 | 50.8% | 17.8%(+33.0)#22 | 19.5%(+31.3)#625 |
| 23. | 13814 | 50.0% | 17.8%(+32.2)#23 | 19.5%(+30.5)#717 |
| 24. | 13782 | 48.6% | 17.8%(+30.8)#24 | 19.5%(+29.1)#741 |
| 25. | 14539 | 47.4% | 17.8%(+29.6)#25 | 19.5%(+27.9)#780 |
| 26. | 13488 | 45.0% | 17.8%(+27.2)#26 | 19.5%(+25.5)#889 |
| 27. | 14486 | 44.4% | 17.8%(+26.7)#27 | 19.5%(+24.9)#916 |
| 28. | 12987 | 44.3% | 17.8%(+26.5)#28 | 19.5%(+24.8)#931 |
| 29. | 10993 | 43.9% | 17.8%(+26.1)#29 | 19.5%(+24.4)#951 |
| 30. | 10501 | 42.7% | 17.8%(+25.0)#30 | 19.5%(+23.2)#1,028 |
| 31. | 13751 | 42.6% | 17.8%(+24.9)#31 | 19.5%(+23.1)#1,030 |
| 32. | 12069 | 40.8% | 17.8%(+23.0)#32 | 19.5%(+21.3)#1,157 |
| 33. | 12124 | 40.8% | 17.8%(+23.0)#33 | 19.5%(+21.3)#1,160 |
| 34. | 14736 | 40.6% | 17.8%(+22.9)#34 | 19.5%(+21.1)#1,176 |
| 35. | 14769 | 40.0% | 17.8%(+22.2)#35 | 19.5%(+20.5)#1,215 |
| 36. | 14785 | 39.6% | 17.8%(+21.8)#36 | 19.5%(+20.1)#1,261 |
| 37. | 14550 | 39.5% | 17.8%(+21.7)#37 | 19.5%(+20.0)#1,268 |
| 38. | 10511 | 39.3% | 17.8%(+21.6)#38 | 19.5%(+19.8)#1,278 |
| 39. | 11976 | 37.5% | 17.8%(+19.7)#39 | 19.5%(+18.0)#1,442 |
| 40. | 12041 | 37.3% | 17.8%(+19.6)#40 | 19.5%(+17.8)#1,461 |
| 41. | 12150 | 37.0% | 17.8%(+19.2)#41 | 19.5%(+17.5)#1,501 |
| 42. | 11975 | 36.9% | 17.8%(+19.1)#42 | 19.5%(+17.4)#1,502 |
| 43. | 12046 | 36.2% | 17.8%(+18.4)#43 | 19.5%(+16.7)#1,577 |
| 44. | 12195 | 36.2% | 17.8%(+18.4)#44 | 19.5%(+16.7)#1,581 |
| 45. | 10474 | 36.0% | 17.8%(+18.2)#45 | 19.5%(+16.5)#1,600 |
| 46. | 12746 | 35.8% | 17.8%(+18.0)#46 | 19.5%(+16.3)#1,628 |
| 47. | 14788 | 34.5% | 17.8%(+16.7)#47 | 19.5%(+15.0)#1,814 |
| 48. | 14740 | 33.9% | 17.8%(+16.2)#48 | 19.5%(+14.4)#1,892 |
| 49. | 12042 | 33.8% | 17.8%(+16.0)#49 | 19.5%(+14.3)#1,911 |
| 50. | 14808 | 33.8% | 17.8%(+16.0)#50 | 19.5%(+14.3)#1,914 |
| 51. | 11514 | 33.0% | 17.8%(+15.2)#51 | 19.5%(+13.5)#2,084 |
| 52. | 14480 | 32.4% | 17.8%(+14.6)#52 | 19.5%(+12.9)#2,182 |
| 53. | 12464 | 32.4% | 17.8%(+14.6)#53 | 19.5%(+12.9)#2,184 |
| 54. | 14166 | 32.3% | 17.8%(+14.6)#54 | 19.5%(+12.8)#2,192 |
| 55. | 12956 | 32.2% | 17.8%(+14.4)#55 | 19.5%(+12.7)#2,217 |
| 56. | 12454 | 32.2% | 17.8%(+14.4)#56 | 19.5%(+12.7)#2,222 |
| 57. | 14476 | 32.0% | 17.8%(+14.3)#57 | 19.5%(+12.5)#2,257 |
| 58. | 12451 | 32.0% | 17.8%(+14.3)#58 | 19.5%(+12.5)#2,260 |
| 59. | 10923 | 31.8% | 17.8%(+14.0)#59 | 19.5%(+12.3)#2,343 |
| 60. | 10069 | 31.5% | 17.8%(+13.8)#60 | 19.5%(+12.0)#2,389 |
| 61. | 10594 | 31.5% | 17.8%(+13.7)#61 | 19.5%(+12.0)#2,395 |
| 62. | 12116 | 31.4% | 17.8%(+13.6)#62 | 19.5%(+11.9)#2,426 |
| 63. | 13338 | 31.3% | 17.8%(+13.6)#63 | 19.5%(+11.8)#2,437 |
| 64. | 13313 | 31.2% | 17.8%(+13.5)#64 | 19.5%(+11.8)#2,460 |
| 65. | 14805 | 31.2% | 17.8%(+13.4)#65 | 19.5%(+11.7)#2,480 |
| 66. | 11716 | 31.0% | 17.8%(+13.3)#66 | 19.5%(+11.5)#2,519 |
| 67. | 11749 | 30.8% | 17.8%(+13.0)#67 | 19.5%(+11.3)#2,583 |
| 68. | 12765 | 30.7% | 17.8%(+12.9)#68 | 19.5%(+11.2)#2,633 |
| 69. | 14723 | 30.6% | 17.8%(+12.9)#69 | 19.5%(+11.1)#2,636 |
| 70. | 12785 | 30.5% | 17.8%(+12.7)#70 | 19.5%(+11.0)#2,665 |
| 71. | 12517 | 30.4% | 17.8%(+12.7)#71 | 19.5%(+10.9)#2,693 |
| 72. | 12444 | 30.3% | 17.8%(+12.5)#72 | 19.5%(+10.8)#2,733 |
| 73. | 11804 | 30.2% | 17.8%(+12.4)#73 | 19.5%(+10.7)#2,759 |
| 74. | 13841 | 30.0% | 17.8%(+12.2)#74 | 19.5%(+10.5)#2,830 |
| 75. | 14475 | 29.9% | 17.8%(+12.2)#75 | 19.5%(+10.4)#2,864 |
| 76. | 13744 | 29.7% | 17.8%(+11.9)#76 | 19.5%(+10.2)#2,932 |
| 77. | 10162 | 29.3% | 17.8%(+11.6)#77 | 19.5%(+9.82)#3,083 |
| 78. | 12955 | 29.2% | 17.8%(+11.4)#78 | 19.5%(+9.67)#3,146 |
| 79. | 12421 | 29.1% | 17.8%(+11.4)#79 | 19.5%(+9.63)#3,159 |
| 80. | 11530 | 29.1% | 17.8%(+11.4)#80 | 19.5%(+9.62)#3,160 |
| 81. | 11030 | 29.1% | 17.8%(+11.3)#81 | 19.5%(+9.59)#3,175 |
| 82. | 13461 | 29.0% | 17.8%(+11.3)#82 | 19.5%(+9.54)#3,187 |
| 83. | 11516 | 28.9% | 17.8%(+11.2)#83 | 19.5%(+9.43)#3,232 |
| 84. | 13780 | 28.9% | 17.8%(+11.2)#84 | 19.5%(+9.43)#3,233 |
| 85. | 12959 | 28.9% | 17.8%(+11.1)#85 | 19.5%(+9.36)#3,265 |
| 86. | 11952 | 28.8% | 17.8%(+11.1)#86 | 19.5%(+9.34)#3,274 |
| 87. | 10006 | 28.8% | 17.8%(+11.1)#87 | 19.5%(+9.34)#3,277 |
| 88. | 14145 | 28.8% | 17.8%(+11.0)#88 | 19.5%(+9.26)#3,309 |
| 89. | 10518 | 28.7% | 17.8%(+11.0)#89 | 19.5%(+9.24)#3,316 |
| 90. | 13040 | 28.4% | 17.8%(+10.7)#90 | 19.5%(+8.94)#3,455 |
| 91. | 13052 | 28.4% | 17.8%(+10.7)#91 | 19.5%(+8.94)#3,456 |
| 92. | 12927 | 28.4% | 17.8%(+10.6)#92 | 19.5%(+8.88)#3,485 |
| 93. | 10573 | 28.3% | 17.8%(+10.6)#93 | 19.5%(+8.85)#3,498 |
| 94. | 13476 | 28.3% | 17.8%(+10.6)#94 | 19.5%(+8.83)#3,502 |
| 95. | 13679 | 28.1% | 17.8%(+10.3)#95 | 19.5%(+8.60)#3,622 |
| 96. | 14032 | 28.0% | 17.8%(+10.2)#96 | 19.5%(+8.50)#3,692 |
| 97. | 10505 | 28.0% | 17.8%(+10.2)#97 | 19.5%(+8.49)#3,698 |
| 98. | 11702 | 27.9% | 17.8%(+10.1)#98 | 19.5%(+8.38)#3,747 |
| 99. | 12842 | 27.7% | 17.8%(+9.93)#99 | 19.5%(+8.20)#3,826 |
| 100. | 10282 | 27.6% | 17.8%(+9.85)#100 | 19.5%(+8.12)#3,859 |
Common Questions
What are the Top 10 Zip Codes with the Highest Percentage of Population with a Degree in Business in New York?
Top 10 Zip Codes with the Highest Percentage of Population with a Degree in Business in New York are:
What zip code has the Highest Percentage of Population with a Degree in Business in New York?
11439 has the Highest Percentage of Population with a Degree in Business in New York with 100.0%.
What is the Percentage of Population with a Degree in Business in the State of New York?
Percentage of Population with a Degree in Business in New York is 17.8%.
What is the Percentage of Population with a Degree in Business in the United States?
Percentage of Population with a Degree in Business in the United States is 19.5%.