Zip Codes with the Highest Percentage of Population Employed in Security & Protection in Beaumont, TX
RELATED REPORTS & OPTIONS
Security & Protection
Beaumont
Compare Zip Codes
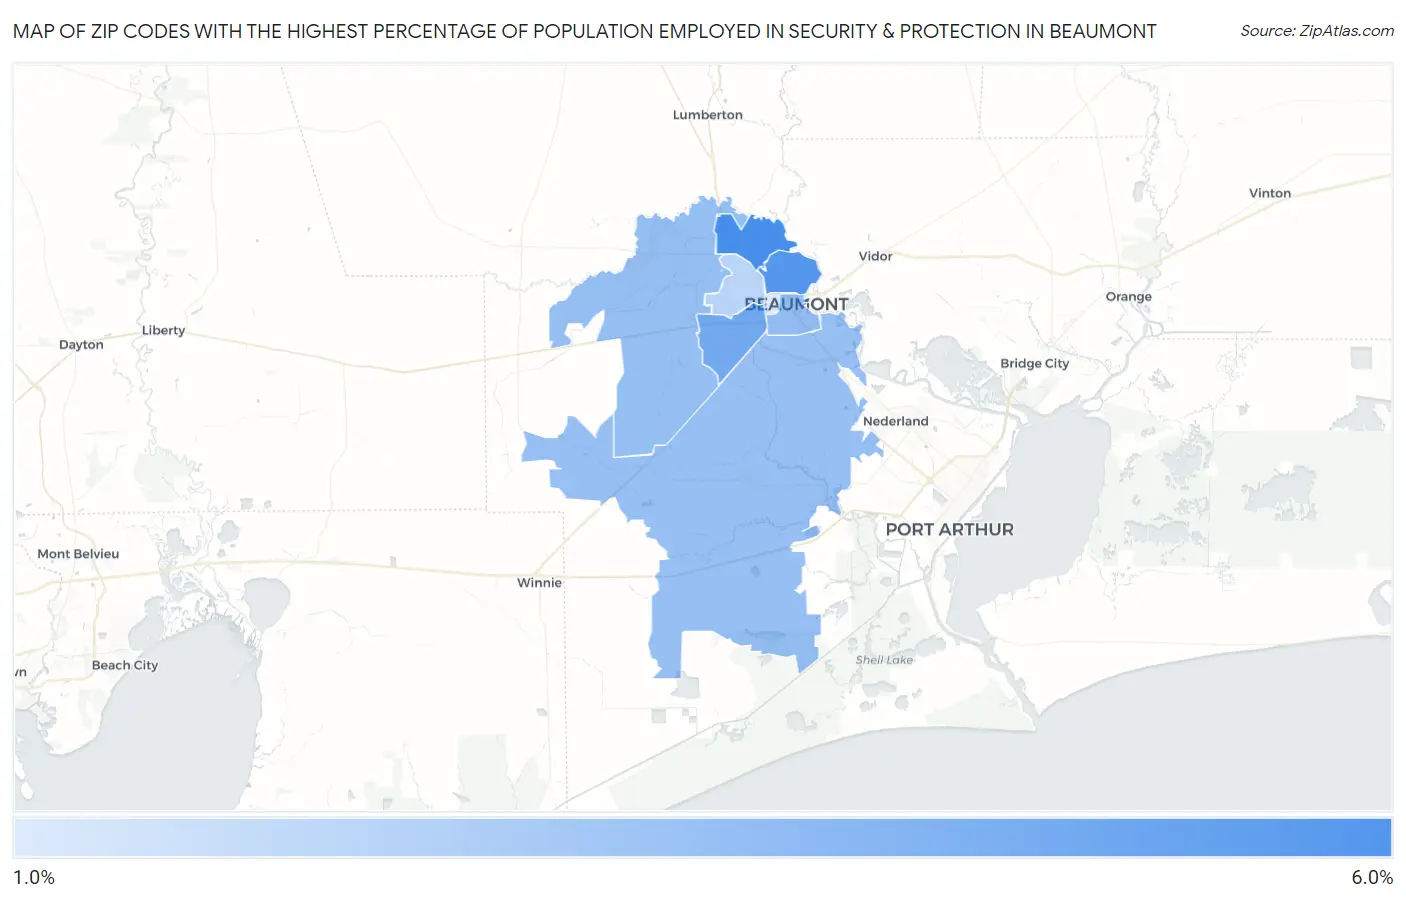
Map of Zip Codes with the Highest Percentage of Population Employed in Security & Protection in Beaumont
0.0%
6.0%
Zip Codes with the Highest Percentage of Population Employed in Security & Protection in Beaumont, TX
| Zip Code | % Employed | vs State | vs National | |
| 1. | 77708 | 5.8% | 2.2%(+3.61)#174 | 2.1%(+3.68)#2,189 |
| 2. | 77703 | 5.4% | 2.2%(+3.16)#196 | 2.1%(+3.23)#2,559 |
| 3. | 77707 | 4.5% | 2.2%(+2.31)#269 | 2.1%(+2.38)#3,566 |
| 4. | 77701 | 3.6% | 2.2%(+1.36)#406 | 2.1%(+1.43)#5,447 |
| 5. | 77713 | 3.5% | 2.2%(+1.23)#423 | 2.1%(+1.31)#5,793 |
| 6. | 77705 | 3.4% | 2.2%(+1.17)#437 | 2.1%(+1.25)#5,939 |
| 7. | 77706 | 2.4% | 2.2%(+0.173)#709 | 2.1%(+0.249)#10,067 |
| 8. | 77702 | 1.4% | 2.2%(-0.829)#1,128 | 2.1%(-0.754)#16,991 |
1
Common Questions
What are the Top 5 Zip Codes with the Highest Percentage of Population Employed in Security & Protection in Beaumont, TX?
Top 5 Zip Codes with the Highest Percentage of Population Employed in Security & Protection in Beaumont, TX are:
What zip code has the Highest Percentage of Population Employed in Security & Protection in Beaumont, TX?
77708 has the Highest Percentage of Population Employed in Security & Protection in Beaumont, TX with 5.8%.
What is the Percentage of Population Employed in Security & Protection in Beaumont, TX?
Percentage of Population Employed in Security & Protection in Beaumont is 3.9%.
What is the Percentage of Population Employed in Security & Protection in Texas?
Percentage of Population Employed in Security & Protection in Texas is 2.2%.
What is the Percentage of Population Employed in Security & Protection in the United States?
Percentage of Population Employed in Security & Protection in the United States is 2.1%.