Central High, OK
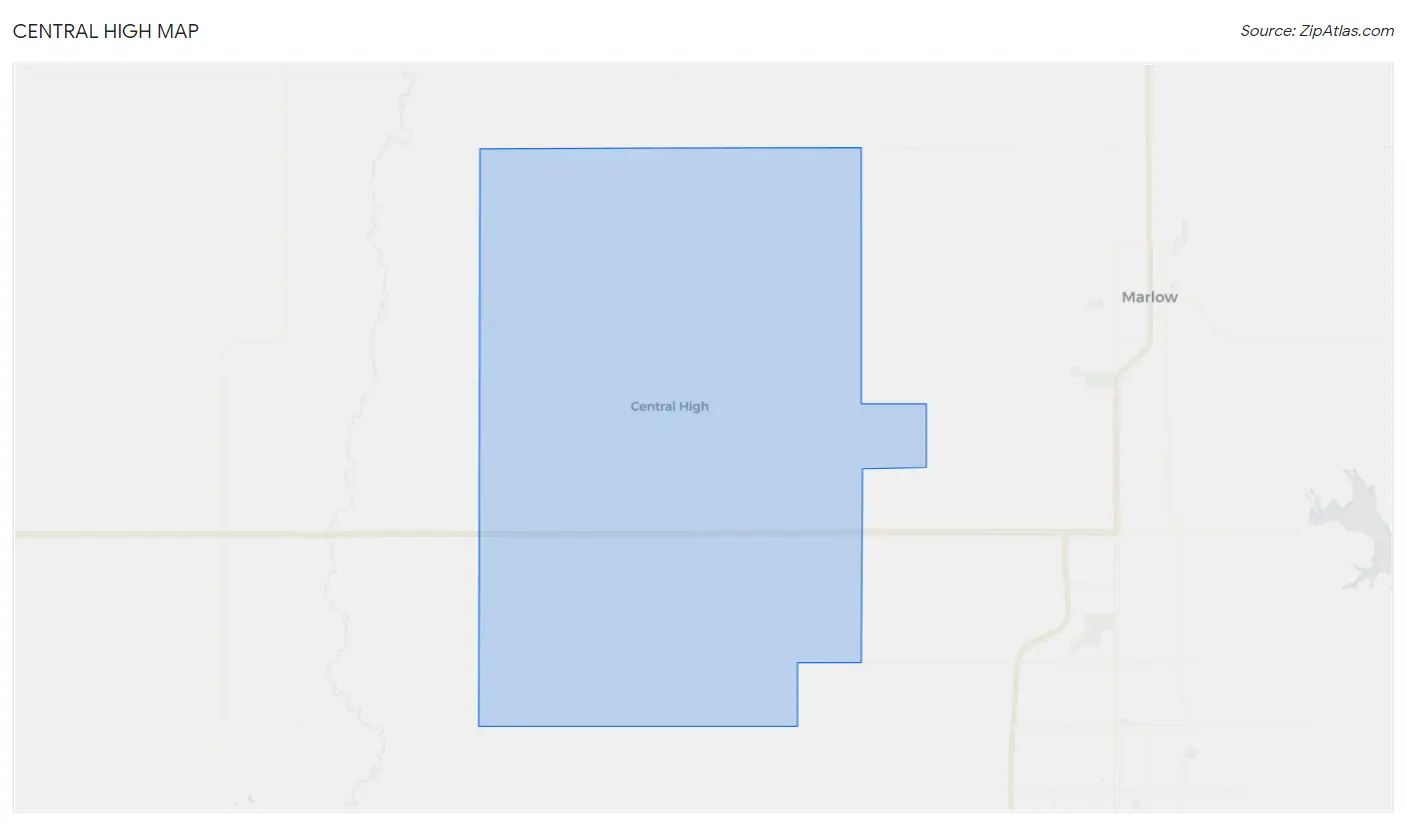
Central High Map
Central High Overview
1,480
TOTAL POPULATION
646
MALE POPULATION
834
FEMALE POPULATION
77.46
MALES / 100 FEMALES
129.10
FEMALES / 100 MALES
32.9
MEDIAN AGE
3.4
AVG FAMILY SIZE
3.0
AVG HOUSEHOLD SIZE
$30,323
PER CAPITA INCOME
$78,400
AVG FAMILY INCOME
$71,898
AVG HOUSEHOLD INCOME
62.2%
WAGE / INCOME GAP [ % ]
37.8¢/ $1
WAGE / INCOME GAP [ $ ]
0.39
INEQUALITY / GINI INDEX
638
LABOR FORCE [ PEOPLE ]
59.9%
PERCENT IN LABOR FORCE
6.4%
UNEMPLOYMENT RATE
Central High Area Codes
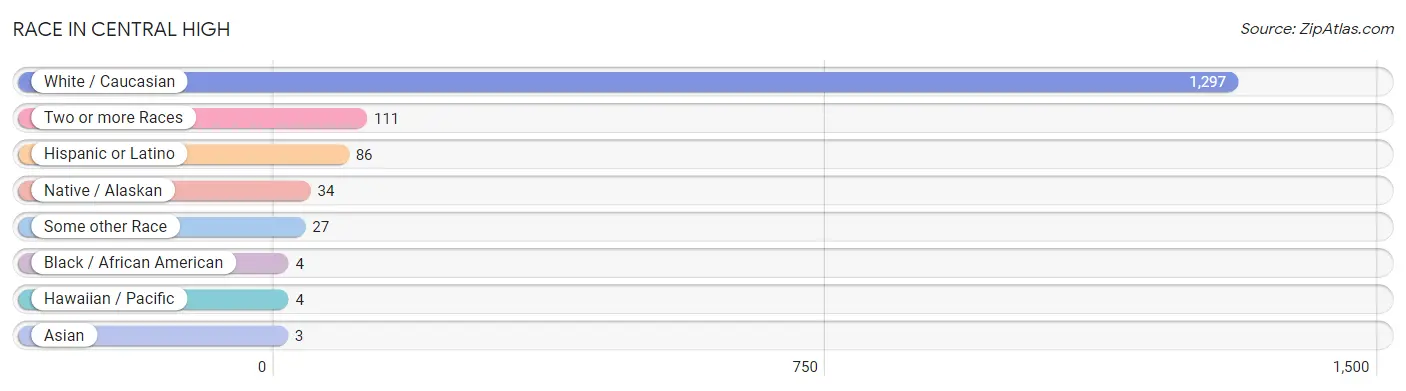
Race in Central High
The most populous races in Central High are White / Caucasian (1,297 | 87.6%), Two or more Races (111 | 7.5%), and Hispanic or Latino (86 | 5.8%).
| Race | # Population | % Population |
| Asian | 3 | 0.2% |
| Black / African American | 4 | 0.3% |
| Hawaiian / Pacific | 4 | 0.3% |
| Hispanic or Latino | 86 | 5.8% |
| Native / Alaskan | 34 | 2.3% |
| White / Caucasian | 1,297 | 87.6% |
| Two or more Races | 111 | 7.5% |
| Some other Race | 27 | 1.8% |
| Total | 1,480 | 100.0% |
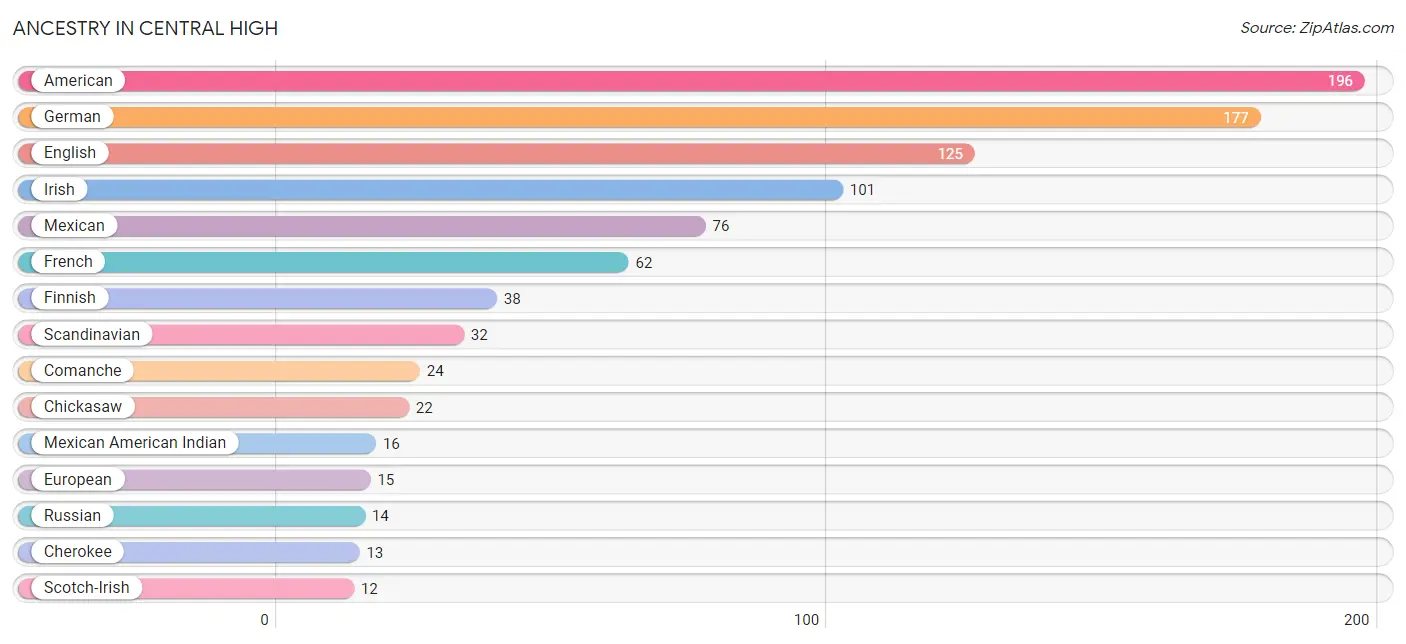
Ancestry in Central High
The most populous ancestries reported in Central High are American (196 | 13.2%), German (177 | 12.0%), English (125 | 8.5%), Irish (101 | 6.8%), and Mexican (76 | 5.1%), together accounting for 45.6% of all Central High residents.
| Ancestry | # Population | % Population |
| American | 196 | 13.2% |
| Apache | 3 | 0.2% |
| British | 6 | 0.4% |
| Burmese | 2 | 0.1% |
| Cherokee | 13 | 0.9% |
| Chickasaw | 22 | 1.5% |
| Choctaw | 8 | 0.5% |
| Comanche | 24 | 1.6% |
| Czech | 11 | 0.7% |
| Dutch | 3 | 0.2% |
| Dutch West Indian | 10 | 0.7% |
| English | 125 | 8.5% |
| Ethiopian | 6 | 0.4% |
| European | 15 | 1.0% |
| Finnish | 38 | 2.6% |
| French | 62 | 4.2% |
| German | 177 | 12.0% |
| Guamanian / Chamorro | 4 | 0.3% |
| Indian (Asian) | 3 | 0.2% |
| Inupiat | 2 | 0.1% |
| Irish | 101 | 6.8% |
| Italian | 6 | 0.4% |
| Mexican | 76 | 5.1% |
| Mexican American Indian | 16 | 1.1% |
| Native Hawaiian | 4 | 0.3% |
| Potawatomi | 5 | 0.3% |
| Puerto Rican | 10 | 0.7% |
| Russian | 14 | 0.9% |
| Scandinavian | 32 | 2.2% |
| Scotch-Irish | 12 | 0.8% |
| Scottish | 11 | 0.7% |
| Seminole | 10 | 0.7% |
| Subsaharan African | 6 | 0.4% |
| Swedish | 3 | 0.2% |
| Swiss | 4 | 0.3% |
| Welsh | 12 | 0.8% | View All 36 Rows |
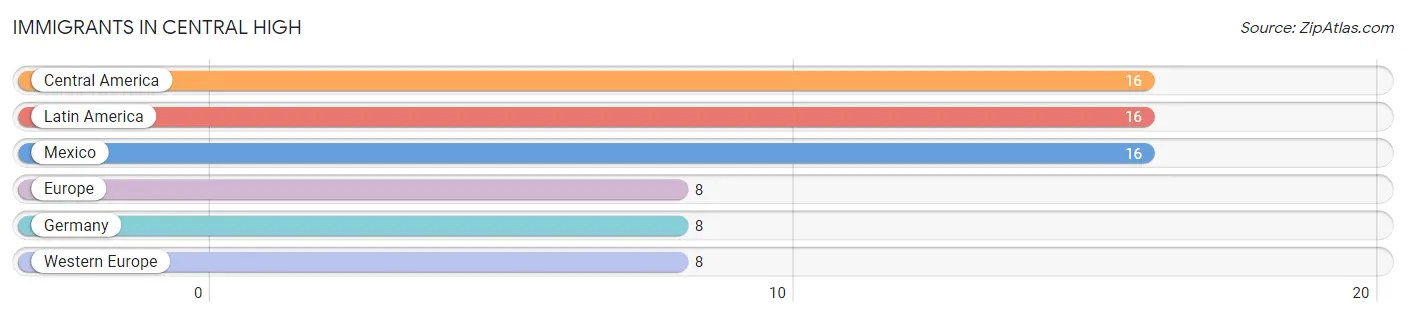
Immigrants in Central High
The most numerous immigrant groups reported in Central High came from Central America (16 | 1.1%), Latin America (16 | 1.1%), Mexico (16 | 1.1%), Europe (8 | 0.5%), and Germany (8 | 0.5%), together accounting for 4.3% of all Central High residents.
| Immigration Origin | # Population | % Population |
| Central America | 16 | 1.1% |
| Europe | 8 | 0.5% |
| Germany | 8 | 0.5% |
| Latin America | 16 | 1.1% |
| Mexico | 16 | 1.1% |
| Western Europe | 8 | 0.5% | View All 6 Rows |
Sex and Age in Central High
Sex and Age in Central High
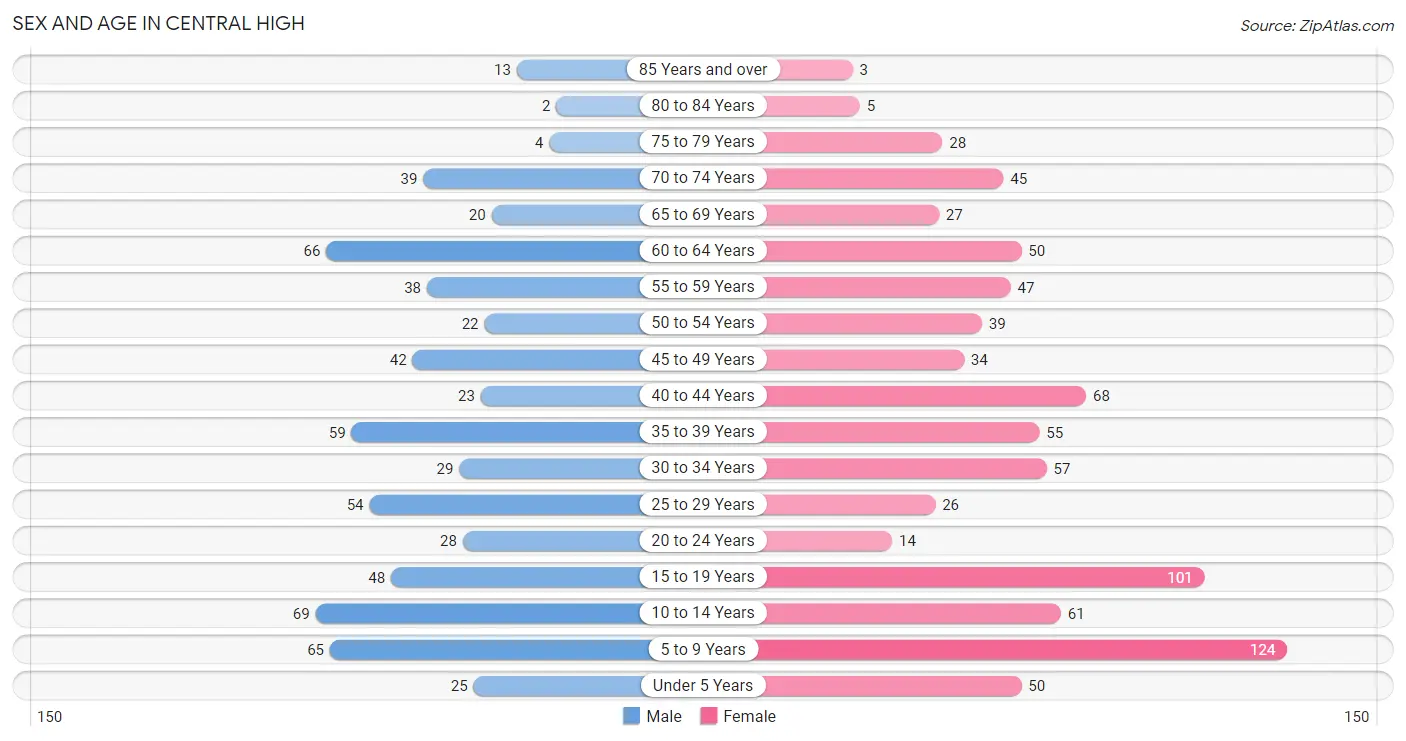
The most populous age groups in Central High are 10 to 14 Years (69 | 10.7%) for men and 5 to 9 Years (124 | 14.9%) for women.
| Age Bracket | Male | Female |
| Under 5 Years | 25 (3.9%) | 50 (6.0%) |
| 5 to 9 Years | 65 (10.1%) | 124 (14.9%) |
| 10 to 14 Years | 69 (10.7%) | 61 (7.3%) |
| 15 to 19 Years | 48 (7.4%) | 101 (12.1%) |
| 20 to 24 Years | 28 (4.3%) | 14 (1.7%) |
| 25 to 29 Years | 54 (8.4%) | 26 (3.1%) |
| 30 to 34 Years | 29 (4.5%) | 57 (6.8%) |
| 35 to 39 Years | 59 (9.1%) | 55 (6.6%) |
| 40 to 44 Years | 23 (3.6%) | 68 (8.2%) |
| 45 to 49 Years | 42 (6.5%) | 34 (4.1%) |
| 50 to 54 Years | 22 (3.4%) | 39 (4.7%) |
| 55 to 59 Years | 38 (5.9%) | 47 (5.6%) |
| 60 to 64 Years | 66 (10.2%) | 50 (6.0%) |
| 65 to 69 Years | 20 (3.1%) | 27 (3.2%) |
| 70 to 74 Years | 39 (6.0%) | 45 (5.4%) |
| 75 to 79 Years | 4 (0.6%) | 28 (3.4%) |
| 80 to 84 Years | 2 (0.3%) | 5 (0.6%) |
| 85 Years and over | 13 (2.0%) | 3 (0.4%) |
| Total | 646 (100.0%) | 834 (100.0%) |
Families and Households in Central High
Median Family Size in Central High
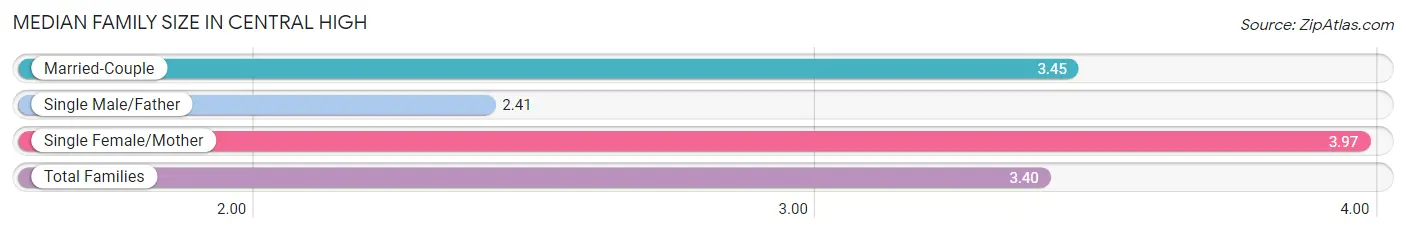
The median family size in Central High is 3.40 persons per family, with single female/mother families (31 | 8.1%) accounting for the largest median family size of 3.97 persons per family. On the other hand, single male/father families (34 | 8.8%) represent the smallest median family size with 2.41 persons per family.
| Family Type | # Families | Family Size |
| Married-Couple | 319 (83.1%) | 3.45 |
| Single Male/Father | 34 (8.8%) | 2.41 |
| Single Female/Mother | 31 (8.1%) | 3.97 |
| Total Families | 384 (100.0%) | 3.40 |
Median Household Size in Central High
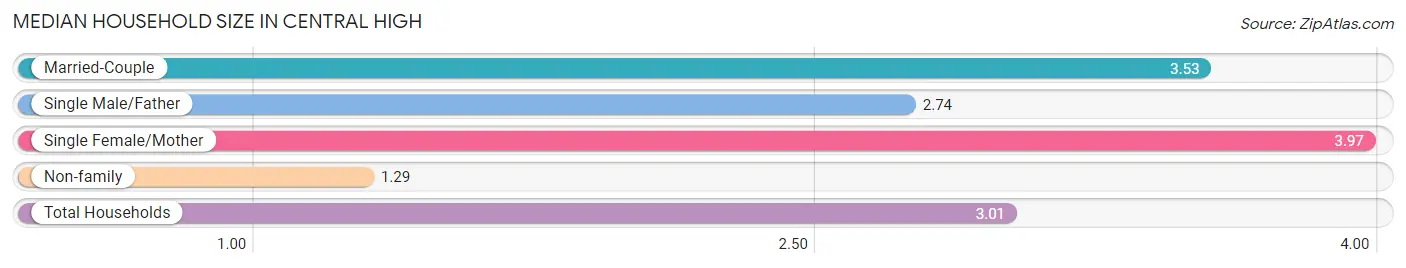
The median household size in Central High is 3.01 persons per household, with single female/mother households (31 | 6.3%) accounting for the largest median household size of 3.97 persons per household. non-family households (107 | 21.8%) represent the smallest median household size with 1.29 persons per household.
| Household Type | # Households | Household Size |
| Married-Couple | 319 (65.0%) | 3.53 |
| Single Male/Father | 34 (6.9%) | 2.74 |
| Single Female/Mother | 31 (6.3%) | 3.97 |
| Non-family | 107 (21.8%) | 1.29 |
| Total Households | 491 (100.0%) | 3.01 |
Household Size by Marriage Status in Central High
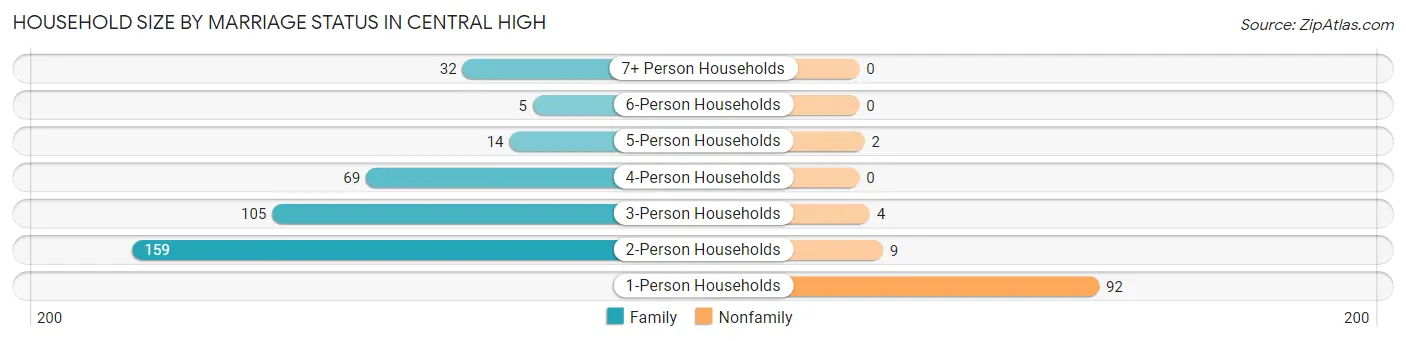
Out of a total of 491 households in Central High, 384 (78.2%) are family households, while 107 (21.8%) are nonfamily households. The most numerous type of family households are 2-person households, comprising 159, and the most common type of nonfamily households are 1-person households, comprising 92.
| Household Size | Family Households | Nonfamily Households |
| 1-Person Households | - | 92 (18.7%) |
| 2-Person Households | 159 (32.4%) | 9 (1.8%) |
| 3-Person Households | 105 (21.4%) | 4 (0.8%) |
| 4-Person Households | 69 (14.1%) | 0 (0.0%) |
| 5-Person Households | 14 (2.9%) | 2 (0.4%) |
| 6-Person Households | 5 (1.0%) | 0 (0.0%) |
| 7+ Person Households | 32 (6.5%) | 0 (0.0%) |
| Total | 384 (78.2%) | 107 (21.8%) |
Female Fertility in Central High
Fertility by Age in Central High
Average fertility rate in Central High is 73.0 births per 1,000 women. Women in the age bracket of 35 to 50 years have the highest fertility rate with 135.0 births per 1,000 women. Women in the age bracket of 35 to 50 years acount for 85.2% of all women with births.
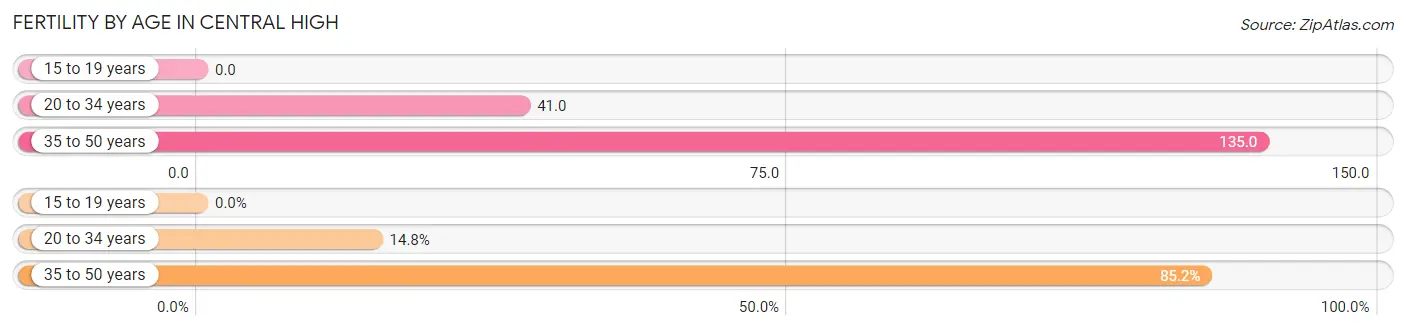
| Age Bracket | Women with Births | Births / 1,000 Women |
| 15 to 19 years | 0 (0.0%) | 0.0 |
| 20 to 34 years | 4 (14.8%) | 41.0 |
| 35 to 50 years | 23 (85.2%) | 135.0 |
| Total | 27 (100.0%) | 73.0 |
Fertility by Age by Marriage Status in Central High
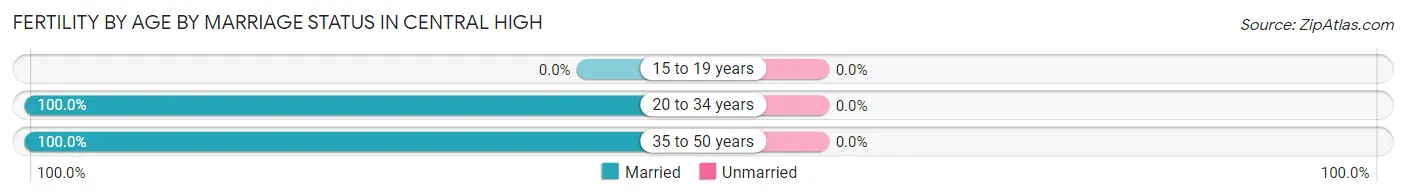
| Age Bracket | Married | Unmarried |
| 15 to 19 years | 0 (0.0%) | 0 (0.0%) |
| 20 to 34 years | 4 (100.0%) | 0 (0.0%) |
| 35 to 50 years | 23 (100.0%) | 0 (0.0%) |
| Total | 27 (100.0%) | 0 (0.0%) |
Fertility by Education in Central High
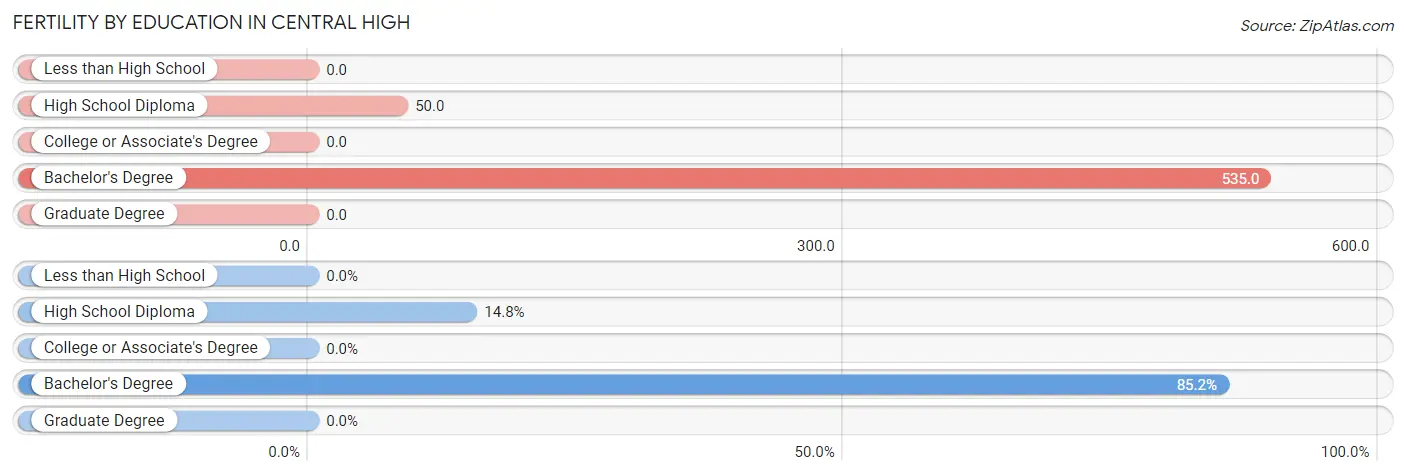
| Educational Attainment | Women with Births | Births / 1,000 Women |
| Less than High School | 0 (0.0%) | 0.0 |
| High School Diploma | 4 (14.8%) | 50.0 |
| College or Associate's Degree | 0 (0.0%) | 0.0 |
| Bachelor's Degree | 23 (85.2%) | 535.0 |
| Graduate Degree | 0 (0.0%) | 0.0 |
| Total | 27 (100.0%) | 73.0 |
Fertility by Education by Marriage Status in Central High
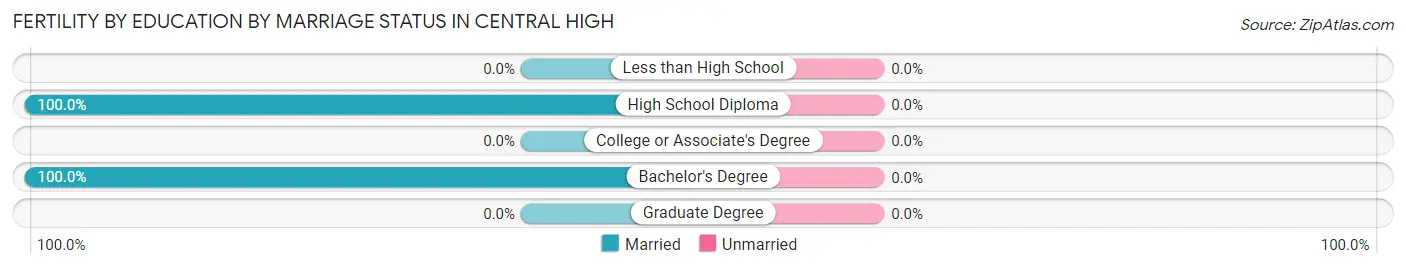
| Educational Attainment | Married | Unmarried |
| Less than High School | 0 (0.0%) | 0 (0.0%) |
| High School Diploma | 4 (100.0%) | 0 (0.0%) |
| College or Associate's Degree | 0 (0.0%) | 0 (0.0%) |
| Bachelor's Degree | 23 (100.0%) | 0 (0.0%) |
| Graduate Degree | 0 (0.0%) | 0 (0.0%) |
| Total | 27 (100.0%) | 0 (0.0%) |
Income in Central High
Income Overview in Central High
Per Capita Income in Central High is $30,323, while median incomes of families and households are $78,400 and $71,898 respectively.
| Characteristic | Number | Measure |
| Per Capita Income | 1,480 | $30,323 |
| Median Family Income | 384 | $78,400 |
| Mean Family Income | 384 | $100,952 |
| Median Household Income | 491 | $71,898 |
| Mean Household Income | 491 | $90,207 |
| Income Deficit | 384 | $0 |
| Wage / Income Gap (%) | 1,480 | 62.19% |
| Wage / Income Gap ($) | 1,480 | 37.81¢ per $1 |
| Gini / Inequality Index | 1,480 | 0.39 |
Earnings by Sex in Central High
Average Earnings in Central High are $35,341, $60,750 for men and $22,969 for women, a difference of 62.2%.
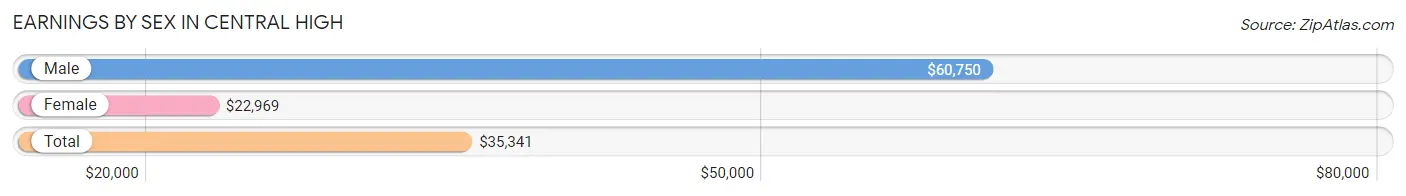
| Sex | Number | Average Earnings |
| Male | 351 (53.1%) | $60,750 |
| Female | 310 (46.9%) | $22,969 |
| Total | 661 (100.0%) | $35,341 |
Earnings by Sex by Income Bracket in Central High
The most common earnings brackets in Central High are $100,000+ for men (66 | 18.8%) and $22,500 to $24,999 for women (48 | 15.5%).
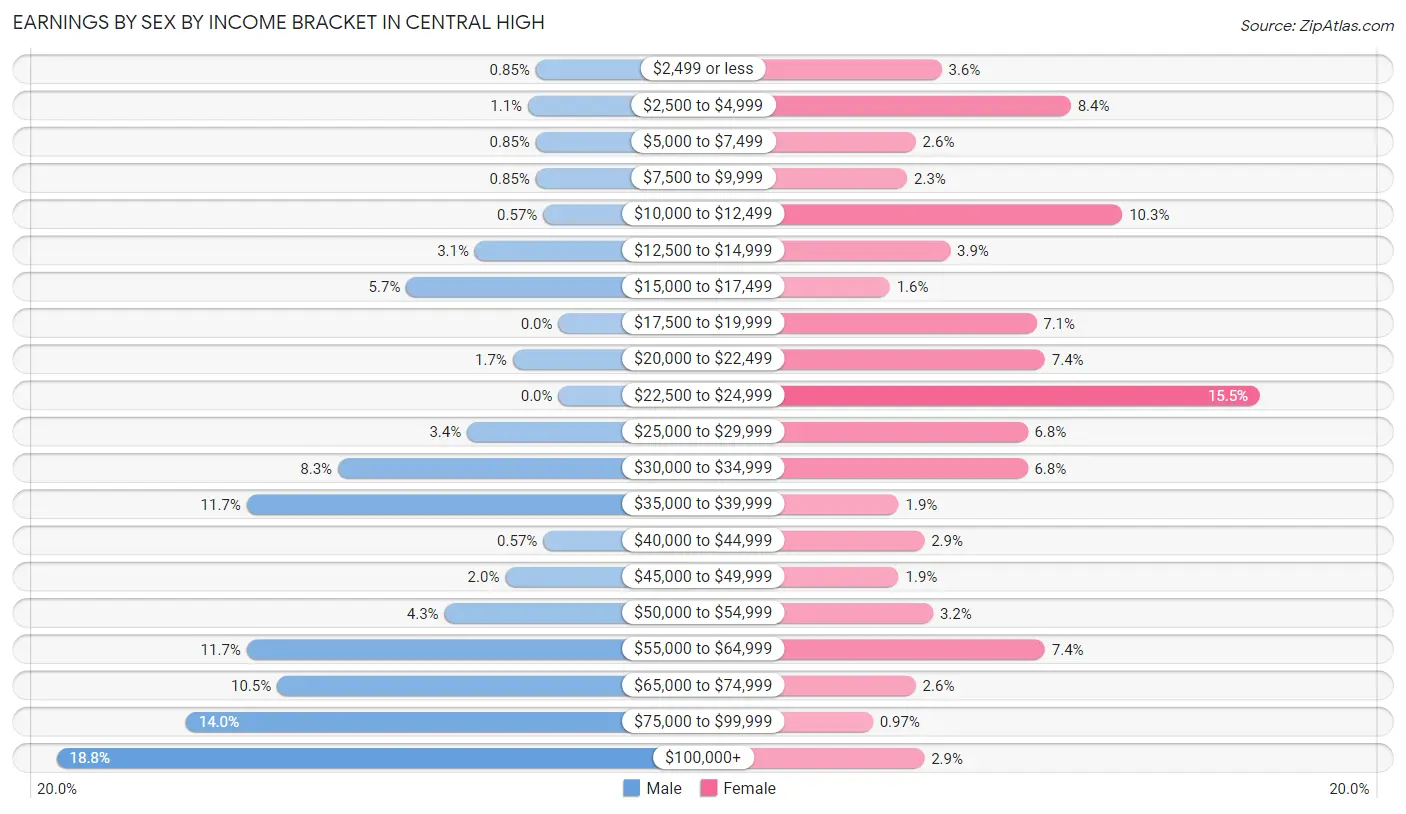
| Income | Male | Female |
| $2,499 or less | 3 (0.9%) | 11 (3.5%) |
| $2,500 to $4,999 | 4 (1.1%) | 26 (8.4%) |
| $5,000 to $7,499 | 3 (0.9%) | 8 (2.6%) |
| $7,500 to $9,999 | 3 (0.9%) | 7 (2.3%) |
| $10,000 to $12,499 | 2 (0.6%) | 32 (10.3%) |
| $12,500 to $14,999 | 11 (3.1%) | 12 (3.9%) |
| $15,000 to $17,499 | 20 (5.7%) | 5 (1.6%) |
| $17,500 to $19,999 | 0 (0.0%) | 22 (7.1%) |
| $20,000 to $22,499 | 6 (1.7%) | 23 (7.4%) |
| $22,500 to $24,999 | 0 (0.0%) | 48 (15.5%) |
| $25,000 to $29,999 | 12 (3.4%) | 21 (6.8%) |
| $30,000 to $34,999 | 29 (8.3%) | 21 (6.8%) |
| $35,000 to $39,999 | 41 (11.7%) | 6 (1.9%) |
| $40,000 to $44,999 | 2 (0.6%) | 9 (2.9%) |
| $45,000 to $49,999 | 7 (2.0%) | 6 (1.9%) |
| $50,000 to $54,999 | 15 (4.3%) | 10 (3.2%) |
| $55,000 to $64,999 | 41 (11.7%) | 23 (7.4%) |
| $65,000 to $74,999 | 37 (10.5%) | 8 (2.6%) |
| $75,000 to $99,999 | 49 (14.0%) | 3 (1.0%) |
| $100,000+ | 66 (18.8%) | 9 (2.9%) |
| Total | 351 (100.0%) | 310 (100.0%) |
Earnings by Sex by Educational Attainment in Central High
Average earnings in Central High are $65,156 for men and $23,490 for women, a difference of 63.9%. Men with an educational attainment of bachelor's degree enjoy the highest average annual earnings of $79,191, while those with high school diploma education earn the least with $39,816. Women with an educational attainment of graduate degree earn the most with the average annual earnings of $54,107, while those with high school diploma education have the smallest earnings of $16,250.
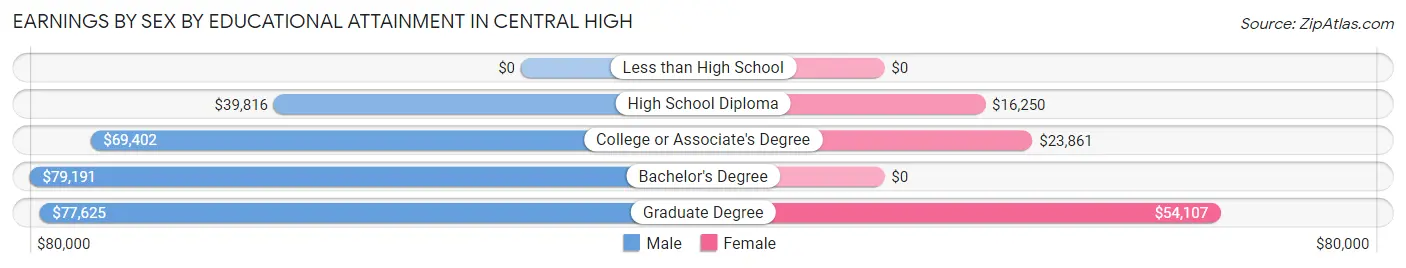
| Educational Attainment | Male Income | Female Income |
| Less than High School | - | - |
| High School Diploma | $39,816 | $16,250 |
| College or Associate's Degree | $69,402 | $23,861 |
| Bachelor's Degree | $79,191 | $0 |
| Graduate Degree | $77,625 | $54,107 |
| Total | $65,156 | $23,490 |
Family Income in Central High
Family Income Brackets in Central High
According to the Central High family income data, there are 102 families falling into the $100,000 to $149,999 income range, which is the most common income bracket and makes up 26.6% of all families.
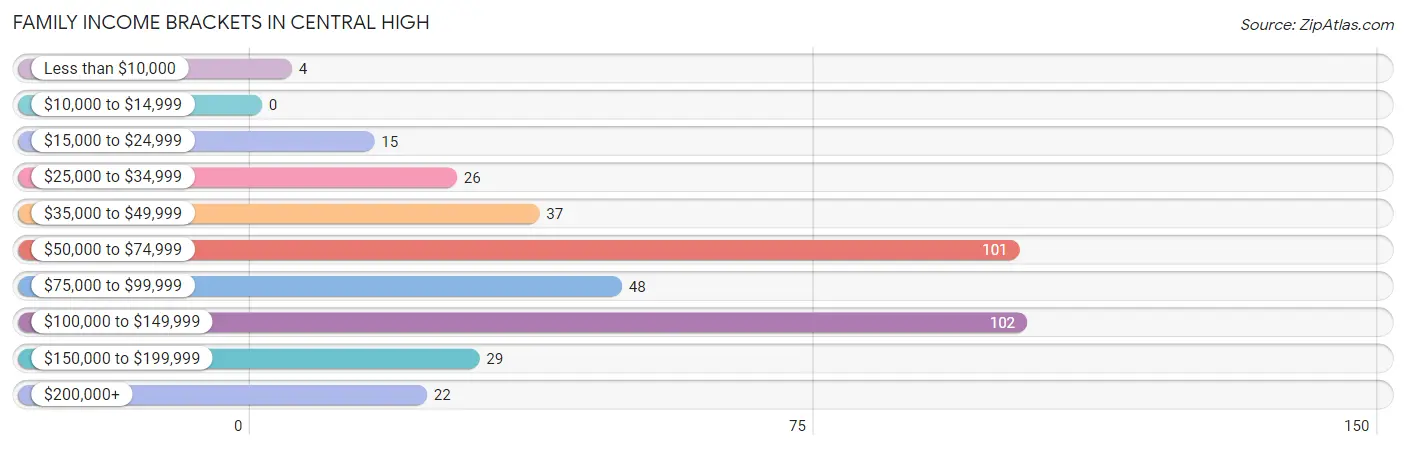
| Income Bracket | # Families | % Families |
| Less than $10,000 | 4 | 1.0% |
| $10,000 to $14,999 | 0 | 0.0% |
| $15,000 to $24,999 | 15 | 3.9% |
| $25,000 to $34,999 | 26 | 6.8% |
| $35,000 to $49,999 | 37 | 9.6% |
| $50,000 to $74,999 | 101 | 26.3% |
| $75,000 to $99,999 | 48 | 12.5% |
| $100,000 to $149,999 | 102 | 26.6% |
| $150,000 to $199,999 | 29 | 7.6% |
| $200,000+ | 22 | 5.7% |
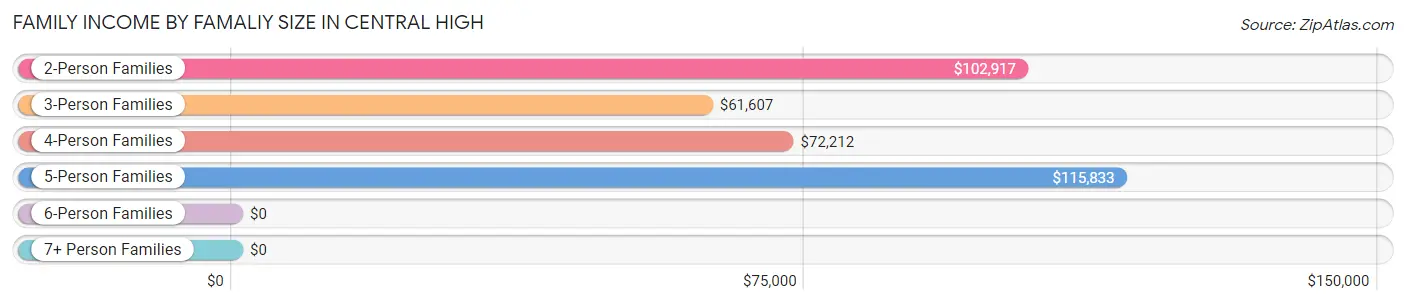
Family Income by Famaliy Size in Central High
5-person families (10 | 2.6%) account for the highest median family income in Central High with $115,833 per family, while 2-person families (169 | 44.0%) have the highest median income of $51,458 per family member.
| Income Bracket | # Families | Median Income |
| 2-Person Families | 169 (44.0%) | $102,917 |
| 3-Person Families | 109 (28.4%) | $61,607 |
| 4-Person Families | 65 (16.9%) | $72,212 |
| 5-Person Families | 10 (2.6%) | $115,833 |
| 6-Person Families | 5 (1.3%) | $0 |
| 7+ Person Families | 26 (6.8%) | $0 |
| Total | 384 (100.0%) | $78,400 |
Family Income by Number of Earners in Central High
The median family income in Central High is $78,400, with families comprising 3+ earners (26) having the highest median family income of $119,500, while families with no earners (42) have the lowest median family income of $45,357, accounting for 6.8% and 10.9% of families, respectively.
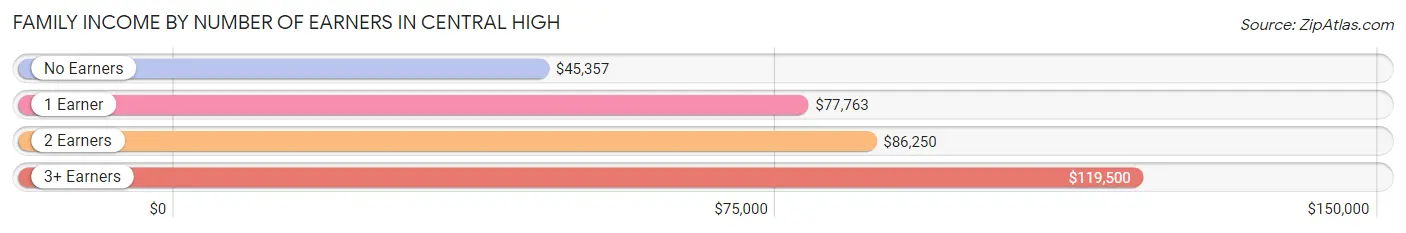
| Number of Earners | # Families | Median Income |
| No Earners | 42 (10.9%) | $45,357 |
| 1 Earner | 122 (31.8%) | $77,763 |
| 2 Earners | 194 (50.5%) | $86,250 |
| 3+ Earners | 26 (6.8%) | $119,500 |
| Total | 384 (100.0%) | $78,400 |
Household Income in Central High
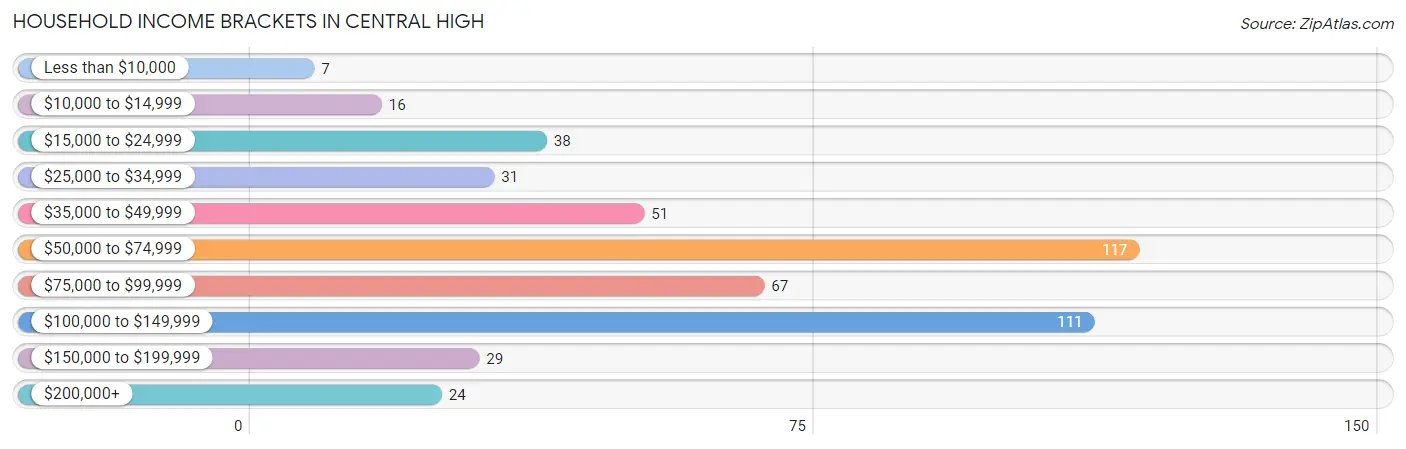
Household Income Brackets in Central High
With 117 households falling in the category, the $50,000 to $74,999 income range is the most frequent in Central High, accounting for 23.8% of all households. In contrast, only 7 households (1.4%) fall into the less than $10,000 income bracket, making it the least populous group.
| Income Bracket | # Households | % Households |
| Less than $10,000 | 7 | 1.4% |
| $10,000 to $14,999 | 16 | 3.3% |
| $15,000 to $24,999 | 38 | 7.7% |
| $25,000 to $34,999 | 31 | 6.3% |
| $35,000 to $49,999 | 51 | 10.4% |
| $50,000 to $74,999 | 117 | 23.8% |
| $75,000 to $99,999 | 67 | 13.6% |
| $100,000 to $149,999 | 111 | 22.6% |
| $150,000 to $199,999 | 29 | 5.9% |
| $200,000+ | 24 | 4.9% |
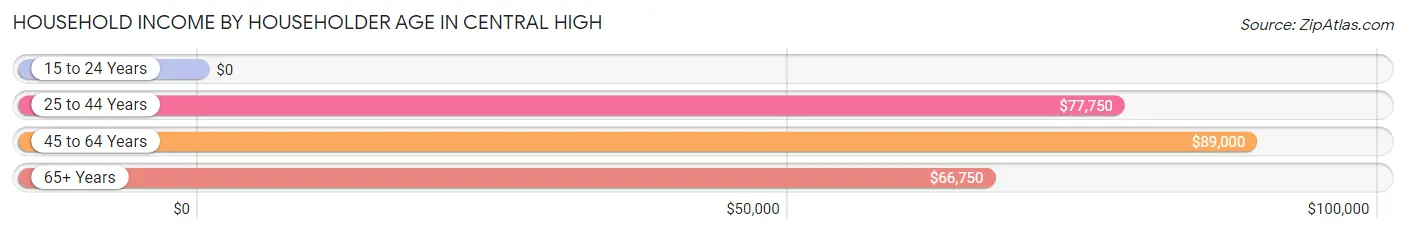
Household Income by Householder Age in Central High
The median household income in Central High is $71,898, with the highest median household income of $89,000 found in the 45 to 64 years age bracket for the primary householder. A total of 188 households (38.3%) fall into this category. Meanwhile, the 15 to 24 years age bracket for the primary householder has the lowest median household income of $0, with 15 households (3.0%) in this group.
| Income Bracket | # Households | Median Income |
| 15 to 24 Years | 15 (3.0%) | $0 |
| 25 to 44 Years | 175 (35.6%) | $77,750 |
| 45 to 64 Years | 188 (38.3%) | $89,000 |
| 65+ Years | 113 (23.0%) | $66,750 |
| Total | 491 (100.0%) | $71,898 |
Poverty in Central High
Income Below Poverty by Sex and Age in Central High
With 9.9% poverty level for males and 9.0% for females among the residents of Central High, 6 to 11 year old males and 45 to 54 year old females are the most vulnerable to poverty, with 17 males (37.0%) and 15 females (20.5%) in their respective age groups living below the poverty level.
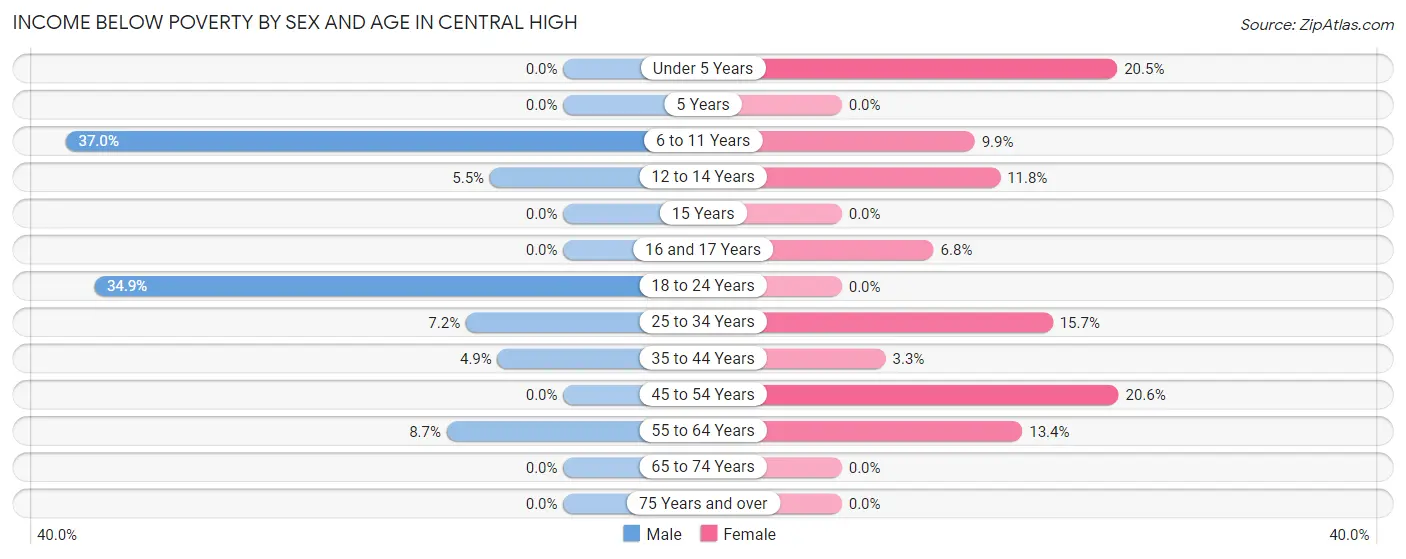
| Age Bracket | Male | Female |
| Under 5 Years | 0 (0.0%) | 9 (20.4%) |
| 5 Years | 0 (0.0%) | 0 (0.0%) |
| 6 to 11 Years | 17 (37.0%) | 15 (9.9%) |
| 12 to 14 Years | 3 (5.4%) | 2 (11.8%) |
| 15 Years | 0 (0.0%) | 0 (0.0%) |
| 16 and 17 Years | 0 (0.0%) | 3 (6.8%) |
| 18 to 24 Years | 23 (34.8%) | 0 (0.0%) |
| 25 to 34 Years | 6 (7.2%) | 13 (15.7%) |
| 35 to 44 Years | 4 (4.9%) | 4 (3.3%) |
| 45 to 54 Years | 0 (0.0%) | 15 (20.5%) |
| 55 to 64 Years | 9 (8.6%) | 13 (13.4%) |
| 65 to 74 Years | 0 (0.0%) | 0 (0.0%) |
| 75 Years and over | 0 (0.0%) | 0 (0.0%) |
| Total | 62 (9.9%) | 74 (9.0%) |
Income Above Poverty by Sex and Age in Central High
According to the poverty statistics in Central High, males aged under 5 years and females aged 5 years are the age groups that are most secure financially, with 100.0% of males and 100.0% of females in these age groups living above the poverty line.
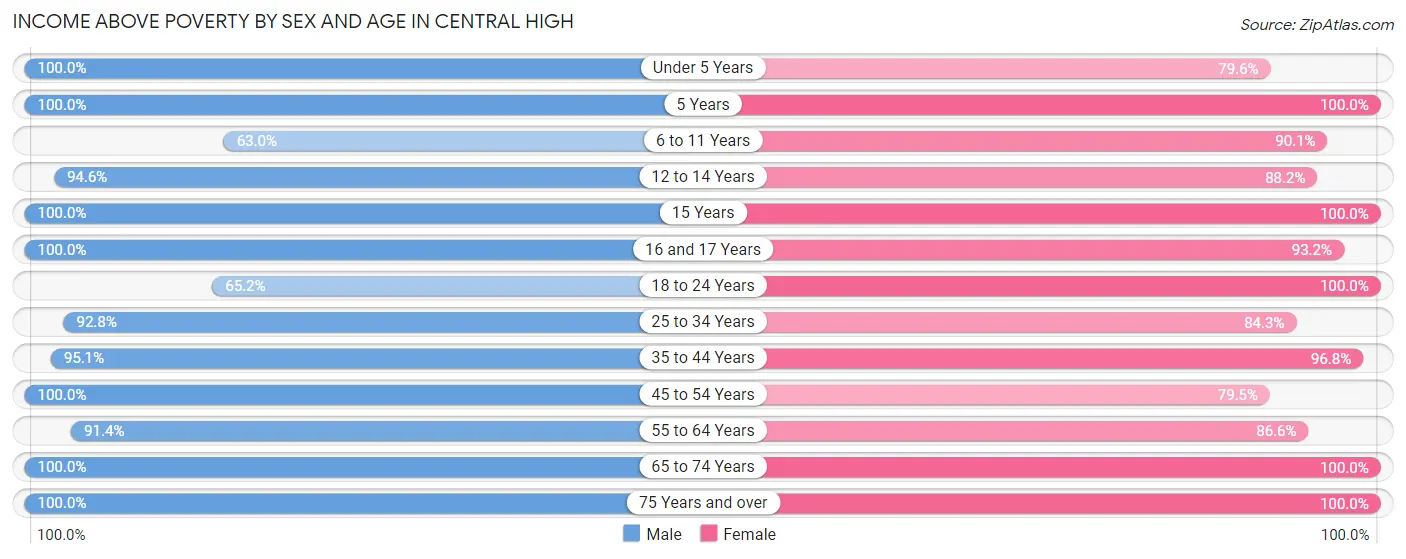
| Age Bracket | Male | Female |
| Under 5 Years | 13 (100.0%) | 35 (79.5%) |
| 5 Years | 25 (100.0%) | 13 (100.0%) |
| 6 to 11 Years | 29 (63.0%) | 137 (90.1%) |
| 12 to 14 Years | 52 (94.6%) | 15 (88.2%) |
| 15 Years | 5 (100.0%) | 16 (100.0%) |
| 16 and 17 Years | 5 (100.0%) | 41 (93.2%) |
| 18 to 24 Years | 43 (65.1%) | 55 (100.0%) |
| 25 to 34 Years | 77 (92.8%) | 70 (84.3%) |
| 35 to 44 Years | 78 (95.1%) | 119 (96.8%) |
| 45 to 54 Years | 64 (100.0%) | 58 (79.4%) |
| 55 to 64 Years | 95 (91.3%) | 84 (86.6%) |
| 65 to 74 Years | 59 (100.0%) | 72 (100.0%) |
| 75 Years and over | 19 (100.0%) | 36 (100.0%) |
| Total | 564 (90.1%) | 751 (91.0%) |
Income Below Poverty Among Married-Couple Families in Central High
The poverty statistics for married-couple families in Central High show that 0.9% or 3 of the total 319 families live below the poverty line. Families with 5 or more children have the highest poverty rate of 23.1%, comprising of 3 families. On the other hand, families with no children have the lowest poverty rate of 0.0%, which includes 0 families.
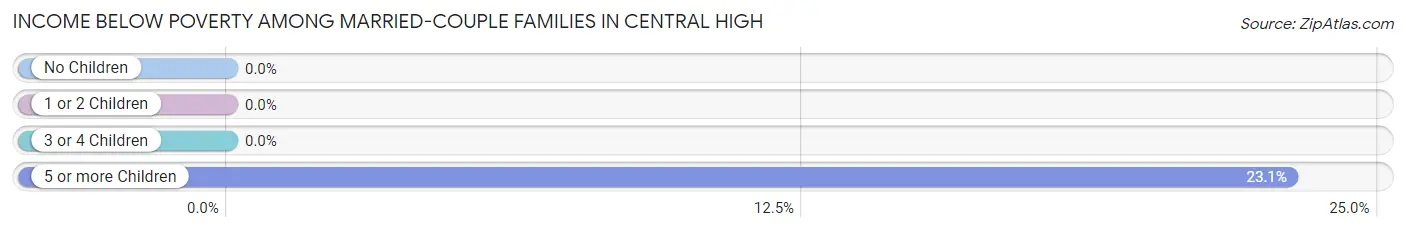
| Children | Above Poverty | Below Poverty |
| No Children | 167 (100.0%) | 0 (0.0%) |
| 1 or 2 Children | 122 (100.0%) | 0 (0.0%) |
| 3 or 4 Children | 17 (100.0%) | 0 (0.0%) |
| 5 or more Children | 10 (76.9%) | 3 (23.1%) |
| Total | 316 (99.1%) | 3 (0.9%) |
Income Below Poverty Among Single-Parent Households in Central High
According to the poverty data in Central High, 50.0% or 17 single-father households and 38.7% or 12 single-mother households are living below the poverty line. Among single-father households, those with 1 or 2 children have the highest poverty rate, with 17 households (80.9%) experiencing poverty. Likewise, among single-mother households, those with 1 or 2 children have the highest poverty rate, with 12 households (85.7%) falling below the poverty line.
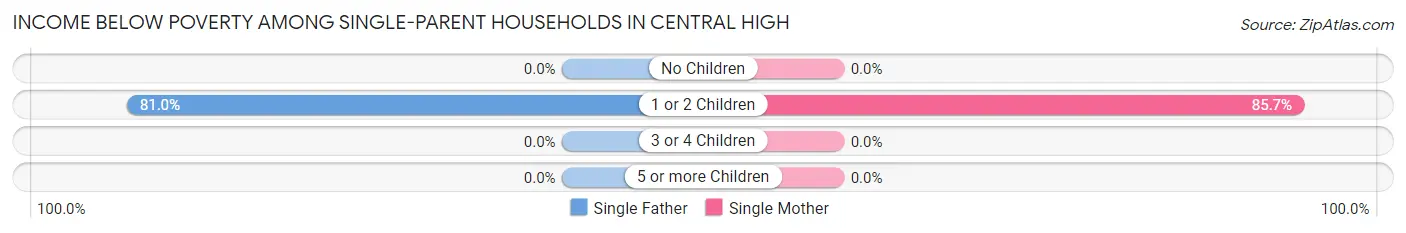
| Children | Single Father | Single Mother |
| No Children | 0 (0.0%) | 0 (0.0%) |
| 1 or 2 Children | 17 (80.9%) | 12 (85.7%) |
| 3 or 4 Children | 0 (0.0%) | 0 (0.0%) |
| 5 or more Children | 0 (0.0%) | 0 (0.0%) |
| Total | 17 (50.0%) | 12 (38.7%) |
Income Below Poverty Among Married-Couple vs Single-Parent Households in Central High
The poverty data for Central High shows that 3 of the married-couple family households (0.9%) and 29 of the single-parent households (44.6%) are living below the poverty level. Within the married-couple family households, those with 5 or more children have the highest poverty rate, with 3 households (23.1%) falling below the poverty line. Among the single-parent households, those with 1 or 2 children have the highest poverty rate, with 29 household (82.9%) living below poverty.
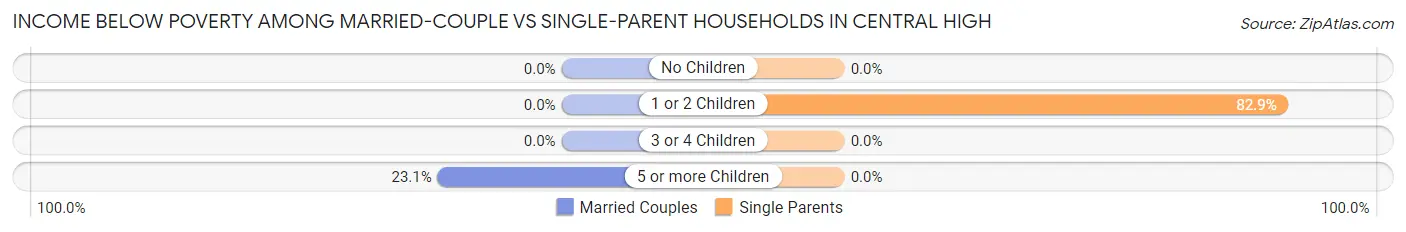
| Children | Married-Couple Families | Single-Parent Households |
| No Children | 0 (0.0%) | 0 (0.0%) |
| 1 or 2 Children | 0 (0.0%) | 29 (82.9%) |
| 3 or 4 Children | 0 (0.0%) | 0 (0.0%) |
| 5 or more Children | 3 (23.1%) | 0 (0.0%) |
| Total | 3 (0.9%) | 29 (44.6%) |
Employment Characteristics in Central High
Employment by Class of Employer in Central High
Among the 585 employed individuals in Central High, private company employees (377 | 64.4%), state government employees (60 | 10.3%), and local government employees (57 | 9.7%) make up the most common classes of employment.
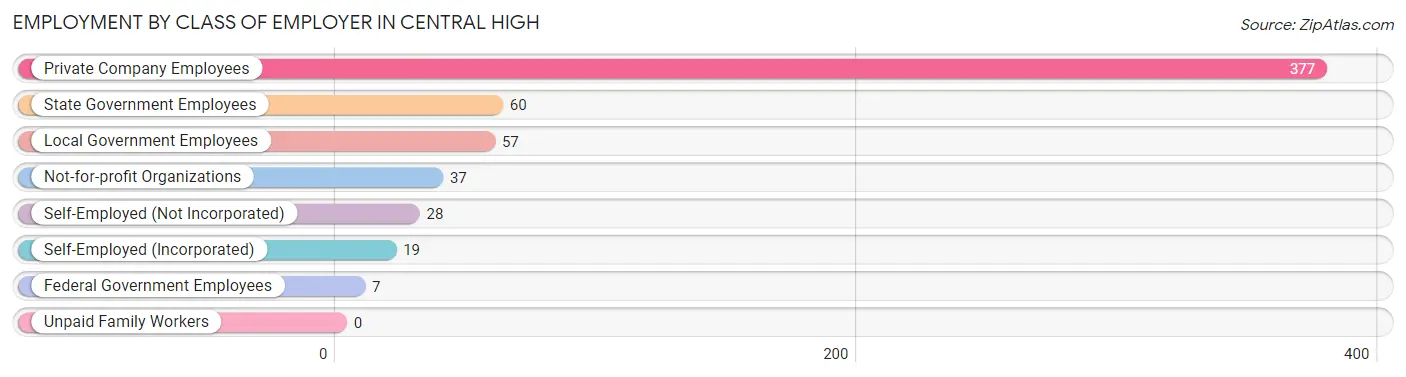
| Employer Class | # Employees | % Employees |
| Private Company Employees | 377 | 64.4% |
| Self-Employed (Incorporated) | 19 | 3.3% |
| Self-Employed (Not Incorporated) | 28 | 4.8% |
| Not-for-profit Organizations | 37 | 6.3% |
| Local Government Employees | 57 | 9.7% |
| State Government Employees | 60 | 10.3% |
| Federal Government Employees | 7 | 1.2% |
| Unpaid Family Workers | 0 | 0.0% |
| Total | 585 | 100.0% |
Employment Status by Age in Central High
According to the labor force statistics for Central High, out of the total population over 16 years of age (1,065), 59.9% or 638 individuals are in the labor force, with 6.4% or 41 of them unemployed. The age group with the highest labor force participation rate is 30 to 34 years, with 97.7% or 84 individuals in the labor force. Within the labor force, the 20 to 24 years age range has the highest percentage of unemployed individuals, with 20.0% or 6 of them being unemployed.
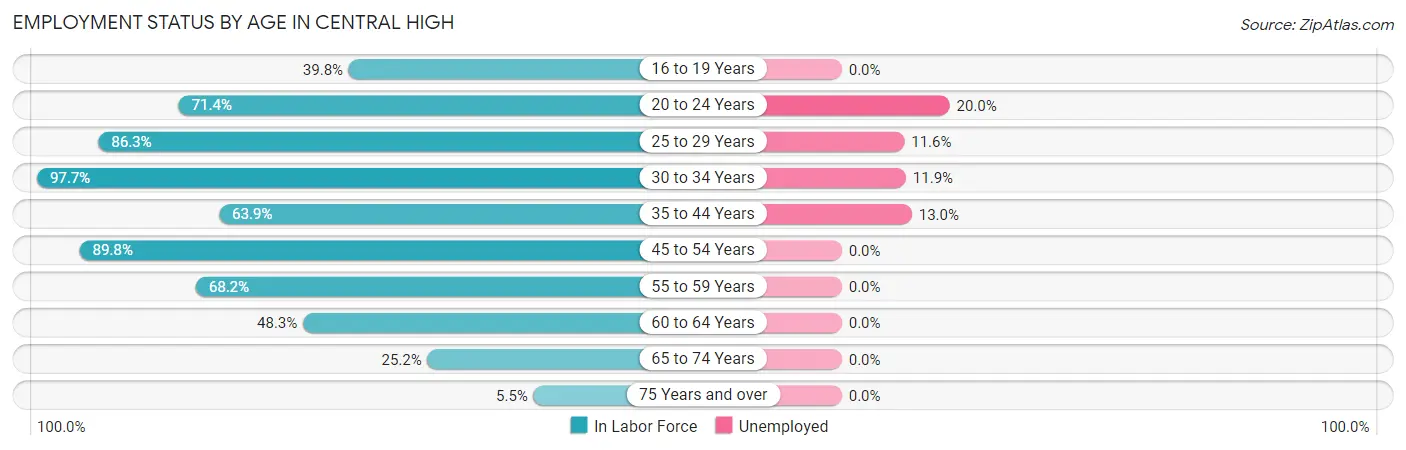
| Age Bracket | In Labor Force | Unemployed |
| 16 to 19 Years | 51 (39.8%) | 0 (0.0%) |
| 20 to 24 Years | 30 (71.4%) | 6 (20.0%) |
| 25 to 29 Years | 69 (86.3%) | 8 (11.6%) |
| 30 to 34 Years | 84 (97.7%) | 10 (11.9%) |
| 35 to 44 Years | 131 (63.9%) | 17 (13.0%) |
| 45 to 54 Years | 123 (89.8%) | 0 (0.0%) |
| 55 to 59 Years | 58 (68.2%) | 0 (0.0%) |
| 60 to 64 Years | 56 (48.3%) | 0 (0.0%) |
| 65 to 74 Years | 33 (25.2%) | 0 (0.0%) |
| 75 Years and over | 3 (5.5%) | 0 (0.0%) |
| Total | 638 (59.9%) | 41 (6.4%) |
Employment Status by Educational Attainment in Central High
According to labor force statistics for Central High, 73.5% of individuals (521) out of the total population between 25 and 64 years of age (709) are in the labor force, with 6.7% or 35 of them being unemployed. The group with the highest labor force participation rate are those with the educational attainment of college / associate degree, with 78.4% or 232 individuals in the labor force. Within the labor force, individuals with less than high school education have the highest percentage of unemployment, with 28.6% or 4 of them being unemployed.
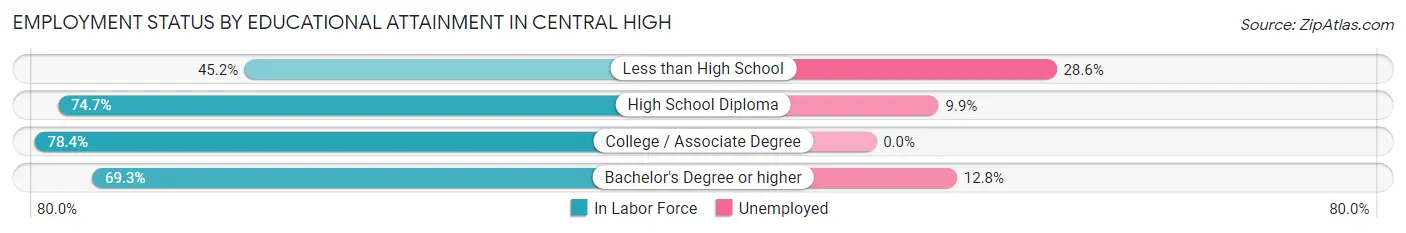
| Educational Attainment | In Labor Force | Unemployed |
| Less than High School | 14 (45.2%) | 9 (28.6%) |
| High School Diploma | 142 (74.7%) | 19 (9.9%) |
| College / Associate Degree | 232 (78.4%) | 0 (0.0%) |
| Bachelor's Degree or higher | 133 (69.3%) | 25 (12.8%) |
| Total | 521 (73.5%) | 48 (6.7%) |
Employment Occupations by Sex in Central High
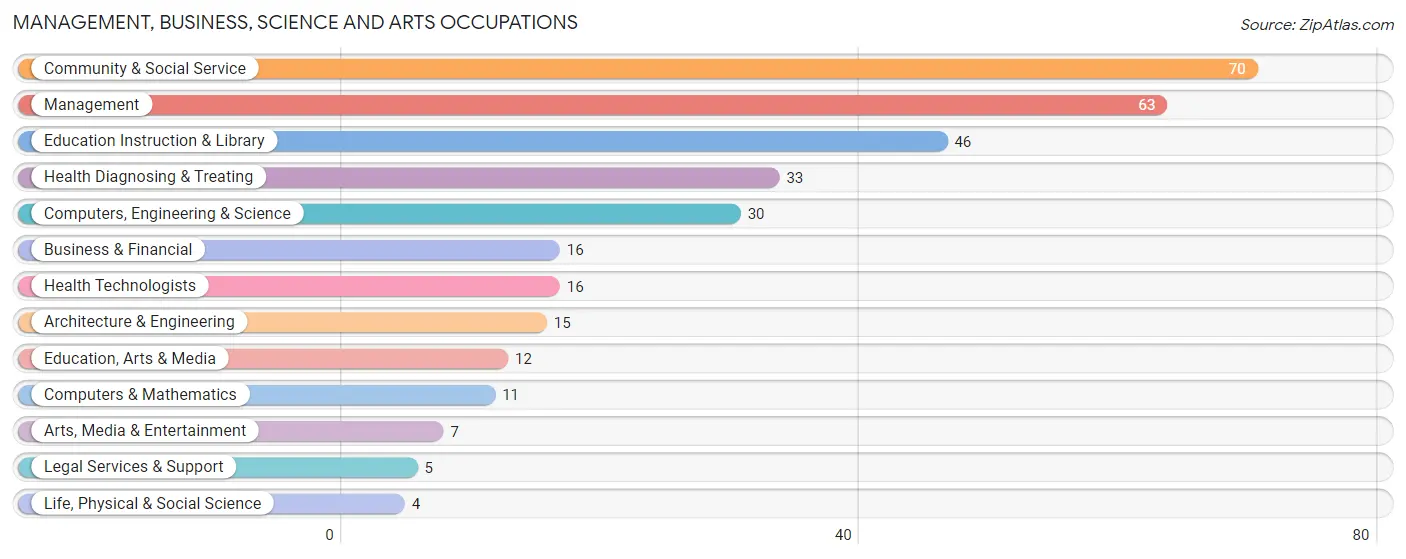
Management, Business, Science and Arts Occupations
The most common Management, Business, Science and Arts occupations in Central High are Community & Social Service (70 | 11.7%), Management (63 | 10.5%), Education Instruction & Library (46 | 7.7%), Health Diagnosing & Treating (33 | 5.5%), and Computers, Engineering & Science (30 | 5.0%).
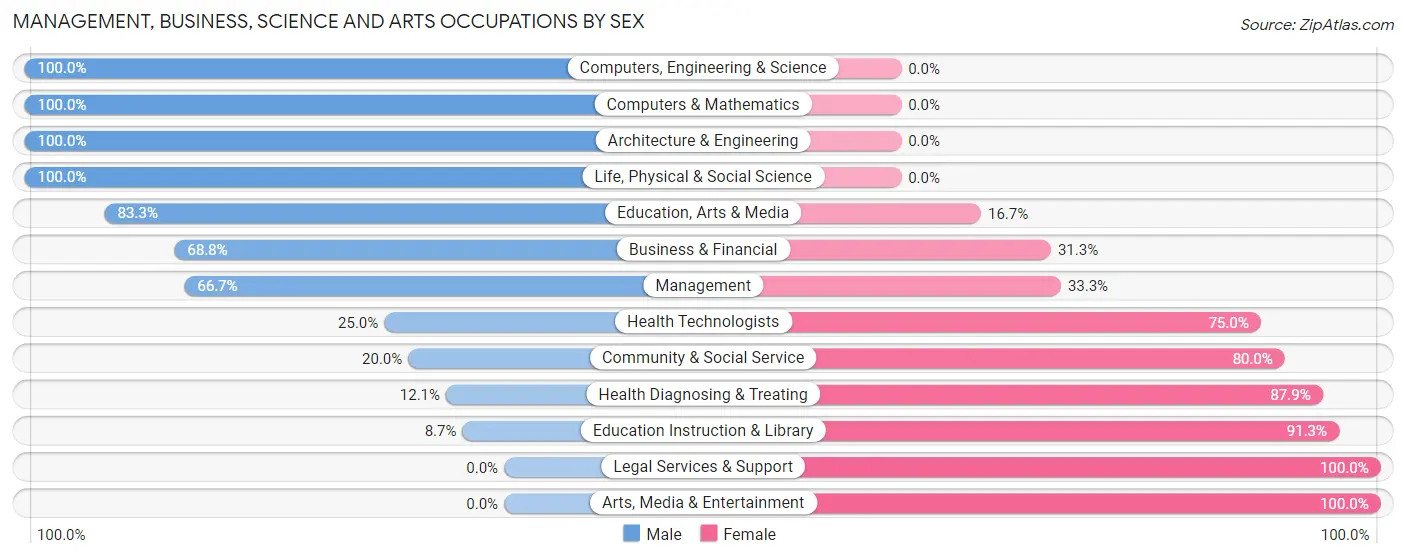
Management, Business, Science and Arts Occupations by Sex
Within the Management, Business, Science and Arts occupations in Central High, the most male-oriented occupations are Computers, Engineering & Science (100.0%), Computers & Mathematics (100.0%), and Architecture & Engineering (100.0%), while the most female-oriented occupations are Legal Services & Support (100.0%), Arts, Media & Entertainment (100.0%), and Education Instruction & Library (91.3%).
| Occupation | Male | Female |
| Management | 42 (66.7%) | 21 (33.3%) |
| Business & Financial | 11 (68.8%) | 5 (31.2%) |
| Computers, Engineering & Science | 30 (100.0%) | 0 (0.0%) |
| Computers & Mathematics | 11 (100.0%) | 0 (0.0%) |
| Architecture & Engineering | 15 (100.0%) | 0 (0.0%) |
| Life, Physical & Social Science | 4 (100.0%) | 0 (0.0%) |
| Community & Social Service | 14 (20.0%) | 56 (80.0%) |
| Education, Arts & Media | 10 (83.3%) | 2 (16.7%) |
| Legal Services & Support | 0 (0.0%) | 5 (100.0%) |
| Education Instruction & Library | 4 (8.7%) | 42 (91.3%) |
| Arts, Media & Entertainment | 0 (0.0%) | 7 (100.0%) |
| Health Diagnosing & Treating | 4 (12.1%) | 29 (87.9%) |
| Health Technologists | 4 (25.0%) | 12 (75.0%) |
| Total (Category) | 101 (47.6%) | 111 (52.4%) |
| Total (Overall) | 311 (52.1%) | 286 (47.9%) |
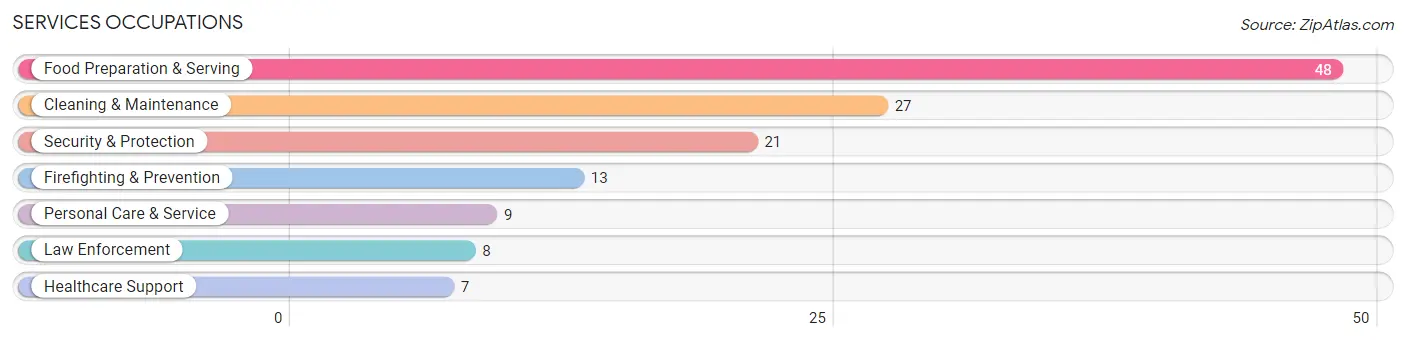
Services Occupations
The most common Services occupations in Central High are Food Preparation & Serving (48 | 8.0%), Cleaning & Maintenance (27 | 4.5%), Security & Protection (21 | 3.5%), Firefighting & Prevention (13 | 2.2%), and Personal Care & Service (9 | 1.5%).
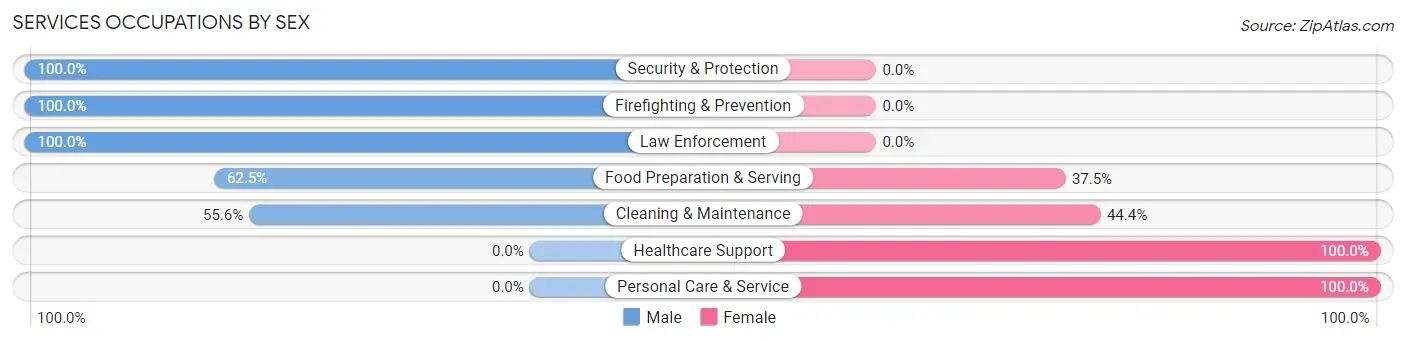
Services Occupations by Sex
Within the Services occupations in Central High, the most male-oriented occupations are Security & Protection (100.0%), Firefighting & Prevention (100.0%), and Law Enforcement (100.0%), while the most female-oriented occupations are Healthcare Support (100.0%), Personal Care & Service (100.0%), and Cleaning & Maintenance (44.4%).
| Occupation | Male | Female |
| Healthcare Support | 0 (0.0%) | 7 (100.0%) |
| Security & Protection | 21 (100.0%) | 0 (0.0%) |
| Firefighting & Prevention | 13 (100.0%) | 0 (0.0%) |
| Law Enforcement | 8 (100.0%) | 0 (0.0%) |
| Food Preparation & Serving | 30 (62.5%) | 18 (37.5%) |
| Cleaning & Maintenance | 15 (55.6%) | 12 (44.4%) |
| Personal Care & Service | 0 (0.0%) | 9 (100.0%) |
| Total (Category) | 66 (58.9%) | 46 (41.1%) |
| Total (Overall) | 311 (52.1%) | 286 (47.9%) |
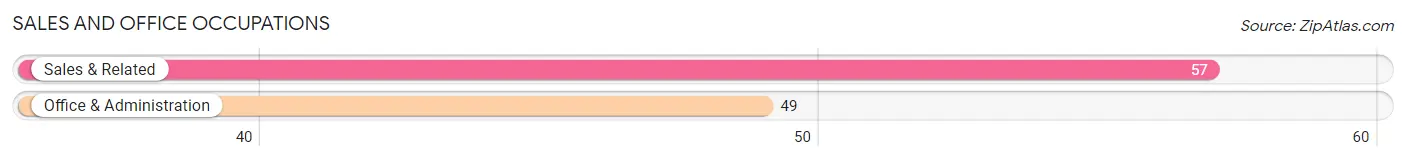
Sales and Office Occupations
The most common Sales and Office occupations in Central High are Sales & Related (57 | 9.6%), and Office & Administration (49 | 8.2%).
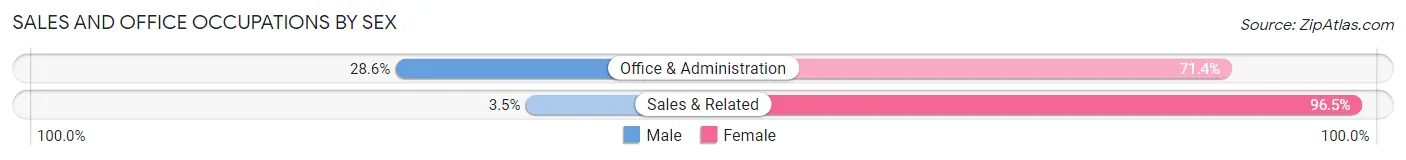
Sales and Office Occupations by Sex
| Occupation | Male | Female |
| Sales & Related | 2 (3.5%) | 55 (96.5%) |
| Office & Administration | 14 (28.6%) | 35 (71.4%) |
| Total (Category) | 16 (15.1%) | 90 (84.9%) |
| Total (Overall) | 311 (52.1%) | 286 (47.9%) |
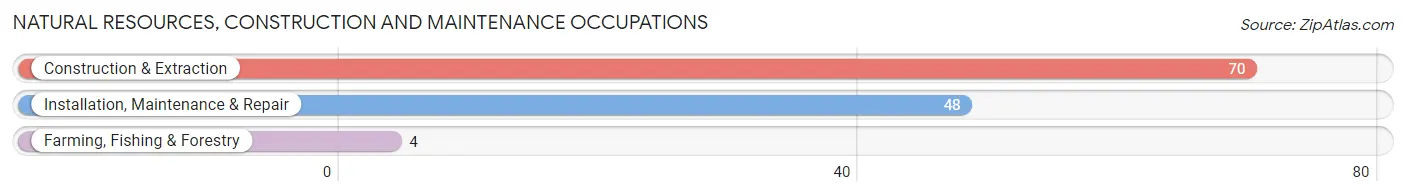
Natural Resources, Construction and Maintenance Occupations
The most common Natural Resources, Construction and Maintenance occupations in Central High are Construction & Extraction (70 | 11.7%), Installation, Maintenance & Repair (48 | 8.0%), and Farming, Fishing & Forestry (4 | 0.7%).
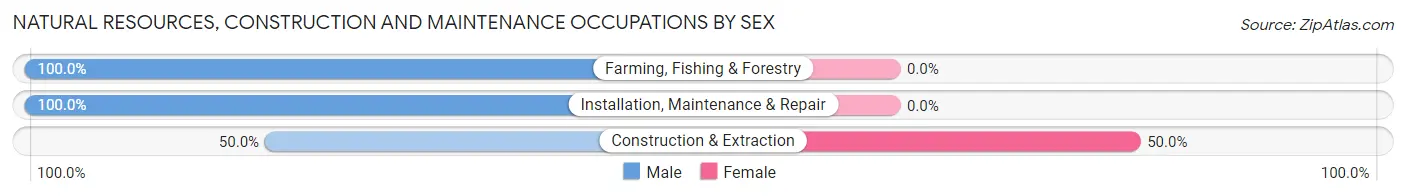
Natural Resources, Construction and Maintenance Occupations by Sex
| Occupation | Male | Female |
| Farming, Fishing & Forestry | 4 (100.0%) | 0 (0.0%) |
| Construction & Extraction | 35 (50.0%) | 35 (50.0%) |
| Installation, Maintenance & Repair | 48 (100.0%) | 0 (0.0%) |
| Total (Category) | 87 (71.3%) | 35 (28.7%) |
| Total (Overall) | 311 (52.1%) | 286 (47.9%) |
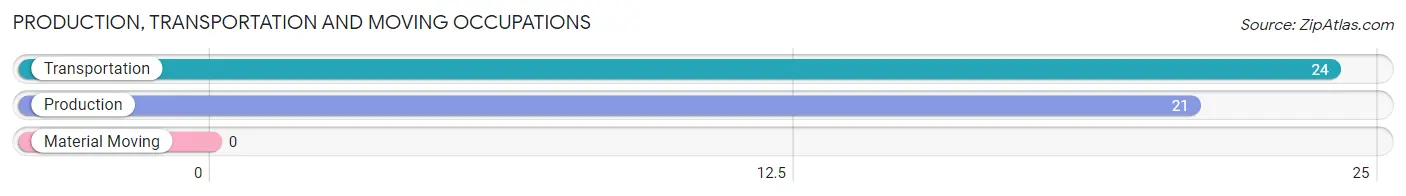
Production, Transportation and Moving Occupations
The most common Production, Transportation and Moving occupations in Central High are Transportation (24 | 4.0%), and Production (21 | 3.5%).
Production, Transportation and Moving Occupations by Sex
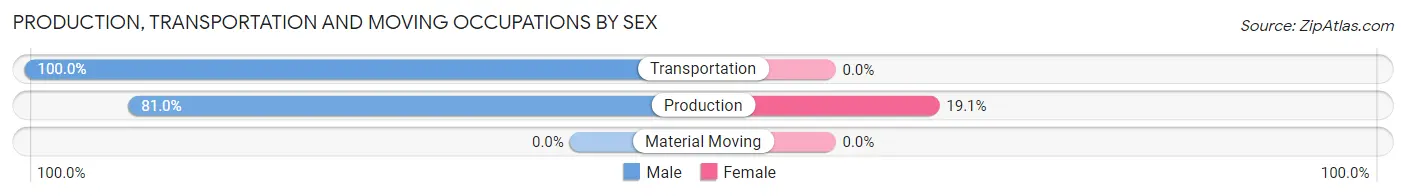
| Occupation | Male | Female |
| Production | 17 (80.9%) | 4 (19.1%) |
| Transportation | 24 (100.0%) | 0 (0.0%) |
| Material Moving | 0 (0.0%) | 0 (0.0%) |
| Total (Category) | 41 (91.1%) | 4 (8.9%) |
| Total (Overall) | 311 (52.1%) | 286 (47.9%) |
Employment Industries by Sex in Central High
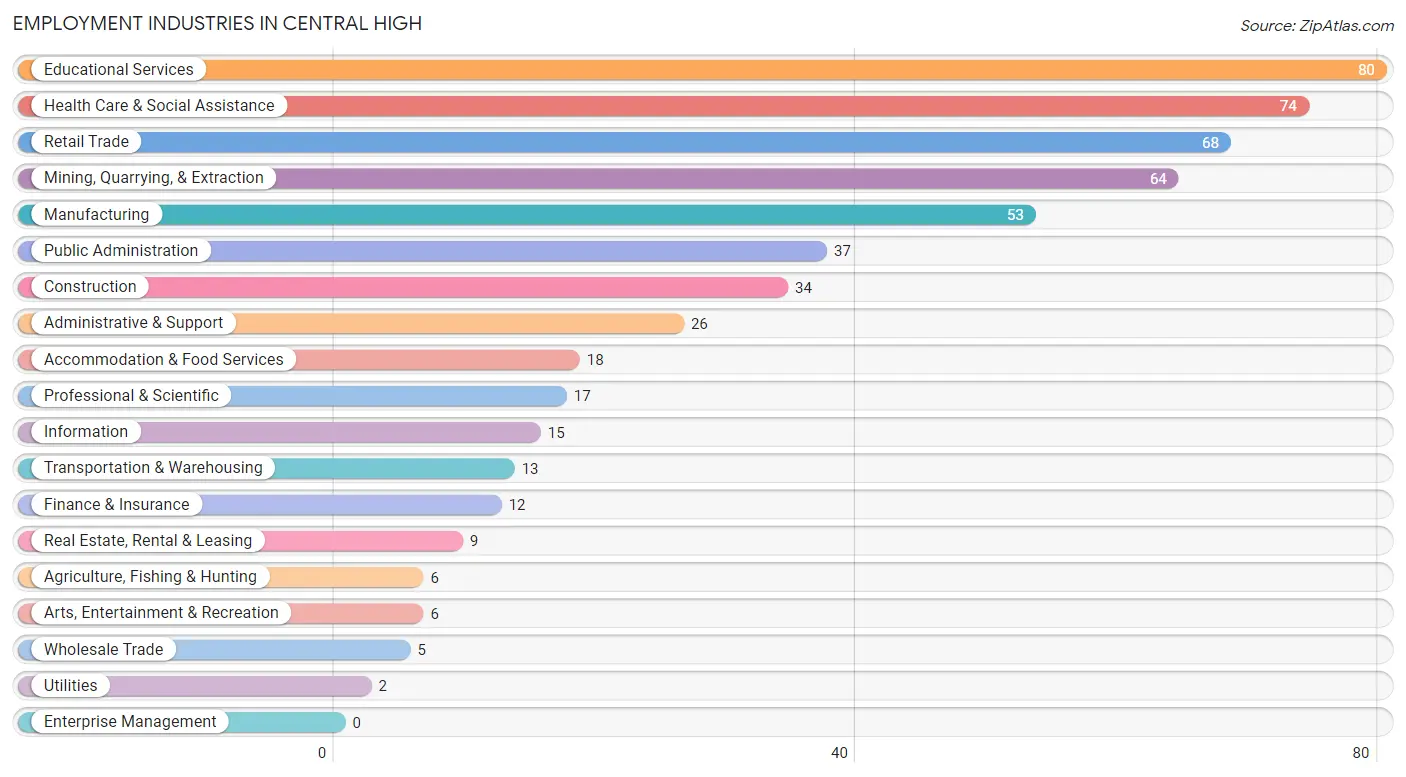
Employment Industries in Central High
The major employment industries in Central High include Educational Services (80 | 13.4%), Health Care & Social Assistance (74 | 12.4%), Retail Trade (68 | 11.4%), Mining, Quarrying, & Extraction (64 | 10.7%), and Manufacturing (53 | 8.9%).
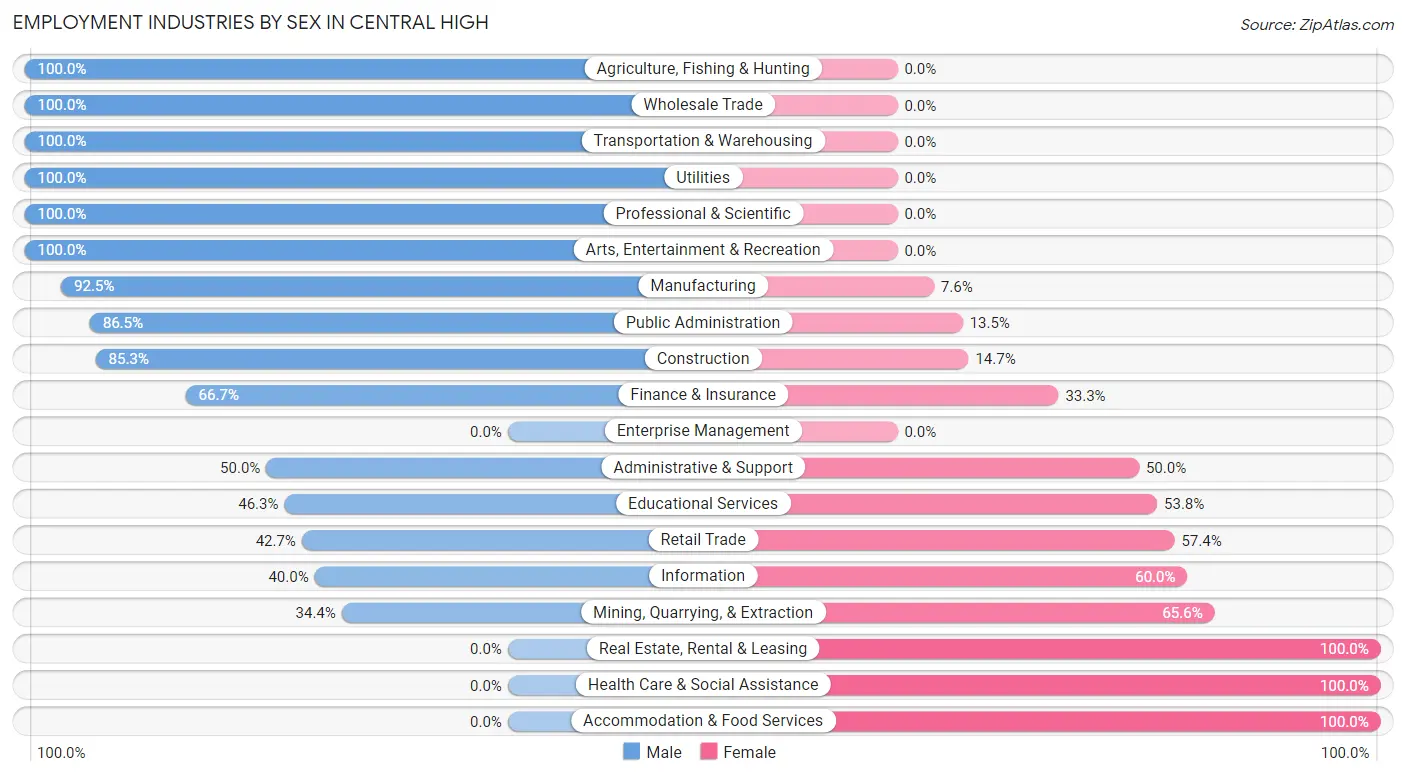
Employment Industries by Sex in Central High
The Central High industries that see more men than women are Agriculture, Fishing & Hunting (100.0%), Wholesale Trade (100.0%), and Transportation & Warehousing (100.0%), whereas the industries that tend to have a higher number of women are Real Estate, Rental & Leasing (100.0%), Health Care & Social Assistance (100.0%), and Accommodation & Food Services (100.0%).
| Industry | Male | Female |
| Agriculture, Fishing & Hunting | 6 (100.0%) | 0 (0.0%) |
| Mining, Quarrying, & Extraction | 22 (34.4%) | 42 (65.6%) |
| Construction | 29 (85.3%) | 5 (14.7%) |
| Manufacturing | 49 (92.4%) | 4 (7.5%) |
| Wholesale Trade | 5 (100.0%) | 0 (0.0%) |
| Retail Trade | 29 (42.6%) | 39 (57.4%) |
| Transportation & Warehousing | 13 (100.0%) | 0 (0.0%) |
| Utilities | 2 (100.0%) | 0 (0.0%) |
| Information | 6 (40.0%) | 9 (60.0%) |
| Finance & Insurance | 8 (66.7%) | 4 (33.3%) |
| Real Estate, Rental & Leasing | 0 (0.0%) | 9 (100.0%) |
| Professional & Scientific | 17 (100.0%) | 0 (0.0%) |
| Enterprise Management | 0 (0.0%) | 0 (0.0%) |
| Administrative & Support | 13 (50.0%) | 13 (50.0%) |
| Educational Services | 37 (46.3%) | 43 (53.7%) |
| Health Care & Social Assistance | 0 (0.0%) | 74 (100.0%) |
| Arts, Entertainment & Recreation | 6 (100.0%) | 0 (0.0%) |
| Accommodation & Food Services | 0 (0.0%) | 18 (100.0%) |
| Public Administration | 32 (86.5%) | 5 (13.5%) |
| Total | 311 (52.1%) | 286 (47.9%) |
Education in Central High
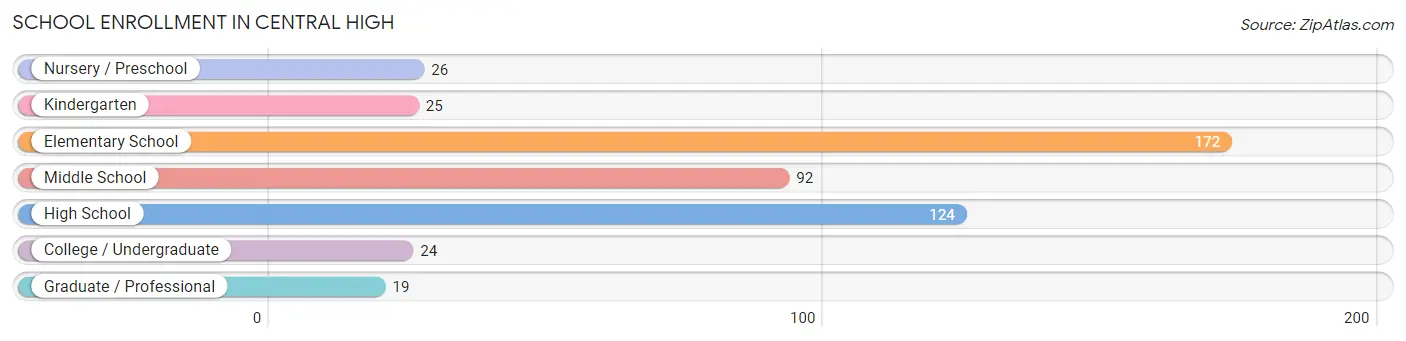
School Enrollment in Central High
The most common levels of schooling among the 482 students in Central High are elementary school (172 | 35.7%), high school (124 | 25.7%), and middle school (92 | 19.1%).
| School Level | # Students | % Students |
| Nursery / Preschool | 26 | 5.4% |
| Kindergarten | 25 | 5.2% |
| Elementary School | 172 | 35.7% |
| Middle School | 92 | 19.1% |
| High School | 124 | 25.7% |
| College / Undergraduate | 24 | 5.0% |
| Graduate / Professional | 19 | 3.9% |
| Total | 482 | 100.0% |
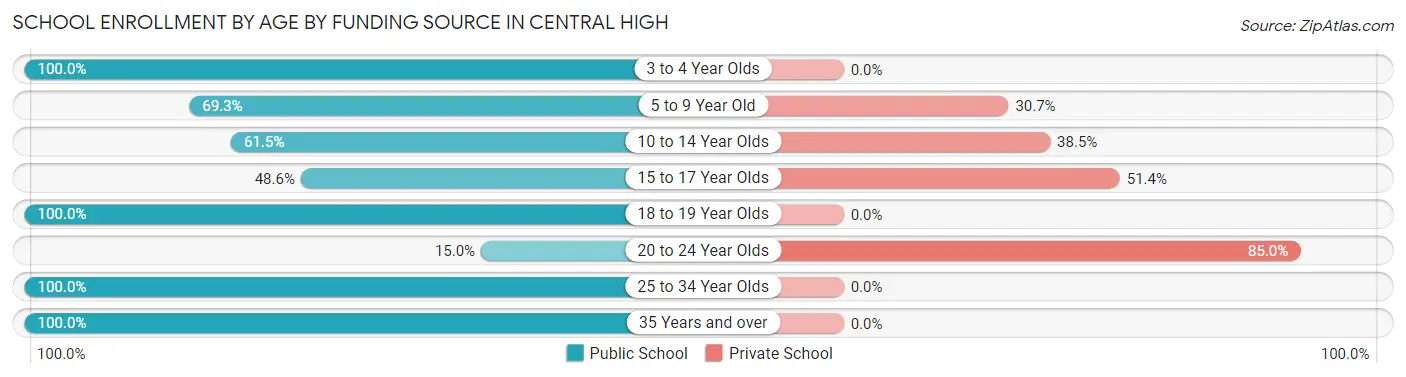
School Enrollment by Age by Funding Source in Central High
Out of a total of 482 students who are enrolled in schools in Central High, 161 (33.4%) attend a private institution, while the remaining 321 (66.6%) are enrolled in public schools. The age group of 20 to 24 year olds has the highest likelihood of being enrolled in private schools, with 17 (85.0% in the age bracket) enrolled. Conversely, the age group of 3 to 4 year olds has the lowest likelihood of being enrolled in a private school, with 13 (100.0% in the age bracket) attending a public institution.
| Age Bracket | Public School | Private School |
| 3 to 4 Year Olds | 13 (100.0%) | 0 (0.0%) |
| 5 to 9 Year Old | 131 (69.3%) | 58 (30.7%) |
| 10 to 14 Year Olds | 80 (61.5%) | 50 (38.5%) |
| 15 to 17 Year Olds | 34 (48.6%) | 36 (51.4%) |
| 18 to 19 Year Olds | 40 (100.0%) | 0 (0.0%) |
| 20 to 24 Year Olds | 3 (15.0%) | 17 (85.0%) |
| 25 to 34 Year Olds | 8 (100.0%) | 0 (0.0%) |
| 35 Years and over | 12 (100.0%) | 0 (0.0%) |
| Total | 321 (66.6%) | 161 (33.4%) |
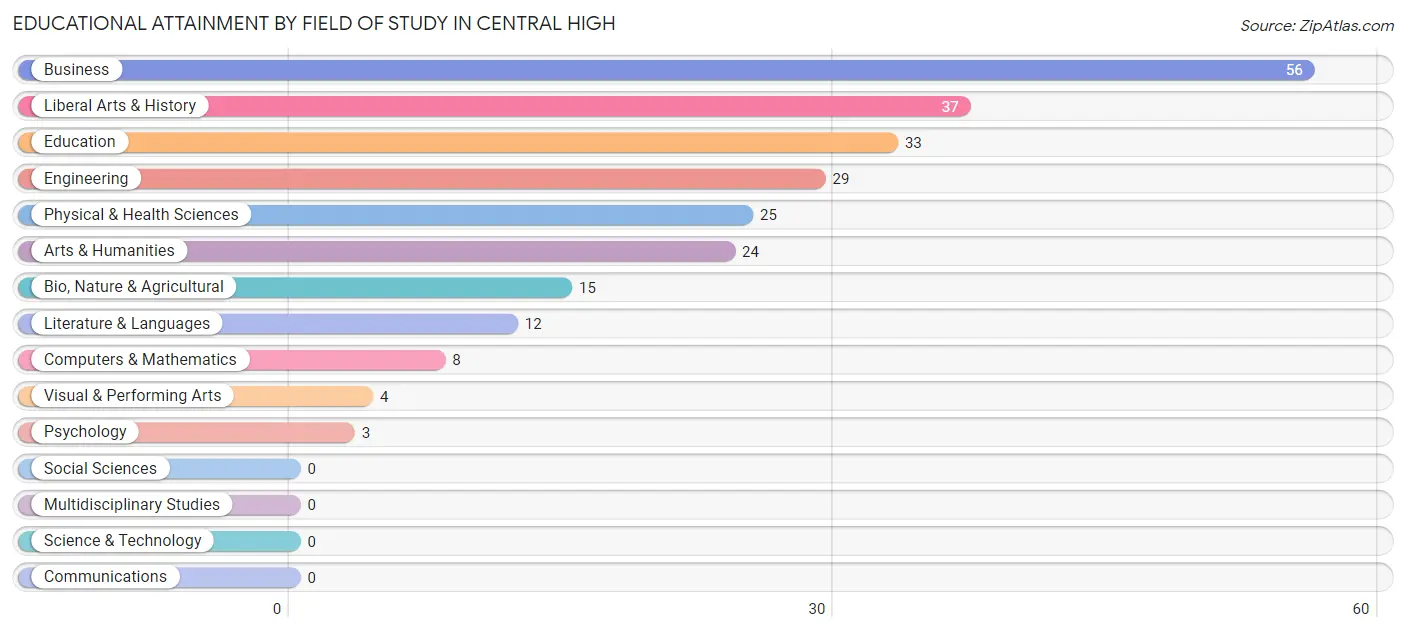
Educational Attainment by Field of Study in Central High
Business (56 | 22.8%), liberal arts & history (37 | 15.0%), education (33 | 13.4%), engineering (29 | 11.8%), and physical & health sciences (25 | 10.2%) are the most common fields of study among 246 individuals in Central High who have obtained a bachelor's degree or higher.
| Field of Study | # Graduates | % Graduates |
| Computers & Mathematics | 8 | 3.3% |
| Bio, Nature & Agricultural | 15 | 6.1% |
| Physical & Health Sciences | 25 | 10.2% |
| Psychology | 3 | 1.2% |
| Social Sciences | 0 | 0.0% |
| Engineering | 29 | 11.8% |
| Multidisciplinary Studies | 0 | 0.0% |
| Science & Technology | 0 | 0.0% |
| Business | 56 | 22.8% |
| Education | 33 | 13.4% |
| Literature & Languages | 12 | 4.9% |
| Liberal Arts & History | 37 | 15.0% |
| Visual & Performing Arts | 4 | 1.6% |
| Communications | 0 | 0.0% |
| Arts & Humanities | 24 | 9.8% |
| Total | 246 | 100.0% |
Transportation & Commute in Central High
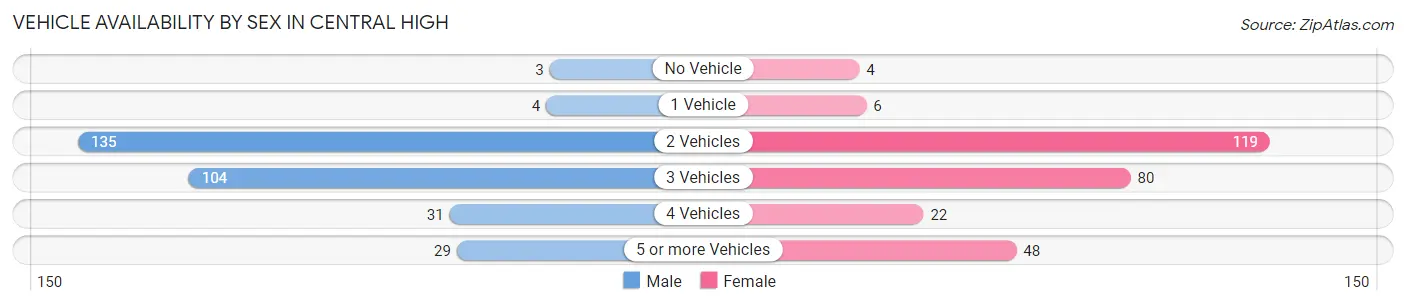
Vehicle Availability by Sex in Central High
The most prevalent vehicle ownership categories in Central High are males with 2 vehicles (135, accounting for 44.1%) and females with 2 vehicles (119, making up 48.4%).
| Vehicles Available | Male | Female |
| No Vehicle | 3 (1.0%) | 4 (1.4%) |
| 1 Vehicle | 4 (1.3%) | 6 (2.1%) |
| 2 Vehicles | 135 (44.1%) | 119 (42.6%) |
| 3 Vehicles | 104 (34.0%) | 80 (28.7%) |
| 4 Vehicles | 31 (10.1%) | 22 (7.9%) |
| 5 or more Vehicles | 29 (9.5%) | 48 (17.2%) |
| Total | 306 (100.0%) | 279 (100.0%) |
Commute Time in Central High
The most frequently occuring commute durations in Central High are 20 to 24 minutes (174 commuters, 30.7%), 30 to 34 minutes (102 commuters, 18.0%), and 10 to 14 minutes (54 commuters, 9.5%).
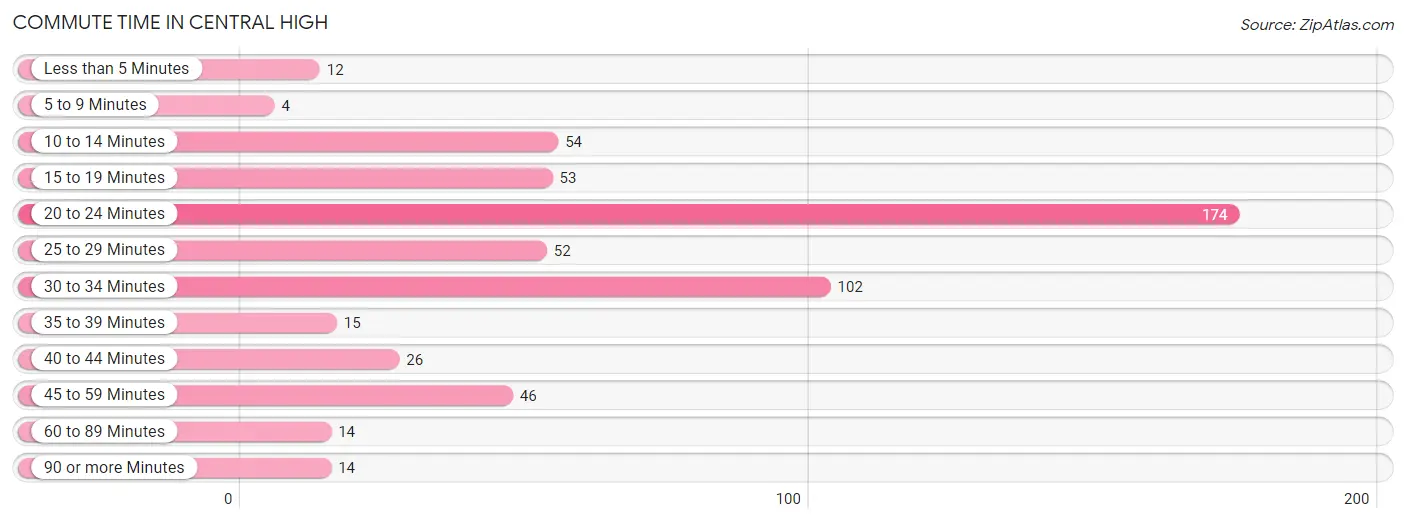
| Commute Time | # Commuters | % Commuters |
| Less than 5 Minutes | 12 | 2.1% |
| 5 to 9 Minutes | 4 | 0.7% |
| 10 to 14 Minutes | 54 | 9.5% |
| 15 to 19 Minutes | 53 | 9.4% |
| 20 to 24 Minutes | 174 | 30.7% |
| 25 to 29 Minutes | 52 | 9.2% |
| 30 to 34 Minutes | 102 | 18.0% |
| 35 to 39 Minutes | 15 | 2.6% |
| 40 to 44 Minutes | 26 | 4.6% |
| 45 to 59 Minutes | 46 | 8.1% |
| 60 to 89 Minutes | 14 | 2.5% |
| 90 or more Minutes | 14 | 2.5% |
Commute Time by Sex in Central High
The most common commute times in Central High are 20 to 24 minutes (61 commuters, 19.9%) for males and 20 to 24 minutes (113 commuters, 43.5%) for females.
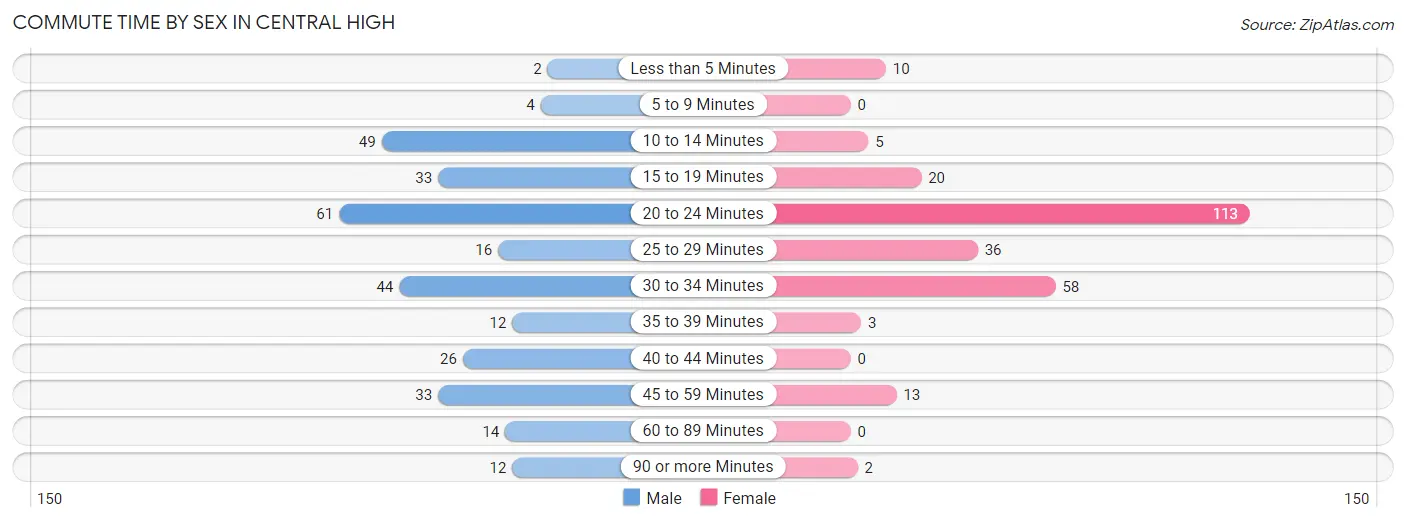
| Commute Time | Male | Female |
| Less than 5 Minutes | 2 (0.6%) | 10 (3.8%) |
| 5 to 9 Minutes | 4 (1.3%) | 0 (0.0%) |
| 10 to 14 Minutes | 49 (16.0%) | 5 (1.9%) |
| 15 to 19 Minutes | 33 (10.8%) | 20 (7.7%) |
| 20 to 24 Minutes | 61 (19.9%) | 113 (43.5%) |
| 25 to 29 Minutes | 16 (5.2%) | 36 (13.9%) |
| 30 to 34 Minutes | 44 (14.4%) | 58 (22.3%) |
| 35 to 39 Minutes | 12 (3.9%) | 3 (1.1%) |
| 40 to 44 Minutes | 26 (8.5%) | 0 (0.0%) |
| 45 to 59 Minutes | 33 (10.8%) | 13 (5.0%) |
| 60 to 89 Minutes | 14 (4.6%) | 0 (0.0%) |
| 90 or more Minutes | 12 (3.9%) | 2 (0.8%) |
Time of Departure to Work by Sex in Central High
The most frequent times of departure to work in Central High are 7:00 AM to 7:29 AM (76, 24.8%) for males and 6:30 AM to 6:59 AM (58, 22.3%) for females.
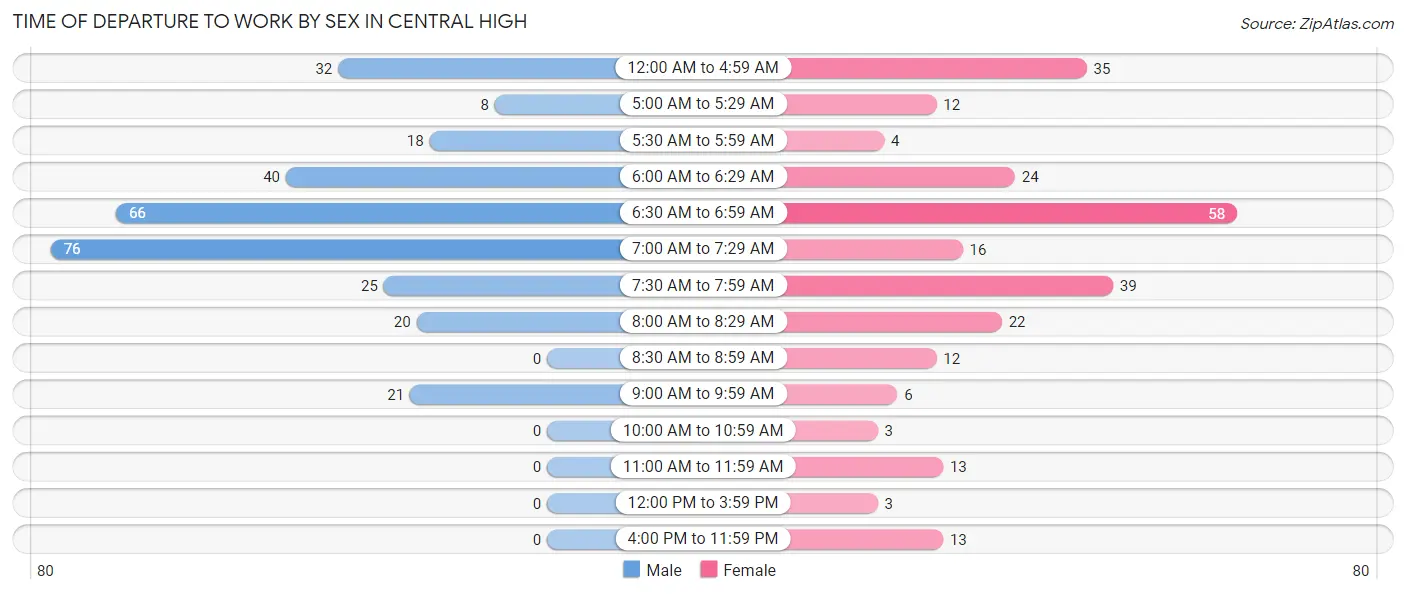
| Time of Departure | Male | Female |
| 12:00 AM to 4:59 AM | 32 (10.5%) | 35 (13.5%) |
| 5:00 AM to 5:29 AM | 8 (2.6%) | 12 (4.6%) |
| 5:30 AM to 5:59 AM | 18 (5.9%) | 4 (1.5%) |
| 6:00 AM to 6:29 AM | 40 (13.1%) | 24 (9.2%) |
| 6:30 AM to 6:59 AM | 66 (21.6%) | 58 (22.3%) |
| 7:00 AM to 7:29 AM | 76 (24.8%) | 16 (6.1%) |
| 7:30 AM to 7:59 AM | 25 (8.2%) | 39 (15.0%) |
| 8:00 AM to 8:29 AM | 20 (6.5%) | 22 (8.5%) |
| 8:30 AM to 8:59 AM | 0 (0.0%) | 12 (4.6%) |
| 9:00 AM to 9:59 AM | 21 (6.9%) | 6 (2.3%) |
| 10:00 AM to 10:59 AM | 0 (0.0%) | 3 (1.1%) |
| 11:00 AM to 11:59 AM | 0 (0.0%) | 13 (5.0%) |
| 12:00 PM to 3:59 PM | 0 (0.0%) | 3 (1.1%) |
| 4:00 PM to 11:59 PM | 0 (0.0%) | 13 (5.0%) |
| Total | 306 (100.0%) | 260 (100.0%) |
Housing Occupancy in Central High
Occupancy by Ownership in Central High
Of the total 491 dwellings in Central High, owner-occupied units account for 432 (88.0%), while renter-occupied units make up 59 (12.0%).
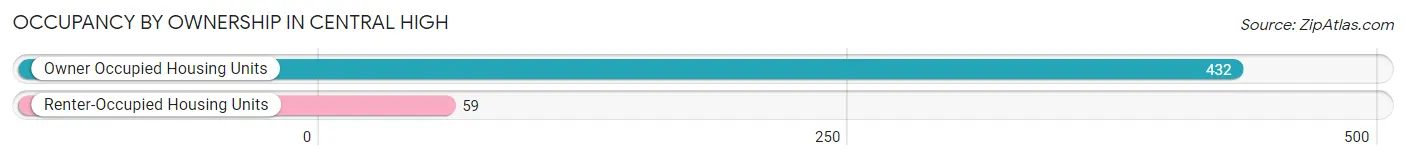
| Occupancy | # Housing Units | % Housing Units |
| Owner Occupied Housing Units | 432 | 88.0% |
| Renter-Occupied Housing Units | 59 | 12.0% |
| Total Occupied Housing Units | 491 | 100.0% |
Occupancy by Household Size in Central High
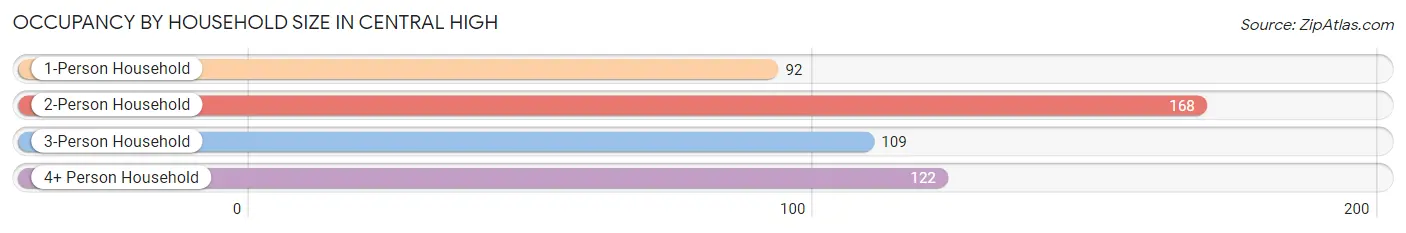
| Household Size | # Housing Units | % Housing Units |
| 1-Person Household | 92 | 18.7% |
| 2-Person Household | 168 | 34.2% |
| 3-Person Household | 109 | 22.2% |
| 4+ Person Household | 122 | 24.8% |
| Total Housing Units | 491 | 100.0% |
Occupancy by Ownership by Household Size in Central High
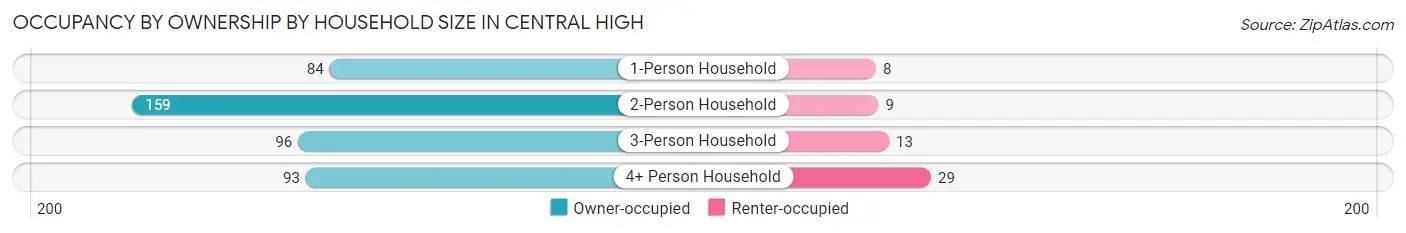
| Household Size | Owner-occupied | Renter-occupied |
| 1-Person Household | 84 (91.3%) | 8 (8.7%) |
| 2-Person Household | 159 (94.6%) | 9 (5.4%) |
| 3-Person Household | 96 (88.1%) | 13 (11.9%) |
| 4+ Person Household | 93 (76.2%) | 29 (23.8%) |
| Total Housing Units | 432 (88.0%) | 59 (12.0%) |
Occupancy by Educational Attainment in Central High
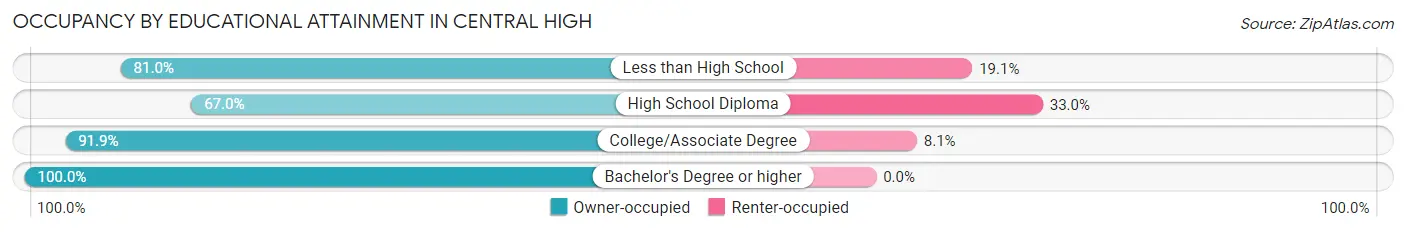
| Household Size | Owner-occupied | Renter-occupied |
| Less than High School | 17 (80.9%) | 4 (19.1%) |
| High School Diploma | 77 (67.0%) | 38 (33.0%) |
| College/Associate Degree | 194 (91.9%) | 17 (8.1%) |
| Bachelor's Degree or higher | 144 (100.0%) | 0 (0.0%) |
Occupancy by Age of Householder in Central High
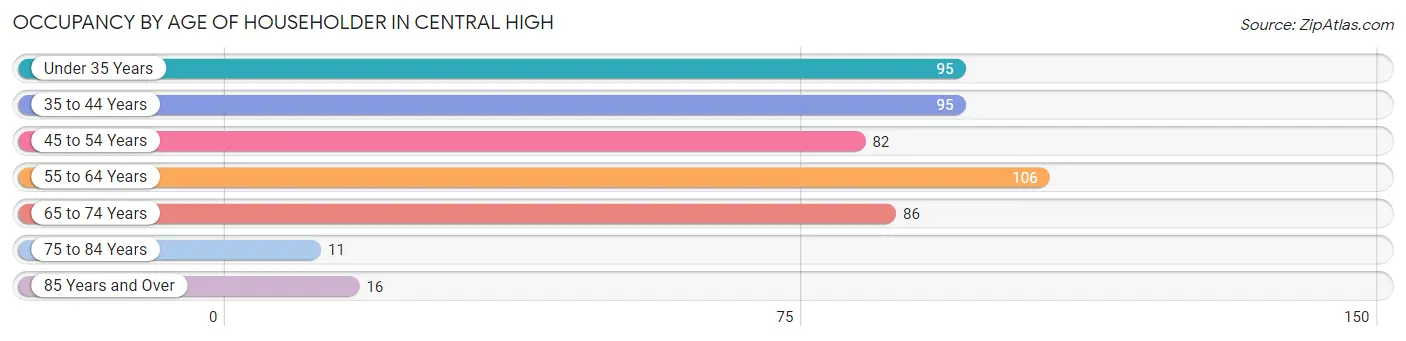
| Age Bracket | # Households | % Households |
| Under 35 Years | 95 | 19.4% |
| 35 to 44 Years | 95 | 19.4% |
| 45 to 54 Years | 82 | 16.7% |
| 55 to 64 Years | 106 | 21.6% |
| 65 to 74 Years | 86 | 17.5% |
| 75 to 84 Years | 11 | 2.2% |
| 85 Years and Over | 16 | 3.3% |
| Total | 491 | 100.0% |
Housing Finances in Central High
Median Income by Occupancy in Central High
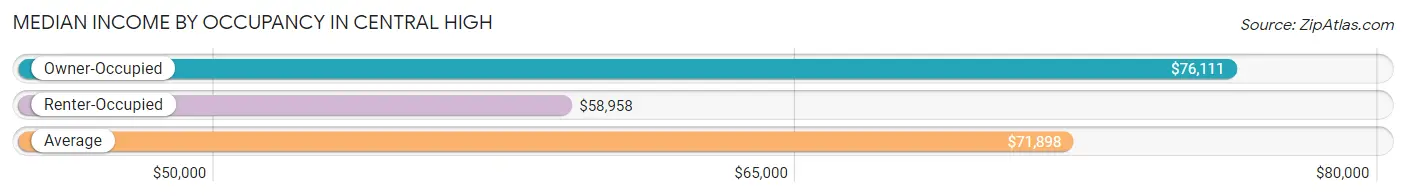
| Occupancy Type | # Households | Median Income |
| Owner-Occupied | 432 (88.0%) | $76,111 |
| Renter-Occupied | 59 (12.0%) | $58,958 |
| Average | 491 (100.0%) | $71,898 |
Occupancy by Householder Income Bracket in Central High
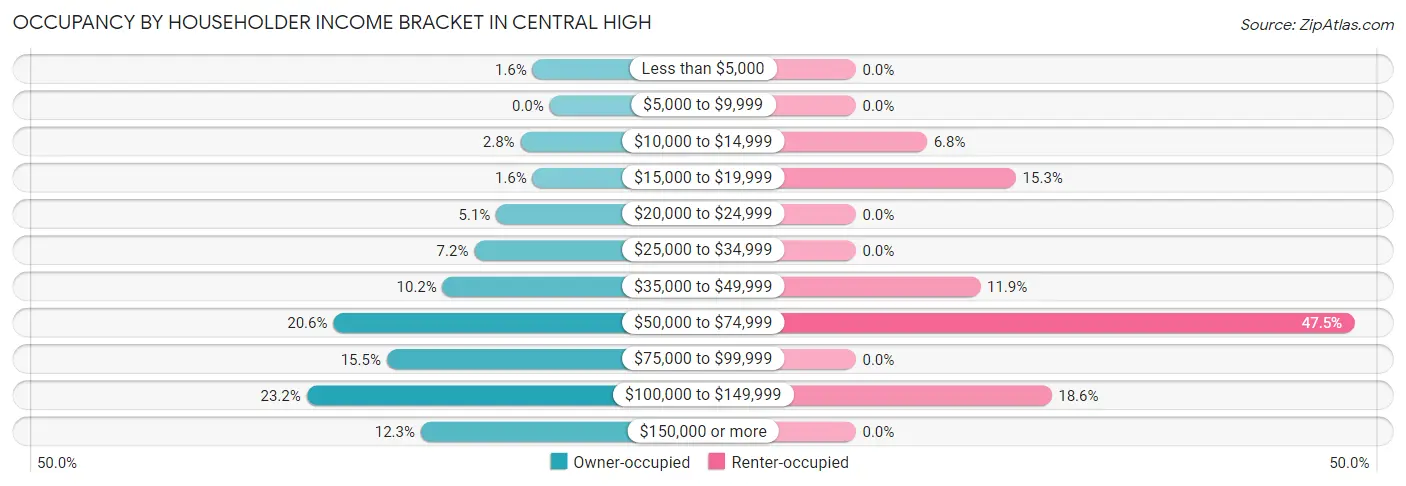
| Income Bracket | Owner-occupied | Renter-occupied |
| Less than $5,000 | 7 (1.6%) | 0 (0.0%) |
| $5,000 to $9,999 | 0 (0.0%) | 0 (0.0%) |
| $10,000 to $14,999 | 12 (2.8%) | 4 (6.8%) |
| $15,000 to $19,999 | 7 (1.6%) | 9 (15.2%) |
| $20,000 to $24,999 | 22 (5.1%) | 0 (0.0%) |
| $25,000 to $34,999 | 31 (7.2%) | 0 (0.0%) |
| $35,000 to $49,999 | 44 (10.2%) | 7 (11.9%) |
| $50,000 to $74,999 | 89 (20.6%) | 28 (47.5%) |
| $75,000 to $99,999 | 67 (15.5%) | 0 (0.0%) |
| $100,000 to $149,999 | 100 (23.2%) | 11 (18.6%) |
| $150,000 or more | 53 (12.3%) | 0 (0.0%) |
| Total | 432 (100.0%) | 59 (100.0%) |
Monthly Housing Cost Tiers in Central High
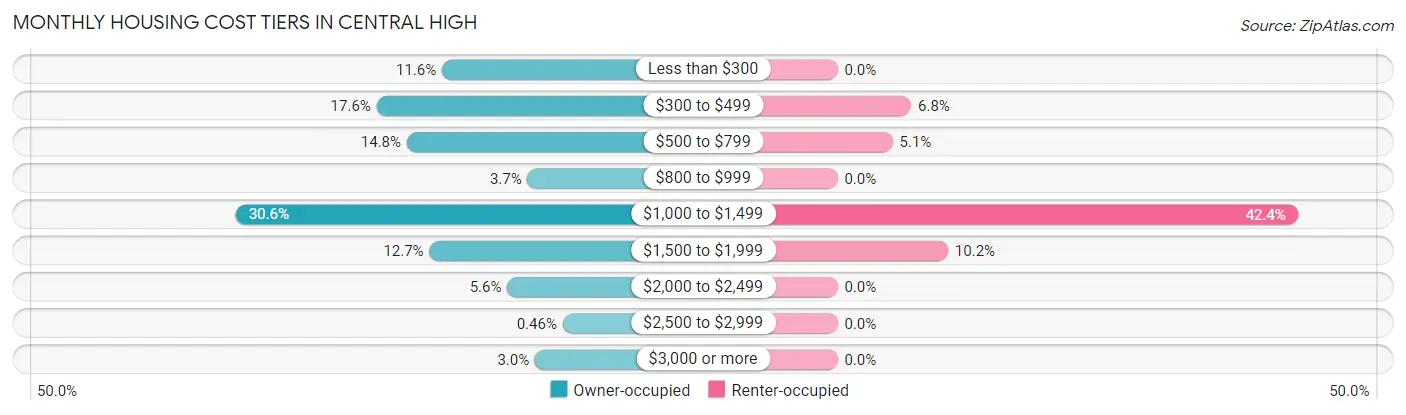
| Monthly Cost | Owner-occupied | Renter-occupied |
| Less than $300 | 50 (11.6%) | 0 (0.0%) |
| $300 to $499 | 76 (17.6%) | 4 (6.8%) |
| $500 to $799 | 64 (14.8%) | 3 (5.1%) |
| $800 to $999 | 16 (3.7%) | 0 (0.0%) |
| $1,000 to $1,499 | 132 (30.6%) | 25 (42.4%) |
| $1,500 to $1,999 | 55 (12.7%) | 6 (10.2%) |
| $2,000 to $2,499 | 24 (5.6%) | 0 (0.0%) |
| $2,500 to $2,999 | 2 (0.5%) | 0 (0.0%) |
| $3,000 or more | 13 (3.0%) | 0 (0.0%) |
| Total | 432 (100.0%) | 59 (100.0%) |
Physical Housing Characteristics in Central High
Housing Structures in Central High
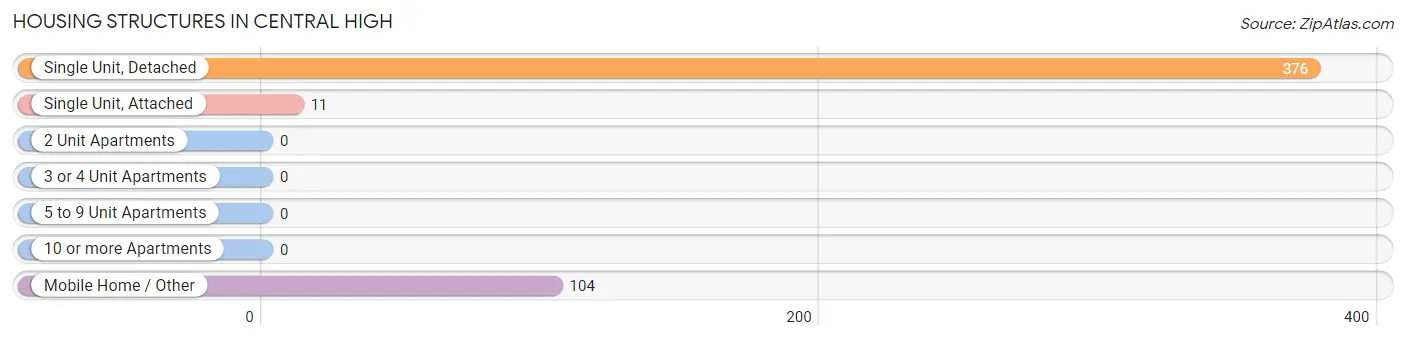
| Structure Type | # Housing Units | % Housing Units |
| Single Unit, Detached | 376 | 76.6% |
| Single Unit, Attached | 11 | 2.2% |
| 2 Unit Apartments | 0 | 0.0% |
| 3 or 4 Unit Apartments | 0 | 0.0% |
| 5 to 9 Unit Apartments | 0 | 0.0% |
| 10 or more Apartments | 0 | 0.0% |
| Mobile Home / Other | 104 | 21.2% |
| Total | 491 | 100.0% |
Housing Structures by Occupancy in Central High
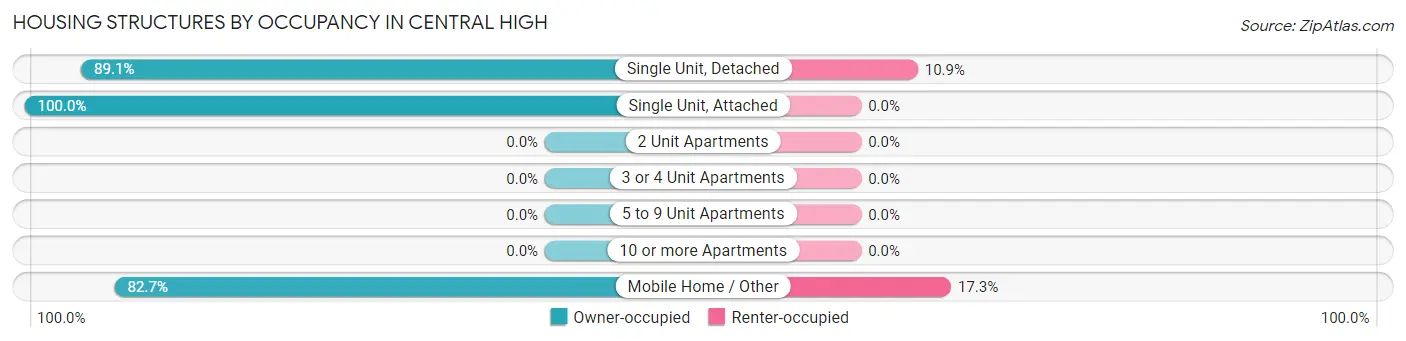
| Structure Type | Owner-occupied | Renter-occupied |
| Single Unit, Detached | 335 (89.1%) | 41 (10.9%) |
| Single Unit, Attached | 11 (100.0%) | 0 (0.0%) |
| 2 Unit Apartments | 0 (0.0%) | 0 (0.0%) |
| 3 or 4 Unit Apartments | 0 (0.0%) | 0 (0.0%) |
| 5 to 9 Unit Apartments | 0 (0.0%) | 0 (0.0%) |
| 10 or more Apartments | 0 (0.0%) | 0 (0.0%) |
| Mobile Home / Other | 86 (82.7%) | 18 (17.3%) |
| Total | 432 (88.0%) | 59 (12.0%) |
Housing Structures by Number of Rooms in Central High
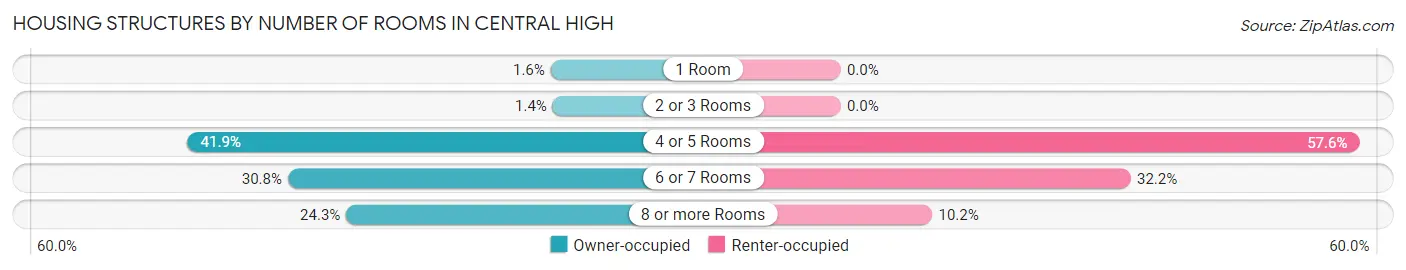
| Number of Rooms | Owner-occupied | Renter-occupied |
| 1 Room | 7 (1.6%) | 0 (0.0%) |
| 2 or 3 Rooms | 6 (1.4%) | 0 (0.0%) |
| 4 or 5 Rooms | 181 (41.9%) | 34 (57.6%) |
| 6 or 7 Rooms | 133 (30.8%) | 19 (32.2%) |
| 8 or more Rooms | 105 (24.3%) | 6 (10.2%) |
| Total | 432 (100.0%) | 59 (100.0%) |
Housing Structure by Heating Type in Central High
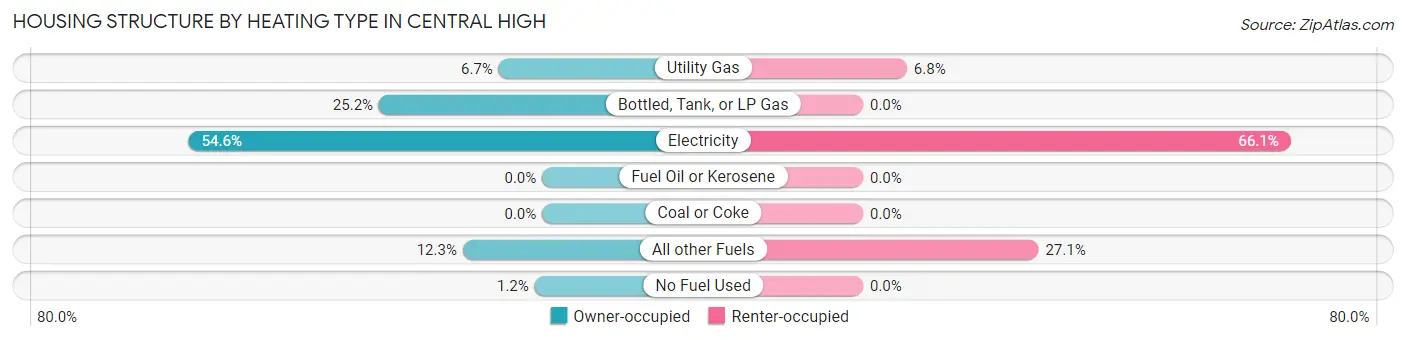
| Heating Type | Owner-occupied | Renter-occupied |
| Utility Gas | 29 (6.7%) | 4 (6.8%) |
| Bottled, Tank, or LP Gas | 109 (25.2%) | 0 (0.0%) |
| Electricity | 236 (54.6%) | 39 (66.1%) |
| Fuel Oil or Kerosene | 0 (0.0%) | 0 (0.0%) |
| Coal or Coke | 0 (0.0%) | 0 (0.0%) |
| All other Fuels | 53 (12.3%) | 16 (27.1%) |
| No Fuel Used | 5 (1.2%) | 0 (0.0%) |
| Total | 432 (100.0%) | 59 (100.0%) |
Household Vehicle Usage in Central High
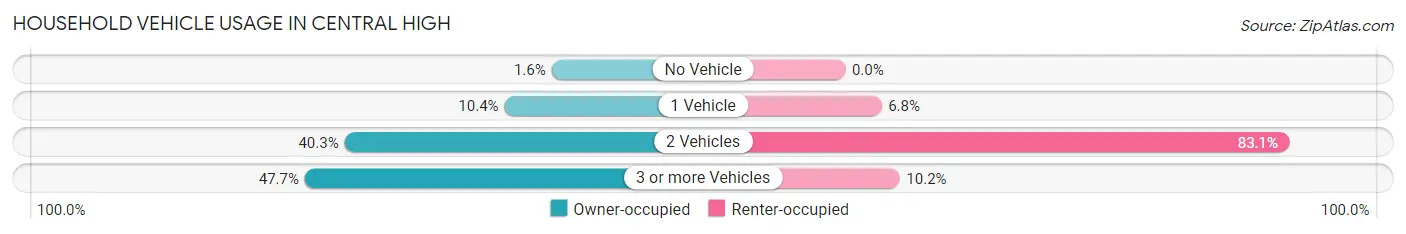
| Vehicles per Household | Owner-occupied | Renter-occupied |
| No Vehicle | 7 (1.6%) | 0 (0.0%) |
| 1 Vehicle | 45 (10.4%) | 4 (6.8%) |
| 2 Vehicles | 174 (40.3%) | 49 (83.1%) |
| 3 or more Vehicles | 206 (47.7%) | 6 (10.2%) |
| Total | 432 (100.0%) | 59 (100.0%) |
Real Estate & Mortgages in Central High
Real Estate and Mortgage Overview in Central High
| Characteristic | Without Mortgage | With Mortgage |
| Housing Units | 204 | 228 |
| Median Property Value | $201,000 | $175,000 |
| Median Household Income | $70,536 | $40 |
| Monthly Housing Costs | $459 | $13 |
| Real Estate Taxes | $1,114 | $64 |
Property Value by Mortgage Status in Central High
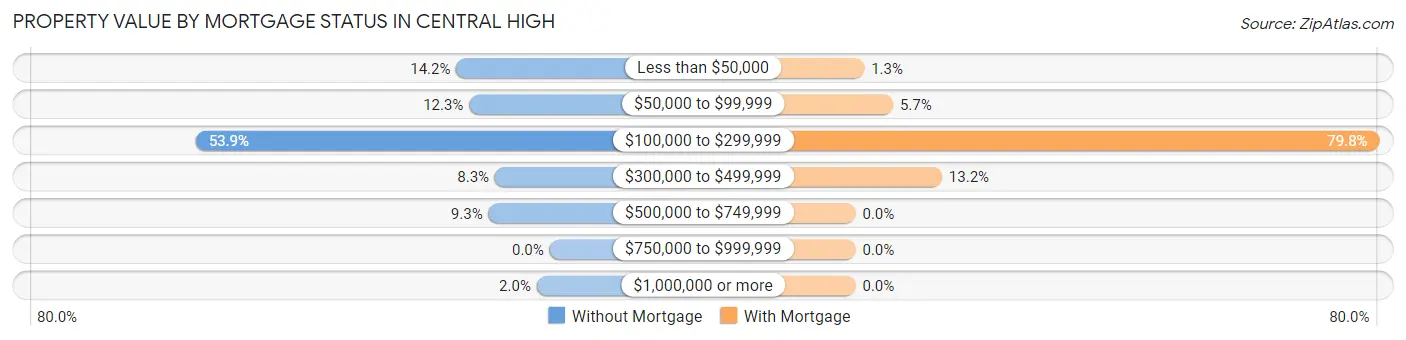
| Property Value | Without Mortgage | With Mortgage |
| Less than $50,000 | 29 (14.2%) | 3 (1.3%) |
| $50,000 to $99,999 | 25 (12.2%) | 13 (5.7%) |
| $100,000 to $299,999 | 110 (53.9%) | 182 (79.8%) |
| $300,000 to $499,999 | 17 (8.3%) | 30 (13.2%) |
| $500,000 to $749,999 | 19 (9.3%) | 0 (0.0%) |
| $750,000 to $999,999 | 0 (0.0%) | 0 (0.0%) |
| $1,000,000 or more | 4 (2.0%) | 0 (0.0%) |
| Total | 204 (100.0%) | 228 (100.0%) |
Household Income by Mortgage Status in Central High
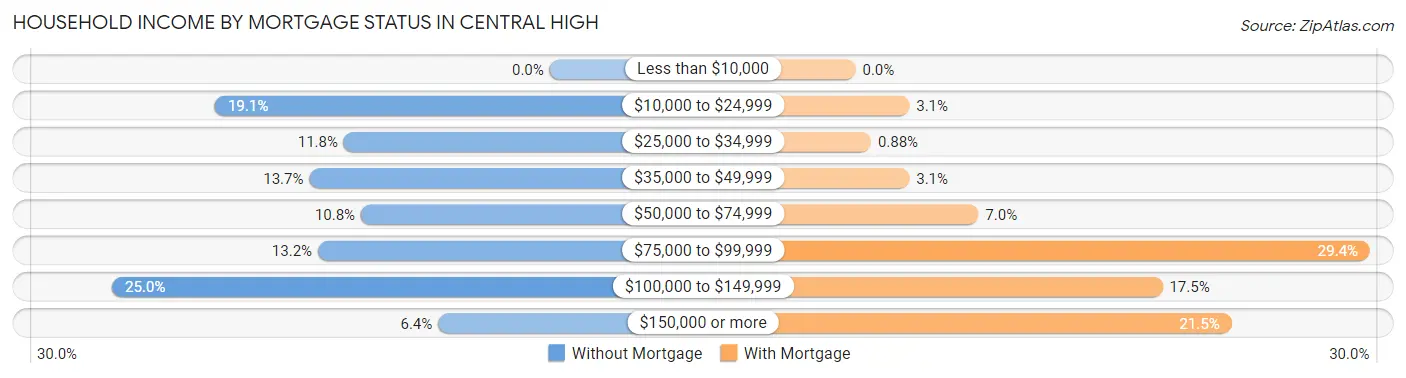
| Household Income | Without Mortgage | With Mortgage |
| Less than $10,000 | 0 (0.0%) | 0 (0.0%) |
| $10,000 to $24,999 | 39 (19.1%) | 7 (3.1%) |
| $25,000 to $34,999 | 24 (11.8%) | 2 (0.9%) |
| $35,000 to $49,999 | 28 (13.7%) | 7 (3.1%) |
| $50,000 to $74,999 | 22 (10.8%) | 16 (7.0%) |
| $75,000 to $99,999 | 27 (13.2%) | 67 (29.4%) |
| $100,000 to $149,999 | 51 (25.0%) | 40 (17.5%) |
| $150,000 or more | 13 (6.4%) | 49 (21.5%) |
| Total | 204 (100.0%) | 228 (100.0%) |
Property Value to Household Income Ratio in Central High
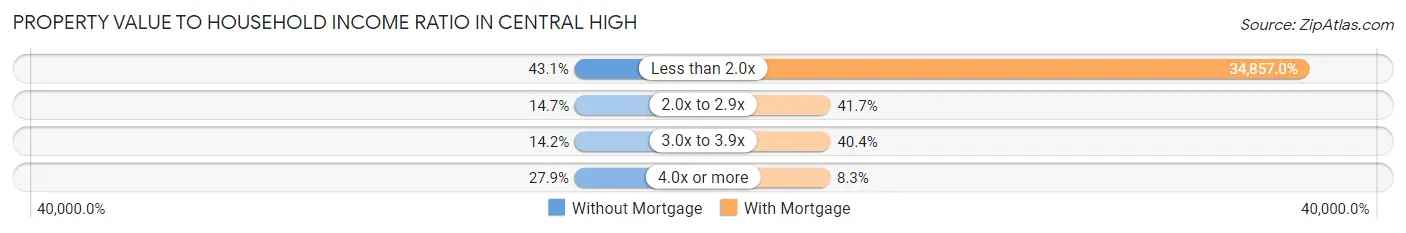
| Value-to-Income Ratio | Without Mortgage | With Mortgage |
| Less than 2.0x | 88 (43.1%) | 79,474 (34,857.0%) |
| 2.0x to 2.9x | 30 (14.7%) | 95 (41.7%) |
| 3.0x to 3.9x | 29 (14.2%) | 92 (40.4%) |
| 4.0x or more | 57 (27.9%) | 19 (8.3%) |
| Total | 204 (100.0%) | 228 (100.0%) |
Real Estate Taxes by Mortgage Status in Central High
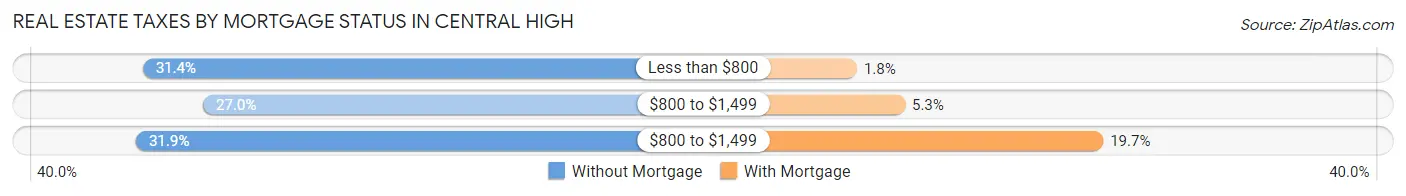
| Property Taxes | Without Mortgage | With Mortgage |
| Less than $800 | 64 (31.4%) | 4 (1.8%) |
| $800 to $1,499 | 55 (27.0%) | 12 (5.3%) |
| $800 to $1,499 | 65 (31.9%) | 45 (19.7%) |
| Total | 204 (100.0%) | 228 (100.0%) |
Health & Disability in Central High
Health Insurance Coverage by Age in Central High
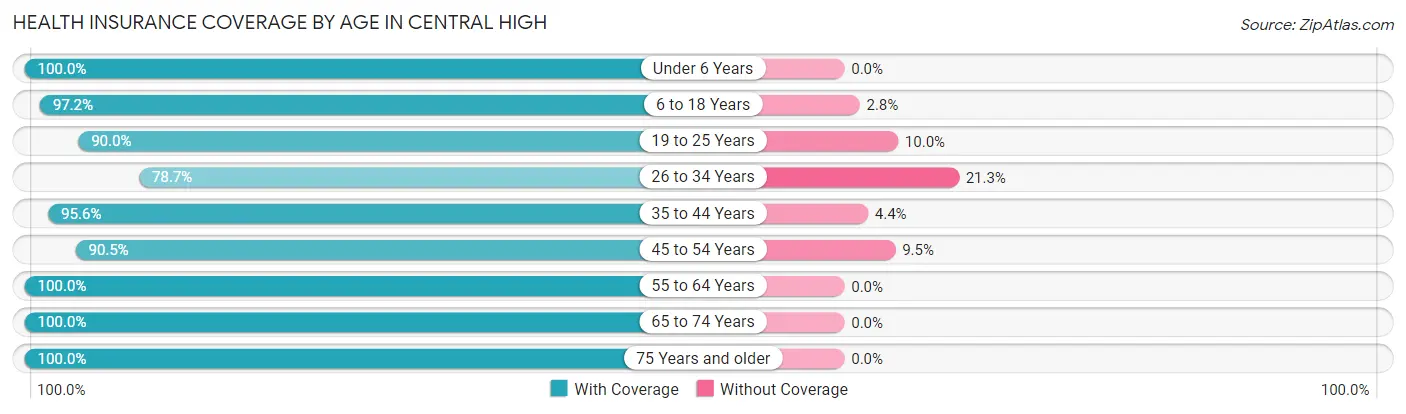
| Age Bracket | With Coverage | Without Coverage |
| Under 6 Years | 113 (100.0%) | 0 (0.0%) |
| 6 to 18 Years | 377 (97.2%) | 11 (2.8%) |
| 19 to 25 Years | 90 (90.0%) | 10 (10.0%) |
| 26 to 34 Years | 118 (78.7%) | 32 (21.3%) |
| 35 to 44 Years | 196 (95.6%) | 9 (4.4%) |
| 45 to 54 Years | 124 (90.5%) | 13 (9.5%) |
| 55 to 64 Years | 201 (100.0%) | 0 (0.0%) |
| 65 to 74 Years | 131 (100.0%) | 0 (0.0%) |
| 75 Years and older | 55 (100.0%) | 0 (0.0%) |
| Total | 1,405 (94.9%) | 75 (5.1%) |
Health Insurance Coverage by Citizenship Status in Central High
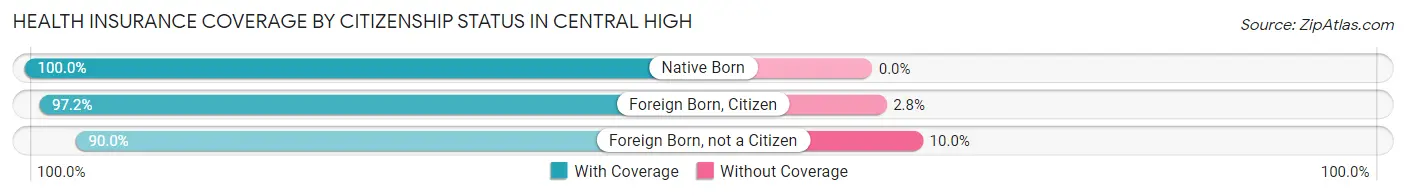
| Citizenship Status | With Coverage | Without Coverage |
| Native Born | 113 (100.0%) | 0 (0.0%) |
| Foreign Born, Citizen | 377 (97.2%) | 11 (2.8%) |
| Foreign Born, not a Citizen | 90 (90.0%) | 10 (10.0%) |
Health Insurance Coverage by Household Income in Central High
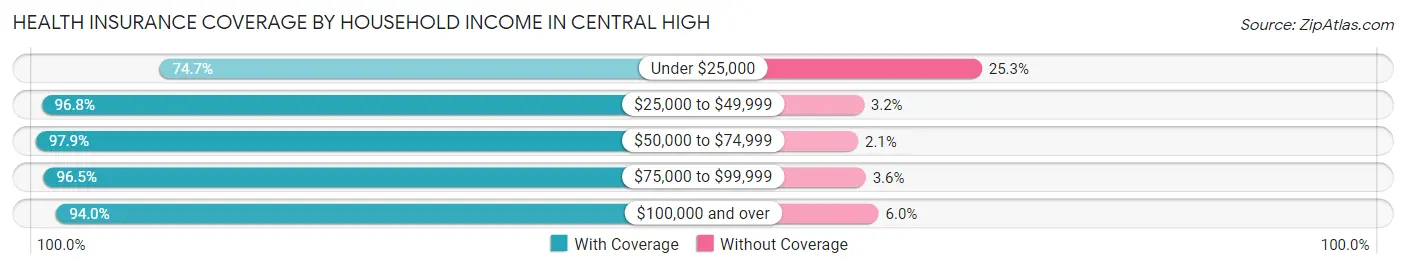
| Household Income | With Coverage | Without Coverage |
| Under $25,000 | 62 (74.7%) | 21 (25.3%) |
| $25,000 to $49,999 | 243 (96.8%) | 8 (3.2%) |
| $50,000 to $74,999 | 464 (97.9%) | 10 (2.1%) |
| $75,000 to $99,999 | 163 (96.5%) | 6 (3.5%) |
| $100,000 and over | 473 (94.0%) | 30 (6.0%) |
Public vs Private Health Insurance Coverage by Age in Central High
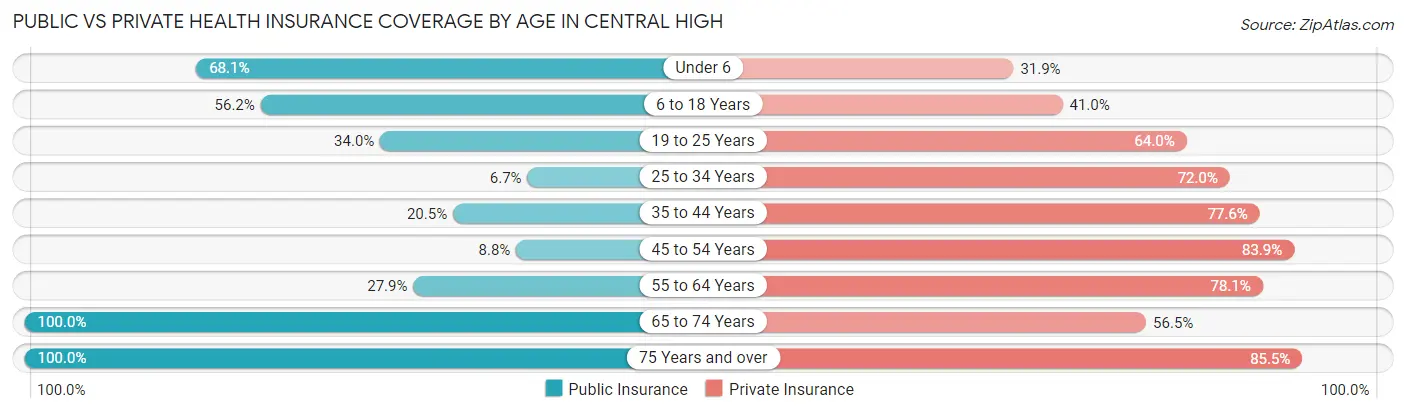
| Age Bracket | Public Insurance | Private Insurance |
| Under 6 | 77 (68.1%) | 36 (31.9%) |
| 6 to 18 Years | 218 (56.2%) | 159 (41.0%) |
| 19 to 25 Years | 34 (34.0%) | 64 (64.0%) |
| 25 to 34 Years | 10 (6.7%) | 108 (72.0%) |
| 35 to 44 Years | 42 (20.5%) | 159 (77.6%) |
| 45 to 54 Years | 12 (8.8%) | 115 (83.9%) |
| 55 to 64 Years | 56 (27.9%) | 157 (78.1%) |
| 65 to 74 Years | 131 (100.0%) | 74 (56.5%) |
| 75 Years and over | 55 (100.0%) | 47 (85.5%) |
| Total | 635 (42.9%) | 919 (62.1%) |
Disability Status by Sex by Age in Central High
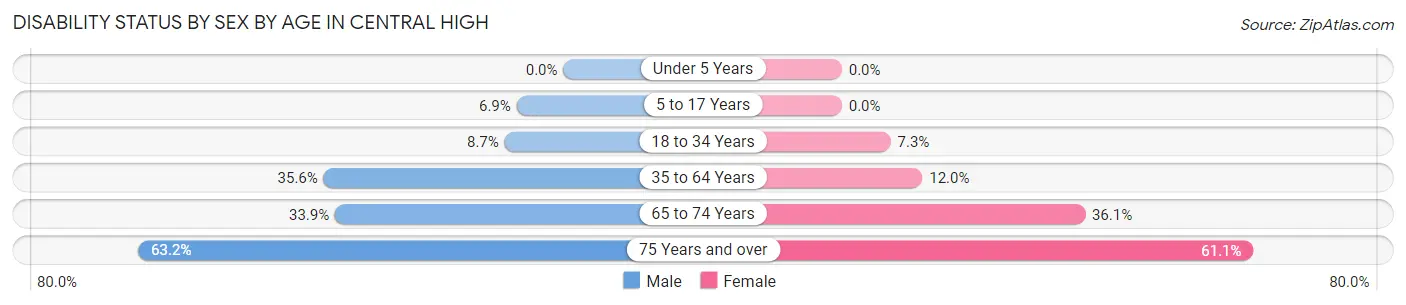
| Age Bracket | Male | Female |
| Under 5 Years | 0 (0.0%) | 0 (0.0%) |
| 5 to 17 Years | 10 (6.9%) | 0 (0.0%) |
| 18 to 34 Years | 13 (8.7%) | 10 (7.2%) |
| 35 to 64 Years | 89 (35.6%) | 35 (11.9%) |
| 65 to 74 Years | 20 (33.9%) | 26 (36.1%) |
| 75 Years and over | 12 (63.2%) | 22 (61.1%) |
Disability Class by Sex by Age in Central High
Disability Class: Hearing Difficulty
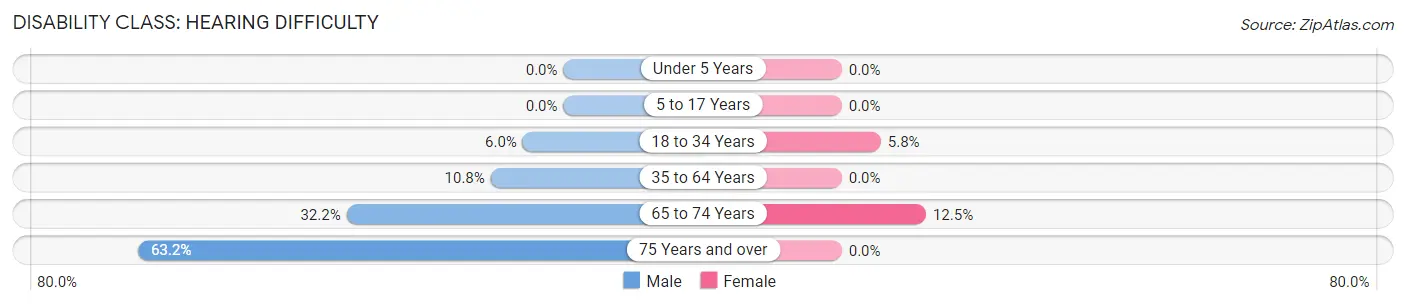
| Age Bracket | Male | Female |
| Under 5 Years | 0 (0.0%) | 0 (0.0%) |
| 5 to 17 Years | 0 (0.0%) | 0 (0.0%) |
| 18 to 34 Years | 9 (6.0%) | 8 (5.8%) |
| 35 to 64 Years | 27 (10.8%) | 0 (0.0%) |
| 65 to 74 Years | 19 (32.2%) | 9 (12.5%) |
| 75 Years and over | 12 (63.2%) | 0 (0.0%) |
Disability Class: Vision Difficulty
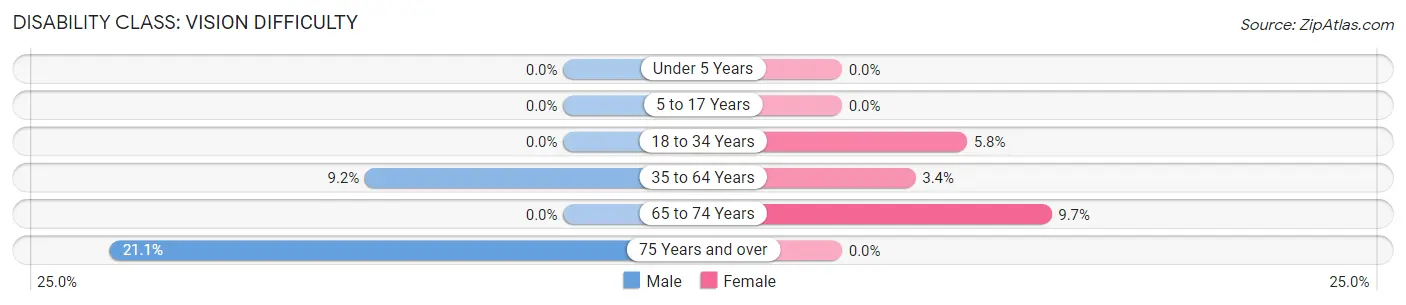
| Age Bracket | Male | Female |
| Under 5 Years | 0 (0.0%) | 0 (0.0%) |
| 5 to 17 Years | 0 (0.0%) | 0 (0.0%) |
| 18 to 34 Years | 0 (0.0%) | 8 (5.8%) |
| 35 to 64 Years | 23 (9.2%) | 10 (3.4%) |
| 65 to 74 Years | 0 (0.0%) | 7 (9.7%) |
| 75 Years and over | 4 (21.0%) | 0 (0.0%) |
Disability Class: Cognitive Difficulty
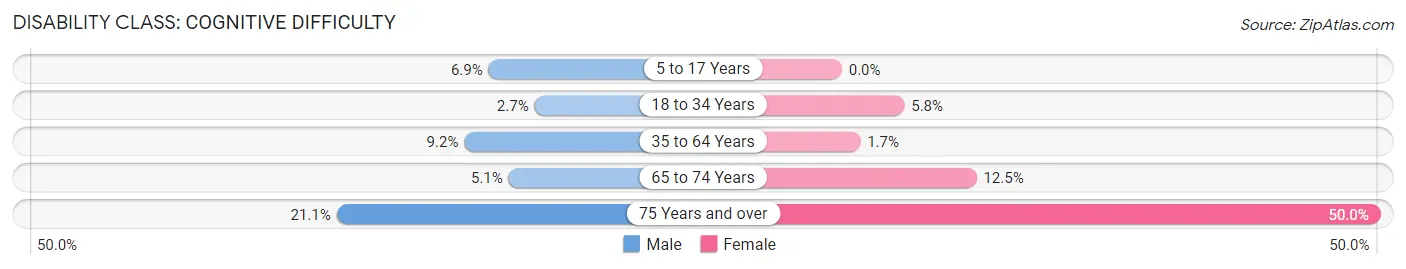
| Age Bracket | Male | Female |
| 5 to 17 Years | 10 (6.9%) | 0 (0.0%) |
| 18 to 34 Years | 4 (2.7%) | 8 (5.8%) |
| 35 to 64 Years | 23 (9.2%) | 5 (1.7%) |
| 65 to 74 Years | 3 (5.1%) | 9 (12.5%) |
| 75 Years and over | 4 (21.0%) | 18 (50.0%) |
Disability Class: Ambulatory Difficulty
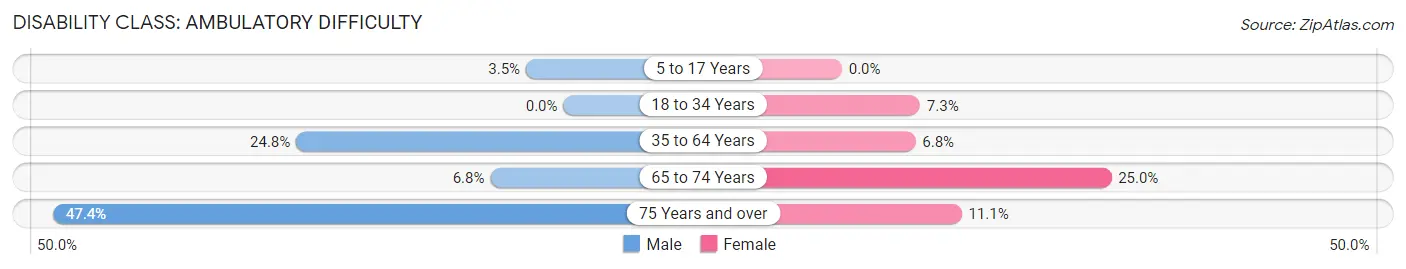
| Age Bracket | Male | Female |
| 5 to 17 Years | 5 (3.5%) | 0 (0.0%) |
| 18 to 34 Years | 0 (0.0%) | 10 (7.2%) |
| 35 to 64 Years | 62 (24.8%) | 20 (6.8%) |
| 65 to 74 Years | 4 (6.8%) | 18 (25.0%) |
| 75 Years and over | 9 (47.4%) | 4 (11.1%) |
Disability Class: Self-Care Difficulty
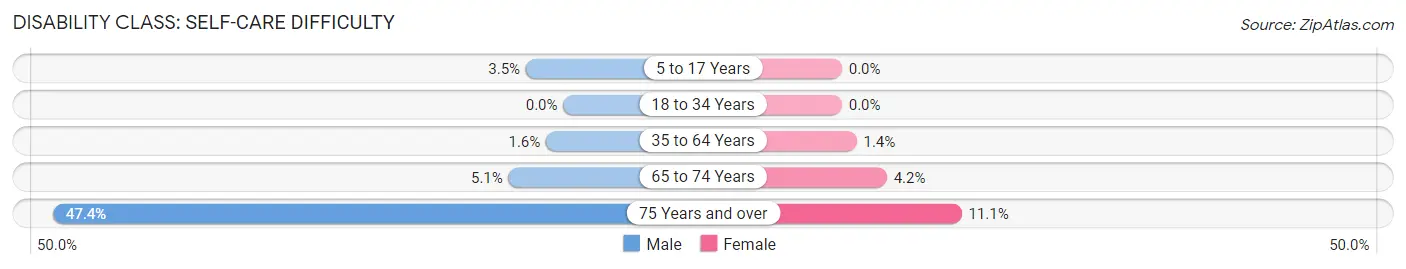
| Age Bracket | Male | Female |
| 5 to 17 Years | 5 (3.5%) | 0 (0.0%) |
| 18 to 34 Years | 0 (0.0%) | 0 (0.0%) |
| 35 to 64 Years | 4 (1.6%) | 4 (1.4%) |
| 65 to 74 Years | 3 (5.1%) | 3 (4.2%) |
| 75 Years and over | 9 (47.4%) | 4 (11.1%) |
Technology Access in Central High
Computing Device Access in Central High
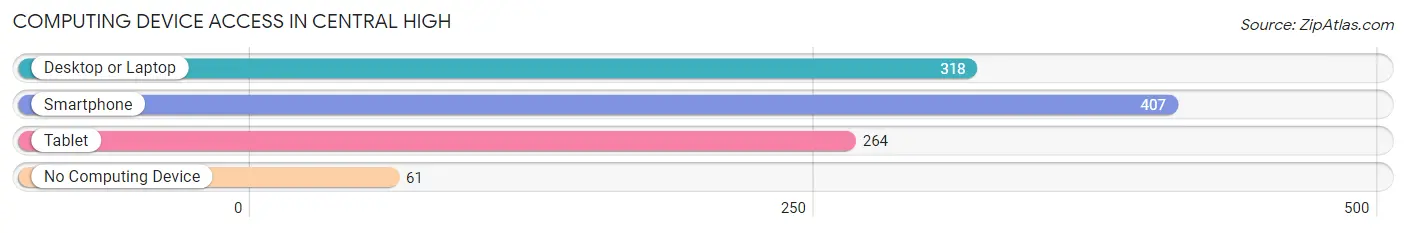
| Device Type | # Households | % Households |
| Desktop or Laptop | 318 | 64.8% |
| Smartphone | 407 | 82.9% |
| Tablet | 264 | 53.8% |
| No Computing Device | 61 | 12.4% |
| Total | 491 | 100.0% |
Internet Access in Central High
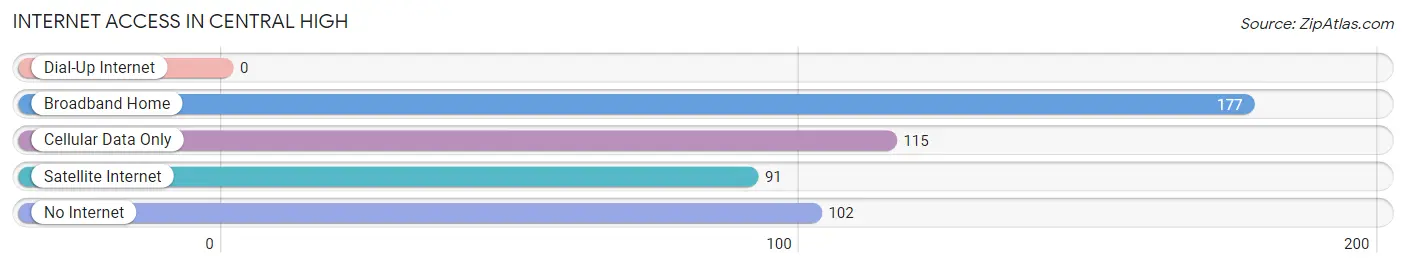
| Internet Type | # Households | % Households |
| Dial-Up Internet | 0 | 0.0% |
| Broadband Home | 177 | 36.0% |
| Cellular Data Only | 115 | 23.4% |
| Satellite Internet | 91 | 18.5% |
| No Internet | 102 | 20.8% |
| Total | 491 | 100.0% |
Central High Summary
High School History
Central High School is located in Central, Oklahoma, a small town in the southeastern part of the state. The school was established in the early 1900s and has been a part of the community ever since. Central High School is a public school that serves students in grades 9-12. The school is part of the Central Public School District, which also includes an elementary school and a middle school.
Central High School has a long and proud history. The school was originally established in the early 1900s as a one-room schoolhouse. Over the years, the school has grown and expanded to include more classrooms and facilities. In the 1950s, the school was expanded to include a gymnasium, cafeteria, and library. In the 1970s, the school was further expanded to include a science lab, computer lab, and art room.
Geography
Central, Oklahoma is located in the southeastern part of the state. The town is situated in the foothills of the Ouachita Mountains and is surrounded by rolling hills and forests. The town is located about 30 miles from the Arkansas border and is about an hour and a half drive from Oklahoma City.
The town of Central is home to about 1,500 people. The town is small and rural, but it is close to larger cities such as Tulsa and Oklahoma City. The town is also close to several lakes, rivers, and other outdoor recreational areas.
Economy
The economy of Central, Oklahoma is largely based on agriculture. The town is home to several farms and ranches, and the surrounding area is known for its cattle and poultry production. The town also has several small businesses, including a grocery store, hardware store, and several restaurants.
The town is also home to several manufacturing companies, including a furniture factory and a plastics factory. The town is also home to several oil and gas companies, which are responsible for much of the town’s economic activity.
Demographics
As of the 2010 census, the population of Central, Oklahoma was 1,521. The town is predominantly white, with about 87% of the population identifying as white. The town is also home to a small Hispanic population, with about 8% of the population identifying as Hispanic or Latino. The town is also home to a small African American population, with about 4% of the population identifying as African American.
The median household income in Central, Oklahoma is about $37,000, which is slightly lower than the national average. The town has a relatively low unemployment rate, with about 4% of the population unemployed. The town also has a relatively low poverty rate, with about 11% of the population living below the poverty line.
Conclusion
Central High School is a public school located in Central, Oklahoma. The school has a long and proud history, and it has been a part of the community for over a century. The town of Central is small and rural, but it is close to larger cities such as Tulsa and Oklahoma City. The economy of Central is largely based on agriculture, and the town is also home to several manufacturing companies and oil and gas companies. The population of Central is predominantly white, with a small Hispanic and African American population. The median household income in Central is slightly lower than the national average, and the town has a relatively low unemployment and poverty rate.
Common Questions
What is the Total Population of Central High?
Total Population of Central High is 1,480.
What is the Total Male Population of Central High?
Total Male Population of Central High is 646.
What is the Total Female Population of Central High?
Total Female Population of Central High is 834.
What is the Ratio of Males per 100 Females in Central High?
There are 77.46 Males per 100 Females in Central High.
What is the Ratio of Females per 100 Males in Central High?
There are 129.10 Females per 100 Males in Central High.
What is the Median Population Age in Central High?
Median Population Age in Central High is 32.9 Years.
What is the Average Family Size in Central High
Average Family Size in Central High is 3.4 People.
What is the Average Household Size in Central High
Average Household Size in Central High is 3.0 People.
What is Per Capita Income in Central High?
Per Capita income in Central High is $30,323.
What is the Median Family Income in Central High?
Median Family Income in Central High is $78,400.
What is the Median Household income in Central High?
Median Household Income in Central High is $71,898.
What is Income or Wage Gap in Central High?
Income or Wage Gap in Central High is 62.2%.
Women in Central High earn 37.8 cents for every dollar earned by a man.
What is Inequality or Gini Index in Central High?
Inequality or Gini Index in Central High is 0.39.
How Large is the Labor Force in Central High?
There are 638 People in the Labor Forcein in Central High.
What is the Percentage of People in the Labor Force in Central High?
59.9% of People are in the Labor Force in Central High.
What is the Unemployment Rate in Central High?
Unemployment Rate in Central High is 6.4%.