Zip Codes with the Highest Percentage of Population Employed in Real Estate, Rental & Leasing in Hawaii
RELATED REPORTS & OPTIONS
Real Estate, Rental & Leasing
Hawaii
Compare Zip Codes
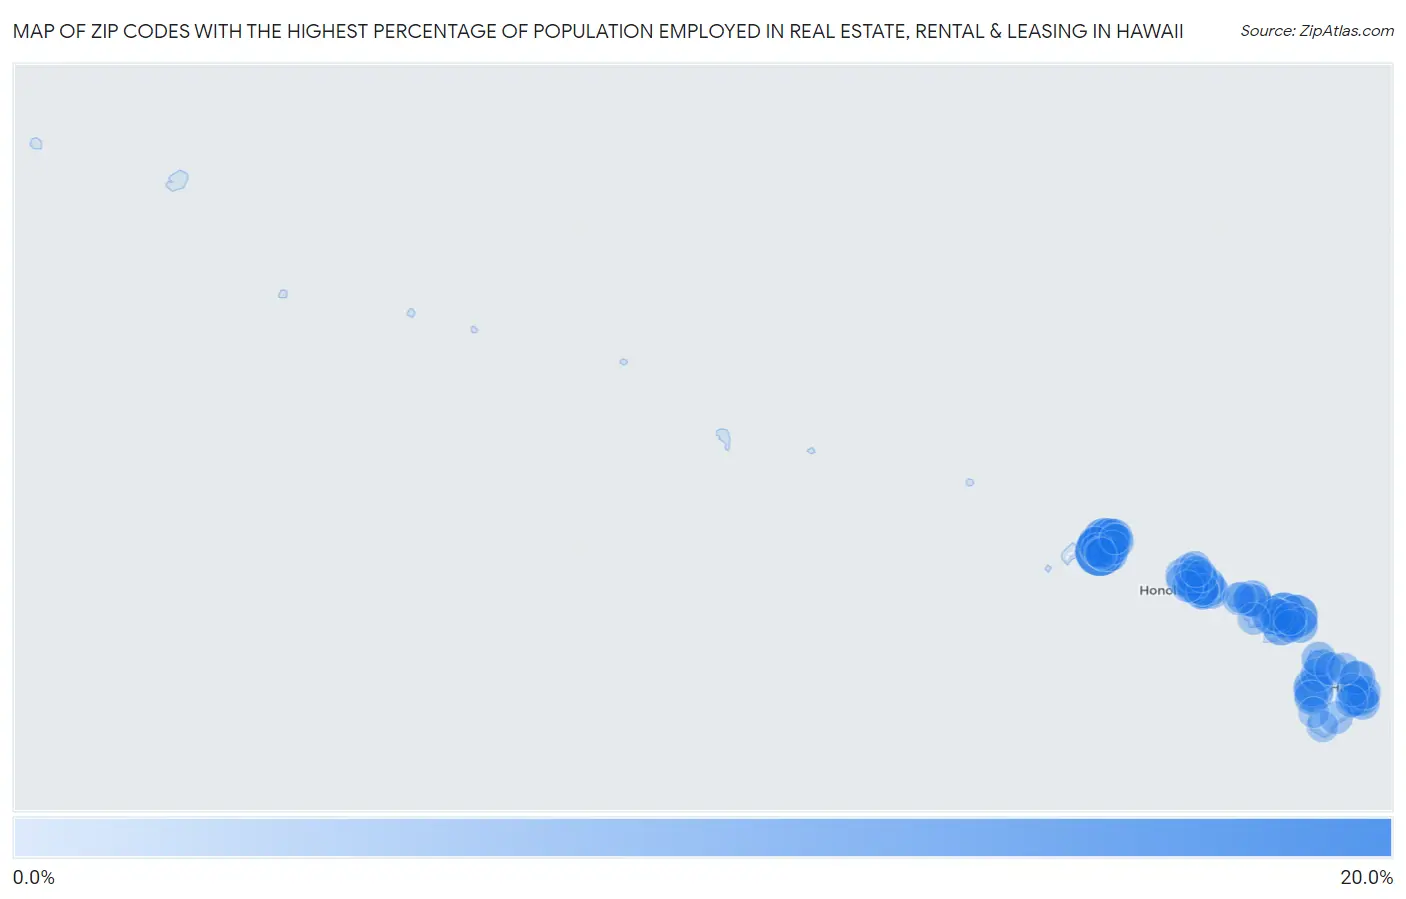
Map of Zip Codes with the Highest Percentage of Population Employed in Real Estate, Rental & Leasing in Hawaii
0.0%
20.0%
Zip Codes with the Highest Percentage of Population Employed in Real Estate, Rental & Leasing in Hawaii
| Zip Code | % Employed | vs State | vs National | |
| 1. | 96769 | 16.9% | 3.0%(+13.9)#1 | 1.9%(+15.0)#137 |
| 2. | 96779 | 12.6% | 3.0%(+9.60)#2 | 1.9%(+10.7)#238 |
| 3. | 96708 | 10.9% | 3.0%(+7.89)#3 | 1.9%(+9.03)#313 |
| 4. | 96714 | 9.5% | 3.0%(+6.45)#4 | 1.9%(+7.60)#424 |
| 5. | 96722 | 9.3% | 3.0%(+6.23)#5 | 1.9%(+7.38)#449 |
| 6. | 96725 | 7.4% | 3.0%(+4.33)#6 | 1.9%(+5.48)#664 |
| 7. | 96761 | 7.1% | 3.0%(+4.11)#7 | 1.9%(+5.25)#702 |
| 8. | 96753 | 6.9% | 3.0%(+3.85)#8 | 1.9%(+4.99)#753 |
| 9. | 96740 | 6.6% | 3.0%(+3.55)#9 | 1.9%(+4.70)#804 |
| 10. | 96754 | 6.1% | 3.0%(+3.07)#10 | 1.9%(+4.21)#942 |
| 11. | 96742 | 5.6% | 3.0%(+2.52)#11 | 1.9%(+3.66)#1,133 |
| 12. | 96760 | 5.5% | 3.0%(+2.50)#12 | 1.9%(+3.65)#1,136 |
| 13. | 96771 | 5.2% | 3.0%(+2.20)#13 | 1.9%(+3.35)#1,271 |
| 14. | 96743 | 5.2% | 3.0%(+2.19)#14 | 1.9%(+3.34)#1,277 |
| 15. | 96783 | 5.0% | 3.0%(+1.93)#15 | 1.9%(+3.07)#1,412 |
| 16. | 96713 | 4.6% | 3.0%(+1.61)#16 | 1.9%(+2.75)#1,606 |
| 17. | 96741 | 4.3% | 3.0%(+1.24)#17 | 1.9%(+2.39)#1,880 |
| 18. | 96756 | 4.3% | 3.0%(+1.22)#18 | 1.9%(+2.37)#1,896 |
| 19. | 96825 | 4.2% | 3.0%(+1.12)#19 | 1.9%(+2.27)#2,001 |
| 20. | 96821 | 4.0% | 3.0%(+0.928)#20 | 1.9%(+2.08)#2,215 |
| 21. | 96814 | 3.9% | 3.0%(+0.857)#21 | 1.9%(+2.00)#2,283 |
| 22. | 96746 | 3.8% | 3.0%(+0.808)#22 | 1.9%(+1.95)#2,327 |
| 23. | 96705 | 3.8% | 3.0%(+0.782)#23 | 1.9%(+1.93)#2,368 |
| 24. | 96717 | 3.8% | 3.0%(+0.765)#24 | 1.9%(+1.91)#2,385 |
| 25. | 96816 | 3.6% | 3.0%(+0.590)#25 | 1.9%(+1.74)#2,618 |
| 26. | 96822 | 3.6% | 3.0%(+0.551)#26 | 1.9%(+1.70)#2,684 |
| 27. | 96778 | 3.5% | 3.0%(+0.470)#27 | 1.9%(+1.62)#2,819 |
| 28. | 96752 | 3.5% | 3.0%(+0.419)#28 | 1.9%(+1.57)#2,919 |
| 29. | 96795 | 3.4% | 3.0%(+0.386)#29 | 1.9%(+1.53)#2,972 |
| 30. | 96749 | 3.4% | 3.0%(+0.373)#30 | 1.9%(+1.52)#2,997 |
| 31. | 96815 | 3.4% | 3.0%(+0.322)#31 | 1.9%(+1.47)#3,109 |
| 32. | 96738 | 3.3% | 3.0%(+0.261)#32 | 1.9%(+1.41)#3,209 |
| 33. | 96755 | 3.3% | 3.0%(+0.227)#33 | 1.9%(+1.37)#3,286 |
| 34. | 96750 | 3.2% | 3.0%(+0.203)#34 | 1.9%(+1.35)#3,336 |
| 35. | 96766 | 3.2% | 3.0%(+0.135)#35 | 1.9%(+1.28)#3,472 |
| 36. | 96732 | 3.1% | 3.0%(+0.054)#36 | 1.9%(+1.20)#3,635 |
| 37. | 96791 | 3.0% | 3.0%(+0.004)#37 | 1.9%(+1.15)#3,775 |
| 38. | 96712 | 3.0% | 3.0%(-0.047)#38 | 1.9%(+1.10)#3,921 |
| 39. | 96734 | 3.0% | 3.0%(-0.050)#39 | 1.9%(+1.10)#3,932 |
| 40. | 96819 | 3.0% | 3.0%(-0.078)#40 | 1.9%(+1.07)#4,008 |
| 41. | 96796 | 2.9% | 3.0%(-0.106)#41 | 1.9%(+1.04)#4,074 |
| 42. | 96748 | 2.9% | 3.0%(-0.143)#42 | 1.9%(+1.00)#4,187 |
| 43. | 96818 | 2.9% | 3.0%(-0.175)#43 | 1.9%(+0.972)#4,260 |
| 44. | 96701 | 2.7% | 3.0%(-0.348)#44 | 1.9%(+0.800)#4,777 |
| 45. | 96793 | 2.7% | 3.0%(-0.356)#45 | 1.9%(+0.791)#4,799 |
| 46. | 96744 | 2.6% | 3.0%(-0.454)#46 | 1.9%(+0.693)#5,146 |
| 47. | 96826 | 2.6% | 3.0%(-0.466)#47 | 1.9%(+0.681)#5,198 |
| 48. | 96727 | 2.6% | 3.0%(-0.483)#48 | 1.9%(+0.664)#5,269 |
| 49. | 96817 | 2.5% | 3.0%(-0.588)#49 | 1.9%(+0.559)#5,675 |
| 50. | 96728 | 2.4% | 3.0%(-0.647)#50 | 1.9%(+0.501)#5,928 |
| 51. | 96757 | 2.4% | 3.0%(-0.650)#51 | 1.9%(+0.497)#5,942 |
| 52. | 96777 | 2.3% | 3.0%(-0.721)#52 | 1.9%(+0.426)#6,227 |
| 53. | 96789 | 2.2% | 3.0%(-0.791)#53 | 1.9%(+0.356)#6,577 |
| 54. | 96731 | 2.2% | 3.0%(-0.863)#54 | 1.9%(+0.284)#6,923 |
| 55. | 96720 | 2.1% | 3.0%(-0.986)#55 | 1.9%(+0.161)#7,572 |
| 56. | 96792 | 2.0% | 3.0%(-1.07)#56 | 1.9%(+0.079)#8,003 |
| 57. | 96790 | 1.9% | 3.0%(-1.10)#57 | 1.9%(+0.047)#8,195 |
| 58. | 96770 | 1.9% | 3.0%(-1.19)#58 | 1.9%(-0.040)#8,770 |
| 59. | 96782 | 1.8% | 3.0%(-1.21)#59 | 1.9%(-0.066)#8,960 |
| 60. | 96768 | 1.8% | 3.0%(-1.25)#60 | 1.9%(-0.103)#9,208 |
| 61. | 96797 | 1.7% | 3.0%(-1.30)#61 | 1.9%(-0.156)#9,516 |
| 62. | 96763 | 1.6% | 3.0%(-1.44)#62 | 1.9%(-0.295)#10,457 |
| 63. | 96706 | 1.6% | 3.0%(-1.46)#63 | 1.9%(-0.316)#10,599 |
| 64. | 96785 | 1.5% | 3.0%(-1.49)#64 | 1.9%(-0.345)#10,816 |
| 65. | 96786 | 1.5% | 3.0%(-1.54)#65 | 1.9%(-0.390)#11,142 |
| 66. | 96813 | 1.5% | 3.0%(-1.55)#66 | 1.9%(-0.399)#11,203 |
| 67. | 96730 | 1.5% | 3.0%(-1.55)#67 | 1.9%(-0.406)#11,260 |
| 68. | 96776 | 1.5% | 3.0%(-1.56)#68 | 1.9%(-0.412)#11,309 |
| 69. | 96707 | 1.4% | 3.0%(-1.67)#69 | 1.9%(-0.520)#12,198 |
| 70. | 96747 | 1.3% | 3.0%(-1.73)#70 | 1.9%(-0.579)#12,639 |
| 71. | 96772 | 1.3% | 3.0%(-1.75)#71 | 1.9%(-0.606)#12,831 |
| 72. | 96716 | 1.2% | 3.0%(-1.80)#72 | 1.9%(-0.649)#13,136 |
| 73. | 96762 | 1.2% | 3.0%(-1.85)#73 | 1.9%(-0.701)#13,553 |
| 74. | 96729 | 1.0% | 3.0%(-2.03)#74 | 1.9%(-0.886)#15,107 |
| 75. | 96703 | 0.73% | 3.0%(-2.31)#75 | 1.9%(-1.16)#17,262 |
| 76. | 96704 | 0.61% | 3.0%(-2.43)#76 | 1.9%(-1.28)#18,211 |
1
Common Questions
What are the Top 10 Zip Codes with the Highest Percentage of Population Employed in Real Estate, Rental & Leasing in Hawaii?
Top 10 Zip Codes with the Highest Percentage of Population Employed in Real Estate, Rental & Leasing in Hawaii are:
What zip code has the Highest Percentage of Population Employed in Real Estate, Rental & Leasing in Hawaii?
96769 has the Highest Percentage of Population Employed in Real Estate, Rental & Leasing in Hawaii with 16.9%.
What is the Percentage of Population Employed in Real Estate, Rental & Leasing in the State of Hawaii?
Percentage of Population Employed in Real Estate, Rental & Leasing in Hawaii is 3.0%.
What is the Percentage of Population Employed in Real Estate, Rental & Leasing in the United States?
Percentage of Population Employed in Real Estate, Rental & Leasing in the United States is 1.9%.