White City, KS
White City Map
White City Overview
518
TOTAL POPULATION
241
MALE POPULATION
277
FEMALE POPULATION
87.00
MALES / 100 FEMALES
114.94
FEMALES / 100 MALES
48.4
MEDIAN AGE
2.8
AVG FAMILY SIZE
2.2
AVG HOUSEHOLD SIZE
$20,771
PER CAPITA INCOME
$53,676
AVG FAMILY INCOME
$47,738
AVG HOUSEHOLD INCOME
0.34
INEQUALITY / GINI INDEX
189
LABOR FORCE [ PEOPLE ]
43.4%
PERCENT IN LABOR FORCE
White City Zip Codes
White City Area Codes
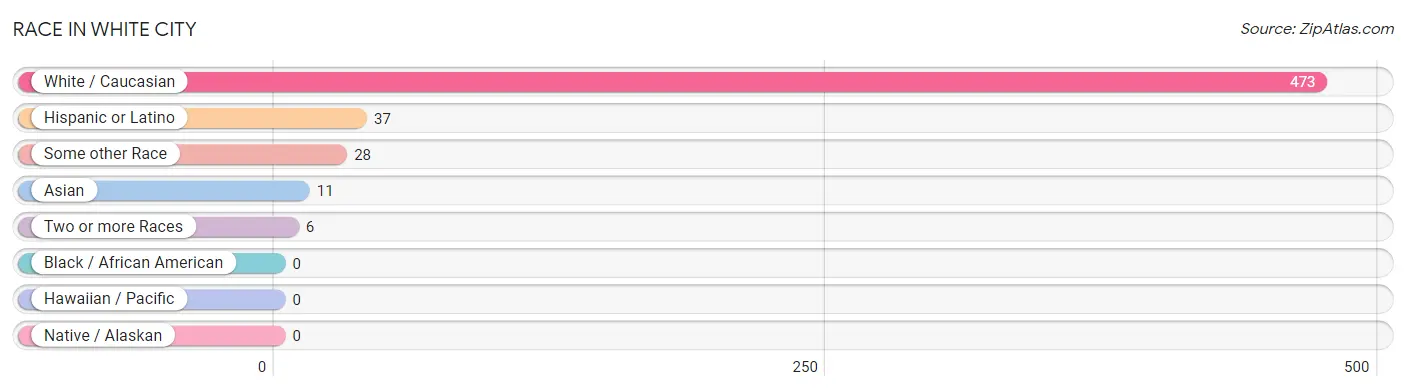
Race in White City
The most populous races in White City are White / Caucasian (473 | 91.3%), Hispanic or Latino (37 | 7.1%), and Some other Race (28 | 5.4%).
| Race | # Population | % Population |
| Asian | 11 | 2.1% |
| Black / African American | 0 | 0.0% |
| Hawaiian / Pacific | 0 | 0.0% |
| Hispanic or Latino | 37 | 7.1% |
| Native / Alaskan | 0 | 0.0% |
| White / Caucasian | 473 | 91.3% |
| Two or more Races | 6 | 1.2% |
| Some other Race | 28 | 5.4% |
| Total | 518 | 100.0% |
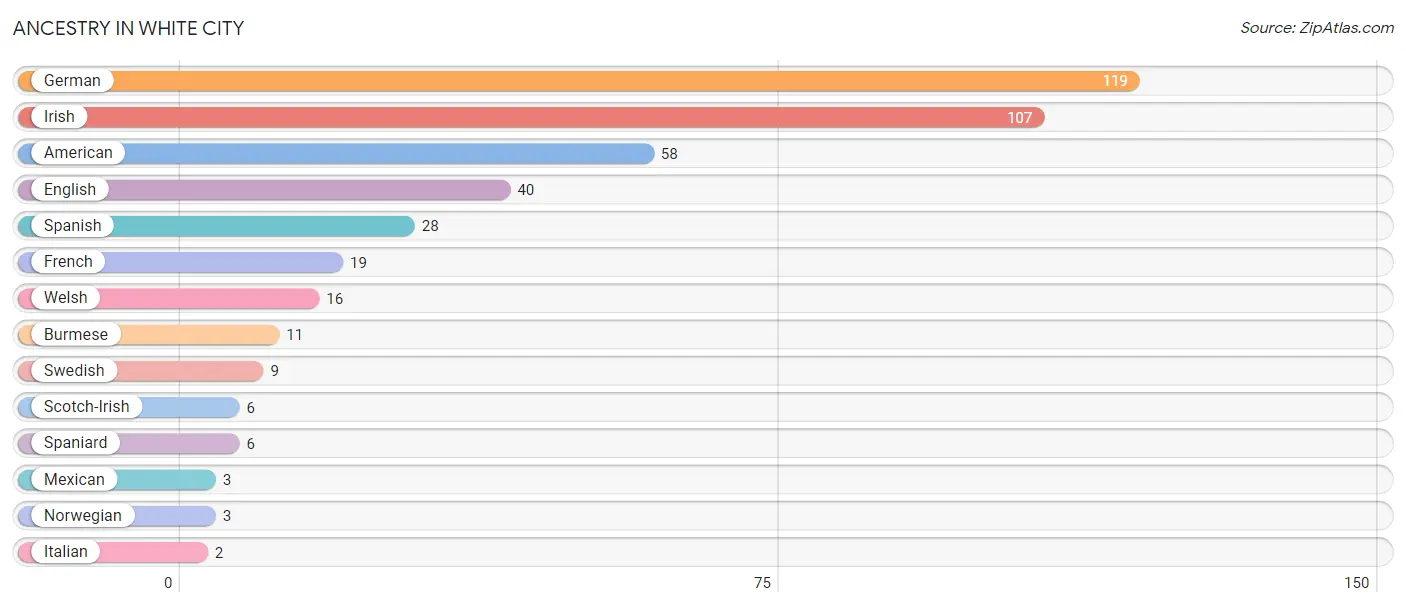
Ancestry in White City
The most populous ancestries reported in White City are German (119 | 23.0%), Irish (107 | 20.7%), American (58 | 11.2%), English (40 | 7.7%), and Spanish (28 | 5.4%), together accounting for 68.0% of all White City residents.
| Ancestry | # Population | % Population |
| American | 58 | 11.2% |
| Burmese | 11 | 2.1% |
| English | 40 | 7.7% |
| French | 19 | 3.7% |
| German | 119 | 23.0% |
| Irish | 107 | 20.7% |
| Italian | 2 | 0.4% |
| Mexican | 3 | 0.6% |
| Norwegian | 3 | 0.6% |
| Scotch-Irish | 6 | 1.2% |
| Spaniard | 6 | 1.2% |
| Spanish | 28 | 5.4% |
| Swedish | 9 | 1.7% |
| Welsh | 16 | 3.1% | View All 14 Rows |
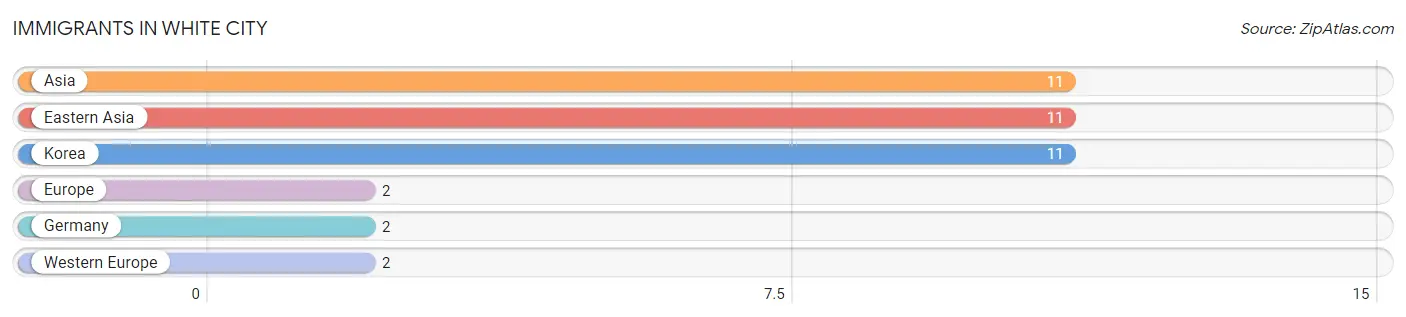
Immigrants in White City
The most numerous immigrant groups reported in White City came from Asia (11 | 2.1%), Eastern Asia (11 | 2.1%), Korea (11 | 2.1%), Europe (2 | 0.4%), and Germany (2 | 0.4%), together accounting for 7.1% of all White City residents.
| Immigration Origin | # Population | % Population |
| Asia | 11 | 2.1% |
| Eastern Asia | 11 | 2.1% |
| Europe | 2 | 0.4% |
| Germany | 2 | 0.4% |
| Korea | 11 | 2.1% |
| Western Europe | 2 | 0.4% | View All 6 Rows |
Sex and Age in White City
Sex and Age in White City
The most populous age groups in White City are Under 5 Years (32 | 13.3%) for men and 15 to 19 Years (36 | 13.0%) for women.
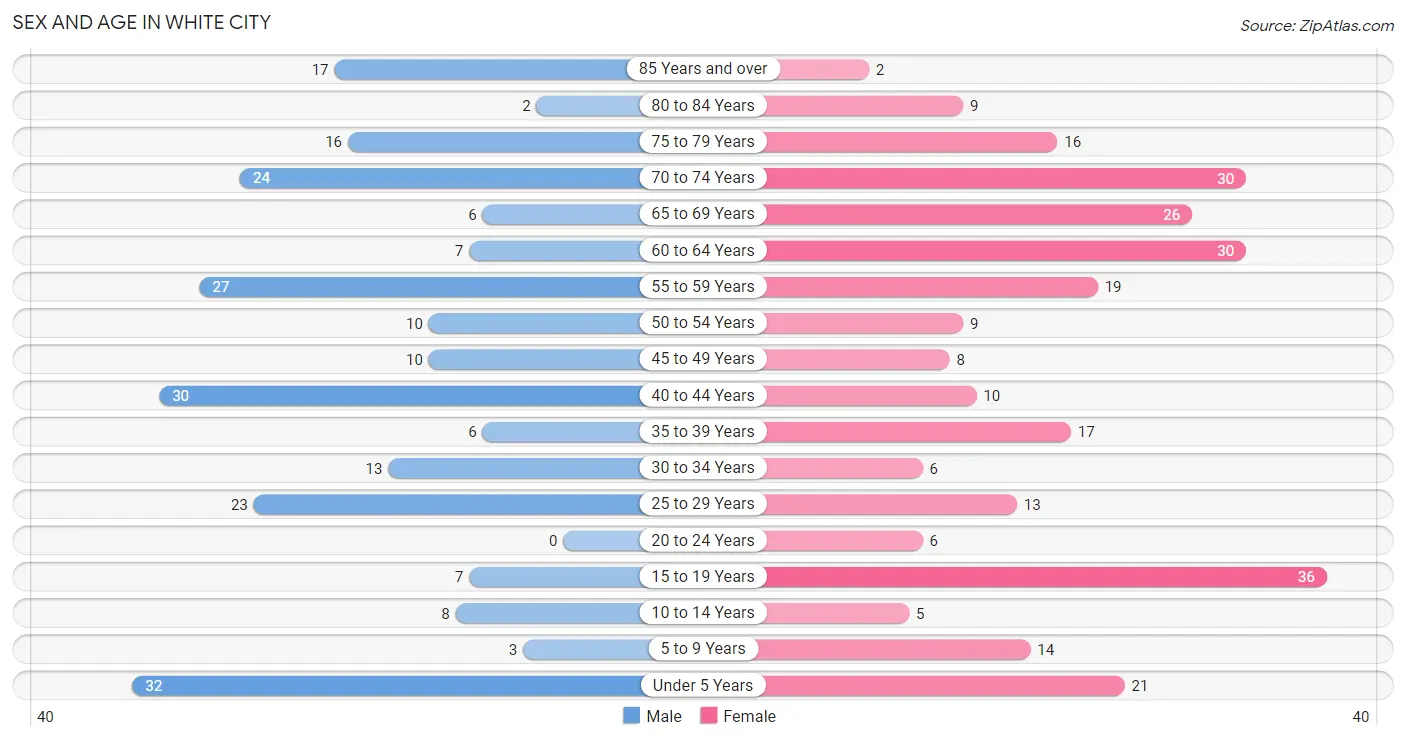
| Age Bracket | Male | Female |
| Under 5 Years | 32 (13.3%) | 21 (7.6%) |
| 5 to 9 Years | 3 (1.2%) | 14 (5.1%) |
| 10 to 14 Years | 8 (3.3%) | 5 (1.8%) |
| 15 to 19 Years | 7 (2.9%) | 36 (13.0%) |
| 20 to 24 Years | 0 (0.0%) | 6 (2.2%) |
| 25 to 29 Years | 23 (9.5%) | 13 (4.7%) |
| 30 to 34 Years | 13 (5.4%) | 6 (2.2%) |
| 35 to 39 Years | 6 (2.5%) | 17 (6.1%) |
| 40 to 44 Years | 30 (12.4%) | 10 (3.6%) |
| 45 to 49 Years | 10 (4.2%) | 8 (2.9%) |
| 50 to 54 Years | 10 (4.2%) | 9 (3.3%) |
| 55 to 59 Years | 27 (11.2%) | 19 (6.9%) |
| 60 to 64 Years | 7 (2.9%) | 30 (10.8%) |
| 65 to 69 Years | 6 (2.5%) | 26 (9.4%) |
| 70 to 74 Years | 24 (10.0%) | 30 (10.8%) |
| 75 to 79 Years | 16 (6.6%) | 16 (5.8%) |
| 80 to 84 Years | 2 (0.8%) | 9 (3.3%) |
| 85 Years and over | 17 (7.0%) | 2 (0.7%) |
| Total | 241 (100.0%) | 277 (100.0%) |
Families and Households in White City
Median Family Size in White City
The median family size in White City is 2.76 persons per family, with single female/mother families (25 | 16.5%) accounting for the largest median family size of 4.72 persons per family. On the other hand, single male/father families (8 | 5.3%) represent the smallest median family size with 1.38 persons per family.
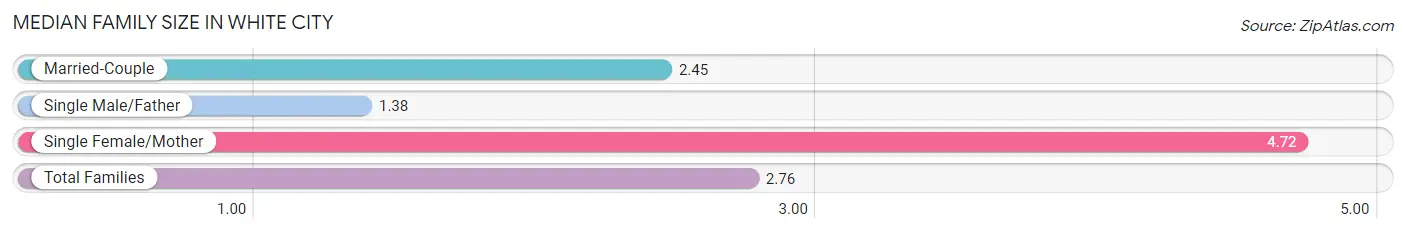
| Family Type | # Families | Family Size |
| Married-Couple | 119 (78.3%) | 2.45 |
| Single Male/Father | 8 (5.3%) | 1.38 |
| Single Female/Mother | 25 (16.5%) | 4.72 |
| Total Families | 152 (100.0%) | 2.76 |
Median Household Size in White City
The median household size in White City is 2.25 persons per household, with single female/mother households (25 | 10.9%) accounting for the largest median household size of 5.4 persons per household. non-family households (78 | 33.9%) represent the smallest median household size with 1.04 persons per household.
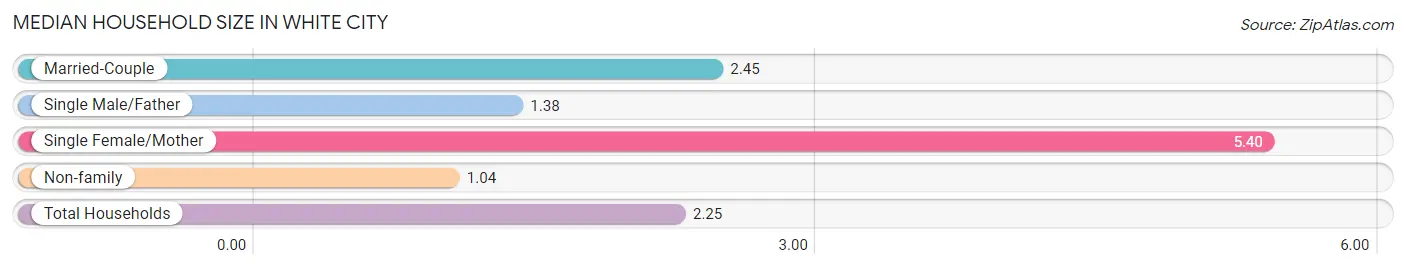
| Household Type | # Households | Household Size |
| Married-Couple | 119 (51.7%) | 2.45 |
| Single Male/Father | 8 (3.5%) | 1.38 |
| Single Female/Mother | 25 (10.9%) | 5.40 |
| Non-family | 78 (33.9%) | 1.04 |
| Total Households | 230 (100.0%) | 2.25 |
Household Size by Marriage Status in White City
Out of a total of 230 households in White City, 152 (66.1%) are family households, while 78 (33.9%) are nonfamily households. The most numerous type of family households are 2-person households, comprising 91, and the most common type of nonfamily households are 1-person households, comprising 69.
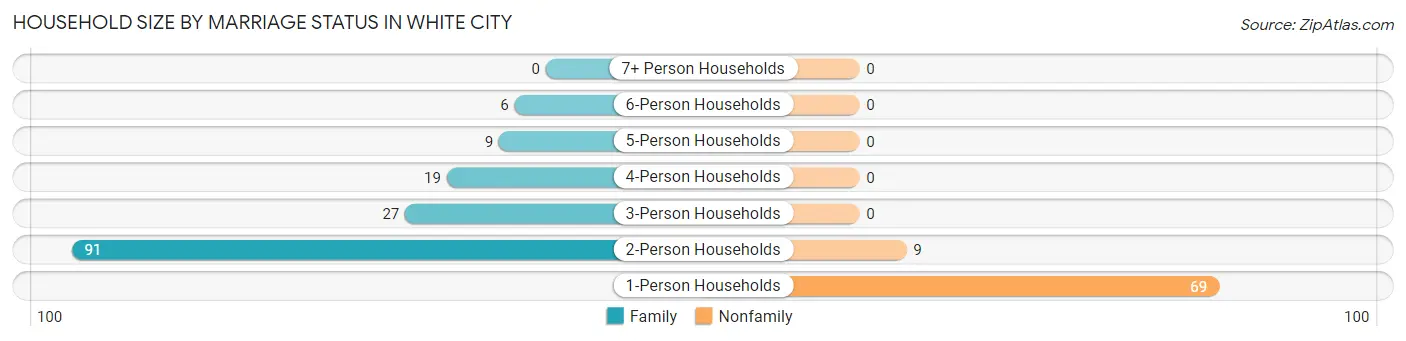
| Household Size | Family Households | Nonfamily Households |
| 1-Person Households | - | 69 (30.0%) |
| 2-Person Households | 91 (39.6%) | 9 (3.9%) |
| 3-Person Households | 27 (11.7%) | 0 (0.0%) |
| 4-Person Households | 19 (8.3%) | 0 (0.0%) |
| 5-Person Households | 9 (3.9%) | 0 (0.0%) |
| 6-Person Households | 6 (2.6%) | 0 (0.0%) |
| 7+ Person Households | 0 (0.0%) | 0 (0.0%) |
| Total | 152 (66.1%) | 78 (33.9%) |
Female Fertility in White City
Fertility by Age in White City
| Age Bracket | Women with Births | Births / 1,000 Women |
| 15 to 19 years | 0 (0.0%) | 0.0 |
| 20 to 34 years | 0 (0.0%) | 0.0 |
| 35 to 50 years | 0 (0.0%) | 0.0 |
| Total | 0 (0.0%) | 0.0 |
Fertility by Age by Marriage Status in White City
| Age Bracket | Married | Unmarried |
| 15 to 19 years | 0 (0.0%) | 0 (0.0%) |
| 20 to 34 years | 0 (0.0%) | 0 (0.0%) |
| 35 to 50 years | 0 (0.0%) | 0 (0.0%) |
| Total | 0 (0.0%) | 0 (0.0%) |
Fertility by Education in White City
| Educational Attainment | Women with Births | Births / 1,000 Women |
| Less than High School | 0 (0.0%) | 0.0 |
| High School Diploma | 0 (0.0%) | 0.0 |
| College or Associate's Degree | 0 (0.0%) | 0.0 |
| Bachelor's Degree | 0 (0.0%) | 0.0 |
| Graduate Degree | 0 (0.0%) | 0.0 |
| Total | 0 (0.0%) | 0.0 |
Fertility by Education by Marriage Status in White City
| Educational Attainment | Married | Unmarried |
| Less than High School | 0 (0.0%) | 0 (0.0%) |
| High School Diploma | 0 (0.0%) | 0 (0.0%) |
| College or Associate's Degree | 0 (0.0%) | 0 (0.0%) |
| Bachelor's Degree | 0 (0.0%) | 0 (0.0%) |
| Graduate Degree | 0 (0.0%) | 0 (0.0%) |
| Total | 0 (0.0%) | 0 (0.0%) |
Income in White City
Income Overview in White City
Per Capita Income in White City is $20,771, while median incomes of families and households are $53,676 and $47,738 respectively.
| Characteristic | Number | Measure |
| Per Capita Income | 518 | $20,771 |
| Median Family Income | 152 | $53,676 |
| Mean Family Income | 152 | $56,755 |
| Median Household Income | 230 | $47,738 |
| Mean Household Income | 230 | $48,070 |
| Income Deficit | 152 | $0 |
| Wage / Income Gap (%) | 518 | 0.00% |
| Wage / Income Gap ($) | 518 | 100.00¢ per $1 |
| Gini / Inequality Index | 518 | 0.34 |
Earnings by Sex in White City
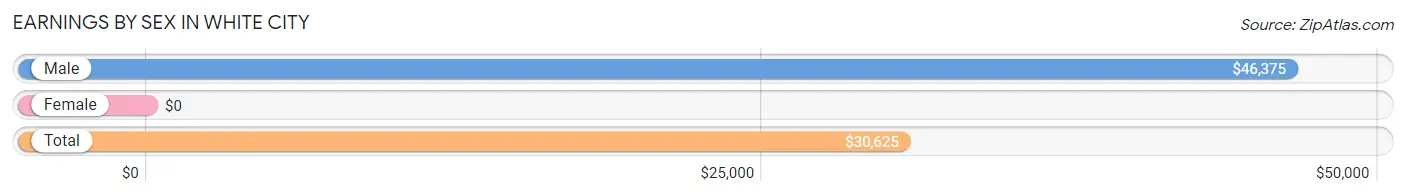
| Sex | Number | Average Earnings |
| Male | 115 (50.2%) | $46,375 |
| Female | 114 (49.8%) | $0 |
| Total | 229 (100.0%) | $30,625 |
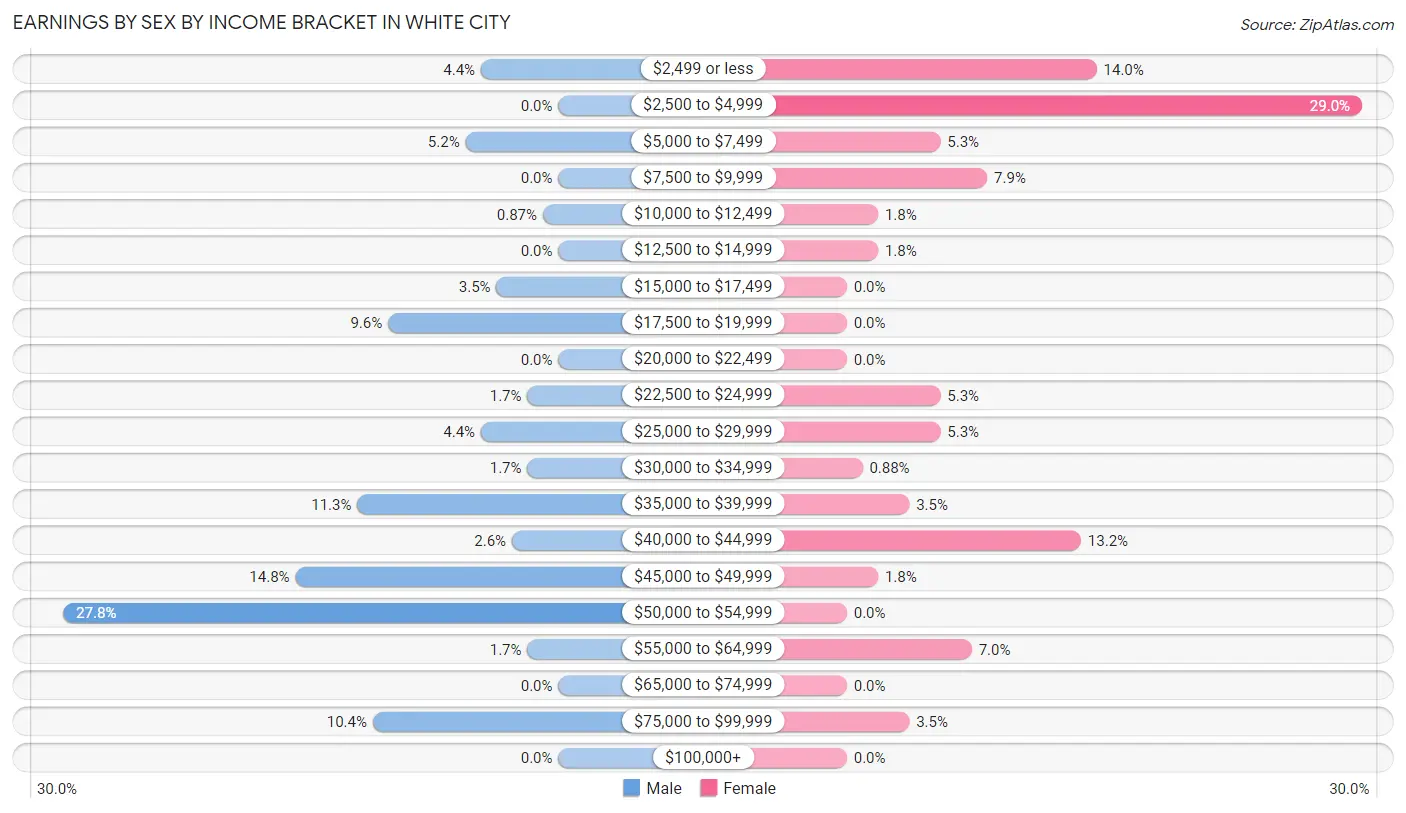
Earnings by Sex by Income Bracket in White City
The most common earnings brackets in White City are $50,000 to $54,999 for men (32 | 27.8%) and $2,500 to $4,999 for women (33 | 28.9%).
| Income | Male | Female |
| $2,499 or less | 5 (4.3%) | 16 (14.0%) |
| $2,500 to $4,999 | 0 (0.0%) | 33 (28.9%) |
| $5,000 to $7,499 | 6 (5.2%) | 6 (5.3%) |
| $7,500 to $9,999 | 0 (0.0%) | 9 (7.9%) |
| $10,000 to $12,499 | 1 (0.9%) | 2 (1.8%) |
| $12,500 to $14,999 | 0 (0.0%) | 2 (1.8%) |
| $15,000 to $17,499 | 4 (3.5%) | 0 (0.0%) |
| $17,500 to $19,999 | 11 (9.6%) | 0 (0.0%) |
| $20,000 to $22,499 | 0 (0.0%) | 0 (0.0%) |
| $22,500 to $24,999 | 2 (1.7%) | 6 (5.3%) |
| $25,000 to $29,999 | 5 (4.3%) | 6 (5.3%) |
| $30,000 to $34,999 | 2 (1.7%) | 1 (0.9%) |
| $35,000 to $39,999 | 13 (11.3%) | 4 (3.5%) |
| $40,000 to $44,999 | 3 (2.6%) | 15 (13.2%) |
| $45,000 to $49,999 | 17 (14.8%) | 2 (1.8%) |
| $50,000 to $54,999 | 32 (27.8%) | 0 (0.0%) |
| $55,000 to $64,999 | 2 (1.7%) | 8 (7.0%) |
| $65,000 to $74,999 | 0 (0.0%) | 0 (0.0%) |
| $75,000 to $99,999 | 12 (10.4%) | 4 (3.5%) |
| $100,000+ | 0 (0.0%) | 0 (0.0%) |
| Total | 115 (100.0%) | 114 (100.0%) |
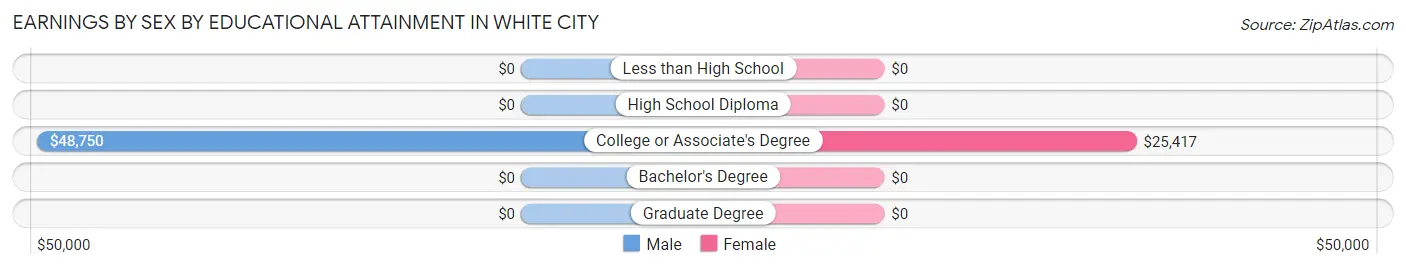
Earnings by Sex by Educational Attainment in White City
Average earnings in White City are $46,750 for men and $24,375 for women, a difference of 47.9%. Men with an educational attainment of college or associate's degree enjoy the highest average annual earnings of $48,750, while those with college or associate's degree education earn the least with $48,750. Women with an educational attainment of college or associate's degree earn the most with the average annual earnings of $25,417, while those with college or associate's degree education have the smallest earnings of $25,417.
| Educational Attainment | Male Income | Female Income |
| Less than High School | - | - |
| High School Diploma | - | - |
| College or Associate's Degree | $48,750 | $25,417 |
| Bachelor's Degree | - | - |
| Graduate Degree | - | - |
| Total | $46,750 | $24,375 |
Family Income in White City
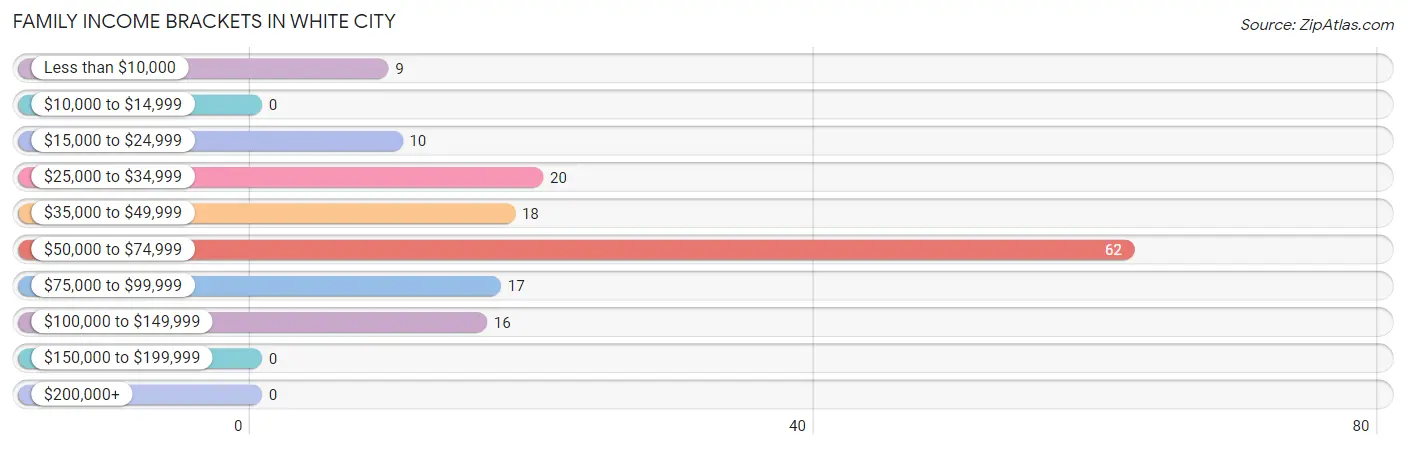
Family Income Brackets in White City
According to the White City family income data, there are 62 families falling into the $50,000 to $74,999 income range, which is the most common income bracket and makes up 40.8% of all families.
| Income Bracket | # Families | % Families |
| Less than $10,000 | 9 | 5.9% |
| $10,000 to $14,999 | 0 | 0.0% |
| $15,000 to $24,999 | 10 | 6.6% |
| $25,000 to $34,999 | 20 | 13.2% |
| $35,000 to $49,999 | 18 | 11.8% |
| $50,000 to $74,999 | 62 | 40.8% |
| $75,000 to $99,999 | 17 | 11.2% |
| $100,000 to $149,999 | 16 | 10.5% |
| $150,000 to $199,999 | 0 | 0.0% |
| $200,000+ | 0 | 0.0% |
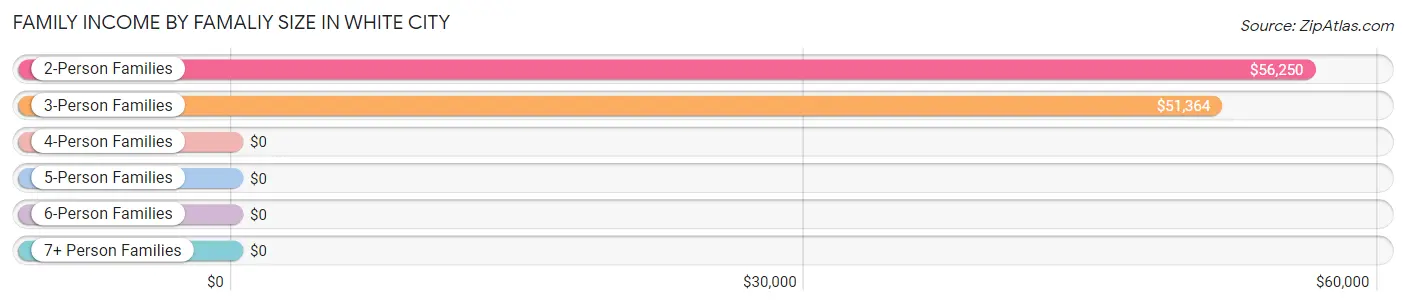
Family Income by Famaliy Size in White City
2-person families (92 | 60.5%) account for the highest median family income in White City with $56,250 per family, while 2-person families (92 | 60.5%) have the highest median income of $28,125 per family member.
| Income Bracket | # Families | Median Income |
| 2-Person Families | 92 (60.5%) | $56,250 |
| 3-Person Families | 26 (17.1%) | $51,364 |
| 4-Person Families | 28 (18.4%) | $0 |
| 5-Person Families | 6 (4.0%) | $0 |
| 6-Person Families | 0 (0.0%) | $0 |
| 7+ Person Families | 0 (0.0%) | $0 |
| Total | 152 (100.0%) | $53,676 |
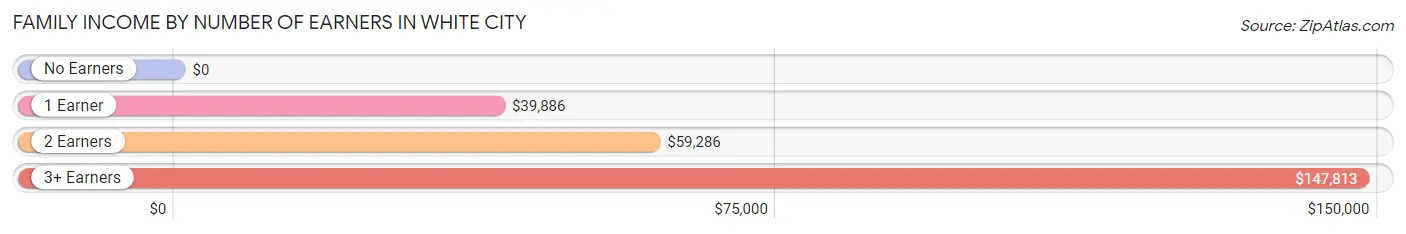
Family Income by Number of Earners in White City
| Number of Earners | # Families | Median Income |
| No Earners | 50 (32.9%) | $0 |
| 1 Earner | 43 (28.3%) | $39,886 |
| 2 Earners | 52 (34.2%) | $59,286 |
| 3+ Earners | 7 (4.6%) | $147,813 |
| Total | 152 (100.0%) | $53,676 |
Household Income in White City
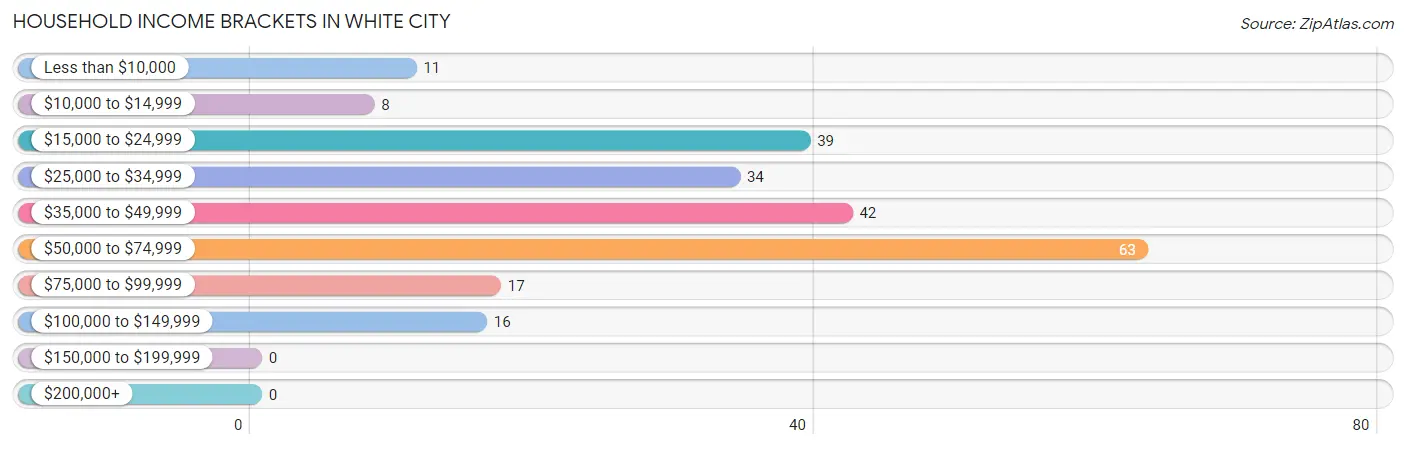
Household Income Brackets in White City
With 63 households falling in the category, the $50,000 to $74,999 income range is the most frequent in White City, accounting for 27.4% of all households.
| Income Bracket | # Households | % Households |
| Less than $10,000 | 11 | 4.8% |
| $10,000 to $14,999 | 8 | 3.5% |
| $15,000 to $24,999 | 39 | 17.0% |
| $25,000 to $34,999 | 34 | 14.8% |
| $35,000 to $49,999 | 42 | 18.3% |
| $50,000 to $74,999 | 63 | 27.4% |
| $75,000 to $99,999 | 17 | 7.4% |
| $100,000 to $149,999 | 16 | 7.0% |
| $150,000 to $199,999 | 0 | 0.0% |
| $200,000+ | 0 | 0.0% |
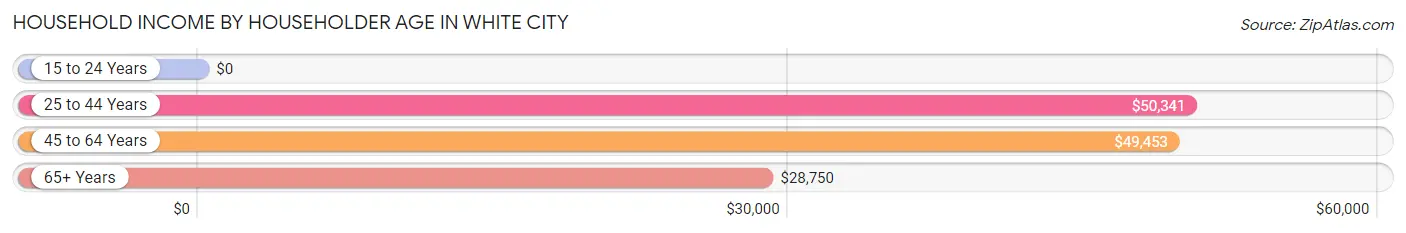
Household Income by Householder Age in White City
The median household income in White City is $47,738, with the highest median household income of $50,341 found in the 25 to 44 years age bracket for the primary householder. A total of 65 households (28.3%) fall into this category.
| Income Bracket | # Households | Median Income |
| 15 to 24 Years | 0 (0.0%) | $0 |
| 25 to 44 Years | 65 (28.3%) | $50,341 |
| 45 to 64 Years | 79 (34.4%) | $49,453 |
| 65+ Years | 86 (37.4%) | $28,750 |
| Total | 230 (100.0%) | $47,738 |
Poverty in White City
Income Below Poverty by Sex and Age in White City
With 9.1% poverty level for males and 16.6% for females among the residents of White City, under 5 year old males and under 5 year old females are the most vulnerable to poverty, with 11 males (34.4%) and 14 females (66.7%) in their respective age groups living below the poverty level.
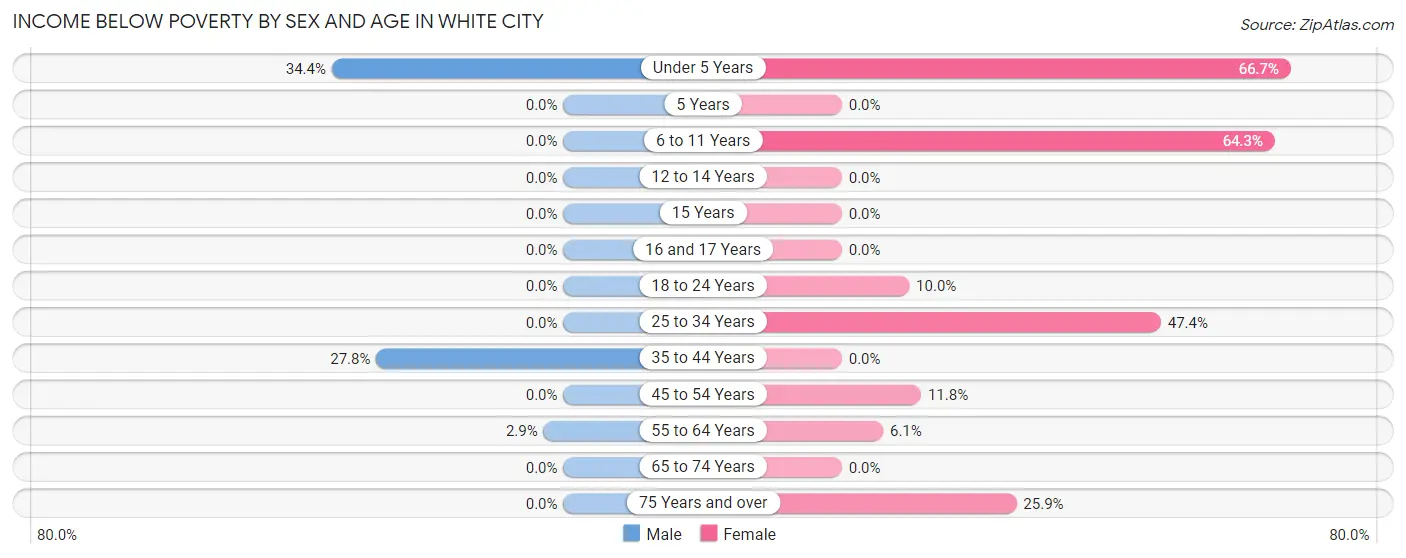
| Age Bracket | Male | Female |
| Under 5 Years | 11 (34.4%) | 14 (66.7%) |
| 5 Years | 0 (0.0%) | 0 (0.0%) |
| 6 to 11 Years | 0 (0.0%) | 9 (64.3%) |
| 12 to 14 Years | 0 (0.0%) | 0 (0.0%) |
| 15 Years | 0 (0.0%) | 0 (0.0%) |
| 16 and 17 Years | 0 (0.0%) | 0 (0.0%) |
| 18 to 24 Years | 0 (0.0%) | 2 (10.0%) |
| 25 to 34 Years | 0 (0.0%) | 9 (47.4%) |
| 35 to 44 Years | 10 (27.8%) | 0 (0.0%) |
| 45 to 54 Years | 0 (0.0%) | 2 (11.8%) |
| 55 to 64 Years | 1 (2.9%) | 3 (6.1%) |
| 65 to 74 Years | 0 (0.0%) | 0 (0.0%) |
| 75 Years and over | 0 (0.0%) | 7 (25.9%) |
| Total | 22 (9.1%) | 46 (16.6%) |
Income Above Poverty by Sex and Age in White City
According to the poverty statistics in White City, males aged 5 years and females aged 12 to 14 years are the age groups that are most secure financially, with 100.0% of males and 100.0% of females in these age groups living above the poverty line.
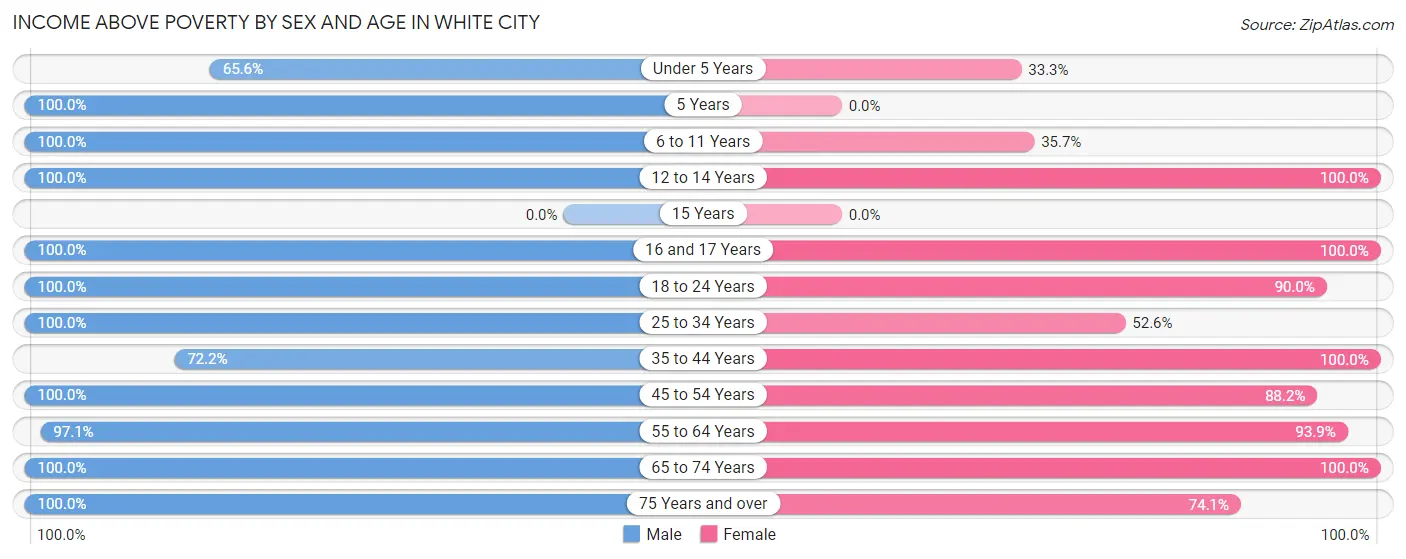
| Age Bracket | Male | Female |
| Under 5 Years | 21 (65.6%) | 7 (33.3%) |
| 5 Years | 3 (100.0%) | 0 (0.0%) |
| 6 to 11 Years | 2 (100.0%) | 5 (35.7%) |
| 12 to 14 Years | 6 (100.0%) | 5 (100.0%) |
| 15 Years | 0 (0.0%) | 0 (0.0%) |
| 16 and 17 Years | 4 (100.0%) | 22 (100.0%) |
| 18 to 24 Years | 3 (100.0%) | 18 (90.0%) |
| 25 to 34 Years | 36 (100.0%) | 10 (52.6%) |
| 35 to 44 Years | 26 (72.2%) | 27 (100.0%) |
| 45 to 54 Years | 20 (100.0%) | 15 (88.2%) |
| 55 to 64 Years | 33 (97.1%) | 46 (93.9%) |
| 65 to 74 Years | 30 (100.0%) | 56 (100.0%) |
| 75 Years and over | 35 (100.0%) | 20 (74.1%) |
| Total | 219 (90.9%) | 231 (83.4%) |
Income Below Poverty Among Married-Couple Families in White City
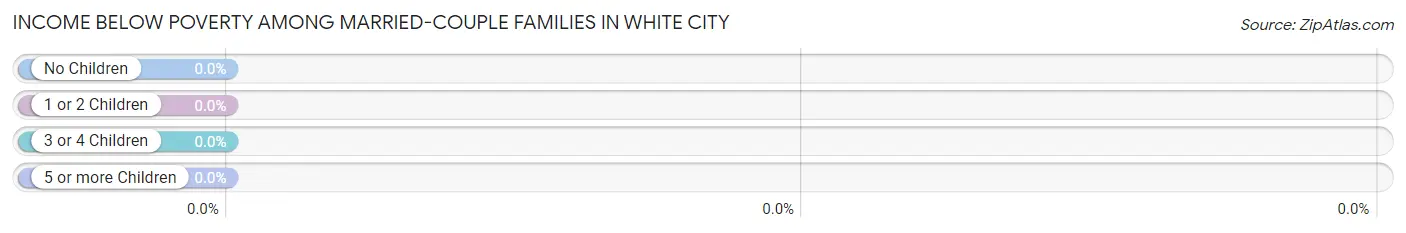
| Children | Above Poverty | Below Poverty |
| No Children | 104 (100.0%) | 0 (0.0%) |
| 1 or 2 Children | 15 (100.0%) | 0 (0.0%) |
| 3 or 4 Children | 0 (0.0%) | 0 (0.0%) |
| 5 or more Children | 0 (0.0%) | 0 (0.0%) |
| Total | 119 (100.0%) | 0 (0.0%) |
Income Below Poverty Among Single-Parent Households in White City
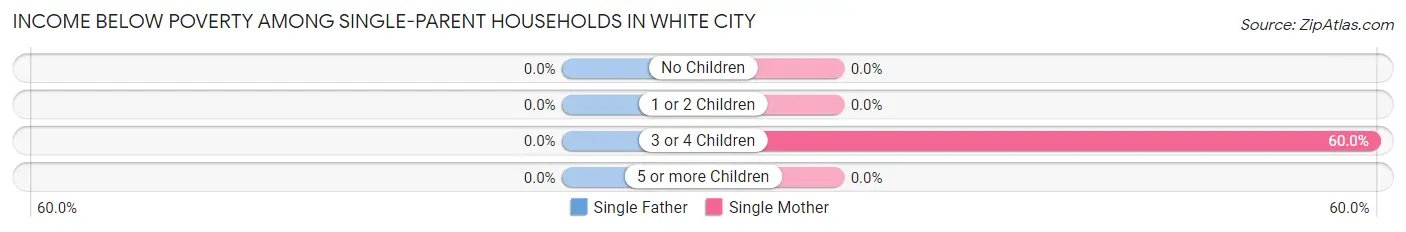
| Children | Single Father | Single Mother |
| No Children | 0 (0.0%) | 0 (0.0%) |
| 1 or 2 Children | 0 (0.0%) | 0 (0.0%) |
| 3 or 4 Children | 0 (0.0%) | 9 (60.0%) |
| 5 or more Children | 0 (0.0%) | 0 (0.0%) |
| Total | 0 (0.0%) | 9 (36.0%) |
Income Below Poverty Among Married-Couple vs Single-Parent Households in White City
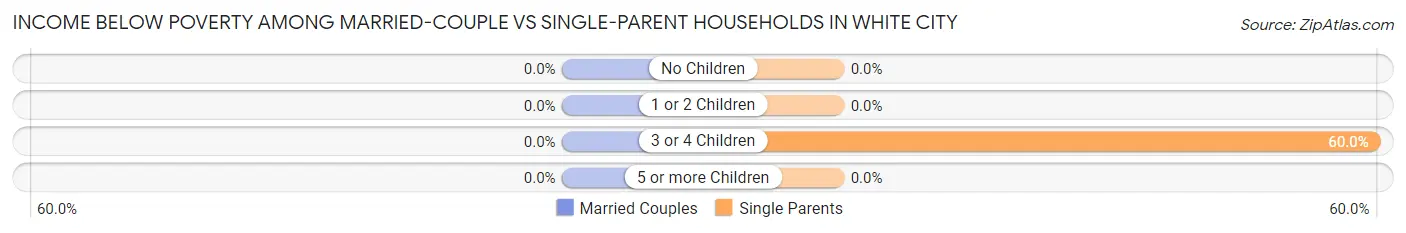
| Children | Married-Couple Families | Single-Parent Households |
| No Children | 0 (0.0%) | 0 (0.0%) |
| 1 or 2 Children | 0 (0.0%) | 0 (0.0%) |
| 3 or 4 Children | 0 (0.0%) | 9 (60.0%) |
| 5 or more Children | 0 (0.0%) | 0 (0.0%) |
| Total | 0 (0.0%) | 9 (27.3%) |
Employment Characteristics in White City
Employment by Class of Employer in White City
Among the 177 employed individuals in White City, private company employees (116 | 65.5%), local government employees (23 | 13.0%), and self-employed (not incorporated) (14 | 7.9%) make up the most common classes of employment.
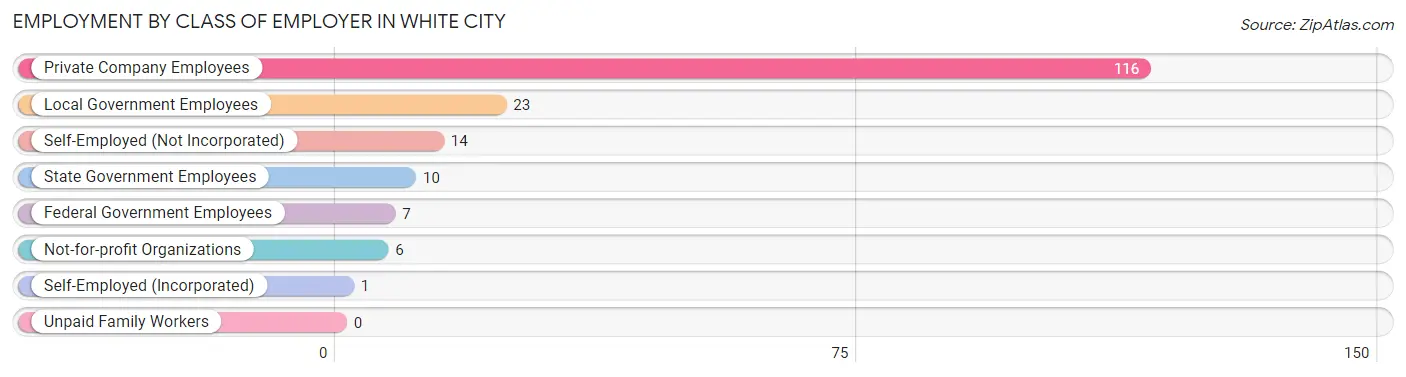
| Employer Class | # Employees | % Employees |
| Private Company Employees | 116 | 65.5% |
| Self-Employed (Incorporated) | 1 | 0.6% |
| Self-Employed (Not Incorporated) | 14 | 7.9% |
| Not-for-profit Organizations | 6 | 3.4% |
| Local Government Employees | 23 | 13.0% |
| State Government Employees | 10 | 5.7% |
| Federal Government Employees | 7 | 4.0% |
| Unpaid Family Workers | 0 | 0.0% |
| Total | 177 | 100.0% |
Employment Status by Age in White City
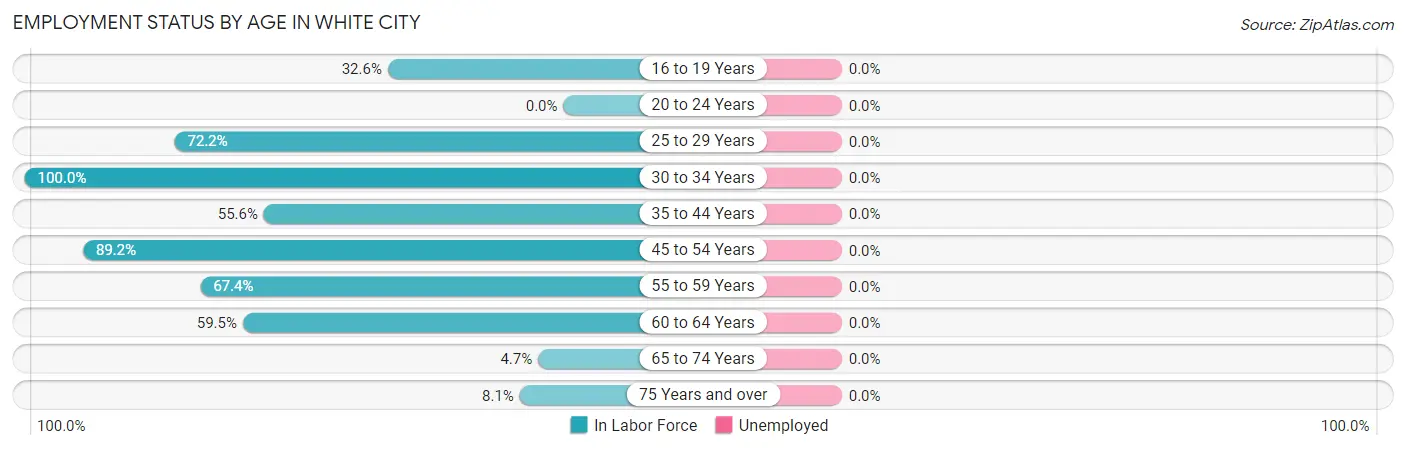
| Age Bracket | In Labor Force | Unemployed |
| 16 to 19 Years | 14 (32.6%) | 0 (0.0%) |
| 20 to 24 Years | 0 (0.0%) | 0 (0.0%) |
| 25 to 29 Years | 26 (72.2%) | 0 (0.0%) |
| 30 to 34 Years | 19 (100.0%) | 0 (0.0%) |
| 35 to 44 Years | 35 (55.6%) | 0 (0.0%) |
| 45 to 54 Years | 33 (89.2%) | 0 (0.0%) |
| 55 to 59 Years | 31 (67.4%) | 0 (0.0%) |
| 60 to 64 Years | 22 (59.5%) | 0 (0.0%) |
| 65 to 74 Years | 4 (4.7%) | 0 (0.0%) |
| 75 Years and over | 5 (8.1%) | 0 (0.0%) |
| Total | 189 (43.4%) | 0 (0.0%) |
Employment Status by Educational Attainment in White City
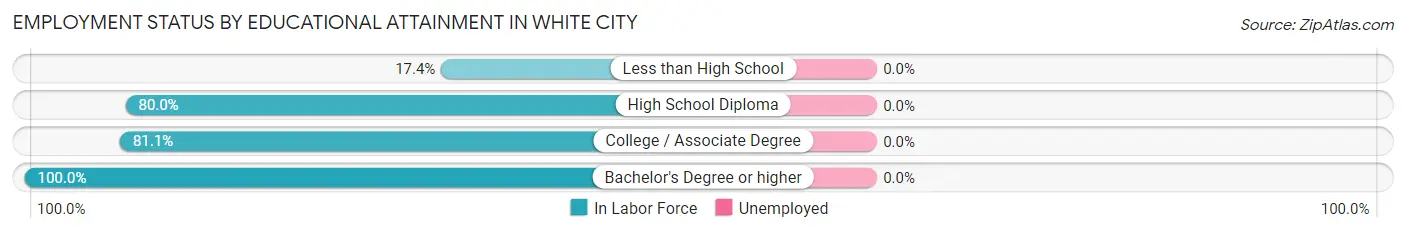
| Educational Attainment | In Labor Force | Unemployed |
| Less than High School | 8 (17.4%) | 0 (0.0%) |
| High School Diploma | 68 (80.0%) | 0 (0.0%) |
| College / Associate Degree | 73 (81.1%) | 0 (0.0%) |
| Bachelor's Degree or higher | 17 (100.0%) | 0 (0.0%) |
| Total | 166 (69.7%) | 0 (0.0%) |
Employment Occupations by Sex in White City
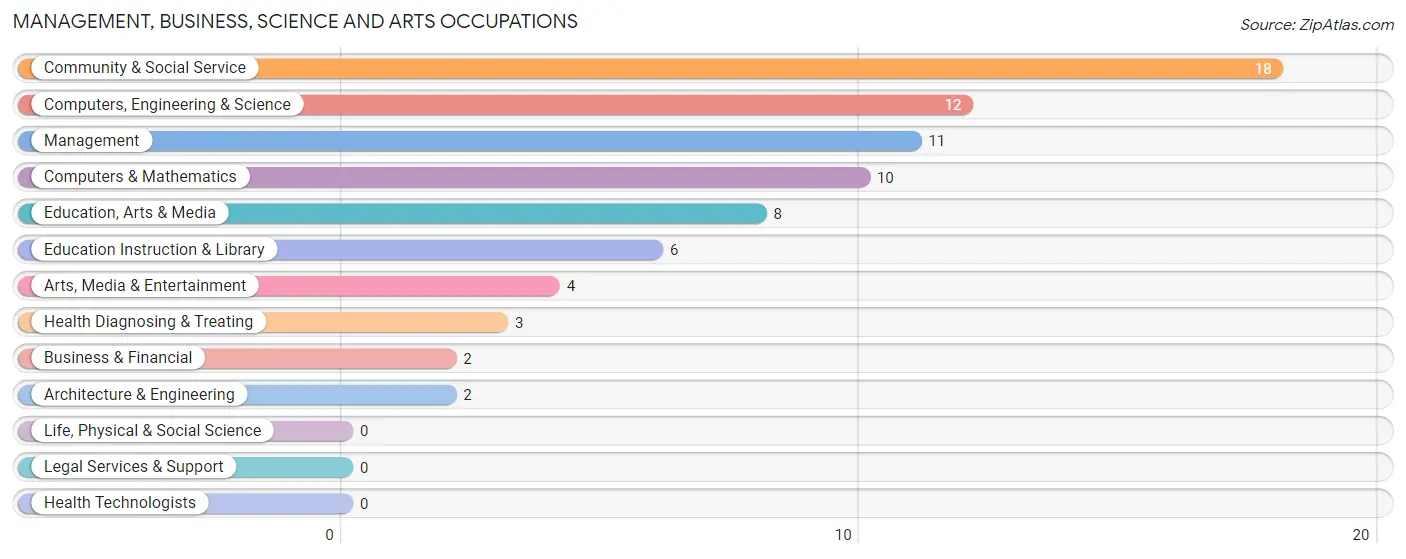
Management, Business, Science and Arts Occupations
The most common Management, Business, Science and Arts occupations in White City are Community & Social Service (18 | 9.7%), Computers, Engineering & Science (12 | 6.5%), Management (11 | 5.9%), Computers & Mathematics (10 | 5.4%), and Education, Arts & Media (8 | 4.3%).
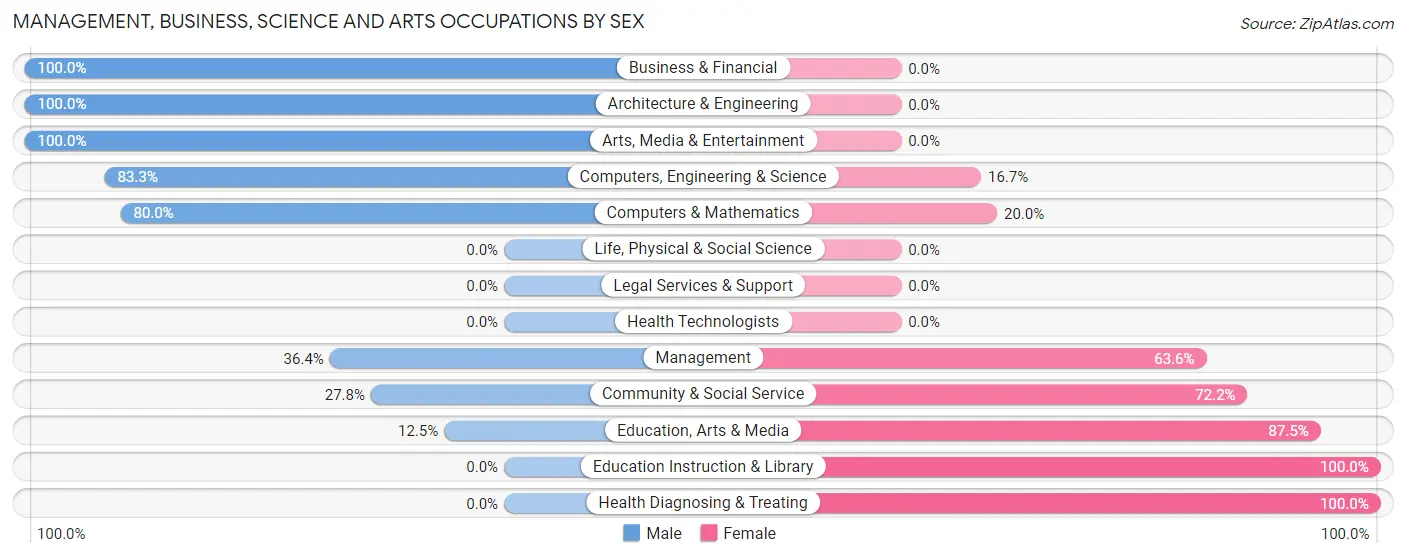
Management, Business, Science and Arts Occupations by Sex
Within the Management, Business, Science and Arts occupations in White City, the most male-oriented occupations are Business & Financial (100.0%), Architecture & Engineering (100.0%), and Arts, Media & Entertainment (100.0%), while the most female-oriented occupations are Education Instruction & Library (100.0%), Health Diagnosing & Treating (100.0%), and Education, Arts & Media (87.5%).
| Occupation | Male | Female |
| Management | 4 (36.4%) | 7 (63.6%) |
| Business & Financial | 2 (100.0%) | 0 (0.0%) |
| Computers, Engineering & Science | 10 (83.3%) | 2 (16.7%) |
| Computers & Mathematics | 8 (80.0%) | 2 (20.0%) |
| Architecture & Engineering | 2 (100.0%) | 0 (0.0%) |
| Life, Physical & Social Science | 0 (0.0%) | 0 (0.0%) |
| Community & Social Service | 5 (27.8%) | 13 (72.2%) |
| Education, Arts & Media | 1 (12.5%) | 7 (87.5%) |
| Legal Services & Support | 0 (0.0%) | 0 (0.0%) |
| Education Instruction & Library | 0 (0.0%) | 6 (100.0%) |
| Arts, Media & Entertainment | 4 (100.0%) | 0 (0.0%) |
| Health Diagnosing & Treating | 0 (0.0%) | 3 (100.0%) |
| Health Technologists | 0 (0.0%) | 0 (0.0%) |
| Total (Category) | 21 (45.7%) | 25 (54.3%) |
| Total (Overall) | 108 (58.1%) | 78 (41.9%) |
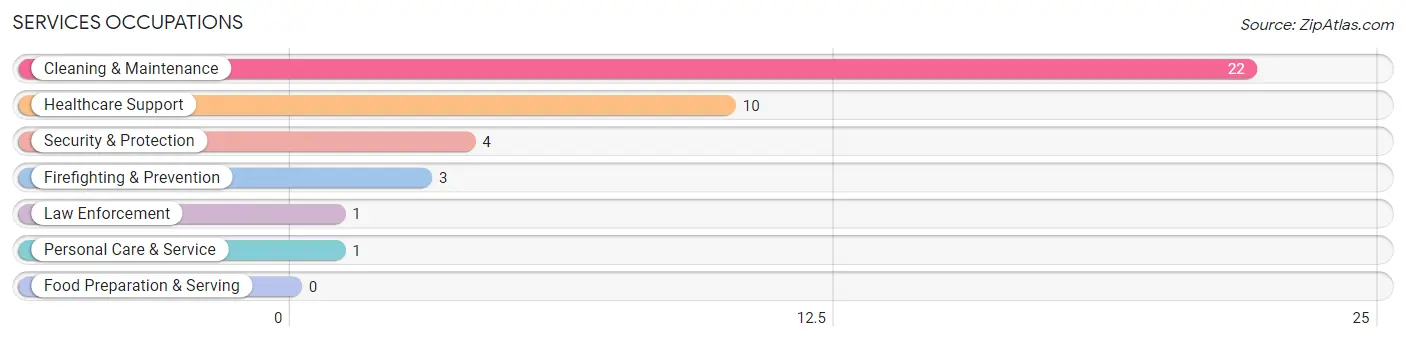
Services Occupations
The most common Services occupations in White City are Cleaning & Maintenance (22 | 11.8%), Healthcare Support (10 | 5.4%), Security & Protection (4 | 2.1%), Firefighting & Prevention (3 | 1.6%), and Law Enforcement (1 | 0.5%).
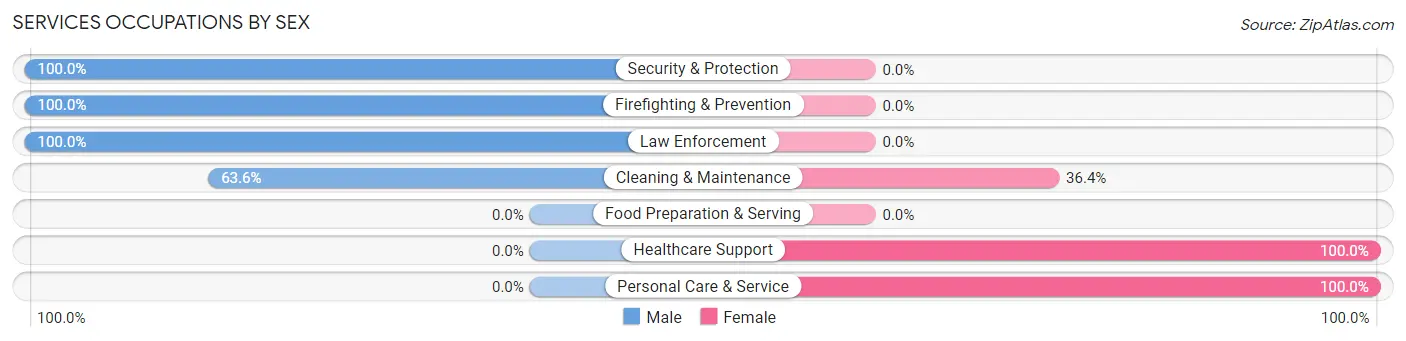
Services Occupations by Sex
Within the Services occupations in White City, the most male-oriented occupations are Security & Protection (100.0%), Firefighting & Prevention (100.0%), and Law Enforcement (100.0%), while the most female-oriented occupations are Healthcare Support (100.0%), Personal Care & Service (100.0%), and Cleaning & Maintenance (36.4%).
| Occupation | Male | Female |
| Healthcare Support | 0 (0.0%) | 10 (100.0%) |
| Security & Protection | 4 (100.0%) | 0 (0.0%) |
| Firefighting & Prevention | 3 (100.0%) | 0 (0.0%) |
| Law Enforcement | 1 (100.0%) | 0 (0.0%) |
| Food Preparation & Serving | 0 (0.0%) | 0 (0.0%) |
| Cleaning & Maintenance | 14 (63.6%) | 8 (36.4%) |
| Personal Care & Service | 0 (0.0%) | 1 (100.0%) |
| Total (Category) | 18 (48.6%) | 19 (51.3%) |
| Total (Overall) | 108 (58.1%) | 78 (41.9%) |
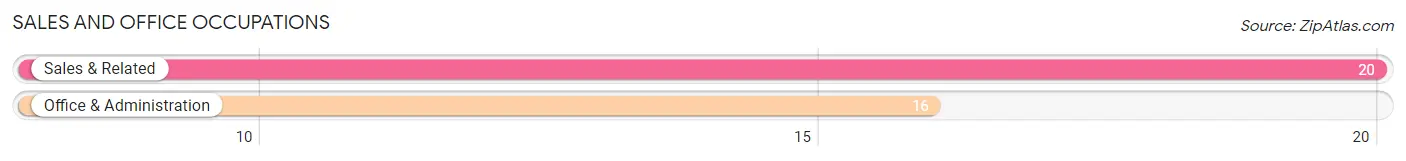
Sales and Office Occupations
The most common Sales and Office occupations in White City are Sales & Related (20 | 10.7%), and Office & Administration (16 | 8.6%).
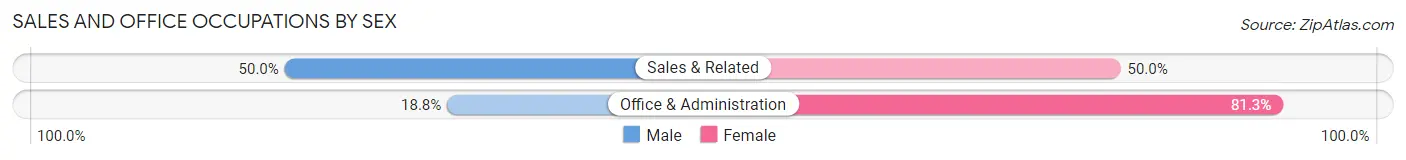
Sales and Office Occupations by Sex
| Occupation | Male | Female |
| Sales & Related | 10 (50.0%) | 10 (50.0%) |
| Office & Administration | 3 (18.8%) | 13 (81.2%) |
| Total (Category) | 13 (36.1%) | 23 (63.9%) |
| Total (Overall) | 108 (58.1%) | 78 (41.9%) |
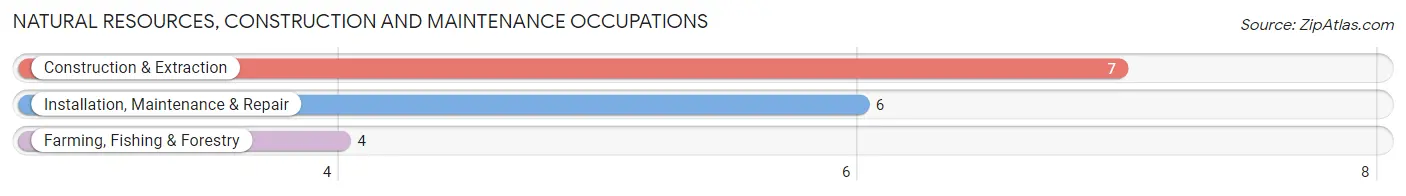
Natural Resources, Construction and Maintenance Occupations
The most common Natural Resources, Construction and Maintenance occupations in White City are Construction & Extraction (7 | 3.8%), Installation, Maintenance & Repair (6 | 3.2%), and Farming, Fishing & Forestry (4 | 2.1%).
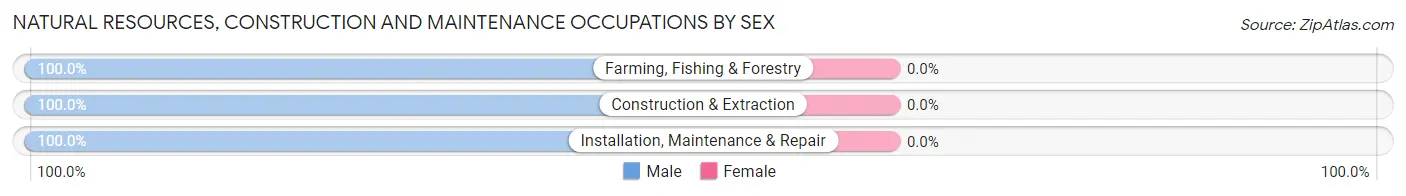
Natural Resources, Construction and Maintenance Occupations by Sex
| Occupation | Male | Female |
| Farming, Fishing & Forestry | 4 (100.0%) | 0 (0.0%) |
| Construction & Extraction | 7 (100.0%) | 0 (0.0%) |
| Installation, Maintenance & Repair | 6 (100.0%) | 0 (0.0%) |
| Total (Category) | 17 (100.0%) | 0 (0.0%) |
| Total (Overall) | 108 (58.1%) | 78 (41.9%) |
Production, Transportation and Moving Occupations
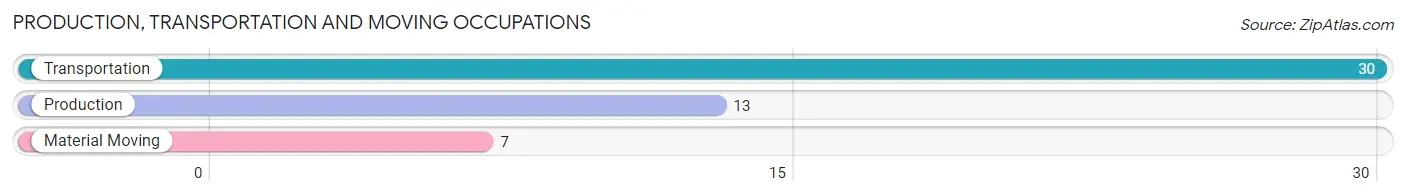
The most common Production, Transportation and Moving occupations in White City are Transportation (30 | 16.1%), Production (13 | 7.0%), and Material Moving (7 | 3.8%).
Production, Transportation and Moving Occupations by Sex
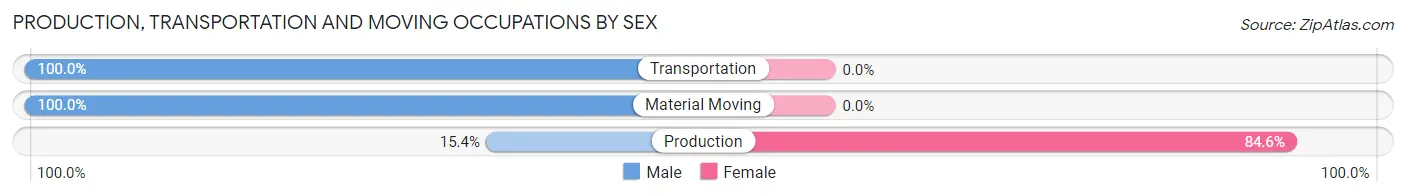
| Occupation | Male | Female |
| Production | 2 (15.4%) | 11 (84.6%) |
| Transportation | 30 (100.0%) | 0 (0.0%) |
| Material Moving | 7 (100.0%) | 0 (0.0%) |
| Total (Category) | 39 (78.0%) | 11 (22.0%) |
| Total (Overall) | 108 (58.1%) | 78 (41.9%) |
Employment Industries by Sex in White City
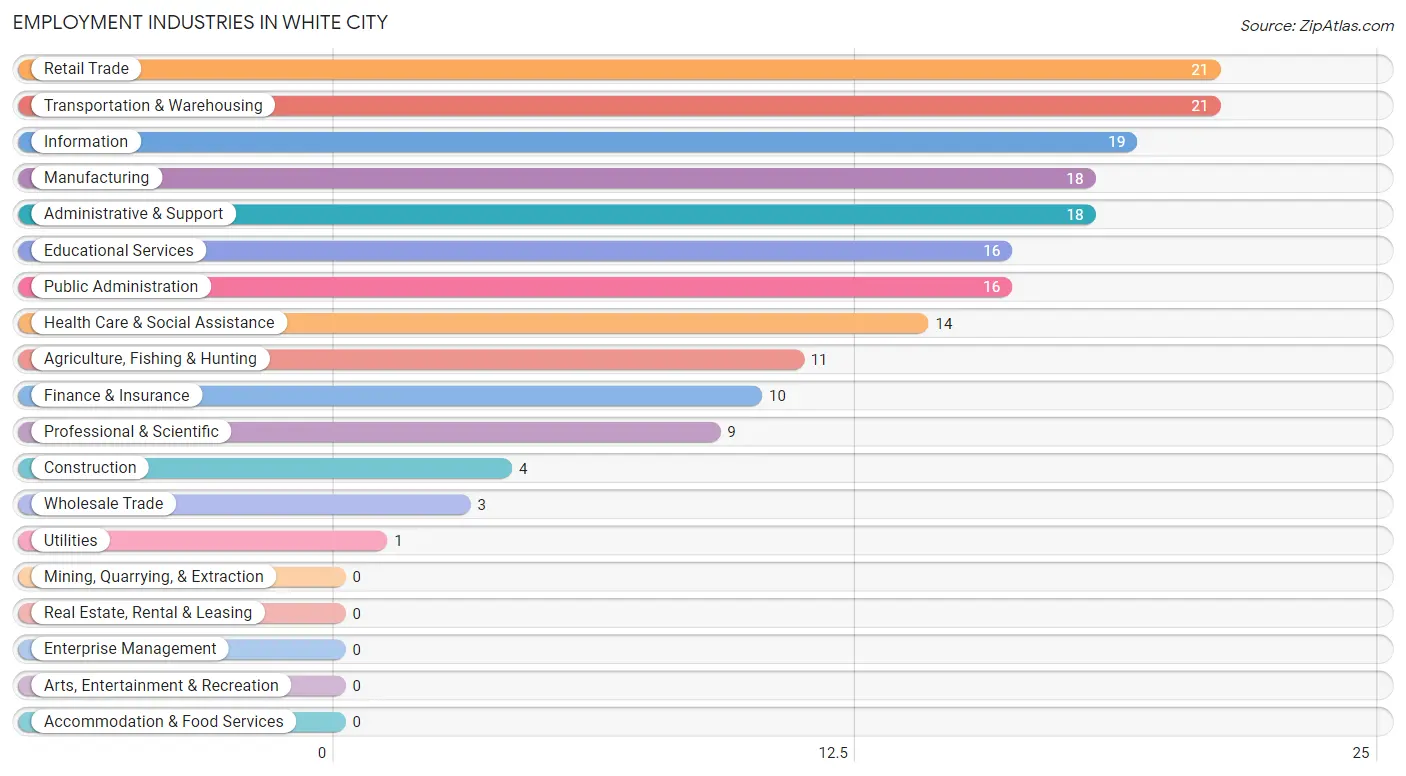
Employment Industries in White City
The major employment industries in White City include Retail Trade (21 | 11.3%), Transportation & Warehousing (21 | 11.3%), Information (19 | 10.2%), Manufacturing (18 | 9.7%), and Administrative & Support (18 | 9.7%).
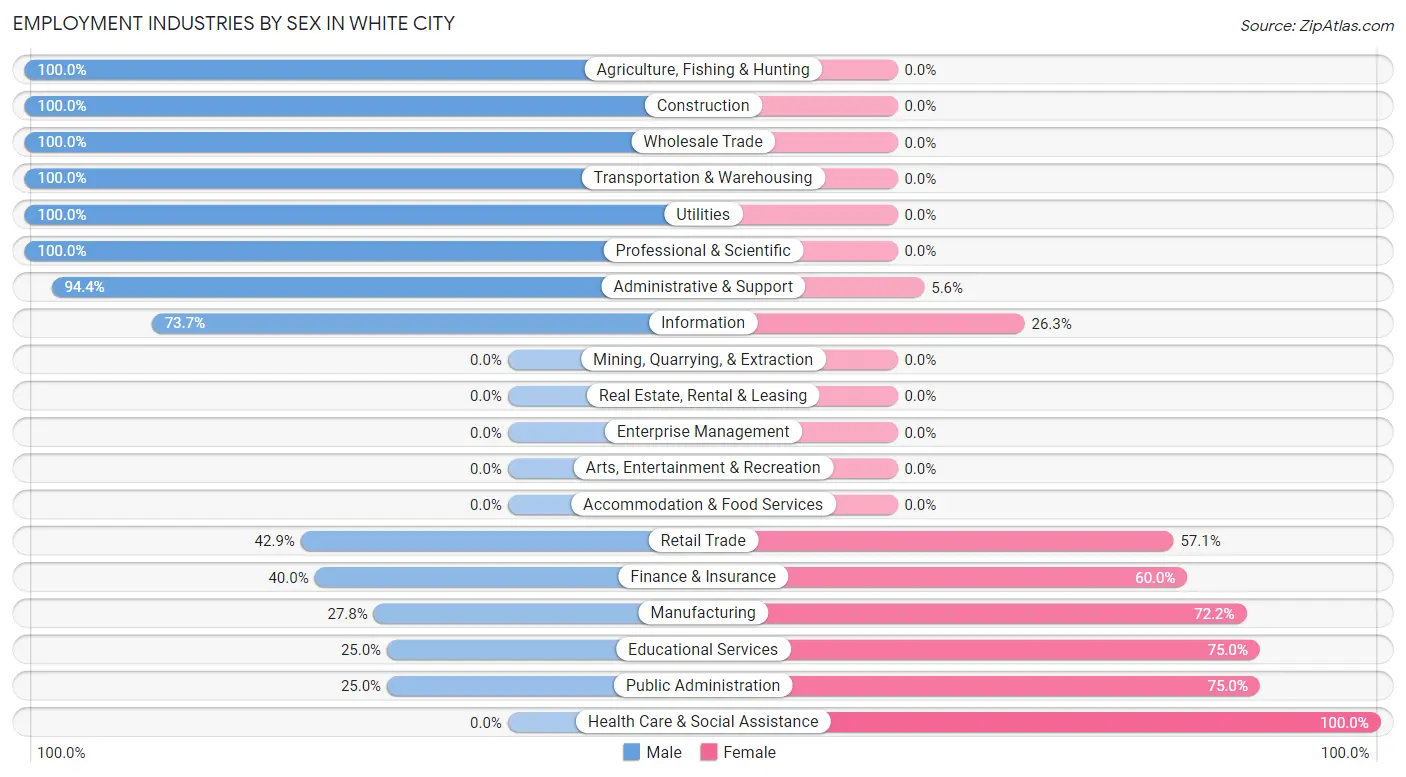
Employment Industries by Sex in White City
The White City industries that see more men than women are Agriculture, Fishing & Hunting (100.0%), Construction (100.0%), and Wholesale Trade (100.0%), whereas the industries that tend to have a higher number of women are Health Care & Social Assistance (100.0%), Educational Services (75.0%), and Public Administration (75.0%).
| Industry | Male | Female |
| Agriculture, Fishing & Hunting | 11 (100.0%) | 0 (0.0%) |
| Mining, Quarrying, & Extraction | 0 (0.0%) | 0 (0.0%) |
| Construction | 4 (100.0%) | 0 (0.0%) |
| Manufacturing | 5 (27.8%) | 13 (72.2%) |
| Wholesale Trade | 3 (100.0%) | 0 (0.0%) |
| Retail Trade | 9 (42.9%) | 12 (57.1%) |
| Transportation & Warehousing | 21 (100.0%) | 0 (0.0%) |
| Utilities | 1 (100.0%) | 0 (0.0%) |
| Information | 14 (73.7%) | 5 (26.3%) |
| Finance & Insurance | 4 (40.0%) | 6 (60.0%) |
| Real Estate, Rental & Leasing | 0 (0.0%) | 0 (0.0%) |
| Professional & Scientific | 9 (100.0%) | 0 (0.0%) |
| Enterprise Management | 0 (0.0%) | 0 (0.0%) |
| Administrative & Support | 17 (94.4%) | 1 (5.6%) |
| Educational Services | 4 (25.0%) | 12 (75.0%) |
| Health Care & Social Assistance | 0 (0.0%) | 14 (100.0%) |
| Arts, Entertainment & Recreation | 0 (0.0%) | 0 (0.0%) |
| Accommodation & Food Services | 0 (0.0%) | 0 (0.0%) |
| Public Administration | 4 (25.0%) | 12 (75.0%) |
| Total | 108 (58.1%) | 78 (41.9%) |
Education in White City
School Enrollment in White City
The most common levels of schooling among the 96 students in White City are high school (32 | 33.3%), college / undergraduate (23 | 24.0%), and nursery / preschool (14 | 14.6%).
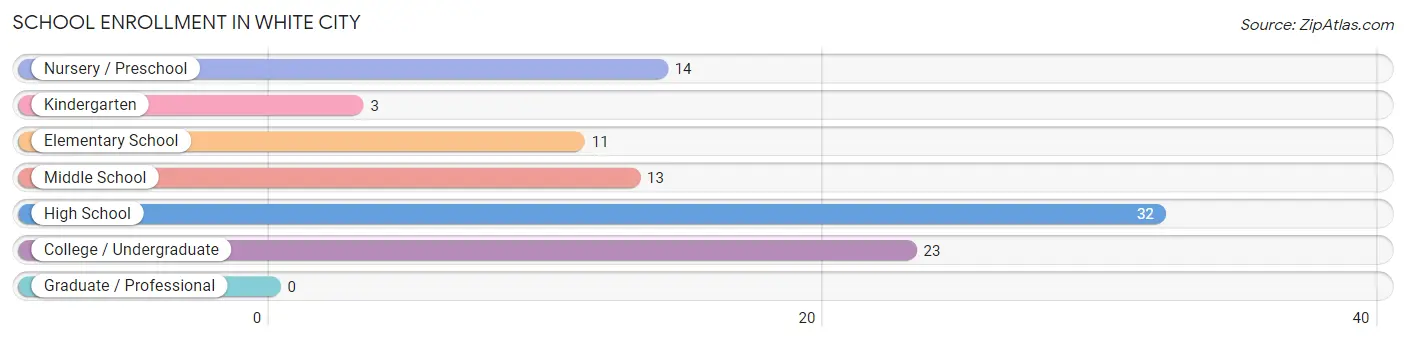
| School Level | # Students | % Students |
| Nursery / Preschool | 14 | 14.6% |
| Kindergarten | 3 | 3.1% |
| Elementary School | 11 | 11.5% |
| Middle School | 13 | 13.5% |
| High School | 32 | 33.3% |
| College / Undergraduate | 23 | 24.0% |
| Graduate / Professional | 0 | 0.0% |
| Total | 96 | 100.0% |
School Enrollment by Age by Funding Source in White City
Out of a total of 96 students who are enrolled in schools in White City, 3 (3.1%) attend a private institution, while the remaining 93 (96.9%) are enrolled in public schools. The age group of 18 to 19 year olds has the highest likelihood of being enrolled in private schools, with 3 (23.1% in the age bracket) enrolled. Conversely, the age group of 3 to 4 year olds has the lowest likelihood of being enrolled in a private school, with 14 (100.0% in the age bracket) attending a public institution.
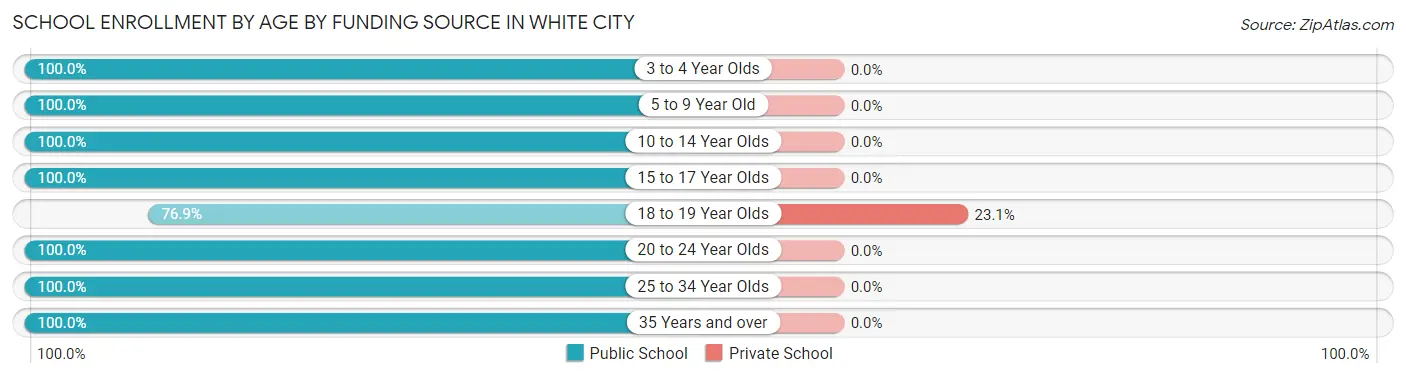
| Age Bracket | Public School | Private School |
| 3 to 4 Year Olds | 14 (100.0%) | 0 (0.0%) |
| 5 to 9 Year Old | 14 (100.0%) | 0 (0.0%) |
| 10 to 14 Year Olds | 13 (100.0%) | 0 (0.0%) |
| 15 to 17 Year Olds | 26 (100.0%) | 0 (0.0%) |
| 18 to 19 Year Olds | 10 (76.9%) | 3 (23.1%) |
| 20 to 24 Year Olds | 6 (100.0%) | 0 (0.0%) |
| 25 to 34 Year Olds | 7 (100.0%) | 0 (0.0%) |
| 35 Years and over | 3 (100.0%) | 0 (0.0%) |
| Total | 93 (96.9%) | 3 (3.1%) |
Educational Attainment by Field of Study in White City
Education (15 | 57.7%), business (6 | 23.1%), and bio, nature & agricultural (5 | 19.2%) are the most common fields of study among 26 individuals in White City who have obtained a bachelor's degree or higher.
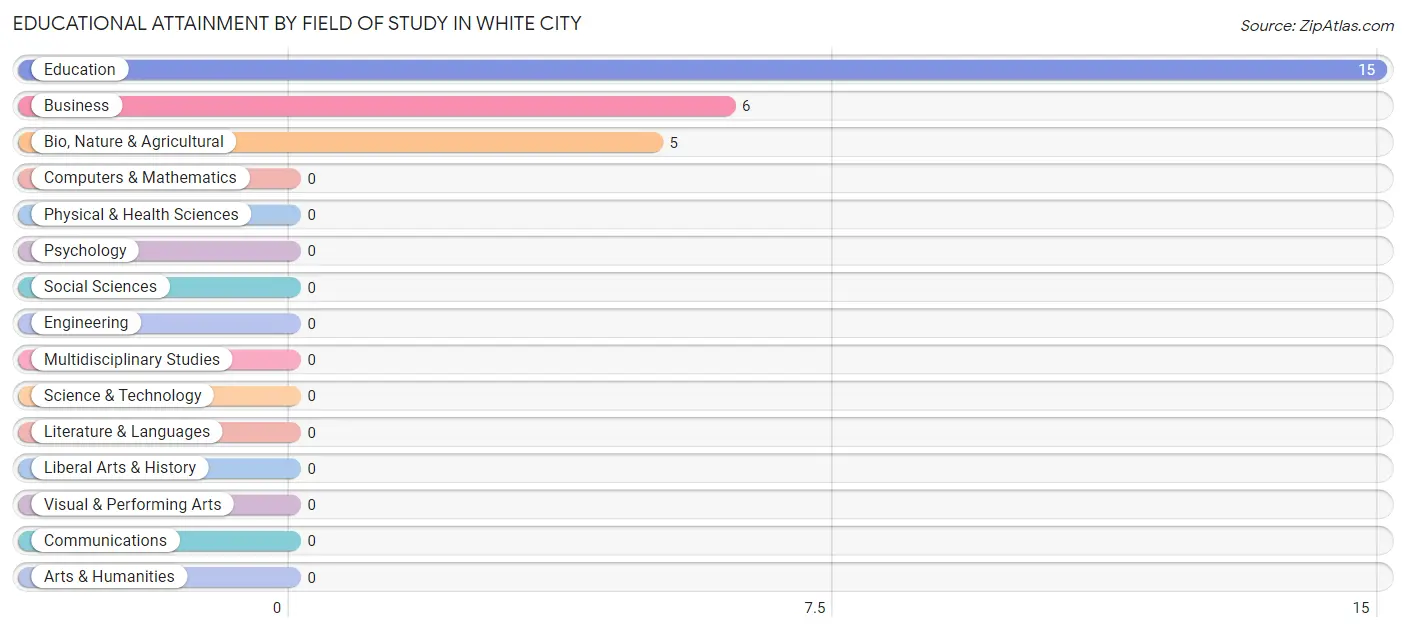
| Field of Study | # Graduates | % Graduates |
| Computers & Mathematics | 0 | 0.0% |
| Bio, Nature & Agricultural | 5 | 19.2% |
| Physical & Health Sciences | 0 | 0.0% |
| Psychology | 0 | 0.0% |
| Social Sciences | 0 | 0.0% |
| Engineering | 0 | 0.0% |
| Multidisciplinary Studies | 0 | 0.0% |
| Science & Technology | 0 | 0.0% |
| Business | 6 | 23.1% |
| Education | 15 | 57.7% |
| Literature & Languages | 0 | 0.0% |
| Liberal Arts & History | 0 | 0.0% |
| Visual & Performing Arts | 0 | 0.0% |
| Communications | 0 | 0.0% |
| Arts & Humanities | 0 | 0.0% |
| Total | 26 | 100.0% |
Transportation & Commute in White City
Vehicle Availability by Sex in White City
The most prevalent vehicle ownership categories in White City are males with 2 vehicles (30, accounting for 30.3%) and females with 2 vehicles (32, making up 38.5%).
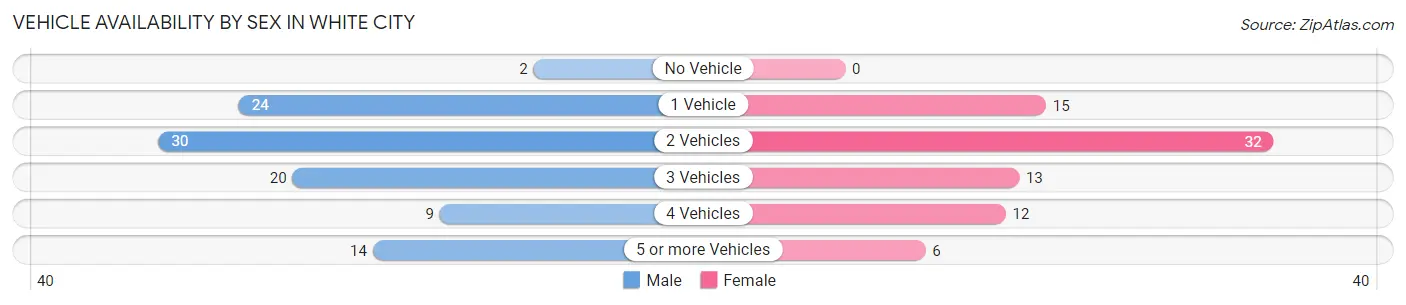
| Vehicles Available | Male | Female |
| No Vehicle | 2 (2.0%) | 0 (0.0%) |
| 1 Vehicle | 24 (24.2%) | 15 (19.2%) |
| 2 Vehicles | 30 (30.3%) | 32 (41.0%) |
| 3 Vehicles | 20 (20.2%) | 13 (16.7%) |
| 4 Vehicles | 9 (9.1%) | 12 (15.4%) |
| 5 or more Vehicles | 14 (14.1%) | 6 (7.7%) |
| Total | 99 (100.0%) | 78 (100.0%) |
Commute Time in White City
The most frequently occuring commute durations in White City are 30 to 34 minutes (60 commuters, 36.1%), less than 5 minutes (28 commuters, 16.9%), and 25 to 29 minutes (23 commuters, 13.9%).
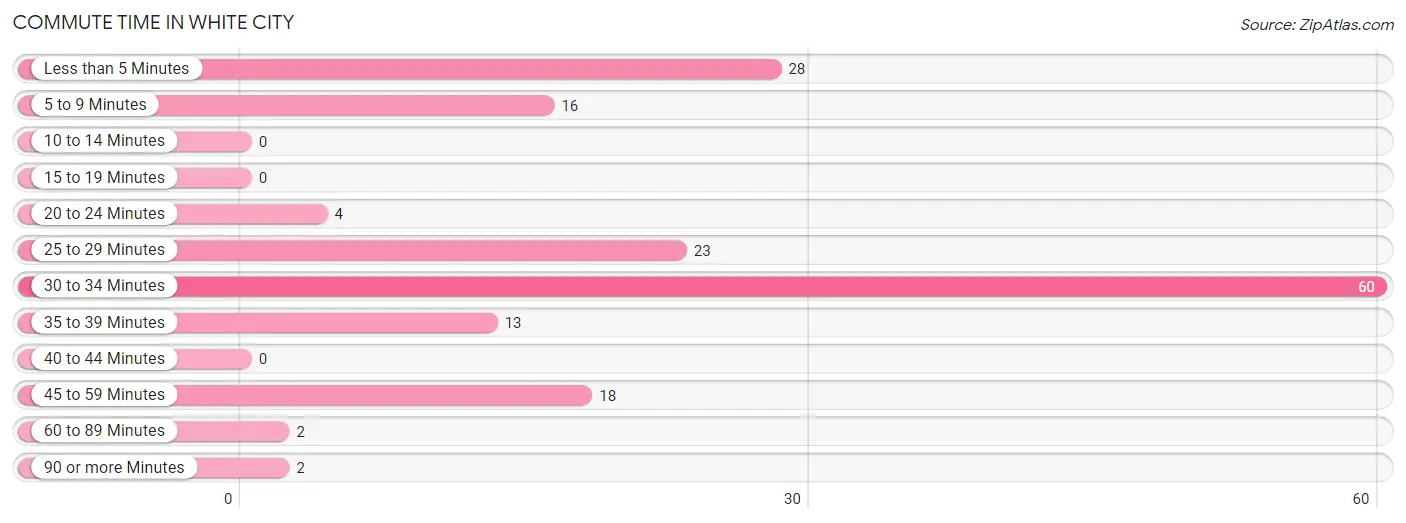
| Commute Time | # Commuters | % Commuters |
| Less than 5 Minutes | 28 | 16.9% |
| 5 to 9 Minutes | 16 | 9.6% |
| 10 to 14 Minutes | 0 | 0.0% |
| 15 to 19 Minutes | 0 | 0.0% |
| 20 to 24 Minutes | 4 | 2.4% |
| 25 to 29 Minutes | 23 | 13.9% |
| 30 to 34 Minutes | 60 | 36.1% |
| 35 to 39 Minutes | 13 | 7.8% |
| 40 to 44 Minutes | 0 | 0.0% |
| 45 to 59 Minutes | 18 | 10.8% |
| 60 to 89 Minutes | 2 | 1.2% |
| 90 or more Minutes | 2 | 1.2% |
Commute Time by Sex in White City
The most common commute times in White City are 30 to 34 minutes (40 commuters, 44.4%) for males and less than 5 minutes (21 commuters, 27.6%) for females.
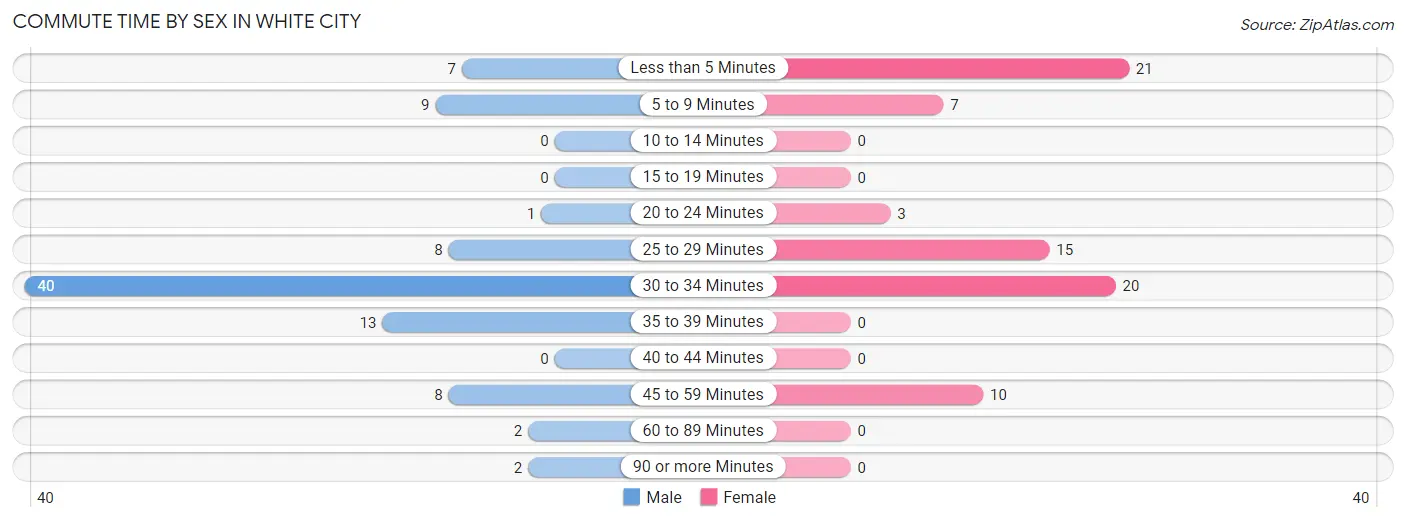
| Commute Time | Male | Female |
| Less than 5 Minutes | 7 (7.8%) | 21 (27.6%) |
| 5 to 9 Minutes | 9 (10.0%) | 7 (9.2%) |
| 10 to 14 Minutes | 0 (0.0%) | 0 (0.0%) |
| 15 to 19 Minutes | 0 (0.0%) | 0 (0.0%) |
| 20 to 24 Minutes | 1 (1.1%) | 3 (4.0%) |
| 25 to 29 Minutes | 8 (8.9%) | 15 (19.7%) |
| 30 to 34 Minutes | 40 (44.4%) | 20 (26.3%) |
| 35 to 39 Minutes | 13 (14.4%) | 0 (0.0%) |
| 40 to 44 Minutes | 0 (0.0%) | 0 (0.0%) |
| 45 to 59 Minutes | 8 (8.9%) | 10 (13.2%) |
| 60 to 89 Minutes | 2 (2.2%) | 0 (0.0%) |
| 90 or more Minutes | 2 (2.2%) | 0 (0.0%) |
Time of Departure to Work by Sex in White City
The most frequent times of departure to work in White City are 6:00 AM to 6:29 AM (23, 25.6%) for males and 7:00 AM to 7:29 AM (33, 43.4%) for females.
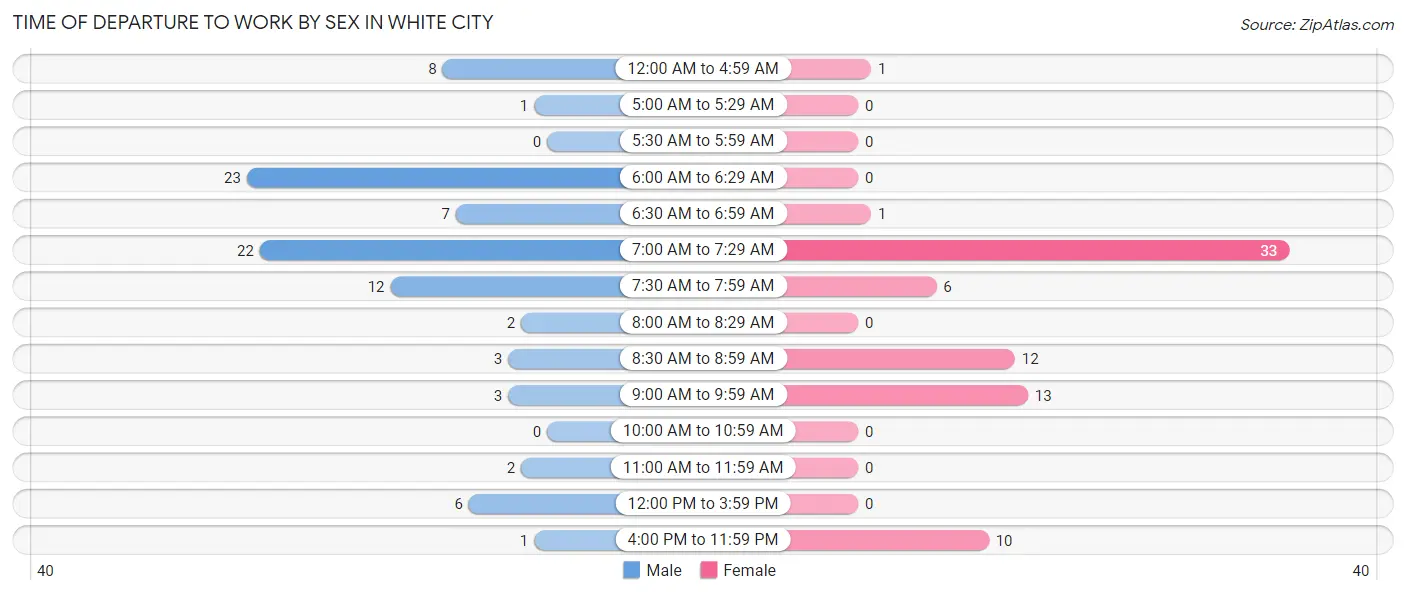
| Time of Departure | Male | Female |
| 12:00 AM to 4:59 AM | 8 (8.9%) | 1 (1.3%) |
| 5:00 AM to 5:29 AM | 1 (1.1%) | 0 (0.0%) |
| 5:30 AM to 5:59 AM | 0 (0.0%) | 0 (0.0%) |
| 6:00 AM to 6:29 AM | 23 (25.6%) | 0 (0.0%) |
| 6:30 AM to 6:59 AM | 7 (7.8%) | 1 (1.3%) |
| 7:00 AM to 7:29 AM | 22 (24.4%) | 33 (43.4%) |
| 7:30 AM to 7:59 AM | 12 (13.3%) | 6 (7.9%) |
| 8:00 AM to 8:29 AM | 2 (2.2%) | 0 (0.0%) |
| 8:30 AM to 8:59 AM | 3 (3.3%) | 12 (15.8%) |
| 9:00 AM to 9:59 AM | 3 (3.3%) | 13 (17.1%) |
| 10:00 AM to 10:59 AM | 0 (0.0%) | 0 (0.0%) |
| 11:00 AM to 11:59 AM | 2 (2.2%) | 0 (0.0%) |
| 12:00 PM to 3:59 PM | 6 (6.7%) | 0 (0.0%) |
| 4:00 PM to 11:59 PM | 1 (1.1%) | 10 (13.2%) |
| Total | 90 (100.0%) | 76 (100.0%) |
Housing Occupancy in White City
Occupancy by Ownership in White City
Of the total 230 dwellings in White City, owner-occupied units account for 172 (74.8%), while renter-occupied units make up 58 (25.2%).
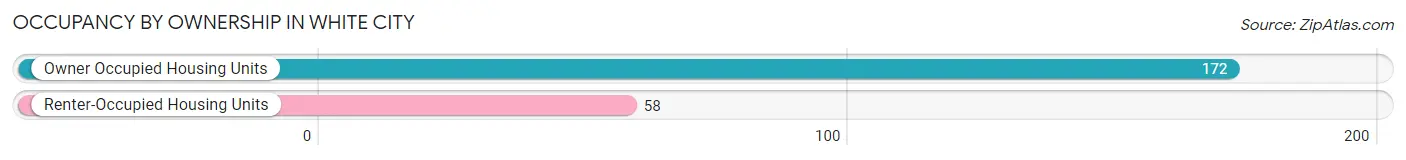
| Occupancy | # Housing Units | % Housing Units |
| Owner Occupied Housing Units | 172 | 74.8% |
| Renter-Occupied Housing Units | 58 | 25.2% |
| Total Occupied Housing Units | 230 | 100.0% |
Occupancy by Household Size in White City
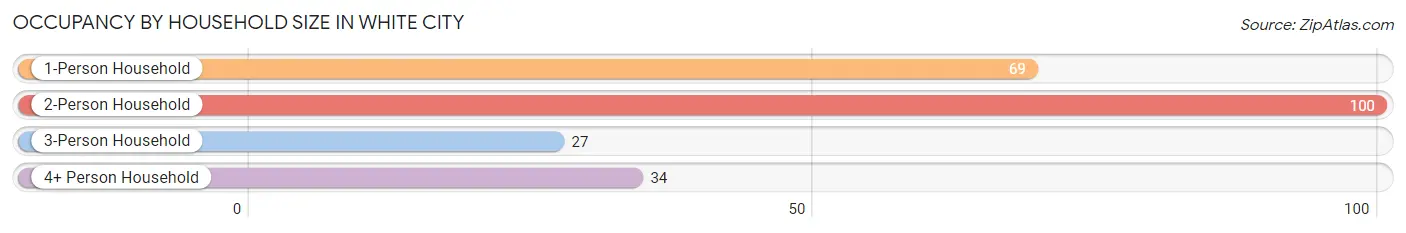
| Household Size | # Housing Units | % Housing Units |
| 1-Person Household | 69 | 30.0% |
| 2-Person Household | 100 | 43.5% |
| 3-Person Household | 27 | 11.7% |
| 4+ Person Household | 34 | 14.8% |
| Total Housing Units | 230 | 100.0% |
Occupancy by Ownership by Household Size in White City
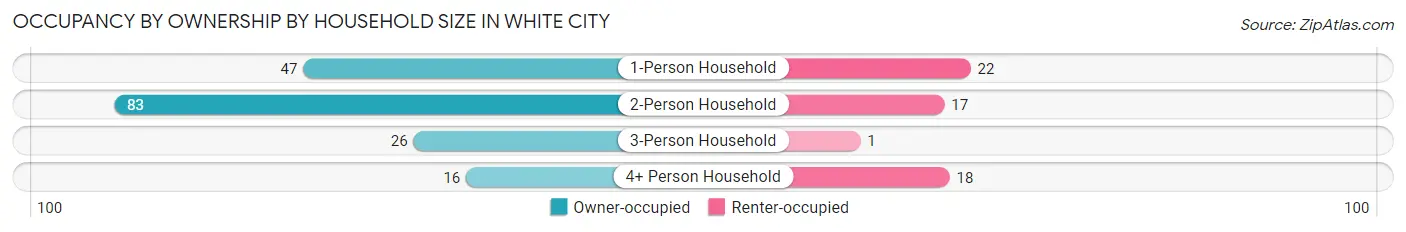
| Household Size | Owner-occupied | Renter-occupied |
| 1-Person Household | 47 (68.1%) | 22 (31.9%) |
| 2-Person Household | 83 (83.0%) | 17 (17.0%) |
| 3-Person Household | 26 (96.3%) | 1 (3.7%) |
| 4+ Person Household | 16 (47.1%) | 18 (52.9%) |
| Total Housing Units | 172 (74.8%) | 58 (25.2%) |
Occupancy by Educational Attainment in White City
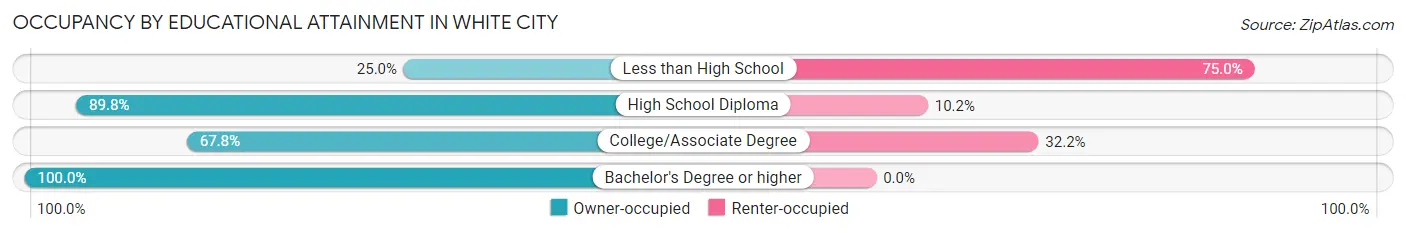
| Household Size | Owner-occupied | Renter-occupied |
| Less than High School | 4 (25.0%) | 12 (75.0%) |
| High School Diploma | 79 (89.8%) | 9 (10.2%) |
| College/Associate Degree | 78 (67.8%) | 37 (32.2%) |
| Bachelor's Degree or higher | 11 (100.0%) | 0 (0.0%) |
Occupancy by Age of Householder in White City
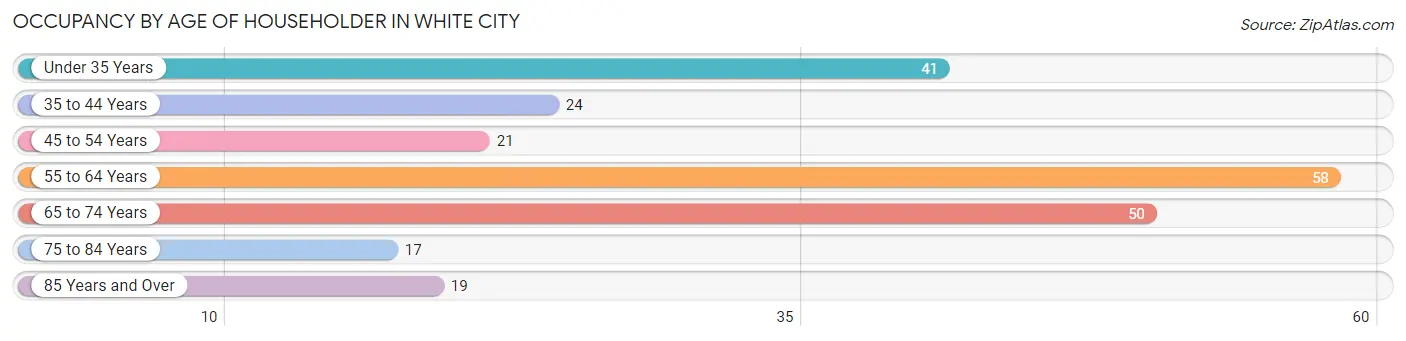
| Age Bracket | # Households | % Households |
| Under 35 Years | 41 | 17.8% |
| 35 to 44 Years | 24 | 10.4% |
| 45 to 54 Years | 21 | 9.1% |
| 55 to 64 Years | 58 | 25.2% |
| 65 to 74 Years | 50 | 21.7% |
| 75 to 84 Years | 17 | 7.4% |
| 85 Years and Over | 19 | 8.3% |
| Total | 230 | 100.0% |
Housing Finances in White City
Median Income by Occupancy in White City
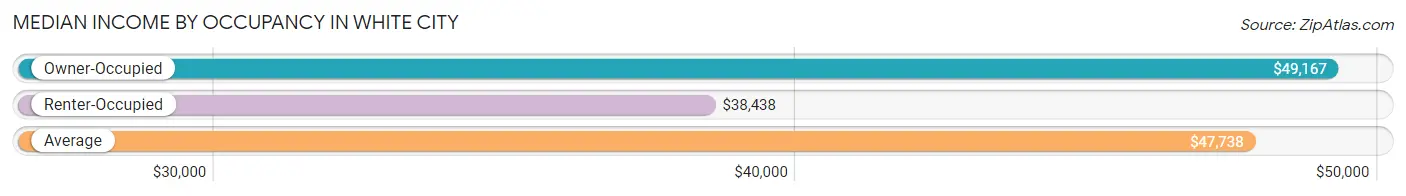
| Occupancy Type | # Households | Median Income |
| Owner-Occupied | 172 (74.8%) | $49,167 |
| Renter-Occupied | 58 (25.2%) | $38,438 |
| Average | 230 (100.0%) | $47,738 |
Occupancy by Householder Income Bracket in White City
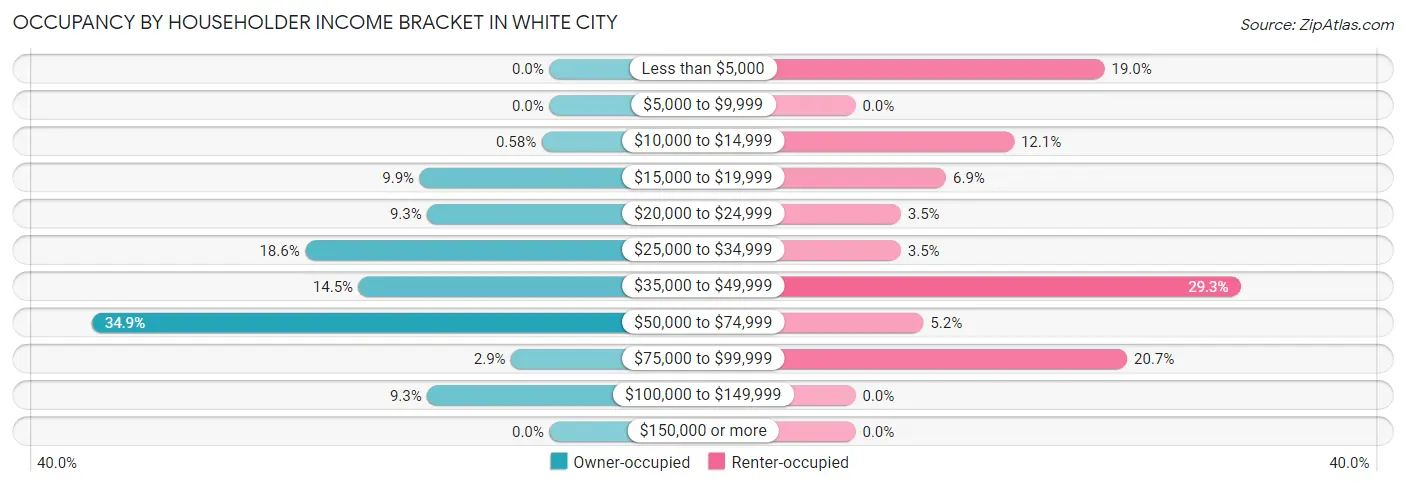
| Income Bracket | Owner-occupied | Renter-occupied |
| Less than $5,000 | 0 (0.0%) | 11 (19.0%) |
| $5,000 to $9,999 | 0 (0.0%) | 0 (0.0%) |
| $10,000 to $14,999 | 1 (0.6%) | 7 (12.1%) |
| $15,000 to $19,999 | 17 (9.9%) | 4 (6.9%) |
| $20,000 to $24,999 | 16 (9.3%) | 2 (3.5%) |
| $25,000 to $34,999 | 32 (18.6%) | 2 (3.5%) |
| $35,000 to $49,999 | 25 (14.5%) | 17 (29.3%) |
| $50,000 to $74,999 | 60 (34.9%) | 3 (5.2%) |
| $75,000 to $99,999 | 5 (2.9%) | 12 (20.7%) |
| $100,000 to $149,999 | 16 (9.3%) | 0 (0.0%) |
| $150,000 or more | 0 (0.0%) | 0 (0.0%) |
| Total | 172 (100.0%) | 58 (100.0%) |
Monthly Housing Cost Tiers in White City
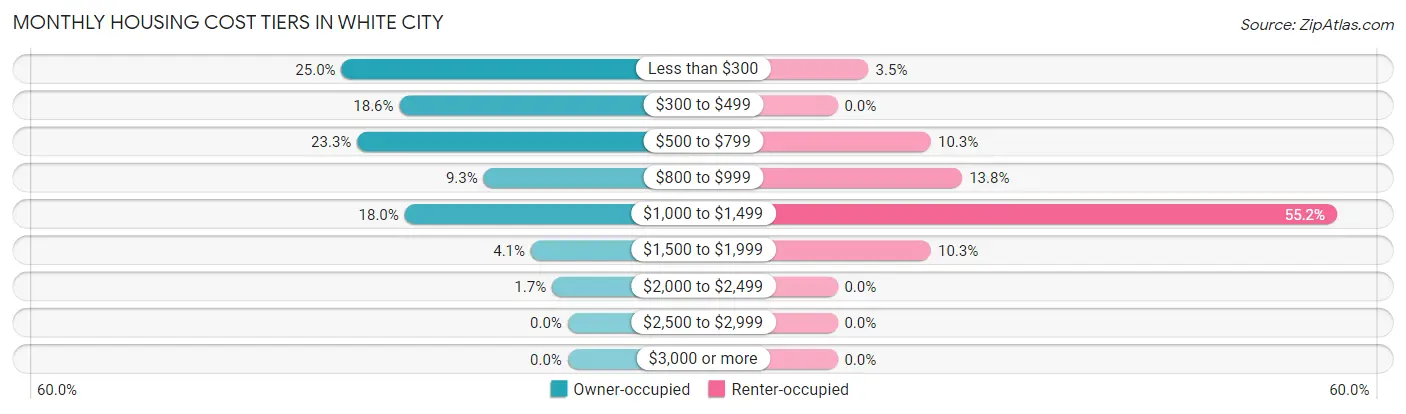
| Monthly Cost | Owner-occupied | Renter-occupied |
| Less than $300 | 43 (25.0%) | 2 (3.5%) |
| $300 to $499 | 32 (18.6%) | 0 (0.0%) |
| $500 to $799 | 40 (23.3%) | 6 (10.3%) |
| $800 to $999 | 16 (9.3%) | 8 (13.8%) |
| $1,000 to $1,499 | 31 (18.0%) | 32 (55.2%) |
| $1,500 to $1,999 | 7 (4.1%) | 6 (10.3%) |
| $2,000 to $2,499 | 3 (1.7%) | 0 (0.0%) |
| $2,500 to $2,999 | 0 (0.0%) | 0 (0.0%) |
| $3,000 or more | 0 (0.0%) | 0 (0.0%) |
| Total | 172 (100.0%) | 58 (100.0%) |
Physical Housing Characteristics in White City
Housing Structures in White City
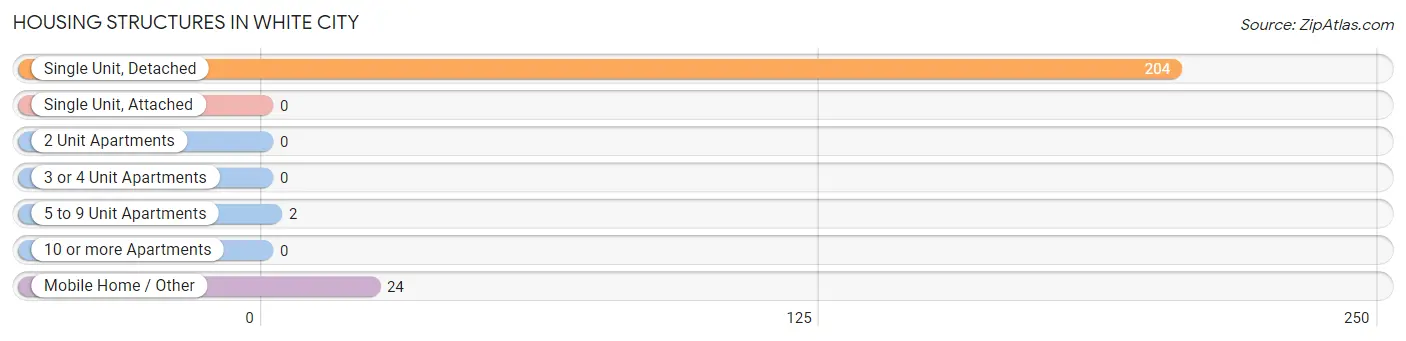
| Structure Type | # Housing Units | % Housing Units |
| Single Unit, Detached | 204 | 88.7% |
| Single Unit, Attached | 0 | 0.0% |
| 2 Unit Apartments | 0 | 0.0% |
| 3 or 4 Unit Apartments | 0 | 0.0% |
| 5 to 9 Unit Apartments | 2 | 0.9% |
| 10 or more Apartments | 0 | 0.0% |
| Mobile Home / Other | 24 | 10.4% |
| Total | 230 | 100.0% |
Housing Structures by Occupancy in White City
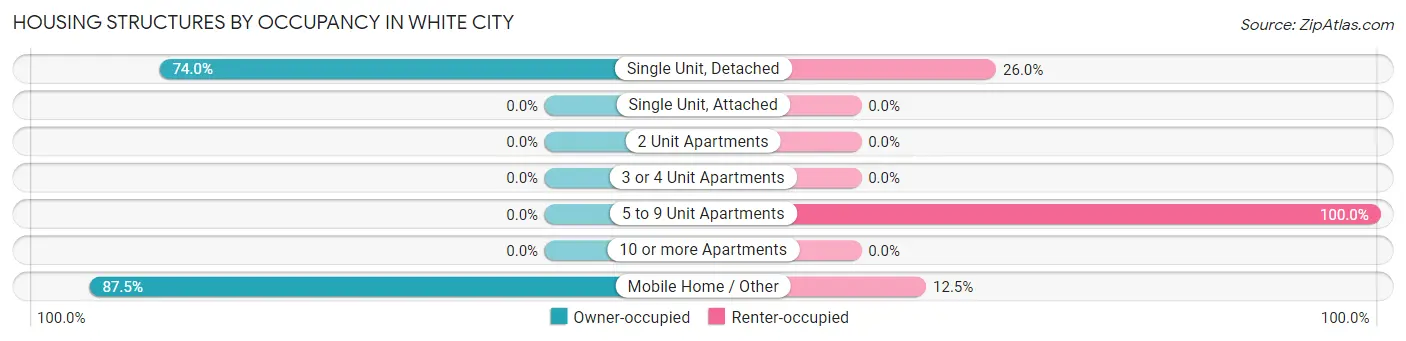
| Structure Type | Owner-occupied | Renter-occupied |
| Single Unit, Detached | 151 (74.0%) | 53 (26.0%) |
| Single Unit, Attached | 0 (0.0%) | 0 (0.0%) |
| 2 Unit Apartments | 0 (0.0%) | 0 (0.0%) |
| 3 or 4 Unit Apartments | 0 (0.0%) | 0 (0.0%) |
| 5 to 9 Unit Apartments | 0 (0.0%) | 2 (100.0%) |
| 10 or more Apartments | 0 (0.0%) | 0 (0.0%) |
| Mobile Home / Other | 21 (87.5%) | 3 (12.5%) |
| Total | 172 (74.8%) | 58 (25.2%) |
Housing Structures by Number of Rooms in White City
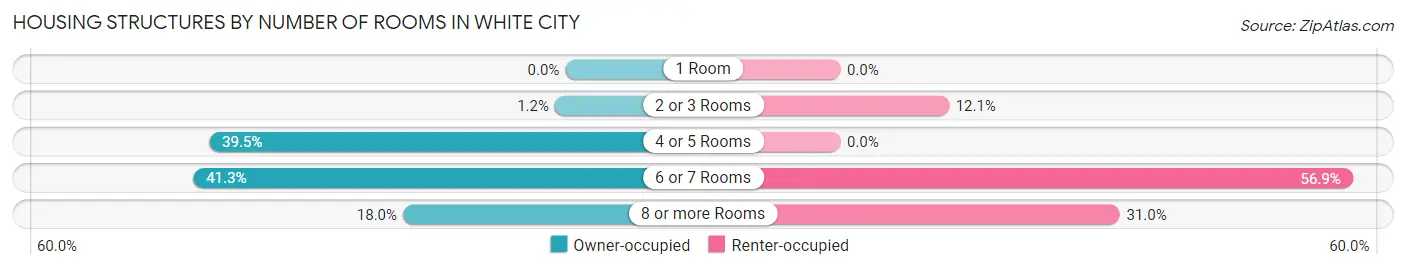
| Number of Rooms | Owner-occupied | Renter-occupied |
| 1 Room | 0 (0.0%) | 0 (0.0%) |
| 2 or 3 Rooms | 2 (1.2%) | 7 (12.1%) |
| 4 or 5 Rooms | 68 (39.5%) | 0 (0.0%) |
| 6 or 7 Rooms | 71 (41.3%) | 33 (56.9%) |
| 8 or more Rooms | 31 (18.0%) | 18 (31.0%) |
| Total | 172 (100.0%) | 58 (100.0%) |
Housing Structure by Heating Type in White City
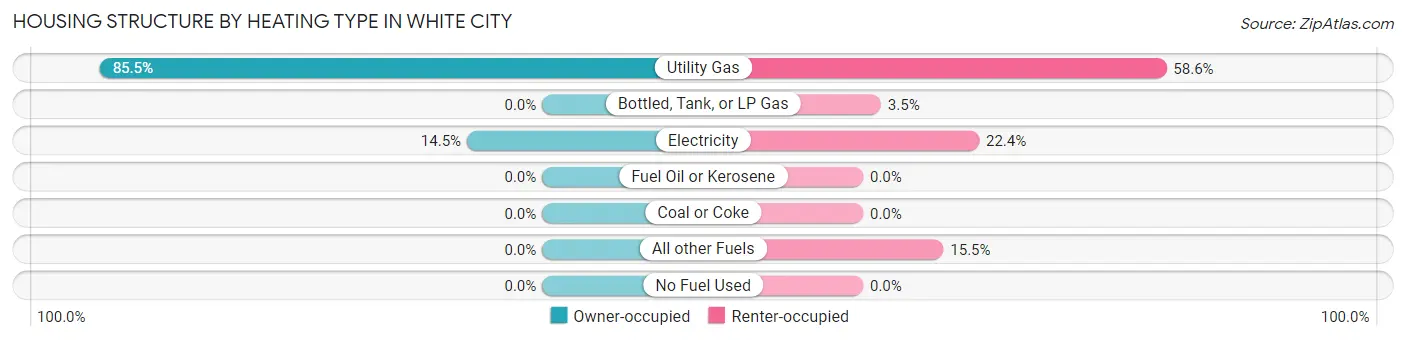
| Heating Type | Owner-occupied | Renter-occupied |
| Utility Gas | 147 (85.5%) | 34 (58.6%) |
| Bottled, Tank, or LP Gas | 0 (0.0%) | 2 (3.5%) |
| Electricity | 25 (14.5%) | 13 (22.4%) |
| Fuel Oil or Kerosene | 0 (0.0%) | 0 (0.0%) |
| Coal or Coke | 0 (0.0%) | 0 (0.0%) |
| All other Fuels | 0 (0.0%) | 9 (15.5%) |
| No Fuel Used | 0 (0.0%) | 0 (0.0%) |
| Total | 172 (100.0%) | 58 (100.0%) |
Household Vehicle Usage in White City
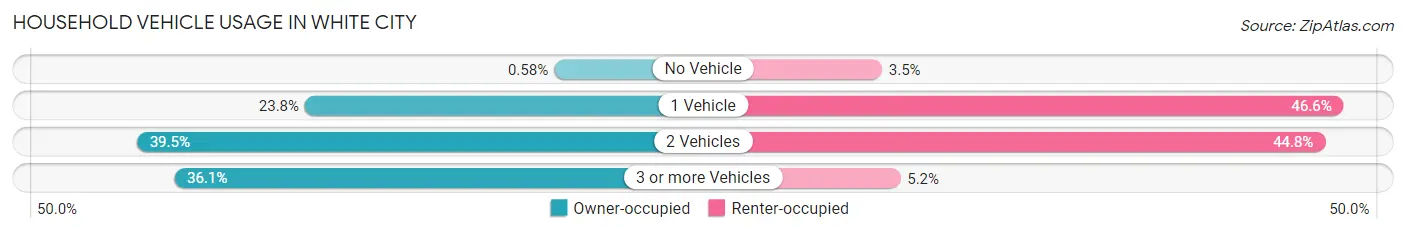
| Vehicles per Household | Owner-occupied | Renter-occupied |
| No Vehicle | 1 (0.6%) | 2 (3.5%) |
| 1 Vehicle | 41 (23.8%) | 27 (46.6%) |
| 2 Vehicles | 68 (39.5%) | 26 (44.8%) |
| 3 or more Vehicles | 62 (36.0%) | 3 (5.2%) |
| Total | 172 (100.0%) | 58 (100.0%) |
Real Estate & Mortgages in White City
Real Estate and Mortgage Overview in White City
| Characteristic | Without Mortgage | With Mortgage |
| Housing Units | 108 | 64 |
| Median Property Value | $54,500 | $108,300 |
| Median Household Income | $43,750 | $0 |
| Monthly Housing Costs | $432 | $0 |
| Real Estate Taxes | - | - |
Property Value by Mortgage Status in White City
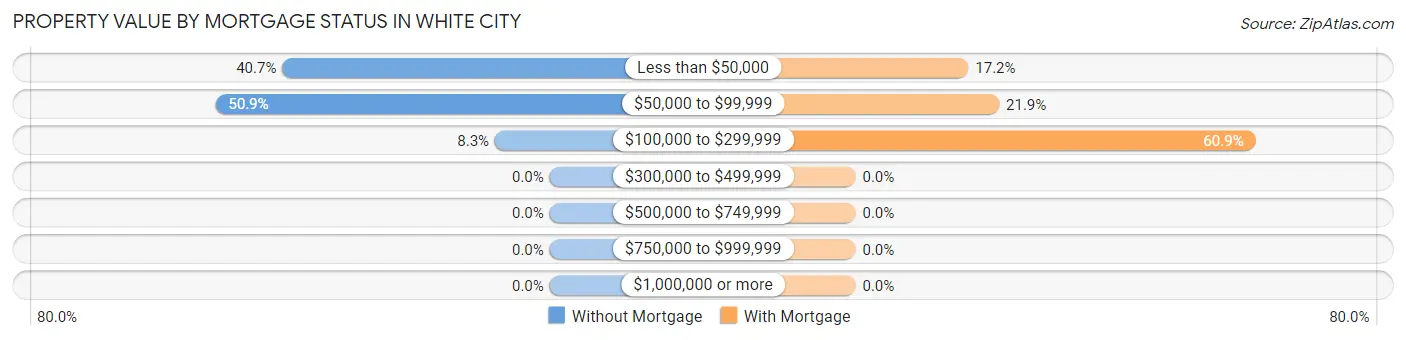
| Property Value | Without Mortgage | With Mortgage |
| Less than $50,000 | 44 (40.7%) | 11 (17.2%) |
| $50,000 to $99,999 | 55 (50.9%) | 14 (21.9%) |
| $100,000 to $299,999 | 9 (8.3%) | 39 (60.9%) |
| $300,000 to $499,999 | 0 (0.0%) | 0 (0.0%) |
| $500,000 to $749,999 | 0 (0.0%) | 0 (0.0%) |
| $750,000 to $999,999 | 0 (0.0%) | 0 (0.0%) |
| $1,000,000 or more | 0 (0.0%) | 0 (0.0%) |
| Total | 108 (100.0%) | 64 (100.0%) |
Household Income by Mortgage Status in White City
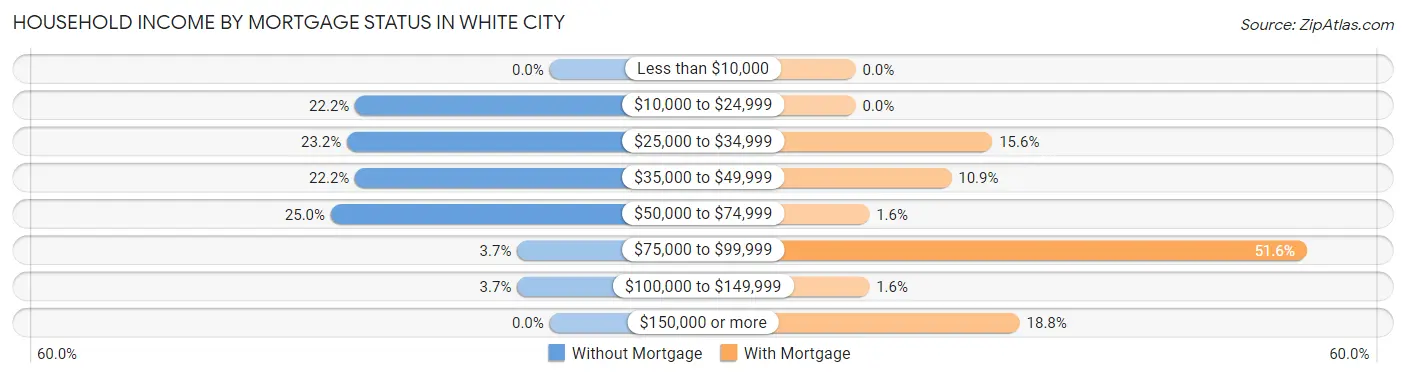
| Household Income | Without Mortgage | With Mortgage |
| Less than $10,000 | 0 (0.0%) | 0 (0.0%) |
| $10,000 to $24,999 | 24 (22.2%) | 0 (0.0%) |
| $25,000 to $34,999 | 25 (23.2%) | 10 (15.6%) |
| $35,000 to $49,999 | 24 (22.2%) | 7 (10.9%) |
| $50,000 to $74,999 | 27 (25.0%) | 1 (1.6%) |
| $75,000 to $99,999 | 4 (3.7%) | 33 (51.6%) |
| $100,000 to $149,999 | 4 (3.7%) | 1 (1.6%) |
| $150,000 or more | 0 (0.0%) | 12 (18.8%) |
| Total | 108 (100.0%) | 64 (100.0%) |
Property Value to Household Income Ratio in White City
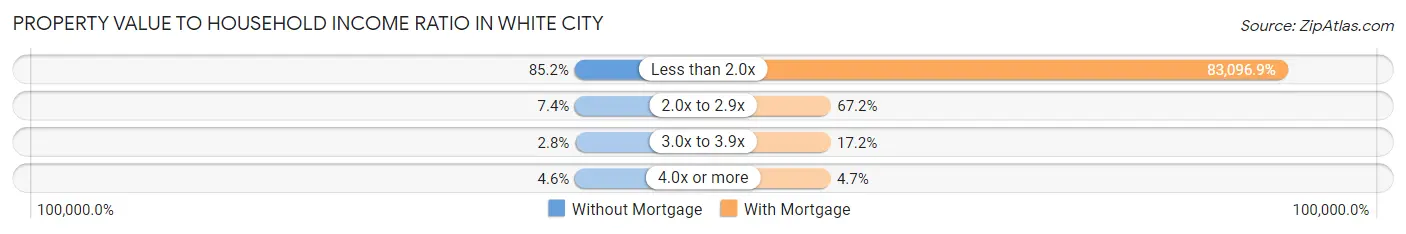
| Value-to-Income Ratio | Without Mortgage | With Mortgage |
| Less than 2.0x | 92 (85.2%) | 53,182 (83,096.9%) |
| 2.0x to 2.9x | 8 (7.4%) | 43 (67.2%) |
| 3.0x to 3.9x | 3 (2.8%) | 11 (17.2%) |
| 4.0x or more | 5 (4.6%) | 3 (4.7%) |
| Total | 108 (100.0%) | 64 (100.0%) |
Real Estate Taxes by Mortgage Status in White City
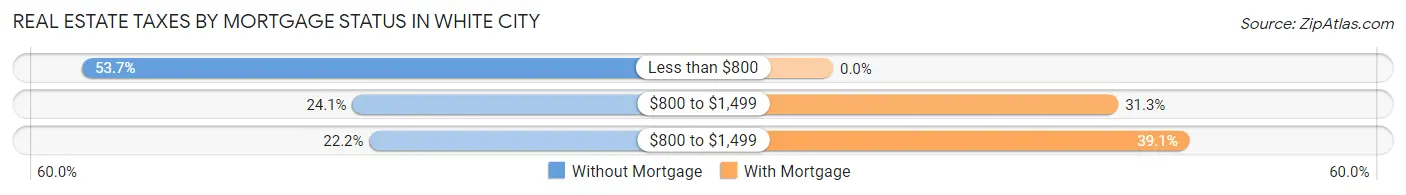
| Property Taxes | Without Mortgage | With Mortgage |
| Less than $800 | 58 (53.7%) | 0 (0.0%) |
| $800 to $1,499 | 26 (24.1%) | 20 (31.2%) |
| $800 to $1,499 | 24 (22.2%) | 25 (39.1%) |
| Total | 108 (100.0%) | 64 (100.0%) |
Health & Disability in White City
Health Insurance Coverage by Age in White City
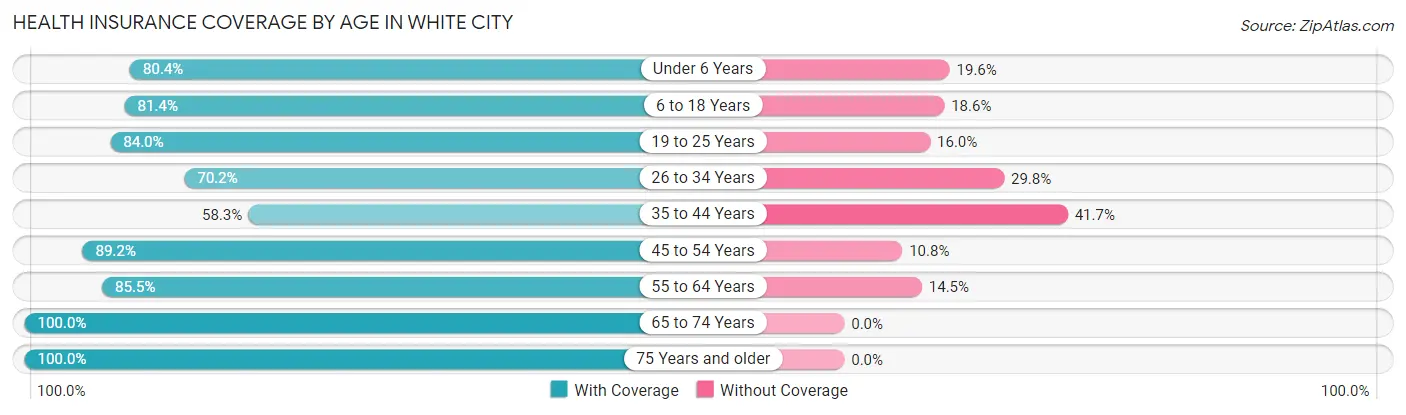
| Age Bracket | With Coverage | Without Coverage |
| Under 6 Years | 45 (80.4%) | 11 (19.6%) |
| 6 to 18 Years | 48 (81.4%) | 11 (18.6%) |
| 19 to 25 Years | 21 (84.0%) | 4 (16.0%) |
| 26 to 34 Years | 33 (70.2%) | 14 (29.8%) |
| 35 to 44 Years | 35 (58.3%) | 25 (41.7%) |
| 45 to 54 Years | 33 (89.2%) | 4 (10.8%) |
| 55 to 64 Years | 71 (85.5%) | 12 (14.5%) |
| 65 to 74 Years | 86 (100.0%) | 0 (0.0%) |
| 75 Years and older | 62 (100.0%) | 0 (0.0%) |
| Total | 434 (84.3%) | 81 (15.7%) |
Health Insurance Coverage by Citizenship Status in White City
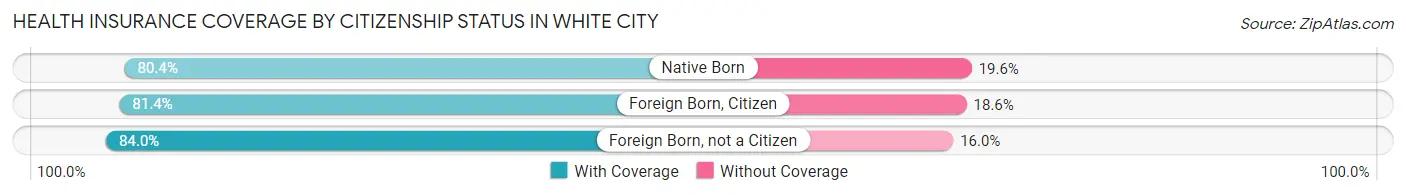
| Citizenship Status | With Coverage | Without Coverage |
| Native Born | 45 (80.4%) | 11 (19.6%) |
| Foreign Born, Citizen | 48 (81.4%) | 11 (18.6%) |
| Foreign Born, not a Citizen | 21 (84.0%) | 4 (16.0%) |
Health Insurance Coverage by Household Income in White City
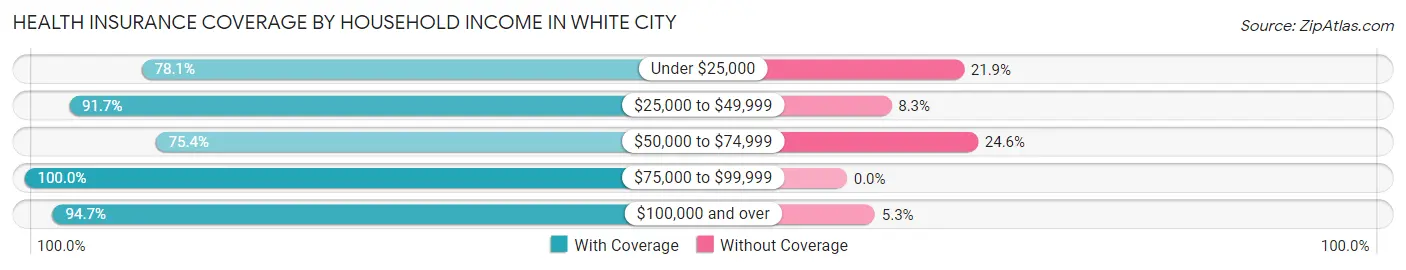
| Household Income | With Coverage | Without Coverage |
| Under $25,000 | 89 (78.1%) | 25 (21.9%) |
| $25,000 to $49,999 | 121 (91.7%) | 11 (8.3%) |
| $50,000 to $74,999 | 129 (75.4%) | 42 (24.6%) |
| $75,000 to $99,999 | 41 (100.0%) | 0 (0.0%) |
| $100,000 and over | 54 (94.7%) | 3 (5.3%) |
Public vs Private Health Insurance Coverage by Age in White City
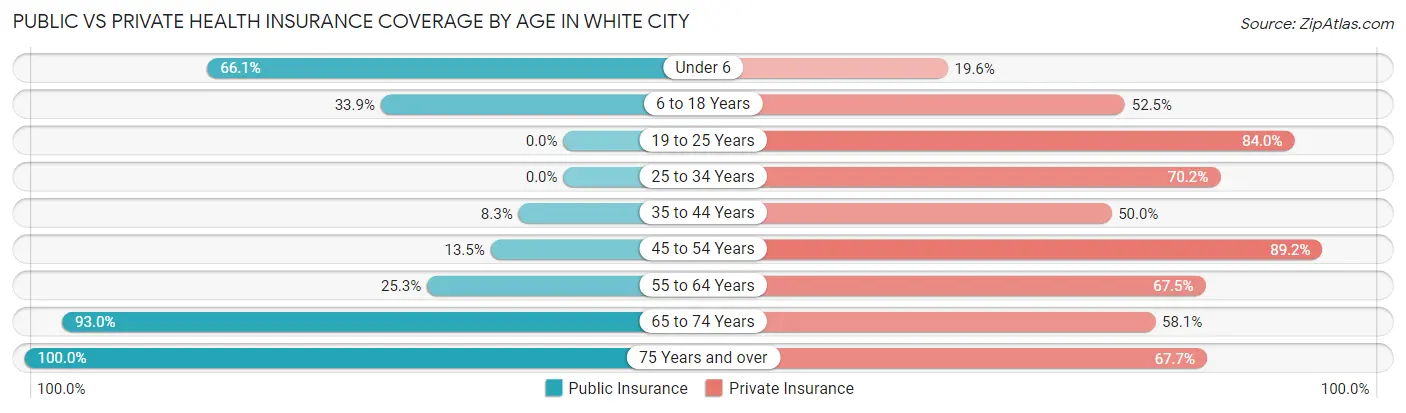
| Age Bracket | Public Insurance | Private Insurance |
| Under 6 | 37 (66.1%) | 11 (19.6%) |
| 6 to 18 Years | 20 (33.9%) | 31 (52.5%) |
| 19 to 25 Years | 0 (0.0%) | 21 (84.0%) |
| 25 to 34 Years | 0 (0.0%) | 33 (70.2%) |
| 35 to 44 Years | 5 (8.3%) | 30 (50.0%) |
| 45 to 54 Years | 5 (13.5%) | 33 (89.2%) |
| 55 to 64 Years | 21 (25.3%) | 56 (67.5%) |
| 65 to 74 Years | 80 (93.0%) | 50 (58.1%) |
| 75 Years and over | 62 (100.0%) | 42 (67.7%) |
| Total | 230 (44.7%) | 307 (59.6%) |
Disability Status by Sex by Age in White City
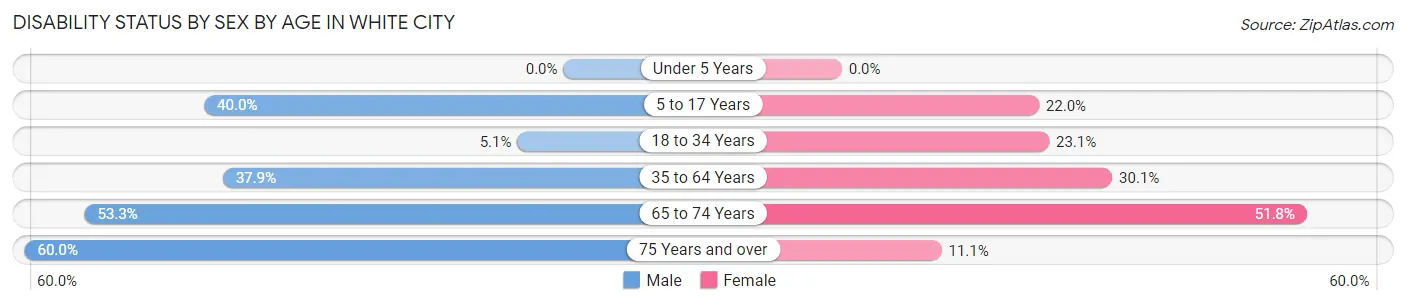
| Age Bracket | Male | Female |
| Under 5 Years | 0 (0.0%) | 0 (0.0%) |
| 5 to 17 Years | 6 (40.0%) | 9 (22.0%) |
| 18 to 34 Years | 2 (5.1%) | 9 (23.1%) |
| 35 to 64 Years | 33 (37.9%) | 28 (30.1%) |
| 65 to 74 Years | 16 (53.3%) | 29 (51.8%) |
| 75 Years and over | 21 (60.0%) | 3 (11.1%) |
Disability Class by Sex by Age in White City
Disability Class: Hearing Difficulty
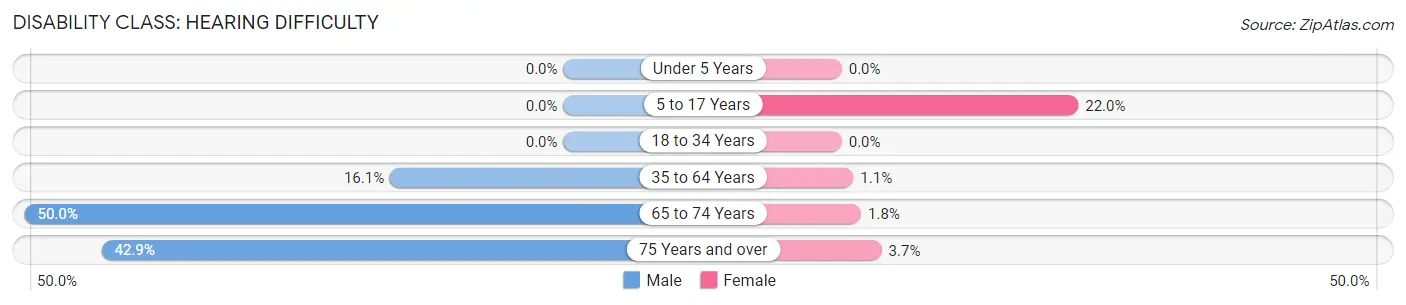
| Age Bracket | Male | Female |
| Under 5 Years | 0 (0.0%) | 0 (0.0%) |
| 5 to 17 Years | 0 (0.0%) | 9 (22.0%) |
| 18 to 34 Years | 0 (0.0%) | 0 (0.0%) |
| 35 to 64 Years | 14 (16.1%) | 1 (1.1%) |
| 65 to 74 Years | 15 (50.0%) | 1 (1.8%) |
| 75 Years and over | 15 (42.9%) | 1 (3.7%) |
Disability Class: Vision Difficulty
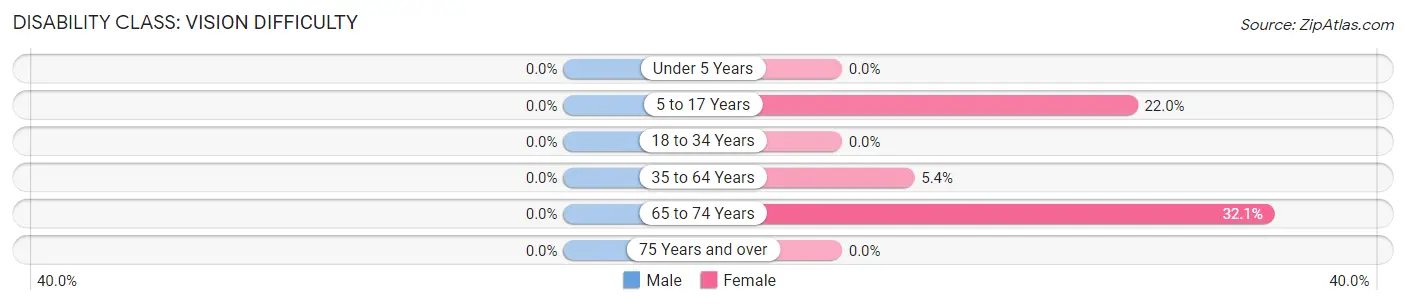
| Age Bracket | Male | Female |
| Under 5 Years | 0 (0.0%) | 0 (0.0%) |
| 5 to 17 Years | 0 (0.0%) | 9 (22.0%) |
| 18 to 34 Years | 0 (0.0%) | 0 (0.0%) |
| 35 to 64 Years | 0 (0.0%) | 5 (5.4%) |
| 65 to 74 Years | 0 (0.0%) | 18 (32.1%) |
| 75 Years and over | 0 (0.0%) | 0 (0.0%) |
Disability Class: Cognitive Difficulty
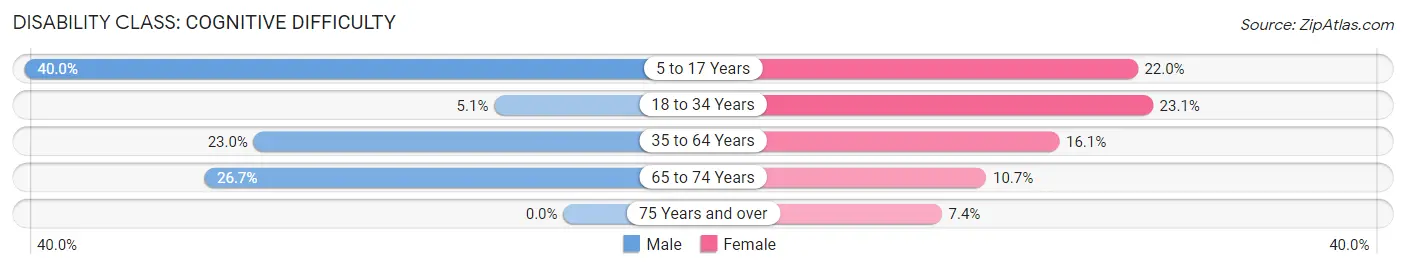
| Age Bracket | Male | Female |
| 5 to 17 Years | 6 (40.0%) | 9 (22.0%) |
| 18 to 34 Years | 2 (5.1%) | 9 (23.1%) |
| 35 to 64 Years | 20 (23.0%) | 15 (16.1%) |
| 65 to 74 Years | 8 (26.7%) | 6 (10.7%) |
| 75 Years and over | 0 (0.0%) | 2 (7.4%) |
Disability Class: Ambulatory Difficulty
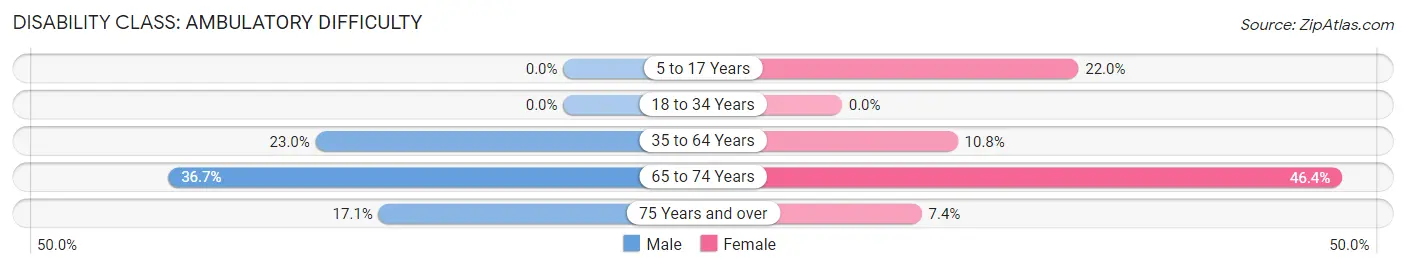
| Age Bracket | Male | Female |
| 5 to 17 Years | 0 (0.0%) | 9 (22.0%) |
| 18 to 34 Years | 0 (0.0%) | 0 (0.0%) |
| 35 to 64 Years | 20 (23.0%) | 10 (10.7%) |
| 65 to 74 Years | 11 (36.7%) | 26 (46.4%) |
| 75 Years and over | 6 (17.1%) | 2 (7.4%) |
Disability Class: Self-Care Difficulty
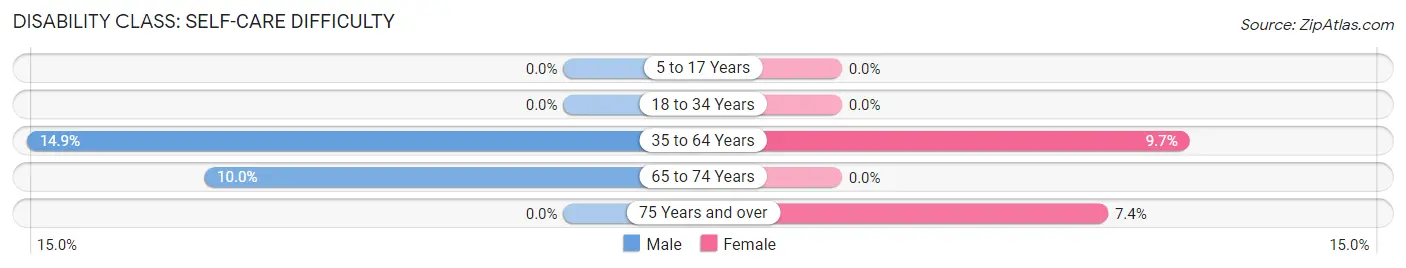
| Age Bracket | Male | Female |
| 5 to 17 Years | 0 (0.0%) | 0 (0.0%) |
| 18 to 34 Years | 0 (0.0%) | 0 (0.0%) |
| 35 to 64 Years | 13 (14.9%) | 9 (9.7%) |
| 65 to 74 Years | 3 (10.0%) | 0 (0.0%) |
| 75 Years and over | 0 (0.0%) | 2 (7.4%) |
Technology Access in White City
Computing Device Access in White City
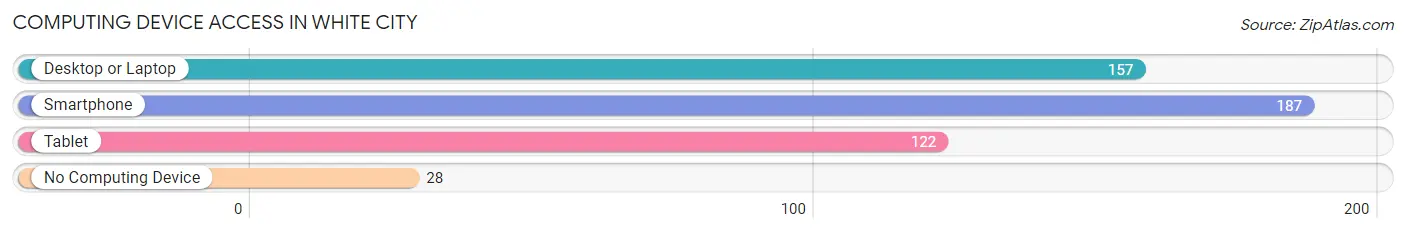
| Device Type | # Households | % Households |
| Desktop or Laptop | 157 | 68.3% |
| Smartphone | 187 | 81.3% |
| Tablet | 122 | 53.0% |
| No Computing Device | 28 | 12.2% |
| Total | 230 | 100.0% |
Internet Access in White City
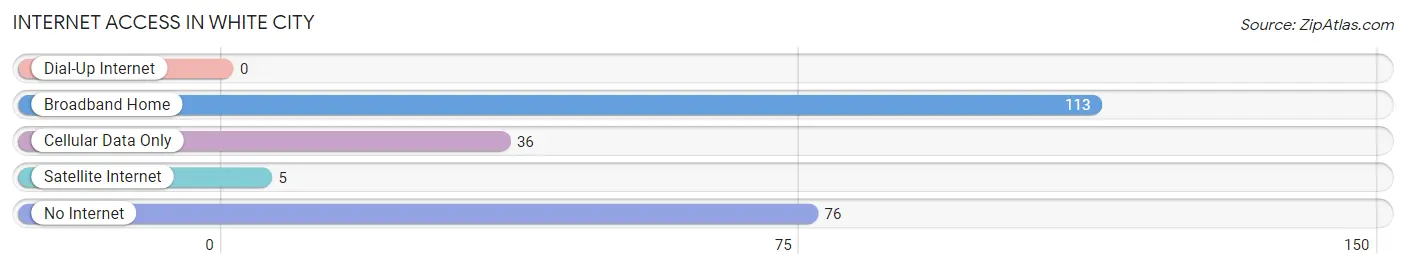
| Internet Type | # Households | % Households |
| Dial-Up Internet | 0 | 0.0% |
| Broadband Home | 113 | 49.1% |
| Cellular Data Only | 36 | 15.7% |
| Satellite Internet | 5 | 2.2% |
| No Internet | 76 | 33.0% |
| Total | 230 | 100.0% |
White City Summary
White City is a small town located in Morris County, Kansas, United States. The population was estimated to be around 545 in the year 2000. The town is located in the Flint Hills region of Kansas, and is known for its rolling hills and prairie grasslands.
Geography
White City is located in the Flint Hills region of Kansas, and is situated in the northern part of Morris County. The town is located at an elevation of 1,068 feet above sea level. The town is located on the banks of the Cottonwood River, and is surrounded by rolling hills and prairie grasslands. The town is located approximately 25 miles south of the city of Manhattan, and is approximately 50 miles north of the city of Topeka.
The climate in White City is characterized by hot, humid summers and cold, dry winters. The average annual temperature is around 54 degrees Fahrenheit, with an average high of around 79 degrees Fahrenheit in the summer months and an average low of around 28 degrees Fahrenheit in the winter months. The average annual precipitation is around 33 inches, with the majority of the precipitation occurring in the spring and summer months.
Demographics
As of the 2000 census, there were 545 people, 213 households, and 149 families residing in the town. The population density was 545 people per square mile (210/km2). There were 233 housing units at an average density of 233 per square mile (90/km2). The racial makeup of the town was 97.45% White, 0.37% African American, 0.37% Native American, 0.18% Asian, 0.37% from other races, and 1.27% from two or more races. Hispanic or Latino of any race were 1.09% of the population.
There were 213 households, out of which 33.2% had children under the age of 18 living with them, 57.2% were married couples living together, 8.0% had a female householder with no husband present, and 30.5% were non-families. 27.2% of all households were made up of individuals, and 14.0% had someone living alone who was 65 years of age or older. The average household size was 2.56 and the average family size was 3.13.
In the town, the population was spread out, with 28.2% under the age of 18, 6.7% from 18 to 24, 28.2% from 25 to 44, 22.2% from 45 to 64, and 14.7% who were 65 years of age or older. The median age was 37 years. For every 100 females, there were 97.3 males. For every 100 females age 18 and over, there were 94.3 males.
The median income for a household in the town was $35,000, and the median income for a family was $41,250. Males had a median income of $30,000 versus $20,000 for females. The per capita income for the town was $15,945. About 8.3% of families and 10.2% of the population were below the poverty line, including 11.3% of those under age 18 and 8.3% of those age 65 or over.
Economy
White City is a small, rural town, and the economy is largely based on agriculture. The town is home to several farms, and the main crops grown in the area are wheat, corn, and soybeans. The town is also home to several small businesses, including a grocery store, a hardware store, and a few restaurants. The town is also home to a few manufacturing companies, including a furniture factory and a plastics factory.
The town is served by the White City-Morris County Airport, which is located just outside of town. The airport is used primarily for general aviation, and is home to several small aircraft. The town is also served by the White City-Morris County Public Library, which is located in the center of town.
Conclusion
White City is a small town located in Morris County, Kansas. The town is situated in the Flint Hills region of Kansas, and is known for its rolling hills and prairie grasslands. The population of the town was estimated to be around 545 in the year 2000. The town is largely agricultural, and the main crops grown in the area are wheat, corn, and soybeans. The town is also home to several small businesses, and is served by the White City-Morris County Airport and the White City-Morris County Public Library.
Common Questions
What is the Total Population of White City?
Total Population of White City is 518.
What is the Total Male Population of White City?
Total Male Population of White City is 241.
What is the Total Female Population of White City?
Total Female Population of White City is 277.
What is the Ratio of Males per 100 Females in White City?
There are 87.00 Males per 100 Females in White City.
What is the Ratio of Females per 100 Males in White City?
There are 114.94 Females per 100 Males in White City.
What is the Median Population Age in White City?
Median Population Age in White City is 48.4 Years.
What is the Average Family Size in White City
Average Family Size in White City is 2.8 People.
What is the Average Household Size in White City
Average Household Size in White City is 2.2 People.
What is Per Capita Income in White City?
Per Capita income in White City is $20,771.
What is the Median Family Income in White City?
Median Family Income in White City is $53,676.
What is the Median Household income in White City?
Median Household Income in White City is $47,738.
What is Inequality or Gini Index in White City?
Inequality or Gini Index in White City is 0.34.
How Large is the Labor Force in White City?
There are 189 People in the Labor Forcein in White City.
What is the Percentage of People in the Labor Force in White City?
43.4% of People are in the Labor Force in White City.