Wyandotte County, KS
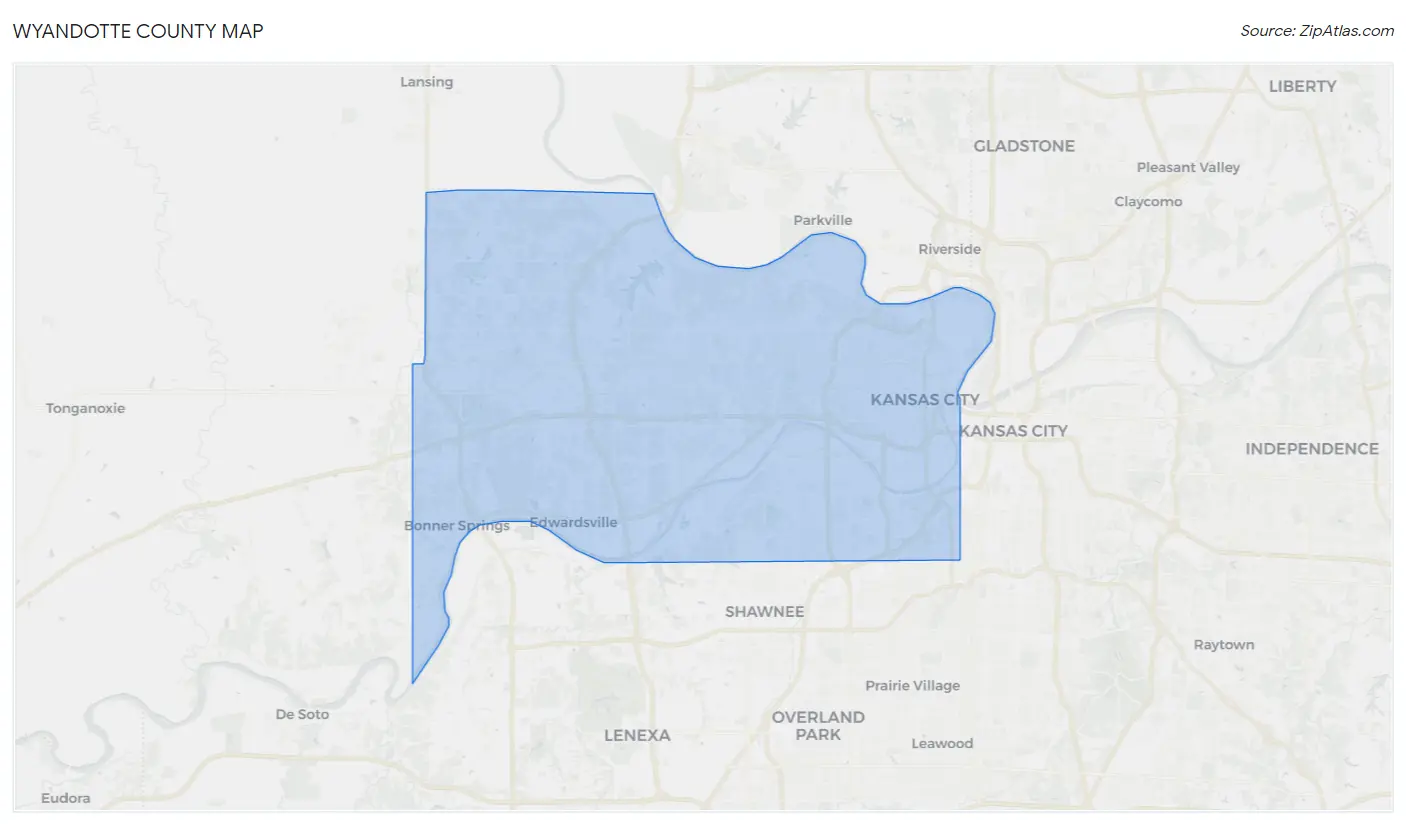
Wyandotte County Map
Wyandotte County Overview
167,989
TOTAL POPULATION
84,439
MALE POPULATION
83,550
FEMALE POPULATION
101.06
MALES / 100 FEMALES
98.95
FEMALES / 100 MALES
34.3
MEDIAN AGE
3.4
AVG FAMILY SIZE
2.7
AVG HOUSEHOLD SIZE
$27,534
PER CAPITA INCOME
$69,819
AVG FAMILY INCOME
$57,771
AVG HOUSEHOLD INCOME
21.3%
WAGE / INCOME GAP [ % ]
78.7¢/ $1
WAGE / INCOME GAP [ $ ]
$10,629
FAMILY INCOME DEFICIT
0.43
INEQUALITY / GINI INDEX
83,577
LABOR FORCE [ PEOPLE ]
65.8%
PERCENT IN LABOR FORCE
5.7%
UNEMPLOYMENT RATE
Wyandotte County Area Codes
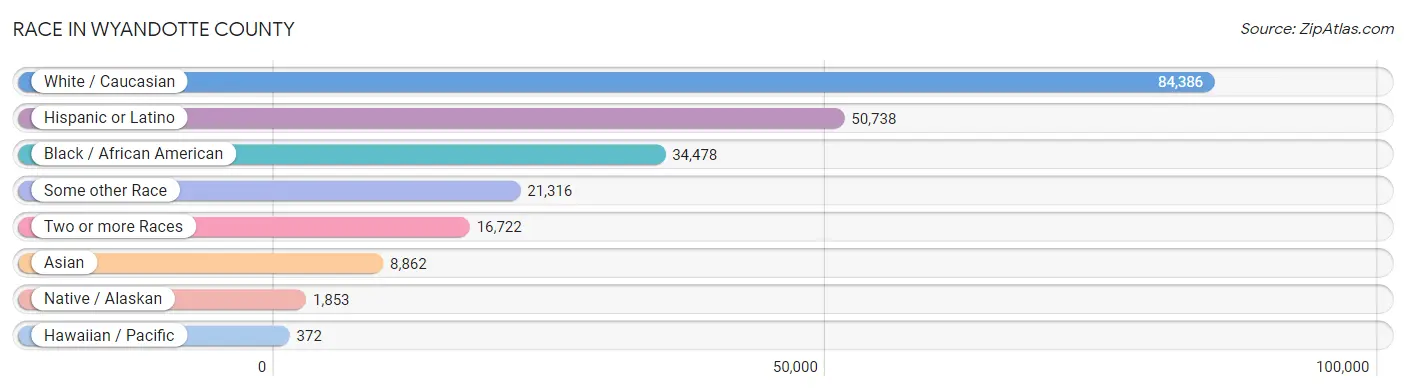
Race in Wyandotte County
The most populous races in Wyandotte County are White / Caucasian (84,386 | 50.2%), Hispanic or Latino (50,738 | 30.2%), and Black / African American (34,478 | 20.5%).
| Race | # Population | % Population |
| Asian | 8,862 | 5.3% |
| Black / African American | 34,478 | 20.5% |
| Hawaiian / Pacific | 372 | 0.2% |
| Hispanic or Latino | 50,738 | 30.2% |
| Native / Alaskan | 1,853 | 1.1% |
| White / Caucasian | 84,386 | 50.2% |
| Two or more Races | 16,722 | 10.0% |
| Some other Race | 21,316 | 12.7% |
| Total | 167,989 | 100.0% |
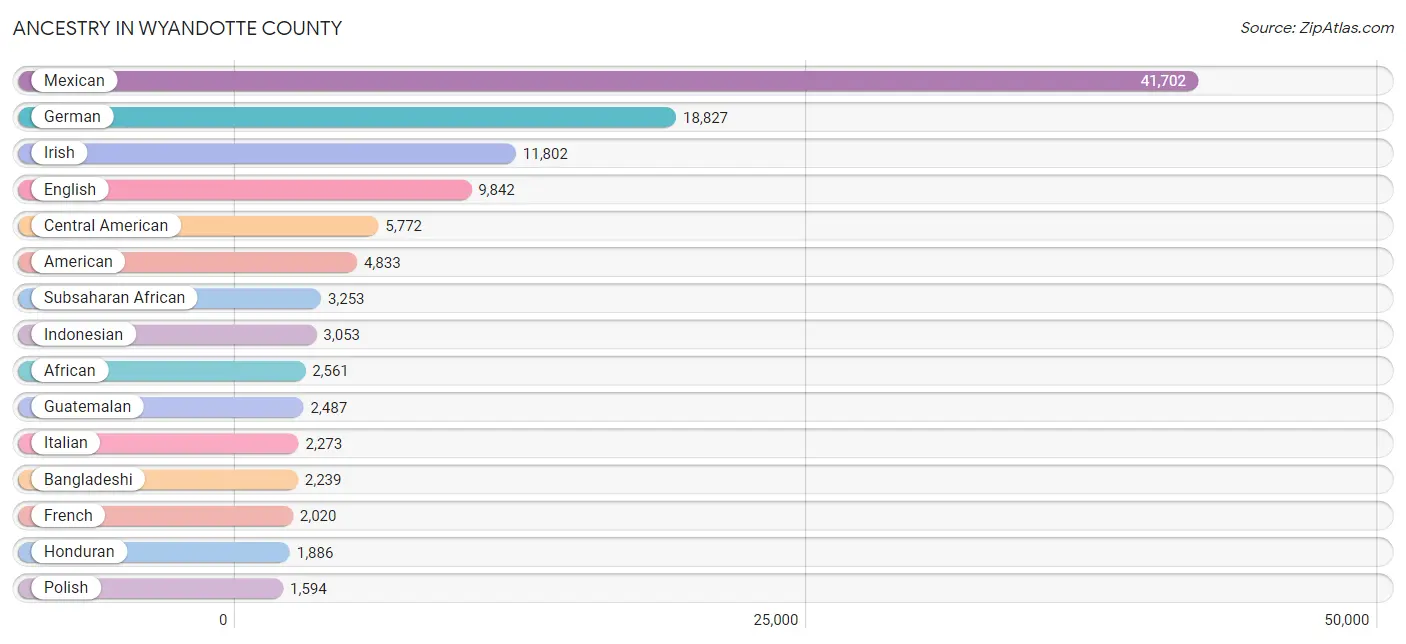
Ancestry in Wyandotte County
The most populous ancestries reported in Wyandotte County are Mexican (41,702 | 24.8%), German (18,827 | 11.2%), Irish (11,802 | 7.0%), English (9,842 | 5.9%), and Central American (5,772 | 3.4%), together accounting for 52.4% of all Wyandotte County residents.
| Ancestry | # Population | % Population |
| Afghan | 290 | 0.2% |
| African | 2,561 | 1.5% |
| Alaskan Athabascan | 27 | 0.0% |
| American | 4,833 | 2.9% |
| Apache | 91 | 0.1% |
| Arab | 142 | 0.1% |
| Arapaho | 9 | 0.0% |
| Argentinean | 4 | 0.0% |
| Armenian | 92 | 0.1% |
| Australian | 60 | 0.0% |
| Austrian | 136 | 0.1% |
| Bangladeshi | 2,239 | 1.3% |
| Barbadian | 11 | 0.0% |
| Basque | 45 | 0.0% |
| Belgian | 145 | 0.1% |
| Bhutanese | 229 | 0.1% |
| Blackfeet | 303 | 0.2% |
| Bolivian | 48 | 0.0% |
| Brazilian | 36 | 0.0% |
| British | 465 | 0.3% |
| Burmese | 307 | 0.2% |
| Cajun | 28 | 0.0% |
| Canadian | 249 | 0.2% |
| Celtic | 27 | 0.0% |
| Central American | 5,772 | 3.4% |
| Central American Indian | 784 | 0.5% |
| Cherokee | 1,043 | 0.6% |
| Chickasaw | 20 | 0.0% |
| Chippewa | 6 | 0.0% |
| Choctaw | 243 | 0.1% |
| Colombian | 87 | 0.1% |
| Comanche | 4 | 0.0% |
| Costa Rican | 36 | 0.0% |
| Creek | 24 | 0.0% |
| Croatian | 790 | 0.5% |
| Crow | 55 | 0.0% |
| Cuban | 746 | 0.4% |
| Czech | 566 | 0.3% |
| Czechoslovakian | 191 | 0.1% |
| Danish | 450 | 0.3% |
| Delaware | 50 | 0.0% |
| Dominican | 177 | 0.1% |
| Dutch | 1,318 | 0.8% |
| Eastern European | 405 | 0.2% |
| Ecuadorian | 77 | 0.1% |
| Egyptian | 10 | 0.0% |
| English | 9,842 | 5.9% |
| Ethiopian | 53 | 0.0% |
| European | 1,346 | 0.8% |
| Fijian | 136 | 0.1% |
| French | 2,020 | 1.2% |
| French Canadian | 316 | 0.2% |
| German | 18,827 | 11.2% |
| German Russian | 23 | 0.0% |
| Ghanaian | 73 | 0.0% |
| Greek | 257 | 0.2% |
| Guamanian / Chamorro | 19 | 0.0% |
| Guatemalan | 2,487 | 1.5% |
| Haitian | 42 | 0.0% |
| Honduran | 1,886 | 1.1% |
| Hopi | 7 | 0.0% |
| Hungarian | 37 | 0.0% |
| Indian (Asian) | 614 | 0.4% |
| Indonesian | 3,053 | 1.8% |
| Iranian | 23 | 0.0% |
| Iraqi | 13 | 0.0% |
| Irish | 11,802 | 7.0% |
| Iroquois | 52 | 0.0% |
| Israeli | 20 | 0.0% |
| Italian | 2,273 | 1.3% |
| Jamaican | 150 | 0.1% |
| Japanese | 6 | 0.0% |
| Kenyan | 32 | 0.0% |
| Kiowa | 1 | 0.0% |
| Korean | 568 | 0.3% |
| Lebanese | 4 | 0.0% |
| Liberian | 41 | 0.0% |
| Lithuanian | 79 | 0.1% |
| Malaysian | 467 | 0.3% |
| Mexican | 41,702 | 24.8% |
| Mexican American Indian | 602 | 0.4% |
| Mongolian | 16 | 0.0% |
| Moroccan | 38 | 0.0% |
| Native Hawaiian | 114 | 0.1% |
| Navajo | 41 | 0.0% |
| Nicaraguan | 30 | 0.0% |
| Nigerian | 108 | 0.1% |
| Northern European | 68 | 0.0% |
| Norwegian | 964 | 0.6% |
| Osage | 24 | 0.0% |
| Pakistani | 156 | 0.1% |
| Palestinian | 9 | 0.0% |
| Panamanian | 18 | 0.0% |
| Pennsylvania German | 6 | 0.0% |
| Peruvian | 20 | 0.0% |
| Polish | 1,594 | 0.9% |
| Portuguese | 126 | 0.1% |
| Potawatomi | 90 | 0.1% |
| Puerto Rican | 1,023 | 0.6% |
| Romanian | 29 | 0.0% |
| Russian | 355 | 0.2% |
| Salvadoran | 1,172 | 0.7% |
| Samoan | 26 | 0.0% |
| Scandinavian | 380 | 0.2% |
| Scotch-Irish | 824 | 0.5% |
| Scottish | 1,274 | 0.8% |
| Serbian | 121 | 0.1% |
| Sioux | 76 | 0.1% |
| Slavic | 25 | 0.0% |
| Slovak | 27 | 0.0% |
| Slovene | 109 | 0.1% |
| Somali | 95 | 0.1% |
| South American | 304 | 0.2% |
| Spaniard | 325 | 0.2% |
| Spanish | 134 | 0.1% |
| Sri Lankan | 427 | 0.3% |
| Subsaharan African | 3,253 | 1.9% |
| Sudanese | 26 | 0.0% |
| Swedish | 1,067 | 0.6% |
| Swiss | 117 | 0.1% |
| Thai | 597 | 0.4% |
| Tlingit-Haida | 25 | 0.0% |
| Turkish | 9 | 0.0% |
| Ugandan | 98 | 0.1% |
| Ukrainian | 58 | 0.0% |
| Uruguayan | 68 | 0.0% |
| Vietnamese | 34 | 0.0% |
| Welsh | 484 | 0.3% |
| West Indian | 115 | 0.1% |
| Yugoslavian | 106 | 0.1% | View All 130 Rows |
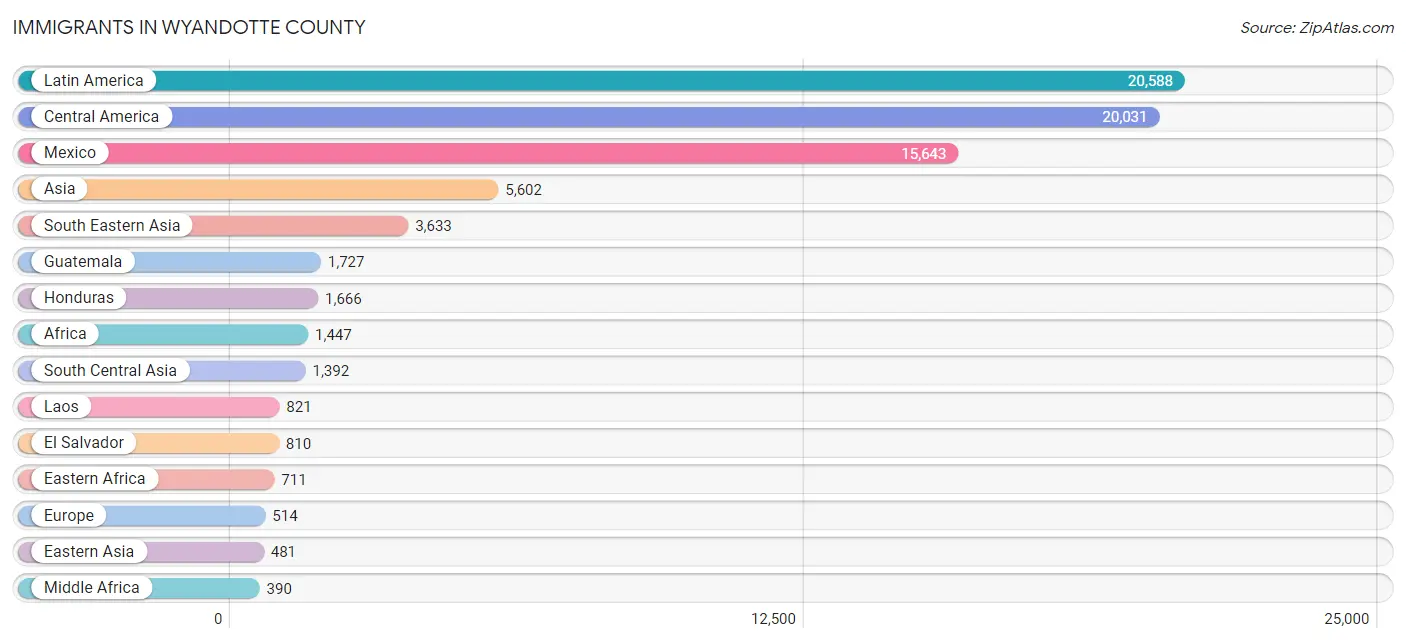
Immigrants in Wyandotte County
The most numerous immigrant groups reported in Wyandotte County came from Latin America (20,588 | 12.3%), Central America (20,031 | 11.9%), Mexico (15,643 | 9.3%), Asia (5,602 | 3.3%), and South Eastern Asia (3,633 | 2.2%), together accounting for 39.0% of all Wyandotte County residents.
| Immigration Origin | # Population | % Population |
| Afghanistan | 290 | 0.2% |
| Africa | 1,447 | 0.9% |
| Argentina | 4 | 0.0% |
| Asia | 5,602 | 3.3% |
| Australia | 44 | 0.0% |
| Bangladesh | 34 | 0.0% |
| Barbados | 11 | 0.0% |
| Bolivia | 48 | 0.0% |
| Bosnia and Herzegovina | 57 | 0.0% |
| Brazil | 66 | 0.0% |
| Cambodia | 6 | 0.0% |
| Canada | 62 | 0.0% |
| Caribbean | 278 | 0.2% |
| Central America | 20,031 | 11.9% |
| China | 360 | 0.2% |
| Colombia | 46 | 0.0% |
| Congo | 315 | 0.2% |
| Costa Rica | 22 | 0.0% |
| Cuba | 102 | 0.1% |
| Dominican Republic | 13 | 0.0% |
| Eastern Africa | 711 | 0.4% |
| Eastern Asia | 481 | 0.3% |
| Eastern Europe | 158 | 0.1% |
| Ecuador | 77 | 0.1% |
| El Salvador | 810 | 0.5% |
| England | 28 | 0.0% |
| Eritrea | 44 | 0.0% |
| Ethiopia | 45 | 0.0% |
| Europe | 514 | 0.3% |
| France | 82 | 0.1% |
| Germany | 43 | 0.0% |
| Ghana | 20 | 0.0% |
| Guatemala | 1,727 | 1.0% |
| Haiti | 25 | 0.0% |
| Honduras | 1,666 | 1.0% |
| Hong Kong | 6 | 0.0% |
| India | 320 | 0.2% |
| Iran | 7 | 0.0% |
| Iraq | 81 | 0.1% |
| Jamaica | 101 | 0.1% |
| Japan | 30 | 0.0% |
| Jordan | 15 | 0.0% |
| Kenya | 102 | 0.1% |
| Korea | 91 | 0.1% |
| Laos | 821 | 0.5% |
| Latin America | 20,588 | 12.3% |
| Liberia | 41 | 0.0% |
| Malaysia | 145 | 0.1% |
| Mexico | 15,643 | 9.3% |
| Micronesia | 233 | 0.1% |
| Middle Africa | 390 | 0.2% |
| Nepal | 319 | 0.2% |
| Nigeria | 51 | 0.0% |
| Northern Africa | 136 | 0.1% |
| Northern Europe | 104 | 0.1% |
| Oceania | 290 | 0.2% |
| Pakistan | 43 | 0.0% |
| Panama | 25 | 0.0% |
| Peru | 14 | 0.0% |
| Philippines | 158 | 0.1% |
| Poland | 10 | 0.0% |
| Romania | 21 | 0.0% |
| Russia | 45 | 0.0% |
| Serbia | 25 | 0.0% |
| Somalia | 62 | 0.0% |
| South Africa | 9 | 0.0% |
| South America | 279 | 0.2% |
| South Central Asia | 1,392 | 0.8% |
| South Eastern Asia | 3,633 | 2.2% |
| Southern Europe | 127 | 0.1% |
| Spain | 127 | 0.1% |
| Sri Lanka | 48 | 0.0% |
| Sudan | 136 | 0.1% |
| Sweden | 5 | 0.0% |
| Thailand | 358 | 0.2% |
| Uganda | 183 | 0.1% |
| Uruguay | 24 | 0.0% |
| Vietnam | 190 | 0.1% |
| Western Africa | 127 | 0.1% |
| Western Asia | 96 | 0.1% |
| Western Europe | 125 | 0.1% |
| Zaire | 75 | 0.0% | View All 82 Rows |
Sex and Age in Wyandotte County
Sex and Age in Wyandotte County
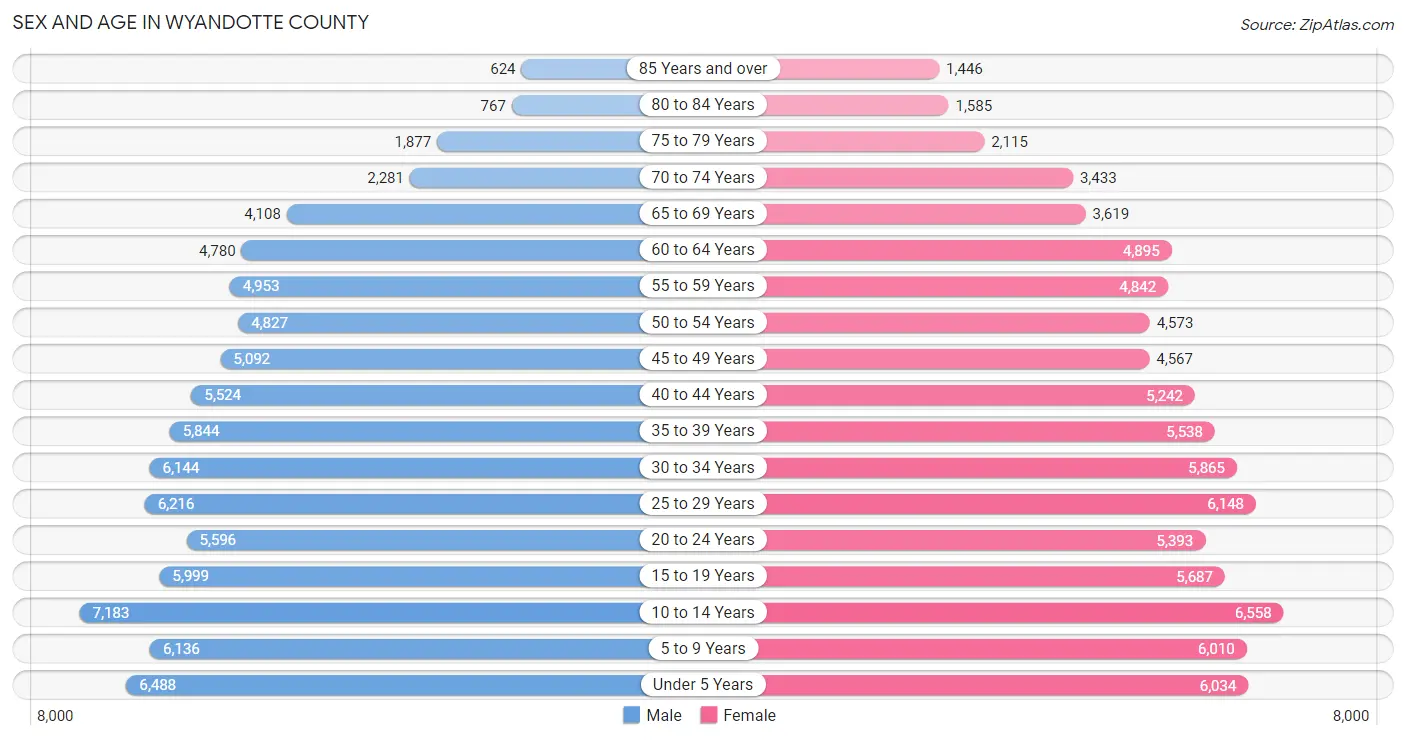
The most populous age groups in Wyandotte County are 10 to 14 Years (7,183 | 8.5%) for men and 10 to 14 Years (6,558 | 7.9%) for women.
| Age Bracket | Male | Female |
| Under 5 Years | 6,488 (7.7%) | 6,034 (7.2%) |
| 5 to 9 Years | 6,136 (7.3%) | 6,010 (7.2%) |
| 10 to 14 Years | 7,183 (8.5%) | 6,558 (7.9%) |
| 15 to 19 Years | 5,999 (7.1%) | 5,687 (6.8%) |
| 20 to 24 Years | 5,596 (6.6%) | 5,393 (6.5%) |
| 25 to 29 Years | 6,216 (7.4%) | 6,148 (7.4%) |
| 30 to 34 Years | 6,144 (7.3%) | 5,865 (7.0%) |
| 35 to 39 Years | 5,844 (6.9%) | 5,538 (6.6%) |
| 40 to 44 Years | 5,524 (6.5%) | 5,242 (6.3%) |
| 45 to 49 Years | 5,092 (6.0%) | 4,567 (5.5%) |
| 50 to 54 Years | 4,827 (5.7%) | 4,573 (5.5%) |
| 55 to 59 Years | 4,953 (5.9%) | 4,842 (5.8%) |
| 60 to 64 Years | 4,780 (5.7%) | 4,895 (5.9%) |
| 65 to 69 Years | 4,108 (4.9%) | 3,619 (4.3%) |
| 70 to 74 Years | 2,281 (2.7%) | 3,433 (4.1%) |
| 75 to 79 Years | 1,877 (2.2%) | 2,115 (2.5%) |
| 80 to 84 Years | 767 (0.9%) | 1,585 (1.9%) |
| 85 Years and over | 624 (0.7%) | 1,446 (1.7%) |
| Total | 84,439 (100.0%) | 83,550 (100.0%) |
Families and Households in Wyandotte County
Median Family Size in Wyandotte County
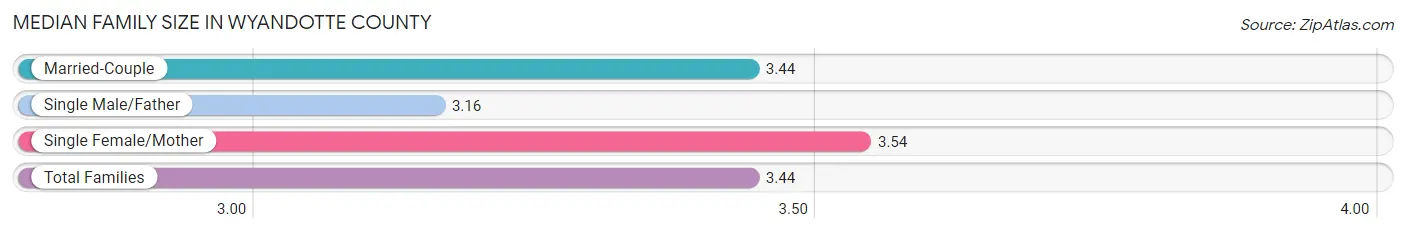
The median family size in Wyandotte County is 3.44 persons per family, with single female/mother families (9,617 | 24.7%) accounting for the largest median family size of 3.54 persons per family. On the other hand, single male/father families (3,727 | 9.6%) represent the smallest median family size with 3.16 persons per family.
| Family Type | # Families | Family Size |
| Married-Couple | 25,528 (65.7%) | 3.44 |
| Single Male/Father | 3,727 (9.6%) | 3.16 |
| Single Female/Mother | 9,617 (24.7%) | 3.54 |
| Total Families | 38,872 (100.0%) | 3.44 |
Median Household Size in Wyandotte County
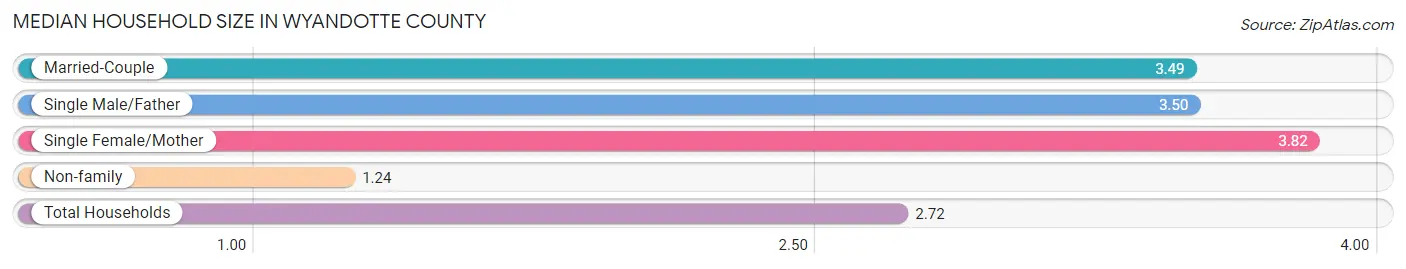
The median household size in Wyandotte County is 2.72 persons per household, with single female/mother households (9,617 | 15.7%) accounting for the largest median household size of 3.82 persons per household. non-family households (22,410 | 36.6%) represent the smallest median household size with 1.24 persons per household.
| Household Type | # Households | Household Size |
| Married-Couple | 25,528 (41.7%) | 3.49 |
| Single Male/Father | 3,727 (6.1%) | 3.50 |
| Single Female/Mother | 9,617 (15.7%) | 3.82 |
| Non-family | 22,410 (36.6%) | 1.24 |
| Total Households | 61,282 (100.0%) | 2.72 |
Household Size by Marriage Status in Wyandotte County
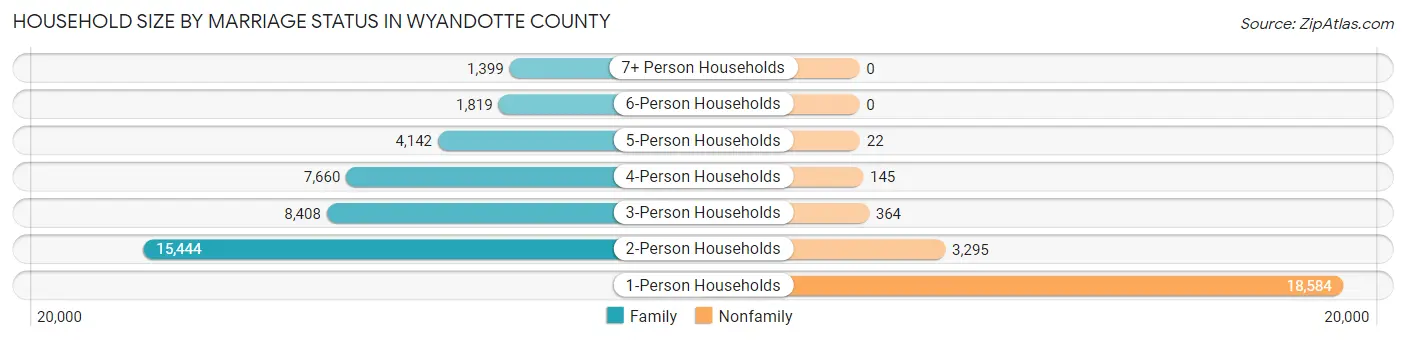
Out of a total of 61,282 households in Wyandotte County, 38,872 (63.4%) are family households, while 22,410 (36.6%) are nonfamily households. The most numerous type of family households are 2-person households, comprising 15,444, and the most common type of nonfamily households are 1-person households, comprising 18,584.
| Household Size | Family Households | Nonfamily Households |
| 1-Person Households | - | 18,584 (30.3%) |
| 2-Person Households | 15,444 (25.2%) | 3,295 (5.4%) |
| 3-Person Households | 8,408 (13.7%) | 364 (0.6%) |
| 4-Person Households | 7,660 (12.5%) | 145 (0.2%) |
| 5-Person Households | 4,142 (6.8%) | 22 (0.0%) |
| 6-Person Households | 1,819 (3.0%) | 0 (0.0%) |
| 7+ Person Households | 1,399 (2.3%) | 0 (0.0%) |
| Total | 38,872 (63.4%) | 22,410 (36.6%) |
Female Fertility in Wyandotte County
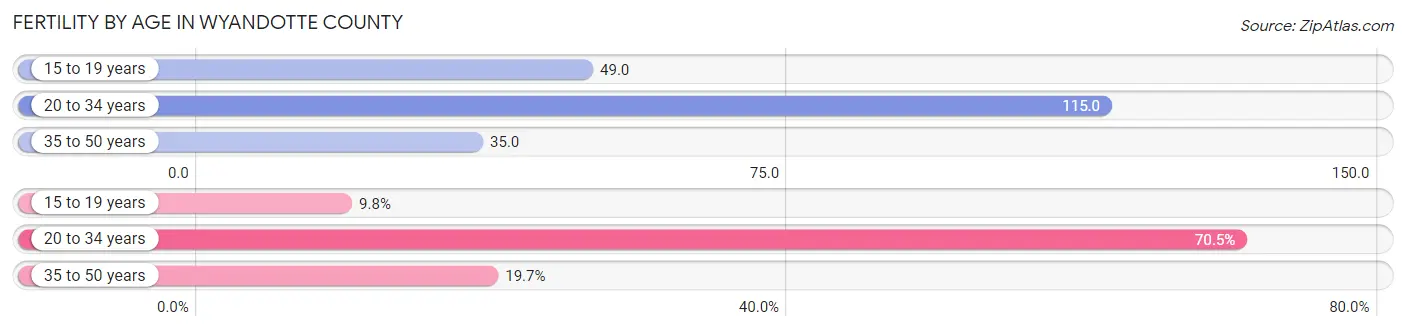
Fertility by Age in Wyandotte County
Average fertility rate in Wyandotte County is 73.0 births per 1,000 women. Women in the age bracket of 20 to 34 years have the highest fertility rate with 115.0 births per 1,000 women. Women in the age bracket of 20 to 34 years acount for 70.5% of all women with births.
| Age Bracket | Women with Births | Births / 1,000 Women |
| 15 to 19 years | 278 (9.8%) | 49.0 |
| 20 to 34 years | 2,005 (70.5%) | 115.0 |
| 35 to 50 years | 560 (19.7%) | 35.0 |
| Total | 2,843 (100.0%) | 73.0 |
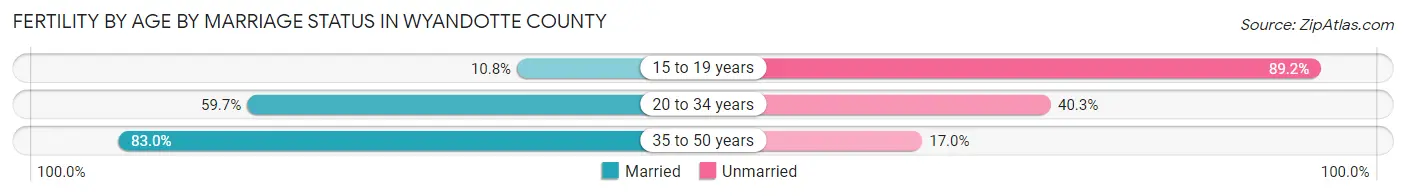
Fertility by Age by Marriage Status in Wyandotte County
59.5% of women with births (2,843) in Wyandotte County are married. The highest percentage of unmarried women with births falls into 15 to 19 years age bracket with 89.2% of them unmarried at the time of birth, while the lowest percentage of unmarried women with births belong to 35 to 50 years age bracket with 17.0% of them unmarried.
| Age Bracket | Married | Unmarried |
| 15 to 19 years | 30 (10.8%) | 248 (89.2%) |
| 20 to 34 years | 1,197 (59.7%) | 808 (40.3%) |
| 35 to 50 years | 465 (83.0%) | 95 (17.0%) |
| Total | 1,692 (59.5%) | 1,151 (40.5%) |
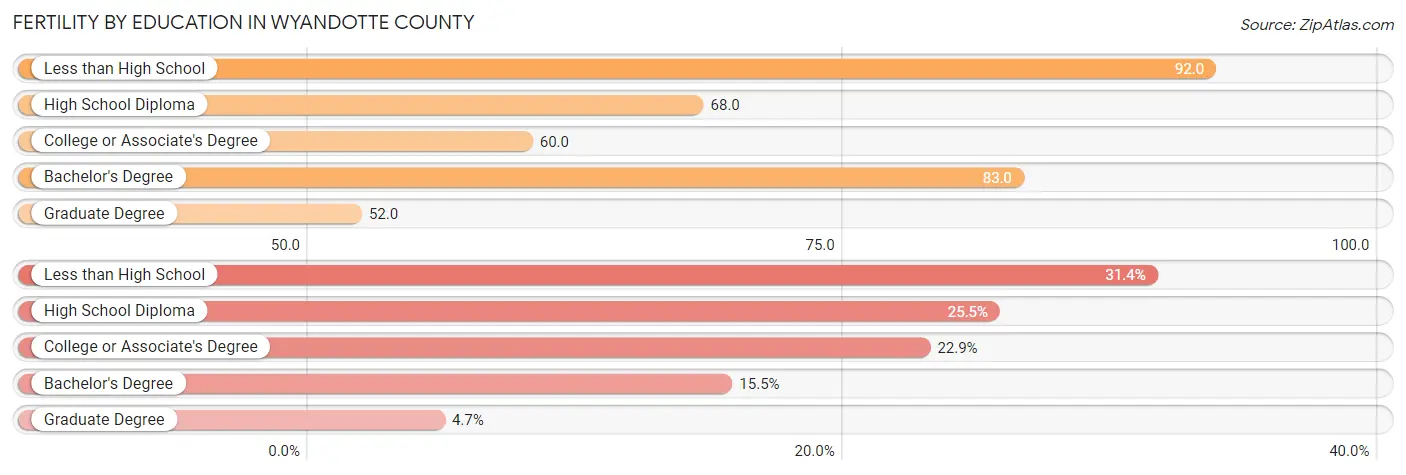
Fertility by Education in Wyandotte County
Average fertility rate in Wyandotte County is 73.0 births per 1,000 women. Women with the education attainment of less than high school have the highest fertility rate of 92.0 births per 1,000 women, while women with the education attainment of graduate degree have the lowest fertility at 52.0 births per 1,000 women. Women with the education attainment of less than high school represent 31.4% of all women with births.
| Educational Attainment | Women with Births | Births / 1,000 Women |
| Less than High School | 893 (31.4%) | 92.0 |
| High School Diploma | 725 (25.5%) | 68.0 |
| College or Associate's Degree | 651 (22.9%) | 60.0 |
| Bachelor's Degree | 440 (15.5%) | 83.0 |
| Graduate Degree | 134 (4.7%) | 52.0 |
| Total | 2,843 (100.0%) | 73.0 |
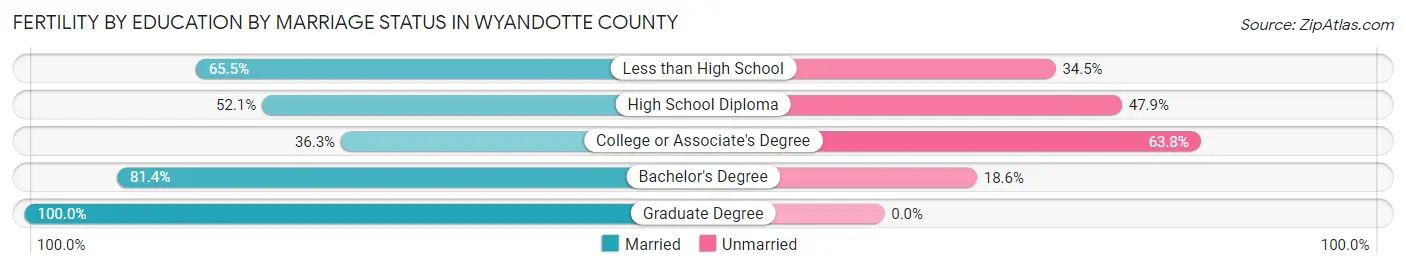
Fertility by Education by Marriage Status in Wyandotte County
40.5% of women with births in Wyandotte County are unmarried. Women with the educational attainment of graduate degree are most likely to be married with 100.0% of them married at childbirth, while women with the educational attainment of college or associate's degree are least likely to be married with 63.7% of them unmarried at childbirth.
| Educational Attainment | Married | Unmarried |
| Less than High School | 585 (65.5%) | 308 (34.5%) |
| High School Diploma | 378 (52.1%) | 347 (47.9%) |
| College or Associate's Degree | 236 (36.2%) | 415 (63.7%) |
| Bachelor's Degree | 358 (81.4%) | 82 (18.6%) |
| Graduate Degree | 134 (100.0%) | 0 (0.0%) |
| Total | 1,692 (59.5%) | 1,151 (40.5%) |
Income in Wyandotte County
Income Overview in Wyandotte County
Per Capita Income in Wyandotte County is $27,534, while median incomes of families and households are $69,819 and $57,771 respectively.
| Characteristic | Number | Measure |
| Per Capita Income | 167,989 | $27,534 |
| Median Family Income | 38,872 | $69,819 |
| Mean Family Income | 38,872 | $83,425 |
| Median Household Income | 61,282 | $57,771 |
| Mean Household Income | 61,282 | $72,423 |
| Income Deficit | 38,872 | $10,629 |
| Wage / Income Gap (%) | 167,989 | 21.31% |
| Wage / Income Gap ($) | 167,989 | 78.69¢ per $1 |
| Gini / Inequality Index | 167,989 | 0.43 |
Earnings by Sex in Wyandotte County
Average Earnings in Wyandotte County are $35,863, $40,054 for men and $31,518 for women, a difference of 21.3%.
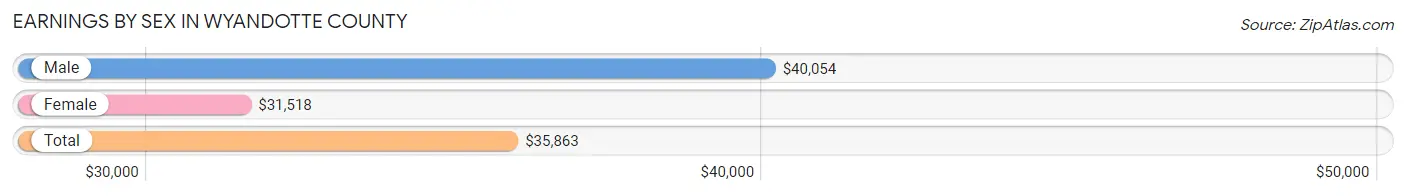
| Sex | Number | Average Earnings |
| Male | 46,857 (54.0%) | $40,054 |
| Female | 39,943 (46.0%) | $31,518 |
| Total | 86,800 (100.0%) | $35,863 |
Earnings by Sex by Income Bracket in Wyandotte County
The most common earnings brackets in Wyandotte County are $55,000 to $64,999 for men (4,662 | 10.0%) and $25,000 to $29,999 for women (3,254 | 8.2%).
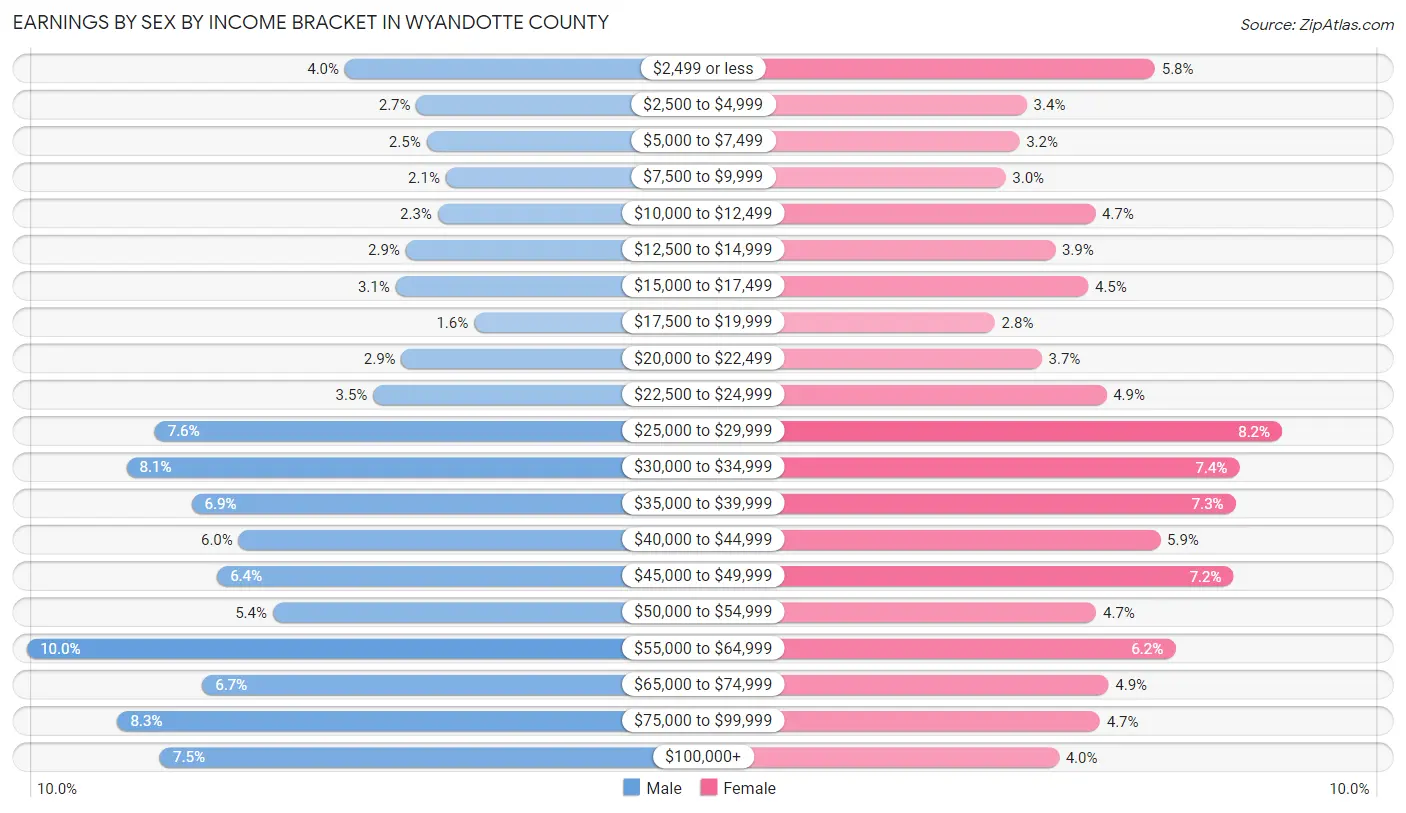
| Income | Male | Female |
| $2,499 or less | 1,872 (4.0%) | 2,306 (5.8%) |
| $2,500 to $4,999 | 1,247 (2.7%) | 1,346 (3.4%) |
| $5,000 to $7,499 | 1,156 (2.5%) | 1,289 (3.2%) |
| $7,500 to $9,999 | 990 (2.1%) | 1,186 (3.0%) |
| $10,000 to $12,499 | 1,061 (2.3%) | 1,857 (4.6%) |
| $12,500 to $14,999 | 1,341 (2.9%) | 1,557 (3.9%) |
| $15,000 to $17,499 | 1,431 (3.0%) | 1,807 (4.5%) |
| $17,500 to $19,999 | 738 (1.6%) | 1,108 (2.8%) |
| $20,000 to $22,499 | 1,376 (2.9%) | 1,459 (3.6%) |
| $22,500 to $24,999 | 1,628 (3.5%) | 1,941 (4.9%) |
| $25,000 to $29,999 | 3,541 (7.6%) | 3,254 (8.2%) |
| $30,000 to $34,999 | 3,790 (8.1%) | 2,934 (7.3%) |
| $35,000 to $39,999 | 3,220 (6.9%) | 2,907 (7.3%) |
| $40,000 to $44,999 | 2,809 (6.0%) | 2,345 (5.9%) |
| $45,000 to $49,999 | 2,994 (6.4%) | 2,891 (7.2%) |
| $50,000 to $54,999 | 2,508 (5.3%) | 1,864 (4.7%) |
| $55,000 to $64,999 | 4,662 (10.0%) | 2,457 (6.1%) |
| $65,000 to $74,999 | 3,126 (6.7%) | 1,958 (4.9%) |
| $75,000 to $99,999 | 3,870 (8.3%) | 1,893 (4.7%) |
| $100,000+ | 3,497 (7.5%) | 1,584 (4.0%) |
| Total | 46,857 (100.0%) | 39,943 (100.0%) |
Earnings by Sex by Educational Attainment in Wyandotte County
Average earnings in Wyandotte County are $45,512 for men and $36,436 for women, a difference of 19.9%. Men with an educational attainment of graduate degree enjoy the highest average annual earnings of $65,135, while those with less than high school education earn the least with $37,134. Women with an educational attainment of graduate degree earn the most with the average annual earnings of $60,433, while those with less than high school education have the smallest earnings of $22,763.
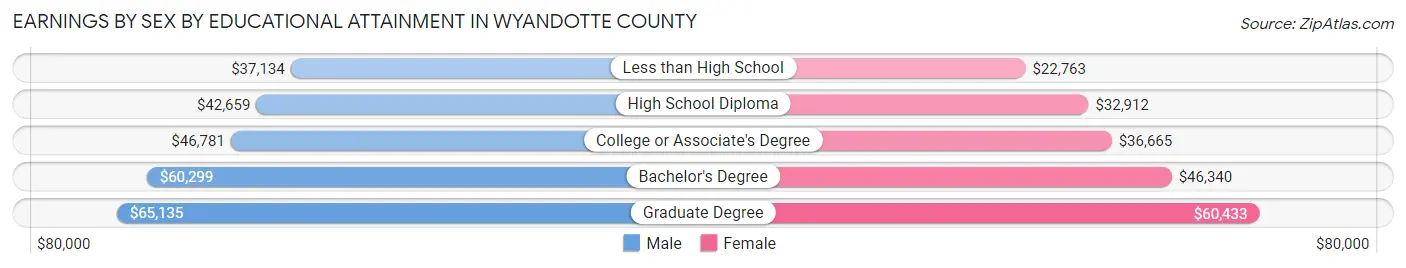
| Educational Attainment | Male Income | Female Income |
| Less than High School | $37,134 | $22,763 |
| High School Diploma | $42,659 | $32,912 |
| College or Associate's Degree | $46,781 | $36,665 |
| Bachelor's Degree | $60,299 | $46,340 |
| Graduate Degree | $65,135 | $60,433 |
| Total | $45,512 | $36,436 |
Family Income in Wyandotte County
Family Income Brackets in Wyandotte County
According to the Wyandotte County family income data, there are 8,435 families falling into the $50,000 to $74,999 income range, which is the most common income bracket and makes up 21.7% of all families. Conversely, the $10,000 to $14,999 income bracket is the least frequent group with only 972 families (2.5%) belonging to this category.
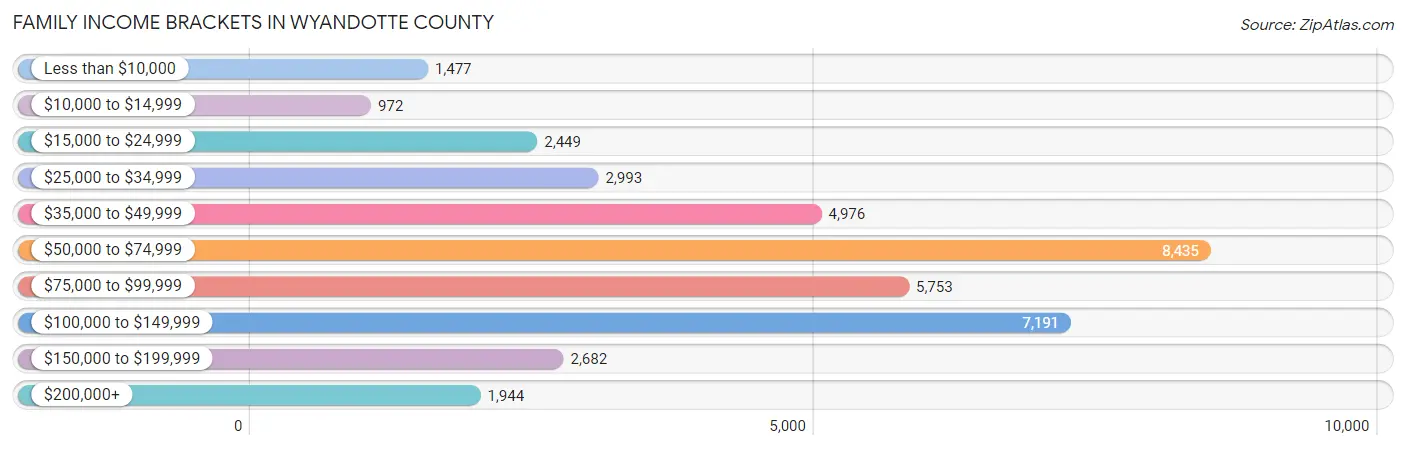
| Income Bracket | # Families | % Families |
| Less than $10,000 | 1,477 | 3.8% |
| $10,000 to $14,999 | 972 | 2.5% |
| $15,000 to $24,999 | 2,449 | 6.3% |
| $25,000 to $34,999 | 2,993 | 7.7% |
| $35,000 to $49,999 | 4,976 | 12.8% |
| $50,000 to $74,999 | 8,435 | 21.7% |
| $75,000 to $99,999 | 5,753 | 14.8% |
| $100,000 to $149,999 | 7,191 | 18.5% |
| $150,000 to $199,999 | 2,682 | 6.9% |
| $200,000+ | 1,944 | 5.0% |
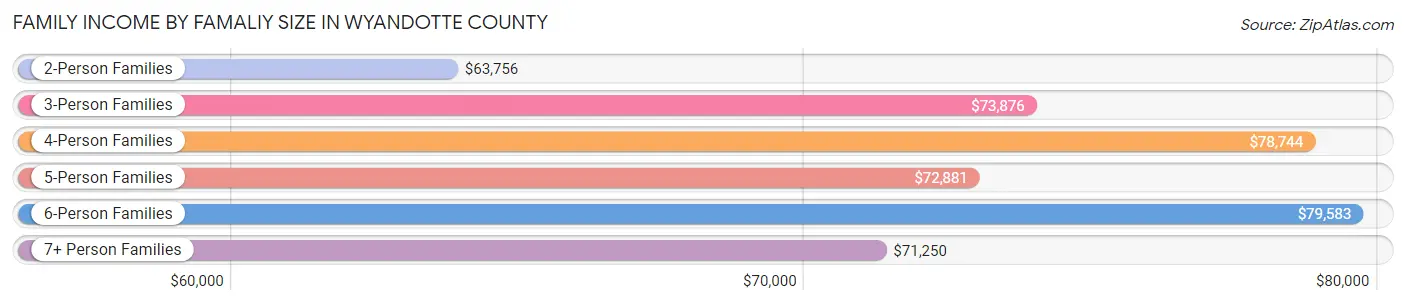
Family Income by Famaliy Size in Wyandotte County
6-person families (1,713 | 4.4%) account for the highest median family income in Wyandotte County with $79,583 per family, while 2-person families (16,713 | 43.0%) have the highest median income of $31,878 per family member.
| Income Bracket | # Families | Median Income |
| 2-Person Families | 16,713 (43.0%) | $63,756 |
| 3-Person Families | 8,310 (21.4%) | $73,876 |
| 4-Person Families | 7,470 (19.2%) | $78,744 |
| 5-Person Families | 3,566 (9.2%) | $72,881 |
| 6-Person Families | 1,713 (4.4%) | $79,583 |
| 7+ Person Families | 1,100 (2.8%) | $71,250 |
| Total | 38,872 (100.0%) | $69,819 |
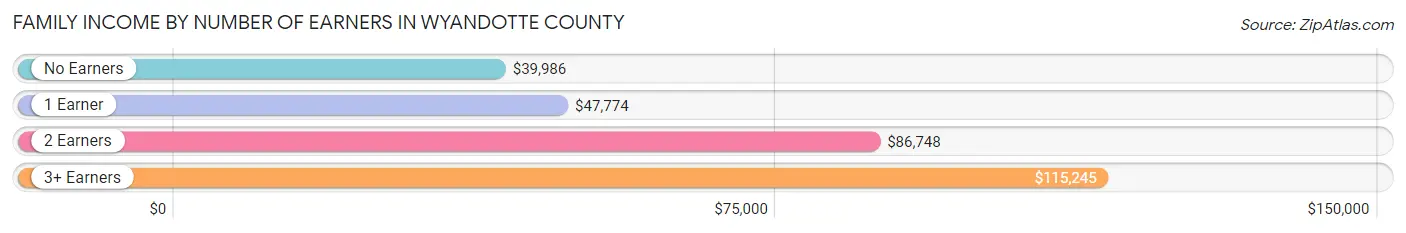
Family Income by Number of Earners in Wyandotte County
The median family income in Wyandotte County is $69,819, with families comprising 3+ earners (5,425) having the highest median family income of $115,245, while families with no earners (4,478) have the lowest median family income of $39,986, accounting for 14.0% and 11.5% of families, respectively.
| Number of Earners | # Families | Median Income |
| No Earners | 4,478 (11.5%) | $39,986 |
| 1 Earner | 13,808 (35.5%) | $47,774 |
| 2 Earners | 15,161 (39.0%) | $86,748 |
| 3+ Earners | 5,425 (14.0%) | $115,245 |
| Total | 38,872 (100.0%) | $69,819 |
Household Income in Wyandotte County
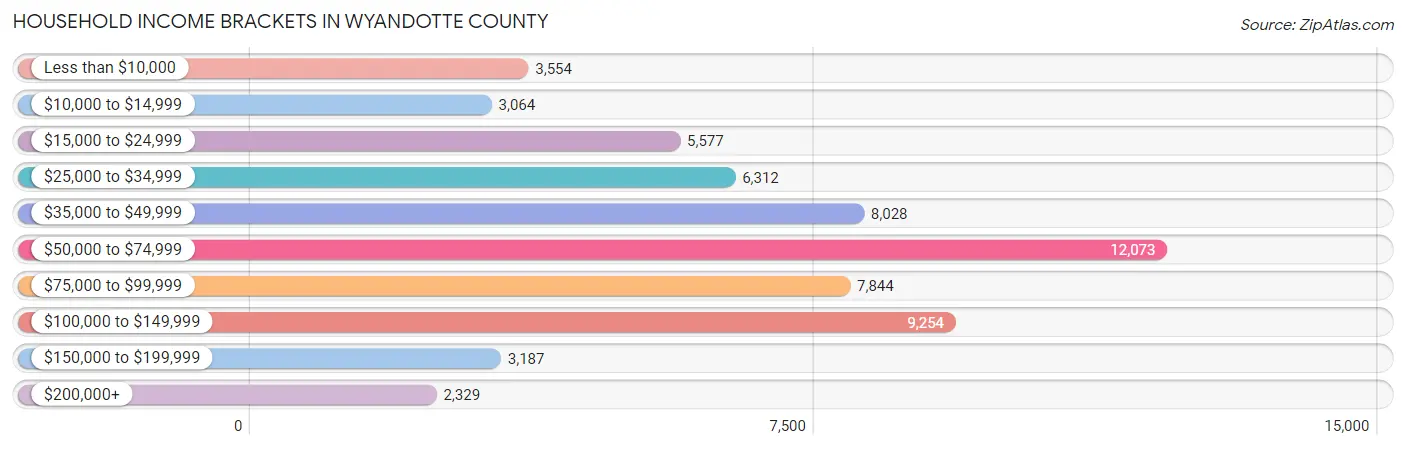
Household Income Brackets in Wyandotte County
With 12,073 households falling in the category, the $50,000 to $74,999 income range is the most frequent in Wyandotte County, accounting for 19.7% of all households. In contrast, only 2,329 households (3.8%) fall into the $200,000+ income bracket, making it the least populous group.
| Income Bracket | # Households | % Households |
| Less than $10,000 | 3,554 | 5.8% |
| $10,000 to $14,999 | 3,064 | 5.0% |
| $15,000 to $24,999 | 5,577 | 9.1% |
| $25,000 to $34,999 | 6,312 | 10.3% |
| $35,000 to $49,999 | 8,028 | 13.1% |
| $50,000 to $74,999 | 12,073 | 19.7% |
| $75,000 to $99,999 | 7,844 | 12.8% |
| $100,000 to $149,999 | 9,254 | 15.1% |
| $150,000 to $199,999 | 3,187 | 5.2% |
| $200,000+ | 2,329 | 3.8% |
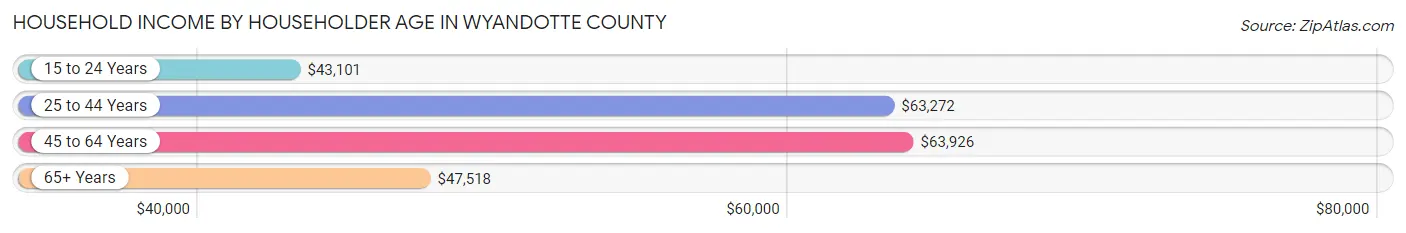
Household Income by Householder Age in Wyandotte County
The median household income in Wyandotte County is $57,771, with the highest median household income of $63,926 found in the 45 to 64 years age bracket for the primary householder. A total of 22,105 households (36.1%) fall into this category. Meanwhile, the 15 to 24 years age bracket for the primary householder has the lowest median household income of $43,101, with 2,861 households (4.7%) in this group.
| Income Bracket | # Households | Median Income |
| 15 to 24 Years | 2,861 (4.7%) | $43,101 |
| 25 to 44 Years | 21,586 (35.2%) | $63,272 |
| 45 to 64 Years | 22,105 (36.1%) | $63,926 |
| 65+ Years | 14,730 (24.0%) | $47,518 |
| Total | 61,282 (100.0%) | $57,771 |
Poverty in Wyandotte County
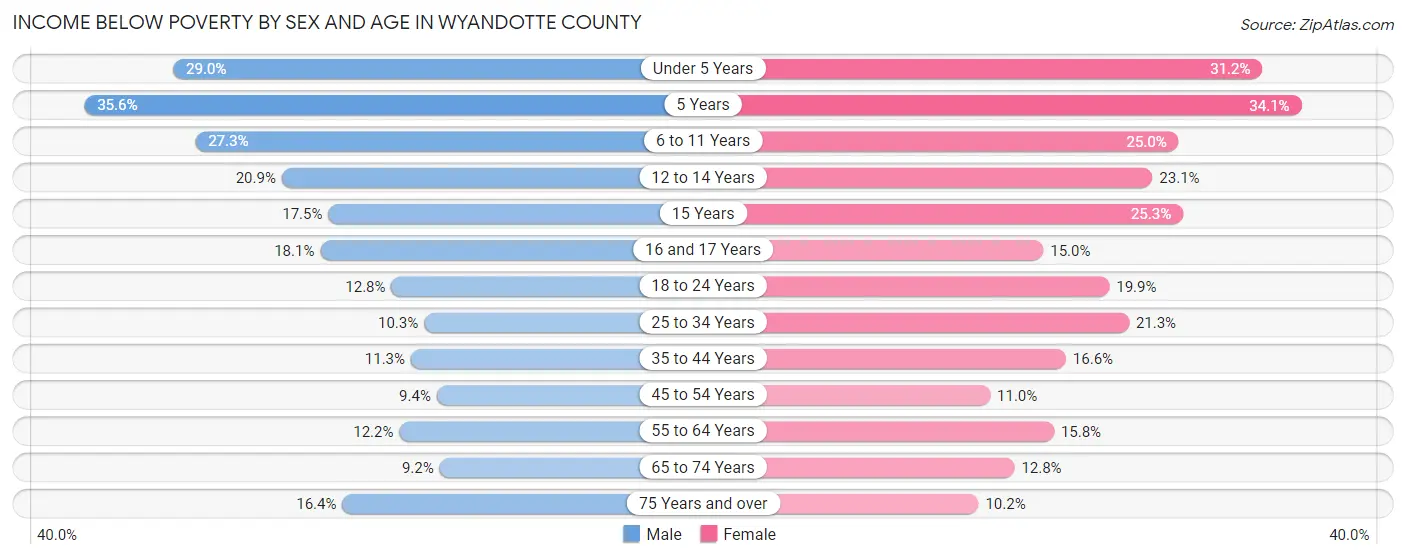
Income Below Poverty by Sex and Age in Wyandotte County
With 15.1% poverty level for males and 18.6% for females among the residents of Wyandotte County, 5 year old males and 5 year old females are the most vulnerable to poverty, with 381 males (35.6%) and 378 females (34.1%) in their respective age groups living below the poverty level.
| Age Bracket | Male | Female |
| Under 5 Years | 1,810 (29.0%) | 1,856 (31.2%) |
| 5 Years | 381 (35.6%) | 378 (34.1%) |
| 6 to 11 Years | 2,101 (27.3%) | 1,836 (25.0%) |
| 12 to 14 Years | 891 (20.9%) | 896 (23.1%) |
| 15 Years | 250 (17.4%) | 286 (25.3%) |
| 16 and 17 Years | 422 (18.0%) | 366 (15.0%) |
| 18 to 24 Years | 991 (12.8%) | 1,476 (19.9%) |
| 25 to 34 Years | 1,261 (10.3%) | 2,549 (21.3%) |
| 35 to 44 Years | 1,266 (11.3%) | 1,786 (16.6%) |
| 45 to 54 Years | 926 (9.4%) | 996 (11.0%) |
| 55 to 64 Years | 1,176 (12.2%) | 1,524 (15.8%) |
| 65 to 74 Years | 584 (9.2%) | 901 (12.8%) |
| 75 Years and over | 527 (16.4%) | 501 (10.2%) |
| Total | 12,586 (15.1%) | 15,351 (18.6%) |
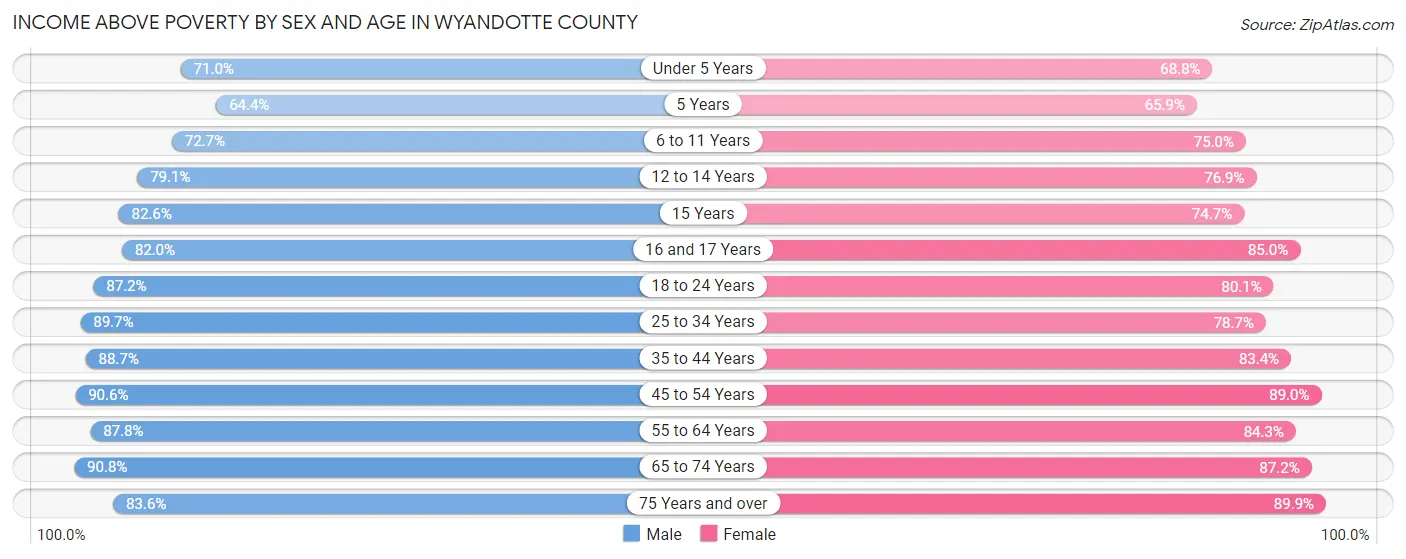
Income Above Poverty by Sex and Age in Wyandotte County
According to the poverty statistics in Wyandotte County, males aged 65 to 74 years and females aged 75 years and over are the age groups that are most secure financially, with 90.8% of males and 89.8% of females in these age groups living above the poverty line.
| Age Bracket | Male | Female |
| Under 5 Years | 4,437 (71.0%) | 4,089 (68.8%) |
| 5 Years | 690 (64.4%) | 730 (65.9%) |
| 6 to 11 Years | 5,586 (72.7%) | 5,506 (75.0%) |
| 12 to 14 Years | 3,371 (79.1%) | 2,990 (76.9%) |
| 15 Years | 1,183 (82.6%) | 843 (74.7%) |
| 16 and 17 Years | 1,916 (82.0%) | 2,081 (85.0%) |
| 18 to 24 Years | 6,771 (87.2%) | 5,957 (80.1%) |
| 25 to 34 Years | 10,939 (89.7%) | 9,406 (78.7%) |
| 35 to 44 Years | 9,921 (88.7%) | 8,945 (83.4%) |
| 45 to 54 Years | 8,929 (90.6%) | 8,053 (89.0%) |
| 55 to 64 Years | 8,481 (87.8%) | 8,154 (84.3%) |
| 65 to 74 Years | 5,774 (90.8%) | 6,125 (87.2%) |
| 75 Years and over | 2,685 (83.6%) | 4,437 (89.8%) |
| Total | 70,683 (84.9%) | 67,316 (81.4%) |
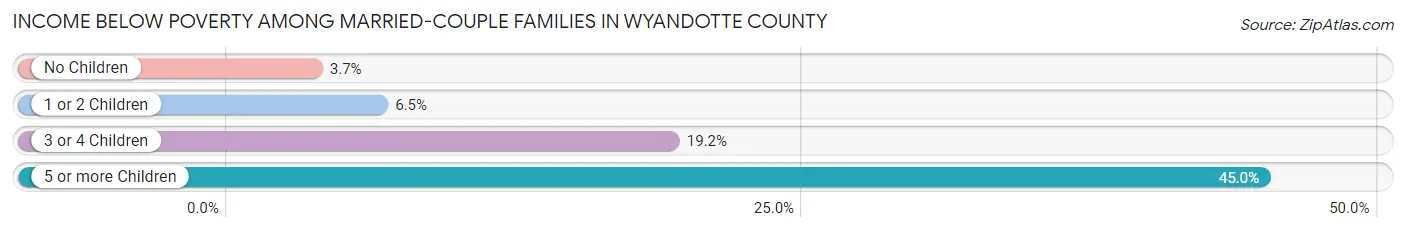
Income Below Poverty Among Married-Couple Families in Wyandotte County
The poverty statistics for married-couple families in Wyandotte County show that 6.9% or 1,767 of the total 25,528 families live below the poverty line. Families with 5 or more children have the highest poverty rate of 45.0%, comprising of 138 families. On the other hand, families with no children have the lowest poverty rate of 3.7%, which includes 499 families.
| Children | Above Poverty | Below Poverty |
| No Children | 13,042 (96.3%) | 499 (3.7%) |
| 1 or 2 Children | 8,219 (93.5%) | 575 (6.5%) |
| 3 or 4 Children | 2,331 (80.8%) | 555 (19.2%) |
| 5 or more Children | 169 (55.0%) | 138 (45.0%) |
| Total | 23,761 (93.1%) | 1,767 (6.9%) |
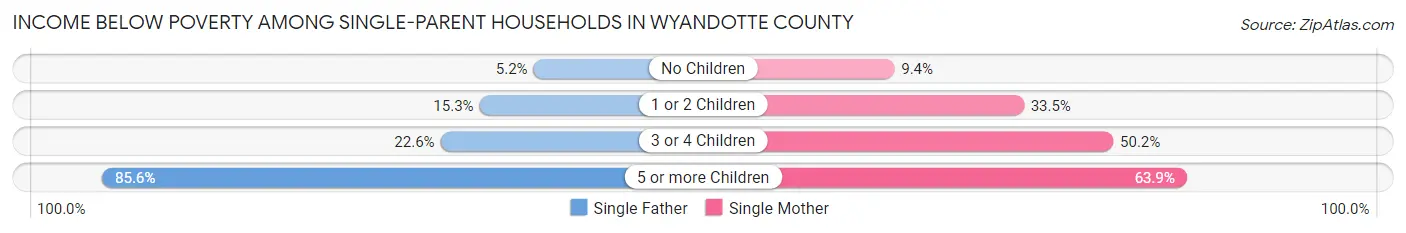
Income Below Poverty Among Single-Parent Households in Wyandotte County
According to the poverty data in Wyandotte County, 13.0% or 483 single-father households and 28.2% or 2,717 single-mother households are living below the poverty line. Among single-father households, those with 5 or more children have the highest poverty rate, with 77 households (85.6%) experiencing poverty. Likewise, among single-mother households, those with 5 or more children have the highest poverty rate, with 69 households (63.9%) falling below the poverty line.
| Children | Single Father | Single Mother |
| No Children | 92 (5.2%) | 312 (9.4%) |
| 1 or 2 Children | 231 (15.3%) | 1,563 (33.5%) |
| 3 or 4 Children | 83 (22.6%) | 773 (50.2%) |
| 5 or more Children | 77 (85.6%) | 69 (63.9%) |
| Total | 483 (13.0%) | 2,717 (28.2%) |
Income Below Poverty Among Married-Couple vs Single-Parent Households in Wyandotte County
The poverty data for Wyandotte County shows that 1,767 of the married-couple family households (6.9%) and 3,200 of the single-parent households (24.0%) are living below the poverty level. Within the married-couple family households, those with 5 or more children have the highest poverty rate, with 138 households (45.0%) falling below the poverty line. Among the single-parent households, those with 5 or more children have the highest poverty rate, with 146 household (73.7%) living below poverty.
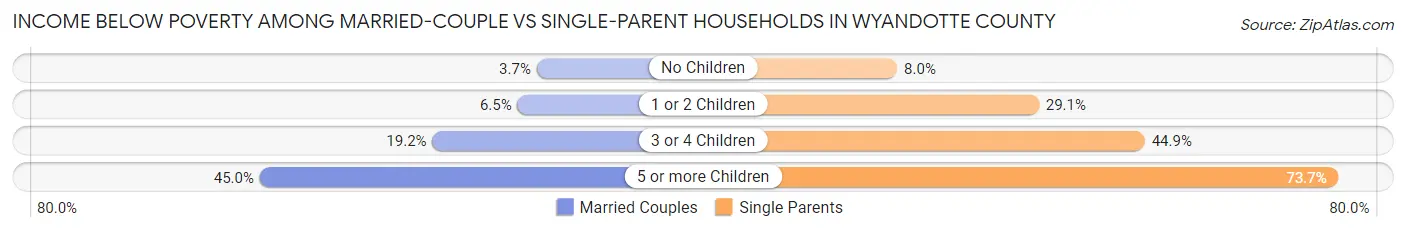
| Children | Married-Couple Families | Single-Parent Households |
| No Children | 499 (3.7%) | 404 (8.0%) |
| 1 or 2 Children | 575 (6.5%) | 1,794 (29.1%) |
| 3 or 4 Children | 555 (19.2%) | 856 (44.9%) |
| 5 or more Children | 138 (45.0%) | 146 (73.7%) |
| Total | 1,767 (6.9%) | 3,200 (24.0%) |
Employment Characteristics in Wyandotte County
Employment by Class of Employer in Wyandotte County
Among the 76,861 employed individuals in Wyandotte County, private company employees (56,673 | 73.7%), local government employees (5,894 | 7.7%), and not-for-profit organizations (5,061 | 6.6%) make up the most common classes of employment.
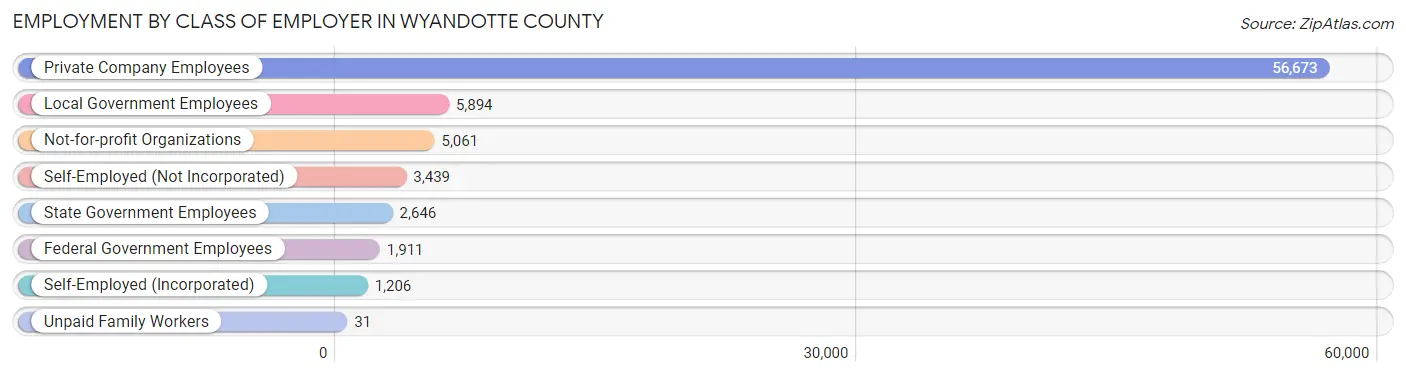
| Employer Class | # Employees | % Employees |
| Private Company Employees | 56,673 | 73.7% |
| Self-Employed (Incorporated) | 1,206 | 1.6% |
| Self-Employed (Not Incorporated) | 3,439 | 4.5% |
| Not-for-profit Organizations | 5,061 | 6.6% |
| Local Government Employees | 5,894 | 7.7% |
| State Government Employees | 2,646 | 3.4% |
| Federal Government Employees | 1,911 | 2.5% |
| Unpaid Family Workers | 31 | 0.0% |
| Total | 76,861 | 100.0% |
Employment Status by Age in Wyandotte County
According to the labor force statistics for Wyandotte County, out of the total population over 16 years of age (127,017), 65.8% or 83,577 individuals are in the labor force, with 5.7% or 4,764 of them unemployed. The age group with the highest labor force participation rate is 35 to 44 years, with 83.6% or 18,516 individuals in the labor force. Within the labor force, the 16 to 19 years age range has the highest percentage of unemployed individuals, with 14.4% or 670 of them being unemployed.
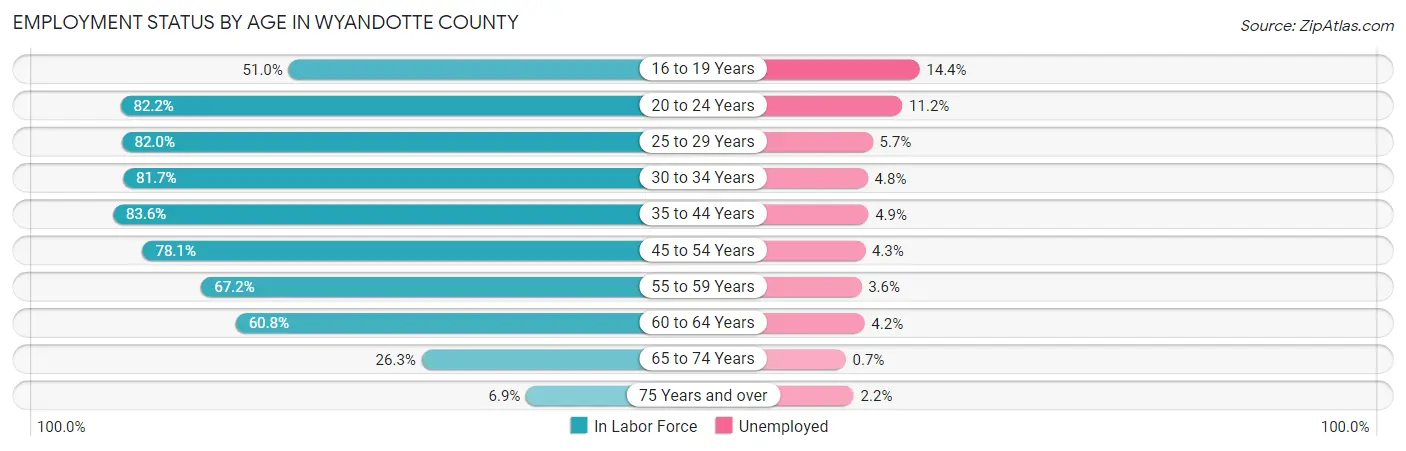
| Age Bracket | In Labor Force | Unemployed |
| 16 to 19 Years | 4,653 (51.0%) | 670 (14.4%) |
| 20 to 24 Years | 9,033 (82.2%) | 1,012 (11.2%) |
| 25 to 29 Years | 10,138 (82.0%) | 578 (5.7%) |
| 30 to 34 Years | 9,811 (81.7%) | 471 (4.8%) |
| 35 to 44 Years | 18,516 (83.6%) | 907 (4.9%) |
| 45 to 54 Years | 14,885 (78.1%) | 640 (4.3%) |
| 55 to 59 Years | 6,582 (67.2%) | 237 (3.6%) |
| 60 to 64 Years | 5,882 (60.8%) | 247 (4.2%) |
| 65 to 74 Years | 3,535 (26.3%) | 25 (0.7%) |
| 75 Years and over | 581 (6.9%) | 13 (2.2%) |
| Total | 83,577 (65.8%) | 4,764 (5.7%) |
Employment Status by Educational Attainment in Wyandotte County
According to labor force statistics for Wyandotte County, 77.4% of individuals (65,829) out of the total population between 25 and 64 years of age (85,050) are in the labor force, with 4.7% or 3,094 of them being unemployed. The group with the highest labor force participation rate are those with the educational attainment of bachelor's degree or higher, with 88.5% or 14,993 individuals in the labor force. Within the labor force, individuals with high school diploma education have the highest percentage of unemployment, with 6.4% or 1,254 of them being unemployed.
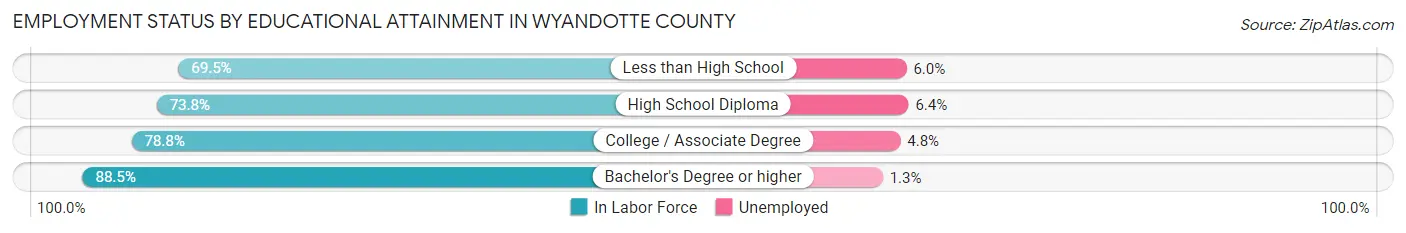
| Educational Attainment | In Labor Force | Unemployed |
| Less than High School | 11,269 (69.5%) | 973 (6.0%) |
| High School Diploma | 19,599 (73.8%) | 1,700 (6.4%) |
| College / Associate Degree | 19,966 (78.8%) | 1,216 (4.8%) |
| Bachelor's Degree or higher | 14,993 (88.5%) | 220 (1.3%) |
| Total | 65,829 (77.4%) | 3,997 (4.7%) |
Employment Occupations by Sex in Wyandotte County
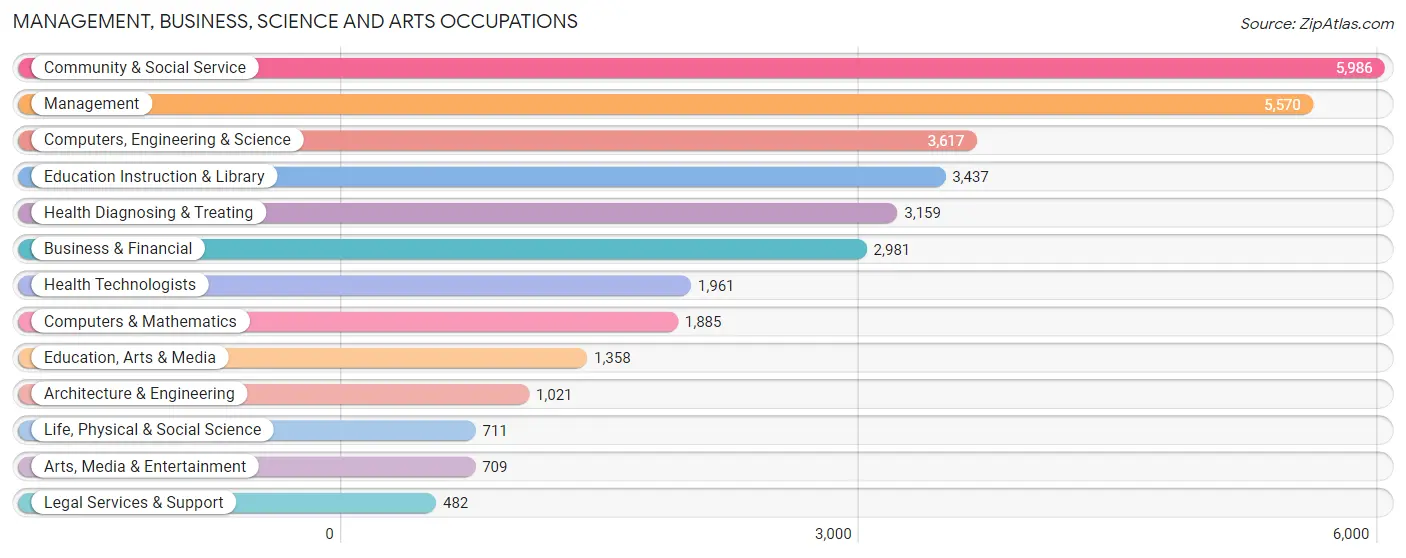
Management, Business, Science and Arts Occupations
The most common Management, Business, Science and Arts occupations in Wyandotte County are Community & Social Service (5,986 | 7.6%), Management (5,570 | 7.1%), Computers, Engineering & Science (3,617 | 4.6%), Education Instruction & Library (3,437 | 4.4%), and Health Diagnosing & Treating (3,159 | 4.0%).
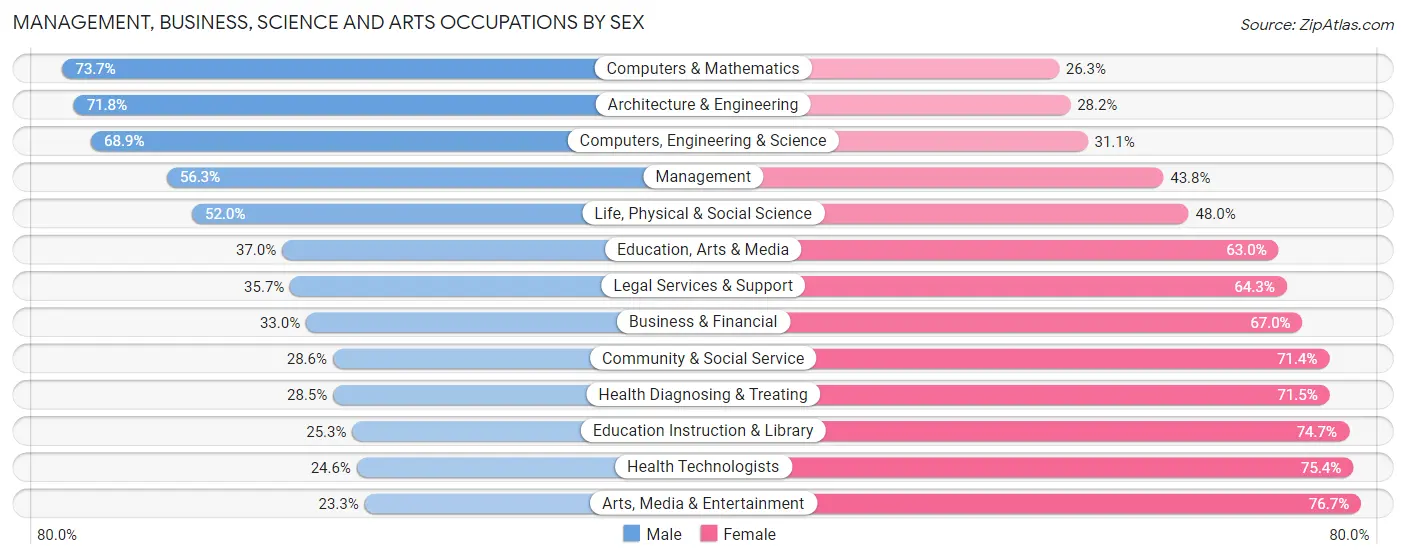
Management, Business, Science and Arts Occupations by Sex
Within the Management, Business, Science and Arts occupations in Wyandotte County, the most male-oriented occupations are Computers & Mathematics (73.7%), Architecture & Engineering (71.8%), and Computers, Engineering & Science (68.9%), while the most female-oriented occupations are Arts, Media & Entertainment (76.7%), Health Technologists (75.4%), and Education Instruction & Library (74.7%).
| Occupation | Male | Female |
| Management | 3,133 (56.2%) | 2,437 (43.8%) |
| Business & Financial | 985 (33.0%) | 1,996 (67.0%) |
| Computers, Engineering & Science | 2,492 (68.9%) | 1,125 (31.1%) |
| Computers & Mathematics | 1,389 (73.7%) | 496 (26.3%) |
| Architecture & Engineering | 733 (71.8%) | 288 (28.2%) |
| Life, Physical & Social Science | 370 (52.0%) | 341 (48.0%) |
| Community & Social Service | 1,710 (28.6%) | 4,276 (71.4%) |
| Education, Arts & Media | 503 (37.0%) | 855 (63.0%) |
| Legal Services & Support | 172 (35.7%) | 310 (64.3%) |
| Education Instruction & Library | 870 (25.3%) | 2,567 (74.7%) |
| Arts, Media & Entertainment | 165 (23.3%) | 544 (76.7%) |
| Health Diagnosing & Treating | 901 (28.5%) | 2,258 (71.5%) |
| Health Technologists | 482 (24.6%) | 1,479 (75.4%) |
| Total (Category) | 9,221 (43.3%) | 12,092 (56.7%) |
| Total (Overall) | 42,526 (54.1%) | 36,064 (45.9%) |
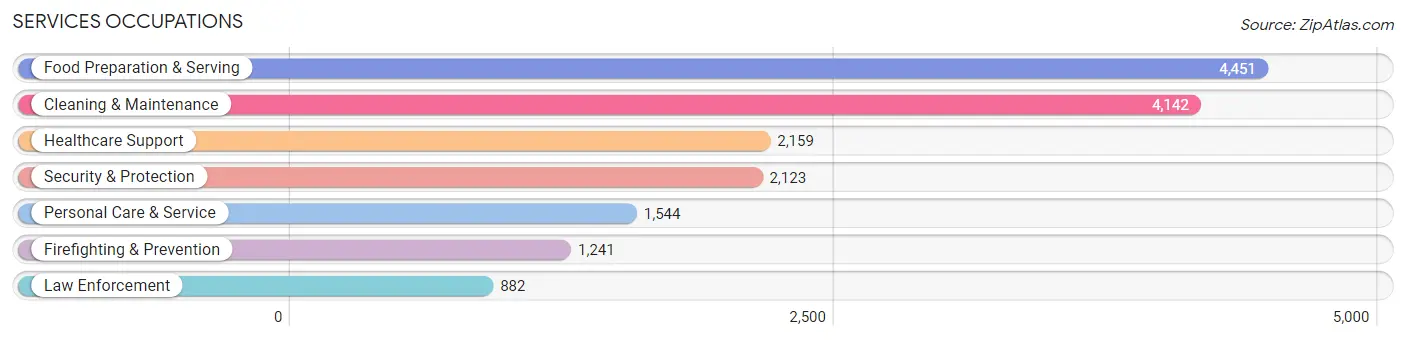
Services Occupations
The most common Services occupations in Wyandotte County are Food Preparation & Serving (4,451 | 5.7%), Cleaning & Maintenance (4,142 | 5.3%), Healthcare Support (2,159 | 2.8%), Security & Protection (2,123 | 2.7%), and Personal Care & Service (1,544 | 2.0%).
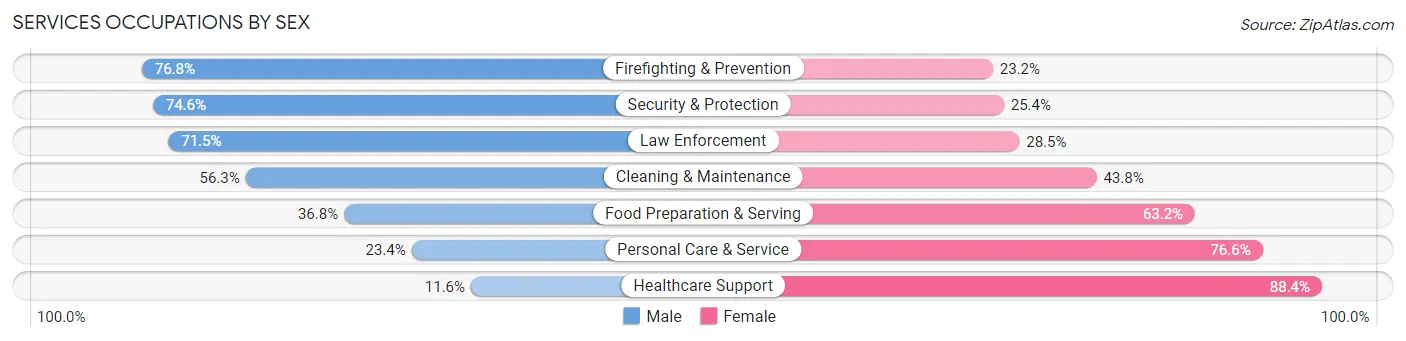
Services Occupations by Sex
Within the Services occupations in Wyandotte County, the most male-oriented occupations are Firefighting & Prevention (76.8%), Security & Protection (74.6%), and Law Enforcement (71.5%), while the most female-oriented occupations are Healthcare Support (88.4%), Personal Care & Service (76.6%), and Food Preparation & Serving (63.2%).
| Occupation | Male | Female |
| Healthcare Support | 251 (11.6%) | 1,908 (88.4%) |
| Security & Protection | 1,584 (74.6%) | 539 (25.4%) |
| Firefighting & Prevention | 953 (76.8%) | 288 (23.2%) |
| Law Enforcement | 631 (71.5%) | 251 (28.5%) |
| Food Preparation & Serving | 1,636 (36.8%) | 2,815 (63.2%) |
| Cleaning & Maintenance | 2,330 (56.2%) | 1,812 (43.8%) |
| Personal Care & Service | 361 (23.4%) | 1,183 (76.6%) |
| Total (Category) | 6,162 (42.7%) | 8,257 (57.3%) |
| Total (Overall) | 42,526 (54.1%) | 36,064 (45.9%) |
Sales and Office Occupations
The most common Sales and Office occupations in Wyandotte County are Office & Administration (8,214 | 10.4%), and Sales & Related (6,532 | 8.3%).

Sales and Office Occupations by Sex
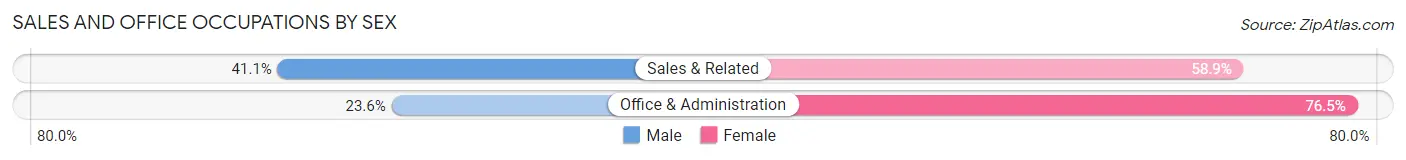
| Occupation | Male | Female |
| Sales & Related | 2,683 (41.1%) | 3,849 (58.9%) |
| Office & Administration | 1,934 (23.5%) | 6,280 (76.4%) |
| Total (Category) | 4,617 (31.3%) | 10,129 (68.7%) |
| Total (Overall) | 42,526 (54.1%) | 36,064 (45.9%) |
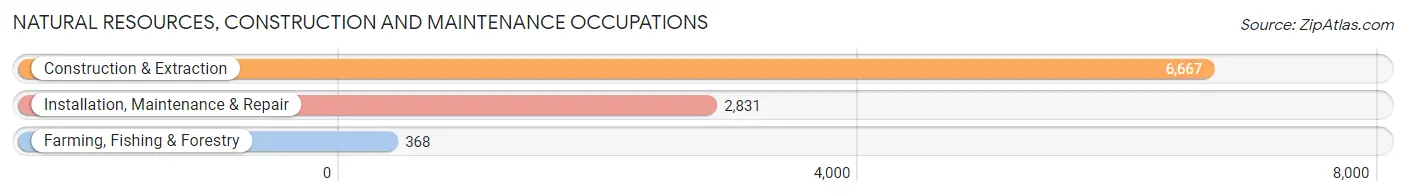
Natural Resources, Construction and Maintenance Occupations
The most common Natural Resources, Construction and Maintenance occupations in Wyandotte County are Construction & Extraction (6,667 | 8.5%), Installation, Maintenance & Repair (2,831 | 3.6%), and Farming, Fishing & Forestry (368 | 0.5%).
Natural Resources, Construction and Maintenance Occupations by Sex
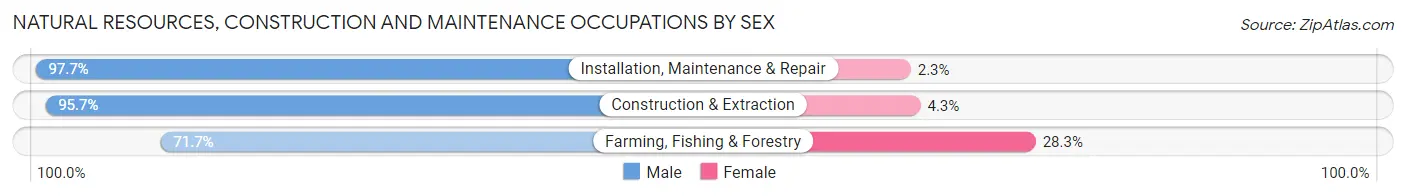
| Occupation | Male | Female |
| Farming, Fishing & Forestry | 264 (71.7%) | 104 (28.3%) |
| Construction & Extraction | 6,381 (95.7%) | 286 (4.3%) |
| Installation, Maintenance & Repair | 2,767 (97.7%) | 64 (2.3%) |
| Total (Category) | 9,412 (95.4%) | 454 (4.6%) |
| Total (Overall) | 42,526 (54.1%) | 36,064 (45.9%) |
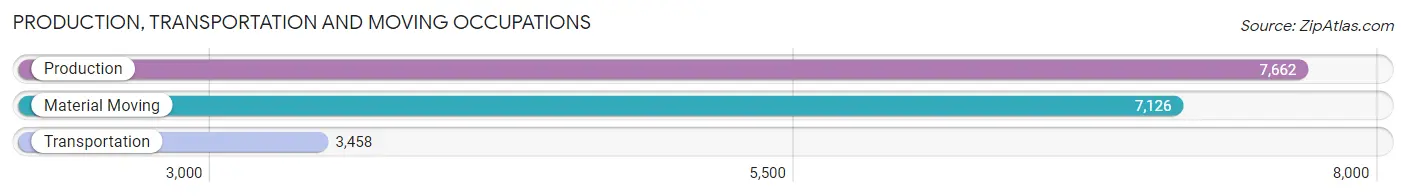
Production, Transportation and Moving Occupations
The most common Production, Transportation and Moving occupations in Wyandotte County are Production (7,662 | 9.8%), Material Moving (7,126 | 9.1%), and Transportation (3,458 | 4.4%).
Production, Transportation and Moving Occupations by Sex
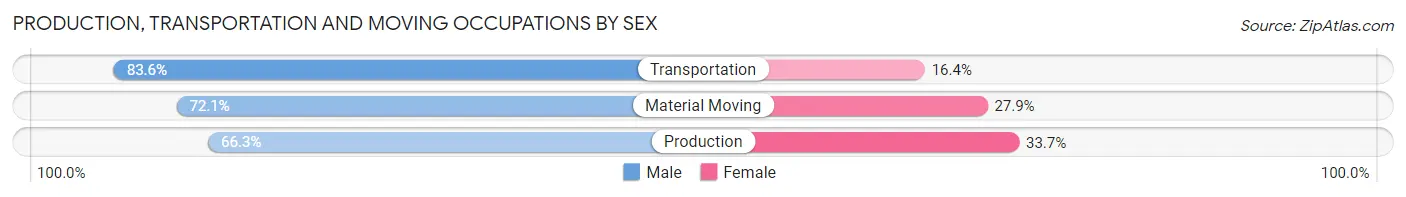
| Occupation | Male | Female |
| Production | 5,082 (66.3%) | 2,580 (33.7%) |
| Transportation | 2,892 (83.6%) | 566 (16.4%) |
| Material Moving | 5,140 (72.1%) | 1,986 (27.9%) |
| Total (Category) | 13,114 (71.9%) | 5,132 (28.1%) |
| Total (Overall) | 42,526 (54.1%) | 36,064 (45.9%) |
Employment Industries by Sex in Wyandotte County
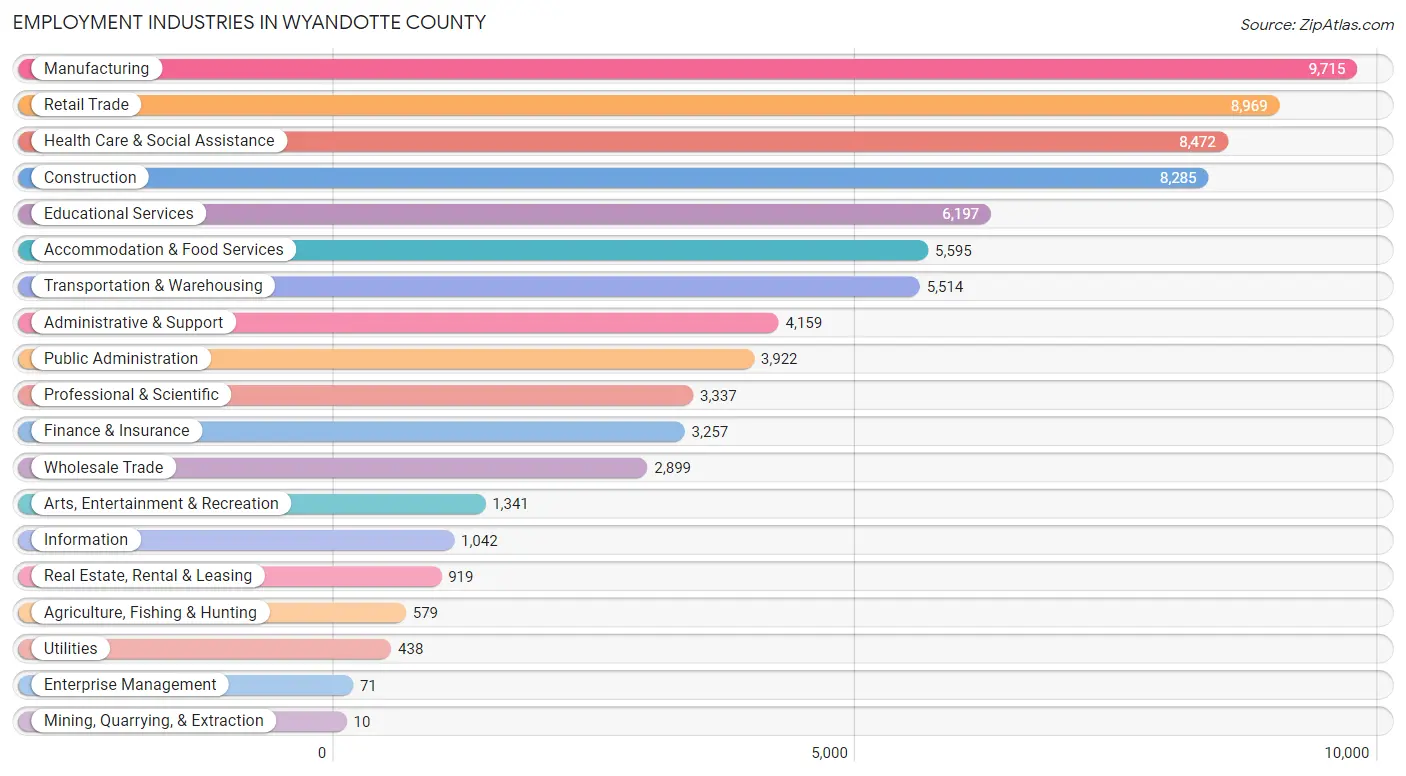
Employment Industries in Wyandotte County
The major employment industries in Wyandotte County include Manufacturing (9,715 | 12.4%), Retail Trade (8,969 | 11.4%), Health Care & Social Assistance (8,472 | 10.8%), Construction (8,285 | 10.5%), and Educational Services (6,197 | 7.9%).
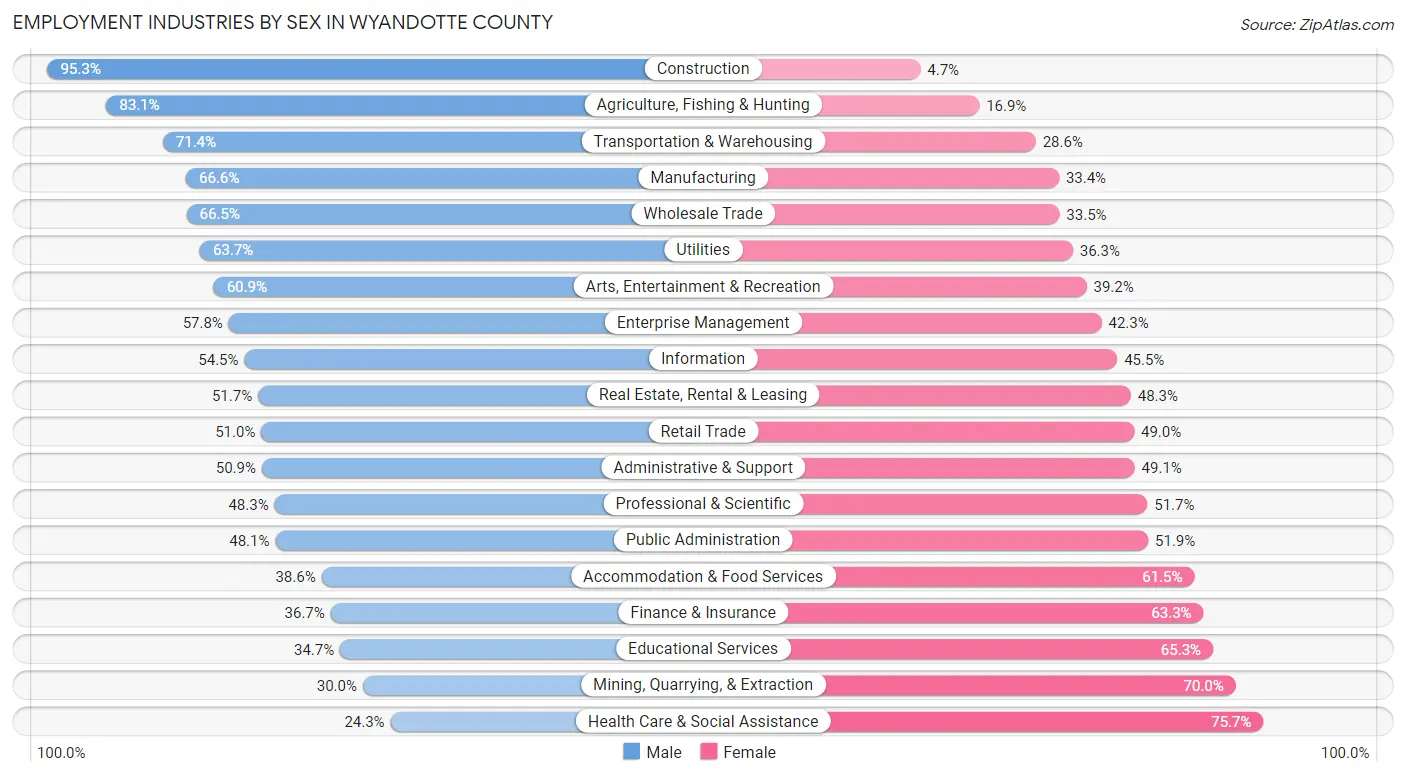
Employment Industries by Sex in Wyandotte County
The Wyandotte County industries that see more men than women are Construction (95.3%), Agriculture, Fishing & Hunting (83.1%), and Transportation & Warehousing (71.4%), whereas the industries that tend to have a higher number of women are Health Care & Social Assistance (75.7%), Mining, Quarrying, & Extraction (70.0%), and Educational Services (65.3%).
| Industry | Male | Female |
| Agriculture, Fishing & Hunting | 481 (83.1%) | 98 (16.9%) |
| Mining, Quarrying, & Extraction | 3 (30.0%) | 7 (70.0%) |
| Construction | 7,892 (95.3%) | 393 (4.7%) |
| Manufacturing | 6,467 (66.6%) | 3,248 (33.4%) |
| Wholesale Trade | 1,927 (66.5%) | 972 (33.5%) |
| Retail Trade | 4,576 (51.0%) | 4,393 (49.0%) |
| Transportation & Warehousing | 3,936 (71.4%) | 1,578 (28.6%) |
| Utilities | 279 (63.7%) | 159 (36.3%) |
| Information | 568 (54.5%) | 474 (45.5%) |
| Finance & Insurance | 1,194 (36.7%) | 2,063 (63.3%) |
| Real Estate, Rental & Leasing | 475 (51.7%) | 444 (48.3%) |
| Professional & Scientific | 1,611 (48.3%) | 1,726 (51.7%) |
| Enterprise Management | 41 (57.8%) | 30 (42.2%) |
| Administrative & Support | 2,117 (50.9%) | 2,042 (49.1%) |
| Educational Services | 2,151 (34.7%) | 4,046 (65.3%) |
| Health Care & Social Assistance | 2,057 (24.3%) | 6,415 (75.7%) |
| Arts, Entertainment & Recreation | 816 (60.9%) | 525 (39.2%) |
| Accommodation & Food Services | 2,157 (38.6%) | 3,438 (61.5%) |
| Public Administration | 1,887 (48.1%) | 2,035 (51.9%) |
| Total | 42,526 (54.1%) | 36,064 (45.9%) |
Education in Wyandotte County
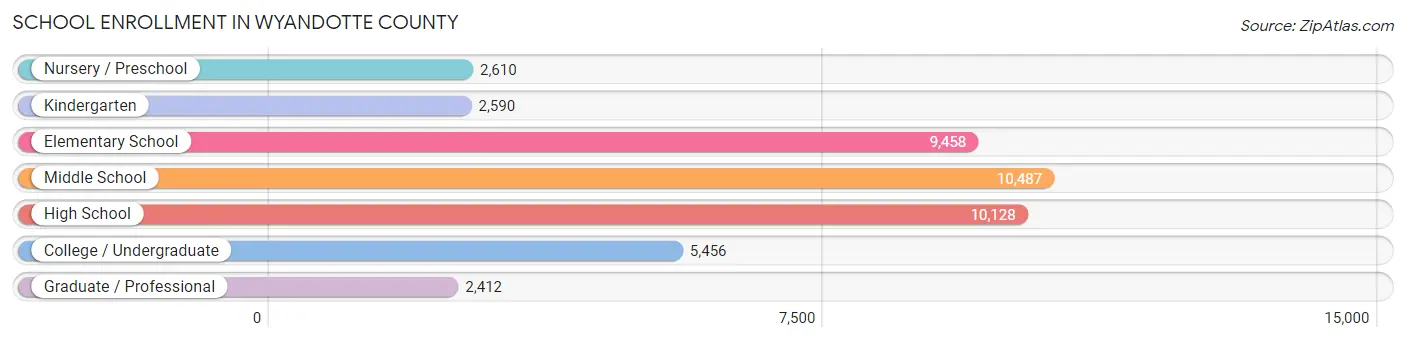
School Enrollment in Wyandotte County
The most common levels of schooling among the 43,141 students in Wyandotte County are middle school (10,487 | 24.3%), high school (10,128 | 23.5%), and elementary school (9,458 | 21.9%).
| School Level | # Students | % Students |
| Nursery / Preschool | 2,610 | 6.0% |
| Kindergarten | 2,590 | 6.0% |
| Elementary School | 9,458 | 21.9% |
| Middle School | 10,487 | 24.3% |
| High School | 10,128 | 23.5% |
| College / Undergraduate | 5,456 | 12.7% |
| Graduate / Professional | 2,412 | 5.6% |
| Total | 43,141 | 100.0% |
School Enrollment by Age by Funding Source in Wyandotte County
Out of a total of 43,141 students who are enrolled in schools in Wyandotte County, 4,487 (10.4%) attend a private institution, while the remaining 38,654 (89.6%) are enrolled in public schools. The age group of 3 to 4 year olds has the highest likelihood of being enrolled in private schools, with 478 (24.1% in the age bracket) enrolled. Conversely, the age group of 5 to 9 year old has the lowest likelihood of being enrolled in a private school, with 10,615 (93.2% in the age bracket) attending a public institution.
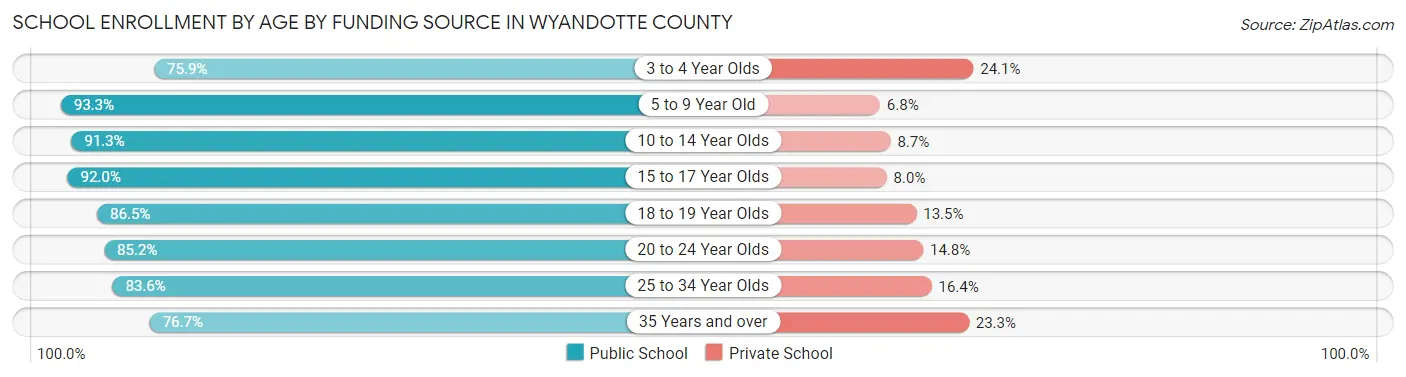
| Age Bracket | Public School | Private School |
| 3 to 4 Year Olds | 1,502 (75.9%) | 478 (24.1%) |
| 5 to 9 Year Old | 10,615 (93.2%) | 768 (6.8%) |
| 10 to 14 Year Olds | 12,321 (91.3%) | 1,175 (8.7%) |
| 15 to 17 Year Olds | 6,535 (92.0%) | 569 (8.0%) |
| 18 to 19 Year Olds | 2,054 (86.5%) | 321 (13.5%) |
| 20 to 24 Year Olds | 2,345 (85.2%) | 407 (14.8%) |
| 25 to 34 Year Olds | 2,136 (83.6%) | 418 (16.4%) |
| 35 Years and over | 1,148 (76.7%) | 349 (23.3%) |
| Total | 38,654 (89.6%) | 4,487 (10.4%) |
Educational Attainment by Field of Study in Wyandotte County
Business (4,528 | 19.6%), education (3,609 | 15.6%), science & technology (2,253 | 9.7%), arts & humanities (1,783 | 7.7%), and bio, nature & agricultural (1,639 | 7.1%) are the most common fields of study among 23,129 individuals in Wyandotte County who have obtained a bachelor's degree or higher.
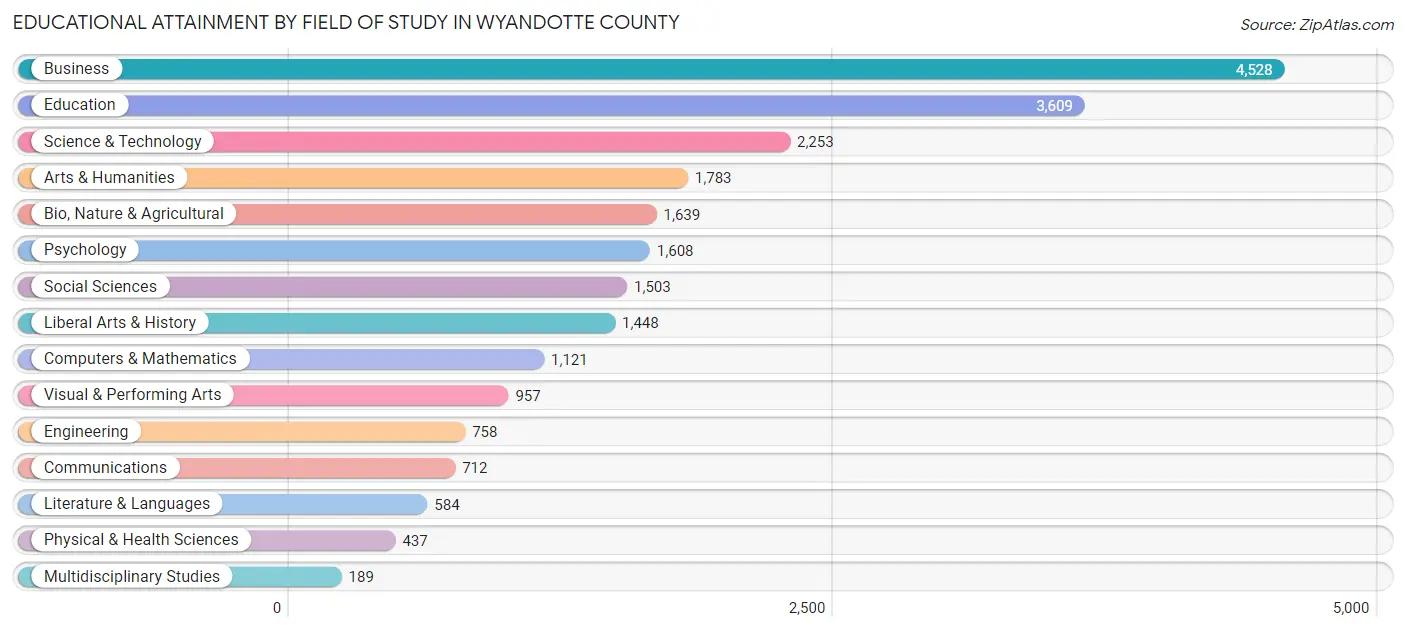
| Field of Study | # Graduates | % Graduates |
| Computers & Mathematics | 1,121 | 4.9% |
| Bio, Nature & Agricultural | 1,639 | 7.1% |
| Physical & Health Sciences | 437 | 1.9% |
| Psychology | 1,608 | 7.0% |
| Social Sciences | 1,503 | 6.5% |
| Engineering | 758 | 3.3% |
| Multidisciplinary Studies | 189 | 0.8% |
| Science & Technology | 2,253 | 9.7% |
| Business | 4,528 | 19.6% |
| Education | 3,609 | 15.6% |
| Literature & Languages | 584 | 2.5% |
| Liberal Arts & History | 1,448 | 6.3% |
| Visual & Performing Arts | 957 | 4.1% |
| Communications | 712 | 3.1% |
| Arts & Humanities | 1,783 | 7.7% |
| Total | 23,129 | 100.0% |
Transportation & Commute in Wyandotte County
Vehicle Availability by Sex in Wyandotte County
The most prevalent vehicle ownership categories in Wyandotte County are males with 2 vehicles (15,747, accounting for 37.8%) and females with 2 vehicles (12,935, making up 44.9%).
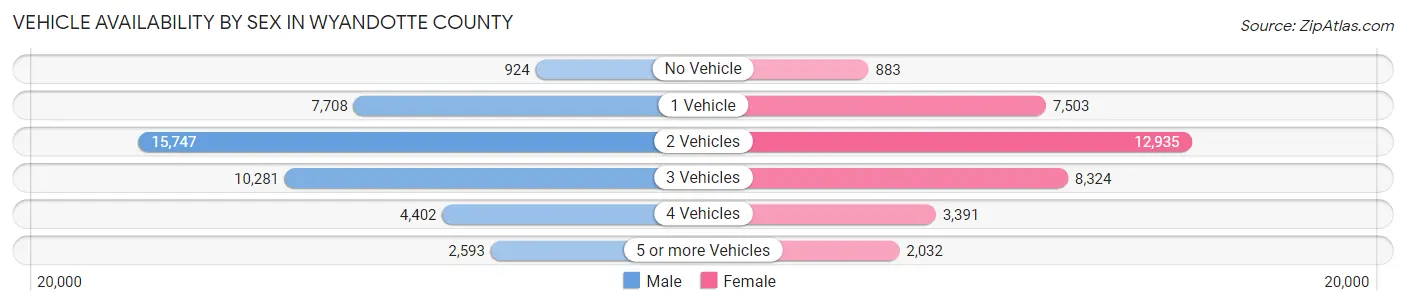
| Vehicles Available | Male | Female |
| No Vehicle | 924 (2.2%) | 883 (2.5%) |
| 1 Vehicle | 7,708 (18.5%) | 7,503 (21.4%) |
| 2 Vehicles | 15,747 (37.8%) | 12,935 (36.9%) |
| 3 Vehicles | 10,281 (24.7%) | 8,324 (23.7%) |
| 4 Vehicles | 4,402 (10.6%) | 3,391 (9.7%) |
| 5 or more Vehicles | 2,593 (6.2%) | 2,032 (5.8%) |
| Total | 41,655 (100.0%) | 35,068 (100.0%) |
Commute Time in Wyandotte County
The most frequently occuring commute durations in Wyandotte County are 15 to 19 minutes (15,062 commuters, 21.2%), 20 to 24 minutes (14,467 commuters, 20.3%), and 10 to 14 minutes (10,255 commuters, 14.4%).
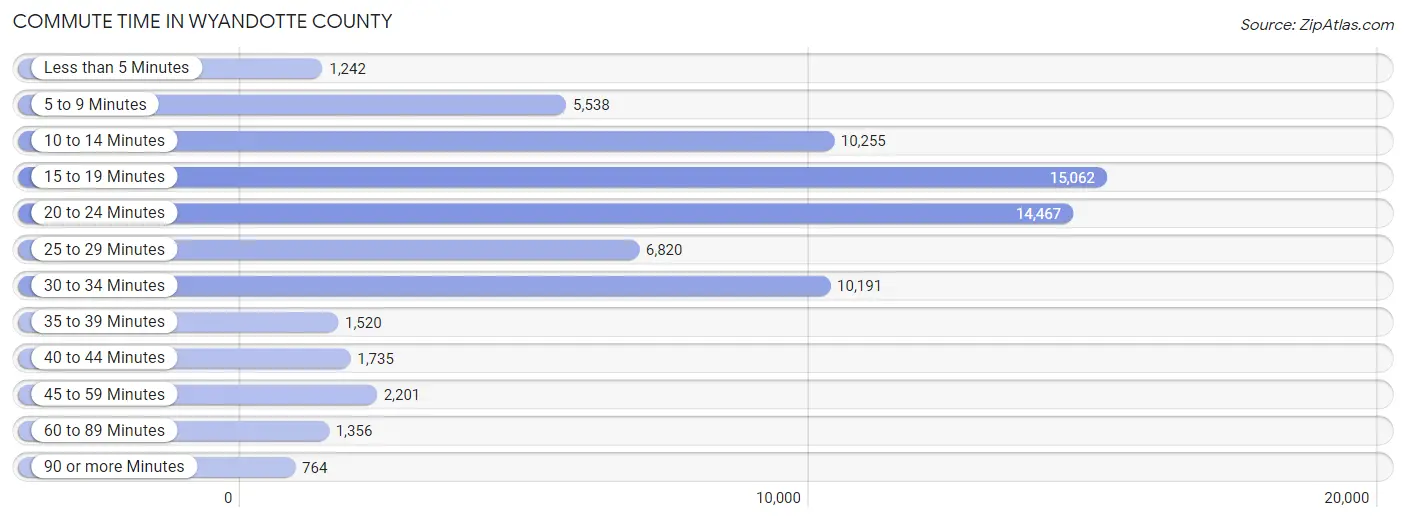
| Commute Time | # Commuters | % Commuters |
| Less than 5 Minutes | 1,242 | 1.8% |
| 5 to 9 Minutes | 5,538 | 7.8% |
| 10 to 14 Minutes | 10,255 | 14.4% |
| 15 to 19 Minutes | 15,062 | 21.2% |
| 20 to 24 Minutes | 14,467 | 20.3% |
| 25 to 29 Minutes | 6,820 | 9.6% |
| 30 to 34 Minutes | 10,191 | 14.3% |
| 35 to 39 Minutes | 1,520 | 2.1% |
| 40 to 44 Minutes | 1,735 | 2.4% |
| 45 to 59 Minutes | 2,201 | 3.1% |
| 60 to 89 Minutes | 1,356 | 1.9% |
| 90 or more Minutes | 764 | 1.1% |
Commute Time by Sex in Wyandotte County
The most common commute times in Wyandotte County are 15 to 19 minutes (8,786 commuters, 22.2%) for males and 20 to 24 minutes (6,878 commuters, 21.7%) for females.
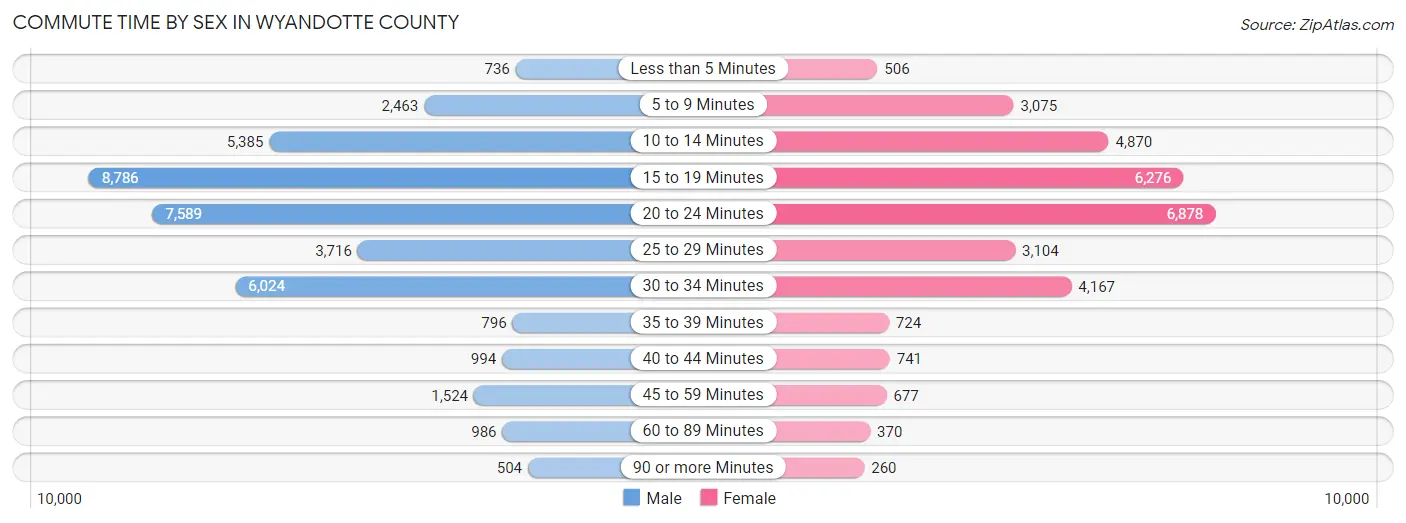
| Commute Time | Male | Female |
| Less than 5 Minutes | 736 (1.9%) | 506 (1.6%) |
| 5 to 9 Minutes | 2,463 (6.2%) | 3,075 (9.7%) |
| 10 to 14 Minutes | 5,385 (13.6%) | 4,870 (15.4%) |
| 15 to 19 Minutes | 8,786 (22.2%) | 6,276 (19.8%) |
| 20 to 24 Minutes | 7,589 (19.2%) | 6,878 (21.7%) |
| 25 to 29 Minutes | 3,716 (9.4%) | 3,104 (9.8%) |
| 30 to 34 Minutes | 6,024 (15.2%) | 4,167 (13.2%) |
| 35 to 39 Minutes | 796 (2.0%) | 724 (2.3%) |
| 40 to 44 Minutes | 994 (2.5%) | 741 (2.3%) |
| 45 to 59 Minutes | 1,524 (3.9%) | 677 (2.1%) |
| 60 to 89 Minutes | 986 (2.5%) | 370 (1.2%) |
| 90 or more Minutes | 504 (1.3%) | 260 (0.8%) |
Time of Departure to Work by Sex in Wyandotte County
The most frequent times of departure to work in Wyandotte County are 7:00 AM to 7:29 AM (5,332, 13.5%) for males and 7:00 AM to 7:29 AM (3,910, 12.3%) for females.
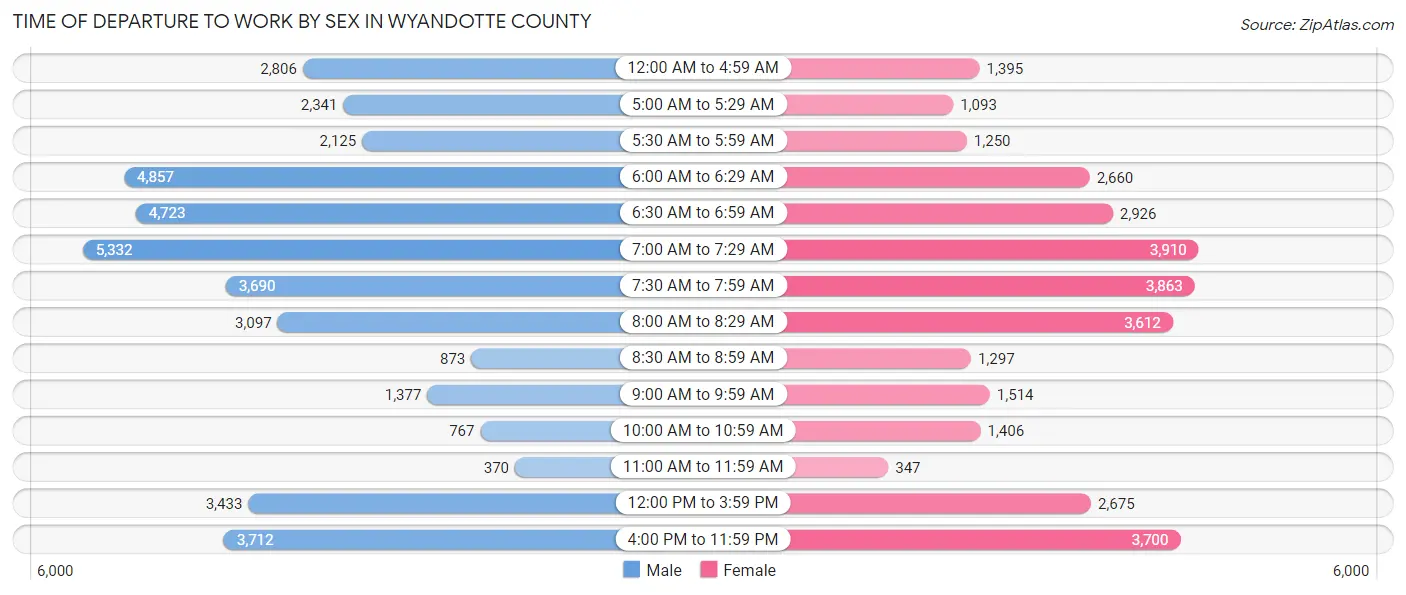
| Time of Departure | Male | Female |
| 12:00 AM to 4:59 AM | 2,806 (7.1%) | 1,395 (4.4%) |
| 5:00 AM to 5:29 AM | 2,341 (5.9%) | 1,093 (3.5%) |
| 5:30 AM to 5:59 AM | 2,125 (5.4%) | 1,250 (4.0%) |
| 6:00 AM to 6:29 AM | 4,857 (12.3%) | 2,660 (8.4%) |
| 6:30 AM to 6:59 AM | 4,723 (12.0%) | 2,926 (9.2%) |
| 7:00 AM to 7:29 AM | 5,332 (13.5%) | 3,910 (12.3%) |
| 7:30 AM to 7:59 AM | 3,690 (9.3%) | 3,863 (12.2%) |
| 8:00 AM to 8:29 AM | 3,097 (7.8%) | 3,612 (11.4%) |
| 8:30 AM to 8:59 AM | 873 (2.2%) | 1,297 (4.1%) |
| 9:00 AM to 9:59 AM | 1,377 (3.5%) | 1,514 (4.8%) |
| 10:00 AM to 10:59 AM | 767 (1.9%) | 1,406 (4.4%) |
| 11:00 AM to 11:59 AM | 370 (0.9%) | 347 (1.1%) |
| 12:00 PM to 3:59 PM | 3,433 (8.7%) | 2,675 (8.5%) |
| 4:00 PM to 11:59 PM | 3,712 (9.4%) | 3,700 (11.7%) |
| Total | 39,503 (100.0%) | 31,648 (100.0%) |
Housing Occupancy in Wyandotte County
Occupancy by Ownership in Wyandotte County
Of the total 61,282 dwellings in Wyandotte County, owner-occupied units account for 37,097 (60.5%), while renter-occupied units make up 24,185 (39.5%).
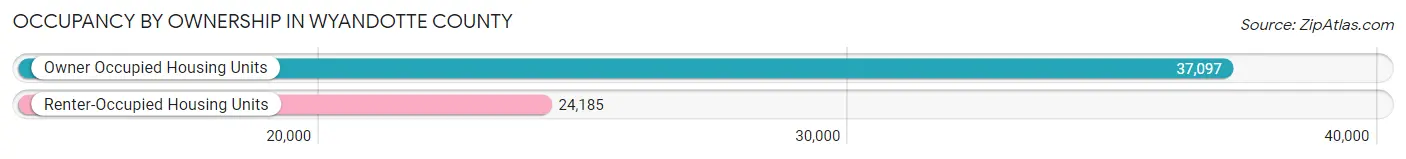
| Occupancy | # Housing Units | % Housing Units |
| Owner Occupied Housing Units | 37,097 | 60.5% |
| Renter-Occupied Housing Units | 24,185 | 39.5% |
| Total Occupied Housing Units | 61,282 | 100.0% |
Occupancy by Household Size in Wyandotte County
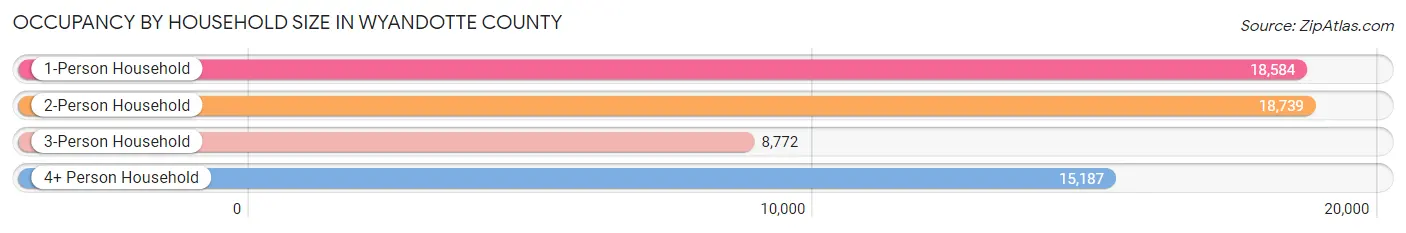
| Household Size | # Housing Units | % Housing Units |
| 1-Person Household | 18,584 | 30.3% |
| 2-Person Household | 18,739 | 30.6% |
| 3-Person Household | 8,772 | 14.3% |
| 4+ Person Household | 15,187 | 24.8% |
| Total Housing Units | 61,282 | 100.0% |
Occupancy by Ownership by Household Size in Wyandotte County
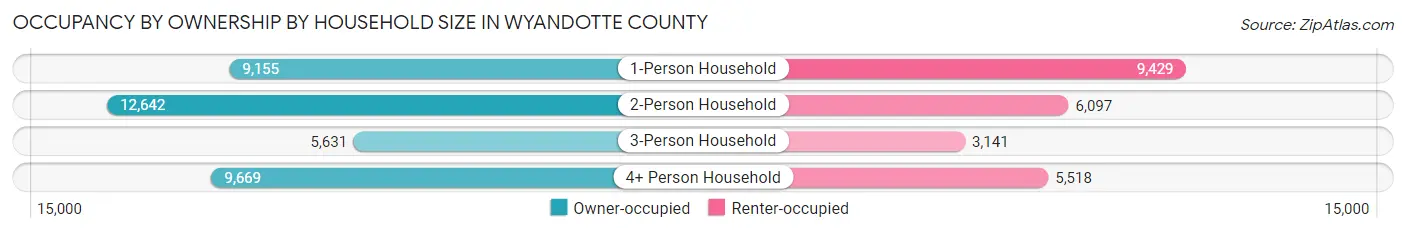
| Household Size | Owner-occupied | Renter-occupied |
| 1-Person Household | 9,155 (49.3%) | 9,429 (50.7%) |
| 2-Person Household | 12,642 (67.5%) | 6,097 (32.5%) |
| 3-Person Household | 5,631 (64.2%) | 3,141 (35.8%) |
| 4+ Person Household | 9,669 (63.7%) | 5,518 (36.3%) |
| Total Housing Units | 37,097 (60.5%) | 24,185 (39.5%) |
Occupancy by Educational Attainment in Wyandotte County
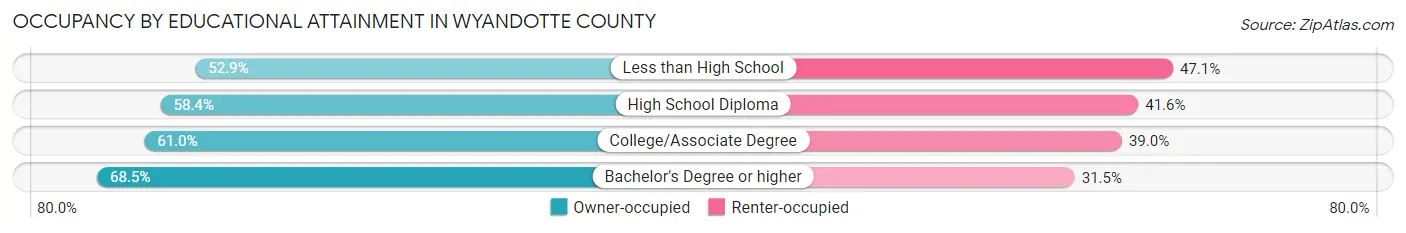
| Household Size | Owner-occupied | Renter-occupied |
| Less than High School | 5,268 (52.9%) | 4,688 (47.1%) |
| High School Diploma | 11,175 (58.4%) | 7,954 (41.6%) |
| College/Associate Degree | 11,394 (61.0%) | 7,282 (39.0%) |
| Bachelor's Degree or higher | 9,260 (68.5%) | 4,261 (31.5%) |
Occupancy by Age of Householder in Wyandotte County
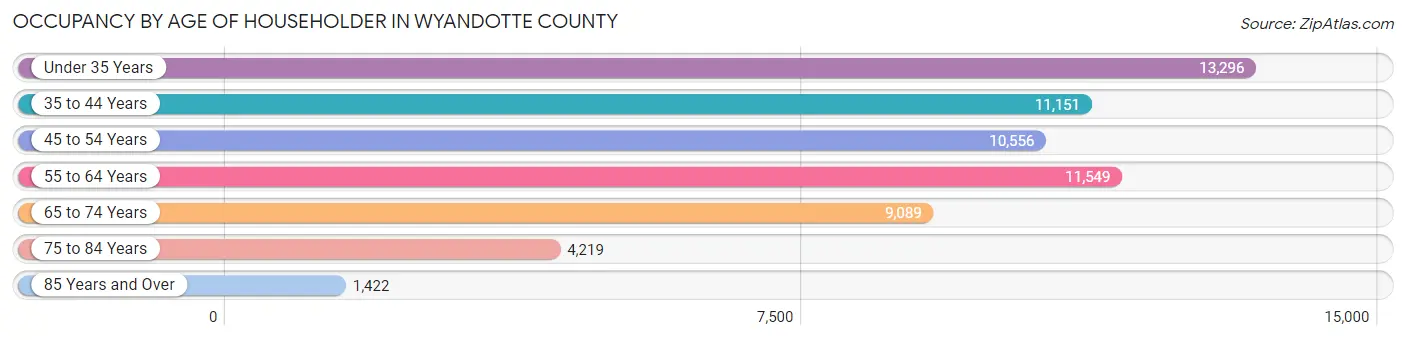
| Age Bracket | # Households | % Households |
| Under 35 Years | 13,296 | 21.7% |
| 35 to 44 Years | 11,151 | 18.2% |
| 45 to 54 Years | 10,556 | 17.2% |
| 55 to 64 Years | 11,549 | 18.9% |
| 65 to 74 Years | 9,089 | 14.8% |
| 75 to 84 Years | 4,219 | 6.9% |
| 85 Years and Over | 1,422 | 2.3% |
| Total | 61,282 | 100.0% |
Housing Finances in Wyandotte County
Median Income by Occupancy in Wyandotte County
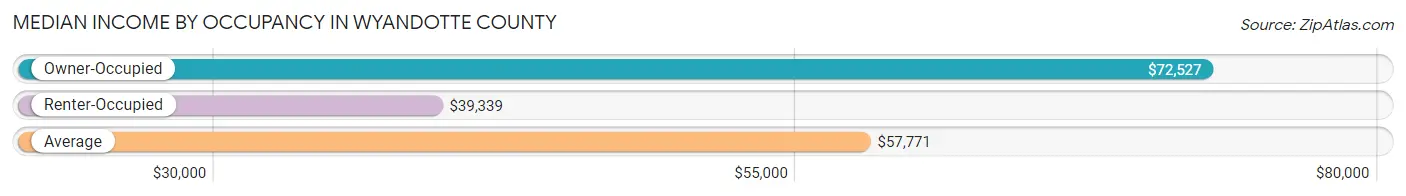
| Occupancy Type | # Households | Median Income |
| Owner-Occupied | 37,097 (60.5%) | $72,527 |
| Renter-Occupied | 24,185 (39.5%) | $39,339 |
| Average | 61,282 (100.0%) | $57,771 |
Occupancy by Householder Income Bracket in Wyandotte County
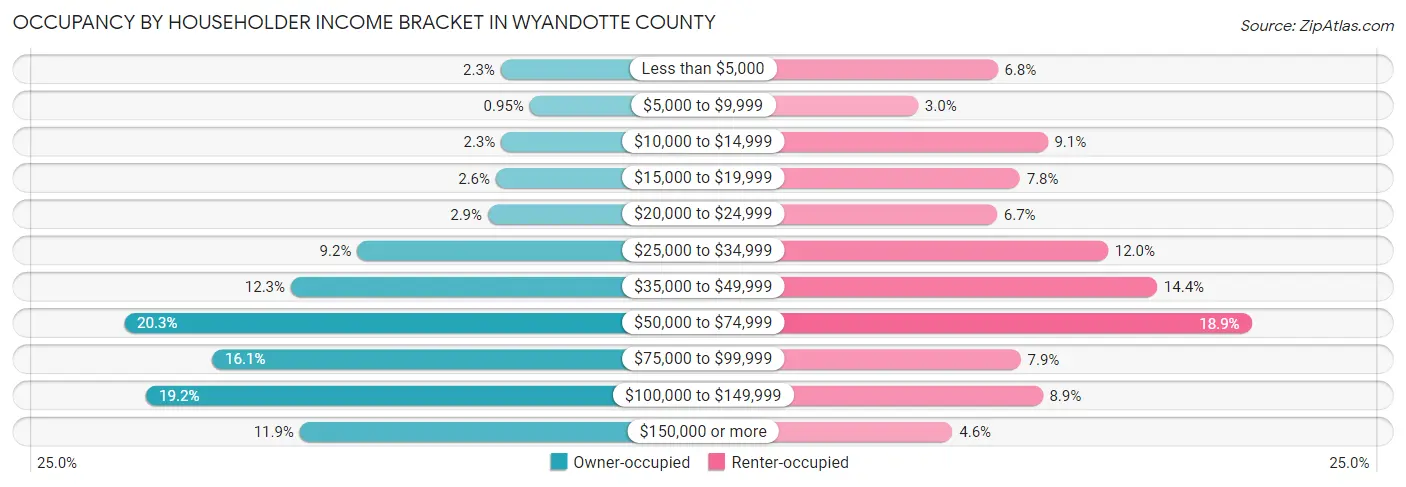
| Income Bracket | Owner-occupied | Renter-occupied |
| Less than $5,000 | 864 (2.3%) | 1,634 (6.8%) |
| $5,000 to $9,999 | 354 (0.9%) | 719 (3.0%) |
| $10,000 to $14,999 | 857 (2.3%) | 2,211 (9.1%) |
| $15,000 to $19,999 | 951 (2.6%) | 1,891 (7.8%) |
| $20,000 to $24,999 | 1,089 (2.9%) | 1,628 (6.7%) |
| $25,000 to $34,999 | 3,397 (9.2%) | 2,905 (12.0%) |
| $35,000 to $49,999 | 4,572 (12.3%) | 3,470 (14.3%) |
| $50,000 to $74,999 | 7,514 (20.3%) | 4,558 (18.9%) |
| $75,000 to $99,999 | 5,960 (16.1%) | 1,902 (7.9%) |
| $100,000 to $149,999 | 7,125 (19.2%) | 2,152 (8.9%) |
| $150,000 or more | 4,414 (11.9%) | 1,115 (4.6%) |
| Total | 37,097 (100.0%) | 24,185 (100.0%) |
Monthly Housing Cost Tiers in Wyandotte County
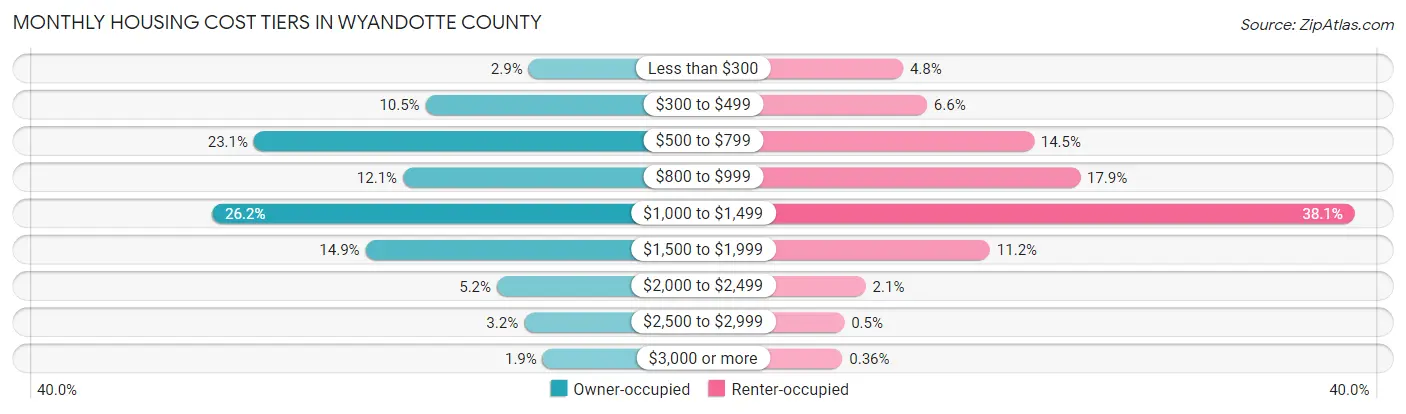
| Monthly Cost | Owner-occupied | Renter-occupied |
| Less than $300 | 1,073 (2.9%) | 1,169 (4.8%) |
| $300 to $499 | 3,889 (10.5%) | 1,595 (6.6%) |
| $500 to $799 | 8,575 (23.1%) | 3,496 (14.5%) |
| $800 to $999 | 4,502 (12.1%) | 4,321 (17.9%) |
| $1,000 to $1,499 | 9,714 (26.2%) | 9,213 (38.1%) |
| $1,500 to $1,999 | 5,526 (14.9%) | 2,717 (11.2%) |
| $2,000 to $2,499 | 1,937 (5.2%) | 503 (2.1%) |
| $2,500 to $2,999 | 1,195 (3.2%) | 120 (0.5%) |
| $3,000 or more | 686 (1.8%) | 87 (0.4%) |
| Total | 37,097 (100.0%) | 24,185 (100.0%) |
Physical Housing Characteristics in Wyandotte County
Housing Structures in Wyandotte County
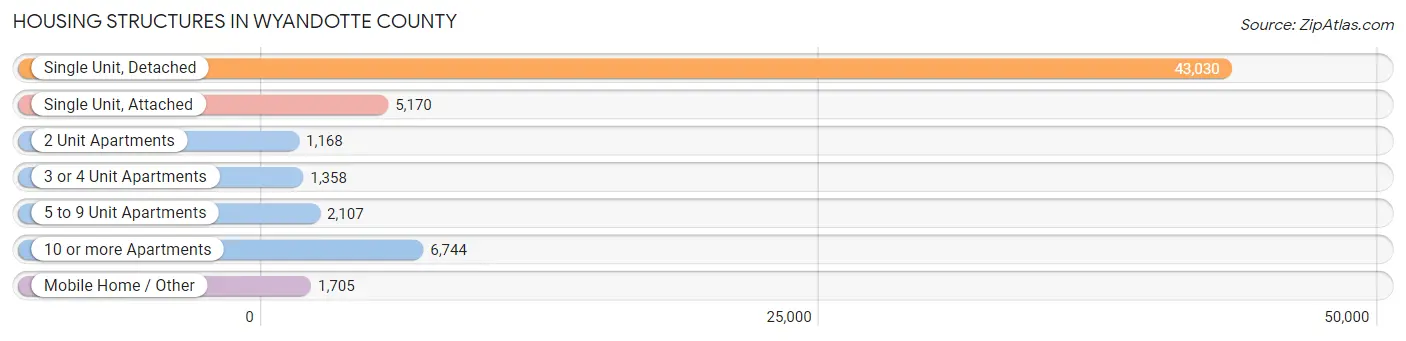
| Structure Type | # Housing Units | % Housing Units |
| Single Unit, Detached | 43,030 | 70.2% |
| Single Unit, Attached | 5,170 | 8.4% |
| 2 Unit Apartments | 1,168 | 1.9% |
| 3 or 4 Unit Apartments | 1,358 | 2.2% |
| 5 to 9 Unit Apartments | 2,107 | 3.4% |
| 10 or more Apartments | 6,744 | 11.0% |
| Mobile Home / Other | 1,705 | 2.8% |
| Total | 61,282 | 100.0% |
Housing Structures by Occupancy in Wyandotte County
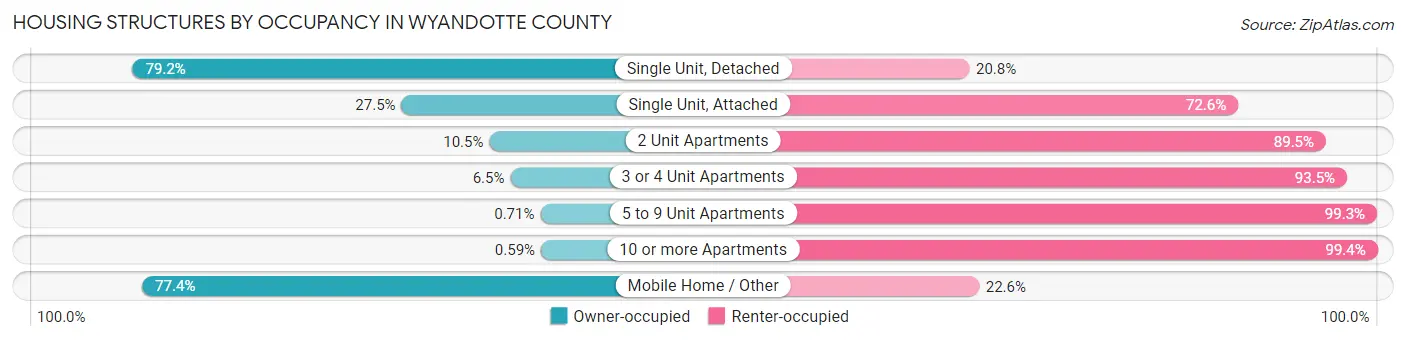
| Structure Type | Owner-occupied | Renter-occupied |
| Single Unit, Detached | 34,093 (79.2%) | 8,937 (20.8%) |
| Single Unit, Attached | 1,419 (27.5%) | 3,751 (72.6%) |
| 2 Unit Apartments | 123 (10.5%) | 1,045 (89.5%) |
| 3 or 4 Unit Apartments | 88 (6.5%) | 1,270 (93.5%) |
| 5 to 9 Unit Apartments | 15 (0.7%) | 2,092 (99.3%) |
| 10 or more Apartments | 40 (0.6%) | 6,704 (99.4%) |
| Mobile Home / Other | 1,319 (77.4%) | 386 (22.6%) |
| Total | 37,097 (60.5%) | 24,185 (39.5%) |
Housing Structures by Number of Rooms in Wyandotte County
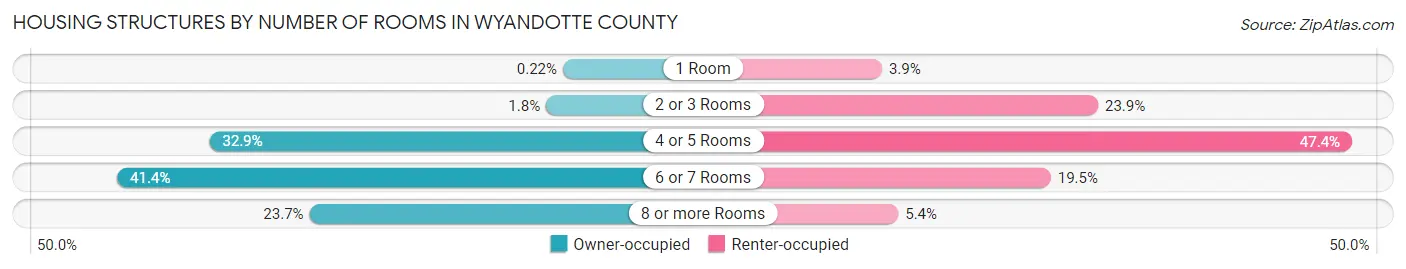
| Number of Rooms | Owner-occupied | Renter-occupied |
| 1 Room | 81 (0.2%) | 941 (3.9%) |
| 2 or 3 Rooms | 659 (1.8%) | 5,772 (23.9%) |
| 4 or 5 Rooms | 12,207 (32.9%) | 11,452 (47.3%) |
| 6 or 7 Rooms | 15,374 (41.4%) | 4,715 (19.5%) |
| 8 or more Rooms | 8,776 (23.7%) | 1,305 (5.4%) |
| Total | 37,097 (100.0%) | 24,185 (100.0%) |
Housing Structure by Heating Type in Wyandotte County
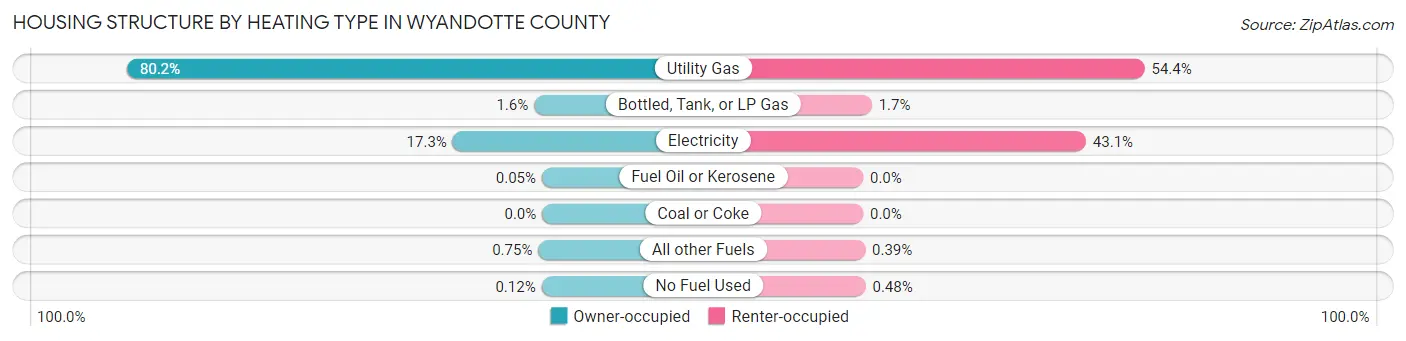
| Heating Type | Owner-occupied | Renter-occupied |
| Utility Gas | 29,763 (80.2%) | 13,156 (54.4%) |
| Bottled, Tank, or LP Gas | 579 (1.6%) | 405 (1.7%) |
| Electricity | 6,411 (17.3%) | 10,414 (43.1%) |
| Fuel Oil or Kerosene | 19 (0.1%) | 0 (0.0%) |
| Coal or Coke | 0 (0.0%) | 0 (0.0%) |
| All other Fuels | 279 (0.7%) | 95 (0.4%) |
| No Fuel Used | 46 (0.1%) | 115 (0.5%) |
| Total | 37,097 (100.0%) | 24,185 (100.0%) |
Household Vehicle Usage in Wyandotte County
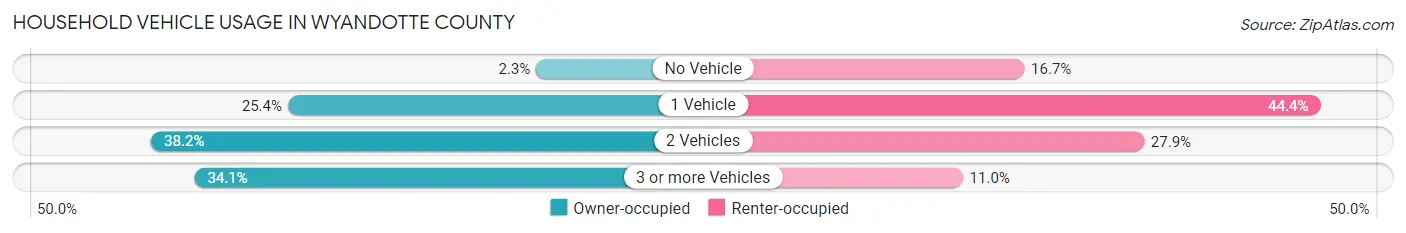
| Vehicles per Household | Owner-occupied | Renter-occupied |
| No Vehicle | 833 (2.2%) | 4,045 (16.7%) |
| 1 Vehicle | 9,433 (25.4%) | 10,733 (44.4%) |
| 2 Vehicles | 14,166 (38.2%) | 6,749 (27.9%) |
| 3 or more Vehicles | 12,665 (34.1%) | 2,658 (11.0%) |
| Total | 37,097 (100.0%) | 24,185 (100.0%) |
Real Estate & Mortgages in Wyandotte County
Real Estate and Mortgage Overview in Wyandotte County
| Characteristic | Without Mortgage | With Mortgage |
| Housing Units | 16,212 | 20,885 |
| Median Property Value | $107,400 | $160,000 |
| Median Household Income | $57,424 | $3,361 |
| Monthly Housing Costs | $604 | $680 |
| Real Estate Taxes | $1,791 | $569 |
Property Value by Mortgage Status in Wyandotte County
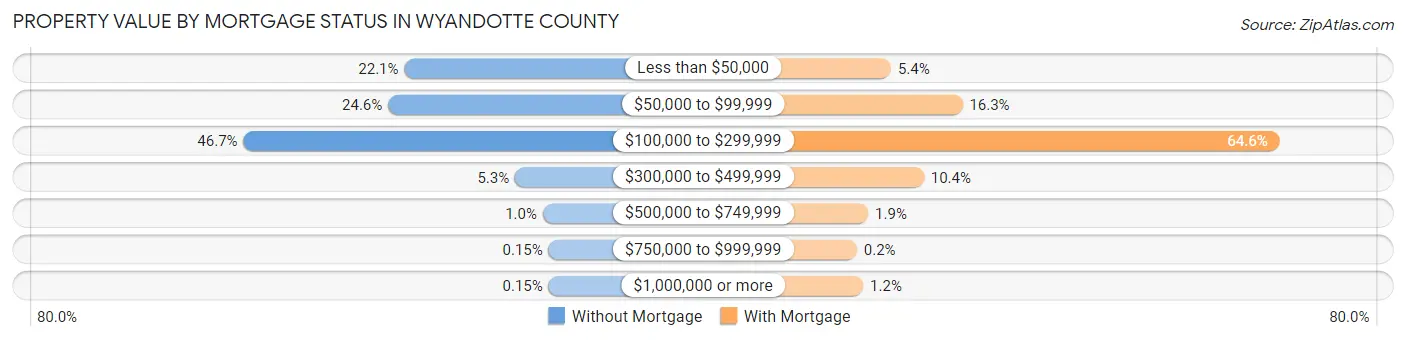
| Property Value | Without Mortgage | With Mortgage |
| Less than $50,000 | 3,588 (22.1%) | 1,127 (5.4%) |
| $50,000 to $99,999 | 3,989 (24.6%) | 3,403 (16.3%) |
| $100,000 to $299,999 | 7,564 (46.7%) | 13,495 (64.6%) |
| $300,000 to $499,999 | 854 (5.3%) | 2,173 (10.4%) |
| $500,000 to $749,999 | 169 (1.0%) | 402 (1.9%) |
| $750,000 to $999,999 | 24 (0.2%) | 42 (0.2%) |
| $1,000,000 or more | 24 (0.2%) | 243 (1.2%) |
| Total | 16,212 (100.0%) | 20,885 (100.0%) |
Household Income by Mortgage Status in Wyandotte County
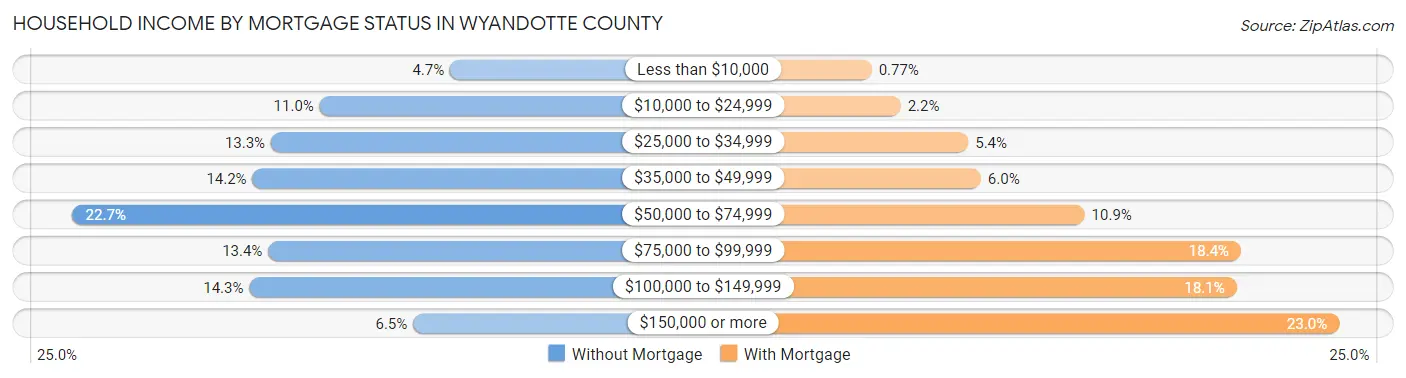
| Household Income | Without Mortgage | With Mortgage |
| Less than $10,000 | 768 (4.7%) | 161 (0.8%) |
| $10,000 to $24,999 | 1,775 (11.0%) | 450 (2.1%) |
| $25,000 to $34,999 | 2,151 (13.3%) | 1,122 (5.4%) |
| $35,000 to $49,999 | 2,294 (14.1%) | 1,246 (6.0%) |
| $50,000 to $74,999 | 3,681 (22.7%) | 2,278 (10.9%) |
| $75,000 to $99,999 | 2,172 (13.4%) | 3,833 (18.3%) |
| $100,000 to $149,999 | 2,318 (14.3%) | 3,788 (18.1%) |
| $150,000 or more | 1,053 (6.5%) | 4,807 (23.0%) |
| Total | 16,212 (100.0%) | 20,885 (100.0%) |
Property Value to Household Income Ratio in Wyandotte County
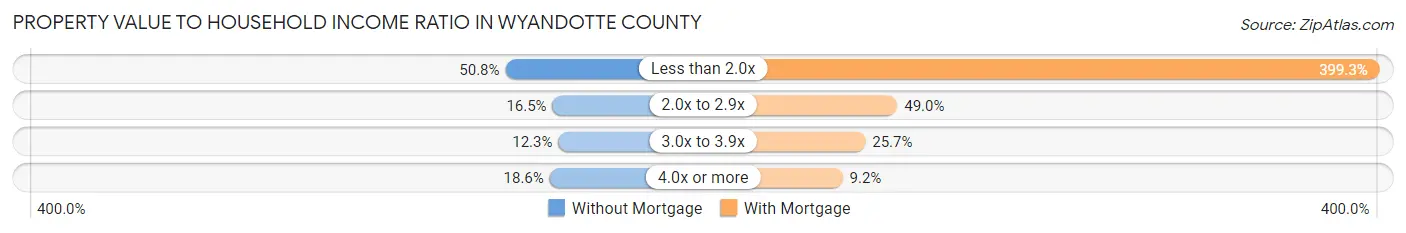
| Value-to-Income Ratio | Without Mortgage | With Mortgage |
| Less than 2.0x | 8,228 (50.7%) | 83,403 (399.3%) |
| 2.0x to 2.9x | 2,682 (16.5%) | 10,223 (48.9%) |
| 3.0x to 3.9x | 1,995 (12.3%) | 5,368 (25.7%) |
| 4.0x or more | 3,018 (18.6%) | 1,926 (9.2%) |
| Total | 16,212 (100.0%) | 20,885 (100.0%) |
Real Estate Taxes by Mortgage Status in Wyandotte County
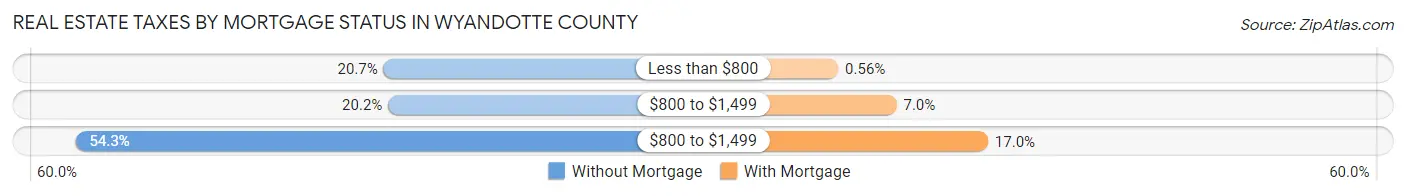
| Property Taxes | Without Mortgage | With Mortgage |
| Less than $800 | 3,349 (20.7%) | 118 (0.6%) |
| $800 to $1,499 | 3,268 (20.2%) | 1,454 (7.0%) |
| $800 to $1,499 | 8,807 (54.3%) | 3,545 (17.0%) |
| Total | 16,212 (100.0%) | 20,885 (100.0%) |
Health & Disability in Wyandotte County
Health Insurance Coverage by Age in Wyandotte County
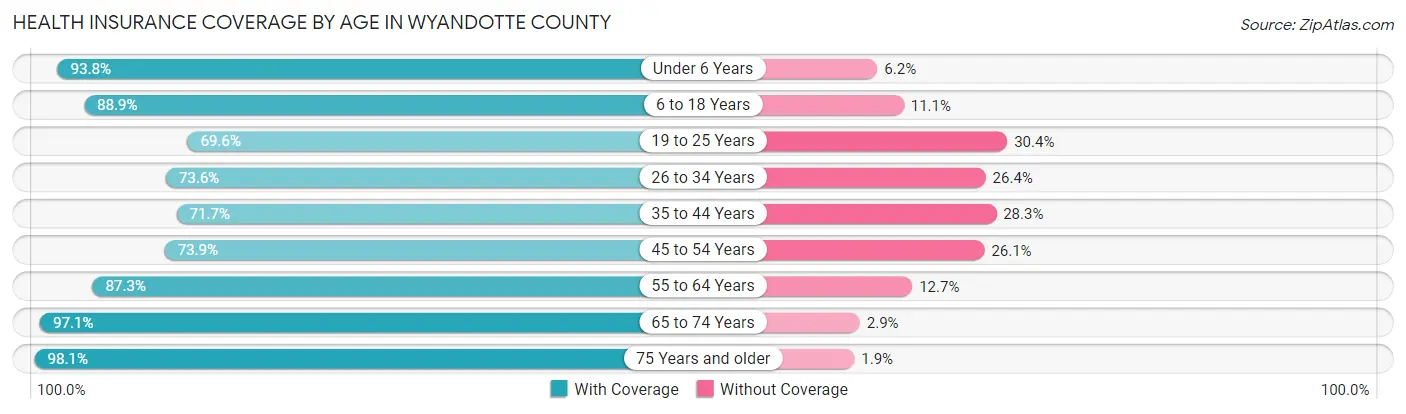
| Age Bracket | With Coverage | Without Coverage |
| Under 6 Years | 13,875 (93.8%) | 912 (6.2%) |
| 6 to 18 Years | 29,504 (88.9%) | 3,684 (11.1%) |
| 19 to 25 Years | 11,025 (69.6%) | 4,812 (30.4%) |
| 26 to 34 Years | 15,586 (73.6%) | 5,579 (26.4%) |
| 35 to 44 Years | 15,678 (71.7%) | 6,197 (28.3%) |
| 45 to 54 Years | 13,962 (73.9%) | 4,942 (26.1%) |
| 55 to 64 Years | 16,885 (87.3%) | 2,450 (12.7%) |
| 65 to 74 Years | 12,996 (97.1%) | 388 (2.9%) |
| 75 Years and older | 7,998 (98.1%) | 152 (1.9%) |
| Total | 137,509 (82.5%) | 29,116 (17.5%) |
Health Insurance Coverage by Citizenship Status in Wyandotte County
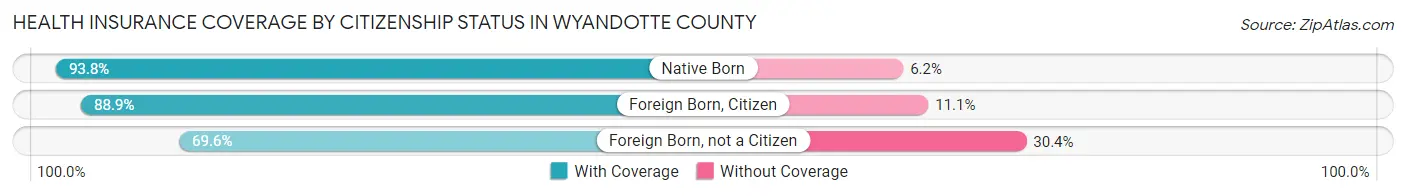
| Citizenship Status | With Coverage | Without Coverage |
| Native Born | 13,875 (93.8%) | 912 (6.2%) |
| Foreign Born, Citizen | 29,504 (88.9%) | 3,684 (11.1%) |
| Foreign Born, not a Citizen | 11,025 (69.6%) | 4,812 (30.4%) |
Health Insurance Coverage by Household Income in Wyandotte County
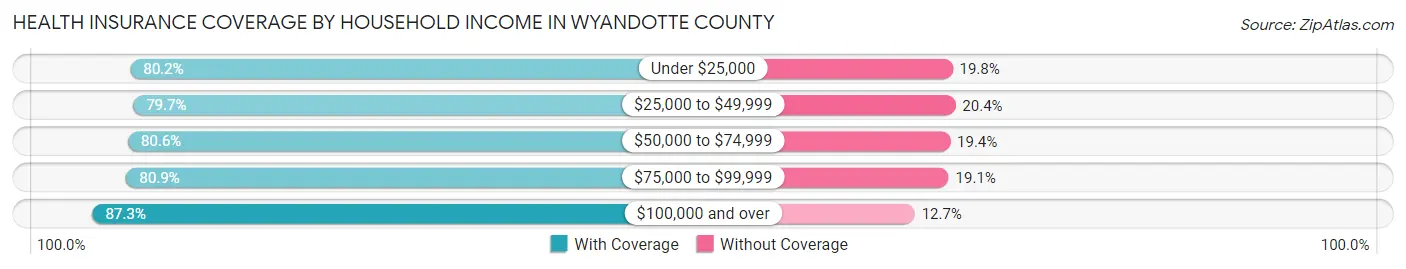
| Household Income | With Coverage | Without Coverage |
| Under $25,000 | 18,344 (80.2%) | 4,531 (19.8%) |
| $25,000 to $49,999 | 26,686 (79.6%) | 6,818 (20.3%) |
| $50,000 to $74,999 | 26,646 (80.6%) | 6,398 (19.4%) |
| $75,000 to $99,999 | 20,122 (80.9%) | 4,745 (19.1%) |
| $100,000 and over | 45,326 (87.3%) | 6,607 (12.7%) |
Public vs Private Health Insurance Coverage by Age in Wyandotte County
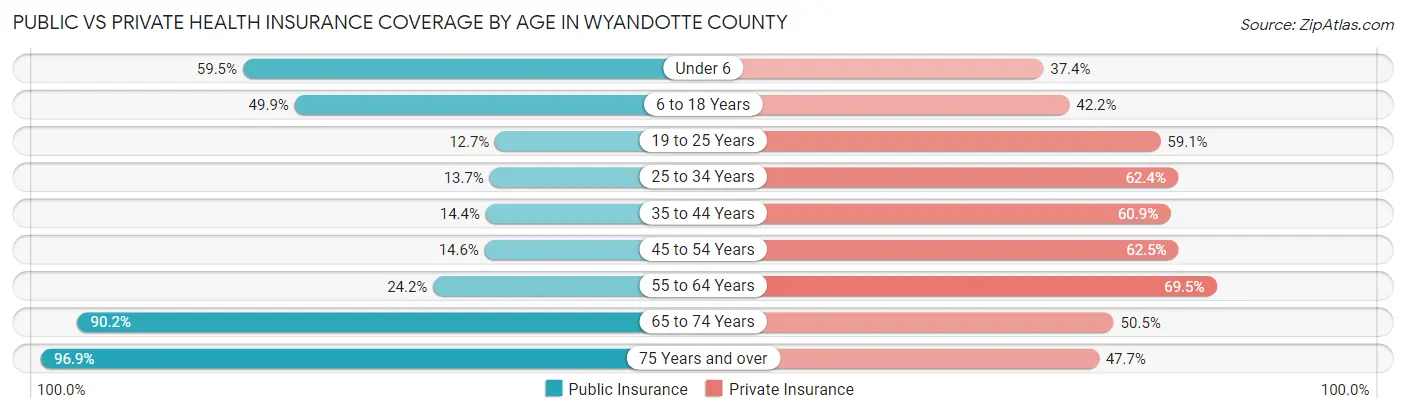
| Age Bracket | Public Insurance | Private Insurance |
| Under 6 | 8,797 (59.5%) | 5,530 (37.4%) |
| 6 to 18 Years | 16,551 (49.9%) | 14,017 (42.2%) |
| 19 to 25 Years | 2,004 (12.7%) | 9,366 (59.1%) |
| 25 to 34 Years | 2,894 (13.7%) | 13,197 (62.4%) |
| 35 to 44 Years | 3,147 (14.4%) | 13,324 (60.9%) |
| 45 to 54 Years | 2,760 (14.6%) | 11,811 (62.5%) |
| 55 to 64 Years | 4,671 (24.2%) | 13,442 (69.5%) |
| 65 to 74 Years | 12,066 (90.1%) | 6,754 (50.5%) |
| 75 Years and over | 7,901 (96.9%) | 3,886 (47.7%) |
| Total | 60,791 (36.5%) | 91,327 (54.8%) |
Disability Status by Sex by Age in Wyandotte County
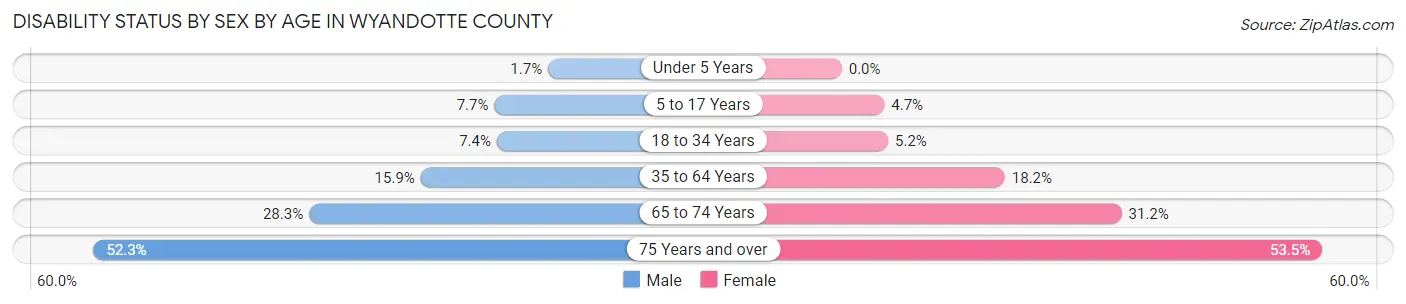
| Age Bracket | Male | Female |
| Under 5 Years | 111 (1.7%) | 0 (0.0%) |
| 5 to 17 Years | 1,313 (7.7%) | 766 (4.7%) |
| 18 to 34 Years | 1,466 (7.4%) | 1,004 (5.2%) |
| 35 to 64 Years | 4,872 (15.9%) | 5,351 (18.2%) |
| 65 to 74 Years | 1,801 (28.3%) | 2,189 (31.2%) |
| 75 Years and over | 1,681 (52.3%) | 2,641 (53.5%) |
Disability Class by Sex by Age in Wyandotte County
Disability Class: Hearing Difficulty
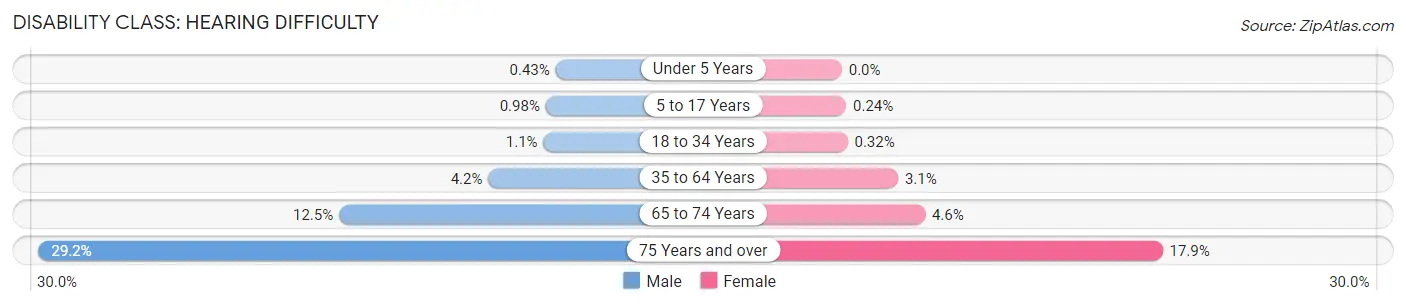
| Age Bracket | Male | Female |
| Under 5 Years | 28 (0.4%) | 0 (0.0%) |
| 5 to 17 Years | 167 (1.0%) | 38 (0.2%) |
| 18 to 34 Years | 219 (1.1%) | 62 (0.3%) |
| 35 to 64 Years | 1,281 (4.2%) | 923 (3.1%) |
| 65 to 74 Years | 794 (12.5%) | 325 (4.6%) |
| 75 Years and over | 939 (29.2%) | 882 (17.9%) |
Disability Class: Vision Difficulty
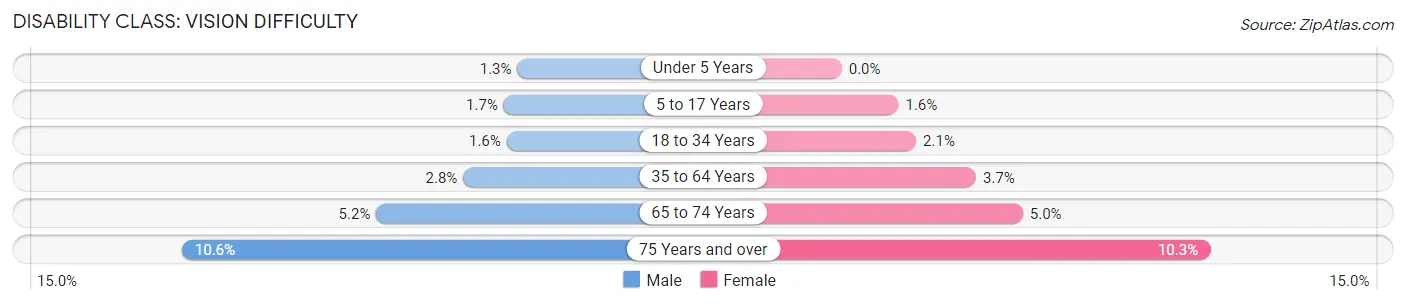
| Age Bracket | Male | Female |
| Under 5 Years | 83 (1.3%) | 0 (0.0%) |
| 5 to 17 Years | 284 (1.7%) | 255 (1.6%) |
| 18 to 34 Years | 312 (1.6%) | 403 (2.1%) |
| 35 to 64 Years | 855 (2.8%) | 1,103 (3.7%) |
| 65 to 74 Years | 331 (5.2%) | 354 (5.0%) |
| 75 Years and over | 341 (10.6%) | 506 (10.2%) |
Disability Class: Cognitive Difficulty
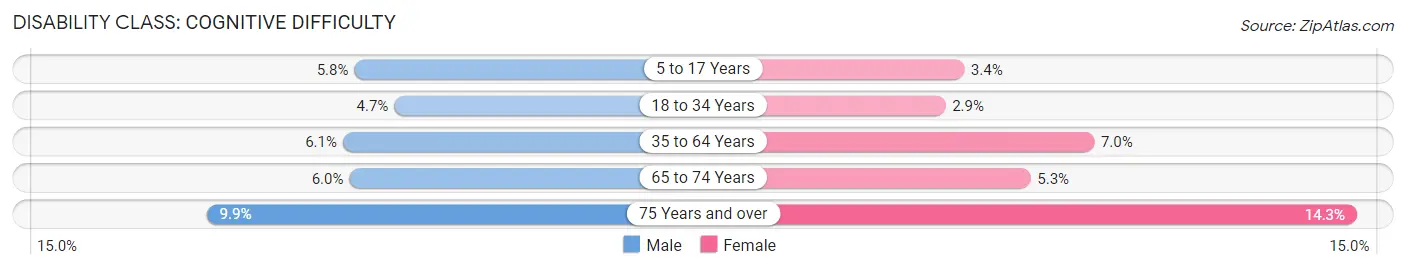
| Age Bracket | Male | Female |
| 5 to 17 Years | 994 (5.8%) | 549 (3.4%) |
| 18 to 34 Years | 933 (4.7%) | 560 (2.9%) |
| 35 to 64 Years | 1,883 (6.1%) | 2,069 (7.0%) |
| 65 to 74 Years | 379 (6.0%) | 369 (5.2%) |
| 75 Years and over | 319 (9.9%) | 708 (14.3%) |
Disability Class: Ambulatory Difficulty
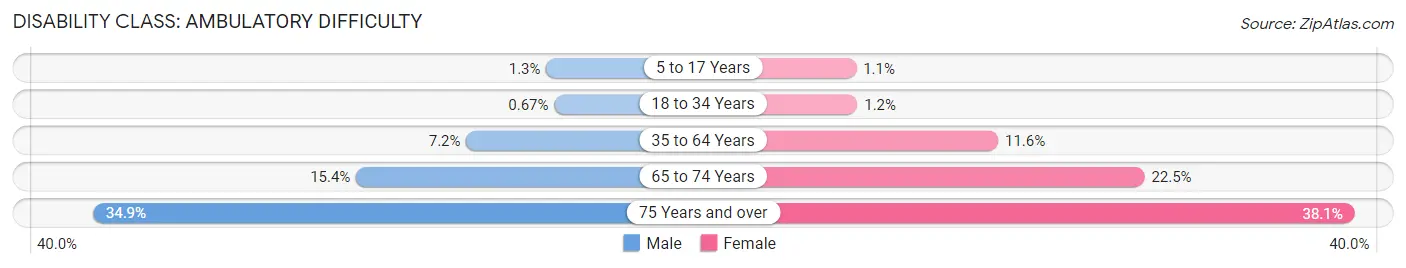
| Age Bracket | Male | Female |
| 5 to 17 Years | 215 (1.3%) | 172 (1.1%) |
| 18 to 34 Years | 133 (0.7%) | 224 (1.1%) |
| 35 to 64 Years | 2,206 (7.2%) | 3,416 (11.6%) |
| 65 to 74 Years | 978 (15.4%) | 1,579 (22.5%) |
| 75 Years and over | 1,122 (34.9%) | 1,880 (38.1%) |
Disability Class: Self-Care Difficulty
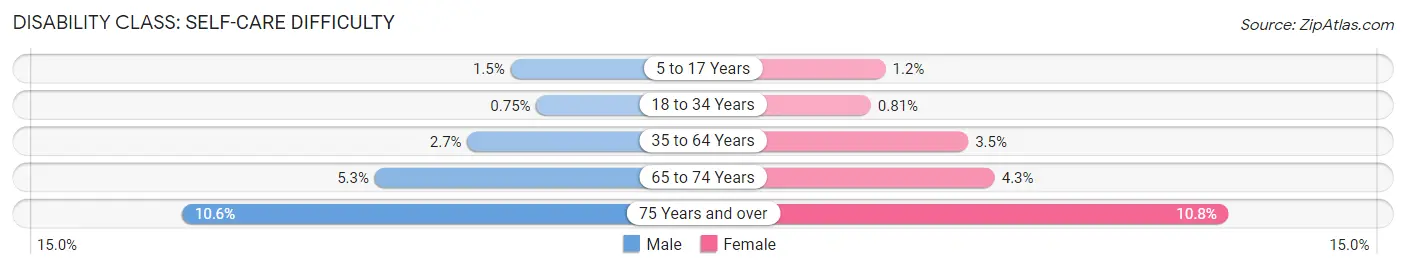
| Age Bracket | Male | Female |
| 5 to 17 Years | 251 (1.5%) | 197 (1.2%) |
| 18 to 34 Years | 149 (0.7%) | 157 (0.8%) |
| 35 to 64 Years | 818 (2.7%) | 1,037 (3.5%) |
| 65 to 74 Years | 334 (5.2%) | 299 (4.3%) |
| 75 Years and over | 341 (10.6%) | 532 (10.8%) |
Technology Access in Wyandotte County
Computing Device Access in Wyandotte County
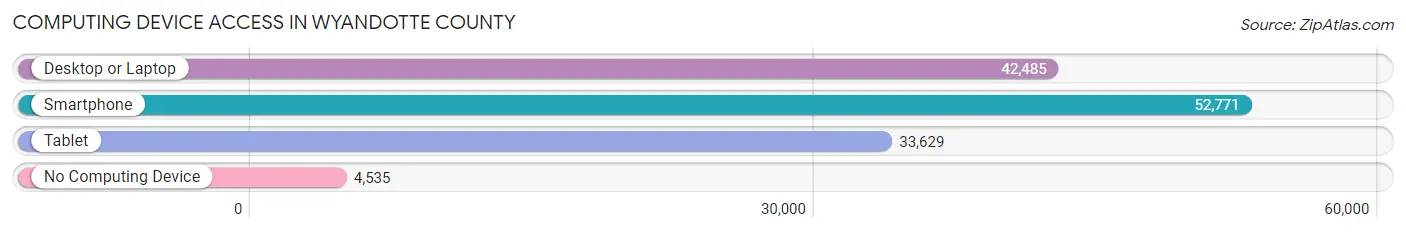
| Device Type | # Households | % Households |
| Desktop or Laptop | 42,485 | 69.3% |
| Smartphone | 52,771 | 86.1% |
| Tablet | 33,629 | 54.9% |
| No Computing Device | 4,535 | 7.4% |
| Total | 61,282 | 100.0% |
Internet Access in Wyandotte County
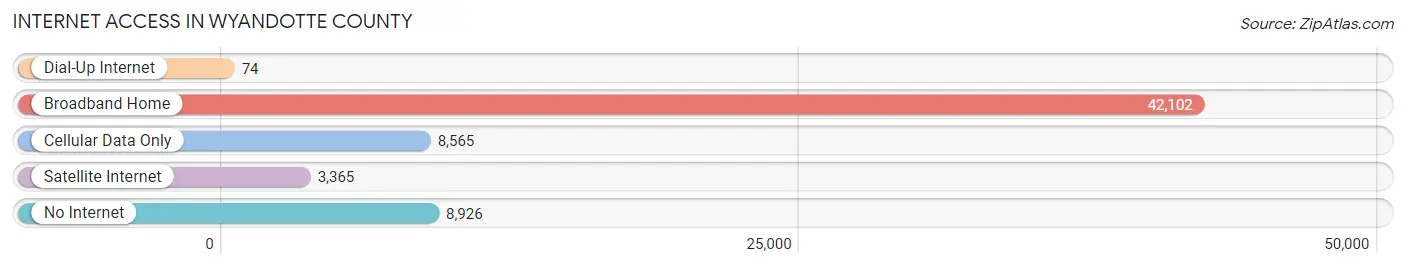
| Internet Type | # Households | % Households |
| Dial-Up Internet | 74 | 0.1% |
| Broadband Home | 42,102 | 68.7% |
| Cellular Data Only | 8,565 | 14.0% |
| Satellite Internet | 3,365 | 5.5% |
| No Internet | 8,926 | 14.6% |
| Total | 61,282 | 100.0% |
Wyandotte County Summary
Wyandotte County is located in the northeastern corner of the state of Kansas, and is part of the Kansas City metropolitan area. It is bordered by Johnson County, Kansas to the north, Leavenworth County to the east, and Missouri to the south and west. The county seat is Kansas City, and the county has a population of 159,637 as of the 2020 census.
History
Wyandotte County was established in 1859, and was named after the Wyandot Indians, who had inhabited the area for centuries prior to the arrival of European settlers. The county was originally part of the Kansas Territory, and was one of the original 33 counties established when Kansas became a state in 1861.
The county was home to a number of Native American tribes, including the Wyandot, Shawnee, and Delaware. The area was also home to a number of early settlers, including the Wyandot, who established a trading post in the area in 1843.
The county was also home to a number of early industries, including coal mining, which began in the late 19th century. The county was also home to a number of railroads, which helped to spur economic growth in the area.
Geography
Wyandotte County covers an area of 246 square miles, and is located in the northeastern corner of the state of Kansas. It is bordered by Johnson County to the north, Leavenworth County to the east, and Missouri to the south and west. The county seat is Kansas City, and the county has a population of 159,637 as of the 2020 census.
The county is located in the Central Lowland region of the United States, and is characterized by rolling hills and flat plains. The county is home to a number of rivers and streams, including the Kansas River, which flows through the county from east to west.
Economy
Wyandotte County has a diverse economy, with a number of industries represented in the area. The county is home to a number of manufacturing companies, including automotive parts, food processing, and printing. The county is also home to a number of retail and service businesses, including restaurants, hotels, and entertainment venues.
The county is also home to a number of government and military installations, including the Kansas City International Airport, the Kansas City Air National Guard Base, and the Kansas City Federal Reserve Bank.
Demographics
As of the 2020 census, Wyandotte County had a population of 159,637. The racial makeup of the county was 68.3% White, 24.2% Black or African American, 0.7% Native American, 2.2% Asian, 0.1% Pacific Islander, 1.7% from other races, and 2.9% from two or more races. Hispanic or Latino of any race were 6.3% of the population.
The median household income in the county was $50,945, and the median family income was $60,945. The per capita income in the county was $25,945. The poverty rate in the county was 15.2%.
Common Questions
What is the Total Population of Wyandotte County?
Total Population of Wyandotte County is 167,989.
What is the Total Male Population of Wyandotte County?
Total Male Population of Wyandotte County is 84,439.
What is the Total Female Population of Wyandotte County?
Total Female Population of Wyandotte County is 83,550.
What is the Ratio of Males per 100 Females in Wyandotte County?
There are 101.06 Males per 100 Females in Wyandotte County.
What is the Ratio of Females per 100 Males in Wyandotte County?
There are 98.95 Females per 100 Males in Wyandotte County.
What is the Median Population Age in Wyandotte County?
Median Population Age in Wyandotte County is 34.3 Years.
What is the Average Family Size in Wyandotte County
Average Family Size in Wyandotte County is 3.4 People.
What is the Average Household Size in Wyandotte County
Average Household Size in Wyandotte County is 2.7 People.
What is Per Capita Income in Wyandotte County?
Per Capita income in Wyandotte County is $27,534.
What is the Median Family Income in Wyandotte County?
Median Family Income in Wyandotte County is $69,819.
What is the Median Household income in Wyandotte County?
Median Household Income in Wyandotte County is $57,771.
What is Income or Wage Gap in Wyandotte County?
Income or Wage Gap in Wyandotte County is 21.3%.
Women in Wyandotte County earn 78.7 cents for every dollar earned by a man.
What is Family Income Deficit in Wyandotte County?
Family Income Deficit in Wyandotte County is $10,629.
Families that are below poverty line in Wyandotte County earn $10,629 less on average than the poverty threshold level.
What is Inequality or Gini Index in Wyandotte County?
Inequality or Gini Index in Wyandotte County is 0.43.
How Large is the Labor Force in Wyandotte County?
There are 83,577 People in the Labor Forcein in Wyandotte County.
What is the Percentage of People in the Labor Force in Wyandotte County?
65.8% of People are in the Labor Force in Wyandotte County.
What is the Unemployment Rate in Wyandotte County?
Unemployment Rate in Wyandotte County is 5.7%.