Woodson County, KS
Woodson County Map
Woodson County Overview
3,134
TOTAL POPULATION
1,602
MALE POPULATION
1,532
FEMALE POPULATION
104.57
MALES / 100 FEMALES
95.63
FEMALES / 100 MALES
46.6
MEDIAN AGE
3.2
AVG FAMILY SIZE
2.6
AVG HOUSEHOLD SIZE
$28,380
PER CAPITA INCOME
$72,772
AVG FAMILY INCOME
$50,670
AVG HOUSEHOLD INCOME
31.8%
WAGE / INCOME GAP [ % ]
68.2¢/ $1
WAGE / INCOME GAP [ $ ]
0.43
INEQUALITY / GINI INDEX
1,418
LABOR FORCE [ PEOPLE ]
54.9%
PERCENT IN LABOR FORCE
6.2%
UNEMPLOYMENT RATE
Woodson County Area Codes
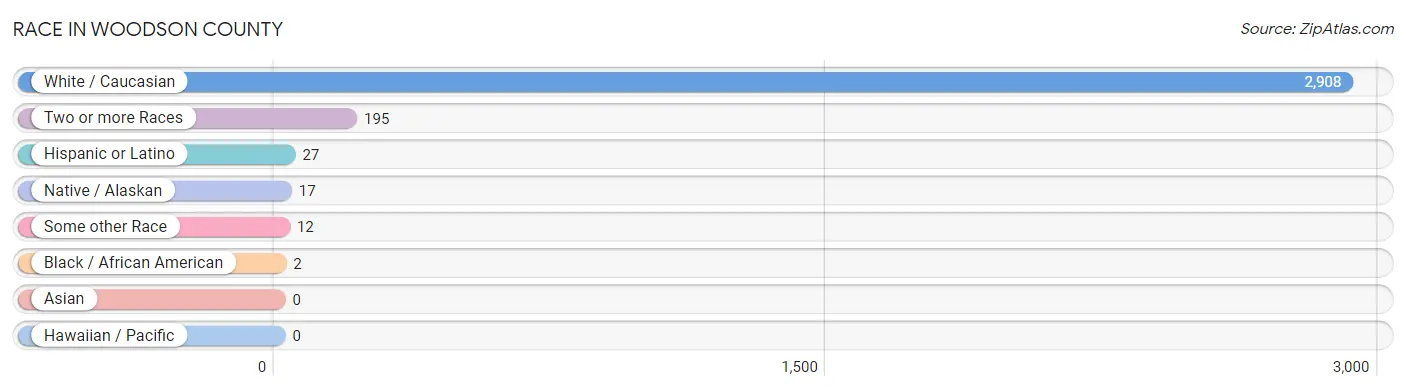
Race in Woodson County
The most populous races in Woodson County are White / Caucasian (2,908 | 92.8%), Two or more Races (195 | 6.2%), and Hispanic or Latino (27 | 0.9%).
| Race | # Population | % Population |
| Asian | 0 | 0.0% |
| Black / African American | 2 | 0.1% |
| Hawaiian / Pacific | 0 | 0.0% |
| Hispanic or Latino | 27 | 0.9% |
| Native / Alaskan | 17 | 0.5% |
| White / Caucasian | 2,908 | 92.8% |
| Two or more Races | 195 | 6.2% |
| Some other Race | 12 | 0.4% |
| Total | 3,134 | 100.0% |
Ancestry in Woodson County
The most populous ancestries reported in Woodson County are German (1,061 | 33.9%), Irish (372 | 11.9%), American (315 | 10.1%), English (258 | 8.2%), and Italian (117 | 3.7%), together accounting for 67.7% of all Woodson County residents.

| Ancestry | # Population | % Population |
| American | 315 | 10.1% |
| Blackfeet | 2 | 0.1% |
| British | 56 | 1.8% |
| Central American | 1 | 0.0% |
| Cherokee | 72 | 2.3% |
| Danish | 14 | 0.4% |
| Delaware | 4 | 0.1% |
| Dutch | 15 | 0.5% |
| English | 258 | 8.2% |
| European | 13 | 0.4% |
| French | 37 | 1.2% |
| French Canadian | 2 | 0.1% |
| German | 1,061 | 33.9% |
| Honduran | 1 | 0.0% |
| Irish | 372 | 11.9% |
| Italian | 117 | 3.7% |
| Mexican | 14 | 0.4% |
| Norwegian | 19 | 0.6% |
| Osage | 7 | 0.2% |
| Pennsylvania German | 9 | 0.3% |
| Polish | 34 | 1.1% |
| Portuguese | 2 | 0.1% |
| Puerto Rican | 12 | 0.4% |
| Russian | 1 | 0.0% |
| Scotch-Irish | 20 | 0.6% |
| Scottish | 62 | 2.0% |
| Sioux | 15 | 0.5% |
| Swedish | 54 | 1.7% |
| Swiss | 4 | 0.1% |
| Welsh | 8 | 0.3% | View All 30 Rows |
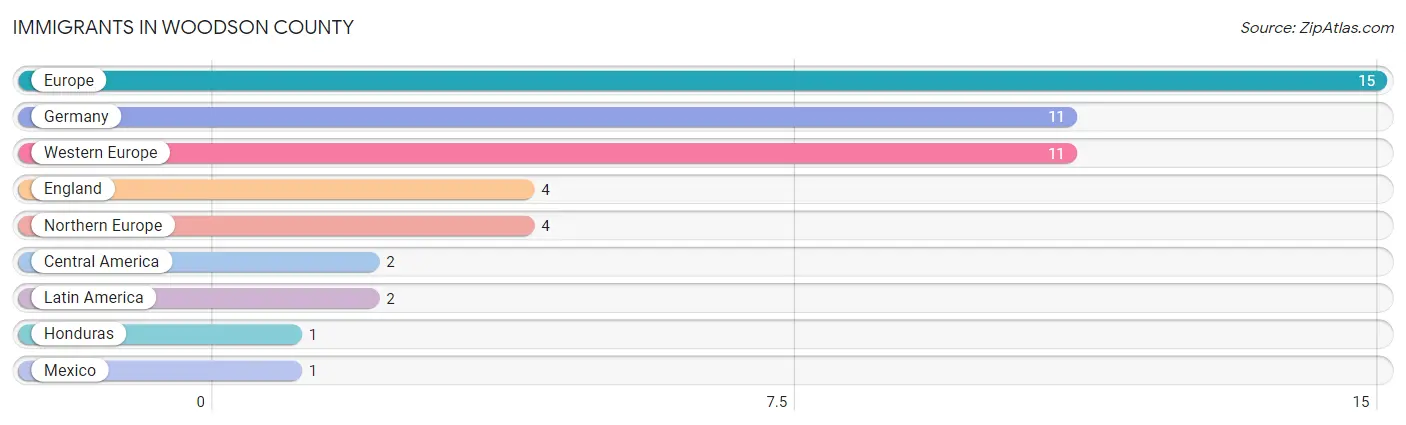
Immigrants in Woodson County
The most numerous immigrant groups reported in Woodson County came from Europe (15 | 0.5%), Germany (11 | 0.4%), Western Europe (11 | 0.4%), England (4 | 0.1%), and Northern Europe (4 | 0.1%), together accounting for 1.4% of all Woodson County residents.
| Immigration Origin | # Population | % Population |
| Central America | 2 | 0.1% |
| England | 4 | 0.1% |
| Europe | 15 | 0.5% |
| Germany | 11 | 0.4% |
| Honduras | 1 | 0.0% |
| Latin America | 2 | 0.1% |
| Mexico | 1 | 0.0% |
| Northern Europe | 4 | 0.1% |
| Western Europe | 11 | 0.4% | View All 9 Rows |
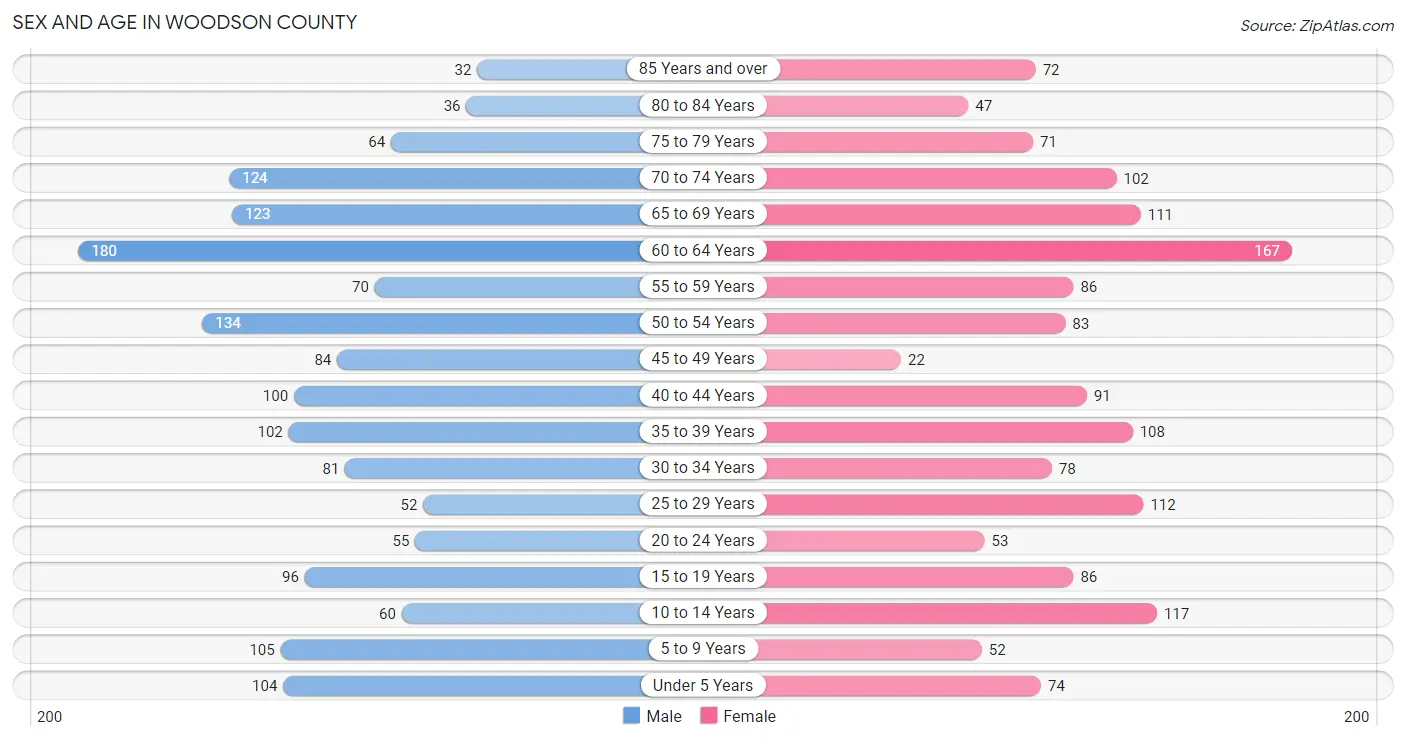
Sex and Age in Woodson County
Sex and Age in Woodson County
The most populous age groups in Woodson County are 60 to 64 Years (180 | 11.2%) for men and 60 to 64 Years (167 | 10.9%) for women.
| Age Bracket | Male | Female |
| Under 5 Years | 104 (6.5%) | 74 (4.8%) |
| 5 to 9 Years | 105 (6.6%) | 52 (3.4%) |
| 10 to 14 Years | 60 (3.7%) | 117 (7.6%) |
| 15 to 19 Years | 96 (6.0%) | 86 (5.6%) |
| 20 to 24 Years | 55 (3.4%) | 53 (3.5%) |
| 25 to 29 Years | 52 (3.3%) | 112 (7.3%) |
| 30 to 34 Years | 81 (5.1%) | 78 (5.1%) |
| 35 to 39 Years | 102 (6.4%) | 108 (7.0%) |
| 40 to 44 Years | 100 (6.2%) | 91 (5.9%) |
| 45 to 49 Years | 84 (5.2%) | 22 (1.4%) |
| 50 to 54 Years | 134 (8.4%) | 83 (5.4%) |
| 55 to 59 Years | 70 (4.4%) | 86 (5.6%) |
| 60 to 64 Years | 180 (11.2%) | 167 (10.9%) |
| 65 to 69 Years | 123 (7.7%) | 111 (7.2%) |
| 70 to 74 Years | 124 (7.7%) | 102 (6.7%) |
| 75 to 79 Years | 64 (4.0%) | 71 (4.6%) |
| 80 to 84 Years | 36 (2.2%) | 47 (3.1%) |
| 85 Years and over | 32 (2.0%) | 72 (4.7%) |
| Total | 1,602 (100.0%) | 1,532 (100.0%) |
Families and Households in Woodson County
Median Family Size in Woodson County
The median family size in Woodson County is 3.24 persons per family, with single male/father families (40 | 5.2%) accounting for the largest median family size of 3.48 persons per family. On the other hand, married-couple families (573 | 75.1%) represent the smallest median family size with 3.16 persons per family.

| Family Type | # Families | Family Size |
| Married-Couple | 573 (75.1%) | 3.16 |
| Single Male/Father | 40 (5.2%) | 3.48 |
| Single Female/Mother | 150 (19.7%) | 3.47 |
| Total Families | 763 (100.0%) | 3.24 |
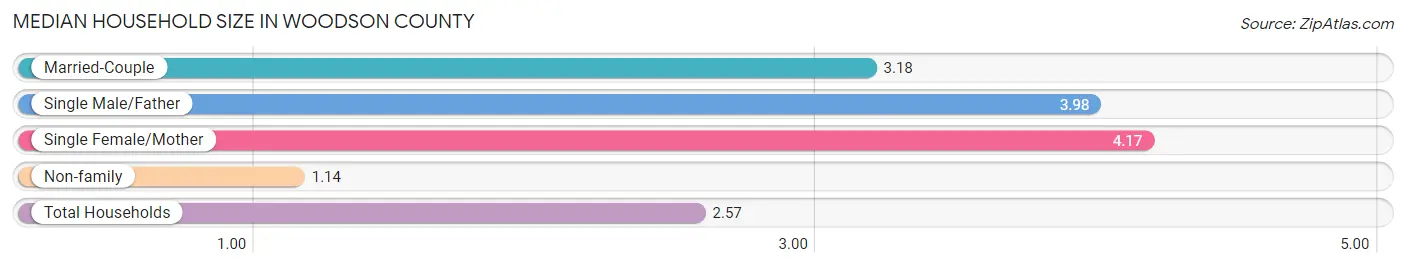
Median Household Size in Woodson County
The median household size in Woodson County is 2.57 persons per household, with single female/mother households (150 | 12.4%) accounting for the largest median household size of 4.17 persons per household. non-family households (450 | 37.1%) represent the smallest median household size with 1.14 persons per household.
| Household Type | # Households | Household Size |
| Married-Couple | 573 (47.2%) | 3.18 |
| Single Male/Father | 40 (3.3%) | 3.98 |
| Single Female/Mother | 150 (12.4%) | 4.17 |
| Non-family | 450 (37.1%) | 1.14 |
| Total Households | 1,213 (100.0%) | 2.57 |
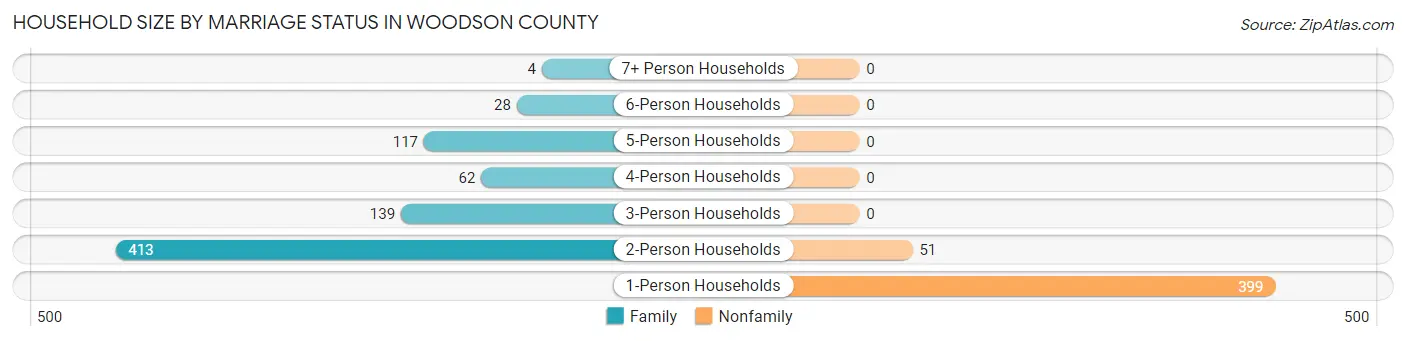
Household Size by Marriage Status in Woodson County
Out of a total of 1,213 households in Woodson County, 763 (62.9%) are family households, while 450 (37.1%) are nonfamily households. The most numerous type of family households are 2-person households, comprising 413, and the most common type of nonfamily households are 1-person households, comprising 399.
| Household Size | Family Households | Nonfamily Households |
| 1-Person Households | - | 399 (32.9%) |
| 2-Person Households | 413 (34.1%) | 51 (4.2%) |
| 3-Person Households | 139 (11.5%) | 0 (0.0%) |
| 4-Person Households | 62 (5.1%) | 0 (0.0%) |
| 5-Person Households | 117 (9.7%) | 0 (0.0%) |
| 6-Person Households | 28 (2.3%) | 0 (0.0%) |
| 7+ Person Households | 4 (0.3%) | 0 (0.0%) |
| Total | 763 (62.9%) | 450 (37.1%) |
Female Fertility in Woodson County
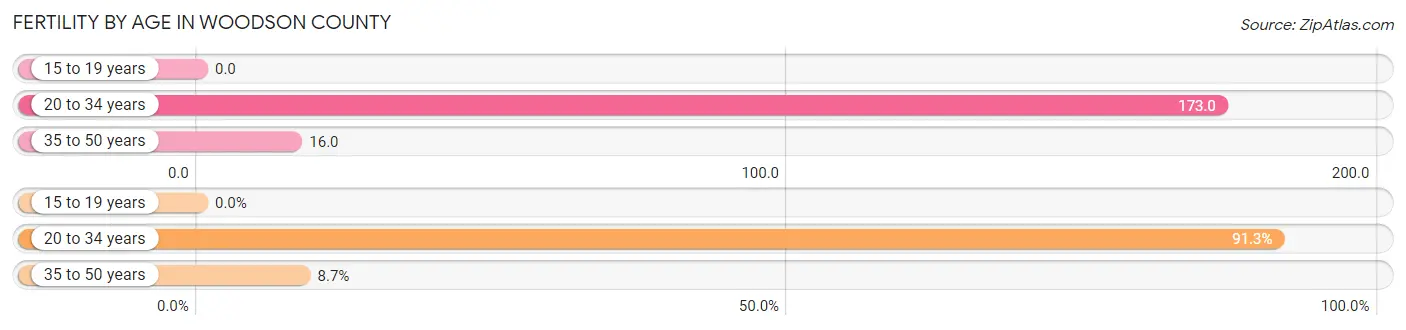
Fertility by Age in Woodson County
Average fertility rate in Woodson County is 79.0 births per 1,000 women. Women in the age bracket of 20 to 34 years have the highest fertility rate with 173.0 births per 1,000 women. Women in the age bracket of 20 to 34 years acount for 91.3% of all women with births.
| Age Bracket | Women with Births | Births / 1,000 Women |
| 15 to 19 years | 0 (0.0%) | 0.0 |
| 20 to 34 years | 42 (91.3%) | 173.0 |
| 35 to 50 years | 4 (8.7%) | 16.0 |
| Total | 46 (100.0%) | 79.0 |
Fertility by Age by Marriage Status in Woodson County
21.7% of women with births (46) in Woodson County are married. The highest percentage of unmarried women with births falls into 20 to 34 years age bracket with 85.7% of them unmarried at the time of birth, while the lowest percentage of unmarried women with births belong to 35 to 50 years age bracket with 0.0% of them unmarried.

| Age Bracket | Married | Unmarried |
| 15 to 19 years | 0 (0.0%) | 0 (0.0%) |
| 20 to 34 years | 6 (14.3%) | 36 (85.7%) |
| 35 to 50 years | 4 (100.0%) | 0 (0.0%) |
| Total | 10 (21.7%) | 36 (78.3%) |
Fertility by Education in Woodson County

| Educational Attainment | Women with Births | Births / 1,000 Women |
| Less than High School | 0 (0.0%) | 0.0 |
| High School Diploma | 16 (34.8%) | 92.0 |
| College or Associate's Degree | 30 (65.2%) | 171.0 |
| Bachelor's Degree | 0 (0.0%) | 0.0 |
| Graduate Degree | 0 (0.0%) | 0.0 |
| Total | 46 (100.0%) | 79.0 |
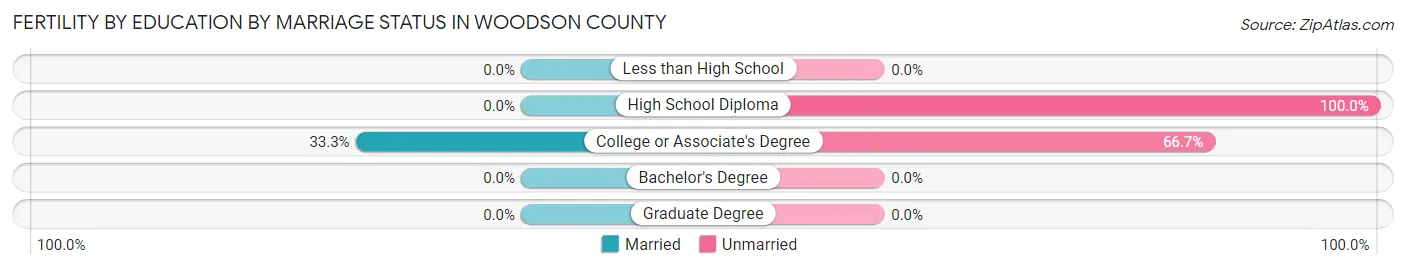
Fertility by Education by Marriage Status in Woodson County
78.3% of women with births in Woodson County are unmarried. Women with the educational attainment of college or associate's degree are most likely to be married with 33.3% of them married at childbirth, while women with the educational attainment of high school diploma are least likely to be married with 100.0% of them unmarried at childbirth.
| Educational Attainment | Married | Unmarried |
| Less than High School | 0 (0.0%) | 0 (0.0%) |
| High School Diploma | 0 (0.0%) | 16 (100.0%) |
| College or Associate's Degree | 10 (33.3%) | 20 (66.7%) |
| Bachelor's Degree | 0 (0.0%) | 0 (0.0%) |
| Graduate Degree | 0 (0.0%) | 0 (0.0%) |
| Total | 10 (21.7%) | 36 (78.3%) |
Income in Woodson County
Income Overview in Woodson County
Per Capita Income in Woodson County is $28,380, while median incomes of families and households are $72,772 and $50,670 respectively.
| Characteristic | Number | Measure |
| Per Capita Income | 3,134 | $28,380 |
| Median Family Income | 763 | $72,772 |
| Mean Family Income | 763 | $77,756 |
| Median Household Income | 1,213 | $50,670 |
| Mean Household Income | 1,213 | $68,094 |
| Income Deficit | 763 | $0 |
| Wage / Income Gap (%) | 3,134 | 31.79% |
| Wage / Income Gap ($) | 3,134 | 68.21¢ per $1 |
| Gini / Inequality Index | 3,134 | 0.43 |
Earnings by Sex in Woodson County
Average Earnings in Woodson County are $28,594, $37,174 for men and $25,357 for women, a difference of 31.8%.
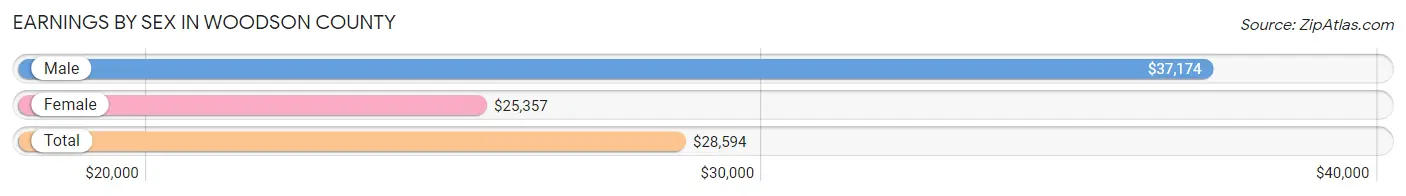
| Sex | Number | Average Earnings |
| Male | 794 (51.5%) | $37,174 |
| Female | 748 (48.5%) | $25,357 |
| Total | 1,542 (100.0%) | $28,594 |
Earnings by Sex by Income Bracket in Woodson County
The most common earnings brackets in Woodson County are $65,000 to $74,999 for men (70 | 8.8%) and $2,499 or less for women (110 | 14.7%).

| Income | Male | Female |
| $2,499 or less | 65 (8.2%) | 110 (14.7%) |
| $2,500 to $4,999 | 42 (5.3%) | 27 (3.6%) |
| $5,000 to $7,499 | 19 (2.4%) | 49 (6.6%) |
| $7,500 to $9,999 | 26 (3.3%) | 21 (2.8%) |
| $10,000 to $12,499 | 34 (4.3%) | 16 (2.1%) |
| $12,500 to $14,999 | 23 (2.9%) | 43 (5.8%) |
| $15,000 to $17,499 | 21 (2.6%) | 24 (3.2%) |
| $17,500 to $19,999 | 7 (0.9%) | 11 (1.5%) |
| $20,000 to $22,499 | 28 (3.5%) | 33 (4.4%) |
| $22,500 to $24,999 | 35 (4.4%) | 30 (4.0%) |
| $25,000 to $29,999 | 38 (4.8%) | 96 (12.8%) |
| $30,000 to $34,999 | 39 (4.9%) | 51 (6.8%) |
| $35,000 to $39,999 | 48 (6.0%) | 36 (4.8%) |
| $40,000 to $44,999 | 66 (8.3%) | 52 (7.0%) |
| $45,000 to $49,999 | 49 (6.2%) | 30 (4.0%) |
| $50,000 to $54,999 | 33 (4.2%) | 26 (3.5%) |
| $55,000 to $64,999 | 42 (5.3%) | 30 (4.0%) |
| $65,000 to $74,999 | 70 (8.8%) | 20 (2.7%) |
| $75,000 to $99,999 | 55 (6.9%) | 3 (0.4%) |
| $100,000+ | 54 (6.8%) | 40 (5.3%) |
| Total | 794 (100.0%) | 748 (100.0%) |
Earnings by Sex by Educational Attainment in Woodson County
Average earnings in Woodson County are $38,400 for men and $26,018 for women, a difference of 32.2%. Men with an educational attainment of less than high school enjoy the highest average annual earnings of $67,292, while those with high school diploma education earn the least with $29,931. Women with an educational attainment of graduate degree earn the most with the average annual earnings of $48,000, while those with college or associate's degree education have the smallest earnings of $17,813.

| Educational Attainment | Male Income | Female Income |
| Less than High School | $67,292 | $0 |
| High School Diploma | $29,931 | $25,776 |
| College or Associate's Degree | $43,355 | $17,813 |
| Bachelor's Degree | $41,538 | $38,594 |
| Graduate Degree | - | - |
| Total | $38,400 | $26,018 |
Family Income in Woodson County
Family Income Brackets in Woodson County
According to the Woodson County family income data, there are 171 families falling into the $75,000 to $99,999 income range, which is the most common income bracket and makes up 22.4% of all families. Conversely, the $10,000 to $14,999 income bracket is the least frequent group with only 23 families (3.0%) belonging to this category.
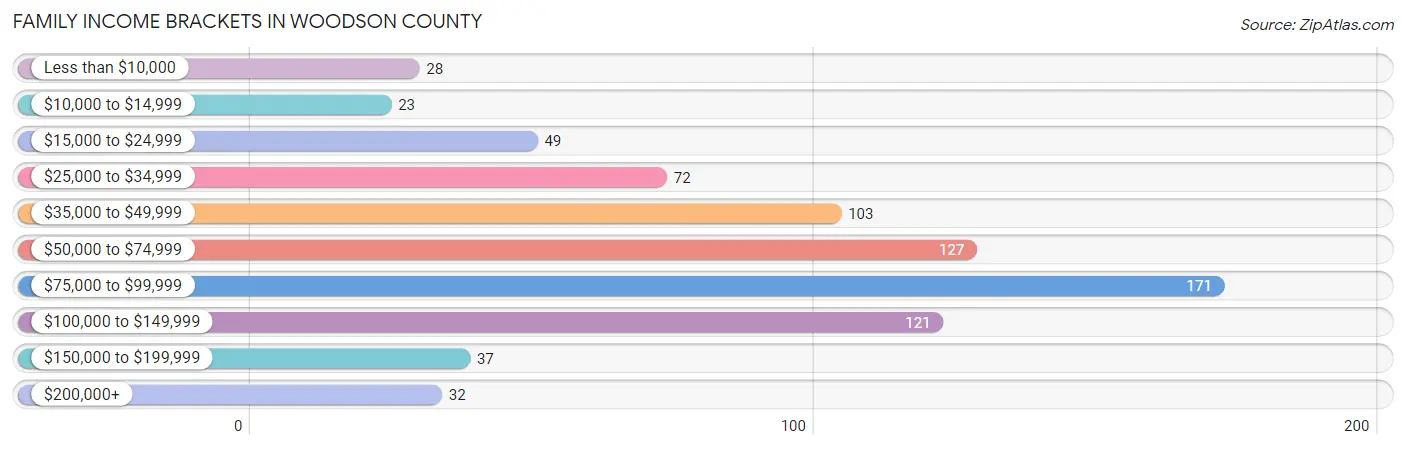
| Income Bracket | # Families | % Families |
| Less than $10,000 | 28 | 3.7% |
| $10,000 to $14,999 | 23 | 3.0% |
| $15,000 to $24,999 | 49 | 6.4% |
| $25,000 to $34,999 | 72 | 9.4% |
| $35,000 to $49,999 | 103 | 13.5% |
| $50,000 to $74,999 | 127 | 16.6% |
| $75,000 to $99,999 | 171 | 22.4% |
| $100,000 to $149,999 | 121 | 15.9% |
| $150,000 to $199,999 | 37 | 4.8% |
| $200,000+ | 32 | 4.2% |
Family Income by Famaliy Size in Woodson County
4-person families (104 | 13.6%) account for the highest median family income in Woodson County with $85,000 per family, while 2-person families (431 | 56.5%) have the highest median income of $32,604 per family member.

| Income Bracket | # Families | Median Income |
| 2-Person Families | 431 (56.5%) | $65,208 |
| 3-Person Families | 142 (18.6%) | $58,333 |
| 4-Person Families | 104 (13.6%) | $85,000 |
| 5-Person Families | 58 (7.6%) | $81,042 |
| 6-Person Families | 24 (3.2%) | $83,125 |
| 7+ Person Families | 4 (0.5%) | $0 |
| Total | 763 (100.0%) | $72,772 |
Family Income by Number of Earners in Woodson County
The median family income in Woodson County is $72,772, with families comprising 3+ earners (49) having the highest median family income of $123,750, while families with no earners (105) have the lowest median family income of $35,250, accounting for 6.4% and 13.8% of families, respectively.

| Number of Earners | # Families | Median Income |
| No Earners | 105 (13.8%) | $35,250 |
| 1 Earner | 309 (40.5%) | $51,845 |
| 2 Earners | 300 (39.3%) | $88,750 |
| 3+ Earners | 49 (6.4%) | $123,750 |
| Total | 763 (100.0%) | $72,772 |
Household Income in Woodson County
Household Income Brackets in Woodson County
With 243 households falling in the category, the $35,000 to $49,999 income range is the most frequent in Woodson County, accounting for 20.0% of all households. In contrast, only 51 households (4.2%) fall into the $150,000 to $199,999 income bracket, making it the least populous group.

| Income Bracket | # Households | % Households |
| Less than $10,000 | 57 | 4.7% |
| $10,000 to $14,999 | 55 | 4.5% |
| $15,000 to $24,999 | 126 | 10.4% |
| $25,000 to $34,999 | 119 | 9.8% |
| $35,000 to $49,999 | 243 | 20.0% |
| $50,000 to $74,999 | 205 | 16.9% |
| $75,000 to $99,999 | 180 | 14.8% |
| $100,000 to $149,999 | 124 | 10.2% |
| $150,000 to $199,999 | 51 | 4.2% |
| $200,000+ | 55 | 4.5% |
Household Income by Householder Age in Woodson County
The median household income in Woodson County is $50,670, with the highest median household income of $71,250 found in the 15 to 24 years age bracket for the primary householder. A total of 16 households (1.3%) fall into this category. Meanwhile, the 65+ years age bracket for the primary householder has the lowest median household income of $38,438, with 436 households (35.9%) in this group.
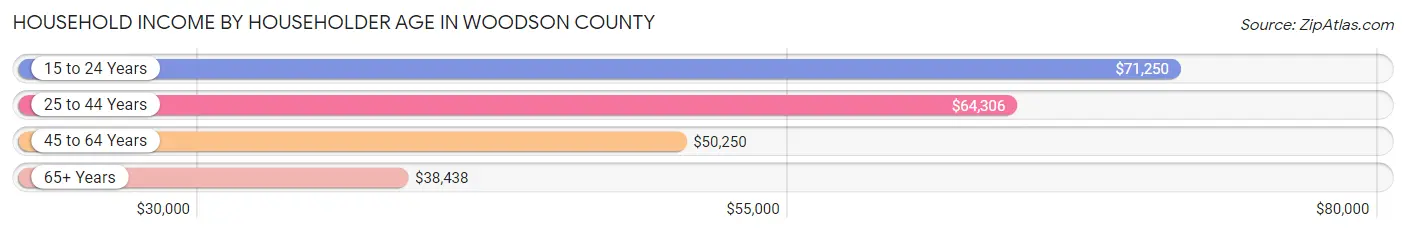
| Income Bracket | # Households | Median Income |
| 15 to 24 Years | 16 (1.3%) | $71,250 |
| 25 to 44 Years | 281 (23.2%) | $64,306 |
| 45 to 64 Years | 480 (39.6%) | $50,250 |
| 65+ Years | 436 (35.9%) | $38,438 |
| Total | 1,213 (100.0%) | $50,670 |
Poverty in Woodson County
Income Below Poverty by Sex and Age in Woodson County
With 14.2% poverty level for males and 12.3% for females among the residents of Woodson County, 18 to 24 year old males and 18 to 24 year old females are the most vulnerable to poverty, with 31 males (30.7%) and 25 females (43.1%) in their respective age groups living below the poverty level.

| Age Bracket | Male | Female |
| Under 5 Years | 18 (24.7%) | 7 (9.5%) |
| 5 Years | 0 (0.0%) | 5 (22.7%) |
| 6 to 11 Years | 24 (22.4%) | 21 (19.4%) |
| 12 to 14 Years | 9 (24.3%) | 0 (0.0%) |
| 15 Years | 0 (0.0%) | 0 (0.0%) |
| 16 and 17 Years | 7 (17.9%) | 8 (16.0%) |
| 18 to 24 Years | 31 (30.7%) | 25 (43.1%) |
| 25 to 34 Years | 23 (17.7%) | 40 (21.0%) |
| 35 to 44 Years | 25 (12.4%) | 12 (6.0%) |
| 45 to 54 Years | 19 (8.8%) | 9 (8.6%) |
| 55 to 64 Years | 55 (22.0%) | 45 (17.8%) |
| 65 to 74 Years | 5 (2.0%) | 10 (4.7%) |
| 75 Years and over | 5 (3.8%) | 5 (2.8%) |
| Total | 221 (14.2%) | 187 (12.3%) |
Income Above Poverty by Sex and Age in Woodson County
According to the poverty statistics in Woodson County, males aged 5 years and females aged 12 to 14 years are the age groups that are most secure financially, with 100.0% of males and 100.0% of females in these age groups living above the poverty line.
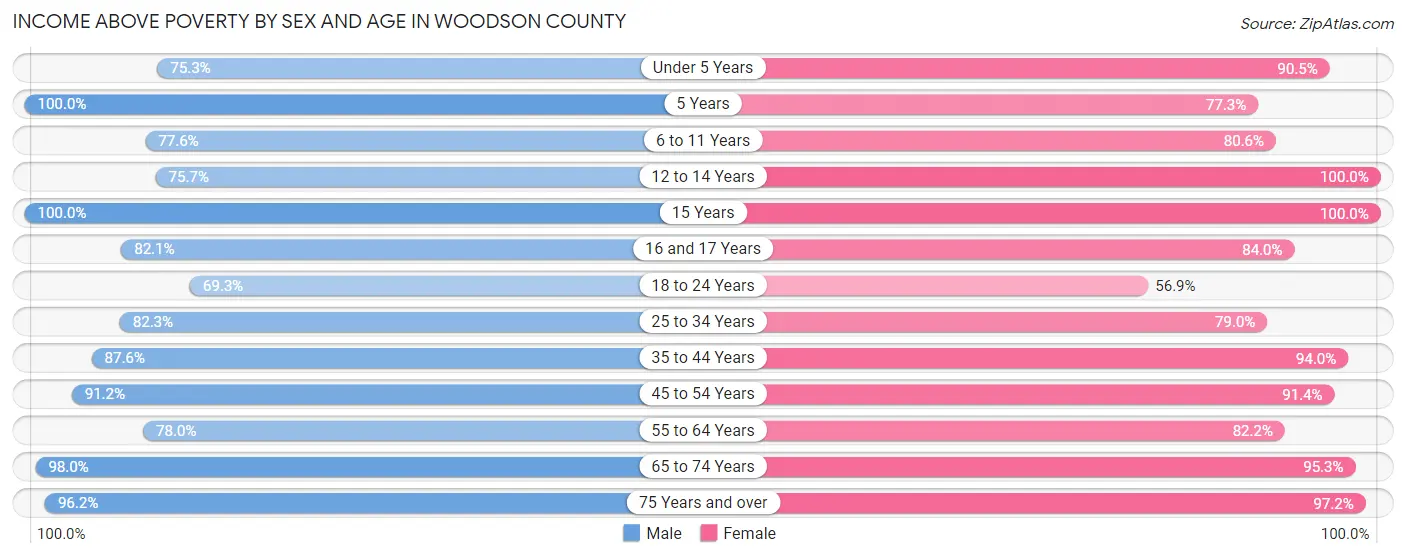
| Age Bracket | Male | Female |
| Under 5 Years | 55 (75.3%) | 67 (90.5%) |
| 5 Years | 16 (100.0%) | 17 (77.3%) |
| 6 to 11 Years | 83 (77.6%) | 87 (80.6%) |
| 12 to 14 Years | 28 (75.7%) | 34 (100.0%) |
| 15 Years | 9 (100.0%) | 31 (100.0%) |
| 16 and 17 Years | 32 (82.1%) | 42 (84.0%) |
| 18 to 24 Years | 70 (69.3%) | 33 (56.9%) |
| 25 to 34 Years | 107 (82.3%) | 150 (78.9%) |
| 35 to 44 Years | 176 (87.6%) | 187 (94.0%) |
| 45 to 54 Years | 198 (91.2%) | 96 (91.4%) |
| 55 to 64 Years | 195 (78.0%) | 208 (82.2%) |
| 65 to 74 Years | 242 (98.0%) | 203 (95.3%) |
| 75 Years and over | 127 (96.2%) | 175 (97.2%) |
| Total | 1,338 (85.8%) | 1,330 (87.7%) |
Income Below Poverty Among Married-Couple Families in Woodson County
The poverty statistics for married-couple families in Woodson County show that 5.9% or 34 of the total 573 families live below the poverty line. Families with 5 or more children have the highest poverty rate of 100.0%, comprising of 4 families. On the other hand, families with no children have the lowest poverty rate of 4.0%, which includes 16 families.
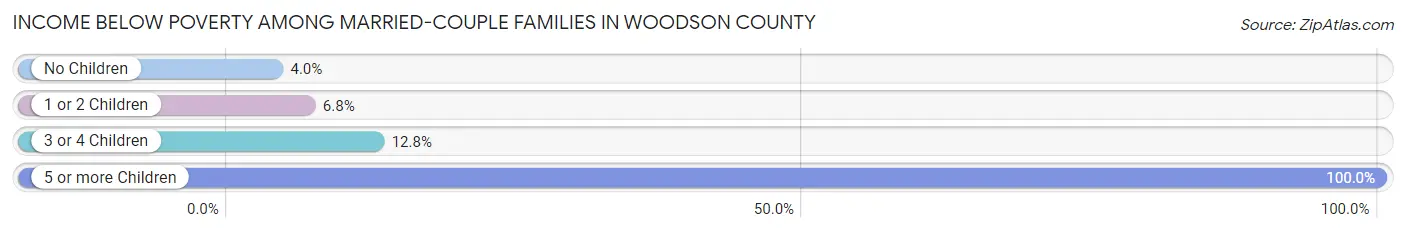
| Children | Above Poverty | Below Poverty |
| No Children | 388 (96.0%) | 16 (4.0%) |
| 1 or 2 Children | 110 (93.2%) | 8 (6.8%) |
| 3 or 4 Children | 41 (87.2%) | 6 (12.8%) |
| 5 or more Children | 0 (0.0%) | 4 (100.0%) |
| Total | 539 (94.1%) | 34 (5.9%) |
Income Below Poverty Among Single-Parent Households in Woodson County
According to the poverty data in Woodson County, 25.0% or 10 single-father households and 25.3% or 38 single-mother households are living below the poverty line. Among single-father households, those with no children have the highest poverty rate, with 6 households (28.6%) experiencing poverty. Likewise, among single-mother households, those with 3 or 4 children have the highest poverty rate, with 20 households (46.5%) falling below the poverty line.

| Children | Single Father | Single Mother |
| No Children | 6 (28.6%) | 3 (6.0%) |
| 1 or 2 Children | 4 (21.0%) | 15 (26.3%) |
| 3 or 4 Children | 0 (0.0%) | 20 (46.5%) |
| 5 or more Children | 0 (0.0%) | 0 (0.0%) |
| Total | 10 (25.0%) | 38 (25.3%) |
Income Below Poverty Among Married-Couple vs Single-Parent Households in Woodson County
The poverty data for Woodson County shows that 34 of the married-couple family households (5.9%) and 48 of the single-parent households (25.3%) are living below the poverty level. Within the married-couple family households, those with 5 or more children have the highest poverty rate, with 4 households (100.0%) falling below the poverty line. Among the single-parent households, those with 3 or 4 children have the highest poverty rate, with 20 household (46.5%) living below poverty.
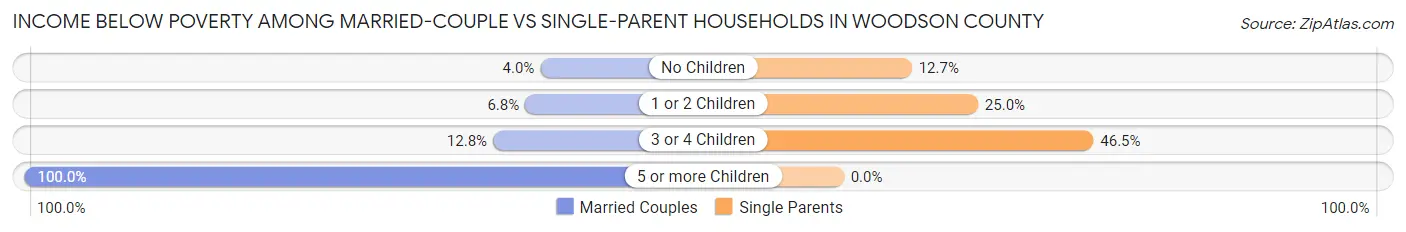
| Children | Married-Couple Families | Single-Parent Households |
| No Children | 16 (4.0%) | 9 (12.7%) |
| 1 or 2 Children | 8 (6.8%) | 19 (25.0%) |
| 3 or 4 Children | 6 (12.8%) | 20 (46.5%) |
| 5 or more Children | 4 (100.0%) | 0 (0.0%) |
| Total | 34 (5.9%) | 48 (25.3%) |
Employment Characteristics in Woodson County
Employment by Class of Employer in Woodson County
Among the 1,271 employed individuals in Woodson County, private company employees (631 | 49.6%), local government employees (215 | 16.9%), and self-employed (not incorporated) (198 | 15.6%) make up the most common classes of employment.
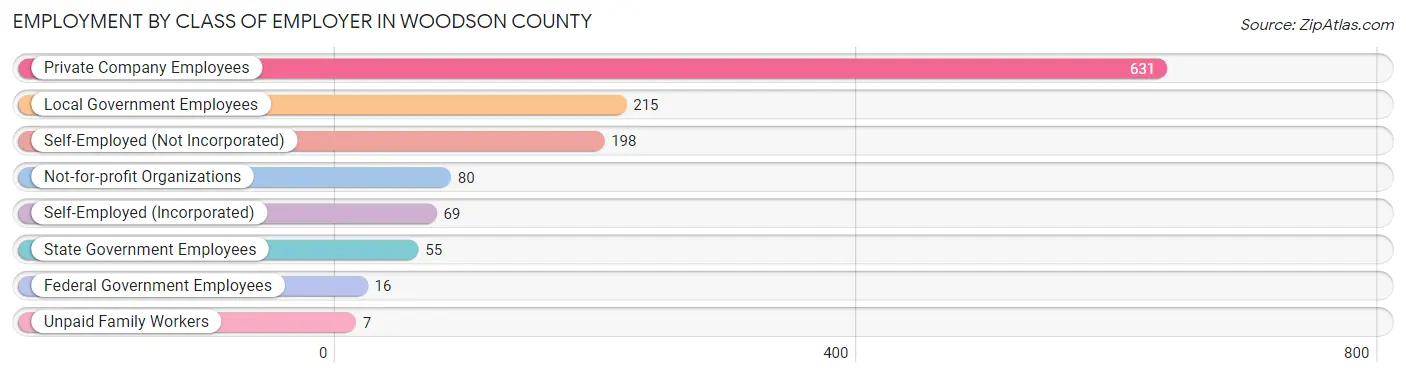
| Employer Class | # Employees | % Employees |
| Private Company Employees | 631 | 49.6% |
| Self-Employed (Incorporated) | 69 | 5.4% |
| Self-Employed (Not Incorporated) | 198 | 15.6% |
| Not-for-profit Organizations | 80 | 6.3% |
| Local Government Employees | 215 | 16.9% |
| State Government Employees | 55 | 4.3% |
| Federal Government Employees | 16 | 1.3% |
| Unpaid Family Workers | 7 | 0.5% |
| Total | 1,271 | 100.0% |
Employment Status by Age in Woodson County
According to the labor force statistics for Woodson County, out of the total population over 16 years of age (2,582), 54.9% or 1,418 individuals are in the labor force, with 6.2% or 88 of them unemployed. The age group with the highest labor force participation rate is 25 to 29 years, with 90.2% or 148 individuals in the labor force. Within the labor force, the 25 to 29 years age range has the highest percentage of unemployed individuals, with 12.8% or 19 of them being unemployed.
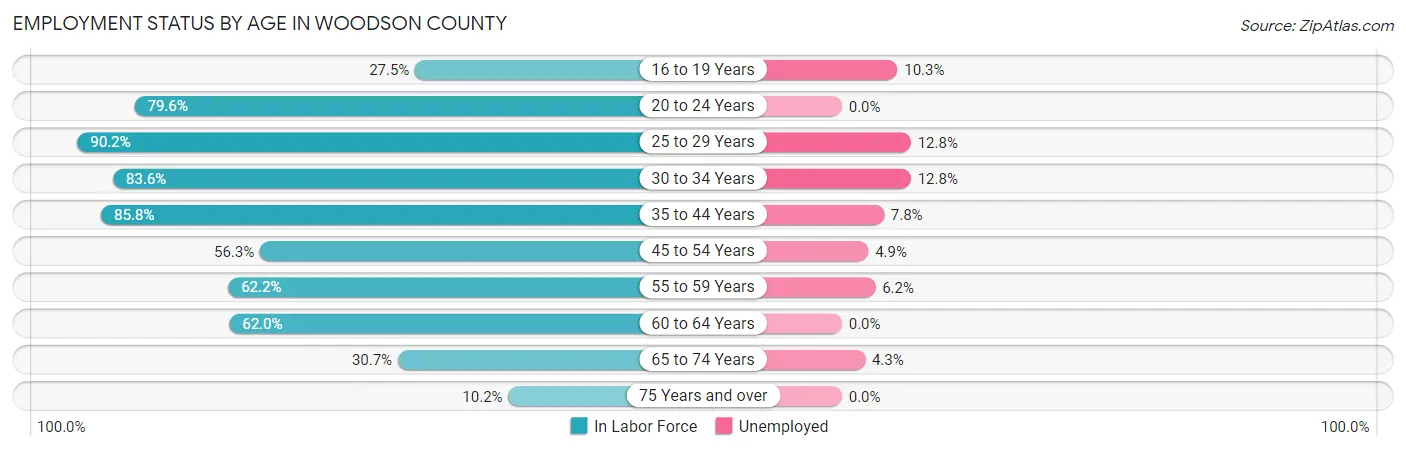
| Age Bracket | In Labor Force | Unemployed |
| 16 to 19 Years | 39 (27.5%) | 4 (10.3%) |
| 20 to 24 Years | 86 (79.6%) | 0 (0.0%) |
| 25 to 29 Years | 148 (90.2%) | 19 (12.8%) |
| 30 to 34 Years | 133 (83.6%) | 17 (12.8%) |
| 35 to 44 Years | 344 (85.8%) | 27 (7.8%) |
| 45 to 54 Years | 182 (56.3%) | 9 (4.9%) |
| 55 to 59 Years | 97 (62.2%) | 6 (6.2%) |
| 60 to 64 Years | 215 (62.0%) | 0 (0.0%) |
| 65 to 74 Years | 141 (30.7%) | 6 (4.3%) |
| 75 Years and over | 33 (10.2%) | 0 (0.0%) |
| Total | 1,418 (54.9%) | 88 (6.2%) |
Employment Status by Educational Attainment in Woodson County
According to labor force statistics for Woodson County, 72.2% of individuals (1,119) out of the total population between 25 and 64 years of age (1,550) are in the labor force, with 7.0% or 78 of them being unemployed. The group with the highest labor force participation rate are those with the educational attainment of bachelor's degree or higher, with 87.0% or 275 individuals in the labor force. Within the labor force, individuals with high school diploma education have the highest percentage of unemployment, with 15.9% or 69 of them being unemployed.
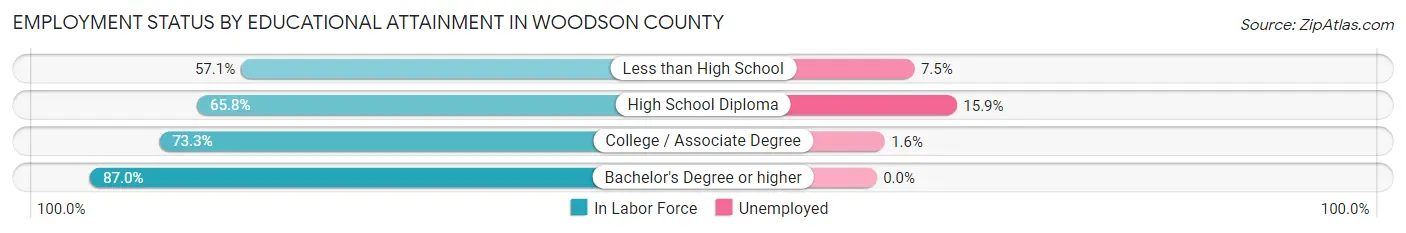
| Educational Attainment | In Labor Force | Unemployed |
| Less than High School | 40 (57.1%) | 5 (7.5%) |
| High School Diploma | 433 (65.8%) | 105 (15.9%) |
| College / Associate Degree | 371 (73.3%) | 8 (1.6%) |
| Bachelor's Degree or higher | 275 (87.0%) | 0 (0.0%) |
| Total | 1,119 (72.2%) | 108 (7.0%) |
Employment Occupations by Sex in Woodson County
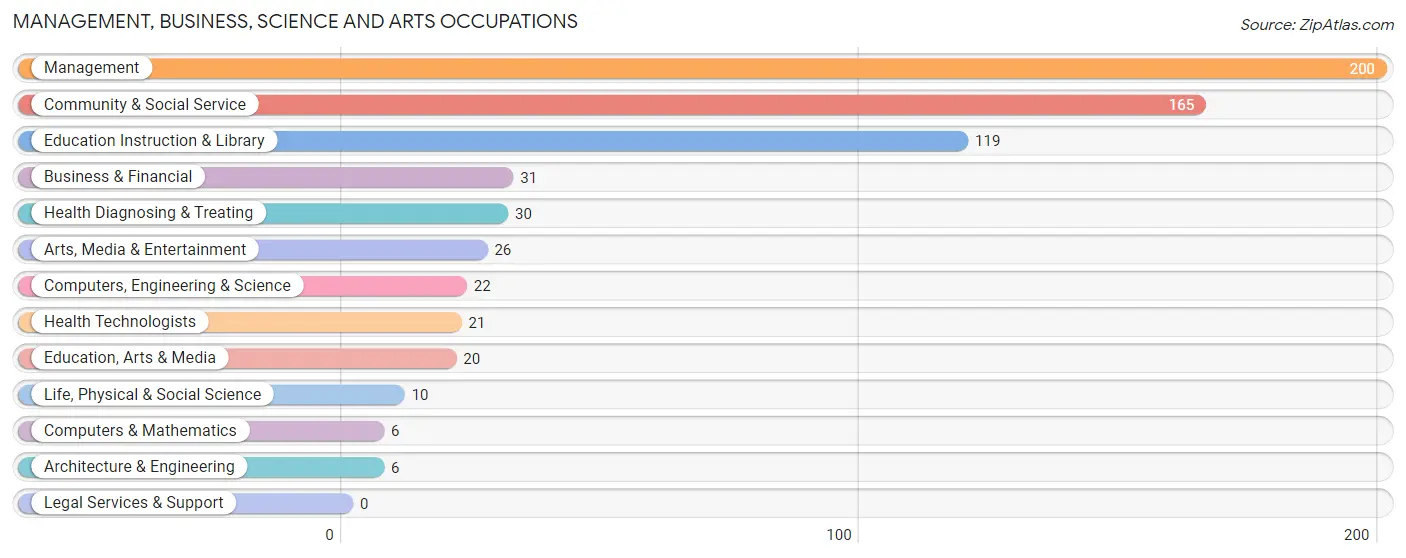
Management, Business, Science and Arts Occupations
The most common Management, Business, Science and Arts occupations in Woodson County are Management (200 | 15.0%), Community & Social Service (165 | 12.4%), Education Instruction & Library (119 | 8.9%), Business & Financial (31 | 2.3%), and Health Diagnosing & Treating (30 | 2.3%).
Management, Business, Science and Arts Occupations by Sex
Within the Management, Business, Science and Arts occupations in Woodson County, the most male-oriented occupations are Architecture & Engineering (100.0%), Computers, Engineering & Science (81.8%), and Life, Physical & Social Science (80.0%), while the most female-oriented occupations are Health Diagnosing & Treating (100.0%), Health Technologists (100.0%), and Education Instruction & Library (83.2%).
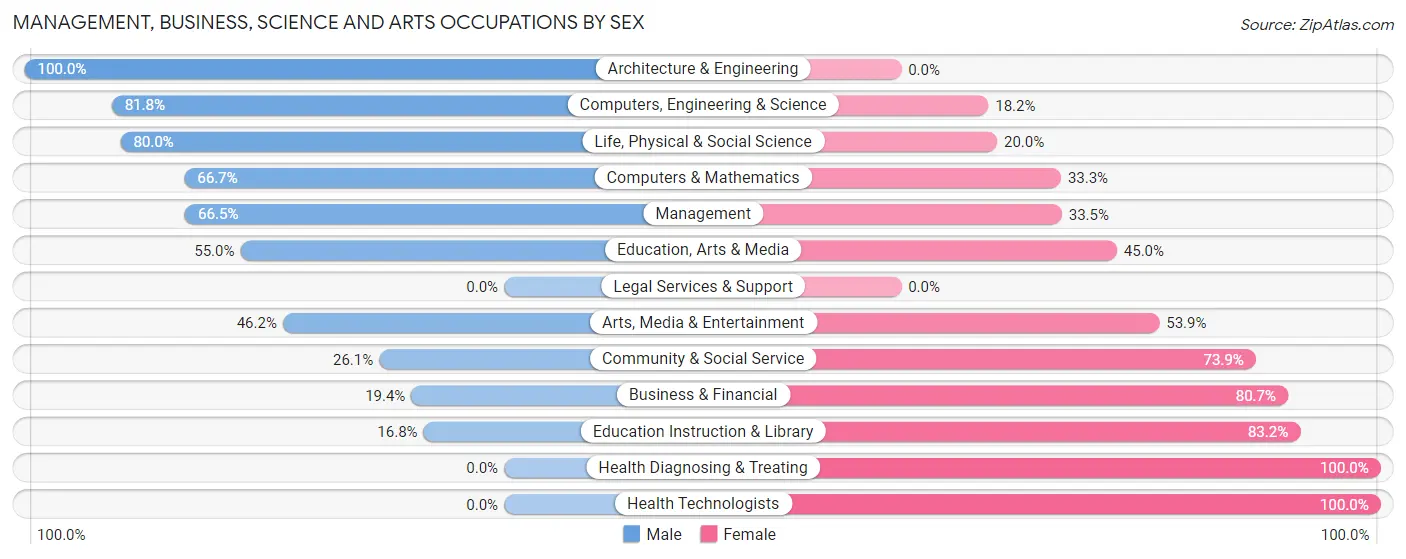
| Occupation | Male | Female |
| Management | 133 (66.5%) | 67 (33.5%) |
| Business & Financial | 6 (19.4%) | 25 (80.6%) |
| Computers, Engineering & Science | 18 (81.8%) | 4 (18.2%) |
| Computers & Mathematics | 4 (66.7%) | 2 (33.3%) |
| Architecture & Engineering | 6 (100.0%) | 0 (0.0%) |
| Life, Physical & Social Science | 8 (80.0%) | 2 (20.0%) |
| Community & Social Service | 43 (26.1%) | 122 (73.9%) |
| Education, Arts & Media | 11 (55.0%) | 9 (45.0%) |
| Legal Services & Support | 0 (0.0%) | 0 (0.0%) |
| Education Instruction & Library | 20 (16.8%) | 99 (83.2%) |
| Arts, Media & Entertainment | 12 (46.2%) | 14 (53.8%) |
| Health Diagnosing & Treating | 0 (0.0%) | 30 (100.0%) |
| Health Technologists | 0 (0.0%) | 21 (100.0%) |
| Total (Category) | 200 (44.6%) | 248 (55.4%) |
| Total (Overall) | 729 (54.8%) | 601 (45.2%) |
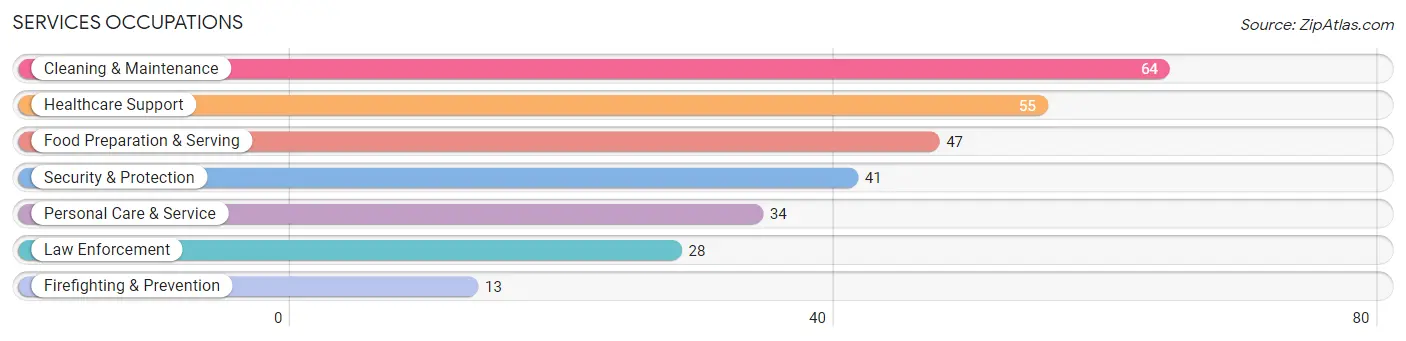
Services Occupations
The most common Services occupations in Woodson County are Cleaning & Maintenance (64 | 4.8%), Healthcare Support (55 | 4.1%), Food Preparation & Serving (47 | 3.5%), Security & Protection (41 | 3.1%), and Personal Care & Service (34 | 2.6%).
Services Occupations by Sex
Within the Services occupations in Woodson County, the most male-oriented occupations are Firefighting & Prevention (92.3%), Security & Protection (90.2%), and Law Enforcement (89.3%), while the most female-oriented occupations are Healthcare Support (100.0%), Personal Care & Service (100.0%), and Food Preparation & Serving (70.2%).
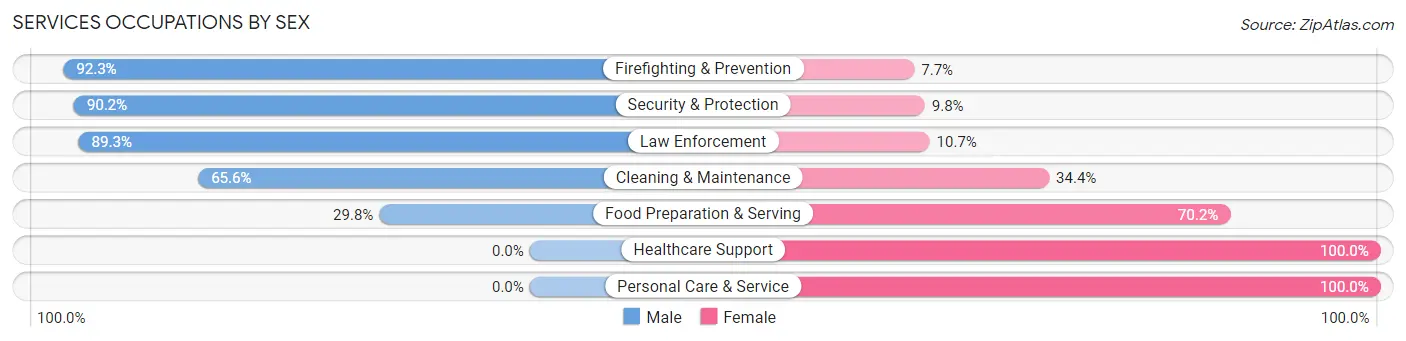
| Occupation | Male | Female |
| Healthcare Support | 0 (0.0%) | 55 (100.0%) |
| Security & Protection | 37 (90.2%) | 4 (9.8%) |
| Firefighting & Prevention | 12 (92.3%) | 1 (7.7%) |
| Law Enforcement | 25 (89.3%) | 3 (10.7%) |
| Food Preparation & Serving | 14 (29.8%) | 33 (70.2%) |
| Cleaning & Maintenance | 42 (65.6%) | 22 (34.4%) |
| Personal Care & Service | 0 (0.0%) | 34 (100.0%) |
| Total (Category) | 93 (38.6%) | 148 (61.4%) |
| Total (Overall) | 729 (54.8%) | 601 (45.2%) |
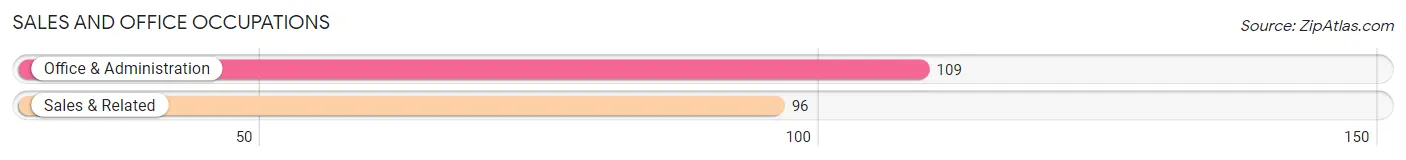
Sales and Office Occupations
The most common Sales and Office occupations in Woodson County are Office & Administration (109 | 8.2%), and Sales & Related (96 | 7.2%).
Sales and Office Occupations by Sex
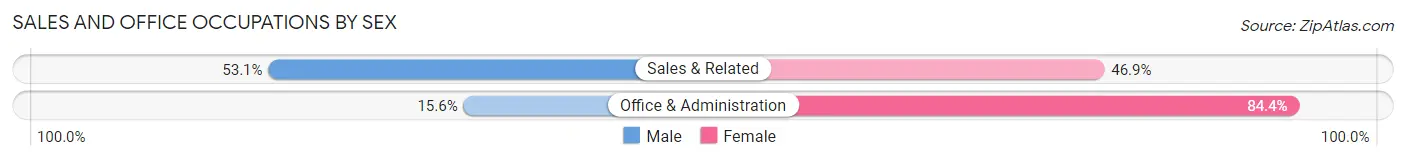
| Occupation | Male | Female |
| Sales & Related | 51 (53.1%) | 45 (46.9%) |
| Office & Administration | 17 (15.6%) | 92 (84.4%) |
| Total (Category) | 68 (33.2%) | 137 (66.8%) |
| Total (Overall) | 729 (54.8%) | 601 (45.2%) |
Natural Resources, Construction and Maintenance Occupations
The most common Natural Resources, Construction and Maintenance occupations in Woodson County are Construction & Extraction (129 | 9.7%), Installation, Maintenance & Repair (49 | 3.7%), and Farming, Fishing & Forestry (21 | 1.6%).
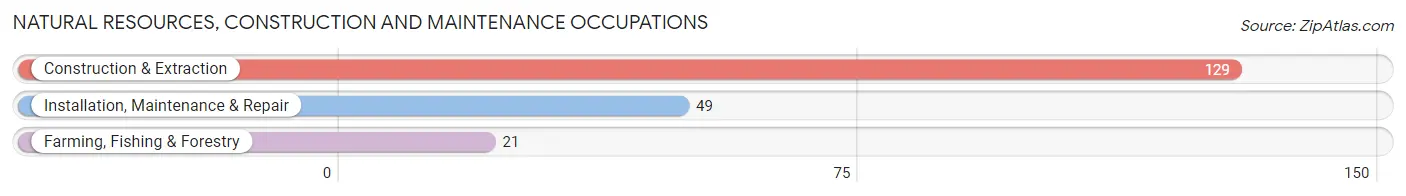
Natural Resources, Construction and Maintenance Occupations by Sex
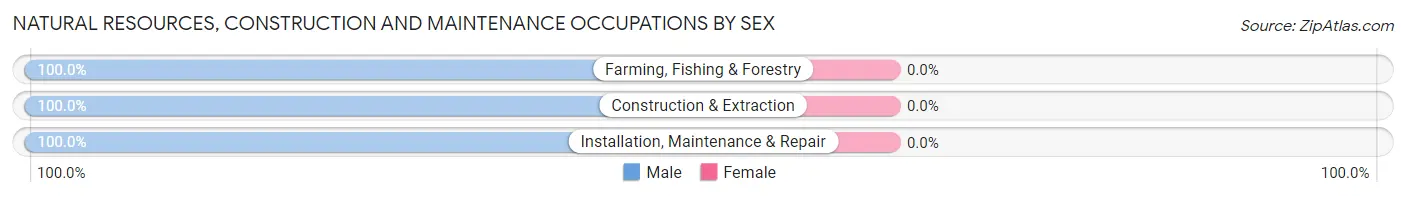
| Occupation | Male | Female |
| Farming, Fishing & Forestry | 21 (100.0%) | 0 (0.0%) |
| Construction & Extraction | 129 (100.0%) | 0 (0.0%) |
| Installation, Maintenance & Repair | 49 (100.0%) | 0 (0.0%) |
| Total (Category) | 199 (100.0%) | 0 (0.0%) |
| Total (Overall) | 729 (54.8%) | 601 (45.2%) |
Production, Transportation and Moving Occupations
The most common Production, Transportation and Moving occupations in Woodson County are Production (126 | 9.5%), Material Moving (69 | 5.2%), and Transportation (42 | 3.2%).
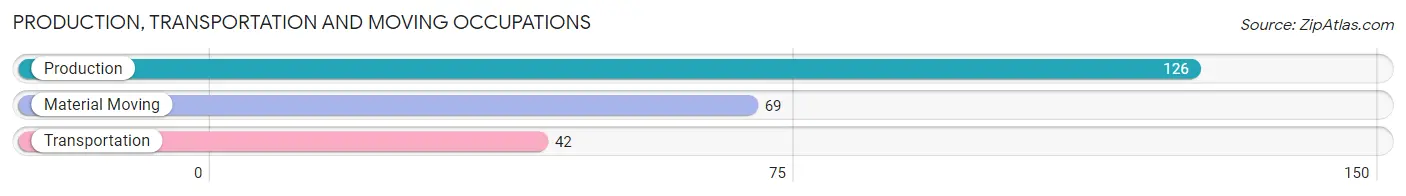
Production, Transportation and Moving Occupations by Sex
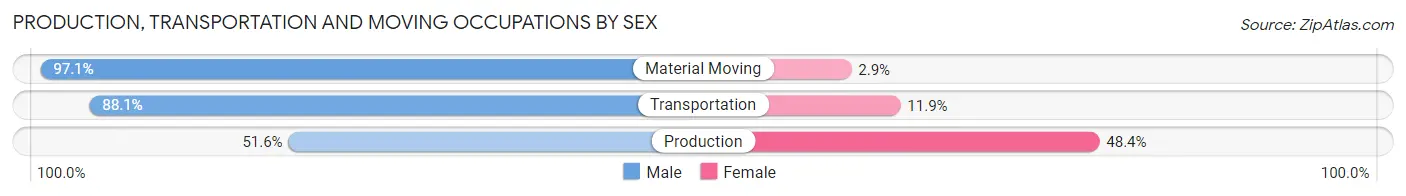
| Occupation | Male | Female |
| Production | 65 (51.6%) | 61 (48.4%) |
| Transportation | 37 (88.1%) | 5 (11.9%) |
| Material Moving | 67 (97.1%) | 2 (2.9%) |
| Total (Category) | 169 (71.3%) | 68 (28.7%) |
| Total (Overall) | 729 (54.8%) | 601 (45.2%) |
Employment Industries by Sex in Woodson County
Employment Industries in Woodson County
The major employment industries in Woodson County include Manufacturing (193 | 14.5%), Agriculture, Fishing & Hunting (164 | 12.3%), Educational Services (149 | 11.2%), Health Care & Social Assistance (143 | 10.7%), and Construction (119 | 8.9%).

Employment Industries by Sex in Woodson County
The Woodson County industries that see more men than women are Construction (97.5%), Utilities (93.9%), and Agriculture, Fishing & Hunting (91.5%), whereas the industries that tend to have a higher number of women are Real Estate, Rental & Leasing (100.0%), Arts, Entertainment & Recreation (100.0%), and Health Care & Social Assistance (92.3%).

| Industry | Male | Female |
| Agriculture, Fishing & Hunting | 150 (91.5%) | 14 (8.5%) |
| Mining, Quarrying, & Extraction | 41 (91.1%) | 4 (8.9%) |
| Construction | 116 (97.5%) | 3 (2.5%) |
| Manufacturing | 109 (56.5%) | 84 (43.5%) |
| Wholesale Trade | 12 (33.3%) | 24 (66.7%) |
| Retail Trade | 65 (57.5%) | 48 (42.5%) |
| Transportation & Warehousing | 39 (84.8%) | 7 (15.2%) |
| Utilities | 46 (93.9%) | 3 (6.1%) |
| Information | 8 (47.1%) | 9 (52.9%) |
| Finance & Insurance | 11 (30.6%) | 25 (69.4%) |
| Real Estate, Rental & Leasing | 0 (0.0%) | 1 (100.0%) |
| Professional & Scientific | 14 (77.8%) | 4 (22.2%) |
| Enterprise Management | 0 (0.0%) | 0 (0.0%) |
| Administrative & Support | 13 (76.5%) | 4 (23.5%) |
| Educational Services | 31 (20.8%) | 118 (79.2%) |
| Health Care & Social Assistance | 11 (7.7%) | 132 (92.3%) |
| Arts, Entertainment & Recreation | 0 (0.0%) | 1 (100.0%) |
| Accommodation & Food Services | 11 (29.7%) | 26 (70.3%) |
| Public Administration | 26 (37.7%) | 43 (62.3%) |
| Total | 729 (54.8%) | 601 (45.2%) |
Education in Woodson County
School Enrollment in Woodson County
The most common levels of schooling among the 632 students in Woodson County are high school (155 | 24.5%), middle school (150 | 23.7%), and elementary school (131 | 20.7%).
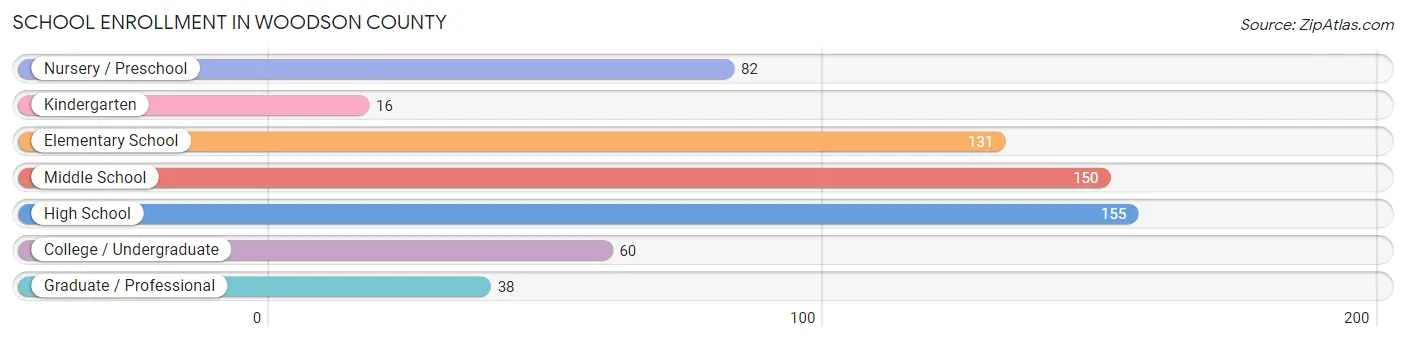
| School Level | # Students | % Students |
| Nursery / Preschool | 82 | 13.0% |
| Kindergarten | 16 | 2.5% |
| Elementary School | 131 | 20.7% |
| Middle School | 150 | 23.7% |
| High School | 155 | 24.5% |
| College / Undergraduate | 60 | 9.5% |
| Graduate / Professional | 38 | 6.0% |
| Total | 632 | 100.0% |
School Enrollment by Age by Funding Source in Woodson County
Out of a total of 632 students who are enrolled in schools in Woodson County, 51 (8.1%) attend a private institution, while the remaining 581 (91.9%) are enrolled in public schools. The age group of 25 to 34 year olds has the highest likelihood of being enrolled in private schools, with 7 (28.0% in the age bracket) enrolled. Conversely, the age group of 3 to 4 year olds has the lowest likelihood of being enrolled in a private school, with 55 (100.0% in the age bracket) attending a public institution.
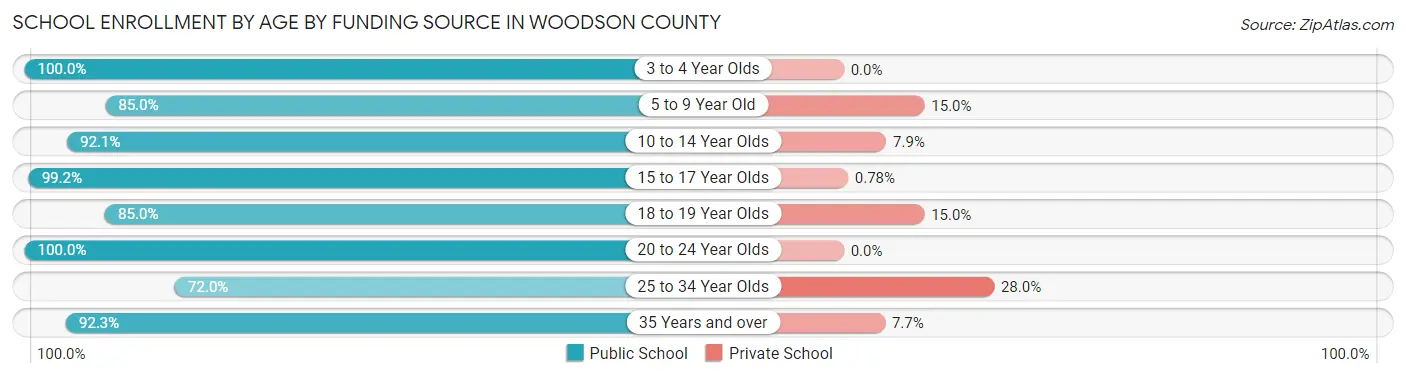
| Age Bracket | Public School | Private School |
| 3 to 4 Year Olds | 55 (100.0%) | 0 (0.0%) |
| 5 to 9 Year Old | 130 (85.0%) | 23 (15.0%) |
| 10 to 14 Year Olds | 163 (92.1%) | 14 (7.9%) |
| 15 to 17 Year Olds | 128 (99.2%) | 1 (0.8%) |
| 18 to 19 Year Olds | 17 (85.0%) | 3 (15.0%) |
| 20 to 24 Year Olds | 34 (100.0%) | 0 (0.0%) |
| 25 to 34 Year Olds | 18 (72.0%) | 7 (28.0%) |
| 35 Years and over | 36 (92.3%) | 3 (7.7%) |
| Total | 581 (91.9%) | 51 (8.1%) |
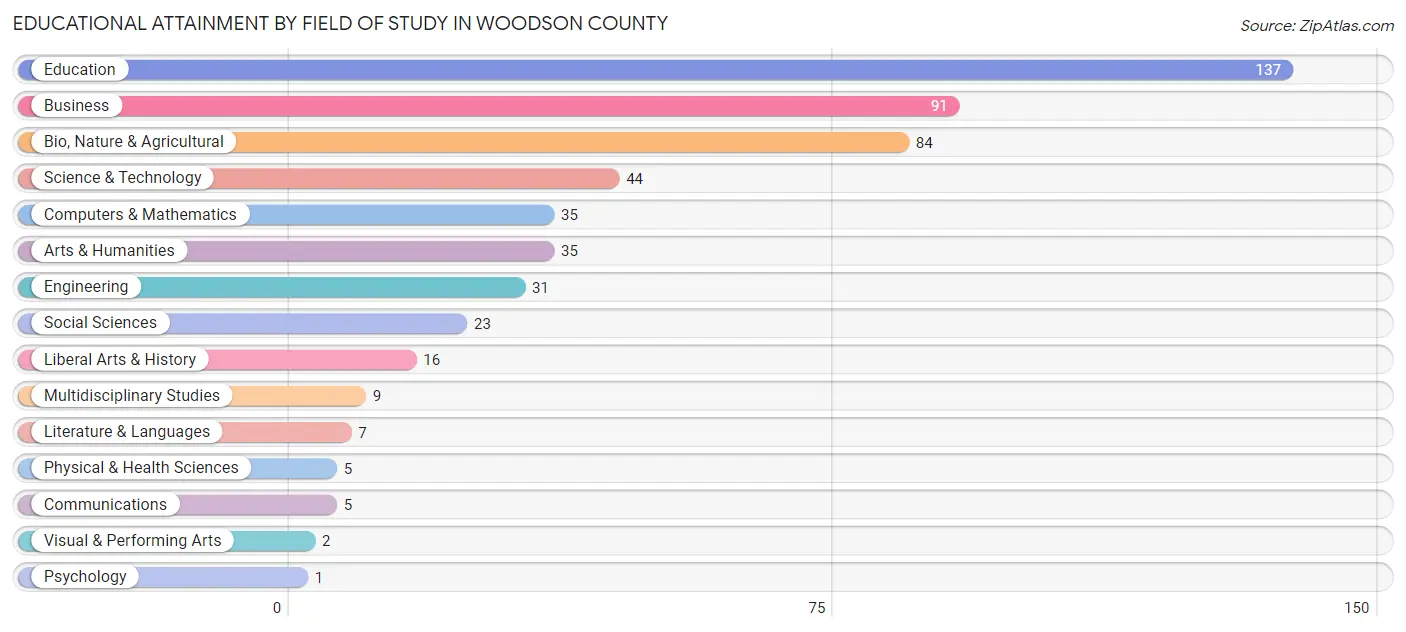
Educational Attainment by Field of Study in Woodson County
Education (137 | 26.1%), business (91 | 17.3%), bio, nature & agricultural (84 | 16.0%), science & technology (44 | 8.4%), and computers & mathematics (35 | 6.7%) are the most common fields of study among 525 individuals in Woodson County who have obtained a bachelor's degree or higher.
| Field of Study | # Graduates | % Graduates |
| Computers & Mathematics | 35 | 6.7% |
| Bio, Nature & Agricultural | 84 | 16.0% |
| Physical & Health Sciences | 5 | 0.9% |
| Psychology | 1 | 0.2% |
| Social Sciences | 23 | 4.4% |
| Engineering | 31 | 5.9% |
| Multidisciplinary Studies | 9 | 1.7% |
| Science & Technology | 44 | 8.4% |
| Business | 91 | 17.3% |
| Education | 137 | 26.1% |
| Literature & Languages | 7 | 1.3% |
| Liberal Arts & History | 16 | 3.0% |
| Visual & Performing Arts | 2 | 0.4% |
| Communications | 5 | 0.9% |
| Arts & Humanities | 35 | 6.7% |
| Total | 525 | 100.0% |
Transportation & Commute in Woodson County
Vehicle Availability by Sex in Woodson County
The most prevalent vehicle ownership categories in Woodson County are males with 2 vehicles (265, accounting for 37.6%) and females with 2 vehicles (203, making up 46.8%).
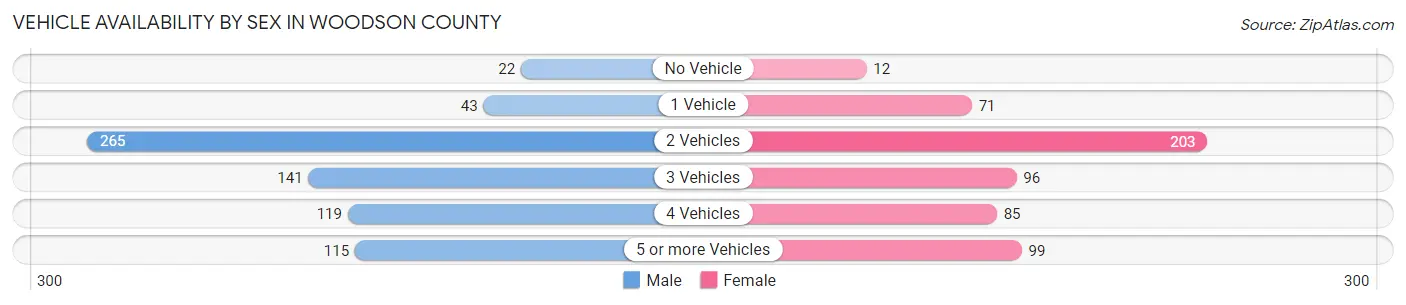
| Vehicles Available | Male | Female |
| No Vehicle | 22 (3.1%) | 12 (2.1%) |
| 1 Vehicle | 43 (6.1%) | 71 (12.5%) |
| 2 Vehicles | 265 (37.6%) | 203 (35.9%) |
| 3 Vehicles | 141 (20.0%) | 96 (17.0%) |
| 4 Vehicles | 119 (16.9%) | 85 (15.0%) |
| 5 or more Vehicles | 115 (16.3%) | 99 (17.5%) |
| Total | 705 (100.0%) | 566 (100.0%) |
Commute Time in Woodson County
The most frequently occuring commute durations in Woodson County are less than 5 minutes (207 commuters, 17.1%), 5 to 9 minutes (201 commuters, 16.6%), and 15 to 19 minutes (157 commuters, 13.0%).
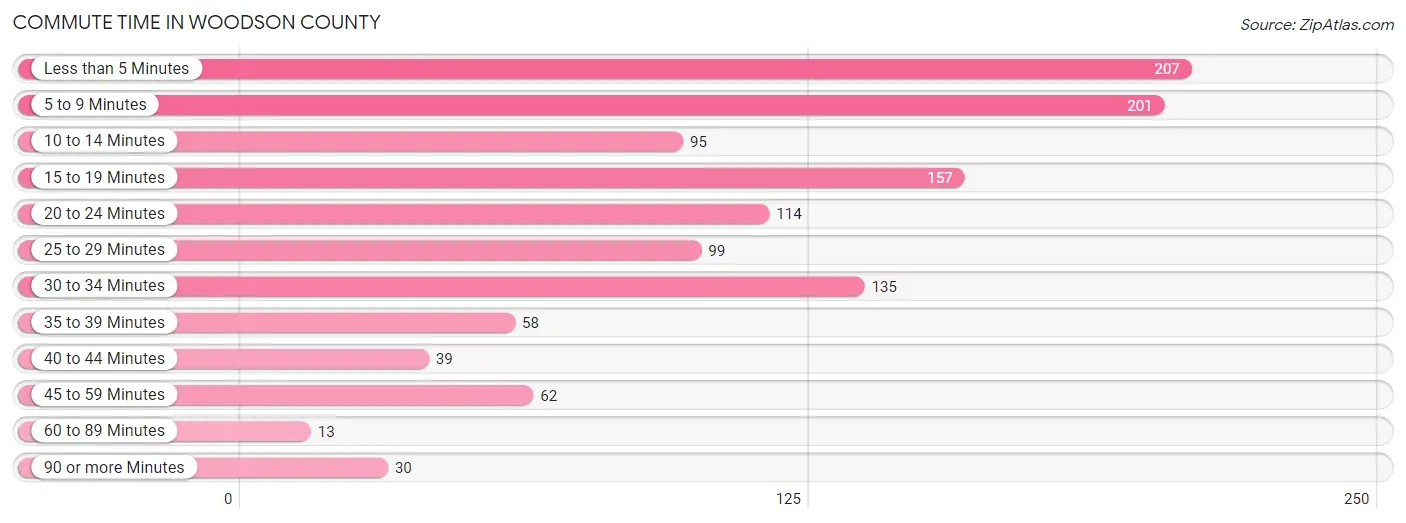
| Commute Time | # Commuters | % Commuters |
| Less than 5 Minutes | 207 | 17.1% |
| 5 to 9 Minutes | 201 | 16.6% |
| 10 to 14 Minutes | 95 | 7.9% |
| 15 to 19 Minutes | 157 | 13.0% |
| 20 to 24 Minutes | 114 | 9.4% |
| 25 to 29 Minutes | 99 | 8.2% |
| 30 to 34 Minutes | 135 | 11.2% |
| 35 to 39 Minutes | 58 | 4.8% |
| 40 to 44 Minutes | 39 | 3.2% |
| 45 to 59 Minutes | 62 | 5.1% |
| 60 to 89 Minutes | 13 | 1.1% |
| 90 or more Minutes | 30 | 2.5% |
Commute Time by Sex in Woodson County
The most common commute times in Woodson County are less than 5 minutes (136 commuters, 20.5%) for males and 5 to 9 minutes (142 commuters, 26.0%) for females.

| Commute Time | Male | Female |
| Less than 5 Minutes | 136 (20.5%) | 71 (13.0%) |
| 5 to 9 Minutes | 59 (8.9%) | 142 (26.0%) |
| 10 to 14 Minutes | 76 (11.5%) | 19 (3.5%) |
| 15 to 19 Minutes | 122 (18.4%) | 35 (6.4%) |
| 20 to 24 Minutes | 45 (6.8%) | 69 (12.6%) |
| 25 to 29 Minutes | 54 (8.1%) | 45 (8.2%) |
| 30 to 34 Minutes | 62 (9.3%) | 73 (13.4%) |
| 35 to 39 Minutes | 24 (3.6%) | 34 (6.2%) |
| 40 to 44 Minutes | 20 (3.0%) | 19 (3.5%) |
| 45 to 59 Minutes | 29 (4.4%) | 33 (6.0%) |
| 60 to 89 Minutes | 10 (1.5%) | 3 (0.5%) |
| 90 or more Minutes | 26 (3.9%) | 4 (0.7%) |
Time of Departure to Work by Sex in Woodson County
The most frequent times of departure to work in Woodson County are 8:00 AM to 8:29 AM (106, 16.0%) for males and 7:30 AM to 7:59 AM (125, 22.9%) for females.
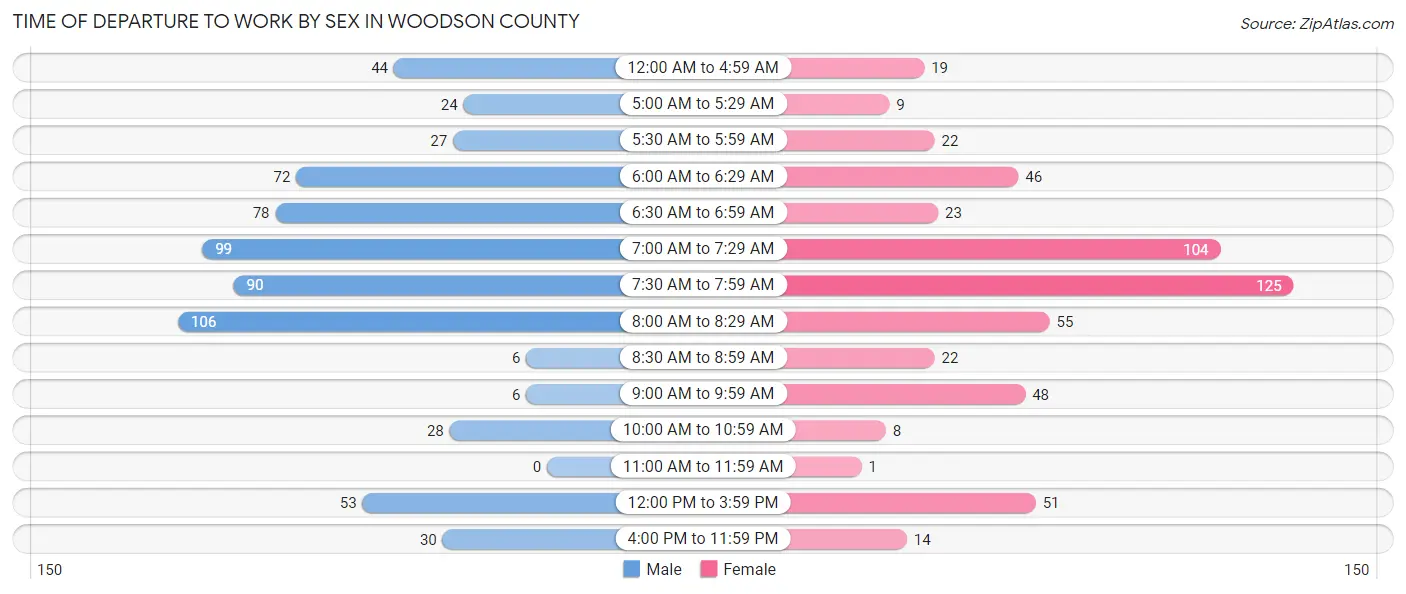
| Time of Departure | Male | Female |
| 12:00 AM to 4:59 AM | 44 (6.6%) | 19 (3.5%) |
| 5:00 AM to 5:29 AM | 24 (3.6%) | 9 (1.7%) |
| 5:30 AM to 5:59 AM | 27 (4.1%) | 22 (4.0%) |
| 6:00 AM to 6:29 AM | 72 (10.9%) | 46 (8.4%) |
| 6:30 AM to 6:59 AM | 78 (11.8%) | 23 (4.2%) |
| 7:00 AM to 7:29 AM | 99 (14.9%) | 104 (19.0%) |
| 7:30 AM to 7:59 AM | 90 (13.6%) | 125 (22.9%) |
| 8:00 AM to 8:29 AM | 106 (16.0%) | 55 (10.1%) |
| 8:30 AM to 8:59 AM | 6 (0.9%) | 22 (4.0%) |
| 9:00 AM to 9:59 AM | 6 (0.9%) | 48 (8.8%) |
| 10:00 AM to 10:59 AM | 28 (4.2%) | 8 (1.5%) |
| 11:00 AM to 11:59 AM | 0 (0.0%) | 1 (0.2%) |
| 12:00 PM to 3:59 PM | 53 (8.0%) | 51 (9.3%) |
| 4:00 PM to 11:59 PM | 30 (4.5%) | 14 (2.6%) |
| Total | 663 (100.0%) | 547 (100.0%) |
Housing Occupancy in Woodson County
Occupancy by Ownership in Woodson County
Of the total 1,213 dwellings in Woodson County, owner-occupied units account for 993 (81.9%), while renter-occupied units make up 220 (18.1%).
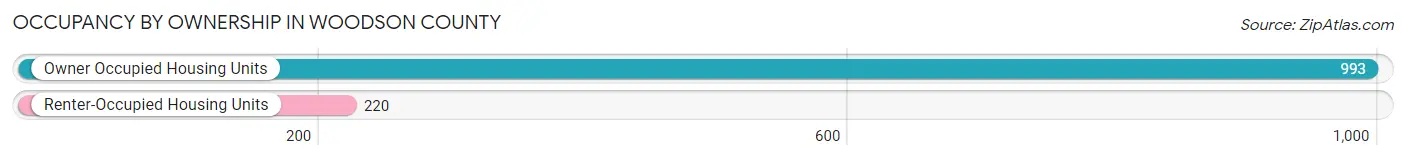
| Occupancy | # Housing Units | % Housing Units |
| Owner Occupied Housing Units | 993 | 81.9% |
| Renter-Occupied Housing Units | 220 | 18.1% |
| Total Occupied Housing Units | 1,213 | 100.0% |
Occupancy by Household Size in Woodson County
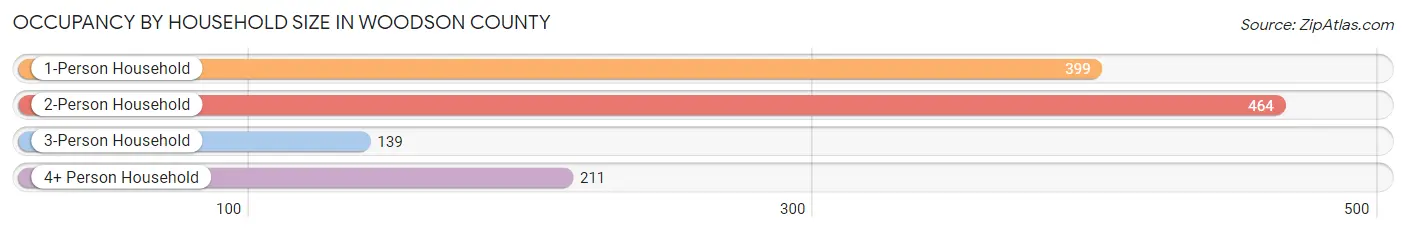
| Household Size | # Housing Units | % Housing Units |
| 1-Person Household | 399 | 32.9% |
| 2-Person Household | 464 | 38.3% |
| 3-Person Household | 139 | 11.5% |
| 4+ Person Household | 211 | 17.4% |
| Total Housing Units | 1,213 | 100.0% |
Occupancy by Ownership by Household Size in Woodson County
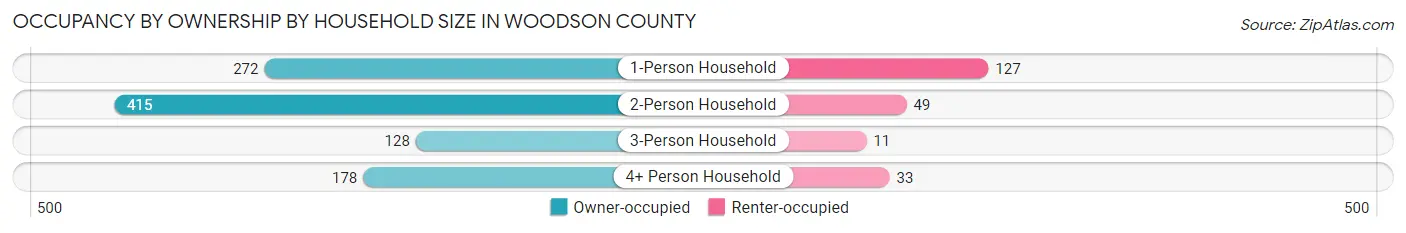
| Household Size | Owner-occupied | Renter-occupied |
| 1-Person Household | 272 (68.2%) | 127 (31.8%) |
| 2-Person Household | 415 (89.4%) | 49 (10.6%) |
| 3-Person Household | 128 (92.1%) | 11 (7.9%) |
| 4+ Person Household | 178 (84.4%) | 33 (15.6%) |
| Total Housing Units | 993 (81.9%) | 220 (18.1%) |
Occupancy by Educational Attainment in Woodson County

| Household Size | Owner-occupied | Renter-occupied |
| Less than High School | 49 (65.3%) | 26 (34.7%) |
| High School Diploma | 334 (82.7%) | 70 (17.3%) |
| College/Associate Degree | 338 (81.1%) | 79 (18.9%) |
| Bachelor's Degree or higher | 272 (85.8%) | 45 (14.2%) |
Occupancy by Age of Householder in Woodson County
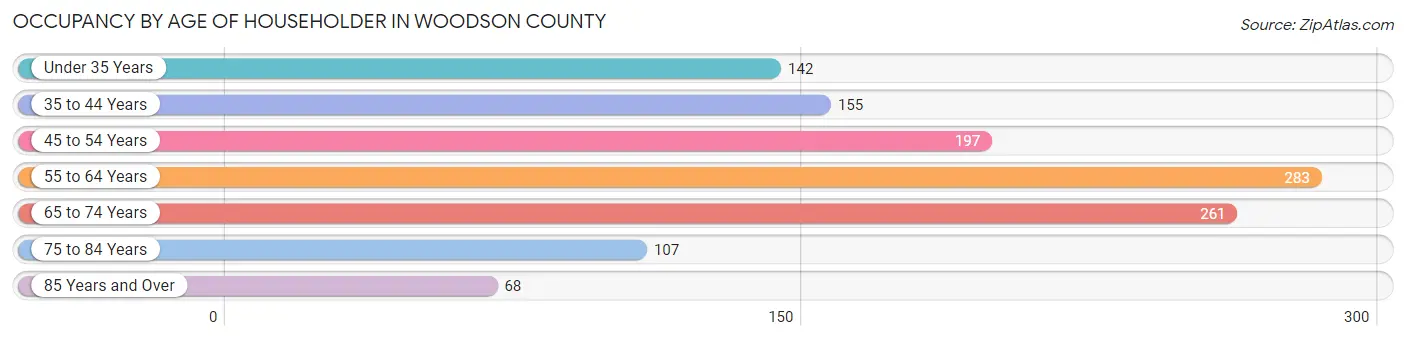
| Age Bracket | # Households | % Households |
| Under 35 Years | 142 | 11.7% |
| 35 to 44 Years | 155 | 12.8% |
| 45 to 54 Years | 197 | 16.2% |
| 55 to 64 Years | 283 | 23.3% |
| 65 to 74 Years | 261 | 21.5% |
| 75 to 84 Years | 107 | 8.8% |
| 85 Years and Over | 68 | 5.6% |
| Total | 1,213 | 100.0% |
Housing Finances in Woodson County
Median Income by Occupancy in Woodson County

| Occupancy Type | # Households | Median Income |
| Owner-Occupied | 993 (81.9%) | $56,563 |
| Renter-Occupied | 220 (18.1%) | $26,786 |
| Average | 1,213 (100.0%) | $50,670 |
Occupancy by Householder Income Bracket in Woodson County
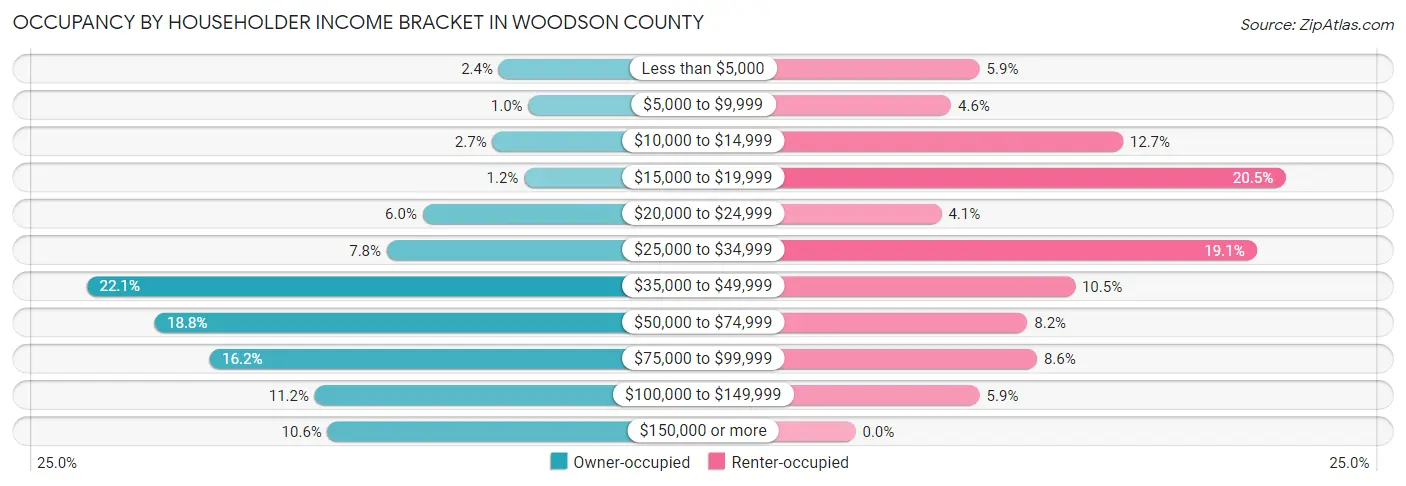
| Income Bracket | Owner-occupied | Renter-occupied |
| Less than $5,000 | 24 (2.4%) | 13 (5.9%) |
| $5,000 to $9,999 | 10 (1.0%) | 10 (4.5%) |
| $10,000 to $14,999 | 27 (2.7%) | 28 (12.7%) |
| $15,000 to $19,999 | 12 (1.2%) | 45 (20.4%) |
| $20,000 to $24,999 | 60 (6.0%) | 9 (4.1%) |
| $25,000 to $34,999 | 77 (7.7%) | 42 (19.1%) |
| $35,000 to $49,999 | 219 (22.1%) | 23 (10.4%) |
| $50,000 to $74,999 | 187 (18.8%) | 18 (8.2%) |
| $75,000 to $99,999 | 161 (16.2%) | 19 (8.6%) |
| $100,000 to $149,999 | 111 (11.2%) | 13 (5.9%) |
| $150,000 or more | 105 (10.6%) | 0 (0.0%) |
| Total | 993 (100.0%) | 220 (100.0%) |
Monthly Housing Cost Tiers in Woodson County
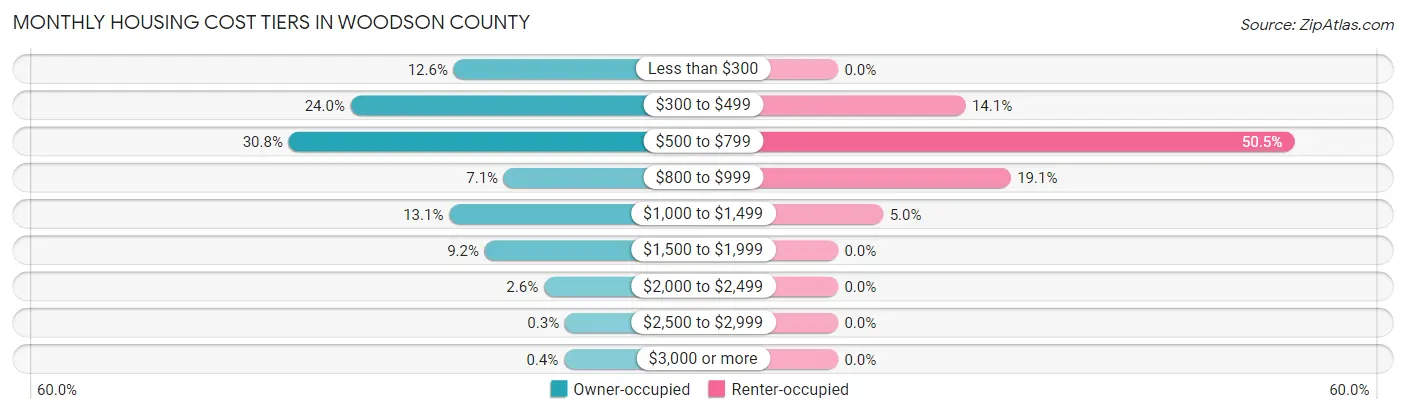
| Monthly Cost | Owner-occupied | Renter-occupied |
| Less than $300 | 125 (12.6%) | 0 (0.0%) |
| $300 to $499 | 238 (24.0%) | 31 (14.1%) |
| $500 to $799 | 306 (30.8%) | 111 (50.4%) |
| $800 to $999 | 70 (7.0%) | 42 (19.1%) |
| $1,000 to $1,499 | 130 (13.1%) | 11 (5.0%) |
| $1,500 to $1,999 | 91 (9.2%) | 0 (0.0%) |
| $2,000 to $2,499 | 26 (2.6%) | 0 (0.0%) |
| $2,500 to $2,999 | 3 (0.3%) | 0 (0.0%) |
| $3,000 or more | 4 (0.4%) | 0 (0.0%) |
| Total | 993 (100.0%) | 220 (100.0%) |
Physical Housing Characteristics in Woodson County
Housing Structures in Woodson County

| Structure Type | # Housing Units | % Housing Units |
| Single Unit, Detached | 1,025 | 84.5% |
| Single Unit, Attached | 18 | 1.5% |
| 2 Unit Apartments | 36 | 3.0% |
| 3 or 4 Unit Apartments | 16 | 1.3% |
| 5 to 9 Unit Apartments | 11 | 0.9% |
| 10 or more Apartments | 9 | 0.7% |
| Mobile Home / Other | 98 | 8.1% |
| Total | 1,213 | 100.0% |
Housing Structures by Occupancy in Woodson County
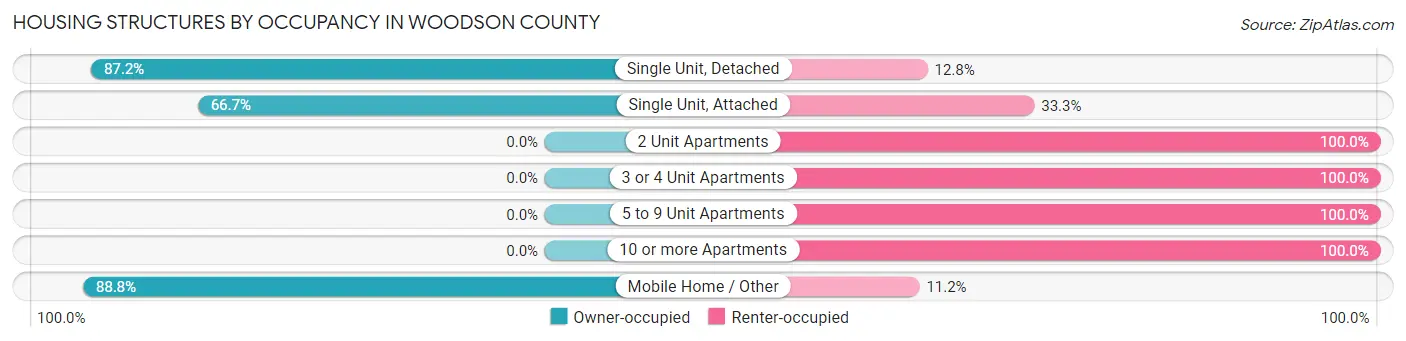
| Structure Type | Owner-occupied | Renter-occupied |
| Single Unit, Detached | 894 (87.2%) | 131 (12.8%) |
| Single Unit, Attached | 12 (66.7%) | 6 (33.3%) |
| 2 Unit Apartments | 0 (0.0%) | 36 (100.0%) |
| 3 or 4 Unit Apartments | 0 (0.0%) | 16 (100.0%) |
| 5 to 9 Unit Apartments | 0 (0.0%) | 11 (100.0%) |
| 10 or more Apartments | 0 (0.0%) | 9 (100.0%) |
| Mobile Home / Other | 87 (88.8%) | 11 (11.2%) |
| Total | 993 (81.9%) | 220 (18.1%) |
Housing Structures by Number of Rooms in Woodson County

| Number of Rooms | Owner-occupied | Renter-occupied |
| 1 Room | 7 (0.7%) | 0 (0.0%) |
| 2 or 3 Rooms | 74 (7.4%) | 47 (21.4%) |
| 4 or 5 Rooms | 233 (23.5%) | 90 (40.9%) |
| 6 or 7 Rooms | 420 (42.3%) | 59 (26.8%) |
| 8 or more Rooms | 259 (26.1%) | 24 (10.9%) |
| Total | 993 (100.0%) | 220 (100.0%) |
Housing Structure by Heating Type in Woodson County
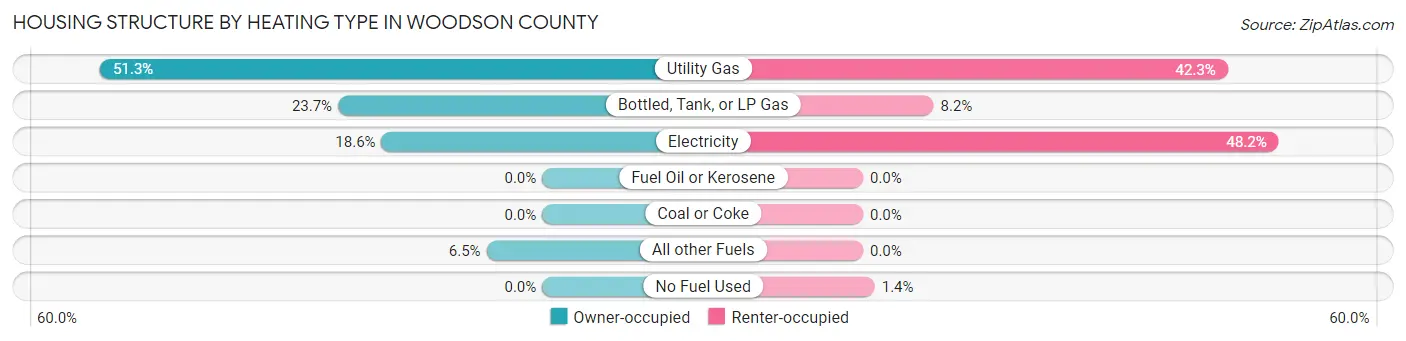
| Heating Type | Owner-occupied | Renter-occupied |
| Utility Gas | 509 (51.3%) | 93 (42.3%) |
| Bottled, Tank, or LP Gas | 235 (23.7%) | 18 (8.2%) |
| Electricity | 185 (18.6%) | 106 (48.2%) |
| Fuel Oil or Kerosene | 0 (0.0%) | 0 (0.0%) |
| Coal or Coke | 0 (0.0%) | 0 (0.0%) |
| All other Fuels | 64 (6.5%) | 0 (0.0%) |
| No Fuel Used | 0 (0.0%) | 3 (1.4%) |
| Total | 993 (100.0%) | 220 (100.0%) |
Household Vehicle Usage in Woodson County
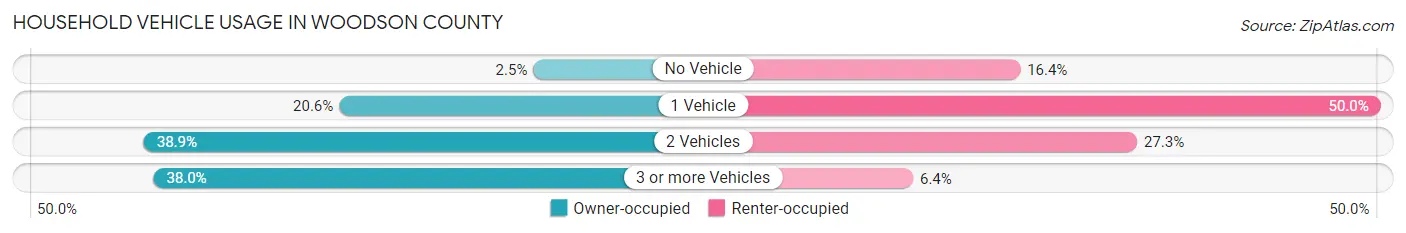
| Vehicles per Household | Owner-occupied | Renter-occupied |
| No Vehicle | 25 (2.5%) | 36 (16.4%) |
| 1 Vehicle | 205 (20.6%) | 110 (50.0%) |
| 2 Vehicles | 386 (38.9%) | 60 (27.3%) |
| 3 or more Vehicles | 377 (38.0%) | 14 (6.4%) |
| Total | 993 (100.0%) | 220 (100.0%) |
Real Estate & Mortgages in Woodson County
Real Estate and Mortgage Overview in Woodson County
| Characteristic | Without Mortgage | With Mortgage |
| Housing Units | 691 | 302 |
| Median Property Value | $58,000 | $112,000 |
| Median Household Income | $44,896 | $45 |
| Monthly Housing Costs | $493 | $4 |
| Real Estate Taxes | $1,262 | $4 |
Property Value by Mortgage Status in Woodson County
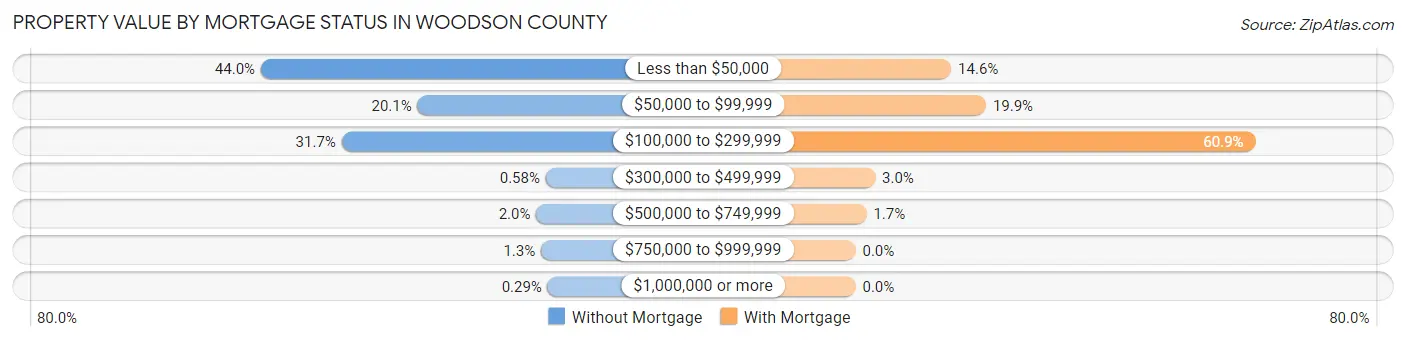
| Property Value | Without Mortgage | With Mortgage |
| Less than $50,000 | 304 (44.0%) | 44 (14.6%) |
| $50,000 to $99,999 | 139 (20.1%) | 60 (19.9%) |
| $100,000 to $299,999 | 219 (31.7%) | 184 (60.9%) |
| $300,000 to $499,999 | 4 (0.6%) | 9 (3.0%) |
| $500,000 to $749,999 | 14 (2.0%) | 5 (1.7%) |
| $750,000 to $999,999 | 9 (1.3%) | 0 (0.0%) |
| $1,000,000 or more | 2 (0.3%) | 0 (0.0%) |
| Total | 691 (100.0%) | 302 (100.0%) |
Household Income by Mortgage Status in Woodson County
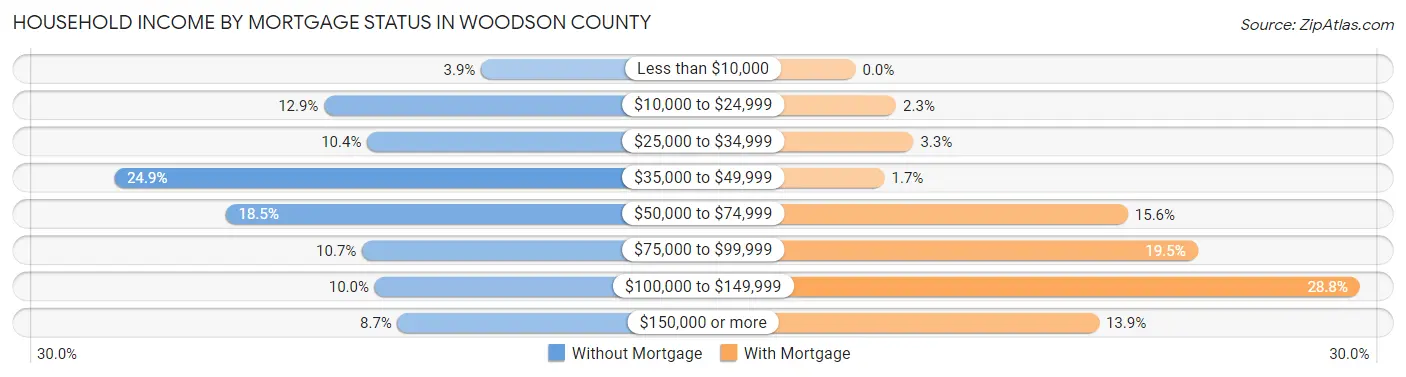
| Household Income | Without Mortgage | With Mortgage |
| Less than $10,000 | 27 (3.9%) | 0 (0.0%) |
| $10,000 to $24,999 | 89 (12.9%) | 7 (2.3%) |
| $25,000 to $34,999 | 72 (10.4%) | 10 (3.3%) |
| $35,000 to $49,999 | 172 (24.9%) | 5 (1.7%) |
| $50,000 to $74,999 | 128 (18.5%) | 47 (15.6%) |
| $75,000 to $99,999 | 74 (10.7%) | 59 (19.5%) |
| $100,000 to $149,999 | 69 (10.0%) | 87 (28.8%) |
| $150,000 or more | 60 (8.7%) | 42 (13.9%) |
| Total | 691 (100.0%) | 302 (100.0%) |
Property Value to Household Income Ratio in Woodson County
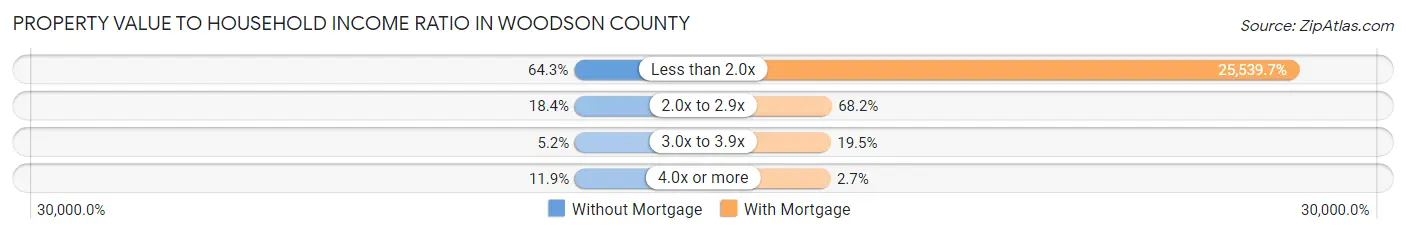
| Value-to-Income Ratio | Without Mortgage | With Mortgage |
| Less than 2.0x | 444 (64.2%) | 77,130 (25,539.7%) |
| 2.0x to 2.9x | 127 (18.4%) | 206 (68.2%) |
| 3.0x to 3.9x | 36 (5.2%) | 59 (19.5%) |
| 4.0x or more | 82 (11.9%) | 8 (2.6%) |
| Total | 691 (100.0%) | 302 (100.0%) |
Real Estate Taxes by Mortgage Status in Woodson County
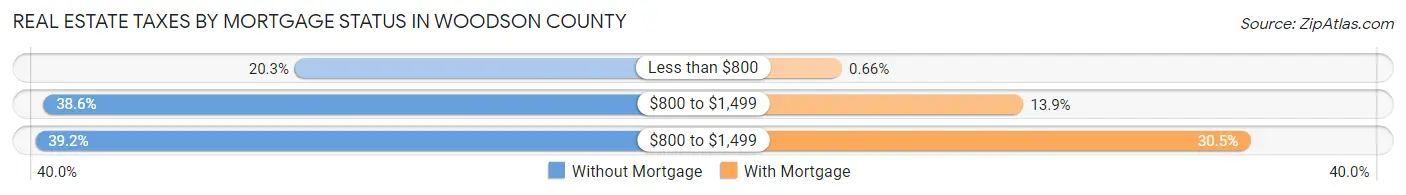
| Property Taxes | Without Mortgage | With Mortgage |
| Less than $800 | 140 (20.3%) | 2 (0.7%) |
| $800 to $1,499 | 267 (38.6%) | 42 (13.9%) |
| $800 to $1,499 | 271 (39.2%) | 92 (30.5%) |
| Total | 691 (100.0%) | 302 (100.0%) |
Health & Disability in Woodson County
Health Insurance Coverage by Age in Woodson County
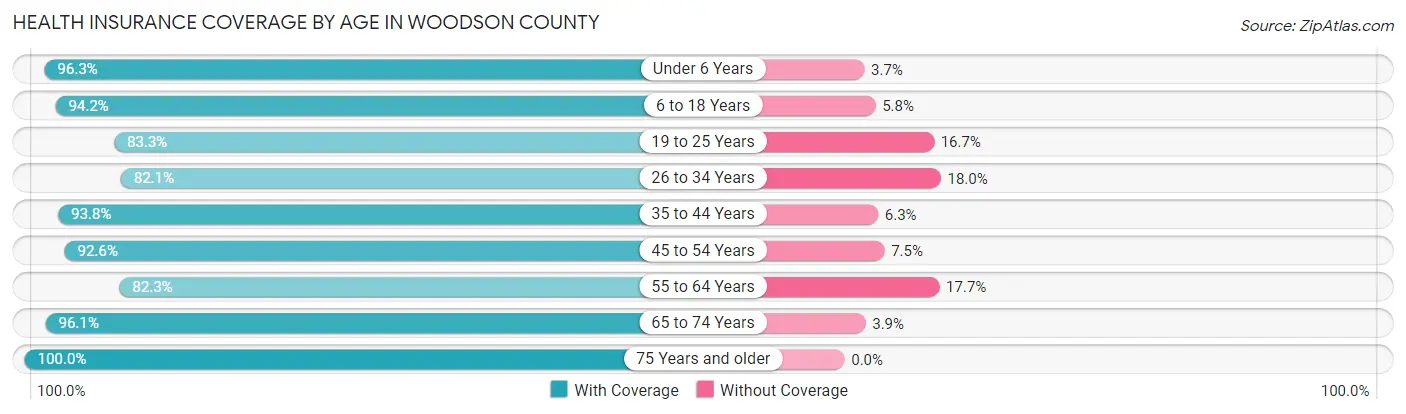
| Age Bracket | With Coverage | Without Coverage |
| Under 6 Years | 208 (96.3%) | 8 (3.7%) |
| 6 to 18 Years | 442 (94.2%) | 27 (5.8%) |
| 19 to 25 Years | 135 (83.3%) | 27 (16.7%) |
| 26 to 34 Years | 224 (82.1%) | 49 (17.9%) |
| 35 to 44 Years | 375 (93.8%) | 25 (6.2%) |
| 45 to 54 Years | 298 (92.5%) | 24 (7.4%) |
| 55 to 64 Years | 414 (82.3%) | 89 (17.7%) |
| 65 to 74 Years | 442 (96.1%) | 18 (3.9%) |
| 75 Years and older | 312 (100.0%) | 0 (0.0%) |
| Total | 2,850 (91.4%) | 267 (8.6%) |
Health Insurance Coverage by Citizenship Status in Woodson County

| Citizenship Status | With Coverage | Without Coverage |
| Native Born | 208 (96.3%) | 8 (3.7%) |
| Foreign Born, Citizen | 442 (94.2%) | 27 (5.8%) |
| Foreign Born, not a Citizen | 135 (83.3%) | 27 (16.7%) |
Health Insurance Coverage by Household Income in Woodson County
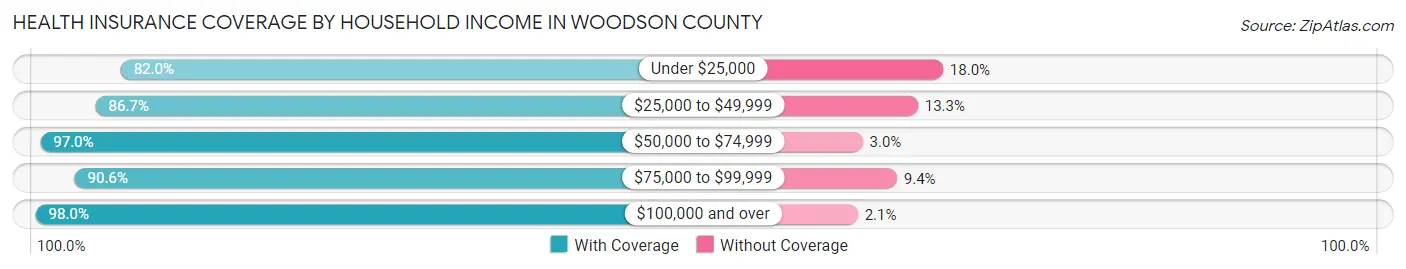
| Household Income | With Coverage | Without Coverage |
| Under $25,000 | 387 (82.0%) | 85 (18.0%) |
| $25,000 to $49,999 | 639 (86.7%) | 98 (13.3%) |
| $50,000 to $74,999 | 623 (97.0%) | 19 (3.0%) |
| $75,000 to $99,999 | 483 (90.6%) | 50 (9.4%) |
| $100,000 and over | 718 (98.0%) | 15 (2.1%) |
Public vs Private Health Insurance Coverage by Age in Woodson County
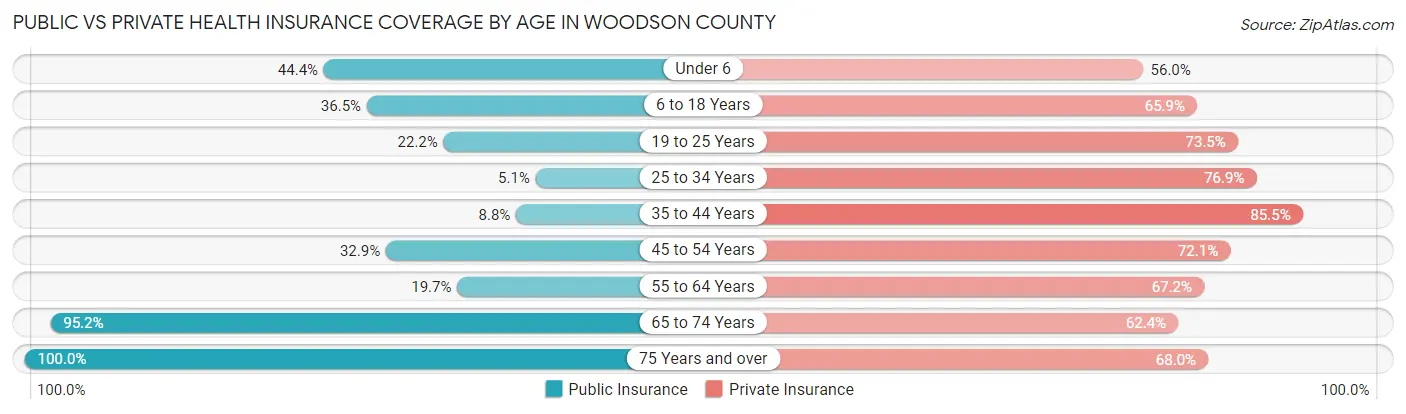
| Age Bracket | Public Insurance | Private Insurance |
| Under 6 | 96 (44.4%) | 121 (56.0%) |
| 6 to 18 Years | 171 (36.5%) | 309 (65.9%) |
| 19 to 25 Years | 36 (22.2%) | 119 (73.5%) |
| 25 to 34 Years | 14 (5.1%) | 210 (76.9%) |
| 35 to 44 Years | 35 (8.7%) | 342 (85.5%) |
| 45 to 54 Years | 106 (32.9%) | 232 (72.1%) |
| 55 to 64 Years | 99 (19.7%) | 338 (67.2%) |
| 65 to 74 Years | 438 (95.2%) | 287 (62.4%) |
| 75 Years and over | 312 (100.0%) | 212 (67.9%) |
| Total | 1,307 (41.9%) | 2,170 (69.6%) |
Disability Status by Sex by Age in Woodson County
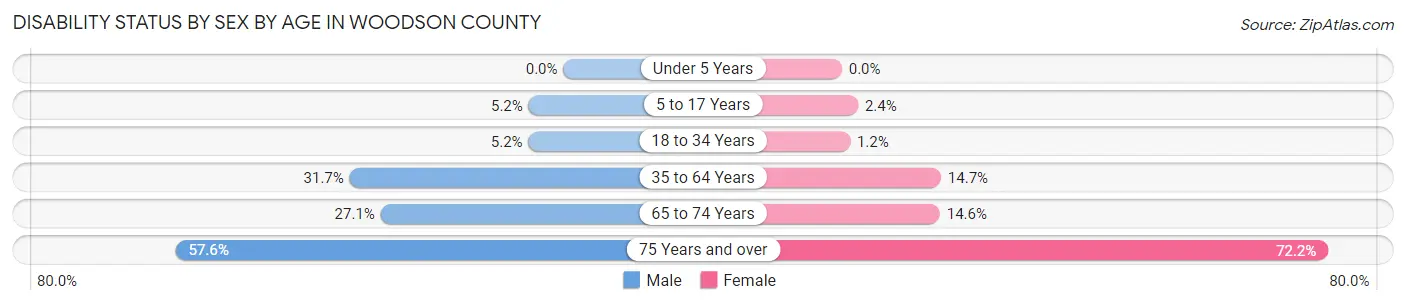
| Age Bracket | Male | Female |
| Under 5 Years | 0 (0.0%) | 0 (0.0%) |
| 5 to 17 Years | 11 (5.2%) | 6 (2.4%) |
| 18 to 34 Years | 12 (5.2%) | 3 (1.2%) |
| 35 to 64 Years | 212 (31.7%) | 82 (14.7%) |
| 65 to 74 Years | 67 (27.1%) | 31 (14.5%) |
| 75 Years and over | 76 (57.6%) | 130 (72.2%) |
Disability Class by Sex by Age in Woodson County
Disability Class: Hearing Difficulty

| Age Bracket | Male | Female |
| Under 5 Years | 0 (0.0%) | 0 (0.0%) |
| 5 to 17 Years | 1 (0.5%) | 2 (0.8%) |
| 18 to 34 Years | 0 (0.0%) | 0 (0.0%) |
| 35 to 64 Years | 52 (7.8%) | 3 (0.5%) |
| 65 to 74 Years | 56 (22.7%) | 0 (0.0%) |
| 75 Years and over | 41 (31.1%) | 33 (18.3%) |
Disability Class: Vision Difficulty
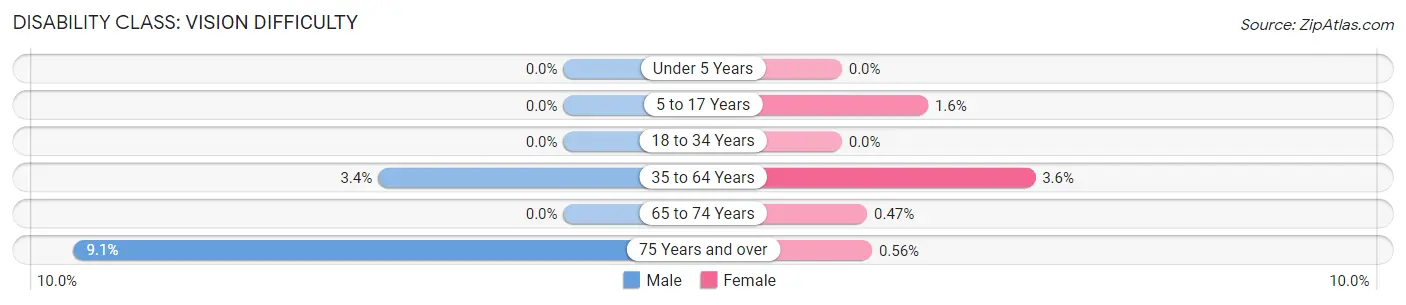
| Age Bracket | Male | Female |
| Under 5 Years | 0 (0.0%) | 0 (0.0%) |
| 5 to 17 Years | 0 (0.0%) | 4 (1.6%) |
| 18 to 34 Years | 0 (0.0%) | 0 (0.0%) |
| 35 to 64 Years | 23 (3.4%) | 20 (3.6%) |
| 65 to 74 Years | 0 (0.0%) | 1 (0.5%) |
| 75 Years and over | 12 (9.1%) | 1 (0.6%) |
Disability Class: Cognitive Difficulty
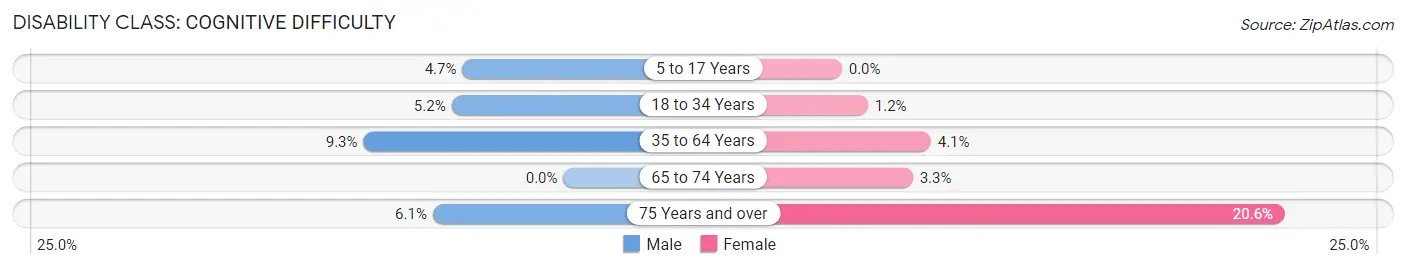
| Age Bracket | Male | Female |
| 5 to 17 Years | 10 (4.7%) | 0 (0.0%) |
| 18 to 34 Years | 12 (5.2%) | 3 (1.2%) |
| 35 to 64 Years | 62 (9.3%) | 23 (4.1%) |
| 65 to 74 Years | 0 (0.0%) | 7 (3.3%) |
| 75 Years and over | 8 (6.1%) | 37 (20.6%) |
Disability Class: Ambulatory Difficulty

| Age Bracket | Male | Female |
| 5 to 17 Years | 0 (0.0%) | 0 (0.0%) |
| 18 to 34 Years | 1 (0.4%) | 0 (0.0%) |
| 35 to 64 Years | 116 (17.4%) | 71 (12.8%) |
| 65 to 74 Years | 15 (6.1%) | 26 (12.2%) |
| 75 Years and over | 49 (37.1%) | 45 (25.0%) |
Disability Class: Self-Care Difficulty
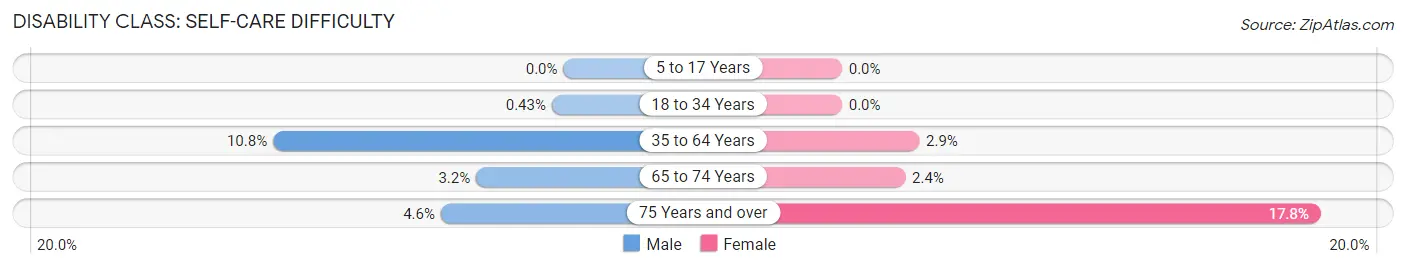
| Age Bracket | Male | Female |
| 5 to 17 Years | 0 (0.0%) | 0 (0.0%) |
| 18 to 34 Years | 1 (0.4%) | 0 (0.0%) |
| 35 to 64 Years | 72 (10.8%) | 16 (2.9%) |
| 65 to 74 Years | 8 (3.2%) | 5 (2.4%) |
| 75 Years and over | 6 (4.5%) | 32 (17.8%) |
Technology Access in Woodson County
Computing Device Access in Woodson County
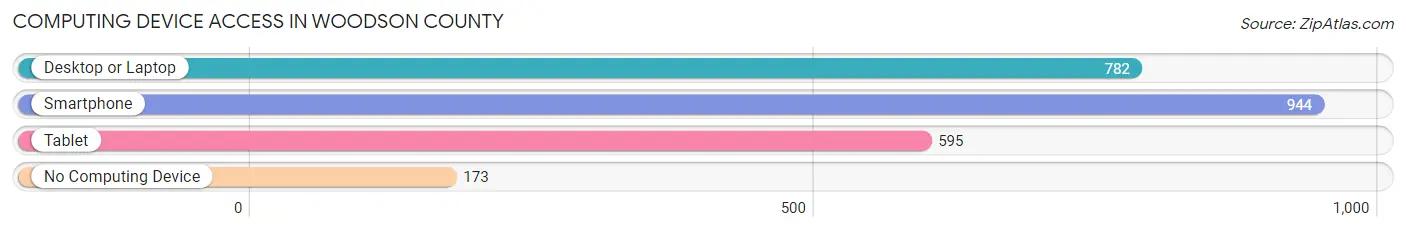
| Device Type | # Households | % Households |
| Desktop or Laptop | 782 | 64.5% |
| Smartphone | 944 | 77.8% |
| Tablet | 595 | 49.0% |
| No Computing Device | 173 | 14.3% |
| Total | 1,213 | 100.0% |
Internet Access in Woodson County
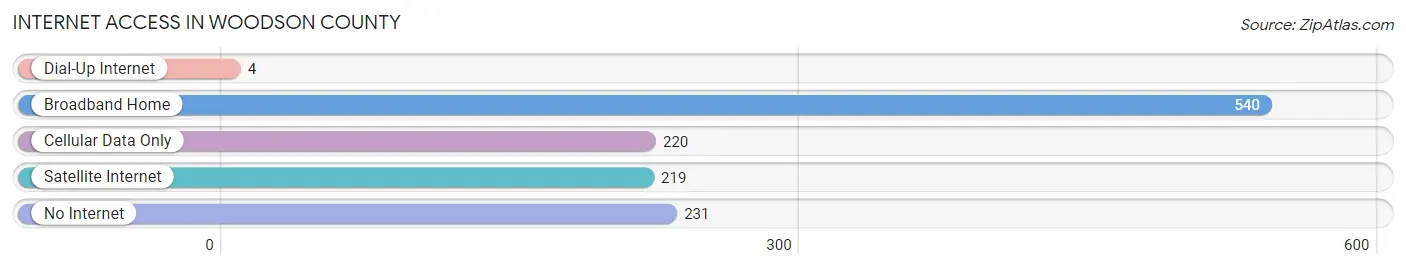
| Internet Type | # Households | % Households |
| Dial-Up Internet | 4 | 0.3% |
| Broadband Home | 540 | 44.5% |
| Cellular Data Only | 220 | 18.1% |
| Satellite Internet | 219 | 18.0% |
| No Internet | 231 | 19.0% |
| Total | 1,213 | 100.0% |
Woodson County Summary
Woodson County, Kansas is located in the southeastern corner of the state, and is bordered by Allen, Anderson, Coffey, and Wilson counties. The county seat is Yates Center, and the county was named after George Woodson, a prominent early settler. The county has a total area of 576 square miles, and a population of 8,845 as of the 2010 census.
Geography
Woodson County is located in the eastern part of the Flint Hills region of Kansas. The county is mostly flat, with rolling hills in the western part. The Neosho River runs through the county, and there are several small creeks and streams. The county is mostly covered in grassland, with some areas of woodland.
History
Woodson County was established in 1855, and was named after George Woodson, a prominent early settler. The county was originally part of the Osage Indian Reservation, and was opened to settlement in 1854. The first settlers arrived in 1855, and the county was officially organized in 1857.
The county was largely agricultural, with the main crops being wheat, corn, and hay. The county also had several small coal mines, which provided employment for many of the residents.
Economy
The economy of Woodson County is largely based on agriculture. The main crops are wheat, corn, and hay, and there are also several small livestock farms. The county also has several small businesses, including a few manufacturing companies.
The county is also home to several state parks, including the Woodson State Fishing Lake, which provides recreational opportunities for visitors.
Demographics
As of the 2010 census, Woodson County had a population of 8,845. The racial makeup of the county was 95.3% White, 0.7% African American, 0.4% Native American, 0.2% Asian, 0.1% Pacific Islander, 1.7% from other races, and 1.6% from two or more races. Hispanic or Latino of any race were 3.2% of the population.
The median income for a household in the county was $41,945, and the median income for a family was $50,945. The per capita income for the county was $20,845. About 11.2% of families and 14.2% of the population were below the poverty line, including 19.2% of those under age 18 and 8.2% of those age 65 or over.
Woodson County is a rural county with a strong agricultural base. The county has a diverse population, and is home to several state parks and recreational areas. The county has a strong economy, and is a great place to live and work.
Common Questions
What is the Total Population of Woodson County?
Total Population of Woodson County is 3,134.
What is the Total Male Population of Woodson County?
Total Male Population of Woodson County is 1,602.
What is the Total Female Population of Woodson County?
Total Female Population of Woodson County is 1,532.
What is the Ratio of Males per 100 Females in Woodson County?
There are 104.57 Males per 100 Females in Woodson County.
What is the Ratio of Females per 100 Males in Woodson County?
There are 95.63 Females per 100 Males in Woodson County.
What is the Median Population Age in Woodson County?
Median Population Age in Woodson County is 46.6 Years.
What is the Average Family Size in Woodson County
Average Family Size in Woodson County is 3.2 People.
What is the Average Household Size in Woodson County
Average Household Size in Woodson County is 2.6 People.
What is Per Capita Income in Woodson County?
Per Capita income in Woodson County is $28,380.
What is the Median Family Income in Woodson County?
Median Family Income in Woodson County is $72,772.
What is the Median Household income in Woodson County?
Median Household Income in Woodson County is $50,670.
What is Income or Wage Gap in Woodson County?
Income or Wage Gap in Woodson County is 31.8%.
Women in Woodson County earn 68.2 cents for every dollar earned by a man.
What is Inequality or Gini Index in Woodson County?
Inequality or Gini Index in Woodson County is 0.43.
How Large is the Labor Force in Woodson County?
There are 1,418 People in the Labor Forcein in Woodson County.
What is the Percentage of People in the Labor Force in Woodson County?
54.9% of People are in the Labor Force in Woodson County.
What is the Unemployment Rate in Woodson County?
Unemployment Rate in Woodson County is 6.2%.