Sumner County, KS
Sumner County Map
Sumner County Overview
22,517
TOTAL POPULATION
11,374
MALE POPULATION
11,143
FEMALE POPULATION
102.07
MALES / 100 FEMALES
97.97
FEMALES / 100 MALES
42.0
MEDIAN AGE
3.2
AVG FAMILY SIZE
2.5
AVG HOUSEHOLD SIZE
$31,072
PER CAPITA INCOME
$82,727
AVG FAMILY INCOME
$59,397
AVG HOUSEHOLD INCOME
38.1%
WAGE / INCOME GAP [ % ]
61.9¢/ $1
WAGE / INCOME GAP [ $ ]
$8,206
FAMILY INCOME DEFICIT
0.41
INEQUALITY / GINI INDEX
10,515
LABOR FORCE [ PEOPLE ]
59.3%
PERCENT IN LABOR FORCE
5.2%
UNEMPLOYMENT RATE
Sumner County Area Codes
Race in Sumner County
The most populous races in Sumner County are White / Caucasian (20,464 | 90.9%), Hispanic or Latino (1,326 | 5.9%), and Two or more Races (932 | 4.1%).

| Race | # Population | % Population |
| Asian | 136 | 0.6% |
| Black / African American | 225 | 1.0% |
| Hawaiian / Pacific | 0 | 0.0% |
| Hispanic or Latino | 1,326 | 5.9% |
| Native / Alaskan | 551 | 2.5% |
| White / Caucasian | 20,464 | 90.9% |
| Two or more Races | 932 | 4.1% |
| Some other Race | 209 | 0.9% |
| Total | 22,517 | 100.0% |
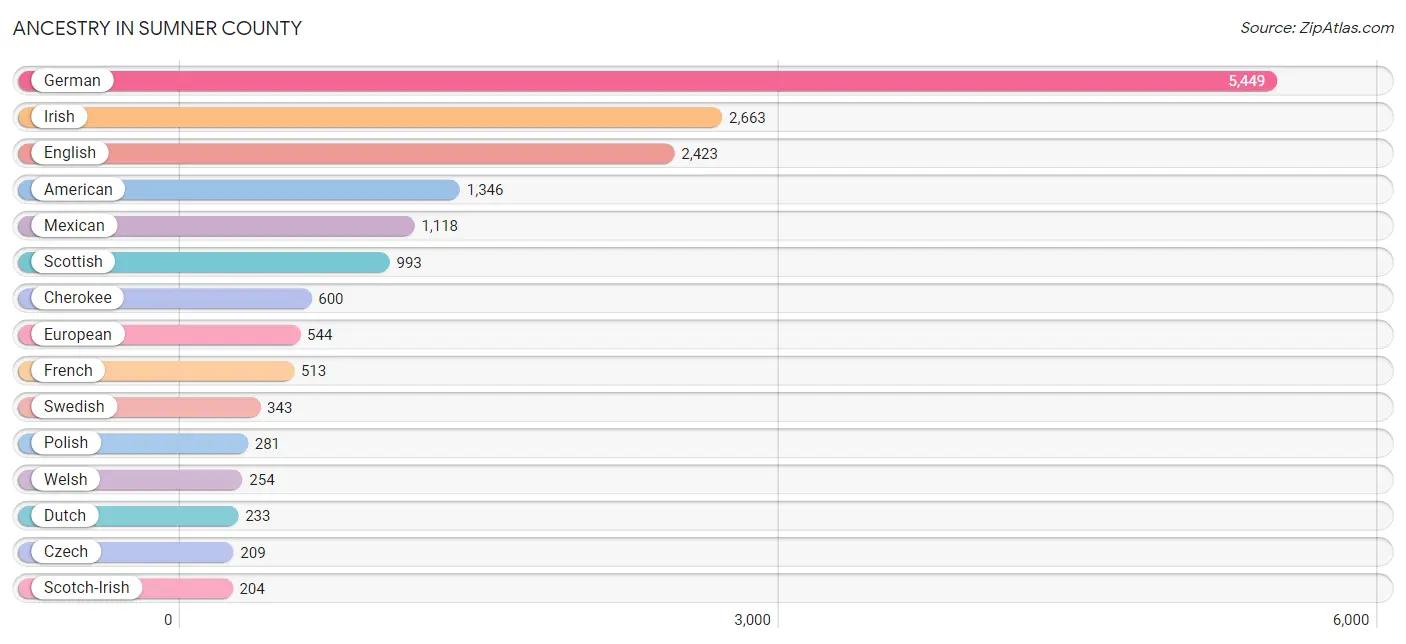
Ancestry in Sumner County
The most populous ancestries reported in Sumner County are German (5,449 | 24.2%), Irish (2,663 | 11.8%), English (2,423 | 10.8%), American (1,346 | 6.0%), and Mexican (1,118 | 5.0%), together accounting for 57.7% of all Sumner County residents.
| Ancestry | # Population | % Population |
| American | 1,346 | 6.0% |
| Apache | 5 | 0.0% |
| Arab | 16 | 0.1% |
| Armenian | 4 | 0.0% |
| Austrian | 6 | 0.0% |
| Belgian | 3 | 0.0% |
| Bhutanese | 32 | 0.1% |
| Blackfeet | 2 | 0.0% |
| Brazilian | 10 | 0.0% |
| British | 57 | 0.3% |
| Canadian | 31 | 0.1% |
| Celtic | 20 | 0.1% |
| Central American | 57 | 0.3% |
| Central American Indian | 6 | 0.0% |
| Cherokee | 600 | 2.7% |
| Chickasaw | 15 | 0.1% |
| Chinese | 6 | 0.0% |
| Choctaw | 12 | 0.1% |
| Comanche | 4 | 0.0% |
| Creek | 3 | 0.0% |
| Croatian | 3 | 0.0% |
| Cuban | 28 | 0.1% |
| Czech | 209 | 0.9% |
| Czechoslovakian | 53 | 0.2% |
| Danish | 109 | 0.5% |
| Delaware | 4 | 0.0% |
| Dutch | 233 | 1.0% |
| Eastern European | 4 | 0.0% |
| English | 2,423 | 10.8% |
| European | 544 | 2.4% |
| French | 513 | 2.3% |
| French Canadian | 10 | 0.0% |
| German | 5,449 | 24.2% |
| German Russian | 4 | 0.0% |
| Greek | 26 | 0.1% |
| Honduran | 8 | 0.0% |
| Hungarian | 42 | 0.2% |
| Indian (Asian) | 40 | 0.2% |
| Irish | 2,663 | 11.8% |
| Iroquois | 3 | 0.0% |
| Italian | 173 | 0.8% |
| Jordanian | 2 | 0.0% |
| Korean | 59 | 0.3% |
| Lebanese | 11 | 0.1% |
| Luxembourger | 1 | 0.0% |
| Mexican | 1,118 | 5.0% |
| Nicaraguan | 24 | 0.1% |
| Nigerian | 2 | 0.0% |
| Northern European | 34 | 0.2% |
| Norwegian | 145 | 0.6% |
| Osage | 6 | 0.0% |
| Panamanian | 19 | 0.1% |
| Pennsylvania German | 7 | 0.0% |
| Peruvian | 1 | 0.0% |
| Polish | 281 | 1.3% |
| Potawatomi | 11 | 0.1% |
| Pueblo | 4 | 0.0% |
| Puerto Rican | 37 | 0.2% |
| Russian | 39 | 0.2% |
| Salvadoran | 6 | 0.0% |
| Scandinavian | 57 | 0.3% |
| Scotch-Irish | 204 | 0.9% |
| Scottish | 993 | 4.4% |
| Seminole | 16 | 0.1% |
| Sioux | 21 | 0.1% |
| Slavic | 11 | 0.1% |
| South African | 12 | 0.1% |
| South American | 1 | 0.0% |
| Spaniard | 39 | 0.2% |
| Subsaharan African | 14 | 0.1% |
| Swedish | 343 | 1.5% |
| Swiss | 37 | 0.2% |
| Thai | 30 | 0.1% |
| Welsh | 254 | 1.1% | View All 74 Rows |
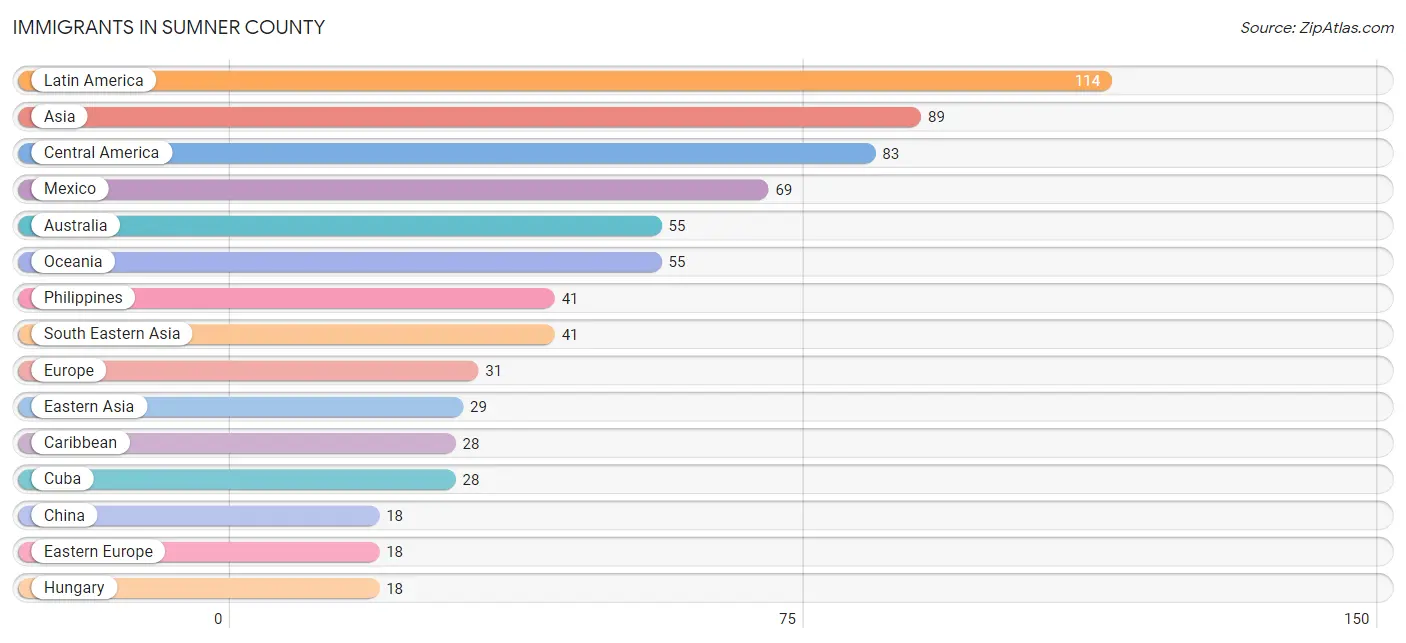
Immigrants in Sumner County
The most numerous immigrant groups reported in Sumner County came from Latin America (114 | 0.5%), Asia (89 | 0.4%), Central America (83 | 0.4%), Mexico (69 | 0.3%), and Australia (55 | 0.2%), together accounting for 1.8% of all Sumner County residents.
| Immigration Origin | # Population | % Population |
| Africa | 4 | 0.0% |
| Asia | 89 | 0.4% |
| Australia | 55 | 0.2% |
| Brazil | 2 | 0.0% |
| Canada | 12 | 0.1% |
| Caribbean | 28 | 0.1% |
| Central America | 83 | 0.4% |
| China | 18 | 0.1% |
| Cuba | 28 | 0.1% |
| Eastern Asia | 29 | 0.1% |
| Eastern Europe | 18 | 0.1% |
| El Salvador | 6 | 0.0% |
| Europe | 31 | 0.1% |
| Germany | 13 | 0.1% |
| Honduras | 8 | 0.0% |
| Hungary | 18 | 0.1% |
| India | 15 | 0.1% |
| Iraq | 4 | 0.0% |
| Japan | 11 | 0.1% |
| Latin America | 114 | 0.5% |
| Mexico | 69 | 0.3% |
| Oceania | 55 | 0.2% |
| Peru | 1 | 0.0% |
| Philippines | 41 | 0.2% |
| South Africa | 4 | 0.0% |
| South America | 3 | 0.0% |
| South Central Asia | 15 | 0.1% |
| South Eastern Asia | 41 | 0.2% |
| Western Asia | 4 | 0.0% |
| Western Europe | 13 | 0.1% | View All 30 Rows |
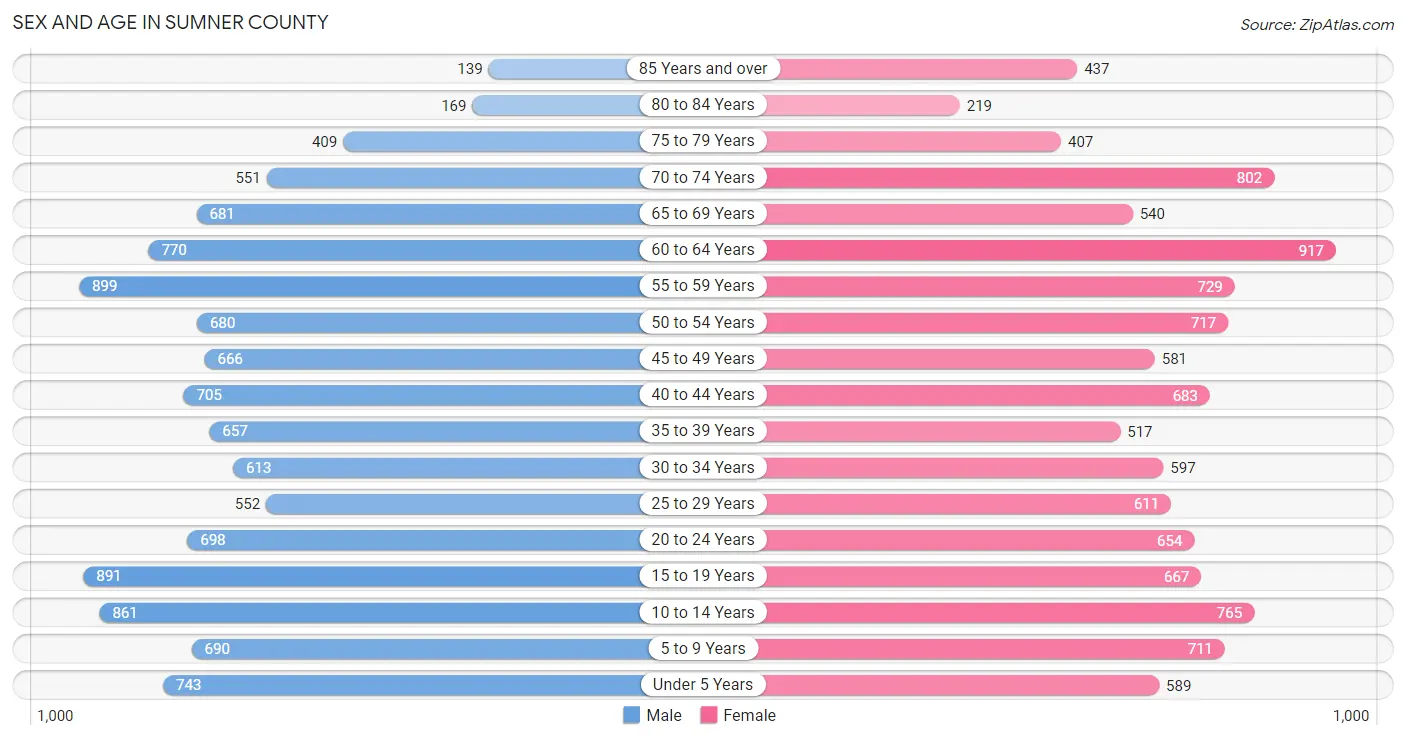
Sex and Age in Sumner County
Sex and Age in Sumner County
The most populous age groups in Sumner County are 55 to 59 Years (899 | 7.9%) for men and 60 to 64 Years (917 | 8.2%) for women.
| Age Bracket | Male | Female |
| Under 5 Years | 743 (6.5%) | 589 (5.3%) |
| 5 to 9 Years | 690 (6.1%) | 711 (6.4%) |
| 10 to 14 Years | 861 (7.6%) | 765 (6.9%) |
| 15 to 19 Years | 891 (7.8%) | 667 (6.0%) |
| 20 to 24 Years | 698 (6.1%) | 654 (5.9%) |
| 25 to 29 Years | 552 (4.9%) | 611 (5.5%) |
| 30 to 34 Years | 613 (5.4%) | 597 (5.4%) |
| 35 to 39 Years | 657 (5.8%) | 517 (4.6%) |
| 40 to 44 Years | 705 (6.2%) | 683 (6.1%) |
| 45 to 49 Years | 666 (5.9%) | 581 (5.2%) |
| 50 to 54 Years | 680 (6.0%) | 717 (6.4%) |
| 55 to 59 Years | 899 (7.9%) | 729 (6.5%) |
| 60 to 64 Years | 770 (6.8%) | 917 (8.2%) |
| 65 to 69 Years | 681 (6.0%) | 540 (4.9%) |
| 70 to 74 Years | 551 (4.8%) | 802 (7.2%) |
| 75 to 79 Years | 409 (3.6%) | 407 (3.6%) |
| 80 to 84 Years | 169 (1.5%) | 219 (2.0%) |
| 85 Years and over | 139 (1.2%) | 437 (3.9%) |
| Total | 11,374 (100.0%) | 11,143 (100.0%) |
Families and Households in Sumner County
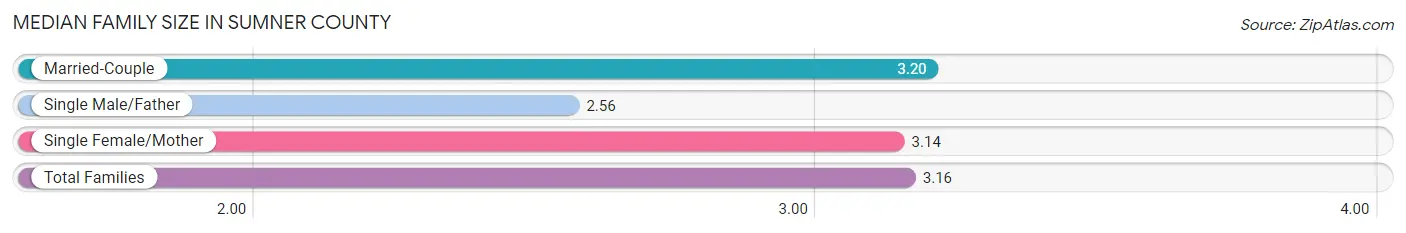
Median Family Size in Sumner County
The median family size in Sumner County is 3.16 persons per family, with married-couple families (4,671 | 83.0%) accounting for the largest median family size of 3.2 persons per family. On the other hand, single male/father families (292 | 5.2%) represent the smallest median family size with 2.56 persons per family.
| Family Type | # Families | Family Size |
| Married-Couple | 4,671 (83.0%) | 3.20 |
| Single Male/Father | 292 (5.2%) | 2.56 |
| Single Female/Mother | 663 (11.8%) | 3.14 |
| Total Families | 5,626 (100.0%) | 3.16 |
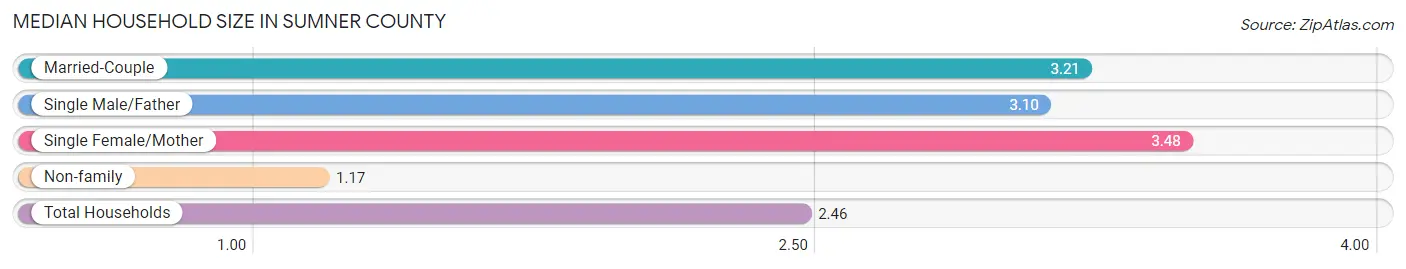
Median Household Size in Sumner County
The median household size in Sumner County is 2.46 persons per household, with single female/mother households (663 | 7.4%) accounting for the largest median household size of 3.48 persons per household. non-family households (3,351 | 37.3%) represent the smallest median household size with 1.17 persons per household.
| Household Type | # Households | Household Size |
| Married-Couple | 4,671 (52.0%) | 3.21 |
| Single Male/Father | 292 (3.3%) | 3.10 |
| Single Female/Mother | 663 (7.4%) | 3.48 |
| Non-family | 3,351 (37.3%) | 1.17 |
| Total Households | 8,977 (100.0%) | 2.46 |
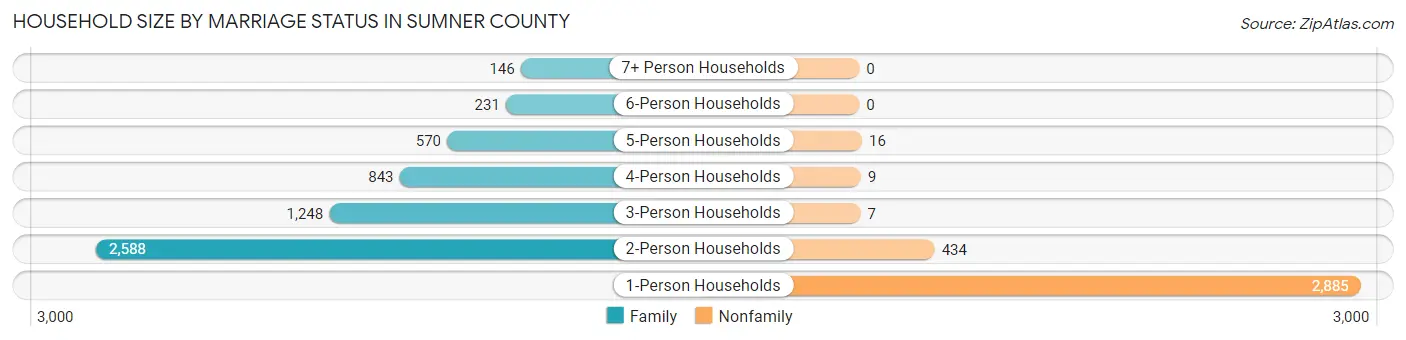
Household Size by Marriage Status in Sumner County
Out of a total of 8,977 households in Sumner County, 5,626 (62.7%) are family households, while 3,351 (37.3%) are nonfamily households. The most numerous type of family households are 2-person households, comprising 2,588, and the most common type of nonfamily households are 1-person households, comprising 2,885.
| Household Size | Family Households | Nonfamily Households |
| 1-Person Households | - | 2,885 (32.1%) |
| 2-Person Households | 2,588 (28.8%) | 434 (4.8%) |
| 3-Person Households | 1,248 (13.9%) | 7 (0.1%) |
| 4-Person Households | 843 (9.4%) | 9 (0.1%) |
| 5-Person Households | 570 (6.4%) | 16 (0.2%) |
| 6-Person Households | 231 (2.6%) | 0 (0.0%) |
| 7+ Person Households | 146 (1.6%) | 0 (0.0%) |
| Total | 5,626 (62.7%) | 3,351 (37.3%) |
Female Fertility in Sumner County
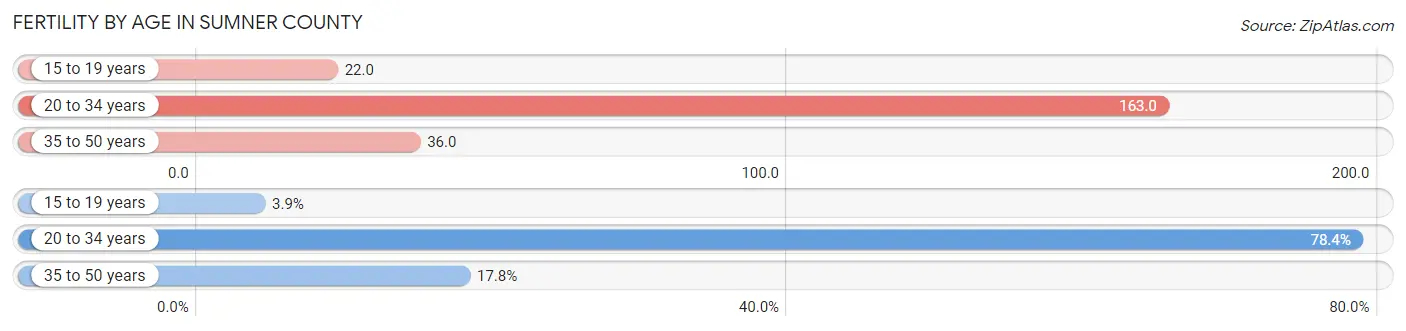
Fertility by Age in Sumner County
Average fertility rate in Sumner County is 88.0 births per 1,000 women. Women in the age bracket of 20 to 34 years have the highest fertility rate with 163.0 births per 1,000 women. Women in the age bracket of 20 to 34 years acount for 78.3% of all women with births.
| Age Bracket | Women with Births | Births / 1,000 Women |
| 15 to 19 years | 15 (3.9%) | 22.0 |
| 20 to 34 years | 304 (78.3%) | 163.0 |
| 35 to 50 years | 69 (17.8%) | 36.0 |
| Total | 388 (100.0%) | 88.0 |
Fertility by Age by Marriage Status in Sumner County
64.4% of women with births (388) in Sumner County are married. The highest percentage of unmarried women with births falls into 20 to 34 years age bracket with 43.1% of them unmarried at the time of birth, while the lowest percentage of unmarried women with births belong to 15 to 19 years age bracket with 0.0% of them unmarried.
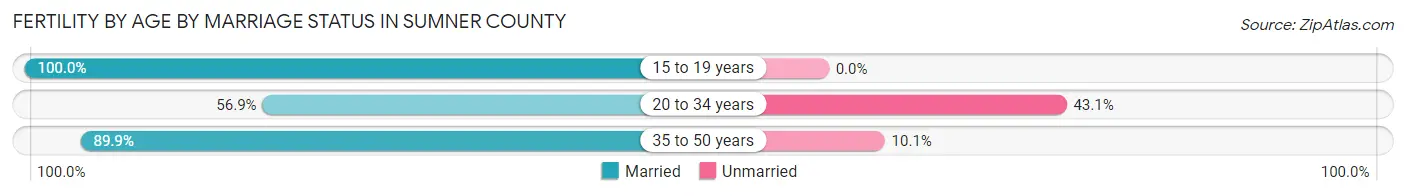
| Age Bracket | Married | Unmarried |
| 15 to 19 years | 15 (100.0%) | 0 (0.0%) |
| 20 to 34 years | 173 (56.9%) | 131 (43.1%) |
| 35 to 50 years | 62 (89.9%) | 7 (10.1%) |
| Total | 250 (64.4%) | 138 (35.6%) |
Fertility by Education in Sumner County
Average fertility rate in Sumner County is 88.0 births per 1,000 women. Women with the education attainment of college or associate's degree have the highest fertility rate of 128.0 births per 1,000 women, while women with the education attainment of graduate degree have the lowest fertility at 28.0 births per 1,000 women. Women with the education attainment of college or associate's degree represent 46.9% of all women with births.
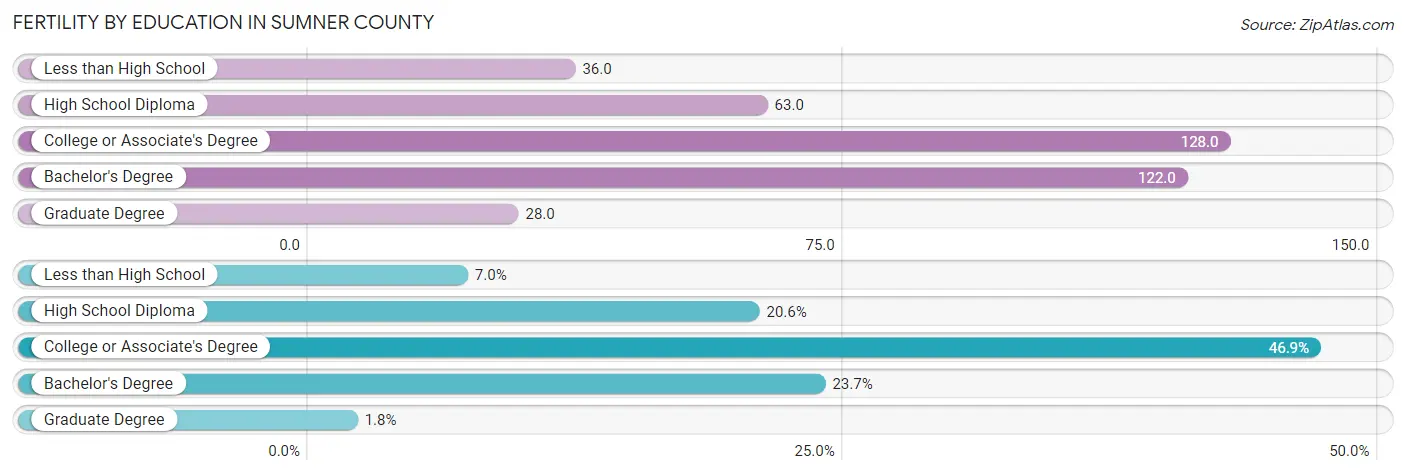
| Educational Attainment | Women with Births | Births / 1,000 Women |
| Less than High School | 27 (7.0%) | 36.0 |
| High School Diploma | 80 (20.6%) | 63.0 |
| College or Associate's Degree | 182 (46.9%) | 128.0 |
| Bachelor's Degree | 92 (23.7%) | 122.0 |
| Graduate Degree | 7 (1.8%) | 28.0 |
| Total | 388 (100.0%) | 88.0 |
Fertility by Education by Marriage Status in Sumner County
35.6% of women with births in Sumner County are unmarried. Women with the educational attainment of graduate degree are most likely to be married with 100.0% of them married at childbirth, while women with the educational attainment of less than high school are least likely to be married with 85.2% of them unmarried at childbirth.
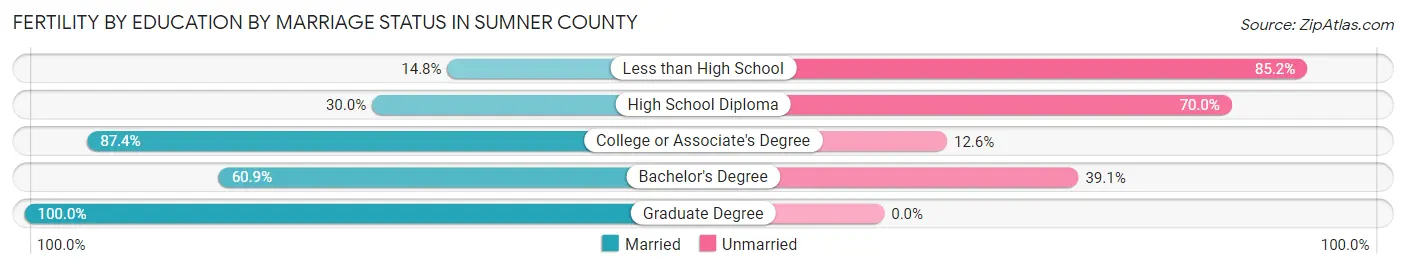
| Educational Attainment | Married | Unmarried |
| Less than High School | 4 (14.8%) | 23 (85.2%) |
| High School Diploma | 24 (30.0%) | 56 (70.0%) |
| College or Associate's Degree | 159 (87.4%) | 23 (12.6%) |
| Bachelor's Degree | 56 (60.9%) | 36 (39.1%) |
| Graduate Degree | 7 (100.0%) | 0 (0.0%) |
| Total | 250 (64.4%) | 138 (35.6%) |
Income in Sumner County
Income Overview in Sumner County
Per Capita Income in Sumner County is $31,072, while median incomes of families and households are $82,727 and $59,397 respectively.
| Characteristic | Number | Measure |
| Per Capita Income | 22,517 | $31,072 |
| Median Family Income | 5,626 | $82,727 |
| Mean Family Income | 5,626 | $94,695 |
| Median Household Income | 8,977 | $59,397 |
| Mean Household Income | 8,977 | $75,973 |
| Income Deficit | 5,626 | $8,206 |
| Wage / Income Gap (%) | 22,517 | 38.14% |
| Wage / Income Gap ($) | 22,517 | 61.86¢ per $1 |
| Gini / Inequality Index | 22,517 | 0.41 |
Earnings by Sex in Sumner County
Average Earnings in Sumner County are $36,381, $46,318 for men and $28,652 for women, a difference of 38.1%.
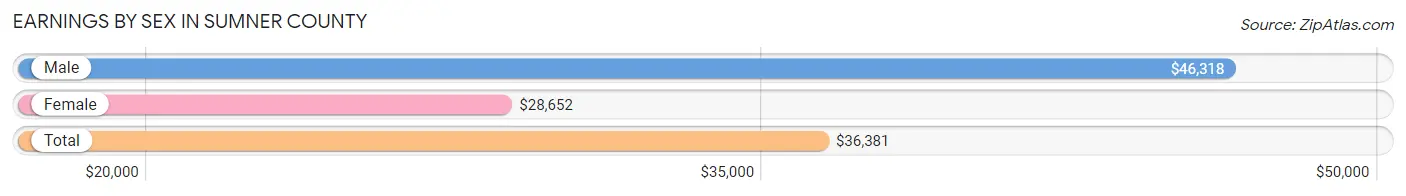
| Sex | Number | Average Earnings |
| Male | 6,160 (54.5%) | $46,318 |
| Female | 5,142 (45.5%) | $28,652 |
| Total | 11,302 (100.0%) | $36,381 |
Earnings by Sex by Income Bracket in Sumner County
The most common earnings brackets in Sumner County are $75,000 to $99,999 for men (814 | 13.2%) and $55,000 to $64,999 for women (395 | 7.7%).
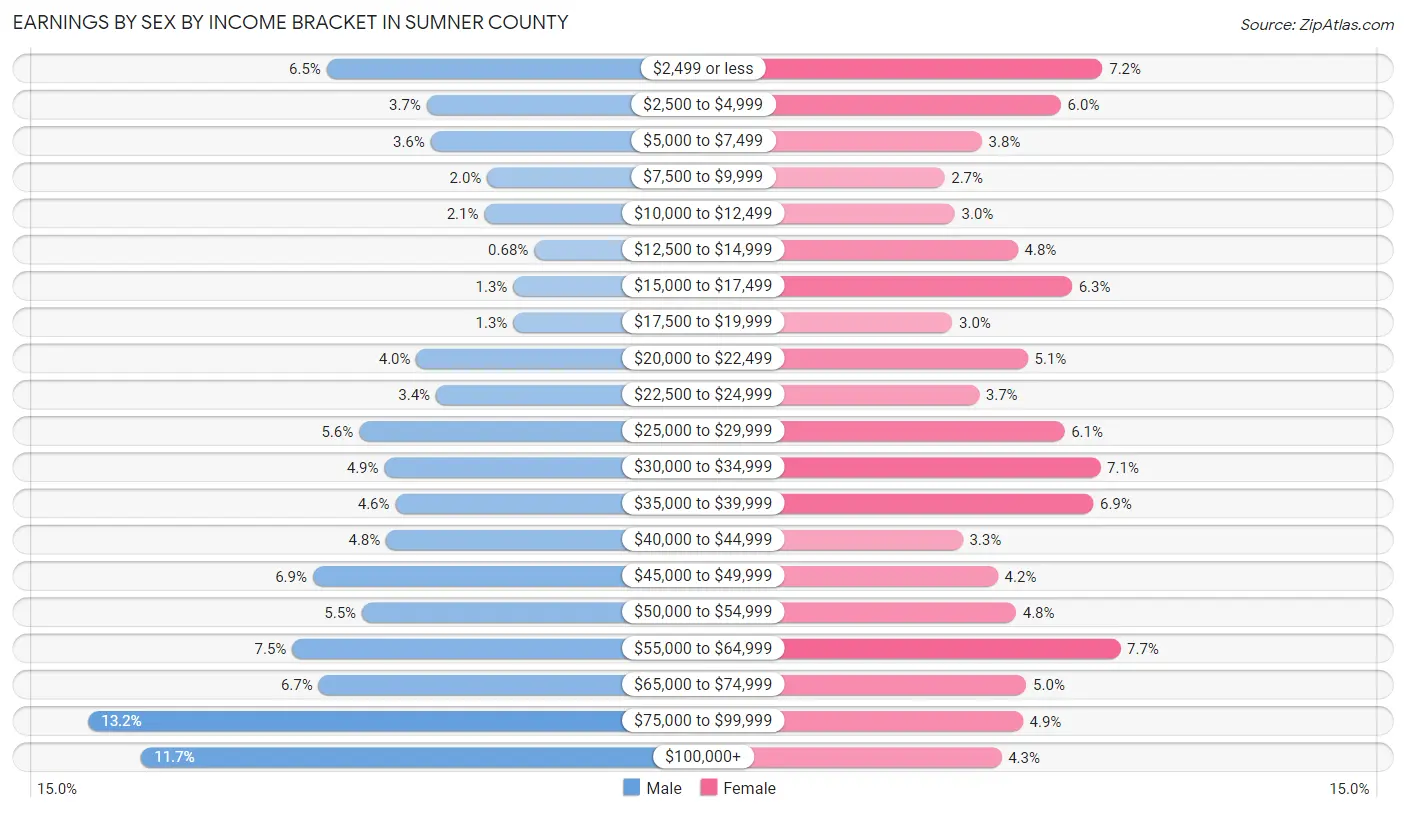
| Income | Male | Female |
| $2,499 or less | 401 (6.5%) | 369 (7.2%) |
| $2,500 to $4,999 | 228 (3.7%) | 309 (6.0%) |
| $5,000 to $7,499 | 221 (3.6%) | 195 (3.8%) |
| $7,500 to $9,999 | 123 (2.0%) | 141 (2.7%) |
| $10,000 to $12,499 | 128 (2.1%) | 156 (3.0%) |
| $12,500 to $14,999 | 42 (0.7%) | 247 (4.8%) |
| $15,000 to $17,499 | 78 (1.3%) | 325 (6.3%) |
| $17,500 to $19,999 | 78 (1.3%) | 152 (3.0%) |
| $20,000 to $22,499 | 246 (4.0%) | 261 (5.1%) |
| $22,500 to $24,999 | 212 (3.4%) | 191 (3.7%) |
| $25,000 to $29,999 | 345 (5.6%) | 314 (6.1%) |
| $30,000 to $34,999 | 301 (4.9%) | 366 (7.1%) |
| $35,000 to $39,999 | 282 (4.6%) | 356 (6.9%) |
| $40,000 to $44,999 | 298 (4.8%) | 167 (3.3%) |
| $45,000 to $49,999 | 425 (6.9%) | 218 (4.2%) |
| $50,000 to $54,999 | 340 (5.5%) | 244 (4.8%) |
| $55,000 to $64,999 | 461 (7.5%) | 395 (7.7%) |
| $65,000 to $74,999 | 415 (6.7%) | 259 (5.0%) |
| $75,000 to $99,999 | 814 (13.2%) | 254 (4.9%) |
| $100,000+ | 722 (11.7%) | 223 (4.3%) |
| Total | 6,160 (100.0%) | 5,142 (100.0%) |
Earnings by Sex by Educational Attainment in Sumner County
Average earnings in Sumner County are $51,192 for men and $33,511 for women, a difference of 34.5%. Men with an educational attainment of graduate degree enjoy the highest average annual earnings of $80,417, while those with less than high school education earn the least with $34,872. Women with an educational attainment of graduate degree earn the most with the average annual earnings of $58,138, while those with high school diploma education have the smallest earnings of $22,612.
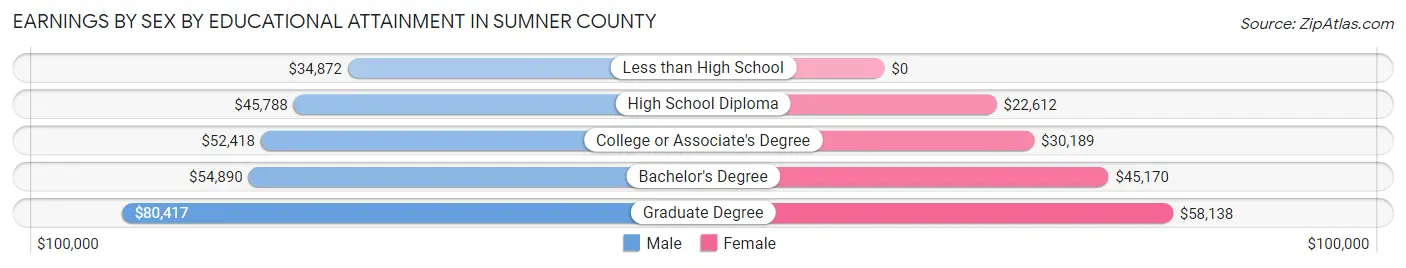
| Educational Attainment | Male Income | Female Income |
| Less than High School | $34,872 | $0 |
| High School Diploma | $45,788 | $22,612 |
| College or Associate's Degree | $52,418 | $30,189 |
| Bachelor's Degree | $54,890 | $45,170 |
| Graduate Degree | $80,417 | $58,138 |
| Total | $51,192 | $33,511 |
Family Income in Sumner County
Family Income Brackets in Sumner County
According to the Sumner County family income data, there are 1,361 families falling into the $100,000 to $149,999 income range, which is the most common income bracket and makes up 24.2% of all families. Conversely, the $10,000 to $14,999 income bracket is the least frequent group with only 62 families (1.1%) belonging to this category.
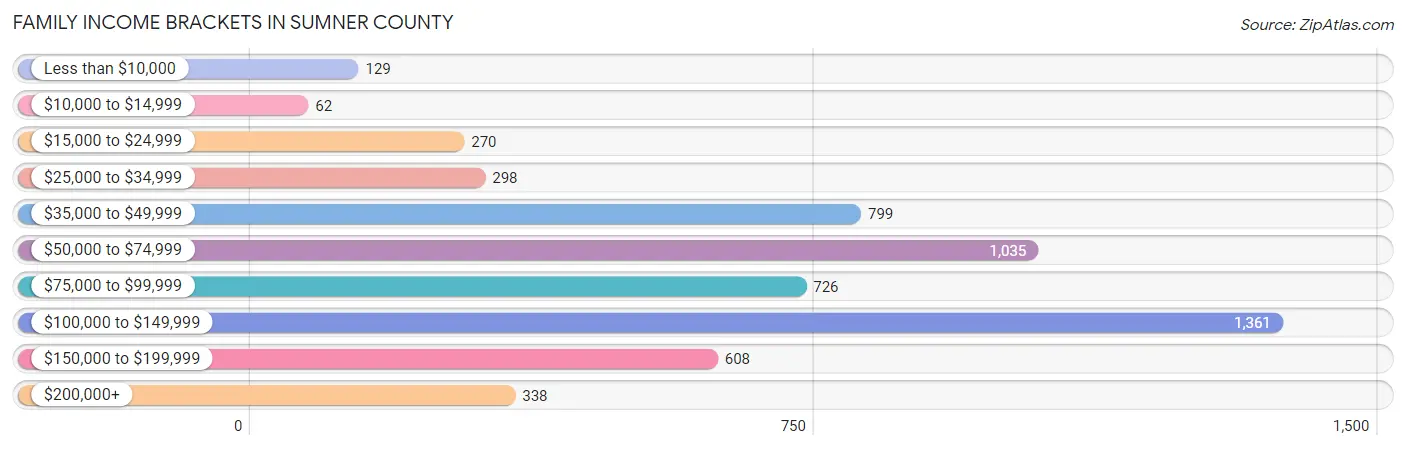
| Income Bracket | # Families | % Families |
| Less than $10,000 | 129 | 2.3% |
| $10,000 to $14,999 | 62 | 1.1% |
| $15,000 to $24,999 | 270 | 4.8% |
| $25,000 to $34,999 | 298 | 5.3% |
| $35,000 to $49,999 | 799 | 14.2% |
| $50,000 to $74,999 | 1,035 | 18.4% |
| $75,000 to $99,999 | 726 | 12.9% |
| $100,000 to $149,999 | 1,361 | 24.2% |
| $150,000 to $199,999 | 608 | 10.8% |
| $200,000+ | 338 | 6.0% |
Family Income by Famaliy Size in Sumner County
6-person families (196 | 3.5%) account for the highest median family income in Sumner County with $111,250 per family, while 2-person families (2,773 | 49.3%) have the highest median income of $36,834 per family member.
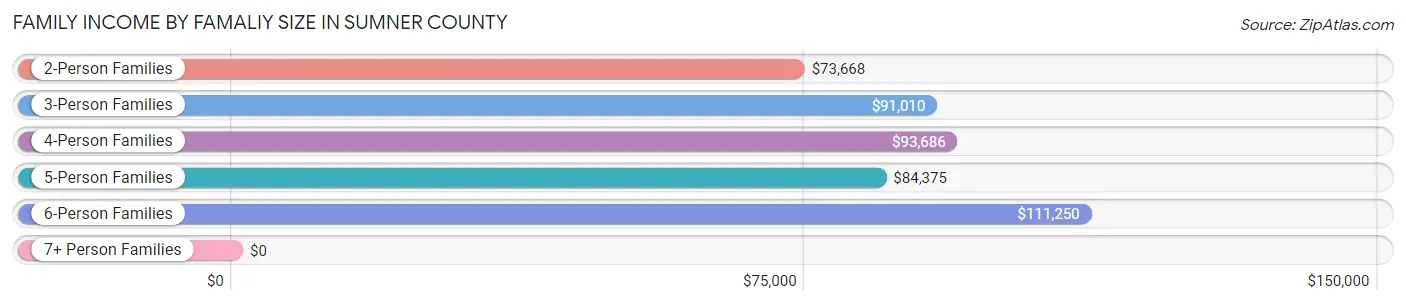
| Income Bracket | # Families | Median Income |
| 2-Person Families | 2,773 (49.3%) | $73,668 |
| 3-Person Families | 1,149 (20.4%) | $91,010 |
| 4-Person Families | 843 (15.0%) | $93,686 |
| 5-Person Families | 519 (9.2%) | $84,375 |
| 6-Person Families | 196 (3.5%) | $111,250 |
| 7+ Person Families | 146 (2.6%) | $0 |
| Total | 5,626 (100.0%) | $82,727 |
Family Income by Number of Earners in Sumner County
The median family income in Sumner County is $82,727, with families comprising 3+ earners (668) having the highest median family income of $125,591, while families with no earners (780) have the lowest median family income of $42,500, accounting for 11.9% and 13.9% of families, respectively.
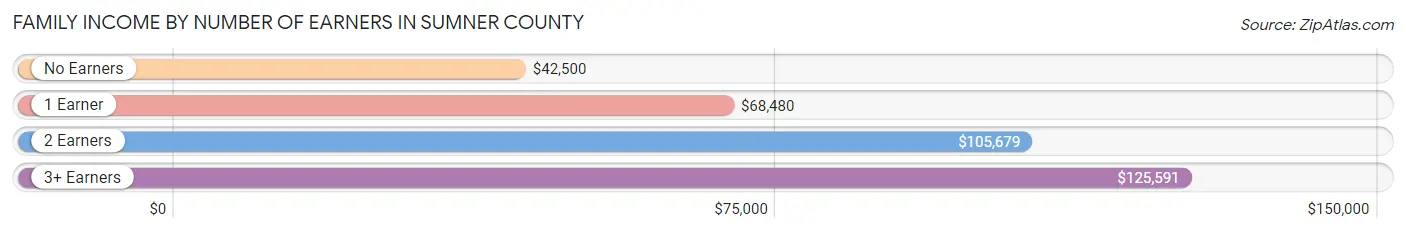
| Number of Earners | # Families | Median Income |
| No Earners | 780 (13.9%) | $42,500 |
| 1 Earner | 1,717 (30.5%) | $68,480 |
| 2 Earners | 2,461 (43.7%) | $105,679 |
| 3+ Earners | 668 (11.9%) | $125,591 |
| Total | 5,626 (100.0%) | $82,727 |
Household Income in Sumner County
Household Income Brackets in Sumner County
With 1,688 households falling in the category, the $50,000 to $74,999 income range is the most frequent in Sumner County, accounting for 18.8% of all households. In contrast, only 359 households (4.0%) fall into the $10,000 to $14,999 income bracket, making it the least populous group.
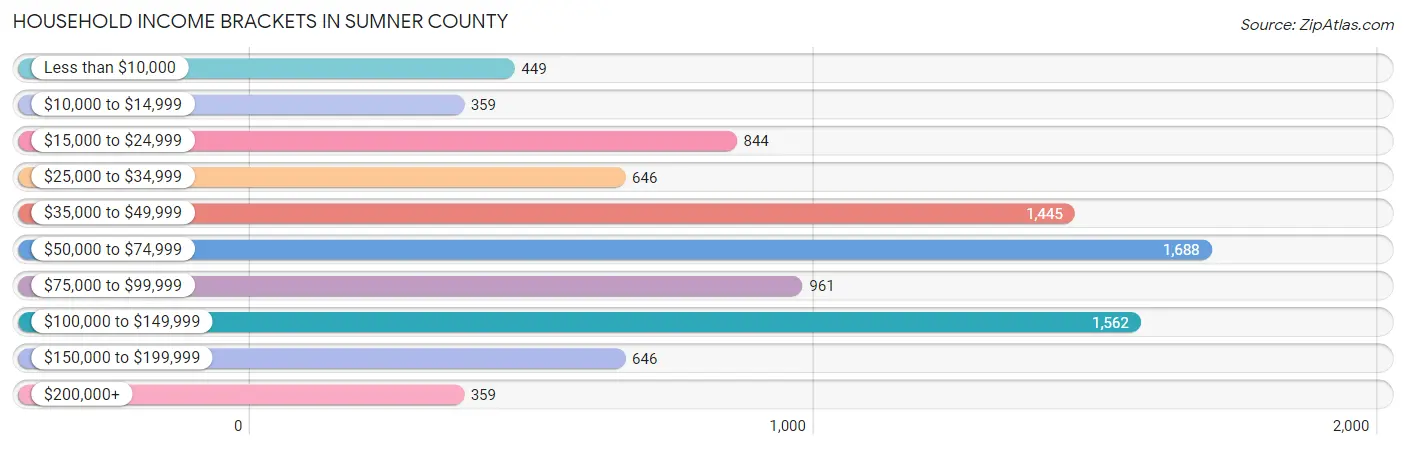
| Income Bracket | # Households | % Households |
| Less than $10,000 | 449 | 5.0% |
| $10,000 to $14,999 | 359 | 4.0% |
| $15,000 to $24,999 | 844 | 9.4% |
| $25,000 to $34,999 | 646 | 7.2% |
| $35,000 to $49,999 | 1,445 | 16.1% |
| $50,000 to $74,999 | 1,688 | 18.8% |
| $75,000 to $99,999 | 961 | 10.7% |
| $100,000 to $149,999 | 1,562 | 17.4% |
| $150,000 to $199,999 | 646 | 7.2% |
| $200,000+ | 359 | 4.0% |
Household Income by Householder Age in Sumner County
The median household income in Sumner County is $59,397, with the highest median household income of $72,344 found in the 45 to 64 years age bracket for the primary householder. A total of 3,431 households (38.2%) fall into this category. Meanwhile, the 65+ years age bracket for the primary householder has the lowest median household income of $45,077, with 2,845 households (31.7%) in this group.
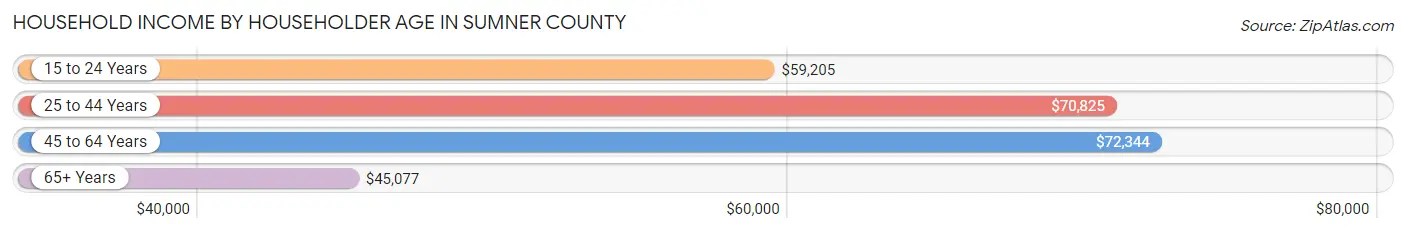
| Income Bracket | # Households | Median Income |
| 15 to 24 Years | 244 (2.7%) | $59,205 |
| 25 to 44 Years | 2,457 (27.4%) | $70,825 |
| 45 to 64 Years | 3,431 (38.2%) | $72,344 |
| 65+ Years | 2,845 (31.7%) | $45,077 |
| Total | 8,977 (100.0%) | $59,397 |
Poverty in Sumner County
Income Below Poverty by Sex and Age in Sumner County
With 10.2% poverty level for males and 13.0% for females among the residents of Sumner County, 5 year old males and 18 to 24 year old females are the most vulnerable to poverty, with 44 males (29.5%) and 162 females (18.8%) in their respective age groups living below the poverty level.
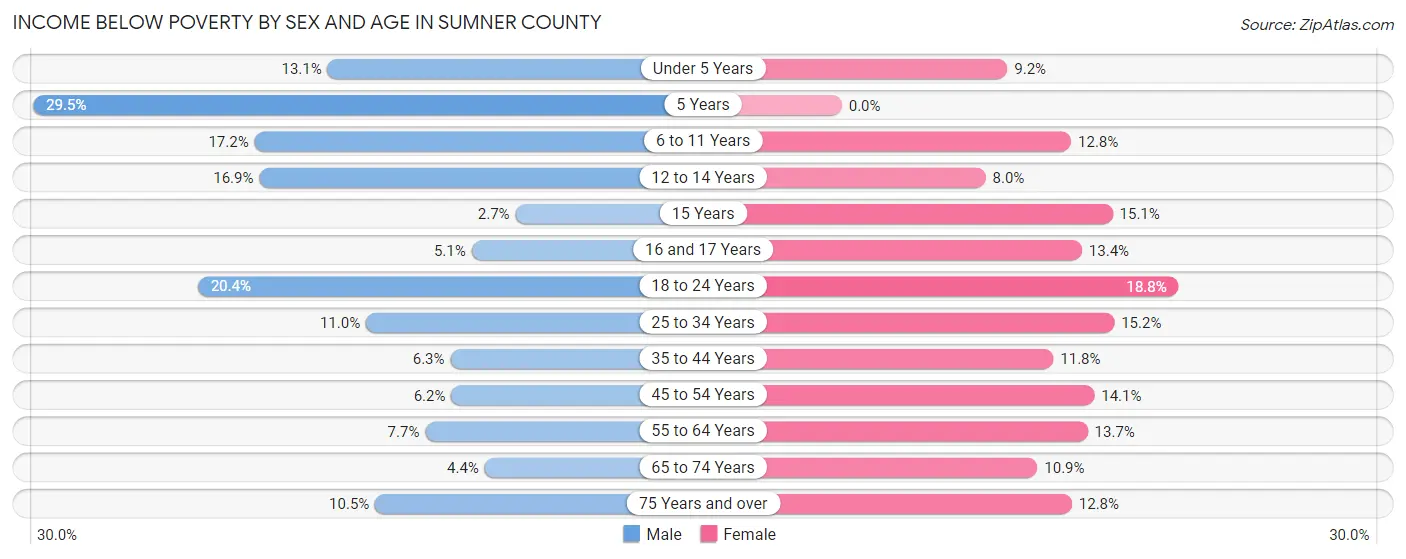
| Age Bracket | Male | Female |
| Under 5 Years | 96 (13.1%) | 54 (9.2%) |
| 5 Years | 44 (29.5%) | 0 (0.0%) |
| 6 to 11 Years | 130 (17.2%) | 122 (12.8%) |
| 12 to 14 Years | 106 (16.9%) | 27 (8.0%) |
| 15 Years | 8 (2.7%) | 19 (15.1%) |
| 16 and 17 Years | 17 (5.1%) | 44 (13.4%) |
| 18 to 24 Years | 191 (20.4%) | 162 (18.8%) |
| 25 to 34 Years | 126 (11.0%) | 183 (15.2%) |
| 35 to 44 Years | 83 (6.3%) | 140 (11.8%) |
| 45 to 54 Years | 82 (6.2%) | 182 (14.1%) |
| 55 to 64 Years | 128 (7.7%) | 224 (13.7%) |
| 65 to 74 Years | 53 (4.4%) | 139 (10.9%) |
| 75 Years and over | 70 (10.5%) | 123 (12.8%) |
| Total | 1,134 (10.2%) | 1,419 (13.0%) |
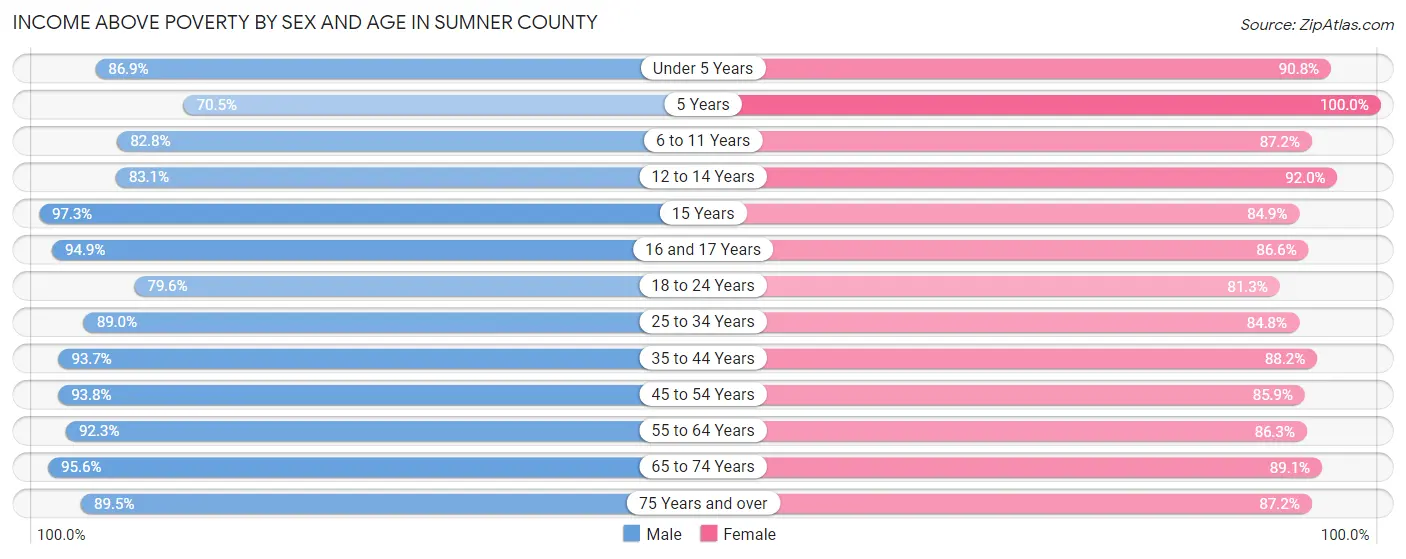
Income Above Poverty by Sex and Age in Sumner County
According to the poverty statistics in Sumner County, males aged 15 years and females aged 5 years are the age groups that are most secure financially, with 97.3% of males and 100.0% of females in these age groups living above the poverty line.
| Age Bracket | Male | Female |
| Under 5 Years | 635 (86.9%) | 532 (90.8%) |
| 5 Years | 105 (70.5%) | 136 (100.0%) |
| 6 to 11 Years | 626 (82.8%) | 833 (87.2%) |
| 12 to 14 Years | 520 (83.1%) | 310 (92.0%) |
| 15 Years | 292 (97.3%) | 107 (84.9%) |
| 16 and 17 Years | 316 (94.9%) | 285 (86.6%) |
| 18 to 24 Years | 747 (79.6%) | 702 (81.2%) |
| 25 to 34 Years | 1,020 (89.0%) | 1,023 (84.8%) |
| 35 to 44 Years | 1,237 (93.7%) | 1,048 (88.2%) |
| 45 to 54 Years | 1,232 (93.8%) | 1,112 (85.9%) |
| 55 to 64 Years | 1,536 (92.3%) | 1,412 (86.3%) |
| 65 to 74 Years | 1,156 (95.6%) | 1,137 (89.1%) |
| 75 Years and over | 598 (89.5%) | 837 (87.2%) |
| Total | 10,020 (89.8%) | 9,474 (87.0%) |
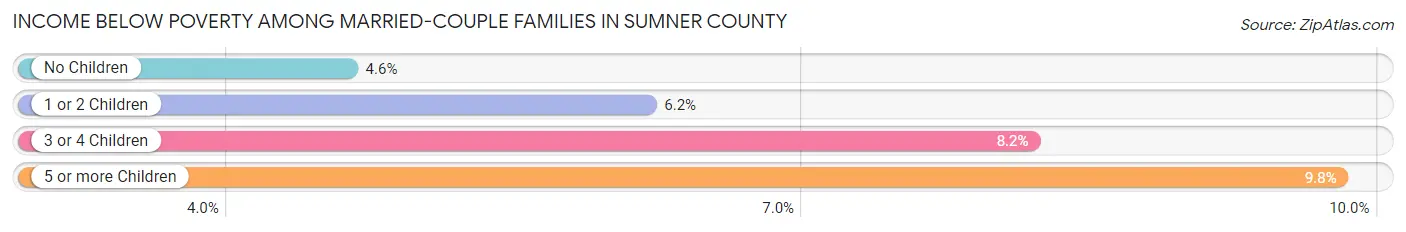
Income Below Poverty Among Married-Couple Families in Sumner County
The poverty statistics for married-couple families in Sumner County show that 5.6% or 263 of the total 4,671 families live below the poverty line. Families with 5 or more children have the highest poverty rate of 9.8%, comprising of 5 families. On the other hand, families with no children have the lowest poverty rate of 4.6%, which includes 121 families.
| Children | Above Poverty | Below Poverty |
| No Children | 2,491 (95.4%) | 121 (4.6%) |
| 1 or 2 Children | 1,288 (93.8%) | 85 (6.2%) |
| 3 or 4 Children | 583 (91.8%) | 52 (8.2%) |
| 5 or more Children | 46 (90.2%) | 5 (9.8%) |
| Total | 4,408 (94.4%) | 263 (5.6%) |
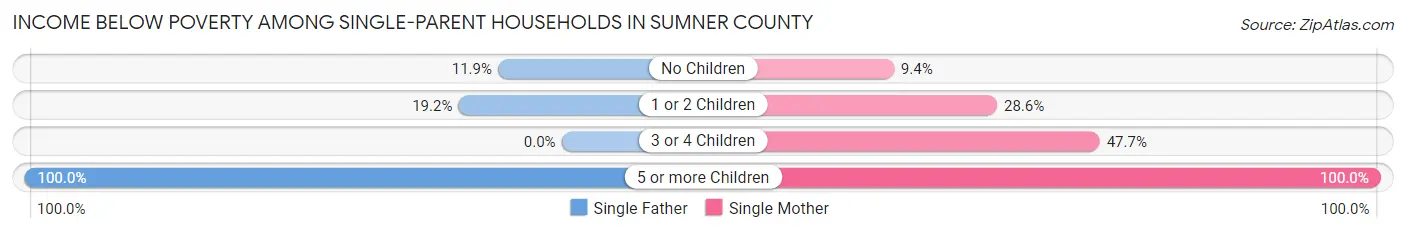
Income Below Poverty Among Single-Parent Households in Sumner County
According to the poverty data in Sumner County, 13.7% or 40 single-father households and 22.9% or 152 single-mother households are living below the poverty line. Among single-father households, those with 5 or more children have the highest poverty rate, with 1 households (100.0%) experiencing poverty. Likewise, among single-mother households, those with 5 or more children have the highest poverty rate, with 2 households (100.0%) falling below the poverty line.
| Children | Single Father | Single Mother |
| No Children | 14 (11.9%) | 25 (9.4%) |
| 1 or 2 Children | 25 (19.2%) | 94 (28.6%) |
| 3 or 4 Children | 0 (0.0%) | 31 (47.7%) |
| 5 or more Children | 1 (100.0%) | 2 (100.0%) |
| Total | 40 (13.7%) | 152 (22.9%) |
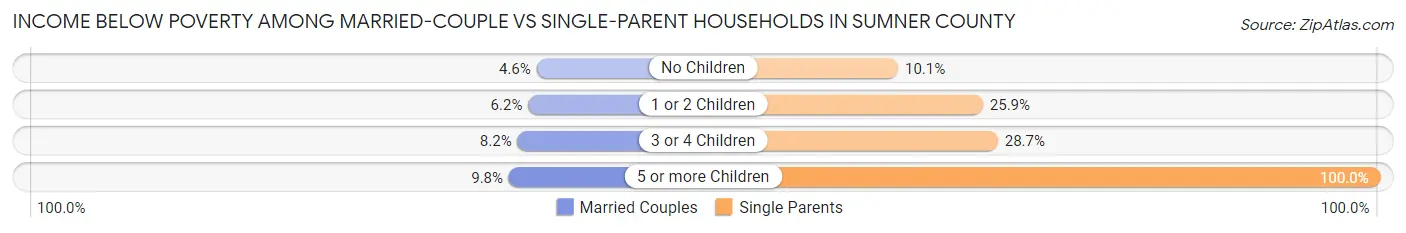
Income Below Poverty Among Married-Couple vs Single-Parent Households in Sumner County
The poverty data for Sumner County shows that 263 of the married-couple family households (5.6%) and 192 of the single-parent households (20.1%) are living below the poverty level. Within the married-couple family households, those with 5 or more children have the highest poverty rate, with 5 households (9.8%) falling below the poverty line. Among the single-parent households, those with 5 or more children have the highest poverty rate, with 3 household (100.0%) living below poverty.
| Children | Married-Couple Families | Single-Parent Households |
| No Children | 121 (4.6%) | 39 (10.1%) |
| 1 or 2 Children | 85 (6.2%) | 119 (25.9%) |
| 3 or 4 Children | 52 (8.2%) | 31 (28.7%) |
| 5 or more Children | 5 (9.8%) | 3 (100.0%) |
| Total | 263 (5.6%) | 192 (20.1%) |
Employment Characteristics in Sumner County
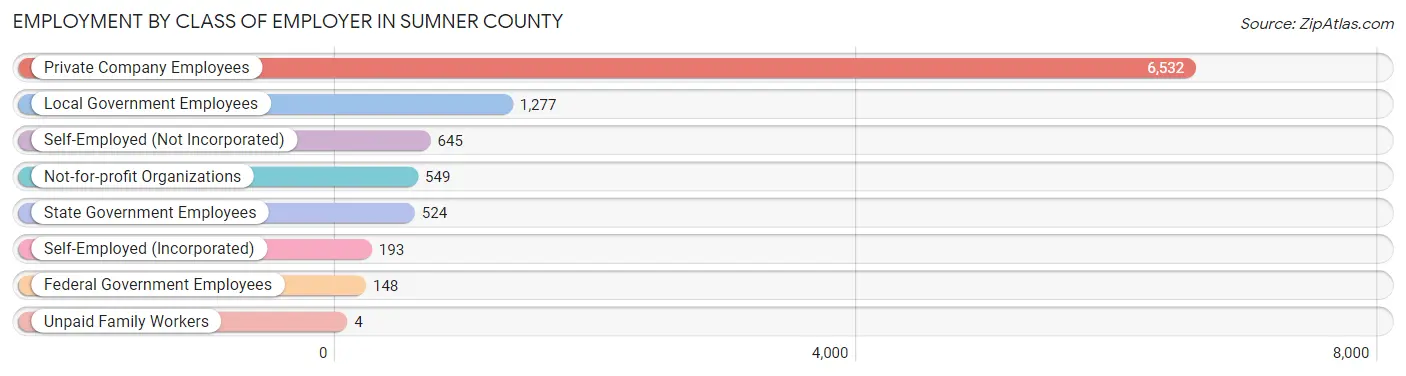
Employment by Class of Employer in Sumner County
Among the 9,872 employed individuals in Sumner County, private company employees (6,532 | 66.2%), local government employees (1,277 | 12.9%), and self-employed (not incorporated) (645 | 6.5%) make up the most common classes of employment.
| Employer Class | # Employees | % Employees |
| Private Company Employees | 6,532 | 66.2% |
| Self-Employed (Incorporated) | 193 | 2.0% |
| Self-Employed (Not Incorporated) | 645 | 6.5% |
| Not-for-profit Organizations | 549 | 5.6% |
| Local Government Employees | 1,277 | 12.9% |
| State Government Employees | 524 | 5.3% |
| Federal Government Employees | 148 | 1.5% |
| Unpaid Family Workers | 4 | 0.0% |
| Total | 9,872 | 100.0% |
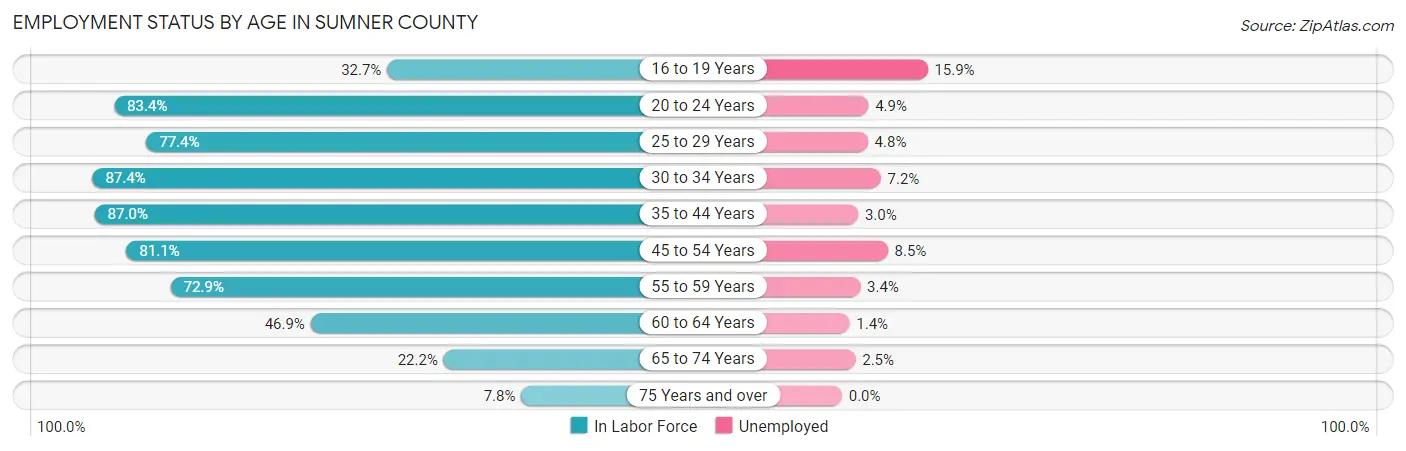
Employment Status by Age in Sumner County
According to the labor force statistics for Sumner County, out of the total population over 16 years of age (17,732), 59.3% or 10,515 individuals are in the labor force, with 5.2% or 547 of them unemployed. The age group with the highest labor force participation rate is 30 to 34 years, with 87.4% or 1,058 individuals in the labor force. Within the labor force, the 16 to 19 years age range has the highest percentage of unemployed individuals, with 15.9% or 59 of them being unemployed.
| Age Bracket | In Labor Force | Unemployed |
| 16 to 19 Years | 370 (32.7%) | 59 (15.9%) |
| 20 to 24 Years | 1,128 (83.4%) | 55 (4.9%) |
| 25 to 29 Years | 900 (77.4%) | 43 (4.8%) |
| 30 to 34 Years | 1,058 (87.4%) | 76 (7.2%) |
| 35 to 44 Years | 2,229 (87.0%) | 67 (3.0%) |
| 45 to 54 Years | 2,144 (81.1%) | 182 (8.5%) |
| 55 to 59 Years | 1,187 (72.9%) | 40 (3.4%) |
| 60 to 64 Years | 791 (46.9%) | 11 (1.4%) |
| 65 to 74 Years | 571 (22.2%) | 14 (2.5%) |
| 75 Years and over | 139 (7.8%) | 0 (0.0%) |
| Total | 10,515 (59.3%) | 547 (5.2%) |
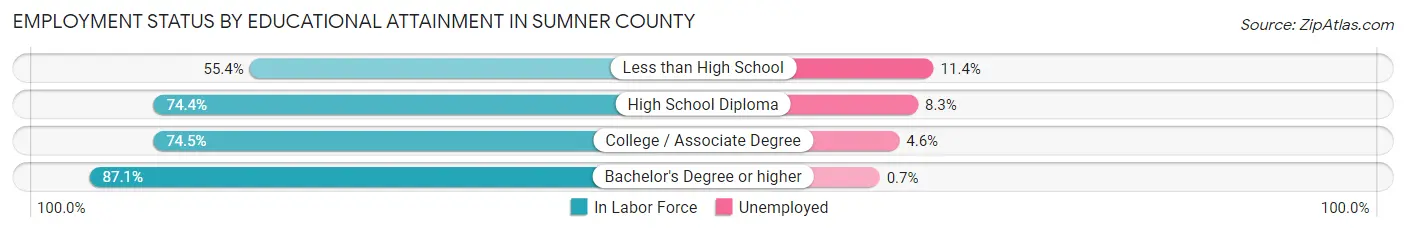
Employment Status by Educational Attainment in Sumner County
According to labor force statistics for Sumner County, 76.3% of individuals (8,312) out of the total population between 25 and 64 years of age (10,894) are in the labor force, with 5.1% or 424 of them being unemployed. The group with the highest labor force participation rate are those with the educational attainment of bachelor's degree or higher, with 87.1% or 2,305 individuals in the labor force. Within the labor force, individuals with less than high school education have the highest percentage of unemployment, with 11.4% or 45 of them being unemployed.
| Educational Attainment | In Labor Force | Unemployed |
| Less than High School | 394 (55.4%) | 81 (11.4%) |
| High School Diploma | 2,758 (74.4%) | 308 (8.3%) |
| College / Associate Degree | 2,853 (74.5%) | 176 (4.6%) |
| Bachelor's Degree or higher | 2,305 (87.1%) | 19 (0.7%) |
| Total | 8,312 (76.3%) | 556 (5.1%) |
Employment Occupations by Sex in Sumner County
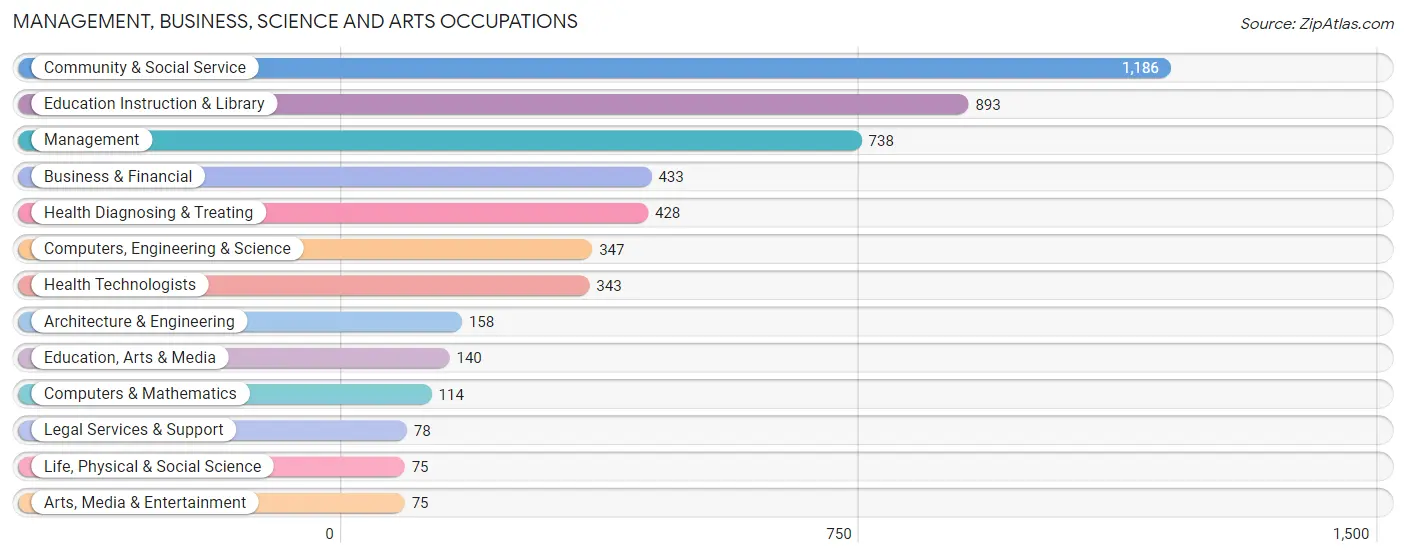
Management, Business, Science and Arts Occupations
The most common Management, Business, Science and Arts occupations in Sumner County are Community & Social Service (1,186 | 11.9%), Education Instruction & Library (893 | 9.0%), Management (738 | 7.4%), Business & Financial (433 | 4.3%), and Health Diagnosing & Treating (428 | 4.3%).
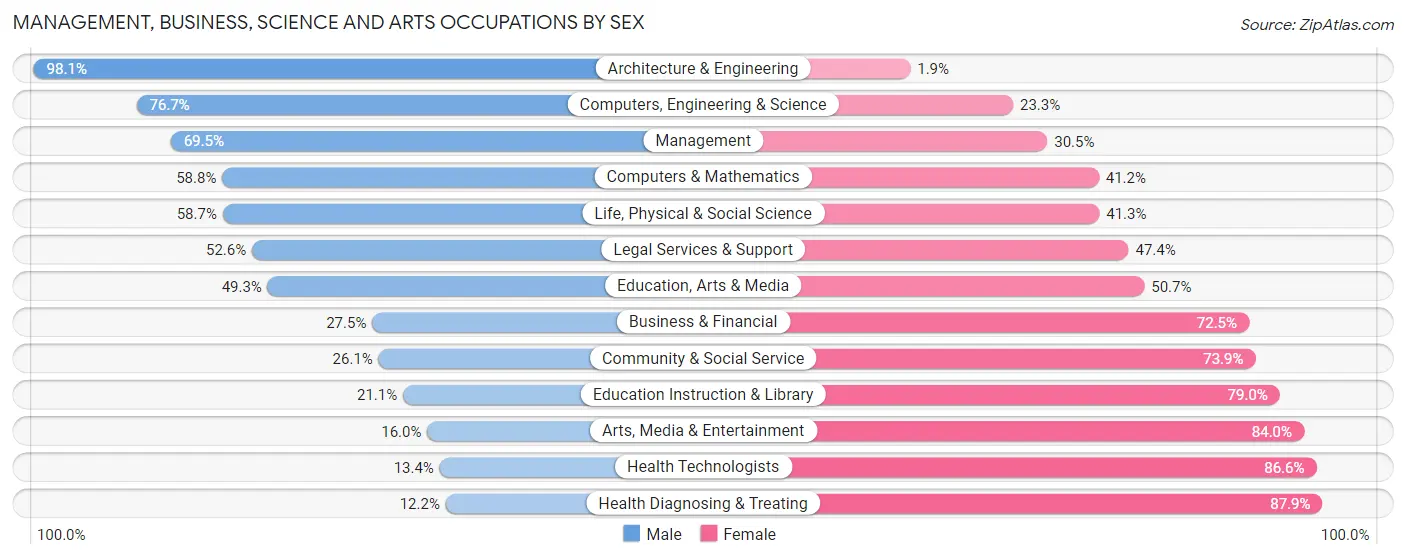
Management, Business, Science and Arts Occupations by Sex
Within the Management, Business, Science and Arts occupations in Sumner County, the most male-oriented occupations are Architecture & Engineering (98.1%), Computers, Engineering & Science (76.7%), and Management (69.5%), while the most female-oriented occupations are Health Diagnosing & Treating (87.8%), Health Technologists (86.6%), and Arts, Media & Entertainment (84.0%).
| Occupation | Male | Female |
| Management | 513 (69.5%) | 225 (30.5%) |
| Business & Financial | 119 (27.5%) | 314 (72.5%) |
| Computers, Engineering & Science | 266 (76.7%) | 81 (23.3%) |
| Computers & Mathematics | 67 (58.8%) | 47 (41.2%) |
| Architecture & Engineering | 155 (98.1%) | 3 (1.9%) |
| Life, Physical & Social Science | 44 (58.7%) | 31 (41.3%) |
| Community & Social Service | 310 (26.1%) | 876 (73.9%) |
| Education, Arts & Media | 69 (49.3%) | 71 (50.7%) |
| Legal Services & Support | 41 (52.6%) | 37 (47.4%) |
| Education Instruction & Library | 188 (21.0%) | 705 (78.9%) |
| Arts, Media & Entertainment | 12 (16.0%) | 63 (84.0%) |
| Health Diagnosing & Treating | 52 (12.1%) | 376 (87.8%) |
| Health Technologists | 46 (13.4%) | 297 (86.6%) |
| Total (Category) | 1,260 (40.2%) | 1,872 (59.8%) |
| Total (Overall) | 5,347 (53.7%) | 4,607 (46.3%) |
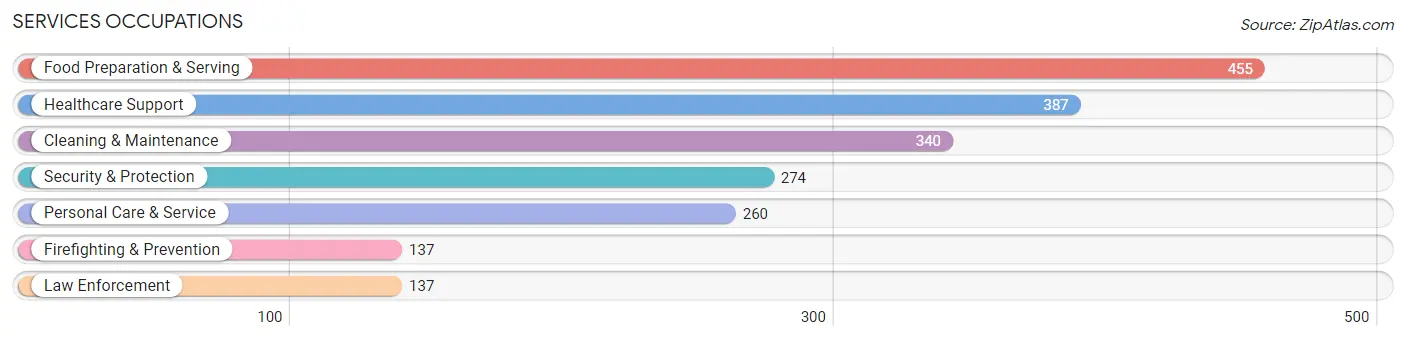
Services Occupations
The most common Services occupations in Sumner County are Food Preparation & Serving (455 | 4.6%), Healthcare Support (387 | 3.9%), Cleaning & Maintenance (340 | 3.4%), Security & Protection (274 | 2.8%), and Personal Care & Service (260 | 2.6%).
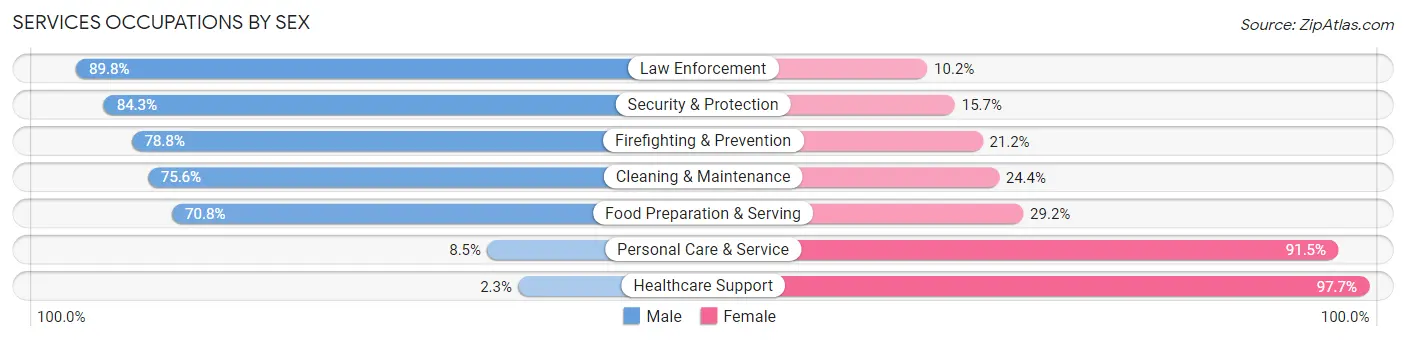
Services Occupations by Sex
Within the Services occupations in Sumner County, the most male-oriented occupations are Law Enforcement (89.8%), Security & Protection (84.3%), and Firefighting & Prevention (78.8%), while the most female-oriented occupations are Healthcare Support (97.7%), Personal Care & Service (91.5%), and Food Preparation & Serving (29.2%).
| Occupation | Male | Female |
| Healthcare Support | 9 (2.3%) | 378 (97.7%) |
| Security & Protection | 231 (84.3%) | 43 (15.7%) |
| Firefighting & Prevention | 108 (78.8%) | 29 (21.2%) |
| Law Enforcement | 123 (89.8%) | 14 (10.2%) |
| Food Preparation & Serving | 322 (70.8%) | 133 (29.2%) |
| Cleaning & Maintenance | 257 (75.6%) | 83 (24.4%) |
| Personal Care & Service | 22 (8.5%) | 238 (91.5%) |
| Total (Category) | 841 (49.0%) | 875 (51.0%) |
| Total (Overall) | 5,347 (53.7%) | 4,607 (46.3%) |
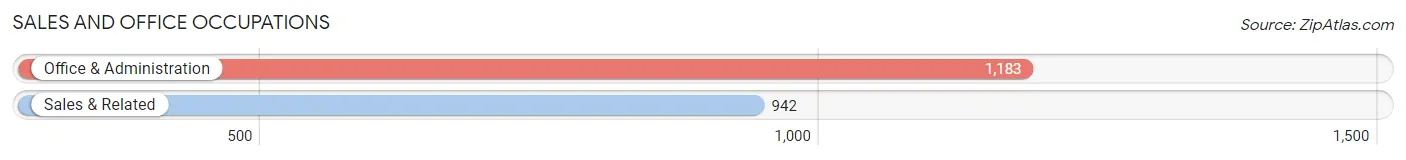
Sales and Office Occupations
The most common Sales and Office occupations in Sumner County are Office & Administration (1,183 | 11.9%), and Sales & Related (942 | 9.5%).
Sales and Office Occupations by Sex
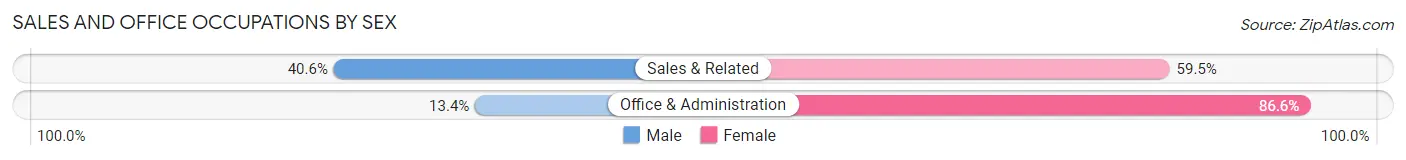
| Occupation | Male | Female |
| Sales & Related | 382 (40.6%) | 560 (59.5%) |
| Office & Administration | 158 (13.4%) | 1,025 (86.6%) |
| Total (Category) | 540 (25.4%) | 1,585 (74.6%) |
| Total (Overall) | 5,347 (53.7%) | 4,607 (46.3%) |
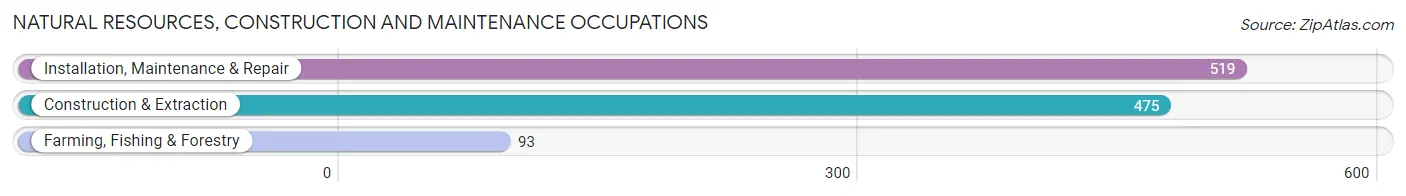
Natural Resources, Construction and Maintenance Occupations
The most common Natural Resources, Construction and Maintenance occupations in Sumner County are Installation, Maintenance & Repair (519 | 5.2%), Construction & Extraction (475 | 4.8%), and Farming, Fishing & Forestry (93 | 0.9%).
Natural Resources, Construction and Maintenance Occupations by Sex
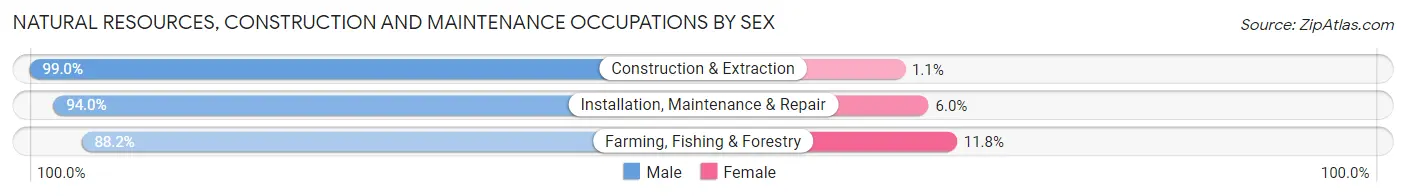
| Occupation | Male | Female |
| Farming, Fishing & Forestry | 82 (88.2%) | 11 (11.8%) |
| Construction & Extraction | 470 (99.0%) | 5 (1.1%) |
| Installation, Maintenance & Repair | 488 (94.0%) | 31 (6.0%) |
| Total (Category) | 1,040 (95.7%) | 47 (4.3%) |
| Total (Overall) | 5,347 (53.7%) | 4,607 (46.3%) |
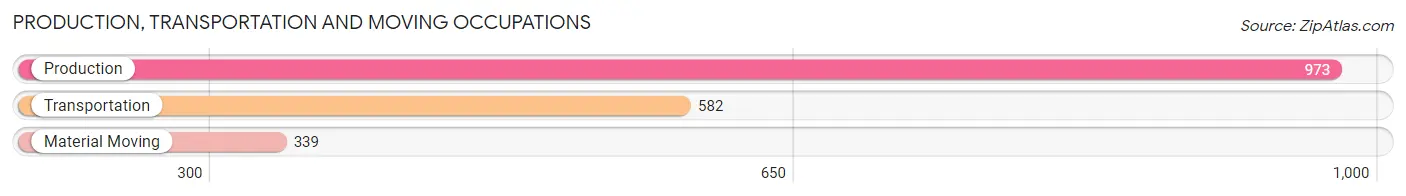
Production, Transportation and Moving Occupations
The most common Production, Transportation and Moving occupations in Sumner County are Production (973 | 9.8%), Transportation (582 | 5.9%), and Material Moving (339 | 3.4%).
Production, Transportation and Moving Occupations by Sex
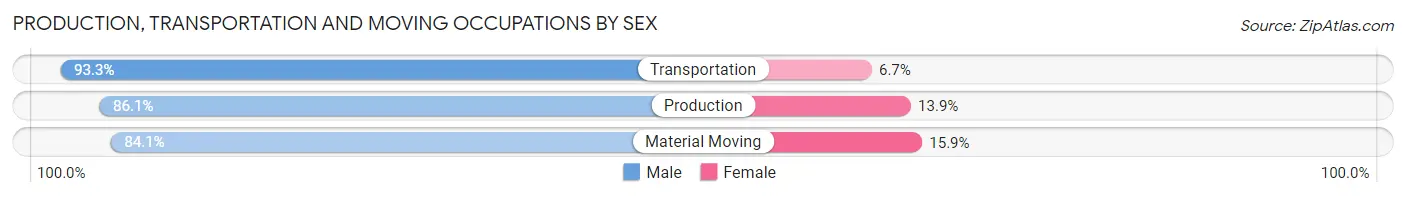
| Occupation | Male | Female |
| Production | 838 (86.1%) | 135 (13.9%) |
| Transportation | 543 (93.3%) | 39 (6.7%) |
| Material Moving | 285 (84.1%) | 54 (15.9%) |
| Total (Category) | 1,666 (88.0%) | 228 (12.0%) |
| Total (Overall) | 5,347 (53.7%) | 4,607 (46.3%) |
Employment Industries by Sex in Sumner County
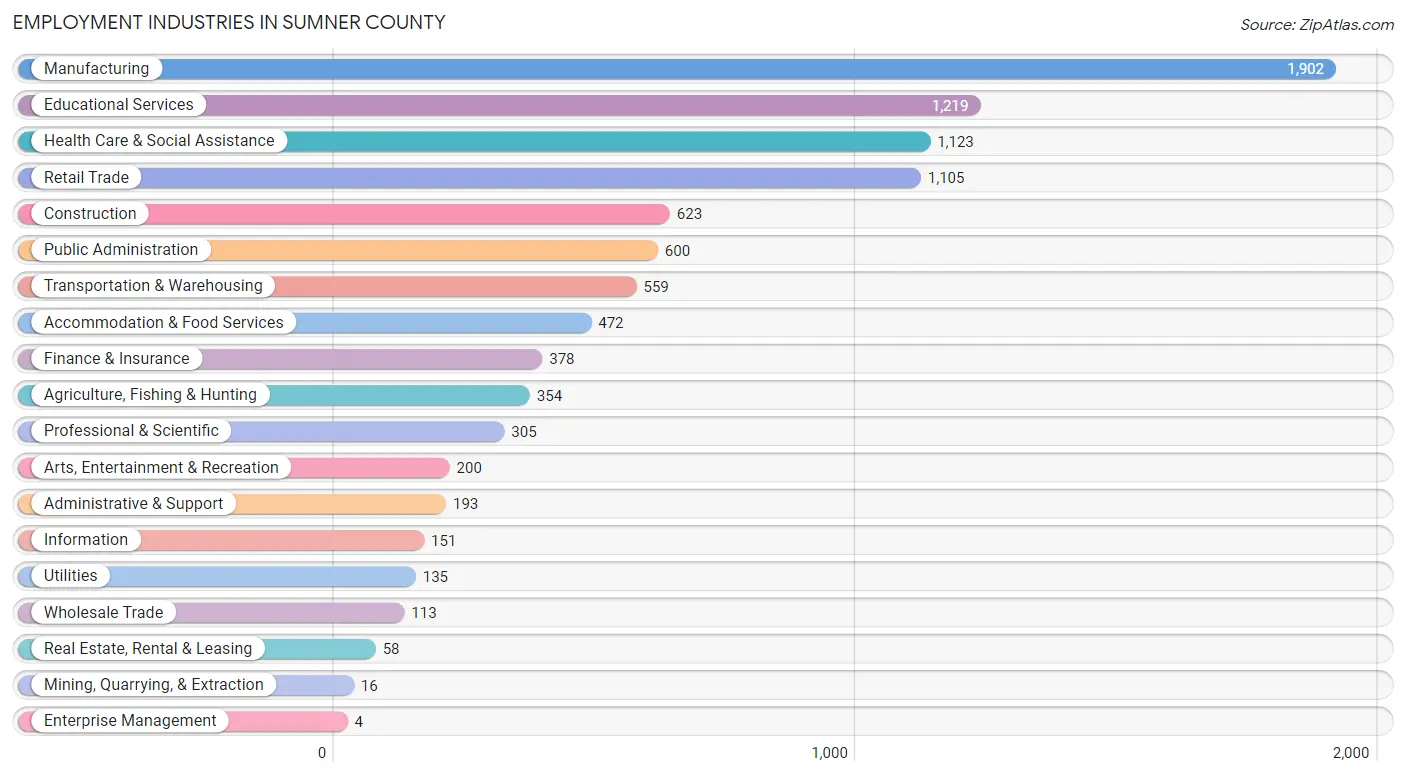
Employment Industries in Sumner County
The major employment industries in Sumner County include Manufacturing (1,902 | 19.1%), Educational Services (1,219 | 12.2%), Health Care & Social Assistance (1,123 | 11.3%), Retail Trade (1,105 | 11.1%), and Construction (623 | 6.3%).
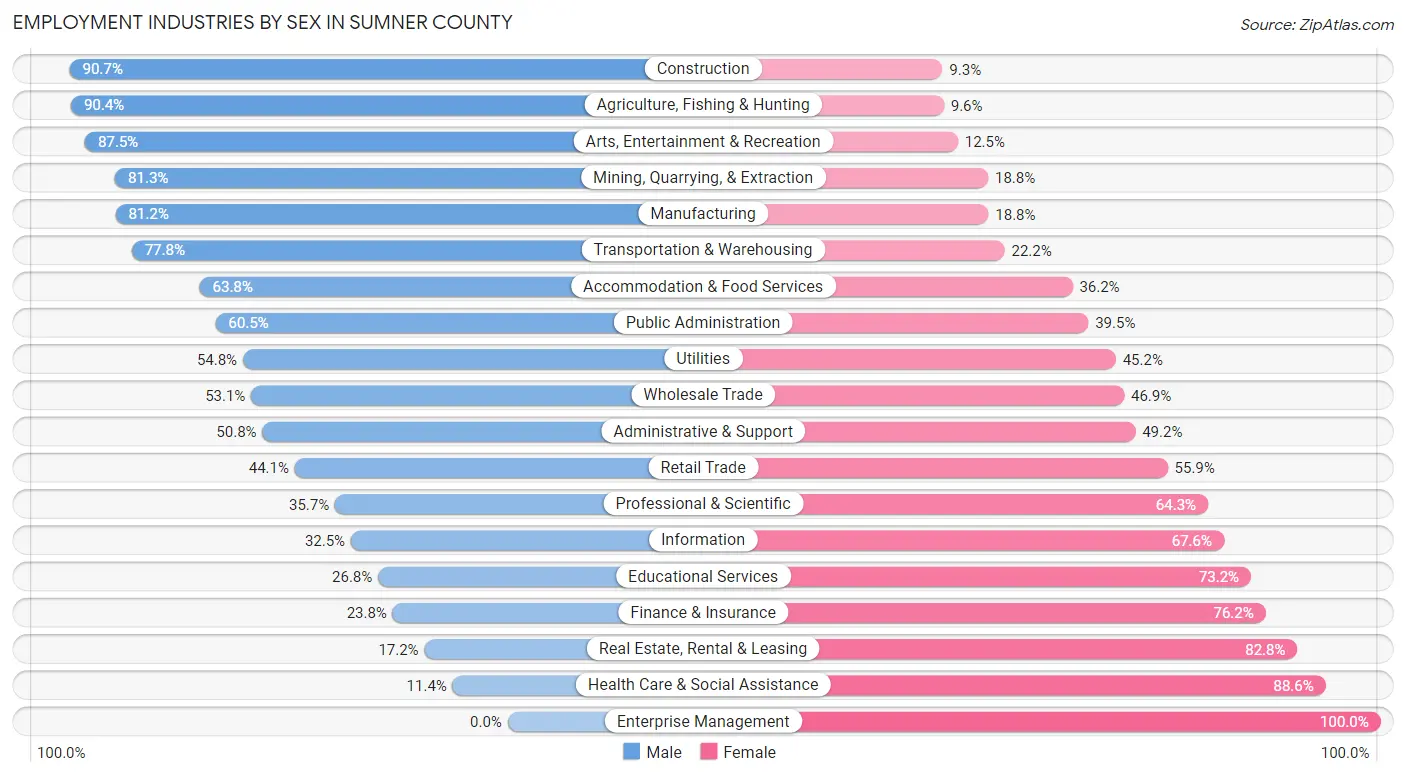
Employment Industries by Sex in Sumner County
The Sumner County industries that see more men than women are Construction (90.7%), Agriculture, Fishing & Hunting (90.4%), and Arts, Entertainment & Recreation (87.5%), whereas the industries that tend to have a higher number of women are Enterprise Management (100.0%), Health Care & Social Assistance (88.6%), and Real Estate, Rental & Leasing (82.8%).
| Industry | Male | Female |
| Agriculture, Fishing & Hunting | 320 (90.4%) | 34 (9.6%) |
| Mining, Quarrying, & Extraction | 13 (81.2%) | 3 (18.8%) |
| Construction | 565 (90.7%) | 58 (9.3%) |
| Manufacturing | 1,544 (81.2%) | 358 (18.8%) |
| Wholesale Trade | 60 (53.1%) | 53 (46.9%) |
| Retail Trade | 487 (44.1%) | 618 (55.9%) |
| Transportation & Warehousing | 435 (77.8%) | 124 (22.2%) |
| Utilities | 74 (54.8%) | 61 (45.2%) |
| Information | 49 (32.5%) | 102 (67.5%) |
| Finance & Insurance | 90 (23.8%) | 288 (76.2%) |
| Real Estate, Rental & Leasing | 10 (17.2%) | 48 (82.8%) |
| Professional & Scientific | 109 (35.7%) | 196 (64.3%) |
| Enterprise Management | 0 (0.0%) | 4 (100.0%) |
| Administrative & Support | 98 (50.8%) | 95 (49.2%) |
| Educational Services | 327 (26.8%) | 892 (73.2%) |
| Health Care & Social Assistance | 128 (11.4%) | 995 (88.6%) |
| Arts, Entertainment & Recreation | 175 (87.5%) | 25 (12.5%) |
| Accommodation & Food Services | 301 (63.8%) | 171 (36.2%) |
| Public Administration | 363 (60.5%) | 237 (39.5%) |
| Total | 5,347 (53.7%) | 4,607 (46.3%) |
Education in Sumner County
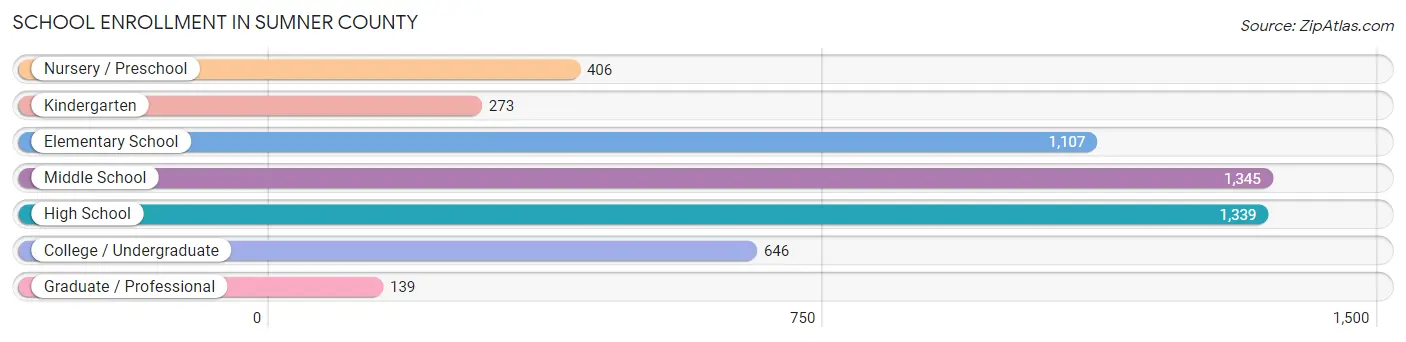
School Enrollment in Sumner County
The most common levels of schooling among the 5,255 students in Sumner County are middle school (1,345 | 25.6%), high school (1,339 | 25.5%), and elementary school (1,107 | 21.1%).
| School Level | # Students | % Students |
| Nursery / Preschool | 406 | 7.7% |
| Kindergarten | 273 | 5.2% |
| Elementary School | 1,107 | 21.1% |
| Middle School | 1,345 | 25.6% |
| High School | 1,339 | 25.5% |
| College / Undergraduate | 646 | 12.3% |
| Graduate / Professional | 139 | 2.6% |
| Total | 5,255 | 100.0% |
School Enrollment by Age by Funding Source in Sumner County
Out of a total of 5,255 students who are enrolled in schools in Sumner County, 494 (9.4%) attend a private institution, while the remaining 4,761 (90.6%) are enrolled in public schools. The age group of 3 to 4 year olds has the highest likelihood of being enrolled in private schools, with 69 (22.7% in the age bracket) enrolled. Conversely, the age group of 25 to 34 year olds has the lowest likelihood of being enrolled in a private school, with 156 (95.7% in the age bracket) attending a public institution.
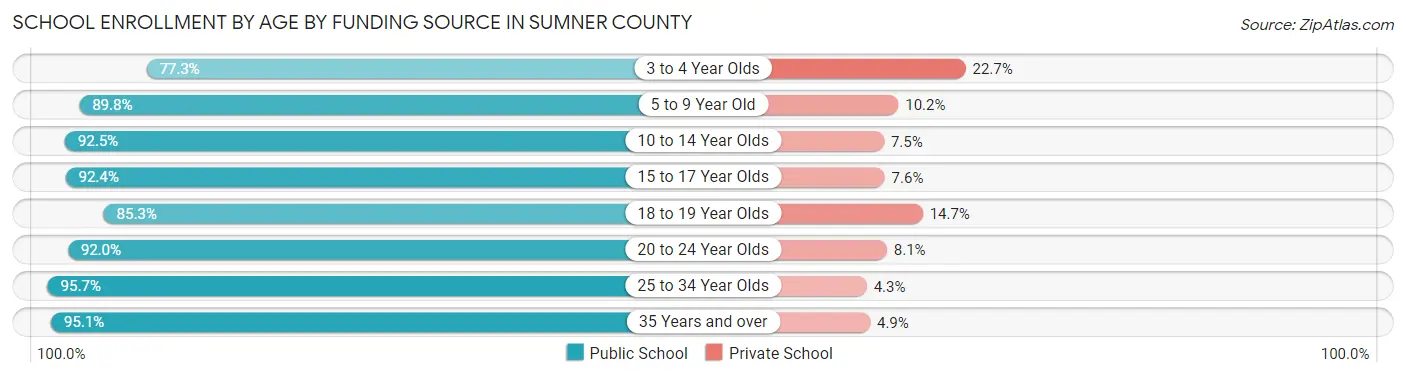
| Age Bracket | Public School | Private School |
| 3 to 4 Year Olds | 235 (77.3%) | 69 (22.7%) |
| 5 to 9 Year Old | 1,182 (89.8%) | 134 (10.2%) |
| 10 to 14 Year Olds | 1,490 (92.5%) | 121 (7.5%) |
| 15 to 17 Year Olds | 969 (92.4%) | 80 (7.6%) |
| 18 to 19 Year Olds | 278 (85.3%) | 48 (14.7%) |
| 20 to 24 Year Olds | 297 (91.9%) | 26 (8.1%) |
| 25 to 34 Year Olds | 156 (95.7%) | 7 (4.3%) |
| 35 Years and over | 155 (95.1%) | 8 (4.9%) |
| Total | 4,761 (90.6%) | 494 (9.4%) |
Educational Attainment by Field of Study in Sumner County
Education (947 | 25.1%), business (848 | 22.5%), science & technology (609 | 16.1%), bio, nature & agricultural (267 | 7.1%), and liberal arts & history (203 | 5.4%) are the most common fields of study among 3,775 individuals in Sumner County who have obtained a bachelor's degree or higher.
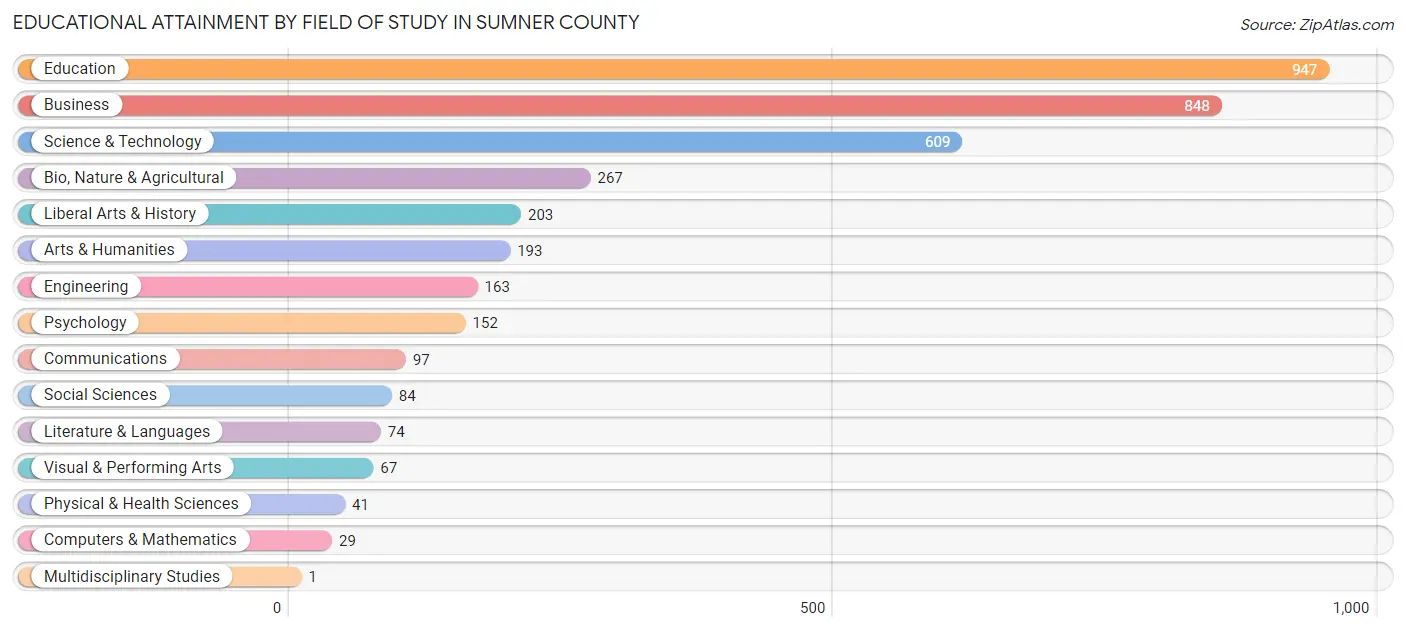
| Field of Study | # Graduates | % Graduates |
| Computers & Mathematics | 29 | 0.8% |
| Bio, Nature & Agricultural | 267 | 7.1% |
| Physical & Health Sciences | 41 | 1.1% |
| Psychology | 152 | 4.0% |
| Social Sciences | 84 | 2.2% |
| Engineering | 163 | 4.3% |
| Multidisciplinary Studies | 1 | 0.0% |
| Science & Technology | 609 | 16.1% |
| Business | 848 | 22.5% |
| Education | 947 | 25.1% |
| Literature & Languages | 74 | 2.0% |
| Liberal Arts & History | 203 | 5.4% |
| Visual & Performing Arts | 67 | 1.8% |
| Communications | 97 | 2.6% |
| Arts & Humanities | 193 | 5.1% |
| Total | 3,775 | 100.0% |
Transportation & Commute in Sumner County
Vehicle Availability by Sex in Sumner County
The most prevalent vehicle ownership categories in Sumner County are males with 2 vehicles (1,644, accounting for 31.0%) and females with 2 vehicles (1,491, making up 36.1%).
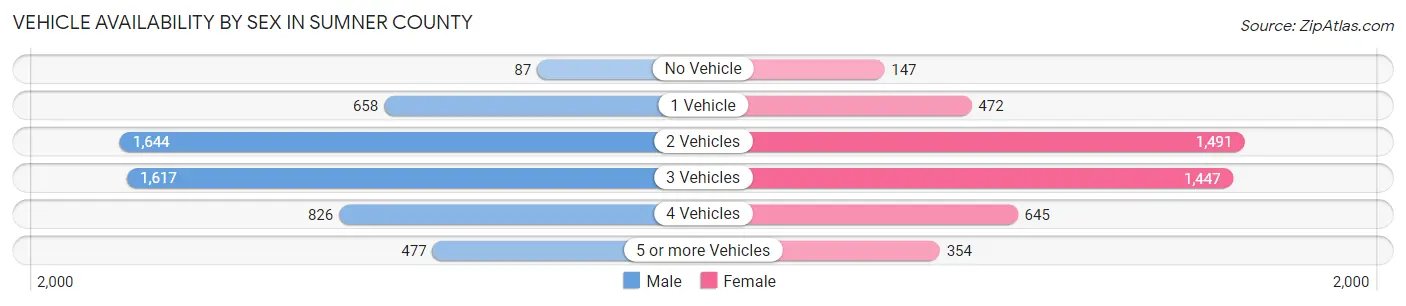
| Vehicles Available | Male | Female |
| No Vehicle | 87 (1.6%) | 147 (3.2%) |
| 1 Vehicle | 658 (12.4%) | 472 (10.4%) |
| 2 Vehicles | 1,644 (31.0%) | 1,491 (32.7%) |
| 3 Vehicles | 1,617 (30.5%) | 1,447 (31.8%) |
| 4 Vehicles | 826 (15.6%) | 645 (14.2%) |
| 5 or more Vehicles | 477 (9.0%) | 354 (7.8%) |
| Total | 5,309 (100.0%) | 4,556 (100.0%) |
Commute Time in Sumner County
The most frequently occuring commute durations in Sumner County are 30 to 34 minutes (1,775 commuters, 19.4%), 5 to 9 minutes (1,706 commuters, 18.6%), and 45 to 59 minutes (858 commuters, 9.3%).
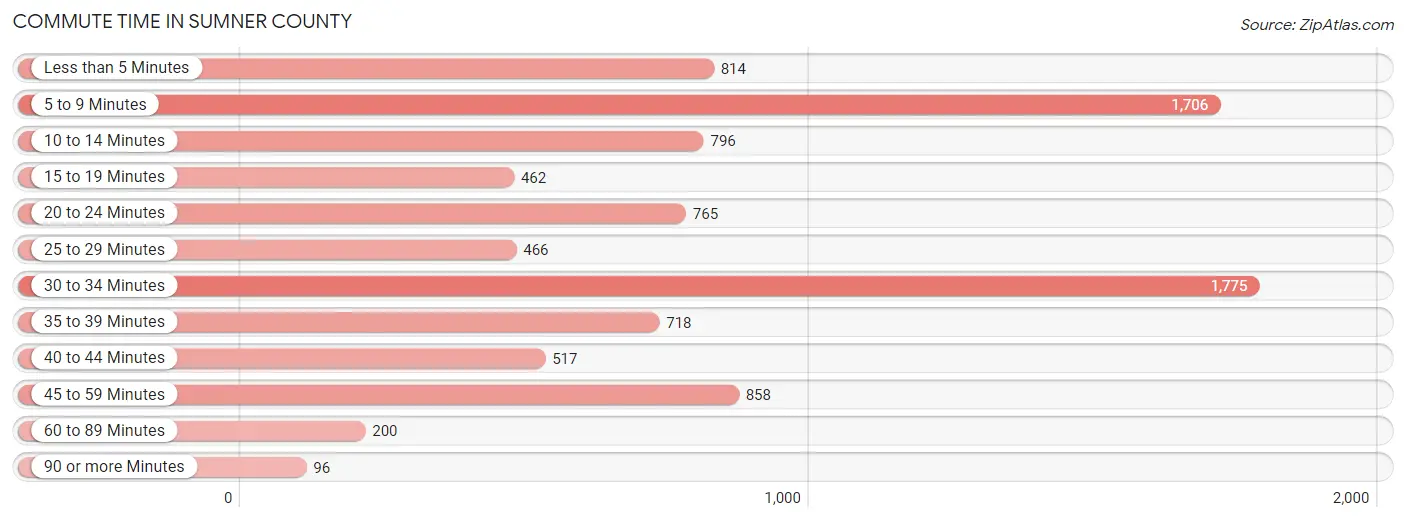
| Commute Time | # Commuters | % Commuters |
| Less than 5 Minutes | 814 | 8.9% |
| 5 to 9 Minutes | 1,706 | 18.6% |
| 10 to 14 Minutes | 796 | 8.7% |
| 15 to 19 Minutes | 462 | 5.0% |
| 20 to 24 Minutes | 765 | 8.3% |
| 25 to 29 Minutes | 466 | 5.1% |
| 30 to 34 Minutes | 1,775 | 19.4% |
| 35 to 39 Minutes | 718 | 7.8% |
| 40 to 44 Minutes | 517 | 5.6% |
| 45 to 59 Minutes | 858 | 9.3% |
| 60 to 89 Minutes | 200 | 2.2% |
| 90 or more Minutes | 96 | 1.1% |
Commute Time by Sex in Sumner County
The most common commute times in Sumner County are 30 to 34 minutes (961 commuters, 19.0%) for males and 5 to 9 minutes (815 commuters, 19.8%) for females.
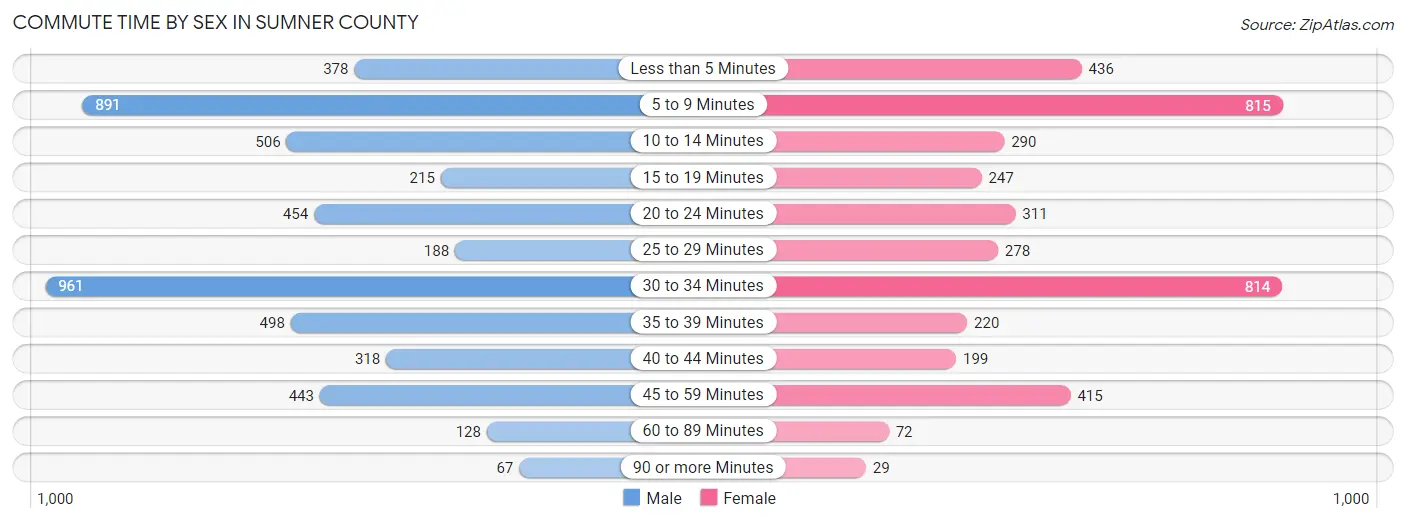
| Commute Time | Male | Female |
| Less than 5 Minutes | 378 (7.5%) | 436 (10.6%) |
| 5 to 9 Minutes | 891 (17.6%) | 815 (19.8%) |
| 10 to 14 Minutes | 506 (10.0%) | 290 (7.0%) |
| 15 to 19 Minutes | 215 (4.3%) | 247 (6.0%) |
| 20 to 24 Minutes | 454 (9.0%) | 311 (7.5%) |
| 25 to 29 Minutes | 188 (3.7%) | 278 (6.7%) |
| 30 to 34 Minutes | 961 (19.0%) | 814 (19.7%) |
| 35 to 39 Minutes | 498 (9.9%) | 220 (5.3%) |
| 40 to 44 Minutes | 318 (6.3%) | 199 (4.8%) |
| 45 to 59 Minutes | 443 (8.8%) | 415 (10.1%) |
| 60 to 89 Minutes | 128 (2.5%) | 72 (1.8%) |
| 90 or more Minutes | 67 (1.3%) | 29 (0.7%) |
Time of Departure to Work by Sex in Sumner County
The most frequent times of departure to work in Sumner County are 7:00 AM to 7:29 AM (797, 15.8%) for males and 7:00 AM to 7:29 AM (971, 23.5%) for females.
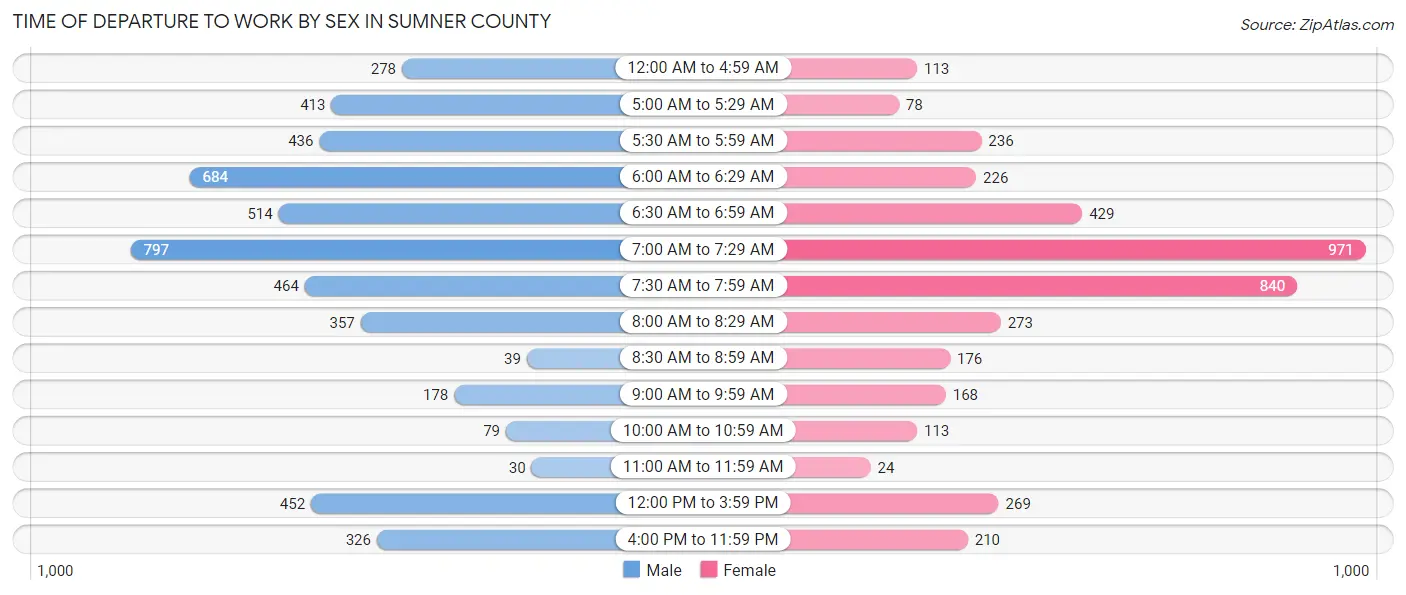
| Time of Departure | Male | Female |
| 12:00 AM to 4:59 AM | 278 (5.5%) | 113 (2.7%) |
| 5:00 AM to 5:29 AM | 413 (8.2%) | 78 (1.9%) |
| 5:30 AM to 5:59 AM | 436 (8.6%) | 236 (5.7%) |
| 6:00 AM to 6:29 AM | 684 (13.6%) | 226 (5.5%) |
| 6:30 AM to 6:59 AM | 514 (10.2%) | 429 (10.4%) |
| 7:00 AM to 7:29 AM | 797 (15.8%) | 971 (23.5%) |
| 7:30 AM to 7:59 AM | 464 (9.2%) | 840 (20.4%) |
| 8:00 AM to 8:29 AM | 357 (7.1%) | 273 (6.6%) |
| 8:30 AM to 8:59 AM | 39 (0.8%) | 176 (4.3%) |
| 9:00 AM to 9:59 AM | 178 (3.5%) | 168 (4.1%) |
| 10:00 AM to 10:59 AM | 79 (1.6%) | 113 (2.7%) |
| 11:00 AM to 11:59 AM | 30 (0.6%) | 24 (0.6%) |
| 12:00 PM to 3:59 PM | 452 (9.0%) | 269 (6.5%) |
| 4:00 PM to 11:59 PM | 326 (6.5%) | 210 (5.1%) |
| Total | 5,047 (100.0%) | 4,126 (100.0%) |
Housing Occupancy in Sumner County
Occupancy by Ownership in Sumner County
Of the total 8,977 dwellings in Sumner County, owner-occupied units account for 6,676 (74.4%), while renter-occupied units make up 2,301 (25.6%).
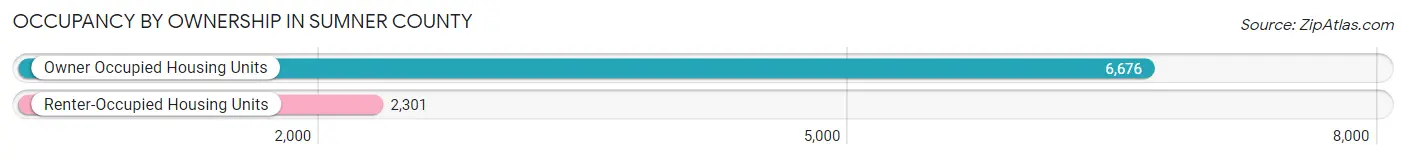
| Occupancy | # Housing Units | % Housing Units |
| Owner Occupied Housing Units | 6,676 | 74.4% |
| Renter-Occupied Housing Units | 2,301 | 25.6% |
| Total Occupied Housing Units | 8,977 | 100.0% |
Occupancy by Household Size in Sumner County
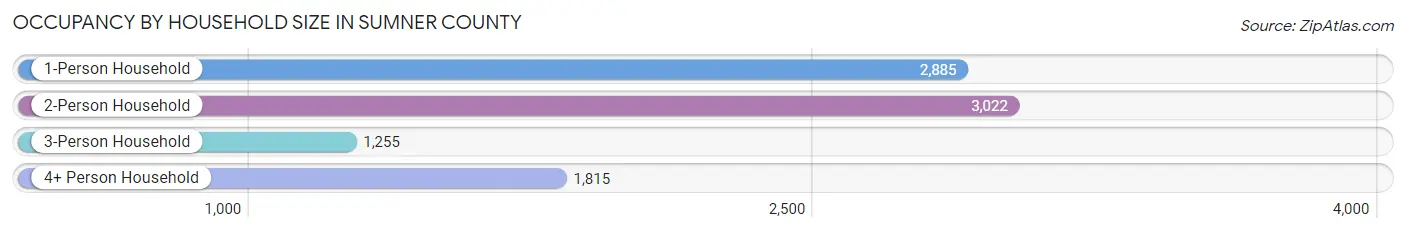
| Household Size | # Housing Units | % Housing Units |
| 1-Person Household | 2,885 | 32.1% |
| 2-Person Household | 3,022 | 33.7% |
| 3-Person Household | 1,255 | 14.0% |
| 4+ Person Household | 1,815 | 20.2% |
| Total Housing Units | 8,977 | 100.0% |
Occupancy by Ownership by Household Size in Sumner County
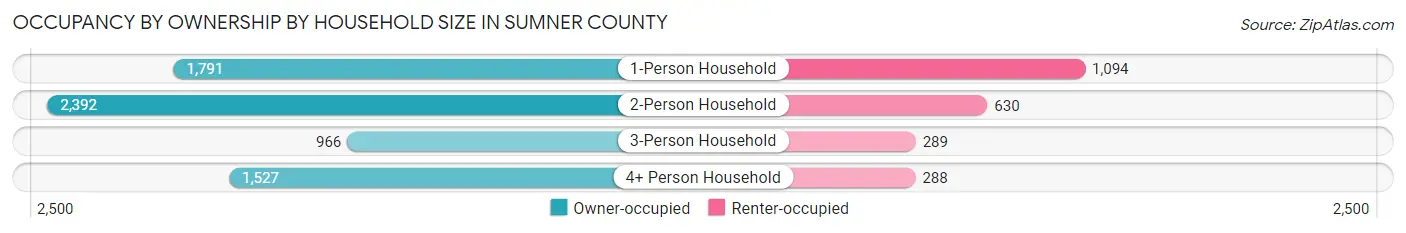
| Household Size | Owner-occupied | Renter-occupied |
| 1-Person Household | 1,791 (62.1%) | 1,094 (37.9%) |
| 2-Person Household | 2,392 (79.1%) | 630 (20.8%) |
| 3-Person Household | 966 (77.0%) | 289 (23.0%) |
| 4+ Person Household | 1,527 (84.1%) | 288 (15.9%) |
| Total Housing Units | 6,676 (74.4%) | 2,301 (25.6%) |
Occupancy by Educational Attainment in Sumner County
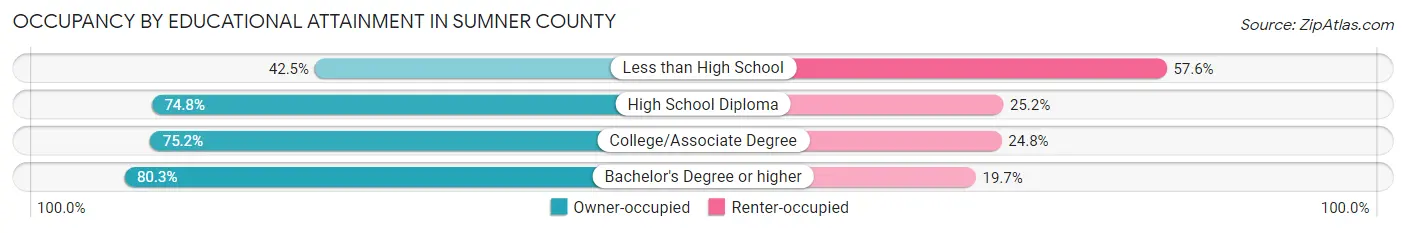
| Household Size | Owner-occupied | Renter-occupied |
| Less than High School | 236 (42.4%) | 320 (57.6%) |
| High School Diploma | 2,201 (74.8%) | 740 (25.2%) |
| College/Associate Degree | 2,361 (75.2%) | 780 (24.8%) |
| Bachelor's Degree or higher | 1,878 (80.3%) | 461 (19.7%) |
Occupancy by Age of Householder in Sumner County
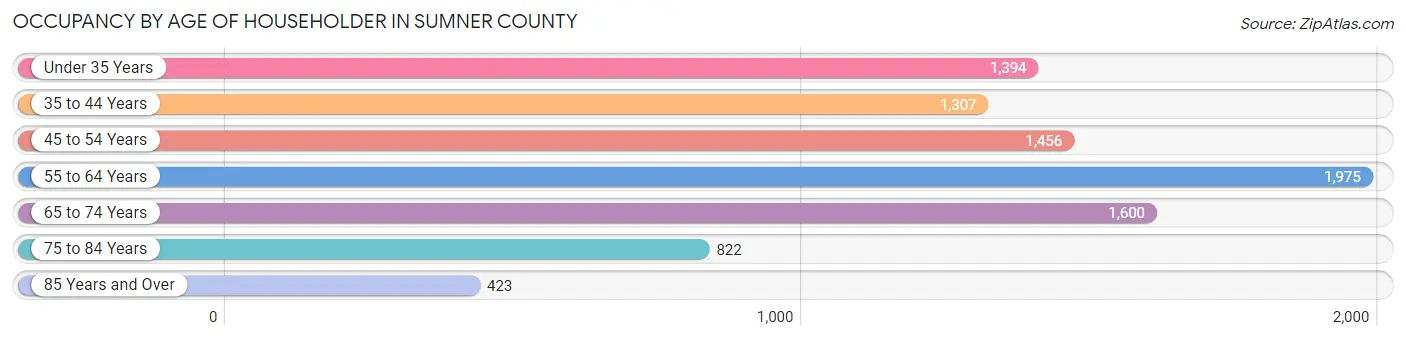
| Age Bracket | # Households | % Households |
| Under 35 Years | 1,394 | 15.5% |
| 35 to 44 Years | 1,307 | 14.6% |
| 45 to 54 Years | 1,456 | 16.2% |
| 55 to 64 Years | 1,975 | 22.0% |
| 65 to 74 Years | 1,600 | 17.8% |
| 75 to 84 Years | 822 | 9.2% |
| 85 Years and Over | 423 | 4.7% |
| Total | 8,977 | 100.0% |
Housing Finances in Sumner County
Median Income by Occupancy in Sumner County
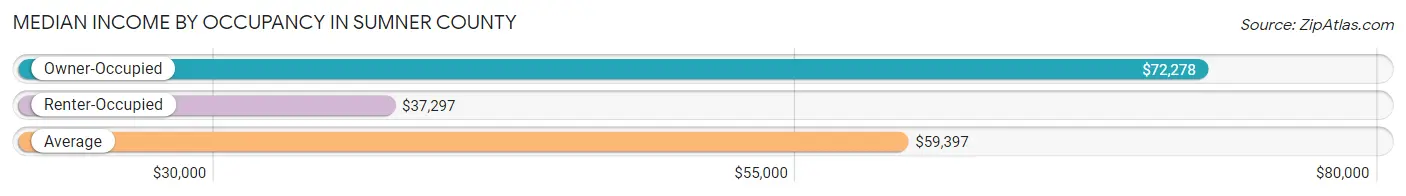
| Occupancy Type | # Households | Median Income |
| Owner-Occupied | 6,676 (74.4%) | $72,278 |
| Renter-Occupied | 2,301 (25.6%) | $37,297 |
| Average | 8,977 (100.0%) | $59,397 |
Occupancy by Householder Income Bracket in Sumner County
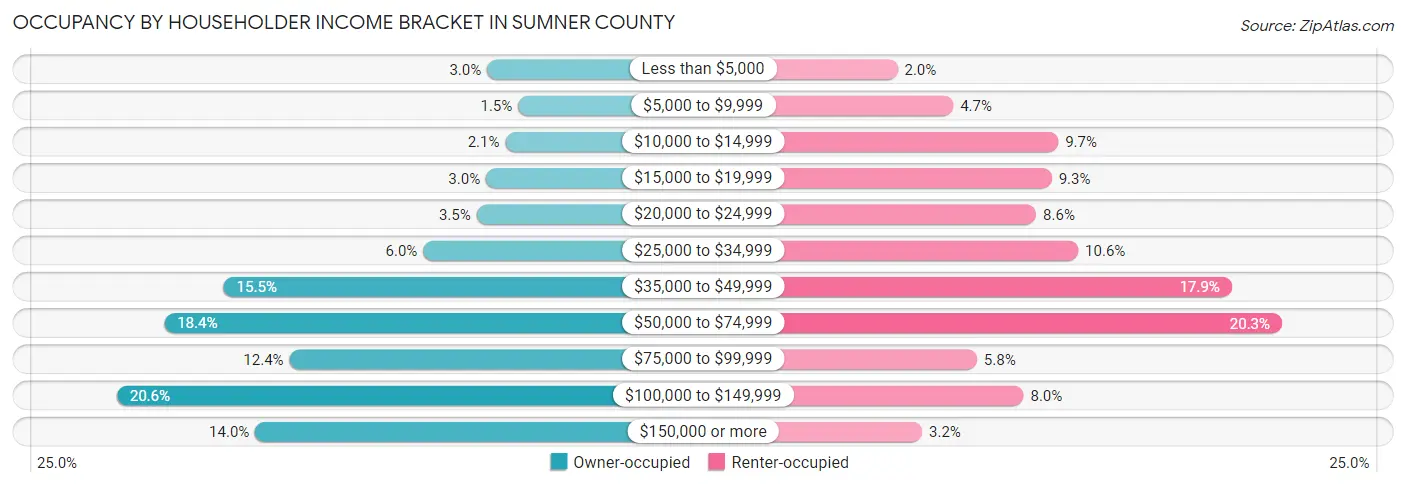
| Income Bracket | Owner-occupied | Renter-occupied |
| Less than $5,000 | 199 (3.0%) | 46 (2.0%) |
| $5,000 to $9,999 | 100 (1.5%) | 107 (4.6%) |
| $10,000 to $14,999 | 141 (2.1%) | 222 (9.7%) |
| $15,000 to $19,999 | 202 (3.0%) | 215 (9.3%) |
| $20,000 to $24,999 | 232 (3.5%) | 198 (8.6%) |
| $25,000 to $34,999 | 402 (6.0%) | 244 (10.6%) |
| $35,000 to $49,999 | 1,036 (15.5%) | 412 (17.9%) |
| $50,000 to $74,999 | 1,225 (18.3%) | 467 (20.3%) |
| $75,000 to $99,999 | 827 (12.4%) | 133 (5.8%) |
| $100,000 to $149,999 | 1,376 (20.6%) | 184 (8.0%) |
| $150,000 or more | 936 (14.0%) | 73 (3.2%) |
| Total | 6,676 (100.0%) | 2,301 (100.0%) |
Monthly Housing Cost Tiers in Sumner County
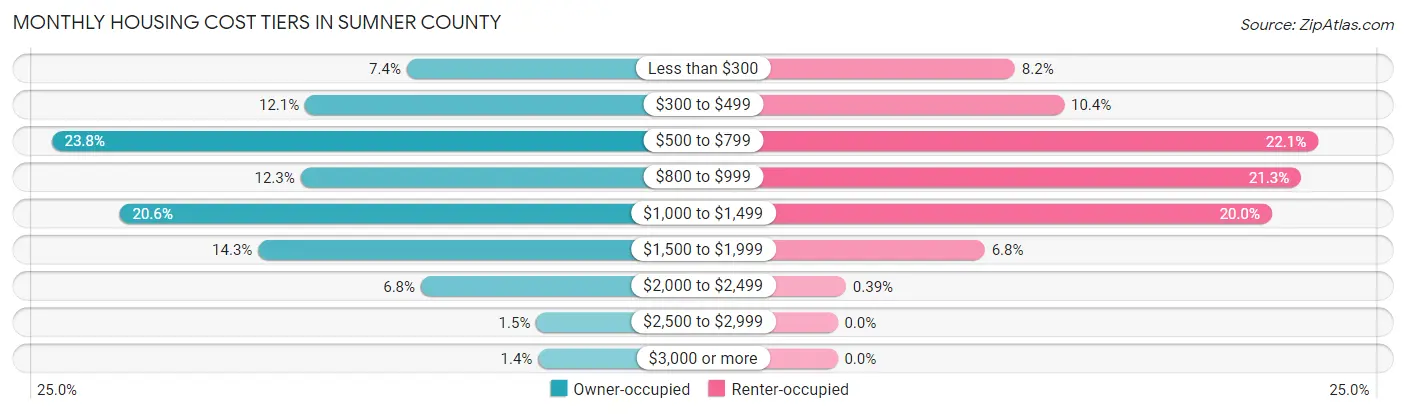
| Monthly Cost | Owner-occupied | Renter-occupied |
| Less than $300 | 495 (7.4%) | 188 (8.2%) |
| $300 to $499 | 807 (12.1%) | 240 (10.4%) |
| $500 to $799 | 1,586 (23.8%) | 509 (22.1%) |
| $800 to $999 | 821 (12.3%) | 491 (21.3%) |
| $1,000 to $1,499 | 1,377 (20.6%) | 460 (20.0%) |
| $1,500 to $1,999 | 951 (14.2%) | 156 (6.8%) |
| $2,000 to $2,499 | 451 (6.8%) | 9 (0.4%) |
| $2,500 to $2,999 | 97 (1.5%) | 0 (0.0%) |
| $3,000 or more | 91 (1.4%) | 0 (0.0%) |
| Total | 6,676 (100.0%) | 2,301 (100.0%) |
Physical Housing Characteristics in Sumner County
Housing Structures in Sumner County
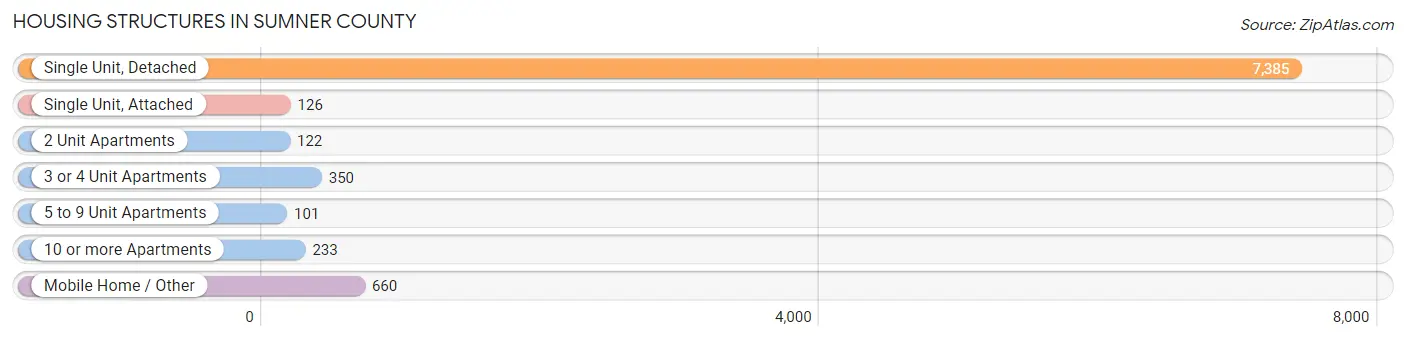
| Structure Type | # Housing Units | % Housing Units |
| Single Unit, Detached | 7,385 | 82.3% |
| Single Unit, Attached | 126 | 1.4% |
| 2 Unit Apartments | 122 | 1.4% |
| 3 or 4 Unit Apartments | 350 | 3.9% |
| 5 to 9 Unit Apartments | 101 | 1.1% |
| 10 or more Apartments | 233 | 2.6% |
| Mobile Home / Other | 660 | 7.3% |
| Total | 8,977 | 100.0% |
Housing Structures by Occupancy in Sumner County
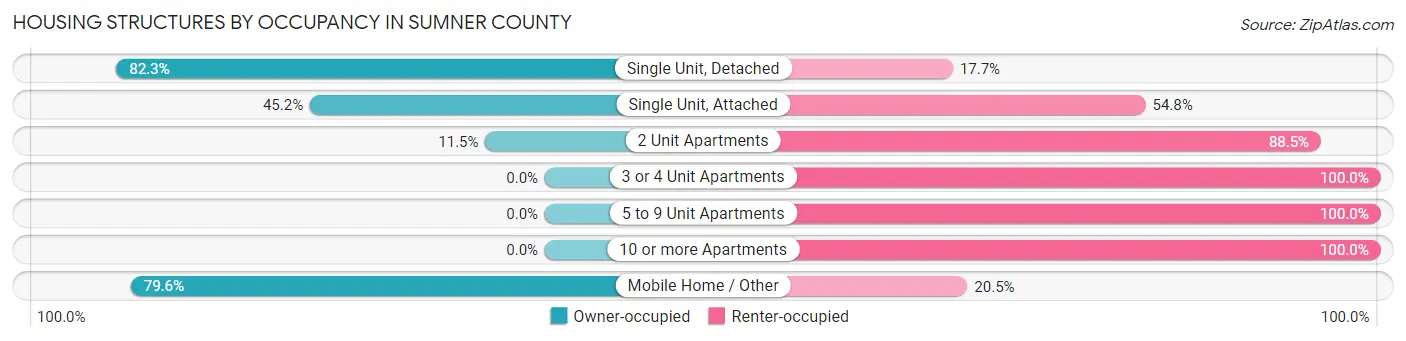
| Structure Type | Owner-occupied | Renter-occupied |
| Single Unit, Detached | 6,080 (82.3%) | 1,305 (17.7%) |
| Single Unit, Attached | 57 (45.2%) | 69 (54.8%) |
| 2 Unit Apartments | 14 (11.5%) | 108 (88.5%) |
| 3 or 4 Unit Apartments | 0 (0.0%) | 350 (100.0%) |
| 5 to 9 Unit Apartments | 0 (0.0%) | 101 (100.0%) |
| 10 or more Apartments | 0 (0.0%) | 233 (100.0%) |
| Mobile Home / Other | 525 (79.5%) | 135 (20.4%) |
| Total | 6,676 (74.4%) | 2,301 (25.6%) |
Housing Structures by Number of Rooms in Sumner County
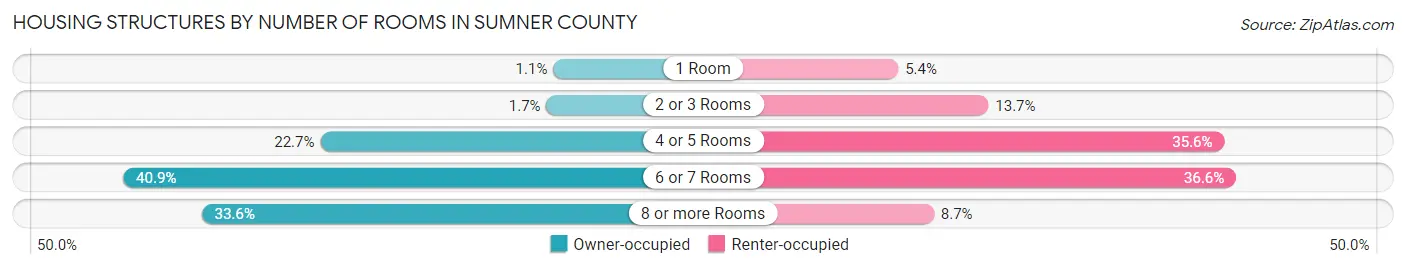
| Number of Rooms | Owner-occupied | Renter-occupied |
| 1 Room | 74 (1.1%) | 124 (5.4%) |
| 2 or 3 Rooms | 116 (1.7%) | 316 (13.7%) |
| 4 or 5 Rooms | 1,512 (22.7%) | 818 (35.5%) |
| 6 or 7 Rooms | 2,729 (40.9%) | 843 (36.6%) |
| 8 or more Rooms | 2,245 (33.6%) | 200 (8.7%) |
| Total | 6,676 (100.0%) | 2,301 (100.0%) |
Housing Structure by Heating Type in Sumner County
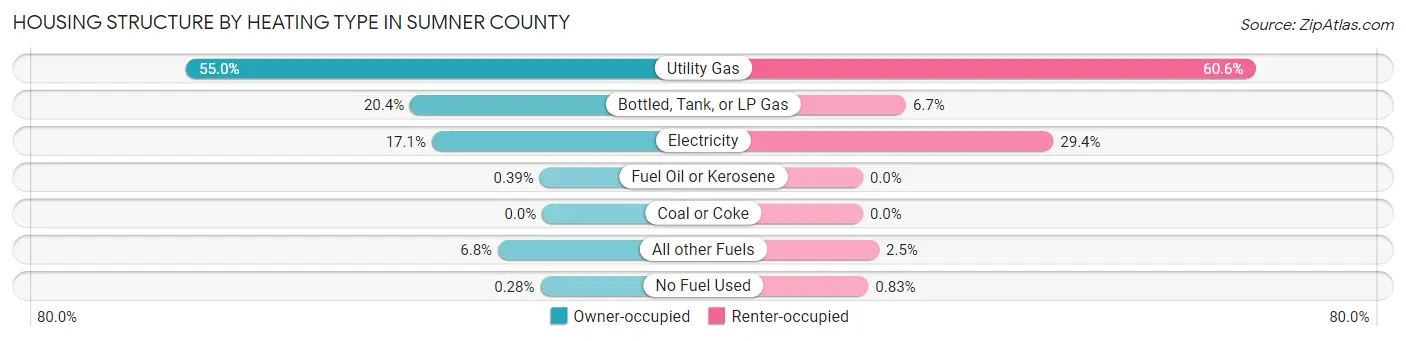
| Heating Type | Owner-occupied | Renter-occupied |
| Utility Gas | 3,673 (55.0%) | 1,395 (60.6%) |
| Bottled, Tank, or LP Gas | 1,363 (20.4%) | 153 (6.7%) |
| Electricity | 1,139 (17.1%) | 677 (29.4%) |
| Fuel Oil or Kerosene | 26 (0.4%) | 0 (0.0%) |
| Coal or Coke | 0 (0.0%) | 0 (0.0%) |
| All other Fuels | 456 (6.8%) | 57 (2.5%) |
| No Fuel Used | 19 (0.3%) | 19 (0.8%) |
| Total | 6,676 (100.0%) | 2,301 (100.0%) |
Household Vehicle Usage in Sumner County
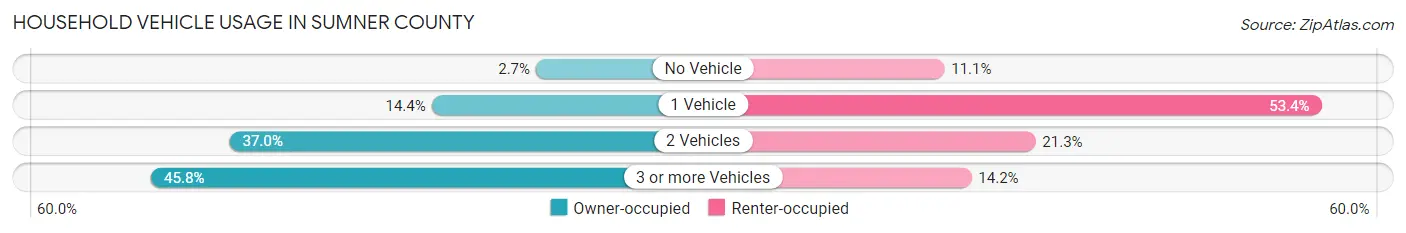
| Vehicles per Household | Owner-occupied | Renter-occupied |
| No Vehicle | 182 (2.7%) | 256 (11.1%) |
| 1 Vehicle | 962 (14.4%) | 1,228 (53.4%) |
| 2 Vehicles | 2,473 (37.0%) | 491 (21.3%) |
| 3 or more Vehicles | 3,059 (45.8%) | 326 (14.2%) |
| Total | 6,676 (100.0%) | 2,301 (100.0%) |
Real Estate & Mortgages in Sumner County
Real Estate and Mortgage Overview in Sumner County
| Characteristic | Without Mortgage | With Mortgage |
| Housing Units | 3,394 | 3,282 |
| Median Property Value | $97,700 | $149,800 |
| Median Household Income | $53,148 | $616 |
| Monthly Housing Costs | $593 | $65 |
| Real Estate Taxes | $1,630 | $45 |
Property Value by Mortgage Status in Sumner County
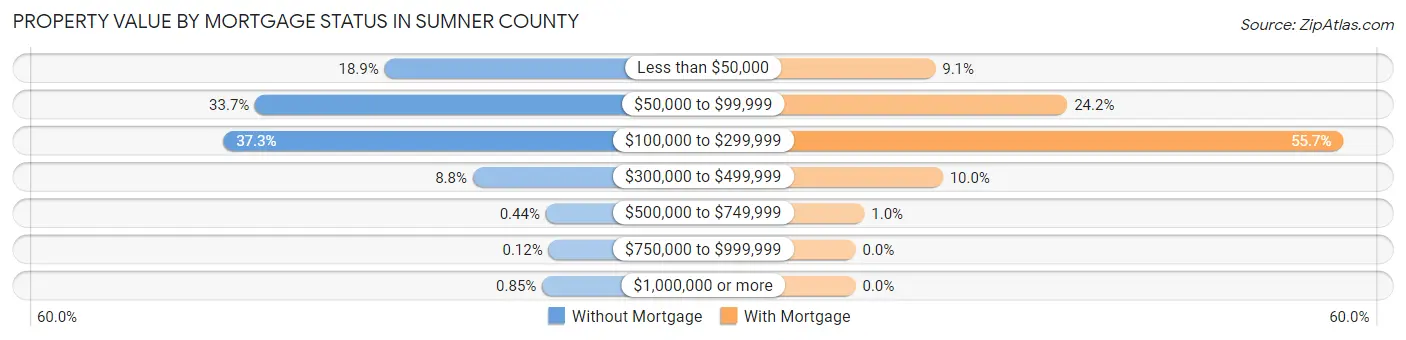
| Property Value | Without Mortgage | With Mortgage |
| Less than $50,000 | 640 (18.9%) | 299 (9.1%) |
| $50,000 to $99,999 | 1,142 (33.7%) | 794 (24.2%) |
| $100,000 to $299,999 | 1,266 (37.3%) | 1,829 (55.7%) |
| $300,000 to $499,999 | 298 (8.8%) | 327 (10.0%) |
| $500,000 to $749,999 | 15 (0.4%) | 33 (1.0%) |
| $750,000 to $999,999 | 4 (0.1%) | 0 (0.0%) |
| $1,000,000 or more | 29 (0.9%) | 0 (0.0%) |
| Total | 3,394 (100.0%) | 3,282 (100.0%) |
Household Income by Mortgage Status in Sumner County
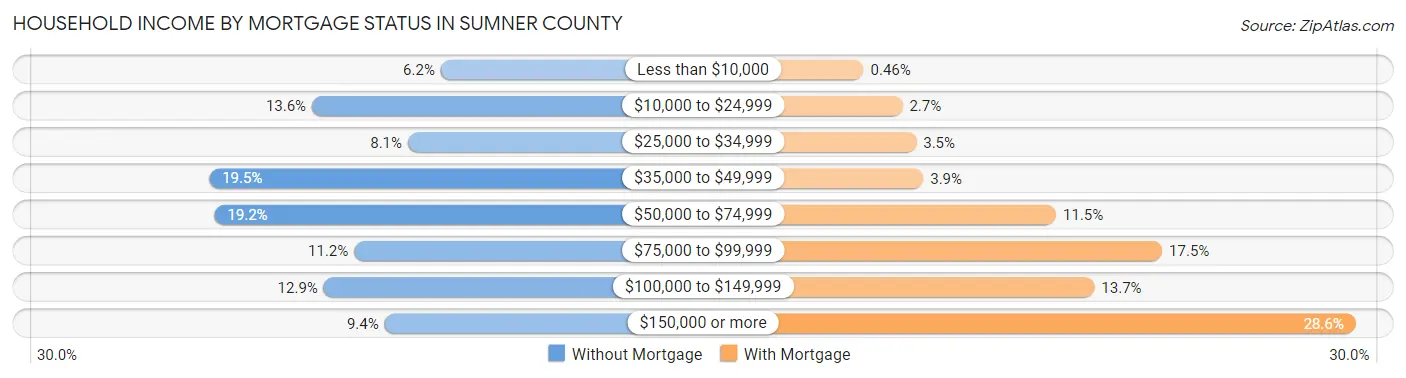
| Household Income | Without Mortgage | With Mortgage |
| Less than $10,000 | 211 (6.2%) | 15 (0.5%) |
| $10,000 to $24,999 | 461 (13.6%) | 88 (2.7%) |
| $25,000 to $34,999 | 275 (8.1%) | 114 (3.5%) |
| $35,000 to $49,999 | 660 (19.5%) | 127 (3.9%) |
| $50,000 to $74,999 | 650 (19.2%) | 376 (11.5%) |
| $75,000 to $99,999 | 379 (11.2%) | 575 (17.5%) |
| $100,000 to $149,999 | 438 (12.9%) | 448 (13.7%) |
| $150,000 or more | 320 (9.4%) | 938 (28.6%) |
| Total | 3,394 (100.0%) | 3,282 (100.0%) |
Property Value to Household Income Ratio in Sumner County
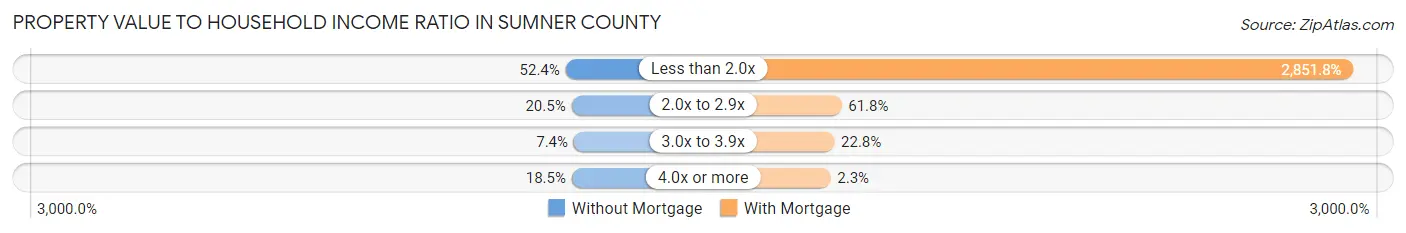
| Value-to-Income Ratio | Without Mortgage | With Mortgage |
| Less than 2.0x | 1,778 (52.4%) | 93,596 (2,851.8%) |
| 2.0x to 2.9x | 694 (20.4%) | 2,029 (61.8%) |
| 3.0x to 3.9x | 250 (7.4%) | 747 (22.8%) |
| 4.0x or more | 629 (18.5%) | 74 (2.2%) |
| Total | 3,394 (100.0%) | 3,282 (100.0%) |
Real Estate Taxes by Mortgage Status in Sumner County
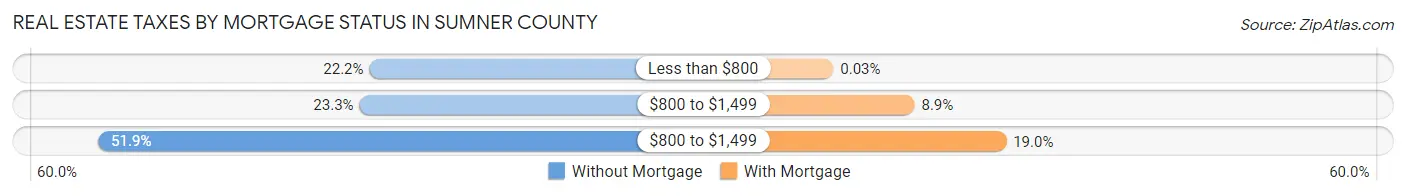
| Property Taxes | Without Mortgage | With Mortgage |
| Less than $800 | 754 (22.2%) | 1 (0.0%) |
| $800 to $1,499 | 791 (23.3%) | 293 (8.9%) |
| $800 to $1,499 | 1,763 (51.9%) | 623 (19.0%) |
| Total | 3,394 (100.0%) | 3,282 (100.0%) |
Health & Disability in Sumner County
Health Insurance Coverage by Age in Sumner County
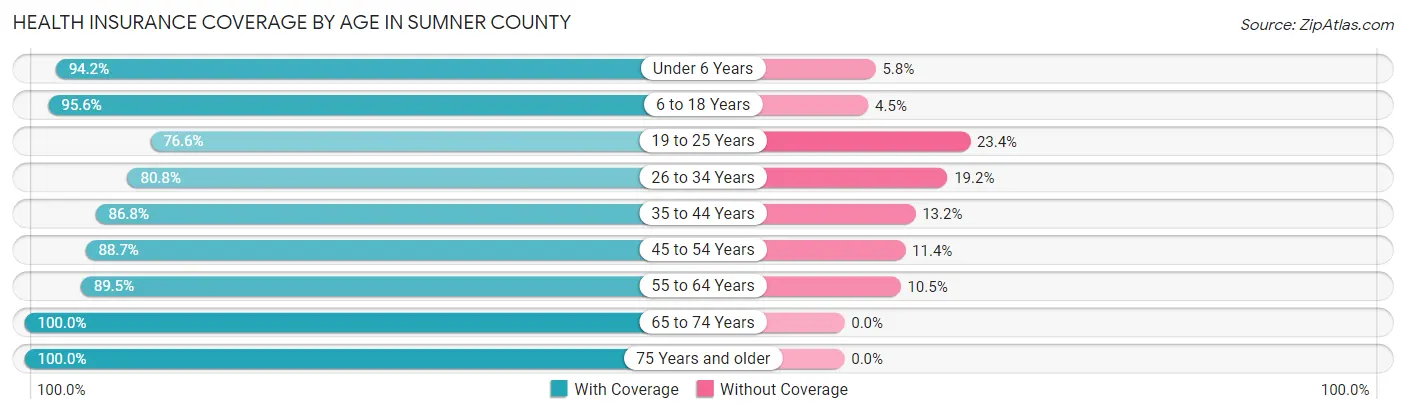
| Age Bracket | With Coverage | Without Coverage |
| Under 6 Years | 1,523 (94.2%) | 94 (5.8%) |
| 6 to 18 Years | 3,953 (95.6%) | 184 (4.4%) |
| 19 to 25 Years | 1,356 (76.6%) | 415 (23.4%) |
| 26 to 34 Years | 1,671 (80.8%) | 397 (19.2%) |
| 35 to 44 Years | 2,170 (86.8%) | 331 (13.2%) |
| 45 to 54 Years | 2,312 (88.6%) | 296 (11.4%) |
| 55 to 64 Years | 2,954 (89.5%) | 346 (10.5%) |
| 65 to 74 Years | 2,485 (100.0%) | 0 (0.0%) |
| 75 Years and older | 1,628 (100.0%) | 0 (0.0%) |
| Total | 20,052 (90.7%) | 2,063 (9.3%) |
Health Insurance Coverage by Citizenship Status in Sumner County
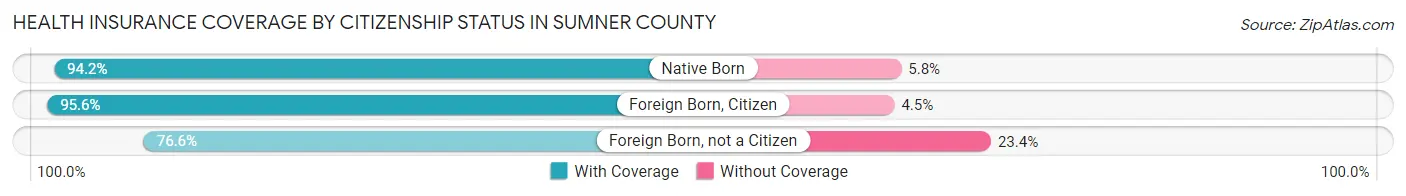
| Citizenship Status | With Coverage | Without Coverage |
| Native Born | 1,523 (94.2%) | 94 (5.8%) |
| Foreign Born, Citizen | 3,953 (95.6%) | 184 (4.4%) |
| Foreign Born, not a Citizen | 1,356 (76.6%) | 415 (23.4%) |
Health Insurance Coverage by Household Income in Sumner County
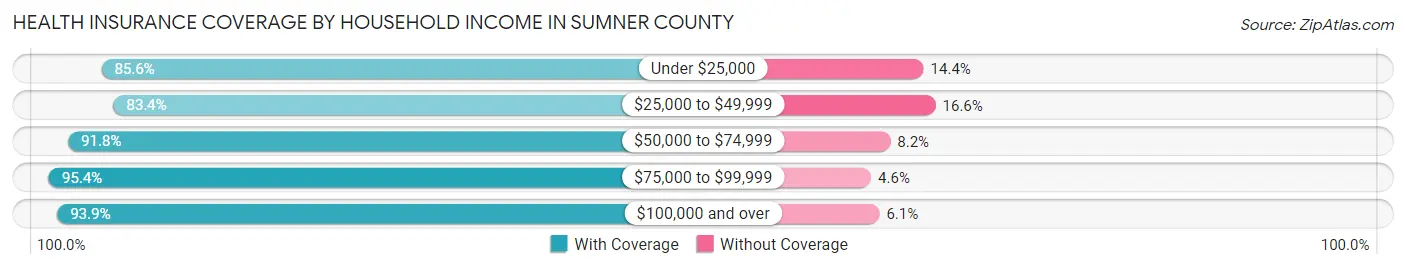
| Household Income | With Coverage | Without Coverage |
| Under $25,000 | 2,068 (85.6%) | 348 (14.4%) |
| $25,000 to $49,999 | 3,756 (83.4%) | 750 (16.6%) |
| $50,000 to $74,999 | 3,736 (91.8%) | 332 (8.2%) |
| $75,000 to $99,999 | 2,867 (95.4%) | 137 (4.6%) |
| $100,000 and over | 7,612 (93.9%) | 496 (6.1%) |
Public vs Private Health Insurance Coverage by Age in Sumner County
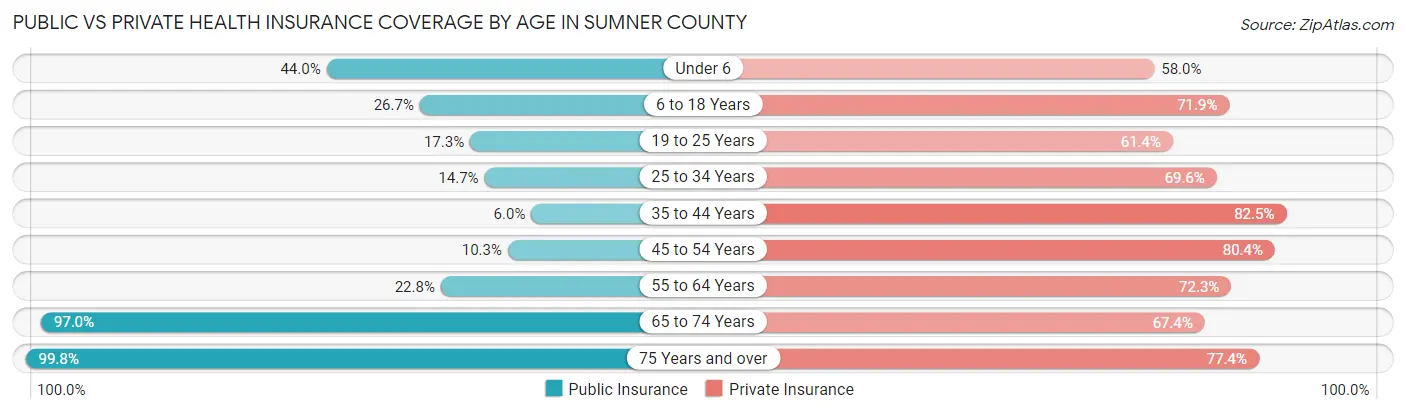
| Age Bracket | Public Insurance | Private Insurance |
| Under 6 | 711 (44.0%) | 938 (58.0%) |
| 6 to 18 Years | 1,103 (26.7%) | 2,975 (71.9%) |
| 19 to 25 Years | 307 (17.3%) | 1,088 (61.4%) |
| 25 to 34 Years | 303 (14.6%) | 1,439 (69.6%) |
| 35 to 44 Years | 149 (6.0%) | 2,063 (82.5%) |
| 45 to 54 Years | 269 (10.3%) | 2,096 (80.4%) |
| 55 to 64 Years | 751 (22.8%) | 2,385 (72.3%) |
| 65 to 74 Years | 2,410 (97.0%) | 1,674 (67.4%) |
| 75 Years and over | 1,625 (99.8%) | 1,260 (77.4%) |
| Total | 7,628 (34.5%) | 15,918 (72.0%) |
Disability Status by Sex by Age in Sumner County
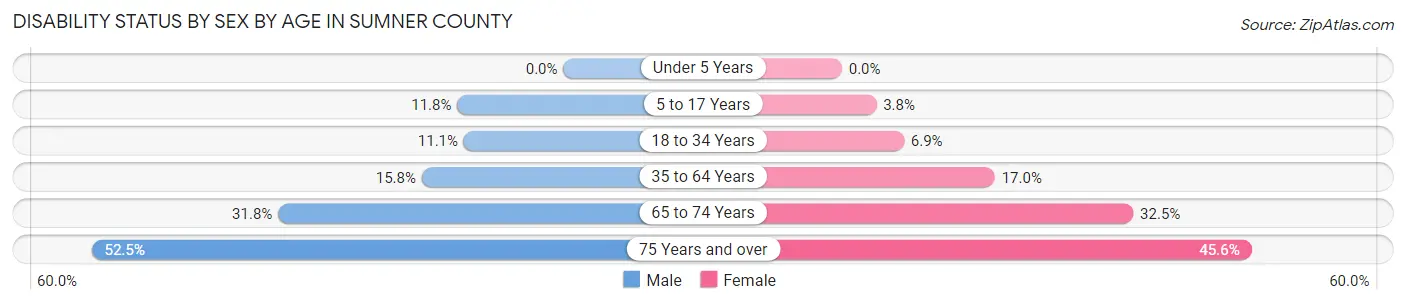
| Age Bracket | Male | Female |
| Under 5 Years | 0 (0.0%) | 0 (0.0%) |
| 5 to 17 Years | 258 (11.8%) | 74 (3.8%) |
| 18 to 34 Years | 230 (11.1%) | 143 (6.9%) |
| 35 to 64 Years | 678 (15.8%) | 700 (17.0%) |
| 65 to 74 Years | 384 (31.8%) | 414 (32.5%) |
| 75 Years and over | 351 (52.5%) | 438 (45.6%) |
Disability Class by Sex by Age in Sumner County
Disability Class: Hearing Difficulty
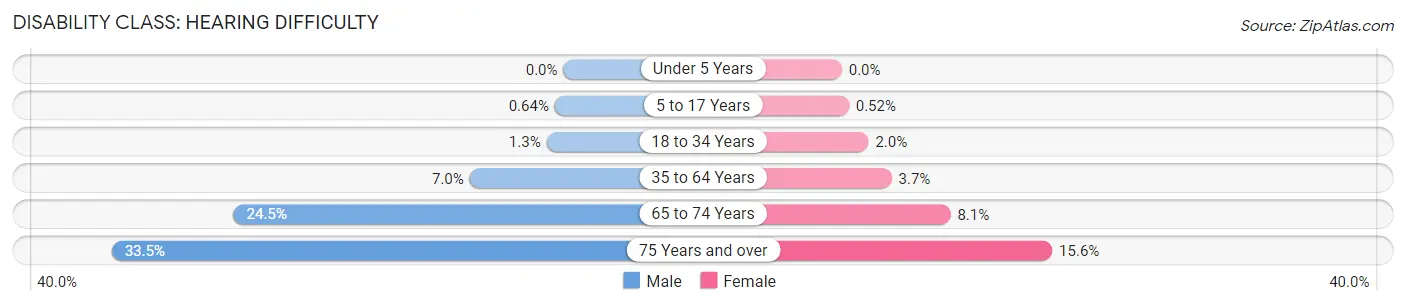
| Age Bracket | Male | Female |
| Under 5 Years | 0 (0.0%) | 0 (0.0%) |
| 5 to 17 Years | 14 (0.6%) | 10 (0.5%) |
| 18 to 34 Years | 26 (1.3%) | 41 (2.0%) |
| 35 to 64 Years | 299 (7.0%) | 152 (3.7%) |
| 65 to 74 Years | 296 (24.5%) | 103 (8.1%) |
| 75 Years and over | 224 (33.5%) | 150 (15.6%) |
Disability Class: Vision Difficulty
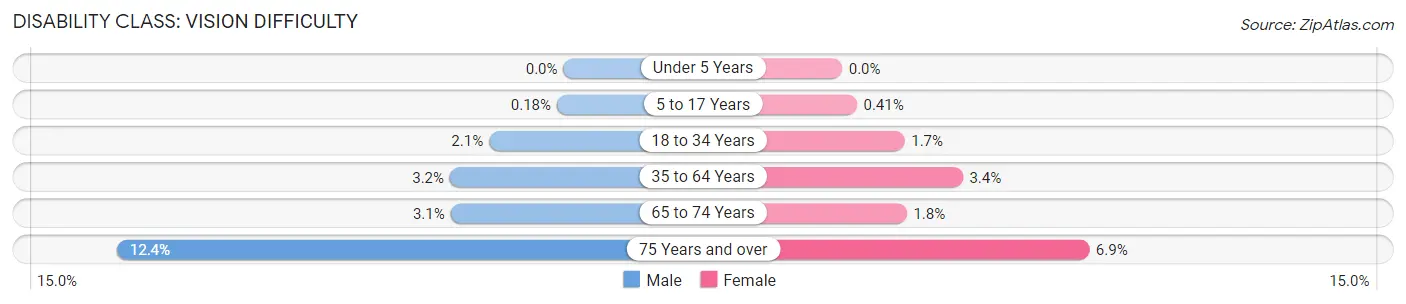
| Age Bracket | Male | Female |
| Under 5 Years | 0 (0.0%) | 0 (0.0%) |
| 5 to 17 Years | 4 (0.2%) | 8 (0.4%) |
| 18 to 34 Years | 43 (2.1%) | 36 (1.7%) |
| 35 to 64 Years | 136 (3.2%) | 138 (3.4%) |
| 65 to 74 Years | 38 (3.1%) | 23 (1.8%) |
| 75 Years and over | 83 (12.4%) | 66 (6.9%) |
Disability Class: Cognitive Difficulty
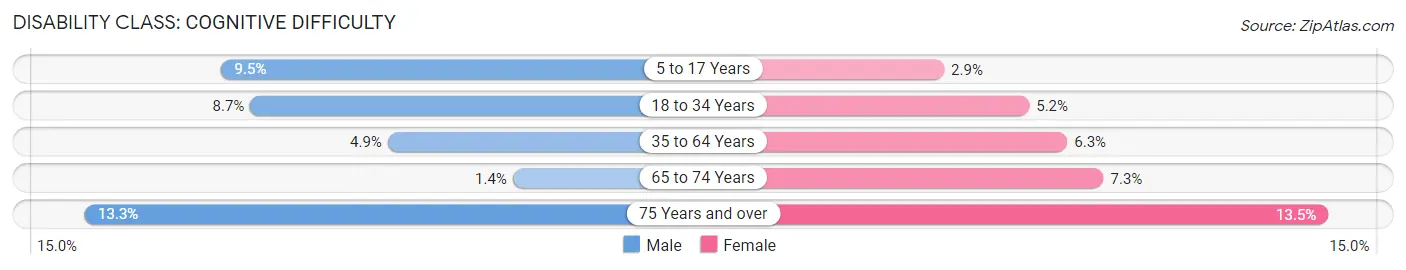
| Age Bracket | Male | Female |
| 5 to 17 Years | 208 (9.5%) | 55 (2.9%) |
| 18 to 34 Years | 181 (8.7%) | 108 (5.2%) |
| 35 to 64 Years | 210 (4.9%) | 258 (6.3%) |
| 65 to 74 Years | 17 (1.4%) | 93 (7.3%) |
| 75 Years and over | 89 (13.3%) | 130 (13.5%) |
Disability Class: Ambulatory Difficulty
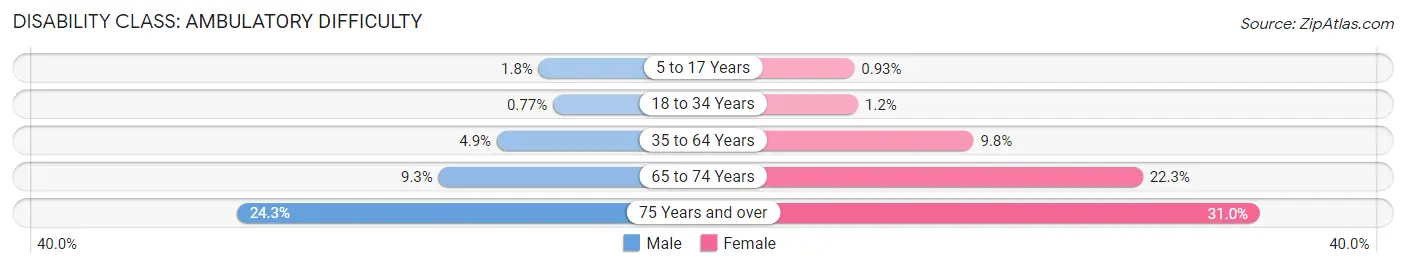
| Age Bracket | Male | Female |
| 5 to 17 Years | 40 (1.8%) | 18 (0.9%) |
| 18 to 34 Years | 16 (0.8%) | 25 (1.2%) |
| 35 to 64 Years | 212 (4.9%) | 402 (9.8%) |
| 65 to 74 Years | 112 (9.3%) | 285 (22.3%) |
| 75 Years and over | 162 (24.2%) | 298 (31.0%) |
Disability Class: Self-Care Difficulty
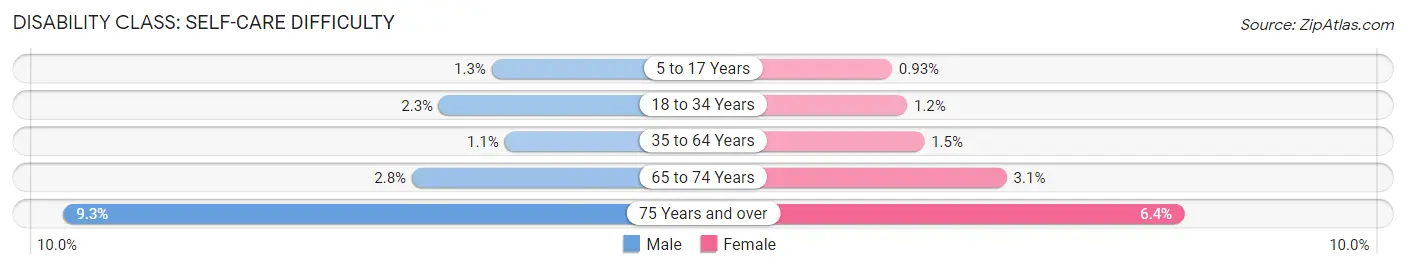
| Age Bracket | Male | Female |
| 5 to 17 Years | 29 (1.3%) | 18 (0.9%) |
| 18 to 34 Years | 48 (2.3%) | 25 (1.2%) |
| 35 to 64 Years | 47 (1.1%) | 63 (1.5%) |
| 65 to 74 Years | 34 (2.8%) | 39 (3.1%) |
| 75 Years and over | 62 (9.3%) | 61 (6.4%) |
Technology Access in Sumner County
Computing Device Access in Sumner County
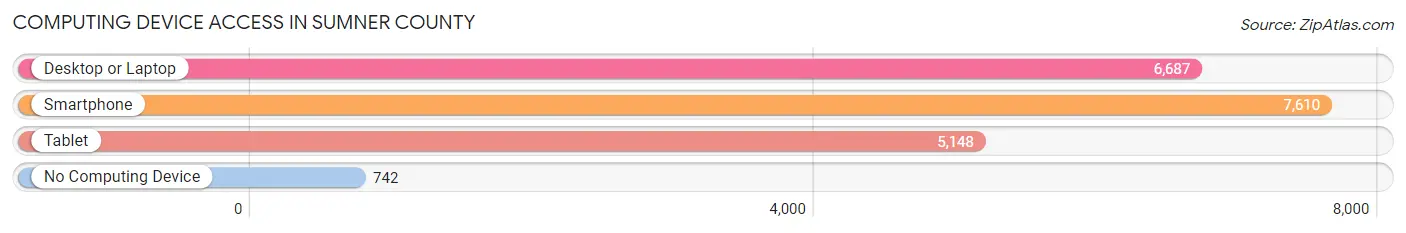
| Device Type | # Households | % Households |
| Desktop or Laptop | 6,687 | 74.5% |
| Smartphone | 7,610 | 84.8% |
| Tablet | 5,148 | 57.4% |
| No Computing Device | 742 | 8.3% |
| Total | 8,977 | 100.0% |
Internet Access in Sumner County
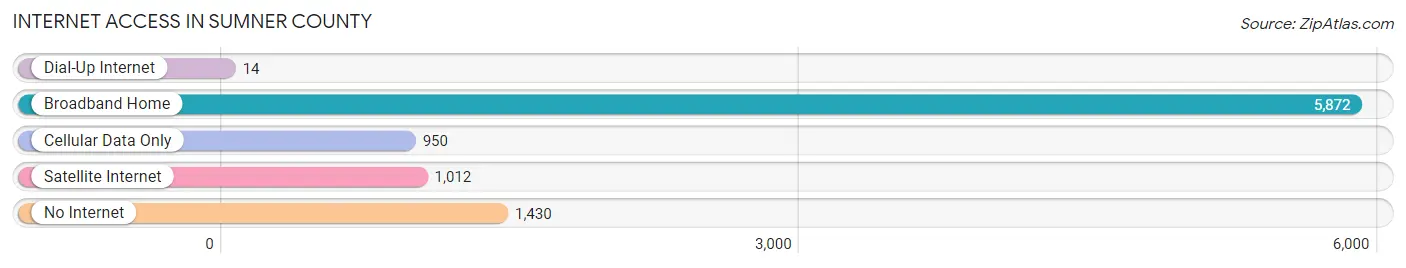
| Internet Type | # Households | % Households |
| Dial-Up Internet | 14 | 0.2% |
| Broadband Home | 5,872 | 65.4% |
| Cellular Data Only | 950 | 10.6% |
| Satellite Internet | 1,012 | 11.3% |
| No Internet | 1,430 | 15.9% |
| Total | 8,977 | 100.0% |
Sumner County Summary
Sumner County, Kansas is located in south-central Kansas and is part of the Wichita Metropolitan Statistical Area. The county was established in 1871 and named after Charles Sumner, a United States Senator from Massachusetts. As of the 2010 census, the population was 24,132.
Geography
Sumner County is located in south-central Kansas and is bordered by Cowley County to the north, Sedgwick County to the east, Kingman County to the south, and Harper County to the west. The county has a total area of 845 square miles, of which 844 square miles is land and 1 square mile is water. The county is located in the Arkansas River Valley and is part of the Great Plains region. The highest point in the county is located in the northwest corner, at an elevation of 1,890 feet.
The county is home to several rivers and streams, including the Arkansas River, Ninnescah River, and Whitewater River. The county also contains several lakes, including Cheney Reservoir, which is the largest lake in the county.
Demographics
As of the 2010 census, there were 24,132 people, 9,717 households, and 6,845 families residing in the county. The population density was 28.5 people per square mile. The racial makeup of the county was 94.2% White, 1.2% Black or African American, 0.7% Native American, 0.4% Asian, 0.1% Pacific Islander, 1.7% from other races, and 1.7% from two or more races. Hispanic or Latino of any race were 4.2% of the population.
The median income for a household in the county was $45,845 and the median income for a family was $54,845. The per capita income for the county was $22,845. About 8.2% of families and 11.2% of the population were below the poverty line, including 15.2% of those under age 18 and 8.2% of those age 65 or over.
Economy
Sumner County is largely an agricultural county, with the majority of the land being used for farming and ranching. The county is home to several large farms, including the largest farm in the state, the Sumner County Farm. The county is also home to several large industries, including the Boeing Wichita plant, which produces aircraft components, and the Cessna Aircraft Company, which produces aircraft.
The county is also home to several small businesses, including restaurants, retail stores, and service providers. The county is also home to several tourist attractions, including the Kansas Cosmosphere and Space Center, the Kansas Underground Salt Museum, and the Chisholm Trail Museum.
History
Sumner County was established in 1871 and named after Charles Sumner, a United States Senator from Massachusetts. The county was originally part of the Cherokee Outlet, which was opened to settlement in 1893. The county was largely settled by farmers and ranchers, and the county seat, Wellington, was established in 1871.
The county experienced rapid growth in the early 20th century, due to the discovery of oil and natural gas in the area. The county was also home to several large military installations during World War II, including the Kansas Army Ammunition Plant and the Kansas Air National Guard Base.
The county has experienced a decline in population since the 1950s, due to the decline of the agricultural industry and the closure of several military installations. However, the county has seen a resurgence in recent years, due to the growth of the aerospace industry in the area.
Common Questions
What is the Total Population of Sumner County?
Total Population of Sumner County is 22,517.
What is the Total Male Population of Sumner County?
Total Male Population of Sumner County is 11,374.
What is the Total Female Population of Sumner County?
Total Female Population of Sumner County is 11,143.
What is the Ratio of Males per 100 Females in Sumner County?
There are 102.07 Males per 100 Females in Sumner County.
What is the Ratio of Females per 100 Males in Sumner County?
There are 97.97 Females per 100 Males in Sumner County.
What is the Median Population Age in Sumner County?
Median Population Age in Sumner County is 42.0 Years.
What is the Average Family Size in Sumner County
Average Family Size in Sumner County is 3.2 People.
What is the Average Household Size in Sumner County
Average Household Size in Sumner County is 2.5 People.
What is Per Capita Income in Sumner County?
Per Capita income in Sumner County is $31,072.
What is the Median Family Income in Sumner County?
Median Family Income in Sumner County is $82,727.
What is the Median Household income in Sumner County?
Median Household Income in Sumner County is $59,397.
What is Income or Wage Gap in Sumner County?
Income or Wage Gap in Sumner County is 38.1%.
Women in Sumner County earn 61.9 cents for every dollar earned by a man.
What is Family Income Deficit in Sumner County?
Family Income Deficit in Sumner County is $8,206.
Families that are below poverty line in Sumner County earn $8,206 less on average than the poverty threshold level.
What is Inequality or Gini Index in Sumner County?
Inequality or Gini Index in Sumner County is 0.41.
How Large is the Labor Force in Sumner County?
There are 10,515 People in the Labor Forcein in Sumner County.
What is the Percentage of People in the Labor Force in Sumner County?
59.3% of People are in the Labor Force in Sumner County.
What is the Unemployment Rate in Sumner County?
Unemployment Rate in Sumner County is 5.2%.