Stevens County, KS
Stevens County Map
Stevens County Overview
5,275
TOTAL POPULATION
2,729
MALE POPULATION
2,546
FEMALE POPULATION
107.19
MALES / 100 FEMALES
93.29
FEMALES / 100 MALES
36.3
MEDIAN AGE
3.5
AVG FAMILY SIZE
3.0
AVG HOUSEHOLD SIZE
$25,674
PER CAPITA INCOME
$78,438
AVG FAMILY INCOME
$67,950
AVG HOUSEHOLD INCOME
47.1%
WAGE / INCOME GAP [ % ]
52.9¢/ $1
WAGE / INCOME GAP [ $ ]
0.35
INEQUALITY / GINI INDEX
2,457
LABOR FORCE [ PEOPLE ]
62.7%
PERCENT IN LABOR FORCE
1.9%
UNEMPLOYMENT RATE
Stevens County Area Codes
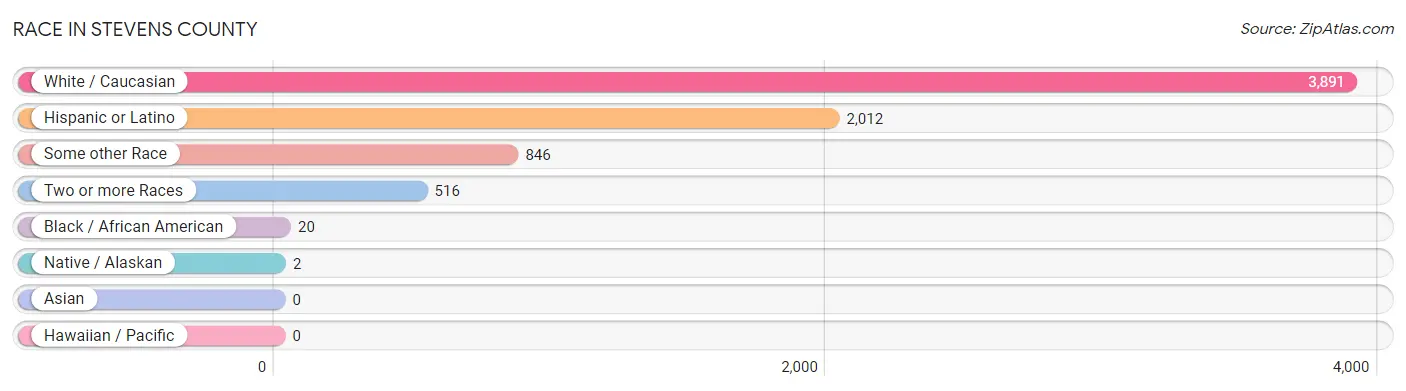
Race in Stevens County
The most populous races in Stevens County are White / Caucasian (3,891 | 73.8%), Hispanic or Latino (2,012 | 38.1%), and Some other Race (846 | 16.0%).
| Race | # Population | % Population |
| Asian | 0 | 0.0% |
| Black / African American | 20 | 0.4% |
| Hawaiian / Pacific | 0 | 0.0% |
| Hispanic or Latino | 2,012 | 38.1% |
| Native / Alaskan | 2 | 0.0% |
| White / Caucasian | 3,891 | 73.8% |
| Two or more Races | 516 | 9.8% |
| Some other Race | 846 | 16.0% |
| Total | 5,275 | 100.0% |
Ancestry in Stevens County
The most populous ancestries reported in Stevens County are Mexican (1,896 | 35.9%), German (736 | 14.0%), Irish (452 | 8.6%), American (410 | 7.8%), and English (308 | 5.8%), together accounting for 72.1% of all Stevens County residents.

| Ancestry | # Population | % Population |
| American | 410 | 7.8% |
| Austrian | 54 | 1.0% |
| British | 26 | 0.5% |
| Canadian | 8 | 0.2% |
| Cherokee | 65 | 1.2% |
| Czechoslovakian | 6 | 0.1% |
| Delaware | 24 | 0.4% |
| Dutch | 46 | 0.9% |
| Eastern European | 2 | 0.0% |
| English | 308 | 5.8% |
| European | 5 | 0.1% |
| Finnish | 26 | 0.5% |
| French | 102 | 1.9% |
| German | 736 | 14.0% |
| Irish | 452 | 8.6% |
| Italian | 102 | 1.9% |
| Mexican | 1,896 | 35.9% |
| Norwegian | 23 | 0.4% |
| Pennsylvania German | 18 | 0.3% |
| Polish | 11 | 0.2% |
| Russian | 144 | 2.7% |
| Scotch-Irish | 39 | 0.7% |
| Scottish | 67 | 1.3% |
| South African | 23 | 0.4% |
| Spaniard | 56 | 1.1% |
| Spanish | 59 | 1.1% |
| Subsaharan African | 23 | 0.4% |
| Swedish | 52 | 1.0% |
| Welsh | 1 | 0.0% | View All 29 Rows |
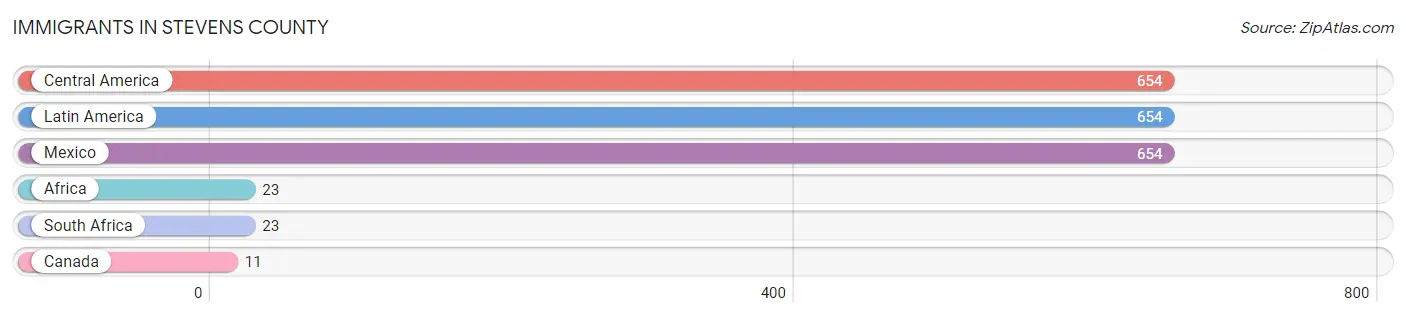
Immigrants in Stevens County
The most numerous immigrant groups reported in Stevens County came from Central America (654 | 12.4%), Latin America (654 | 12.4%), Mexico (654 | 12.4%), Africa (23 | 0.4%), and South Africa (23 | 0.4%), together accounting for 38.1% of all Stevens County residents.
| Immigration Origin | # Population | % Population |
| Africa | 23 | 0.4% |
| Canada | 11 | 0.2% |
| Central America | 654 | 12.4% |
| Latin America | 654 | 12.4% |
| Mexico | 654 | 12.4% |
| South Africa | 23 | 0.4% | View All 6 Rows |
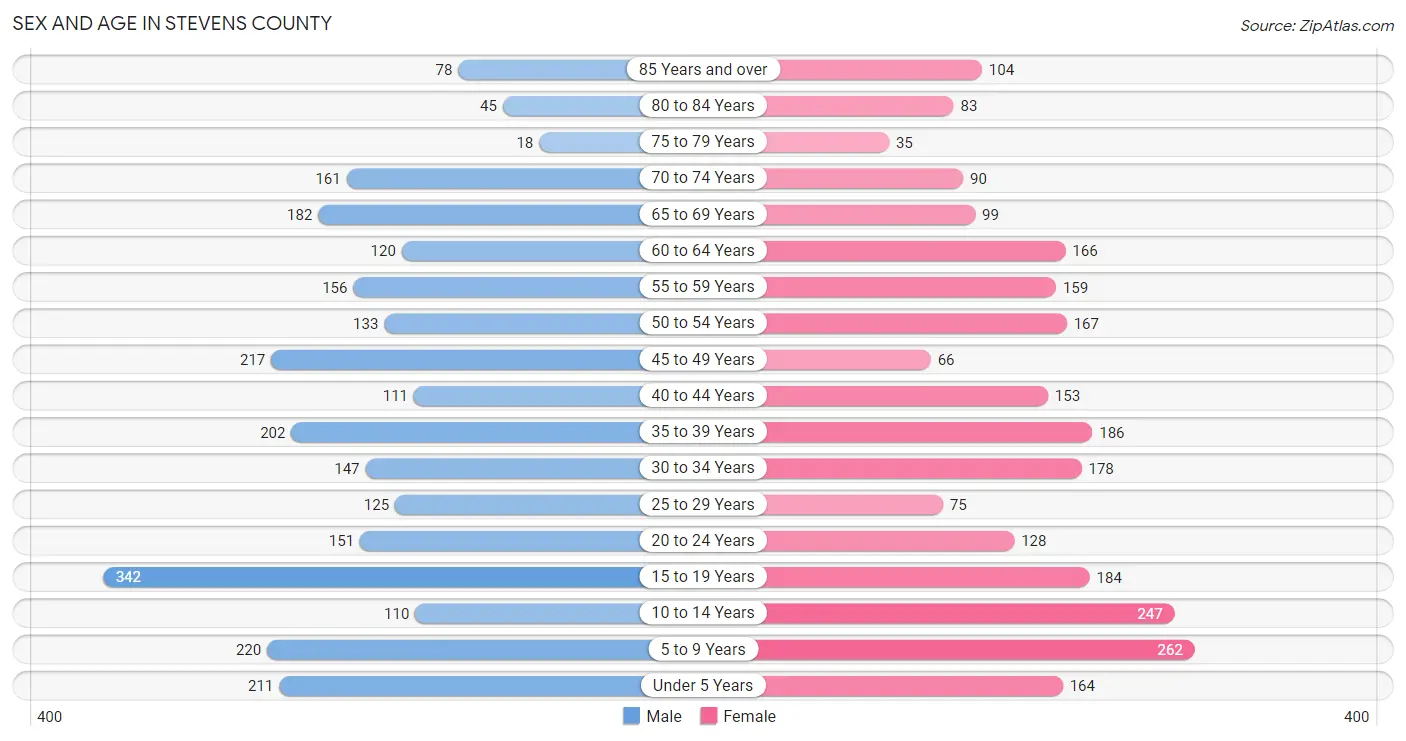
Sex and Age in Stevens County
Sex and Age in Stevens County
The most populous age groups in Stevens County are 15 to 19 Years (342 | 12.5%) for men and 5 to 9 Years (262 | 10.3%) for women.
| Age Bracket | Male | Female |
| Under 5 Years | 211 (7.7%) | 164 (6.4%) |
| 5 to 9 Years | 220 (8.1%) | 262 (10.3%) |
| 10 to 14 Years | 110 (4.0%) | 247 (9.7%) |
| 15 to 19 Years | 342 (12.5%) | 184 (7.2%) |
| 20 to 24 Years | 151 (5.5%) | 128 (5.0%) |
| 25 to 29 Years | 125 (4.6%) | 75 (2.9%) |
| 30 to 34 Years | 147 (5.4%) | 178 (7.0%) |
| 35 to 39 Years | 202 (7.4%) | 186 (7.3%) |
| 40 to 44 Years | 111 (4.1%) | 153 (6.0%) |
| 45 to 49 Years | 217 (8.0%) | 66 (2.6%) |
| 50 to 54 Years | 133 (4.9%) | 167 (6.6%) |
| 55 to 59 Years | 156 (5.7%) | 159 (6.2%) |
| 60 to 64 Years | 120 (4.4%) | 166 (6.5%) |
| 65 to 69 Years | 182 (6.7%) | 99 (3.9%) |
| 70 to 74 Years | 161 (5.9%) | 90 (3.5%) |
| 75 to 79 Years | 18 (0.7%) | 35 (1.4%) |
| 80 to 84 Years | 45 (1.7%) | 83 (3.3%) |
| 85 Years and over | 78 (2.9%) | 104 (4.1%) |
| Total | 2,729 (100.0%) | 2,546 (100.0%) |
Families and Households in Stevens County
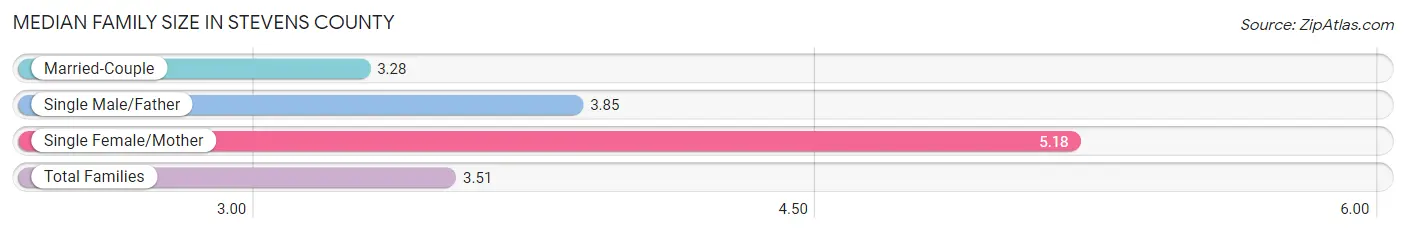
Median Family Size in Stevens County
The median family size in Stevens County is 3.51 persons per family, with single female/mother families (106 | 8.4%) accounting for the largest median family size of 5.18 persons per family. On the other hand, married-couple families (988 | 78.2%) represent the smallest median family size with 3.28 persons per family.
| Family Type | # Families | Family Size |
| Married-Couple | 988 (78.2%) | 3.28 |
| Single Male/Father | 169 (13.4%) | 3.85 |
| Single Female/Mother | 106 (8.4%) | 5.18 |
| Total Families | 1,263 (100.0%) | 3.51 |
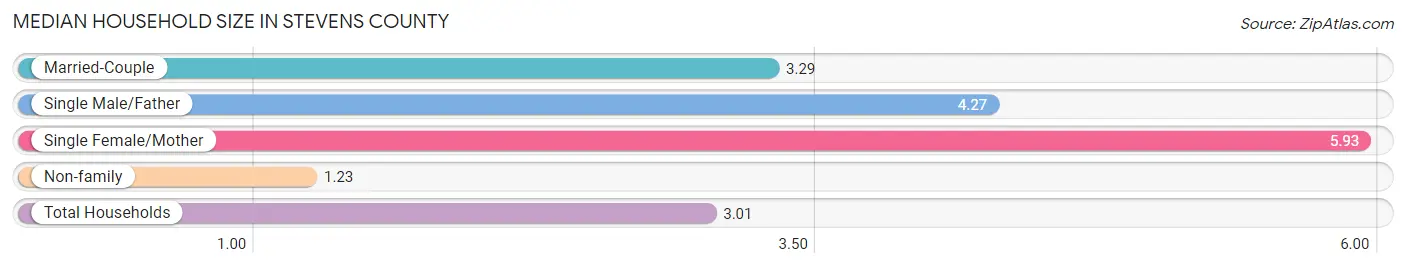
Median Household Size in Stevens County
The median household size in Stevens County is 3.01 persons per household, with single female/mother households (106 | 6.2%) accounting for the largest median household size of 5.93 persons per household. non-family households (452 | 26.4%) represent the smallest median household size with 1.23 persons per household.
| Household Type | # Households | Household Size |
| Married-Couple | 988 (57.6%) | 3.29 |
| Single Male/Father | 169 (9.9%) | 4.27 |
| Single Female/Mother | 106 (6.2%) | 5.93 |
| Non-family | 452 (26.4%) | 1.23 |
| Total Households | 1,715 (100.0%) | 3.01 |
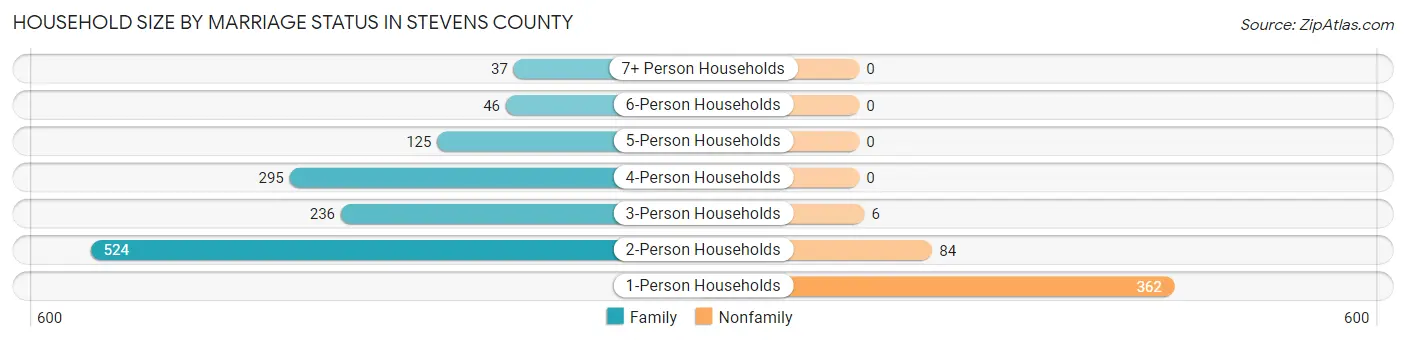
Household Size by Marriage Status in Stevens County
Out of a total of 1,715 households in Stevens County, 1,263 (73.6%) are family households, while 452 (26.4%) are nonfamily households. The most numerous type of family households are 2-person households, comprising 524, and the most common type of nonfamily households are 1-person households, comprising 362.
| Household Size | Family Households | Nonfamily Households |
| 1-Person Households | - | 362 (21.1%) |
| 2-Person Households | 524 (30.5%) | 84 (4.9%) |
| 3-Person Households | 236 (13.8%) | 6 (0.4%) |
| 4-Person Households | 295 (17.2%) | 0 (0.0%) |
| 5-Person Households | 125 (7.3%) | 0 (0.0%) |
| 6-Person Households | 46 (2.7%) | 0 (0.0%) |
| 7+ Person Households | 37 (2.2%) | 0 (0.0%) |
| Total | 1,263 (73.6%) | 452 (26.4%) |
Female Fertility in Stevens County
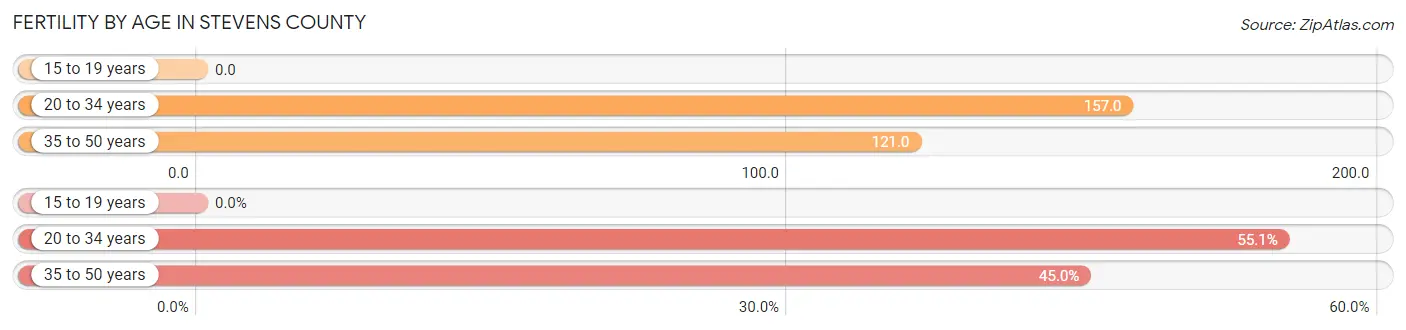
Fertility by Age in Stevens County
Average fertility rate in Stevens County is 112.0 births per 1,000 women. Women in the age bracket of 20 to 34 years have the highest fertility rate with 157.0 births per 1,000 women. Women in the age bracket of 20 to 34 years acount for 55.0% of all women with births.
| Age Bracket | Women with Births | Births / 1,000 Women |
| 15 to 19 years | 0 (0.0%) | 0.0 |
| 20 to 34 years | 60 (55.0%) | 157.0 |
| 35 to 50 years | 49 (45.0%) | 121.0 |
| Total | 109 (100.0%) | 112.0 |
Fertility by Age by Marriage Status in Stevens County
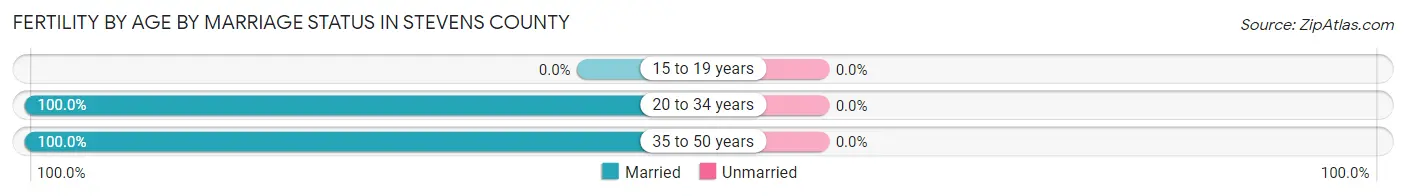
| Age Bracket | Married | Unmarried |
| 15 to 19 years | 0 (0.0%) | 0 (0.0%) |
| 20 to 34 years | 60 (100.0%) | 0 (0.0%) |
| 35 to 50 years | 49 (100.0%) | 0 (0.0%) |
| Total | 109 (100.0%) | 0 (0.0%) |
Fertility by Education in Stevens County

| Educational Attainment | Women with Births | Births / 1,000 Women |
| Less than High School | 7 (6.4%) | 31.0 |
| High School Diploma | 24 (22.0%) | 122.0 |
| College or Associate's Degree | 69 (63.3%) | 155.0 |
| Bachelor's Degree | 9 (8.3%) | 130.0 |
| Graduate Degree | 0 (0.0%) | 0.0 |
| Total | 109 (100.0%) | 112.0 |
Fertility by Education by Marriage Status in Stevens County
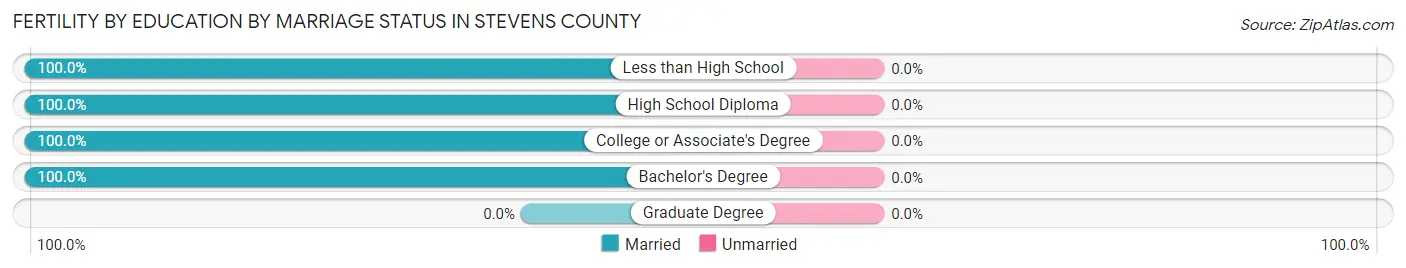
| Educational Attainment | Married | Unmarried |
| Less than High School | 7 (100.0%) | 0 (0.0%) |
| High School Diploma | 24 (100.0%) | 0 (0.0%) |
| College or Associate's Degree | 69 (100.0%) | 0 (0.0%) |
| Bachelor's Degree | 9 (100.0%) | 0 (0.0%) |
| Graduate Degree | 0 (0.0%) | 0 (0.0%) |
| Total | 109 (100.0%) | 0 (0.0%) |
Income in Stevens County
Income Overview in Stevens County
Per Capita Income in Stevens County is $25,674, while median incomes of families and households are $78,438 and $67,950 respectively.
| Characteristic | Number | Measure |
| Per Capita Income | 5,275 | $25,674 |
| Median Family Income | 1,263 | $78,438 |
| Mean Family Income | 1,263 | $84,085 |
| Median Household Income | 1,715 | $67,950 |
| Mean Household Income | 1,715 | $76,991 |
| Income Deficit | 1,263 | $0 |
| Wage / Income Gap (%) | 5,275 | 47.07% |
| Wage / Income Gap ($) | 5,275 | 52.93¢ per $1 |
| Gini / Inequality Index | 5,275 | 0.35 |
Earnings by Sex in Stevens County
Average Earnings in Stevens County are $36,738, $46,557 for men and $24,643 for women, a difference of 47.1%.
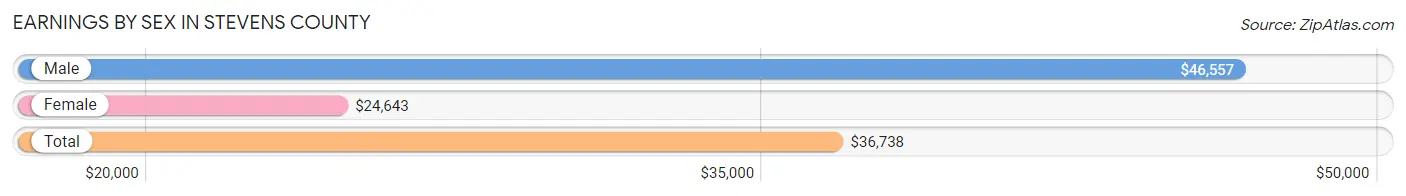
| Sex | Number | Average Earnings |
| Male | 1,522 (57.3%) | $46,557 |
| Female | 1,136 (42.7%) | $24,643 |
| Total | 2,658 (100.0%) | $36,738 |
Earnings by Sex by Income Bracket in Stevens County
The most common earnings brackets in Stevens County are $75,000 to $99,999 for men (244 | 16.0%) and $25,000 to $29,999 for women (156 | 13.7%).

| Income | Male | Female |
| $2,499 or less | 73 (4.8%) | 62 (5.5%) |
| $2,500 to $4,999 | 61 (4.0%) | 78 (6.9%) |
| $5,000 to $7,499 | 79 (5.2%) | 21 (1.8%) |
| $7,500 to $9,999 | 4 (0.3%) | 36 (3.2%) |
| $10,000 to $12,499 | 8 (0.5%) | 3 (0.3%) |
| $12,500 to $14,999 | 60 (3.9%) | 89 (7.8%) |
| $15,000 to $17,499 | 13 (0.9%) | 120 (10.6%) |
| $17,500 to $19,999 | 15 (1.0%) | 50 (4.4%) |
| $20,000 to $22,499 | 9 (0.6%) | 7 (0.6%) |
| $22,500 to $24,999 | 51 (3.4%) | 119 (10.5%) |
| $25,000 to $29,999 | 92 (6.0%) | 156 (13.7%) |
| $30,000 to $34,999 | 41 (2.7%) | 25 (2.2%) |
| $35,000 to $39,999 | 74 (4.9%) | 140 (12.3%) |
| $40,000 to $44,999 | 143 (9.4%) | 46 (4.1%) |
| $45,000 to $49,999 | 78 (5.1%) | 42 (3.7%) |
| $50,000 to $54,999 | 30 (2.0%) | 10 (0.9%) |
| $55,000 to $64,999 | 210 (13.8%) | 42 (3.7%) |
| $65,000 to $74,999 | 160 (10.5%) | 27 (2.4%) |
| $75,000 to $99,999 | 244 (16.0%) | 43 (3.8%) |
| $100,000+ | 77 (5.1%) | 20 (1.8%) |
| Total | 1,522 (100.0%) | 1,136 (100.0%) |
Earnings by Sex by Educational Attainment in Stevens County
Average earnings in Stevens County are $58,457 for men and $26,731 for women, a difference of 54.3%. Men with an educational attainment of bachelor's degree enjoy the highest average annual earnings of $69,149, while those with less than high school education earn the least with $41,649. Women with an educational attainment of graduate degree earn the most with the average annual earnings of $54,375, while those with less than high school education have the smallest earnings of $16,875.
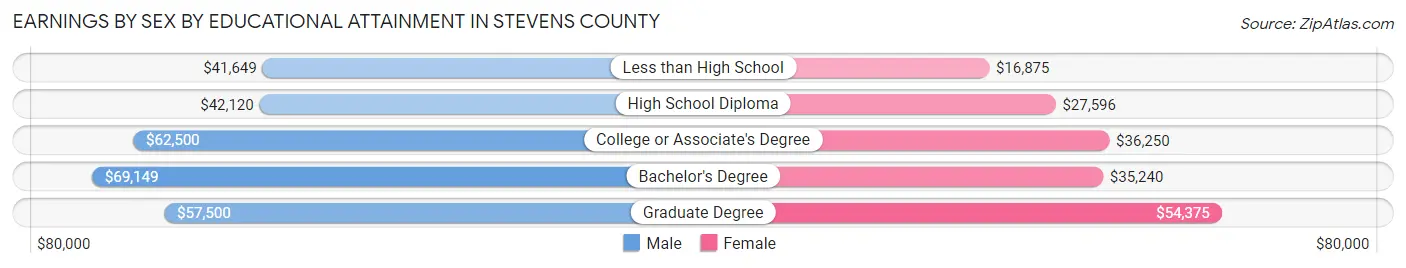
| Educational Attainment | Male Income | Female Income |
| Less than High School | $41,649 | $16,875 |
| High School Diploma | $42,120 | $27,596 |
| College or Associate's Degree | $62,500 | $36,250 |
| Bachelor's Degree | $69,149 | $35,240 |
| Graduate Degree | $57,500 | $54,375 |
| Total | $58,457 | $26,731 |
Family Income in Stevens County
Family Income Brackets in Stevens County
According to the Stevens County family income data, there are 338 families falling into the $100,000 to $149,999 income range, which is the most common income bracket and makes up 26.8% of all families.

| Income Bracket | # Families | % Families |
| Less than $10,000 | 28 | 2.2% |
| $10,000 to $14,999 | 9 | 0.7% |
| $15,000 to $24,999 | 54 | 4.3% |
| $25,000 to $34,999 | 56 | 4.4% |
| $35,000 to $49,999 | 232 | 18.4% |
| $50,000 to $74,999 | 242 | 19.2% |
| $75,000 to $99,999 | 206 | 16.3% |
| $100,000 to $149,999 | 338 | 26.8% |
| $150,000 to $199,999 | 96 | 7.6% |
| $200,000+ | 0 | 0.0% |
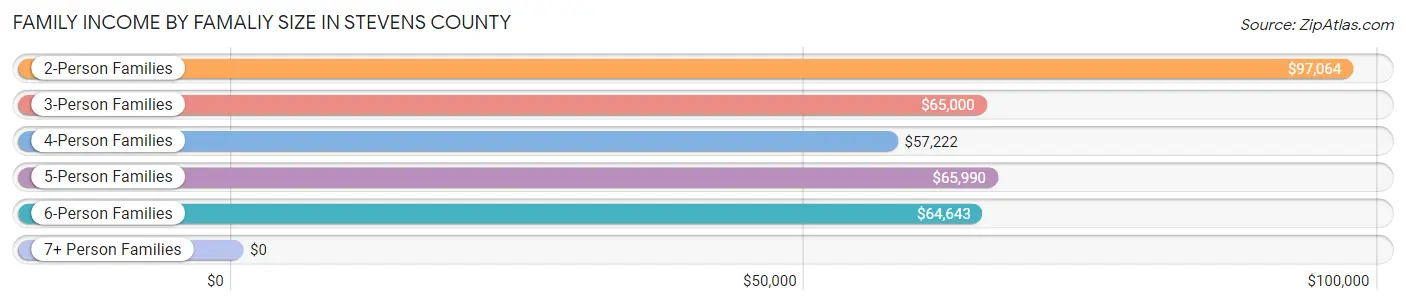
Family Income by Famaliy Size in Stevens County
2-person families (569 | 45.1%) account for the highest median family income in Stevens County with $97,064 per family, while 2-person families (569 | 45.1%) have the highest median income of $48,532 per family member.
| Income Bracket | # Families | Median Income |
| 2-Person Families | 569 (45.1%) | $97,064 |
| 3-Person Families | 264 (20.9%) | $65,000 |
| 4-Person Families | 242 (19.2%) | $57,222 |
| 5-Person Families | 113 (8.9%) | $65,990 |
| 6-Person Families | 38 (3.0%) | $64,643 |
| 7+ Person Families | 37 (2.9%) | $0 |
| Total | 1,263 (100.0%) | $78,438 |
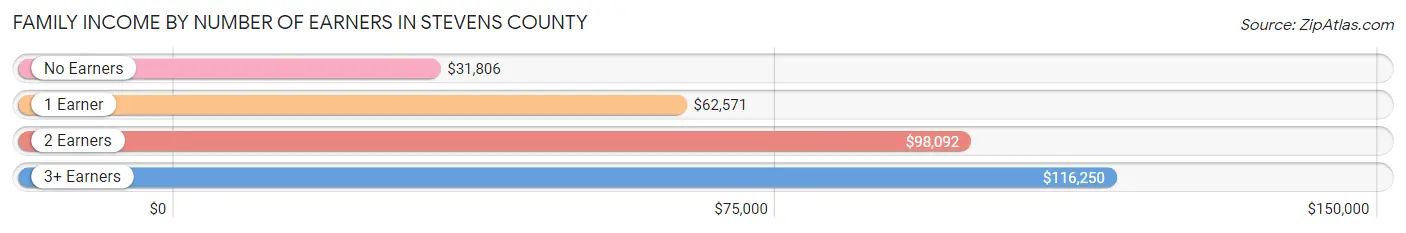
Family Income by Number of Earners in Stevens County
The median family income in Stevens County is $78,438, with families comprising 3+ earners (171) having the highest median family income of $116,250, while families with no earners (107) have the lowest median family income of $31,806, accounting for 13.5% and 8.5% of families, respectively.
| Number of Earners | # Families | Median Income |
| No Earners | 107 (8.5%) | $31,806 |
| 1 Earner | 377 (29.8%) | $62,571 |
| 2 Earners | 608 (48.1%) | $98,092 |
| 3+ Earners | 171 (13.5%) | $116,250 |
| Total | 1,263 (100.0%) | $78,438 |
Household Income in Stevens County
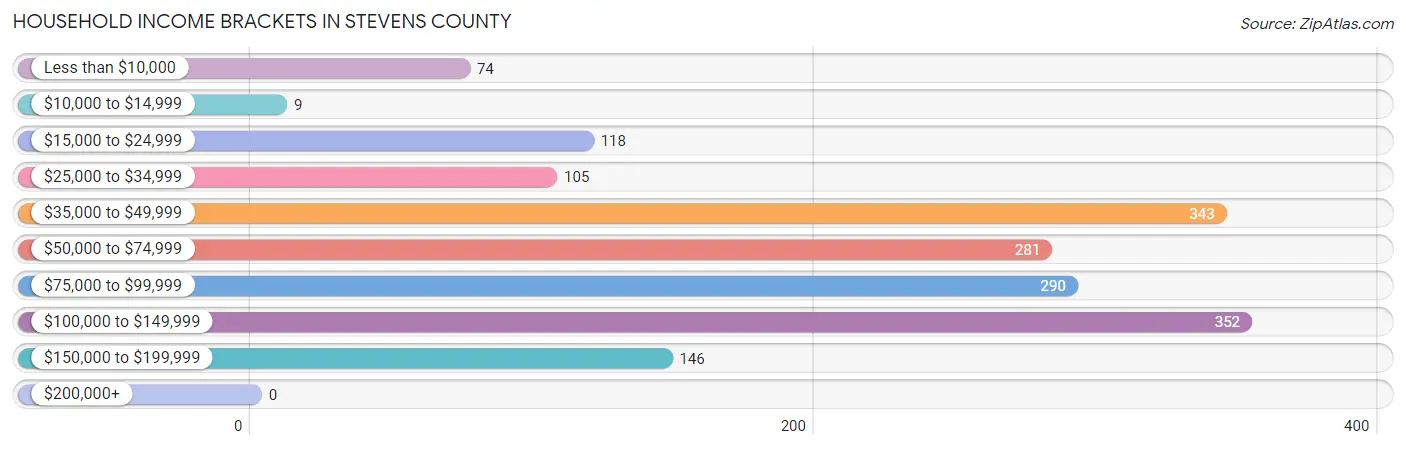
Household Income Brackets in Stevens County
With 352 households falling in the category, the $100,000 to $149,999 income range is the most frequent in Stevens County, accounting for 20.5% of all households.
| Income Bracket | # Households | % Households |
| Less than $10,000 | 74 | 4.3% |
| $10,000 to $14,999 | 9 | 0.5% |
| $15,000 to $24,999 | 118 | 6.9% |
| $25,000 to $34,999 | 105 | 6.1% |
| $35,000 to $49,999 | 343 | 20.0% |
| $50,000 to $74,999 | 281 | 16.4% |
| $75,000 to $99,999 | 290 | 16.9% |
| $100,000 to $149,999 | 352 | 20.5% |
| $150,000 to $199,999 | 146 | 8.5% |
| $200,000+ | 0 | 0.0% |
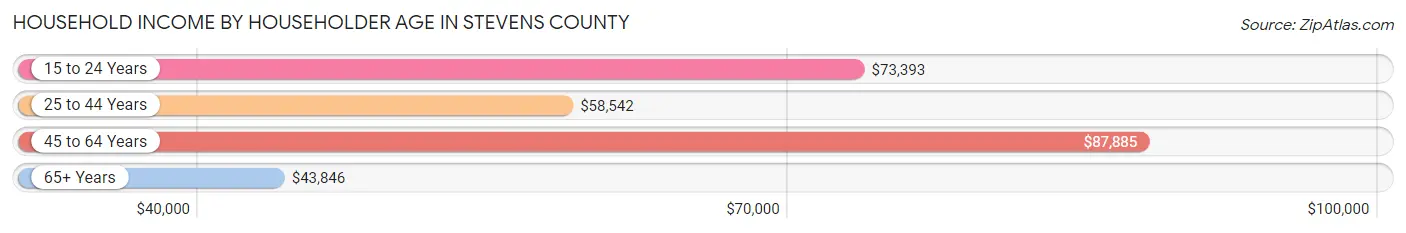
Household Income by Householder Age in Stevens County
The median household income in Stevens County is $67,950, with the highest median household income of $87,885 found in the 45 to 64 years age bracket for the primary householder. A total of 634 households (37.0%) fall into this category. Meanwhile, the 65+ years age bracket for the primary householder has the lowest median household income of $43,846, with 446 households (26.0%) in this group.
| Income Bracket | # Households | Median Income |
| 15 to 24 Years | 54 (3.2%) | $73,393 |
| 25 to 44 Years | 581 (33.9%) | $58,542 |
| 45 to 64 Years | 634 (37.0%) | $87,885 |
| 65+ Years | 446 (26.0%) | $43,846 |
| Total | 1,715 (100.0%) | $67,950 |
Poverty in Stevens County
Income Below Poverty by Sex and Age in Stevens County
With 13.3% poverty level for males and 18.5% for females among the residents of Stevens County, 15 year old males and 6 to 11 year old females are the most vulnerable to poverty, with 38 males (54.3%) and 124 females (53.9%) in their respective age groups living below the poverty level.

| Age Bracket | Male | Female |
| Under 5 Years | 0 (0.0%) | 65 (39.6%) |
| 5 Years | 0 (0.0%) | 0 (0.0%) |
| 6 to 11 Years | 0 (0.0%) | 124 (53.9%) |
| 12 to 14 Years | 0 (0.0%) | 67 (39.6%) |
| 15 Years | 38 (54.3%) | 0 (0.0%) |
| 16 and 17 Years | 0 (0.0%) | 0 (0.0%) |
| 18 to 24 Years | 53 (20.6%) | 52 (23.5%) |
| 25 to 34 Years | 31 (11.7%) | 51 (20.2%) |
| 35 to 44 Years | 46 (15.0%) | 47 (13.9%) |
| 45 to 54 Years | 27 (7.9%) | 3 (1.3%) |
| 55 to 64 Years | 33 (12.0%) | 37 (11.7%) |
| 65 to 74 Years | 117 (34.1%) | 8 (4.6%) |
| 75 Years and over | 8 (8.3%) | 9 (4.5%) |
| Total | 353 (13.3%) | 463 (18.5%) |
Income Above Poverty by Sex and Age in Stevens County
According to the poverty statistics in Stevens County, males aged under 5 years and females aged 5 years are the age groups that are most secure financially, with 100.0% of males and 100.0% of females in these age groups living above the poverty line.

| Age Bracket | Male | Female |
| Under 5 Years | 211 (100.0%) | 99 (60.4%) |
| 5 Years | 12 (100.0%) | 110 (100.0%) |
| 6 to 11 Years | 294 (100.0%) | 106 (46.1%) |
| 12 to 14 Years | 24 (100.0%) | 102 (60.4%) |
| 15 Years | 32 (45.7%) | 72 (100.0%) |
| 16 and 17 Years | 163 (100.0%) | 19 (100.0%) |
| 18 to 24 Years | 204 (79.4%) | 169 (76.5%) |
| 25 to 34 Years | 234 (88.3%) | 202 (79.8%) |
| 35 to 44 Years | 260 (85.0%) | 292 (86.1%) |
| 45 to 54 Years | 316 (92.1%) | 230 (98.7%) |
| 55 to 64 Years | 242 (88.0%) | 280 (88.3%) |
| 65 to 74 Years | 226 (65.9%) | 165 (95.4%) |
| 75 Years and over | 89 (91.7%) | 189 (95.5%) |
| Total | 2,307 (86.7%) | 2,035 (81.5%) |
Income Below Poverty Among Married-Couple Families in Stevens County
The poverty statistics for married-couple families in Stevens County show that 5.2% or 51 of the total 988 families live below the poverty line. Families with 5 or more children have the highest poverty rate of 100.0%, comprising of 35 families. On the other hand, families with 1 or 2 children have the lowest poverty rate of 0.0%, which includes 0 families.

| Children | Above Poverty | Below Poverty |
| No Children | 564 (98.4%) | 9 (1.6%) |
| 1 or 2 Children | 235 (100.0%) | 0 (0.0%) |
| 3 or 4 Children | 138 (95.2%) | 7 (4.8%) |
| 5 or more Children | 0 (0.0%) | 35 (100.0%) |
| Total | 937 (94.8%) | 51 (5.2%) |
Income Below Poverty Among Single-Parent Households in Stevens County
According to the poverty data in Stevens County, 1.8% or 3 single-father households and 34.0% or 36 single-mother households are living below the poverty line. Among single-father households, those with 1 or 2 children have the highest poverty rate, with 3 households (2.2%) experiencing poverty. Likewise, among single-mother households, those with 3 or 4 children have the highest poverty rate, with 19 households (100.0%) falling below the poverty line.

| Children | Single Father | Single Mother |
| No Children | 0 (0.0%) | 11 (32.4%) |
| 1 or 2 Children | 3 (2.2%) | 6 (11.3%) |
| 3 or 4 Children | 0 (0.0%) | 19 (100.0%) |
| 5 or more Children | 0 (0.0%) | 0 (0.0%) |
| Total | 3 (1.8%) | 36 (34.0%) |
Income Below Poverty Among Married-Couple vs Single-Parent Households in Stevens County
The poverty data for Stevens County shows that 51 of the married-couple family households (5.2%) and 39 of the single-parent households (14.2%) are living below the poverty level. Within the married-couple family households, those with 5 or more children have the highest poverty rate, with 35 households (100.0%) falling below the poverty line. Among the single-parent households, those with 3 or 4 children have the highest poverty rate, with 19 household (70.4%) living below poverty.

| Children | Married-Couple Families | Single-Parent Households |
| No Children | 9 (1.6%) | 11 (19.6%) |
| 1 or 2 Children | 0 (0.0%) | 9 (4.7%) |
| 3 or 4 Children | 7 (4.8%) | 19 (70.4%) |
| 5 or more Children | 35 (100.0%) | 0 (0.0%) |
| Total | 51 (5.2%) | 39 (14.2%) |
Employment Characteristics in Stevens County
Employment by Class of Employer in Stevens County
Among the 2,386 employed individuals in Stevens County, private company employees (1,477 | 61.9%), local government employees (296 | 12.4%), and self-employed (not incorporated) (203 | 8.5%) make up the most common classes of employment.
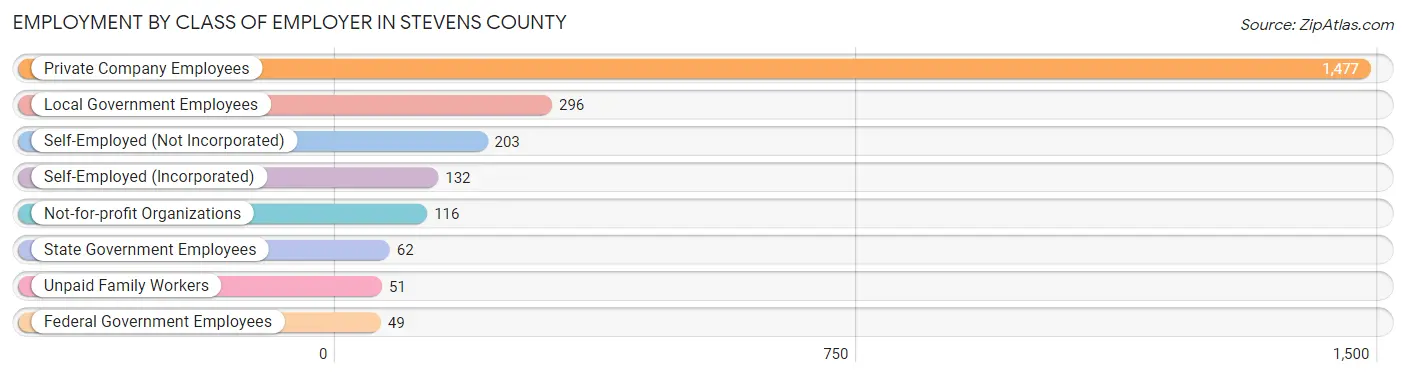
| Employer Class | # Employees | % Employees |
| Private Company Employees | 1,477 | 61.9% |
| Self-Employed (Incorporated) | 132 | 5.5% |
| Self-Employed (Not Incorporated) | 203 | 8.5% |
| Not-for-profit Organizations | 116 | 4.9% |
| Local Government Employees | 296 | 12.4% |
| State Government Employees | 62 | 2.6% |
| Federal Government Employees | 49 | 2.1% |
| Unpaid Family Workers | 51 | 2.1% |
| Total | 2,386 | 100.0% |
Employment Status by Age in Stevens County
According to the labor force statistics for Stevens County, out of the total population over 16 years of age (3,919), 62.7% or 2,457 individuals are in the labor force, with 1.9% or 47 of them unemployed. The age group with the highest labor force participation rate is 25 to 29 years, with 82.0% or 164 individuals in the labor force. Within the labor force, the 30 to 34 years age range has the highest percentage of unemployed individuals, with 13.7% or 31 of them being unemployed.
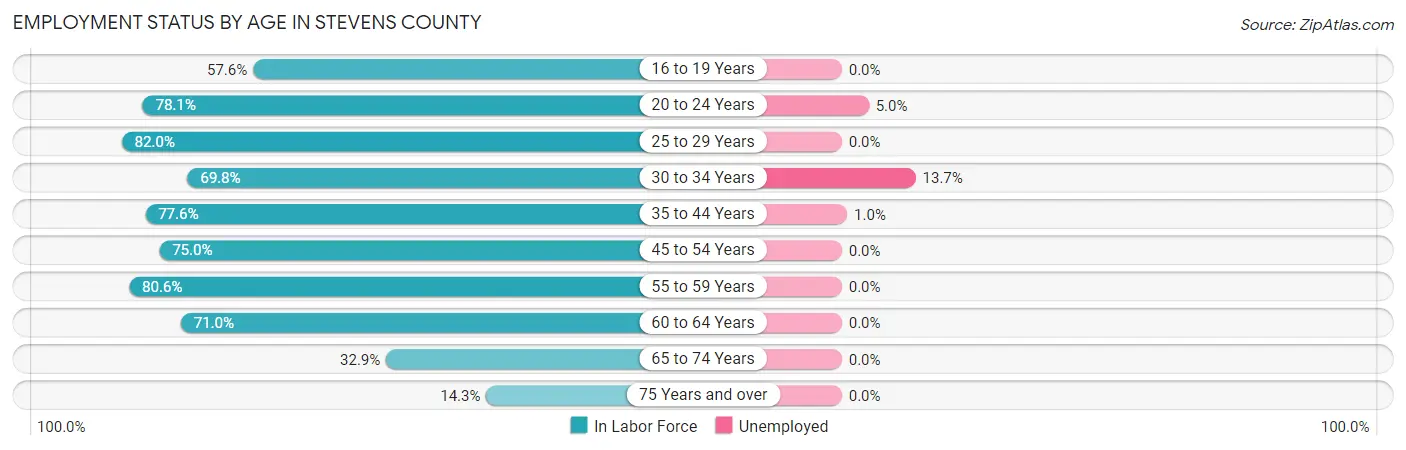
| Age Bracket | In Labor Force | Unemployed |
| 16 to 19 Years | 221 (57.6%) | 0 (0.0%) |
| 20 to 24 Years | 218 (78.1%) | 11 (5.0%) |
| 25 to 29 Years | 164 (82.0%) | 0 (0.0%) |
| 30 to 34 Years | 227 (69.8%) | 31 (13.7%) |
| 35 to 44 Years | 506 (77.6%) | 5 (1.0%) |
| 45 to 54 Years | 437 (75.0%) | 0 (0.0%) |
| 55 to 59 Years | 254 (80.6%) | 0 (0.0%) |
| 60 to 64 Years | 203 (71.0%) | 0 (0.0%) |
| 65 to 74 Years | 175 (32.9%) | 0 (0.0%) |
| 75 Years and over | 52 (14.3%) | 0 (0.0%) |
| Total | 2,457 (62.7%) | 47 (1.9%) |
Employment Status by Educational Attainment in Stevens County
According to labor force statistics for Stevens County, 75.9% of individuals (1,792) out of the total population between 25 and 64 years of age (2,361) are in the labor force, with 2.0% or 36 of them being unemployed. The group with the highest labor force participation rate are those with the educational attainment of bachelor's degree or higher, with 84.7% or 243 individuals in the labor force. Within the labor force, individuals with less than high school education have the highest percentage of unemployment, with 5.4% or 25 of them being unemployed.

| Educational Attainment | In Labor Force | Unemployed |
| Less than High School | 461 (77.1%) | 32 (5.4%) |
| High School Diploma | 297 (57.1%) | 10 (2.0%) |
| College / Associate Degree | 790 (82.6%) | 6 (0.6%) |
| Bachelor's Degree or higher | 243 (84.7%) | 0 (0.0%) |
| Total | 1,792 (75.9%) | 47 (2.0%) |
Employment Occupations by Sex in Stevens County
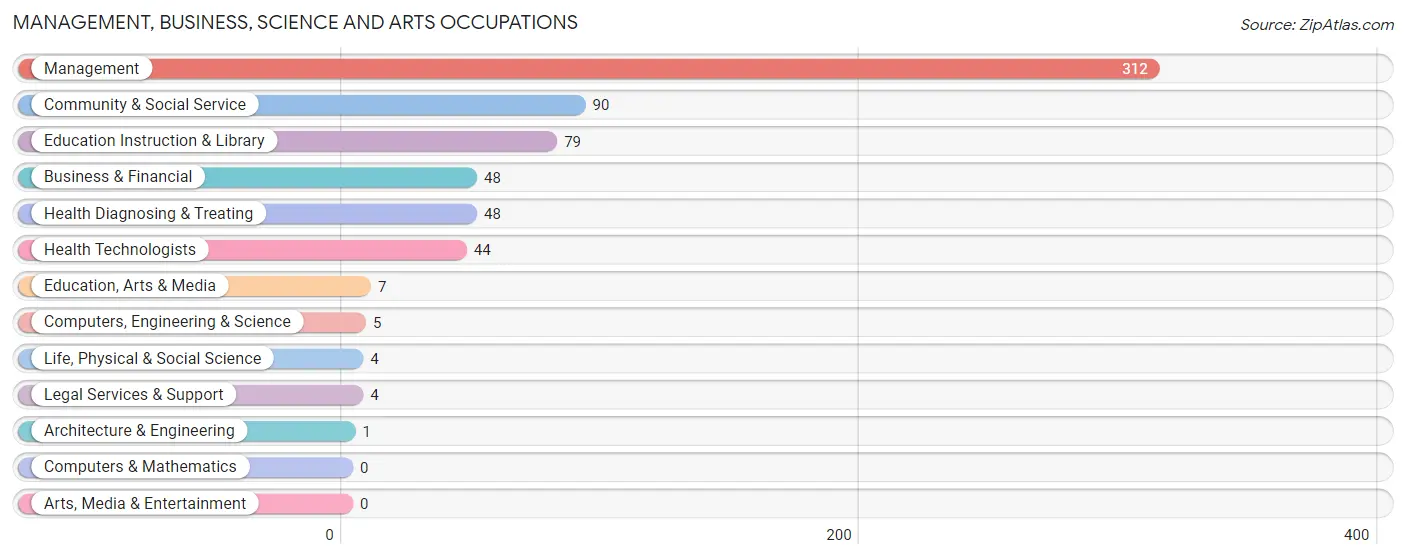
Management, Business, Science and Arts Occupations
The most common Management, Business, Science and Arts occupations in Stevens County are Management (312 | 13.0%), Community & Social Service (90 | 3.7%), Education Instruction & Library (79 | 3.3%), Business & Financial (48 | 2.0%), and Health Diagnosing & Treating (48 | 2.0%).
Management, Business, Science and Arts Occupations by Sex
Within the Management, Business, Science and Arts occupations in Stevens County, the most male-oriented occupations are Business & Financial (100.0%), Architecture & Engineering (100.0%), and Legal Services & Support (100.0%), while the most female-oriented occupations are Life, Physical & Social Science (100.0%), Health Diagnosing & Treating (93.8%), and Health Technologists (93.2%).
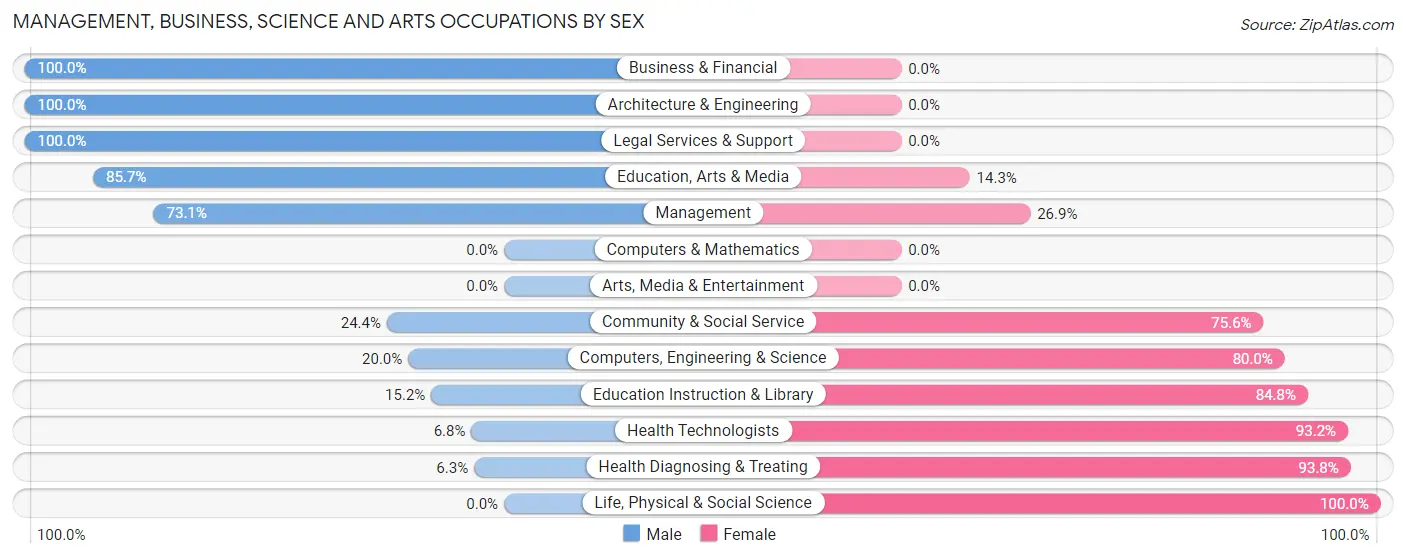
| Occupation | Male | Female |
| Management | 228 (73.1%) | 84 (26.9%) |
| Business & Financial | 48 (100.0%) | 0 (0.0%) |
| Computers, Engineering & Science | 1 (20.0%) | 4 (80.0%) |
| Computers & Mathematics | 0 (0.0%) | 0 (0.0%) |
| Architecture & Engineering | 1 (100.0%) | 0 (0.0%) |
| Life, Physical & Social Science | 0 (0.0%) | 4 (100.0%) |
| Community & Social Service | 22 (24.4%) | 68 (75.6%) |
| Education, Arts & Media | 6 (85.7%) | 1 (14.3%) |
| Legal Services & Support | 4 (100.0%) | 0 (0.0%) |
| Education Instruction & Library | 12 (15.2%) | 67 (84.8%) |
| Arts, Media & Entertainment | 0 (0.0%) | 0 (0.0%) |
| Health Diagnosing & Treating | 3 (6.2%) | 45 (93.8%) |
| Health Technologists | 3 (6.8%) | 41 (93.2%) |
| Total (Category) | 302 (60.0%) | 201 (40.0%) |
| Total (Overall) | 1,400 (58.1%) | 1,010 (41.9%) |
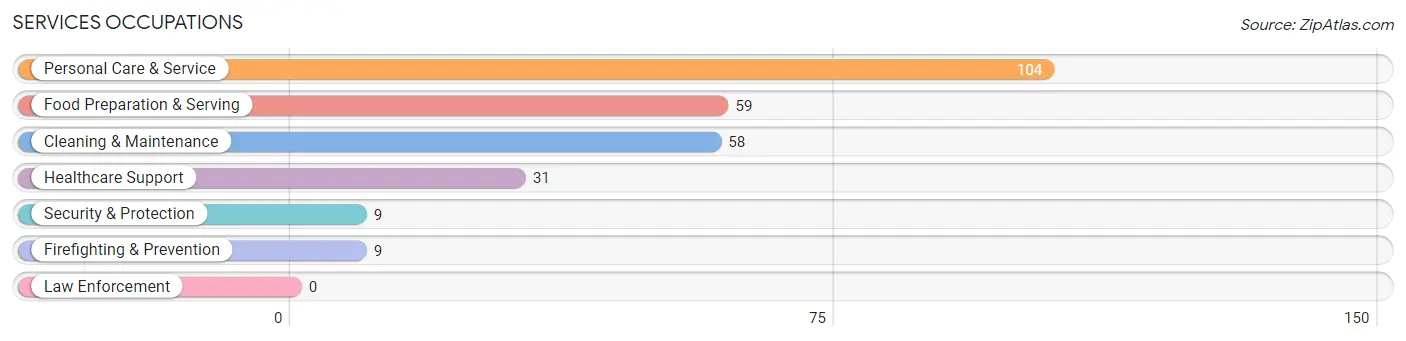
Services Occupations
The most common Services occupations in Stevens County are Personal Care & Service (104 | 4.3%), Food Preparation & Serving (59 | 2.5%), Cleaning & Maintenance (58 | 2.4%), Healthcare Support (31 | 1.3%), and Security & Protection (9 | 0.4%).
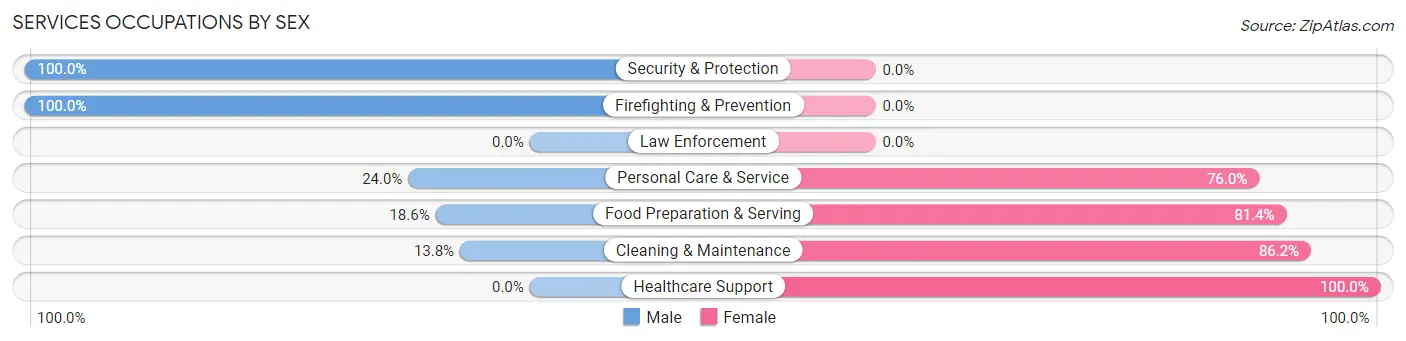
Services Occupations by Sex
Within the Services occupations in Stevens County, the most male-oriented occupations are Security & Protection (100.0%), Firefighting & Prevention (100.0%), and Personal Care & Service (24.0%), while the most female-oriented occupations are Healthcare Support (100.0%), Cleaning & Maintenance (86.2%), and Food Preparation & Serving (81.4%).
| Occupation | Male | Female |
| Healthcare Support | 0 (0.0%) | 31 (100.0%) |
| Security & Protection | 9 (100.0%) | 0 (0.0%) |
| Firefighting & Prevention | 9 (100.0%) | 0 (0.0%) |
| Law Enforcement | 0 (0.0%) | 0 (0.0%) |
| Food Preparation & Serving | 11 (18.6%) | 48 (81.4%) |
| Cleaning & Maintenance | 8 (13.8%) | 50 (86.2%) |
| Personal Care & Service | 25 (24.0%) | 79 (76.0%) |
| Total (Category) | 53 (20.3%) | 208 (79.7%) |
| Total (Overall) | 1,400 (58.1%) | 1,010 (41.9%) |
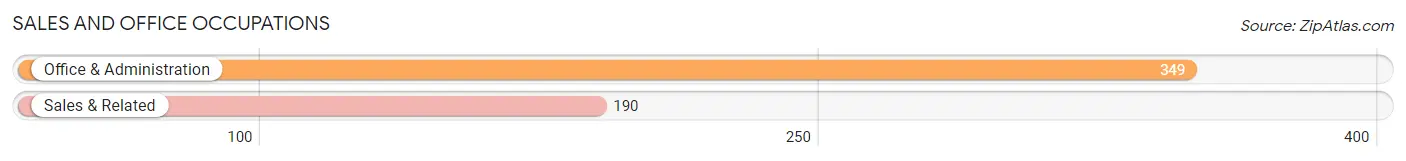
Sales and Office Occupations
The most common Sales and Office occupations in Stevens County are Office & Administration (349 | 14.5%), and Sales & Related (190 | 7.9%).
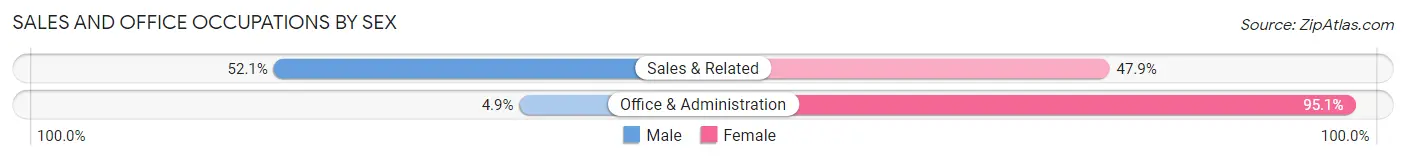
Sales and Office Occupations by Sex
| Occupation | Male | Female |
| Sales & Related | 99 (52.1%) | 91 (47.9%) |
| Office & Administration | 17 (4.9%) | 332 (95.1%) |
| Total (Category) | 116 (21.5%) | 423 (78.5%) |
| Total (Overall) | 1,400 (58.1%) | 1,010 (41.9%) |
Natural Resources, Construction and Maintenance Occupations
The most common Natural Resources, Construction and Maintenance occupations in Stevens County are Farming, Fishing & Forestry (273 | 11.3%), Construction & Extraction (202 | 8.4%), and Installation, Maintenance & Repair (153 | 6.4%).

Natural Resources, Construction and Maintenance Occupations by Sex
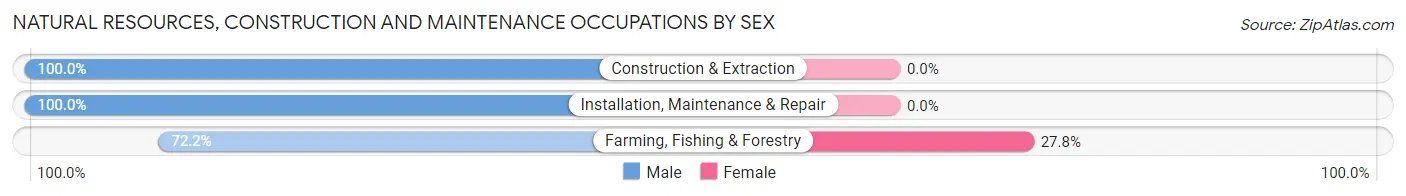
| Occupation | Male | Female |
| Farming, Fishing & Forestry | 197 (72.2%) | 76 (27.8%) |
| Construction & Extraction | 202 (100.0%) | 0 (0.0%) |
| Installation, Maintenance & Repair | 153 (100.0%) | 0 (0.0%) |
| Total (Category) | 552 (87.9%) | 76 (12.1%) |
| Total (Overall) | 1,400 (58.1%) | 1,010 (41.9%) |
Production, Transportation and Moving Occupations
The most common Production, Transportation and Moving occupations in Stevens County are Production (183 | 7.6%), Transportation (157 | 6.5%), and Material Moving (139 | 5.8%).
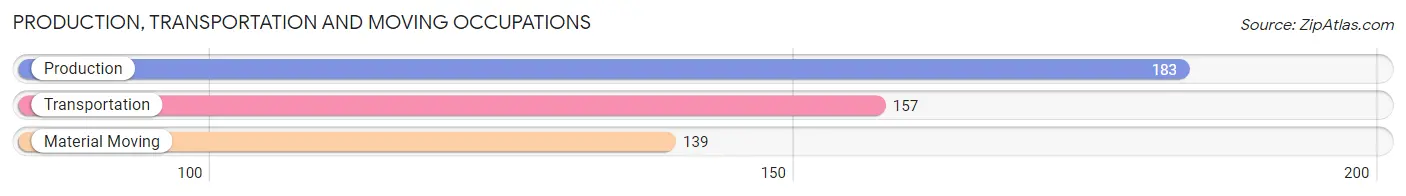
Production, Transportation and Moving Occupations by Sex

| Occupation | Male | Female |
| Production | 183 (100.0%) | 0 (0.0%) |
| Transportation | 146 (93.0%) | 11 (7.0%) |
| Material Moving | 48 (34.5%) | 91 (65.5%) |
| Total (Category) | 377 (78.7%) | 102 (21.3%) |
| Total (Overall) | 1,400 (58.1%) | 1,010 (41.9%) |
Employment Industries by Sex in Stevens County
Employment Industries in Stevens County
The major employment industries in Stevens County include Agriculture, Fishing & Hunting (470 | 19.5%), Manufacturing (269 | 11.2%), Transportation & Warehousing (219 | 9.1%), Educational Services (219 | 9.1%), and Retail Trade (218 | 9.0%).

Employment Industries by Sex in Stevens County
The Stevens County industries that see more men than women are Arts, Entertainment & Recreation (100.0%), Wholesale Trade (98.4%), and Construction (91.8%), whereas the industries that tend to have a higher number of women are Accommodation & Food Services (100.0%), Health Care & Social Assistance (98.4%), and Public Administration (84.2%).
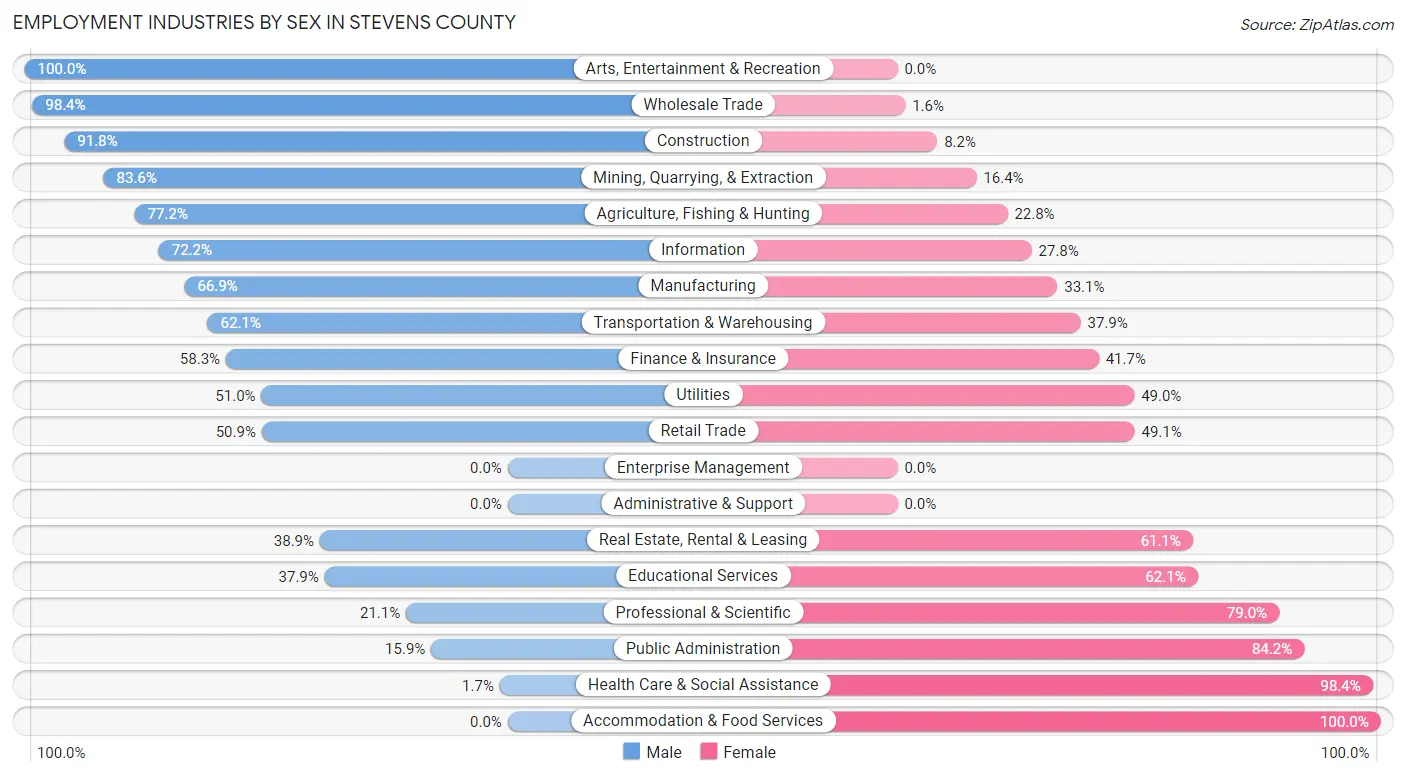
| Industry | Male | Female |
| Agriculture, Fishing & Hunting | 363 (77.2%) | 107 (22.8%) |
| Mining, Quarrying, & Extraction | 46 (83.6%) | 9 (16.4%) |
| Construction | 167 (91.8%) | 15 (8.2%) |
| Manufacturing | 180 (66.9%) | 89 (33.1%) |
| Wholesale Trade | 61 (98.4%) | 1 (1.6%) |
| Retail Trade | 111 (50.9%) | 107 (49.1%) |
| Transportation & Warehousing | 136 (62.1%) | 83 (37.9%) |
| Utilities | 77 (51.0%) | 74 (49.0%) |
| Information | 52 (72.2%) | 20 (27.8%) |
| Finance & Insurance | 14 (58.3%) | 10 (41.7%) |
| Real Estate, Rental & Leasing | 7 (38.9%) | 11 (61.1%) |
| Professional & Scientific | 4 (21.0%) | 15 (78.9%) |
| Enterprise Management | 0 (0.0%) | 0 (0.0%) |
| Administrative & Support | 0 (0.0%) | 0 (0.0%) |
| Educational Services | 83 (37.9%) | 136 (62.1%) |
| Health Care & Social Assistance | 3 (1.7%) | 179 (98.4%) |
| Arts, Entertainment & Recreation | 8 (100.0%) | 0 (0.0%) |
| Accommodation & Food Services | 0 (0.0%) | 53 (100.0%) |
| Public Administration | 13 (15.9%) | 69 (84.2%) |
| Total | 1,400 (58.1%) | 1,010 (41.9%) |
Education in Stevens County
School Enrollment in Stevens County
The most common levels of schooling among the 1,345 students in Stevens County are high school (370 | 27.5%), middle school (332 | 24.7%), and elementary school (303 | 22.5%).

| School Level | # Students | % Students |
| Nursery / Preschool | 104 | 7.7% |
| Kindergarten | 70 | 5.2% |
| Elementary School | 303 | 22.5% |
| Middle School | 332 | 24.7% |
| High School | 370 | 27.5% |
| College / Undergraduate | 153 | 11.4% |
| Graduate / Professional | 13 | 1.0% |
| Total | 1,345 | 100.0% |
School Enrollment by Age by Funding Source in Stevens County
Out of a total of 1,345 students who are enrolled in schools in Stevens County, 42 (3.1%) attend a private institution, while the remaining 1,303 (96.9%) are enrolled in public schools. The age group of 20 to 24 year olds has the highest likelihood of being enrolled in private schools, with 11 (45.8% in the age bracket) enrolled. Conversely, the age group of 3 to 4 year olds has the lowest likelihood of being enrolled in a private school, with 5 (100.0% in the age bracket) attending a public institution.
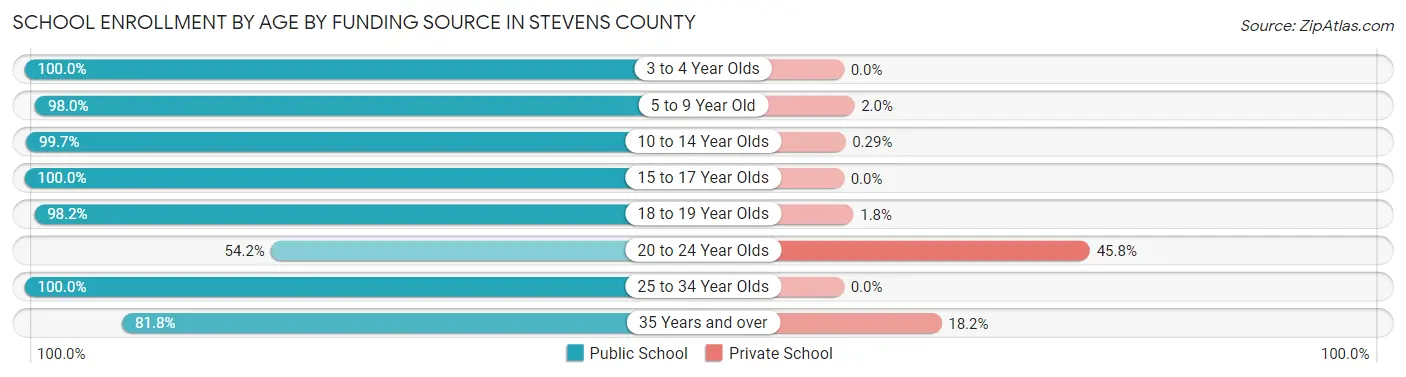
| Age Bracket | Public School | Private School |
| 3 to 4 Year Olds | 5 (100.0%) | 0 (0.0%) |
| 5 to 9 Year Old | 401 (98.0%) | 8 (2.0%) |
| 10 to 14 Year Olds | 343 (99.7%) | 1 (0.3%) |
| 15 to 17 Year Olds | 324 (100.0%) | 0 (0.0%) |
| 18 to 19 Year Olds | 110 (98.2%) | 2 (1.8%) |
| 20 to 24 Year Olds | 13 (54.2%) | 11 (45.8%) |
| 25 to 34 Year Olds | 17 (100.0%) | 0 (0.0%) |
| 35 Years and over | 90 (81.8%) | 20 (18.2%) |
| Total | 1,303 (96.9%) | 42 (3.1%) |
Educational Attainment by Field of Study in Stevens County
Bio, nature & agricultural (143 | 27.0%), science & technology (131 | 24.7%), business (97 | 18.3%), education (55 | 10.4%), and social sciences (24 | 4.5%) are the most common fields of study among 530 individuals in Stevens County who have obtained a bachelor's degree or higher.

| Field of Study | # Graduates | % Graduates |
| Computers & Mathematics | 0 | 0.0% |
| Bio, Nature & Agricultural | 143 | 27.0% |
| Physical & Health Sciences | 23 | 4.3% |
| Psychology | 3 | 0.6% |
| Social Sciences | 24 | 4.5% |
| Engineering | 13 | 2.5% |
| Multidisciplinary Studies | 12 | 2.3% |
| Science & Technology | 131 | 24.7% |
| Business | 97 | 18.3% |
| Education | 55 | 10.4% |
| Literature & Languages | 11 | 2.1% |
| Liberal Arts & History | 6 | 1.1% |
| Visual & Performing Arts | 9 | 1.7% |
| Communications | 0 | 0.0% |
| Arts & Humanities | 3 | 0.6% |
| Total | 530 | 100.0% |
Transportation & Commute in Stevens County
Vehicle Availability by Sex in Stevens County
The most prevalent vehicle ownership categories in Stevens County are males with 2 vehicles (486, accounting for 35.1%) and females with 2 vehicles (347, making up 48.4%).
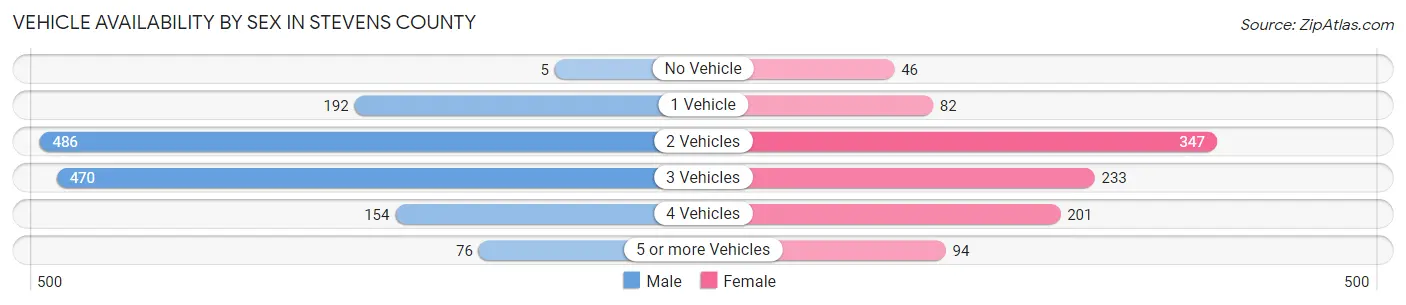
| Vehicles Available | Male | Female |
| No Vehicle | 5 (0.4%) | 46 (4.6%) |
| 1 Vehicle | 192 (13.9%) | 82 (8.2%) |
| 2 Vehicles | 486 (35.1%) | 347 (34.6%) |
| 3 Vehicles | 470 (34.0%) | 233 (23.2%) |
| 4 Vehicles | 154 (11.1%) | 201 (20.0%) |
| 5 or more Vehicles | 76 (5.5%) | 94 (9.4%) |
| Total | 1,383 (100.0%) | 1,003 (100.0%) |
Commute Time in Stevens County
The most frequently occuring commute durations in Stevens County are 5 to 9 minutes (689 commuters, 31.0%), less than 5 minutes (527 commuters, 23.7%), and 30 to 34 minutes (322 commuters, 14.5%).

| Commute Time | # Commuters | % Commuters |
| Less than 5 Minutes | 527 | 23.7% |
| 5 to 9 Minutes | 689 | 31.0% |
| 10 to 14 Minutes | 168 | 7.6% |
| 15 to 19 Minutes | 164 | 7.4% |
| 20 to 24 Minutes | 30 | 1.3% |
| 25 to 29 Minutes | 30 | 1.3% |
| 30 to 34 Minutes | 322 | 14.5% |
| 35 to 39 Minutes | 33 | 1.5% |
| 40 to 44 Minutes | 91 | 4.1% |
| 45 to 59 Minutes | 72 | 3.2% |
| 60 to 89 Minutes | 11 | 0.5% |
| 90 or more Minutes | 85 | 3.8% |
Commute Time by Sex in Stevens County
The most common commute times in Stevens County are 5 to 9 minutes (385 commuters, 29.6%) for males and 5 to 9 minutes (304 commuters, 32.9%) for females.
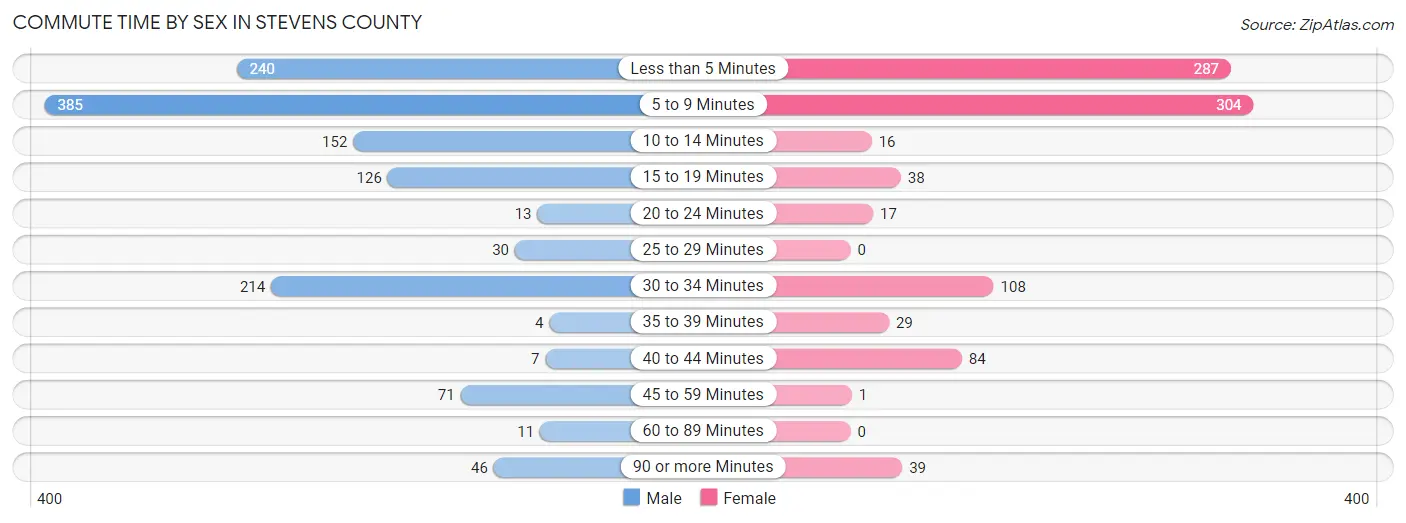
| Commute Time | Male | Female |
| Less than 5 Minutes | 240 (18.5%) | 287 (31.1%) |
| 5 to 9 Minutes | 385 (29.6%) | 304 (32.9%) |
| 10 to 14 Minutes | 152 (11.7%) | 16 (1.7%) |
| 15 to 19 Minutes | 126 (9.7%) | 38 (4.1%) |
| 20 to 24 Minutes | 13 (1.0%) | 17 (1.8%) |
| 25 to 29 Minutes | 30 (2.3%) | 0 (0.0%) |
| 30 to 34 Minutes | 214 (16.5%) | 108 (11.7%) |
| 35 to 39 Minutes | 4 (0.3%) | 29 (3.1%) |
| 40 to 44 Minutes | 7 (0.5%) | 84 (9.1%) |
| 45 to 59 Minutes | 71 (5.5%) | 1 (0.1%) |
| 60 to 89 Minutes | 11 (0.9%) | 0 (0.0%) |
| 90 or more Minutes | 46 (3.5%) | 39 (4.2%) |
Time of Departure to Work by Sex in Stevens County
The most frequent times of departure to work in Stevens County are 7:30 AM to 7:59 AM (290, 22.3%) for males and 7:30 AM to 7:59 AM (209, 22.6%) for females.
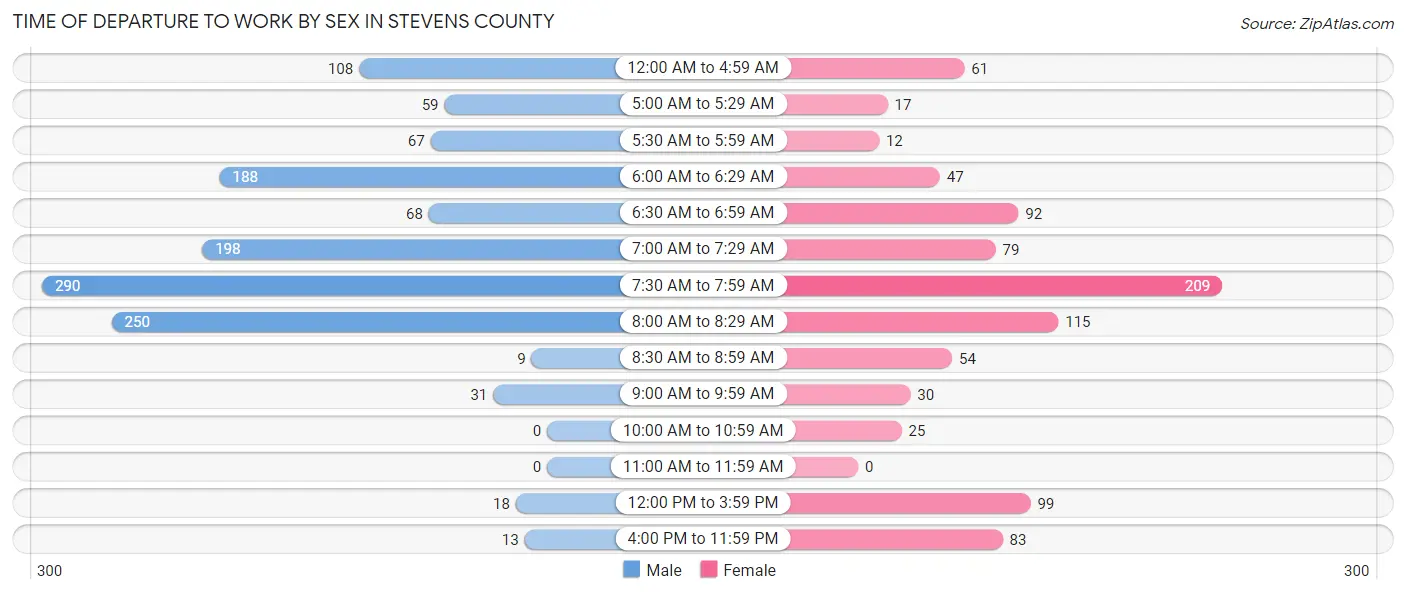
| Time of Departure | Male | Female |
| 12:00 AM to 4:59 AM | 108 (8.3%) | 61 (6.6%) |
| 5:00 AM to 5:29 AM | 59 (4.5%) | 17 (1.8%) |
| 5:30 AM to 5:59 AM | 67 (5.2%) | 12 (1.3%) |
| 6:00 AM to 6:29 AM | 188 (14.5%) | 47 (5.1%) |
| 6:30 AM to 6:59 AM | 68 (5.2%) | 92 (10.0%) |
| 7:00 AM to 7:29 AM | 198 (15.2%) | 79 (8.6%) |
| 7:30 AM to 7:59 AM | 290 (22.3%) | 209 (22.6%) |
| 8:00 AM to 8:29 AM | 250 (19.3%) | 115 (12.5%) |
| 8:30 AM to 8:59 AM | 9 (0.7%) | 54 (5.9%) |
| 9:00 AM to 9:59 AM | 31 (2.4%) | 30 (3.3%) |
| 10:00 AM to 10:59 AM | 0 (0.0%) | 25 (2.7%) |
| 11:00 AM to 11:59 AM | 0 (0.0%) | 0 (0.0%) |
| 12:00 PM to 3:59 PM | 18 (1.4%) | 99 (10.7%) |
| 4:00 PM to 11:59 PM | 13 (1.0%) | 83 (9.0%) |
| Total | 1,299 (100.0%) | 923 (100.0%) |
Housing Occupancy in Stevens County
Occupancy by Ownership in Stevens County
Of the total 1,715 dwellings in Stevens County, owner-occupied units account for 1,198 (69.9%), while renter-occupied units make up 517 (30.1%).

| Occupancy | # Housing Units | % Housing Units |
| Owner Occupied Housing Units | 1,198 | 69.9% |
| Renter-Occupied Housing Units | 517 | 30.1% |
| Total Occupied Housing Units | 1,715 | 100.0% |
Occupancy by Household Size in Stevens County
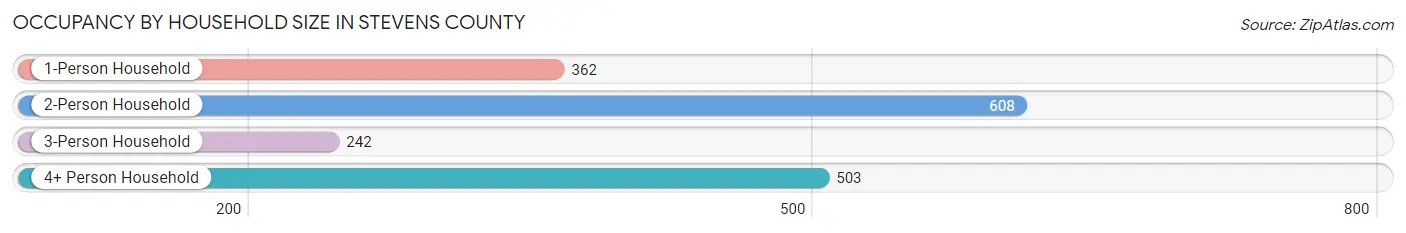
| Household Size | # Housing Units | % Housing Units |
| 1-Person Household | 362 | 21.1% |
| 2-Person Household | 608 | 35.4% |
| 3-Person Household | 242 | 14.1% |
| 4+ Person Household | 503 | 29.3% |
| Total Housing Units | 1,715 | 100.0% |
Occupancy by Ownership by Household Size in Stevens County
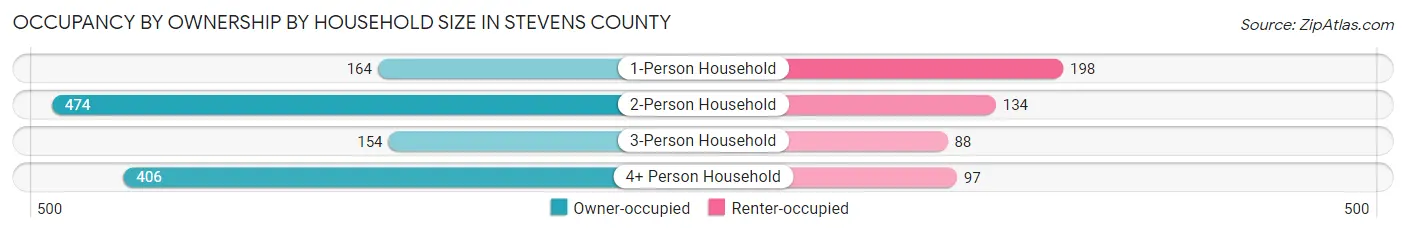
| Household Size | Owner-occupied | Renter-occupied |
| 1-Person Household | 164 (45.3%) | 198 (54.7%) |
| 2-Person Household | 474 (78.0%) | 134 (22.0%) |
| 3-Person Household | 154 (63.6%) | 88 (36.4%) |
| 4+ Person Household | 406 (80.7%) | 97 (19.3%) |
| Total Housing Units | 1,198 (69.9%) | 517 (30.1%) |
Occupancy by Educational Attainment in Stevens County

| Household Size | Owner-occupied | Renter-occupied |
| Less than High School | 234 (75.5%) | 76 (24.5%) |
| High School Diploma | 342 (67.9%) | 162 (32.1%) |
| College/Associate Degree | 416 (64.0%) | 234 (36.0%) |
| Bachelor's Degree or higher | 206 (82.1%) | 45 (17.9%) |
Occupancy by Age of Householder in Stevens County

| Age Bracket | # Households | % Households |
| Under 35 Years | 310 | 18.1% |
| 35 to 44 Years | 325 | 19.0% |
| 45 to 54 Years | 329 | 19.2% |
| 55 to 64 Years | 305 | 17.8% |
| 65 to 74 Years | 252 | 14.7% |
| 75 to 84 Years | 93 | 5.4% |
| 85 Years and Over | 101 | 5.9% |
| Total | 1,715 | 100.0% |
Housing Finances in Stevens County
Median Income by Occupancy in Stevens County

| Occupancy Type | # Households | Median Income |
| Owner-Occupied | 1,198 (69.9%) | $83,667 |
| Renter-Occupied | 517 (30.1%) | $43,973 |
| Average | 1,715 (100.0%) | $67,950 |
Occupancy by Householder Income Bracket in Stevens County
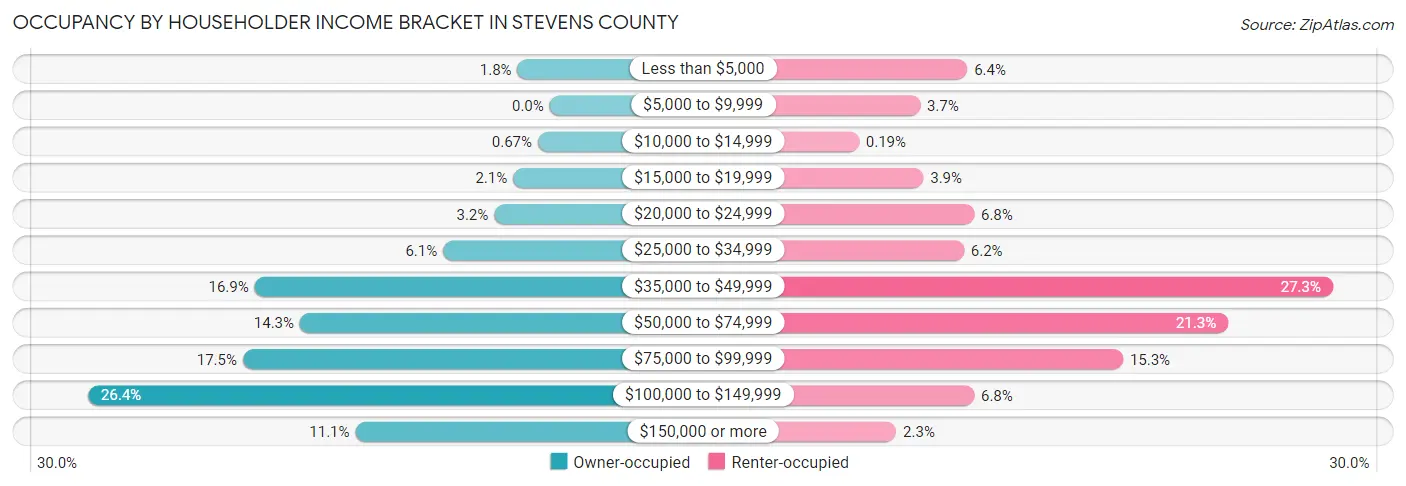
| Income Bracket | Owner-occupied | Renter-occupied |
| Less than $5,000 | 22 (1.8%) | 33 (6.4%) |
| $5,000 to $9,999 | 0 (0.0%) | 19 (3.7%) |
| $10,000 to $14,999 | 8 (0.7%) | 1 (0.2%) |
| $15,000 to $19,999 | 25 (2.1%) | 20 (3.9%) |
| $20,000 to $24,999 | 38 (3.2%) | 35 (6.8%) |
| $25,000 to $34,999 | 73 (6.1%) | 32 (6.2%) |
| $35,000 to $49,999 | 202 (16.9%) | 141 (27.3%) |
| $50,000 to $74,999 | 171 (14.3%) | 110 (21.3%) |
| $75,000 to $99,999 | 210 (17.5%) | 79 (15.3%) |
| $100,000 to $149,999 | 316 (26.4%) | 35 (6.8%) |
| $150,000 or more | 133 (11.1%) | 12 (2.3%) |
| Total | 1,198 (100.0%) | 517 (100.0%) |
Monthly Housing Cost Tiers in Stevens County
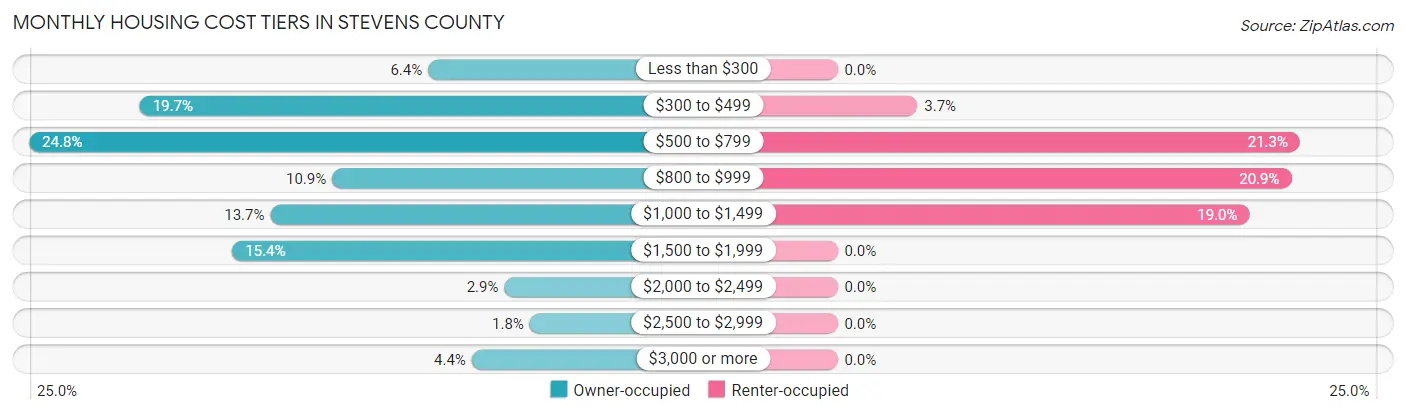
| Monthly Cost | Owner-occupied | Renter-occupied |
| Less than $300 | 77 (6.4%) | 0 (0.0%) |
| $300 to $499 | 236 (19.7%) | 19 (3.7%) |
| $500 to $799 | 297 (24.8%) | 110 (21.3%) |
| $800 to $999 | 130 (10.8%) | 108 (20.9%) |
| $1,000 to $1,499 | 164 (13.7%) | 98 (19.0%) |
| $1,500 to $1,999 | 185 (15.4%) | 0 (0.0%) |
| $2,000 to $2,499 | 35 (2.9%) | 0 (0.0%) |
| $2,500 to $2,999 | 21 (1.8%) | 0 (0.0%) |
| $3,000 or more | 53 (4.4%) | 0 (0.0%) |
| Total | 1,198 (100.0%) | 517 (100.0%) |
Physical Housing Characteristics in Stevens County
Housing Structures in Stevens County

| Structure Type | # Housing Units | % Housing Units |
| Single Unit, Detached | 1,303 | 76.0% |
| Single Unit, Attached | 14 | 0.8% |
| 2 Unit Apartments | 0 | 0.0% |
| 3 or 4 Unit Apartments | 8 | 0.5% |
| 5 to 9 Unit Apartments | 0 | 0.0% |
| 10 or more Apartments | 36 | 2.1% |
| Mobile Home / Other | 354 | 20.6% |
| Total | 1,715 | 100.0% |
Housing Structures by Occupancy in Stevens County
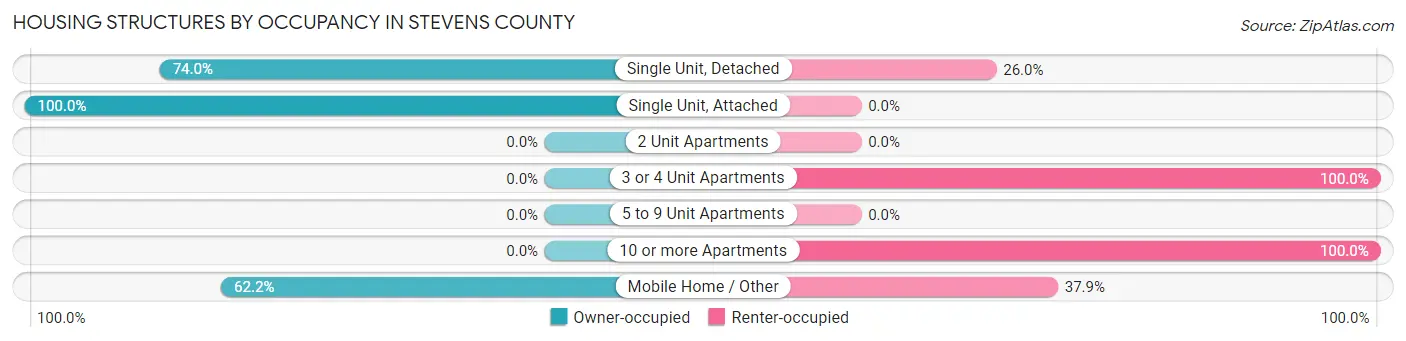
| Structure Type | Owner-occupied | Renter-occupied |
| Single Unit, Detached | 964 (74.0%) | 339 (26.0%) |
| Single Unit, Attached | 14 (100.0%) | 0 (0.0%) |
| 2 Unit Apartments | 0 (0.0%) | 0 (0.0%) |
| 3 or 4 Unit Apartments | 0 (0.0%) | 8 (100.0%) |
| 5 to 9 Unit Apartments | 0 (0.0%) | 0 (0.0%) |
| 10 or more Apartments | 0 (0.0%) | 36 (100.0%) |
| Mobile Home / Other | 220 (62.2%) | 134 (37.9%) |
| Total | 1,198 (69.9%) | 517 (30.1%) |
Housing Structures by Number of Rooms in Stevens County
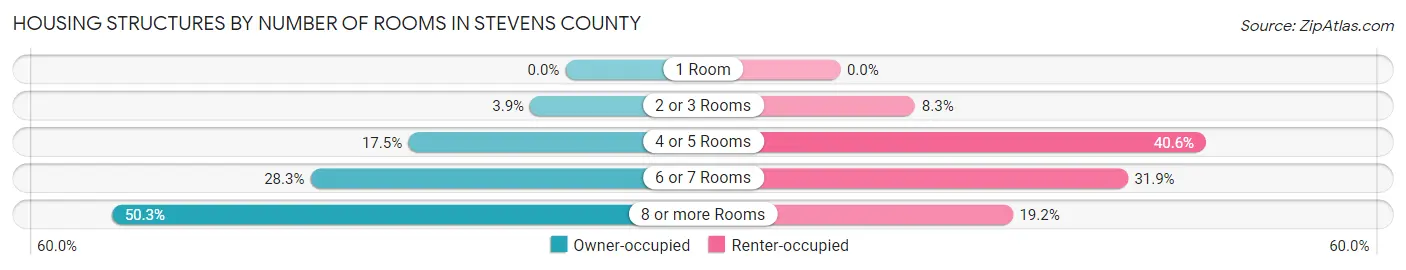
| Number of Rooms | Owner-occupied | Renter-occupied |
| 1 Room | 0 (0.0%) | 0 (0.0%) |
| 2 or 3 Rooms | 47 (3.9%) | 43 (8.3%) |
| 4 or 5 Rooms | 209 (17.4%) | 210 (40.6%) |
| 6 or 7 Rooms | 339 (28.3%) | 165 (31.9%) |
| 8 or more Rooms | 603 (50.3%) | 99 (19.2%) |
| Total | 1,198 (100.0%) | 517 (100.0%) |
Housing Structure by Heating Type in Stevens County
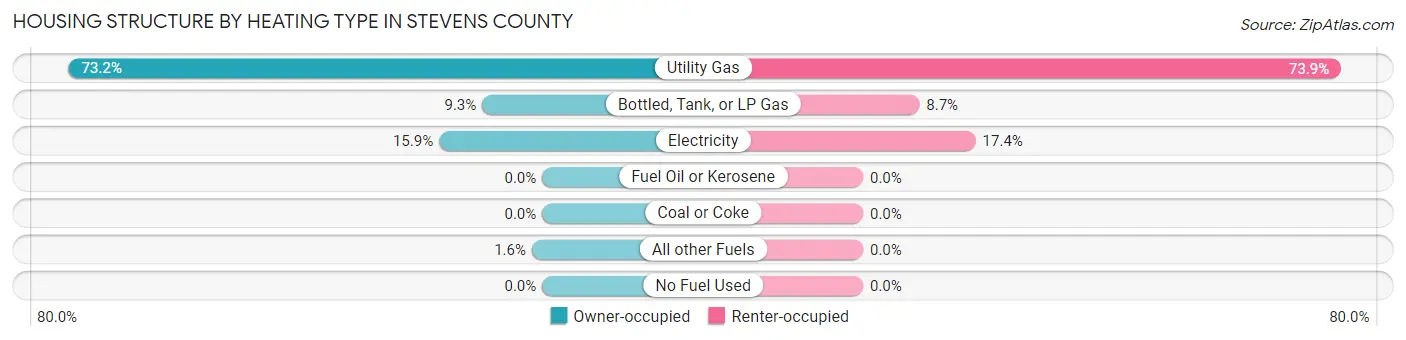
| Heating Type | Owner-occupied | Renter-occupied |
| Utility Gas | 877 (73.2%) | 382 (73.9%) |
| Bottled, Tank, or LP Gas | 111 (9.3%) | 45 (8.7%) |
| Electricity | 191 (15.9%) | 90 (17.4%) |
| Fuel Oil or Kerosene | 0 (0.0%) | 0 (0.0%) |
| Coal or Coke | 0 (0.0%) | 0 (0.0%) |
| All other Fuels | 19 (1.6%) | 0 (0.0%) |
| No Fuel Used | 0 (0.0%) | 0 (0.0%) |
| Total | 1,198 (100.0%) | 517 (100.0%) |
Household Vehicle Usage in Stevens County
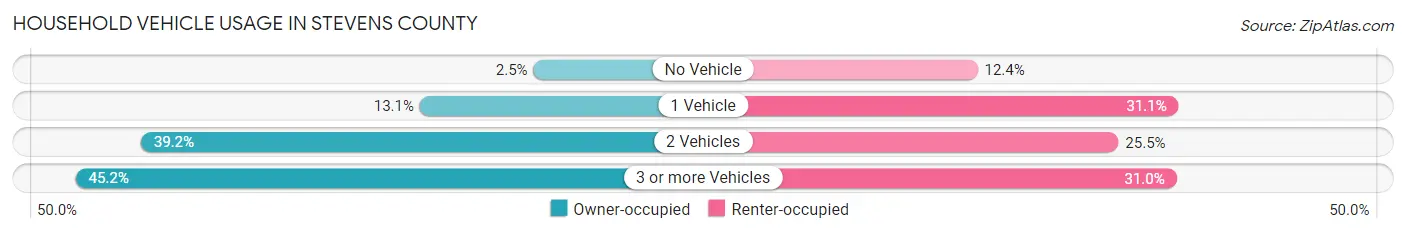
| Vehicles per Household | Owner-occupied | Renter-occupied |
| No Vehicle | 30 (2.5%) | 64 (12.4%) |
| 1 Vehicle | 157 (13.1%) | 161 (31.1%) |
| 2 Vehicles | 469 (39.2%) | 132 (25.5%) |
| 3 or more Vehicles | 542 (45.2%) | 160 (30.9%) |
| Total | 1,198 (100.0%) | 517 (100.0%) |
Real Estate & Mortgages in Stevens County
Real Estate and Mortgage Overview in Stevens County
| Characteristic | Without Mortgage | With Mortgage |
| Housing Units | 705 | 493 |
| Median Property Value | $128,600 | $152,700 |
| Median Household Income | $63,631 | $57 |
| Monthly Housing Costs | $533 | $53 |
| Real Estate Taxes | $1,446 | $0 |
Property Value by Mortgage Status in Stevens County
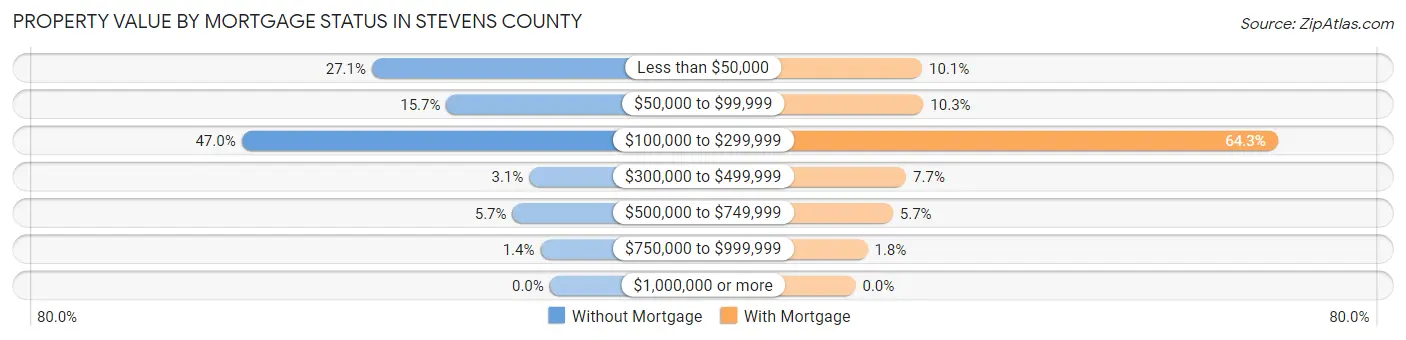
| Property Value | Without Mortgage | With Mortgage |
| Less than $50,000 | 191 (27.1%) | 50 (10.1%) |
| $50,000 to $99,999 | 111 (15.7%) | 51 (10.3%) |
| $100,000 to $299,999 | 331 (46.9%) | 317 (64.3%) |
| $300,000 to $499,999 | 22 (3.1%) | 38 (7.7%) |
| $500,000 to $749,999 | 40 (5.7%) | 28 (5.7%) |
| $750,000 to $999,999 | 10 (1.4%) | 9 (1.8%) |
| $1,000,000 or more | 0 (0.0%) | 0 (0.0%) |
| Total | 705 (100.0%) | 493 (100.0%) |
Household Income by Mortgage Status in Stevens County
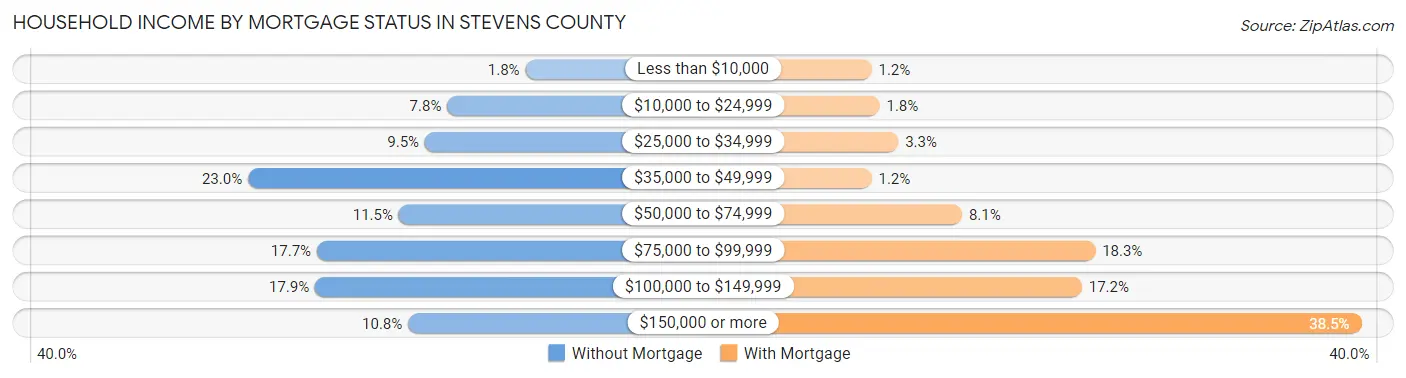
| Household Income | Without Mortgage | With Mortgage |
| Less than $10,000 | 13 (1.8%) | 6 (1.2%) |
| $10,000 to $24,999 | 55 (7.8%) | 9 (1.8%) |
| $25,000 to $34,999 | 67 (9.5%) | 16 (3.3%) |
| $35,000 to $49,999 | 162 (23.0%) | 6 (1.2%) |
| $50,000 to $74,999 | 81 (11.5%) | 40 (8.1%) |
| $75,000 to $99,999 | 125 (17.7%) | 90 (18.3%) |
| $100,000 to $149,999 | 126 (17.9%) | 85 (17.2%) |
| $150,000 or more | 76 (10.8%) | 190 (38.5%) |
| Total | 705 (100.0%) | 493 (100.0%) |
Property Value to Household Income Ratio in Stevens County
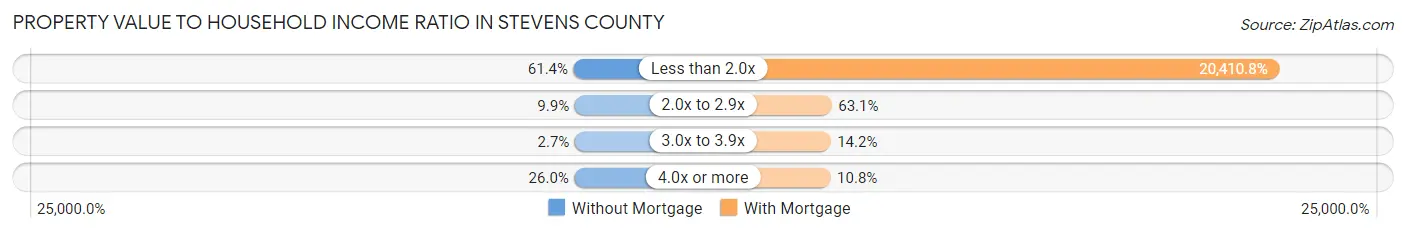
| Value-to-Income Ratio | Without Mortgage | With Mortgage |
| Less than 2.0x | 433 (61.4%) | 100,625 (20,410.7%) |
| 2.0x to 2.9x | 70 (9.9%) | 311 (63.1%) |
| 3.0x to 3.9x | 19 (2.7%) | 70 (14.2%) |
| 4.0x or more | 183 (26.0%) | 53 (10.7%) |
| Total | 705 (100.0%) | 493 (100.0%) |
Real Estate Taxes by Mortgage Status in Stevens County
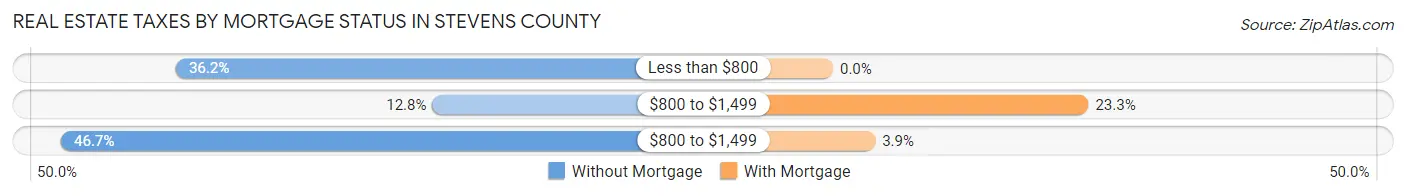
| Property Taxes | Without Mortgage | With Mortgage |
| Less than $800 | 255 (36.2%) | 0 (0.0%) |
| $800 to $1,499 | 90 (12.8%) | 115 (23.3%) |
| $800 to $1,499 | 329 (46.7%) | 19 (3.8%) |
| Total | 705 (100.0%) | 493 (100.0%) |
Health & Disability in Stevens County
Health Insurance Coverage by Age in Stevens County

| Age Bracket | With Coverage | Without Coverage |
| Under 6 Years | 490 (98.6%) | 7 (1.4%) |
| 6 to 18 Years | 951 (86.9%) | 143 (13.1%) |
| 19 to 25 Years | 376 (84.5%) | 69 (15.5%) |
| 26 to 34 Years | 371 (74.5%) | 127 (25.5%) |
| 35 to 44 Years | 440 (68.2%) | 205 (31.8%) |
| 45 to 54 Years | 417 (72.4%) | 159 (27.6%) |
| 55 to 64 Years | 528 (89.2%) | 64 (10.8%) |
| 65 to 74 Years | 516 (100.0%) | 0 (0.0%) |
| 75 Years and older | 295 (100.0%) | 0 (0.0%) |
| Total | 4,384 (85.0%) | 774 (15.0%) |
Health Insurance Coverage by Citizenship Status in Stevens County
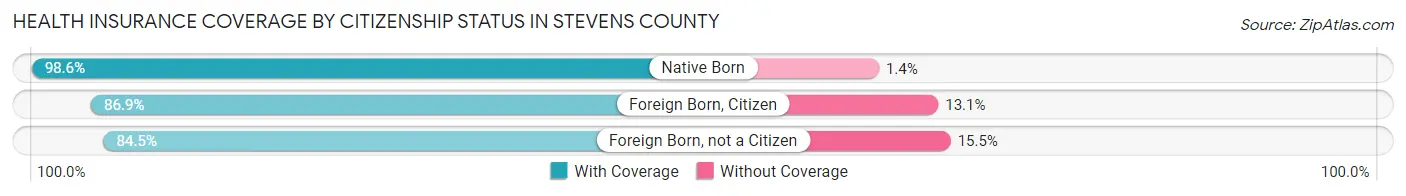
| Citizenship Status | With Coverage | Without Coverage |
| Native Born | 490 (98.6%) | 7 (1.4%) |
| Foreign Born, Citizen | 951 (86.9%) | 143 (13.1%) |
| Foreign Born, not a Citizen | 376 (84.5%) | 69 (15.5%) |
Health Insurance Coverage by Household Income in Stevens County
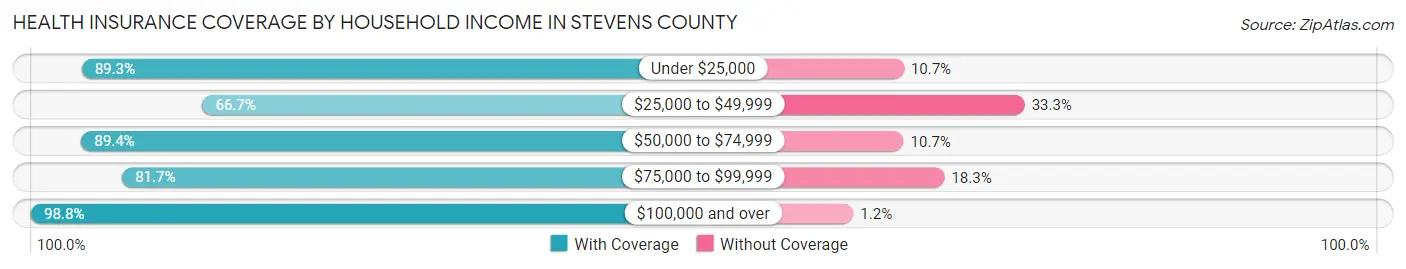
| Household Income | With Coverage | Without Coverage |
| Under $25,000 | 617 (89.3%) | 74 (10.7%) |
| $25,000 to $49,999 | 838 (66.7%) | 419 (33.3%) |
| $50,000 to $74,999 | 998 (89.3%) | 119 (10.6%) |
| $75,000 to $99,999 | 652 (81.7%) | 146 (18.3%) |
| $100,000 and over | 1,279 (98.8%) | 16 (1.2%) |
Public vs Private Health Insurance Coverage by Age in Stevens County
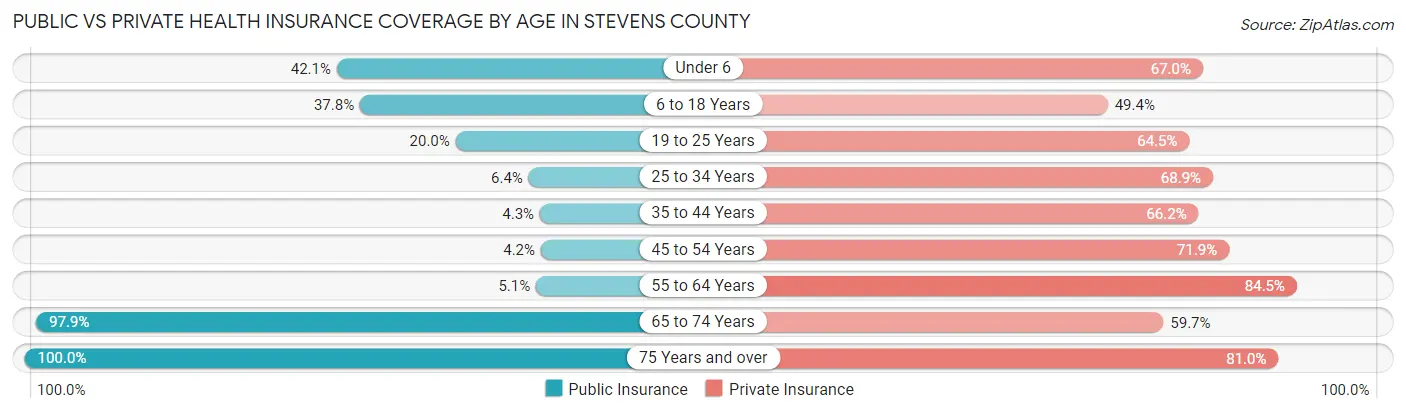
| Age Bracket | Public Insurance | Private Insurance |
| Under 6 | 209 (42.0%) | 333 (67.0%) |
| 6 to 18 Years | 413 (37.8%) | 540 (49.4%) |
| 19 to 25 Years | 89 (20.0%) | 287 (64.5%) |
| 25 to 34 Years | 32 (6.4%) | 343 (68.9%) |
| 35 to 44 Years | 28 (4.3%) | 427 (66.2%) |
| 45 to 54 Years | 24 (4.2%) | 414 (71.9%) |
| 55 to 64 Years | 30 (5.1%) | 500 (84.5%) |
| 65 to 74 Years | 505 (97.9%) | 308 (59.7%) |
| 75 Years and over | 295 (100.0%) | 239 (81.0%) |
| Total | 1,625 (31.5%) | 3,391 (65.7%) |
Disability Status by Sex by Age in Stevens County
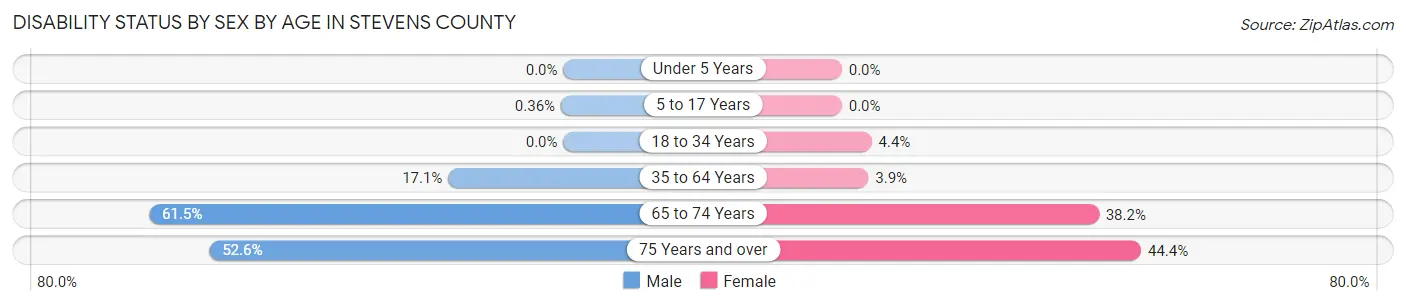
| Age Bracket | Male | Female |
| Under 5 Years | 0 (0.0%) | 0 (0.0%) |
| 5 to 17 Years | 2 (0.4%) | 0 (0.0%) |
| 18 to 34 Years | 0 (0.0%) | 21 (4.4%) |
| 35 to 64 Years | 158 (17.1%) | 35 (3.9%) |
| 65 to 74 Years | 211 (61.5%) | 66 (38.2%) |
| 75 Years and over | 51 (52.6%) | 88 (44.4%) |
Disability Class by Sex by Age in Stevens County
Disability Class: Hearing Difficulty
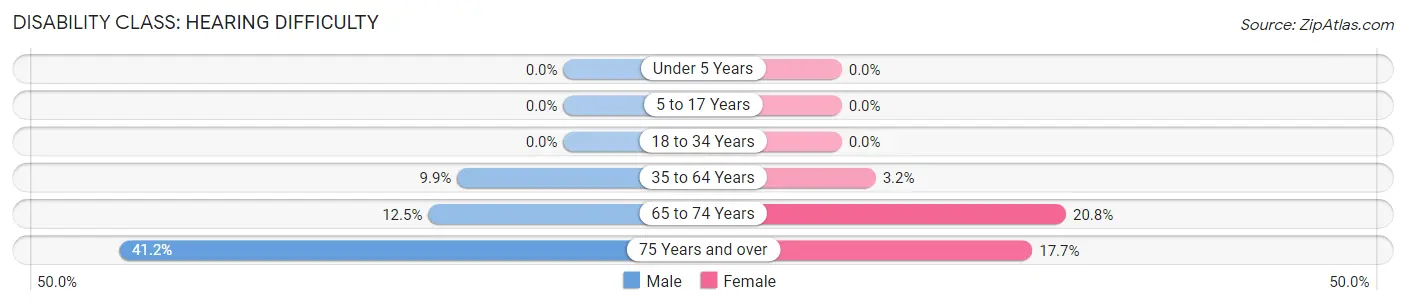
| Age Bracket | Male | Female |
| Under 5 Years | 0 (0.0%) | 0 (0.0%) |
| 5 to 17 Years | 0 (0.0%) | 0 (0.0%) |
| 18 to 34 Years | 0 (0.0%) | 0 (0.0%) |
| 35 to 64 Years | 91 (9.9%) | 28 (3.2%) |
| 65 to 74 Years | 43 (12.5%) | 36 (20.8%) |
| 75 Years and over | 40 (41.2%) | 35 (17.7%) |
Disability Class: Vision Difficulty
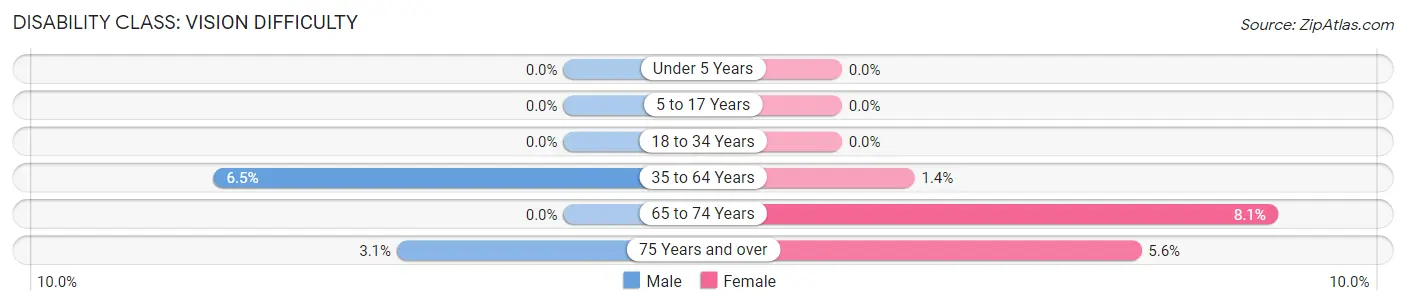
| Age Bracket | Male | Female |
| Under 5 Years | 0 (0.0%) | 0 (0.0%) |
| 5 to 17 Years | 0 (0.0%) | 0 (0.0%) |
| 18 to 34 Years | 0 (0.0%) | 0 (0.0%) |
| 35 to 64 Years | 60 (6.5%) | 12 (1.3%) |
| 65 to 74 Years | 0 (0.0%) | 14 (8.1%) |
| 75 Years and over | 3 (3.1%) | 11 (5.6%) |
Disability Class: Cognitive Difficulty
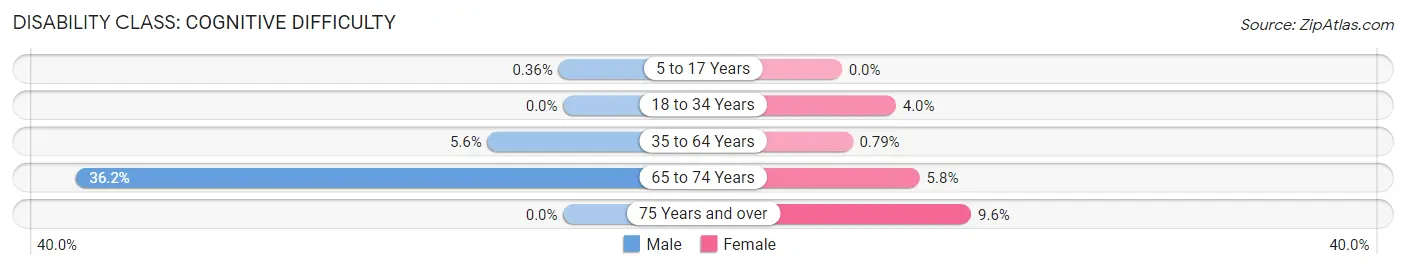
| Age Bracket | Male | Female |
| 5 to 17 Years | 2 (0.4%) | 0 (0.0%) |
| 18 to 34 Years | 0 (0.0%) | 19 (4.0%) |
| 35 to 64 Years | 52 (5.6%) | 7 (0.8%) |
| 65 to 74 Years | 124 (36.1%) | 10 (5.8%) |
| 75 Years and over | 0 (0.0%) | 19 (9.6%) |
Disability Class: Ambulatory Difficulty
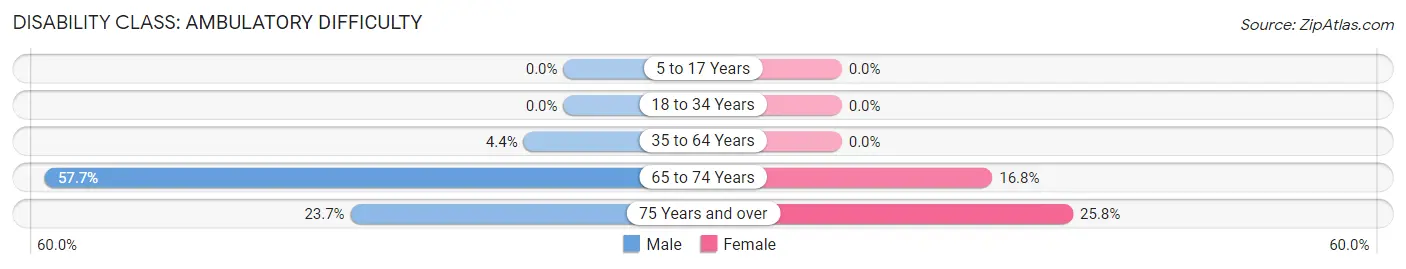
| Age Bracket | Male | Female |
| 5 to 17 Years | 0 (0.0%) | 0 (0.0%) |
| 18 to 34 Years | 0 (0.0%) | 0 (0.0%) |
| 35 to 64 Years | 41 (4.4%) | 0 (0.0%) |
| 65 to 74 Years | 198 (57.7%) | 29 (16.8%) |
| 75 Years and over | 23 (23.7%) | 51 (25.8%) |
Disability Class: Self-Care Difficulty
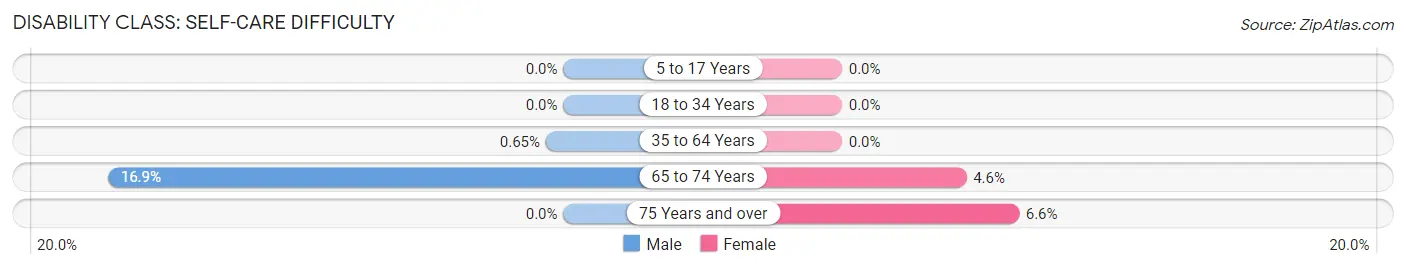
| Age Bracket | Male | Female |
| 5 to 17 Years | 0 (0.0%) | 0 (0.0%) |
| 18 to 34 Years | 0 (0.0%) | 0 (0.0%) |
| 35 to 64 Years | 6 (0.6%) | 0 (0.0%) |
| 65 to 74 Years | 58 (16.9%) | 8 (4.6%) |
| 75 Years and over | 0 (0.0%) | 13 (6.6%) |
Technology Access in Stevens County
Computing Device Access in Stevens County

| Device Type | # Households | % Households |
| Desktop or Laptop | 1,189 | 69.3% |
| Smartphone | 1,552 | 90.5% |
| Tablet | 1,033 | 60.2% |
| No Computing Device | 79 | 4.6% |
| Total | 1,715 | 100.0% |
Internet Access in Stevens County

| Internet Type | # Households | % Households |
| Dial-Up Internet | 0 | 0.0% |
| Broadband Home | 1,212 | 70.7% |
| Cellular Data Only | 221 | 12.9% |
| Satellite Internet | 83 | 4.8% |
| No Internet | 230 | 13.4% |
| Total | 1,715 | 100.0% |
Stevens County Summary
Stevens County, Kansas is located in the southwestern corner of the state, bordered by Oklahoma to the south and Colorado to the west. It is part of the High Plains region of the Great Plains, and is one of the most sparsely populated counties in the state. The county seat is Hugoton, and the largest city is Hugoton.
History
Stevens County was established in 1873, and was named after Thaddeus Stevens, a prominent politician in the United States during the 19th century. The county was originally part of the larger Kiowa County, which was divided into Stevens and Kiowa counties in 1873.
The first settlers in the area were ranchers, who began to arrive in the late 1870s. The first town in the county was Hugoton, which was founded in 1879. The town was named after the Hugoton Indians, who were the original inhabitants of the area.
The county was largely agricultural in the early 20th century, with wheat, corn, and sorghum being the main crops. The county also had a large cattle industry, and the town of Hugoton was a major cattle shipping center.
In the 1950s, oil and natural gas were discovered in the county, and the area quickly became an important energy producer. The county is now one of the top oil and gas producing counties in the state.
Geography
Stevens County is located in the southwestern corner of Kansas, and is bordered by Oklahoma to the south and Colorado to the west. The county covers an area of 1,092 square miles, and is the second-largest county in the state.
The county is part of the High Plains region of the Great Plains, and is mostly flat and treeless. The county is drained by the Cimarron River, which flows through the county from north to south.
The county has a semi-arid climate, with hot summers and cold winters. The average annual precipitation is about 18 inches, and the average annual temperature is about 54 degrees Fahrenheit.
Economy
Stevens County has a largely agricultural economy, with wheat, corn, and sorghum being the main crops. The county also has a large cattle industry, and the town of Hugoton is a major cattle shipping center.
In addition, the county is an important energy producer, with oil and natural gas being the main sources of energy. The county is one of the top oil and gas producing counties in the state, and the energy industry is a major contributor to the local economy.
Demographics
As of the 2010 census, Stevens County had a population of 5,717. The population was spread out, with 48.3% male and 51.7% female. The median age was 38.7 years.
The racial makeup of the county was 87.2% White, 0.7% African American, 0.7% Native American, 0.2% Asian, 0.1% Pacific Islander, 9.7% from other races, and 1.4% from two or more races. Hispanic or Latino of any race were 16.2% of the population.
The median household income was $41,945, and the median family income was $50,938. The per capita income was $20,945. About 14.2% of the population was below the poverty line.
Common Questions
What is the Total Population of Stevens County?
Total Population of Stevens County is 5,275.
What is the Total Male Population of Stevens County?
Total Male Population of Stevens County is 2,729.
What is the Total Female Population of Stevens County?
Total Female Population of Stevens County is 2,546.
What is the Ratio of Males per 100 Females in Stevens County?
There are 107.19 Males per 100 Females in Stevens County.
What is the Ratio of Females per 100 Males in Stevens County?
There are 93.29 Females per 100 Males in Stevens County.
What is the Median Population Age in Stevens County?
Median Population Age in Stevens County is 36.3 Years.
What is the Average Family Size in Stevens County
Average Family Size in Stevens County is 3.5 People.
What is the Average Household Size in Stevens County
Average Household Size in Stevens County is 3.0 People.
What is Per Capita Income in Stevens County?
Per Capita income in Stevens County is $25,674.
What is the Median Family Income in Stevens County?
Median Family Income in Stevens County is $78,438.
What is the Median Household income in Stevens County?
Median Household Income in Stevens County is $67,950.
What is Income or Wage Gap in Stevens County?
Income or Wage Gap in Stevens County is 47.1%.
Women in Stevens County earn 52.9 cents for every dollar earned by a man.
What is Inequality or Gini Index in Stevens County?
Inequality or Gini Index in Stevens County is 0.35.
How Large is the Labor Force in Stevens County?
There are 2,457 People in the Labor Forcein in Stevens County.
What is the Percentage of People in the Labor Force in Stevens County?
62.7% of People are in the Labor Force in Stevens County.
What is the Unemployment Rate in Stevens County?
Unemployment Rate in Stevens County is 1.9%.