Smith County, KS
Smith County Map
Smith County Overview
3,561
TOTAL POPULATION
1,837
MALE POPULATION
1,724
FEMALE POPULATION
106.55
MALES / 100 FEMALES
93.85
FEMALES / 100 MALES
50.0
MEDIAN AGE
2.9
AVG FAMILY SIZE
2.2
AVG HOUSEHOLD SIZE
$33,881
PER CAPITA INCOME
$74,911
AVG FAMILY INCOME
$50,943
AVG HOUSEHOLD INCOME
37.4%
WAGE / INCOME GAP [ % ]
62.6¢/ $1
WAGE / INCOME GAP [ $ ]
$9,190
FAMILY INCOME DEFICIT
0.44
INEQUALITY / GINI INDEX
1,772
LABOR FORCE [ PEOPLE ]
60.1%
PERCENT IN LABOR FORCE
2.1%
UNEMPLOYMENT RATE
Smith County Area Codes
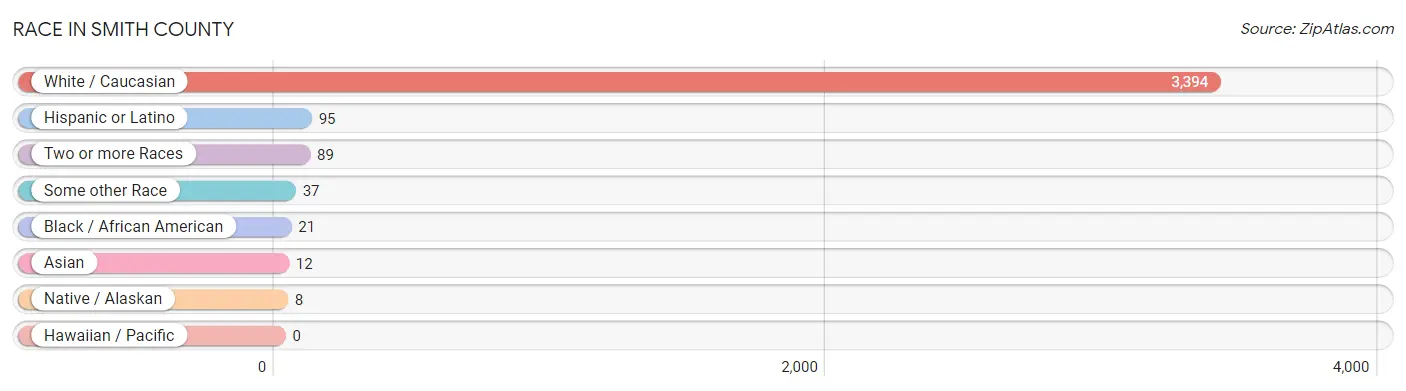
Race in Smith County
The most populous races in Smith County are White / Caucasian (3,394 | 95.3%), Hispanic or Latino (95 | 2.7%), and Two or more Races (89 | 2.5%).
| Race | # Population | % Population |
| Asian | 12 | 0.3% |
| Black / African American | 21 | 0.6% |
| Hawaiian / Pacific | 0 | 0.0% |
| Hispanic or Latino | 95 | 2.7% |
| Native / Alaskan | 8 | 0.2% |
| White / Caucasian | 3,394 | 95.3% |
| Two or more Races | 89 | 2.5% |
| Some other Race | 37 | 1.0% |
| Total | 3,561 | 100.0% |
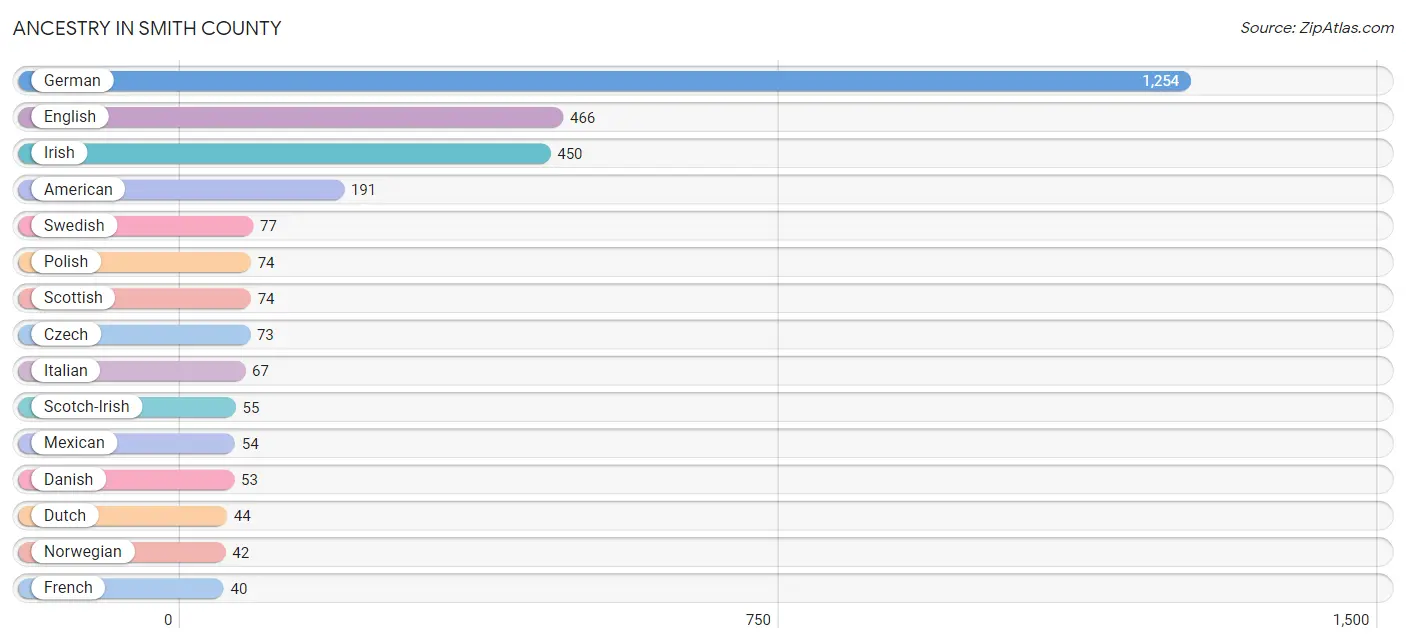
Ancestry in Smith County
The most populous ancestries reported in Smith County are German (1,254 | 35.2%), English (466 | 13.1%), Irish (450 | 12.6%), American (191 | 5.4%), and Swedish (77 | 2.2%), together accounting for 68.5% of all Smith County residents.
| Ancestry | # Population | % Population |
| Alaska Native | 1 | 0.0% |
| American | 191 | 5.4% |
| Austrian | 6 | 0.2% |
| Belgian | 8 | 0.2% |
| Bhutanese | 13 | 0.4% |
| British | 15 | 0.4% |
| British West Indian | 1 | 0.0% |
| Canadian | 3 | 0.1% |
| Cherokee | 7 | 0.2% |
| Choctaw | 2 | 0.1% |
| Czech | 73 | 2.1% |
| Danish | 53 | 1.5% |
| Dutch | 44 | 1.2% |
| Eastern European | 1 | 0.0% |
| English | 466 | 13.1% |
| European | 30 | 0.8% |
| French | 40 | 1.1% |
| French Canadian | 6 | 0.2% |
| German | 1,254 | 35.2% |
| German Russian | 1 | 0.0% |
| Indian (Asian) | 4 | 0.1% |
| Irish | 450 | 12.6% |
| Italian | 67 | 1.9% |
| Mexican | 54 | 1.5% |
| Native Hawaiian | 17 | 0.5% |
| Northern European | 4 | 0.1% |
| Norwegian | 42 | 1.2% |
| Osage | 4 | 0.1% |
| Pennsylvania German | 6 | 0.2% |
| Polish | 74 | 2.1% |
| Portuguese | 1 | 0.0% |
| Puerto Rican | 4 | 0.1% |
| Russian | 24 | 0.7% |
| Scandinavian | 3 | 0.1% |
| Scotch-Irish | 55 | 1.5% |
| Scottish | 74 | 2.1% |
| Sioux | 1 | 0.0% |
| Spanish | 1 | 0.0% |
| Sri Lankan | 1 | 0.0% |
| Swedish | 77 | 2.2% |
| Swiss | 31 | 0.9% |
| Ukrainian | 3 | 0.1% |
| Ute | 5 | 0.1% |
| Welsh | 21 | 0.6% |
| Yup'ik | 3 | 0.1% | View All 45 Rows |
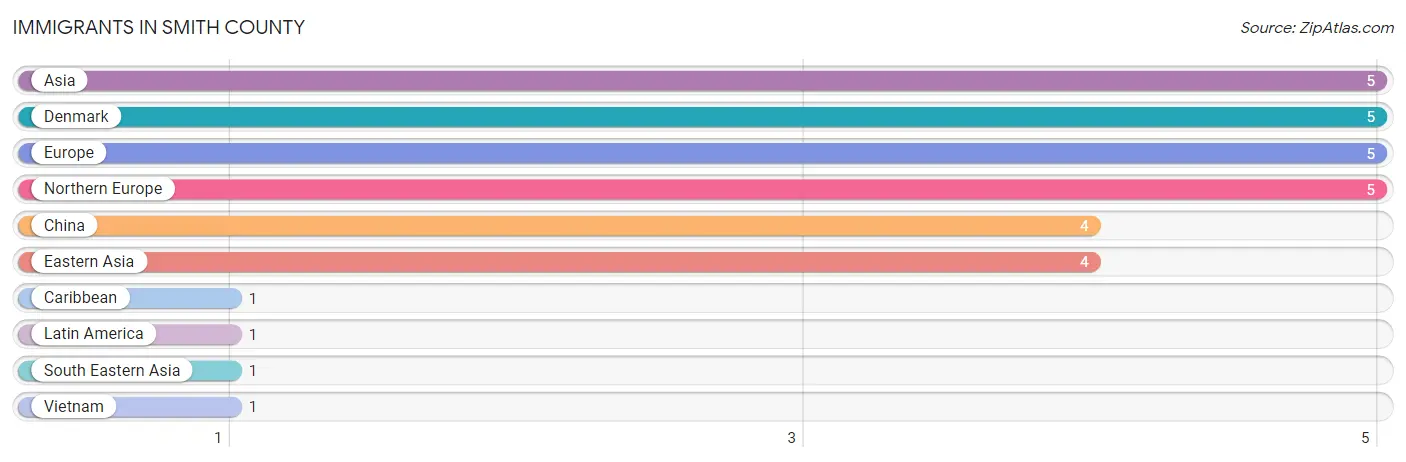
Immigrants in Smith County
The most numerous immigrant groups reported in Smith County came from Asia (5 | 0.1%), Denmark (5 | 0.1%), Europe (5 | 0.1%), Northern Europe (5 | 0.1%), and China (4 | 0.1%), together accounting for 0.7% of all Smith County residents.
| Immigration Origin | # Population | % Population |
| Asia | 5 | 0.1% |
| Caribbean | 1 | 0.0% |
| China | 4 | 0.1% |
| Denmark | 5 | 0.1% |
| Eastern Asia | 4 | 0.1% |
| Europe | 5 | 0.1% |
| Latin America | 1 | 0.0% |
| Northern Europe | 5 | 0.1% |
| South Eastern Asia | 1 | 0.0% |
| Vietnam | 1 | 0.0% | View All 10 Rows |
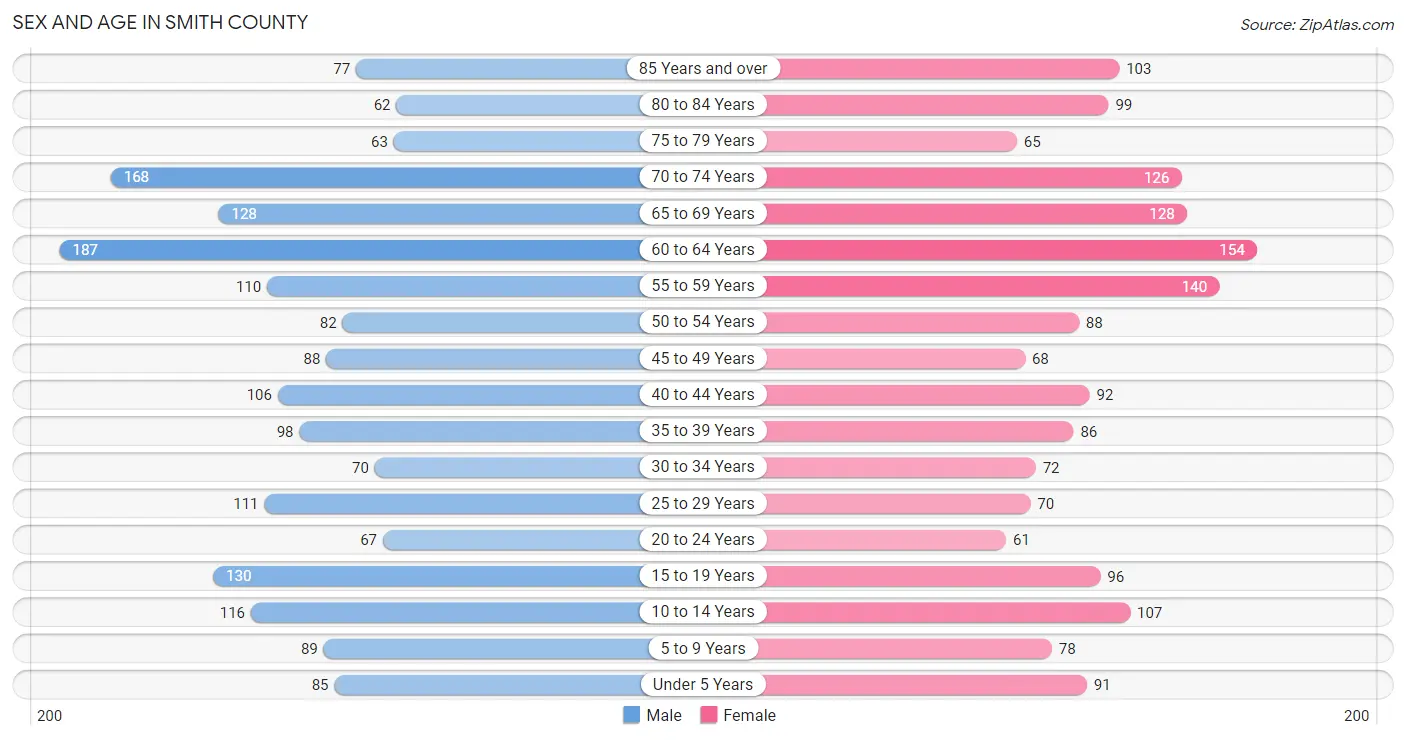
Sex and Age in Smith County
Sex and Age in Smith County
The most populous age groups in Smith County are 60 to 64 Years (187 | 10.2%) for men and 60 to 64 Years (154 | 8.9%) for women.
| Age Bracket | Male | Female |
| Under 5 Years | 85 (4.6%) | 91 (5.3%) |
| 5 to 9 Years | 89 (4.8%) | 78 (4.5%) |
| 10 to 14 Years | 116 (6.3%) | 107 (6.2%) |
| 15 to 19 Years | 130 (7.1%) | 96 (5.6%) |
| 20 to 24 Years | 67 (3.6%) | 61 (3.5%) |
| 25 to 29 Years | 111 (6.0%) | 70 (4.1%) |
| 30 to 34 Years | 70 (3.8%) | 72 (4.2%) |
| 35 to 39 Years | 98 (5.3%) | 86 (5.0%) |
| 40 to 44 Years | 106 (5.8%) | 92 (5.3%) |
| 45 to 49 Years | 88 (4.8%) | 68 (3.9%) |
| 50 to 54 Years | 82 (4.5%) | 88 (5.1%) |
| 55 to 59 Years | 110 (6.0%) | 140 (8.1%) |
| 60 to 64 Years | 187 (10.2%) | 154 (8.9%) |
| 65 to 69 Years | 128 (7.0%) | 128 (7.4%) |
| 70 to 74 Years | 168 (9.1%) | 126 (7.3%) |
| 75 to 79 Years | 63 (3.4%) | 65 (3.8%) |
| 80 to 84 Years | 62 (3.4%) | 99 (5.7%) |
| 85 Years and over | 77 (4.2%) | 103 (6.0%) |
| Total | 1,837 (100.0%) | 1,724 (100.0%) |
Families and Households in Smith County
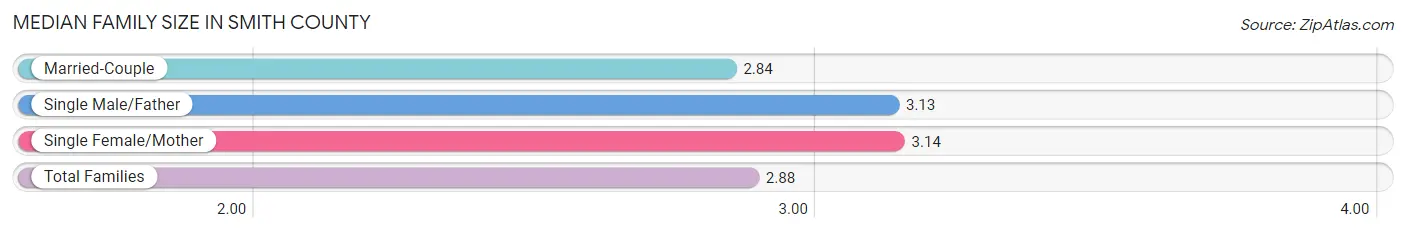
Median Family Size in Smith County
The median family size in Smith County is 2.88 persons per family, with single female/mother families (72 | 7.4%) accounting for the largest median family size of 3.14 persons per family. On the other hand, married-couple families (825 | 84.8%) represent the smallest median family size with 2.84 persons per family.
| Family Type | # Families | Family Size |
| Married-Couple | 825 (84.8%) | 2.84 |
| Single Male/Father | 76 (7.8%) | 3.13 |
| Single Female/Mother | 72 (7.4%) | 3.14 |
| Total Families | 973 (100.0%) | 2.88 |
Median Household Size in Smith County
The median household size in Smith County is 2.24 persons per household, with single female/mother households (72 | 4.6%) accounting for the largest median household size of 3.46 persons per household. non-family households (587 | 37.6%) represent the smallest median household size with 1.10 persons per household.

| Household Type | # Households | Household Size |
| Married-Couple | 825 (52.9%) | 2.86 |
| Single Male/Father | 76 (4.9%) | 3.18 |
| Single Female/Mother | 72 (4.6%) | 3.46 |
| Non-family | 587 (37.6%) | 1.10 |
| Total Households | 1,560 (100.0%) | 2.24 |
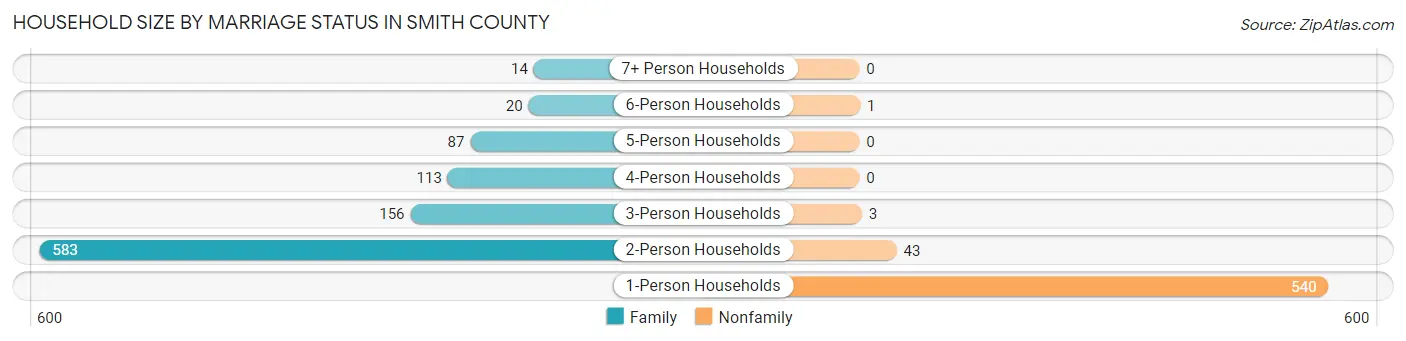
Household Size by Marriage Status in Smith County
Out of a total of 1,560 households in Smith County, 973 (62.4%) are family households, while 587 (37.6%) are nonfamily households. The most numerous type of family households are 2-person households, comprising 583, and the most common type of nonfamily households are 1-person households, comprising 540.
| Household Size | Family Households | Nonfamily Households |
| 1-Person Households | - | 540 (34.6%) |
| 2-Person Households | 583 (37.4%) | 43 (2.8%) |
| 3-Person Households | 156 (10.0%) | 3 (0.2%) |
| 4-Person Households | 113 (7.2%) | 0 (0.0%) |
| 5-Person Households | 87 (5.6%) | 0 (0.0%) |
| 6-Person Households | 20 (1.3%) | 1 (0.1%) |
| 7+ Person Households | 14 (0.9%) | 0 (0.0%) |
| Total | 973 (62.4%) | 587 (37.6%) |
Female Fertility in Smith County
Fertility by Age in Smith County
Average fertility rate in Smith County is 72.0 births per 1,000 women. Women in the age bracket of 20 to 34 years have the highest fertility rate with 197.0 births per 1,000 women. Women in the age bracket of 20 to 34 years acount for 95.2% of all women with births.

| Age Bracket | Women with Births | Births / 1,000 Women |
| 15 to 19 years | 0 (0.0%) | 0.0 |
| 20 to 34 years | 40 (95.2%) | 197.0 |
| 35 to 50 years | 2 (4.8%) | 7.0 |
| Total | 42 (100.0%) | 72.0 |
Fertility by Age by Marriage Status in Smith County
88.1% of women with births (42) in Smith County are married. The highest percentage of unmarried women with births falls into 35 to 50 years age bracket with 100.0% of them unmarried at the time of birth, while the lowest percentage of unmarried women with births belong to 20 to 34 years age bracket with 7.5% of them unmarried.

| Age Bracket | Married | Unmarried |
| 15 to 19 years | 0 (0.0%) | 0 (0.0%) |
| 20 to 34 years | 37 (92.5%) | 3 (7.5%) |
| 35 to 50 years | 0 (0.0%) | 2 (100.0%) |
| Total | 37 (88.1%) | 5 (11.9%) |
Fertility by Education in Smith County
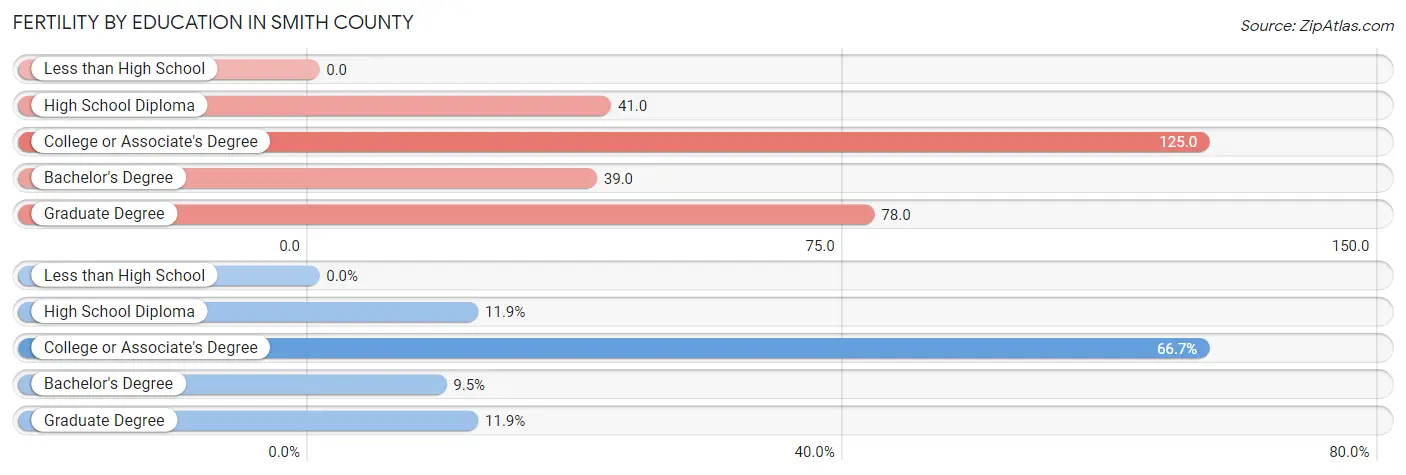
| Educational Attainment | Women with Births | Births / 1,000 Women |
| Less than High School | 0 (0.0%) | 0.0 |
| High School Diploma | 5 (11.9%) | 41.0 |
| College or Associate's Degree | 28 (66.7%) | 125.0 |
| Bachelor's Degree | 4 (9.5%) | 39.0 |
| Graduate Degree | 5 (11.9%) | 78.0 |
| Total | 42 (100.0%) | 72.0 |
Fertility by Education by Marriage Status in Smith County
11.9% of women with births in Smith County are unmarried. Women with the educational attainment of college or associate's degree are most likely to be married with 100.0% of them married at childbirth, while women with the educational attainment of high school diploma are least likely to be married with 60.0% of them unmarried at childbirth.
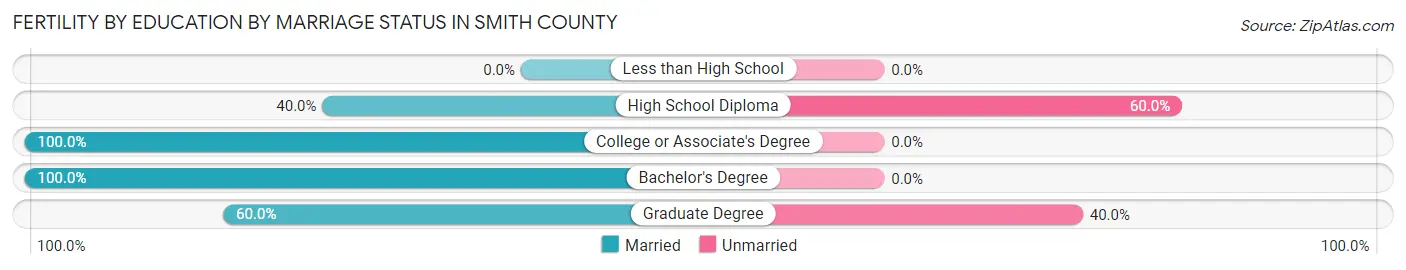
| Educational Attainment | Married | Unmarried |
| Less than High School | 0 (0.0%) | 0 (0.0%) |
| High School Diploma | 2 (40.0%) | 3 (60.0%) |
| College or Associate's Degree | 28 (100.0%) | 0 (0.0%) |
| Bachelor's Degree | 4 (100.0%) | 0 (0.0%) |
| Graduate Degree | 3 (60.0%) | 2 (40.0%) |
| Total | 37 (88.1%) | 5 (11.9%) |
Income in Smith County
Income Overview in Smith County
Per Capita Income in Smith County is $33,881, while median incomes of families and households are $74,911 and $50,943 respectively.
| Characteristic | Number | Measure |
| Per Capita Income | 3,561 | $33,881 |
| Median Family Income | 973 | $74,911 |
| Mean Family Income | 973 | $91,970 |
| Median Household Income | 1,560 | $50,943 |
| Mean Household Income | 1,560 | $74,345 |
| Income Deficit | 973 | $9,190 |
| Wage / Income Gap (%) | 3,561 | 37.40% |
| Wage / Income Gap ($) | 3,561 | 62.60¢ per $1 |
| Gini / Inequality Index | 3,561 | 0.44 |
Earnings by Sex in Smith County
Average Earnings in Smith County are $33,983, $41,750 for men and $26,136 for women, a difference of 37.4%.
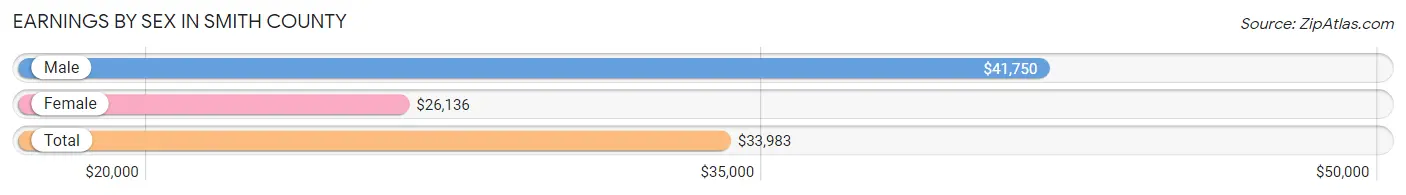
| Sex | Number | Average Earnings |
| Male | 1,035 (54.7%) | $41,750 |
| Female | 858 (45.3%) | $26,136 |
| Total | 1,893 (100.0%) | $33,983 |
Earnings by Sex by Income Bracket in Smith County
The most common earnings brackets in Smith County are $100,000+ for men (139 | 13.4%) and $12,500 to $14,999 for women (122 | 14.2%).
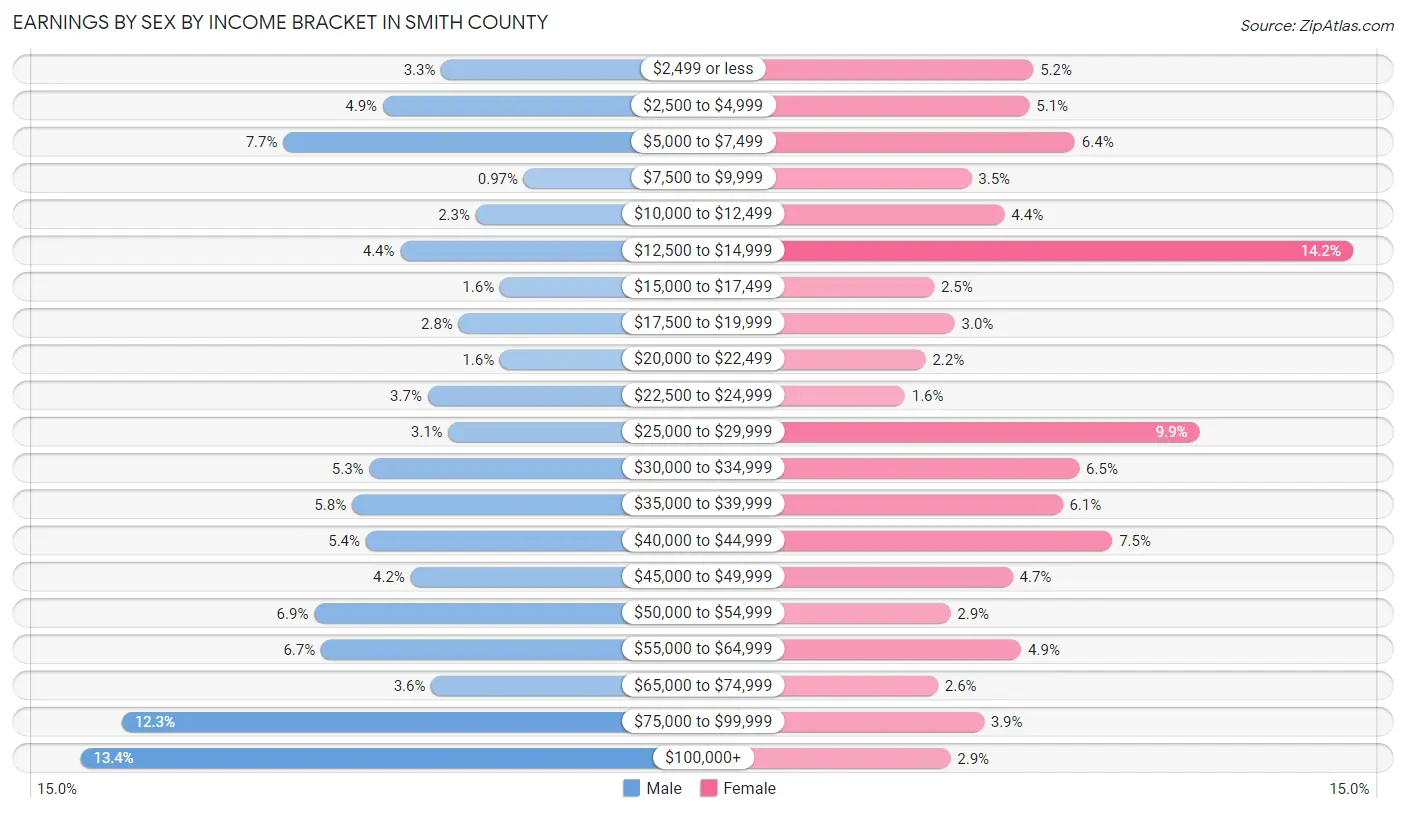
| Income | Male | Female |
| $2,499 or less | 34 (3.3%) | 45 (5.2%) |
| $2,500 to $4,999 | 51 (4.9%) | 44 (5.1%) |
| $5,000 to $7,499 | 80 (7.7%) | 55 (6.4%) |
| $7,500 to $9,999 | 10 (1.0%) | 30 (3.5%) |
| $10,000 to $12,499 | 24 (2.3%) | 38 (4.4%) |
| $12,500 to $14,999 | 46 (4.4%) | 122 (14.2%) |
| $15,000 to $17,499 | 17 (1.6%) | 21 (2.5%) |
| $17,500 to $19,999 | 29 (2.8%) | 26 (3.0%) |
| $20,000 to $22,499 | 17 (1.6%) | 19 (2.2%) |
| $22,500 to $24,999 | 38 (3.7%) | 14 (1.6%) |
| $25,000 to $29,999 | 32 (3.1%) | 85 (9.9%) |
| $30,000 to $34,999 | 55 (5.3%) | 56 (6.5%) |
| $35,000 to $39,999 | 60 (5.8%) | 52 (6.1%) |
| $40,000 to $44,999 | 56 (5.4%) | 64 (7.5%) |
| $45,000 to $49,999 | 43 (4.2%) | 40 (4.7%) |
| $50,000 to $54,999 | 71 (6.9%) | 25 (2.9%) |
| $55,000 to $64,999 | 69 (6.7%) | 42 (4.9%) |
| $65,000 to $74,999 | 37 (3.6%) | 22 (2.6%) |
| $75,000 to $99,999 | 127 (12.3%) | 33 (3.8%) |
| $100,000+ | 139 (13.4%) | 25 (2.9%) |
| Total | 1,035 (100.0%) | 858 (100.0%) |
Earnings by Sex by Educational Attainment in Smith County
Average earnings in Smith County are $48,897 for men and $27,837 for women, a difference of 43.1%. Men with an educational attainment of bachelor's degree enjoy the highest average annual earnings of $64,583, while those with high school diploma education earn the least with $33,882. Women with an educational attainment of graduate degree earn the most with the average annual earnings of $55,104, while those with high school diploma education have the smallest earnings of $18,516.
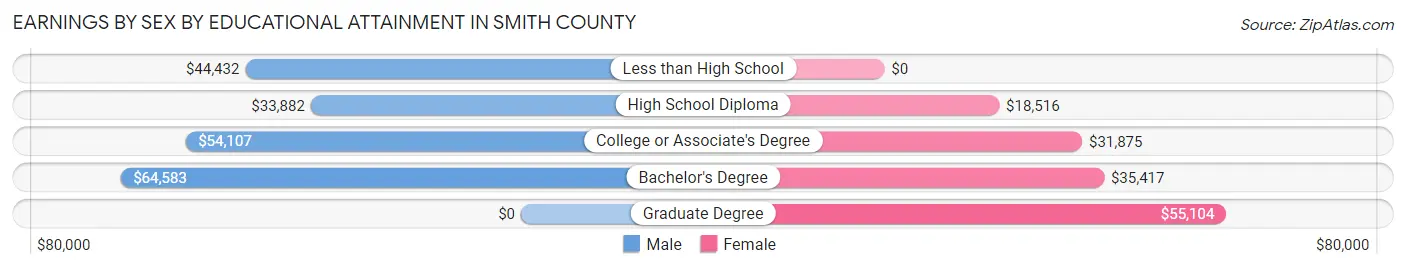
| Educational Attainment | Male Income | Female Income |
| Less than High School | $44,432 | $0 |
| High School Diploma | $33,882 | $18,516 |
| College or Associate's Degree | $54,107 | $31,875 |
| Bachelor's Degree | $64,583 | $35,417 |
| Graduate Degree | - | - |
| Total | $48,897 | $27,837 |
Family Income in Smith County
Family Income Brackets in Smith County
According to the Smith County family income data, there are 205 families falling into the $75,000 to $99,999 income range, which is the most common income bracket and makes up 21.1% of all families. Conversely, the less than $10,000 income bracket is the least frequent group with only 14 families (1.4%) belonging to this category.
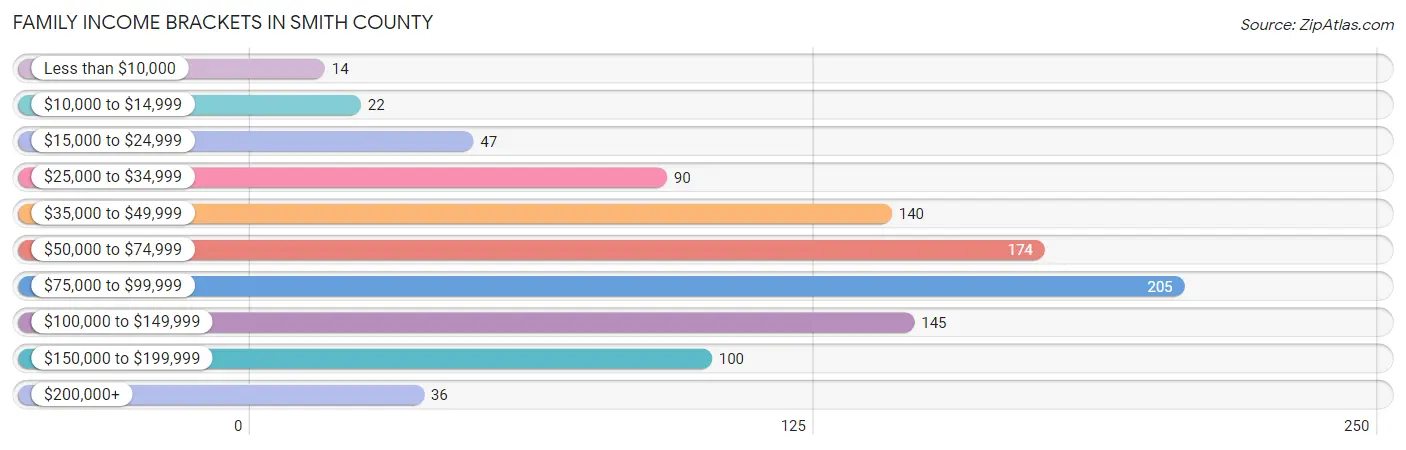
| Income Bracket | # Families | % Families |
| Less than $10,000 | 14 | 1.4% |
| $10,000 to $14,999 | 22 | 2.3% |
| $15,000 to $24,999 | 47 | 4.8% |
| $25,000 to $34,999 | 90 | 9.2% |
| $35,000 to $49,999 | 140 | 14.4% |
| $50,000 to $74,999 | 174 | 17.9% |
| $75,000 to $99,999 | 205 | 21.1% |
| $100,000 to $149,999 | 145 | 14.9% |
| $150,000 to $199,999 | 100 | 10.3% |
| $200,000+ | 36 | 3.7% |
Family Income by Famaliy Size in Smith County
5-person families (85 | 8.7%) account for the highest median family income in Smith County with $114,886 per family, while 2-person families (612 | 62.9%) have the highest median income of $31,458 per family member.
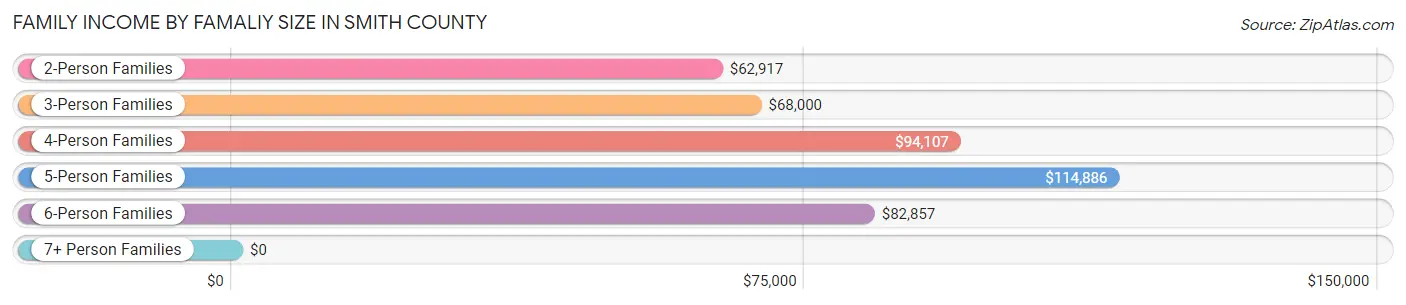
| Income Bracket | # Families | Median Income |
| 2-Person Families | 612 (62.9%) | $62,917 |
| 3-Person Families | 136 (14.0%) | $68,000 |
| 4-Person Families | 106 (10.9%) | $94,107 |
| 5-Person Families | 85 (8.7%) | $114,886 |
| 6-Person Families | 24 (2.5%) | $82,857 |
| 7+ Person Families | 10 (1.0%) | $0 |
| Total | 973 (100.0%) | $74,911 |
Family Income by Number of Earners in Smith County
The median family income in Smith County is $74,911, with families comprising 3+ earners (70) having the highest median family income of $114,318, while families with no earners (181) have the lowest median family income of $39,844, accounting for 7.2% and 18.6% of families, respectively.
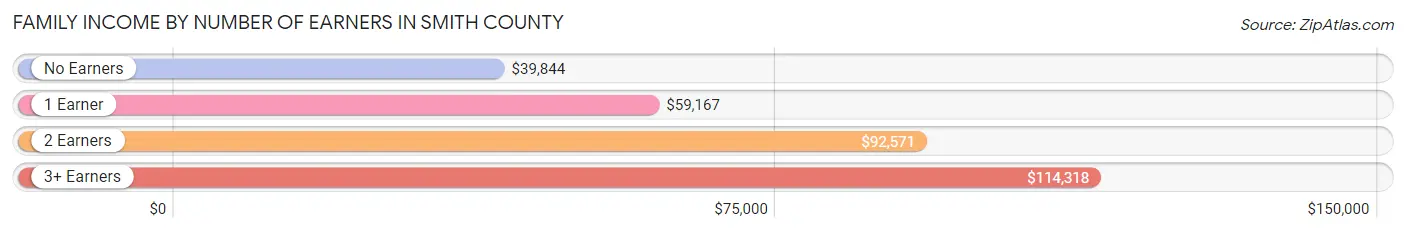
| Number of Earners | # Families | Median Income |
| No Earners | 181 (18.6%) | $39,844 |
| 1 Earner | 274 (28.2%) | $59,167 |
| 2 Earners | 448 (46.0%) | $92,571 |
| 3+ Earners | 70 (7.2%) | $114,318 |
| Total | 973 (100.0%) | $74,911 |
Household Income in Smith County
Household Income Brackets in Smith County
With 282 households falling in the category, the $35,000 to $49,999 income range is the most frequent in Smith County, accounting for 18.1% of all households. In contrast, only 44 households (2.8%) fall into the less than $10,000 income bracket, making it the least populous group.
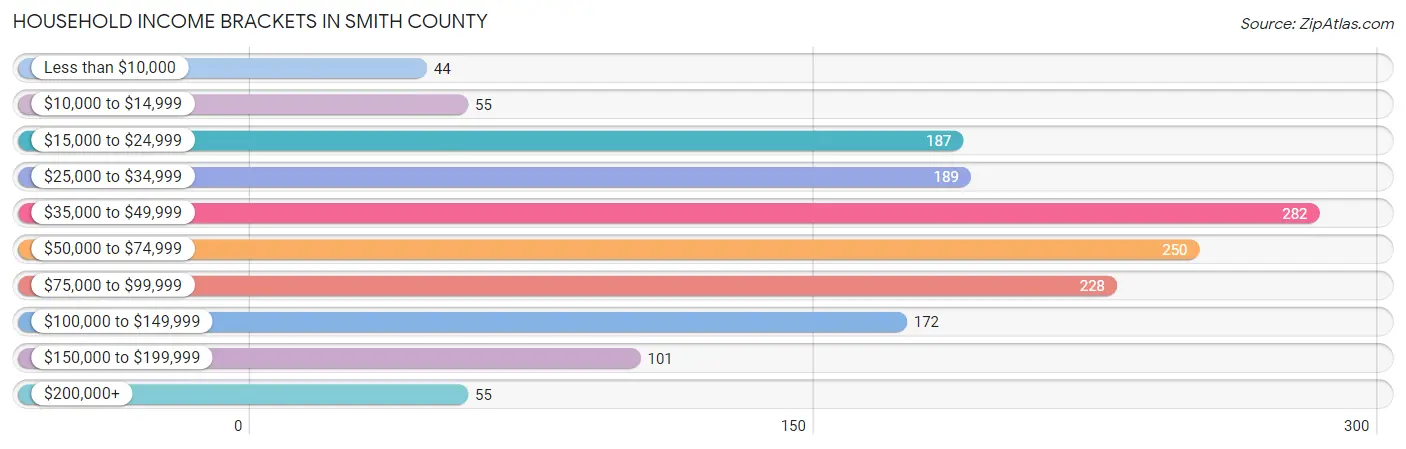
| Income Bracket | # Households | % Households |
| Less than $10,000 | 44 | 2.8% |
| $10,000 to $14,999 | 55 | 3.5% |
| $15,000 to $24,999 | 187 | 12.0% |
| $25,000 to $34,999 | 189 | 12.1% |
| $35,000 to $49,999 | 282 | 18.1% |
| $50,000 to $74,999 | 250 | 16.0% |
| $75,000 to $99,999 | 228 | 14.6% |
| $100,000 to $149,999 | 172 | 11.0% |
| $150,000 to $199,999 | 101 | 6.5% |
| $200,000+ | 55 | 3.5% |
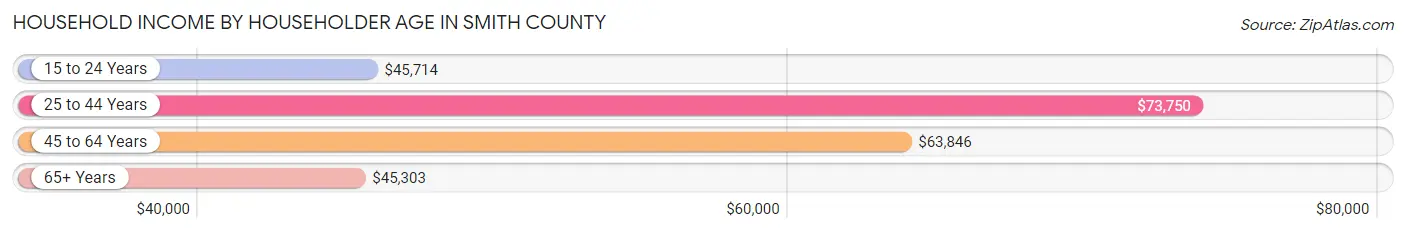
Household Income by Householder Age in Smith County
The median household income in Smith County is $50,943, with the highest median household income of $73,750 found in the 25 to 44 years age bracket for the primary householder. A total of 346 households (22.2%) fall into this category. Meanwhile, the 65+ years age bracket for the primary householder has the lowest median household income of $45,303, with 652 households (41.8%) in this group.
| Income Bracket | # Households | Median Income |
| 15 to 24 Years | 40 (2.6%) | $45,714 |
| 25 to 44 Years | 346 (22.2%) | $73,750 |
| 45 to 64 Years | 522 (33.5%) | $63,846 |
| 65+ Years | 652 (41.8%) | $45,303 |
| Total | 1,560 (100.0%) | $50,943 |
Poverty in Smith County
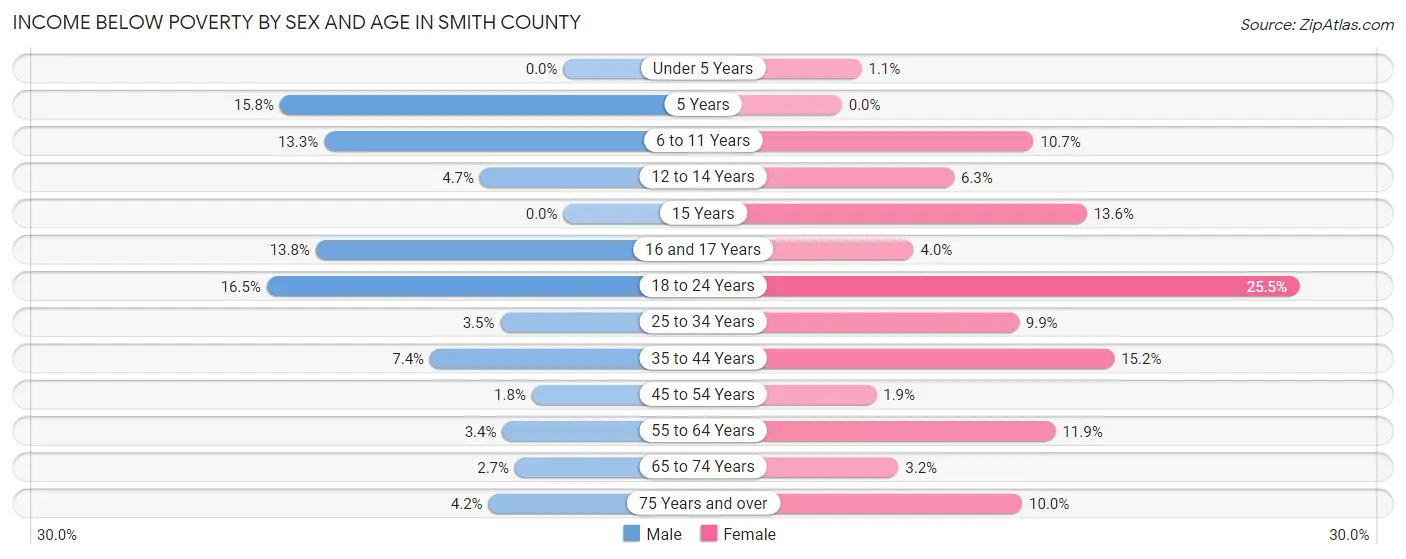
Income Below Poverty by Sex and Age in Smith County
With 5.3% poverty level for males and 9.5% for females among the residents of Smith County, 18 to 24 year old males and 18 to 24 year old females are the most vulnerable to poverty, with 19 males (16.5%) and 28 females (25.5%) in their respective age groups living below the poverty level.
| Age Bracket | Male | Female |
| Under 5 Years | 0 (0.0%) | 1 (1.1%) |
| 5 Years | 3 (15.8%) | 0 (0.0%) |
| 6 to 11 Years | 12 (13.3%) | 11 (10.7%) |
| 12 to 14 Years | 4 (4.6%) | 5 (6.2%) |
| 15 Years | 0 (0.0%) | 3 (13.6%) |
| 16 and 17 Years | 8 (13.8%) | 1 (4.0%) |
| 18 to 24 Years | 19 (16.5%) | 28 (25.5%) |
| 25 to 34 Years | 6 (3.5%) | 14 (9.9%) |
| 35 to 44 Years | 15 (7.4%) | 27 (15.2%) |
| 45 to 54 Years | 3 (1.8%) | 3 (1.9%) |
| 55 to 64 Years | 10 (3.4%) | 35 (11.9%) |
| 65 to 74 Years | 8 (2.7%) | 8 (3.2%) |
| 75 Years and over | 8 (4.2%) | 24 (10.0%) |
| Total | 96 (5.3%) | 160 (9.5%) |
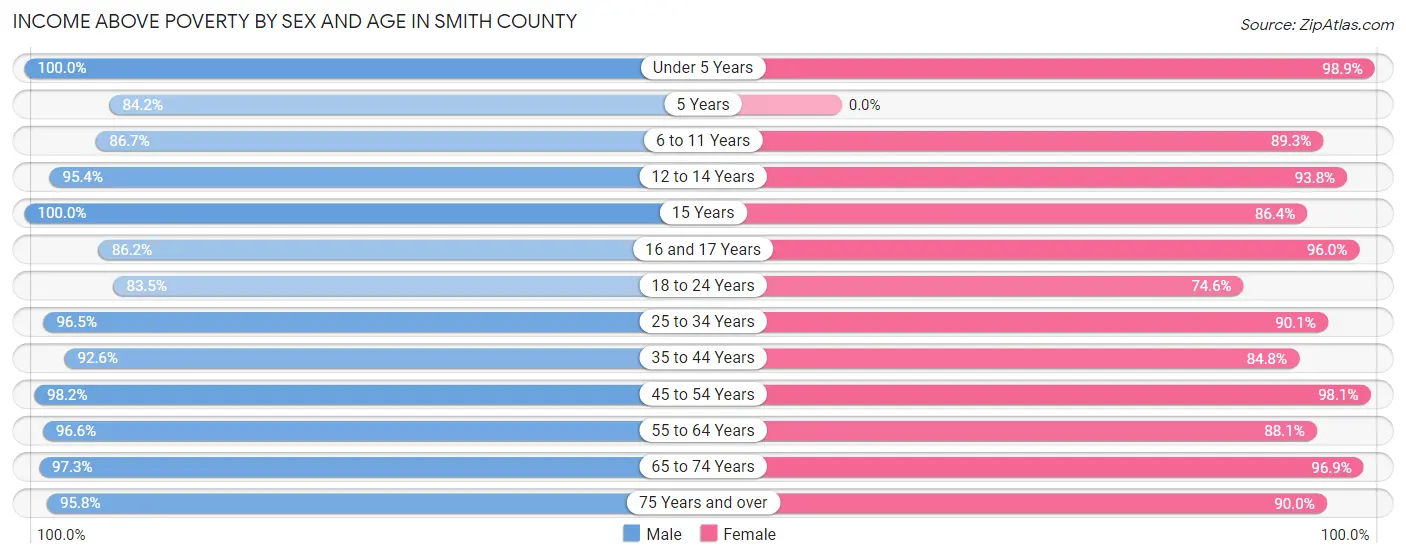
Income Above Poverty by Sex and Age in Smith County
According to the poverty statistics in Smith County, males aged under 5 years and females aged under 5 years are the age groups that are most secure financially, with 100.0% of males and 98.9% of females in these age groups living above the poverty line.
| Age Bracket | Male | Female |
| Under 5 Years | 85 (100.0%) | 90 (98.9%) |
| 5 Years | 16 (84.2%) | 0 (0.0%) |
| 6 to 11 Years | 78 (86.7%) | 92 (89.3%) |
| 12 to 14 Years | 82 (95.4%) | 75 (93.8%) |
| 15 Years | 24 (100.0%) | 19 (86.4%) |
| 16 and 17 Years | 50 (86.2%) | 24 (96.0%) |
| 18 to 24 Years | 96 (83.5%) | 82 (74.6%) |
| 25 to 34 Years | 165 (96.5%) | 128 (90.1%) |
| 35 to 44 Years | 187 (92.6%) | 151 (84.8%) |
| 45 to 54 Years | 167 (98.2%) | 153 (98.1%) |
| 55 to 64 Years | 284 (96.6%) | 259 (88.1%) |
| 65 to 74 Years | 288 (97.3%) | 246 (96.9%) |
| 75 Years and over | 184 (95.8%) | 215 (90.0%) |
| Total | 1,706 (94.7%) | 1,534 (90.5%) |
Income Below Poverty Among Married-Couple Families in Smith County
The poverty statistics for married-couple families in Smith County show that 1.7% or 14 of the total 825 families live below the poverty line. Families with 3 or 4 children have the highest poverty rate of 4.1%, comprising of 3 families. On the other hand, families with 1 or 2 children have the lowest poverty rate of 0.0%, which includes 0 families.

| Children | Above Poverty | Below Poverty |
| No Children | 539 (98.0%) | 11 (2.0%) |
| 1 or 2 Children | 199 (100.0%) | 0 (0.0%) |
| 3 or 4 Children | 70 (95.9%) | 3 (4.1%) |
| 5 or more Children | 3 (100.0%) | 0 (0.0%) |
| Total | 811 (98.3%) | 14 (1.7%) |
Income Below Poverty Among Single-Parent Households in Smith County

| Children | Single Father | Single Mother |
| No Children | 0 (0.0%) | 7 (20.6%) |
| 1 or 2 Children | 0 (0.0%) | 16 (48.5%) |
| 3 or 4 Children | 0 (0.0%) | 0 (0.0%) |
| 5 or more Children | 0 (0.0%) | 3 (100.0%) |
| Total | 0 (0.0%) | 26 (36.1%) |
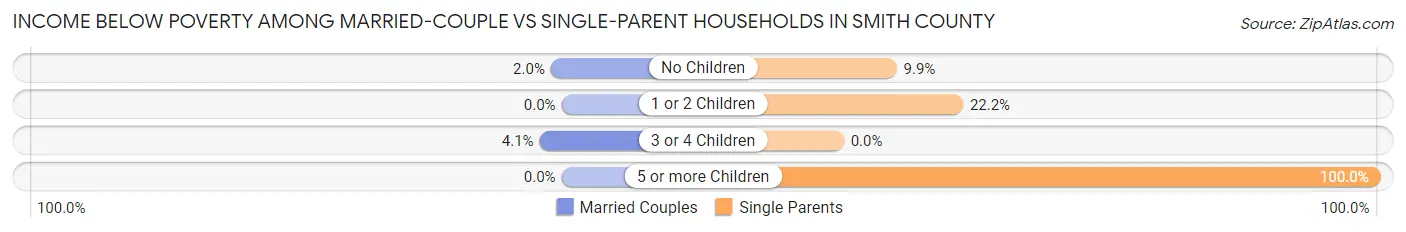
Income Below Poverty Among Married-Couple vs Single-Parent Households in Smith County
The poverty data for Smith County shows that 14 of the married-couple family households (1.7%) and 26 of the single-parent households (17.6%) are living below the poverty level. Within the married-couple family households, those with 3 or 4 children have the highest poverty rate, with 3 households (4.1%) falling below the poverty line. Among the single-parent households, those with 5 or more children have the highest poverty rate, with 3 household (100.0%) living below poverty.
| Children | Married-Couple Families | Single-Parent Households |
| No Children | 11 (2.0%) | 7 (9.9%) |
| 1 or 2 Children | 0 (0.0%) | 16 (22.2%) |
| 3 or 4 Children | 3 (4.1%) | 0 (0.0%) |
| 5 or more Children | 0 (0.0%) | 3 (100.0%) |
| Total | 14 (1.7%) | 26 (17.6%) |
Employment Characteristics in Smith County
Employment by Class of Employer in Smith County
Among the 1,693 employed individuals in Smith County, private company employees (984 | 58.1%), local government employees (201 | 11.9%), and not-for-profit organizations (200 | 11.8%) make up the most common classes of employment.
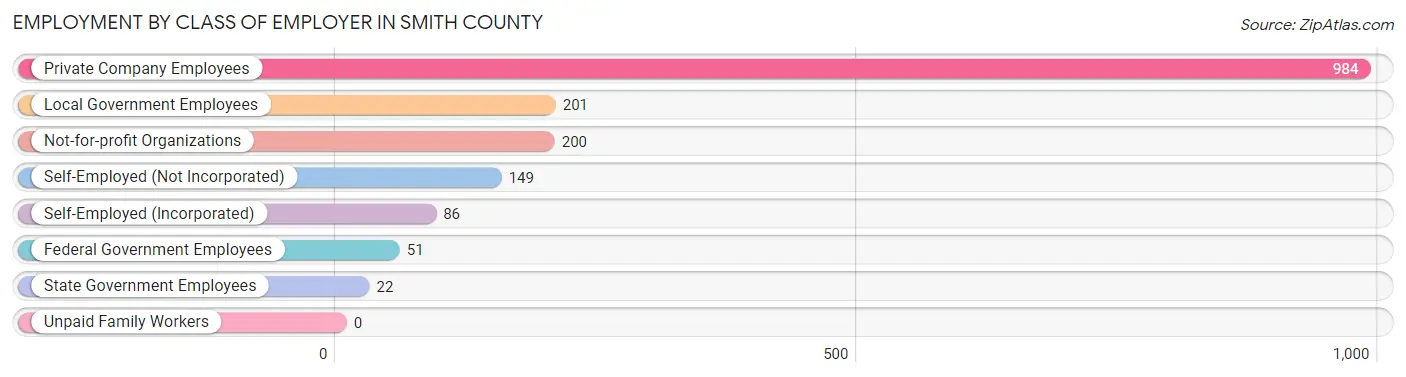
| Employer Class | # Employees | % Employees |
| Private Company Employees | 984 | 58.1% |
| Self-Employed (Incorporated) | 86 | 5.1% |
| Self-Employed (Not Incorporated) | 149 | 8.8% |
| Not-for-profit Organizations | 200 | 11.8% |
| Local Government Employees | 201 | 11.9% |
| State Government Employees | 22 | 1.3% |
| Federal Government Employees | 51 | 3.0% |
| Unpaid Family Workers | 0 | 0.0% |
| Total | 1,693 | 100.0% |
Employment Status by Age in Smith County
According to the labor force statistics for Smith County, out of the total population over 16 years of age (2,949), 60.1% or 1,772 individuals are in the labor force, with 2.1% or 37 of them unemployed. The age group with the highest labor force participation rate is 45 to 54 years, with 95.7% or 312 individuals in the labor force. Within the labor force, the 20 to 24 years age range has the highest percentage of unemployed individuals, with 5.7% or 6 of them being unemployed.
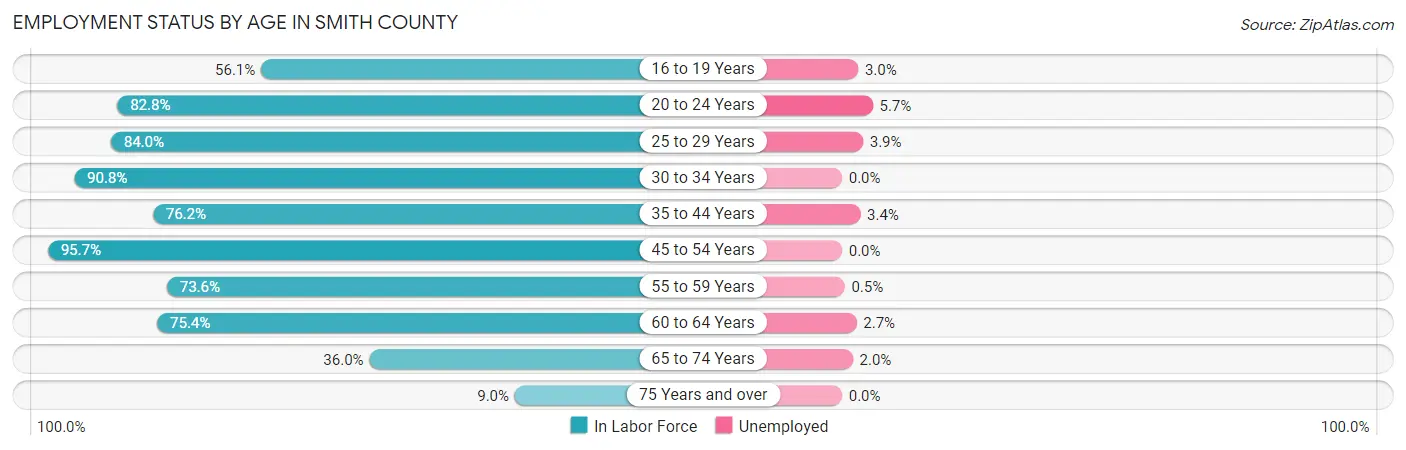
| Age Bracket | In Labor Force | Unemployed |
| 16 to 19 Years | 101 (56.1%) | 3 (3.0%) |
| 20 to 24 Years | 106 (82.8%) | 6 (5.7%) |
| 25 to 29 Years | 152 (84.0%) | 6 (3.9%) |
| 30 to 34 Years | 129 (90.8%) | 0 (0.0%) |
| 35 to 44 Years | 291 (76.2%) | 10 (3.4%) |
| 45 to 54 Years | 312 (95.7%) | 0 (0.0%) |
| 55 to 59 Years | 184 (73.6%) | 1 (0.5%) |
| 60 to 64 Years | 257 (75.4%) | 7 (2.7%) |
| 65 to 74 Years | 198 (36.0%) | 4 (2.0%) |
| 75 Years and over | 42 (9.0%) | 0 (0.0%) |
| Total | 1,772 (60.1%) | 37 (2.1%) |
Employment Status by Educational Attainment in Smith County
According to labor force statistics for Smith County, 81.7% of individuals (1,325) out of the total population between 25 and 64 years of age (1,622) are in the labor force, with 1.8% or 24 of them being unemployed. The group with the highest labor force participation rate are those with the educational attainment of college / associate degree, with 91.9% or 536 individuals in the labor force. Within the labor force, individuals with high school diploma education have the highest percentage of unemployment, with 2.5% or 9 of them being unemployed.
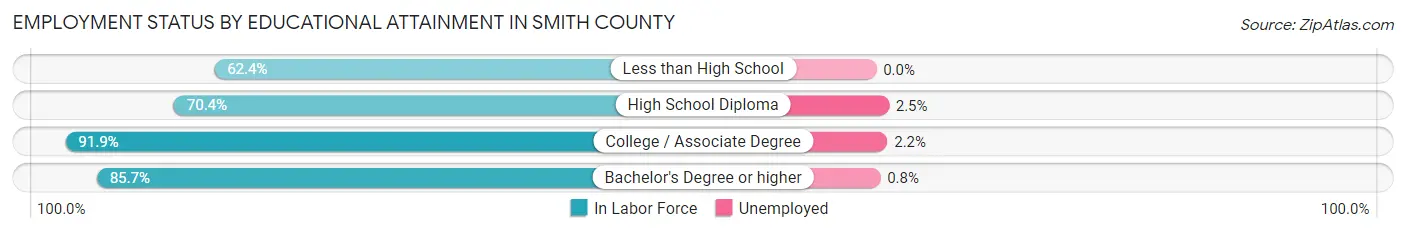
| Educational Attainment | In Labor Force | Unemployed |
| Less than High School | 58 (62.4%) | 0 (0.0%) |
| High School Diploma | 366 (70.4%) | 13 (2.5%) |
| College / Associate Degree | 536 (91.9%) | 13 (2.2%) |
| Bachelor's Degree or higher | 365 (85.7%) | 3 (0.8%) |
| Total | 1,325 (81.7%) | 29 (1.8%) |
Employment Occupations by Sex in Smith County
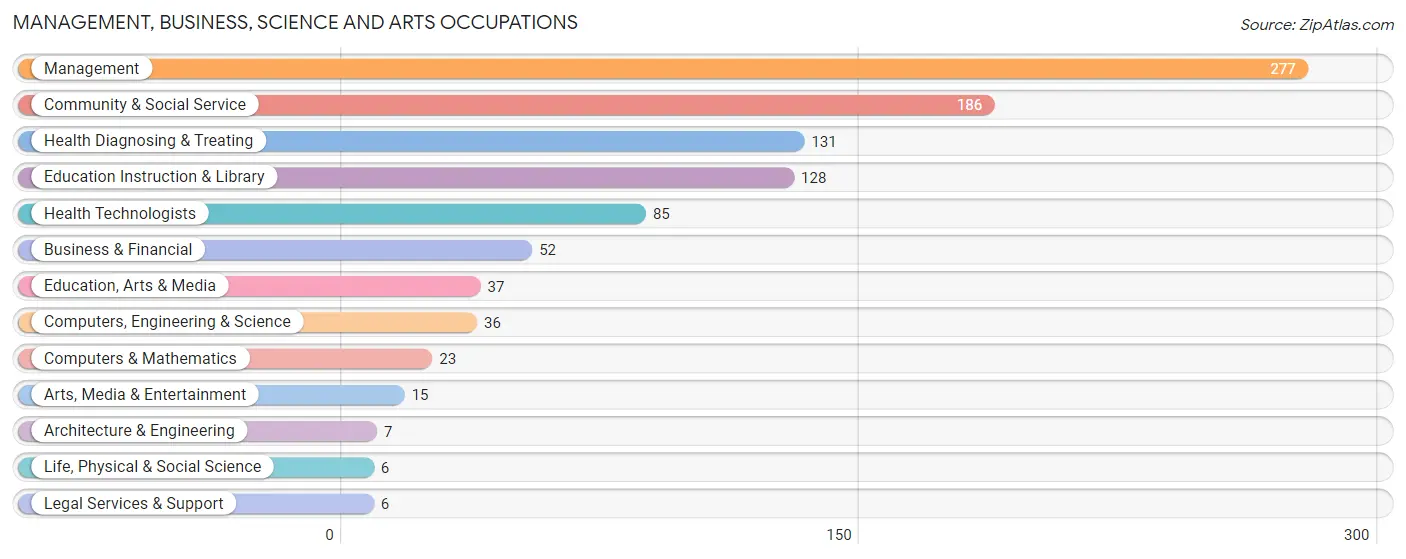
Management, Business, Science and Arts Occupations
The most common Management, Business, Science and Arts occupations in Smith County are Management (277 | 16.0%), Community & Social Service (186 | 10.7%), Health Diagnosing & Treating (131 | 7.5%), Education Instruction & Library (128 | 7.4%), and Health Technologists (85 | 4.9%).
Management, Business, Science and Arts Occupations by Sex
Within the Management, Business, Science and Arts occupations in Smith County, the most male-oriented occupations are Architecture & Engineering (100.0%), Computers, Engineering & Science (91.7%), and Computers & Mathematics (91.3%), while the most female-oriented occupations are Legal Services & Support (100.0%), Business & Financial (84.6%), and Education Instruction & Library (83.6%).
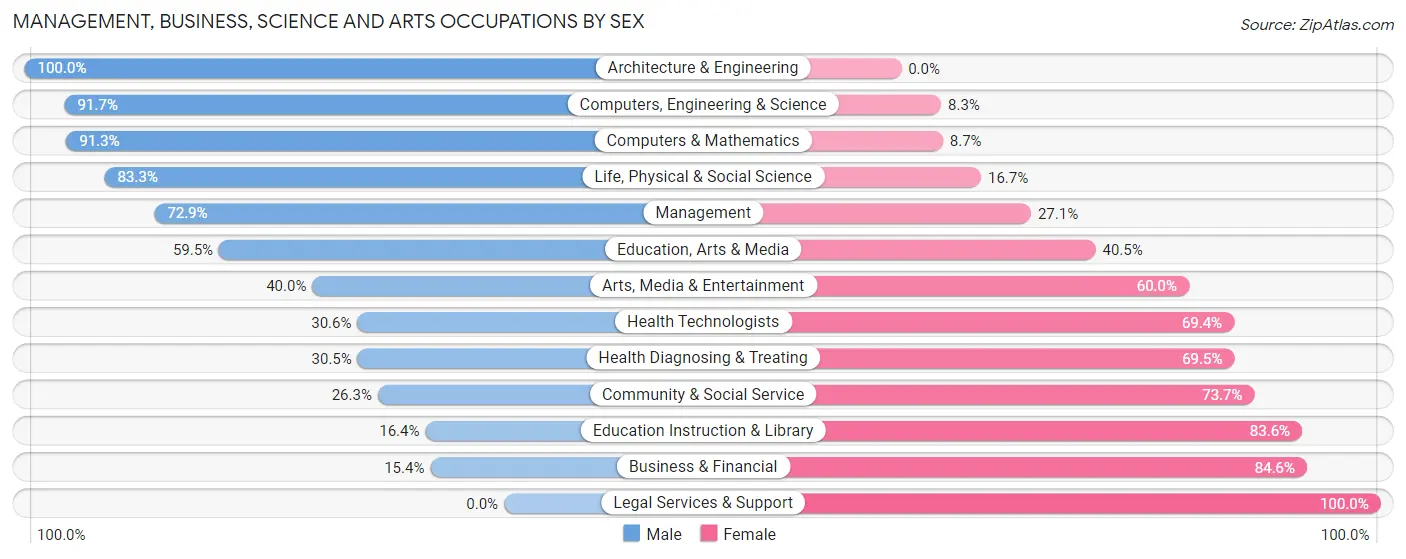
| Occupation | Male | Female |
| Management | 202 (72.9%) | 75 (27.1%) |
| Business & Financial | 8 (15.4%) | 44 (84.6%) |
| Computers, Engineering & Science | 33 (91.7%) | 3 (8.3%) |
| Computers & Mathematics | 21 (91.3%) | 2 (8.7%) |
| Architecture & Engineering | 7 (100.0%) | 0 (0.0%) |
| Life, Physical & Social Science | 5 (83.3%) | 1 (16.7%) |
| Community & Social Service | 49 (26.3%) | 137 (73.7%) |
| Education, Arts & Media | 22 (59.5%) | 15 (40.5%) |
| Legal Services & Support | 0 (0.0%) | 6 (100.0%) |
| Education Instruction & Library | 21 (16.4%) | 107 (83.6%) |
| Arts, Media & Entertainment | 6 (40.0%) | 9 (60.0%) |
| Health Diagnosing & Treating | 40 (30.5%) | 91 (69.5%) |
| Health Technologists | 26 (30.6%) | 59 (69.4%) |
| Total (Category) | 332 (48.7%) | 350 (51.3%) |
| Total (Overall) | 957 (55.2%) | 778 (44.8%) |
Services Occupations
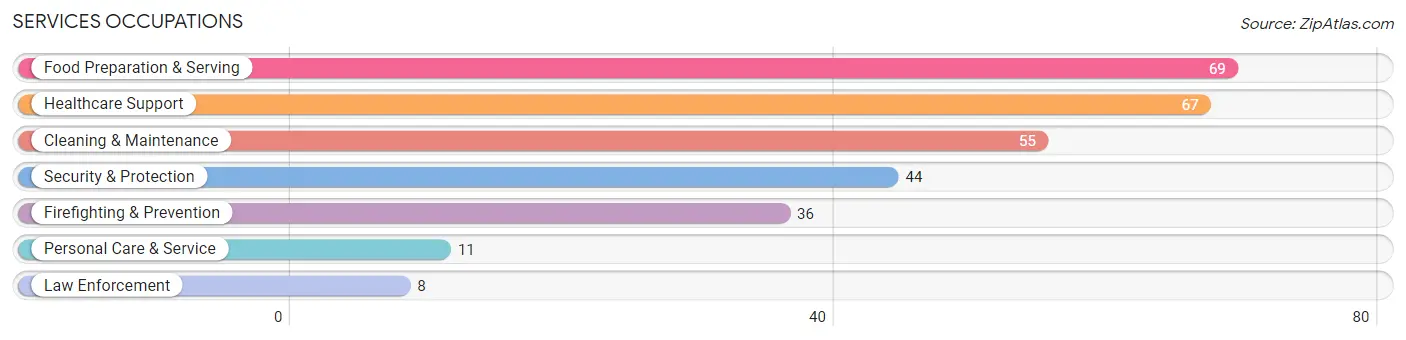
The most common Services occupations in Smith County are Food Preparation & Serving (69 | 4.0%), Healthcare Support (67 | 3.9%), Cleaning & Maintenance (55 | 3.2%), Security & Protection (44 | 2.5%), and Firefighting & Prevention (36 | 2.1%).
Services Occupations by Sex
Within the Services occupations in Smith County, the most male-oriented occupations are Law Enforcement (100.0%), Security & Protection (72.7%), and Firefighting & Prevention (66.7%), while the most female-oriented occupations are Personal Care & Service (100.0%), Healthcare Support (88.1%), and Food Preparation & Serving (75.4%).
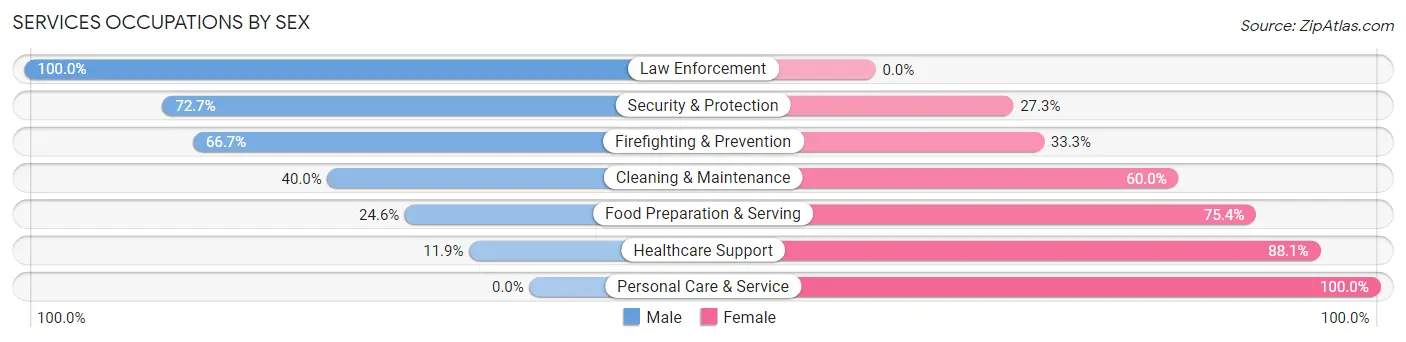
| Occupation | Male | Female |
| Healthcare Support | 8 (11.9%) | 59 (88.1%) |
| Security & Protection | 32 (72.7%) | 12 (27.3%) |
| Firefighting & Prevention | 24 (66.7%) | 12 (33.3%) |
| Law Enforcement | 8 (100.0%) | 0 (0.0%) |
| Food Preparation & Serving | 17 (24.6%) | 52 (75.4%) |
| Cleaning & Maintenance | 22 (40.0%) | 33 (60.0%) |
| Personal Care & Service | 0 (0.0%) | 11 (100.0%) |
| Total (Category) | 79 (32.1%) | 167 (67.9%) |
| Total (Overall) | 957 (55.2%) | 778 (44.8%) |
Sales and Office Occupations
The most common Sales and Office occupations in Smith County are Office & Administration (198 | 11.4%), and Sales & Related (161 | 9.3%).

Sales and Office Occupations by Sex
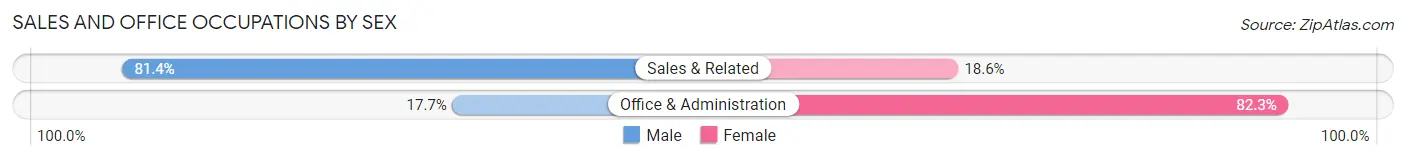
| Occupation | Male | Female |
| Sales & Related | 131 (81.4%) | 30 (18.6%) |
| Office & Administration | 35 (17.7%) | 163 (82.3%) |
| Total (Category) | 166 (46.2%) | 193 (53.8%) |
| Total (Overall) | 957 (55.2%) | 778 (44.8%) |
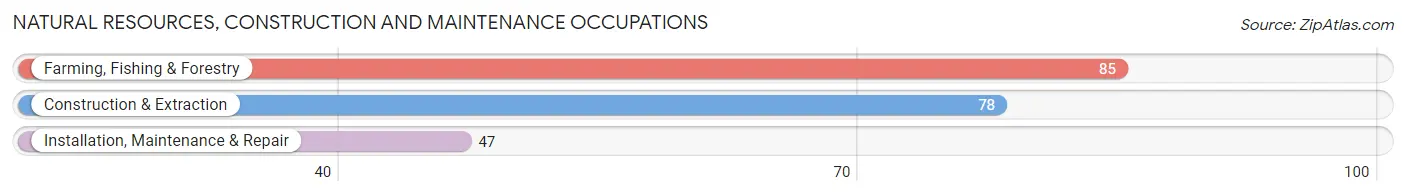
Natural Resources, Construction and Maintenance Occupations
The most common Natural Resources, Construction and Maintenance occupations in Smith County are Farming, Fishing & Forestry (85 | 4.9%), Construction & Extraction (78 | 4.5%), and Installation, Maintenance & Repair (47 | 2.7%).
Natural Resources, Construction and Maintenance Occupations by Sex
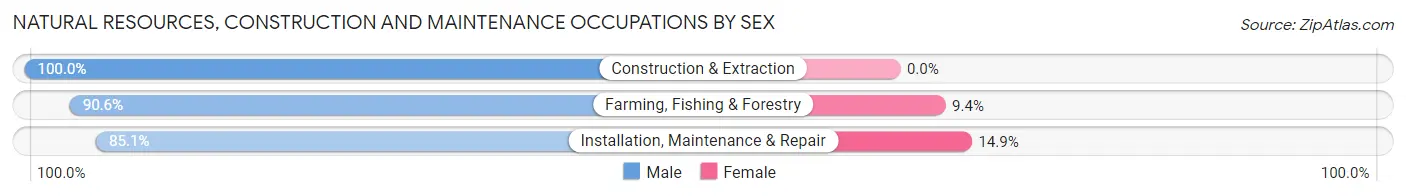
| Occupation | Male | Female |
| Farming, Fishing & Forestry | 77 (90.6%) | 8 (9.4%) |
| Construction & Extraction | 78 (100.0%) | 0 (0.0%) |
| Installation, Maintenance & Repair | 40 (85.1%) | 7 (14.9%) |
| Total (Category) | 195 (92.9%) | 15 (7.1%) |
| Total (Overall) | 957 (55.2%) | 778 (44.8%) |
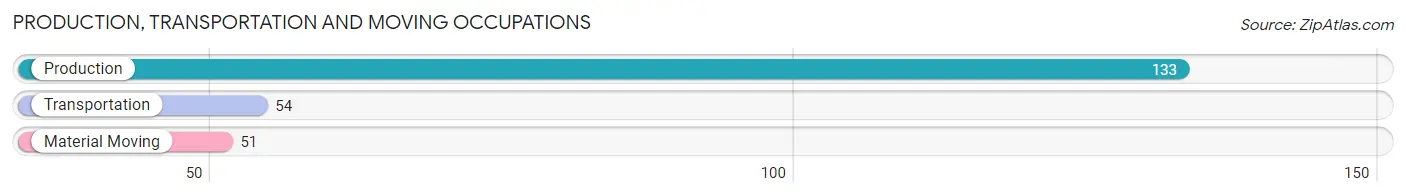
Production, Transportation and Moving Occupations
The most common Production, Transportation and Moving occupations in Smith County are Production (133 | 7.7%), Transportation (54 | 3.1%), and Material Moving (51 | 2.9%).
Production, Transportation and Moving Occupations by Sex
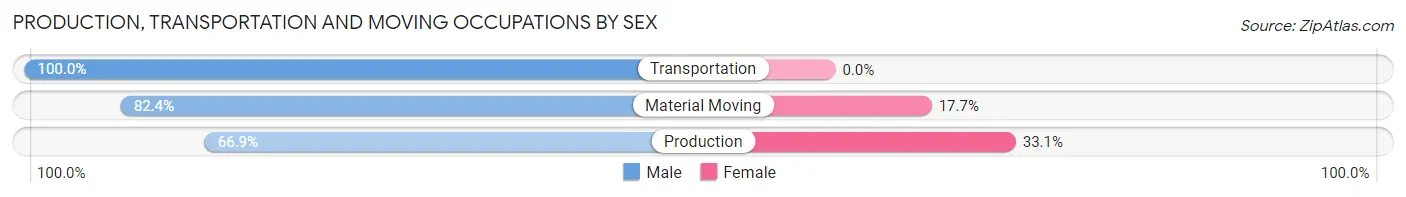
| Occupation | Male | Female |
| Production | 89 (66.9%) | 44 (33.1%) |
| Transportation | 54 (100.0%) | 0 (0.0%) |
| Material Moving | 42 (82.4%) | 9 (17.6%) |
| Total (Category) | 185 (77.7%) | 53 (22.3%) |
| Total (Overall) | 957 (55.2%) | 778 (44.8%) |
Employment Industries by Sex in Smith County
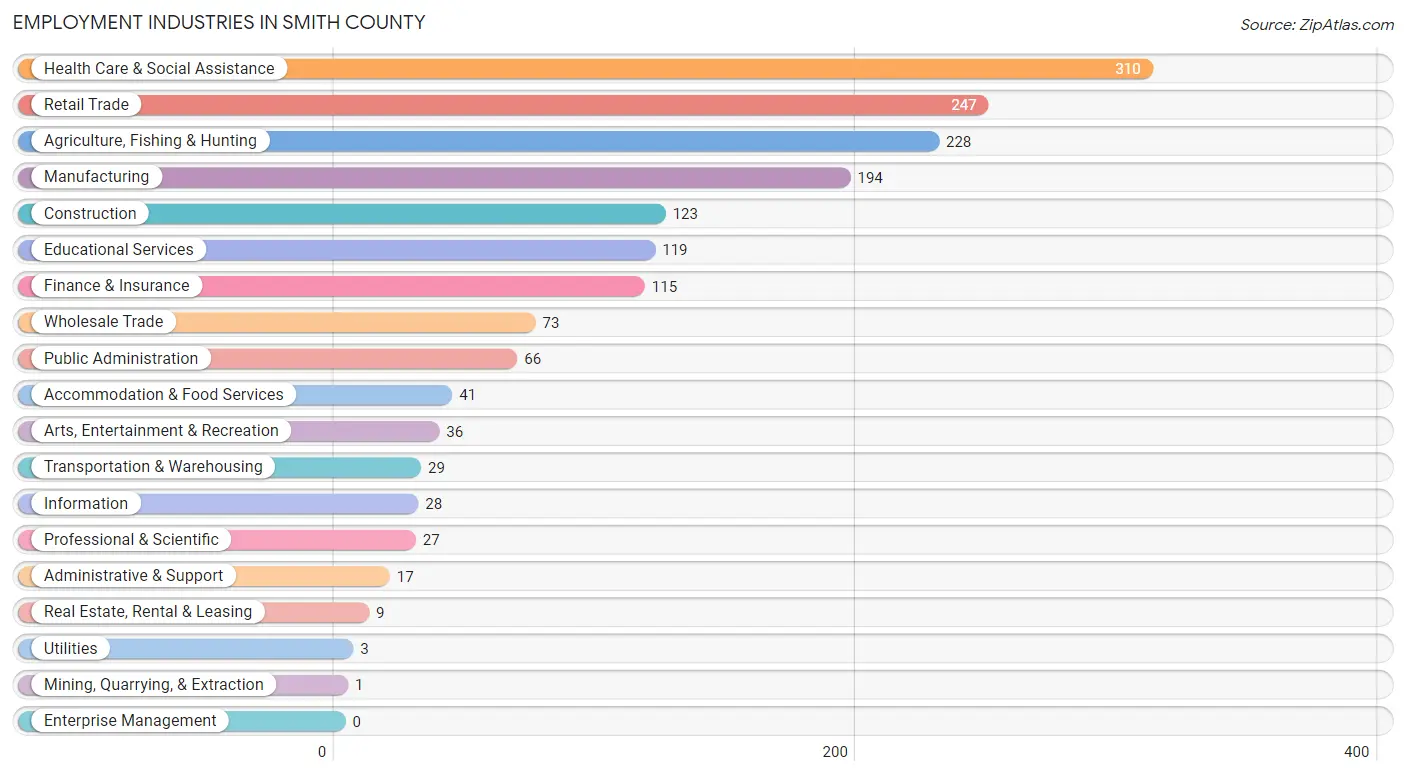
Employment Industries in Smith County
The major employment industries in Smith County include Health Care & Social Assistance (310 | 17.9%), Retail Trade (247 | 14.2%), Agriculture, Fishing & Hunting (228 | 13.1%), Manufacturing (194 | 11.2%), and Construction (123 | 7.1%).
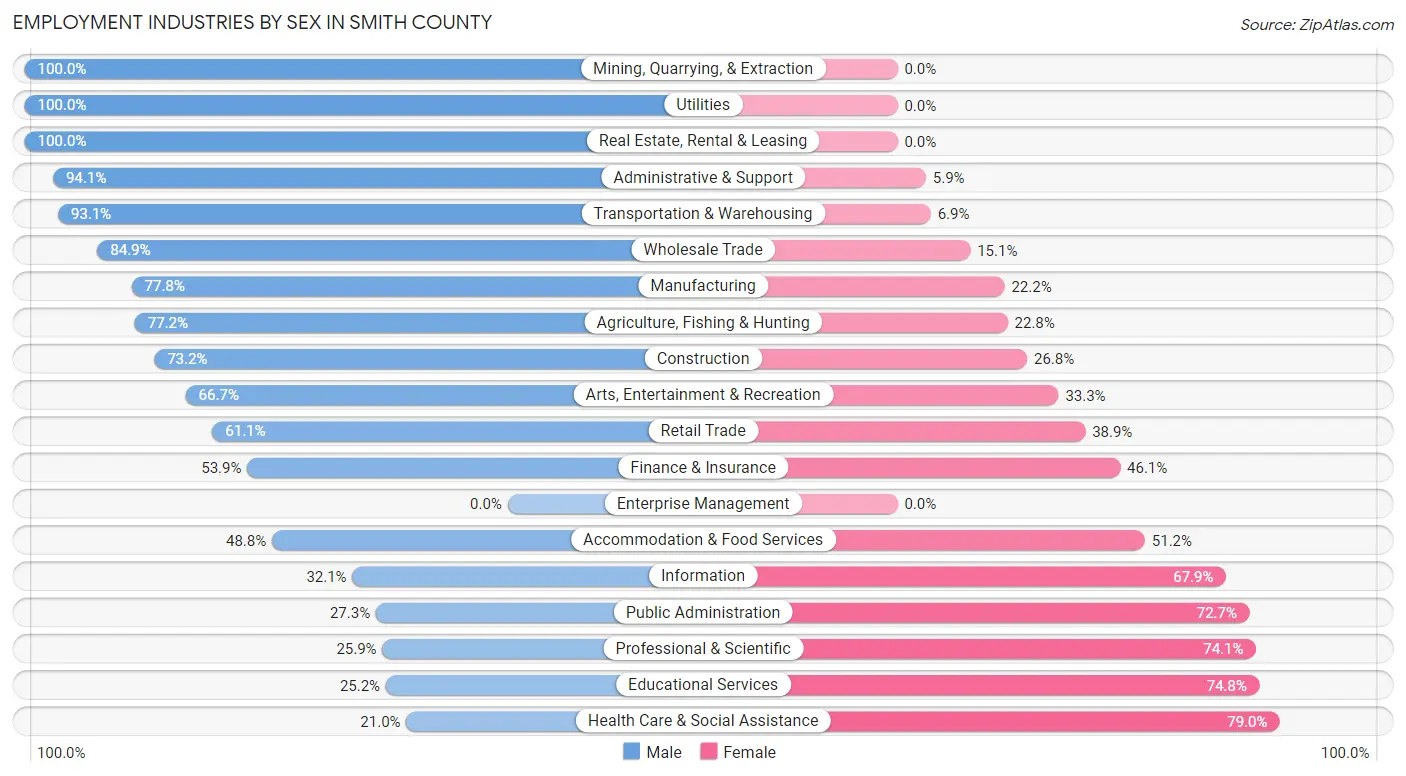
Employment Industries by Sex in Smith County
The Smith County industries that see more men than women are Mining, Quarrying, & Extraction (100.0%), Utilities (100.0%), and Real Estate, Rental & Leasing (100.0%), whereas the industries that tend to have a higher number of women are Health Care & Social Assistance (79.0%), Educational Services (74.8%), and Professional & Scientific (74.1%).
| Industry | Male | Female |
| Agriculture, Fishing & Hunting | 176 (77.2%) | 52 (22.8%) |
| Mining, Quarrying, & Extraction | 1 (100.0%) | 0 (0.0%) |
| Construction | 90 (73.2%) | 33 (26.8%) |
| Manufacturing | 151 (77.8%) | 43 (22.2%) |
| Wholesale Trade | 62 (84.9%) | 11 (15.1%) |
| Retail Trade | 151 (61.1%) | 96 (38.9%) |
| Transportation & Warehousing | 27 (93.1%) | 2 (6.9%) |
| Utilities | 3 (100.0%) | 0 (0.0%) |
| Information | 9 (32.1%) | 19 (67.9%) |
| Finance & Insurance | 62 (53.9%) | 53 (46.1%) |
| Real Estate, Rental & Leasing | 9 (100.0%) | 0 (0.0%) |
| Professional & Scientific | 7 (25.9%) | 20 (74.1%) |
| Enterprise Management | 0 (0.0%) | 0 (0.0%) |
| Administrative & Support | 16 (94.1%) | 1 (5.9%) |
| Educational Services | 30 (25.2%) | 89 (74.8%) |
| Health Care & Social Assistance | 65 (21.0%) | 245 (79.0%) |
| Arts, Entertainment & Recreation | 24 (66.7%) | 12 (33.3%) |
| Accommodation & Food Services | 20 (48.8%) | 21 (51.2%) |
| Public Administration | 18 (27.3%) | 48 (72.7%) |
| Total | 957 (55.2%) | 778 (44.8%) |
Education in Smith County
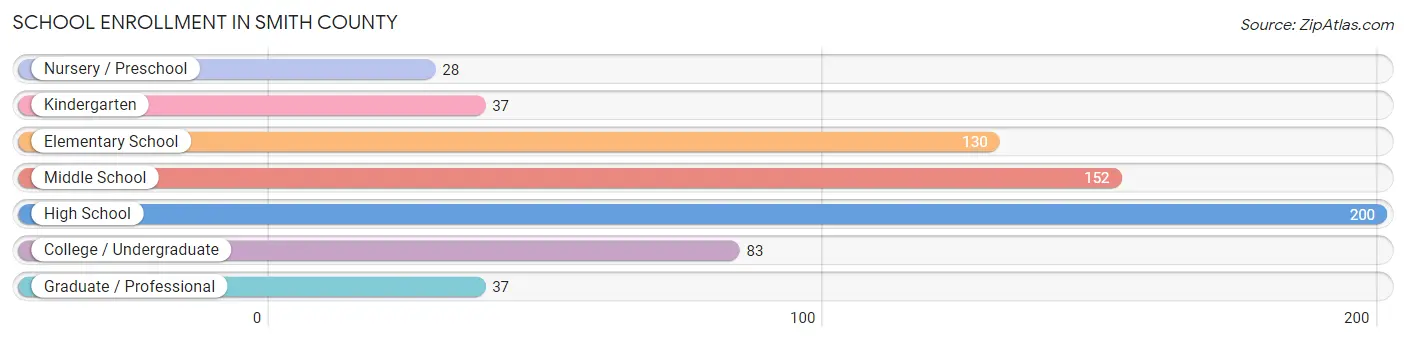
School Enrollment in Smith County
The most common levels of schooling among the 667 students in Smith County are high school (200 | 30.0%), middle school (152 | 22.8%), and elementary school (130 | 19.5%).
| School Level | # Students | % Students |
| Nursery / Preschool | 28 | 4.2% |
| Kindergarten | 37 | 5.6% |
| Elementary School | 130 | 19.5% |
| Middle School | 152 | 22.8% |
| High School | 200 | 30.0% |
| College / Undergraduate | 83 | 12.4% |
| Graduate / Professional | 37 | 5.6% |
| Total | 667 | 100.0% |
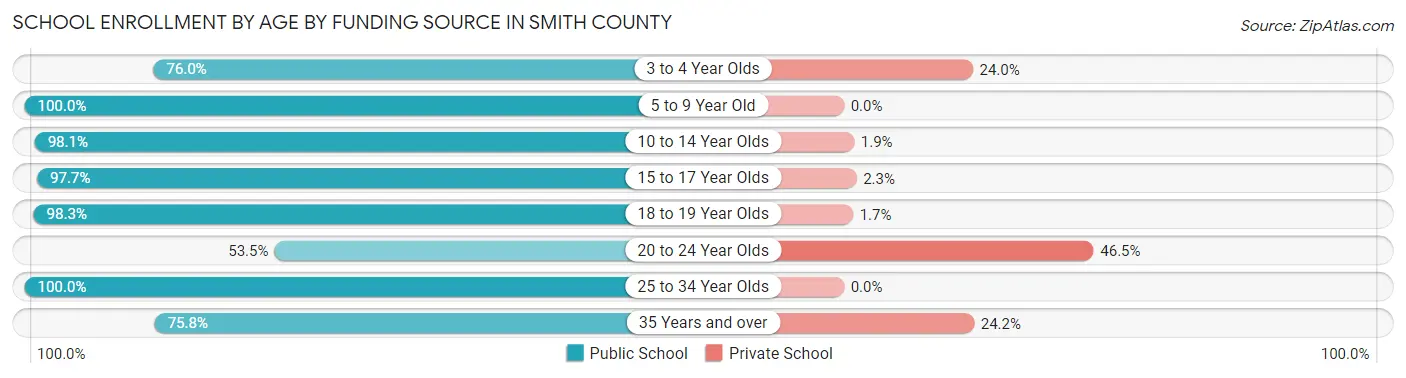
School Enrollment by Age by Funding Source in Smith County
Out of a total of 667 students who are enrolled in schools in Smith County, 42 (6.3%) attend a private institution, while the remaining 625 (93.7%) are enrolled in public schools. The age group of 20 to 24 year olds has the highest likelihood of being enrolled in private schools, with 20 (46.5% in the age bracket) enrolled. Conversely, the age group of 5 to 9 year old has the lowest likelihood of being enrolled in a private school, with 145 (100.0% in the age bracket) attending a public institution.
| Age Bracket | Public School | Private School |
| 3 to 4 Year Olds | 19 (76.0%) | 6 (24.0%) |
| 5 to 9 Year Old | 145 (100.0%) | 0 (0.0%) |
| 10 to 14 Year Olds | 208 (98.1%) | 4 (1.9%) |
| 15 to 17 Year Olds | 126 (97.7%) | 3 (2.3%) |
| 18 to 19 Year Olds | 58 (98.3%) | 1 (1.7%) |
| 20 to 24 Year Olds | 23 (53.5%) | 20 (46.5%) |
| 25 to 34 Year Olds | 21 (100.0%) | 0 (0.0%) |
| 35 Years and over | 25 (75.8%) | 8 (24.2%) |
| Total | 625 (93.7%) | 42 (6.3%) |
Educational Attainment by Field of Study in Smith County
Education (157 | 23.3%), business (110 | 16.3%), bio, nature & agricultural (105 | 15.6%), science & technology (76 | 11.3%), and arts & humanities (54 | 8.0%) are the most common fields of study among 674 individuals in Smith County who have obtained a bachelor's degree or higher.
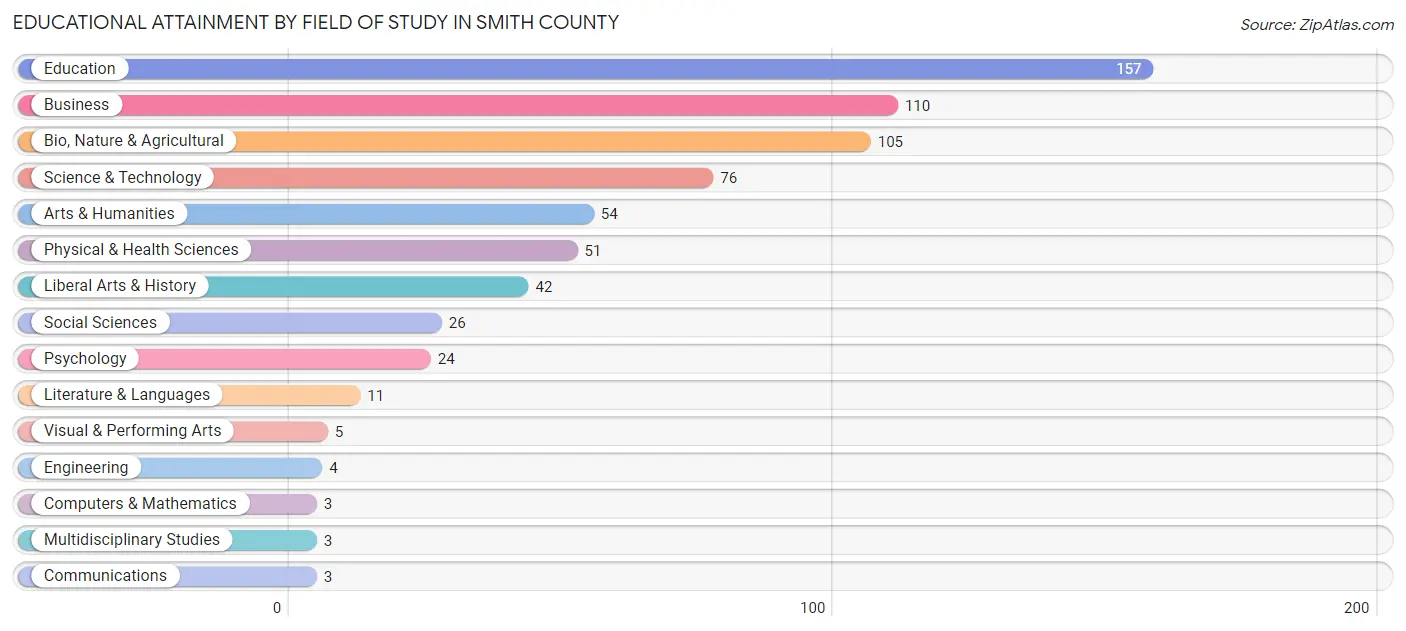
| Field of Study | # Graduates | % Graduates |
| Computers & Mathematics | 3 | 0.4% |
| Bio, Nature & Agricultural | 105 | 15.6% |
| Physical & Health Sciences | 51 | 7.6% |
| Psychology | 24 | 3.6% |
| Social Sciences | 26 | 3.9% |
| Engineering | 4 | 0.6% |
| Multidisciplinary Studies | 3 | 0.4% |
| Science & Technology | 76 | 11.3% |
| Business | 110 | 16.3% |
| Education | 157 | 23.3% |
| Literature & Languages | 11 | 1.6% |
| Liberal Arts & History | 42 | 6.2% |
| Visual & Performing Arts | 5 | 0.7% |
| Communications | 3 | 0.4% |
| Arts & Humanities | 54 | 8.0% |
| Total | 674 | 100.0% |
Transportation & Commute in Smith County
Vehicle Availability by Sex in Smith County
The most prevalent vehicle ownership categories in Smith County are males with 2 vehicles (359, accounting for 38.1%) and females with 2 vehicles (290, making up 48.1%).
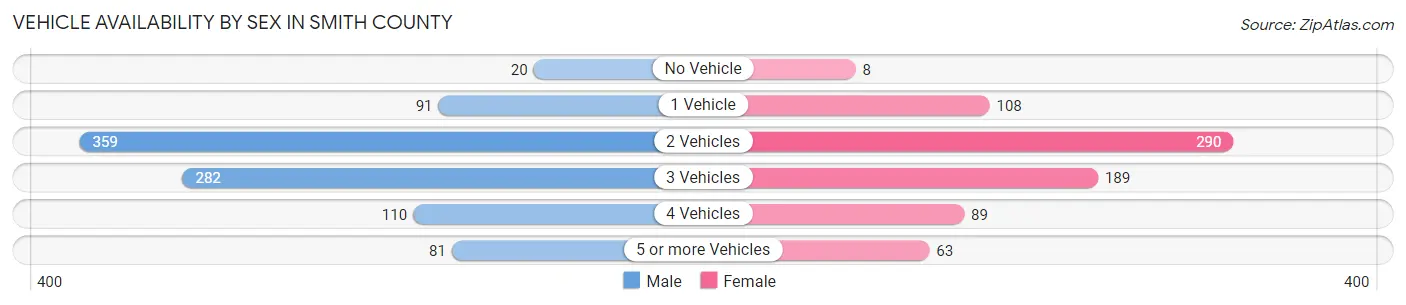
| Vehicles Available | Male | Female |
| No Vehicle | 20 (2.1%) | 8 (1.1%) |
| 1 Vehicle | 91 (9.7%) | 108 (14.5%) |
| 2 Vehicles | 359 (38.1%) | 290 (38.8%) |
| 3 Vehicles | 282 (29.9%) | 189 (25.3%) |
| 4 Vehicles | 110 (11.7%) | 89 (11.9%) |
| 5 or more Vehicles | 81 (8.6%) | 63 (8.4%) |
| Total | 943 (100.0%) | 747 (100.0%) |
Commute Time in Smith County
The most frequently occuring commute durations in Smith County are less than 5 minutes (504 commuters, 31.2%), 5 to 9 minutes (384 commuters, 23.8%), and 15 to 19 minutes (194 commuters, 12.0%).
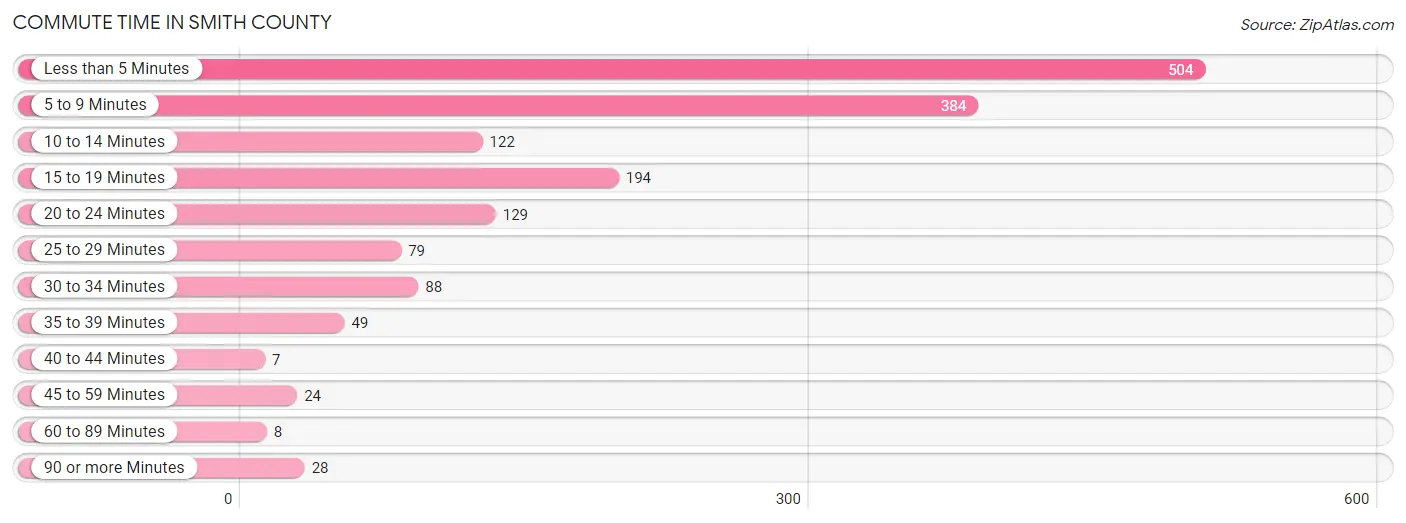
| Commute Time | # Commuters | % Commuters |
| Less than 5 Minutes | 504 | 31.2% |
| 5 to 9 Minutes | 384 | 23.8% |
| 10 to 14 Minutes | 122 | 7.5% |
| 15 to 19 Minutes | 194 | 12.0% |
| 20 to 24 Minutes | 129 | 8.0% |
| 25 to 29 Minutes | 79 | 4.9% |
| 30 to 34 Minutes | 88 | 5.4% |
| 35 to 39 Minutes | 49 | 3.0% |
| 40 to 44 Minutes | 7 | 0.4% |
| 45 to 59 Minutes | 24 | 1.5% |
| 60 to 89 Minutes | 8 | 0.5% |
| 90 or more Minutes | 28 | 1.7% |
Commute Time by Sex in Smith County
The most common commute times in Smith County are less than 5 minutes (318 commuters, 35.5%) for males and less than 5 minutes (186 commuters, 25.8%) for females.
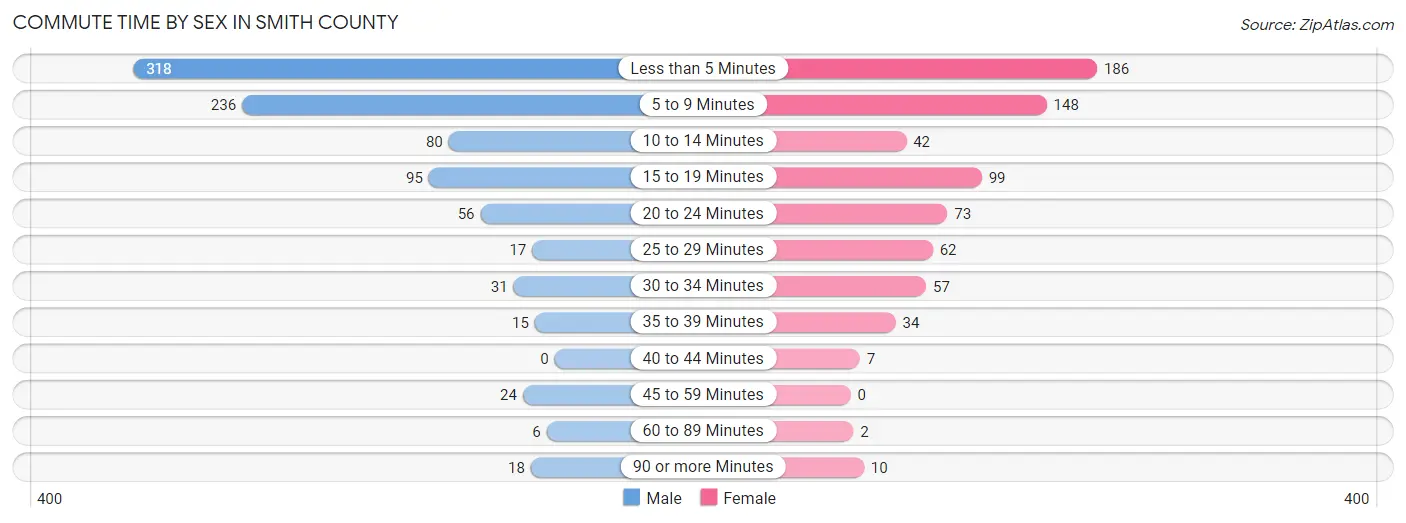
| Commute Time | Male | Female |
| Less than 5 Minutes | 318 (35.5%) | 186 (25.8%) |
| 5 to 9 Minutes | 236 (26.3%) | 148 (20.6%) |
| 10 to 14 Minutes | 80 (8.9%) | 42 (5.8%) |
| 15 to 19 Minutes | 95 (10.6%) | 99 (13.8%) |
| 20 to 24 Minutes | 56 (6.2%) | 73 (10.1%) |
| 25 to 29 Minutes | 17 (1.9%) | 62 (8.6%) |
| 30 to 34 Minutes | 31 (3.5%) | 57 (7.9%) |
| 35 to 39 Minutes | 15 (1.7%) | 34 (4.7%) |
| 40 to 44 Minutes | 0 (0.0%) | 7 (1.0%) |
| 45 to 59 Minutes | 24 (2.7%) | 0 (0.0%) |
| 60 to 89 Minutes | 6 (0.7%) | 2 (0.3%) |
| 90 or more Minutes | 18 (2.0%) | 10 (1.4%) |
Time of Departure to Work by Sex in Smith County
The most frequent times of departure to work in Smith County are 7:30 AM to 7:59 AM (281, 31.4%) for males and 7:30 AM to 7:59 AM (192, 26.7%) for females.
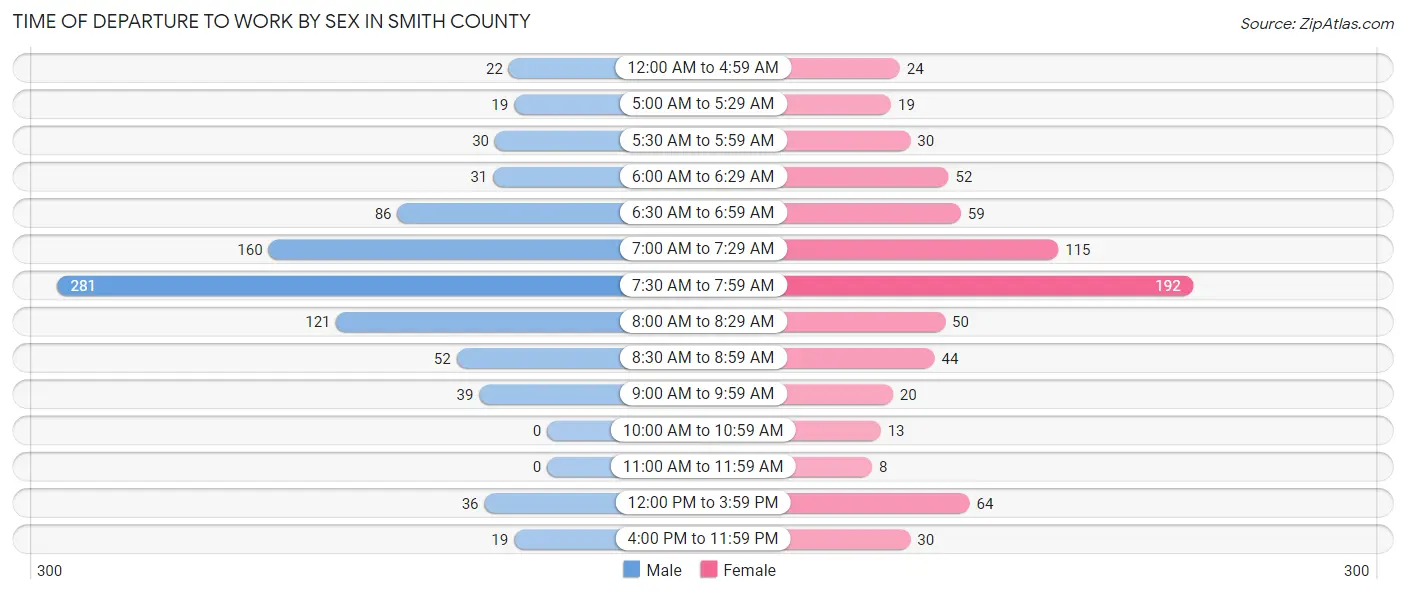
| Time of Departure | Male | Female |
| 12:00 AM to 4:59 AM | 22 (2.5%) | 24 (3.3%) |
| 5:00 AM to 5:29 AM | 19 (2.1%) | 19 (2.6%) |
| 5:30 AM to 5:59 AM | 30 (3.4%) | 30 (4.2%) |
| 6:00 AM to 6:29 AM | 31 (3.5%) | 52 (7.2%) |
| 6:30 AM to 6:59 AM | 86 (9.6%) | 59 (8.2%) |
| 7:00 AM to 7:29 AM | 160 (17.9%) | 115 (16.0%) |
| 7:30 AM to 7:59 AM | 281 (31.4%) | 192 (26.7%) |
| 8:00 AM to 8:29 AM | 121 (13.5%) | 50 (6.9%) |
| 8:30 AM to 8:59 AM | 52 (5.8%) | 44 (6.1%) |
| 9:00 AM to 9:59 AM | 39 (4.3%) | 20 (2.8%) |
| 10:00 AM to 10:59 AM | 0 (0.0%) | 13 (1.8%) |
| 11:00 AM to 11:59 AM | 0 (0.0%) | 8 (1.1%) |
| 12:00 PM to 3:59 PM | 36 (4.0%) | 64 (8.9%) |
| 4:00 PM to 11:59 PM | 19 (2.1%) | 30 (4.2%) |
| Total | 896 (100.0%) | 720 (100.0%) |
Housing Occupancy in Smith County
Occupancy by Ownership in Smith County
Of the total 1,560 dwellings in Smith County, owner-occupied units account for 1,309 (83.9%), while renter-occupied units make up 251 (16.1%).
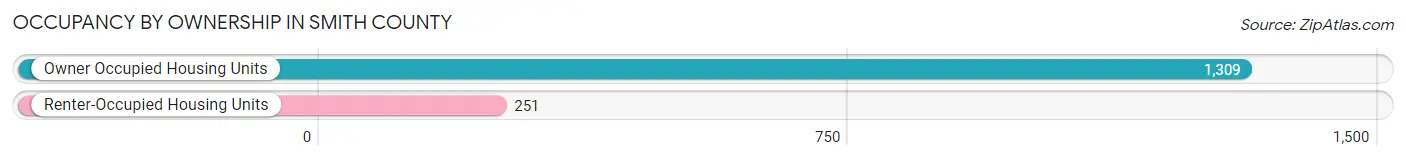
| Occupancy | # Housing Units | % Housing Units |
| Owner Occupied Housing Units | 1,309 | 83.9% |
| Renter-Occupied Housing Units | 251 | 16.1% |
| Total Occupied Housing Units | 1,560 | 100.0% |
Occupancy by Household Size in Smith County
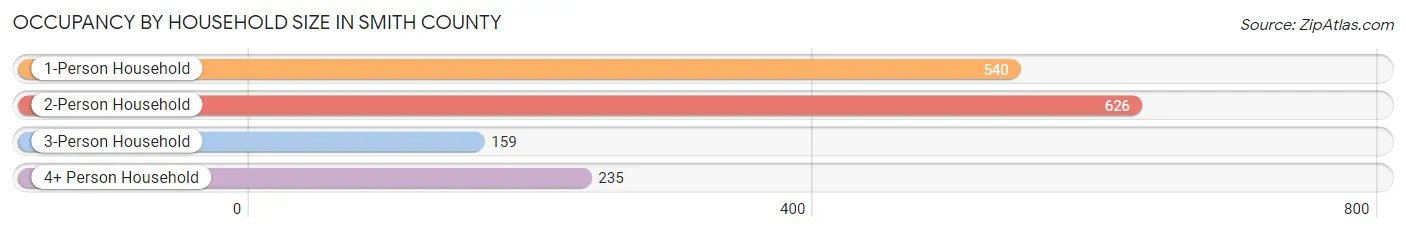
| Household Size | # Housing Units | % Housing Units |
| 1-Person Household | 540 | 34.6% |
| 2-Person Household | 626 | 40.1% |
| 3-Person Household | 159 | 10.2% |
| 4+ Person Household | 235 | 15.1% |
| Total Housing Units | 1,560 | 100.0% |
Occupancy by Ownership by Household Size in Smith County

| Household Size | Owner-occupied | Renter-occupied |
| 1-Person Household | 443 (82.0%) | 97 (18.0%) |
| 2-Person Household | 526 (84.0%) | 100 (16.0%) |
| 3-Person Household | 139 (87.4%) | 20 (12.6%) |
| 4+ Person Household | 201 (85.5%) | 34 (14.5%) |
| Total Housing Units | 1,309 (83.9%) | 251 (16.1%) |
Occupancy by Educational Attainment in Smith County
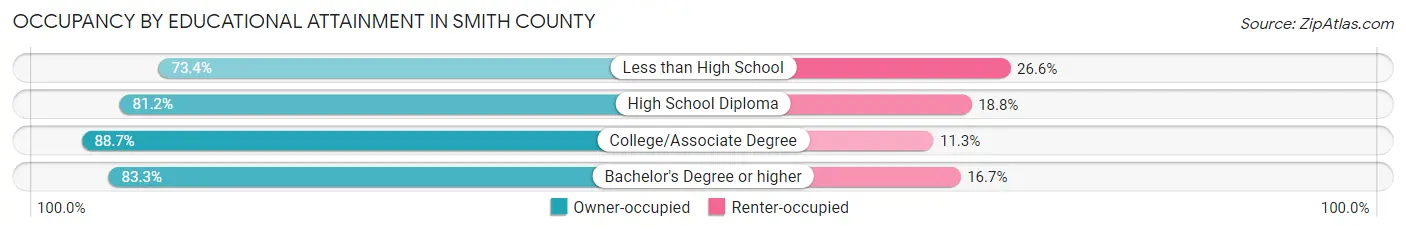
| Household Size | Owner-occupied | Renter-occupied |
| Less than High School | 47 (73.4%) | 17 (26.6%) |
| High School Diploma | 461 (81.2%) | 107 (18.8%) |
| College/Associate Degree | 456 (88.7%) | 58 (11.3%) |
| Bachelor's Degree or higher | 345 (83.3%) | 69 (16.7%) |
Occupancy by Age of Householder in Smith County
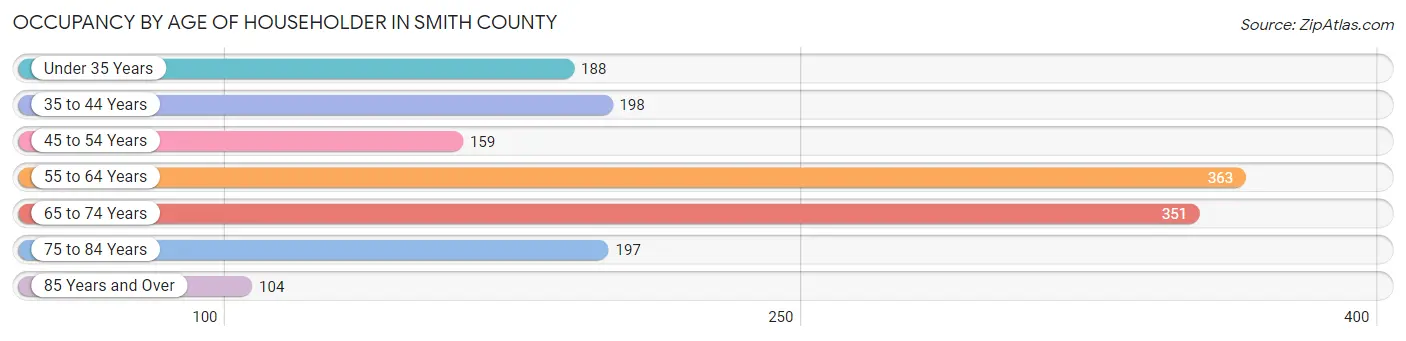
| Age Bracket | # Households | % Households |
| Under 35 Years | 188 | 12.0% |
| 35 to 44 Years | 198 | 12.7% |
| 45 to 54 Years | 159 | 10.2% |
| 55 to 64 Years | 363 | 23.3% |
| 65 to 74 Years | 351 | 22.5% |
| 75 to 84 Years | 197 | 12.6% |
| 85 Years and Over | 104 | 6.7% |
| Total | 1,560 | 100.0% |
Housing Finances in Smith County
Median Income by Occupancy in Smith County

| Occupancy Type | # Households | Median Income |
| Owner-Occupied | 1,309 (83.9%) | $55,799 |
| Renter-Occupied | 251 (16.1%) | $45,742 |
| Average | 1,560 (100.0%) | $50,943 |
Occupancy by Householder Income Bracket in Smith County
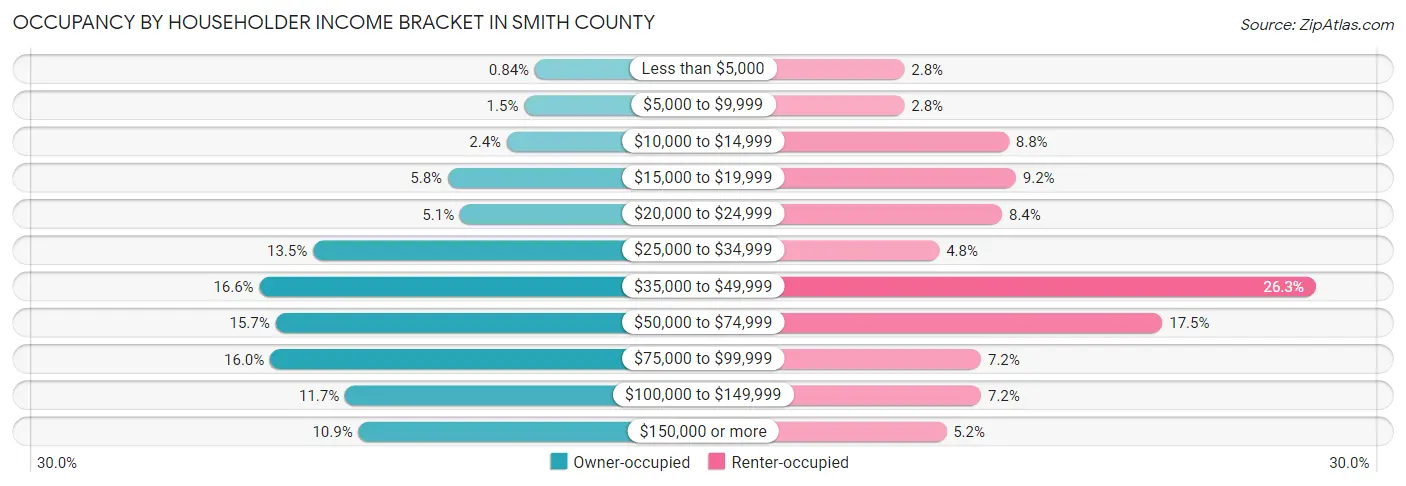
| Income Bracket | Owner-occupied | Renter-occupied |
| Less than $5,000 | 11 (0.8%) | 7 (2.8%) |
| $5,000 to $9,999 | 19 (1.5%) | 7 (2.8%) |
| $10,000 to $14,999 | 32 (2.4%) | 22 (8.8%) |
| $15,000 to $19,999 | 76 (5.8%) | 23 (9.2%) |
| $20,000 to $24,999 | 67 (5.1%) | 21 (8.4%) |
| $25,000 to $34,999 | 177 (13.5%) | 12 (4.8%) |
| $35,000 to $49,999 | 217 (16.6%) | 66 (26.3%) |
| $50,000 to $74,999 | 205 (15.7%) | 44 (17.5%) |
| $75,000 to $99,999 | 209 (16.0%) | 18 (7.2%) |
| $100,000 to $149,999 | 153 (11.7%) | 18 (7.2%) |
| $150,000 or more | 143 (10.9%) | 13 (5.2%) |
| Total | 1,309 (100.0%) | 251 (100.0%) |
Monthly Housing Cost Tiers in Smith County
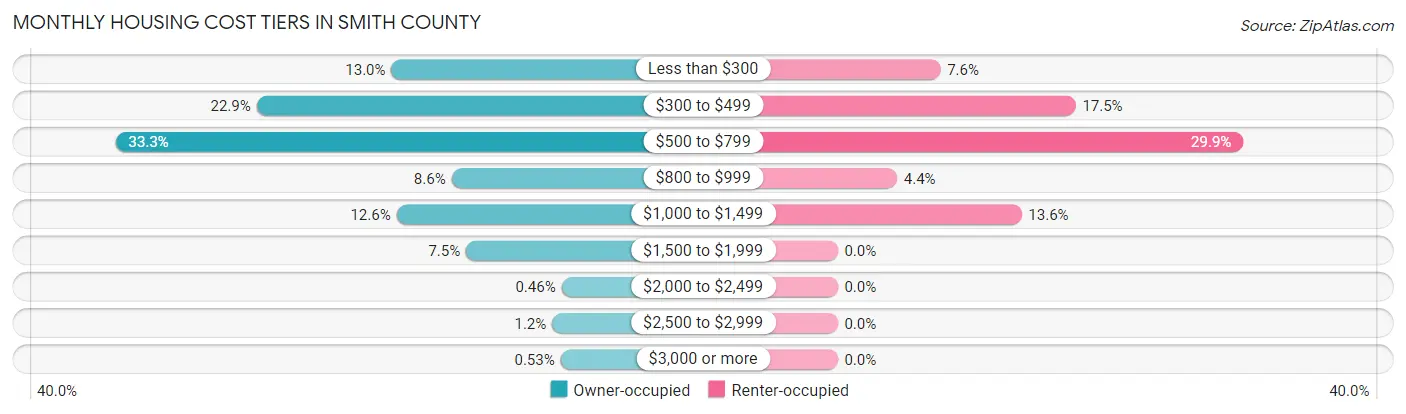
| Monthly Cost | Owner-occupied | Renter-occupied |
| Less than $300 | 170 (13.0%) | 19 (7.6%) |
| $300 to $499 | 300 (22.9%) | 44 (17.5%) |
| $500 to $799 | 436 (33.3%) | 75 (29.9%) |
| $800 to $999 | 112 (8.6%) | 11 (4.4%) |
| $1,000 to $1,499 | 165 (12.6%) | 34 (13.6%) |
| $1,500 to $1,999 | 98 (7.5%) | 0 (0.0%) |
| $2,000 to $2,499 | 6 (0.5%) | 0 (0.0%) |
| $2,500 to $2,999 | 15 (1.1%) | 0 (0.0%) |
| $3,000 or more | 7 (0.5%) | 0 (0.0%) |
| Total | 1,309 (100.0%) | 251 (100.0%) |
Physical Housing Characteristics in Smith County
Housing Structures in Smith County
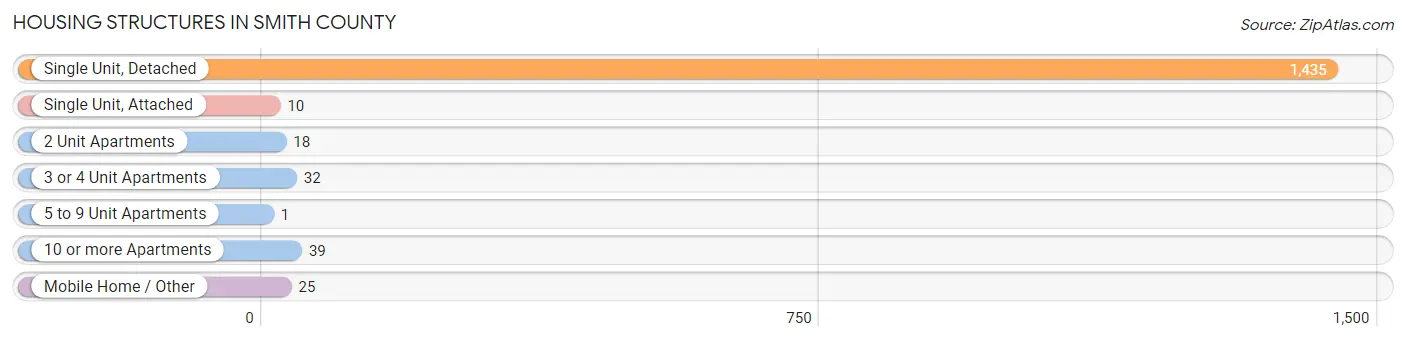
| Structure Type | # Housing Units | % Housing Units |
| Single Unit, Detached | 1,435 | 92.0% |
| Single Unit, Attached | 10 | 0.6% |
| 2 Unit Apartments | 18 | 1.1% |
| 3 or 4 Unit Apartments | 32 | 2.1% |
| 5 to 9 Unit Apartments | 1 | 0.1% |
| 10 or more Apartments | 39 | 2.5% |
| Mobile Home / Other | 25 | 1.6% |
| Total | 1,560 | 100.0% |
Housing Structures by Occupancy in Smith County
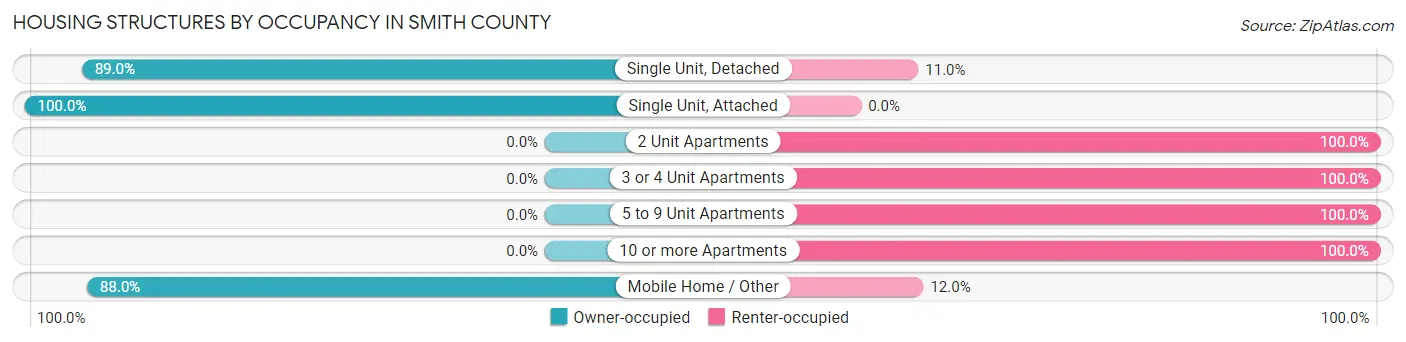
| Structure Type | Owner-occupied | Renter-occupied |
| Single Unit, Detached | 1,277 (89.0%) | 158 (11.0%) |
| Single Unit, Attached | 10 (100.0%) | 0 (0.0%) |
| 2 Unit Apartments | 0 (0.0%) | 18 (100.0%) |
| 3 or 4 Unit Apartments | 0 (0.0%) | 32 (100.0%) |
| 5 to 9 Unit Apartments | 0 (0.0%) | 1 (100.0%) |
| 10 or more Apartments | 0 (0.0%) | 39 (100.0%) |
| Mobile Home / Other | 22 (88.0%) | 3 (12.0%) |
| Total | 1,309 (83.9%) | 251 (16.1%) |
Housing Structures by Number of Rooms in Smith County
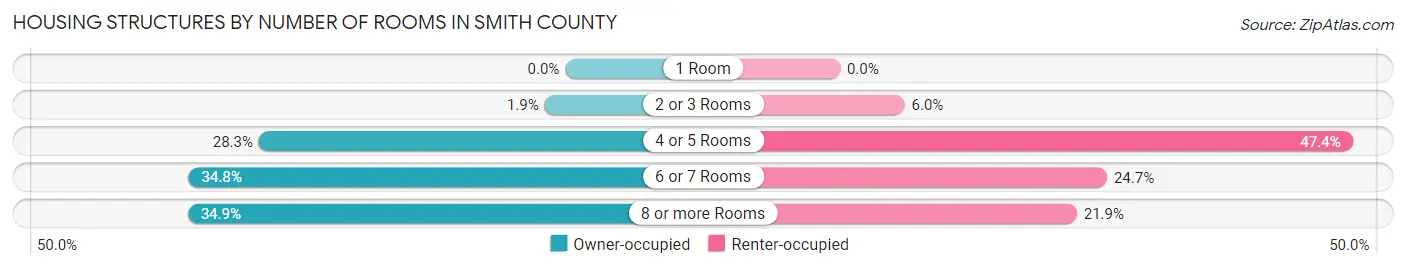
| Number of Rooms | Owner-occupied | Renter-occupied |
| 1 Room | 0 (0.0%) | 0 (0.0%) |
| 2 or 3 Rooms | 25 (1.9%) | 15 (6.0%) |
| 4 or 5 Rooms | 371 (28.3%) | 119 (47.4%) |
| 6 or 7 Rooms | 456 (34.8%) | 62 (24.7%) |
| 8 or more Rooms | 457 (34.9%) | 55 (21.9%) |
| Total | 1,309 (100.0%) | 251 (100.0%) |
Housing Structure by Heating Type in Smith County
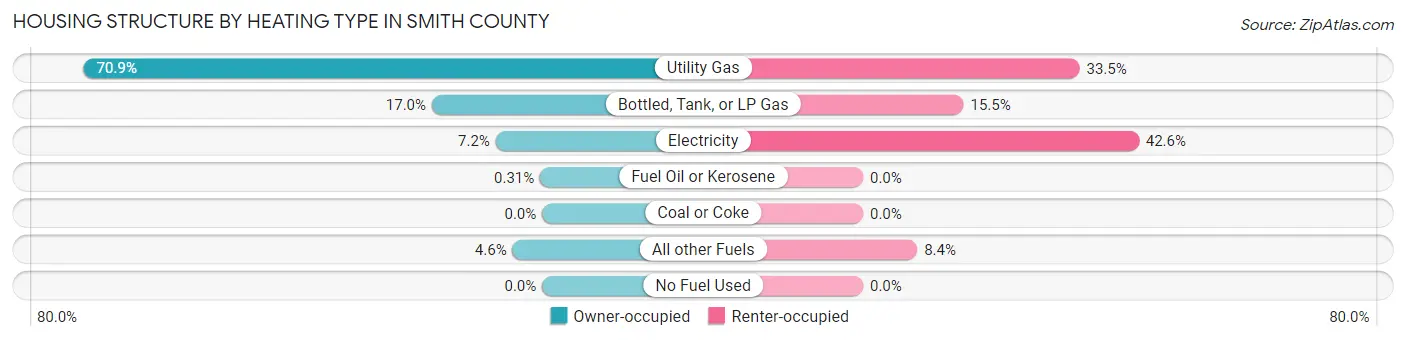
| Heating Type | Owner-occupied | Renter-occupied |
| Utility Gas | 928 (70.9%) | 84 (33.5%) |
| Bottled, Tank, or LP Gas | 223 (17.0%) | 39 (15.5%) |
| Electricity | 94 (7.2%) | 107 (42.6%) |
| Fuel Oil or Kerosene | 4 (0.3%) | 0 (0.0%) |
| Coal or Coke | 0 (0.0%) | 0 (0.0%) |
| All other Fuels | 60 (4.6%) | 21 (8.4%) |
| No Fuel Used | 0 (0.0%) | 0 (0.0%) |
| Total | 1,309 (100.0%) | 251 (100.0%) |
Household Vehicle Usage in Smith County
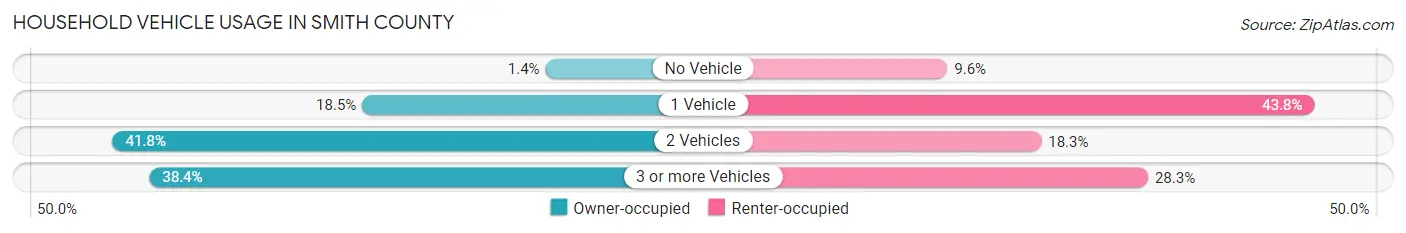
| Vehicles per Household | Owner-occupied | Renter-occupied |
| No Vehicle | 18 (1.4%) | 24 (9.6%) |
| 1 Vehicle | 242 (18.5%) | 110 (43.8%) |
| 2 Vehicles | 547 (41.8%) | 46 (18.3%) |
| 3 or more Vehicles | 502 (38.4%) | 71 (28.3%) |
| Total | 1,309 (100.0%) | 251 (100.0%) |
Real Estate & Mortgages in Smith County
Real Estate and Mortgage Overview in Smith County
| Characteristic | Without Mortgage | With Mortgage |
| Housing Units | 845 | 464 |
| Median Property Value | $63,300 | $98,700 |
| Median Household Income | $45,117 | $68 |
| Monthly Housing Costs | $477 | $7 |
| Real Estate Taxes | $1,314 | $3 |
Property Value by Mortgage Status in Smith County
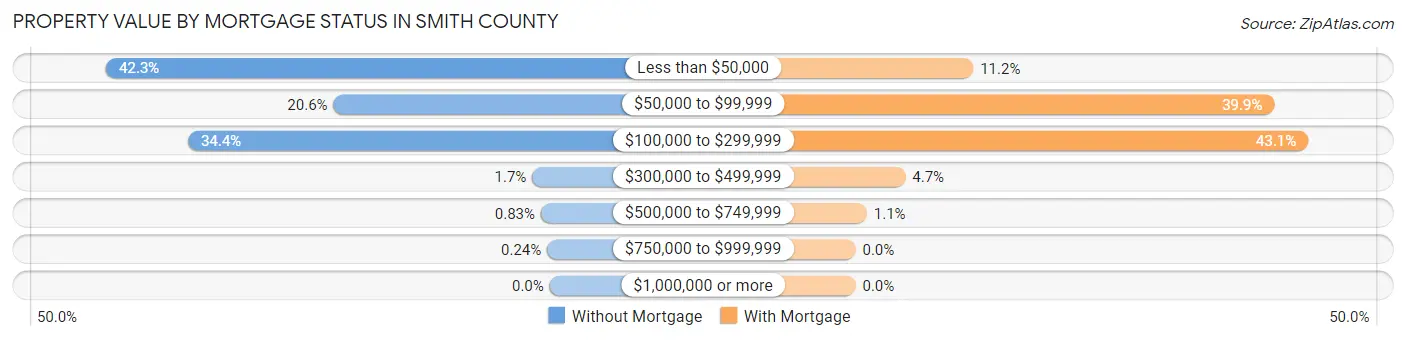
| Property Value | Without Mortgage | With Mortgage |
| Less than $50,000 | 357 (42.2%) | 52 (11.2%) |
| $50,000 to $99,999 | 174 (20.6%) | 185 (39.9%) |
| $100,000 to $299,999 | 291 (34.4%) | 200 (43.1%) |
| $300,000 to $499,999 | 14 (1.7%) | 22 (4.7%) |
| $500,000 to $749,999 | 7 (0.8%) | 5 (1.1%) |
| $750,000 to $999,999 | 2 (0.2%) | 0 (0.0%) |
| $1,000,000 or more | 0 (0.0%) | 0 (0.0%) |
| Total | 845 (100.0%) | 464 (100.0%) |
Household Income by Mortgage Status in Smith County
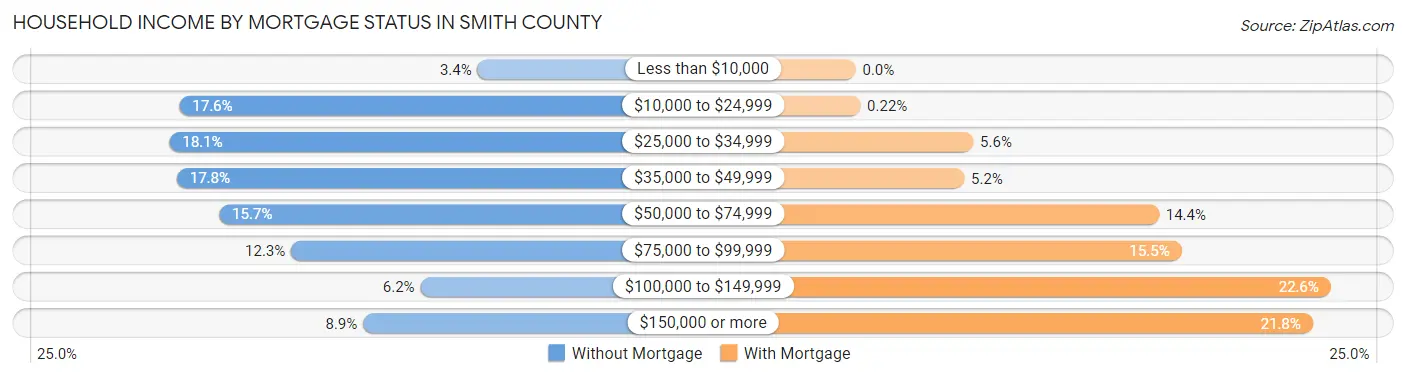
| Household Income | Without Mortgage | With Mortgage |
| Less than $10,000 | 29 (3.4%) | 0 (0.0%) |
| $10,000 to $24,999 | 149 (17.6%) | 1 (0.2%) |
| $25,000 to $34,999 | 153 (18.1%) | 26 (5.6%) |
| $35,000 to $49,999 | 150 (17.7%) | 24 (5.2%) |
| $50,000 to $74,999 | 133 (15.7%) | 67 (14.4%) |
| $75,000 to $99,999 | 104 (12.3%) | 72 (15.5%) |
| $100,000 to $149,999 | 52 (6.1%) | 105 (22.6%) |
| $150,000 or more | 75 (8.9%) | 101 (21.8%) |
| Total | 845 (100.0%) | 464 (100.0%) |
Property Value to Household Income Ratio in Smith County
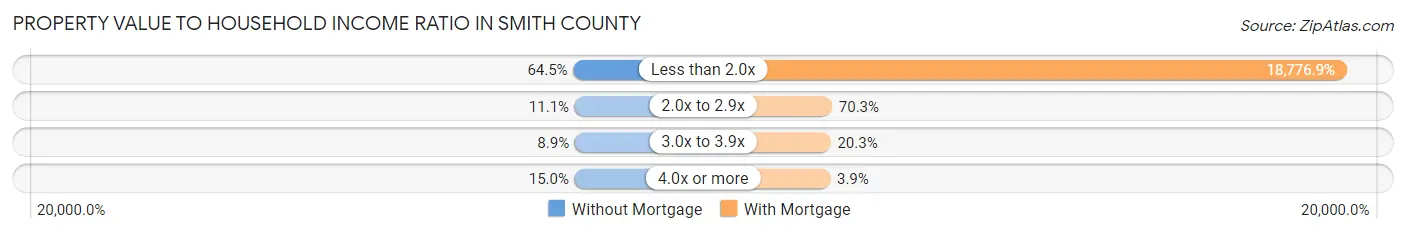
| Value-to-Income Ratio | Without Mortgage | With Mortgage |
| Less than 2.0x | 545 (64.5%) | 87,125 (18,776.9%) |
| 2.0x to 2.9x | 94 (11.1%) | 326 (70.3%) |
| 3.0x to 3.9x | 75 (8.9%) | 94 (20.3%) |
| 4.0x or more | 127 (15.0%) | 18 (3.9%) |
| Total | 845 (100.0%) | 464 (100.0%) |
Real Estate Taxes by Mortgage Status in Smith County
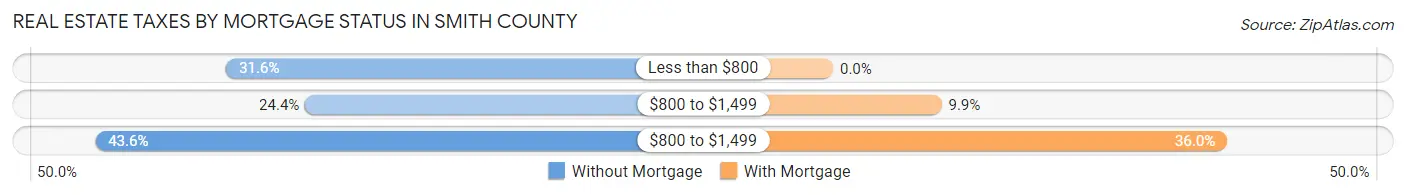
| Property Taxes | Without Mortgage | With Mortgage |
| Less than $800 | 267 (31.6%) | 0 (0.0%) |
| $800 to $1,499 | 206 (24.4%) | 46 (9.9%) |
| $800 to $1,499 | 368 (43.5%) | 167 (36.0%) |
| Total | 845 (100.0%) | 464 (100.0%) |
Health & Disability in Smith County
Health Insurance Coverage by Age in Smith County
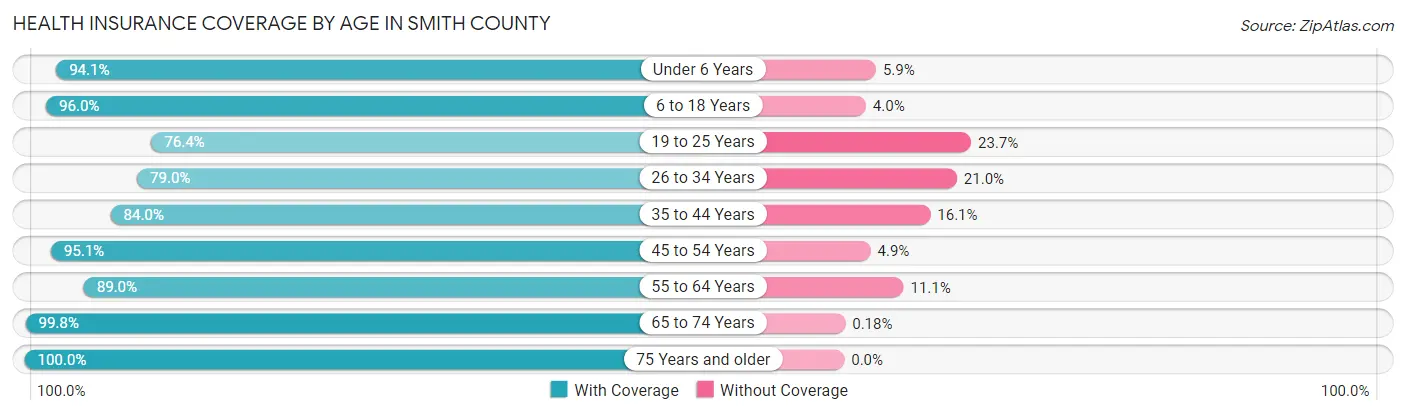
| Age Bracket | With Coverage | Without Coverage |
| Under 6 Years | 191 (94.1%) | 12 (5.9%) |
| 6 to 18 Years | 524 (96.0%) | 22 (4.0%) |
| 19 to 25 Years | 155 (76.3%) | 48 (23.6%) |
| 26 to 34 Years | 222 (79.0%) | 59 (21.0%) |
| 35 to 44 Years | 319 (84.0%) | 61 (16.1%) |
| 45 to 54 Years | 310 (95.1%) | 16 (4.9%) |
| 55 to 64 Years | 523 (88.9%) | 65 (11.1%) |
| 65 to 74 Years | 549 (99.8%) | 1 (0.2%) |
| 75 Years and older | 431 (100.0%) | 0 (0.0%) |
| Total | 3,224 (91.9%) | 284 (8.1%) |
Health Insurance Coverage by Citizenship Status in Smith County
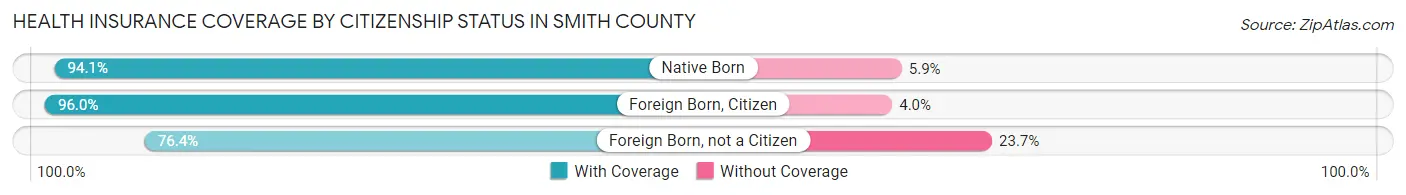
| Citizenship Status | With Coverage | Without Coverage |
| Native Born | 191 (94.1%) | 12 (5.9%) |
| Foreign Born, Citizen | 524 (96.0%) | 22 (4.0%) |
| Foreign Born, not a Citizen | 155 (76.3%) | 48 (23.6%) |
Health Insurance Coverage by Household Income in Smith County
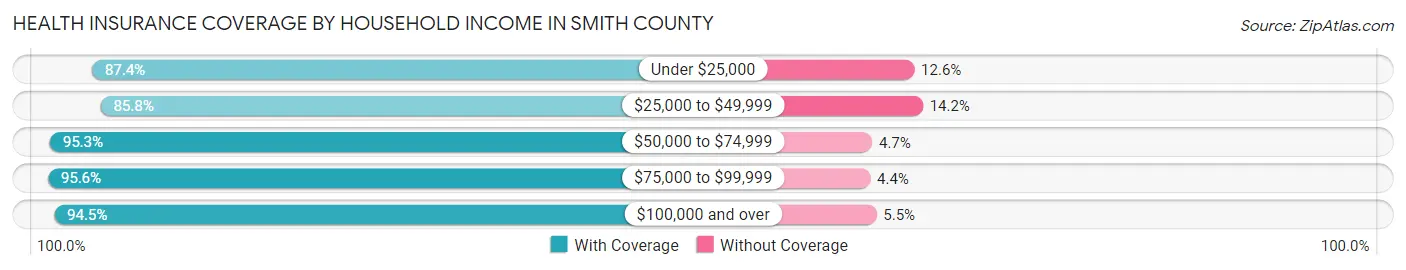
| Household Income | With Coverage | Without Coverage |
| Under $25,000 | 353 (87.4%) | 51 (12.6%) |
| $25,000 to $49,999 | 730 (85.8%) | 121 (14.2%) |
| $50,000 to $74,999 | 584 (95.3%) | 29 (4.7%) |
| $75,000 to $99,999 | 592 (95.6%) | 27 (4.4%) |
| $100,000 and over | 957 (94.5%) | 56 (5.5%) |
Public vs Private Health Insurance Coverage by Age in Smith County
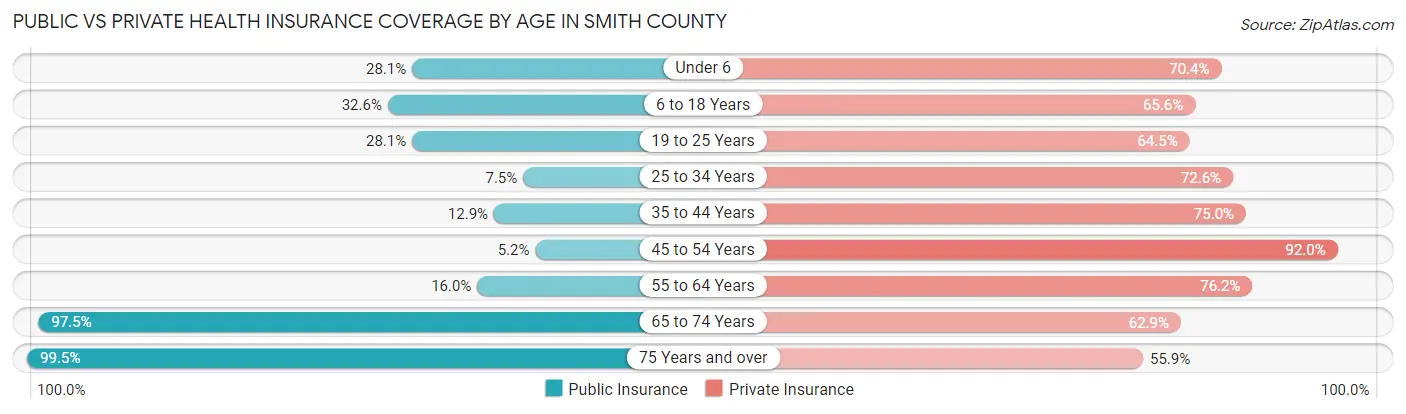
| Age Bracket | Public Insurance | Private Insurance |
| Under 6 | 57 (28.1%) | 143 (70.4%) |
| 6 to 18 Years | 178 (32.6%) | 358 (65.6%) |
| 19 to 25 Years | 57 (28.1%) | 131 (64.5%) |
| 25 to 34 Years | 21 (7.5%) | 204 (72.6%) |
| 35 to 44 Years | 49 (12.9%) | 285 (75.0%) |
| 45 to 54 Years | 17 (5.2%) | 300 (92.0%) |
| 55 to 64 Years | 94 (16.0%) | 448 (76.2%) |
| 65 to 74 Years | 536 (97.5%) | 346 (62.9%) |
| 75 Years and over | 429 (99.5%) | 241 (55.9%) |
| Total | 1,438 (41.0%) | 2,456 (70.0%) |
Disability Status by Sex by Age in Smith County
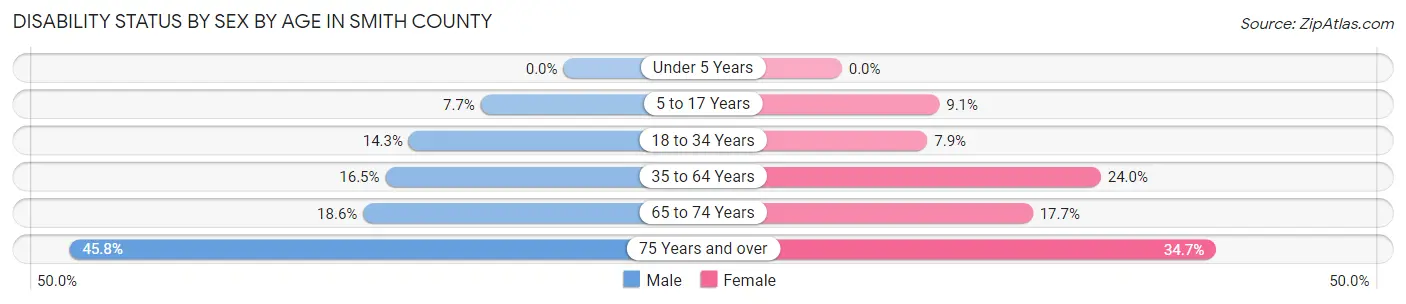
| Age Bracket | Male | Female |
| Under 5 Years | 0 (0.0%) | 0 (0.0%) |
| 5 to 17 Years | 22 (7.7%) | 21 (9.0%) |
| 18 to 34 Years | 41 (14.3%) | 20 (7.9%) |
| 35 to 64 Years | 110 (16.5%) | 151 (24.0%) |
| 65 to 74 Years | 55 (18.6%) | 45 (17.7%) |
| 75 Years and over | 88 (45.8%) | 83 (34.7%) |
Disability Class by Sex by Age in Smith County
Disability Class: Hearing Difficulty
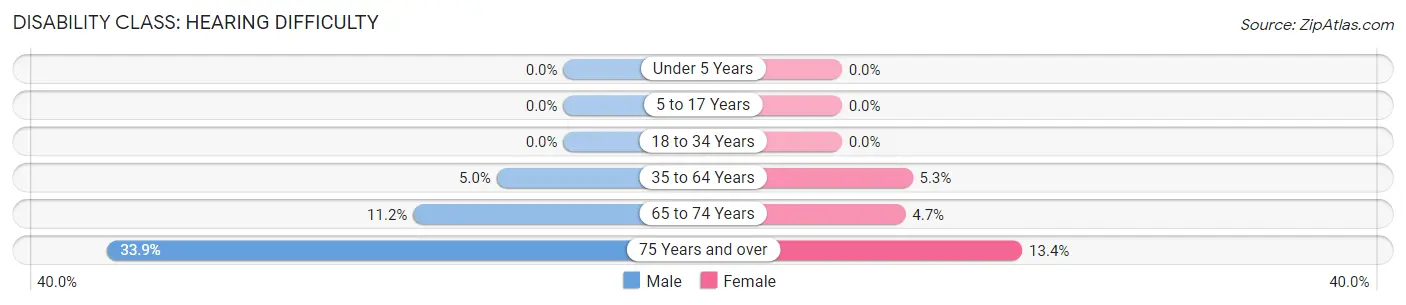
| Age Bracket | Male | Female |
| Under 5 Years | 0 (0.0%) | 0 (0.0%) |
| 5 to 17 Years | 0 (0.0%) | 0 (0.0%) |
| 18 to 34 Years | 0 (0.0%) | 0 (0.0%) |
| 35 to 64 Years | 33 (5.0%) | 33 (5.2%) |
| 65 to 74 Years | 33 (11.2%) | 12 (4.7%) |
| 75 Years and over | 65 (33.9%) | 32 (13.4%) |
Disability Class: Vision Difficulty
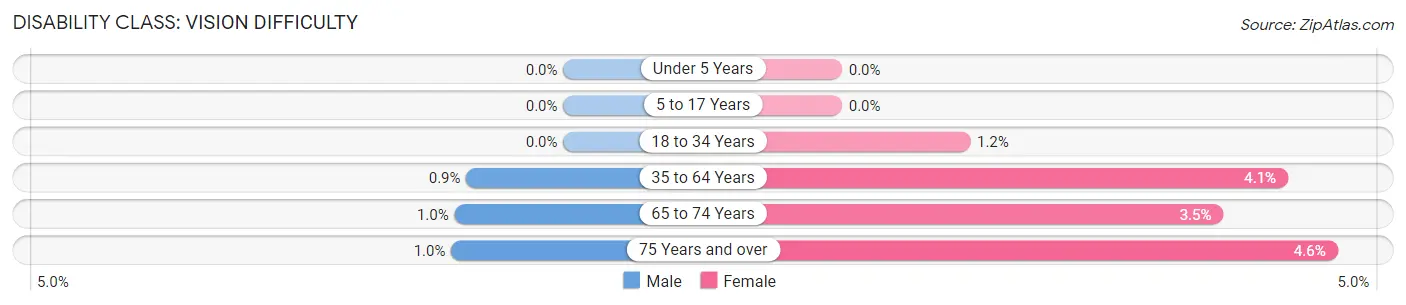
| Age Bracket | Male | Female |
| Under 5 Years | 0 (0.0%) | 0 (0.0%) |
| 5 to 17 Years | 0 (0.0%) | 0 (0.0%) |
| 18 to 34 Years | 0 (0.0%) | 3 (1.2%) |
| 35 to 64 Years | 6 (0.9%) | 26 (4.1%) |
| 65 to 74 Years | 3 (1.0%) | 9 (3.5%) |
| 75 Years and over | 2 (1.0%) | 11 (4.6%) |
Disability Class: Cognitive Difficulty
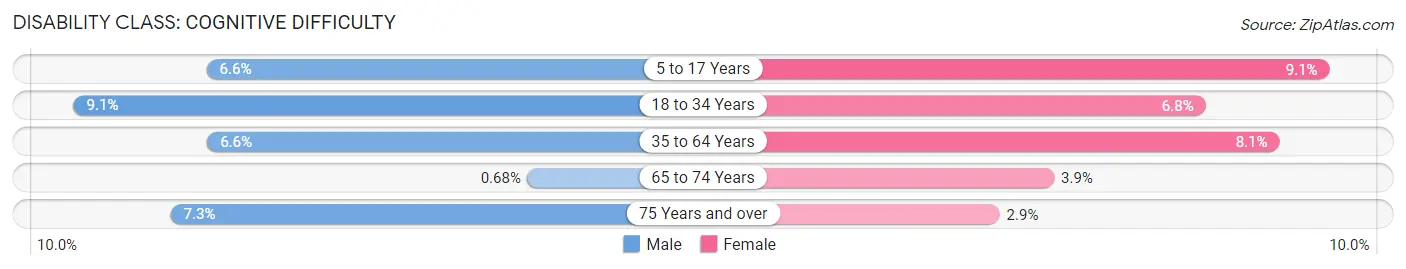
| Age Bracket | Male | Female |
| 5 to 17 Years | 19 (6.6%) | 21 (9.0%) |
| 18 to 34 Years | 26 (9.1%) | 17 (6.8%) |
| 35 to 64 Years | 44 (6.6%) | 51 (8.1%) |
| 65 to 74 Years | 2 (0.7%) | 10 (3.9%) |
| 75 Years and over | 14 (7.3%) | 7 (2.9%) |
Disability Class: Ambulatory Difficulty
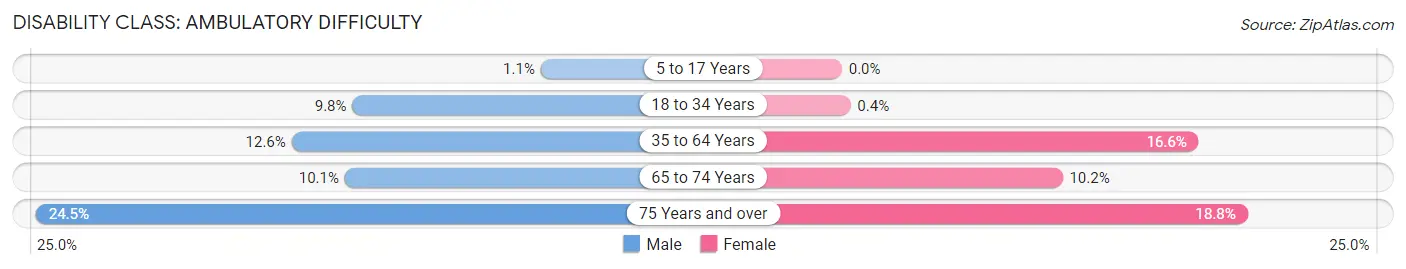
| Age Bracket | Male | Female |
| 5 to 17 Years | 3 (1.1%) | 0 (0.0%) |
| 18 to 34 Years | 28 (9.8%) | 1 (0.4%) |
| 35 to 64 Years | 84 (12.6%) | 104 (16.6%) |
| 65 to 74 Years | 30 (10.1%) | 26 (10.2%) |
| 75 Years and over | 47 (24.5%) | 45 (18.8%) |
Disability Class: Self-Care Difficulty
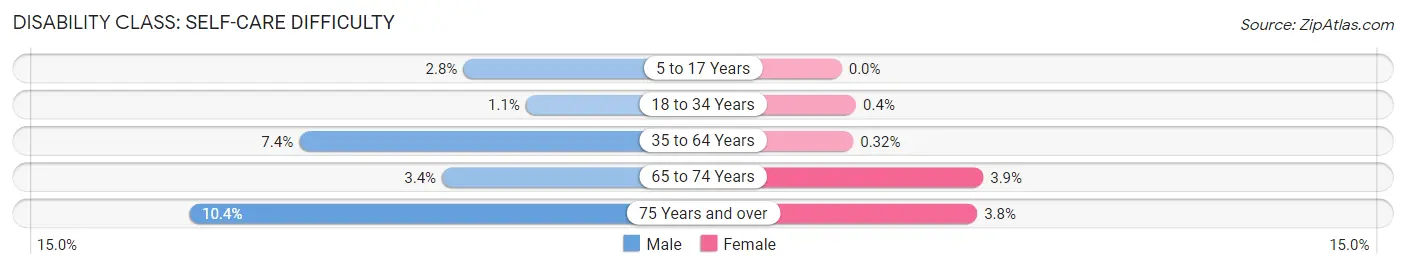
| Age Bracket | Male | Female |
| 5 to 17 Years | 8 (2.8%) | 0 (0.0%) |
| 18 to 34 Years | 3 (1.1%) | 1 (0.4%) |
| 35 to 64 Years | 49 (7.4%) | 2 (0.3%) |
| 65 to 74 Years | 10 (3.4%) | 10 (3.9%) |
| 75 Years and over | 20 (10.4%) | 9 (3.8%) |
Technology Access in Smith County
Computing Device Access in Smith County

| Device Type | # Households | % Households |
| Desktop or Laptop | 1,147 | 73.5% |
| Smartphone | 1,170 | 75.0% |
| Tablet | 877 | 56.2% |
| No Computing Device | 148 | 9.5% |
| Total | 1,560 | 100.0% |
Internet Access in Smith County
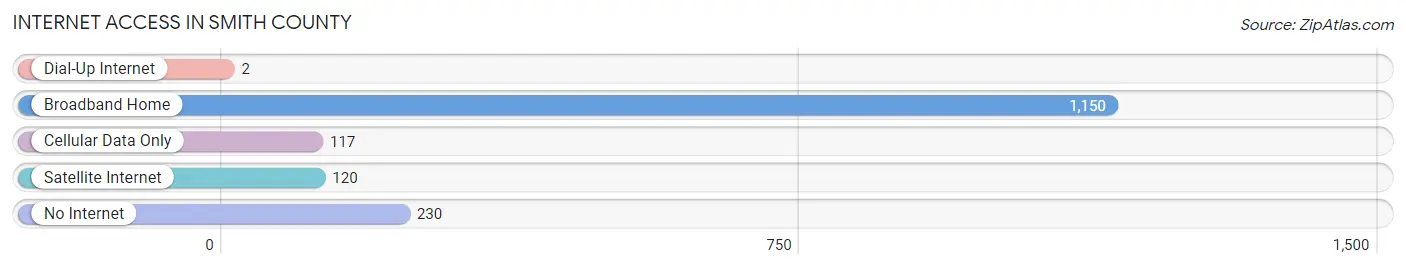
| Internet Type | # Households | % Households |
| Dial-Up Internet | 2 | 0.1% |
| Broadband Home | 1,150 | 73.7% |
| Cellular Data Only | 117 | 7.5% |
| Satellite Internet | 120 | 7.7% |
| No Internet | 230 | 14.7% |
| Total | 1,560 | 100.0% |
Smith County Summary
Smith County is located in the north-central region of Kansas, and is bordered by Phillips, Rooks, Osborne, and Jewell counties. The county seat is Smith Center, and the county was named after Major J. Nelson Smith, a Civil War veteran. Smith County has a total area of 876 square miles, with 874 square miles of land and 2 square miles of water.
History
Smith County was established in 1867, and was originally part of the larger Phillips County. The county was named after Major J. Nelson Smith, a Civil War veteran. The first settlers arrived in the area in 1871, and the county was officially organized in 1872. The first county seat was located in Gaylord, but it was moved to Smith Center in 1873.
The county experienced rapid growth in the late 19th century, with the population increasing from 1,845 in 1880 to 4,845 in 1900. The county was largely agricultural, with wheat, corn, and oats being the main crops. The county also had a thriving livestock industry, with cattle, horses, and hogs being the main animals raised.
In the early 20th century, Smith County experienced a period of economic decline. The population decreased from 4,845 in 1900 to 4,072 in 1910. The Great Depression further exacerbated the economic decline, and the population decreased to 3,845 in 1940.
The county experienced a period of economic recovery in the mid-20th century, with the population increasing to 4,845 in 1950. The economy was largely agricultural, with wheat, corn, and oats being the main crops. The county also had a thriving livestock industry, with cattle, horses, and hogs being the main animals raised.
Geography
Smith County is located in the north-central region of Kansas, and is bordered by Phillips, Rooks, Osborne, and Jewell counties. The county has a total area of 876 square miles, with 874 square miles of land and 2 square miles of water. The county is mostly flat, with rolling hills in the east and south. The county is drained by the Solomon River, which flows through the county from north to south.
The county is home to several state parks, including Cedar Bluff State Park, which is located in the northwest corner of the county. The park features a lake, camping, and hiking trails. The county is also home to several wildlife areas, including the Smith County Wildlife Area, which is located in the northeast corner of the county.
Economy
Smith County has a largely agricultural economy, with wheat, corn, and oats being the main crops. The county also has a thriving livestock industry, with cattle, horses, and hogs being the main animals raised. The county is also home to several manufacturing companies, including Smith County Manufacturing, which produces agricultural equipment.
The county is also home to several tourist attractions, including the Smith County Historical Museum, which is located in Smith Center. The museum features exhibits on the history of the county, as well as artifacts from the area. The county is also home to several wineries, including the Smith County Winery, which produces a variety of wines.
Demographics
As of the 2010 census, Smith County had a population of 5,890. The population was spread out, with 25.3% under the age of 18, 8.2% from 18 to 24, 24.2% from 25 to 44, 28.2% from 45 to 64, and 14.1% who were 65 years of age or older. The median age was 40.3 years.
The median income for a household in the county was $45,938, and the median income for a family was $51,938. The per capita income for the county was $20,938. About 11.2% of families and 14.2% of the population were below the poverty line, including 19.2% of those under age 18 and 8.2% of those age 65 or over.
Common Questions
What is the Total Population of Smith County?
Total Population of Smith County is 3,561.
What is the Total Male Population of Smith County?
Total Male Population of Smith County is 1,837.
What is the Total Female Population of Smith County?
Total Female Population of Smith County is 1,724.
What is the Ratio of Males per 100 Females in Smith County?
There are 106.55 Males per 100 Females in Smith County.
What is the Ratio of Females per 100 Males in Smith County?
There are 93.85 Females per 100 Males in Smith County.
What is the Median Population Age in Smith County?
Median Population Age in Smith County is 50.0 Years.
What is the Average Family Size in Smith County
Average Family Size in Smith County is 2.9 People.
What is the Average Household Size in Smith County
Average Household Size in Smith County is 2.2 People.
What is Per Capita Income in Smith County?
Per Capita income in Smith County is $33,881.
What is the Median Family Income in Smith County?
Median Family Income in Smith County is $74,911.
What is the Median Household income in Smith County?
Median Household Income in Smith County is $50,943.
What is Income or Wage Gap in Smith County?
Income or Wage Gap in Smith County is 37.4%.
Women in Smith County earn 62.6 cents for every dollar earned by a man.
What is Family Income Deficit in Smith County?
Family Income Deficit in Smith County is $9,190.
Families that are below poverty line in Smith County earn $9,190 less on average than the poverty threshold level.
What is Inequality or Gini Index in Smith County?
Inequality or Gini Index in Smith County is 0.44.
How Large is the Labor Force in Smith County?
There are 1,772 People in the Labor Forcein in Smith County.
What is the Percentage of People in the Labor Force in Smith County?
60.1% of People are in the Labor Force in Smith County.
What is the Unemployment Rate in Smith County?
Unemployment Rate in Smith County is 2.1%.