Shawnee County, KS
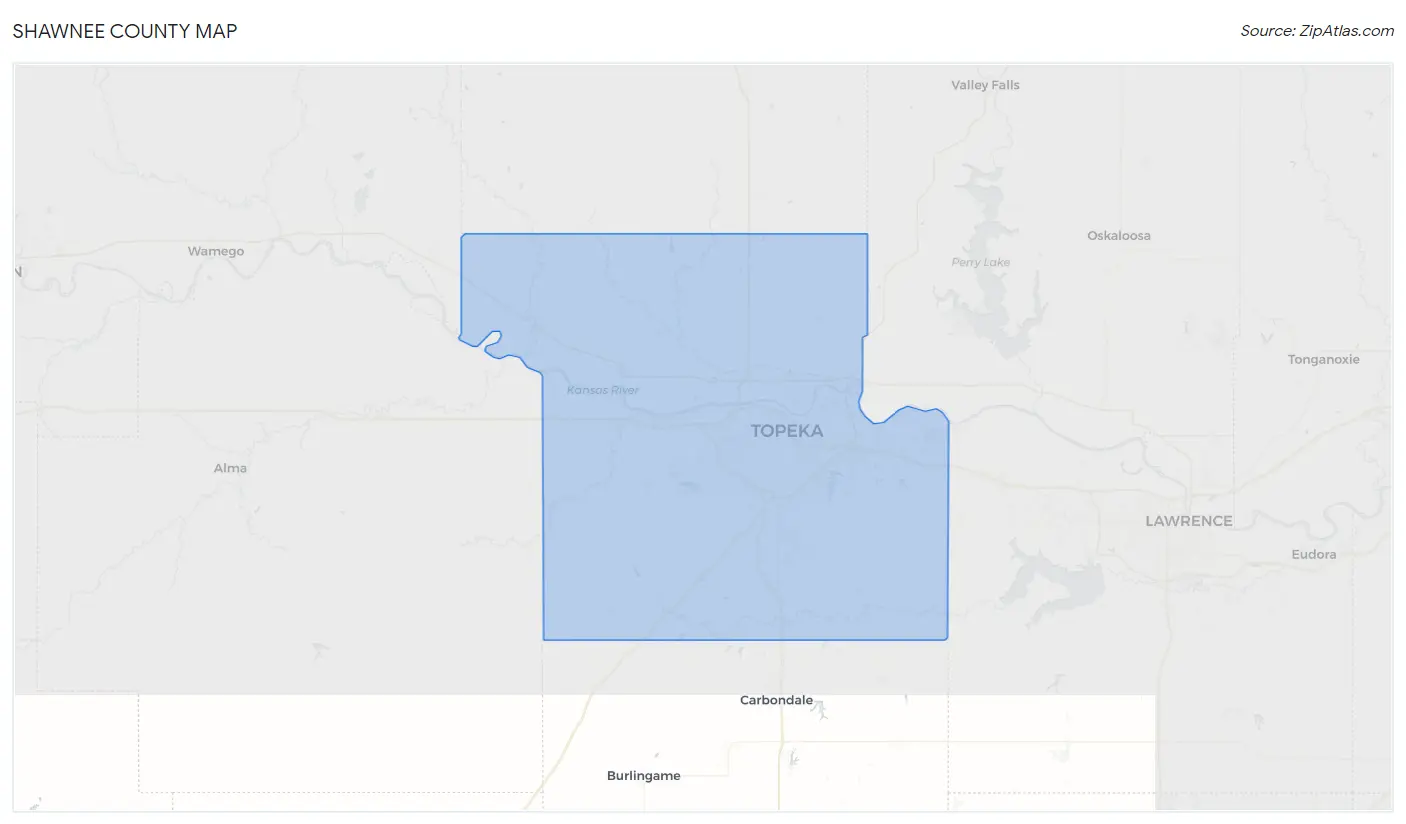
Shawnee County Map
Shawnee County Overview
178,625
TOTAL POPULATION
87,074
MALE POPULATION
91,551
FEMALE POPULATION
95.11
MALES / 100 FEMALES
105.14
FEMALES / 100 MALES
39.4
MEDIAN AGE
3.0
AVG FAMILY SIZE
2.3
AVG HOUSEHOLD SIZE
$36,011
PER CAPITA INCOME
$85,262
AVG FAMILY INCOME
$63,463
AVG HOUSEHOLD INCOME
24.9%
WAGE / INCOME GAP [ % ]
75.1¢/ $1
WAGE / INCOME GAP [ $ ]
$10,605
FAMILY INCOME DEFICIT
0.45
INEQUALITY / GINI INDEX
88,707
LABOR FORCE [ PEOPLE ]
62.4%
PERCENT IN LABOR FORCE
4.2%
UNEMPLOYMENT RATE
Shawnee County Area Codes
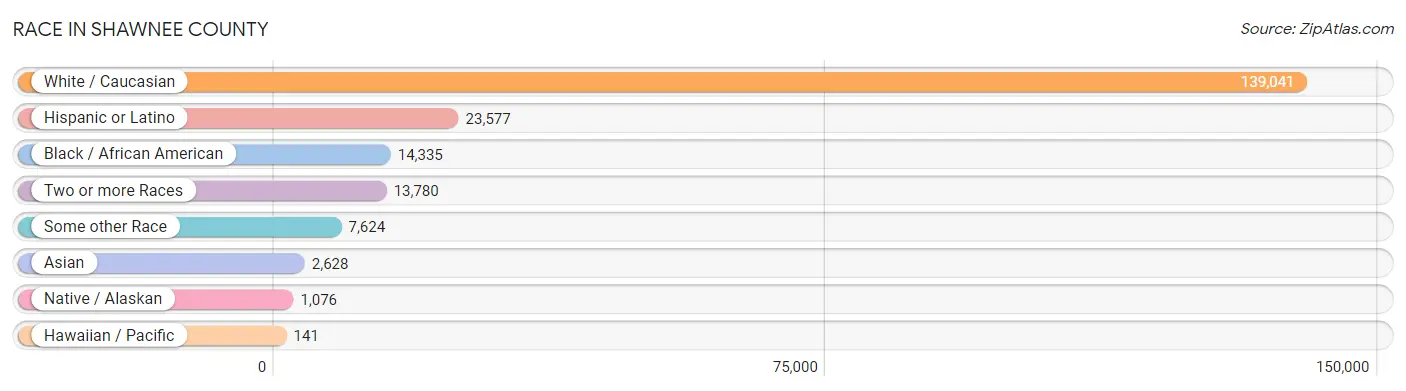
Race in Shawnee County
The most populous races in Shawnee County are White / Caucasian (139,041 | 77.8%), Hispanic or Latino (23,577 | 13.2%), and Black / African American (14,335 | 8.0%).
| Race | # Population | % Population |
| Asian | 2,628 | 1.5% |
| Black / African American | 14,335 | 8.0% |
| Hawaiian / Pacific | 141 | 0.1% |
| Hispanic or Latino | 23,577 | 13.2% |
| Native / Alaskan | 1,076 | 0.6% |
| White / Caucasian | 139,041 | 77.8% |
| Two or more Races | 13,780 | 7.7% |
| Some other Race | 7,624 | 4.3% |
| Total | 178,625 | 100.0% |
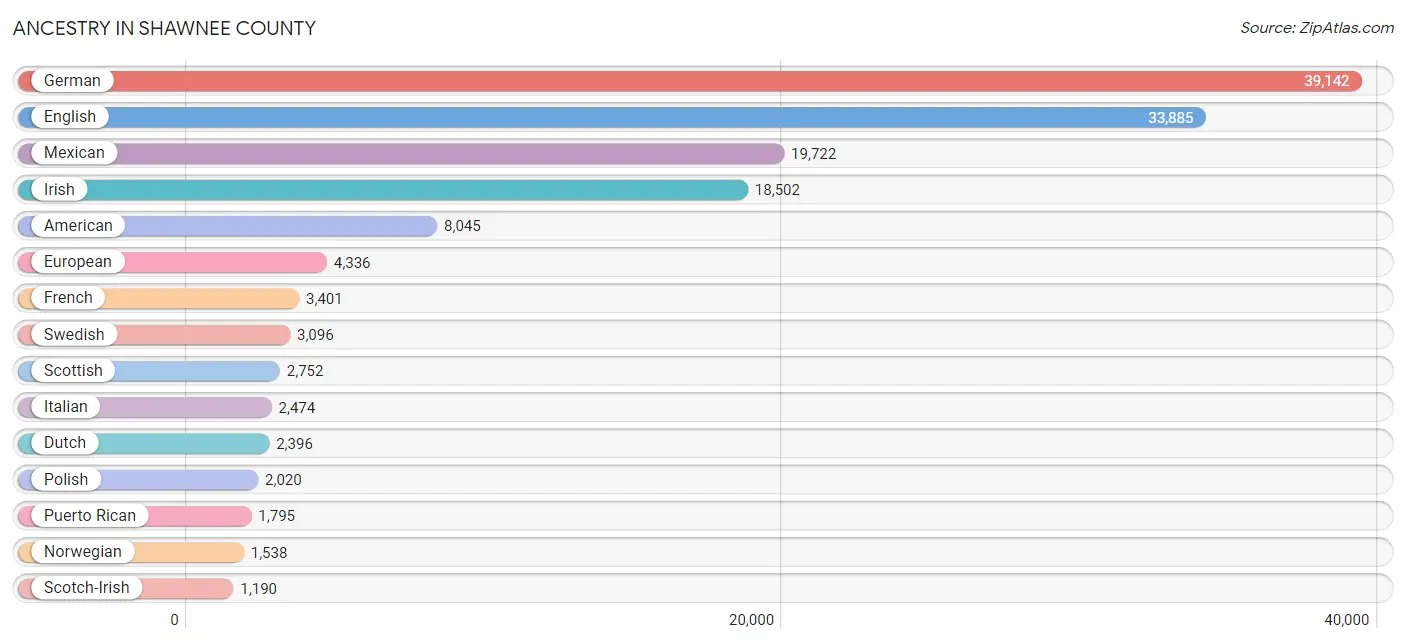
Ancestry in Shawnee County
The most populous ancestries reported in Shawnee County are German (39,142 | 21.9%), English (33,885 | 19.0%), Mexican (19,722 | 11.0%), Irish (18,502 | 10.4%), and American (8,045 | 4.5%), together accounting for 66.8% of all Shawnee County residents.
| Ancestry | # Population | % Population |
| African | 522 | 0.3% |
| Alaska Native | 40 | 0.0% |
| Albanian | 12 | 0.0% |
| Alsatian | 1 | 0.0% |
| American | 8,045 | 4.5% |
| Apache | 64 | 0.0% |
| Arab | 196 | 0.1% |
| Argentinean | 15 | 0.0% |
| Armenian | 80 | 0.0% |
| Austrian | 261 | 0.2% |
| Belgian | 68 | 0.0% |
| Bermudan | 8 | 0.0% |
| Bhutanese | 673 | 0.4% |
| Blackfeet | 195 | 0.1% |
| Brazilian | 86 | 0.1% |
| British | 1,107 | 0.6% |
| Burmese | 373 | 0.2% |
| Canadian | 157 | 0.1% |
| Celtic | 13 | 0.0% |
| Central American | 682 | 0.4% |
| Central American Indian | 54 | 0.0% |
| Cherokee | 1,080 | 0.6% |
| Cheyenne | 18 | 0.0% |
| Chickasaw | 38 | 0.0% |
| Chilean | 9 | 0.0% |
| Chippewa | 156 | 0.1% |
| Choctaw | 68 | 0.0% |
| Colombian | 98 | 0.1% |
| Comanche | 32 | 0.0% |
| Costa Rican | 17 | 0.0% |
| Cree | 100 | 0.1% |
| Creek | 27 | 0.0% |
| Croatian | 149 | 0.1% |
| Crow | 4 | 0.0% |
| Cuban | 249 | 0.1% |
| Czech | 830 | 0.5% |
| Czechoslovakian | 259 | 0.1% |
| Danish | 808 | 0.4% |
| Delaware | 100 | 0.1% |
| Dominican | 67 | 0.0% |
| Dutch | 2,396 | 1.3% |
| Dutch West Indian | 2 | 0.0% |
| Eastern European | 258 | 0.1% |
| Ecuadorian | 22 | 0.0% |
| English | 33,885 | 19.0% |
| Ethiopian | 6 | 0.0% |
| European | 4,336 | 2.4% |
| Finnish | 105 | 0.1% |
| French | 3,401 | 1.9% |
| French Canadian | 281 | 0.2% |
| German | 39,142 | 21.9% |
| German Russian | 105 | 0.1% |
| Ghanaian | 26 | 0.0% |
| Greek | 124 | 0.1% |
| Guamanian / Chamorro | 2 | 0.0% |
| Guatemalan | 191 | 0.1% |
| Haitian | 15 | 0.0% |
| Hopi | 15 | 0.0% |
| Hungarian | 199 | 0.1% |
| Indian (Asian) | 559 | 0.3% |
| Indonesian | 4 | 0.0% |
| Inupiat | 15 | 0.0% |
| Iranian | 9 | 0.0% |
| Irish | 18,502 | 10.4% |
| Italian | 2,474 | 1.4% |
| Jamaican | 91 | 0.1% |
| Japanese | 30 | 0.0% |
| Jordanian | 10 | 0.0% |
| Kenyan | 93 | 0.1% |
| Kiowa | 7 | 0.0% |
| Korean | 759 | 0.4% |
| Laotian | 7 | 0.0% |
| Latvian | 16 | 0.0% |
| Lebanese | 87 | 0.1% |
| Lithuanian | 162 | 0.1% |
| Luxembourger | 8 | 0.0% |
| Macedonian | 34 | 0.0% |
| Malaysian | 50 | 0.0% |
| Mexican | 19,722 | 11.0% |
| Mexican American Indian | 132 | 0.1% |
| Native Hawaiian | 106 | 0.1% |
| Navajo | 79 | 0.0% |
| New Zealander | 20 | 0.0% |
| Nicaraguan | 428 | 0.2% |
| Nigerian | 64 | 0.0% |
| Northern European | 315 | 0.2% |
| Norwegian | 1,538 | 0.9% |
| Osage | 87 | 0.1% |
| Ottawa | 9 | 0.0% |
| Pakistani | 42 | 0.0% |
| Palestinian | 8 | 0.0% |
| Panamanian | 8 | 0.0% |
| Paraguayan | 4 | 0.0% |
| Pennsylvania German | 31 | 0.0% |
| Peruvian | 16 | 0.0% |
| Pima | 4 | 0.0% |
| Polish | 2,020 | 1.1% |
| Portuguese | 359 | 0.2% |
| Potawatomi | 748 | 0.4% |
| Puerto Rican | 1,795 | 1.0% |
| Romanian | 43 | 0.0% |
| Russian | 422 | 0.2% |
| Salvadoran | 38 | 0.0% |
| Samoan | 40 | 0.0% |
| Scandinavian | 420 | 0.2% |
| Scotch-Irish | 1,190 | 0.7% |
| Scottish | 2,752 | 1.5% |
| Shoshone | 18 | 0.0% |
| Sioux | 90 | 0.1% |
| Slavic | 33 | 0.0% |
| Slovak | 82 | 0.1% |
| South American | 193 | 0.1% |
| South American Indian | 57 | 0.0% |
| Spaniard | 219 | 0.1% |
| Spanish | 189 | 0.1% |
| Sri Lankan | 301 | 0.2% |
| Subsaharan African | 716 | 0.4% |
| Swedish | 3,096 | 1.7% |
| Swiss | 665 | 0.4% |
| Syrian | 13 | 0.0% |
| Thai | 946 | 0.5% |
| Tohono O'Odham | 4 | 0.0% |
| Tongan | 10 | 0.0% |
| Ukrainian | 242 | 0.1% |
| Venezuelan | 29 | 0.0% |
| Vietnamese | 83 | 0.1% |
| Welsh | 1,121 | 0.6% |
| Yaqui | 35 | 0.0% |
| Yugoslavian | 13 | 0.0% |
| Yuman | 15 | 0.0% | View All 130 Rows |
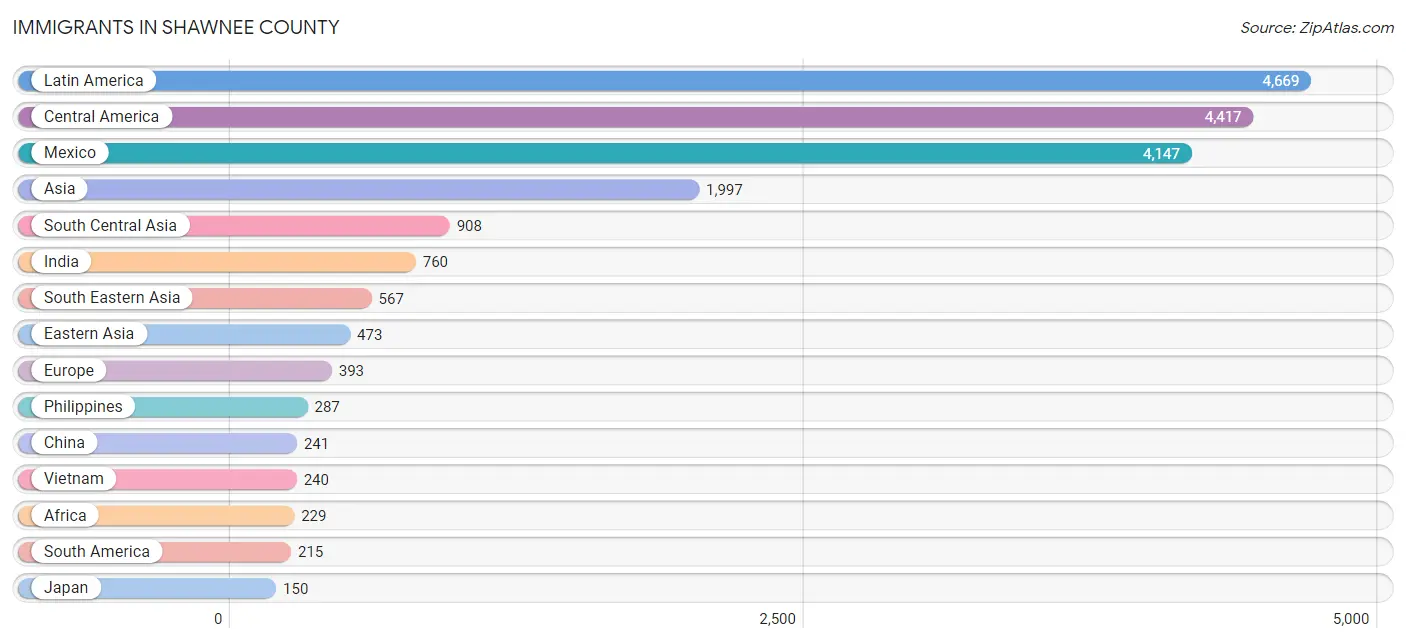
Immigrants in Shawnee County
The most numerous immigrant groups reported in Shawnee County came from Latin America (4,669 | 2.6%), Central America (4,417 | 2.5%), Mexico (4,147 | 2.3%), Asia (1,997 | 1.1%), and South Central Asia (908 | 0.5%), together accounting for 9.0% of all Shawnee County residents.
| Immigration Origin | # Population | % Population |
| Africa | 229 | 0.1% |
| Argentina | 15 | 0.0% |
| Asia | 1,997 | 1.1% |
| Australia | 8 | 0.0% |
| Azores | 10 | 0.0% |
| Bahamas | 1 | 0.0% |
| Bangladesh | 65 | 0.0% |
| Brazil | 132 | 0.1% |
| Cameroon | 40 | 0.0% |
| Canada | 135 | 0.1% |
| Caribbean | 37 | 0.0% |
| Central America | 4,417 | 2.5% |
| China | 241 | 0.1% |
| Colombia | 30 | 0.0% |
| Costa Rica | 14 | 0.0% |
| Czechoslovakia | 18 | 0.0% |
| Dominican Republic | 14 | 0.0% |
| Eastern Africa | 94 | 0.1% |
| Eastern Asia | 473 | 0.3% |
| Eastern Europe | 116 | 0.1% |
| Ecuador | 11 | 0.0% |
| El Salvador | 29 | 0.0% |
| England | 35 | 0.0% |
| Europe | 393 | 0.2% |
| Germany | 111 | 0.1% |
| Ghana | 26 | 0.0% |
| Guatemala | 103 | 0.1% |
| Haiti | 15 | 0.0% |
| Honduras | 12 | 0.0% |
| Hong Kong | 46 | 0.0% |
| Hungary | 20 | 0.0% |
| India | 760 | 0.4% |
| Indonesia | 10 | 0.0% |
| Iran | 13 | 0.0% |
| Italy | 31 | 0.0% |
| Jamaica | 7 | 0.0% |
| Japan | 150 | 0.1% |
| Kazakhstan | 53 | 0.0% |
| Kenya | 34 | 0.0% |
| Korea | 82 | 0.1% |
| Laos | 16 | 0.0% |
| Latin America | 4,669 | 2.6% |
| Lebanon | 16 | 0.0% |
| Mexico | 4,147 | 2.3% |
| Micronesia | 76 | 0.0% |
| Middle Africa | 40 | 0.0% |
| Netherlands | 32 | 0.0% |
| Nicaragua | 112 | 0.1% |
| Nigeria | 49 | 0.0% |
| Northern Europe | 93 | 0.1% |
| Oceania | 119 | 0.1% |
| Pakistan | 6 | 0.0% |
| Philippines | 287 | 0.2% |
| Poland | 8 | 0.0% |
| Portugal | 10 | 0.0% |
| Russia | 30 | 0.0% |
| South Africa | 20 | 0.0% |
| South America | 215 | 0.1% |
| South Central Asia | 908 | 0.5% |
| South Eastern Asia | 567 | 0.3% |
| Southern Europe | 41 | 0.0% |
| Syria | 22 | 0.0% |
| Taiwan | 16 | 0.0% |
| Thailand | 14 | 0.0% |
| Ukraine | 22 | 0.0% |
| Uzbekistan | 11 | 0.0% |
| Venezuela | 19 | 0.0% |
| Vietnam | 240 | 0.1% |
| Western Africa | 75 | 0.0% |
| Western Asia | 49 | 0.0% |
| Western Europe | 143 | 0.1% |
| Zimbabwe | 55 | 0.0% | View All 72 Rows |
Sex and Age in Shawnee County
Sex and Age in Shawnee County
The most populous age groups in Shawnee County are 15 to 19 Years (6,147 | 7.1%) for men and 60 to 64 Years (6,972 | 7.6%) for women.
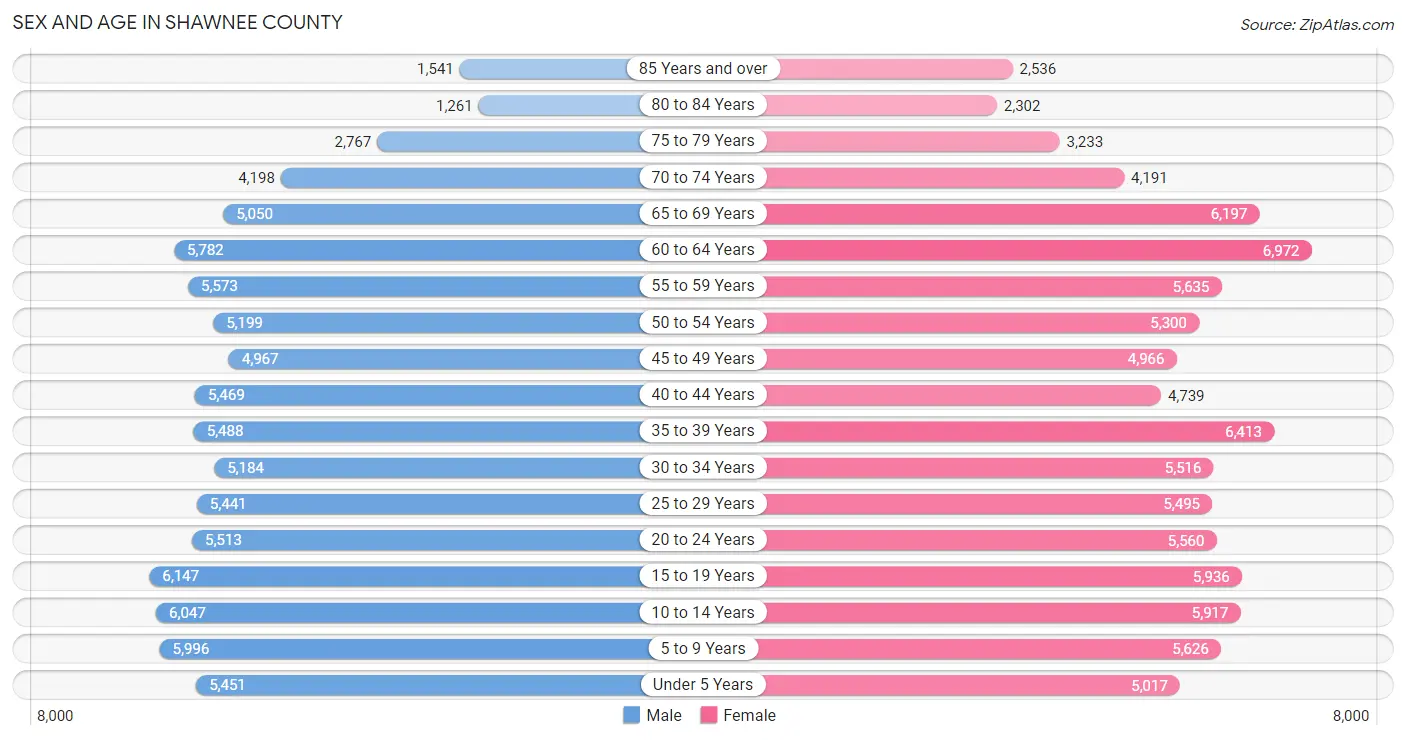
| Age Bracket | Male | Female |
| Under 5 Years | 5,451 (6.3%) | 5,017 (5.5%) |
| 5 to 9 Years | 5,996 (6.9%) | 5,626 (6.1%) |
| 10 to 14 Years | 6,047 (6.9%) | 5,917 (6.5%) |
| 15 to 19 Years | 6,147 (7.1%) | 5,936 (6.5%) |
| 20 to 24 Years | 5,513 (6.3%) | 5,560 (6.1%) |
| 25 to 29 Years | 5,441 (6.2%) | 5,495 (6.0%) |
| 30 to 34 Years | 5,184 (5.9%) | 5,516 (6.0%) |
| 35 to 39 Years | 5,488 (6.3%) | 6,413 (7.0%) |
| 40 to 44 Years | 5,469 (6.3%) | 4,739 (5.2%) |
| 45 to 49 Years | 4,967 (5.7%) | 4,966 (5.4%) |
| 50 to 54 Years | 5,199 (6.0%) | 5,300 (5.8%) |
| 55 to 59 Years | 5,573 (6.4%) | 5,635 (6.2%) |
| 60 to 64 Years | 5,782 (6.6%) | 6,972 (7.6%) |
| 65 to 69 Years | 5,050 (5.8%) | 6,197 (6.8%) |
| 70 to 74 Years | 4,198 (4.8%) | 4,191 (4.6%) |
| 75 to 79 Years | 2,767 (3.2%) | 3,233 (3.5%) |
| 80 to 84 Years | 1,261 (1.5%) | 2,302 (2.5%) |
| 85 Years and over | 1,541 (1.8%) | 2,536 (2.8%) |
| Total | 87,074 (100.0%) | 91,551 (100.0%) |
Families and Households in Shawnee County
Median Family Size in Shawnee County
The median family size in Shawnee County is 2.98 persons per family, with married-couple families (33,365 | 73.9%) accounting for the largest median family size of 3.02 persons per family. On the other hand, single female/mother families (8,346 | 18.5%) represent the smallest median family size with 2.85 persons per family.
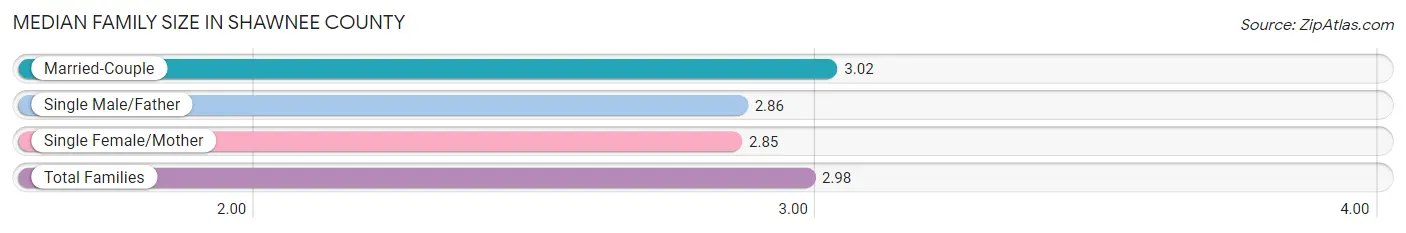
| Family Type | # Families | Family Size |
| Married-Couple | 33,365 (73.9%) | 3.02 |
| Single Male/Father | 3,449 (7.6%) | 2.86 |
| Single Female/Mother | 8,346 (18.5%) | 2.85 |
| Total Families | 45,160 (100.0%) | 2.98 |
Median Household Size in Shawnee County
The median household size in Shawnee County is 2.33 persons per household, with single male/father households (3,449 | 4.6%) accounting for the largest median household size of 3.18 persons per household. non-family households (29,234 | 39.3%) represent the smallest median household size with 1.20 persons per household.
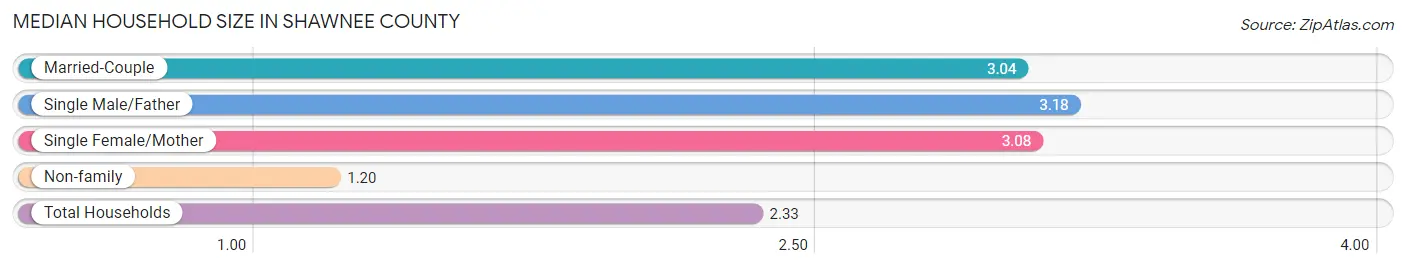
| Household Type | # Households | Household Size |
| Married-Couple | 33,365 (44.9%) | 3.04 |
| Single Male/Father | 3,449 (4.6%) | 3.18 |
| Single Female/Mother | 8,346 (11.2%) | 3.08 |
| Non-family | 29,234 (39.3%) | 1.20 |
| Total Households | 74,394 (100.0%) | 2.33 |
Household Size by Marriage Status in Shawnee County
Out of a total of 74,394 households in Shawnee County, 45,160 (60.7%) are family households, while 29,234 (39.3%) are nonfamily households. The most numerous type of family households are 2-person households, comprising 22,090, and the most common type of nonfamily households are 1-person households, comprising 24,590.
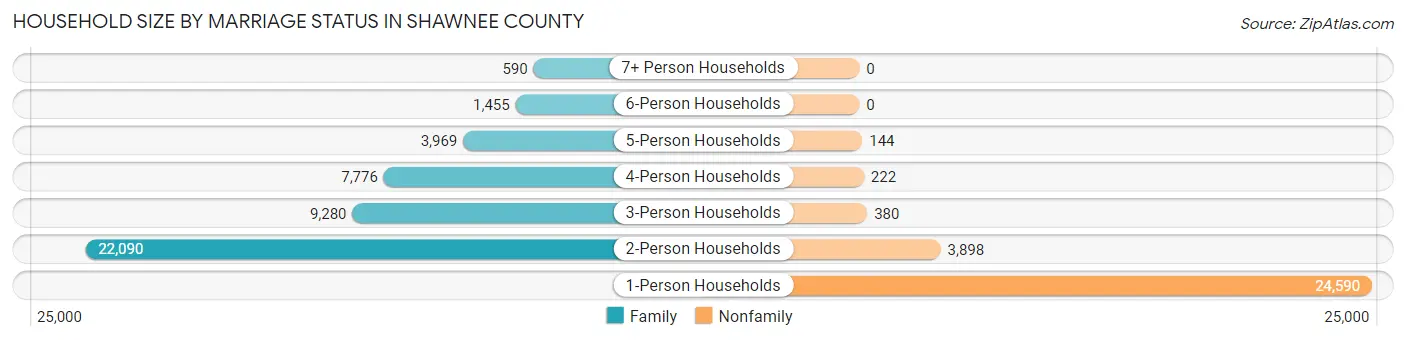
| Household Size | Family Households | Nonfamily Households |
| 1-Person Households | - | 24,590 (33.1%) |
| 2-Person Households | 22,090 (29.7%) | 3,898 (5.2%) |
| 3-Person Households | 9,280 (12.5%) | 380 (0.5%) |
| 4-Person Households | 7,776 (10.4%) | 222 (0.3%) |
| 5-Person Households | 3,969 (5.3%) | 144 (0.2%) |
| 6-Person Households | 1,455 (2.0%) | 0 (0.0%) |
| 7+ Person Households | 590 (0.8%) | 0 (0.0%) |
| Total | 45,160 (60.7%) | 29,234 (39.3%) |
Female Fertility in Shawnee County
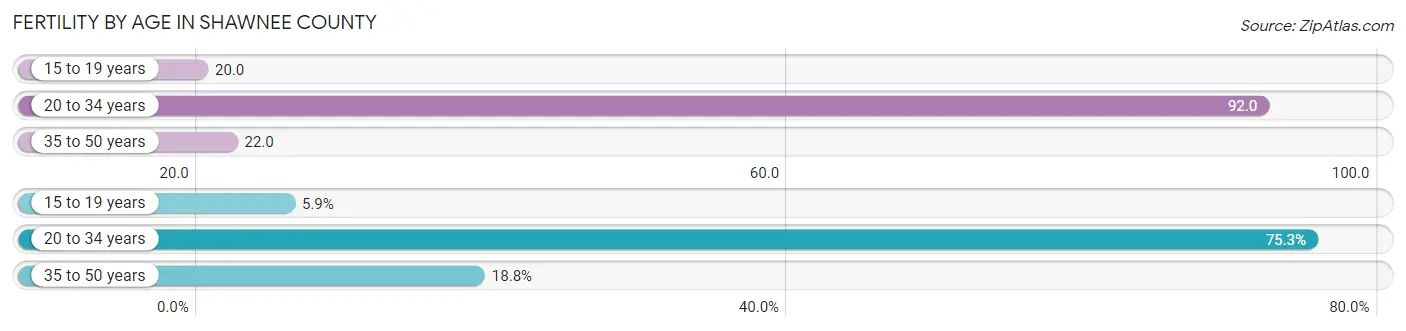
Fertility by Age in Shawnee County
Average fertility rate in Shawnee County is 51.0 births per 1,000 women. Women in the age bracket of 20 to 34 years have the highest fertility rate with 92.0 births per 1,000 women. Women in the age bracket of 20 to 34 years acount for 75.3% of all women with births.
| Age Bracket | Women with Births | Births / 1,000 Women |
| 15 to 19 years | 120 (5.9%) | 20.0 |
| 20 to 34 years | 1,531 (75.3%) | 92.0 |
| 35 to 50 years | 382 (18.8%) | 22.0 |
| Total | 2,033 (100.0%) | 51.0 |
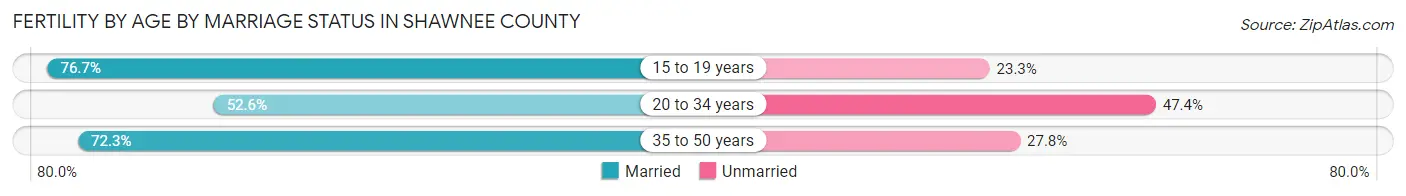
Fertility by Age by Marriage Status in Shawnee County
57.7% of women with births (2,033) in Shawnee County are married. The highest percentage of unmarried women with births falls into 20 to 34 years age bracket with 47.4% of them unmarried at the time of birth, while the lowest percentage of unmarried women with births belong to 15 to 19 years age bracket with 23.3% of them unmarried.
| Age Bracket | Married | Unmarried |
| 15 to 19 years | 92 (76.7%) | 28 (23.3%) |
| 20 to 34 years | 805 (52.6%) | 726 (47.4%) |
| 35 to 50 years | 276 (72.3%) | 106 (27.8%) |
| Total | 1,173 (57.7%) | 860 (42.3%) |
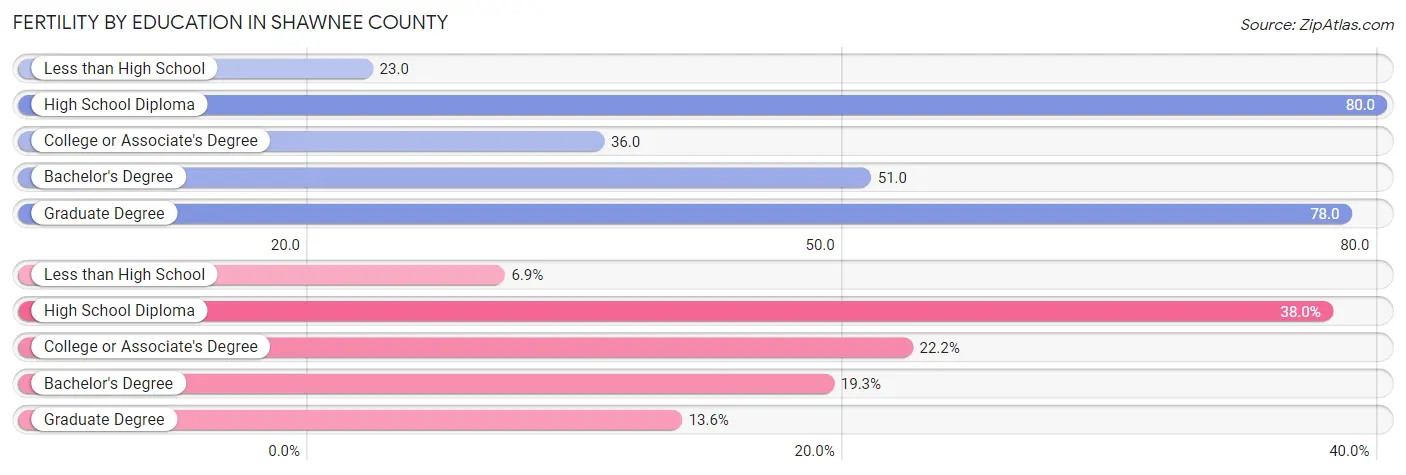
Fertility by Education in Shawnee County
Average fertility rate in Shawnee County is 51.0 births per 1,000 women. Women with the education attainment of high school diploma have the highest fertility rate of 80.0 births per 1,000 women, while women with the education attainment of less than high school have the lowest fertility at 23.0 births per 1,000 women. Women with the education attainment of high school diploma represent 38.0% of all women with births.
| Educational Attainment | Women with Births | Births / 1,000 Women |
| Less than High School | 141 (6.9%) | 23.0 |
| High School Diploma | 772 (38.0%) | 80.0 |
| College or Associate's Degree | 452 (22.2%) | 36.0 |
| Bachelor's Degree | 392 (19.3%) | 51.0 |
| Graduate Degree | 276 (13.6%) | 78.0 |
| Total | 2,033 (100.0%) | 51.0 |
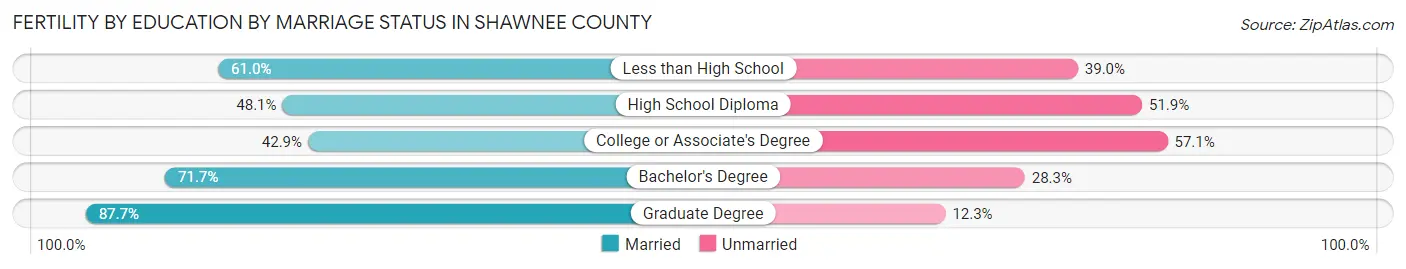
Fertility by Education by Marriage Status in Shawnee County
42.3% of women with births in Shawnee County are unmarried. Women with the educational attainment of graduate degree are most likely to be married with 87.7% of them married at childbirth, while women with the educational attainment of college or associate's degree are least likely to be married with 57.1% of them unmarried at childbirth.
| Educational Attainment | Married | Unmarried |
| Less than High School | 86 (61.0%) | 55 (39.0%) |
| High School Diploma | 371 (48.1%) | 401 (51.9%) |
| College or Associate's Degree | 194 (42.9%) | 258 (57.1%) |
| Bachelor's Degree | 281 (71.7%) | 111 (28.3%) |
| Graduate Degree | 242 (87.7%) | 34 (12.3%) |
| Total | 1,173 (57.7%) | 860 (42.3%) |
Income in Shawnee County
Income Overview in Shawnee County
Per Capita Income in Shawnee County is $36,011, while median incomes of families and households are $85,262 and $63,463 respectively.
| Characteristic | Number | Measure |
| Per Capita Income | 178,625 | $36,011 |
| Median Family Income | 45,160 | $85,262 |
| Mean Family Income | 45,160 | $104,785 |
| Median Household Income | 74,394 | $63,463 |
| Mean Household Income | 74,394 | $84,874 |
| Income Deficit | 45,160 | $10,605 |
| Wage / Income Gap (%) | 178,625 | 24.85% |
| Wage / Income Gap ($) | 178,625 | 75.15¢ per $1 |
| Gini / Inequality Index | 178,625 | 0.45 |
Earnings by Sex in Shawnee County
Average Earnings in Shawnee County are $41,046, $47,229 for men and $35,491 for women, a difference of 24.8%.
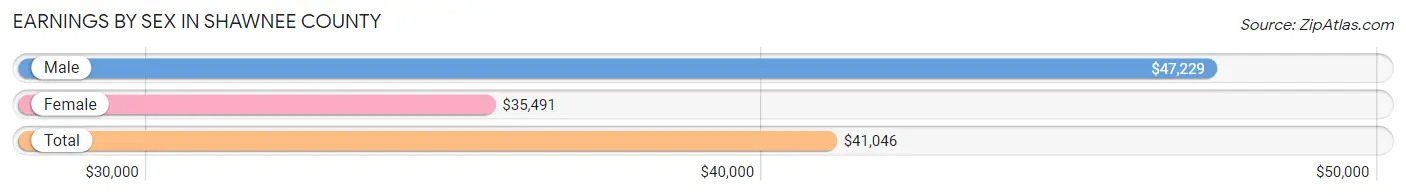
| Sex | Number | Average Earnings |
| Male | 46,996 (50.6%) | $47,229 |
| Female | 45,800 (49.4%) | $35,491 |
| Total | 92,796 (100.0%) | $41,046 |
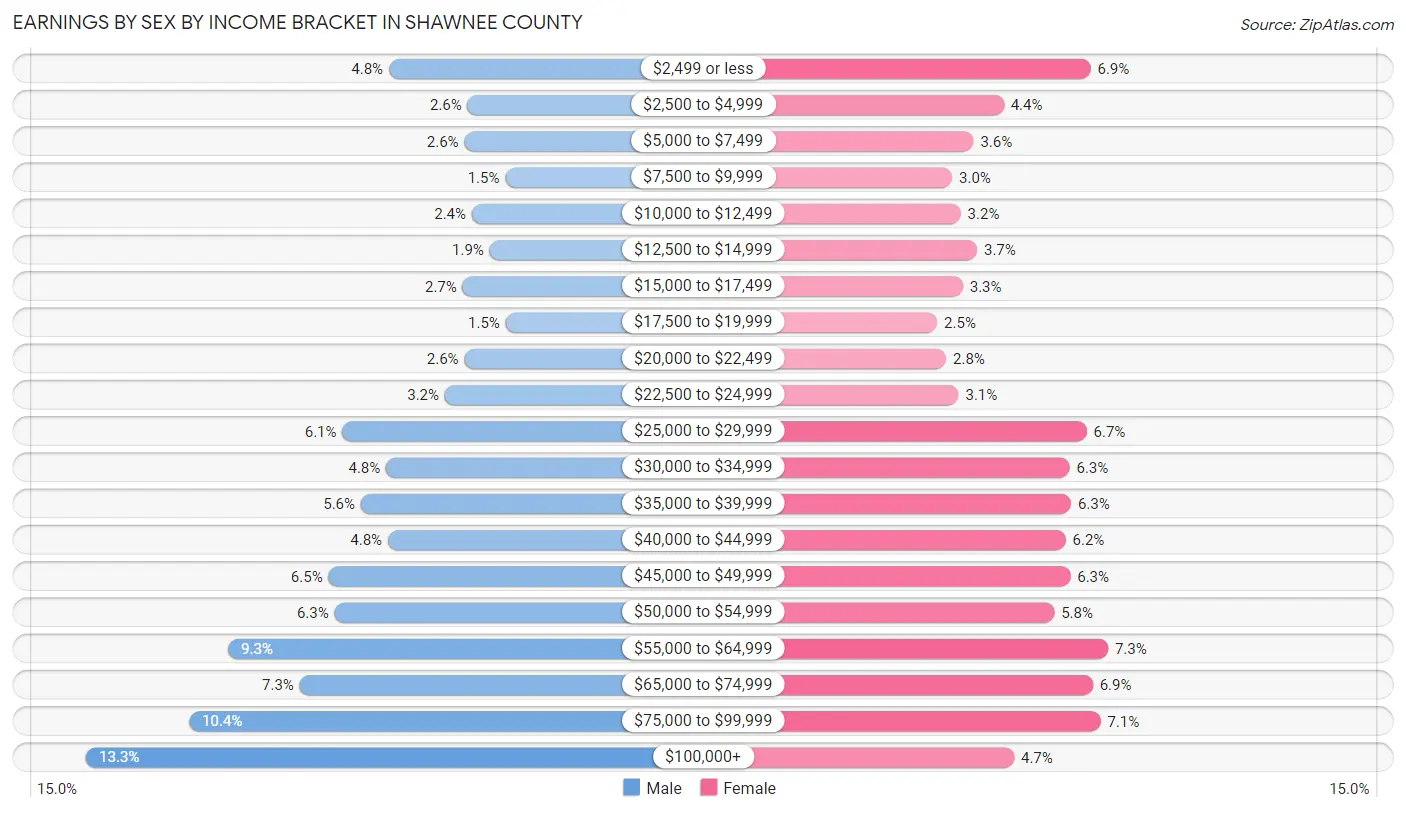
Earnings by Sex by Income Bracket in Shawnee County
The most common earnings brackets in Shawnee County are $100,000+ for men (6,237 | 13.3%) and $55,000 to $64,999 for women (3,361 | 7.3%).
| Income | Male | Female |
| $2,499 or less | 2,235 (4.8%) | 3,139 (6.9%) |
| $2,500 to $4,999 | 1,199 (2.5%) | 2,021 (4.4%) |
| $5,000 to $7,499 | 1,242 (2.6%) | 1,630 (3.6%) |
| $7,500 to $9,999 | 699 (1.5%) | 1,354 (3.0%) |
| $10,000 to $12,499 | 1,143 (2.4%) | 1,467 (3.2%) |
| $12,500 to $14,999 | 909 (1.9%) | 1,676 (3.7%) |
| $15,000 to $17,499 | 1,262 (2.7%) | 1,491 (3.3%) |
| $17,500 to $19,999 | 695 (1.5%) | 1,165 (2.5%) |
| $20,000 to $22,499 | 1,242 (2.6%) | 1,276 (2.8%) |
| $22,500 to $24,999 | 1,499 (3.2%) | 1,438 (3.1%) |
| $25,000 to $29,999 | 2,853 (6.1%) | 3,085 (6.7%) |
| $30,000 to $34,999 | 2,274 (4.8%) | 2,865 (6.3%) |
| $35,000 to $39,999 | 2,607 (5.6%) | 2,885 (6.3%) |
| $40,000 to $44,999 | 2,249 (4.8%) | 2,817 (6.1%) |
| $45,000 to $49,999 | 3,035 (6.5%) | 2,876 (6.3%) |
| $50,000 to $54,999 | 2,956 (6.3%) | 2,669 (5.8%) |
| $55,000 to $64,999 | 4,362 (9.3%) | 3,361 (7.3%) |
| $65,000 to $74,999 | 3,418 (7.3%) | 3,165 (6.9%) |
| $75,000 to $99,999 | 4,880 (10.4%) | 3,266 (7.1%) |
| $100,000+ | 6,237 (13.3%) | 2,154 (4.7%) |
| Total | 46,996 (100.0%) | 45,800 (100.0%) |
Earnings by Sex by Educational Attainment in Shawnee County
Average earnings in Shawnee County are $52,622 for men and $40,923 for women, a difference of 22.2%. Men with an educational attainment of graduate degree enjoy the highest average annual earnings of $74,610, while those with less than high school education earn the least with $33,532. Women with an educational attainment of graduate degree earn the most with the average annual earnings of $64,089, while those with less than high school education have the smallest earnings of $15,041.
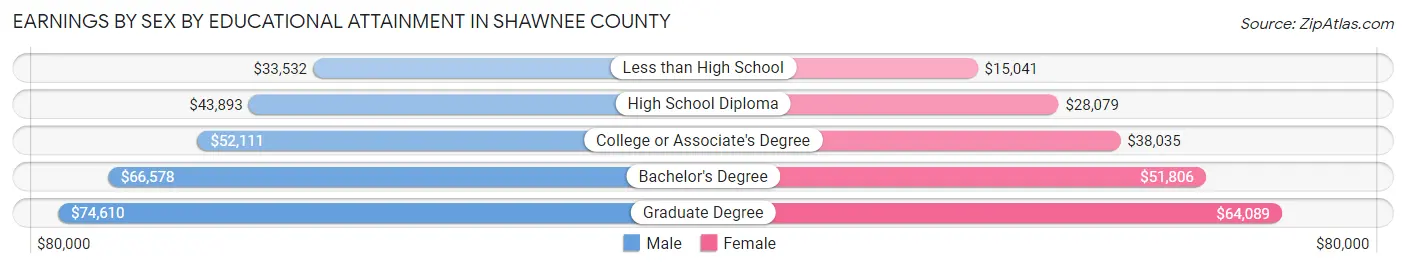
| Educational Attainment | Male Income | Female Income |
| Less than High School | $33,532 | $15,041 |
| High School Diploma | $43,893 | $28,079 |
| College or Associate's Degree | $52,111 | $38,035 |
| Bachelor's Degree | $66,578 | $51,806 |
| Graduate Degree | $74,610 | $64,089 |
| Total | $52,622 | $40,923 |
Family Income in Shawnee County
Family Income Brackets in Shawnee County
According to the Shawnee County family income data, there are 10,884 families falling into the $100,000 to $149,999 income range, which is the most common income bracket and makes up 24.1% of all families. Conversely, the $10,000 to $14,999 income bracket is the least frequent group with only 677 families (1.5%) belonging to this category.
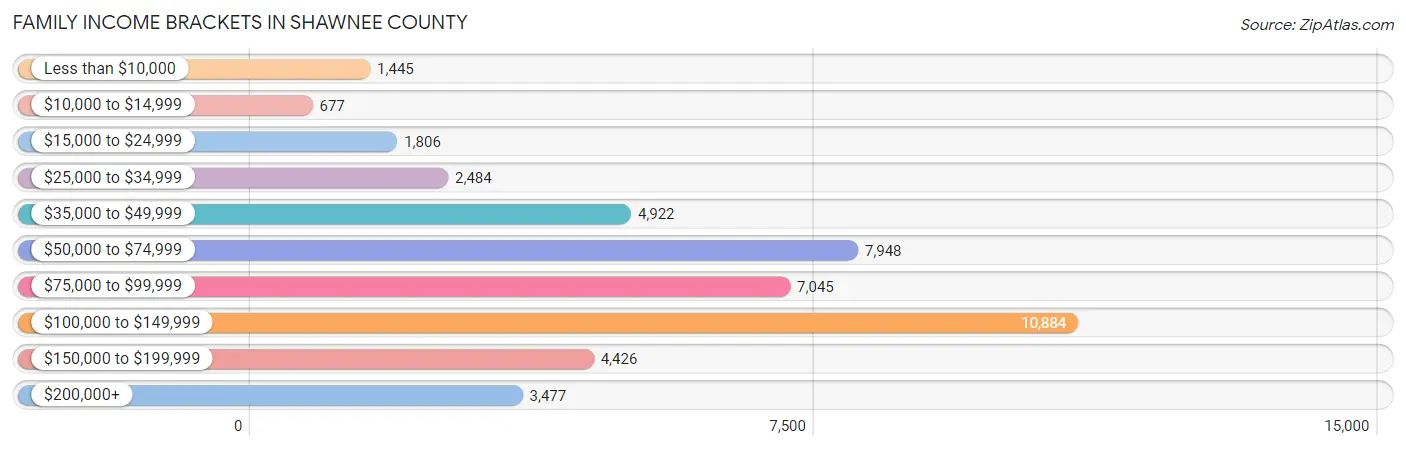
| Income Bracket | # Families | % Families |
| Less than $10,000 | 1,445 | 3.2% |
| $10,000 to $14,999 | 677 | 1.5% |
| $15,000 to $24,999 | 1,806 | 4.0% |
| $25,000 to $34,999 | 2,484 | 5.5% |
| $35,000 to $49,999 | 4,922 | 10.9% |
| $50,000 to $74,999 | 7,948 | 17.6% |
| $75,000 to $99,999 | 7,045 | 15.6% |
| $100,000 to $149,999 | 10,884 | 24.1% |
| $150,000 to $199,999 | 4,426 | 9.8% |
| $200,000+ | 3,477 | 7.7% |
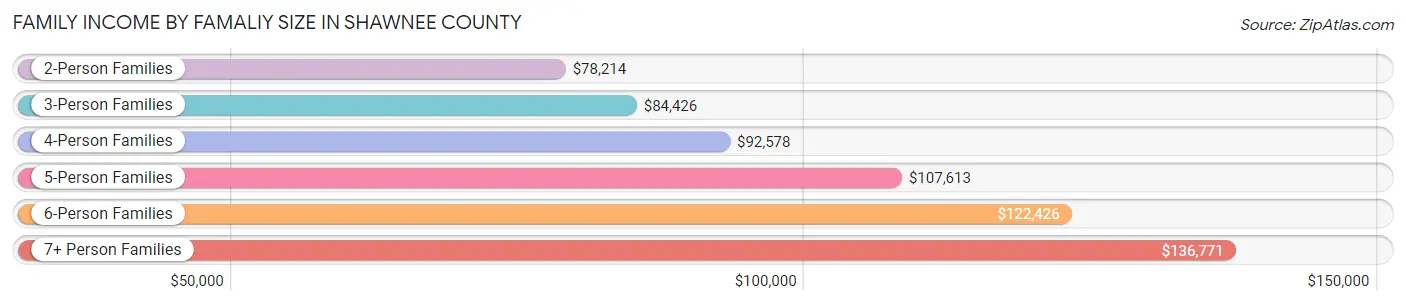
Family Income by Famaliy Size in Shawnee County
7+ person families (521 | 1.1%) account for the highest median family income in Shawnee County with $136,771 per family, while 2-person families (23,092 | 51.1%) have the highest median income of $39,107 per family member.
| Income Bracket | # Families | Median Income |
| 2-Person Families | 23,092 (51.1%) | $78,214 |
| 3-Person Families | 9,241 (20.5%) | $84,426 |
| 4-Person Families | 7,838 (17.4%) | $92,578 |
| 5-Person Families | 3,337 (7.4%) | $107,613 |
| 6-Person Families | 1,131 (2.5%) | $122,426 |
| 7+ Person Families | 521 (1.1%) | $136,771 |
| Total | 45,160 (100.0%) | $85,262 |
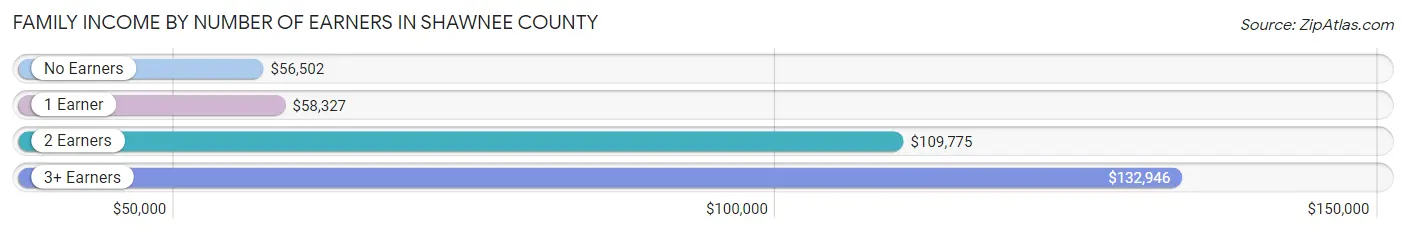
Family Income by Number of Earners in Shawnee County
The median family income in Shawnee County is $85,262, with families comprising 3+ earners (4,182) having the highest median family income of $132,946, while families with no earners (7,671) have the lowest median family income of $56,502, accounting for 9.3% and 17.0% of families, respectively.
| Number of Earners | # Families | Median Income |
| No Earners | 7,671 (17.0%) | $56,502 |
| 1 Earner | 13,867 (30.7%) | $58,327 |
| 2 Earners | 19,440 (43.0%) | $109,775 |
| 3+ Earners | 4,182 (9.3%) | $132,946 |
| Total | 45,160 (100.0%) | $85,262 |
Household Income in Shawnee County
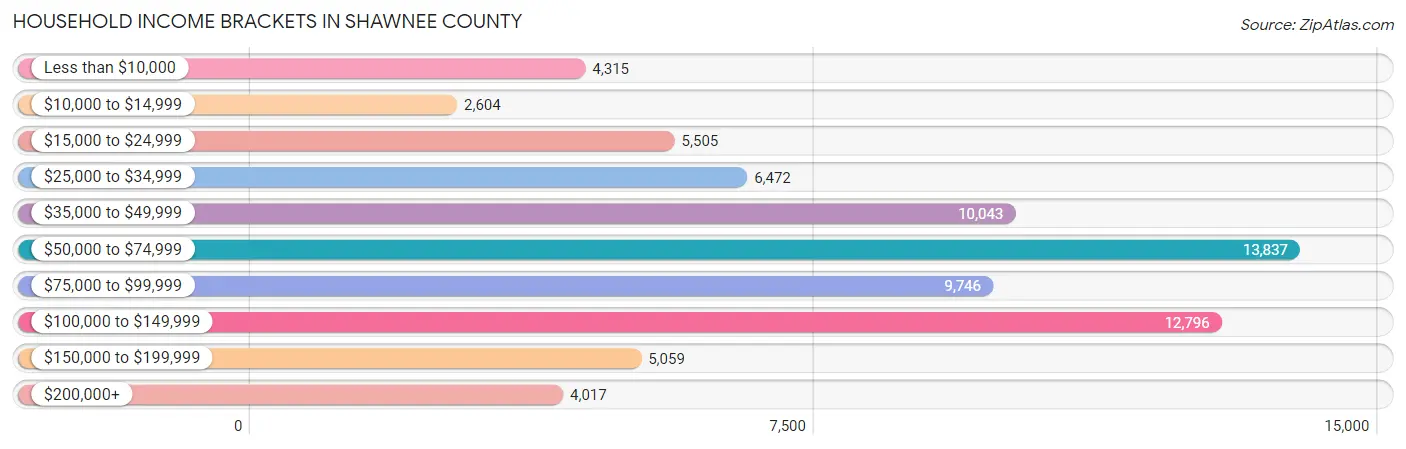
Household Income Brackets in Shawnee County
With 13,837 households falling in the category, the $50,000 to $74,999 income range is the most frequent in Shawnee County, accounting for 18.6% of all households. In contrast, only 2,604 households (3.5%) fall into the $10,000 to $14,999 income bracket, making it the least populous group.
| Income Bracket | # Households | % Households |
| Less than $10,000 | 4,315 | 5.8% |
| $10,000 to $14,999 | 2,604 | 3.5% |
| $15,000 to $24,999 | 5,505 | 7.4% |
| $25,000 to $34,999 | 6,472 | 8.7% |
| $35,000 to $49,999 | 10,043 | 13.5% |
| $50,000 to $74,999 | 13,837 | 18.6% |
| $75,000 to $99,999 | 9,746 | 13.1% |
| $100,000 to $149,999 | 12,796 | 17.2% |
| $150,000 to $199,999 | 5,059 | 6.8% |
| $200,000+ | 4,017 | 5.4% |
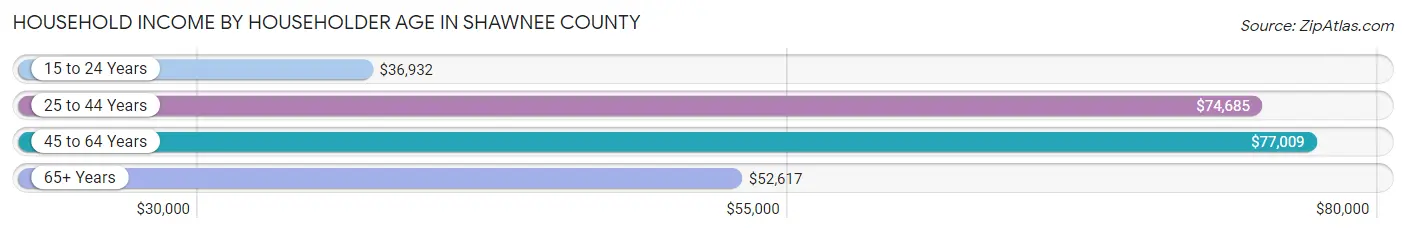
Household Income by Householder Age in Shawnee County
The median household income in Shawnee County is $63,463, with the highest median household income of $77,009 found in the 45 to 64 years age bracket for the primary householder. A total of 26,207 households (35.2%) fall into this category. Meanwhile, the 15 to 24 years age bracket for the primary householder has the lowest median household income of $36,932, with 4,284 households (5.8%) in this group.
| Income Bracket | # Households | Median Income |
| 15 to 24 Years | 4,284 (5.8%) | $36,932 |
| 25 to 44 Years | 21,902 (29.4%) | $74,685 |
| 45 to 64 Years | 26,207 (35.2%) | $77,009 |
| 65+ Years | 22,001 (29.6%) | $52,617 |
| Total | 74,394 (100.0%) | $63,463 |
Poverty in Shawnee County
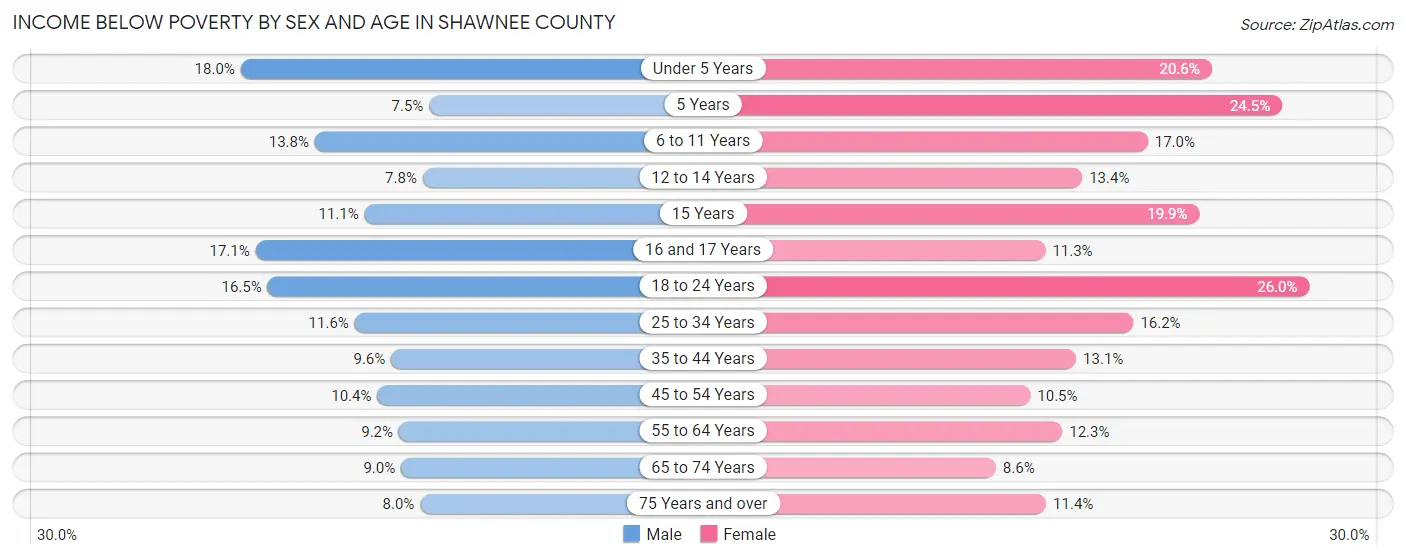
Income Below Poverty by Sex and Age in Shawnee County
With 11.3% poverty level for males and 14.3% for females among the residents of Shawnee County, under 5 year old males and 18 to 24 year old females are the most vulnerable to poverty, with 963 males (18.0%) and 1,921 females (26.0%) in their respective age groups living below the poverty level.
| Age Bracket | Male | Female |
| Under 5 Years | 963 (18.0%) | 1,018 (20.6%) |
| 5 Years | 99 (7.5%) | 238 (24.5%) |
| 6 to 11 Years | 979 (13.8%) | 1,128 (17.0%) |
| 12 to 14 Years | 267 (7.8%) | 486 (13.4%) |
| 15 Years | 143 (11.1%) | 216 (19.9%) |
| 16 and 17 Years | 408 (17.1%) | 288 (11.3%) |
| 18 to 24 Years | 1,213 (16.5%) | 1,921 (26.0%) |
| 25 to 34 Years | 1,226 (11.6%) | 1,702 (16.2%) |
| 35 to 44 Years | 1,030 (9.6%) | 1,426 (13.1%) |
| 45 to 54 Years | 1,044 (10.4%) | 1,062 (10.5%) |
| 55 to 64 Years | 1,028 (9.2%) | 1,535 (12.3%) |
| 65 to 74 Years | 809 (9.0%) | 881 (8.6%) |
| 75 Years and over | 416 (8.0%) | 869 (11.4%) |
| Total | 9,625 (11.3%) | 12,770 (14.3%) |
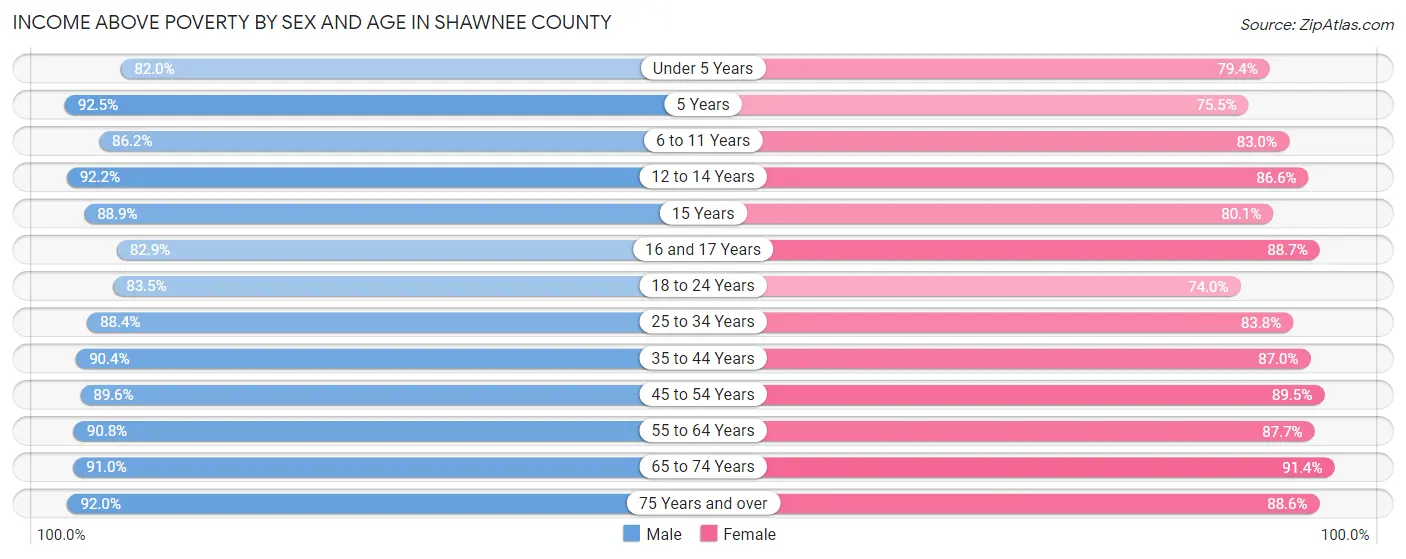
Income Above Poverty by Sex and Age in Shawnee County
According to the poverty statistics in Shawnee County, males aged 5 years and females aged 65 to 74 years are the age groups that are most secure financially, with 92.5% of males and 91.4% of females in these age groups living above the poverty line.
| Age Bracket | Male | Female |
| Under 5 Years | 4,396 (82.0%) | 3,926 (79.4%) |
| 5 Years | 1,226 (92.5%) | 733 (75.5%) |
| 6 to 11 Years | 6,096 (86.2%) | 5,490 (83.0%) |
| 12 to 14 Years | 3,142 (92.2%) | 3,144 (86.6%) |
| 15 Years | 1,149 (88.9%) | 869 (80.1%) |
| 16 and 17 Years | 1,972 (82.9%) | 2,252 (88.7%) |
| 18 to 24 Years | 6,150 (83.5%) | 5,459 (74.0%) |
| 25 to 34 Years | 9,327 (88.4%) | 8,778 (83.8%) |
| 35 to 44 Years | 9,712 (90.4%) | 9,503 (87.0%) |
| 45 to 54 Years | 9,033 (89.6%) | 9,051 (89.5%) |
| 55 to 64 Years | 10,190 (90.8%) | 10,961 (87.7%) |
| 65 to 74 Years | 8,138 (91.0%) | 9,384 (91.4%) |
| 75 Years and over | 4,802 (92.0%) | 6,770 (88.6%) |
| Total | 75,333 (88.7%) | 76,320 (85.7%) |
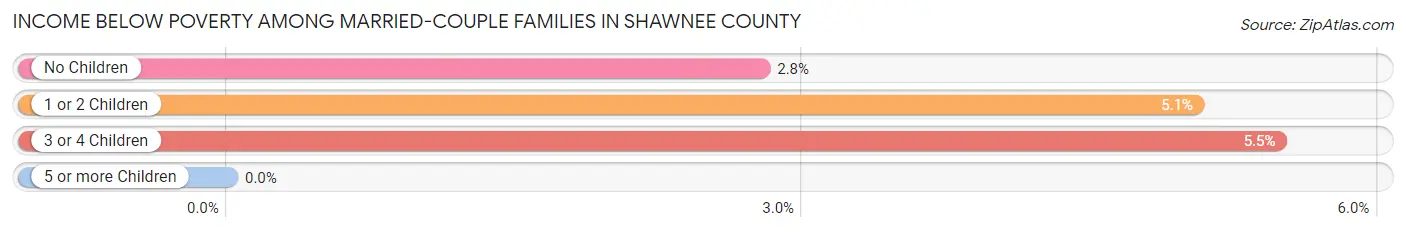
Income Below Poverty Among Married-Couple Families in Shawnee County
The poverty statistics for married-couple families in Shawnee County show that 3.7% or 1,230 of the total 33,365 families live below the poverty line. Families with 3 or 4 children have the highest poverty rate of 5.5%, comprising of 158 families. On the other hand, families with 5 or more children have the lowest poverty rate of 0.0%, which includes 0 families.
| Children | Above Poverty | Below Poverty |
| No Children | 19,663 (97.2%) | 563 (2.8%) |
| 1 or 2 Children | 9,562 (95.0%) | 509 (5.1%) |
| 3 or 4 Children | 2,723 (94.5%) | 158 (5.5%) |
| 5 or more Children | 187 (100.0%) | 0 (0.0%) |
| Total | 32,135 (96.3%) | 1,230 (3.7%) |
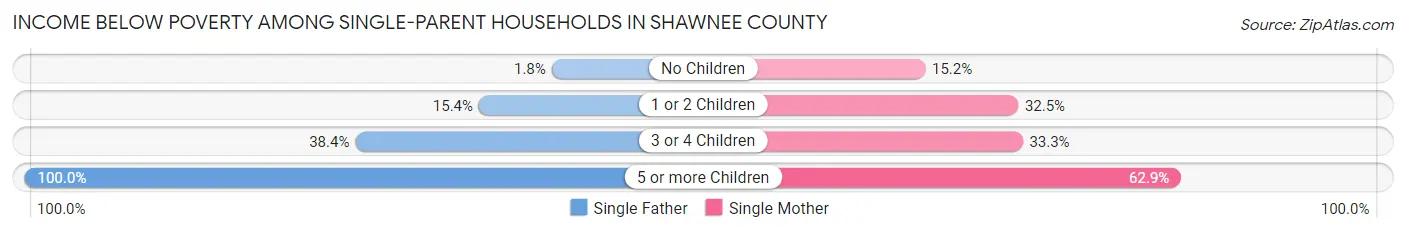
Income Below Poverty Among Single-Parent Households in Shawnee County
According to the poverty data in Shawnee County, 13.7% or 472 single-father households and 26.3% or 2,197 single-mother households are living below the poverty line. Among single-father households, those with 5 or more children have the highest poverty rate, with 12 households (100.0%) experiencing poverty. Likewise, among single-mother households, those with 5 or more children have the highest poverty rate, with 44 households (62.9%) falling below the poverty line.
| Children | Single Father | Single Mother |
| No Children | 22 (1.8%) | 476 (15.2%) |
| 1 or 2 Children | 282 (15.4%) | 1,303 (32.5%) |
| 3 or 4 Children | 156 (38.4%) | 374 (33.3%) |
| 5 or more Children | 12 (100.0%) | 44 (62.9%) |
| Total | 472 (13.7%) | 2,197 (26.3%) |
Income Below Poverty Among Married-Couple vs Single-Parent Households in Shawnee County
The poverty data for Shawnee County shows that 1,230 of the married-couple family households (3.7%) and 2,669 of the single-parent households (22.6%) are living below the poverty level. Within the married-couple family households, those with 3 or 4 children have the highest poverty rate, with 158 households (5.5%) falling below the poverty line. Among the single-parent households, those with 5 or more children have the highest poverty rate, with 56 household (68.3%) living below poverty.
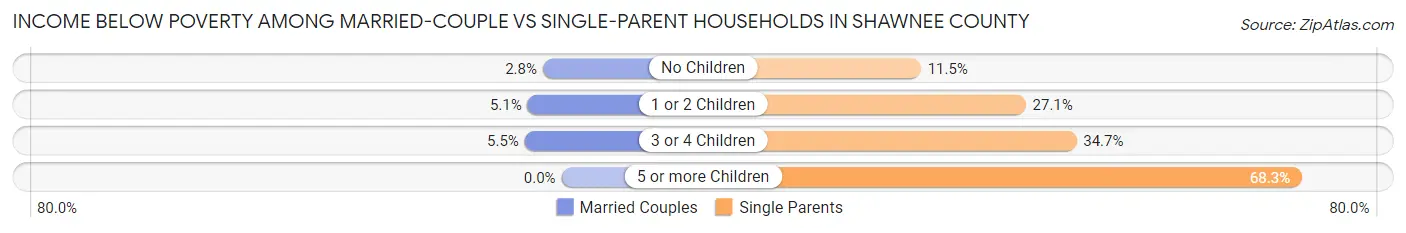
| Children | Married-Couple Families | Single-Parent Households |
| No Children | 563 (2.8%) | 498 (11.5%) |
| 1 or 2 Children | 509 (5.1%) | 1,585 (27.1%) |
| 3 or 4 Children | 158 (5.5%) | 530 (34.7%) |
| 5 or more Children | 0 (0.0%) | 56 (68.3%) |
| Total | 1,230 (3.7%) | 2,669 (22.6%) |
Employment Characteristics in Shawnee County
Employment by Class of Employer in Shawnee County
Among the 83,882 employed individuals in Shawnee County, private company employees (50,770 | 60.5%), not-for-profit organizations (8,802 | 10.5%), and local government employees (7,143 | 8.5%) make up the most common classes of employment.
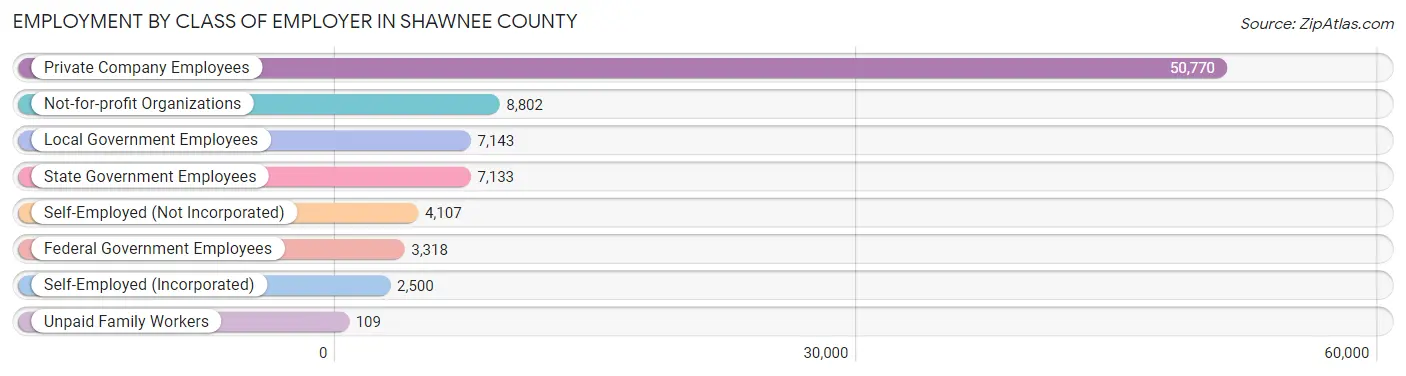
| Employer Class | # Employees | % Employees |
| Private Company Employees | 50,770 | 60.5% |
| Self-Employed (Incorporated) | 2,500 | 3.0% |
| Self-Employed (Not Incorporated) | 4,107 | 4.9% |
| Not-for-profit Organizations | 8,802 | 10.5% |
| Local Government Employees | 7,143 | 8.5% |
| State Government Employees | 7,133 | 8.5% |
| Federal Government Employees | 3,318 | 4.0% |
| Unpaid Family Workers | 109 | 0.1% |
| Total | 83,882 | 100.0% |
Employment Status by Age in Shawnee County
According to the labor force statistics for Shawnee County, out of the total population over 16 years of age (142,158), 62.4% or 88,707 individuals are in the labor force, with 4.2% or 3,726 of them unemployed. The age group with the highest labor force participation rate is 35 to 44 years, with 85.0% or 18,793 individuals in the labor force. Within the labor force, the 16 to 19 years age range has the highest percentage of unemployed individuals, with 10.0% or 505 of them being unemployed.
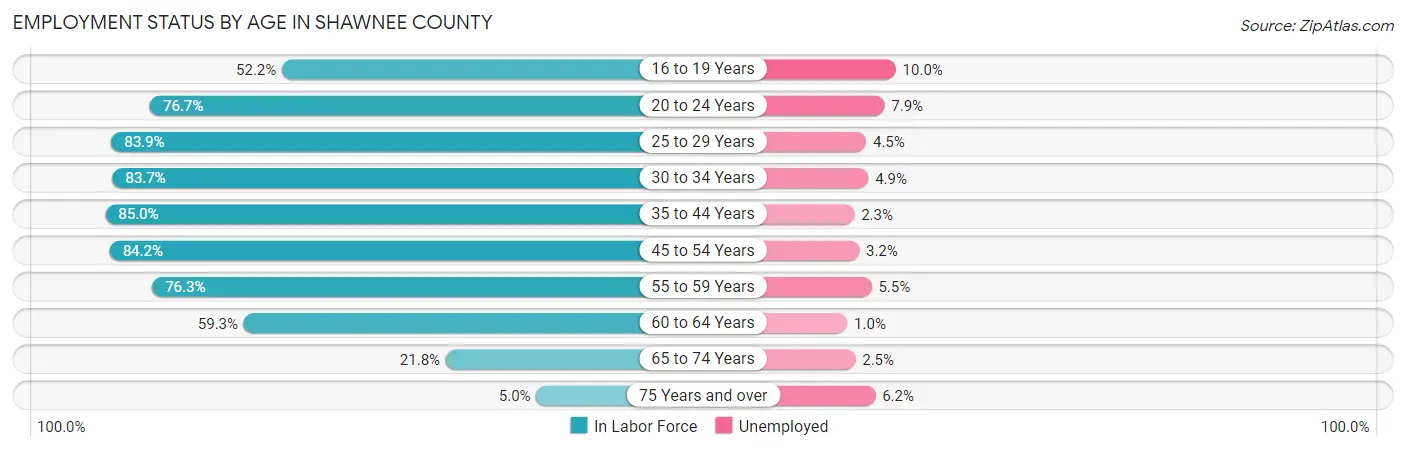
| Age Bracket | In Labor Force | Unemployed |
| 16 to 19 Years | 5,048 (52.2%) | 505 (10.0%) |
| 20 to 24 Years | 8,493 (76.7%) | 671 (7.9%) |
| 25 to 29 Years | 9,175 (83.9%) | 413 (4.5%) |
| 30 to 34 Years | 8,956 (83.7%) | 439 (4.9%) |
| 35 to 44 Years | 18,793 (85.0%) | 432 (2.3%) |
| 45 to 54 Years | 17,204 (84.2%) | 551 (3.2%) |
| 55 to 59 Years | 8,552 (76.3%) | 470 (5.5%) |
| 60 to 64 Years | 7,563 (59.3%) | 76 (1.0%) |
| 65 to 74 Years | 4,281 (21.8%) | 107 (2.5%) |
| 75 Years and over | 682 (5.0%) | 42 (6.2%) |
| Total | 88,707 (62.4%) | 3,726 (4.2%) |
Employment Status by Educational Attainment in Shawnee County
According to labor force statistics for Shawnee County, 79.7% of individuals (70,247) out of the total population between 25 and 64 years of age (88,139) are in the labor force, with 3.4% or 2,388 of them being unemployed. The group with the highest labor force participation rate are those with the educational attainment of bachelor's degree or higher, with 88.3% or 25,062 individuals in the labor force. Within the labor force, individuals with less than high school education have the highest percentage of unemployment, with 9.4% or 356 of them being unemployed.
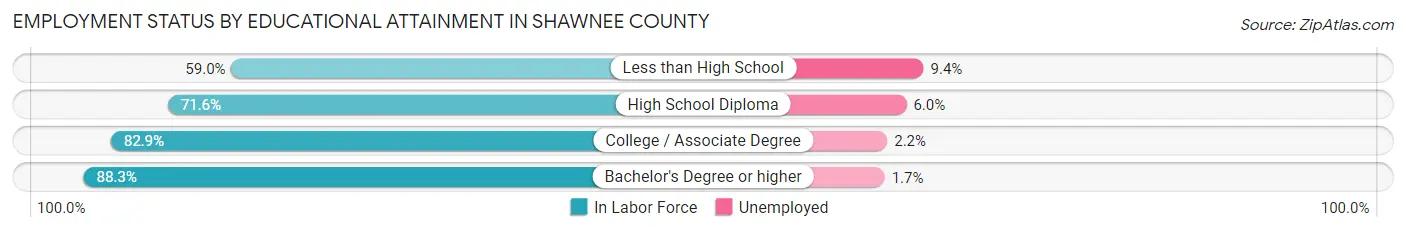
| Educational Attainment | In Labor Force | Unemployed |
| Less than High School | 3,783 (59.0%) | 603 (9.4%) |
| High School Diploma | 17,876 (71.6%) | 1,498 (6.0%) |
| College / Associate Degree | 23,525 (82.9%) | 624 (2.2%) |
| Bachelor's Degree or higher | 25,062 (88.3%) | 483 (1.7%) |
| Total | 70,247 (79.7%) | 2,997 (3.4%) |
Employment Occupations by Sex in Shawnee County
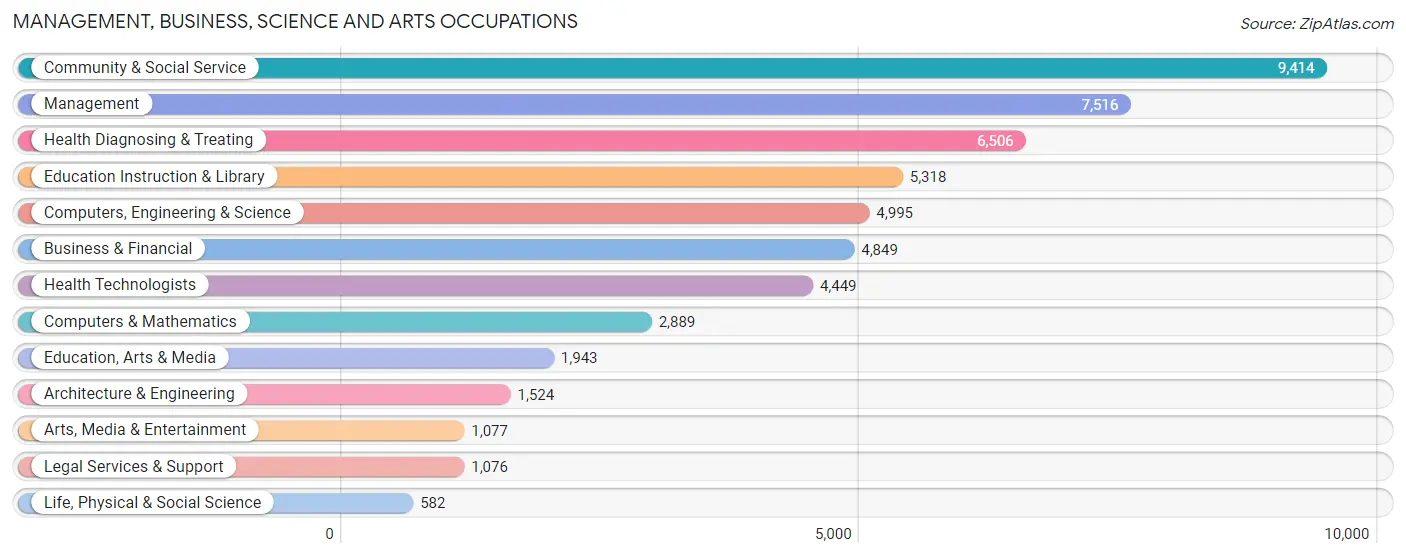
Management, Business, Science and Arts Occupations
The most common Management, Business, Science and Arts occupations in Shawnee County are Community & Social Service (9,414 | 11.1%), Management (7,516 | 8.9%), Health Diagnosing & Treating (6,506 | 7.7%), Education Instruction & Library (5,318 | 6.3%), and Computers, Engineering & Science (4,995 | 5.9%).
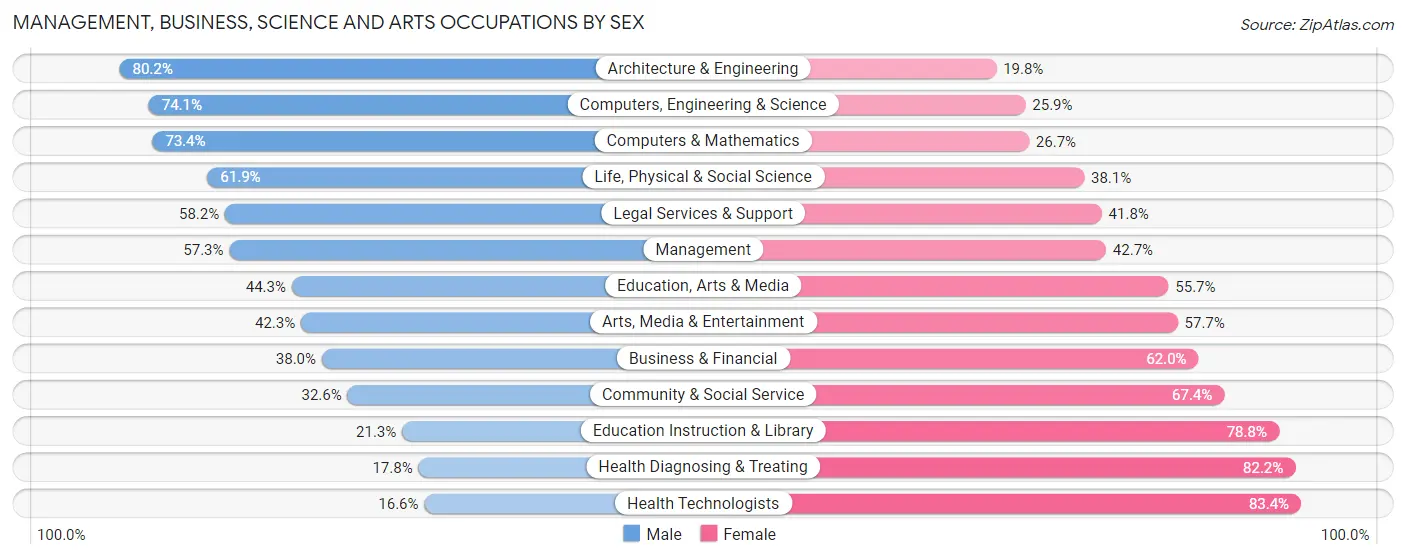
Management, Business, Science and Arts Occupations by Sex
Within the Management, Business, Science and Arts occupations in Shawnee County, the most male-oriented occupations are Architecture & Engineering (80.2%), Computers, Engineering & Science (74.1%), and Computers & Mathematics (73.4%), while the most female-oriented occupations are Health Technologists (83.4%), Health Diagnosing & Treating (82.2%), and Education Instruction & Library (78.7%).
| Occupation | Male | Female |
| Management | 4,306 (57.3%) | 3,210 (42.7%) |
| Business & Financial | 1,842 (38.0%) | 3,007 (62.0%) |
| Computers, Engineering & Science | 3,701 (74.1%) | 1,294 (25.9%) |
| Computers & Mathematics | 2,119 (73.4%) | 770 (26.7%) |
| Architecture & Engineering | 1,222 (80.2%) | 302 (19.8%) |
| Life, Physical & Social Science | 360 (61.9%) | 222 (38.1%) |
| Community & Social Service | 3,072 (32.6%) | 6,342 (67.4%) |
| Education, Arts & Media | 860 (44.3%) | 1,083 (55.7%) |
| Legal Services & Support | 626 (58.2%) | 450 (41.8%) |
| Education Instruction & Library | 1,130 (21.2%) | 4,188 (78.7%) |
| Arts, Media & Entertainment | 456 (42.3%) | 621 (57.7%) |
| Health Diagnosing & Treating | 1,160 (17.8%) | 5,346 (82.2%) |
| Health Technologists | 739 (16.6%) | 3,710 (83.4%) |
| Total (Category) | 14,081 (42.3%) | 19,199 (57.7%) |
| Total (Overall) | 43,157 (51.0%) | 41,506 (49.0%) |
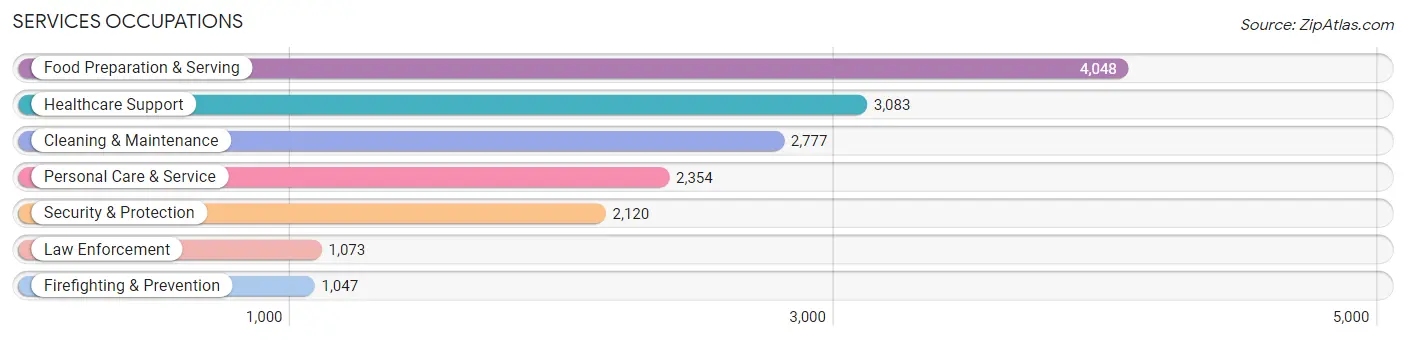
Services Occupations
The most common Services occupations in Shawnee County are Food Preparation & Serving (4,048 | 4.8%), Healthcare Support (3,083 | 3.6%), Cleaning & Maintenance (2,777 | 3.3%), Personal Care & Service (2,354 | 2.8%), and Security & Protection (2,120 | 2.5%).
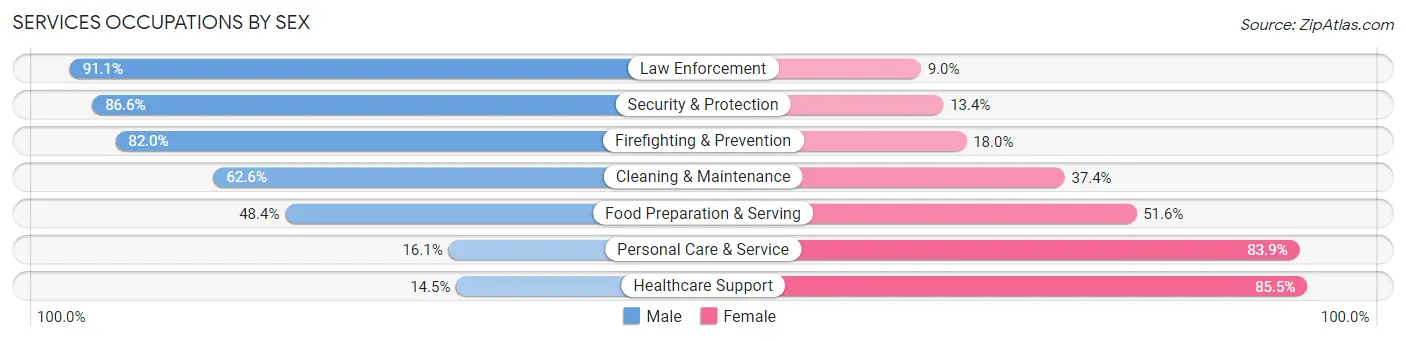
Services Occupations by Sex
Within the Services occupations in Shawnee County, the most male-oriented occupations are Law Enforcement (91.0%), Security & Protection (86.6%), and Firefighting & Prevention (82.0%), while the most female-oriented occupations are Healthcare Support (85.5%), Personal Care & Service (83.9%), and Food Preparation & Serving (51.6%).
| Occupation | Male | Female |
| Healthcare Support | 448 (14.5%) | 2,635 (85.5%) |
| Security & Protection | 1,836 (86.6%) | 284 (13.4%) |
| Firefighting & Prevention | 859 (82.0%) | 188 (18.0%) |
| Law Enforcement | 977 (91.0%) | 96 (8.9%) |
| Food Preparation & Serving | 1,959 (48.4%) | 2,089 (51.6%) |
| Cleaning & Maintenance | 1,738 (62.6%) | 1,039 (37.4%) |
| Personal Care & Service | 378 (16.1%) | 1,976 (83.9%) |
| Total (Category) | 6,359 (44.2%) | 8,023 (55.8%) |
| Total (Overall) | 43,157 (51.0%) | 41,506 (49.0%) |
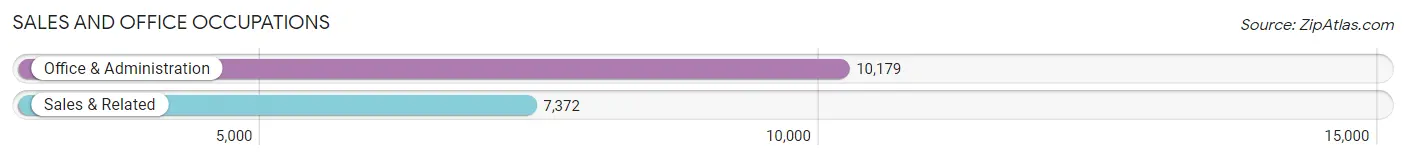
Sales and Office Occupations
The most common Sales and Office occupations in Shawnee County are Office & Administration (10,179 | 12.0%), and Sales & Related (7,372 | 8.7%).
Sales and Office Occupations by Sex
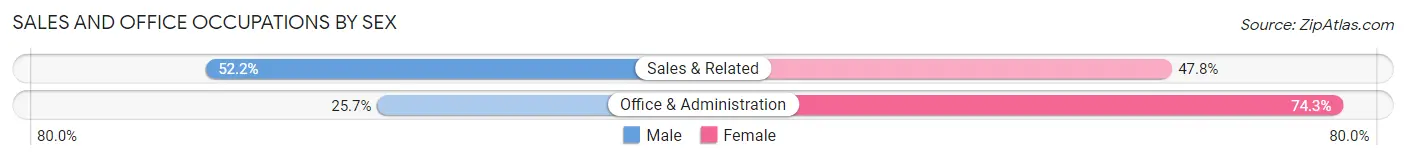
| Occupation | Male | Female |
| Sales & Related | 3,849 (52.2%) | 3,523 (47.8%) |
| Office & Administration | 2,620 (25.7%) | 7,559 (74.3%) |
| Total (Category) | 6,469 (36.9%) | 11,082 (63.1%) |
| Total (Overall) | 43,157 (51.0%) | 41,506 (49.0%) |
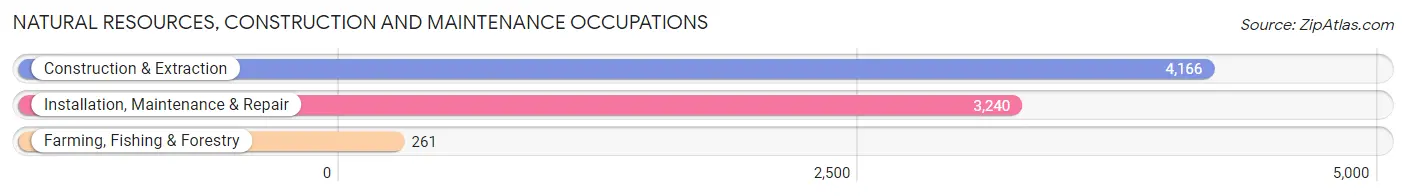
Natural Resources, Construction and Maintenance Occupations
The most common Natural Resources, Construction and Maintenance occupations in Shawnee County are Construction & Extraction (4,166 | 4.9%), Installation, Maintenance & Repair (3,240 | 3.8%), and Farming, Fishing & Forestry (261 | 0.3%).
Natural Resources, Construction and Maintenance Occupations by Sex
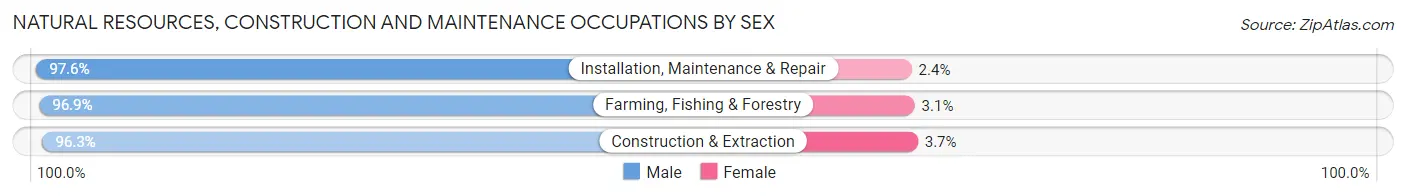
| Occupation | Male | Female |
| Farming, Fishing & Forestry | 253 (96.9%) | 8 (3.1%) |
| Construction & Extraction | 4,011 (96.3%) | 155 (3.7%) |
| Installation, Maintenance & Repair | 3,161 (97.6%) | 79 (2.4%) |
| Total (Category) | 7,425 (96.8%) | 242 (3.2%) |
| Total (Overall) | 43,157 (51.0%) | 41,506 (49.0%) |
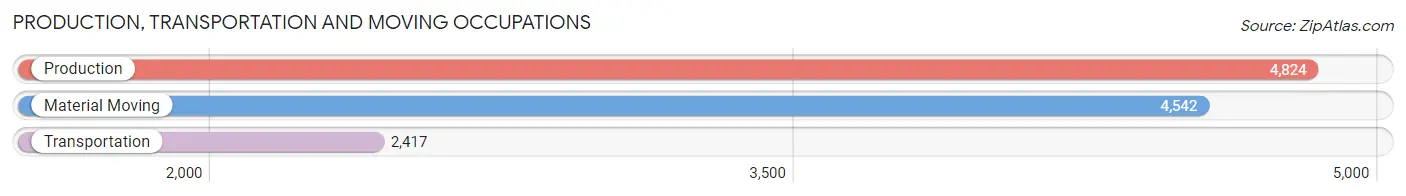
Production, Transportation and Moving Occupations
The most common Production, Transportation and Moving occupations in Shawnee County are Production (4,824 | 5.7%), Material Moving (4,542 | 5.4%), and Transportation (2,417 | 2.9%).
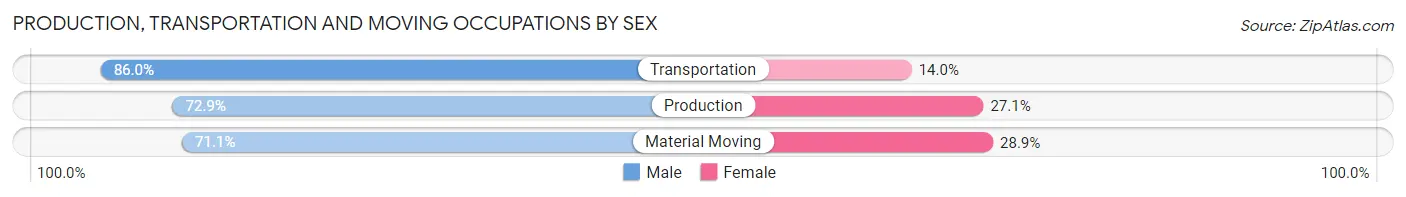
Production, Transportation and Moving Occupations by Sex
| Occupation | Male | Female |
| Production | 3,515 (72.9%) | 1,309 (27.1%) |
| Transportation | 2,079 (86.0%) | 338 (14.0%) |
| Material Moving | 3,229 (71.1%) | 1,313 (28.9%) |
| Total (Category) | 8,823 (74.9%) | 2,960 (25.1%) |
| Total (Overall) | 43,157 (51.0%) | 41,506 (49.0%) |
Employment Industries by Sex in Shawnee County
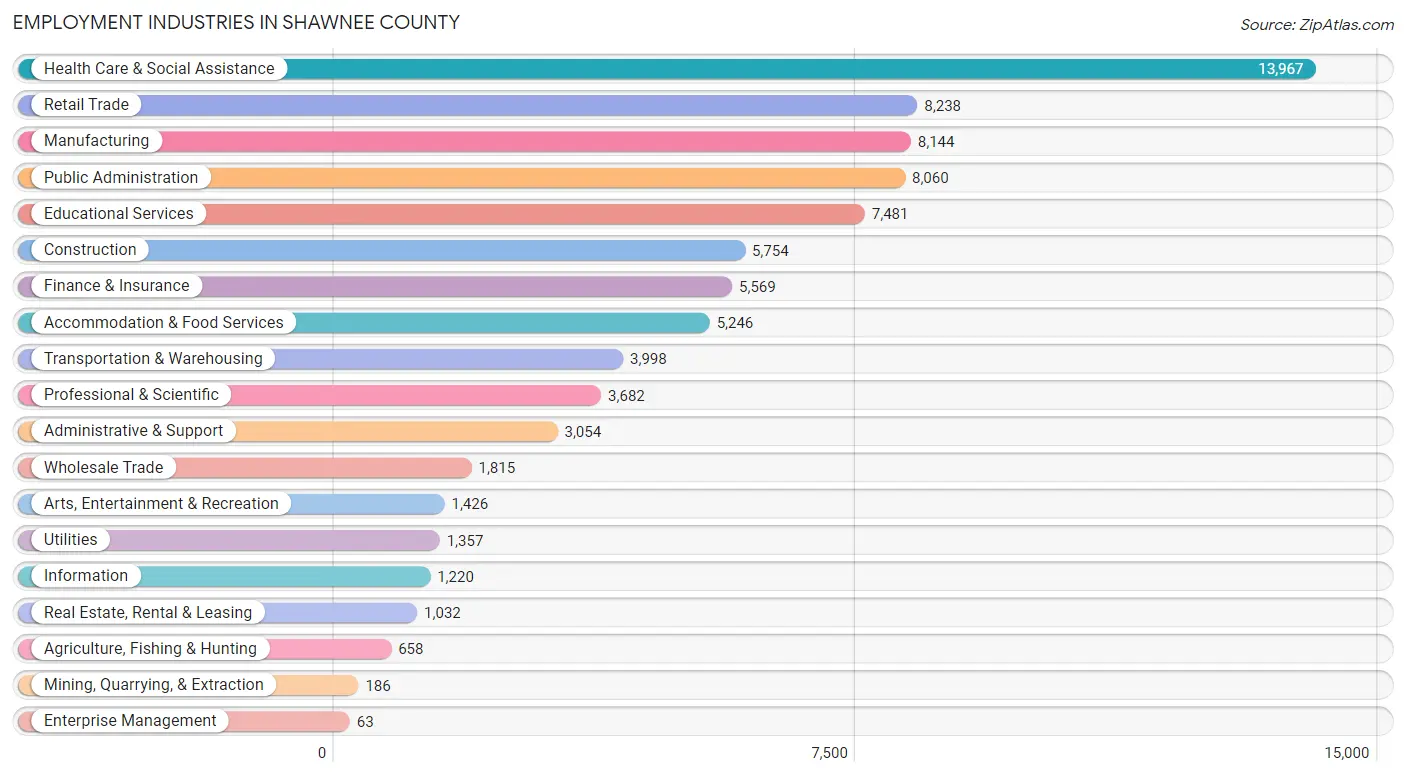
Employment Industries in Shawnee County
The major employment industries in Shawnee County include Health Care & Social Assistance (13,967 | 16.5%), Retail Trade (8,238 | 9.7%), Manufacturing (8,144 | 9.6%), Public Administration (8,060 | 9.5%), and Educational Services (7,481 | 8.8%).
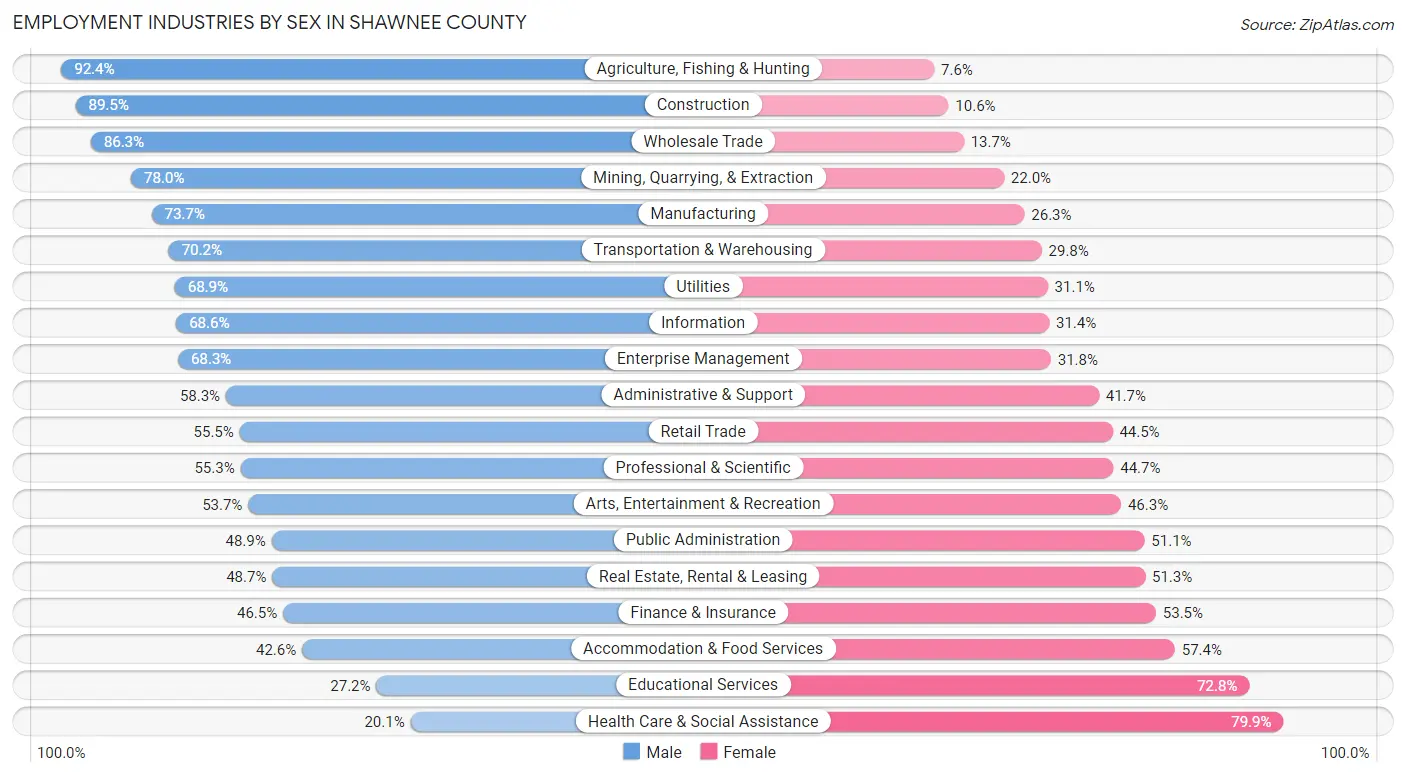
Employment Industries by Sex in Shawnee County
The Shawnee County industries that see more men than women are Agriculture, Fishing & Hunting (92.4%), Construction (89.4%), and Wholesale Trade (86.3%), whereas the industries that tend to have a higher number of women are Health Care & Social Assistance (79.9%), Educational Services (72.8%), and Accommodation & Food Services (57.4%).
| Industry | Male | Female |
| Agriculture, Fishing & Hunting | 608 (92.4%) | 50 (7.6%) |
| Mining, Quarrying, & Extraction | 145 (78.0%) | 41 (22.0%) |
| Construction | 5,147 (89.4%) | 607 (10.5%) |
| Manufacturing | 6,004 (73.7%) | 2,140 (26.3%) |
| Wholesale Trade | 1,566 (86.3%) | 249 (13.7%) |
| Retail Trade | 4,571 (55.5%) | 3,667 (44.5%) |
| Transportation & Warehousing | 2,805 (70.2%) | 1,193 (29.8%) |
| Utilities | 935 (68.9%) | 422 (31.1%) |
| Information | 837 (68.6%) | 383 (31.4%) |
| Finance & Insurance | 2,590 (46.5%) | 2,979 (53.5%) |
| Real Estate, Rental & Leasing | 503 (48.7%) | 529 (51.3%) |
| Professional & Scientific | 2,037 (55.3%) | 1,645 (44.7%) |
| Enterprise Management | 43 (68.2%) | 20 (31.8%) |
| Administrative & Support | 1,781 (58.3%) | 1,273 (41.7%) |
| Educational Services | 2,034 (27.2%) | 5,447 (72.8%) |
| Health Care & Social Assistance | 2,811 (20.1%) | 11,156 (79.9%) |
| Arts, Entertainment & Recreation | 766 (53.7%) | 660 (46.3%) |
| Accommodation & Food Services | 2,234 (42.6%) | 3,012 (57.4%) |
| Public Administration | 3,940 (48.9%) | 4,120 (51.1%) |
| Total | 43,157 (51.0%) | 41,506 (49.0%) |
Education in Shawnee County
School Enrollment in Shawnee County
The most common levels of schooling among the 40,391 students in Shawnee County are high school (9,272 | 23.0%), elementary school (9,215 | 22.8%), and middle school (9,127 | 22.6%).
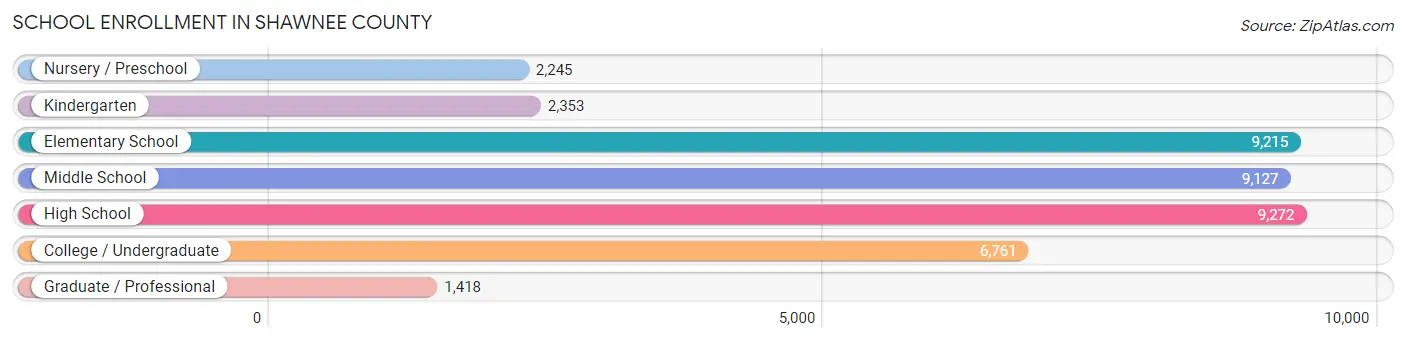
| School Level | # Students | % Students |
| Nursery / Preschool | 2,245 | 5.6% |
| Kindergarten | 2,353 | 5.8% |
| Elementary School | 9,215 | 22.8% |
| Middle School | 9,127 | 22.6% |
| High School | 9,272 | 23.0% |
| College / Undergraduate | 6,761 | 16.7% |
| Graduate / Professional | 1,418 | 3.5% |
| Total | 40,391 | 100.0% |
School Enrollment by Age by Funding Source in Shawnee County
Out of a total of 40,391 students who are enrolled in schools in Shawnee County, 4,847 (12.0%) attend a private institution, while the remaining 35,544 (88.0%) are enrolled in public schools. The age group of 3 to 4 year olds has the highest likelihood of being enrolled in private schools, with 579 (32.8% in the age bracket) enrolled. Conversely, the age group of 20 to 24 year olds has the lowest likelihood of being enrolled in a private school, with 3,043 (91.9% in the age bracket) attending a public institution.
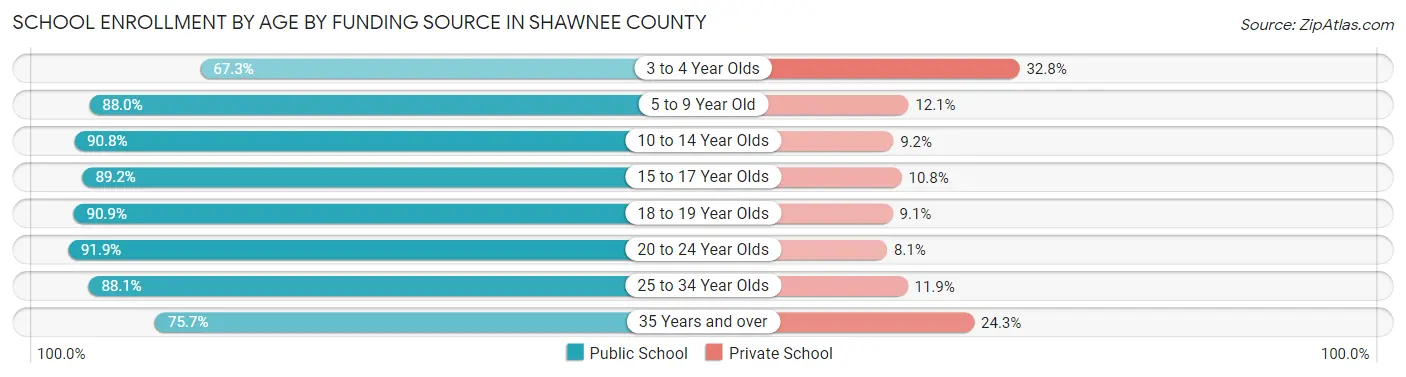
| Age Bracket | Public School | Private School |
| 3 to 4 Year Olds | 1,189 (67.2%) | 579 (32.8%) |
| 5 to 9 Year Old | 9,354 (87.9%) | 1,281 (12.0%) |
| 10 to 14 Year Olds | 10,244 (90.8%) | 1,043 (9.2%) |
| 15 to 17 Year Olds | 6,389 (89.2%) | 772 (10.8%) |
| 18 to 19 Year Olds | 2,471 (90.9%) | 248 (9.1%) |
| 20 to 24 Year Olds | 3,043 (91.9%) | 267 (8.1%) |
| 25 to 34 Year Olds | 1,458 (88.1%) | 197 (11.9%) |
| 35 Years and over | 1,405 (75.7%) | 451 (24.3%) |
| Total | 35,544 (88.0%) | 4,847 (12.0%) |
Educational Attainment by Field of Study in Shawnee County
Business (8,597 | 20.5%), education (7,596 | 18.1%), science & technology (5,499 | 13.1%), arts & humanities (3,468 | 8.3%), and social sciences (2,604 | 6.2%) are the most common fields of study among 41,881 individuals in Shawnee County who have obtained a bachelor's degree or higher.
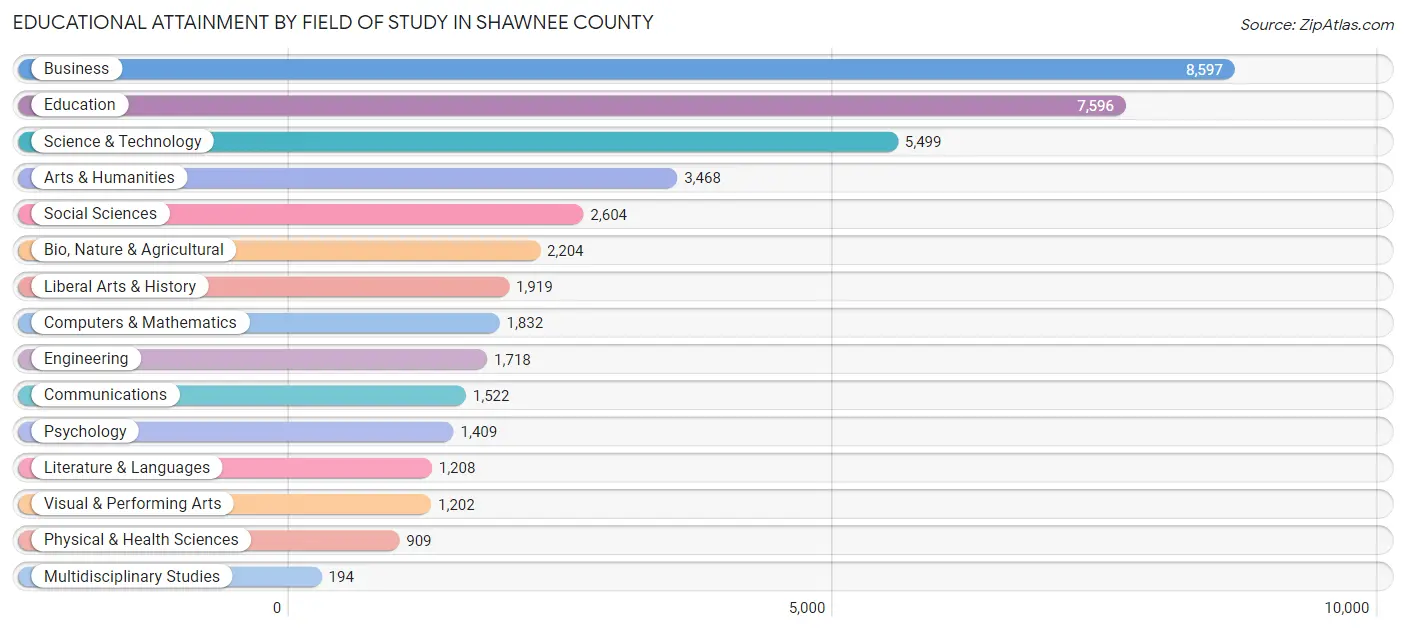
| Field of Study | # Graduates | % Graduates |
| Computers & Mathematics | 1,832 | 4.4% |
| Bio, Nature & Agricultural | 2,204 | 5.3% |
| Physical & Health Sciences | 909 | 2.2% |
| Psychology | 1,409 | 3.4% |
| Social Sciences | 2,604 | 6.2% |
| Engineering | 1,718 | 4.1% |
| Multidisciplinary Studies | 194 | 0.5% |
| Science & Technology | 5,499 | 13.1% |
| Business | 8,597 | 20.5% |
| Education | 7,596 | 18.1% |
| Literature & Languages | 1,208 | 2.9% |
| Liberal Arts & History | 1,919 | 4.6% |
| Visual & Performing Arts | 1,202 | 2.9% |
| Communications | 1,522 | 3.6% |
| Arts & Humanities | 3,468 | 8.3% |
| Total | 41,881 | 100.0% |
Transportation & Commute in Shawnee County
Vehicle Availability by Sex in Shawnee County
The most prevalent vehicle ownership categories in Shawnee County are males with 2 vehicles (19,096, accounting for 44.7%) and females with 2 vehicles (17,134, making up 47.0%).
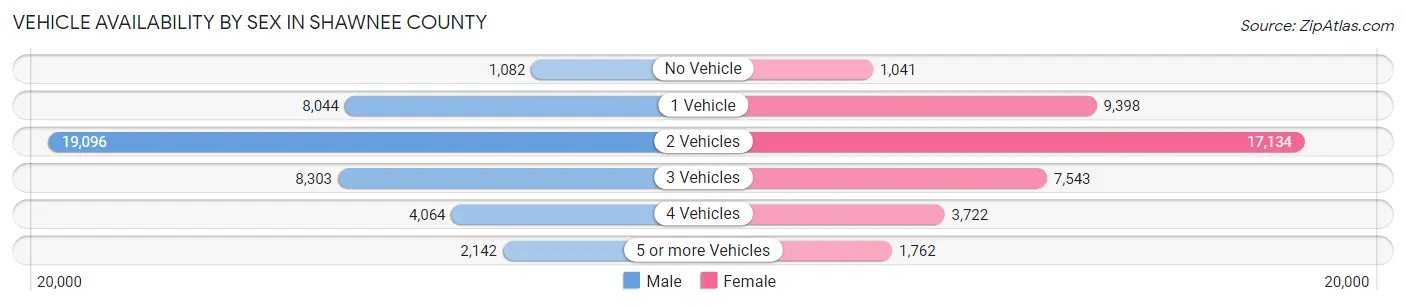
| Vehicles Available | Male | Female |
| No Vehicle | 1,082 (2.5%) | 1,041 (2.6%) |
| 1 Vehicle | 8,044 (18.8%) | 9,398 (23.2%) |
| 2 Vehicles | 19,096 (44.7%) | 17,134 (42.2%) |
| 3 Vehicles | 8,303 (19.4%) | 7,543 (18.6%) |
| 4 Vehicles | 4,064 (9.5%) | 3,722 (9.2%) |
| 5 or more Vehicles | 2,142 (5.0%) | 1,762 (4.3%) |
| Total | 42,731 (100.0%) | 40,600 (100.0%) |
Commute Time in Shawnee County
The most frequently occuring commute durations in Shawnee County are 15 to 19 minutes (20,210 commuters, 26.5%), 10 to 14 minutes (17,540 commuters, 23.0%), and 20 to 24 minutes (12,809 commuters, 16.8%).
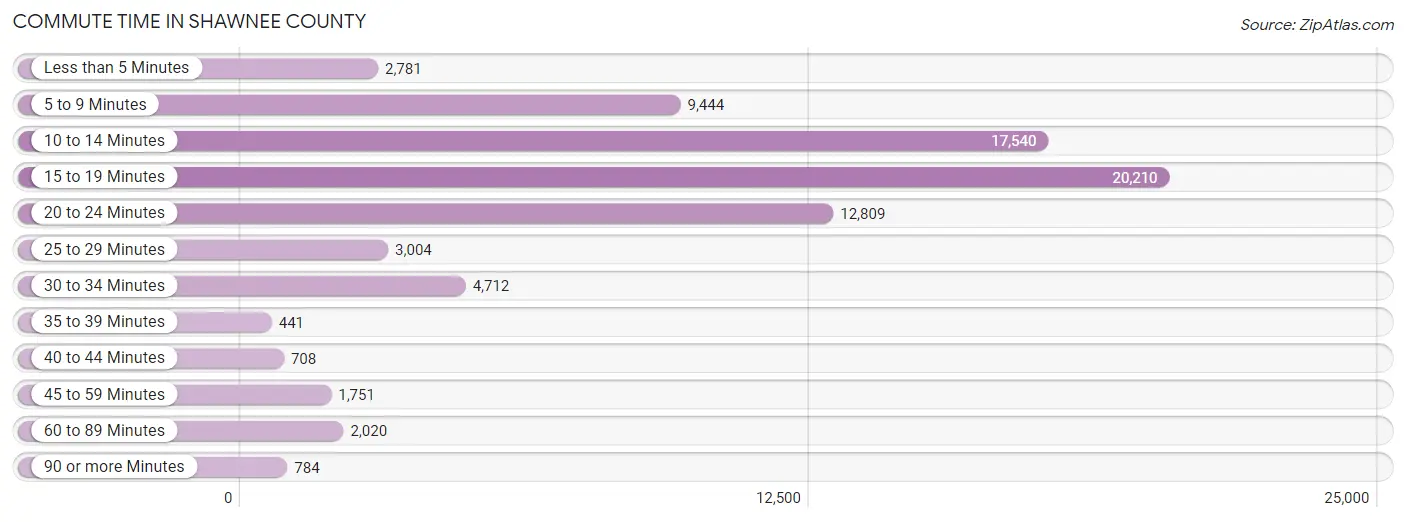
| Commute Time | # Commuters | % Commuters |
| Less than 5 Minutes | 2,781 | 3.6% |
| 5 to 9 Minutes | 9,444 | 12.4% |
| 10 to 14 Minutes | 17,540 | 23.0% |
| 15 to 19 Minutes | 20,210 | 26.5% |
| 20 to 24 Minutes | 12,809 | 16.8% |
| 25 to 29 Minutes | 3,004 | 3.9% |
| 30 to 34 Minutes | 4,712 | 6.2% |
| 35 to 39 Minutes | 441 | 0.6% |
| 40 to 44 Minutes | 708 | 0.9% |
| 45 to 59 Minutes | 1,751 | 2.3% |
| 60 to 89 Minutes | 2,020 | 2.6% |
| 90 or more Minutes | 784 | 1.0% |
Commute Time by Sex in Shawnee County
The most common commute times in Shawnee County are 15 to 19 minutes (10,846 commuters, 27.5%) for males and 15 to 19 minutes (9,364 commuters, 25.5%) for females.
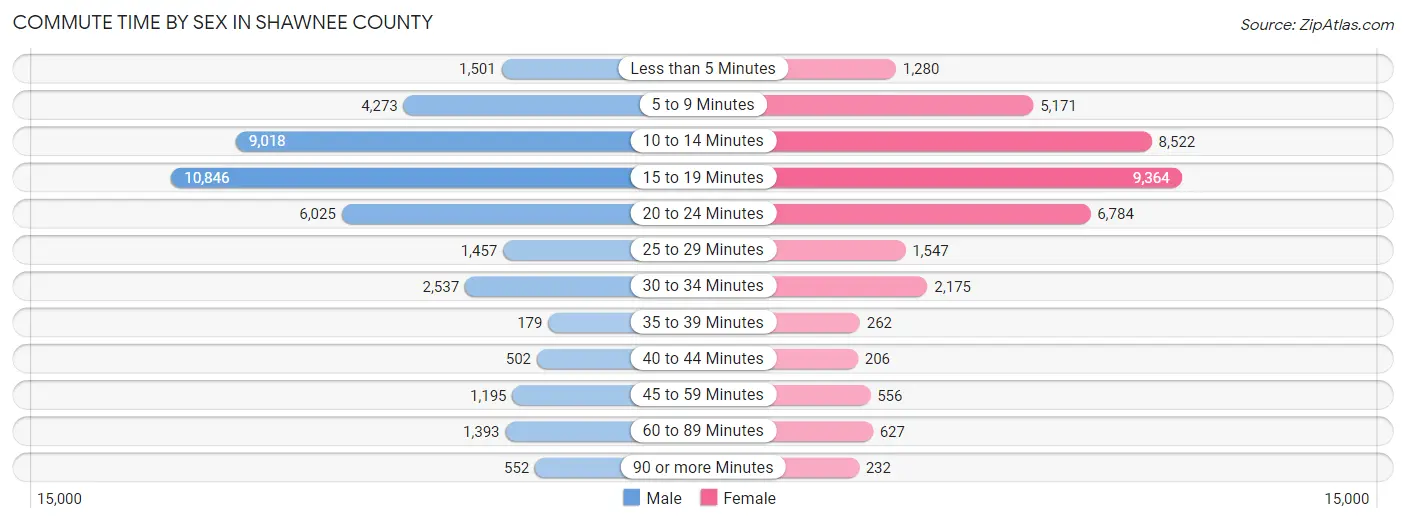
| Commute Time | Male | Female |
| Less than 5 Minutes | 1,501 (3.8%) | 1,280 (3.5%) |
| 5 to 9 Minutes | 4,273 (10.8%) | 5,171 (14.1%) |
| 10 to 14 Minutes | 9,018 (22.8%) | 8,522 (23.2%) |
| 15 to 19 Minutes | 10,846 (27.5%) | 9,364 (25.5%) |
| 20 to 24 Minutes | 6,025 (15.3%) | 6,784 (18.5%) |
| 25 to 29 Minutes | 1,457 (3.7%) | 1,547 (4.2%) |
| 30 to 34 Minutes | 2,537 (6.4%) | 2,175 (5.9%) |
| 35 to 39 Minutes | 179 (0.4%) | 262 (0.7%) |
| 40 to 44 Minutes | 502 (1.3%) | 206 (0.6%) |
| 45 to 59 Minutes | 1,195 (3.0%) | 556 (1.5%) |
| 60 to 89 Minutes | 1,393 (3.5%) | 627 (1.7%) |
| 90 or more Minutes | 552 (1.4%) | 232 (0.6%) |
Time of Departure to Work by Sex in Shawnee County
The most frequent times of departure to work in Shawnee County are 7:30 AM to 7:59 AM (7,848, 19.9%) for males and 7:30 AM to 7:59 AM (9,851, 26.8%) for females.
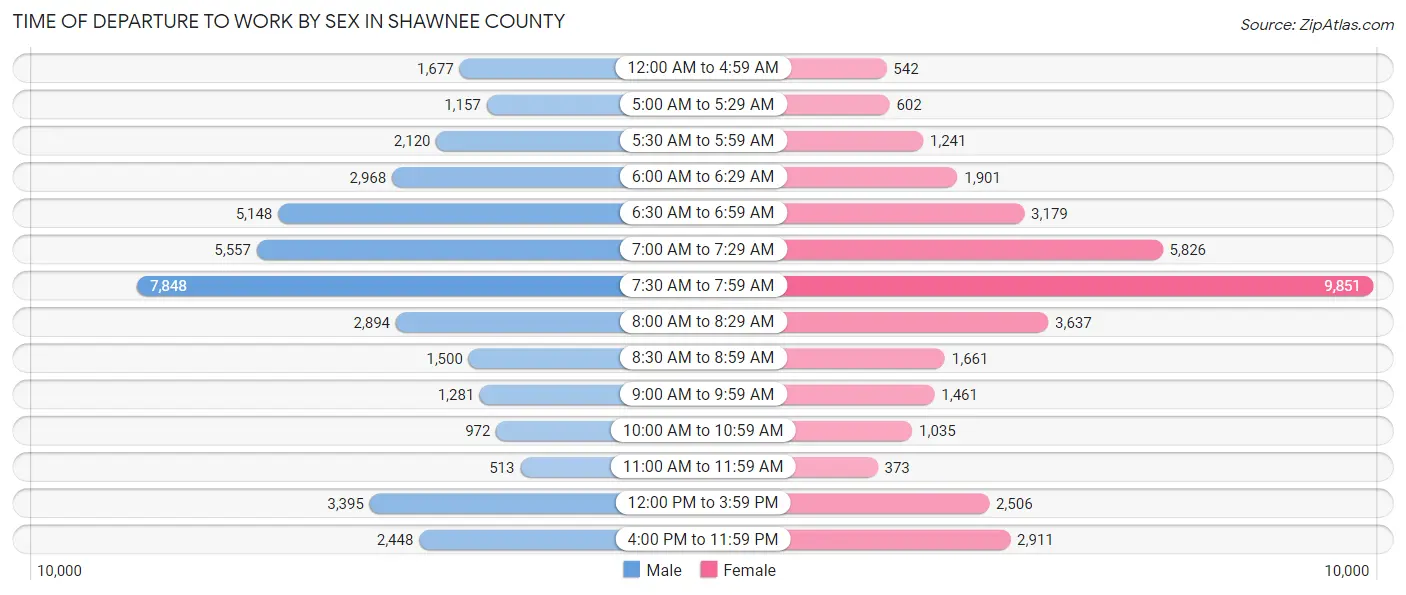
| Time of Departure | Male | Female |
| 12:00 AM to 4:59 AM | 1,677 (4.3%) | 542 (1.5%) |
| 5:00 AM to 5:29 AM | 1,157 (2.9%) | 602 (1.6%) |
| 5:30 AM to 5:59 AM | 2,120 (5.4%) | 1,241 (3.4%) |
| 6:00 AM to 6:29 AM | 2,968 (7.5%) | 1,901 (5.2%) |
| 6:30 AM to 6:59 AM | 5,148 (13.0%) | 3,179 (8.7%) |
| 7:00 AM to 7:29 AM | 5,557 (14.1%) | 5,826 (15.9%) |
| 7:30 AM to 7:59 AM | 7,848 (19.9%) | 9,851 (26.8%) |
| 8:00 AM to 8:29 AM | 2,894 (7.3%) | 3,637 (9.9%) |
| 8:30 AM to 8:59 AM | 1,500 (3.8%) | 1,661 (4.5%) |
| 9:00 AM to 9:59 AM | 1,281 (3.2%) | 1,461 (4.0%) |
| 10:00 AM to 10:59 AM | 972 (2.5%) | 1,035 (2.8%) |
| 11:00 AM to 11:59 AM | 513 (1.3%) | 373 (1.0%) |
| 12:00 PM to 3:59 PM | 3,395 (8.6%) | 2,506 (6.8%) |
| 4:00 PM to 11:59 PM | 2,448 (6.2%) | 2,911 (7.9%) |
| Total | 39,478 (100.0%) | 36,726 (100.0%) |
Housing Occupancy in Shawnee County
Occupancy by Ownership in Shawnee County
Of the total 74,394 dwellings in Shawnee County, owner-occupied units account for 49,740 (66.9%), while renter-occupied units make up 24,654 (33.1%).
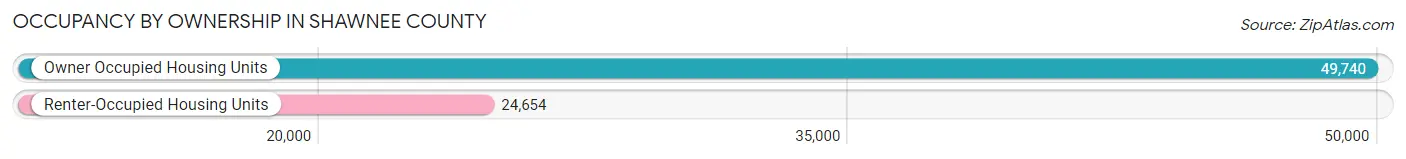
| Occupancy | # Housing Units | % Housing Units |
| Owner Occupied Housing Units | 49,740 | 66.9% |
| Renter-Occupied Housing Units | 24,654 | 33.1% |
| Total Occupied Housing Units | 74,394 | 100.0% |
Occupancy by Household Size in Shawnee County
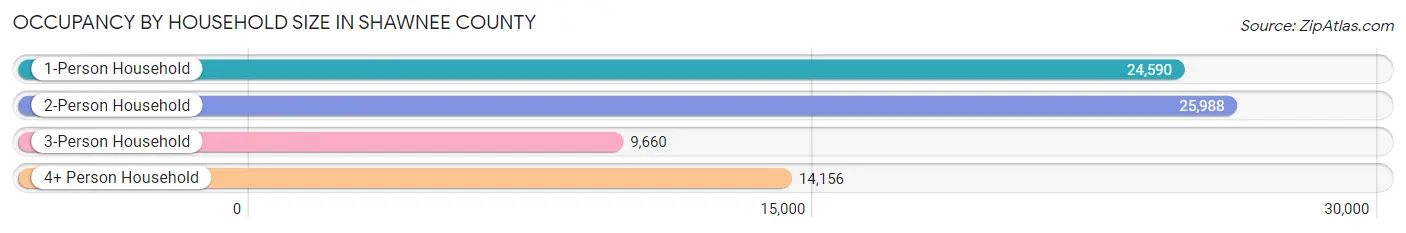
| Household Size | # Housing Units | % Housing Units |
| 1-Person Household | 24,590 | 33.1% |
| 2-Person Household | 25,988 | 34.9% |
| 3-Person Household | 9,660 | 13.0% |
| 4+ Person Household | 14,156 | 19.0% |
| Total Housing Units | 74,394 | 100.0% |
Occupancy by Ownership by Household Size in Shawnee County
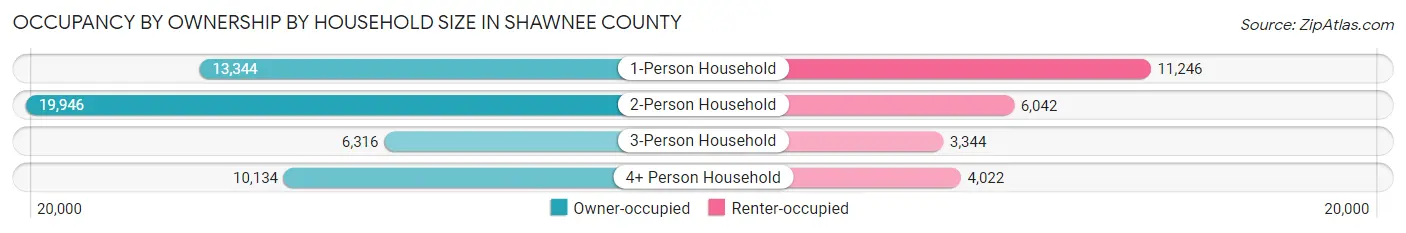
| Household Size | Owner-occupied | Renter-occupied |
| 1-Person Household | 13,344 (54.3%) | 11,246 (45.7%) |
| 2-Person Household | 19,946 (76.7%) | 6,042 (23.3%) |
| 3-Person Household | 6,316 (65.4%) | 3,344 (34.6%) |
| 4+ Person Household | 10,134 (71.6%) | 4,022 (28.4%) |
| Total Housing Units | 49,740 (66.9%) | 24,654 (33.1%) |
Occupancy by Educational Attainment in Shawnee County
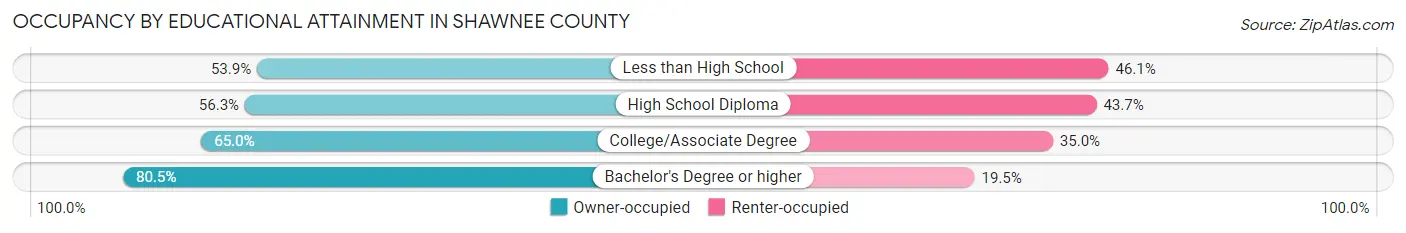
| Household Size | Owner-occupied | Renter-occupied |
| Less than High School | 2,340 (53.9%) | 1,999 (46.1%) |
| High School Diploma | 12,213 (56.3%) | 9,473 (43.7%) |
| College/Associate Degree | 15,655 (65.0%) | 8,444 (35.0%) |
| Bachelor's Degree or higher | 19,532 (80.5%) | 4,738 (19.5%) |
Occupancy by Age of Householder in Shawnee County
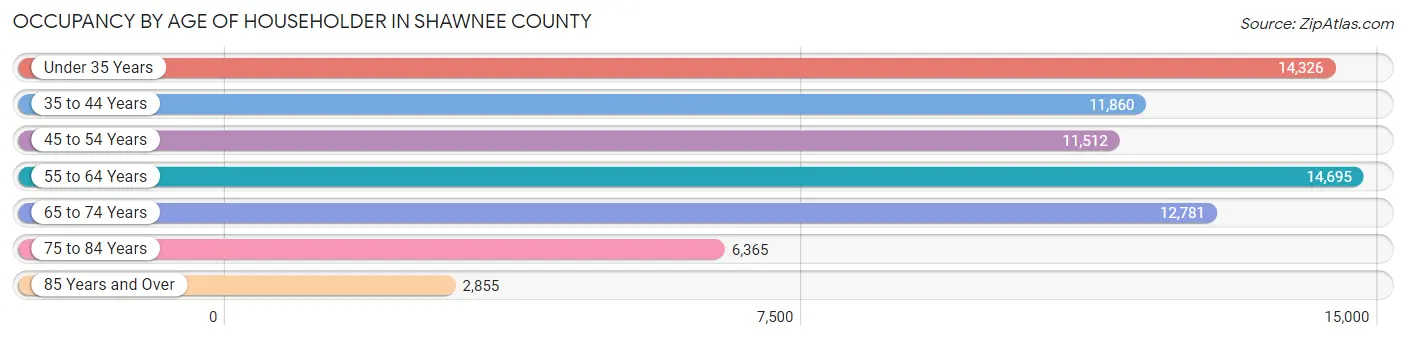
| Age Bracket | # Households | % Households |
| Under 35 Years | 14,326 | 19.3% |
| 35 to 44 Years | 11,860 | 15.9% |
| 45 to 54 Years | 11,512 | 15.5% |
| 55 to 64 Years | 14,695 | 19.8% |
| 65 to 74 Years | 12,781 | 17.2% |
| 75 to 84 Years | 6,365 | 8.6% |
| 85 Years and Over | 2,855 | 3.8% |
| Total | 74,394 | 100.0% |
Housing Finances in Shawnee County
Median Income by Occupancy in Shawnee County
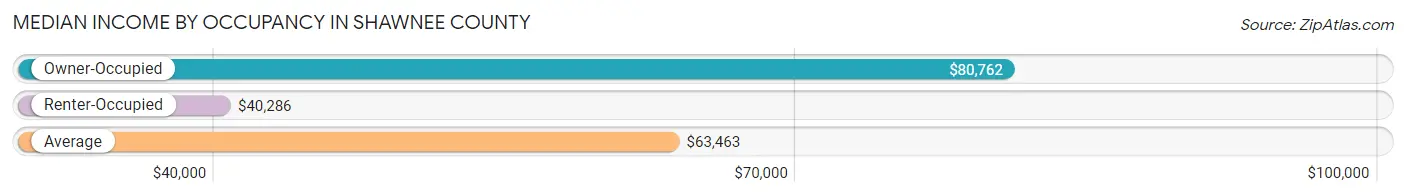
| Occupancy Type | # Households | Median Income |
| Owner-Occupied | 49,740 (66.9%) | $80,762 |
| Renter-Occupied | 24,654 (33.1%) | $40,286 |
| Average | 74,394 (100.0%) | $63,463 |
Occupancy by Householder Income Bracket in Shawnee County
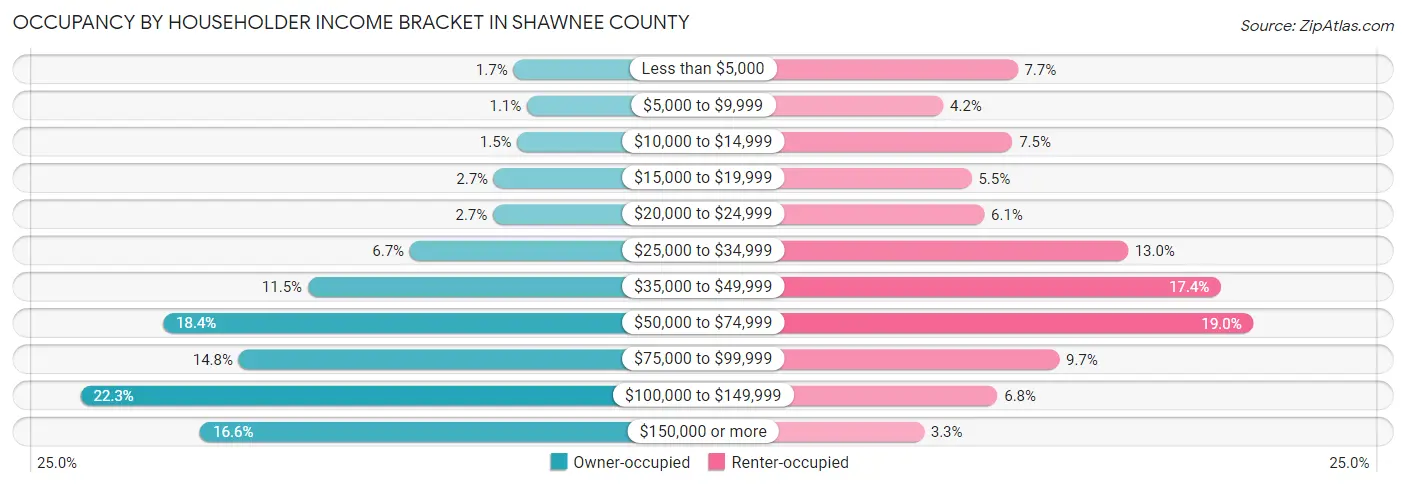
| Income Bracket | Owner-occupied | Renter-occupied |
| Less than $5,000 | 854 (1.7%) | 1,901 (7.7%) |
| $5,000 to $9,999 | 532 (1.1%) | 1,028 (4.2%) |
| $10,000 to $14,999 | 763 (1.5%) | 1,838 (7.5%) |
| $15,000 to $19,999 | 1,317 (2.6%) | 1,362 (5.5%) |
| $20,000 to $24,999 | 1,337 (2.7%) | 1,510 (6.1%) |
| $25,000 to $34,999 | 3,307 (6.7%) | 3,194 (13.0%) |
| $35,000 to $49,999 | 5,726 (11.5%) | 4,293 (17.4%) |
| $50,000 to $74,999 | 9,157 (18.4%) | 4,673 (19.0%) |
| $75,000 to $99,999 | 7,361 (14.8%) | 2,390 (9.7%) |
| $100,000 to $149,999 | 11,111 (22.3%) | 1,663 (6.8%) |
| $150,000 or more | 8,275 (16.6%) | 802 (3.3%) |
| Total | 49,740 (100.0%) | 24,654 (100.0%) |
Monthly Housing Cost Tiers in Shawnee County
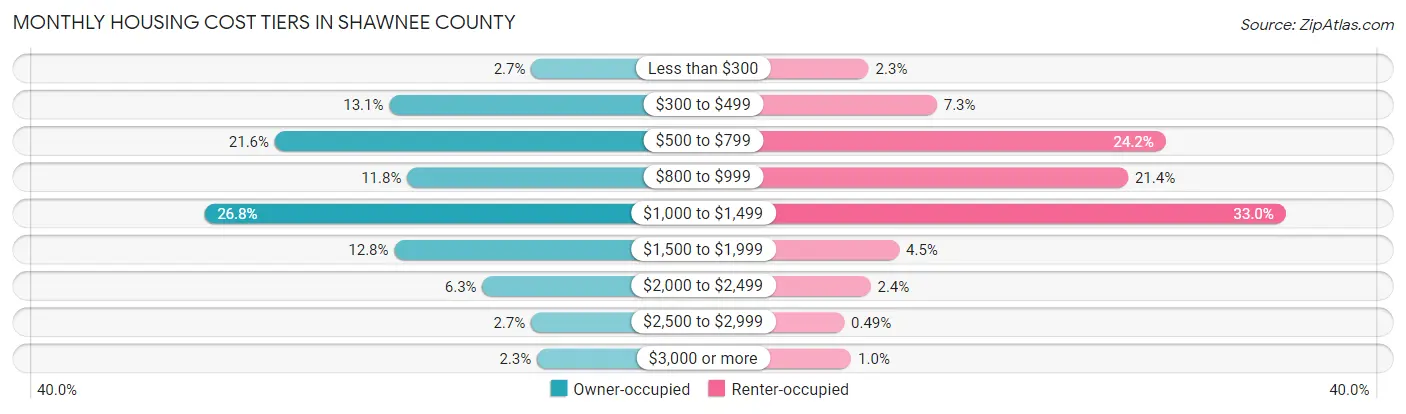
| Monthly Cost | Owner-occupied | Renter-occupied |
| Less than $300 | 1,333 (2.7%) | 567 (2.3%) |
| $300 to $499 | 6,536 (13.1%) | 1,805 (7.3%) |
| $500 to $799 | 10,728 (21.6%) | 5,959 (24.2%) |
| $800 to $999 | 5,878 (11.8%) | 5,277 (21.4%) |
| $1,000 to $1,499 | 13,317 (26.8%) | 8,138 (33.0%) |
| $1,500 to $1,999 | 6,354 (12.8%) | 1,120 (4.5%) |
| $2,000 to $2,499 | 3,125 (6.3%) | 602 (2.4%) |
| $2,500 to $2,999 | 1,344 (2.7%) | 120 (0.5%) |
| $3,000 or more | 1,125 (2.3%) | 250 (1.0%) |
| Total | 49,740 (100.0%) | 24,654 (100.0%) |
Physical Housing Characteristics in Shawnee County
Housing Structures in Shawnee County
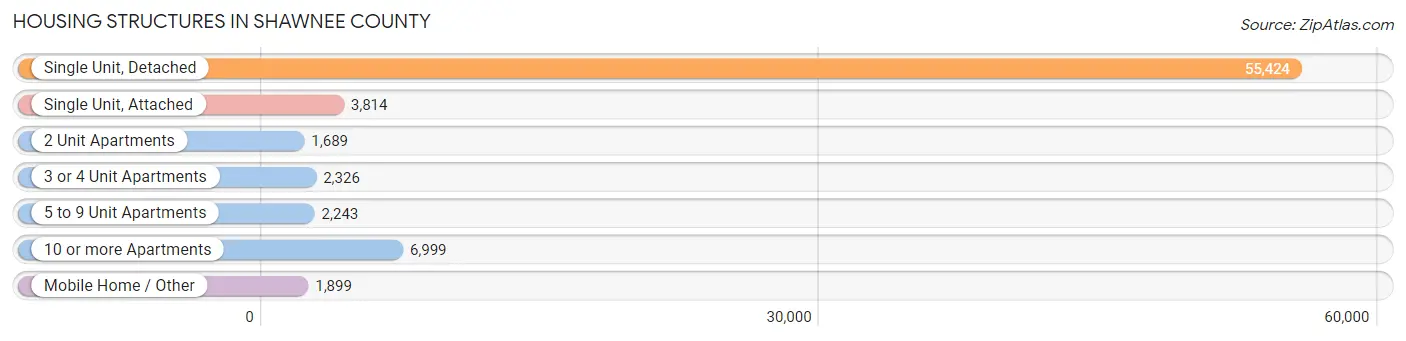
| Structure Type | # Housing Units | % Housing Units |
| Single Unit, Detached | 55,424 | 74.5% |
| Single Unit, Attached | 3,814 | 5.1% |
| 2 Unit Apartments | 1,689 | 2.3% |
| 3 or 4 Unit Apartments | 2,326 | 3.1% |
| 5 to 9 Unit Apartments | 2,243 | 3.0% |
| 10 or more Apartments | 6,999 | 9.4% |
| Mobile Home / Other | 1,899 | 2.5% |
| Total | 74,394 | 100.0% |
Housing Structures by Occupancy in Shawnee County
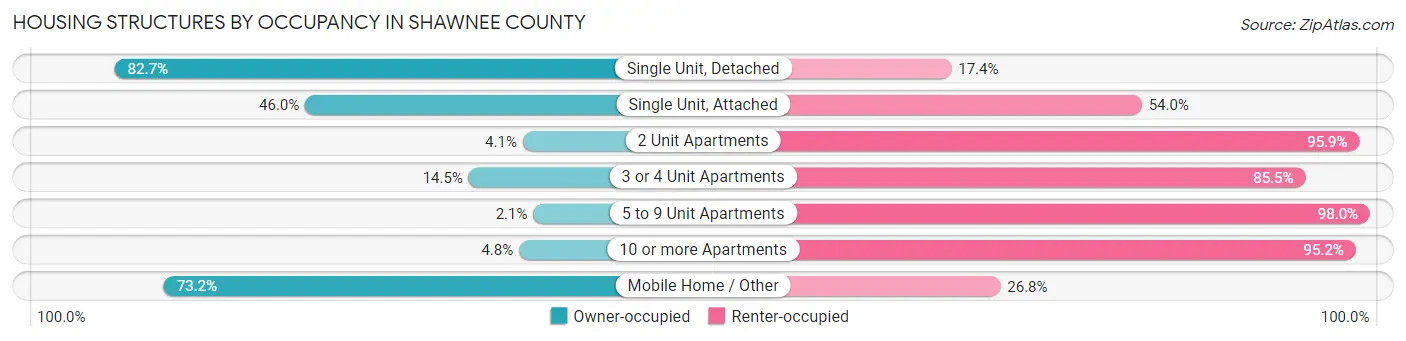
| Structure Type | Owner-occupied | Renter-occupied |
| Single Unit, Detached | 45,808 (82.7%) | 9,616 (17.3%) |
| Single Unit, Attached | 1,754 (46.0%) | 2,060 (54.0%) |
| 2 Unit Apartments | 69 (4.1%) | 1,620 (95.9%) |
| 3 or 4 Unit Apartments | 337 (14.5%) | 1,989 (85.5%) |
| 5 to 9 Unit Apartments | 46 (2.1%) | 2,197 (98.0%) |
| 10 or more Apartments | 336 (4.8%) | 6,663 (95.2%) |
| Mobile Home / Other | 1,390 (73.2%) | 509 (26.8%) |
| Total | 49,740 (66.9%) | 24,654 (33.1%) |
Housing Structures by Number of Rooms in Shawnee County
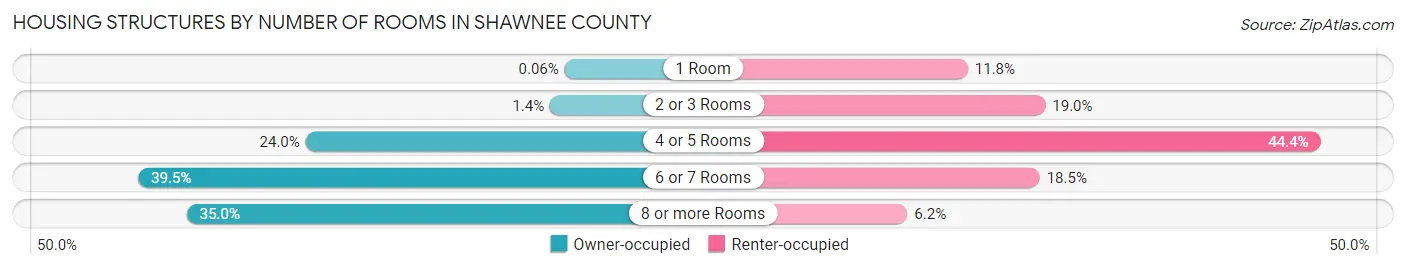
| Number of Rooms | Owner-occupied | Renter-occupied |
| 1 Room | 31 (0.1%) | 2,916 (11.8%) |
| 2 or 3 Rooms | 698 (1.4%) | 4,685 (19.0%) |
| 4 or 5 Rooms | 11,944 (24.0%) | 10,957 (44.4%) |
| 6 or 7 Rooms | 19,649 (39.5%) | 4,557 (18.5%) |
| 8 or more Rooms | 17,418 (35.0%) | 1,539 (6.2%) |
| Total | 49,740 (100.0%) | 24,654 (100.0%) |
Housing Structure by Heating Type in Shawnee County
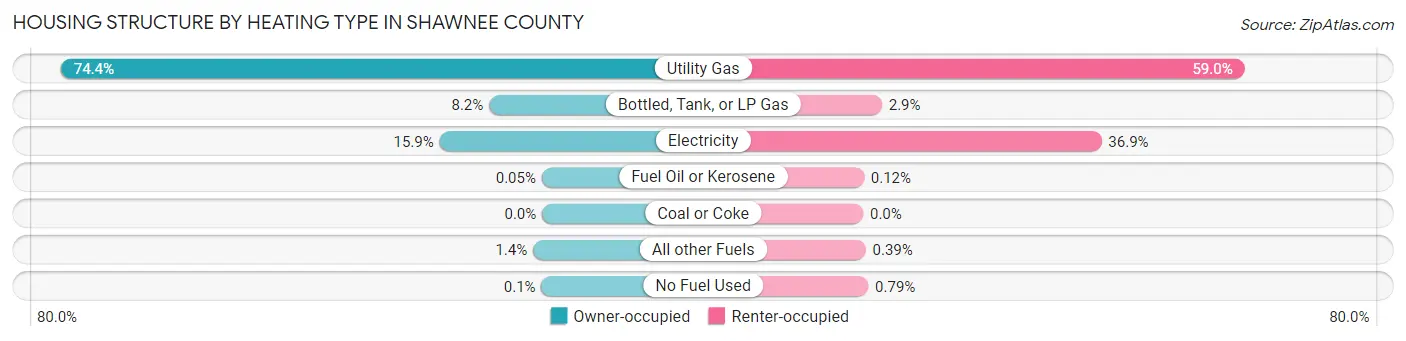
| Heating Type | Owner-occupied | Renter-occupied |
| Utility Gas | 37,005 (74.4%) | 14,536 (59.0%) |
| Bottled, Tank, or LP Gas | 4,076 (8.2%) | 715 (2.9%) |
| Electricity | 7,888 (15.9%) | 9,084 (36.8%) |
| Fuel Oil or Kerosene | 25 (0.1%) | 30 (0.1%) |
| Coal or Coke | 0 (0.0%) | 0 (0.0%) |
| All other Fuels | 696 (1.4%) | 95 (0.4%) |
| No Fuel Used | 50 (0.1%) | 194 (0.8%) |
| Total | 49,740 (100.0%) | 24,654 (100.0%) |
Household Vehicle Usage in Shawnee County
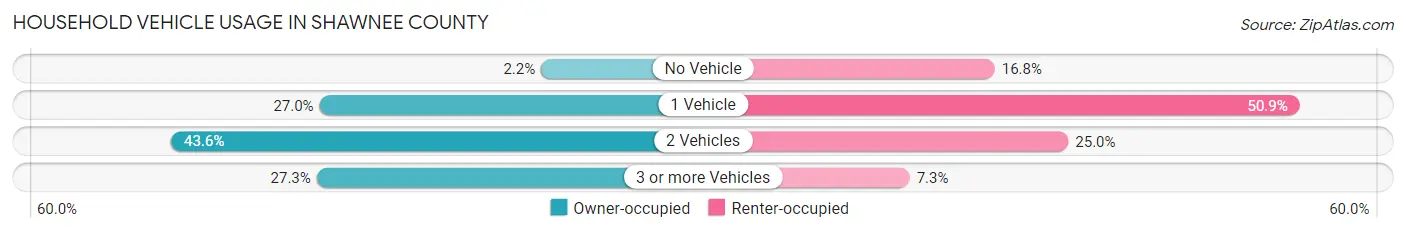
| Vehicles per Household | Owner-occupied | Renter-occupied |
| No Vehicle | 1,069 (2.1%) | 4,139 (16.8%) |
| 1 Vehicle | 13,417 (27.0%) | 12,555 (50.9%) |
| 2 Vehicles | 21,681 (43.6%) | 6,170 (25.0%) |
| 3 or more Vehicles | 13,573 (27.3%) | 1,790 (7.3%) |
| Total | 49,740 (100.0%) | 24,654 (100.0%) |
Real Estate & Mortgages in Shawnee County
Real Estate and Mortgage Overview in Shawnee County
| Characteristic | Without Mortgage | With Mortgage |
| Housing Units | 21,029 | 28,711 |
| Median Property Value | $146,700 | $167,400 |
| Median Household Income | $61,349 | $5,524 |
| Monthly Housing Costs | $582 | $1,060 |
| Real Estate Taxes | $2,307 | $524 |
Property Value by Mortgage Status in Shawnee County
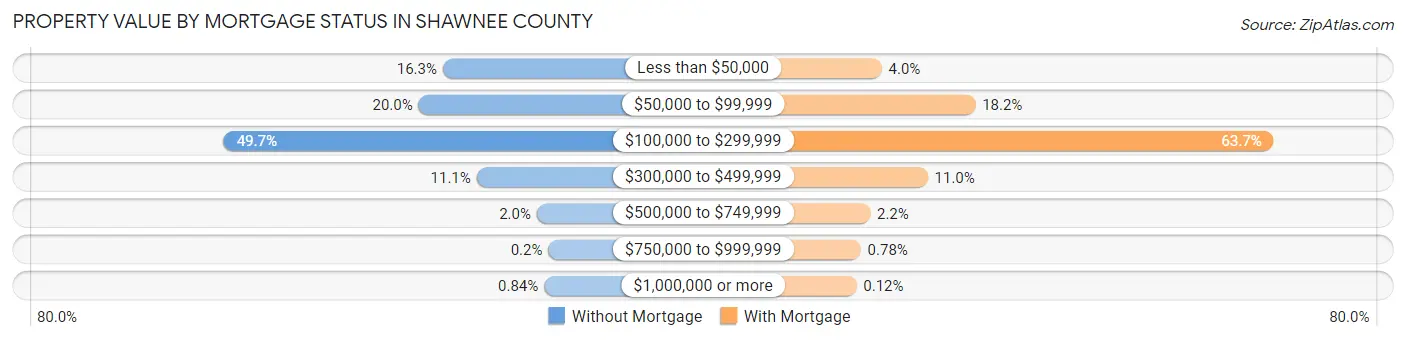
| Property Value | Without Mortgage | With Mortgage |
| Less than $50,000 | 3,422 (16.3%) | 1,141 (4.0%) |
| $50,000 to $99,999 | 4,199 (20.0%) | 5,233 (18.2%) |
| $100,000 to $299,999 | 10,440 (49.6%) | 18,292 (63.7%) |
| $300,000 to $499,999 | 2,339 (11.1%) | 3,153 (11.0%) |
| $500,000 to $749,999 | 411 (1.9%) | 635 (2.2%) |
| $750,000 to $999,999 | 42 (0.2%) | 223 (0.8%) |
| $1,000,000 or more | 176 (0.8%) | 34 (0.1%) |
| Total | 21,029 (100.0%) | 28,711 (100.0%) |
Household Income by Mortgage Status in Shawnee County
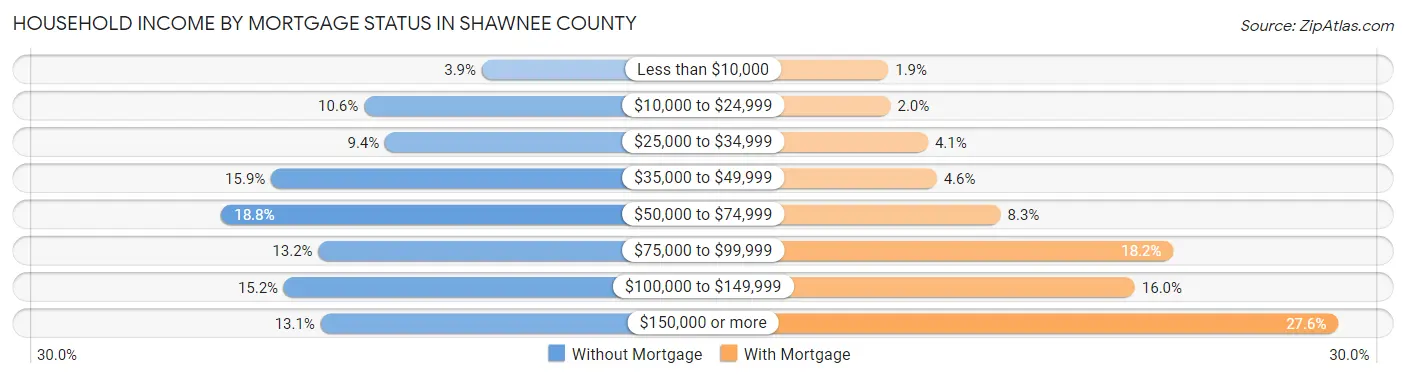
| Household Income | Without Mortgage | With Mortgage |
| Less than $10,000 | 813 (3.9%) | 538 (1.9%) |
| $10,000 to $24,999 | 2,229 (10.6%) | 573 (2.0%) |
| $25,000 to $34,999 | 1,976 (9.4%) | 1,188 (4.1%) |
| $35,000 to $49,999 | 3,346 (15.9%) | 1,331 (4.6%) |
| $50,000 to $74,999 | 3,944 (18.8%) | 2,380 (8.3%) |
| $75,000 to $99,999 | 2,778 (13.2%) | 5,213 (18.2%) |
| $100,000 to $149,999 | 3,192 (15.2%) | 4,583 (16.0%) |
| $150,000 or more | 2,751 (13.1%) | 7,919 (27.6%) |
| Total | 21,029 (100.0%) | 28,711 (100.0%) |
Property Value to Household Income Ratio in Shawnee County
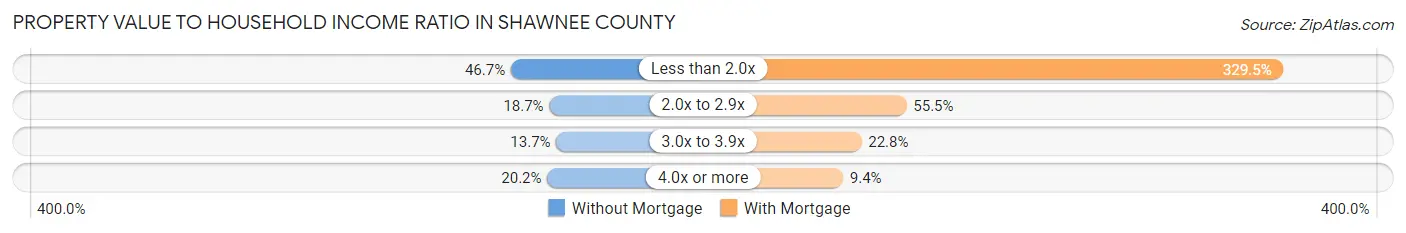
| Value-to-Income Ratio | Without Mortgage | With Mortgage |
| Less than 2.0x | 9,812 (46.7%) | 94,603 (329.5%) |
| 2.0x to 2.9x | 3,938 (18.7%) | 15,940 (55.5%) |
| 3.0x to 3.9x | 2,872 (13.7%) | 6,535 (22.8%) |
| 4.0x or more | 4,257 (20.2%) | 2,699 (9.4%) |
| Total | 21,029 (100.0%) | 28,711 (100.0%) |
Real Estate Taxes by Mortgage Status in Shawnee County
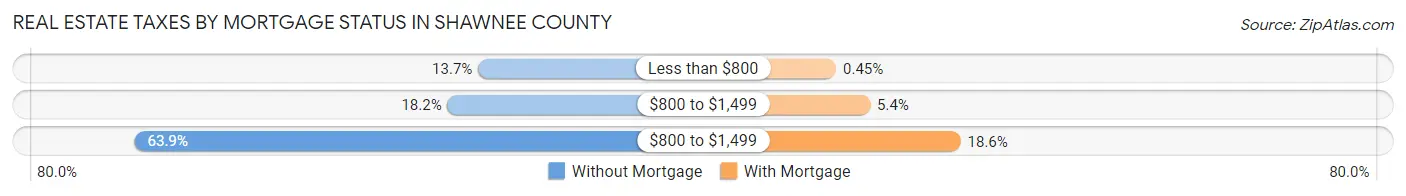
| Property Taxes | Without Mortgage | With Mortgage |
| Less than $800 | 2,888 (13.7%) | 128 (0.4%) |
| $800 to $1,499 | 3,830 (18.2%) | 1,553 (5.4%) |
| $800 to $1,499 | 13,442 (63.9%) | 5,352 (18.6%) |
| Total | 21,029 (100.0%) | 28,711 (100.0%) |
Health & Disability in Shawnee County
Health Insurance Coverage by Age in Shawnee County
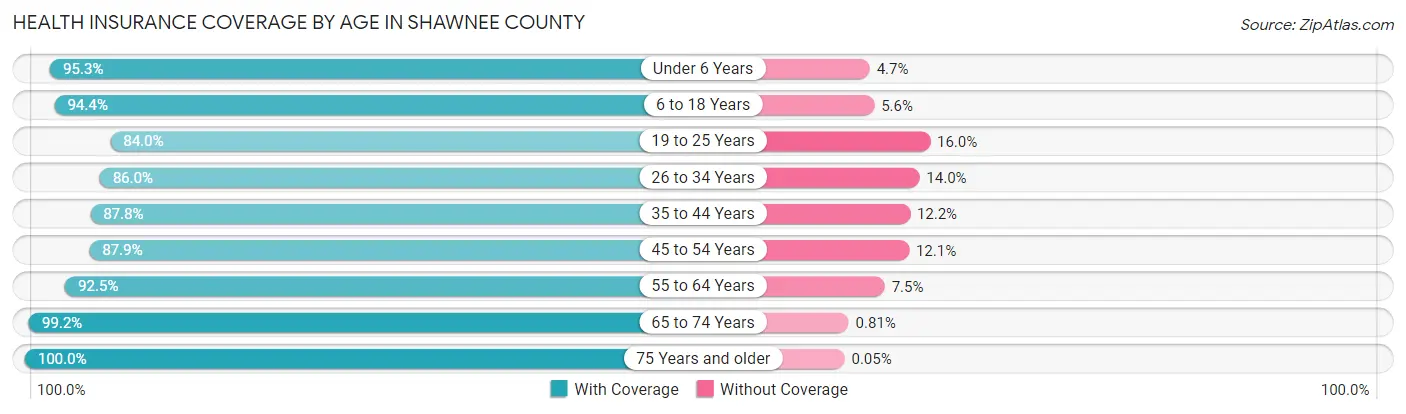
| Age Bracket | With Coverage | Without Coverage |
| Under 6 Years | 12,200 (95.3%) | 607 (4.7%) |
| 6 to 18 Years | 28,909 (94.4%) | 1,709 (5.6%) |
| 19 to 25 Years | 12,711 (84.0%) | 2,419 (16.0%) |
| 26 to 34 Years | 16,455 (86.0%) | 2,682 (14.0%) |
| 35 to 44 Years | 18,877 (87.8%) | 2,634 (12.2%) |
| 45 to 54 Years | 17,715 (87.9%) | 2,429 (12.1%) |
| 55 to 64 Years | 21,927 (92.5%) | 1,787 (7.5%) |
| 65 to 74 Years | 19,056 (99.2%) | 156 (0.8%) |
| 75 Years and older | 12,851 (100.0%) | 6 (0.1%) |
| Total | 160,701 (91.8%) | 14,429 (8.2%) |
Health Insurance Coverage by Citizenship Status in Shawnee County
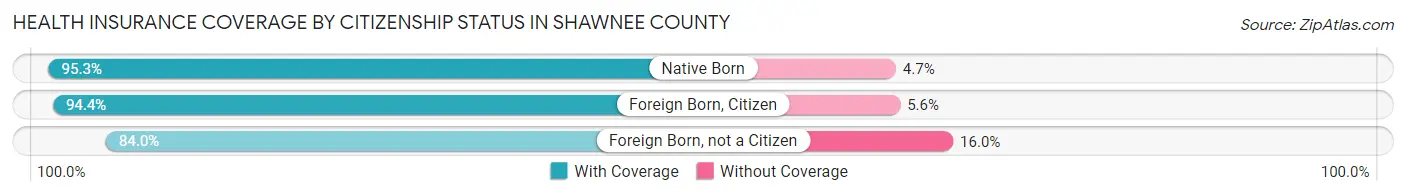
| Citizenship Status | With Coverage | Without Coverage |
| Native Born | 12,200 (95.3%) | 607 (4.7%) |
| Foreign Born, Citizen | 28,909 (94.4%) | 1,709 (5.6%) |
| Foreign Born, not a Citizen | 12,711 (84.0%) | 2,419 (16.0%) |
Health Insurance Coverage by Household Income in Shawnee County
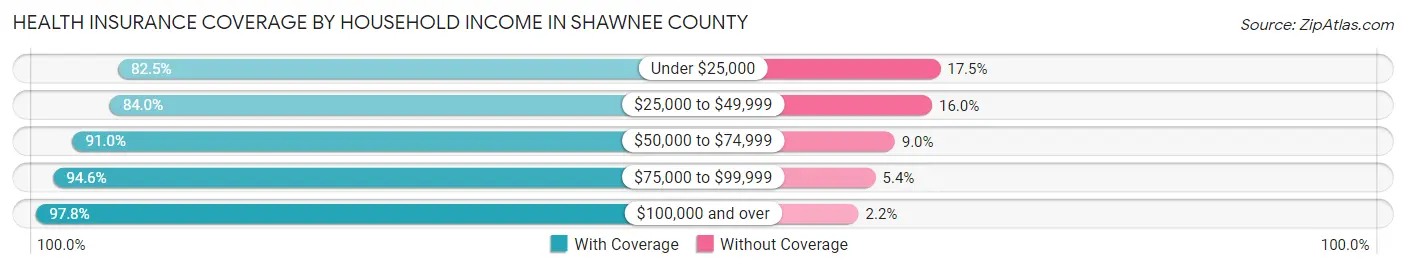
| Household Income | With Coverage | Without Coverage |
| Under $25,000 | 16,737 (82.5%) | 3,556 (17.5%) |
| $25,000 to $49,999 | 26,092 (84.0%) | 4,960 (16.0%) |
| $50,000 to $74,999 | 26,382 (91.0%) | 2,606 (9.0%) |
| $75,000 to $99,999 | 24,793 (94.6%) | 1,416 (5.4%) |
| $100,000 and over | 64,853 (97.8%) | 1,467 (2.2%) |
Public vs Private Health Insurance Coverage by Age in Shawnee County
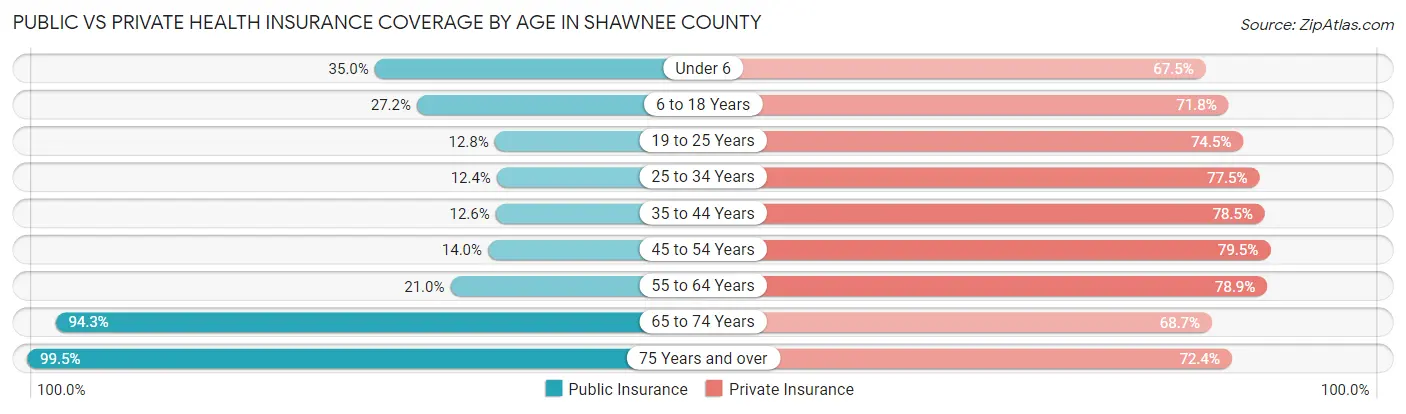
| Age Bracket | Public Insurance | Private Insurance |
| Under 6 | 4,486 (35.0%) | 8,646 (67.5%) |
| 6 to 18 Years | 8,327 (27.2%) | 21,979 (71.8%) |
| 19 to 25 Years | 1,932 (12.8%) | 11,274 (74.5%) |
| 25 to 34 Years | 2,367 (12.4%) | 14,830 (77.5%) |
| 35 to 44 Years | 2,709 (12.6%) | 16,885 (78.5%) |
| 45 to 54 Years | 2,822 (14.0%) | 16,013 (79.5%) |
| 55 to 64 Years | 4,978 (21.0%) | 18,721 (78.9%) |
| 65 to 74 Years | 18,112 (94.3%) | 13,194 (68.7%) |
| 75 Years and over | 12,795 (99.5%) | 9,304 (72.4%) |
| Total | 58,528 (33.4%) | 130,846 (74.7%) |
Disability Status by Sex by Age in Shawnee County
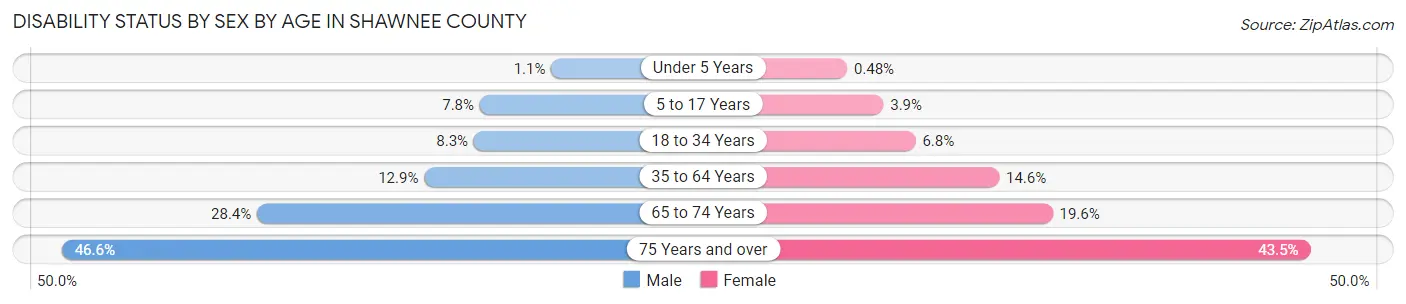
| Age Bracket | Male | Female |
| Under 5 Years | 61 (1.1%) | 24 (0.5%) |
| 5 to 17 Years | 1,217 (7.7%) | 584 (3.8%) |
| 18 to 34 Years | 1,508 (8.3%) | 1,245 (6.8%) |
| 35 to 64 Years | 4,110 (12.9%) | 4,891 (14.6%) |
| 65 to 74 Years | 2,543 (28.4%) | 2,008 (19.6%) |
| 75 Years and over | 2,429 (46.6%) | 3,322 (43.5%) |
Disability Class by Sex by Age in Shawnee County
Disability Class: Hearing Difficulty
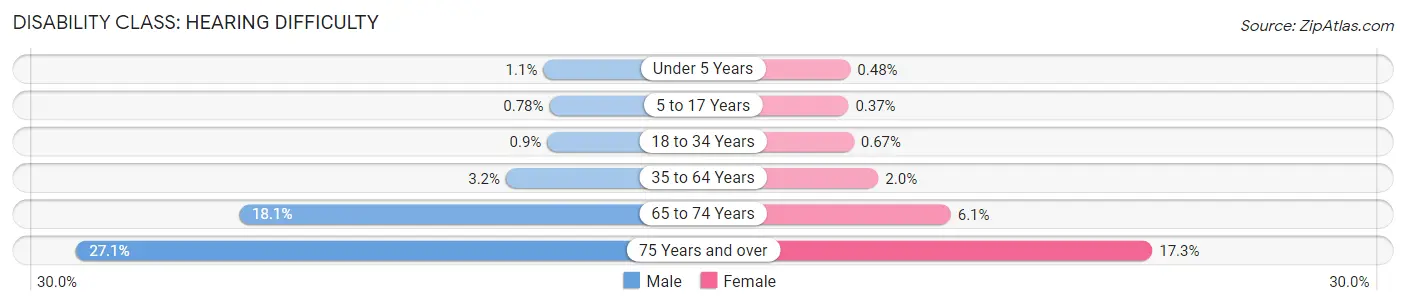
| Age Bracket | Male | Female |
| Under 5 Years | 61 (1.1%) | 24 (0.5%) |
| 5 to 17 Years | 122 (0.8%) | 56 (0.4%) |
| 18 to 34 Years | 163 (0.9%) | 122 (0.7%) |
| 35 to 64 Years | 1,019 (3.2%) | 683 (2.0%) |
| 65 to 74 Years | 1,616 (18.1%) | 623 (6.1%) |
| 75 Years and over | 1,415 (27.1%) | 1,321 (17.3%) |
Disability Class: Vision Difficulty
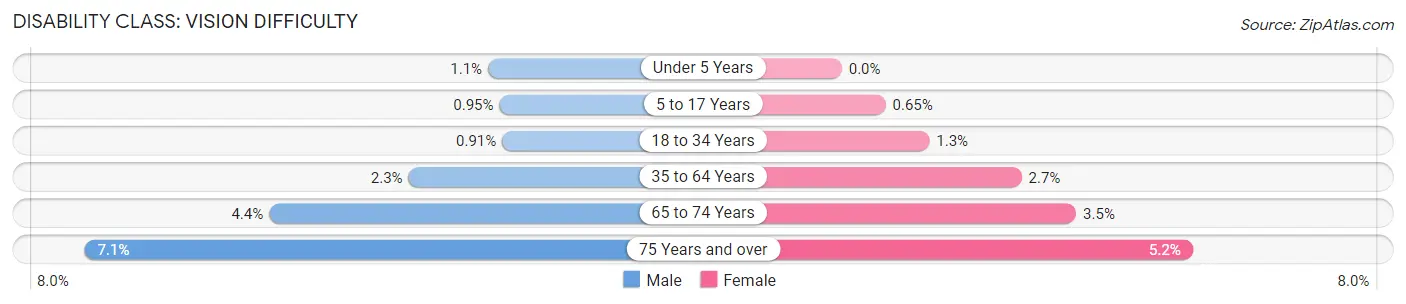
| Age Bracket | Male | Female |
| Under 5 Years | 61 (1.1%) | 0 (0.0%) |
| 5 to 17 Years | 149 (0.9%) | 98 (0.6%) |
| 18 to 34 Years | 165 (0.9%) | 237 (1.3%) |
| 35 to 64 Years | 733 (2.3%) | 896 (2.7%) |
| 65 to 74 Years | 391 (4.4%) | 357 (3.5%) |
| 75 Years and over | 371 (7.1%) | 398 (5.2%) |
Disability Class: Cognitive Difficulty
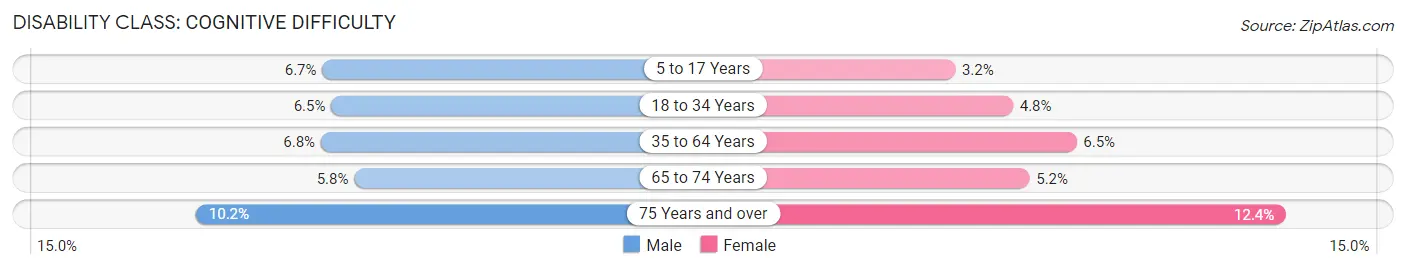
| Age Bracket | Male | Female |
| 5 to 17 Years | 1,053 (6.7%) | 478 (3.2%) |
| 18 to 34 Years | 1,174 (6.5%) | 866 (4.8%) |
| 35 to 64 Years | 2,148 (6.8%) | 2,189 (6.5%) |
| 65 to 74 Years | 521 (5.8%) | 536 (5.2%) |
| 75 Years and over | 534 (10.2%) | 945 (12.4%) |
Disability Class: Ambulatory Difficulty
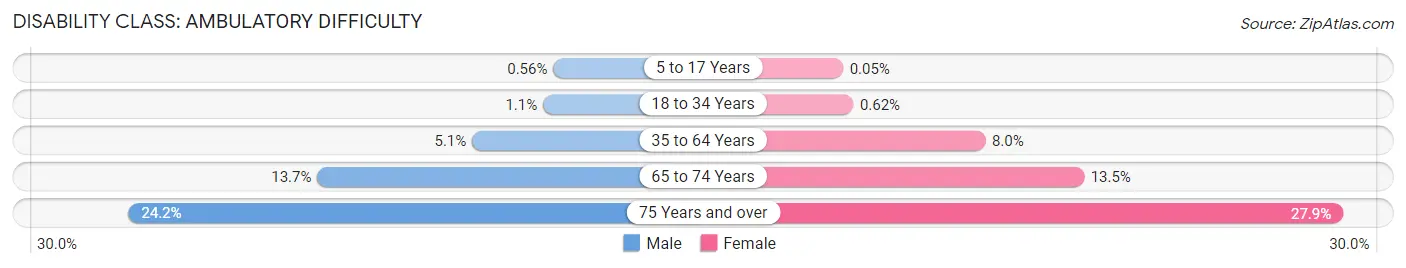
| Age Bracket | Male | Female |
| 5 to 17 Years | 88 (0.6%) | 7 (0.1%) |
| 18 to 34 Years | 206 (1.1%) | 113 (0.6%) |
| 35 to 64 Years | 1,619 (5.1%) | 2,671 (8.0%) |
| 65 to 74 Years | 1,226 (13.7%) | 1,383 (13.5%) |
| 75 Years and over | 1,264 (24.2%) | 2,132 (27.9%) |
Disability Class: Self-Care Difficulty
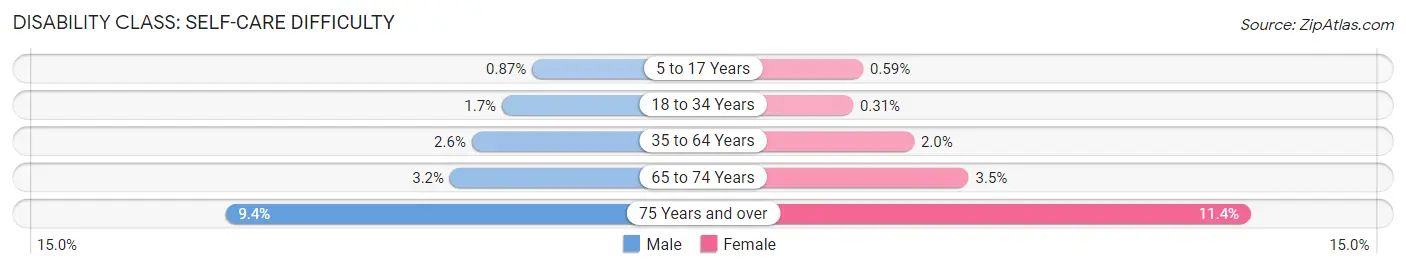
| Age Bracket | Male | Female |
| 5 to 17 Years | 137 (0.9%) | 89 (0.6%) |
| 18 to 34 Years | 311 (1.7%) | 57 (0.3%) |
| 35 to 64 Years | 812 (2.5%) | 673 (2.0%) |
| 65 to 74 Years | 283 (3.2%) | 362 (3.5%) |
| 75 Years and over | 491 (9.4%) | 870 (11.4%) |
Technology Access in Shawnee County
Computing Device Access in Shawnee County
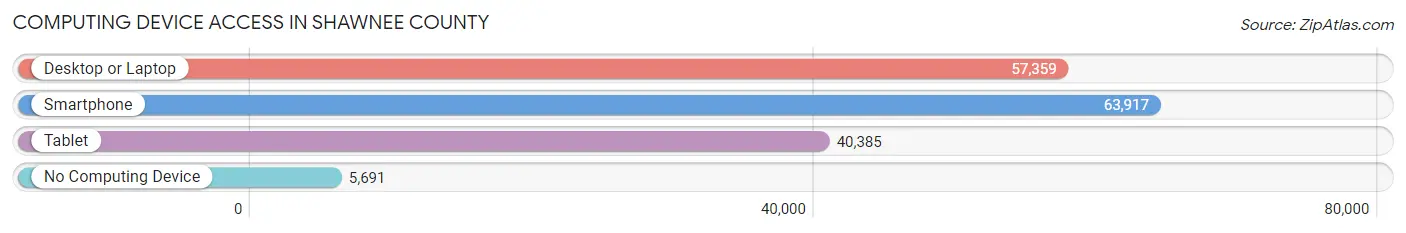
| Device Type | # Households | % Households |
| Desktop or Laptop | 57,359 | 77.1% |
| Smartphone | 63,917 | 85.9% |
| Tablet | 40,385 | 54.3% |
| No Computing Device | 5,691 | 7.6% |
| Total | 74,394 | 100.0% |
Internet Access in Shawnee County
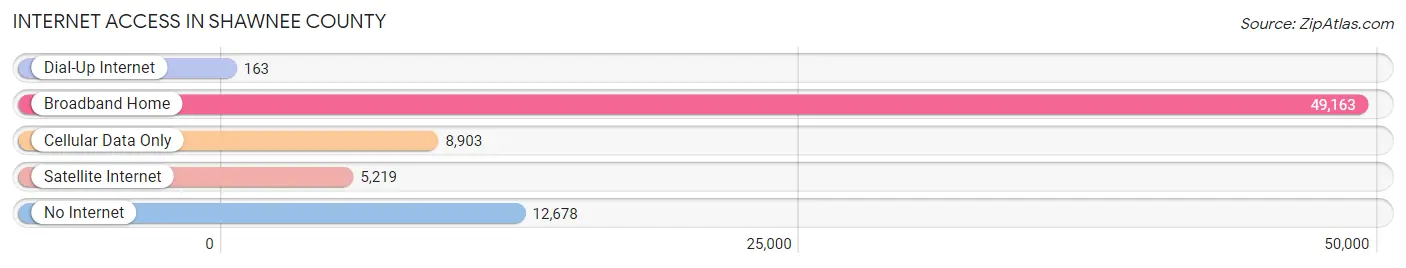
| Internet Type | # Households | % Households |
| Dial-Up Internet | 163 | 0.2% |
| Broadband Home | 49,163 | 66.1% |
| Cellular Data Only | 8,903 | 12.0% |
| Satellite Internet | 5,219 | 7.0% |
| No Internet | 12,678 | 17.0% |
| Total | 74,394 | 100.0% |
Shawnee County Summary
Shawnee County, Kansas is located in the northeastern part of the state and is the third most populous county in the state. It is bordered by Jackson County to the north, Jefferson County to the east, Osage County to the south, and Wabaunsee County to the west. The county seat is Topeka, the state capital.
History
Shawnee County was established in 1855 and named after the Shawnee Native American tribe. The county was originally part of the Indian Territory, and the Shawnee Indians were the first inhabitants of the area. The county was organized in 1859 and Topeka was chosen as the county seat.
In 1861, the Kansas-Nebraska Act was passed, which allowed Kansas to become a state. During the Civil War, Shawnee County was a major center of activity, with several battles taking place in the area. After the war, the county experienced a period of growth and development, with the establishment of several railroads and the growth of Topeka as a major city.
Geography
Shawnee County covers an area of 576 square miles and is located in the northeastern part of the state. The county is mostly flat, with some rolling hills in the western part. The county is drained by the Kansas River, which flows through the county from east to west. The county is also home to several lakes, including Lake Shawnee, Lake Perry, and Lake Wabaunsee.
The climate of Shawnee County is characterized by hot, humid summers and cold, dry winters. The average annual temperature is around 54°F, with the average high in July being around 90°F and the average low in January being around 20°F.
Economy
The economy of Shawnee County is largely based on government, manufacturing, and services. The county is home to several government agencies, including the Kansas State Capitol, the Kansas Department of Transportation, and the Kansas Bureau of Investigation.
Manufacturing is also an important part of the county's economy, with several major companies located in the area. These include Goodyear Tire & Rubber Company, Frito-Lay, and Hill's Pet Nutrition.
The service sector is also an important part of the county's economy, with several major employers in the area. These include Stormont-Vail Health Care, the Topeka Zoo, and the Topeka Performing Arts Center.
Demographics
As of the 2010 census, Shawnee County had a population of 177,934. The racial makeup of the county was 79.2% White, 11.3% African American, 1.7% Native American, 2.2% Asian, 0.2% Pacific Islander, and 4.4% from other races. Hispanic or Latino of any race were 8.2% of the population.
The median household income in the county was $48,945, and the median family income was $60,945. The per capita income was $25,945. About 11.2% of the population was below the poverty line.
Shawnee County is home to several major universities, including Washburn University, Kansas State University, and the University of Kansas. The county is also home to several major attractions, including the Topeka Zoo, the Kansas State Capitol, and the Topeka Performing Arts Center.
Common Questions
What is the Total Population of Shawnee County?
Total Population of Shawnee County is 178,625.
What is the Total Male Population of Shawnee County?
Total Male Population of Shawnee County is 87,074.
What is the Total Female Population of Shawnee County?
Total Female Population of Shawnee County is 91,551.
What is the Ratio of Males per 100 Females in Shawnee County?
There are 95.11 Males per 100 Females in Shawnee County.
What is the Ratio of Females per 100 Males in Shawnee County?
There are 105.14 Females per 100 Males in Shawnee County.
What is the Median Population Age in Shawnee County?
Median Population Age in Shawnee County is 39.4 Years.
What is the Average Family Size in Shawnee County
Average Family Size in Shawnee County is 3.0 People.
What is the Average Household Size in Shawnee County
Average Household Size in Shawnee County is 2.3 People.
What is Per Capita Income in Shawnee County?
Per Capita income in Shawnee County is $36,011.
What is the Median Family Income in Shawnee County?
Median Family Income in Shawnee County is $85,262.
What is the Median Household income in Shawnee County?
Median Household Income in Shawnee County is $63,463.
What is Income or Wage Gap in Shawnee County?
Income or Wage Gap in Shawnee County is 24.9%.
Women in Shawnee County earn 75.1 cents for every dollar earned by a man.
What is Family Income Deficit in Shawnee County?
Family Income Deficit in Shawnee County is $10,605.
Families that are below poverty line in Shawnee County earn $10,605 less on average than the poverty threshold level.
What is Inequality or Gini Index in Shawnee County?
Inequality or Gini Index in Shawnee County is 0.45.
How Large is the Labor Force in Shawnee County?
There are 88,707 People in the Labor Forcein in Shawnee County.
What is the Percentage of People in the Labor Force in Shawnee County?
62.4% of People are in the Labor Force in Shawnee County.
What is the Unemployment Rate in Shawnee County?
Unemployment Rate in Shawnee County is 4.2%.