Seward County, KS
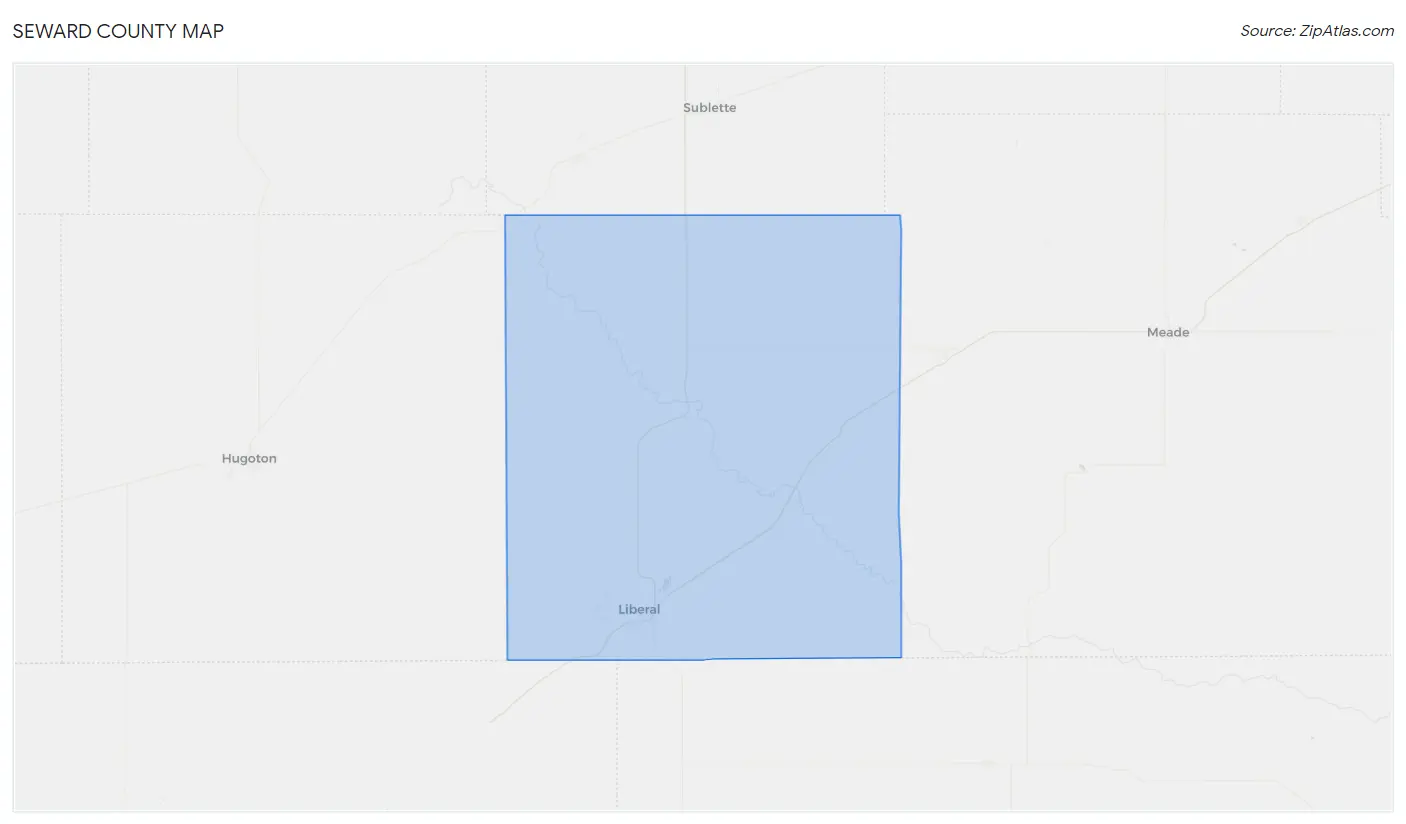
Seward County Map
Seward County Overview
21,942
TOTAL POPULATION
11,564
MALE POPULATION
10,378
FEMALE POPULATION
111.43
MALES / 100 FEMALES
89.74
FEMALES / 100 MALES
30.5
MEDIAN AGE
3.8
AVG FAMILY SIZE
3.0
AVG HOUSEHOLD SIZE
$25,391
PER CAPITA INCOME
$70,120
AVG FAMILY INCOME
$57,131
AVG HOUSEHOLD INCOME
33.2%
WAGE / INCOME GAP [ % ]
66.8¢/ $1
WAGE / INCOME GAP [ $ ]
$10,294
FAMILY INCOME DEFICIT
0.39
INEQUALITY / GINI INDEX
11,011
LABOR FORCE [ PEOPLE ]
70.0%
PERCENT IN LABOR FORCE
2.7%
UNEMPLOYMENT RATE
Seward County Area Codes
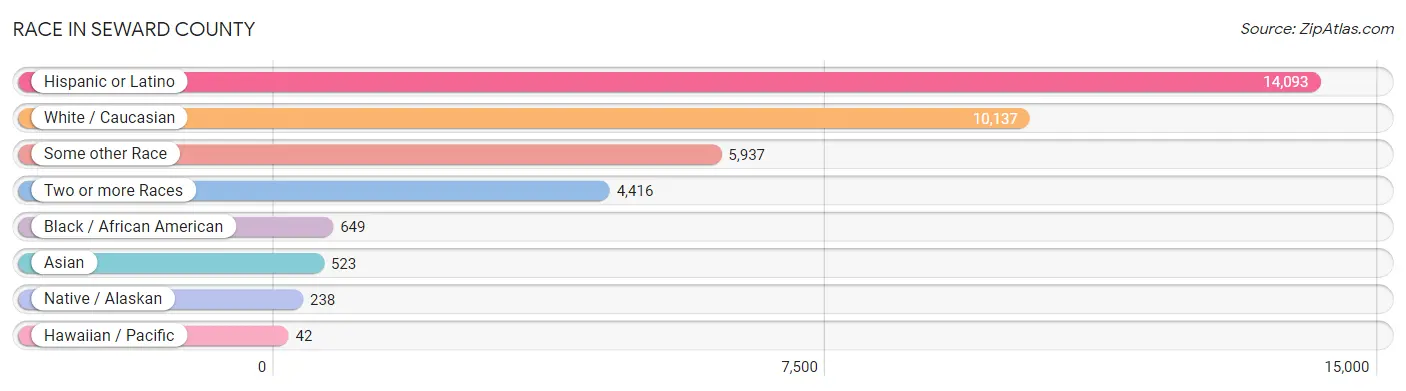
Race in Seward County
The most populous races in Seward County are Hispanic or Latino (14,093 | 64.2%), White / Caucasian (10,137 | 46.2%), and Some other Race (5,937 | 27.1%).
| Race | # Population | % Population |
| Asian | 523 | 2.4% |
| Black / African American | 649 | 3.0% |
| Hawaiian / Pacific | 42 | 0.2% |
| Hispanic or Latino | 14,093 | 64.2% |
| Native / Alaskan | 238 | 1.1% |
| White / Caucasian | 10,137 | 46.2% |
| Two or more Races | 4,416 | 20.1% |
| Some other Race | 5,937 | 27.1% |
| Total | 21,942 | 100.0% |
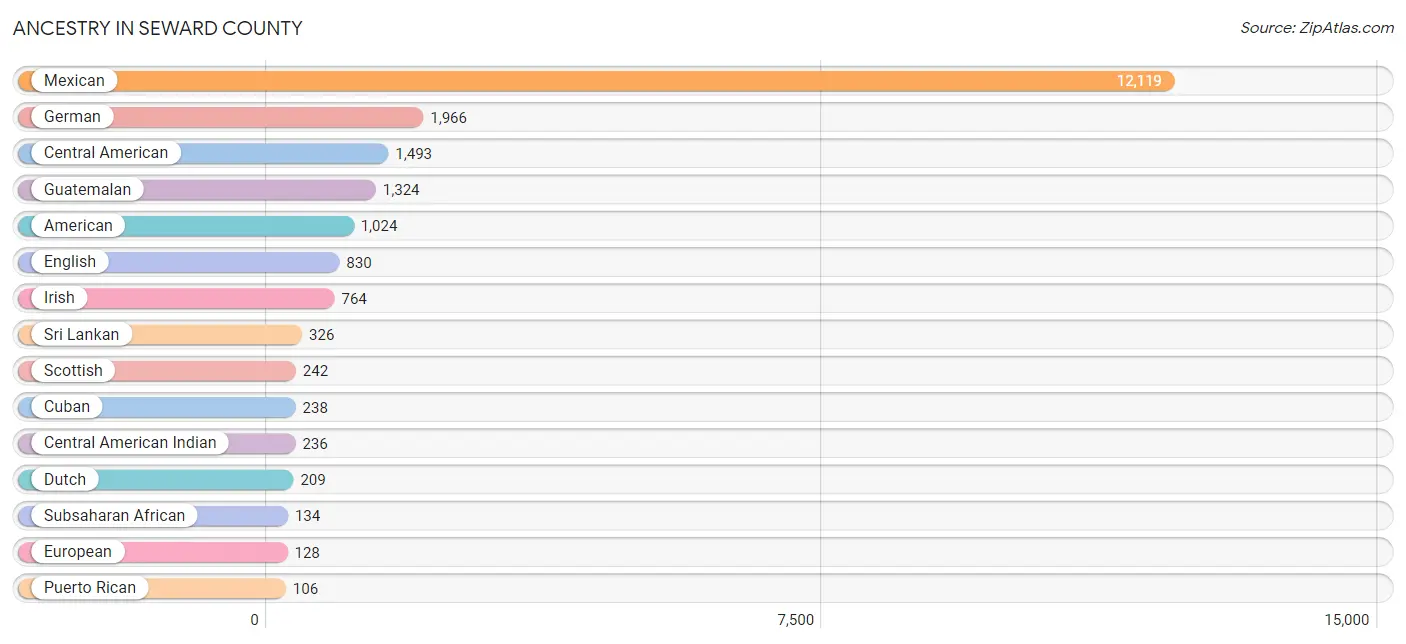
Ancestry in Seward County
The most populous ancestries reported in Seward County are Mexican (12,119 | 55.2%), German (1,966 | 9.0%), Central American (1,493 | 6.8%), Guatemalan (1,324 | 6.0%), and American (1,024 | 4.7%), together accounting for 81.7% of all Seward County residents.
| Ancestry | # Population | % Population |
| African | 43 | 0.2% |
| American | 1,024 | 4.7% |
| Apache | 2 | 0.0% |
| Arab | 5 | 0.0% |
| Austrian | 5 | 0.0% |
| Bhutanese | 59 | 0.3% |
| Brazilian | 6 | 0.0% |
| British | 13 | 0.1% |
| Burmese | 11 | 0.1% |
| Central American | 1,493 | 6.8% |
| Central American Indian | 236 | 1.1% |
| Cherokee | 20 | 0.1% |
| Choctaw | 13 | 0.1% |
| Croatian | 6 | 0.0% |
| Cuban | 238 | 1.1% |
| Czechoslovakian | 14 | 0.1% |
| Danish | 22 | 0.1% |
| Dominican | 25 | 0.1% |
| Dutch | 209 | 0.9% |
| Eastern European | 15 | 0.1% |
| English | 830 | 3.8% |
| European | 128 | 0.6% |
| Finnish | 20 | 0.1% |
| French | 42 | 0.2% |
| French Canadian | 56 | 0.3% |
| German | 1,966 | 9.0% |
| Guatemalan | 1,324 | 6.0% |
| Haitian | 15 | 0.1% |
| Honduran | 97 | 0.4% |
| Indian (Asian) | 9 | 0.0% |
| Irish | 764 | 3.5% |
| Italian | 101 | 0.5% |
| Japanese | 41 | 0.2% |
| Lebanese | 5 | 0.0% |
| Malaysian | 52 | 0.2% |
| Mexican | 12,119 | 55.2% |
| Mexican American Indian | 79 | 0.4% |
| Nicaraguan | 36 | 0.2% |
| Northern European | 11 | 0.1% |
| Norwegian | 102 | 0.5% |
| Pennsylvania German | 11 | 0.1% |
| Polish | 25 | 0.1% |
| Portuguese | 7 | 0.0% |
| Puerto Rican | 106 | 0.5% |
| Russian | 28 | 0.1% |
| Salvadoran | 36 | 0.2% |
| Samoan | 42 | 0.2% |
| Scandinavian | 33 | 0.2% |
| Scotch-Irish | 78 | 0.4% |
| Scottish | 242 | 1.1% |
| South American | 39 | 0.2% |
| Spaniard | 10 | 0.1% |
| Spanish | 1 | 0.0% |
| Sri Lankan | 326 | 1.5% |
| Subsaharan African | 134 | 0.6% |
| Swedish | 80 | 0.4% |
| Swiss | 86 | 0.4% |
| Thai | 84 | 0.4% |
| Venezuelan | 39 | 0.2% |
| Welsh | 32 | 0.2% | View All 60 Rows |
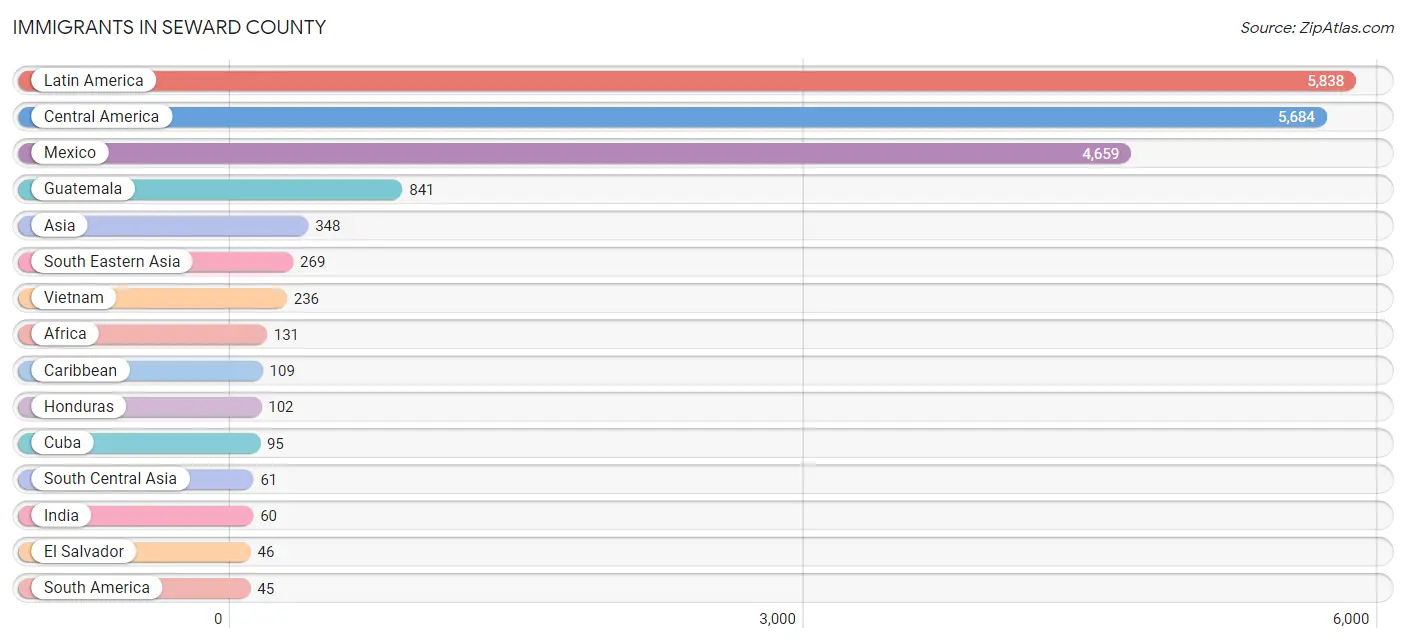
Immigrants in Seward County
The most numerous immigrant groups reported in Seward County came from Latin America (5,838 | 26.6%), Central America (5,684 | 25.9%), Mexico (4,659 | 21.2%), Guatemala (841 | 3.8%), and Asia (348 | 1.6%), together accounting for 79.2% of all Seward County residents.
| Immigration Origin | # Population | % Population |
| Africa | 131 | 0.6% |
| Asia | 348 | 1.6% |
| Brazil | 6 | 0.0% |
| Cambodia | 16 | 0.1% |
| Canada | 36 | 0.2% |
| Caribbean | 109 | 0.5% |
| Central America | 5,684 | 25.9% |
| China | 9 | 0.0% |
| Cuba | 95 | 0.4% |
| Eastern Africa | 43 | 0.2% |
| Eastern Asia | 18 | 0.1% |
| Eastern Europe | 11 | 0.1% |
| El Salvador | 46 | 0.2% |
| Eritrea | 43 | 0.2% |
| Europe | 21 | 0.1% |
| Guatemala | 841 | 3.8% |
| Honduras | 102 | 0.5% |
| India | 60 | 0.3% |
| Korea | 9 | 0.0% |
| Laos | 17 | 0.1% |
| Latin America | 5,838 | 26.6% |
| Mexico | 4,659 | 21.2% |
| Nicaragua | 36 | 0.2% |
| Poland | 11 | 0.1% |
| South America | 45 | 0.2% |
| South Central Asia | 61 | 0.3% |
| South Eastern Asia | 269 | 1.2% |
| Southern Europe | 10 | 0.1% |
| Spain | 10 | 0.1% |
| Sri Lanka | 1 | 0.0% |
| Taiwan | 2 | 0.0% |
| Venezuela | 39 | 0.2% |
| Vietnam | 236 | 1.1% | View All 33 Rows |
Sex and Age in Seward County
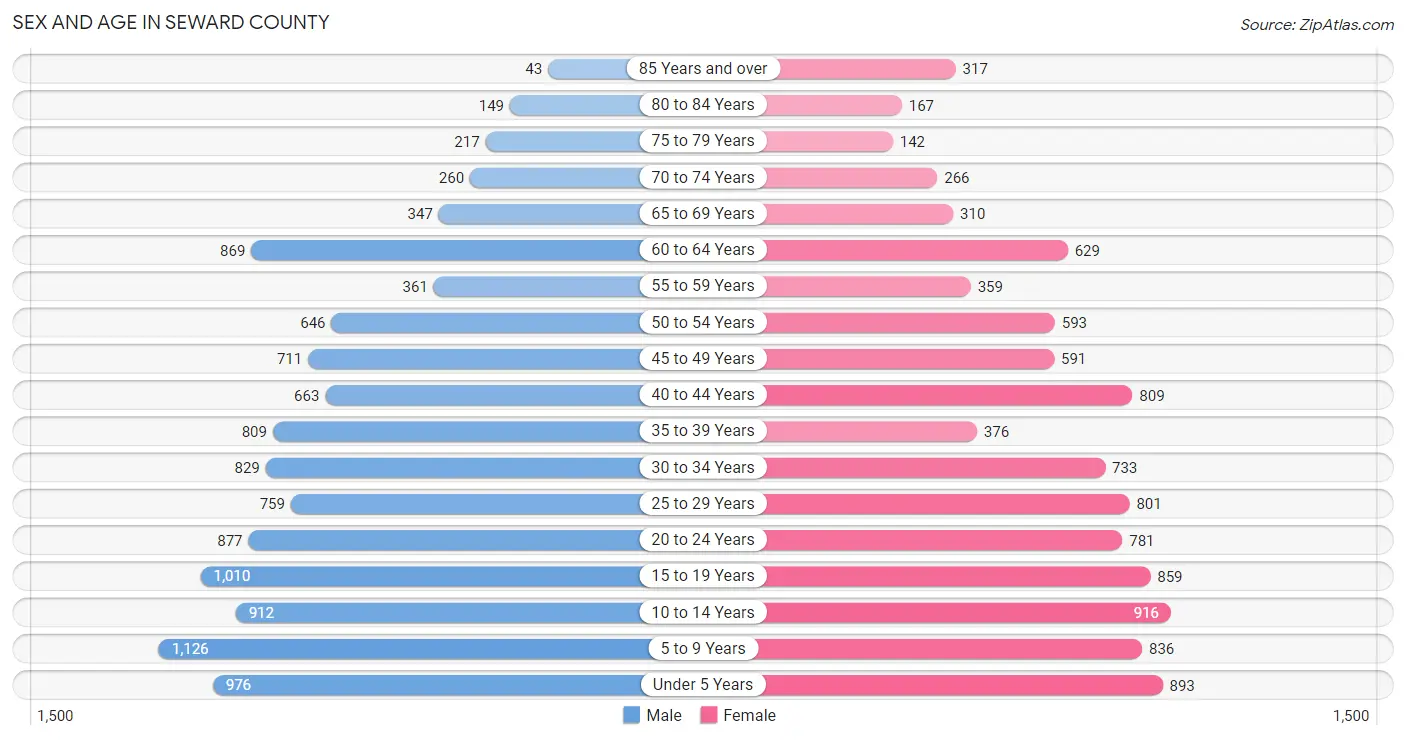
Sex and Age in Seward County
The most populous age groups in Seward County are 5 to 9 Years (1,126 | 9.7%) for men and 10 to 14 Years (916 | 8.8%) for women.
| Age Bracket | Male | Female |
| Under 5 Years | 976 (8.4%) | 893 (8.6%) |
| 5 to 9 Years | 1,126 (9.7%) | 836 (8.1%) |
| 10 to 14 Years | 912 (7.9%) | 916 (8.8%) |
| 15 to 19 Years | 1,010 (8.7%) | 859 (8.3%) |
| 20 to 24 Years | 877 (7.6%) | 781 (7.5%) |
| 25 to 29 Years | 759 (6.6%) | 801 (7.7%) |
| 30 to 34 Years | 829 (7.2%) | 733 (7.1%) |
| 35 to 39 Years | 809 (7.0%) | 376 (3.6%) |
| 40 to 44 Years | 663 (5.7%) | 809 (7.8%) |
| 45 to 49 Years | 711 (6.1%) | 591 (5.7%) |
| 50 to 54 Years | 646 (5.6%) | 593 (5.7%) |
| 55 to 59 Years | 361 (3.1%) | 359 (3.5%) |
| 60 to 64 Years | 869 (7.5%) | 629 (6.1%) |
| 65 to 69 Years | 347 (3.0%) | 310 (3.0%) |
| 70 to 74 Years | 260 (2.2%) | 266 (2.6%) |
| 75 to 79 Years | 217 (1.9%) | 142 (1.4%) |
| 80 to 84 Years | 149 (1.3%) | 167 (1.6%) |
| 85 Years and over | 43 (0.4%) | 317 (3.0%) |
| Total | 11,564 (100.0%) | 10,378 (100.0%) |
Families and Households in Seward County
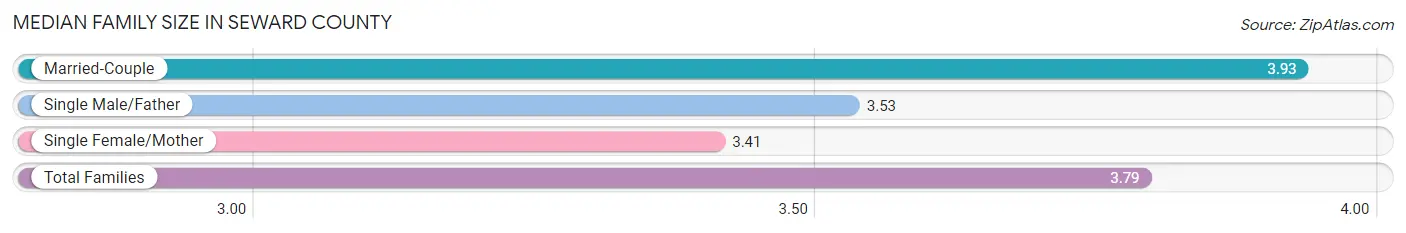
Median Family Size in Seward County
The median family size in Seward County is 3.79 persons per family, with married-couple families (3,395 | 71.8%) accounting for the largest median family size of 3.93 persons per family. On the other hand, single female/mother families (929 | 19.6%) represent the smallest median family size with 3.41 persons per family.
| Family Type | # Families | Family Size |
| Married-Couple | 3,395 (71.8%) | 3.93 |
| Single Male/Father | 408 (8.6%) | 3.53 |
| Single Female/Mother | 929 (19.6%) | 3.41 |
| Total Families | 4,732 (100.0%) | 3.79 |
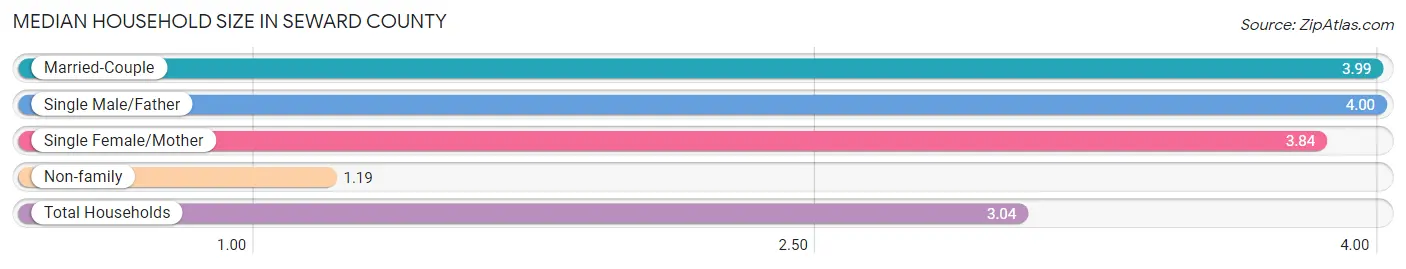
Median Household Size in Seward County
The median household size in Seward County is 3.04 persons per household, with single male/father households (408 | 5.8%) accounting for the largest median household size of 4 persons per household. non-family households (2,339 | 33.1%) represent the smallest median household size with 1.19 persons per household.
| Household Type | # Households | Household Size |
| Married-Couple | 3,395 (48.0%) | 3.99 |
| Single Male/Father | 408 (5.8%) | 4.00 |
| Single Female/Mother | 929 (13.1%) | 3.84 |
| Non-family | 2,339 (33.1%) | 1.19 |
| Total Households | 7,071 (100.0%) | 3.04 |
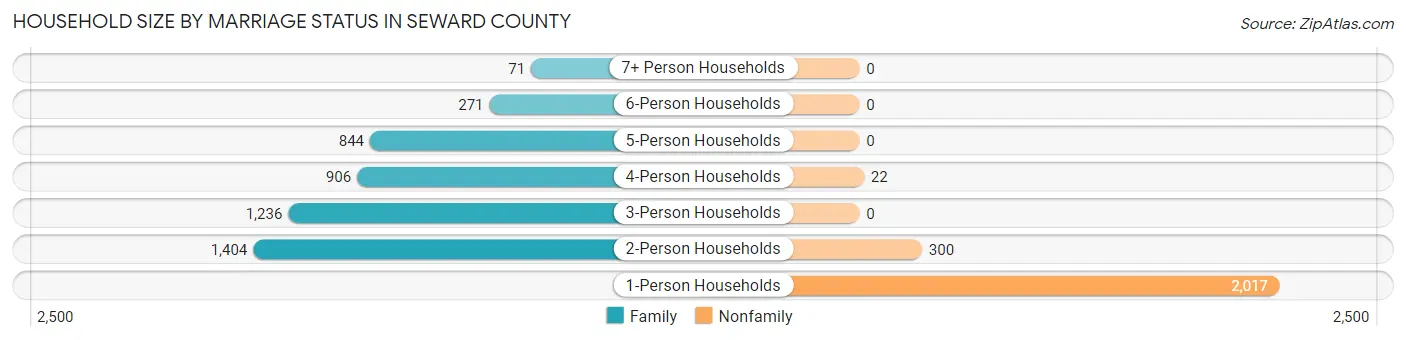
Household Size by Marriage Status in Seward County
Out of a total of 7,071 households in Seward County, 4,732 (66.9%) are family households, while 2,339 (33.1%) are nonfamily households. The most numerous type of family households are 2-person households, comprising 1,404, and the most common type of nonfamily households are 1-person households, comprising 2,017.
| Household Size | Family Households | Nonfamily Households |
| 1-Person Households | - | 2,017 (28.5%) |
| 2-Person Households | 1,404 (19.9%) | 300 (4.2%) |
| 3-Person Households | 1,236 (17.5%) | 0 (0.0%) |
| 4-Person Households | 906 (12.8%) | 22 (0.3%) |
| 5-Person Households | 844 (11.9%) | 0 (0.0%) |
| 6-Person Households | 271 (3.8%) | 0 (0.0%) |
| 7+ Person Households | 71 (1.0%) | 0 (0.0%) |
| Total | 4,732 (66.9%) | 2,339 (33.1%) |
Female Fertility in Seward County
Fertility by Age in Seward County
Average fertility rate in Seward County is 88.0 births per 1,000 women. Women in the age bracket of 20 to 34 years have the highest fertility rate with 141.0 births per 1,000 women. Women in the age bracket of 20 to 34 years acount for 71.8% of all women with births.

| Age Bracket | Women with Births | Births / 1,000 Women |
| 15 to 19 years | 89 (19.6%) | 104.0 |
| 20 to 34 years | 326 (71.8%) | 141.0 |
| 35 to 50 years | 39 (8.6%) | 20.0 |
| Total | 454 (100.0%) | 88.0 |
Fertility by Age by Marriage Status in Seward County
44.7% of women with births (454) in Seward County are married. The highest percentage of unmarried women with births falls into 15 to 19 years age bracket with 85.4% of them unmarried at the time of birth, while the lowest percentage of unmarried women with births belong to 35 to 50 years age bracket with 0.0% of them unmarried.
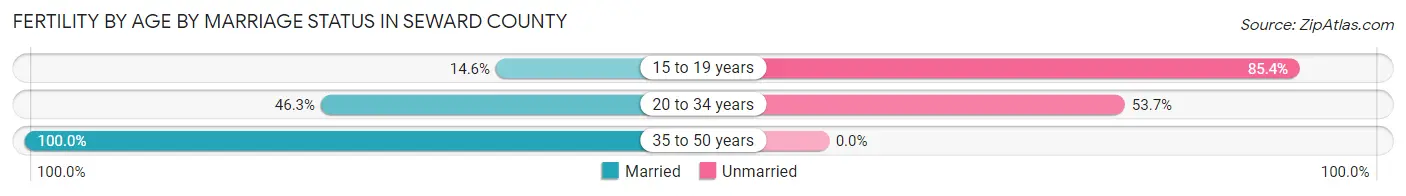
| Age Bracket | Married | Unmarried |
| 15 to 19 years | 13 (14.6%) | 76 (85.4%) |
| 20 to 34 years | 151 (46.3%) | 175 (53.7%) |
| 35 to 50 years | 39 (100.0%) | 0 (0.0%) |
| Total | 203 (44.7%) | 251 (55.3%) |
Fertility by Education in Seward County
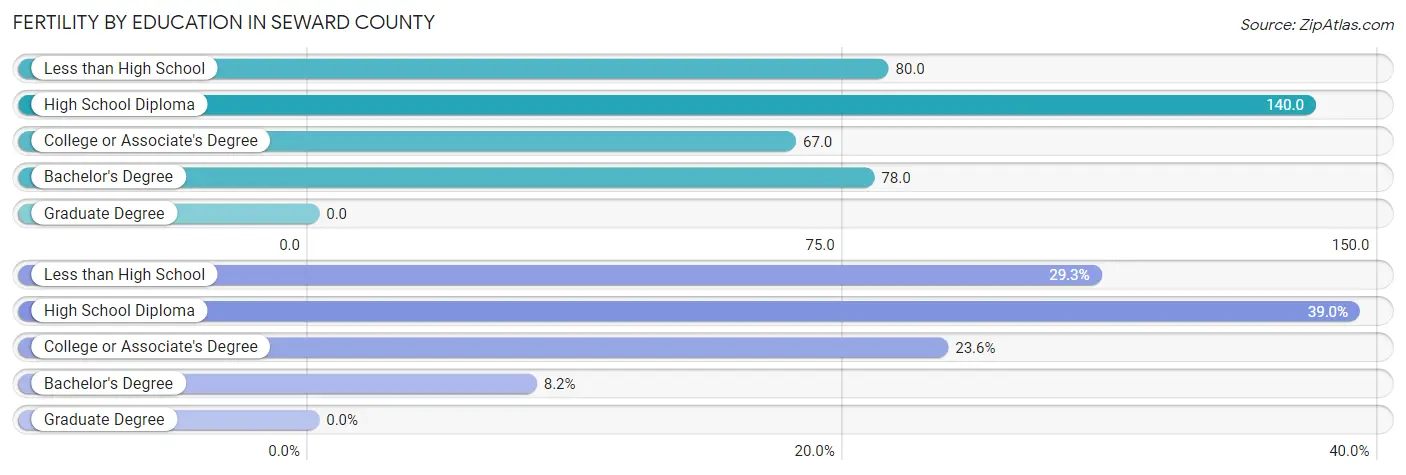
| Educational Attainment | Women with Births | Births / 1,000 Women |
| Less than High School | 133 (29.3%) | 80.0 |
| High School Diploma | 177 (39.0%) | 140.0 |
| College or Associate's Degree | 107 (23.6%) | 67.0 |
| Bachelor's Degree | 37 (8.2%) | 78.0 |
| Graduate Degree | 0 (0.0%) | 0.0 |
| Total | 454 (100.0%) | 88.0 |
Fertility by Education by Marriage Status in Seward County
55.3% of women with births in Seward County are unmarried. Women with the educational attainment of bachelor's degree are most likely to be married with 100.0% of them married at childbirth, while women with the educational attainment of high school diploma are least likely to be married with 82.5% of them unmarried at childbirth.
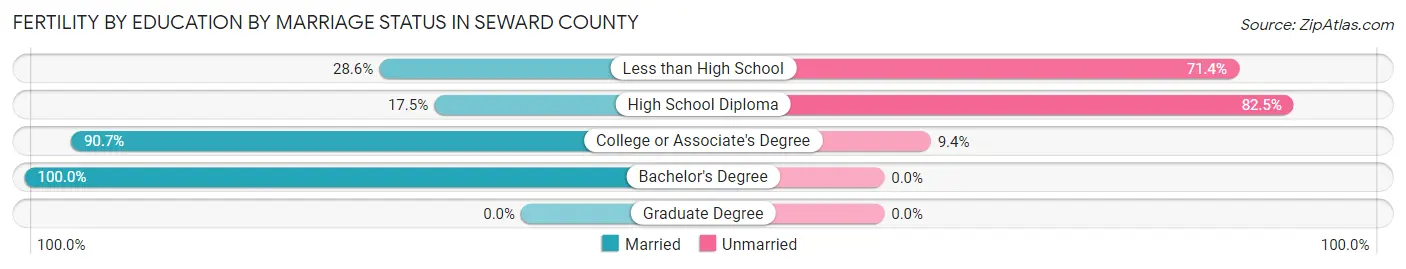
| Educational Attainment | Married | Unmarried |
| Less than High School | 38 (28.6%) | 95 (71.4%) |
| High School Diploma | 31 (17.5%) | 146 (82.5%) |
| College or Associate's Degree | 97 (90.6%) | 10 (9.3%) |
| Bachelor's Degree | 37 (100.0%) | 0 (0.0%) |
| Graduate Degree | 0 (0.0%) | 0 (0.0%) |
| Total | 203 (44.7%) | 251 (55.3%) |
Income in Seward County
Income Overview in Seward County
Per Capita Income in Seward County is $25,391, while median incomes of families and households are $70,120 and $57,131 respectively.
| Characteristic | Number | Measure |
| Per Capita Income | 21,942 | $25,391 |
| Median Family Income | 4,732 | $70,120 |
| Mean Family Income | 4,732 | $82,693 |
| Median Household Income | 7,071 | $57,131 |
| Mean Household Income | 7,071 | $72,107 |
| Income Deficit | 4,732 | $10,294 |
| Wage / Income Gap (%) | 21,942 | 33.17% |
| Wage / Income Gap ($) | 21,942 | 66.83¢ per $1 |
| Gini / Inequality Index | 21,942 | 0.39 |
Earnings by Sex in Seward County
Average Earnings in Seward County are $35,800, $41,958 for men and $28,039 for women, a difference of 33.2%.
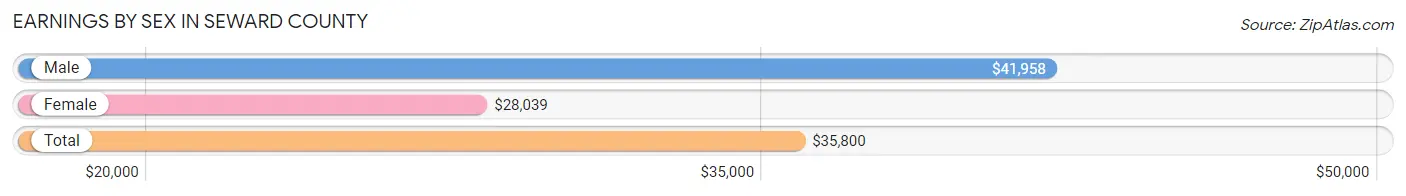
| Sex | Number | Average Earnings |
| Male | 6,524 (56.0%) | $41,958 |
| Female | 5,127 (44.0%) | $28,039 |
| Total | 11,651 (100.0%) | $35,800 |
Earnings by Sex by Income Bracket in Seward County
The most common earnings brackets in Seward County are $55,000 to $64,999 for men (716 | 11.0%) and $25,000 to $29,999 for women (802 | 15.6%).
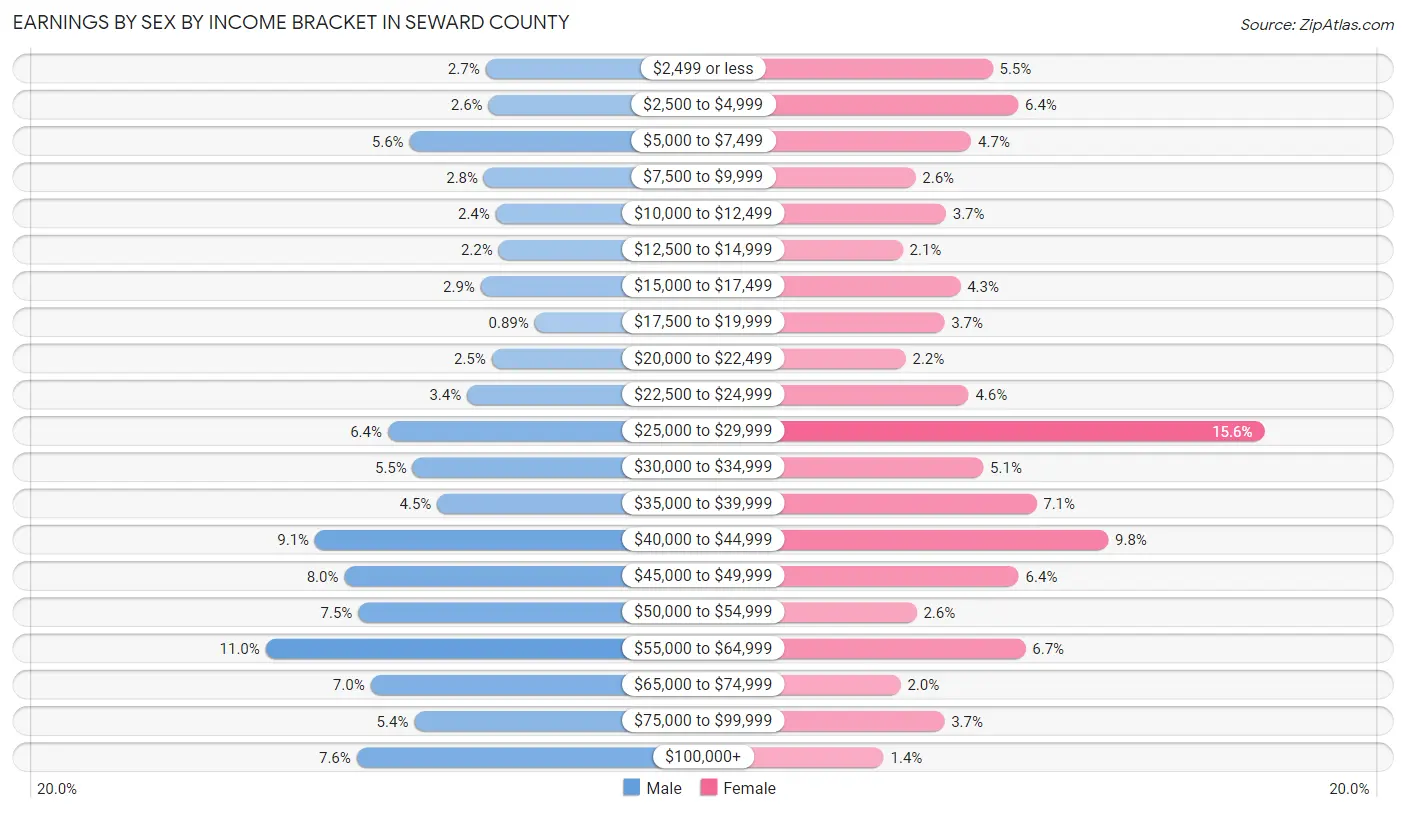
| Income | Male | Female |
| $2,499 or less | 178 (2.7%) | 280 (5.5%) |
| $2,500 to $4,999 | 171 (2.6%) | 329 (6.4%) |
| $5,000 to $7,499 | 364 (5.6%) | 239 (4.7%) |
| $7,500 to $9,999 | 182 (2.8%) | 132 (2.6%) |
| $10,000 to $12,499 | 153 (2.4%) | 190 (3.7%) |
| $12,500 to $14,999 | 146 (2.2%) | 107 (2.1%) |
| $15,000 to $17,499 | 190 (2.9%) | 218 (4.3%) |
| $17,500 to $19,999 | 58 (0.9%) | 187 (3.6%) |
| $20,000 to $22,499 | 163 (2.5%) | 113 (2.2%) |
| $22,500 to $24,999 | 223 (3.4%) | 234 (4.6%) |
| $25,000 to $29,999 | 417 (6.4%) | 802 (15.6%) |
| $30,000 to $34,999 | 356 (5.5%) | 262 (5.1%) |
| $35,000 to $39,999 | 296 (4.5%) | 364 (7.1%) |
| $40,000 to $44,999 | 595 (9.1%) | 502 (9.8%) |
| $45,000 to $49,999 | 523 (8.0%) | 330 (6.4%) |
| $50,000 to $54,999 | 489 (7.5%) | 134 (2.6%) |
| $55,000 to $64,999 | 716 (11.0%) | 343 (6.7%) |
| $65,000 to $74,999 | 459 (7.0%) | 103 (2.0%) |
| $75,000 to $99,999 | 352 (5.4%) | 187 (3.6%) |
| $100,000+ | 493 (7.6%) | 71 (1.4%) |
| Total | 6,524 (100.0%) | 5,127 (100.0%) |
Earnings by Sex by Educational Attainment in Seward County
Average earnings in Seward County are $46,560 for men and $29,682 for women, a difference of 36.2%. Men with an educational attainment of graduate degree enjoy the highest average annual earnings of $81,719, while those with less than high school education earn the least with $45,050. Women with an educational attainment of graduate degree earn the most with the average annual earnings of $66,250, while those with less than high school education have the smallest earnings of $27,055.
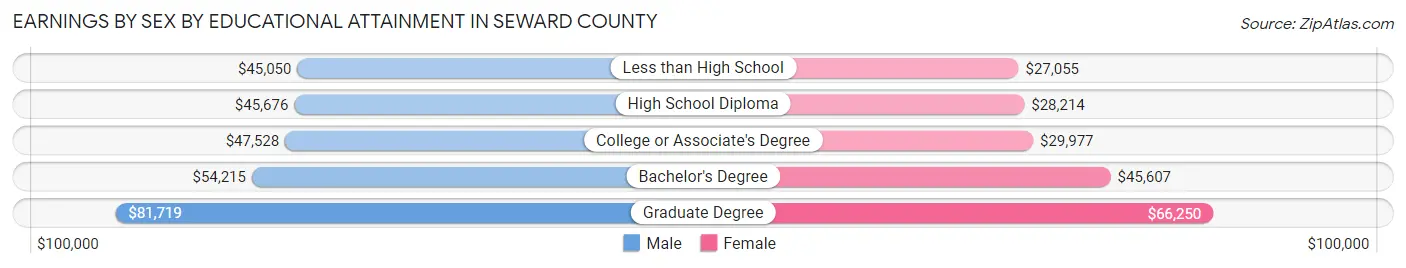
| Educational Attainment | Male Income | Female Income |
| Less than High School | $45,050 | $27,055 |
| High School Diploma | $45,676 | $28,214 |
| College or Associate's Degree | $47,528 | $29,977 |
| Bachelor's Degree | $54,215 | $45,607 |
| Graduate Degree | $81,719 | $66,250 |
| Total | $46,560 | $29,682 |
Family Income in Seward County
Family Income Brackets in Seward County
According to the Seward County family income data, there are 1,065 families falling into the $50,000 to $74,999 income range, which is the most common income bracket and makes up 22.5% of all families. Conversely, the $10,000 to $14,999 income bracket is the least frequent group with only 90 families (1.9%) belonging to this category.
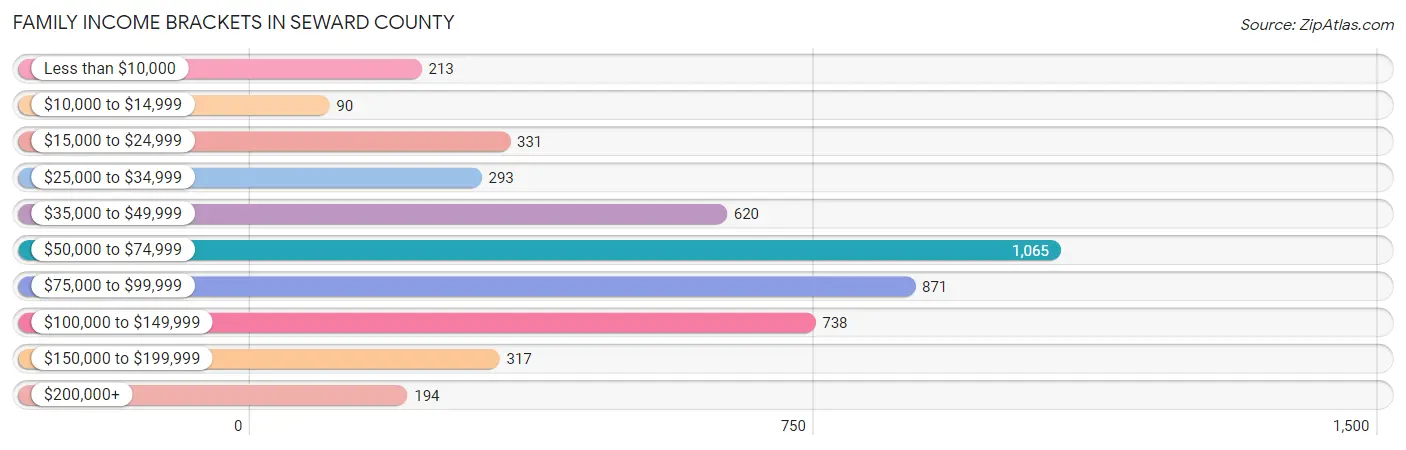
| Income Bracket | # Families | % Families |
| Less than $10,000 | 213 | 4.5% |
| $10,000 to $14,999 | 90 | 1.9% |
| $15,000 to $24,999 | 331 | 7.0% |
| $25,000 to $34,999 | 293 | 6.2% |
| $35,000 to $49,999 | 620 | 13.1% |
| $50,000 to $74,999 | 1,065 | 22.5% |
| $75,000 to $99,999 | 871 | 18.4% |
| $100,000 to $149,999 | 738 | 15.6% |
| $150,000 to $199,999 | 317 | 6.7% |
| $200,000+ | 194 | 4.1% |
Family Income by Famaliy Size in Seward County
6-person families (205 | 4.3%) account for the highest median family income in Seward County with $132,802 per family, while 2-person families (1,631 | 34.5%) have the highest median income of $26,222 per family member.
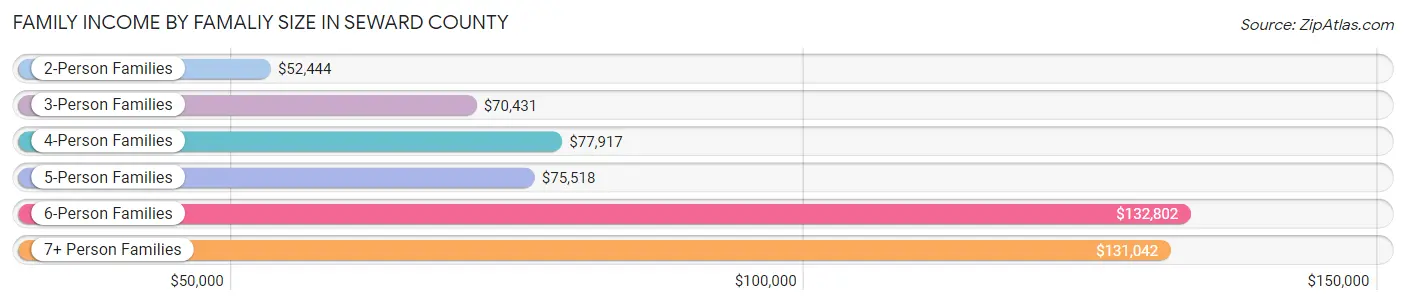
| Income Bracket | # Families | Median Income |
| 2-Person Families | 1,631 (34.5%) | $52,444 |
| 3-Person Families | 1,106 (23.4%) | $70,431 |
| 4-Person Families | 965 (20.4%) | $77,917 |
| 5-Person Families | 755 (16.0%) | $75,518 |
| 6-Person Families | 205 (4.3%) | $132,802 |
| 7+ Person Families | 70 (1.5%) | $131,042 |
| Total | 4,732 (100.0%) | $70,120 |
Family Income by Number of Earners in Seward County
The median family income in Seward County is $70,120, with families comprising 3+ earners (761) having the highest median family income of $134,497, while families with no earners (271) have the lowest median family income of $33,133, accounting for 16.1% and 5.7% of families, respectively.
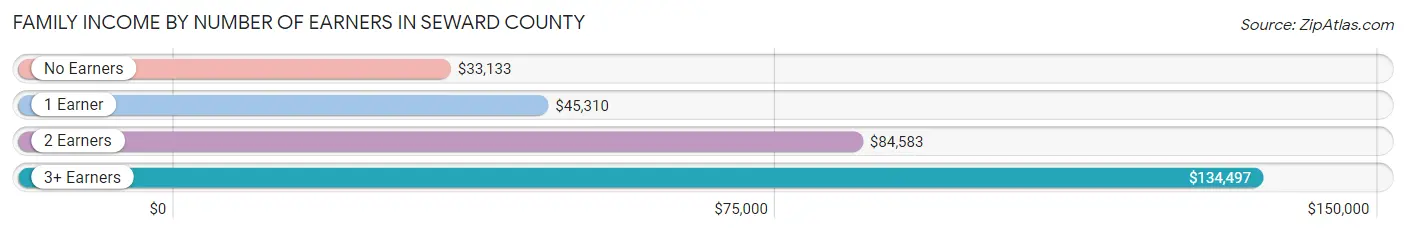
| Number of Earners | # Families | Median Income |
| No Earners | 271 (5.7%) | $33,133 |
| 1 Earner | 1,672 (35.3%) | $45,310 |
| 2 Earners | 2,028 (42.9%) | $84,583 |
| 3+ Earners | 761 (16.1%) | $134,497 |
| Total | 4,732 (100.0%) | $70,120 |
Household Income in Seward County
Household Income Brackets in Seward County
With 1,478 households falling in the category, the $50,000 to $74,999 income range is the most frequent in Seward County, accounting for 20.9% of all households. In contrast, only 191 households (2.7%) fall into the less than $10,000 income bracket, making it the least populous group.
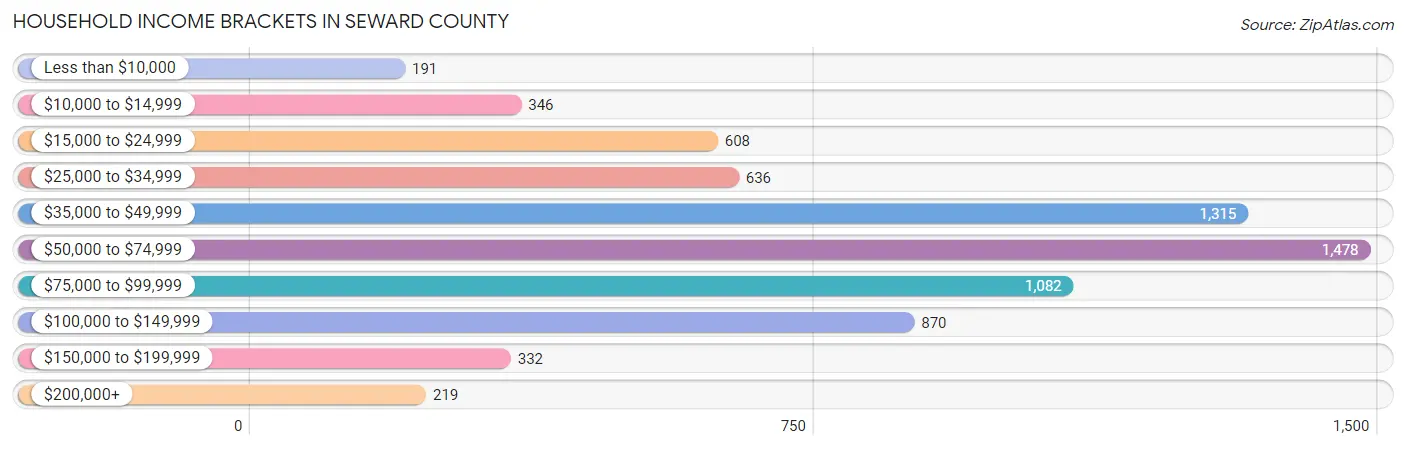
| Income Bracket | # Households | % Households |
| Less than $10,000 | 191 | 2.7% |
| $10,000 to $14,999 | 346 | 4.9% |
| $15,000 to $24,999 | 608 | 8.6% |
| $25,000 to $34,999 | 636 | 9.0% |
| $35,000 to $49,999 | 1,315 | 18.6% |
| $50,000 to $74,999 | 1,478 | 20.9% |
| $75,000 to $99,999 | 1,082 | 15.3% |
| $100,000 to $149,999 | 870 | 12.3% |
| $150,000 to $199,999 | 332 | 4.7% |
| $200,000+ | 219 | 3.1% |
Household Income by Householder Age in Seward County
The median household income in Seward County is $57,131, with the highest median household income of $64,731 found in the 45 to 64 years age bracket for the primary householder. A total of 2,616 households (37.0%) fall into this category. Meanwhile, the 15 to 24 years age bracket for the primary householder has the lowest median household income of $29,779, with 515 households (7.3%) in this group.
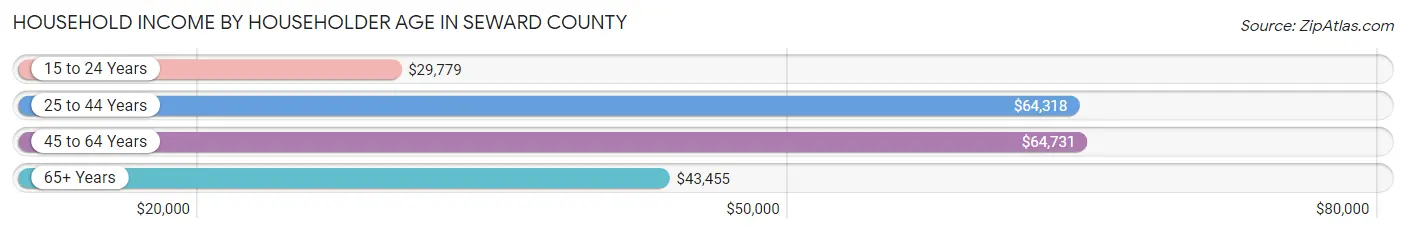
| Income Bracket | # Households | Median Income |
| 15 to 24 Years | 515 (7.3%) | $29,779 |
| 25 to 44 Years | 2,596 (36.7%) | $64,318 |
| 45 to 64 Years | 2,616 (37.0%) | $64,731 |
| 65+ Years | 1,344 (19.0%) | $43,455 |
| Total | 7,071 (100.0%) | $57,131 |
Poverty in Seward County
Income Below Poverty by Sex and Age in Seward County
With 12.6% poverty level for males and 14.6% for females among the residents of Seward County, 5 year old males and under 5 year old females are the most vulnerable to poverty, with 68 males (35.0%) and 260 females (30.2%) in their respective age groups living below the poverty level.
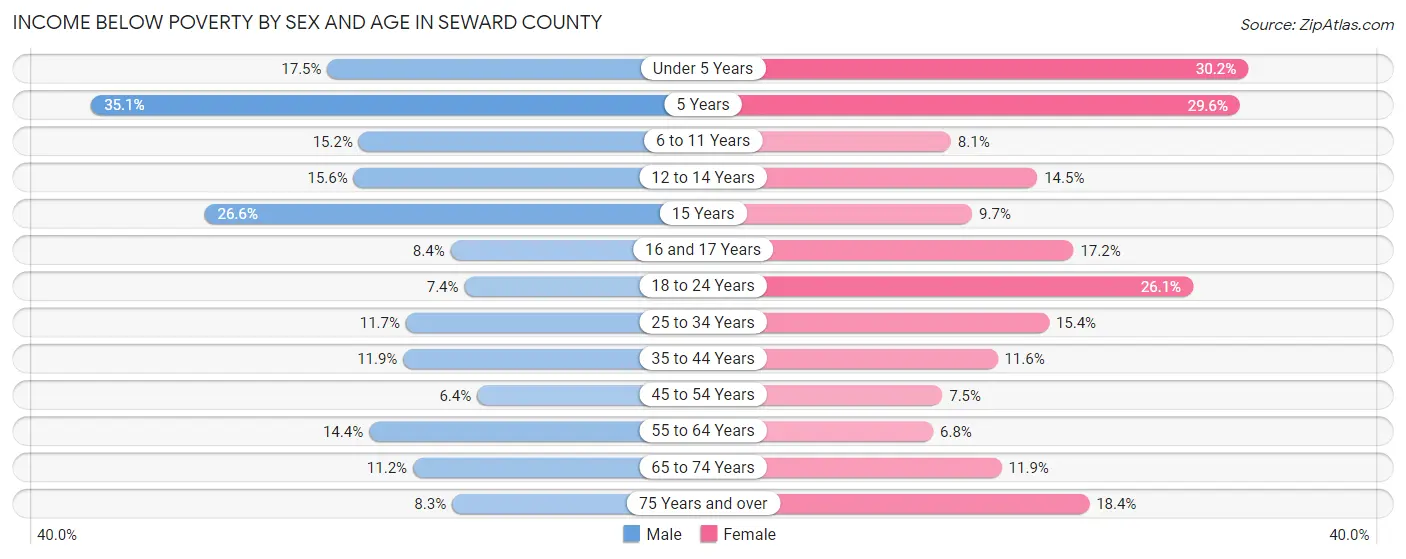
| Age Bracket | Male | Female |
| Under 5 Years | 171 (17.5%) | 260 (30.2%) |
| 5 Years | 68 (35.0%) | 26 (29.5%) |
| 6 to 11 Years | 185 (15.2%) | 94 (8.1%) |
| 12 to 14 Years | 96 (15.6%) | 73 (14.5%) |
| 15 Years | 73 (26.6%) | 27 (9.7%) |
| 16 and 17 Years | 28 (8.4%) | 43 (17.2%) |
| 18 to 24 Years | 83 (7.3%) | 273 (26.1%) |
| 25 to 34 Years | 183 (11.7%) | 236 (15.4%) |
| 35 to 44 Years | 172 (11.9%) | 137 (11.6%) |
| 45 to 54 Years | 86 (6.4%) | 88 (7.5%) |
| 55 to 64 Years | 177 (14.4%) | 67 (6.8%) |
| 65 to 74 Years | 65 (11.2%) | 68 (11.9%) |
| 75 Years and over | 33 (8.3%) | 106 (18.4%) |
| Total | 1,420 (12.6%) | 1,498 (14.6%) |
Income Above Poverty by Sex and Age in Seward County
According to the poverty statistics in Seward County, males aged 45 to 54 years and females aged 55 to 64 years are the age groups that are most secure financially, with 93.6% of males and 93.2% of females in these age groups living above the poverty line.
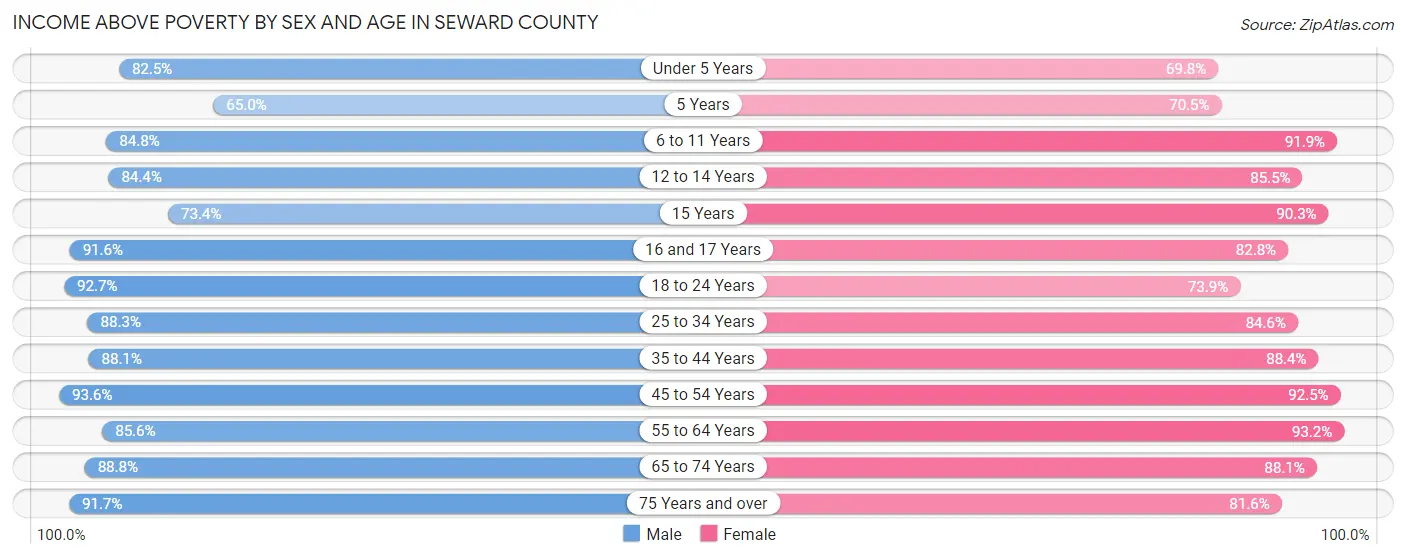
| Age Bracket | Male | Female |
| Under 5 Years | 805 (82.5%) | 602 (69.8%) |
| 5 Years | 126 (64.9%) | 62 (70.5%) |
| 6 to 11 Years | 1,033 (84.8%) | 1,066 (91.9%) |
| 12 to 14 Years | 520 (84.4%) | 430 (85.5%) |
| 15 Years | 201 (73.4%) | 252 (90.3%) |
| 16 and 17 Years | 306 (91.6%) | 207 (82.8%) |
| 18 to 24 Years | 1,047 (92.6%) | 774 (73.9%) |
| 25 to 34 Years | 1,381 (88.3%) | 1,298 (84.6%) |
| 35 to 44 Years | 1,274 (88.1%) | 1,048 (88.4%) |
| 45 to 54 Years | 1,255 (93.6%) | 1,091 (92.5%) |
| 55 to 64 Years | 1,050 (85.6%) | 921 (93.2%) |
| 65 to 74 Years | 517 (88.8%) | 505 (88.1%) |
| 75 Years and over | 366 (91.7%) | 471 (81.6%) |
| Total | 9,881 (87.4%) | 8,727 (85.4%) |
Income Below Poverty Among Married-Couple Families in Seward County
The poverty statistics for married-couple families in Seward County show that 6.3% or 213 of the total 3,395 families live below the poverty line. Families with 1 or 2 children have the highest poverty rate of 13.8%, comprising of 131 families. On the other hand, families with 5 or more children have the lowest poverty rate of 0.0%, which includes 0 families.
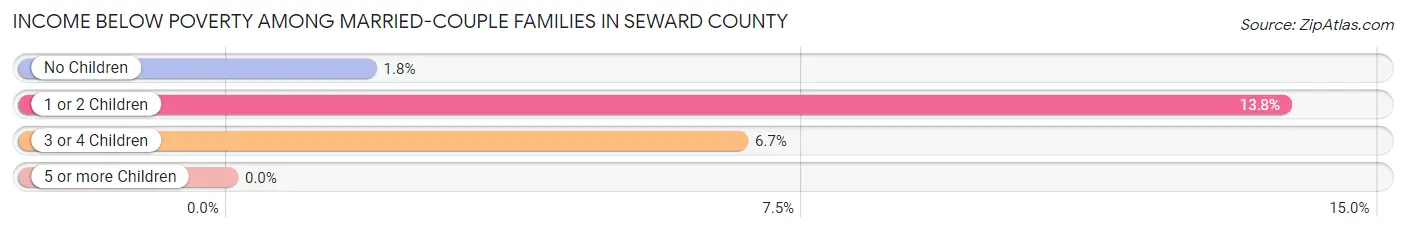
| Children | Above Poverty | Below Poverty |
| No Children | 1,625 (98.2%) | 30 (1.8%) |
| 1 or 2 Children | 821 (86.2%) | 131 (13.8%) |
| 3 or 4 Children | 729 (93.3%) | 52 (6.7%) |
| 5 or more Children | 7 (100.0%) | 0 (0.0%) |
| Total | 3,182 (93.7%) | 213 (6.3%) |
Income Below Poverty Among Single-Parent Households in Seward County
According to the poverty data in Seward County, 30.9% or 126 single-father households and 23.1% or 215 single-mother households are living below the poverty line. Among single-father households, those with 3 or 4 children have the highest poverty rate, with 78 households (66.7%) experiencing poverty. Likewise, among single-mother households, those with 5 or more children have the highest poverty rate, with 1 households (33.3%) falling below the poverty line.
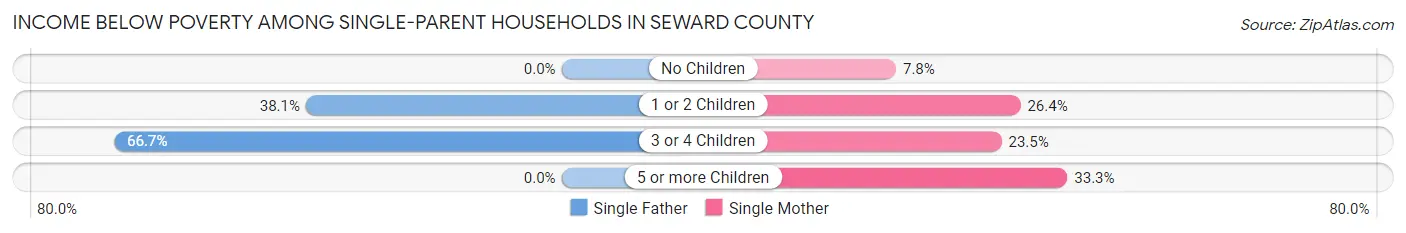
| Children | Single Father | Single Mother |
| No Children | 0 (0.0%) | 11 (7.8%) |
| 1 or 2 Children | 48 (38.1%) | 171 (26.4%) |
| 3 or 4 Children | 78 (66.7%) | 32 (23.5%) |
| 5 or more Children | 0 (0.0%) | 1 (33.3%) |
| Total | 126 (30.9%) | 215 (23.1%) |
Income Below Poverty Among Married-Couple vs Single-Parent Households in Seward County
The poverty data for Seward County shows that 213 of the married-couple family households (6.3%) and 341 of the single-parent households (25.5%) are living below the poverty level. Within the married-couple family households, those with 1 or 2 children have the highest poverty rate, with 131 households (13.8%) falling below the poverty line. Among the single-parent households, those with 3 or 4 children have the highest poverty rate, with 110 household (43.5%) living below poverty.
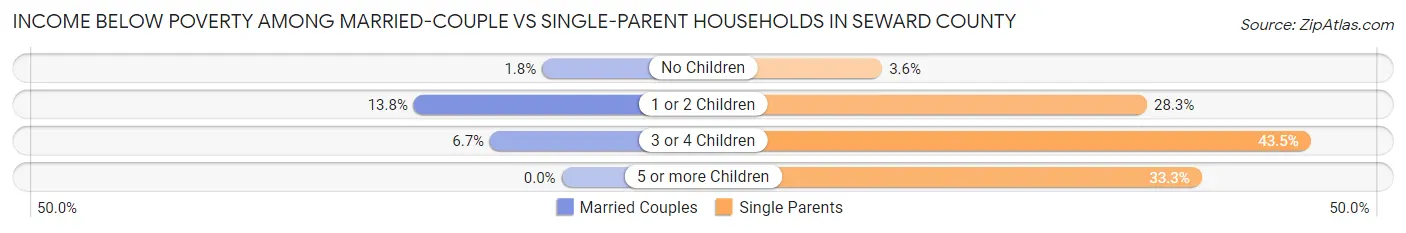
| Children | Married-Couple Families | Single-Parent Households |
| No Children | 30 (1.8%) | 11 (3.6%) |
| 1 or 2 Children | 131 (13.8%) | 219 (28.3%) |
| 3 or 4 Children | 52 (6.7%) | 110 (43.5%) |
| 5 or more Children | 0 (0.0%) | 1 (33.3%) |
| Total | 213 (6.3%) | 341 (25.5%) |
Employment Characteristics in Seward County
Employment by Class of Employer in Seward County
Among the 10,455 employed individuals in Seward County, private company employees (7,461 | 71.4%), local government employees (1,010 | 9.7%), and self-employed (not incorporated) (632 | 6.0%) make up the most common classes of employment.
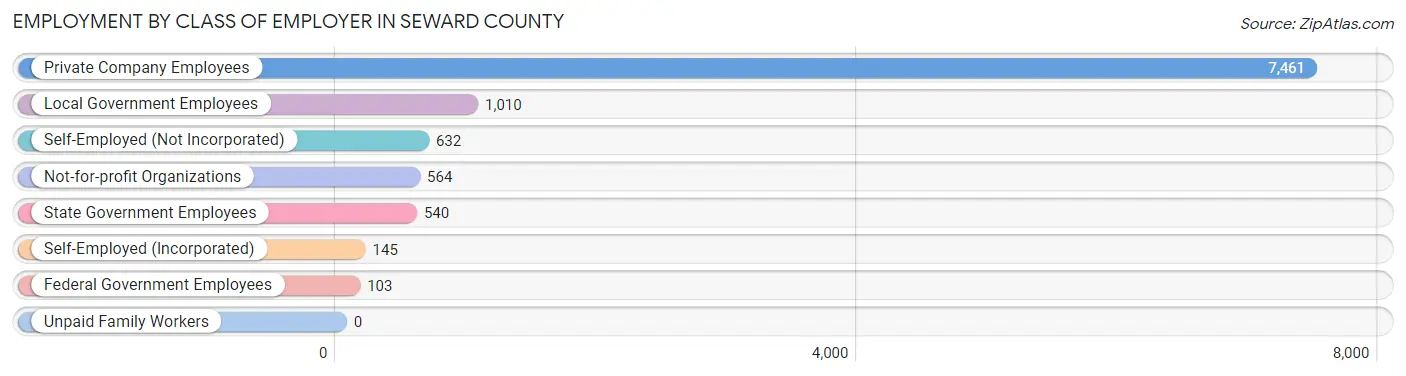
| Employer Class | # Employees | % Employees |
| Private Company Employees | 7,461 | 71.4% |
| Self-Employed (Incorporated) | 145 | 1.4% |
| Self-Employed (Not Incorporated) | 632 | 6.0% |
| Not-for-profit Organizations | 564 | 5.4% |
| Local Government Employees | 1,010 | 9.7% |
| State Government Employees | 540 | 5.2% |
| Federal Government Employees | 103 | 1.0% |
| Unpaid Family Workers | 0 | 0.0% |
| Total | 10,455 | 100.0% |
Employment Status by Age in Seward County
According to the labor force statistics for Seward County, out of the total population over 16 years of age (15,730), 70.0% or 11,011 individuals are in the labor force, with 2.7% or 297 of them unemployed. The age group with the highest labor force participation rate is 45 to 54 years, with 89.8% or 2,282 individuals in the labor force. Within the labor force, the 16 to 19 years age range has the highest percentage of unemployed individuals, with 8.7% or 60 of them being unemployed.
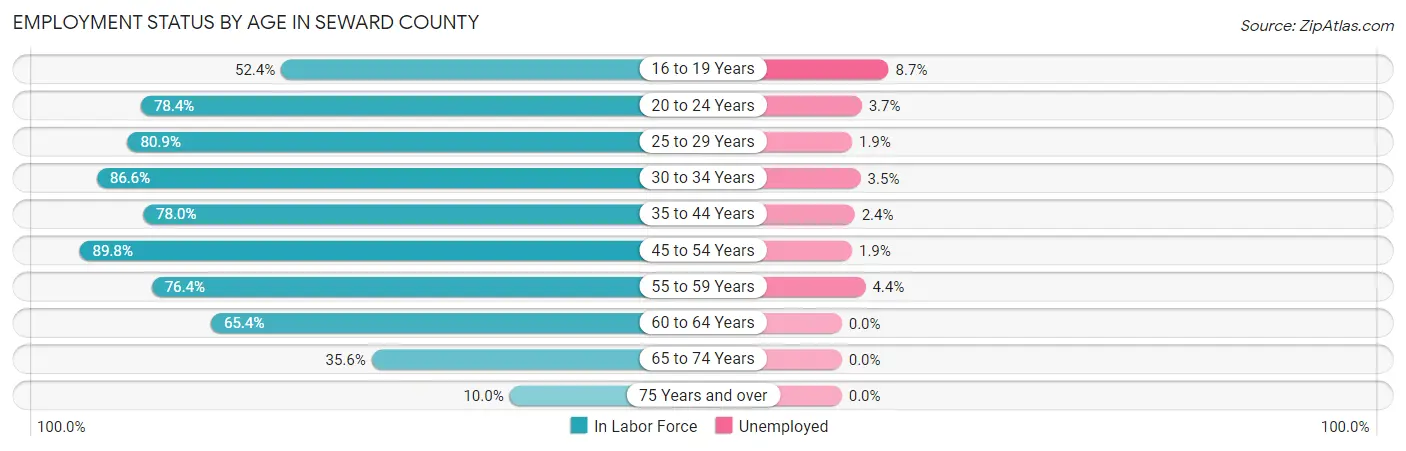
| Age Bracket | In Labor Force | Unemployed |
| 16 to 19 Years | 690 (52.4%) | 60 (8.7%) |
| 20 to 24 Years | 1,300 (78.4%) | 48 (3.7%) |
| 25 to 29 Years | 1,262 (80.9%) | 24 (1.9%) |
| 30 to 34 Years | 1,353 (86.6%) | 47 (3.5%) |
| 35 to 44 Years | 2,072 (78.0%) | 50 (2.4%) |
| 45 to 54 Years | 2,282 (89.8%) | 43 (1.9%) |
| 55 to 59 Years | 550 (76.4%) | 24 (4.4%) |
| 60 to 64 Years | 980 (65.4%) | 0 (0.0%) |
| 65 to 74 Years | 421 (35.6%) | 0 (0.0%) |
| 75 Years and over | 104 (10.0%) | 0 (0.0%) |
| Total | 11,011 (70.0%) | 297 (2.7%) |
Employment Status by Educational Attainment in Seward County
According to labor force statistics for Seward County, 80.7% of individuals (8,504) out of the total population between 25 and 64 years of age (10,538) are in the labor force, with 2.2% or 187 of them being unemployed. The group with the highest labor force participation rate are those with the educational attainment of college / associate degree, with 84.4% or 2,413 individuals in the labor force. Within the labor force, individuals with less than high school education have the highest percentage of unemployment, with 4.7% or 121 of them being unemployed.
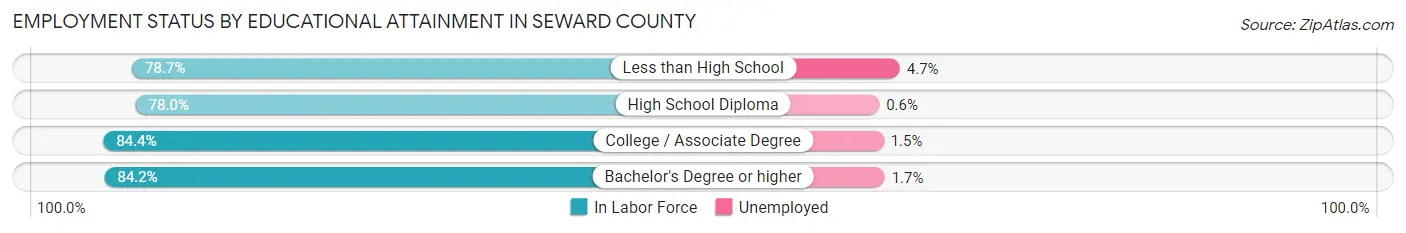
| Educational Attainment | In Labor Force | Unemployed |
| Less than High School | 2,572 (78.7%) | 154 (4.7%) |
| High School Diploma | 2,529 (78.0%) | 19 (0.6%) |
| College / Associate Degree | 2,413 (84.4%) | 43 (1.5%) |
| Bachelor's Degree or higher | 984 (84.2%) | 20 (1.7%) |
| Total | 8,504 (80.7%) | 232 (2.2%) |
Employment Occupations by Sex in Seward County
Management, Business, Science and Arts Occupations
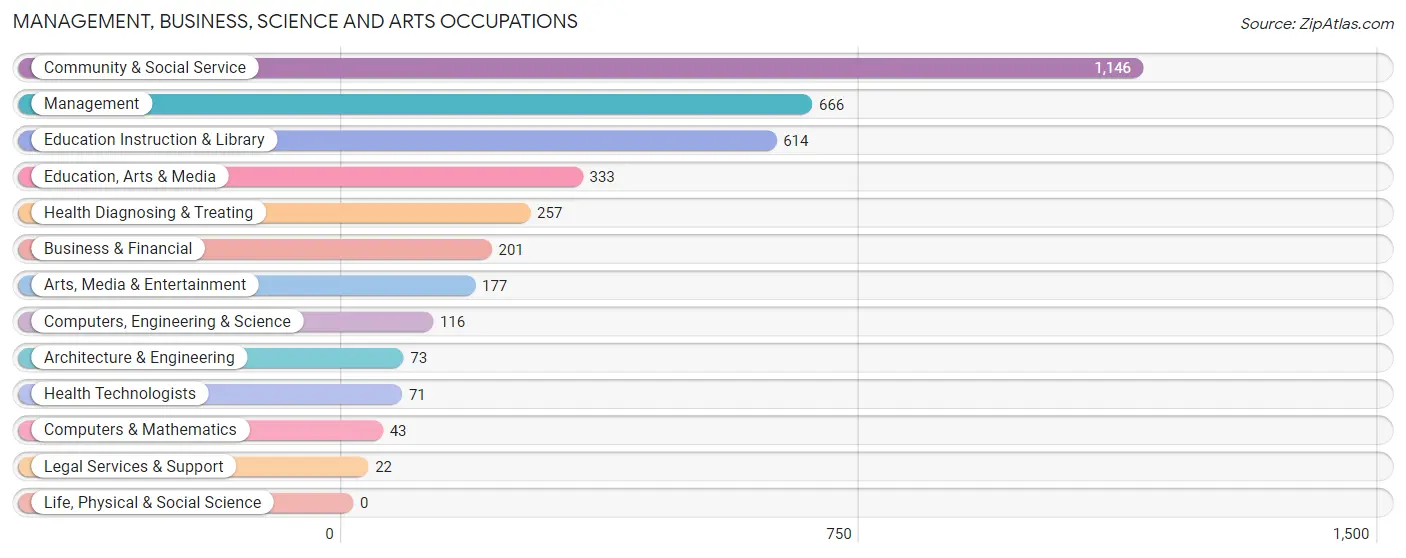
The most common Management, Business, Science and Arts occupations in Seward County are Community & Social Service (1,146 | 10.7%), Management (666 | 6.2%), Education Instruction & Library (614 | 5.7%), Education, Arts & Media (333 | 3.1%), and Health Diagnosing & Treating (257 | 2.4%).
Management, Business, Science and Arts Occupations by Sex
Within the Management, Business, Science and Arts occupations in Seward County, the most male-oriented occupations are Legal Services & Support (100.0%), Computers & Mathematics (69.8%), and Management (60.4%), while the most female-oriented occupations are Education, Arts & Media (79.9%), Health Diagnosing & Treating (74.3%), and Education Instruction & Library (67.7%).
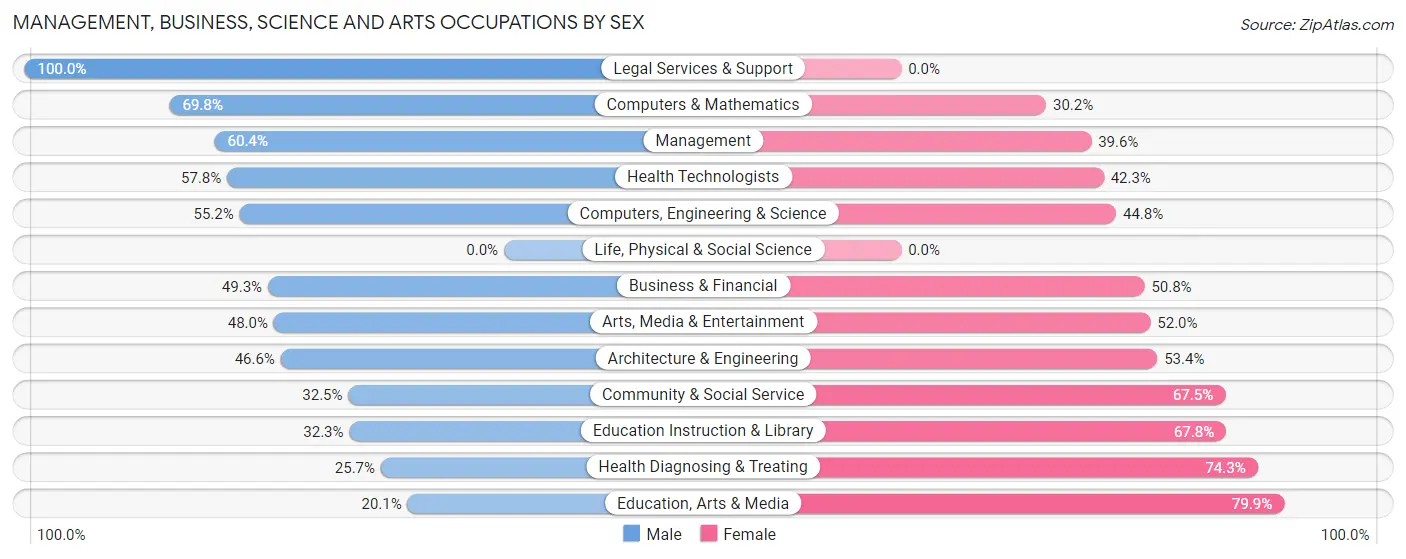
| Occupation | Male | Female |
| Management | 402 (60.4%) | 264 (39.6%) |
| Business & Financial | 99 (49.2%) | 102 (50.7%) |
| Computers, Engineering & Science | 64 (55.2%) | 52 (44.8%) |
| Computers & Mathematics | 30 (69.8%) | 13 (30.2%) |
| Architecture & Engineering | 34 (46.6%) | 39 (53.4%) |
| Life, Physical & Social Science | 0 (0.0%) | 0 (0.0%) |
| Community & Social Service | 372 (32.5%) | 774 (67.5%) |
| Education, Arts & Media | 67 (20.1%) | 266 (79.9%) |
| Legal Services & Support | 22 (100.0%) | 0 (0.0%) |
| Education Instruction & Library | 198 (32.3%) | 416 (67.7%) |
| Arts, Media & Entertainment | 85 (48.0%) | 92 (52.0%) |
| Health Diagnosing & Treating | 66 (25.7%) | 191 (74.3%) |
| Health Technologists | 41 (57.8%) | 30 (42.2%) |
| Total (Category) | 1,003 (42.0%) | 1,383 (58.0%) |
| Total (Overall) | 6,050 (56.5%) | 4,667 (43.5%) |
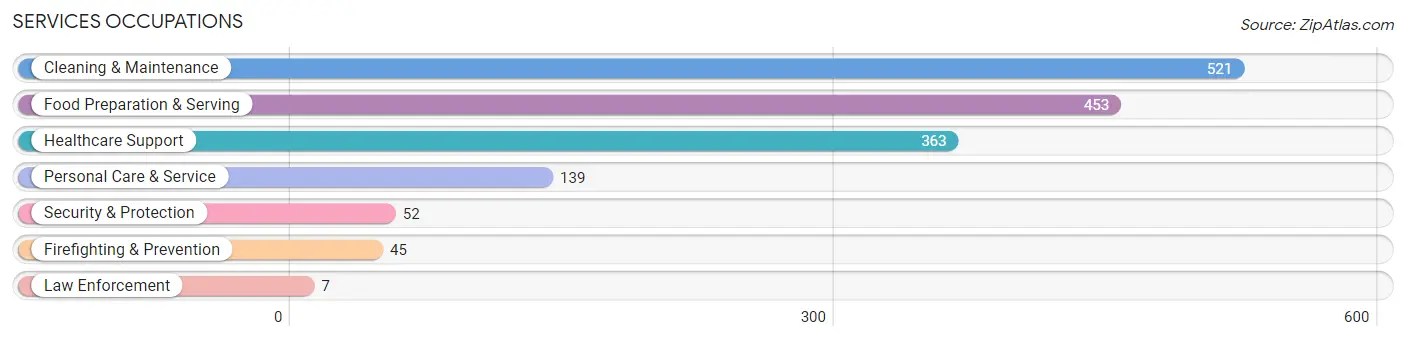
Services Occupations
The most common Services occupations in Seward County are Cleaning & Maintenance (521 | 4.9%), Food Preparation & Serving (453 | 4.2%), Healthcare Support (363 | 3.4%), Personal Care & Service (139 | 1.3%), and Security & Protection (52 | 0.5%).
Services Occupations by Sex
Within the Services occupations in Seward County, the most male-oriented occupations are Law Enforcement (100.0%), Security & Protection (50.0%), and Firefighting & Prevention (42.2%), while the most female-oriented occupations are Healthcare Support (83.8%), Personal Care & Service (71.9%), and Cleaning & Maintenance (70.6%).
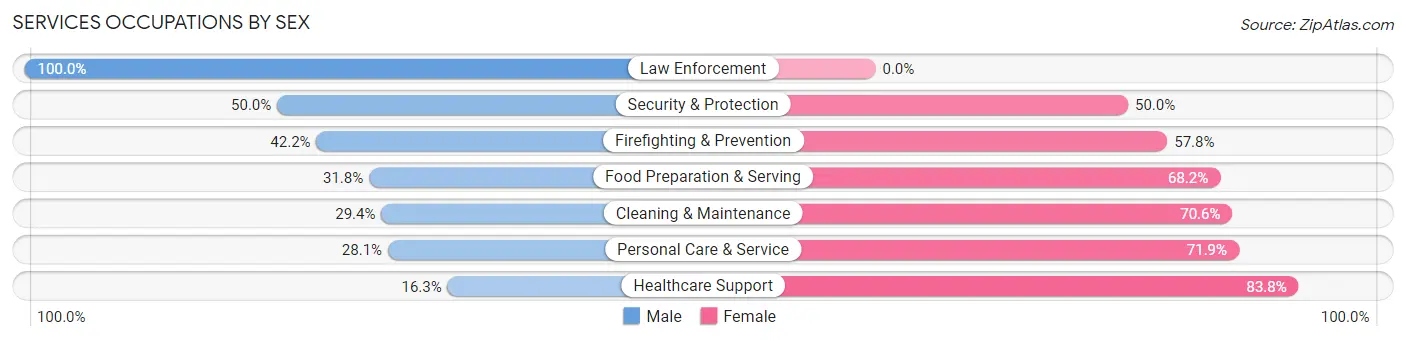
| Occupation | Male | Female |
| Healthcare Support | 59 (16.3%) | 304 (83.8%) |
| Security & Protection | 26 (50.0%) | 26 (50.0%) |
| Firefighting & Prevention | 19 (42.2%) | 26 (57.8%) |
| Law Enforcement | 7 (100.0%) | 0 (0.0%) |
| Food Preparation & Serving | 144 (31.8%) | 309 (68.2%) |
| Cleaning & Maintenance | 153 (29.4%) | 368 (70.6%) |
| Personal Care & Service | 39 (28.1%) | 100 (71.9%) |
| Total (Category) | 421 (27.6%) | 1,107 (72.5%) |
| Total (Overall) | 6,050 (56.5%) | 4,667 (43.5%) |
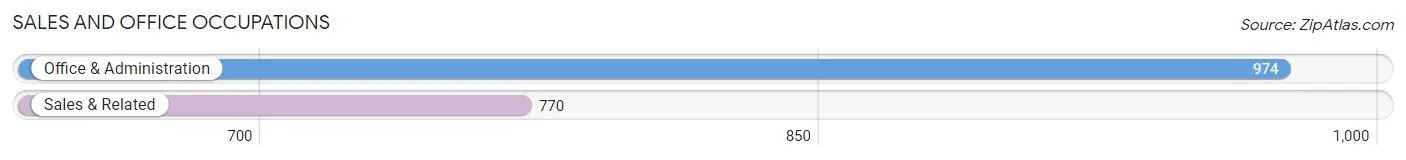
Sales and Office Occupations
The most common Sales and Office occupations in Seward County are Office & Administration (974 | 9.1%), and Sales & Related (770 | 7.2%).
Sales and Office Occupations by Sex
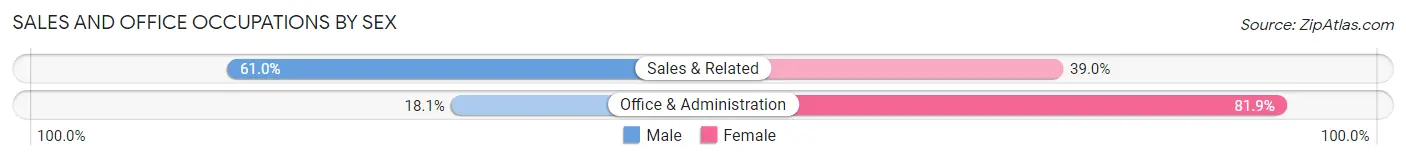
| Occupation | Male | Female |
| Sales & Related | 470 (61.0%) | 300 (39.0%) |
| Office & Administration | 176 (18.1%) | 798 (81.9%) |
| Total (Category) | 646 (37.0%) | 1,098 (63.0%) |
| Total (Overall) | 6,050 (56.5%) | 4,667 (43.5%) |
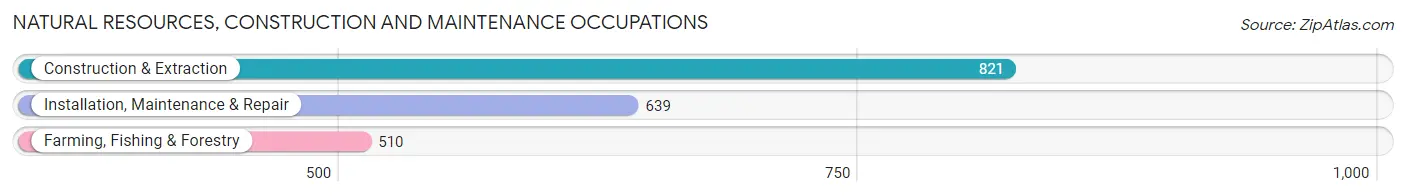
Natural Resources, Construction and Maintenance Occupations
The most common Natural Resources, Construction and Maintenance occupations in Seward County are Construction & Extraction (821 | 7.7%), Installation, Maintenance & Repair (639 | 6.0%), and Farming, Fishing & Forestry (510 | 4.8%).
Natural Resources, Construction and Maintenance Occupations by Sex
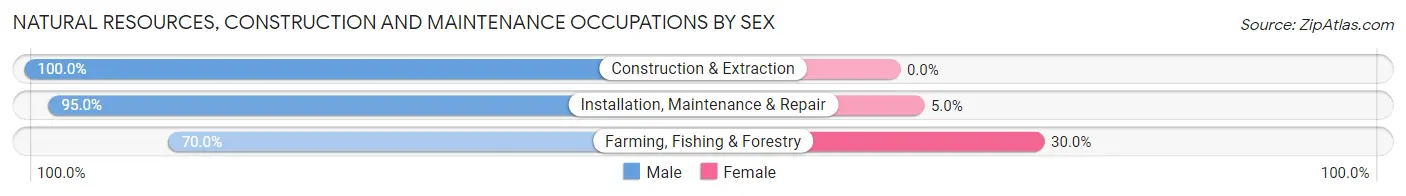
| Occupation | Male | Female |
| Farming, Fishing & Forestry | 357 (70.0%) | 153 (30.0%) |
| Construction & Extraction | 821 (100.0%) | 0 (0.0%) |
| Installation, Maintenance & Repair | 607 (95.0%) | 32 (5.0%) |
| Total (Category) | 1,785 (90.6%) | 185 (9.4%) |
| Total (Overall) | 6,050 (56.5%) | 4,667 (43.5%) |
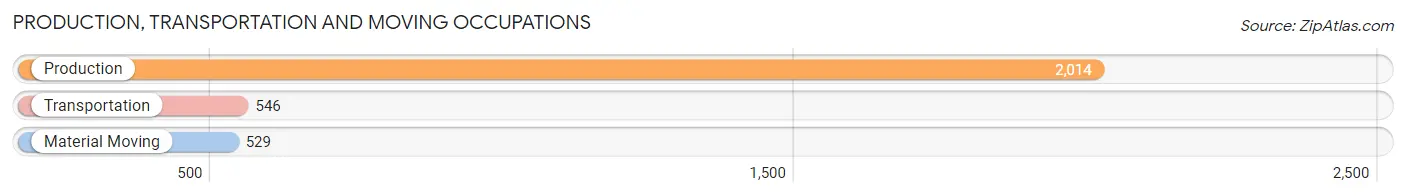
Production, Transportation and Moving Occupations
The most common Production, Transportation and Moving occupations in Seward County are Production (2,014 | 18.8%), Transportation (546 | 5.1%), and Material Moving (529 | 4.9%).
Production, Transportation and Moving Occupations by Sex
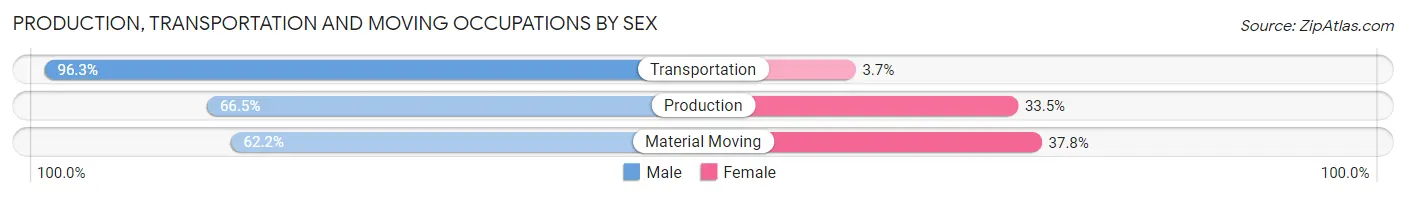
| Occupation | Male | Female |
| Production | 1,340 (66.5%) | 674 (33.5%) |
| Transportation | 526 (96.3%) | 20 (3.7%) |
| Material Moving | 329 (62.2%) | 200 (37.8%) |
| Total (Category) | 2,195 (71.1%) | 894 (28.9%) |
| Total (Overall) | 6,050 (56.5%) | 4,667 (43.5%) |
Employment Industries by Sex in Seward County
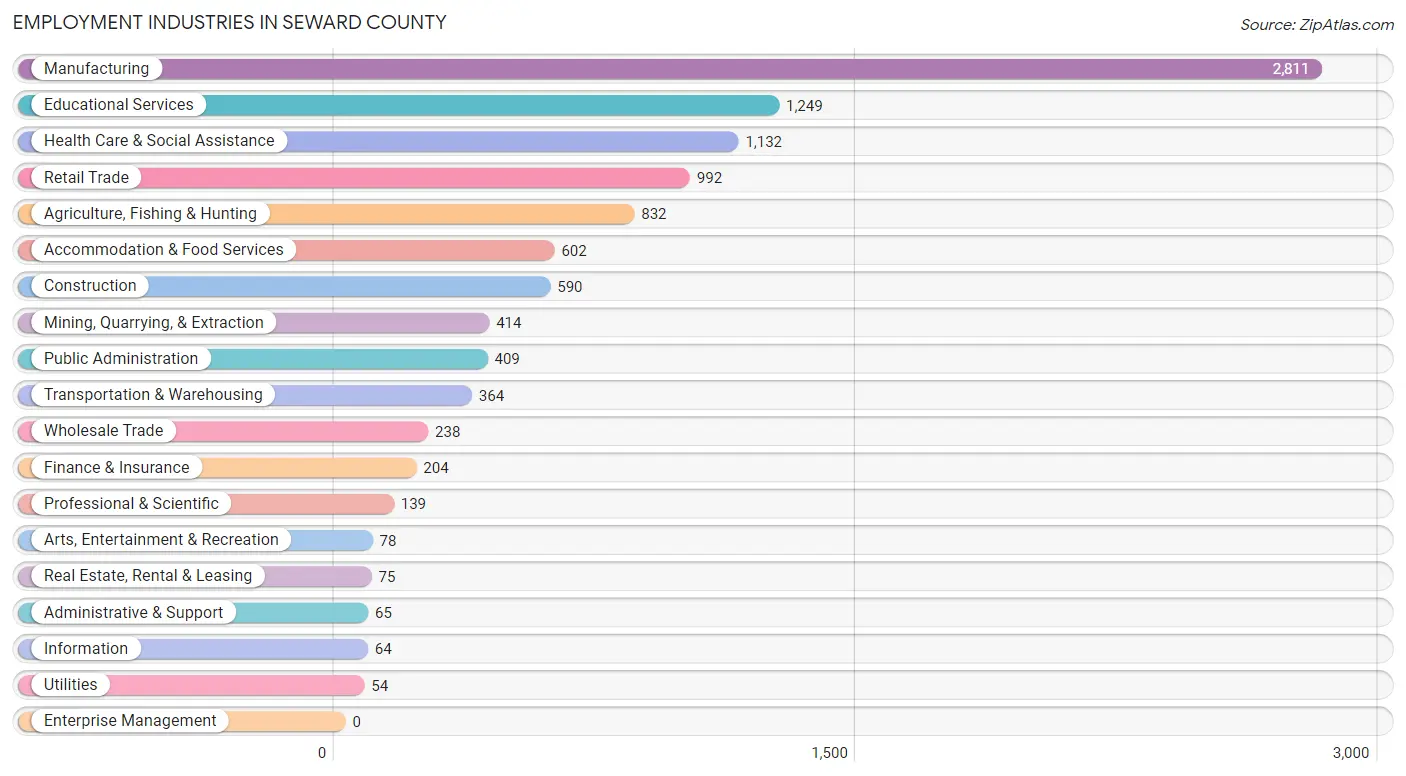
Employment Industries in Seward County
The major employment industries in Seward County include Manufacturing (2,811 | 26.2%), Educational Services (1,249 | 11.7%), Health Care & Social Assistance (1,132 | 10.6%), Retail Trade (992 | 9.3%), and Agriculture, Fishing & Hunting (832 | 7.8%).
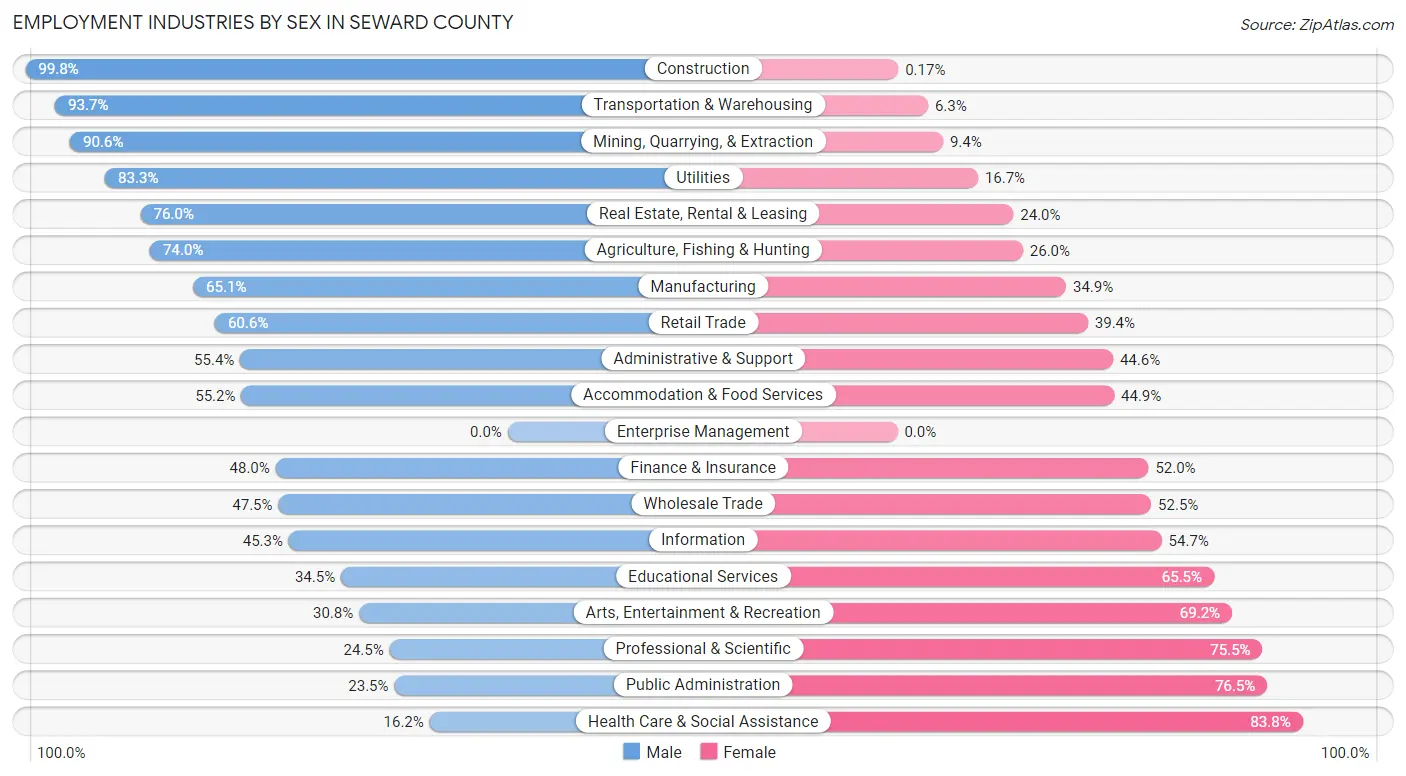
Employment Industries by Sex in Seward County
The Seward County industries that see more men than women are Construction (99.8%), Transportation & Warehousing (93.7%), and Mining, Quarrying, & Extraction (90.6%), whereas the industries that tend to have a higher number of women are Health Care & Social Assistance (83.8%), Public Administration (76.5%), and Professional & Scientific (75.5%).
| Industry | Male | Female |
| Agriculture, Fishing & Hunting | 616 (74.0%) | 216 (26.0%) |
| Mining, Quarrying, & Extraction | 375 (90.6%) | 39 (9.4%) |
| Construction | 589 (99.8%) | 1 (0.2%) |
| Manufacturing | 1,830 (65.1%) | 981 (34.9%) |
| Wholesale Trade | 113 (47.5%) | 125 (52.5%) |
| Retail Trade | 601 (60.6%) | 391 (39.4%) |
| Transportation & Warehousing | 341 (93.7%) | 23 (6.3%) |
| Utilities | 45 (83.3%) | 9 (16.7%) |
| Information | 29 (45.3%) | 35 (54.7%) |
| Finance & Insurance | 98 (48.0%) | 106 (52.0%) |
| Real Estate, Rental & Leasing | 57 (76.0%) | 18 (24.0%) |
| Professional & Scientific | 34 (24.5%) | 105 (75.5%) |
| Enterprise Management | 0 (0.0%) | 0 (0.0%) |
| Administrative & Support | 36 (55.4%) | 29 (44.6%) |
| Educational Services | 431 (34.5%) | 818 (65.5%) |
| Health Care & Social Assistance | 183 (16.2%) | 949 (83.8%) |
| Arts, Entertainment & Recreation | 24 (30.8%) | 54 (69.2%) |
| Accommodation & Food Services | 332 (55.1%) | 270 (44.9%) |
| Public Administration | 96 (23.5%) | 313 (76.5%) |
| Total | 6,050 (56.5%) | 4,667 (43.5%) |
Education in Seward County
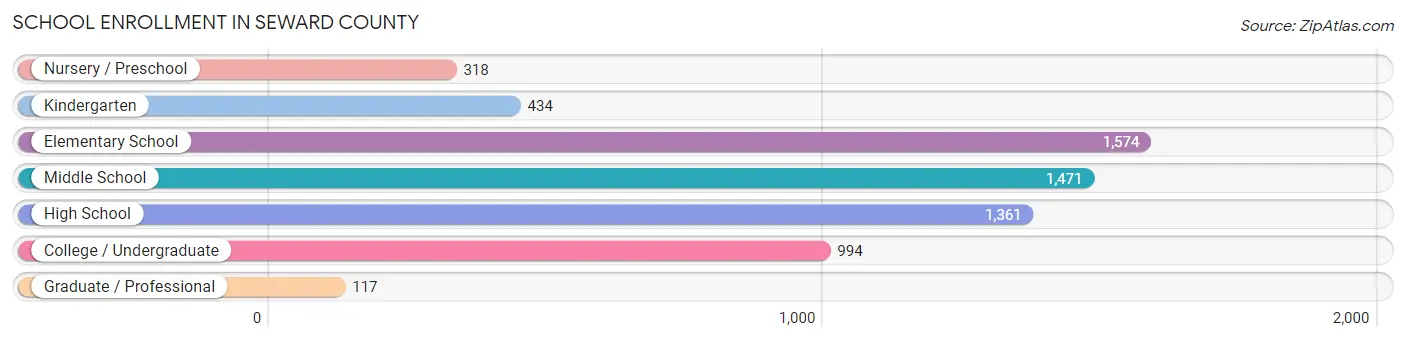
School Enrollment in Seward County
The most common levels of schooling among the 6,269 students in Seward County are elementary school (1,574 | 25.1%), middle school (1,471 | 23.5%), and high school (1,361 | 21.7%).
| School Level | # Students | % Students |
| Nursery / Preschool | 318 | 5.1% |
| Kindergarten | 434 | 6.9% |
| Elementary School | 1,574 | 25.1% |
| Middle School | 1,471 | 23.5% |
| High School | 1,361 | 21.7% |
| College / Undergraduate | 994 | 15.9% |
| Graduate / Professional | 117 | 1.9% |
| Total | 6,269 | 100.0% |
School Enrollment by Age by Funding Source in Seward County
Out of a total of 6,269 students who are enrolled in schools in Seward County, 138 (2.2%) attend a private institution, while the remaining 6,131 (97.8%) are enrolled in public schools. The age group of 25 to 34 year olds has the highest likelihood of being enrolled in private schools, with 41 (25.0% in the age bracket) enrolled. Conversely, the age group of 15 to 17 year olds has the lowest likelihood of being enrolled in a private school, with 1,120 (99.7% in the age bracket) attending a public institution.
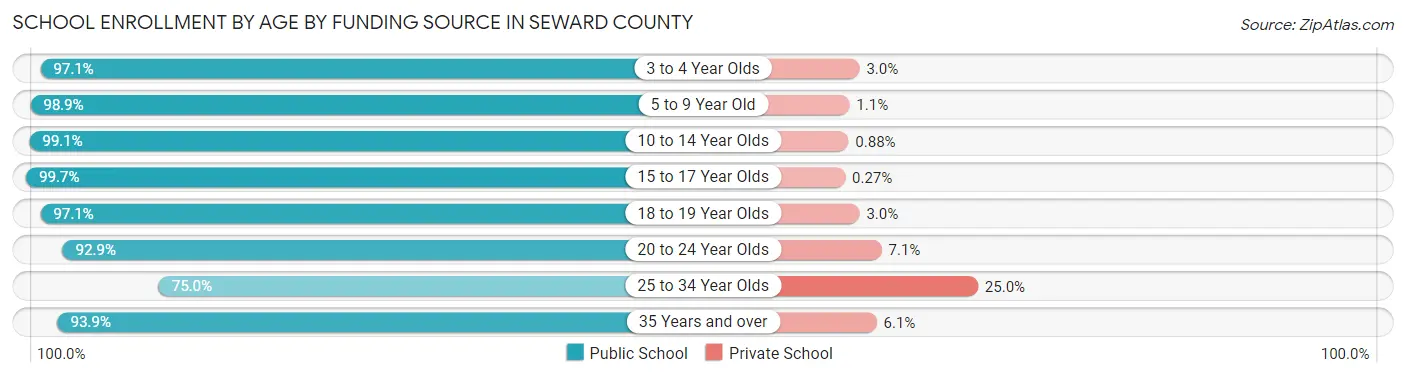
| Age Bracket | Public School | Private School |
| 3 to 4 Year Olds | 230 (97.1%) | 7 (2.9%) |
| 5 to 9 Year Old | 1,842 (98.9%) | 20 (1.1%) |
| 10 to 14 Year Olds | 1,812 (99.1%) | 16 (0.9%) |
| 15 to 17 Year Olds | 1,120 (99.7%) | 3 (0.3%) |
| 18 to 19 Year Olds | 460 (97.1%) | 14 (2.9%) |
| 20 to 24 Year Olds | 434 (92.9%) | 33 (7.1%) |
| 25 to 34 Year Olds | 123 (75.0%) | 41 (25.0%) |
| 35 Years and over | 107 (93.9%) | 7 (6.1%) |
| Total | 6,131 (97.8%) | 138 (2.2%) |
Educational Attainment by Field of Study in Seward County
Education (316 | 21.1%), social sciences (199 | 13.3%), business (198 | 13.2%), bio, nature & agricultural (173 | 11.5%), and science & technology (129 | 8.6%) are the most common fields of study among 1,500 individuals in Seward County who have obtained a bachelor's degree or higher.
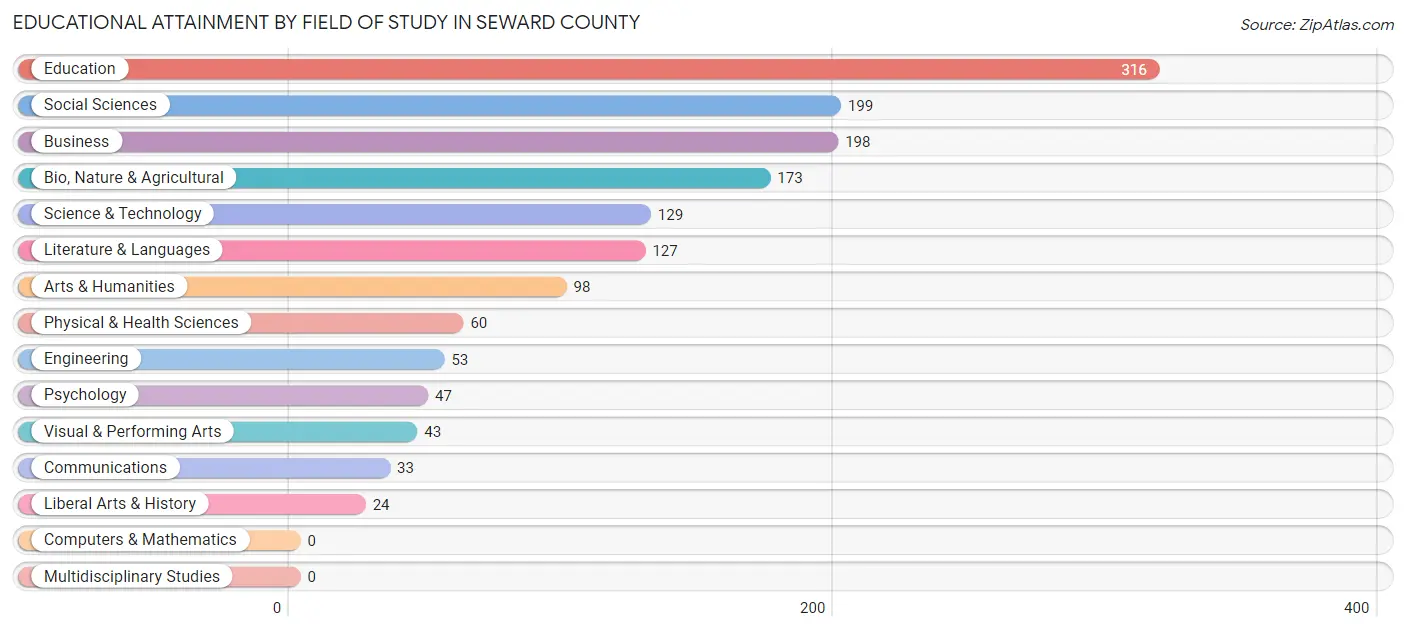
| Field of Study | # Graduates | % Graduates |
| Computers & Mathematics | 0 | 0.0% |
| Bio, Nature & Agricultural | 173 | 11.5% |
| Physical & Health Sciences | 60 | 4.0% |
| Psychology | 47 | 3.1% |
| Social Sciences | 199 | 13.3% |
| Engineering | 53 | 3.5% |
| Multidisciplinary Studies | 0 | 0.0% |
| Science & Technology | 129 | 8.6% |
| Business | 198 | 13.2% |
| Education | 316 | 21.1% |
| Literature & Languages | 127 | 8.5% |
| Liberal Arts & History | 24 | 1.6% |
| Visual & Performing Arts | 43 | 2.9% |
| Communications | 33 | 2.2% |
| Arts & Humanities | 98 | 6.5% |
| Total | 1,500 | 100.0% |
Transportation & Commute in Seward County
Vehicle Availability by Sex in Seward County
The most prevalent vehicle ownership categories in Seward County are males with 2 vehicles (2,045, accounting for 34.6%) and females with 2 vehicles (1,492, making up 46.5%).
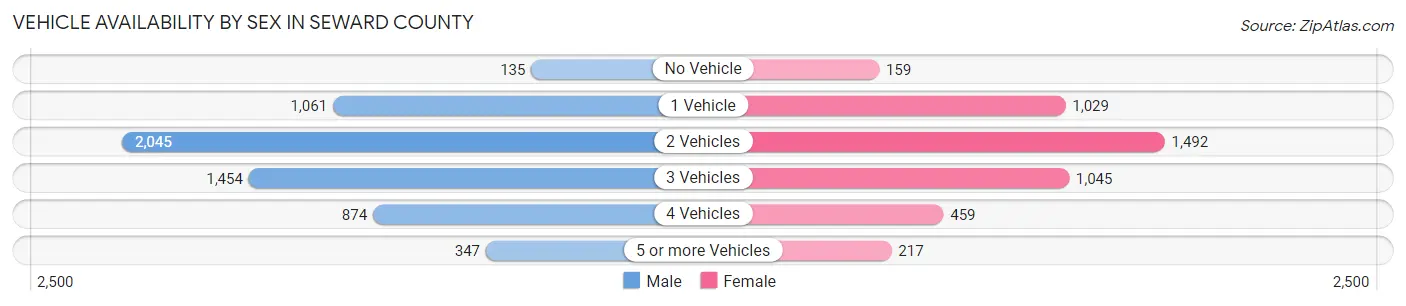
| Vehicles Available | Male | Female |
| No Vehicle | 135 (2.3%) | 159 (3.6%) |
| 1 Vehicle | 1,061 (17.9%) | 1,029 (23.4%) |
| 2 Vehicles | 2,045 (34.6%) | 1,492 (33.9%) |
| 3 Vehicles | 1,454 (24.6%) | 1,045 (23.7%) |
| 4 Vehicles | 874 (14.8%) | 459 (10.4%) |
| 5 or more Vehicles | 347 (5.9%) | 217 (4.9%) |
| Total | 5,916 (100.0%) | 4,401 (100.0%) |
Commute Time in Seward County
The most frequently occuring commute durations in Seward County are 5 to 9 minutes (3,051 commuters, 30.2%), 10 to 14 minutes (2,860 commuters, 28.3%), and 15 to 19 minutes (1,765 commuters, 17.5%).
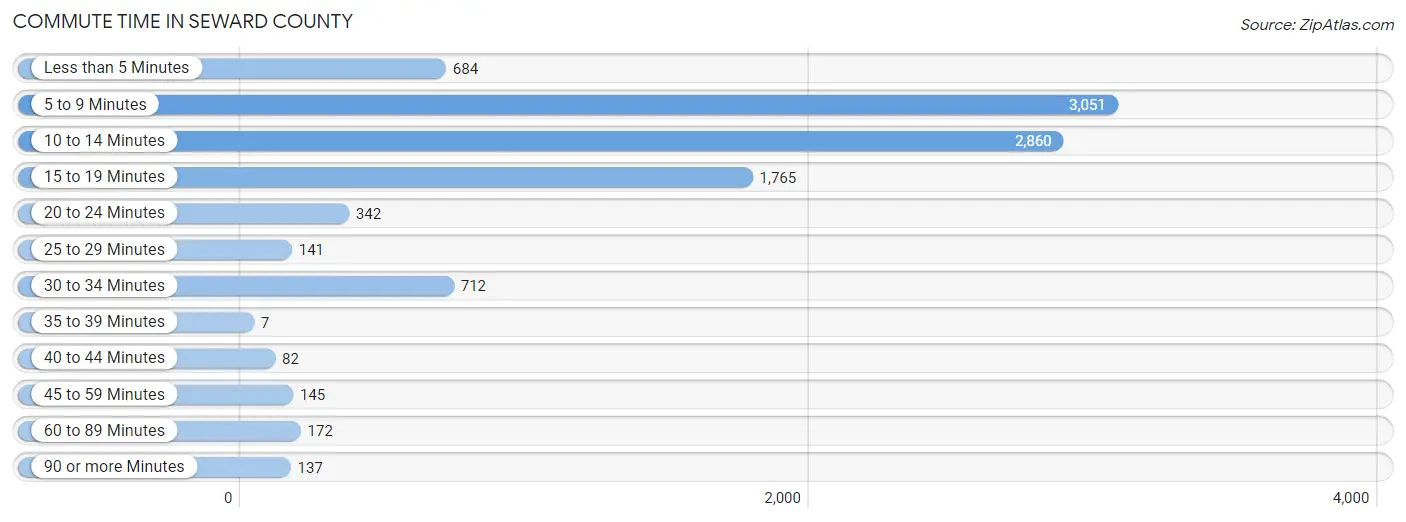
| Commute Time | # Commuters | % Commuters |
| Less than 5 Minutes | 684 | 6.8% |
| 5 to 9 Minutes | 3,051 | 30.2% |
| 10 to 14 Minutes | 2,860 | 28.3% |
| 15 to 19 Minutes | 1,765 | 17.5% |
| 20 to 24 Minutes | 342 | 3.4% |
| 25 to 29 Minutes | 141 | 1.4% |
| 30 to 34 Minutes | 712 | 7.0% |
| 35 to 39 Minutes | 7 | 0.1% |
| 40 to 44 Minutes | 82 | 0.8% |
| 45 to 59 Minutes | 145 | 1.4% |
| 60 to 89 Minutes | 172 | 1.7% |
| 90 or more Minutes | 137 | 1.4% |
Commute Time by Sex in Seward County
The most common commute times in Seward County are 10 to 14 minutes (1,713 commuters, 29.0%) for males and 5 to 9 minutes (1,630 commuters, 38.9%) for females.
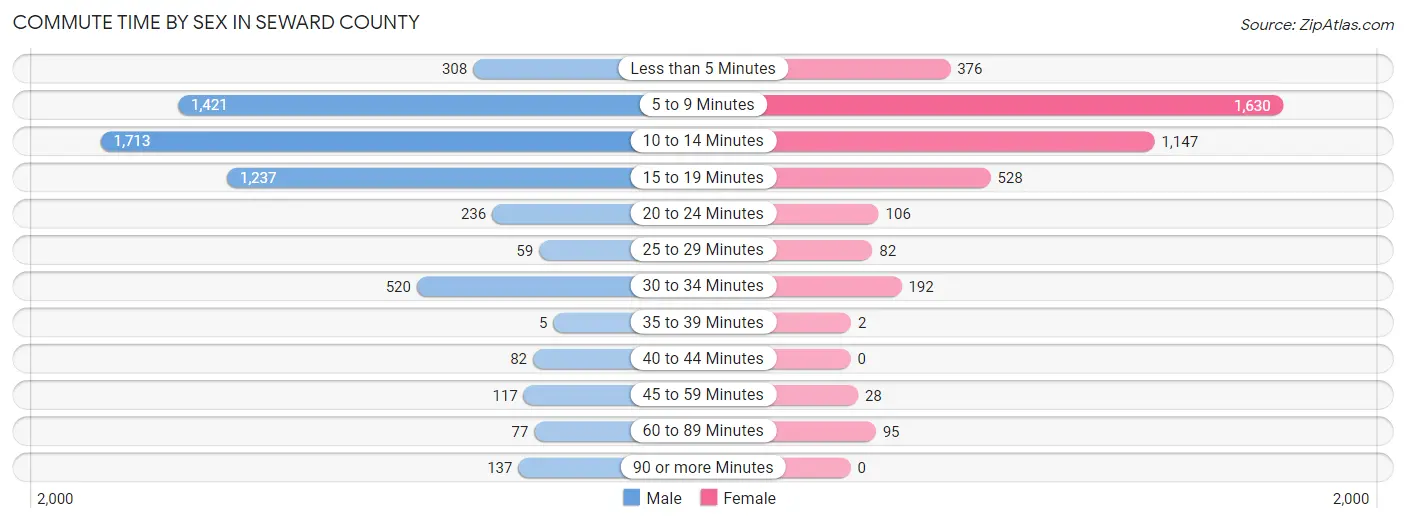
| Commute Time | Male | Female |
| Less than 5 Minutes | 308 (5.2%) | 376 (9.0%) |
| 5 to 9 Minutes | 1,421 (24.0%) | 1,630 (38.9%) |
| 10 to 14 Minutes | 1,713 (29.0%) | 1,147 (27.4%) |
| 15 to 19 Minutes | 1,237 (20.9%) | 528 (12.6%) |
| 20 to 24 Minutes | 236 (4.0%) | 106 (2.5%) |
| 25 to 29 Minutes | 59 (1.0%) | 82 (2.0%) |
| 30 to 34 Minutes | 520 (8.8%) | 192 (4.6%) |
| 35 to 39 Minutes | 5 (0.1%) | 2 (0.1%) |
| 40 to 44 Minutes | 82 (1.4%) | 0 (0.0%) |
| 45 to 59 Minutes | 117 (2.0%) | 28 (0.7%) |
| 60 to 89 Minutes | 77 (1.3%) | 95 (2.3%) |
| 90 or more Minutes | 137 (2.3%) | 0 (0.0%) |
Time of Departure to Work by Sex in Seward County
The most frequent times of departure to work in Seward County are 6:30 AM to 6:59 AM (745, 12.6%) for males and 7:30 AM to 7:59 AM (790, 18.9%) for females.
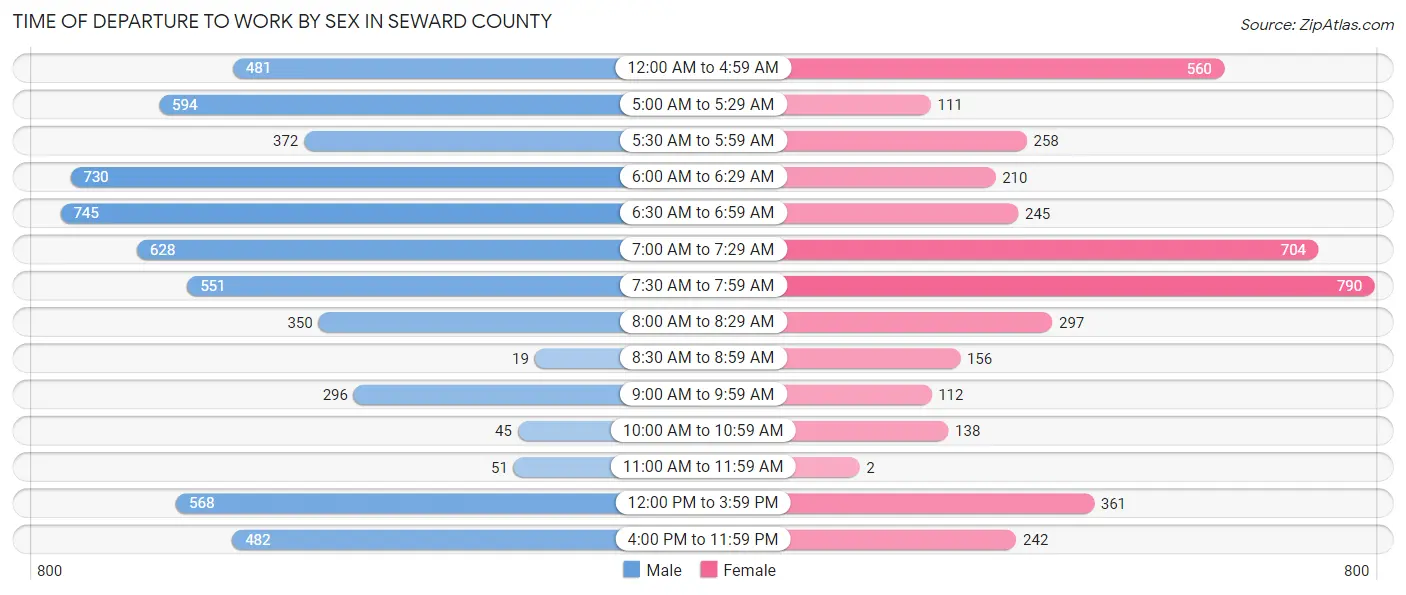
| Time of Departure | Male | Female |
| 12:00 AM to 4:59 AM | 481 (8.1%) | 560 (13.4%) |
| 5:00 AM to 5:29 AM | 594 (10.1%) | 111 (2.6%) |
| 5:30 AM to 5:59 AM | 372 (6.3%) | 258 (6.2%) |
| 6:00 AM to 6:29 AM | 730 (12.3%) | 210 (5.0%) |
| 6:30 AM to 6:59 AM | 745 (12.6%) | 245 (5.9%) |
| 7:00 AM to 7:29 AM | 628 (10.6%) | 704 (16.8%) |
| 7:30 AM to 7:59 AM | 551 (9.3%) | 790 (18.9%) |
| 8:00 AM to 8:29 AM | 350 (5.9%) | 297 (7.1%) |
| 8:30 AM to 8:59 AM | 19 (0.3%) | 156 (3.7%) |
| 9:00 AM to 9:59 AM | 296 (5.0%) | 112 (2.7%) |
| 10:00 AM to 10:59 AM | 45 (0.8%) | 138 (3.3%) |
| 11:00 AM to 11:59 AM | 51 (0.9%) | 2 (0.1%) |
| 12:00 PM to 3:59 PM | 568 (9.6%) | 361 (8.6%) |
| 4:00 PM to 11:59 PM | 482 (8.2%) | 242 (5.8%) |
| Total | 5,912 (100.0%) | 4,186 (100.0%) |
Housing Occupancy in Seward County
Occupancy by Ownership in Seward County
Of the total 7,071 dwellings in Seward County, owner-occupied units account for 4,615 (65.3%), while renter-occupied units make up 2,456 (34.7%).
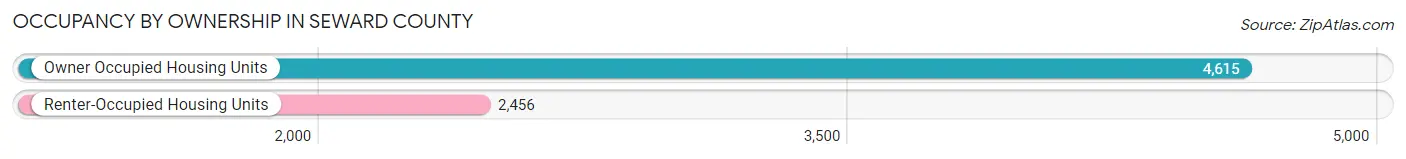
| Occupancy | # Housing Units | % Housing Units |
| Owner Occupied Housing Units | 4,615 | 65.3% |
| Renter-Occupied Housing Units | 2,456 | 34.7% |
| Total Occupied Housing Units | 7,071 | 100.0% |
Occupancy by Household Size in Seward County
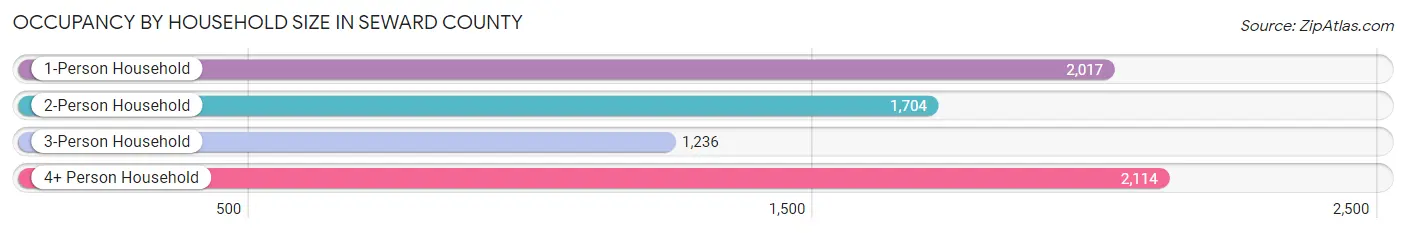
| Household Size | # Housing Units | % Housing Units |
| 1-Person Household | 2,017 | 28.5% |
| 2-Person Household | 1,704 | 24.1% |
| 3-Person Household | 1,236 | 17.5% |
| 4+ Person Household | 2,114 | 29.9% |
| Total Housing Units | 7,071 | 100.0% |
Occupancy by Ownership by Household Size in Seward County
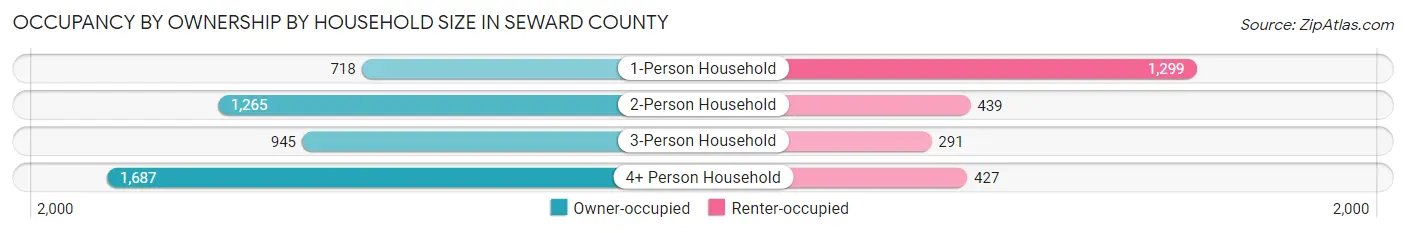
| Household Size | Owner-occupied | Renter-occupied |
| 1-Person Household | 718 (35.6%) | 1,299 (64.4%) |
| 2-Person Household | 1,265 (74.2%) | 439 (25.8%) |
| 3-Person Household | 945 (76.5%) | 291 (23.5%) |
| 4+ Person Household | 1,687 (79.8%) | 427 (20.2%) |
| Total Housing Units | 4,615 (65.3%) | 2,456 (34.7%) |
Occupancy by Educational Attainment in Seward County
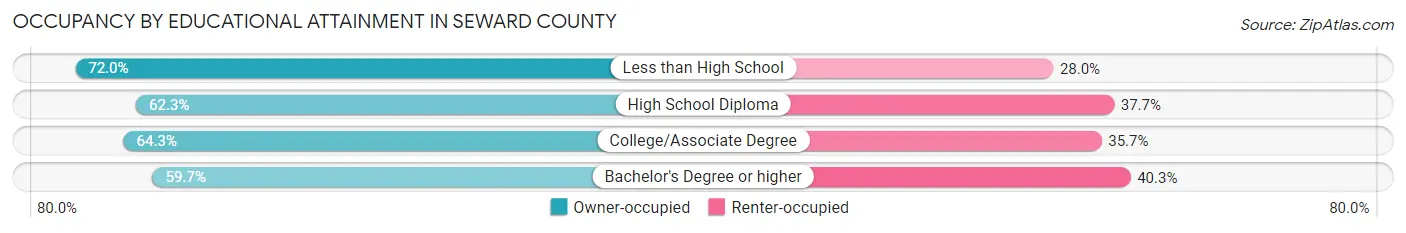
| Household Size | Owner-occupied | Renter-occupied |
| Less than High School | 1,383 (72.0%) | 539 (28.0%) |
| High School Diploma | 1,212 (62.3%) | 733 (37.7%) |
| College/Associate Degree | 1,503 (64.3%) | 835 (35.7%) |
| Bachelor's Degree or higher | 517 (59.7%) | 349 (40.3%) |
Occupancy by Age of Householder in Seward County
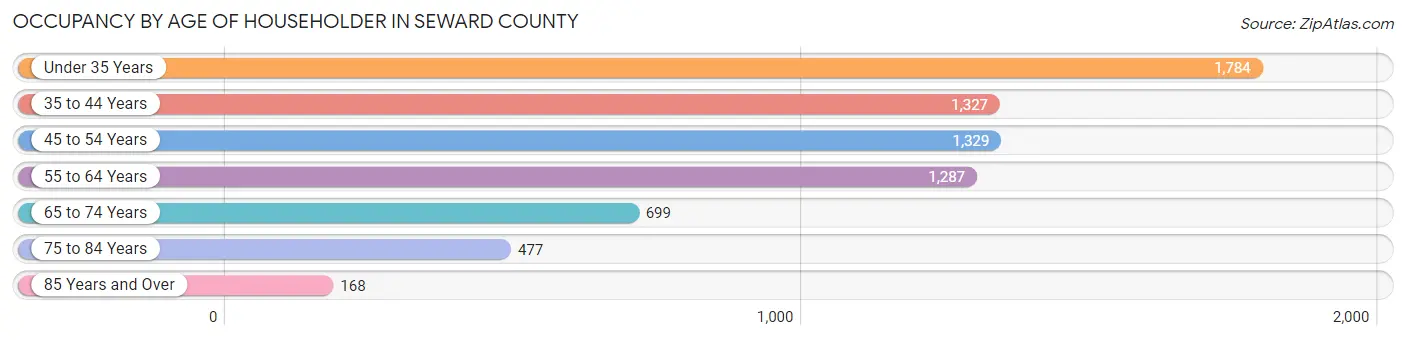
| Age Bracket | # Households | % Households |
| Under 35 Years | 1,784 | 25.2% |
| 35 to 44 Years | 1,327 | 18.8% |
| 45 to 54 Years | 1,329 | 18.8% |
| 55 to 64 Years | 1,287 | 18.2% |
| 65 to 74 Years | 699 | 9.9% |
| 75 to 84 Years | 477 | 6.8% |
| 85 Years and Over | 168 | 2.4% |
| Total | 7,071 | 100.0% |
Housing Finances in Seward County
Median Income by Occupancy in Seward County
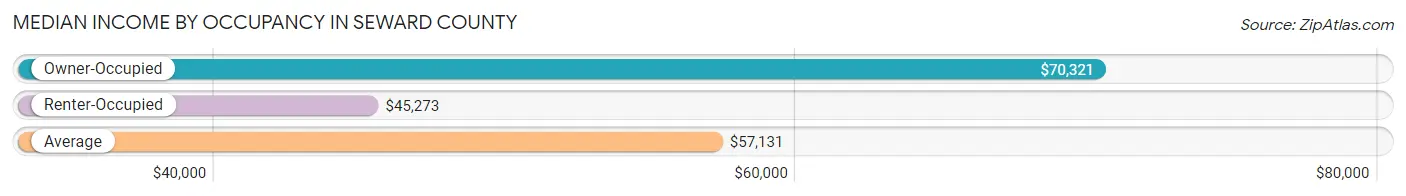
| Occupancy Type | # Households | Median Income |
| Owner-Occupied | 4,615 (65.3%) | $70,321 |
| Renter-Occupied | 2,456 (34.7%) | $45,273 |
| Average | 7,071 (100.0%) | $57,131 |
Occupancy by Householder Income Bracket in Seward County
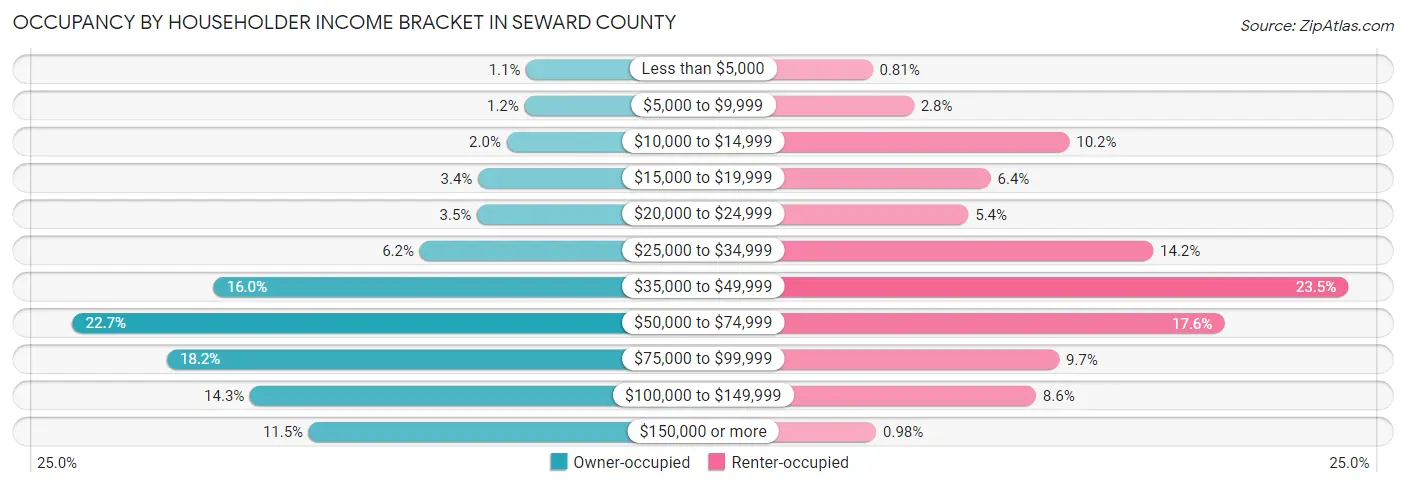
| Income Bracket | Owner-occupied | Renter-occupied |
| Less than $5,000 | 51 (1.1%) | 20 (0.8%) |
| $5,000 to $9,999 | 55 (1.2%) | 68 (2.8%) |
| $10,000 to $14,999 | 94 (2.0%) | 250 (10.2%) |
| $15,000 to $19,999 | 157 (3.4%) | 158 (6.4%) |
| $20,000 to $24,999 | 159 (3.5%) | 132 (5.4%) |
| $25,000 to $34,999 | 285 (6.2%) | 348 (14.2%) |
| $35,000 to $49,999 | 738 (16.0%) | 576 (23.4%) |
| $50,000 to $74,999 | 1,048 (22.7%) | 431 (17.5%) |
| $75,000 to $99,999 | 841 (18.2%) | 238 (9.7%) |
| $100,000 to $149,999 | 658 (14.3%) | 211 (8.6%) |
| $150,000 or more | 529 (11.5%) | 24 (1.0%) |
| Total | 4,615 (100.0%) | 2,456 (100.0%) |
Monthly Housing Cost Tiers in Seward County
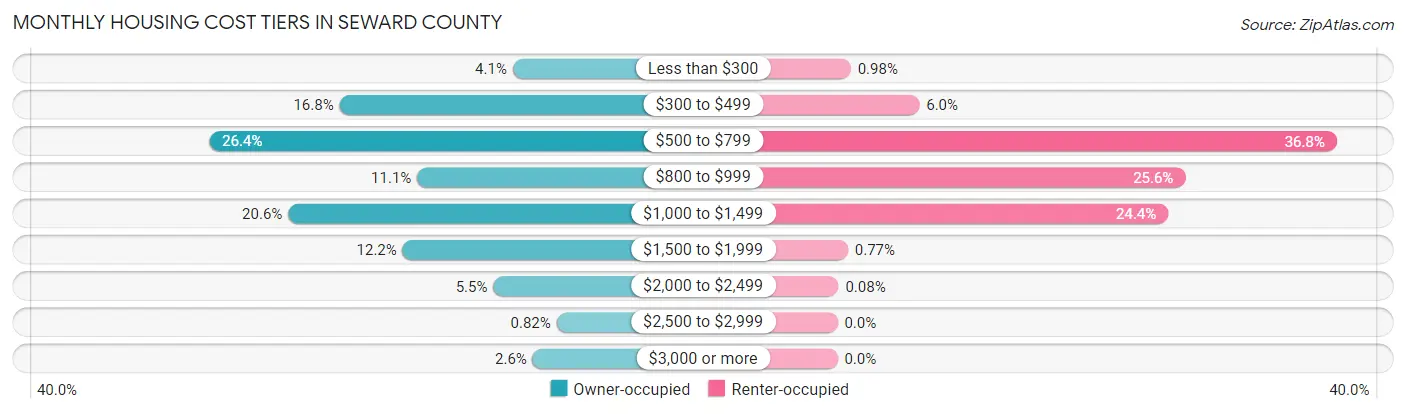
| Monthly Cost | Owner-occupied | Renter-occupied |
| Less than $300 | 187 (4.1%) | 24 (1.0%) |
| $300 to $499 | 776 (16.8%) | 148 (6.0%) |
| $500 to $799 | 1,219 (26.4%) | 903 (36.8%) |
| $800 to $999 | 512 (11.1%) | 629 (25.6%) |
| $1,000 to $1,499 | 950 (20.6%) | 598 (24.3%) |
| $1,500 to $1,999 | 561 (12.2%) | 19 (0.8%) |
| $2,000 to $2,499 | 253 (5.5%) | 2 (0.1%) |
| $2,500 to $2,999 | 38 (0.8%) | 0 (0.0%) |
| $3,000 or more | 119 (2.6%) | 0 (0.0%) |
| Total | 4,615 (100.0%) | 2,456 (100.0%) |
Physical Housing Characteristics in Seward County
Housing Structures in Seward County
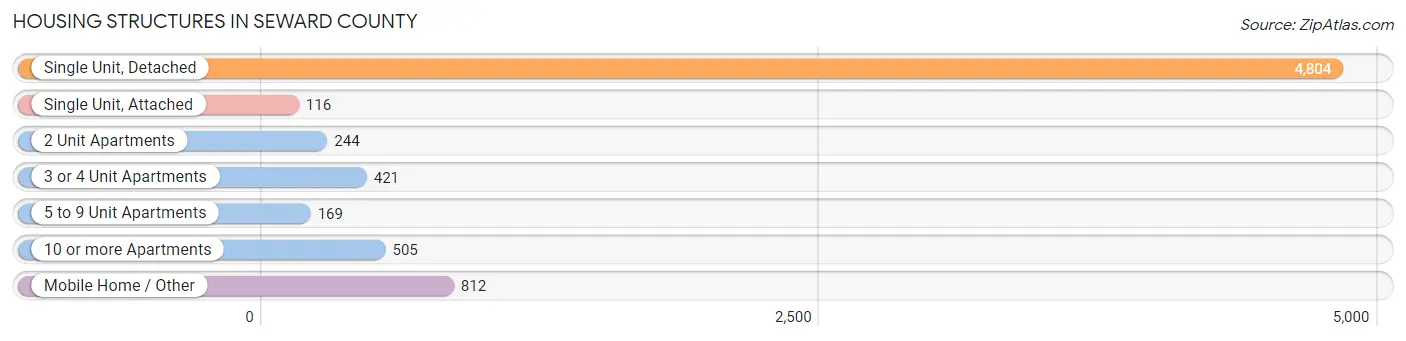
| Structure Type | # Housing Units | % Housing Units |
| Single Unit, Detached | 4,804 | 67.9% |
| Single Unit, Attached | 116 | 1.6% |
| 2 Unit Apartments | 244 | 3.5% |
| 3 or 4 Unit Apartments | 421 | 5.9% |
| 5 to 9 Unit Apartments | 169 | 2.4% |
| 10 or more Apartments | 505 | 7.1% |
| Mobile Home / Other | 812 | 11.5% |
| Total | 7,071 | 100.0% |
Housing Structures by Occupancy in Seward County
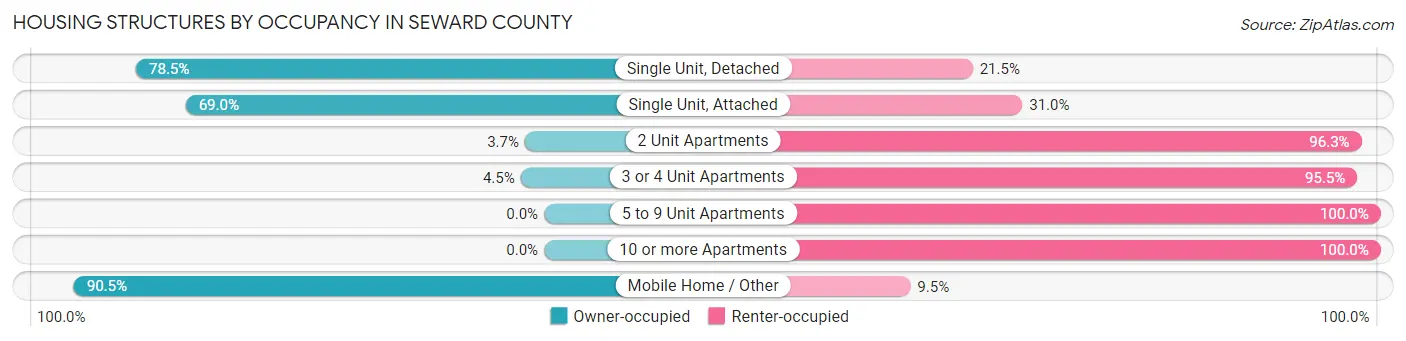
| Structure Type | Owner-occupied | Renter-occupied |
| Single Unit, Detached | 3,772 (78.5%) | 1,032 (21.5%) |
| Single Unit, Attached | 80 (69.0%) | 36 (31.0%) |
| 2 Unit Apartments | 9 (3.7%) | 235 (96.3%) |
| 3 or 4 Unit Apartments | 19 (4.5%) | 402 (95.5%) |
| 5 to 9 Unit Apartments | 0 (0.0%) | 169 (100.0%) |
| 10 or more Apartments | 0 (0.0%) | 505 (100.0%) |
| Mobile Home / Other | 735 (90.5%) | 77 (9.5%) |
| Total | 4,615 (65.3%) | 2,456 (34.7%) |
Housing Structures by Number of Rooms in Seward County
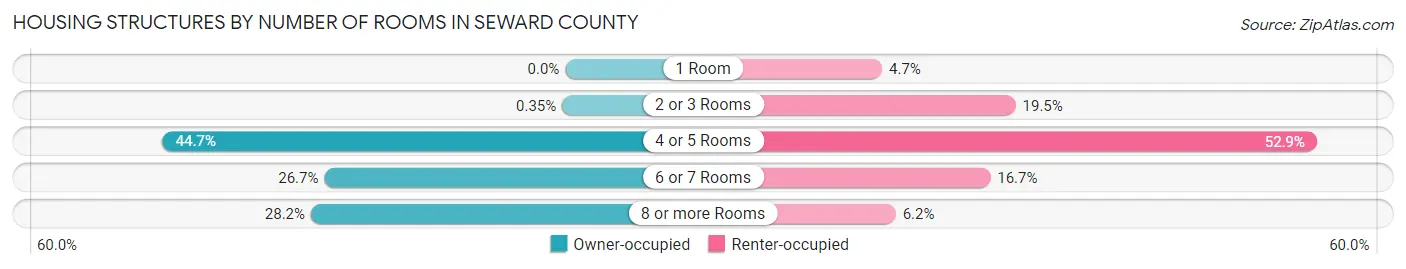
| Number of Rooms | Owner-occupied | Renter-occupied |
| 1 Room | 0 (0.0%) | 115 (4.7%) |
| 2 or 3 Rooms | 16 (0.4%) | 479 (19.5%) |
| 4 or 5 Rooms | 2,062 (44.7%) | 1,300 (52.9%) |
| 6 or 7 Rooms | 1,234 (26.7%) | 410 (16.7%) |
| 8 or more Rooms | 1,303 (28.2%) | 152 (6.2%) |
| Total | 4,615 (100.0%) | 2,456 (100.0%) |
Housing Structure by Heating Type in Seward County
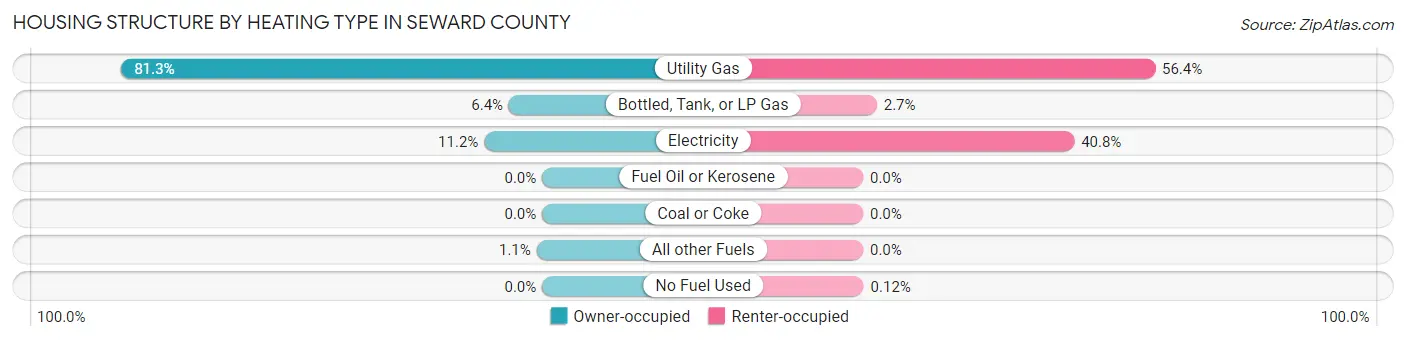
| Heating Type | Owner-occupied | Renter-occupied |
| Utility Gas | 3,753 (81.3%) | 1,386 (56.4%) |
| Bottled, Tank, or LP Gas | 296 (6.4%) | 65 (2.6%) |
| Electricity | 517 (11.2%) | 1,002 (40.8%) |
| Fuel Oil or Kerosene | 0 (0.0%) | 0 (0.0%) |
| Coal or Coke | 0 (0.0%) | 0 (0.0%) |
| All other Fuels | 49 (1.1%) | 0 (0.0%) |
| No Fuel Used | 0 (0.0%) | 3 (0.1%) |
| Total | 4,615 (100.0%) | 2,456 (100.0%) |
Household Vehicle Usage in Seward County
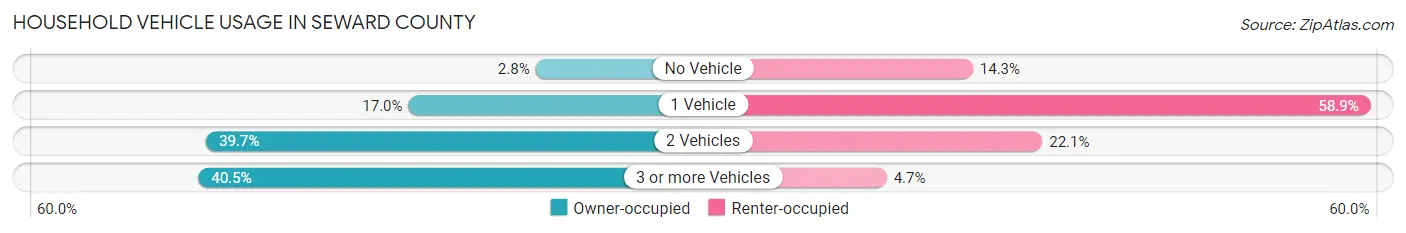
| Vehicles per Household | Owner-occupied | Renter-occupied |
| No Vehicle | 128 (2.8%) | 352 (14.3%) |
| 1 Vehicle | 785 (17.0%) | 1,446 (58.9%) |
| 2 Vehicles | 1,831 (39.7%) | 543 (22.1%) |
| 3 or more Vehicles | 1,871 (40.5%) | 115 (4.7%) |
| Total | 4,615 (100.0%) | 2,456 (100.0%) |
Real Estate & Mortgages in Seward County
Real Estate and Mortgage Overview in Seward County
| Characteristic | Without Mortgage | With Mortgage |
| Housing Units | 2,526 | 2,089 |
| Median Property Value | $106,600 | $155,400 |
| Median Household Income | $62,143 | $276 |
| Monthly Housing Costs | $557 | $119 |
| Real Estate Taxes | $1,779 | $47 |
Property Value by Mortgage Status in Seward County
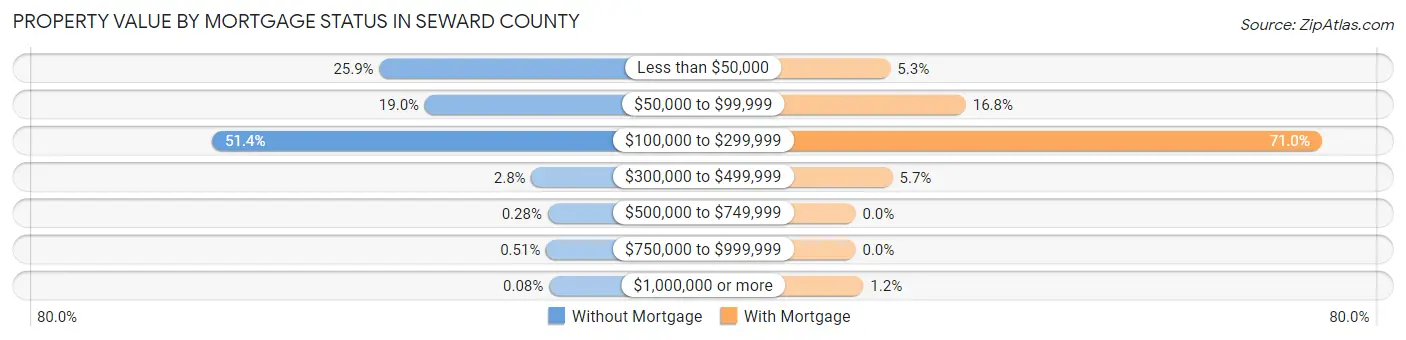
| Property Value | Without Mortgage | With Mortgage |
| Less than $50,000 | 655 (25.9%) | 111 (5.3%) |
| $50,000 to $99,999 | 480 (19.0%) | 351 (16.8%) |
| $100,000 to $299,999 | 1,299 (51.4%) | 1,484 (71.0%) |
| $300,000 to $499,999 | 70 (2.8%) | 118 (5.7%) |
| $500,000 to $749,999 | 7 (0.3%) | 0 (0.0%) |
| $750,000 to $999,999 | 13 (0.5%) | 0 (0.0%) |
| $1,000,000 or more | 2 (0.1%) | 25 (1.2%) |
| Total | 2,526 (100.0%) | 2,089 (100.0%) |
Household Income by Mortgage Status in Seward County
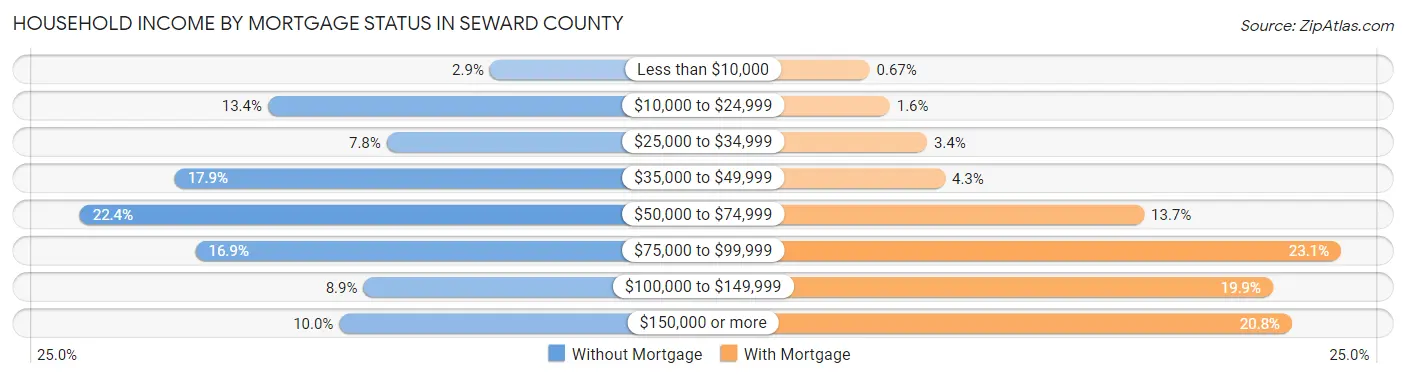
| Household Income | Without Mortgage | With Mortgage |
| Less than $10,000 | 72 (2.9%) | 14 (0.7%) |
| $10,000 to $24,999 | 339 (13.4%) | 34 (1.6%) |
| $25,000 to $34,999 | 196 (7.8%) | 71 (3.4%) |
| $35,000 to $49,999 | 451 (17.8%) | 89 (4.3%) |
| $50,000 to $74,999 | 565 (22.4%) | 287 (13.7%) |
| $75,000 to $99,999 | 426 (16.9%) | 483 (23.1%) |
| $100,000 to $149,999 | 224 (8.9%) | 415 (19.9%) |
| $150,000 or more | 253 (10.0%) | 434 (20.8%) |
| Total | 2,526 (100.0%) | 2,089 (100.0%) |
Property Value to Household Income Ratio in Seward County
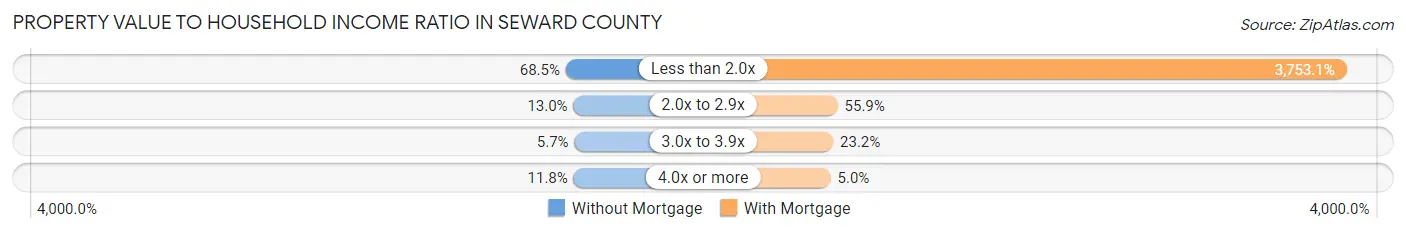
| Value-to-Income Ratio | Without Mortgage | With Mortgage |
| Less than 2.0x | 1,729 (68.4%) | 78,403 (3,753.1%) |
| 2.0x to 2.9x | 327 (13.0%) | 1,167 (55.9%) |
| 3.0x to 3.9x | 145 (5.7%) | 485 (23.2%) |
| 4.0x or more | 299 (11.8%) | 105 (5.0%) |
| Total | 2,526 (100.0%) | 2,089 (100.0%) |
Real Estate Taxes by Mortgage Status in Seward County
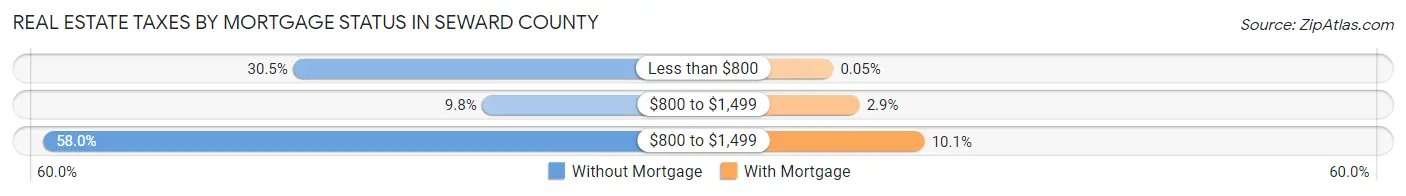
| Property Taxes | Without Mortgage | With Mortgage |
| Less than $800 | 771 (30.5%) | 1 (0.1%) |
| $800 to $1,499 | 248 (9.8%) | 61 (2.9%) |
| $800 to $1,499 | 1,464 (58.0%) | 210 (10.1%) |
| Total | 2,526 (100.0%) | 2,089 (100.0%) |
Health & Disability in Seward County
Health Insurance Coverage by Age in Seward County
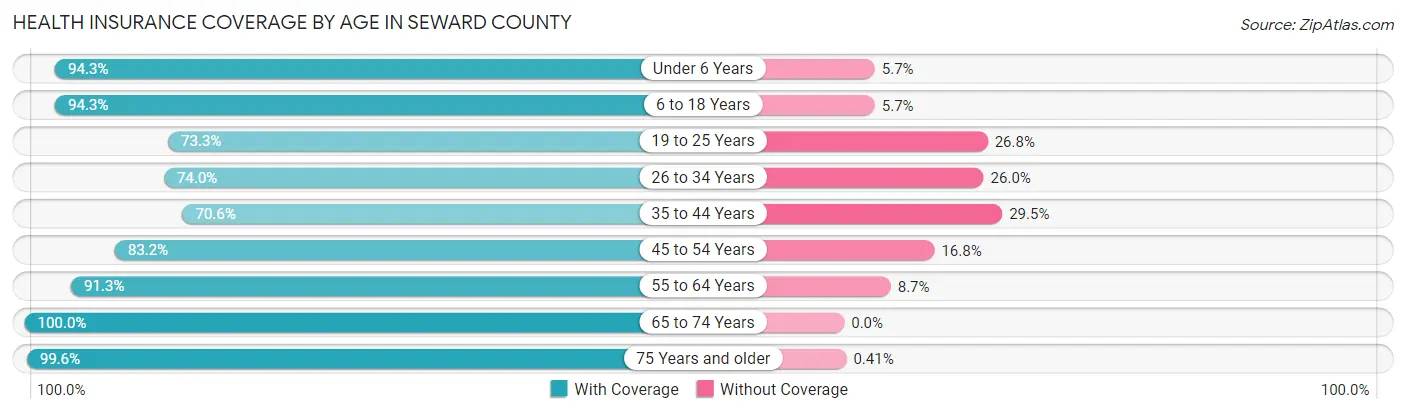
| Age Bracket | With Coverage | Without Coverage |
| Under 6 Years | 2,039 (94.3%) | 123 (5.7%) |
| 6 to 18 Years | 4,714 (94.3%) | 285 (5.7%) |
| 19 to 25 Years | 1,728 (73.3%) | 631 (26.8%) |
| 26 to 34 Years | 2,028 (74.0%) | 712 (26.0%) |
| 35 to 44 Years | 1,859 (70.6%) | 776 (29.4%) |
| 45 to 54 Years | 2,102 (83.2%) | 425 (16.8%) |
| 55 to 64 Years | 2,023 (91.3%) | 192 (8.7%) |
| 65 to 74 Years | 1,155 (100.0%) | 0 (0.0%) |
| 75 Years and older | 972 (99.6%) | 4 (0.4%) |
| Total | 18,620 (85.5%) | 3,148 (14.5%) |
Health Insurance Coverage by Citizenship Status in Seward County
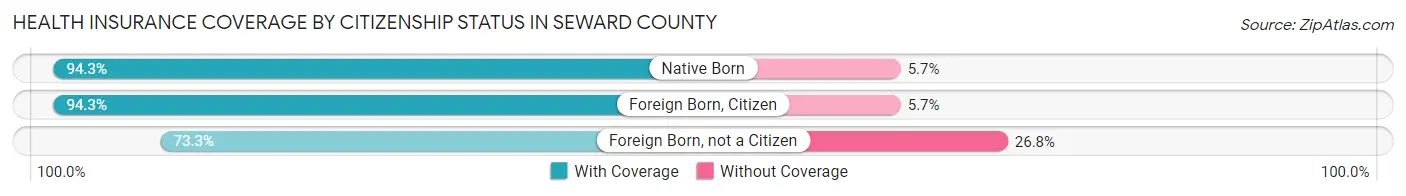
| Citizenship Status | With Coverage | Without Coverage |
| Native Born | 2,039 (94.3%) | 123 (5.7%) |
| Foreign Born, Citizen | 4,714 (94.3%) | 285 (5.7%) |
| Foreign Born, not a Citizen | 1,728 (73.3%) | 631 (26.8%) |
Health Insurance Coverage by Household Income in Seward County
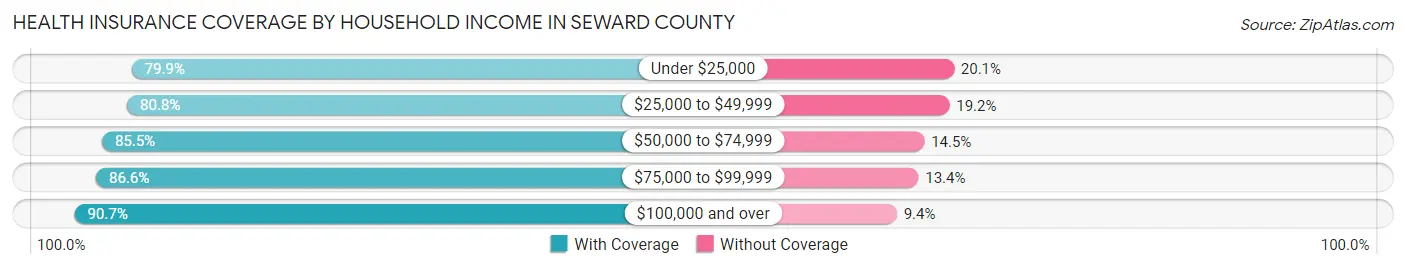
| Household Income | With Coverage | Without Coverage |
| Under $25,000 | 1,933 (79.9%) | 485 (20.1%) |
| $25,000 to $49,999 | 3,835 (80.8%) | 911 (19.2%) |
| $50,000 to $74,999 | 3,567 (85.5%) | 605 (14.5%) |
| $75,000 to $99,999 | 3,822 (86.6%) | 591 (13.4%) |
| $100,000 and over | 5,233 (90.6%) | 540 (9.3%) |
Public vs Private Health Insurance Coverage by Age in Seward County
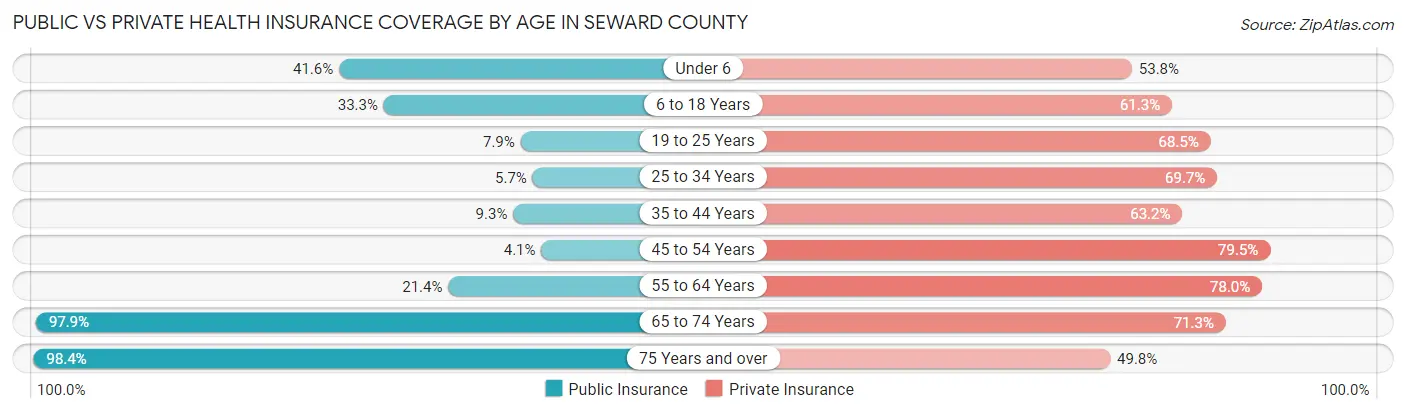
| Age Bracket | Public Insurance | Private Insurance |
| Under 6 | 900 (41.6%) | 1,164 (53.8%) |
| 6 to 18 Years | 1,666 (33.3%) | 3,064 (61.3%) |
| 19 to 25 Years | 187 (7.9%) | 1,615 (68.5%) |
| 25 to 34 Years | 156 (5.7%) | 1,909 (69.7%) |
| 35 to 44 Years | 245 (9.3%) | 1,665 (63.2%) |
| 45 to 54 Years | 103 (4.1%) | 2,009 (79.5%) |
| 55 to 64 Years | 473 (21.3%) | 1,728 (78.0%) |
| 65 to 74 Years | 1,131 (97.9%) | 823 (71.3%) |
| 75 Years and over | 960 (98.4%) | 486 (49.8%) |
| Total | 5,821 (26.7%) | 14,463 (66.4%) |
Disability Status by Sex by Age in Seward County
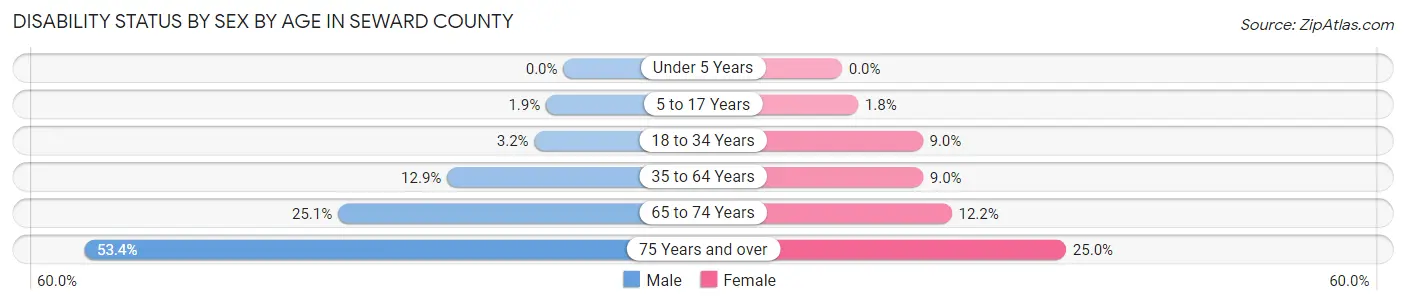
| Age Bracket | Male | Female |
| Under 5 Years | 0 (0.0%) | 0 (0.0%) |
| 5 to 17 Years | 51 (1.9%) | 41 (1.8%) |
| 18 to 34 Years | 91 (3.2%) | 237 (9.0%) |
| 35 to 64 Years | 520 (12.9%) | 303 (9.0%) |
| 65 to 74 Years | 146 (25.1%) | 70 (12.2%) |
| 75 Years and over | 213 (53.4%) | 144 (25.0%) |
Disability Class by Sex by Age in Seward County
Disability Class: Hearing Difficulty
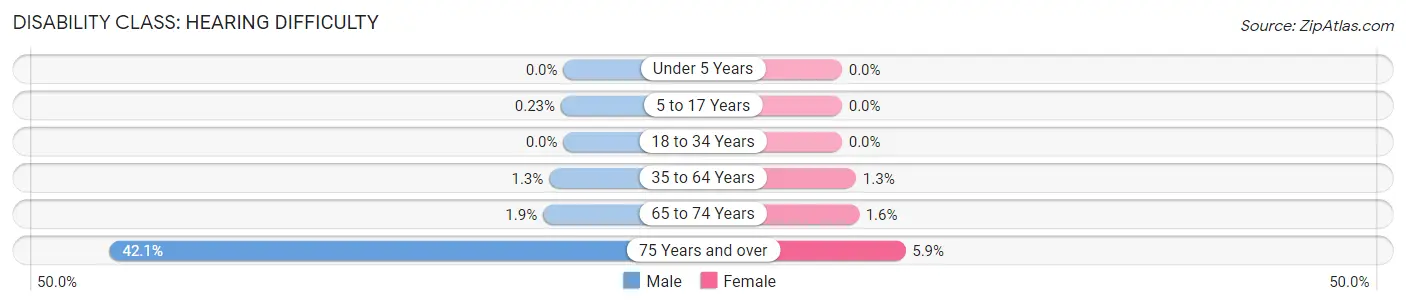
| Age Bracket | Male | Female |
| Under 5 Years | 0 (0.0%) | 0 (0.0%) |
| 5 to 17 Years | 6 (0.2%) | 0 (0.0%) |
| 18 to 34 Years | 0 (0.0%) | 0 (0.0%) |
| 35 to 64 Years | 53 (1.3%) | 44 (1.3%) |
| 65 to 74 Years | 11 (1.9%) | 9 (1.6%) |
| 75 Years and over | 168 (42.1%) | 34 (5.9%) |
Disability Class: Vision Difficulty
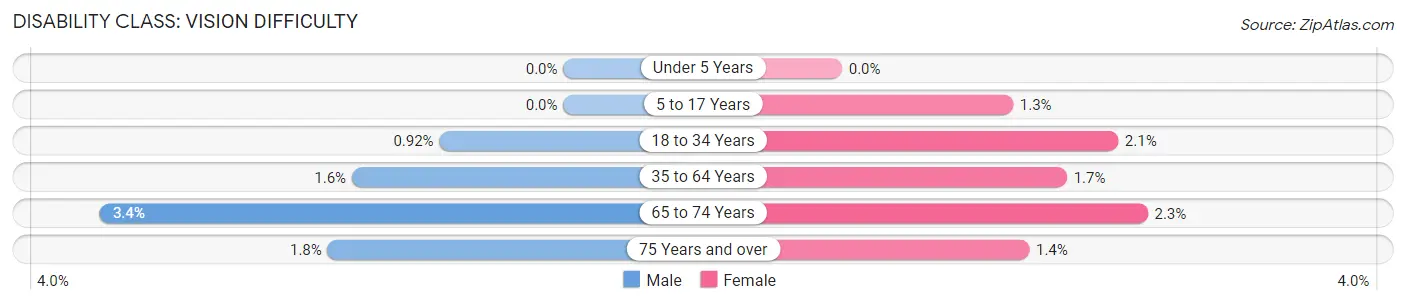
| Age Bracket | Male | Female |
| Under 5 Years | 0 (0.0%) | 0 (0.0%) |
| 5 to 17 Years | 0 (0.0%) | 29 (1.3%) |
| 18 to 34 Years | 26 (0.9%) | 54 (2.1%) |
| 35 to 64 Years | 63 (1.6%) | 56 (1.7%) |
| 65 to 74 Years | 20 (3.4%) | 13 (2.3%) |
| 75 Years and over | 7 (1.8%) | 8 (1.4%) |
Disability Class: Cognitive Difficulty
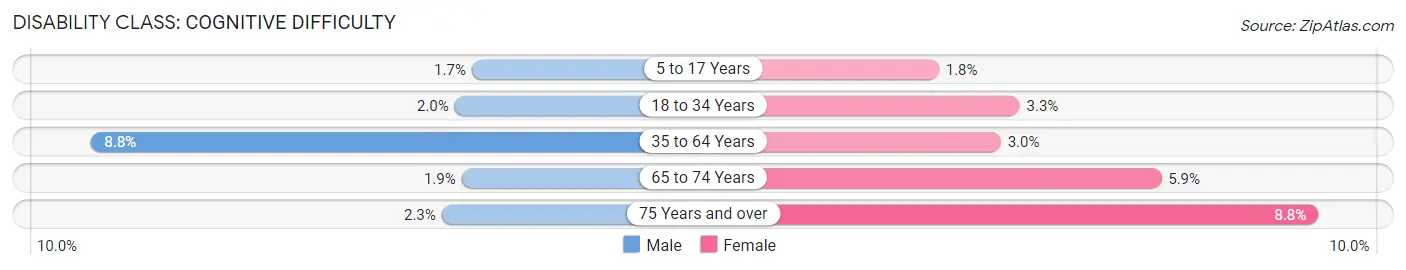
| Age Bracket | Male | Female |
| 5 to 17 Years | 45 (1.7%) | 41 (1.8%) |
| 18 to 34 Years | 57 (2.0%) | 87 (3.3%) |
| 35 to 64 Years | 352 (8.8%) | 99 (2.9%) |
| 65 to 74 Years | 11 (1.9%) | 34 (5.9%) |
| 75 Years and over | 9 (2.3%) | 51 (8.8%) |
Disability Class: Ambulatory Difficulty
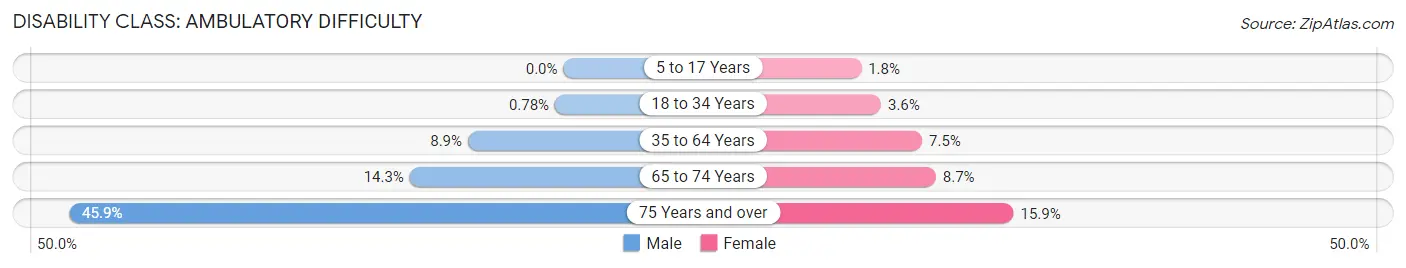
| Age Bracket | Male | Female |
| 5 to 17 Years | 0 (0.0%) | 41 (1.8%) |
| 18 to 34 Years | 22 (0.8%) | 96 (3.6%) |
| 35 to 64 Years | 356 (8.9%) | 250 (7.4%) |
| 65 to 74 Years | 83 (14.3%) | 50 (8.7%) |
| 75 Years and over | 183 (45.9%) | 92 (15.9%) |
Disability Class: Self-Care Difficulty
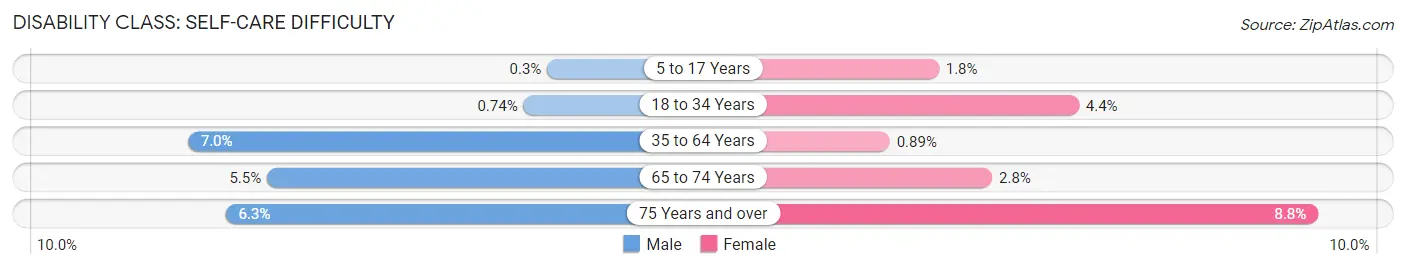
| Age Bracket | Male | Female |
| 5 to 17 Years | 8 (0.3%) | 41 (1.8%) |
| 18 to 34 Years | 21 (0.7%) | 116 (4.4%) |
| 35 to 64 Years | 280 (7.0%) | 30 (0.9%) |
| 65 to 74 Years | 32 (5.5%) | 16 (2.8%) |
| 75 Years and over | 25 (6.3%) | 51 (8.8%) |
Technology Access in Seward County
Computing Device Access in Seward County
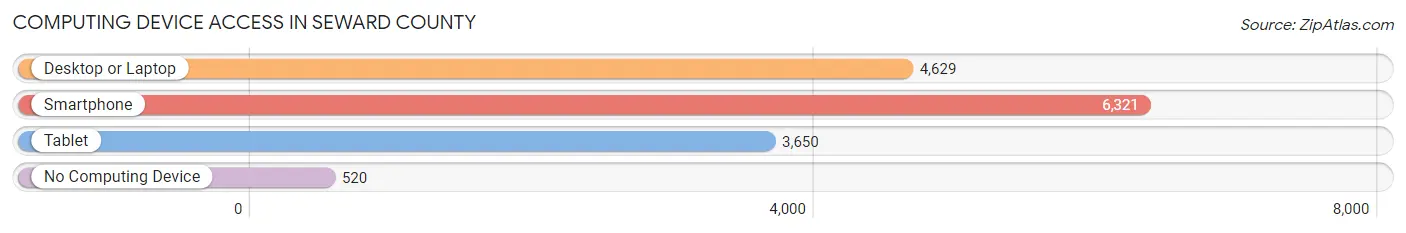
| Device Type | # Households | % Households |
| Desktop or Laptop | 4,629 | 65.5% |
| Smartphone | 6,321 | 89.4% |
| Tablet | 3,650 | 51.6% |
| No Computing Device | 520 | 7.3% |
| Total | 7,071 | 100.0% |
Internet Access in Seward County
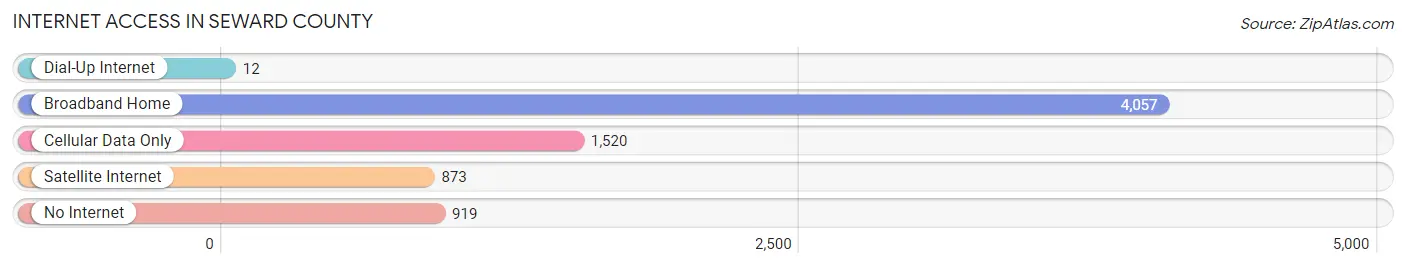
| Internet Type | # Households | % Households |
| Dial-Up Internet | 12 | 0.2% |
| Broadband Home | 4,057 | 57.4% |
| Cellular Data Only | 1,520 | 21.5% |
| Satellite Internet | 873 | 12.3% |
| No Internet | 919 | 13.0% |
| Total | 7,071 | 100.0% |
Seward County Summary
Seward County is located in the southwestern corner of Kansas, and is bordered by Meade County to the north, Ford County to the east, and Stevens County to the south. The county seat is Liberal, and the county has a total area of 1,092 square miles. As of the 2010 census, the population was 22,952.
History
Seward County was established in 1873 and named after William H. Seward, the Secretary of State under President Abraham Lincoln. The county was originally part of Ford County, but was split off in 1873. The first settlers in the area were mostly ranchers and farmers, and the county was largely rural until the early 20th century.
In the early 1900s, the discovery of oil in the area led to an economic boom. The oil industry brought jobs and money to the area, and Liberal quickly became the largest city in the county. The oil industry also led to the development of other industries, such as manufacturing and agriculture.
Geography
Seward County is located in the southwestern corner of Kansas, and is bordered by Meade County to the north, Ford County to the east, and Stevens County to the south. The county has a total area of 1,092 square miles, and is mostly flat with some rolling hills. The county is located in the High Plains region of the Great Plains, and is mostly covered in grasslands.
The county is home to several rivers and streams, including the Cimarron River, which runs through the county from north to south. The county also has several lakes, including Lake Seward, which is located in the northern part of the county.
Economy
Seward County has a diverse economy, with a mix of agriculture, manufacturing, and oil and gas production. Agriculture is the largest industry in the county, and the main crops grown are wheat, corn, sorghum, and soybeans. The county also has a large cattle industry, and is home to several feedlots and dairies.
Manufacturing is also an important part of the economy, and the county is home to several factories that produce a variety of products, including furniture, clothing, and electronics. The county is also home to several oil and gas production companies, and the oil and gas industry is a major contributor to the local economy.
Demographics
As of the 2010 census, the population of Seward County was 22,952. The population is mostly white (87.3%), with a small Hispanic population (7.2%) and a small African American population (2.2%). The median household income in the county is $45,845, and the median age is 36.7 years.
The county is home to several small towns, including Liberal, which is the largest city in the county with a population of 20,525. Other towns in the county include Kismet, Plains, and Sublette.
Conclusion
Seward County is located in the southwestern corner of Kansas, and is bordered by Meade County to the north, Ford County to the east, and Stevens County to the south. The county has a total area of 1,092 square miles, and is mostly flat with some rolling hills. The county has a diverse economy, with a mix of agriculture, manufacturing, and oil and gas production. As of the 2010 census, the population of Seward County was 22,952. The county is home to several small towns, including Liberal, which is the largest city in the county with a population of 20,525.
Common Questions
What is the Total Population of Seward County?
Total Population of Seward County is 21,942.
What is the Total Male Population of Seward County?
Total Male Population of Seward County is 11,564.
What is the Total Female Population of Seward County?
Total Female Population of Seward County is 10,378.
What is the Ratio of Males per 100 Females in Seward County?
There are 111.43 Males per 100 Females in Seward County.
What is the Ratio of Females per 100 Males in Seward County?
There are 89.74 Females per 100 Males in Seward County.
What is the Median Population Age in Seward County?
Median Population Age in Seward County is 30.5 Years.
What is the Average Family Size in Seward County
Average Family Size in Seward County is 3.8 People.
What is the Average Household Size in Seward County
Average Household Size in Seward County is 3.0 People.
What is Per Capita Income in Seward County?
Per Capita income in Seward County is $25,391.
What is the Median Family Income in Seward County?
Median Family Income in Seward County is $70,120.
What is the Median Household income in Seward County?
Median Household Income in Seward County is $57,131.
What is Income or Wage Gap in Seward County?
Income or Wage Gap in Seward County is 33.2%.
Women in Seward County earn 66.8 cents for every dollar earned by a man.
What is Family Income Deficit in Seward County?
Family Income Deficit in Seward County is $10,294.
Families that are below poverty line in Seward County earn $10,294 less on average than the poverty threshold level.
What is Inequality or Gini Index in Seward County?
Inequality or Gini Index in Seward County is 0.39.
How Large is the Labor Force in Seward County?
There are 11,011 People in the Labor Forcein in Seward County.
What is the Percentage of People in the Labor Force in Seward County?
70.0% of People are in the Labor Force in Seward County.
What is the Unemployment Rate in Seward County?
Unemployment Rate in Seward County is 2.7%.