Sedgwick County, KS
Sedgwick County Overview
522,700
TOTAL POPULATION
260,195
MALE POPULATION
262,505
FEMALE POPULATION
99.12
MALES / 100 FEMALES
100.89
FEMALES / 100 MALES
35.8
MEDIAN AGE
3.2
AVG FAMILY SIZE
2.5
AVG HOUSEHOLD SIZE
$35,338
PER CAPITA INCOME
$82,858
AVG FAMILY INCOME
$65,372
AVG HOUSEHOLD INCOME
31.3%
WAGE / INCOME GAP [ % ]
68.7¢/ $1
WAGE / INCOME GAP [ $ ]
$10,791
FAMILY INCOME DEFICIT
0.46
INEQUALITY / GINI INDEX
268,576
LABOR FORCE [ PEOPLE ]
66.1%
PERCENT IN LABOR FORCE
5.3%
UNEMPLOYMENT RATE
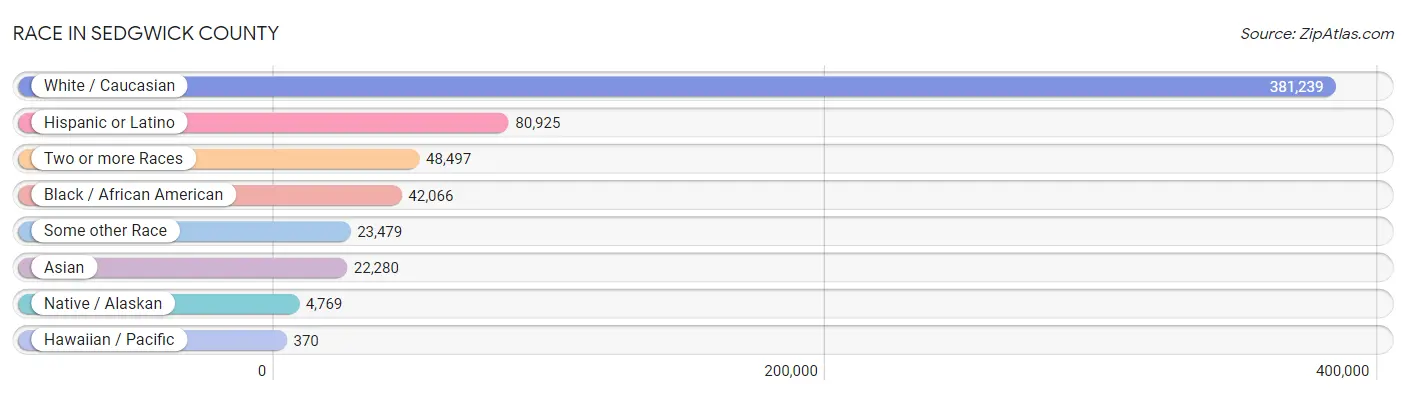
Race in Sedgwick County
The most populous races in Sedgwick County are White / Caucasian (381,239 | 72.9%), Hispanic or Latino (80,925 | 15.5%), and Two or more Races (48,497 | 9.3%).
| Race | # Population | % Population |
| Asian | 22,280 | 4.3% |
| Black / African American | 42,066 | 8.1% |
| Hawaiian / Pacific | 370 | 0.1% |
| Hispanic or Latino | 80,925 | 15.5% |
| Native / Alaskan | 4,769 | 0.9% |
| White / Caucasian | 381,239 | 72.9% |
| Two or more Races | 48,497 | 9.3% |
| Some other Race | 23,479 | 4.5% |
| Total | 522,700 | 100.0% |
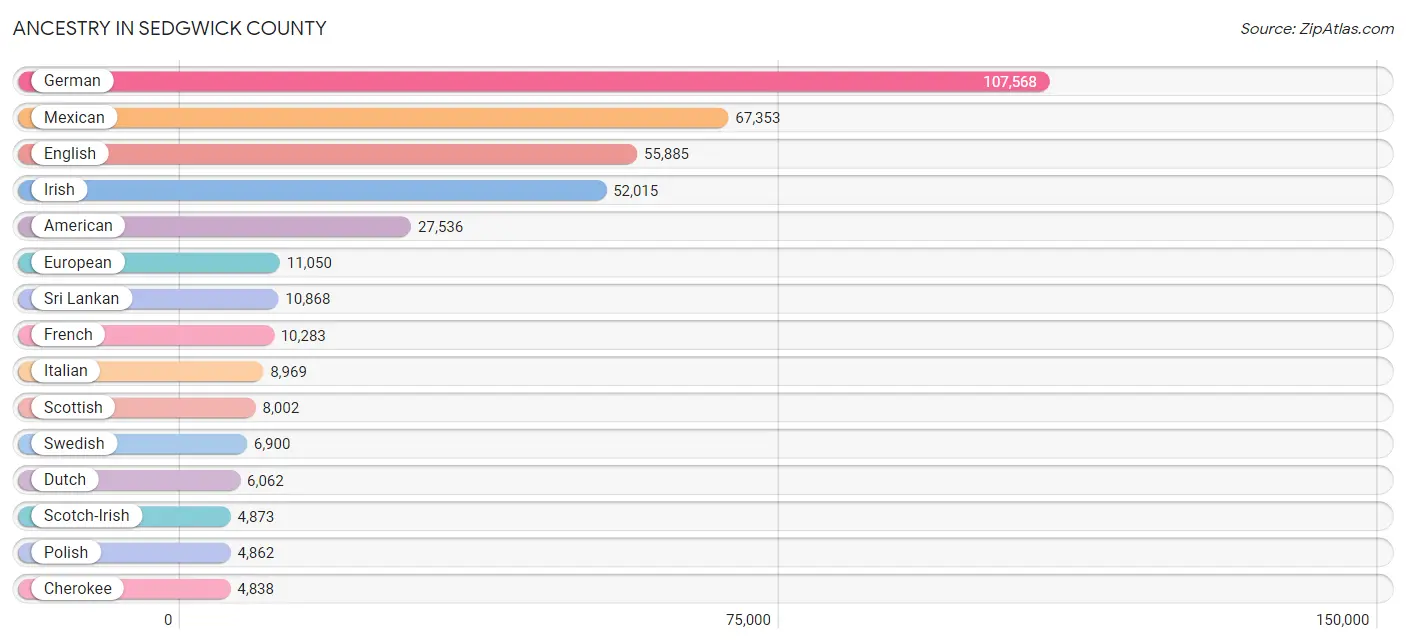
Ancestry in Sedgwick County
The most populous ancestries reported in Sedgwick County are German (107,568 | 20.6%), Mexican (67,353 | 12.9%), English (55,885 | 10.7%), Irish (52,015 | 10.0%), and American (27,536 | 5.3%), together accounting for 59.4% of all Sedgwick County residents.
| Ancestry | # Population | % Population |
| African | 3,004 | 0.6% |
| Alaska Native | 17 | 0.0% |
| Albanian | 11 | 0.0% |
| Aleut | 8 | 0.0% |
| Alsatian | 8 | 0.0% |
| American | 27,536 | 5.3% |
| Apache | 614 | 0.1% |
| Arab | 3,247 | 0.6% |
| Arapaho | 95 | 0.0% |
| Argentinean | 269 | 0.1% |
| Armenian | 54 | 0.0% |
| Australian | 100 | 0.0% |
| Austrian | 977 | 0.2% |
| Bahamian | 15 | 0.0% |
| Bangladeshi | 194 | 0.0% |
| Barbadian | 83 | 0.0% |
| Belgian | 412 | 0.1% |
| Belizean | 16 | 0.0% |
| Bhutanese | 1,119 | 0.2% |
| Blackfeet | 943 | 0.2% |
| Bolivian | 29 | 0.0% |
| Brazilian | 175 | 0.0% |
| British | 3,634 | 0.7% |
| Bulgarian | 258 | 0.1% |
| Burmese | 997 | 0.2% |
| Cajun | 68 | 0.0% |
| Canadian | 426 | 0.1% |
| Celtic | 96 | 0.0% |
| Central American | 3,728 | 0.7% |
| Central American Indian | 268 | 0.1% |
| Cherokee | 4,838 | 0.9% |
| Cheyenne | 186 | 0.0% |
| Chickasaw | 130 | 0.0% |
| Chilean | 124 | 0.0% |
| Chippewa | 132 | 0.0% |
| Choctaw | 1,120 | 0.2% |
| Colombian | 338 | 0.1% |
| Comanche | 220 | 0.0% |
| Costa Rican | 182 | 0.0% |
| Cree | 32 | 0.0% |
| Creek | 1,007 | 0.2% |
| Croatian | 300 | 0.1% |
| Cuban | 459 | 0.1% |
| Czech | 1,999 | 0.4% |
| Czechoslovakian | 486 | 0.1% |
| Danish | 1,582 | 0.3% |
| Delaware | 228 | 0.0% |
| Dominican | 79 | 0.0% |
| Dutch | 6,062 | 1.2% |
| Dutch West Indian | 54 | 0.0% |
| Eastern European | 600 | 0.1% |
| Ecuadorian | 146 | 0.0% |
| Egyptian | 170 | 0.0% |
| English | 55,885 | 10.7% |
| Estonian | 6 | 0.0% |
| Ethiopian | 74 | 0.0% |
| European | 11,050 | 2.1% |
| Fijian | 58 | 0.0% |
| Filipino | 167 | 0.0% |
| Finnish | 294 | 0.1% |
| French | 10,283 | 2.0% |
| French American Indian | 21 | 0.0% |
| French Canadian | 1,581 | 0.3% |
| German | 107,568 | 20.6% |
| German Russian | 164 | 0.0% |
| Ghanaian | 126 | 0.0% |
| Greek | 676 | 0.1% |
| Guamanian / Chamorro | 254 | 0.1% |
| Guatemalan | 805 | 0.2% |
| Haitian | 93 | 0.0% |
| Honduran | 681 | 0.1% |
| Hopi | 18 | 0.0% |
| Hungarian | 809 | 0.2% |
| Icelander | 53 | 0.0% |
| Indian (Asian) | 2,740 | 0.5% |
| Indonesian | 451 | 0.1% |
| Inupiat | 16 | 0.0% |
| Iranian | 539 | 0.1% |
| Iraqi | 7 | 0.0% |
| Irish | 52,015 | 10.0% |
| Iroquois | 140 | 0.0% |
| Israeli | 16 | 0.0% |
| Italian | 8,969 | 1.7% |
| Jamaican | 295 | 0.1% |
| Japanese | 1,872 | 0.4% |
| Jordanian | 89 | 0.0% |
| Kenyan | 372 | 0.1% |
| Kiowa | 243 | 0.1% |
| Korean | 3,821 | 0.7% |
| Laotian | 98 | 0.0% |
| Latvian | 12 | 0.0% |
| Lebanese | 1,533 | 0.3% |
| Lithuanian | 169 | 0.0% |
| Lumbee | 16 | 0.0% |
| Luxembourger | 58 | 0.0% |
| Macedonian | 4 | 0.0% |
| Malaysian | 2,461 | 0.5% |
| Maltese | 14 | 0.0% |
| Menominee | 3 | 0.0% |
| Mexican | 67,353 | 12.9% |
| Mexican American Indian | 698 | 0.1% |
| Mongolian | 163 | 0.0% |
| Moroccan | 180 | 0.0% |
| Native Hawaiian | 176 | 0.0% |
| Navajo | 140 | 0.0% |
| New Zealander | 18 | 0.0% |
| Nicaraguan | 106 | 0.0% |
| Nigerian | 477 | 0.1% |
| Northern European | 616 | 0.1% |
| Norwegian | 3,619 | 0.7% |
| Okinawan | 15 | 0.0% |
| Osage | 362 | 0.1% |
| Ottawa | 86 | 0.0% |
| Pakistani | 450 | 0.1% |
| Palestinian | 157 | 0.0% |
| Panamanian | 155 | 0.0% |
| Paraguayan | 47 | 0.0% |
| Pennsylvania German | 424 | 0.1% |
| Peruvian | 444 | 0.1% |
| Pima | 104 | 0.0% |
| Polish | 4,862 | 0.9% |
| Portuguese | 384 | 0.1% |
| Potawatomi | 355 | 0.1% |
| Pueblo | 371 | 0.1% |
| Puerto Rican | 3,100 | 0.6% |
| Puget Sound Salish | 4 | 0.0% |
| Romanian | 159 | 0.0% |
| Russian | 2,487 | 0.5% |
| Salvadoran | 1,799 | 0.3% |
| Samoan | 86 | 0.0% |
| Scandinavian | 1,736 | 0.3% |
| Scotch-Irish | 4,873 | 0.9% |
| Scottish | 8,002 | 1.5% |
| Seminole | 114 | 0.0% |
| Serbian | 11 | 0.0% |
| Sioux | 343 | 0.1% |
| Slavic | 53 | 0.0% |
| Slovak | 216 | 0.0% |
| Slovene | 46 | 0.0% |
| South African | 23 | 0.0% |
| South American | 1,932 | 0.4% |
| South American Indian | 12 | 0.0% |
| Spaniard | 1,068 | 0.2% |
| Spanish | 581 | 0.1% |
| Spanish American | 120 | 0.0% |
| Spanish American Indian | 13 | 0.0% |
| Sri Lankan | 10,868 | 2.1% |
| Subsaharan African | 4,768 | 0.9% |
| Sudanese | 215 | 0.0% |
| Swedish | 6,900 | 1.3% |
| Swiss | 1,456 | 0.3% |
| Syrian | 173 | 0.0% |
| Thai | 2,615 | 0.5% |
| Trinidadian and Tobagonian | 14 | 0.0% |
| Turkish | 58 | 0.0% |
| U.S. Virgin Islander | 6 | 0.0% |
| Ugandan | 28 | 0.0% |
| Ukrainian | 451 | 0.1% |
| Uruguayan | 29 | 0.0% |
| Venezuelan | 506 | 0.1% |
| Vietnamese | 66 | 0.0% |
| Welsh | 3,349 | 0.6% |
| West Indian | 27 | 0.0% |
| Yaqui | 20 | 0.0% |
| Yugoslavian | 75 | 0.0% |
| Zimbabwean | 10 | 0.0% | View All 166 Rows |
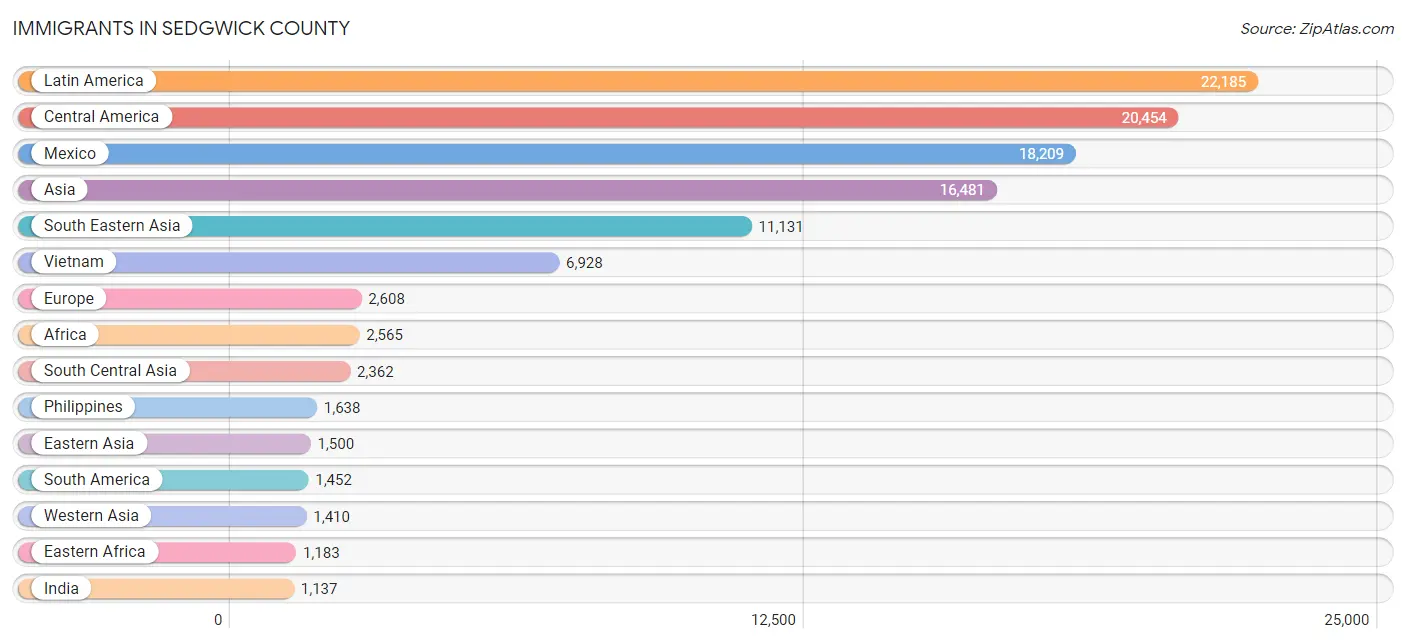
Immigrants in Sedgwick County
The most numerous immigrant groups reported in Sedgwick County came from Latin America (22,185 | 4.2%), Central America (20,454 | 3.9%), Mexico (18,209 | 3.5%), Asia (16,481 | 3.2%), and South Eastern Asia (11,131 | 2.1%), together accounting for 16.9% of all Sedgwick County residents.
| Immigration Origin | # Population | % Population |
| Africa | 2,565 | 0.5% |
| Argentina | 61 | 0.0% |
| Armenia | 7 | 0.0% |
| Asia | 16,481 | 3.2% |
| Australia | 16 | 0.0% |
| Austria | 26 | 0.0% |
| Bahamas | 4 | 0.0% |
| Bangladesh | 229 | 0.0% |
| Barbados | 22 | 0.0% |
| Belize | 11 | 0.0% |
| Bosnia and Herzegovina | 14 | 0.0% |
| Brazil | 220 | 0.0% |
| Bulgaria | 144 | 0.0% |
| Cambodia | 604 | 0.1% |
| Cameroon | 14 | 0.0% |
| Canada | 386 | 0.1% |
| Caribbean | 279 | 0.1% |
| Central America | 20,454 | 3.9% |
| Chile | 46 | 0.0% |
| China | 945 | 0.2% |
| Colombia | 164 | 0.0% |
| Congo | 241 | 0.1% |
| Costa Rica | 138 | 0.0% |
| Croatia | 13 | 0.0% |
| Cuba | 83 | 0.0% |
| Czechoslovakia | 15 | 0.0% |
| Dominican Republic | 70 | 0.0% |
| Eastern Africa | 1,183 | 0.2% |
| Eastern Asia | 1,500 | 0.3% |
| Eastern Europe | 703 | 0.1% |
| Ecuador | 188 | 0.0% |
| Egypt | 127 | 0.0% |
| El Salvador | 801 | 0.2% |
| England | 487 | 0.1% |
| Eritrea | 173 | 0.0% |
| Ethiopia | 176 | 0.0% |
| Europe | 2,608 | 0.5% |
| France | 77 | 0.0% |
| Germany | 431 | 0.1% |
| Ghana | 66 | 0.0% |
| Greece | 19 | 0.0% |
| Guatemala | 752 | 0.1% |
| Haiti | 27 | 0.0% |
| Honduras | 411 | 0.1% |
| Hong Kong | 87 | 0.0% |
| Hungary | 27 | 0.0% |
| India | 1,137 | 0.2% |
| Indonesia | 88 | 0.0% |
| Iran | 199 | 0.0% |
| Iraq | 283 | 0.1% |
| Ireland | 20 | 0.0% |
| Israel | 8 | 0.0% |
| Italy | 79 | 0.0% |
| Jamaica | 48 | 0.0% |
| Japan | 165 | 0.0% |
| Jordan | 99 | 0.0% |
| Kazakhstan | 9 | 0.0% |
| Kenya | 464 | 0.1% |
| Korea | 390 | 0.1% |
| Kuwait | 118 | 0.0% |
| Laos | 865 | 0.2% |
| Latin America | 22,185 | 4.2% |
| Lebanon | 593 | 0.1% |
| Malaysia | 233 | 0.0% |
| Mexico | 18,209 | 3.5% |
| Micronesia | 122 | 0.0% |
| Middle Africa | 417 | 0.1% |
| Moldova | 8 | 0.0% |
| Morocco | 104 | 0.0% |
| Nepal | 322 | 0.1% |
| Netherlands | 171 | 0.0% |
| Nicaragua | 38 | 0.0% |
| Nigeria | 339 | 0.1% |
| Northern Africa | 409 | 0.1% |
| Northern Europe | 1,019 | 0.2% |
| Norway | 33 | 0.0% |
| Oceania | 196 | 0.0% |
| Pakistan | 343 | 0.1% |
| Panama | 94 | 0.0% |
| Peru | 233 | 0.0% |
| Philippines | 1,638 | 0.3% |
| Poland | 42 | 0.0% |
| Romania | 90 | 0.0% |
| Russia | 41 | 0.0% |
| Saudi Arabia | 88 | 0.0% |
| Scotland | 18 | 0.0% |
| Singapore | 26 | 0.0% |
| South America | 1,452 | 0.3% |
| South Central Asia | 2,362 | 0.4% |
| South Eastern Asia | 11,131 | 2.1% |
| Southern Europe | 181 | 0.0% |
| Spain | 83 | 0.0% |
| Sri Lanka | 110 | 0.0% |
| Sudan | 75 | 0.0% |
| Sweden | 4 | 0.0% |
| Syria | 76 | 0.0% |
| Taiwan | 132 | 0.0% |
| Thailand | 459 | 0.1% |
| Trinidad and Tobago | 11 | 0.0% |
| Turkey | 116 | 0.0% |
| Uganda | 120 | 0.0% |
| Ukraine | 92 | 0.0% |
| Venezuela | 427 | 0.1% |
| Vietnam | 6,928 | 1.3% |
| Western Africa | 502 | 0.1% |
| Western Asia | 1,410 | 0.3% |
| Western Europe | 705 | 0.1% |
| Zaire | 162 | 0.0% |
| Zimbabwe | 29 | 0.0% | View All 109 Rows |
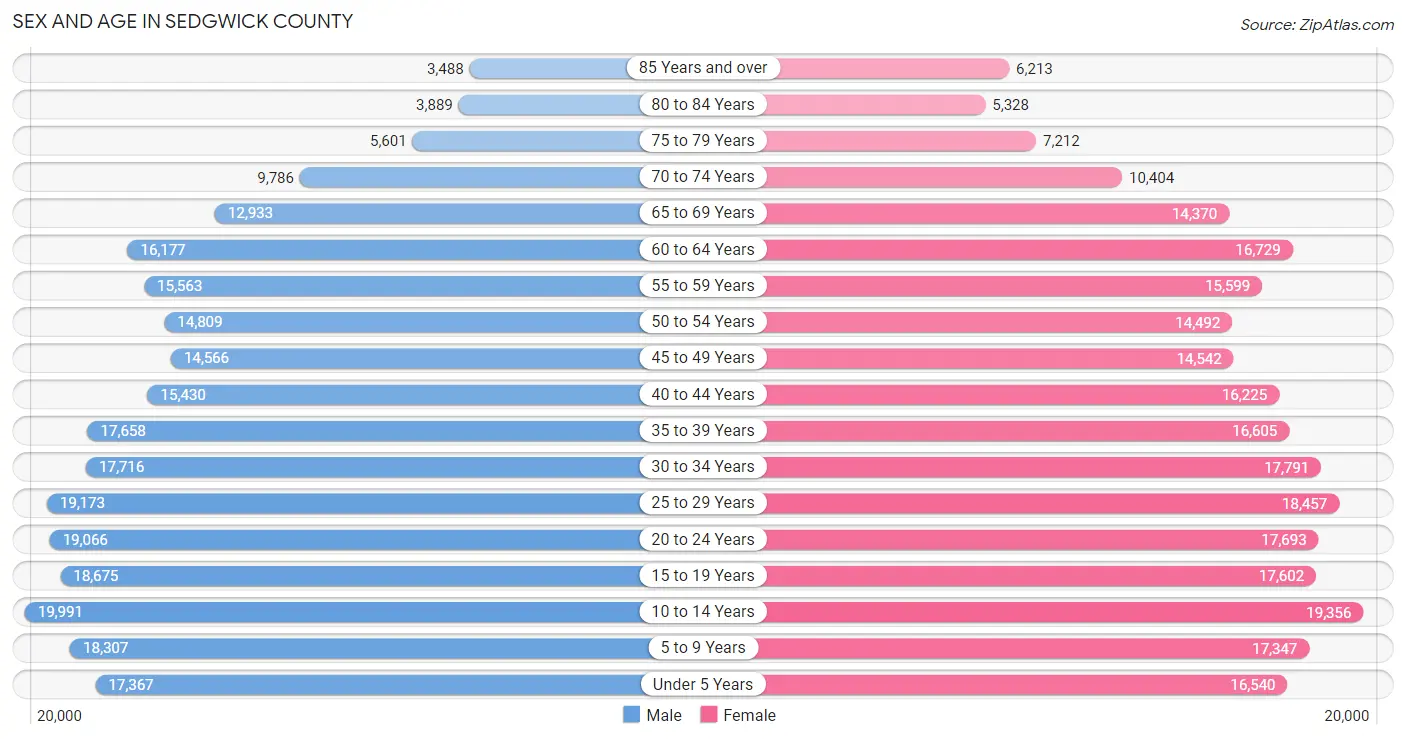
Sex and Age in Sedgwick County
Sex and Age in Sedgwick County
The most populous age groups in Sedgwick County are 10 to 14 Years (19,991 | 7.7%) for men and 10 to 14 Years (19,356 | 7.4%) for women.
| Age Bracket | Male | Female |
| Under 5 Years | 17,367 (6.7%) | 16,540 (6.3%) |
| 5 to 9 Years | 18,307 (7.0%) | 17,347 (6.6%) |
| 10 to 14 Years | 19,991 (7.7%) | 19,356 (7.4%) |
| 15 to 19 Years | 18,675 (7.2%) | 17,602 (6.7%) |
| 20 to 24 Years | 19,066 (7.3%) | 17,693 (6.7%) |
| 25 to 29 Years | 19,173 (7.4%) | 18,457 (7.0%) |
| 30 to 34 Years | 17,716 (6.8%) | 17,791 (6.8%) |
| 35 to 39 Years | 17,658 (6.8%) | 16,605 (6.3%) |
| 40 to 44 Years | 15,430 (5.9%) | 16,225 (6.2%) |
| 45 to 49 Years | 14,566 (5.6%) | 14,542 (5.5%) |
| 50 to 54 Years | 14,809 (5.7%) | 14,492 (5.5%) |
| 55 to 59 Years | 15,563 (6.0%) | 15,599 (5.9%) |
| 60 to 64 Years | 16,177 (6.2%) | 16,729 (6.4%) |
| 65 to 69 Years | 12,933 (5.0%) | 14,370 (5.5%) |
| 70 to 74 Years | 9,786 (3.8%) | 10,404 (4.0%) |
| 75 to 79 Years | 5,601 (2.1%) | 7,212 (2.8%) |
| 80 to 84 Years | 3,889 (1.5%) | 5,328 (2.0%) |
| 85 Years and over | 3,488 (1.3%) | 6,213 (2.4%) |
| Total | 260,195 (100.0%) | 262,505 (100.0%) |
Families and Households in Sedgwick County
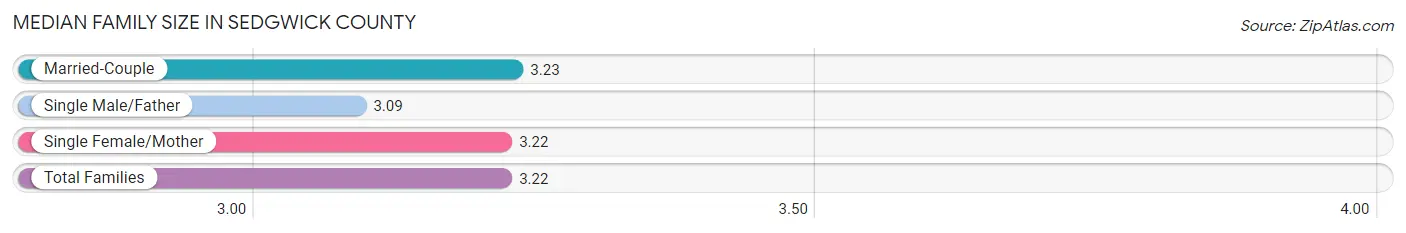
Median Family Size in Sedgwick County
The median family size in Sedgwick County is 3.22 persons per family, with married-couple families (94,197 | 73.8%) accounting for the largest median family size of 3.23 persons per family. On the other hand, single male/father families (9,429 | 7.4%) represent the smallest median family size with 3.09 persons per family.
| Family Type | # Families | Family Size |
| Married-Couple | 94,197 (73.8%) | 3.23 |
| Single Male/Father | 9,429 (7.4%) | 3.09 |
| Single Female/Mother | 24,045 (18.8%) | 3.22 |
| Total Families | 127,671 (100.0%) | 3.22 |
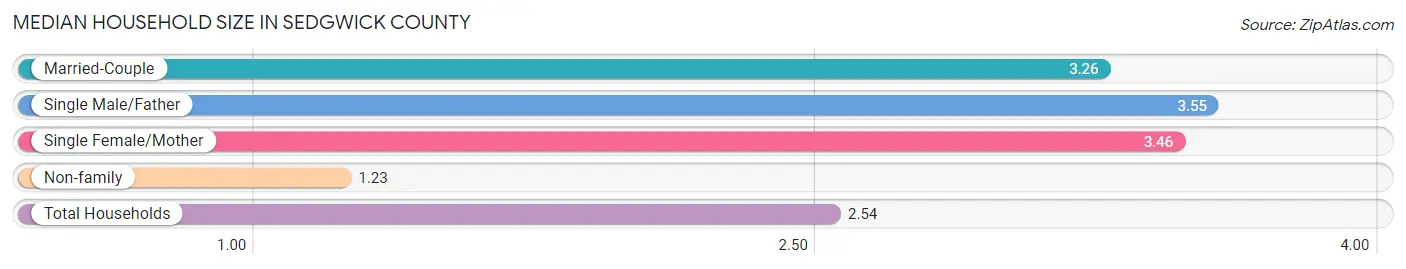
Median Household Size in Sedgwick County
The median household size in Sedgwick County is 2.54 persons per household, with single male/father households (9,429 | 4.7%) accounting for the largest median household size of 3.55 persons per household. non-family households (74,814 | 36.9%) represent the smallest median household size with 1.23 persons per household.
| Household Type | # Households | Household Size |
| Married-Couple | 94,197 (46.5%) | 3.26 |
| Single Male/Father | 9,429 (4.7%) | 3.55 |
| Single Female/Mother | 24,045 (11.9%) | 3.46 |
| Non-family | 74,814 (36.9%) | 1.23 |
| Total Households | 202,485 (100.0%) | 2.54 |
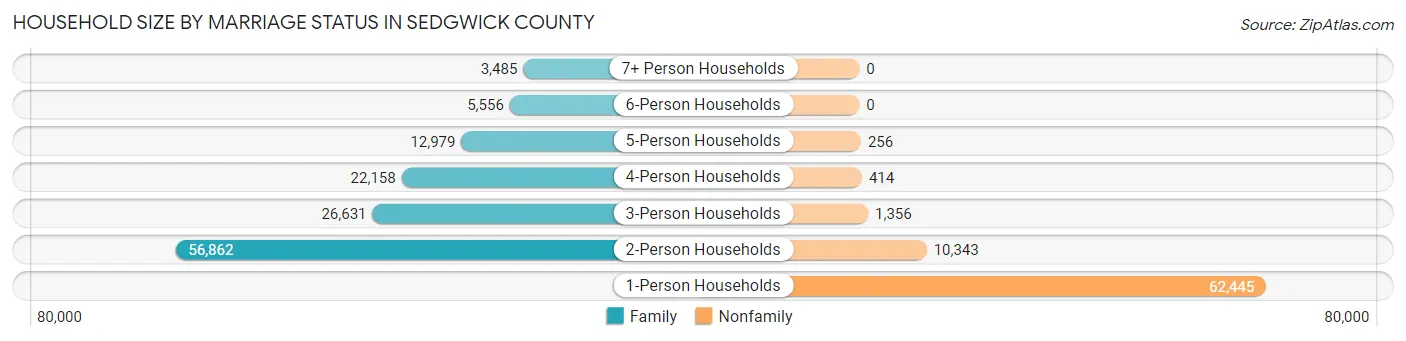
Household Size by Marriage Status in Sedgwick County
Out of a total of 202,485 households in Sedgwick County, 127,671 (63.0%) are family households, while 74,814 (36.9%) are nonfamily households. The most numerous type of family households are 2-person households, comprising 56,862, and the most common type of nonfamily households are 1-person households, comprising 62,445.
| Household Size | Family Households | Nonfamily Households |
| 1-Person Households | - | 62,445 (30.8%) |
| 2-Person Households | 56,862 (28.1%) | 10,343 (5.1%) |
| 3-Person Households | 26,631 (13.2%) | 1,356 (0.7%) |
| 4-Person Households | 22,158 (10.9%) | 414 (0.2%) |
| 5-Person Households | 12,979 (6.4%) | 256 (0.1%) |
| 6-Person Households | 5,556 (2.7%) | 0 (0.0%) |
| 7+ Person Households | 3,485 (1.7%) | 0 (0.0%) |
| Total | 127,671 (63.0%) | 74,814 (36.9%) |
Female Fertility in Sedgwick County
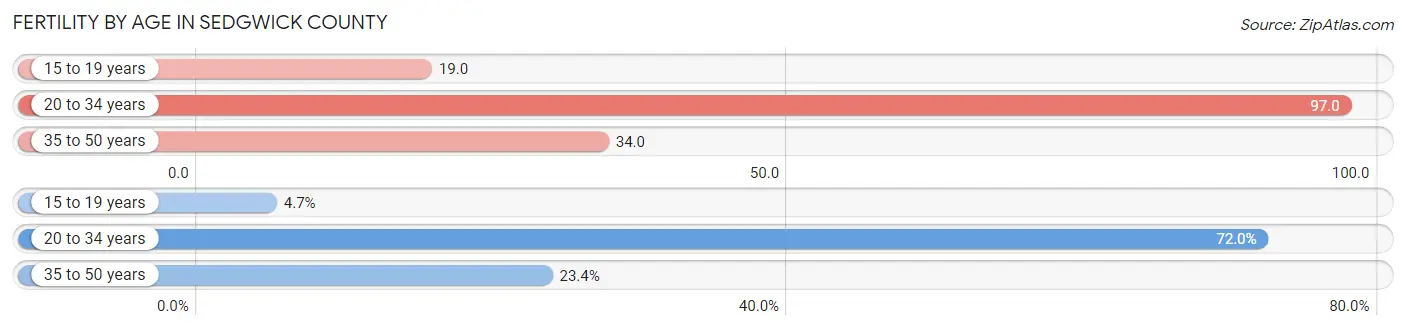
Fertility by Age in Sedgwick County
Average fertility rate in Sedgwick County is 60.0 births per 1,000 women. Women in the age bracket of 20 to 34 years have the highest fertility rate with 97.0 births per 1,000 women. Women in the age bracket of 20 to 34 years acount for 72.0% of all women with births.
| Age Bracket | Women with Births | Births / 1,000 Women |
| 15 to 19 years | 339 (4.7%) | 19.0 |
| 20 to 34 years | 5,227 (72.0%) | 97.0 |
| 35 to 50 years | 1,698 (23.4%) | 34.0 |
| Total | 7,264 (100.0%) | 60.0 |
Fertility by Age by Marriage Status in Sedgwick County
65.9% of women with births (7,264) in Sedgwick County are married. The highest percentage of unmarried women with births falls into 15 to 19 years age bracket with 83.8% of them unmarried at the time of birth, while the lowest percentage of unmarried women with births belong to 35 to 50 years age bracket with 20.5% of them unmarried.
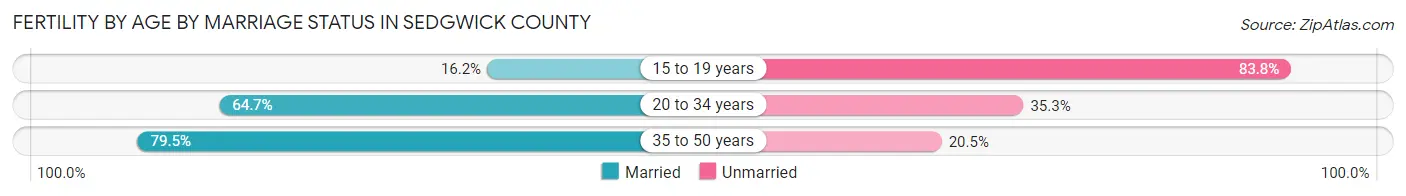
| Age Bracket | Married | Unmarried |
| 15 to 19 years | 55 (16.2%) | 284 (83.8%) |
| 20 to 34 years | 3,382 (64.7%) | 1,845 (35.3%) |
| 35 to 50 years | 1,350 (79.5%) | 348 (20.5%) |
| Total | 4,787 (65.9%) | 2,477 (34.1%) |
Fertility by Education in Sedgwick County
Average fertility rate in Sedgwick County is 60.0 births per 1,000 women. Women with the education attainment of graduate degree have the highest fertility rate of 69.0 births per 1,000 women, while women with the education attainment of less than high school have the lowest fertility at 36.0 births per 1,000 women. Women with the education attainment of college or associate's degree represent 36.8% of all women with births.
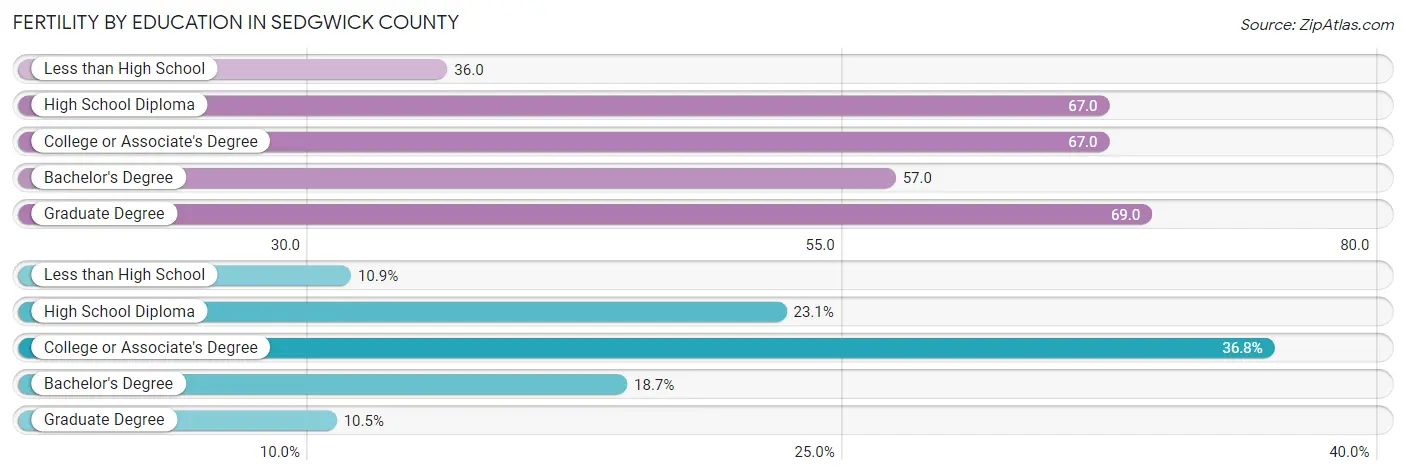
| Educational Attainment | Women with Births | Births / 1,000 Women |
| Less than High School | 791 (10.9%) | 36.0 |
| High School Diploma | 1,680 (23.1%) | 67.0 |
| College or Associate's Degree | 2,676 (36.8%) | 67.0 |
| Bachelor's Degree | 1,355 (18.6%) | 57.0 |
| Graduate Degree | 762 (10.5%) | 69.0 |
| Total | 7,264 (100.0%) | 60.0 |
Fertility by Education by Marriage Status in Sedgwick County
34.1% of women with births in Sedgwick County are unmarried. Women with the educational attainment of graduate degree are most likely to be married with 93.0% of them married at childbirth, while women with the educational attainment of high school diploma are least likely to be married with 58.0% of them unmarried at childbirth.
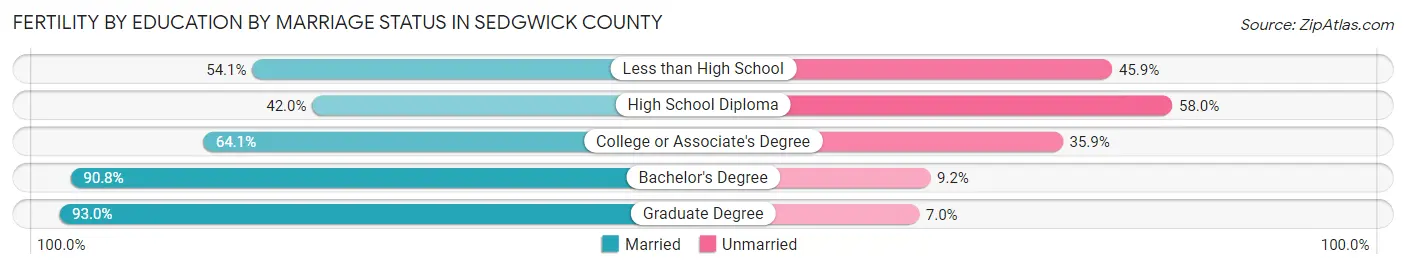
| Educational Attainment | Married | Unmarried |
| Less than High School | 428 (54.1%) | 363 (45.9%) |
| High School Diploma | 706 (42.0%) | 974 (58.0%) |
| College or Associate's Degree | 1,715 (64.1%) | 961 (35.9%) |
| Bachelor's Degree | 1,230 (90.8%) | 125 (9.2%) |
| Graduate Degree | 709 (93.0%) | 53 (7.0%) |
| Total | 4,787 (65.9%) | 2,477 (34.1%) |
Income in Sedgwick County
Income Overview in Sedgwick County
Per Capita Income in Sedgwick County is $35,338, while median incomes of families and households are $82,858 and $65,372 respectively.
| Characteristic | Number | Measure |
| Per Capita Income | 522,700 | $35,338 |
| Median Family Income | 127,671 | $82,858 |
| Mean Family Income | 127,671 | $105,693 |
| Median Household Income | 202,485 | $65,372 |
| Mean Household Income | 202,485 | $88,589 |
| Income Deficit | 127,671 | $10,791 |
| Wage / Income Gap (%) | 522,700 | 31.34% |
| Wage / Income Gap ($) | 522,700 | 68.66¢ per $1 |
| Gini / Inequality Index | 522,700 | 0.46 |
Earnings by Sex in Sedgwick County
Average Earnings in Sedgwick County are $37,970, $45,711 for men and $31,386 for women, a difference of 31.3%.
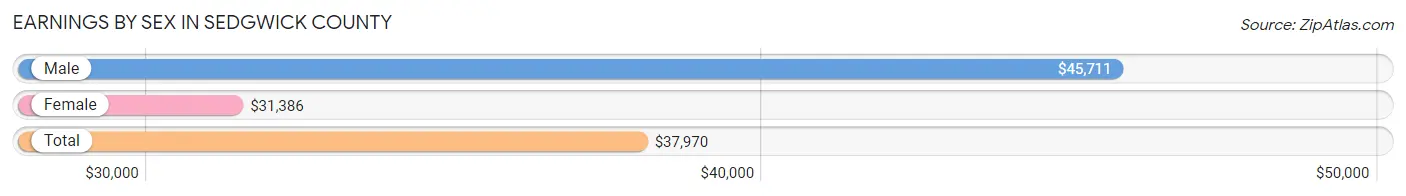
| Sex | Number | Average Earnings |
| Male | 146,618 (52.8%) | $45,711 |
| Female | 131,219 (47.2%) | $31,386 |
| Total | 277,837 (100.0%) | $37,970 |
Earnings by Sex by Income Bracket in Sedgwick County
The most common earnings brackets in Sedgwick County are $100,000+ for men (21,458 | 14.6%) and $25,000 to $29,999 for women (10,169 | 7.7%).
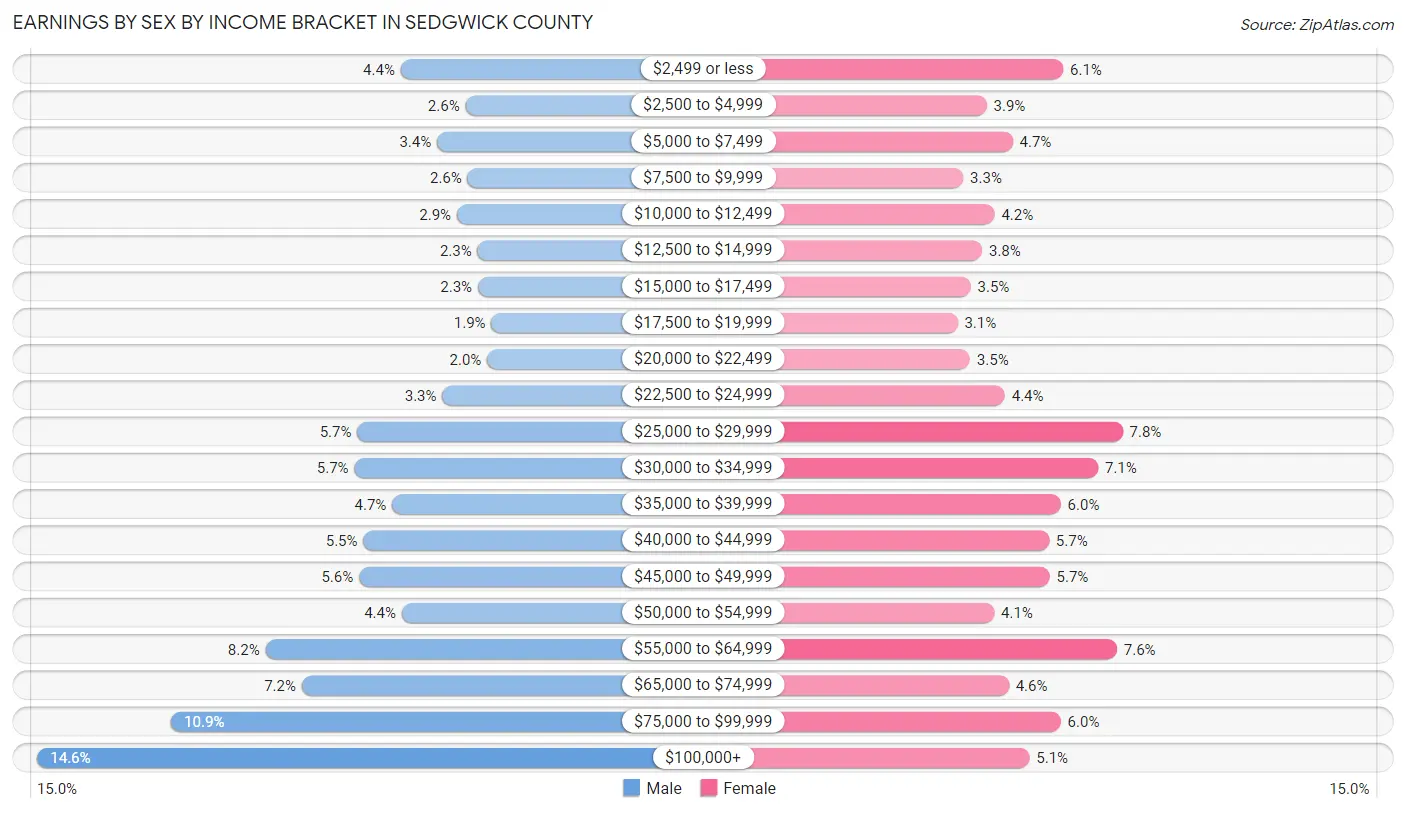
| Income | Male | Female |
| $2,499 or less | 6,496 (4.4%) | 7,976 (6.1%) |
| $2,500 to $4,999 | 3,823 (2.6%) | 5,159 (3.9%) |
| $5,000 to $7,499 | 4,997 (3.4%) | 6,112 (4.7%) |
| $7,500 to $9,999 | 3,737 (2.5%) | 4,295 (3.3%) |
| $10,000 to $12,499 | 4,172 (2.9%) | 5,451 (4.2%) |
| $12,500 to $14,999 | 3,335 (2.3%) | 4,985 (3.8%) |
| $15,000 to $17,499 | 3,312 (2.3%) | 4,564 (3.5%) |
| $17,500 to $19,999 | 2,755 (1.9%) | 4,075 (3.1%) |
| $20,000 to $22,499 | 2,933 (2.0%) | 4,541 (3.5%) |
| $22,500 to $24,999 | 4,775 (3.3%) | 5,825 (4.4%) |
| $25,000 to $29,999 | 8,282 (5.7%) | 10,169 (7.7%) |
| $30,000 to $34,999 | 8,404 (5.7%) | 9,261 (7.1%) |
| $35,000 to $39,999 | 6,842 (4.7%) | 7,892 (6.0%) |
| $40,000 to $44,999 | 8,036 (5.5%) | 7,453 (5.7%) |
| $45,000 to $49,999 | 8,216 (5.6%) | 7,479 (5.7%) |
| $50,000 to $54,999 | 6,447 (4.4%) | 5,433 (4.1%) |
| $55,000 to $64,999 | 12,068 (8.2%) | 9,964 (7.6%) |
| $65,000 to $74,999 | 10,572 (7.2%) | 5,966 (4.5%) |
| $75,000 to $99,999 | 15,958 (10.9%) | 7,886 (6.0%) |
| $100,000+ | 21,458 (14.6%) | 6,733 (5.1%) |
| Total | 146,618 (100.0%) | 131,219 (100.0%) |
Earnings by Sex by Educational Attainment in Sedgwick County
Average earnings in Sedgwick County are $52,667 for men and $36,300 for women, a difference of 31.1%. Men with an educational attainment of graduate degree enjoy the highest average annual earnings of $85,987, while those with less than high school education earn the least with $36,246. Women with an educational attainment of graduate degree earn the most with the average annual earnings of $59,029, while those with less than high school education have the smallest earnings of $23,519.
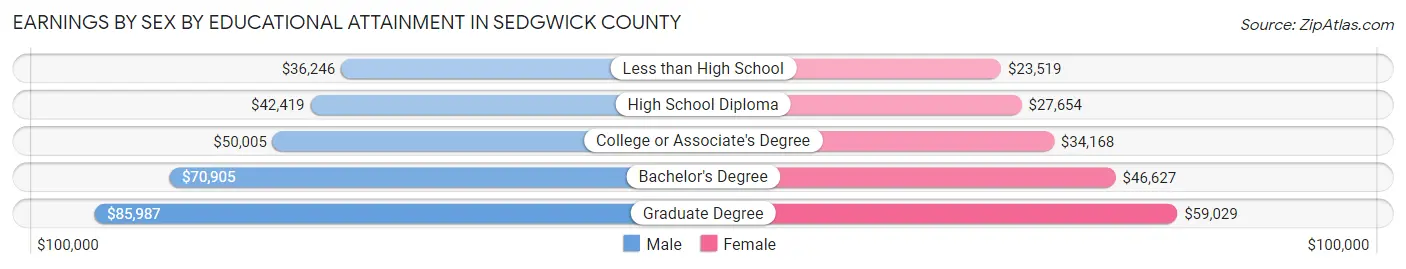
| Educational Attainment | Male Income | Female Income |
| Less than High School | $36,246 | $23,519 |
| High School Diploma | $42,419 | $27,654 |
| College or Associate's Degree | $50,005 | $34,168 |
| Bachelor's Degree | $70,905 | $46,627 |
| Graduate Degree | $85,987 | $59,029 |
| Total | $52,667 | $36,300 |
Family Income in Sedgwick County
Family Income Brackets in Sedgwick County
According to the Sedgwick County family income data, there are 26,300 families falling into the $100,000 to $149,999 income range, which is the most common income bracket and makes up 20.6% of all families. Conversely, the $10,000 to $14,999 income bracket is the least frequent group with only 2,553 families (2.0%) belonging to this category.
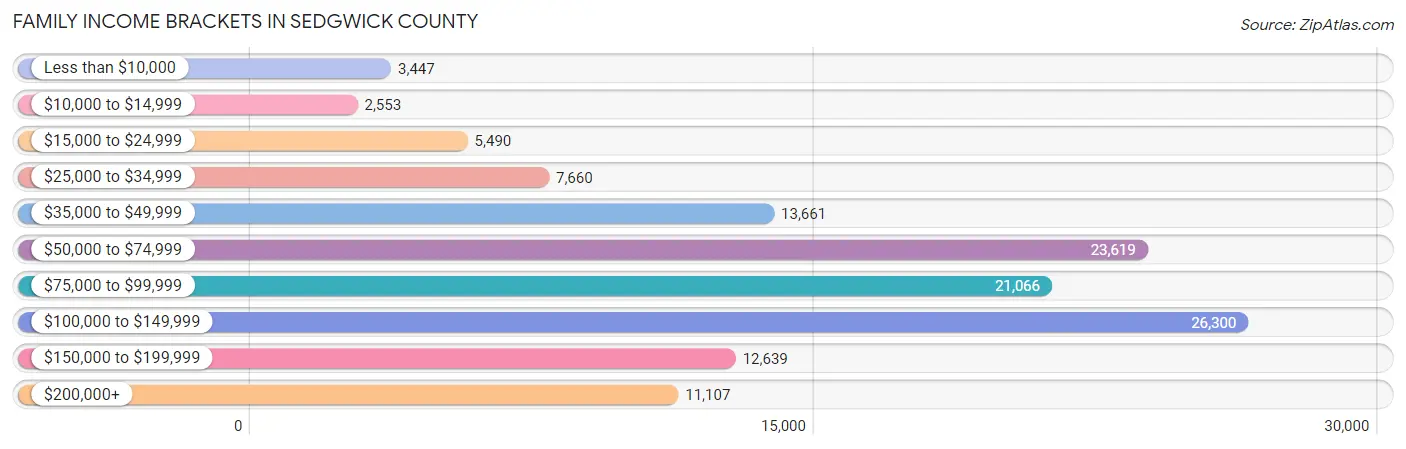
| Income Bracket | # Families | % Families |
| Less than $10,000 | 3,447 | 2.7% |
| $10,000 to $14,999 | 2,553 | 2.0% |
| $15,000 to $24,999 | 5,490 | 4.3% |
| $25,000 to $34,999 | 7,660 | 6.0% |
| $35,000 to $49,999 | 13,661 | 10.7% |
| $50,000 to $74,999 | 23,619 | 18.5% |
| $75,000 to $99,999 | 21,066 | 16.5% |
| $100,000 to $149,999 | 26,300 | 20.6% |
| $150,000 to $199,999 | 12,639 | 9.9% |
| $200,000+ | 11,107 | 8.7% |
Family Income by Famaliy Size in Sedgwick County
4-person families (20,819 | 16.3%) account for the highest median family income in Sedgwick County with $99,061 per family, while 2-person families (61,099 | 47.9%) have the highest median income of $37,670 per family member.
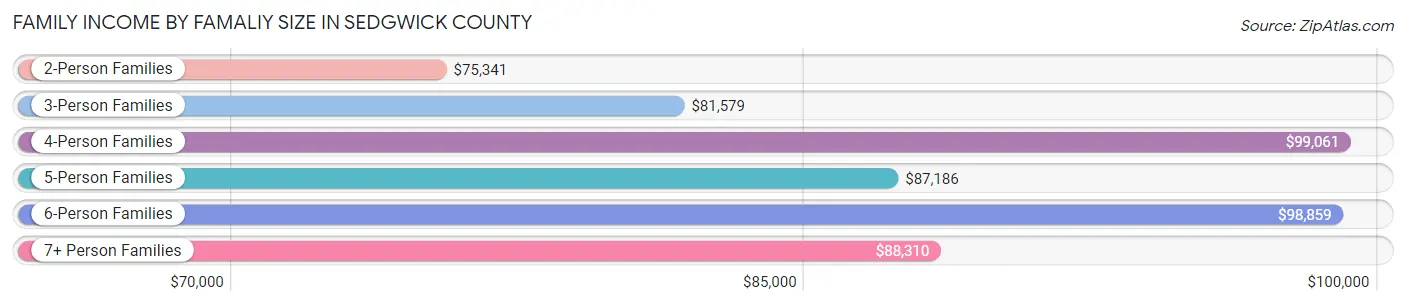
| Income Bracket | # Families | Median Income |
| 2-Person Families | 61,099 (47.9%) | $75,341 |
| 3-Person Families | 25,593 (20.1%) | $81,579 |
| 4-Person Families | 20,819 (16.3%) | $99,061 |
| 5-Person Families | 12,342 (9.7%) | $87,186 |
| 6-Person Families | 4,936 (3.9%) | $98,859 |
| 7+ Person Families | 2,882 (2.3%) | $88,310 |
| Total | 127,671 (100.0%) | $82,858 |
Family Income by Number of Earners in Sedgwick County
The median family income in Sedgwick County is $82,858, with families comprising 3+ earners (14,801) having the highest median family income of $131,777, while families with no earners (17,724) have the lowest median family income of $56,929, accounting for 11.6% and 13.9% of families, respectively.
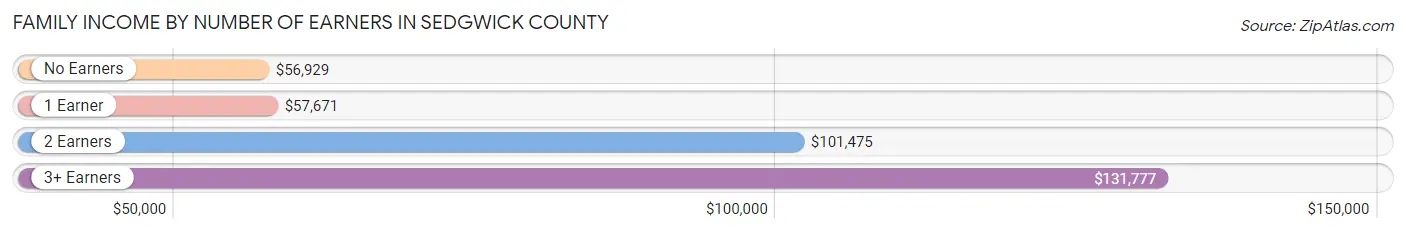
| Number of Earners | # Families | Median Income |
| No Earners | 17,724 (13.9%) | $56,929 |
| 1 Earner | 41,773 (32.7%) | $57,671 |
| 2 Earners | 53,373 (41.8%) | $101,475 |
| 3+ Earners | 14,801 (11.6%) | $131,777 |
| Total | 127,671 (100.0%) | $82,858 |
Household Income in Sedgwick County
Household Income Brackets in Sedgwick County
With 37,257 households falling in the category, the $50,000 to $74,999 income range is the most frequent in Sedgwick County, accounting for 18.4% of all households. In contrast, only 8,099 households (4.0%) fall into the $10,000 to $14,999 income bracket, making it the least populous group.
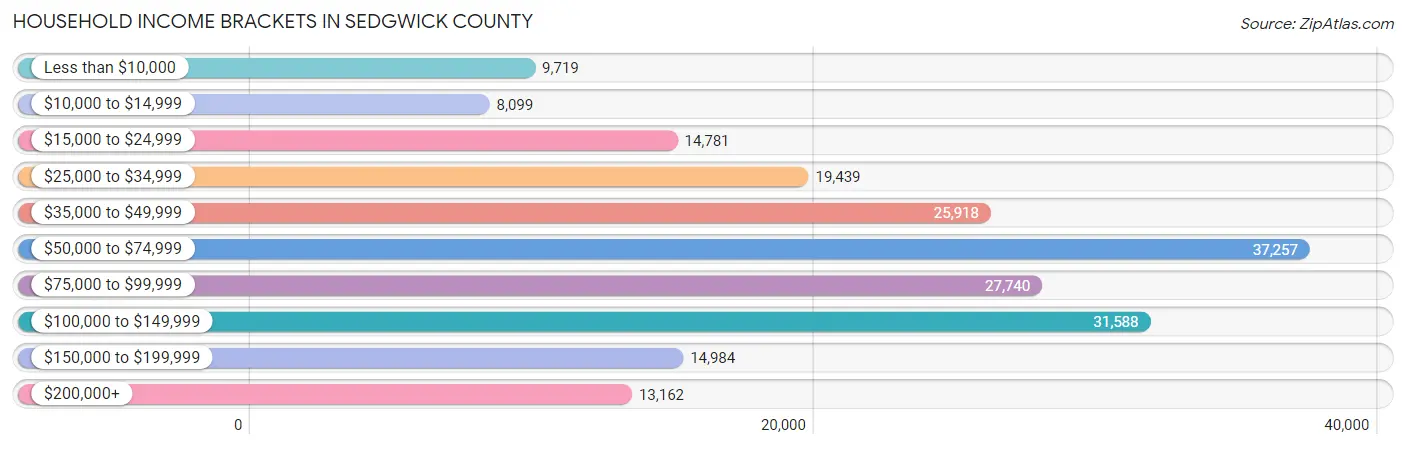
| Income Bracket | # Households | % Households |
| Less than $10,000 | 9,719 | 4.8% |
| $10,000 to $14,999 | 8,099 | 4.0% |
| $15,000 to $24,999 | 14,781 | 7.3% |
| $25,000 to $34,999 | 19,439 | 9.6% |
| $35,000 to $49,999 | 25,918 | 12.8% |
| $50,000 to $74,999 | 37,257 | 18.4% |
| $75,000 to $99,999 | 27,740 | 13.7% |
| $100,000 to $149,999 | 31,588 | 15.6% |
| $150,000 to $199,999 | 14,984 | 7.4% |
| $200,000+ | 13,162 | 6.5% |
Household Income by Householder Age in Sedgwick County
The median household income in Sedgwick County is $65,372, with the highest median household income of $79,820 found in the 45 to 64 years age bracket for the primary householder. A total of 70,612 households (34.9%) fall into this category. Meanwhile, the 15 to 24 years age bracket for the primary householder has the lowest median household income of $38,170, with 11,122 households (5.5%) in this group.
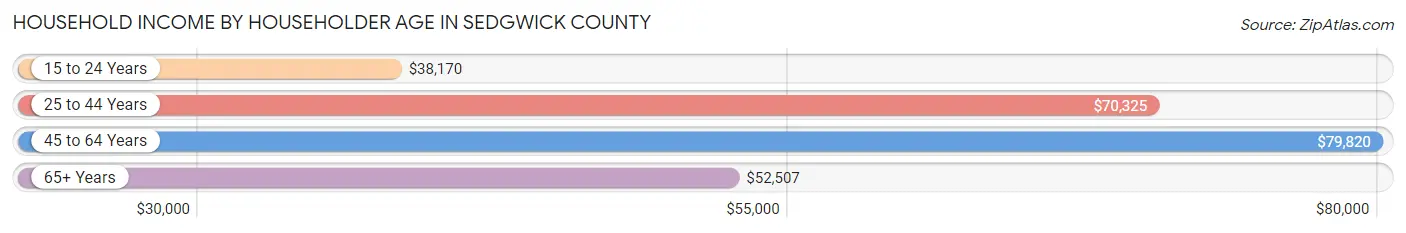
| Income Bracket | # Households | Median Income |
| 15 to 24 Years | 11,122 (5.5%) | $38,170 |
| 25 to 44 Years | 69,719 (34.4%) | $70,325 |
| 45 to 64 Years | 70,612 (34.9%) | $79,820 |
| 65+ Years | 51,032 (25.2%) | $52,507 |
| Total | 202,485 (100.0%) | $65,372 |
Poverty in Sedgwick County
Income Below Poverty by Sex and Age in Sedgwick County
With 12.9% poverty level for males and 14.4% for females among the residents of Sedgwick County, 6 to 11 year old males and 18 to 24 year old females are the most vulnerable to poverty, with 4,260 males (19.0%) and 5,314 females (22.6%) in their respective age groups living below the poverty level.
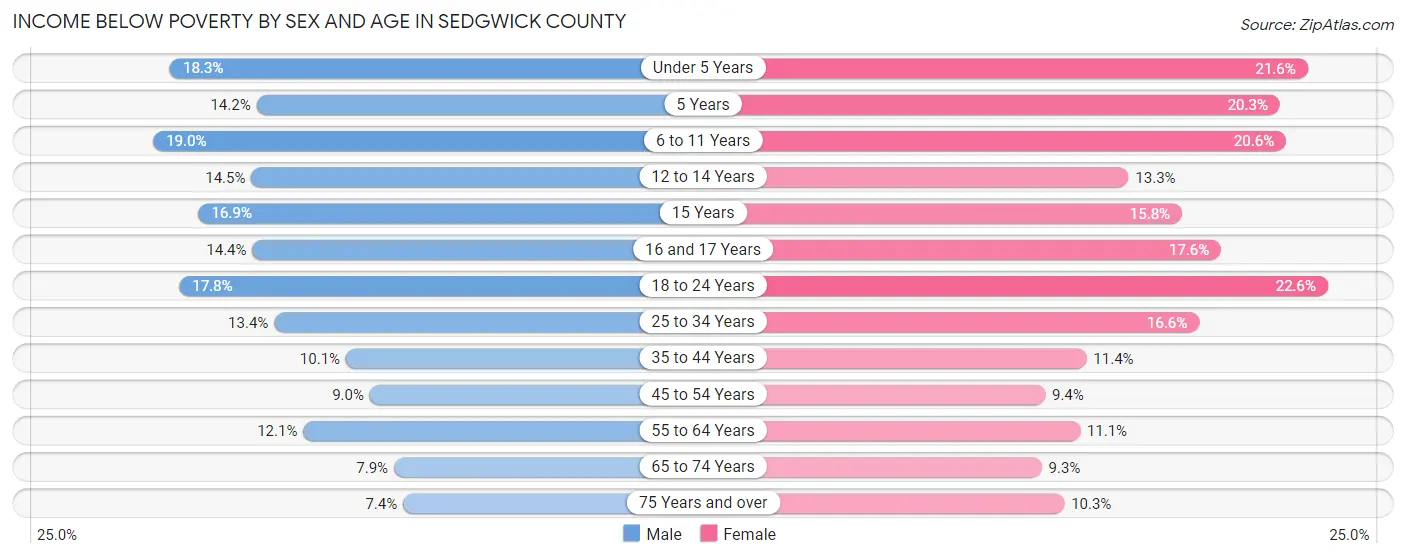
| Age Bracket | Male | Female |
| Under 5 Years | 3,104 (18.2%) | 3,472 (21.6%) |
| 5 Years | 487 (14.2%) | 599 (20.3%) |
| 6 to 11 Years | 4,260 (19.0%) | 4,270 (20.6%) |
| 12 to 14 Years | 1,720 (14.5%) | 1,663 (13.3%) |
| 15 Years | 679 (16.9%) | 544 (15.8%) |
| 16 and 17 Years | 1,074 (14.4%) | 1,329 (17.6%) |
| 18 to 24 Years | 4,450 (17.8%) | 5,314 (22.6%) |
| 25 to 34 Years | 4,868 (13.4%) | 5,993 (16.6%) |
| 35 to 44 Years | 3,296 (10.1%) | 3,710 (11.4%) |
| 45 to 54 Years | 2,622 (9.0%) | 2,731 (9.4%) |
| 55 to 64 Years | 3,804 (12.1%) | 3,558 (11.1%) |
| 65 to 74 Years | 1,768 (7.9%) | 2,266 (9.3%) |
| 75 Years and over | 936 (7.4%) | 1,834 (10.3%) |
| Total | 33,068 (12.9%) | 37,283 (14.4%) |
Income Above Poverty by Sex and Age in Sedgwick County
According to the poverty statistics in Sedgwick County, males aged 75 years and over and females aged 65 to 74 years are the age groups that are most secure financially, with 92.6% of males and 90.7% of females in these age groups living above the poverty line.
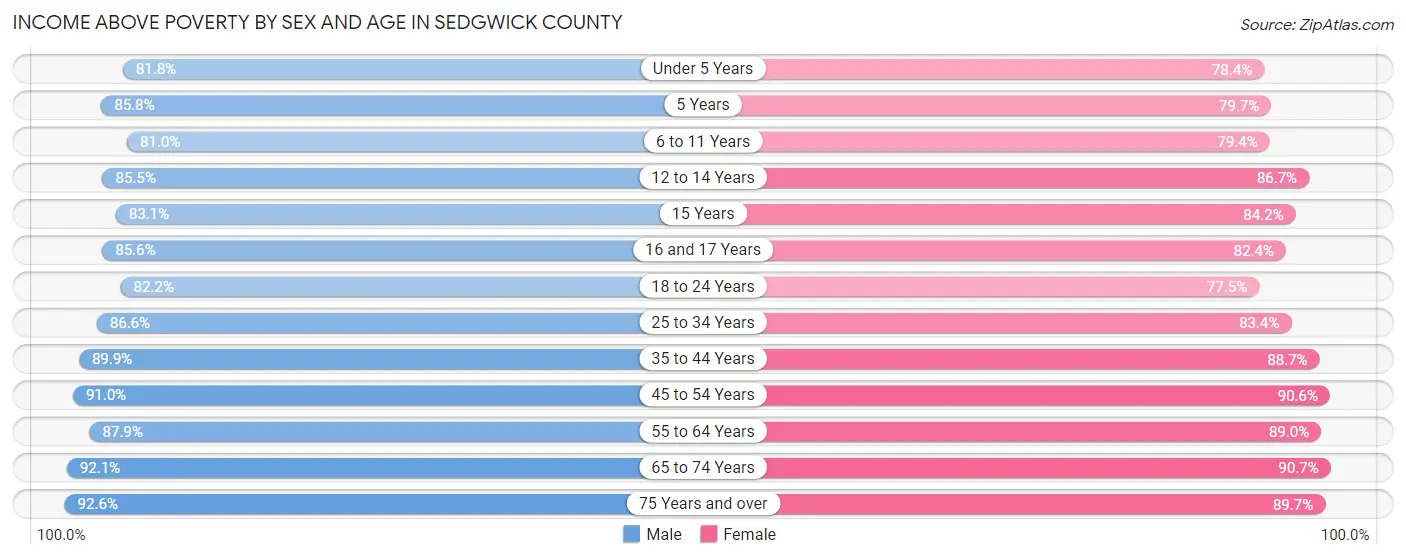
| Age Bracket | Male | Female |
| Under 5 Years | 13,908 (81.8%) | 12,597 (78.4%) |
| 5 Years | 2,933 (85.8%) | 2,349 (79.7%) |
| 6 to 11 Years | 18,122 (81.0%) | 16,453 (79.4%) |
| 12 to 14 Years | 10,162 (85.5%) | 10,841 (86.7%) |
| 15 Years | 3,332 (83.1%) | 2,903 (84.2%) |
| 16 and 17 Years | 6,367 (85.6%) | 6,220 (82.4%) |
| 18 to 24 Years | 20,524 (82.2%) | 18,251 (77.4%) |
| 25 to 34 Years | 31,412 (86.6%) | 30,149 (83.4%) |
| 35 to 44 Years | 29,362 (89.9%) | 28,989 (88.6%) |
| 45 to 54 Years | 26,574 (91.0%) | 26,235 (90.6%) |
| 55 to 64 Years | 27,722 (87.9%) | 28,632 (88.9%) |
| 65 to 74 Years | 20,723 (92.1%) | 22,180 (90.7%) |
| 75 Years and over | 11,640 (92.6%) | 15,932 (89.7%) |
| Total | 222,781 (87.1%) | 221,731 (85.6%) |
Income Below Poverty Among Married-Couple Families in Sedgwick County
The poverty statistics for married-couple families in Sedgwick County show that 4.9% or 4,602 of the total 94,197 families live below the poverty line. Families with 5 or more children have the highest poverty rate of 14.4%, comprising of 157 families. On the other hand, families with no children have the lowest poverty rate of 3.7%, which includes 1,988 families.
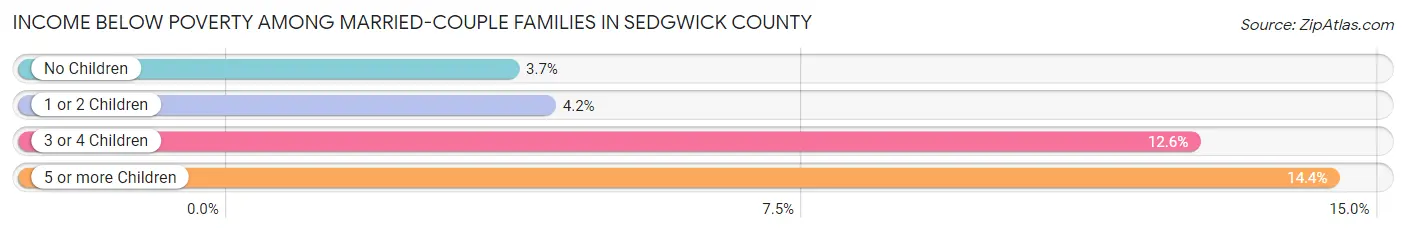
| Children | Above Poverty | Below Poverty |
| No Children | 52,205 (96.3%) | 1,988 (3.7%) |
| 1 or 2 Children | 27,694 (95.9%) | 1,199 (4.2%) |
| 3 or 4 Children | 8,761 (87.4%) | 1,258 (12.6%) |
| 5 or more Children | 935 (85.6%) | 157 (14.4%) |
| Total | 89,595 (95.1%) | 4,602 (4.9%) |
Income Below Poverty Among Single-Parent Households in Sedgwick County
According to the poverty data in Sedgwick County, 14.0% or 1,319 single-father households and 24.5% or 5,901 single-mother households are living below the poverty line. Among single-father households, those with 5 or more children have the highest poverty rate, with 85 households (76.6%) experiencing poverty. Likewise, among single-mother households, those with 5 or more children have the highest poverty rate, with 438 households (78.5%) falling below the poverty line.
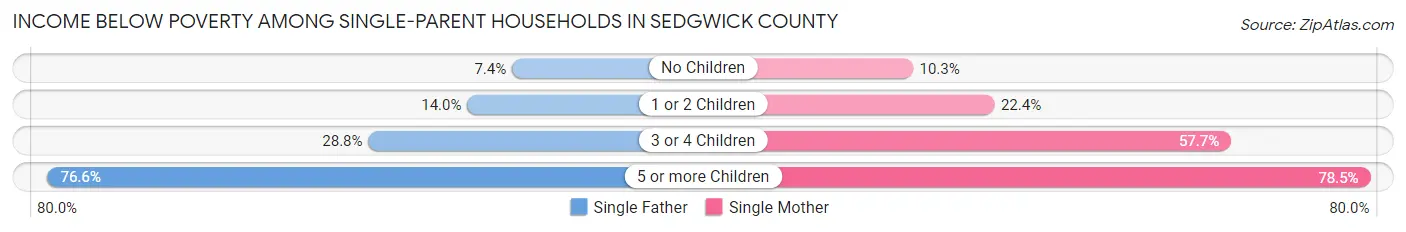
| Children | Single Father | Single Mother |
| No Children | 269 (7.4%) | 791 (10.3%) |
| 1 or 2 Children | 634 (14.0%) | 2,814 (22.4%) |
| 3 or 4 Children | 331 (28.8%) | 1,858 (57.7%) |
| 5 or more Children | 85 (76.6%) | 438 (78.5%) |
| Total | 1,319 (14.0%) | 5,901 (24.5%) |
Income Below Poverty Among Married-Couple vs Single-Parent Households in Sedgwick County
The poverty data for Sedgwick County shows that 4,602 of the married-couple family households (4.9%) and 7,220 of the single-parent households (21.6%) are living below the poverty level. Within the married-couple family households, those with 5 or more children have the highest poverty rate, with 157 households (14.4%) falling below the poverty line. Among the single-parent households, those with 5 or more children have the highest poverty rate, with 523 household (78.2%) living below poverty.
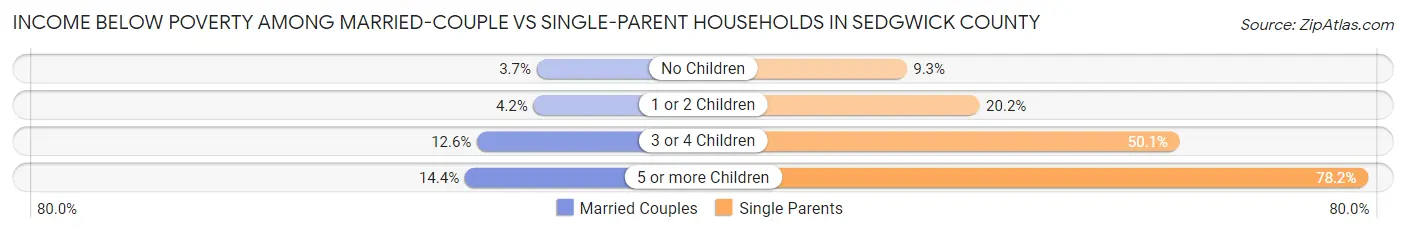
| Children | Married-Couple Families | Single-Parent Households |
| No Children | 1,988 (3.7%) | 1,060 (9.3%) |
| 1 or 2 Children | 1,199 (4.2%) | 3,448 (20.2%) |
| 3 or 4 Children | 1,258 (12.6%) | 2,189 (50.1%) |
| 5 or more Children | 157 (14.4%) | 523 (78.2%) |
| Total | 4,602 (4.9%) | 7,220 (21.6%) |
Employment Characteristics in Sedgwick County
Employment by Class of Employer in Sedgwick County
Among the 250,143 employed individuals in Sedgwick County, private company employees (175,285 | 70.1%), not-for-profit organizations (19,632 | 7.9%), and local government employees (17,570 | 7.0%) make up the most common classes of employment.
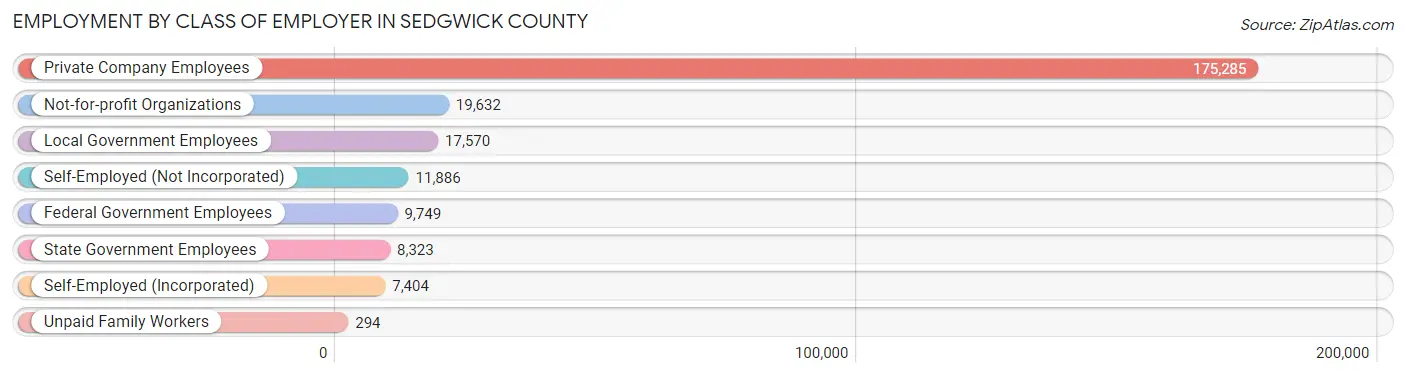
| Employer Class | # Employees | % Employees |
| Private Company Employees | 175,285 | 70.1% |
| Self-Employed (Incorporated) | 7,404 | 3.0% |
| Self-Employed (Not Incorporated) | 11,886 | 4.8% |
| Not-for-profit Organizations | 19,632 | 7.9% |
| Local Government Employees | 17,570 | 7.0% |
| State Government Employees | 8,323 | 3.3% |
| Federal Government Employees | 9,749 | 3.9% |
| Unpaid Family Workers | 294 | 0.1% |
| Total | 250,143 | 100.0% |
Employment Status by Age in Sedgwick County
According to the labor force statistics for Sedgwick County, out of the total population over 16 years of age (406,318), 66.1% or 268,576 individuals are in the labor force, with 5.3% or 14,235 of them unemployed. The age group with the highest labor force participation rate is 25 to 29 years, with 85.4% or 32,136 individuals in the labor force. Within the labor force, the 16 to 19 years age range has the highest percentage of unemployed individuals, with 18.4% or 2,597 of them being unemployed.
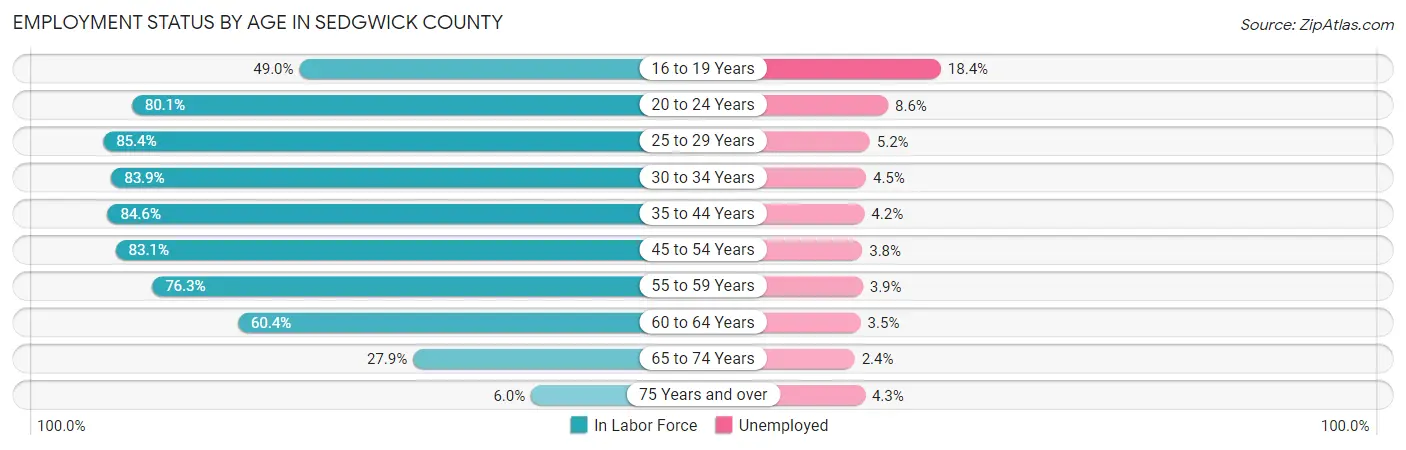
| Age Bracket | In Labor Force | Unemployed |
| 16 to 19 Years | 14,113 (49.0%) | 2,597 (18.4%) |
| 20 to 24 Years | 29,444 (80.1%) | 2,532 (8.6%) |
| 25 to 29 Years | 32,136 (85.4%) | 1,671 (5.2%) |
| 30 to 34 Years | 29,790 (83.9%) | 1,341 (4.5%) |
| 35 to 44 Years | 55,767 (84.6%) | 2,342 (4.2%) |
| 45 to 54 Years | 48,538 (83.1%) | 1,844 (3.8%) |
| 55 to 59 Years | 23,777 (76.3%) | 927 (3.9%) |
| 60 to 64 Years | 19,875 (60.4%) | 696 (3.5%) |
| 65 to 74 Years | 13,251 (27.9%) | 318 (2.4%) |
| 75 Years and over | 1,904 (6.0%) | 82 (4.3%) |
| Total | 268,576 (66.1%) | 14,235 (5.3%) |
Employment Status by Educational Attainment in Sedgwick County
According to labor force statistics for Sedgwick County, 80.2% of individuals (209,749) out of the total population between 25 and 64 years of age (261,532) are in the labor force, with 4.2% or 8,809 of them being unemployed. The group with the highest labor force participation rate are those with the educational attainment of bachelor's degree or higher, with 86.4% or 73,193 individuals in the labor force. Within the labor force, individuals with less than high school education have the highest percentage of unemployment, with 6.7% or 1,279 of them being unemployed.
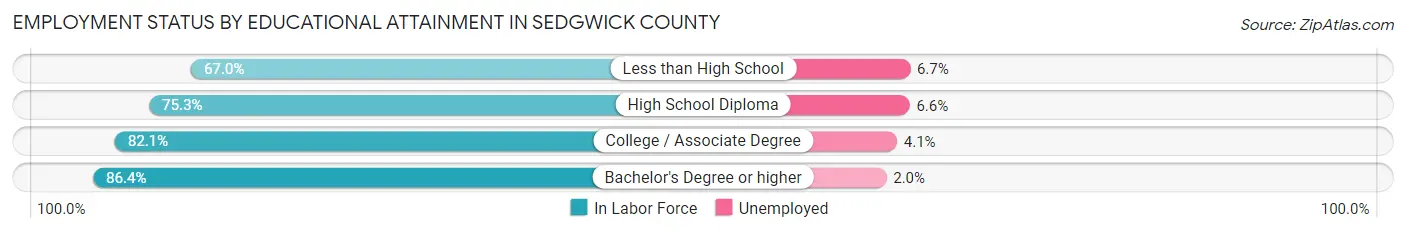
| Educational Attainment | In Labor Force | Unemployed |
| Less than High School | 19,090 (67.0%) | 1,909 (6.7%) |
| High School Diploma | 47,425 (75.3%) | 4,157 (6.6%) |
| College / Associate Degree | 70,067 (82.1%) | 3,499 (4.1%) |
| Bachelor's Degree or higher | 73,193 (86.4%) | 1,694 (2.0%) |
| Total | 209,749 (80.2%) | 10,984 (4.2%) |
Employment Occupations by Sex in Sedgwick County
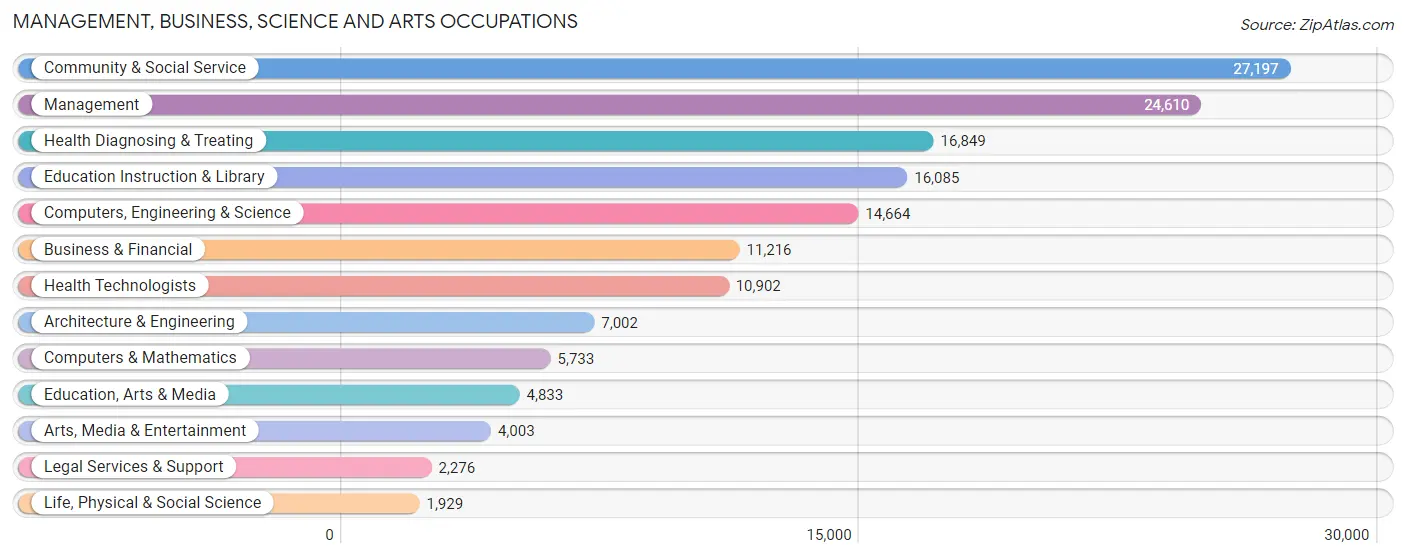
Management, Business, Science and Arts Occupations
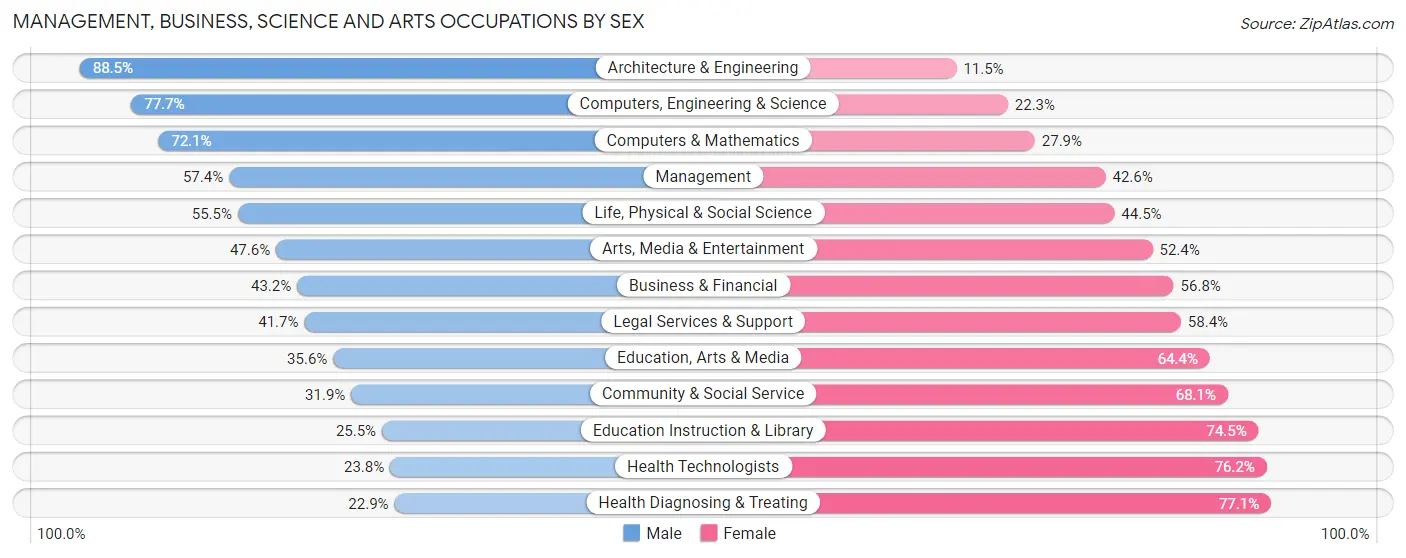
The most common Management, Business, Science and Arts occupations in Sedgwick County are Community & Social Service (27,197 | 10.8%), Management (24,610 | 9.8%), Health Diagnosing & Treating (16,849 | 6.7%), Education Instruction & Library (16,085 | 6.4%), and Computers, Engineering & Science (14,664 | 5.8%).
Management, Business, Science and Arts Occupations by Sex
Within the Management, Business, Science and Arts occupations in Sedgwick County, the most male-oriented occupations are Architecture & Engineering (88.5%), Computers, Engineering & Science (77.7%), and Computers & Mathematics (72.1%), while the most female-oriented occupations are Health Diagnosing & Treating (77.1%), Health Technologists (76.2%), and Education Instruction & Library (74.5%).
| Occupation | Male | Female |
| Management | 14,118 (57.4%) | 10,492 (42.6%) |
| Business & Financial | 4,841 (43.2%) | 6,375 (56.8%) |
| Computers, Engineering & Science | 11,400 (77.7%) | 3,264 (22.3%) |
| Computers & Mathematics | 4,134 (72.1%) | 1,599 (27.9%) |
| Architecture & Engineering | 6,195 (88.5%) | 807 (11.5%) |
| Life, Physical & Social Science | 1,071 (55.5%) | 858 (44.5%) |
| Community & Social Service | 8,670 (31.9%) | 18,527 (68.1%) |
| Education, Arts & Media | 1,722 (35.6%) | 3,111 (64.4%) |
| Legal Services & Support | 948 (41.6%) | 1,328 (58.4%) |
| Education Instruction & Library | 4,096 (25.5%) | 11,989 (74.5%) |
| Arts, Media & Entertainment | 1,904 (47.6%) | 2,099 (52.4%) |
| Health Diagnosing & Treating | 3,852 (22.9%) | 12,997 (77.1%) |
| Health Technologists | 2,590 (23.8%) | 8,312 (76.2%) |
| Total (Category) | 42,881 (45.4%) | 51,655 (54.6%) |
| Total (Overall) | 131,885 (52.5%) | 119,247 (47.5%) |
Services Occupations
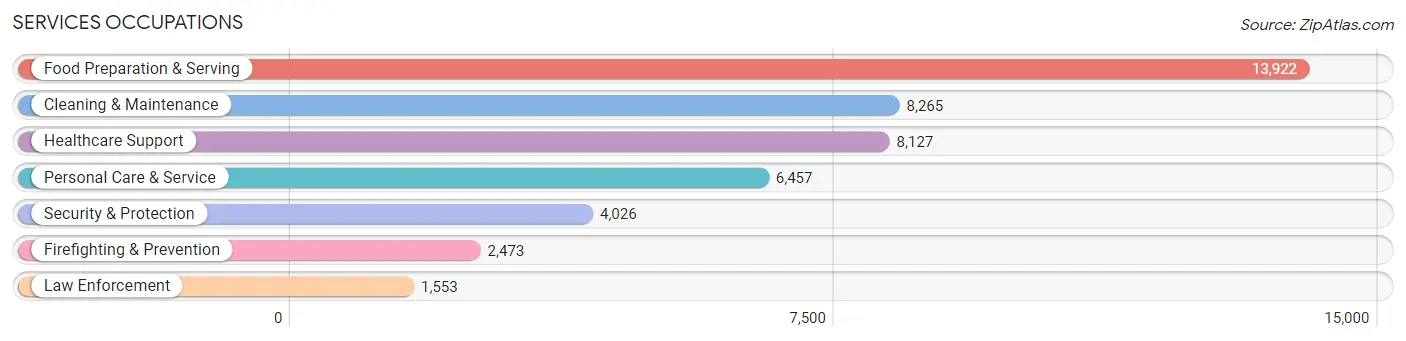
The most common Services occupations in Sedgwick County are Food Preparation & Serving (13,922 | 5.5%), Cleaning & Maintenance (8,265 | 3.3%), Healthcare Support (8,127 | 3.2%), Personal Care & Service (6,457 | 2.6%), and Security & Protection (4,026 | 1.6%).
Services Occupations by Sex
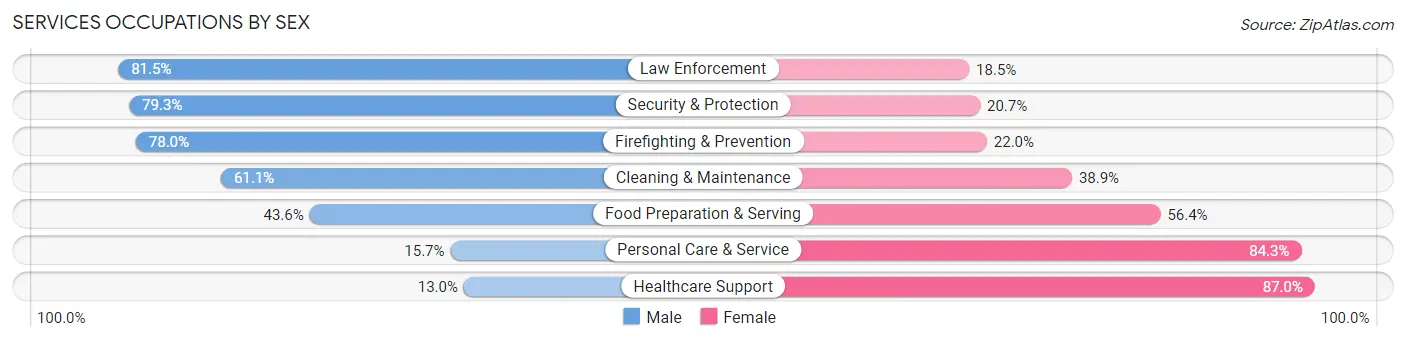
Within the Services occupations in Sedgwick County, the most male-oriented occupations are Law Enforcement (81.5%), Security & Protection (79.3%), and Firefighting & Prevention (78.0%), while the most female-oriented occupations are Healthcare Support (87.0%), Personal Care & Service (84.3%), and Food Preparation & Serving (56.4%).
| Occupation | Male | Female |
| Healthcare Support | 1,059 (13.0%) | 7,068 (87.0%) |
| Security & Protection | 3,193 (79.3%) | 833 (20.7%) |
| Firefighting & Prevention | 1,928 (78.0%) | 545 (22.0%) |
| Law Enforcement | 1,265 (81.5%) | 288 (18.5%) |
| Food Preparation & Serving | 6,067 (43.6%) | 7,855 (56.4%) |
| Cleaning & Maintenance | 5,051 (61.1%) | 3,214 (38.9%) |
| Personal Care & Service | 1,013 (15.7%) | 5,444 (84.3%) |
| Total (Category) | 16,383 (40.2%) | 24,414 (59.8%) |
| Total (Overall) | 131,885 (52.5%) | 119,247 (47.5%) |
Sales and Office Occupations
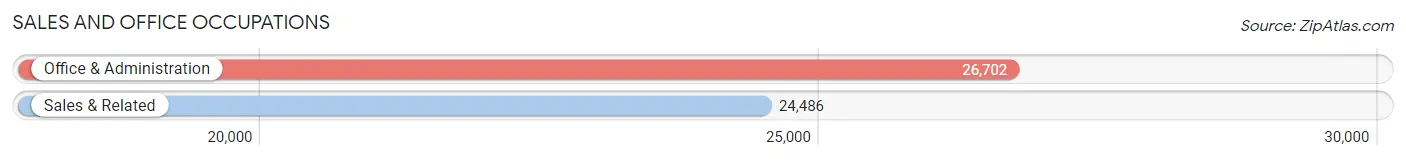
The most common Sales and Office occupations in Sedgwick County are Office & Administration (26,702 | 10.6%), and Sales & Related (24,486 | 9.8%).
Sales and Office Occupations by Sex
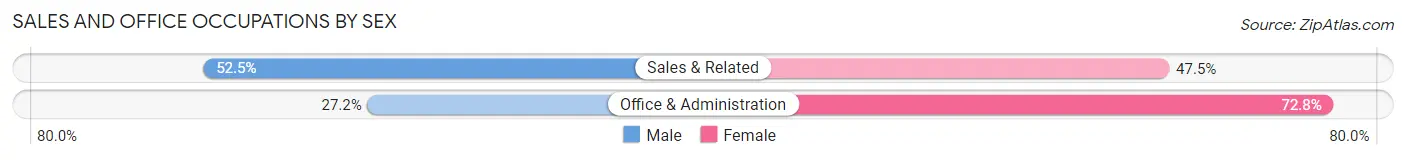
| Occupation | Male | Female |
| Sales & Related | 12,861 (52.5%) | 11,625 (47.5%) |
| Office & Administration | 7,273 (27.2%) | 19,429 (72.8%) |
| Total (Category) | 20,134 (39.3%) | 31,054 (60.7%) |
| Total (Overall) | 131,885 (52.5%) | 119,247 (47.5%) |
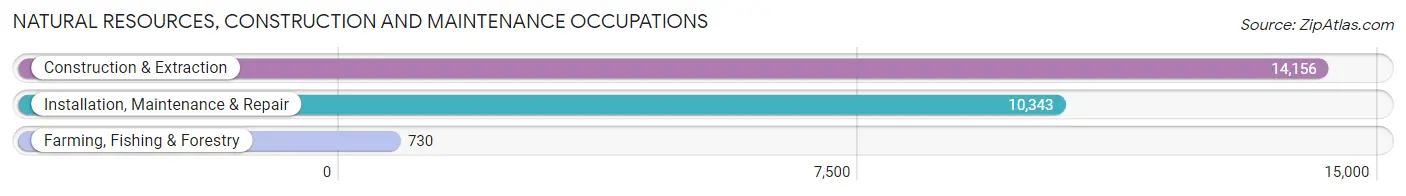
Natural Resources, Construction and Maintenance Occupations
The most common Natural Resources, Construction and Maintenance occupations in Sedgwick County are Construction & Extraction (14,156 | 5.6%), Installation, Maintenance & Repair (10,343 | 4.1%), and Farming, Fishing & Forestry (730 | 0.3%).
Natural Resources, Construction and Maintenance Occupations by Sex
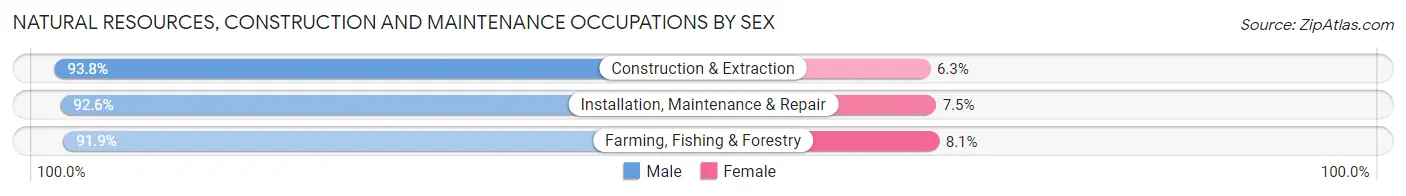
| Occupation | Male | Female |
| Farming, Fishing & Forestry | 671 (91.9%) | 59 (8.1%) |
| Construction & Extraction | 13,271 (93.8%) | 885 (6.2%) |
| Installation, Maintenance & Repair | 9,572 (92.5%) | 771 (7.4%) |
| Total (Category) | 23,514 (93.2%) | 1,715 (6.8%) |
| Total (Overall) | 131,885 (52.5%) | 119,247 (47.5%) |
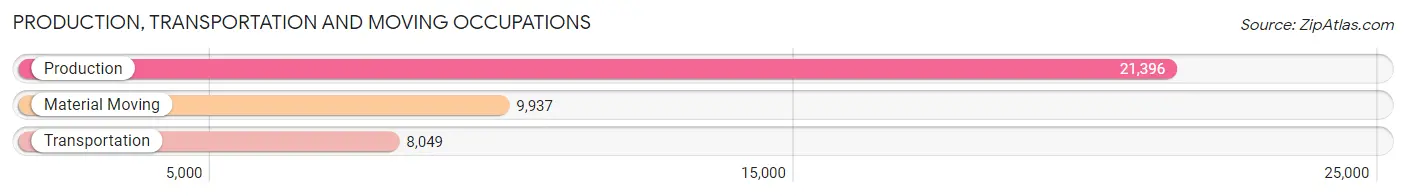
Production, Transportation and Moving Occupations
The most common Production, Transportation and Moving occupations in Sedgwick County are Production (21,396 | 8.5%), Material Moving (9,937 | 4.0%), and Transportation (8,049 | 3.2%).
Production, Transportation and Moving Occupations by Sex
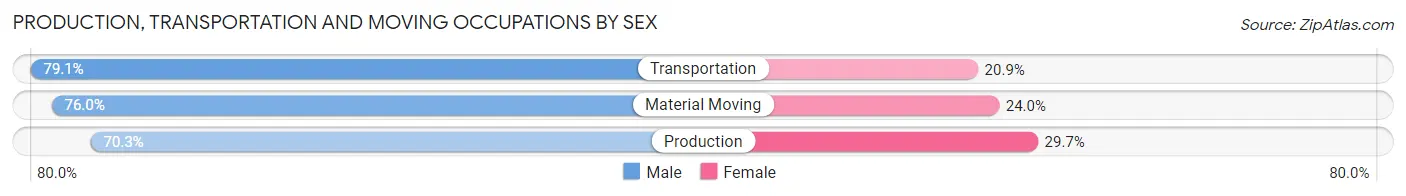
| Occupation | Male | Female |
| Production | 15,047 (70.3%) | 6,349 (29.7%) |
| Transportation | 6,370 (79.1%) | 1,679 (20.9%) |
| Material Moving | 7,556 (76.0%) | 2,381 (24.0%) |
| Total (Category) | 28,973 (73.6%) | 10,409 (26.4%) |
| Total (Overall) | 131,885 (52.5%) | 119,247 (47.5%) |
Employment Industries by Sex in Sedgwick County
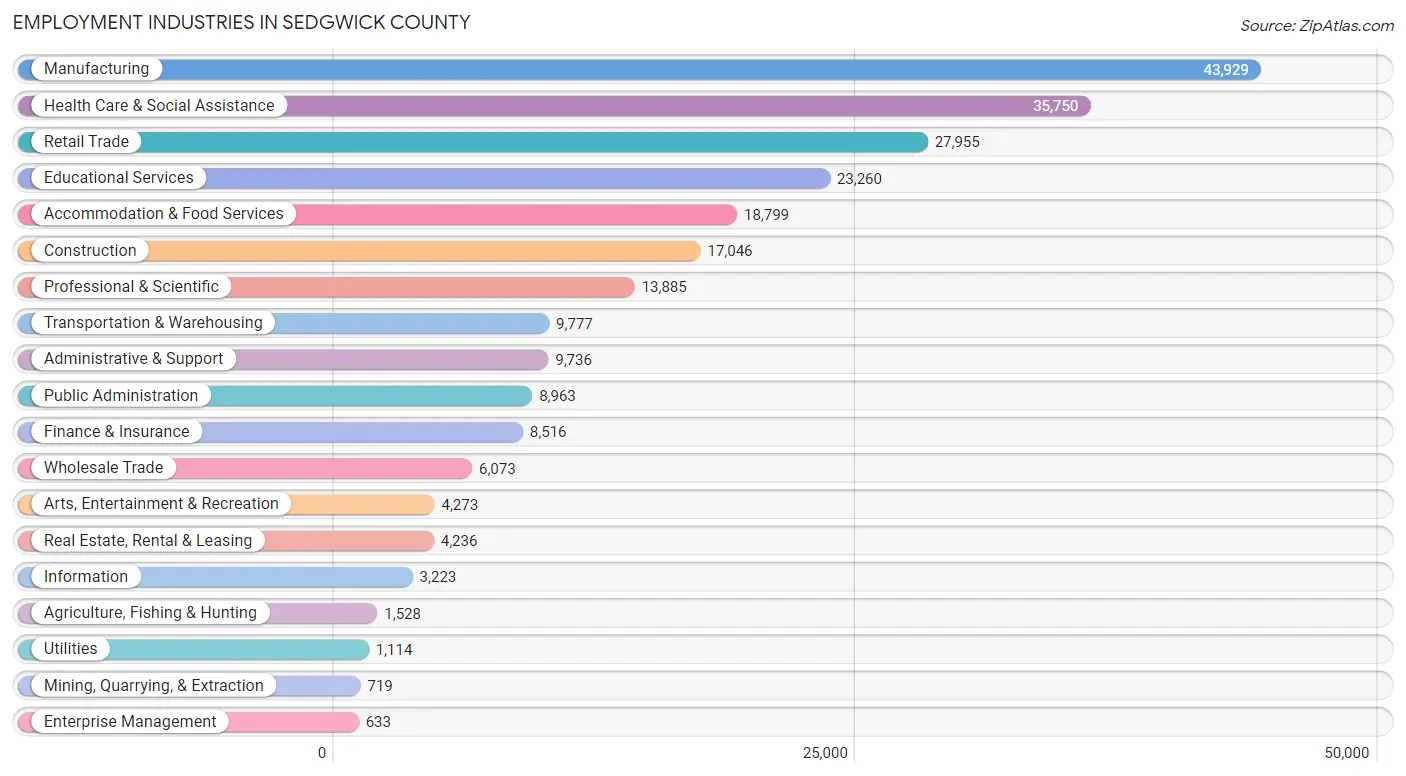
Employment Industries in Sedgwick County
The major employment industries in Sedgwick County include Manufacturing (43,929 | 17.5%), Health Care & Social Assistance (35,750 | 14.2%), Retail Trade (27,955 | 11.1%), Educational Services (23,260 | 9.3%), and Accommodation & Food Services (18,799 | 7.5%).
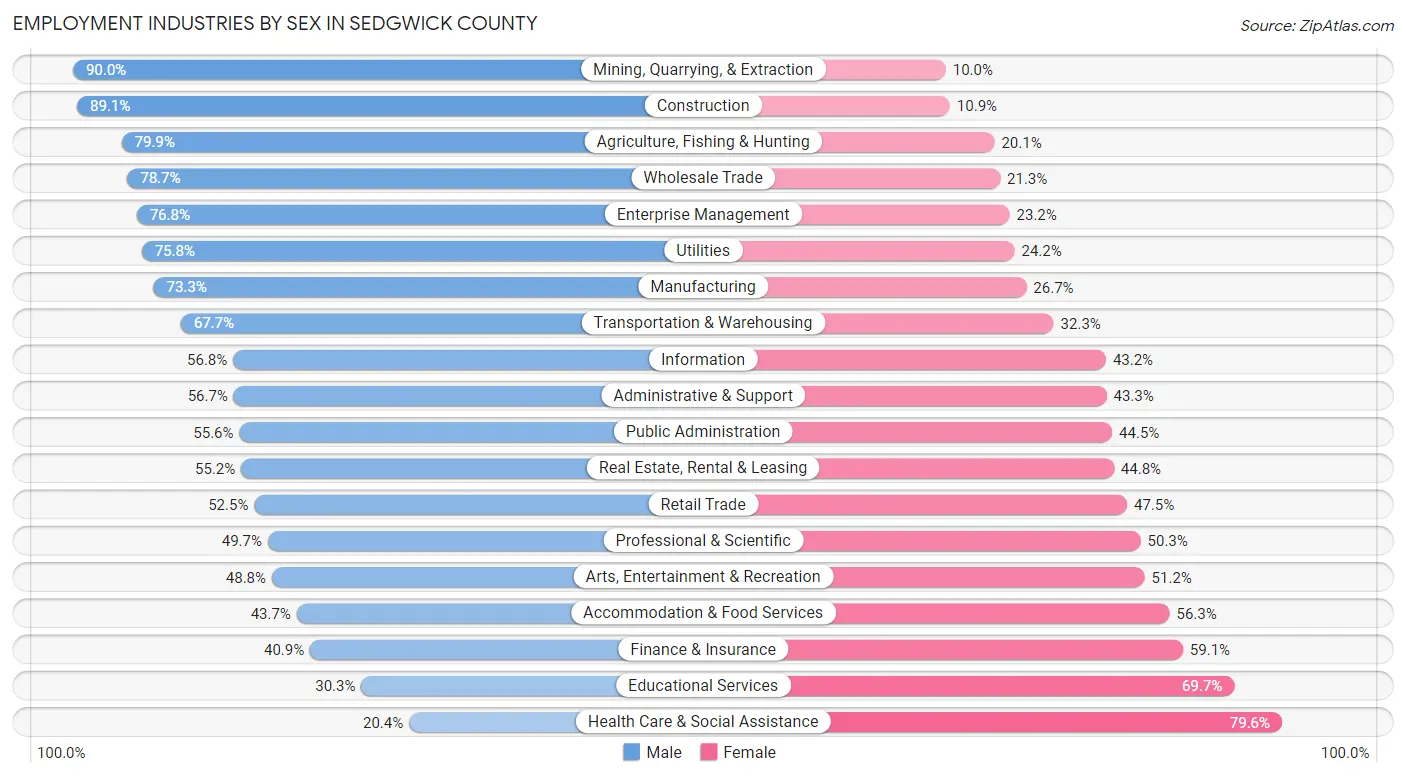
Employment Industries by Sex in Sedgwick County
The Sedgwick County industries that see more men than women are Mining, Quarrying, & Extraction (90.0%), Construction (89.1%), and Agriculture, Fishing & Hunting (79.9%), whereas the industries that tend to have a higher number of women are Health Care & Social Assistance (79.6%), Educational Services (69.7%), and Finance & Insurance (59.1%).
| Industry | Male | Female |
| Agriculture, Fishing & Hunting | 1,221 (79.9%) | 307 (20.1%) |
| Mining, Quarrying, & Extraction | 647 (90.0%) | 72 (10.0%) |
| Construction | 15,194 (89.1%) | 1,852 (10.9%) |
| Manufacturing | 32,200 (73.3%) | 11,729 (26.7%) |
| Wholesale Trade | 4,782 (78.7%) | 1,291 (21.3%) |
| Retail Trade | 14,667 (52.5%) | 13,288 (47.5%) |
| Transportation & Warehousing | 6,615 (67.7%) | 3,162 (32.3%) |
| Utilities | 844 (75.8%) | 270 (24.2%) |
| Information | 1,832 (56.8%) | 1,391 (43.2%) |
| Finance & Insurance | 3,484 (40.9%) | 5,032 (59.1%) |
| Real Estate, Rental & Leasing | 2,338 (55.2%) | 1,898 (44.8%) |
| Professional & Scientific | 6,895 (49.7%) | 6,990 (50.3%) |
| Enterprise Management | 486 (76.8%) | 147 (23.2%) |
| Administrative & Support | 5,522 (56.7%) | 4,214 (43.3%) |
| Educational Services | 7,050 (30.3%) | 16,210 (69.7%) |
| Health Care & Social Assistance | 7,305 (20.4%) | 28,445 (79.6%) |
| Arts, Entertainment & Recreation | 2,086 (48.8%) | 2,187 (51.2%) |
| Accommodation & Food Services | 8,212 (43.7%) | 10,587 (56.3%) |
| Public Administration | 4,979 (55.5%) | 3,984 (44.5%) |
| Total | 131,885 (52.5%) | 119,247 (47.5%) |
Education in Sedgwick County
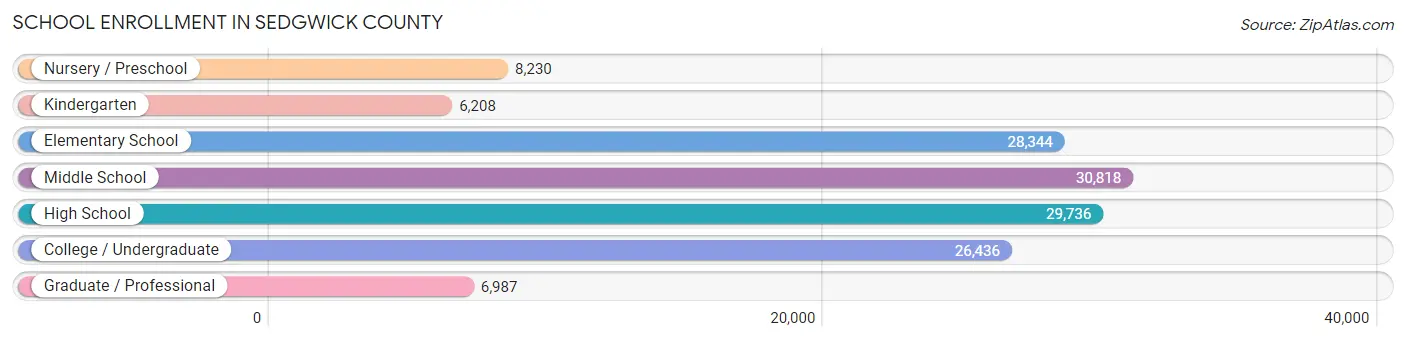
School Enrollment in Sedgwick County
The most common levels of schooling among the 136,759 students in Sedgwick County are middle school (30,818 | 22.5%), high school (29,736 | 21.7%), and elementary school (28,344 | 20.7%).
| School Level | # Students | % Students |
| Nursery / Preschool | 8,230 | 6.0% |
| Kindergarten | 6,208 | 4.5% |
| Elementary School | 28,344 | 20.7% |
| Middle School | 30,818 | 22.5% |
| High School | 29,736 | 21.7% |
| College / Undergraduate | 26,436 | 19.3% |
| Graduate / Professional | 6,987 | 5.1% |
| Total | 136,759 | 100.0% |
School Enrollment by Age by Funding Source in Sedgwick County
Out of a total of 136,759 students who are enrolled in schools in Sedgwick County, 22,428 (16.4%) attend a private institution, while the remaining 114,331 (83.6%) are enrolled in public schools. The age group of 3 to 4 year olds has the highest likelihood of being enrolled in private schools, with 2,144 (38.7% in the age bracket) enrolled. Conversely, the age group of 25 to 34 year olds has the lowest likelihood of being enrolled in a private school, with 8,208 (86.8% in the age bracket) attending a public institution.
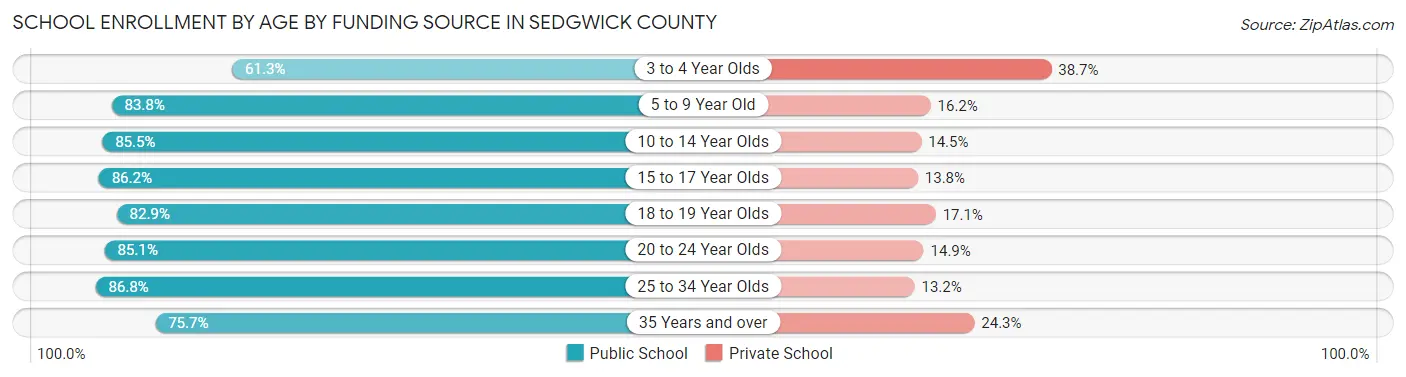
| Age Bracket | Public School | Private School |
| 3 to 4 Year Olds | 3,401 (61.3%) | 2,144 (38.7%) |
| 5 to 9 Year Old | 28,069 (83.8%) | 5,424 (16.2%) |
| 10 to 14 Year Olds | 32,611 (85.5%) | 5,513 (14.5%) |
| 15 to 17 Year Olds | 18,618 (86.2%) | 2,985 (13.8%) |
| 18 to 19 Year Olds | 7,091 (82.9%) | 1,467 (17.1%) |
| 20 to 24 Year Olds | 10,791 (85.1%) | 1,888 (14.9%) |
| 25 to 34 Year Olds | 8,208 (86.8%) | 1,248 (13.2%) |
| 35 Years and over | 5,524 (75.7%) | 1,777 (24.3%) |
| Total | 114,331 (83.6%) | 22,428 (16.4%) |
Educational Attainment by Field of Study in Sedgwick County
Business (27,572 | 23.4%), education (17,074 | 14.5%), science & technology (13,525 | 11.5%), engineering (8,550 | 7.2%), and arts & humanities (8,134 | 6.9%) are the most common fields of study among 118,060 individuals in Sedgwick County who have obtained a bachelor's degree or higher.
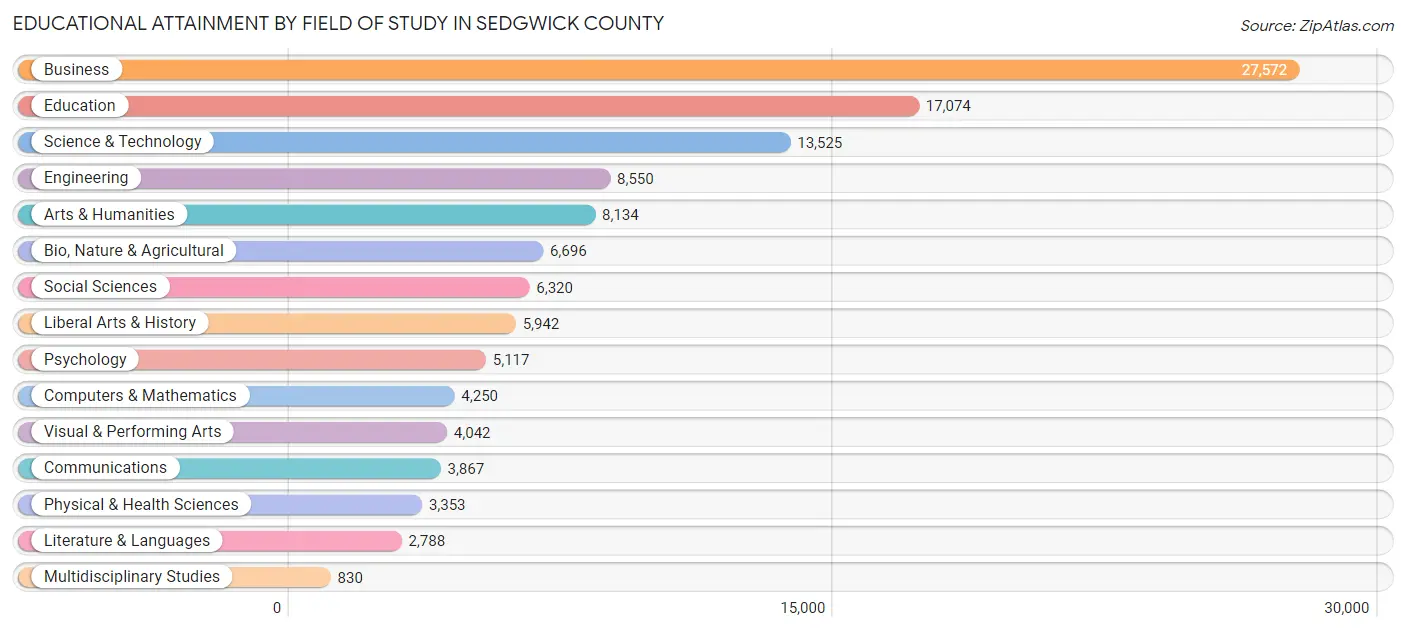
| Field of Study | # Graduates | % Graduates |
| Computers & Mathematics | 4,250 | 3.6% |
| Bio, Nature & Agricultural | 6,696 | 5.7% |
| Physical & Health Sciences | 3,353 | 2.8% |
| Psychology | 5,117 | 4.3% |
| Social Sciences | 6,320 | 5.3% |
| Engineering | 8,550 | 7.2% |
| Multidisciplinary Studies | 830 | 0.7% |
| Science & Technology | 13,525 | 11.5% |
| Business | 27,572 | 23.4% |
| Education | 17,074 | 14.5% |
| Literature & Languages | 2,788 | 2.4% |
| Liberal Arts & History | 5,942 | 5.0% |
| Visual & Performing Arts | 4,042 | 3.4% |
| Communications | 3,867 | 3.3% |
| Arts & Humanities | 8,134 | 6.9% |
| Total | 118,060 | 100.0% |
Transportation & Commute in Sedgwick County
Vehicle Availability by Sex in Sedgwick County
The most prevalent vehicle ownership categories in Sedgwick County are males with 2 vehicles (53,426, accounting for 40.5%) and females with 2 vehicles (45,603, making up 45.6%).
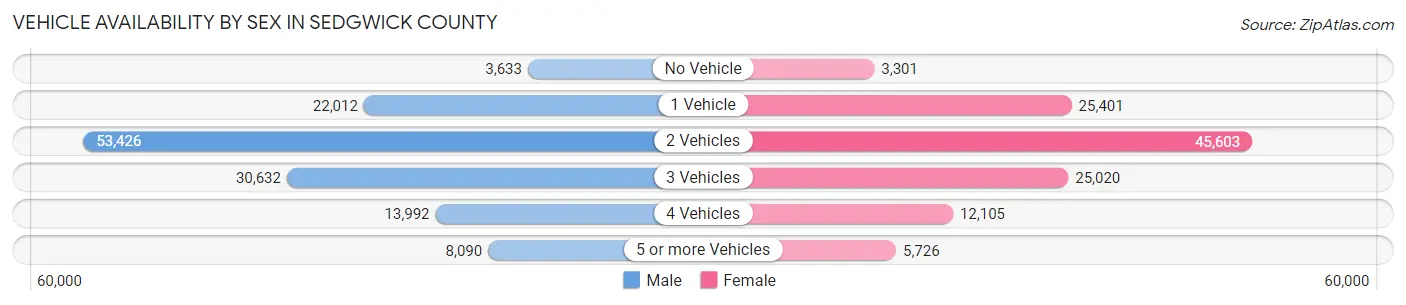
| Vehicles Available | Male | Female |
| No Vehicle | 3,633 (2.8%) | 3,301 (2.8%) |
| 1 Vehicle | 22,012 (16.7%) | 25,401 (21.7%) |
| 2 Vehicles | 53,426 (40.5%) | 45,603 (38.9%) |
| 3 Vehicles | 30,632 (23.2%) | 25,020 (21.4%) |
| 4 Vehicles | 13,992 (10.6%) | 12,105 (10.3%) |
| 5 or more Vehicles | 8,090 (6.1%) | 5,726 (4.9%) |
| Total | 131,785 (100.0%) | 117,156 (100.0%) |
Commute Time in Sedgwick County
The most frequently occuring commute durations in Sedgwick County are 15 to 19 minutes (55,573 commuters, 23.7%), 20 to 24 minutes (48,669 commuters, 20.8%), and 10 to 14 minutes (41,189 commuters, 17.6%).
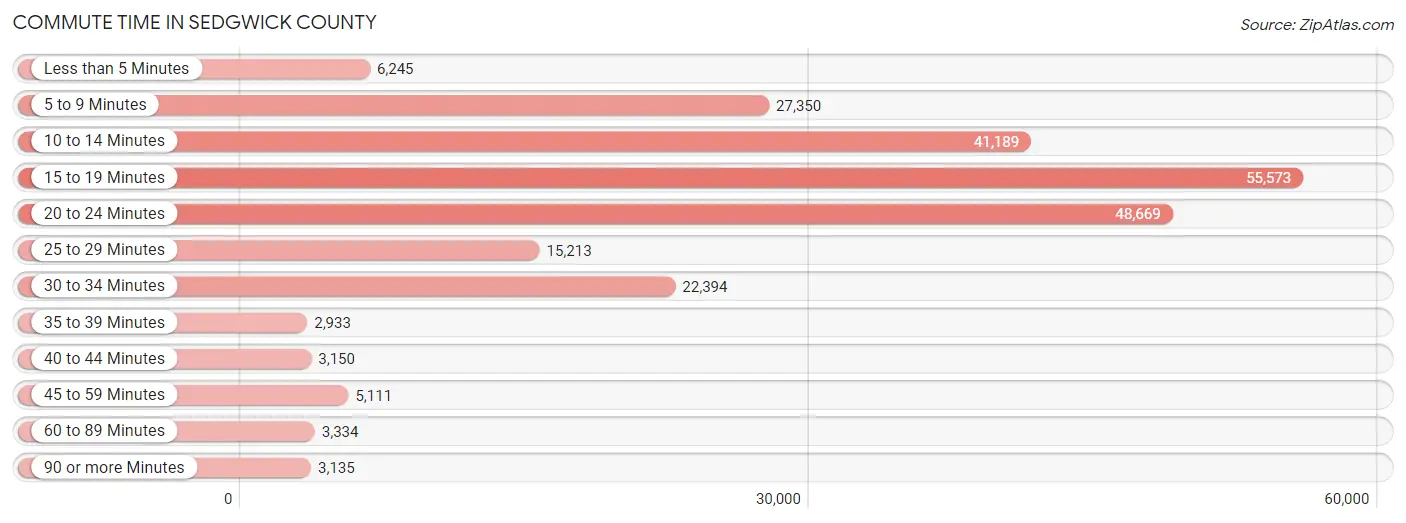
| Commute Time | # Commuters | % Commuters |
| Less than 5 Minutes | 6,245 | 2.7% |
| 5 to 9 Minutes | 27,350 | 11.7% |
| 10 to 14 Minutes | 41,189 | 17.6% |
| 15 to 19 Minutes | 55,573 | 23.7% |
| 20 to 24 Minutes | 48,669 | 20.8% |
| 25 to 29 Minutes | 15,213 | 6.5% |
| 30 to 34 Minutes | 22,394 | 9.6% |
| 35 to 39 Minutes | 2,933 | 1.3% |
| 40 to 44 Minutes | 3,150 | 1.3% |
| 45 to 59 Minutes | 5,111 | 2.2% |
| 60 to 89 Minutes | 3,334 | 1.4% |
| 90 or more Minutes | 3,135 | 1.3% |
Commute Time by Sex in Sedgwick County
The most common commute times in Sedgwick County are 15 to 19 minutes (29,583 commuters, 23.5%) for males and 15 to 19 minutes (25,990 commuters, 24.0%) for females.
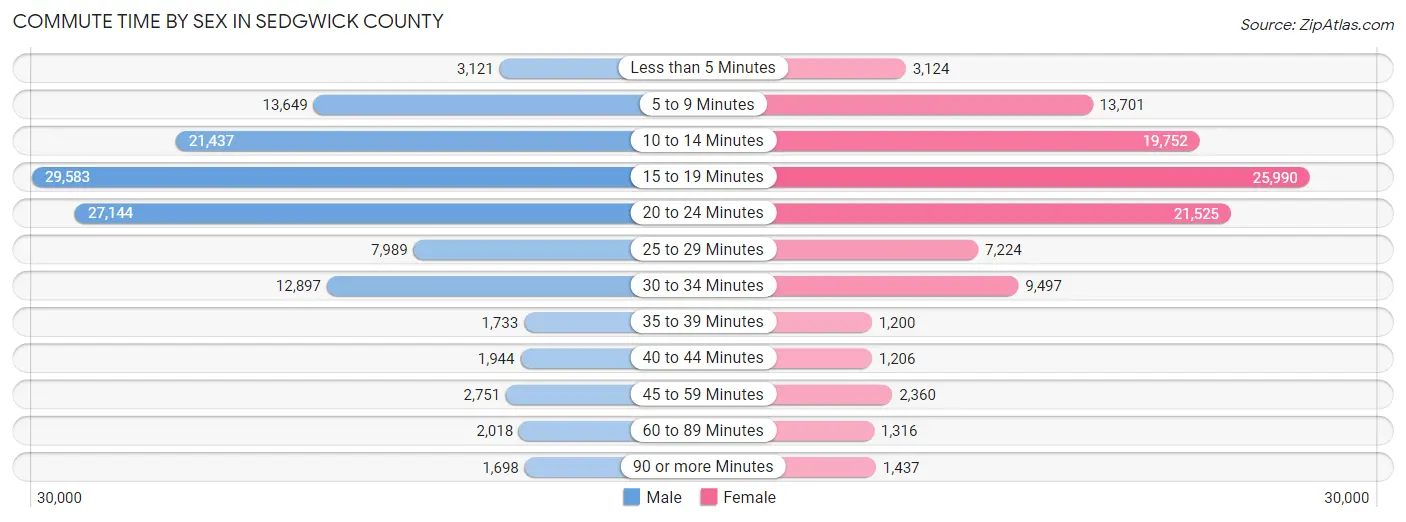
| Commute Time | Male | Female |
| Less than 5 Minutes | 3,121 (2.5%) | 3,124 (2.9%) |
| 5 to 9 Minutes | 13,649 (10.8%) | 13,701 (12.7%) |
| 10 to 14 Minutes | 21,437 (17.0%) | 19,752 (18.2%) |
| 15 to 19 Minutes | 29,583 (23.5%) | 25,990 (24.0%) |
| 20 to 24 Minutes | 27,144 (21.5%) | 21,525 (19.9%) |
| 25 to 29 Minutes | 7,989 (6.3%) | 7,224 (6.7%) |
| 30 to 34 Minutes | 12,897 (10.2%) | 9,497 (8.8%) |
| 35 to 39 Minutes | 1,733 (1.4%) | 1,200 (1.1%) |
| 40 to 44 Minutes | 1,944 (1.5%) | 1,206 (1.1%) |
| 45 to 59 Minutes | 2,751 (2.2%) | 2,360 (2.2%) |
| 60 to 89 Minutes | 2,018 (1.6%) | 1,316 (1.2%) |
| 90 or more Minutes | 1,698 (1.3%) | 1,437 (1.3%) |
Time of Departure to Work by Sex in Sedgwick County
The most frequent times of departure to work in Sedgwick County are 7:30 AM to 7:59 AM (17,467, 13.9%) for males and 7:30 AM to 7:59 AM (18,704, 17.3%) for females.
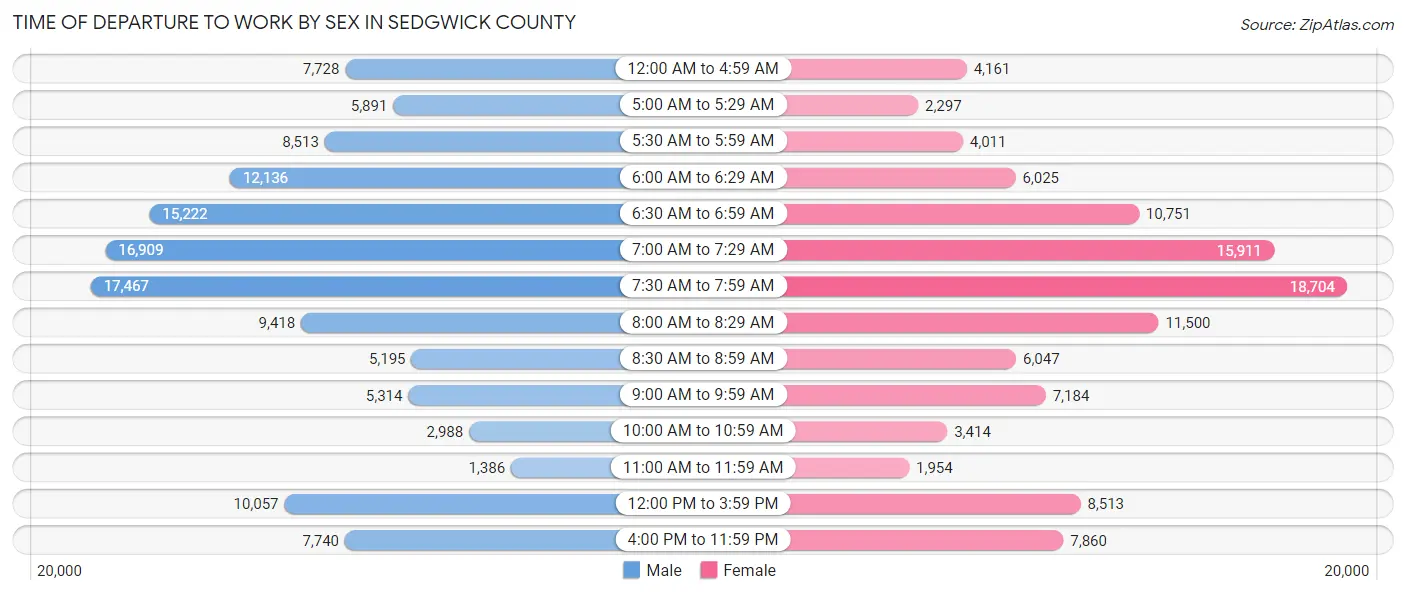
| Time of Departure | Male | Female |
| 12:00 AM to 4:59 AM | 7,728 (6.1%) | 4,161 (3.8%) |
| 5:00 AM to 5:29 AM | 5,891 (4.7%) | 2,297 (2.1%) |
| 5:30 AM to 5:59 AM | 8,513 (6.8%) | 4,011 (3.7%) |
| 6:00 AM to 6:29 AM | 12,136 (9.6%) | 6,025 (5.6%) |
| 6:30 AM to 6:59 AM | 15,222 (12.1%) | 10,751 (9.9%) |
| 7:00 AM to 7:29 AM | 16,909 (13.4%) | 15,911 (14.7%) |
| 7:30 AM to 7:59 AM | 17,467 (13.9%) | 18,704 (17.3%) |
| 8:00 AM to 8:29 AM | 9,418 (7.5%) | 11,500 (10.6%) |
| 8:30 AM to 8:59 AM | 5,195 (4.1%) | 6,047 (5.6%) |
| 9:00 AM to 9:59 AM | 5,314 (4.2%) | 7,184 (6.6%) |
| 10:00 AM to 10:59 AM | 2,988 (2.4%) | 3,414 (3.2%) |
| 11:00 AM to 11:59 AM | 1,386 (1.1%) | 1,954 (1.8%) |
| 12:00 PM to 3:59 PM | 10,057 (8.0%) | 8,513 (7.9%) |
| 4:00 PM to 11:59 PM | 7,740 (6.1%) | 7,860 (7.3%) |
| Total | 125,964 (100.0%) | 108,332 (100.0%) |
Housing Occupancy in Sedgwick County
Occupancy by Ownership in Sedgwick County
Of the total 202,485 dwellings in Sedgwick County, owner-occupied units account for 126,637 (62.5%), while renter-occupied units make up 75,848 (37.5%).
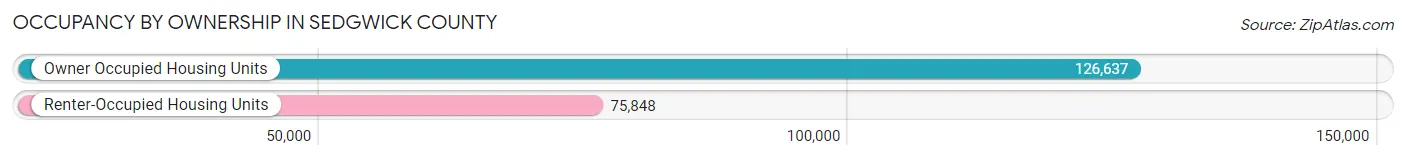
| Occupancy | # Housing Units | % Housing Units |
| Owner Occupied Housing Units | 126,637 | 62.5% |
| Renter-Occupied Housing Units | 75,848 | 37.5% |
| Total Occupied Housing Units | 202,485 | 100.0% |
Occupancy by Household Size in Sedgwick County
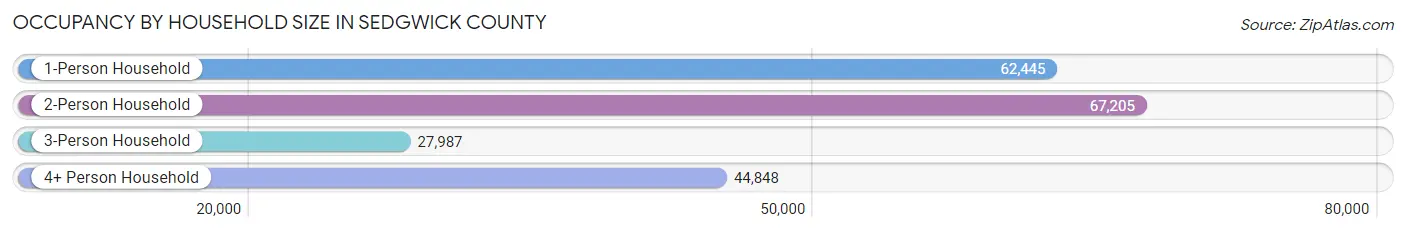
| Household Size | # Housing Units | % Housing Units |
| 1-Person Household | 62,445 | 30.8% |
| 2-Person Household | 67,205 | 33.2% |
| 3-Person Household | 27,987 | 13.8% |
| 4+ Person Household | 44,848 | 22.2% |
| Total Housing Units | 202,485 | 100.0% |
Occupancy by Ownership by Household Size in Sedgwick County
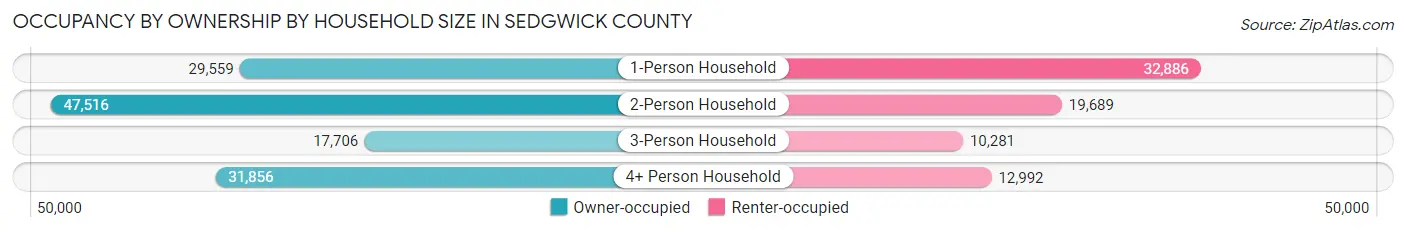
| Household Size | Owner-occupied | Renter-occupied |
| 1-Person Household | 29,559 (47.3%) | 32,886 (52.7%) |
| 2-Person Household | 47,516 (70.7%) | 19,689 (29.3%) |
| 3-Person Household | 17,706 (63.3%) | 10,281 (36.7%) |
| 4+ Person Household | 31,856 (71.0%) | 12,992 (29.0%) |
| Total Housing Units | 126,637 (62.5%) | 75,848 (37.5%) |
Occupancy by Educational Attainment in Sedgwick County
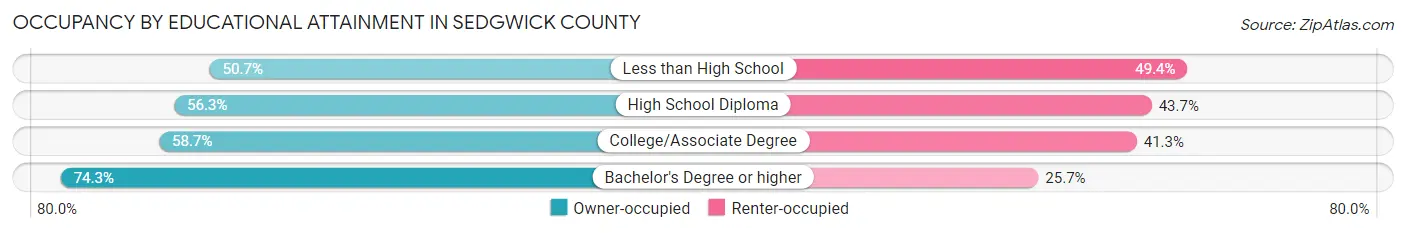
| Household Size | Owner-occupied | Renter-occupied |
| Less than High School | 8,945 (50.6%) | 8,714 (49.3%) |
| High School Diploma | 27,004 (56.3%) | 20,973 (43.7%) |
| College/Associate Degree | 41,151 (58.7%) | 28,997 (41.3%) |
| Bachelor's Degree or higher | 49,537 (74.3%) | 17,164 (25.7%) |
Occupancy by Age of Householder in Sedgwick County
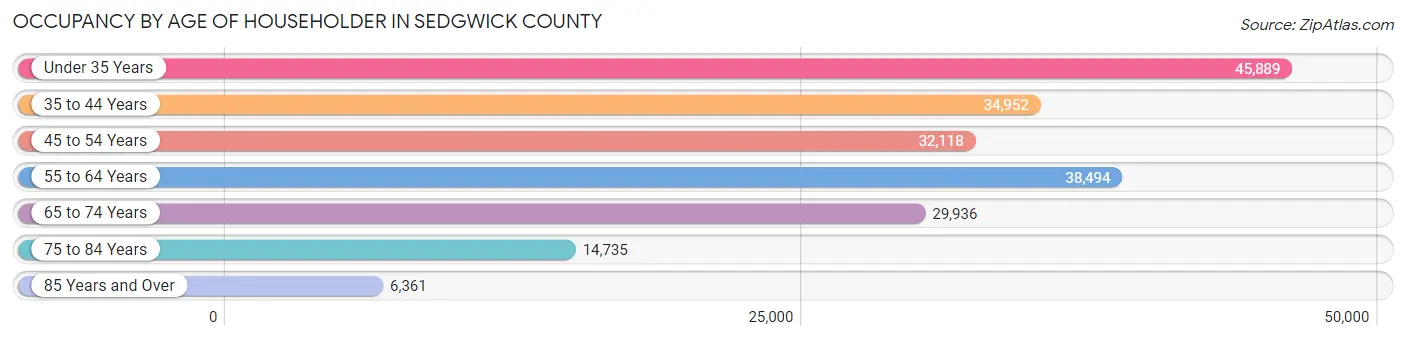
| Age Bracket | # Households | % Households |
| Under 35 Years | 45,889 | 22.7% |
| 35 to 44 Years | 34,952 | 17.3% |
| 45 to 54 Years | 32,118 | 15.9% |
| 55 to 64 Years | 38,494 | 19.0% |
| 65 to 74 Years | 29,936 | 14.8% |
| 75 to 84 Years | 14,735 | 7.3% |
| 85 Years and Over | 6,361 | 3.1% |
| Total | 202,485 | 100.0% |
Housing Finances in Sedgwick County
Median Income by Occupancy in Sedgwick County
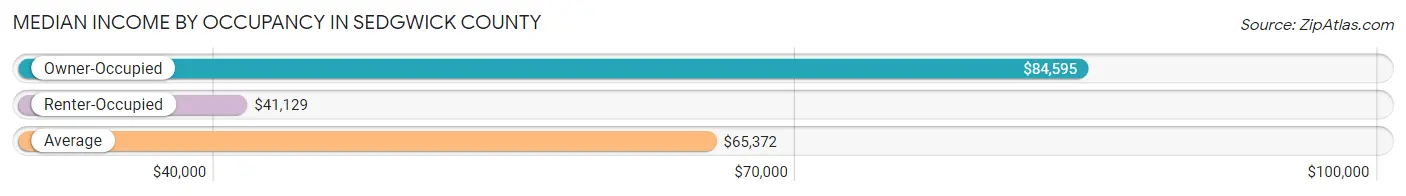
| Occupancy Type | # Households | Median Income |
| Owner-Occupied | 126,637 (62.5%) | $84,595 |
| Renter-Occupied | 75,848 (37.5%) | $41,129 |
| Average | 202,485 (100.0%) | $65,372 |
Occupancy by Householder Income Bracket in Sedgwick County
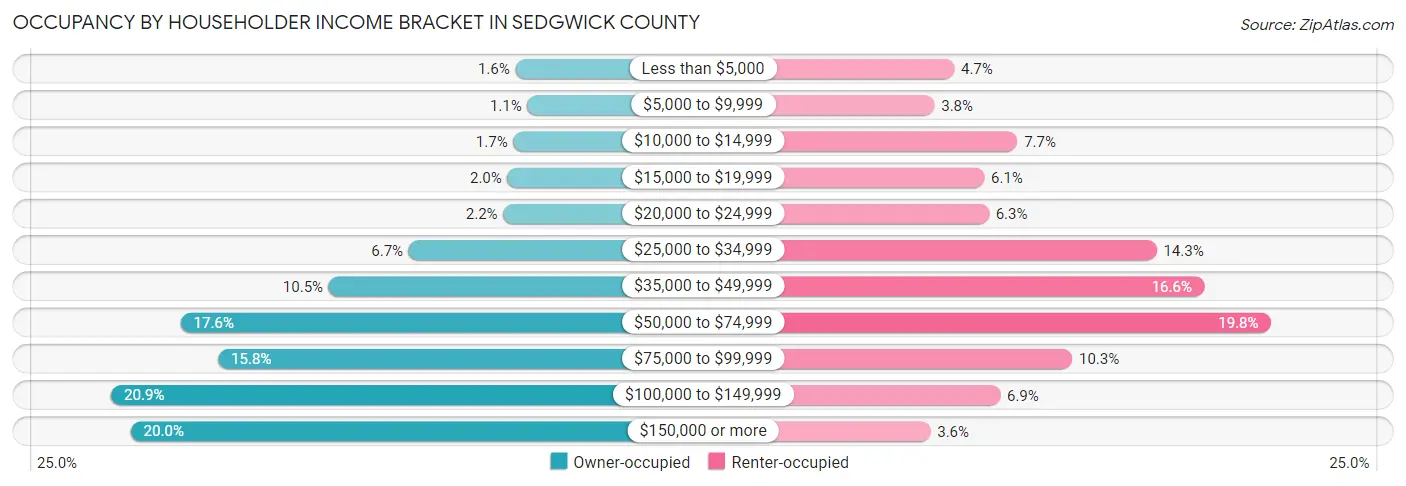
| Income Bracket | Owner-occupied | Renter-occupied |
| Less than $5,000 | 2,053 (1.6%) | 3,556 (4.7%) |
| $5,000 to $9,999 | 1,336 (1.1%) | 2,843 (3.7%) |
| $10,000 to $14,999 | 2,182 (1.7%) | 5,839 (7.7%) |
| $15,000 to $19,999 | 2,537 (2.0%) | 4,641 (6.1%) |
| $20,000 to $24,999 | 2,782 (2.2%) | 4,807 (6.3%) |
| $25,000 to $34,999 | 8,488 (6.7%) | 10,867 (14.3%) |
| $35,000 to $49,999 | 13,314 (10.5%) | 12,577 (16.6%) |
| $50,000 to $74,999 | 22,245 (17.6%) | 14,978 (19.8%) |
| $75,000 to $99,999 | 19,996 (15.8%) | 7,819 (10.3%) |
| $100,000 to $149,999 | 26,442 (20.9%) | 5,222 (6.9%) |
| $150,000 or more | 25,262 (20.0%) | 2,699 (3.6%) |
| Total | 126,637 (100.0%) | 75,848 (100.0%) |
Monthly Housing Cost Tiers in Sedgwick County
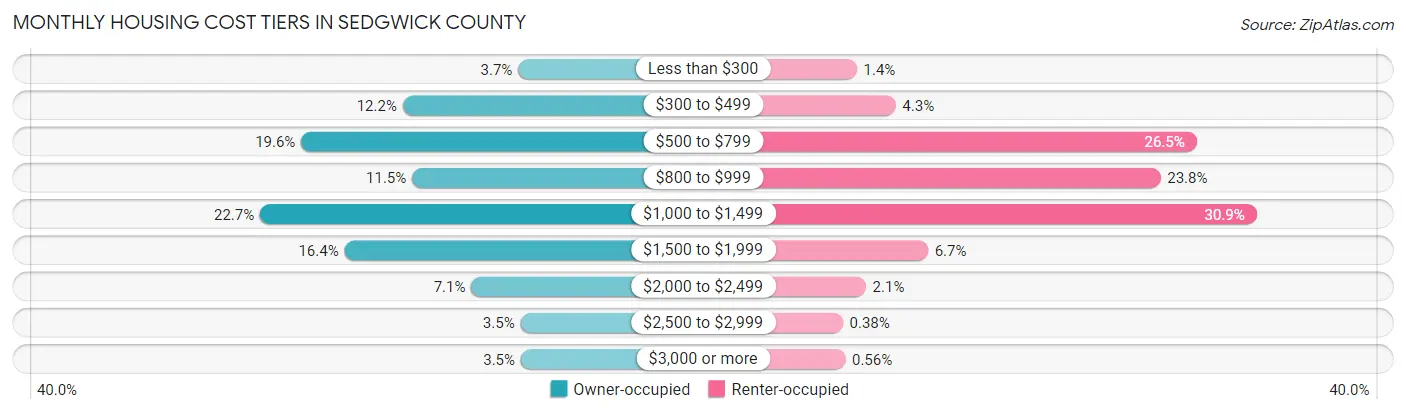
| Monthly Cost | Owner-occupied | Renter-occupied |
| Less than $300 | 4,617 (3.6%) | 1,072 (1.4%) |
| $300 to $499 | 15,386 (12.1%) | 3,235 (4.3%) |
| $500 to $799 | 24,854 (19.6%) | 20,062 (26.5%) |
| $800 to $999 | 14,509 (11.5%) | 18,036 (23.8%) |
| $1,000 to $1,499 | 28,697 (22.7%) | 23,417 (30.9%) |
| $1,500 to $1,999 | 20,816 (16.4%) | 5,046 (6.7%) |
| $2,000 to $2,499 | 8,991 (7.1%) | 1,580 (2.1%) |
| $2,500 to $2,999 | 4,403 (3.5%) | 291 (0.4%) |
| $3,000 or more | 4,364 (3.5%) | 422 (0.6%) |
| Total | 126,637 (100.0%) | 75,848 (100.0%) |
Physical Housing Characteristics in Sedgwick County
Housing Structures in Sedgwick County
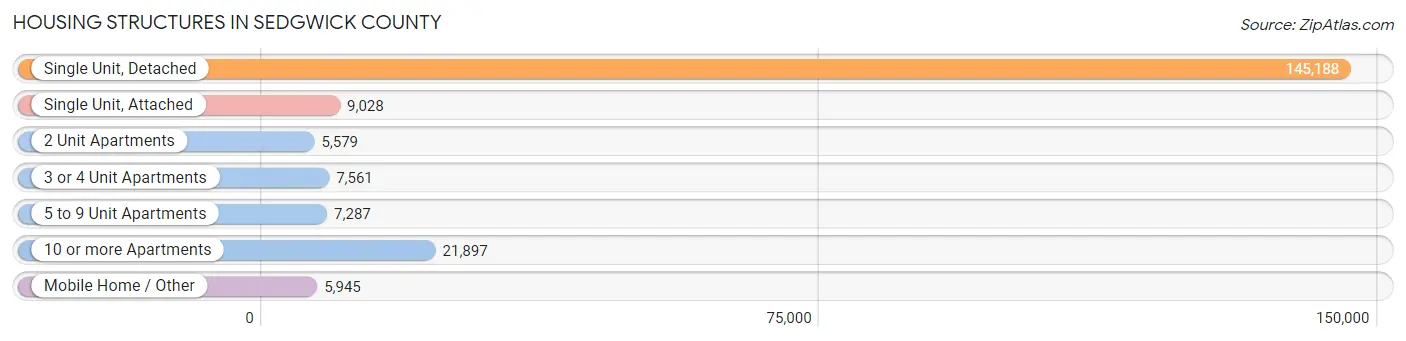
| Structure Type | # Housing Units | % Housing Units |
| Single Unit, Detached | 145,188 | 71.7% |
| Single Unit, Attached | 9,028 | 4.5% |
| 2 Unit Apartments | 5,579 | 2.8% |
| 3 or 4 Unit Apartments | 7,561 | 3.7% |
| 5 to 9 Unit Apartments | 7,287 | 3.6% |
| 10 or more Apartments | 21,897 | 10.8% |
| Mobile Home / Other | 5,945 | 2.9% |
| Total | 202,485 | 100.0% |
Housing Structures by Occupancy in Sedgwick County
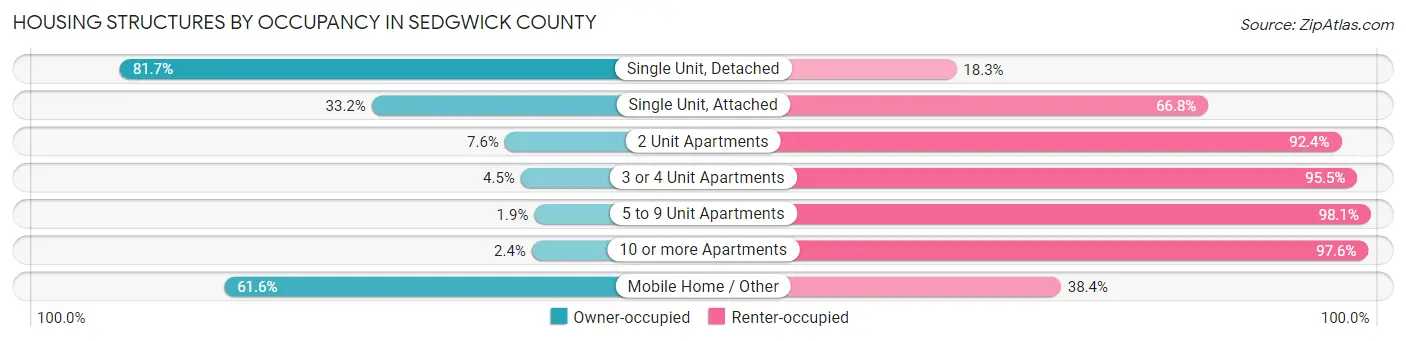
| Structure Type | Owner-occupied | Renter-occupied |
| Single Unit, Detached | 118,565 (81.7%) | 26,623 (18.3%) |
| Single Unit, Attached | 2,996 (33.2%) | 6,032 (66.8%) |
| 2 Unit Apartments | 422 (7.6%) | 5,157 (92.4%) |
| 3 or 4 Unit Apartments | 339 (4.5%) | 7,222 (95.5%) |
| 5 to 9 Unit Apartments | 137 (1.9%) | 7,150 (98.1%) |
| 10 or more Apartments | 518 (2.4%) | 21,379 (97.6%) |
| Mobile Home / Other | 3,660 (61.6%) | 2,285 (38.4%) |
| Total | 126,637 (62.5%) | 75,848 (37.5%) |
Housing Structures by Number of Rooms in Sedgwick County
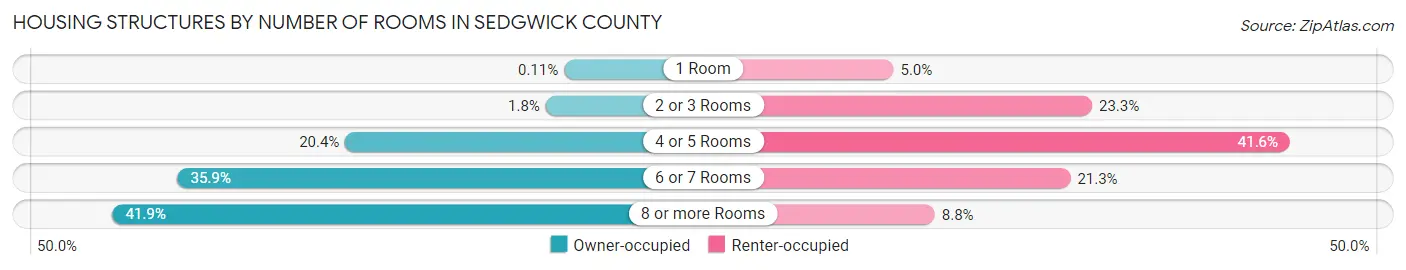
| Number of Rooms | Owner-occupied | Renter-occupied |
| 1 Room | 142 (0.1%) | 3,764 (5.0%) |
| 2 or 3 Rooms | 2,294 (1.8%) | 17,689 (23.3%) |
| 4 or 5 Rooms | 25,775 (20.3%) | 31,563 (41.6%) |
| 6 or 7 Rooms | 45,405 (35.8%) | 16,172 (21.3%) |
| 8 or more Rooms | 53,021 (41.9%) | 6,660 (8.8%) |
| Total | 126,637 (100.0%) | 75,848 (100.0%) |
Housing Structure by Heating Type in Sedgwick County
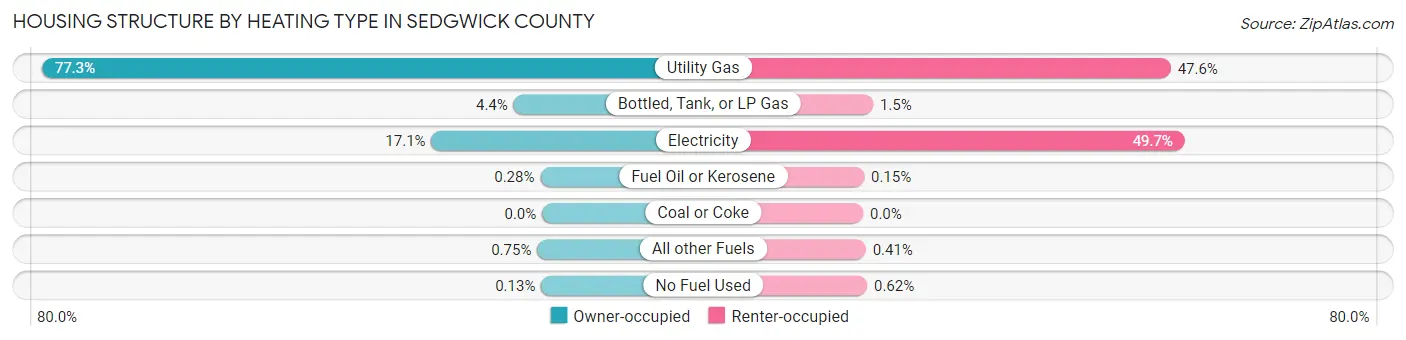
| Heating Type | Owner-occupied | Renter-occupied |
| Utility Gas | 97,938 (77.3%) | 36,074 (47.6%) |
| Bottled, Tank, or LP Gas | 5,570 (4.4%) | 1,163 (1.5%) |
| Electricity | 21,668 (17.1%) | 37,715 (49.7%) |
| Fuel Oil or Kerosene | 350 (0.3%) | 117 (0.2%) |
| Coal or Coke | 0 (0.0%) | 0 (0.0%) |
| All other Fuels | 944 (0.7%) | 310 (0.4%) |
| No Fuel Used | 167 (0.1%) | 469 (0.6%) |
| Total | 126,637 (100.0%) | 75,848 (100.0%) |
Household Vehicle Usage in Sedgwick County
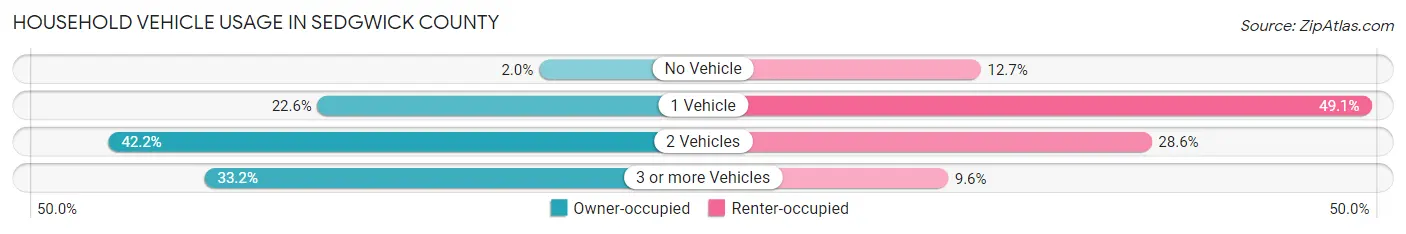
| Vehicles per Household | Owner-occupied | Renter-occupied |
| No Vehicle | 2,509 (2.0%) | 9,601 (12.7%) |
| 1 Vehicle | 28,674 (22.6%) | 37,270 (49.1%) |
| 2 Vehicles | 53,406 (42.2%) | 21,699 (28.6%) |
| 3 or more Vehicles | 42,048 (33.2%) | 7,278 (9.6%) |
| Total | 126,637 (100.0%) | 75,848 (100.0%) |
Real Estate & Mortgages in Sedgwick County
Real Estate and Mortgage Overview in Sedgwick County
| Characteristic | Without Mortgage | With Mortgage |
| Housing Units | 48,665 | 77,972 |
| Median Property Value | $158,900 | $185,300 |
| Median Household Income | $65,697 | $18,332 |
| Monthly Housing Costs | $568 | $4,240 |
| Real Estate Taxes | $2,024 | $1,422 |
Property Value by Mortgage Status in Sedgwick County
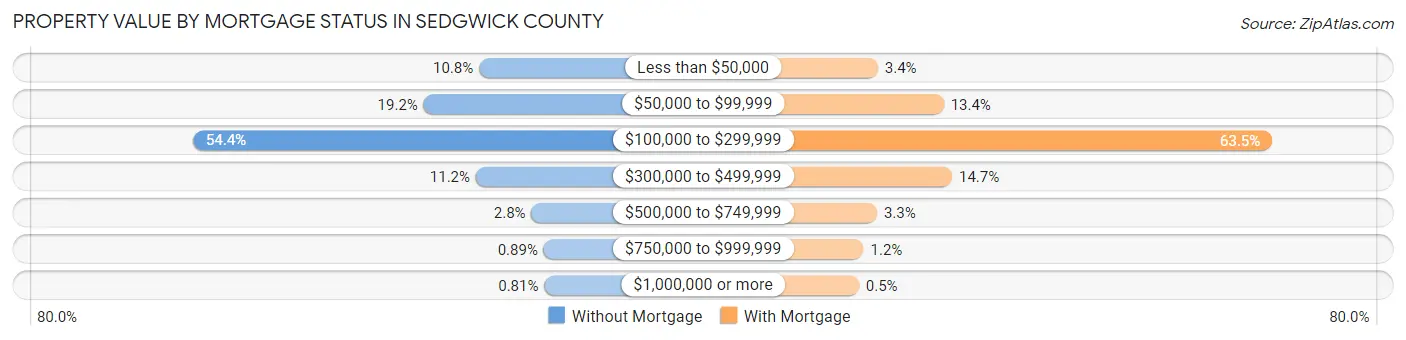
| Property Value | Without Mortgage | With Mortgage |
| Less than $50,000 | 5,233 (10.7%) | 2,651 (3.4%) |
| $50,000 to $99,999 | 9,337 (19.2%) | 10,472 (13.4%) |
| $100,000 to $299,999 | 26,448 (54.3%) | 49,488 (63.5%) |
| $300,000 to $499,999 | 5,470 (11.2%) | 11,466 (14.7%) |
| $500,000 to $749,999 | 1,348 (2.8%) | 2,552 (3.3%) |
| $750,000 to $999,999 | 434 (0.9%) | 956 (1.2%) |
| $1,000,000 or more | 395 (0.8%) | 387 (0.5%) |
| Total | 48,665 (100.0%) | 77,972 (100.0%) |
Household Income by Mortgage Status in Sedgwick County
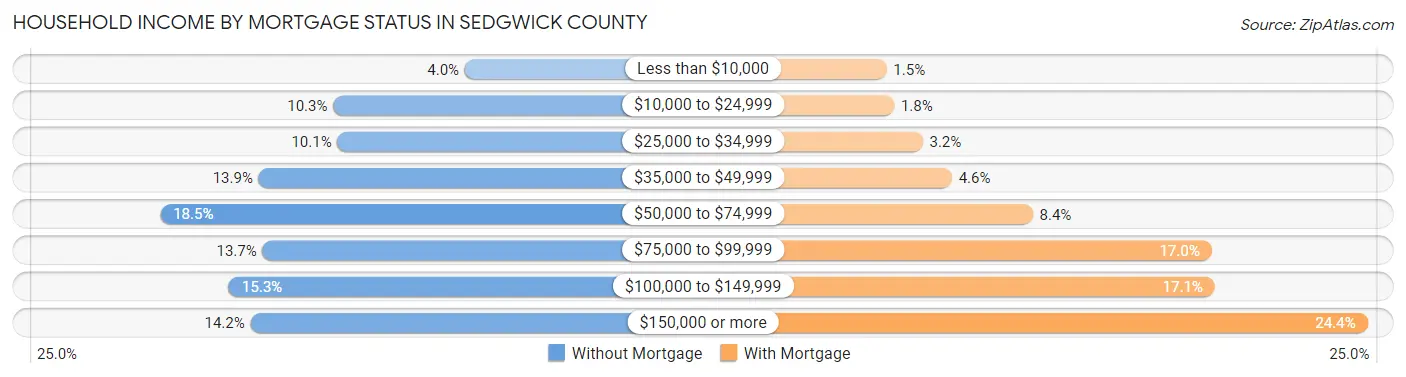
| Household Income | Without Mortgage | With Mortgage |
| Less than $10,000 | 1,960 (4.0%) | 1,148 (1.5%) |
| $10,000 to $24,999 | 5,014 (10.3%) | 1,429 (1.8%) |
| $25,000 to $34,999 | 4,913 (10.1%) | 2,487 (3.2%) |
| $35,000 to $49,999 | 6,742 (13.9%) | 3,575 (4.6%) |
| $50,000 to $74,999 | 9,023 (18.5%) | 6,572 (8.4%) |
| $75,000 to $99,999 | 6,652 (13.7%) | 13,222 (17.0%) |
| $100,000 to $149,999 | 7,431 (15.3%) | 13,344 (17.1%) |
| $150,000 or more | 6,930 (14.2%) | 19,011 (24.4%) |
| Total | 48,665 (100.0%) | 77,972 (100.0%) |
Property Value to Household Income Ratio in Sedgwick County
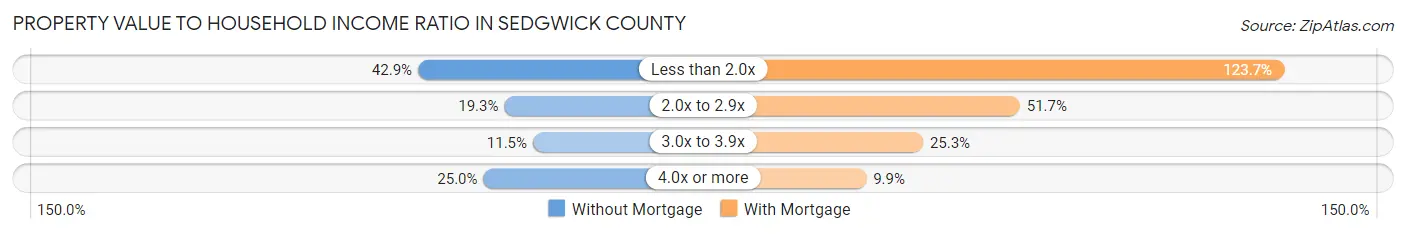
| Value-to-Income Ratio | Without Mortgage | With Mortgage |
| Less than 2.0x | 20,858 (42.9%) | 96,423 (123.7%) |
| 2.0x to 2.9x | 9,404 (19.3%) | 40,332 (51.7%) |
| 3.0x to 3.9x | 5,614 (11.5%) | 19,759 (25.3%) |
| 4.0x or more | 12,183 (25.0%) | 7,703 (9.9%) |
| Total | 48,665 (100.0%) | 77,972 (100.0%) |
Real Estate Taxes by Mortgage Status in Sedgwick County
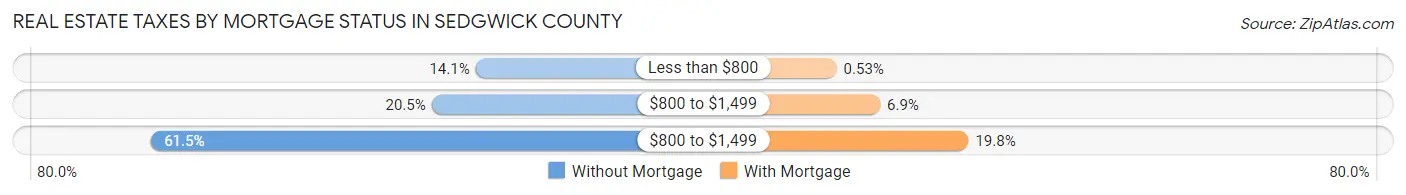
| Property Taxes | Without Mortgage | With Mortgage |
| Less than $800 | 6,870 (14.1%) | 415 (0.5%) |
| $800 to $1,499 | 9,995 (20.5%) | 5,358 (6.9%) |
| $800 to $1,499 | 29,924 (61.5%) | 15,432 (19.8%) |
| Total | 48,665 (100.0%) | 77,972 (100.0%) |
Health & Disability in Sedgwick County
Health Insurance Coverage by Age in Sedgwick County
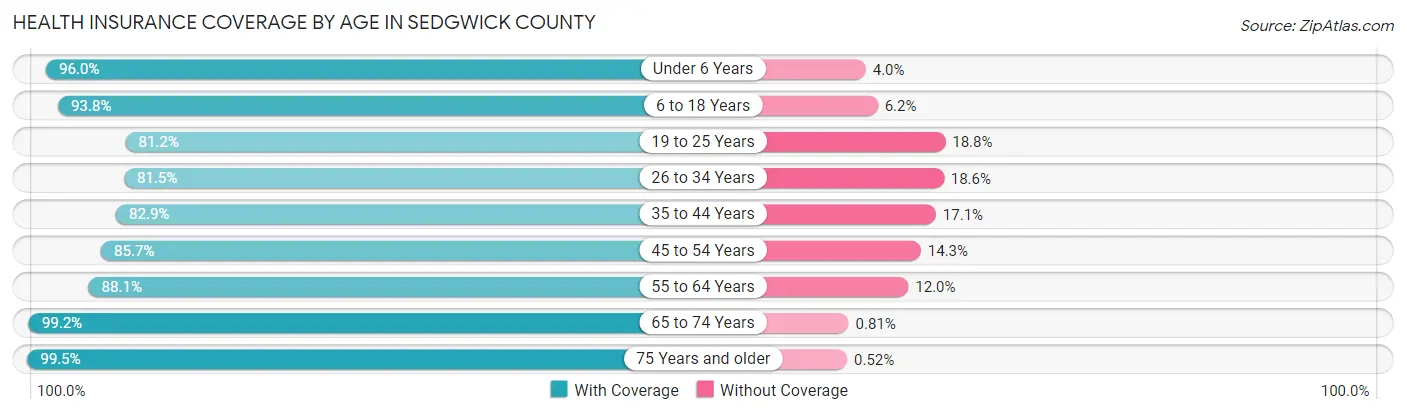
| Age Bracket | With Coverage | Without Coverage |
| Under 6 Years | 38,765 (96.0%) | 1,620 (4.0%) |
| 6 to 18 Years | 91,537 (93.8%) | 6,083 (6.2%) |
| 19 to 25 Years | 41,097 (81.2%) | 9,531 (18.8%) |
| 26 to 34 Years | 51,412 (81.5%) | 11,706 (18.5%) |
| 35 to 44 Years | 53,475 (82.9%) | 11,013 (17.1%) |
| 45 to 54 Years | 49,691 (85.7%) | 8,280 (14.3%) |
| 55 to 64 Years | 56,100 (88.0%) | 7,616 (11.9%) |
| 65 to 74 Years | 46,557 (99.2%) | 380 (0.8%) |
| 75 Years and older | 30,185 (99.5%) | 157 (0.5%) |
| Total | 458,819 (89.1%) | 56,386 (10.9%) |
Health Insurance Coverage by Citizenship Status in Sedgwick County
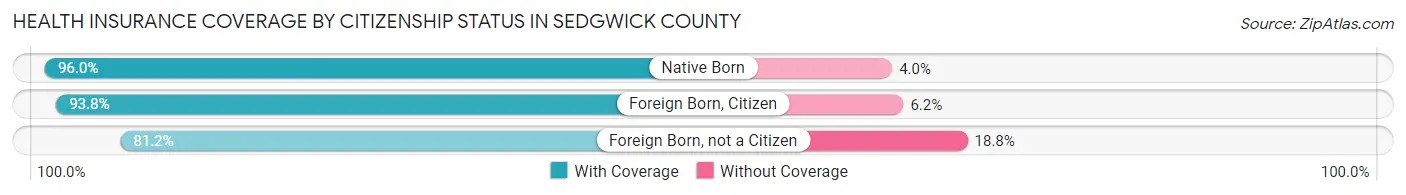
| Citizenship Status | With Coverage | Without Coverage |
| Native Born | 38,765 (96.0%) | 1,620 (4.0%) |
| Foreign Born, Citizen | 91,537 (93.8%) | 6,083 (6.2%) |
| Foreign Born, not a Citizen | 41,097 (81.2%) | 9,531 (18.8%) |
Health Insurance Coverage by Household Income in Sedgwick County
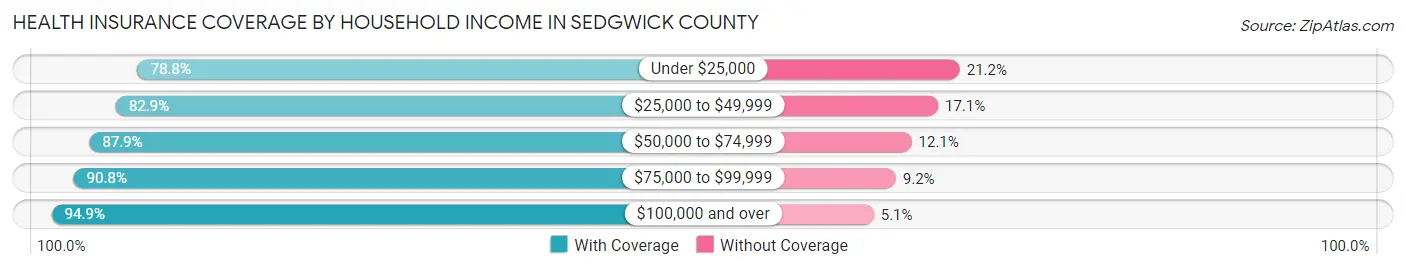
| Household Income | With Coverage | Without Coverage |
| Under $25,000 | 45,682 (78.8%) | 12,269 (21.2%) |
| $25,000 to $49,999 | 76,967 (82.9%) | 15,878 (17.1%) |
| $50,000 to $74,999 | 77,781 (87.9%) | 10,749 (12.1%) |
| $75,000 to $99,999 | 74,168 (90.8%) | 7,509 (9.2%) |
| $100,000 and over | 181,639 (94.9%) | 9,675 (5.1%) |
Public vs Private Health Insurance Coverage by Age in Sedgwick County
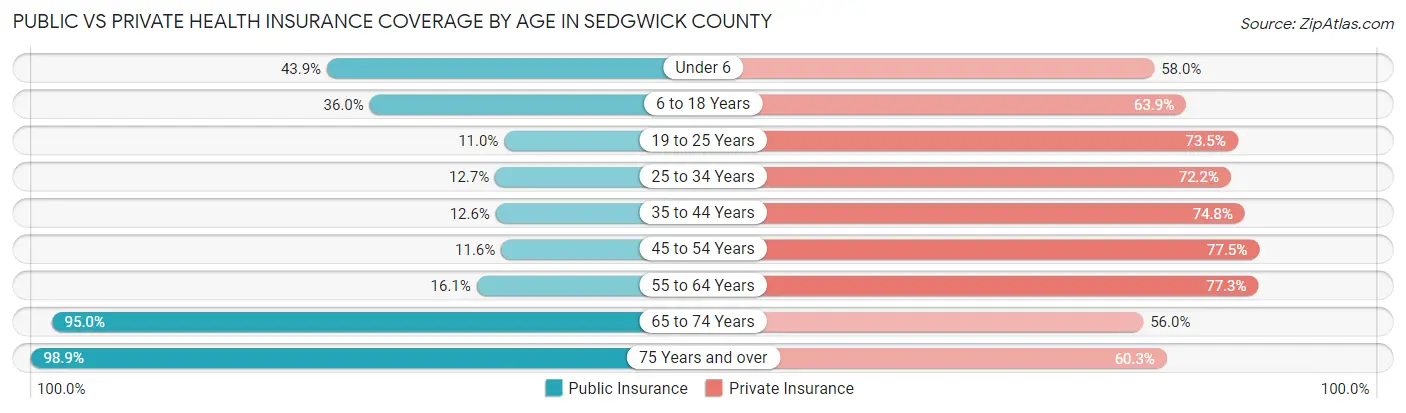
| Age Bracket | Public Insurance | Private Insurance |
| Under 6 | 17,721 (43.9%) | 23,419 (58.0%) |
| 6 to 18 Years | 35,109 (36.0%) | 62,369 (63.9%) |
| 19 to 25 Years | 5,558 (11.0%) | 37,184 (73.5%) |
| 25 to 34 Years | 8,001 (12.7%) | 45,572 (72.2%) |
| 35 to 44 Years | 8,098 (12.6%) | 48,231 (74.8%) |
| 45 to 54 Years | 6,694 (11.6%) | 44,899 (77.4%) |
| 55 to 64 Years | 10,261 (16.1%) | 49,254 (77.3%) |
| 65 to 74 Years | 44,583 (95.0%) | 26,259 (55.9%) |
| 75 Years and over | 30,009 (98.9%) | 18,295 (60.3%) |
| Total | 166,034 (32.2%) | 355,482 (69.0%) |
Disability Status by Sex by Age in Sedgwick County
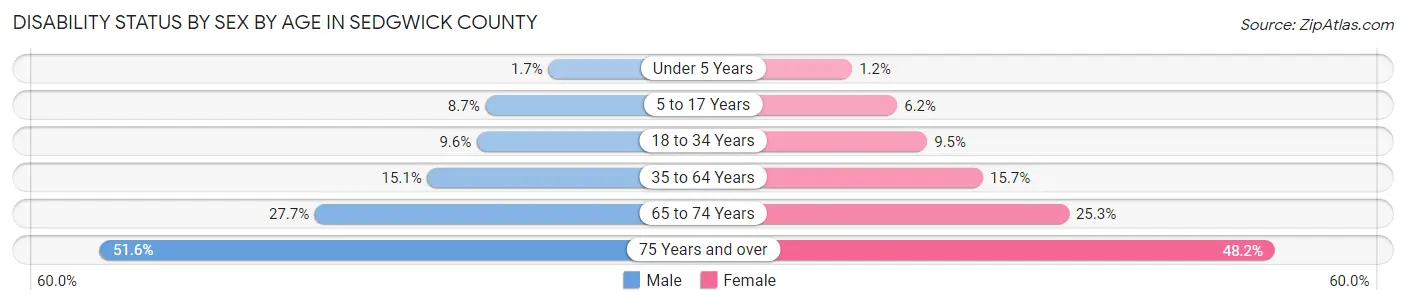
| Age Bracket | Male | Female |
| Under 5 Years | 286 (1.7%) | 192 (1.2%) |
| 5 to 17 Years | 4,309 (8.7%) | 2,945 (6.2%) |
| 18 to 34 Years | 5,802 (9.6%) | 5,721 (9.5%) |
| 35 to 64 Years | 13,971 (15.1%) | 14,753 (15.7%) |
| 65 to 74 Years | 6,219 (27.7%) | 6,186 (25.3%) |
| 75 Years and over | 6,488 (51.6%) | 8,566 (48.2%) |
Disability Class by Sex by Age in Sedgwick County
Disability Class: Hearing Difficulty
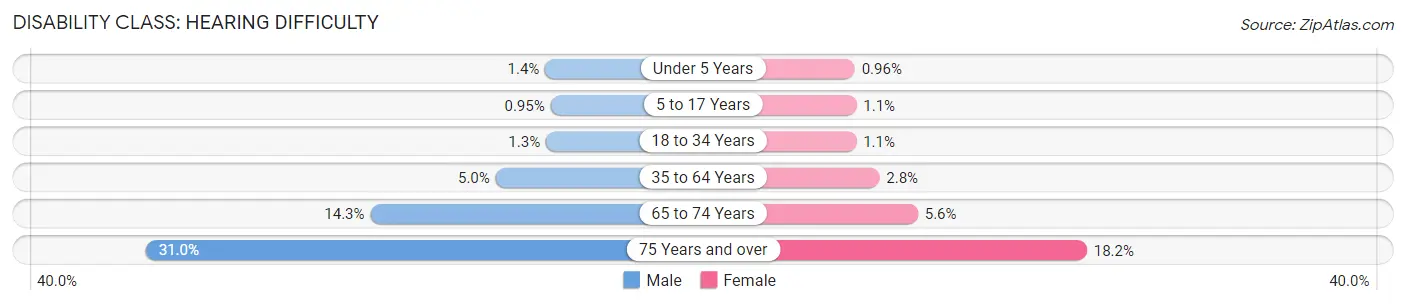
| Age Bracket | Male | Female |
| Under 5 Years | 234 (1.3%) | 159 (1.0%) |
| 5 to 17 Years | 473 (0.9%) | 517 (1.1%) |
| 18 to 34 Years | 777 (1.3%) | 644 (1.1%) |
| 35 to 64 Years | 4,653 (5.0%) | 2,617 (2.8%) |
| 65 to 74 Years | 3,224 (14.3%) | 1,378 (5.6%) |
| 75 Years and over | 3,898 (31.0%) | 3,231 (18.2%) |
Disability Class: Vision Difficulty
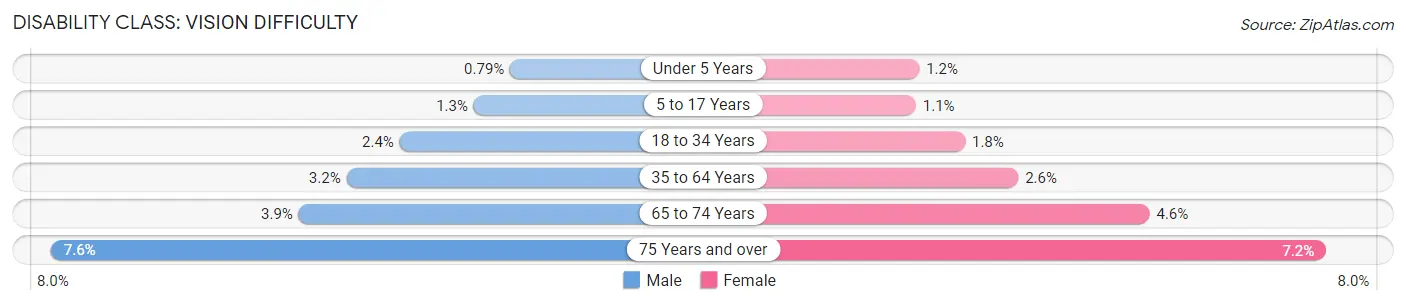
| Age Bracket | Male | Female |
| Under 5 Years | 137 (0.8%) | 191 (1.1%) |
| 5 to 17 Years | 661 (1.3%) | 524 (1.1%) |
| 18 to 34 Years | 1,464 (2.4%) | 1,102 (1.8%) |
| 35 to 64 Years | 2,973 (3.2%) | 2,453 (2.6%) |
| 65 to 74 Years | 885 (3.9%) | 1,117 (4.6%) |
| 75 Years and over | 957 (7.6%) | 1,278 (7.2%) |
Disability Class: Cognitive Difficulty
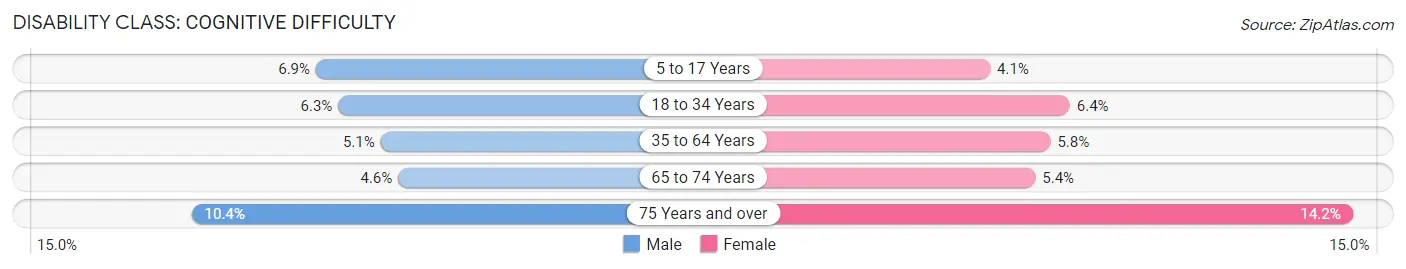
| Age Bracket | Male | Female |
| 5 to 17 Years | 3,426 (6.9%) | 1,969 (4.1%) |
| 18 to 34 Years | 3,785 (6.3%) | 3,817 (6.4%) |
| 35 to 64 Years | 4,708 (5.1%) | 5,448 (5.8%) |
| 65 to 74 Years | 1,034 (4.6%) | 1,318 (5.4%) |
| 75 Years and over | 1,302 (10.3%) | 2,526 (14.2%) |
Disability Class: Ambulatory Difficulty
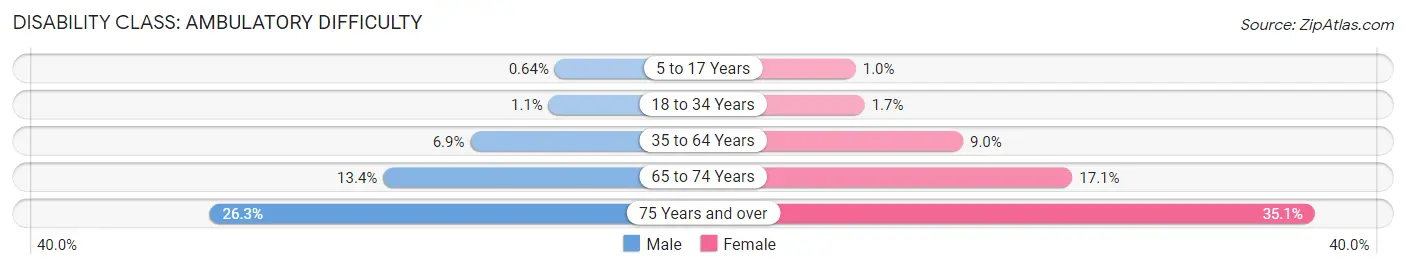
| Age Bracket | Male | Female |
| 5 to 17 Years | 316 (0.6%) | 494 (1.0%) |
| 18 to 34 Years | 660 (1.1%) | 1,021 (1.7%) |
| 35 to 64 Years | 6,385 (6.9%) | 8,436 (9.0%) |
| 65 to 74 Years | 3,009 (13.4%) | 4,184 (17.1%) |
| 75 Years and over | 3,302 (26.3%) | 6,237 (35.1%) |
Disability Class: Self-Care Difficulty
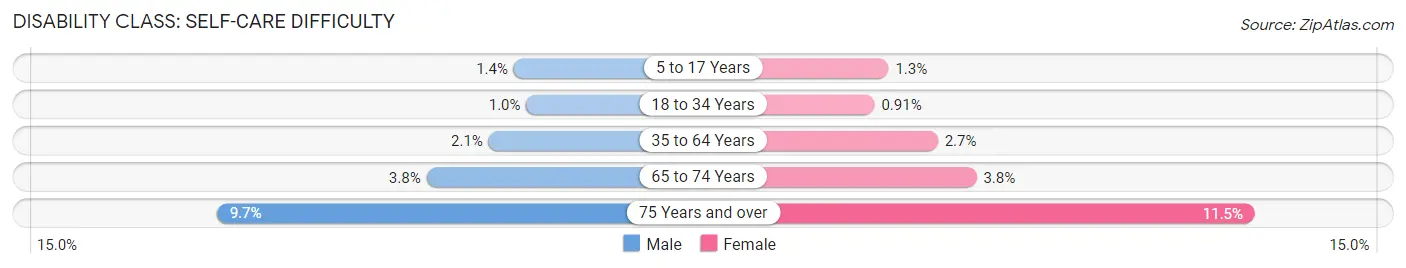
| Age Bracket | Male | Female |
| 5 to 17 Years | 688 (1.4%) | 621 (1.3%) |
| 18 to 34 Years | 622 (1.0%) | 545 (0.9%) |
| 35 to 64 Years | 1,918 (2.1%) | 2,503 (2.7%) |
| 65 to 74 Years | 857 (3.8%) | 916 (3.7%) |
| 75 Years and over | 1,213 (9.7%) | 2,043 (11.5%) |
Technology Access in Sedgwick County
Computing Device Access in Sedgwick County
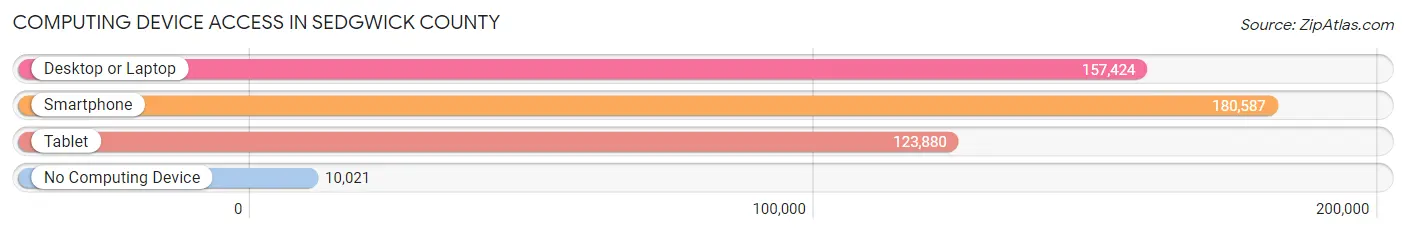
| Device Type | # Households | % Households |
| Desktop or Laptop | 157,424 | 77.7% |
| Smartphone | 180,587 | 89.2% |
| Tablet | 123,880 | 61.2% |
| No Computing Device | 10,021 | 5.0% |
| Total | 202,485 | 100.0% |
Internet Access in Sedgwick County
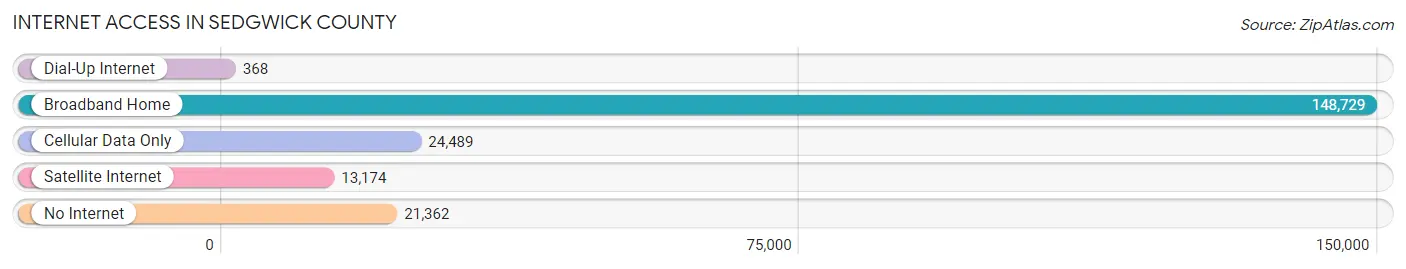
| Internet Type | # Households | % Households |
| Dial-Up Internet | 368 | 0.2% |
| Broadband Home | 148,729 | 73.5% |
| Cellular Data Only | 24,489 | 12.1% |
| Satellite Internet | 13,174 | 6.5% |
| No Internet | 21,362 | 10.5% |
| Total | 202,485 | 100.0% |
Sedgwick County Summary
Sedgwick County is located in the south-central region of the U.S. state of Kansas. It is the most populous county in the state, with a population of 522,021 as of the 2010 census. The county seat is Wichita, the largest city in the state. The county was named for Fort Sedgwick, a military post that was established in 1865 during the American Civil War.
History
Sedgwick County was established in 1867, when the Kansas Legislature created it from part of the original Cherokee Neutral Lands. The county was named for Fort Sedgwick, a military post that was established in 1865 during the American Civil War. The fort was named for Major General John Sedgwick, who was killed in action during the Battle of Spotsylvania Court House in 1864.
The county was originally populated by Native American tribes, including the Wichita, Osage, and Pawnee. The first white settlers arrived in the area in the late 1860s, and the county was officially organized in 1872.
Geography
Sedgwick County covers an area of 1,009 square miles, making it the largest county in Kansas. It is located in the south-central region of the state, and is bordered by Harvey County to the north, Butler County to the east, Cowley County to the south, and Sumner County to the west.
The county is divided into two distinct regions: the Arkansas River Valley in the east, and the Great Plains in the west. The Arkansas River flows through the county, and is a major source of recreation and economic activity. The county also contains several lakes, including Cheney Reservoir, El Dorado Lake, and Lake Afton.
The county is home to several state parks, including Cheney State Park, El Dorado State Park, and Lake Afton State Park. The county also contains several wildlife areas, including the Sedgwick County Wildlife Area and the Chisholm Creek Wildlife Area.
Economy
Sedgwick County is home to a diverse economy, with a variety of industries providing employment opportunities. The county is home to several major employers, including Cessna Aircraft Company, Spirit AeroSystems, and Koch Industries. The county is also home to several universities and colleges, including Wichita State University, Friends University, and Newman University.
The county is also home to several major tourist attractions, including the Sedgwick County Zoo, the Wichita Art Museum, and the Old Cowtown Museum. The county is also home to several major shopping centers, including Towne West Square and the Wichita Mall.
Demographics
As of the 2010 census, there were 522,021 people, 202,945 households, and 131,945 families residing in the county. The population density was 517.3 people per square mile. There were 221,945 housing units at an average density of 219.7 per square mile.
The racial makeup of the county was 75.2% White, 11.3% African American, 1.7% Native American, 3.2% Asian, 0.1% Pacific Islander, 5.2% from other races, and 3.3% from two or more races. Hispanic or Latino of any race were 11.3% of the population.
The median income for a household in the county was $45,845, and the median income for a family was $54,817. The per capita income for the county was $23,845. About 8.7% of families and 12.2% of the population were below the poverty line, including 17.2% of those under age 18 and 6.7% of those age 65 or over.
Common Questions
What is the Total Population of Sedgwick County?
Total Population of Sedgwick County is 522,700.
What is the Total Male Population of Sedgwick County?
Total Male Population of Sedgwick County is 260,195.
What is the Total Female Population of Sedgwick County?
Total Female Population of Sedgwick County is 262,505.
What is the Ratio of Males per 100 Females in Sedgwick County?
There are 99.12 Males per 100 Females in Sedgwick County.
What is the Ratio of Females per 100 Males in Sedgwick County?
There are 100.89 Females per 100 Males in Sedgwick County.
What is the Median Population Age in Sedgwick County?
Median Population Age in Sedgwick County is 35.8 Years.
What is the Average Family Size in Sedgwick County
Average Family Size in Sedgwick County is 3.2 People.
What is the Average Household Size in Sedgwick County
Average Household Size in Sedgwick County is 2.5 People.
What is Per Capita Income in Sedgwick County?
Per Capita income in Sedgwick County is $35,338.
What is the Median Family Income in Sedgwick County?
Median Family Income in Sedgwick County is $82,858.
What is the Median Household income in Sedgwick County?
Median Household Income in Sedgwick County is $65,372.
What is Income or Wage Gap in Sedgwick County?
Income or Wage Gap in Sedgwick County is 31.3%.
Women in Sedgwick County earn 68.7 cents for every dollar earned by a man.
What is Family Income Deficit in Sedgwick County?
Family Income Deficit in Sedgwick County is $10,791.
Families that are below poverty line in Sedgwick County earn $10,791 less on average than the poverty threshold level.
What is Inequality or Gini Index in Sedgwick County?
Inequality or Gini Index in Sedgwick County is 0.46.
How Large is the Labor Force in Sedgwick County?
There are 268,576 People in the Labor Forcein in Sedgwick County.
What is the Percentage of People in the Labor Force in Sedgwick County?
66.1% of People are in the Labor Force in Sedgwick County.
What is the Unemployment Rate in Sedgwick County?
Unemployment Rate in Sedgwick County is 5.3%.