Rooks County, KS
Rooks County Overview
4,925
TOTAL POPULATION
2,442
MALE POPULATION
2,483
FEMALE POPULATION
98.35
MALES / 100 FEMALES
101.68
FEMALES / 100 MALES
44.9
MEDIAN AGE
2.8
AVG FAMILY SIZE
2.2
AVG HOUSEHOLD SIZE
$33,751
PER CAPITA INCOME
$83,361
AVG FAMILY INCOME
$60,821
AVG HOUSEHOLD INCOME
51.6%
WAGE / INCOME GAP [ % ]
48.4¢/ $1
WAGE / INCOME GAP [ $ ]
0.37
INEQUALITY / GINI INDEX
2,506
LABOR FORCE [ PEOPLE ]
62.3%
PERCENT IN LABOR FORCE
1.8%
UNEMPLOYMENT RATE
Rooks County Area Codes
Race in Rooks County
The most populous races in Rooks County are White / Caucasian (4,670 | 94.8%), Hispanic or Latino (127 | 2.6%), and Two or more Races (102 | 2.1%).
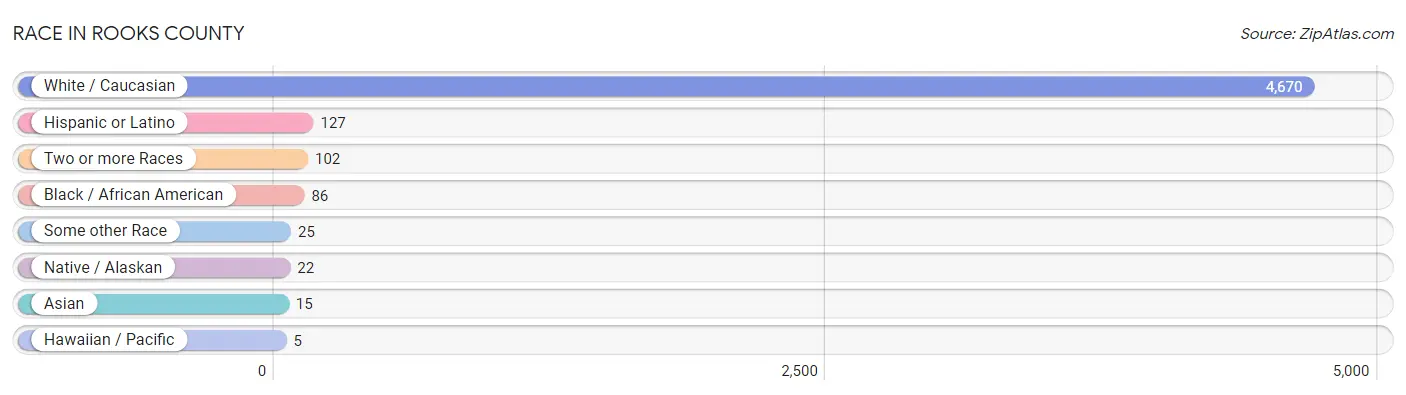
| Race | # Population | % Population |
| Asian | 15 | 0.3% |
| Black / African American | 86 | 1.8% |
| Hawaiian / Pacific | 5 | 0.1% |
| Hispanic or Latino | 127 | 2.6% |
| Native / Alaskan | 22 | 0.4% |
| White / Caucasian | 4,670 | 94.8% |
| Two or more Races | 102 | 2.1% |
| Some other Race | 25 | 0.5% |
| Total | 4,925 | 100.0% |
Ancestry in Rooks County
The most populous ancestries reported in Rooks County are German (1,642 | 33.3%), Irish (631 | 12.8%), American (521 | 10.6%), English (450 | 9.1%), and French (200 | 4.1%), together accounting for 69.9% of all Rooks County residents.
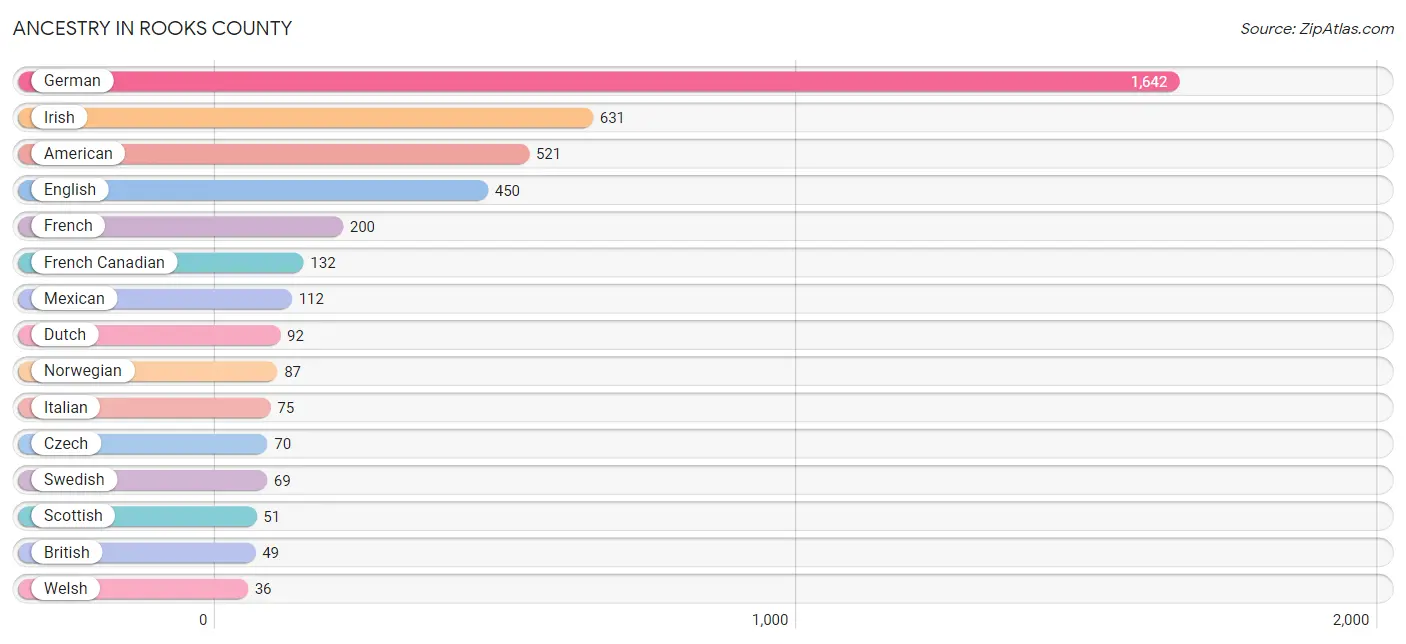
| Ancestry | # Population | % Population |
| Alaskan Athabascan | 1 | 0.0% |
| American | 521 | 10.6% |
| Blackfeet | 1 | 0.0% |
| British | 49 | 1.0% |
| Cherokee | 2 | 0.0% |
| Chickasaw | 4 | 0.1% |
| Comanche | 5 | 0.1% |
| Cuban | 6 | 0.1% |
| Czech | 70 | 1.4% |
| Czechoslovakian | 32 | 0.6% |
| Danish | 19 | 0.4% |
| Delaware | 6 | 0.1% |
| Dutch | 92 | 1.9% |
| English | 450 | 9.1% |
| European | 32 | 0.6% |
| French | 200 | 4.1% |
| French Canadian | 132 | 2.7% |
| German | 1,642 | 33.3% |
| German Russian | 14 | 0.3% |
| Indian (Asian) | 15 | 0.3% |
| Irish | 631 | 12.8% |
| Italian | 75 | 1.5% |
| Jamaican | 1 | 0.0% |
| Kiowa | 8 | 0.2% |
| Mexican | 112 | 2.3% |
| Native Hawaiian | 5 | 0.1% |
| Northern European | 11 | 0.2% |
| Norwegian | 87 | 1.8% |
| Pennsylvania German | 6 | 0.1% |
| Polish | 34 | 0.7% |
| Portuguese | 3 | 0.1% |
| Potawatomi | 5 | 0.1% |
| Russian | 14 | 0.3% |
| Scandinavian | 18 | 0.4% |
| Scotch-Irish | 16 | 0.3% |
| Scottish | 51 | 1.0% |
| Swedish | 69 | 1.4% |
| Swiss | 12 | 0.2% |
| Ukrainian | 9 | 0.2% |
| Welsh | 36 | 0.7% | View All 40 Rows |
Immigrants in Rooks County
The most numerous immigrant groups reported in Rooks County came from Asia (15 | 0.3%), China (15 | 0.3%), Eastern Asia (15 | 0.3%), Canada (6 | 0.1%), and Central America (6 | 0.1%), together accounting for 1.1% of all Rooks County residents.

| Immigration Origin | # Population | % Population |
| Asia | 15 | 0.3% |
| Canada | 6 | 0.1% |
| Central America | 6 | 0.1% |
| China | 15 | 0.3% |
| Eastern Asia | 15 | 0.3% |
| Latin America | 6 | 0.1% |
| Mexico | 6 | 0.1% | View All 7 Rows |
Sex and Age in Rooks County
Sex and Age in Rooks County
The most populous age groups in Rooks County are 60 to 64 Years (198 | 8.1%) for men and 55 to 59 Years (219 | 8.8%) for women.
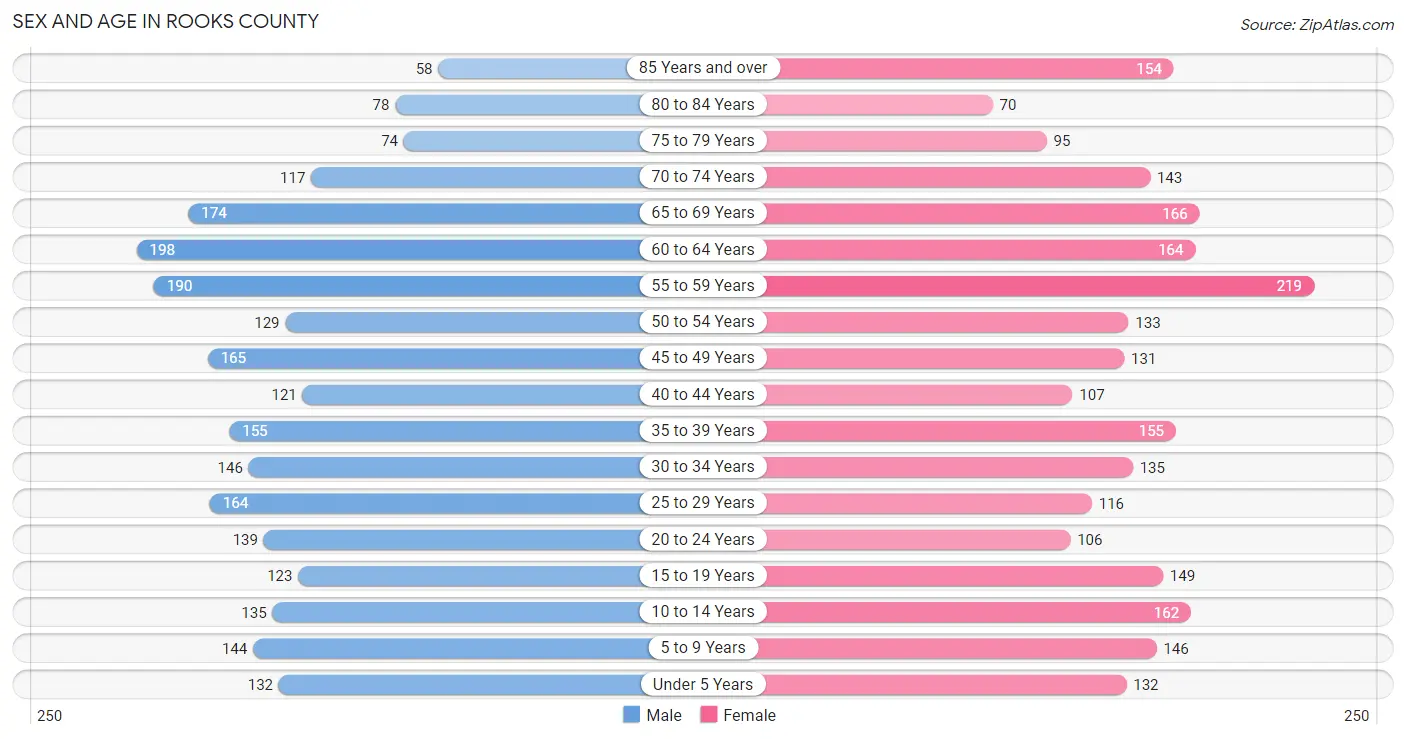
| Age Bracket | Male | Female |
| Under 5 Years | 132 (5.4%) | 132 (5.3%) |
| 5 to 9 Years | 144 (5.9%) | 146 (5.9%) |
| 10 to 14 Years | 135 (5.5%) | 162 (6.5%) |
| 15 to 19 Years | 123 (5.0%) | 149 (6.0%) |
| 20 to 24 Years | 139 (5.7%) | 106 (4.3%) |
| 25 to 29 Years | 164 (6.7%) | 116 (4.7%) |
| 30 to 34 Years | 146 (6.0%) | 135 (5.4%) |
| 35 to 39 Years | 155 (6.4%) | 155 (6.2%) |
| 40 to 44 Years | 121 (5.0%) | 107 (4.3%) |
| 45 to 49 Years | 165 (6.8%) | 131 (5.3%) |
| 50 to 54 Years | 129 (5.3%) | 133 (5.4%) |
| 55 to 59 Years | 190 (7.8%) | 219 (8.8%) |
| 60 to 64 Years | 198 (8.1%) | 164 (6.6%) |
| 65 to 69 Years | 174 (7.1%) | 166 (6.7%) |
| 70 to 74 Years | 117 (4.8%) | 143 (5.8%) |
| 75 to 79 Years | 74 (3.0%) | 95 (3.8%) |
| 80 to 84 Years | 78 (3.2%) | 70 (2.8%) |
| 85 Years and over | 58 (2.4%) | 154 (6.2%) |
| Total | 2,442 (100.0%) | 2,483 (100.0%) |
Families and Households in Rooks County
Median Family Size in Rooks County
The median family size in Rooks County is 2.82 persons per family, with single female/mother families (74 | 5.4%) accounting for the largest median family size of 2.88 persons per family. On the other hand, single male/father families (81 | 6.0%) represent the smallest median family size with 2.33 persons per family.
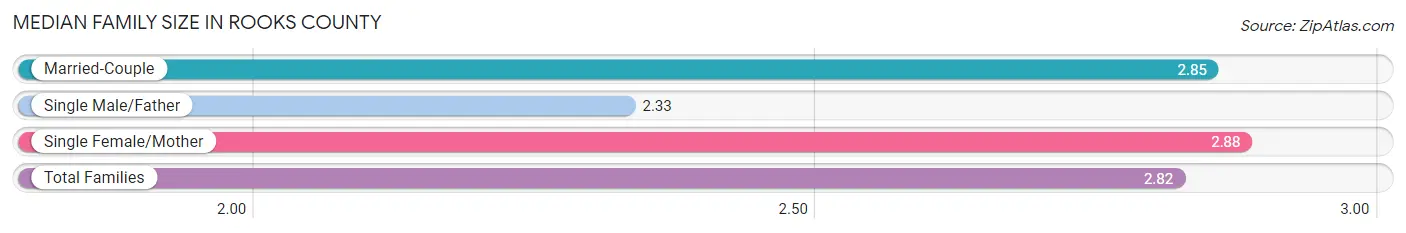
| Family Type | # Families | Family Size |
| Married-Couple | 1,202 (88.6%) | 2.85 |
| Single Male/Father | 81 (6.0%) | 2.33 |
| Single Female/Mother | 74 (5.4%) | 2.88 |
| Total Families | 1,357 (100.0%) | 2.82 |
Median Household Size in Rooks County
The median household size in Rooks County is 2.22 persons per household, with single female/mother households (74 | 3.5%) accounting for the largest median household size of 3.05 persons per household. non-family households (770 | 36.2%) represent the smallest median household size with 1.10 persons per household.
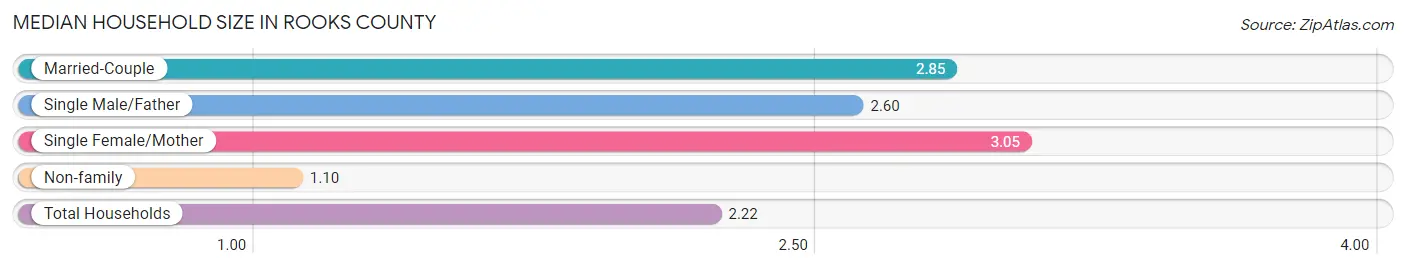
| Household Type | # Households | Household Size |
| Married-Couple | 1,202 (56.5%) | 2.85 |
| Single Male/Father | 81 (3.8%) | 2.60 |
| Single Female/Mother | 74 (3.5%) | 3.05 |
| Non-family | 770 (36.2%) | 1.10 |
| Total Households | 2,127 (100.0%) | 2.22 |
Household Size by Marriage Status in Rooks County
Out of a total of 2,127 households in Rooks County, 1,357 (63.8%) are family households, while 770 (36.2%) are nonfamily households. The most numerous type of family households are 2-person households, comprising 685, and the most common type of nonfamily households are 1-person households, comprising 699.

| Household Size | Family Households | Nonfamily Households |
| 1-Person Households | - | 699 (32.9%) |
| 2-Person Households | 685 (32.2%) | 54 (2.5%) |
| 3-Person Households | 193 (9.1%) | 0 (0.0%) |
| 4-Person Households | 208 (9.8%) | 0 (0.0%) |
| 5-Person Households | 185 (8.7%) | 0 (0.0%) |
| 6-Person Households | 83 (3.9%) | 17 (0.8%) |
| 7+ Person Households | 3 (0.1%) | 0 (0.0%) |
| Total | 1,357 (63.8%) | 770 (36.2%) |
Female Fertility in Rooks County
Fertility by Age in Rooks County
Average fertility rate in Rooks County is 41.0 births per 1,000 women. Women in the age bracket of 20 to 34 years have the highest fertility rate with 106.0 births per 1,000 women. Women in the age bracket of 20 to 34 years acount for 100.0% of all women with births.
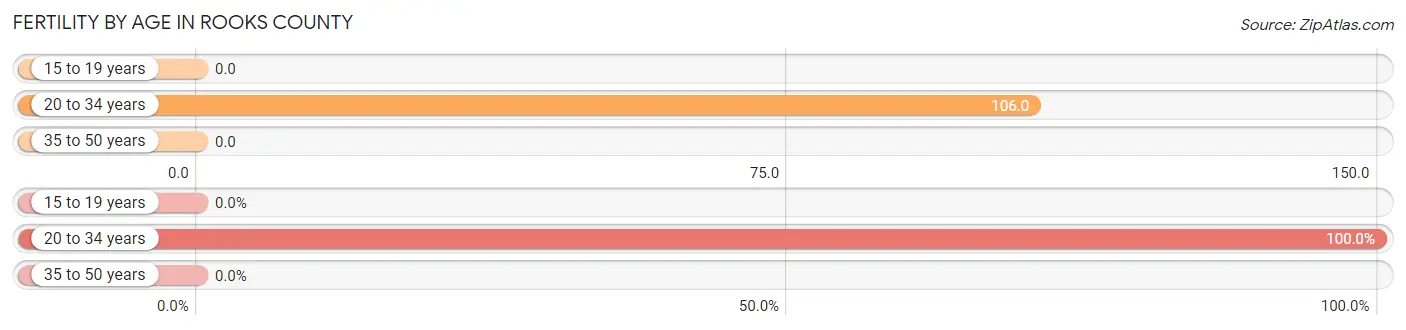
| Age Bracket | Women with Births | Births / 1,000 Women |
| 15 to 19 years | 0 (0.0%) | 0.0 |
| 20 to 34 years | 38 (100.0%) | 106.0 |
| 35 to 50 years | 0 (0.0%) | 0.0 |
| Total | 38 (100.0%) | 41.0 |
Fertility by Age by Marriage Status in Rooks County
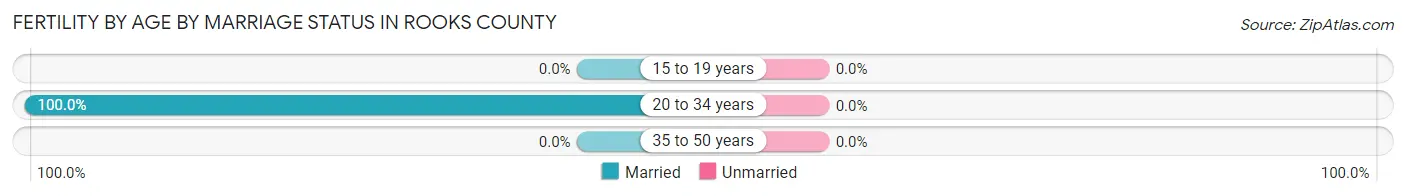
| Age Bracket | Married | Unmarried |
| 15 to 19 years | 0 (0.0%) | 0 (0.0%) |
| 20 to 34 years | 38 (100.0%) | 0 (0.0%) |
| 35 to 50 years | 0 (0.0%) | 0 (0.0%) |
| Total | 38 (100.0%) | 0 (0.0%) |
Fertility by Education in Rooks County
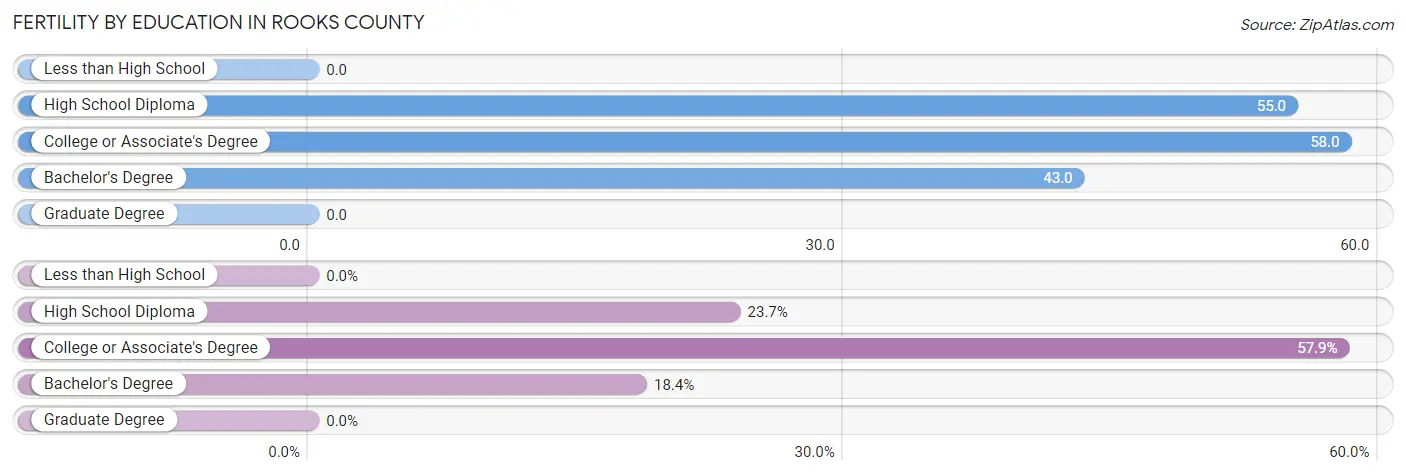
| Educational Attainment | Women with Births | Births / 1,000 Women |
| Less than High School | 0 (0.0%) | 0.0 |
| High School Diploma | 9 (23.7%) | 55.0 |
| College or Associate's Degree | 22 (57.9%) | 58.0 |
| Bachelor's Degree | 7 (18.4%) | 43.0 |
| Graduate Degree | 0 (0.0%) | 0.0 |
| Total | 38 (100.0%) | 41.0 |
Fertility by Education by Marriage Status in Rooks County
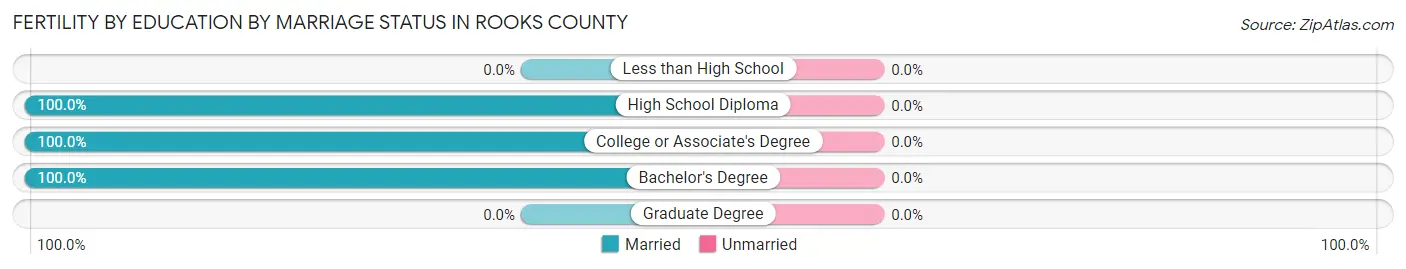
| Educational Attainment | Married | Unmarried |
| Less than High School | 0 (0.0%) | 0 (0.0%) |
| High School Diploma | 9 (100.0%) | 0 (0.0%) |
| College or Associate's Degree | 22 (100.0%) | 0 (0.0%) |
| Bachelor's Degree | 7 (100.0%) | 0 (0.0%) |
| Graduate Degree | 0 (0.0%) | 0 (0.0%) |
| Total | 38 (100.0%) | 0 (0.0%) |
Income in Rooks County
Income Overview in Rooks County
Per Capita Income in Rooks County is $33,751, while median incomes of families and households are $83,361 and $60,821 respectively.
| Characteristic | Number | Measure |
| Per Capita Income | 4,925 | $33,751 |
| Median Family Income | 1,357 | $83,361 |
| Mean Family Income | 1,357 | $91,601 |
| Median Household Income | 2,127 | $60,821 |
| Mean Household Income | 2,127 | $77,922 |
| Income Deficit | 1,357 | $0 |
| Wage / Income Gap (%) | 4,925 | 51.62% |
| Wage / Income Gap ($) | 4,925 | 48.38¢ per $1 |
| Gini / Inequality Index | 4,925 | 0.37 |
Earnings by Sex in Rooks County
Average Earnings in Rooks County are $36,996, $49,212 for men and $23,810 for women, a difference of 51.6%.
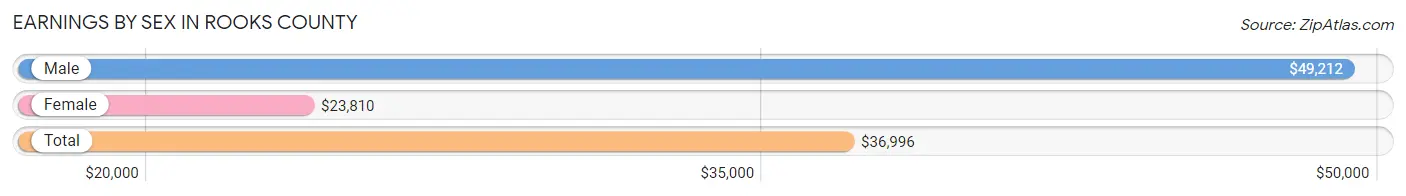
| Sex | Number | Average Earnings |
| Male | 1,473 (53.4%) | $49,212 |
| Female | 1,284 (46.6%) | $23,810 |
| Total | 2,757 (100.0%) | $36,996 |
Earnings by Sex by Income Bracket in Rooks County
The most common earnings brackets in Rooks County are $55,000 to $64,999 for men (223 | 15.1%) and $2,499 or less for women (132 | 10.3%).
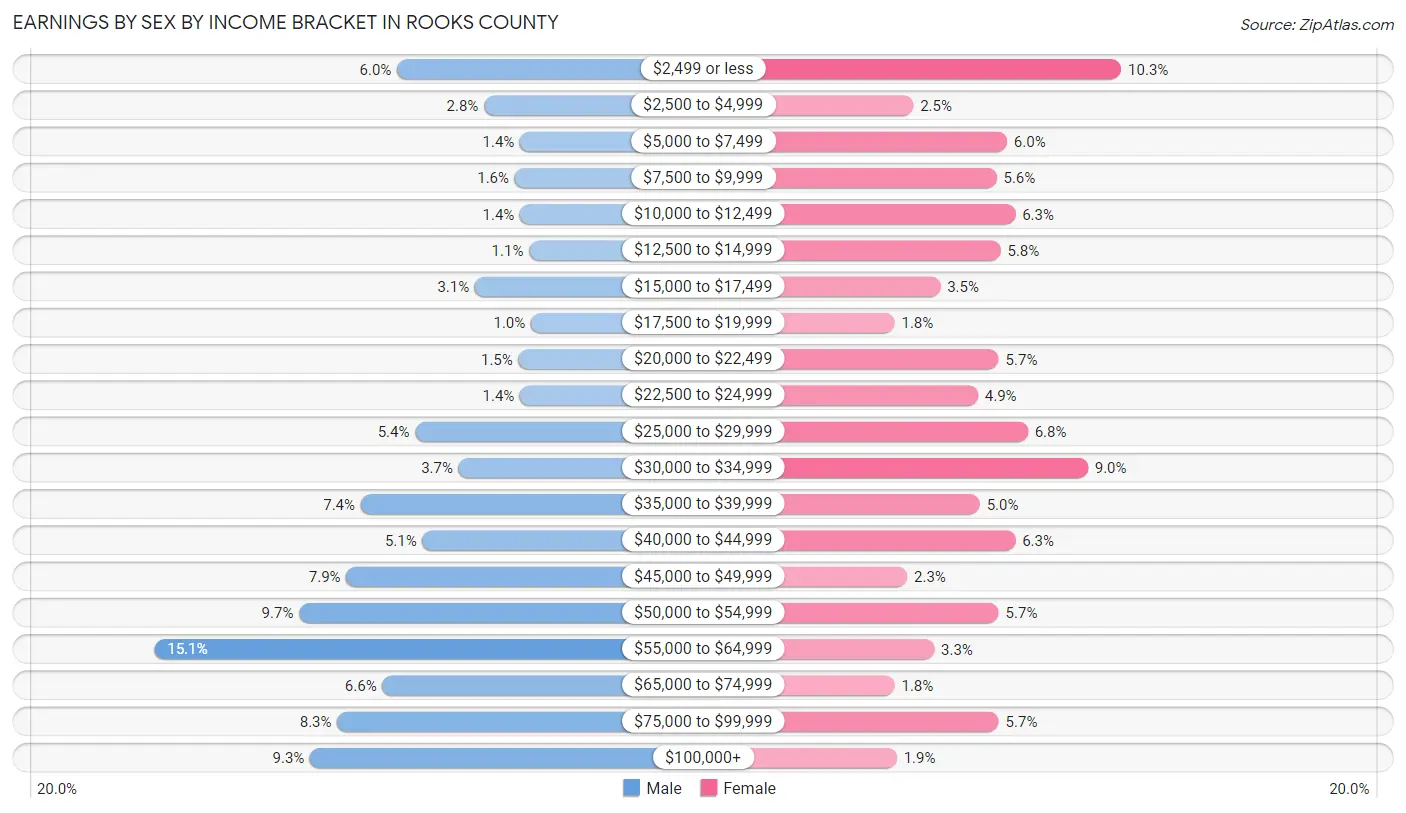
| Income | Male | Female |
| $2,499 or less | 89 (6.0%) | 132 (10.3%) |
| $2,500 to $4,999 | 41 (2.8%) | 32 (2.5%) |
| $5,000 to $7,499 | 21 (1.4%) | 77 (6.0%) |
| $7,500 to $9,999 | 24 (1.6%) | 72 (5.6%) |
| $10,000 to $12,499 | 21 (1.4%) | 81 (6.3%) |
| $12,500 to $14,999 | 16 (1.1%) | 74 (5.8%) |
| $15,000 to $17,499 | 46 (3.1%) | 45 (3.5%) |
| $17,500 to $19,999 | 15 (1.0%) | 23 (1.8%) |
| $20,000 to $22,499 | 22 (1.5%) | 73 (5.7%) |
| $22,500 to $24,999 | 21 (1.4%) | 63 (4.9%) |
| $25,000 to $29,999 | 79 (5.4%) | 87 (6.8%) |
| $30,000 to $34,999 | 55 (3.7%) | 116 (9.0%) |
| $35,000 to $39,999 | 109 (7.4%) | 64 (5.0%) |
| $40,000 to $44,999 | 75 (5.1%) | 81 (6.3%) |
| $45,000 to $49,999 | 117 (7.9%) | 29 (2.3%) |
| $50,000 to $54,999 | 143 (9.7%) | 73 (5.7%) |
| $55,000 to $64,999 | 223 (15.1%) | 42 (3.3%) |
| $65,000 to $74,999 | 97 (6.6%) | 23 (1.8%) |
| $75,000 to $99,999 | 122 (8.3%) | 73 (5.7%) |
| $100,000+ | 137 (9.3%) | 24 (1.9%) |
| Total | 1,473 (100.0%) | 1,284 (100.0%) |
Earnings by Sex by Educational Attainment in Rooks County
Average earnings in Rooks County are $51,694 for men and $29,096 for women, a difference of 43.7%. Men with an educational attainment of graduate degree enjoy the highest average annual earnings of $65,132, while those with less than high school education earn the least with $35,648. Women with an educational attainment of graduate degree earn the most with the average annual earnings of $44,167, while those with high school diploma education have the smallest earnings of $22,813.

| Educational Attainment | Male Income | Female Income |
| Less than High School | $35,648 | $0 |
| High School Diploma | $48,125 | $22,813 |
| College or Associate's Degree | $56,106 | $28,704 |
| Bachelor's Degree | $48,125 | $43,589 |
| Graduate Degree | $65,132 | $44,167 |
| Total | $51,694 | $29,096 |
Family Income in Rooks County
Family Income Brackets in Rooks County
According to the Rooks County family income data, there are 358 families falling into the $100,000 to $149,999 income range, which is the most common income bracket and makes up 26.4% of all families. Conversely, the $10,000 to $14,999 income bracket is the least frequent group with only 7 families (0.5%) belonging to this category.
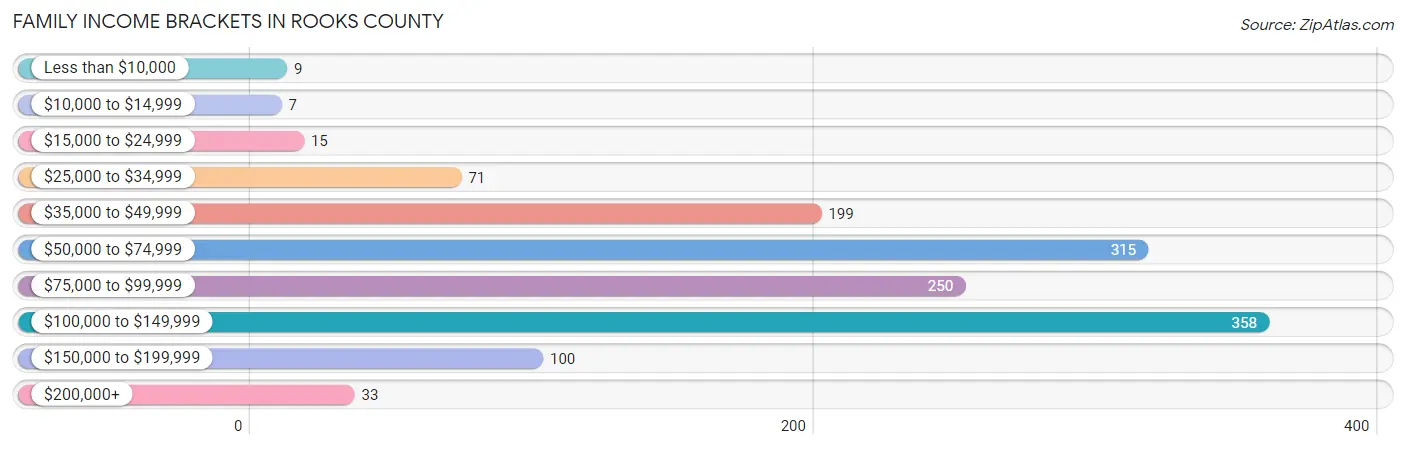
| Income Bracket | # Families | % Families |
| Less than $10,000 | 9 | 0.7% |
| $10,000 to $14,999 | 7 | 0.5% |
| $15,000 to $24,999 | 15 | 1.1% |
| $25,000 to $34,999 | 71 | 5.2% |
| $35,000 to $49,999 | 199 | 14.7% |
| $50,000 to $74,999 | 315 | 23.2% |
| $75,000 to $99,999 | 250 | 18.4% |
| $100,000 to $149,999 | 358 | 26.4% |
| $150,000 to $199,999 | 100 | 7.4% |
| $200,000+ | 33 | 2.4% |
Family Income by Famaliy Size in Rooks County
6-person families (83 | 6.1%) account for the highest median family income in Rooks County with $115,766 per family, while 2-person families (688 | 50.7%) have the highest median income of $37,102 per family member.
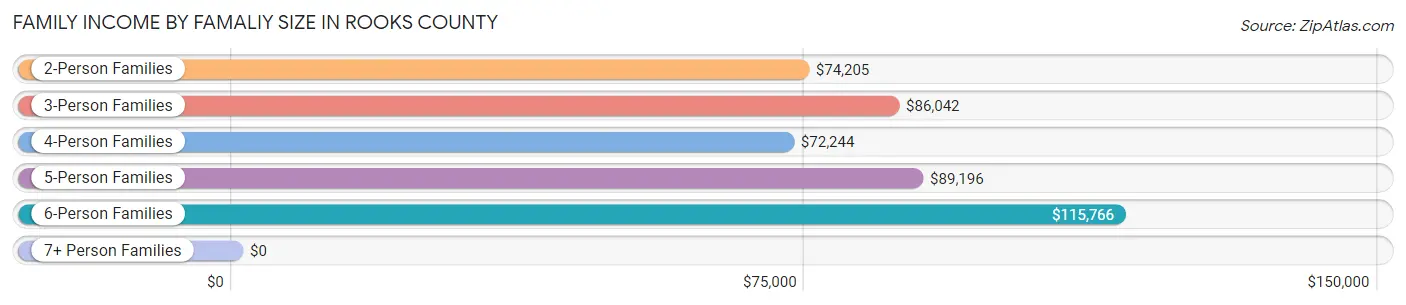
| Income Bracket | # Families | Median Income |
| 2-Person Families | 688 (50.7%) | $74,205 |
| 3-Person Families | 217 (16.0%) | $86,042 |
| 4-Person Families | 188 (13.9%) | $72,244 |
| 5-Person Families | 178 (13.1%) | $89,196 |
| 6-Person Families | 83 (6.1%) | $115,766 |
| 7+ Person Families | 3 (0.2%) | $0 |
| Total | 1,357 (100.0%) | $83,361 |
Family Income by Number of Earners in Rooks County
The median family income in Rooks County is $83,361, with families comprising 3+ earners (180) having the highest median family income of $114,688, while families with 1 earner (360) have the lowest median family income of $55,962, accounting for 13.3% and 26.5% of families, respectively.
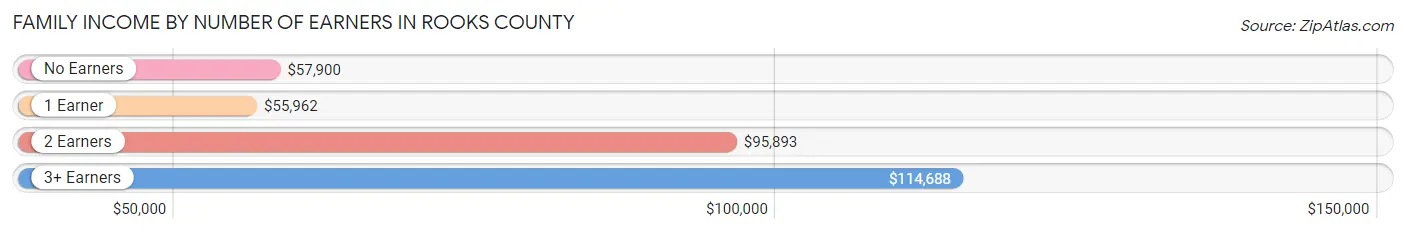
| Number of Earners | # Families | Median Income |
| No Earners | 192 (14.1%) | $57,900 |
| 1 Earner | 360 (26.5%) | $55,962 |
| 2 Earners | 625 (46.1%) | $95,893 |
| 3+ Earners | 180 (13.3%) | $114,688 |
| Total | 1,357 (100.0%) | $83,361 |
Household Income in Rooks County
Household Income Brackets in Rooks County
With 496 households falling in the category, the $50,000 to $74,999 income range is the most frequent in Rooks County, accounting for 23.3% of all households. In contrast, only 51 households (2.4%) fall into the $200,000+ income bracket, making it the least populous group.
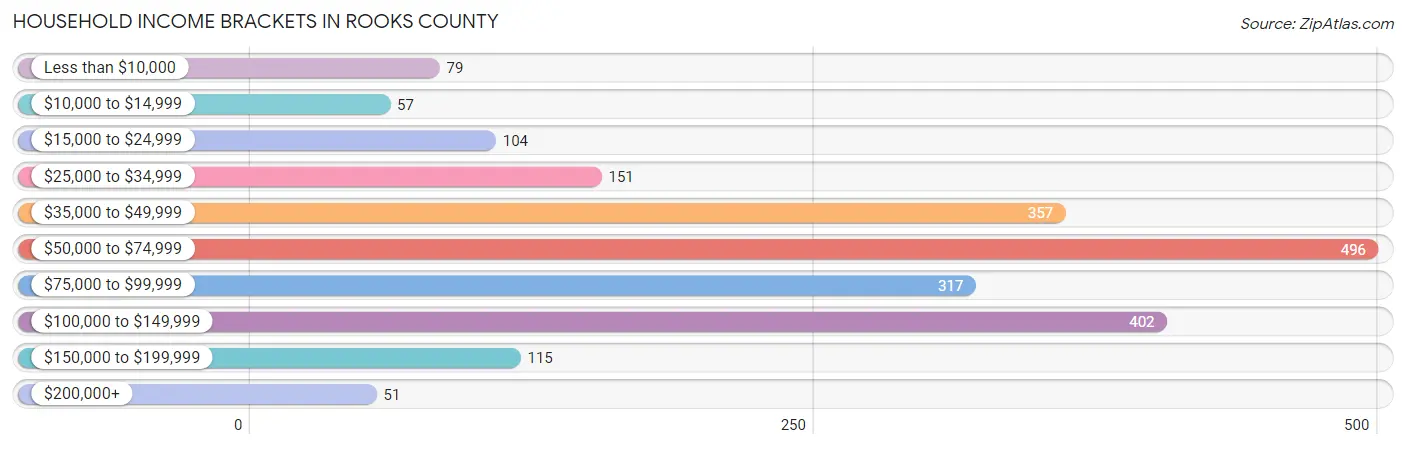
| Income Bracket | # Households | % Households |
| Less than $10,000 | 79 | 3.7% |
| $10,000 to $14,999 | 57 | 2.7% |
| $15,000 to $24,999 | 104 | 4.9% |
| $25,000 to $34,999 | 151 | 7.1% |
| $35,000 to $49,999 | 357 | 16.8% |
| $50,000 to $74,999 | 496 | 23.3% |
| $75,000 to $99,999 | 317 | 14.9% |
| $100,000 to $149,999 | 402 | 18.9% |
| $150,000 to $199,999 | 115 | 5.4% |
| $200,000+ | 51 | 2.4% |
Household Income by Householder Age in Rooks County
The median household income in Rooks County is $60,821, with the highest median household income of $93,036 found in the 45 to 64 years age bracket for the primary householder. A total of 660 households (31.0%) fall into this category. Meanwhile, the 15 to 24 years age bracket for the primary householder has the lowest median household income of $49,634, with 116 households (5.4%) in this group.
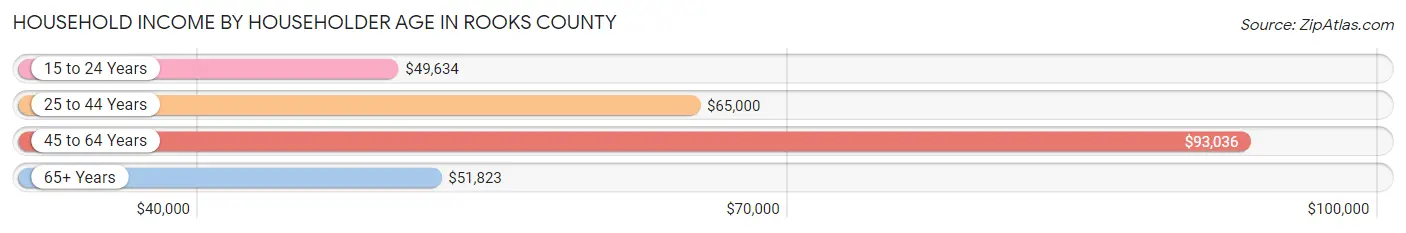
| Income Bracket | # Households | Median Income |
| 15 to 24 Years | 116 (5.4%) | $49,634 |
| 25 to 44 Years | 592 (27.8%) | $65,000 |
| 45 to 64 Years | 660 (31.0%) | $93,036 |
| 65+ Years | 759 (35.7%) | $51,823 |
| Total | 2,127 (100.0%) | $60,821 |
Poverty in Rooks County
Income Below Poverty by Sex and Age in Rooks County
With 2.9% poverty level for males and 6.3% for females among the residents of Rooks County, 16 and 17 year old males and 15 year old females are the most vulnerable to poverty, with 4 males (6.1%) and 8 females (25.8%) in their respective age groups living below the poverty level.
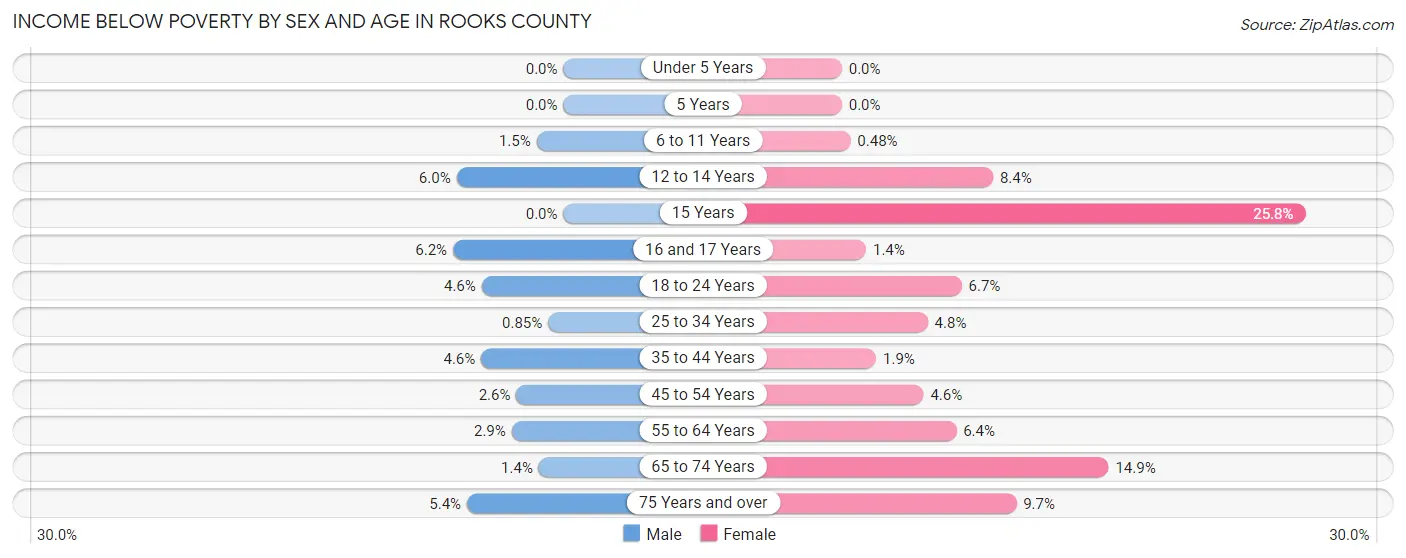
| Age Bracket | Male | Female |
| Under 5 Years | 0 (0.0%) | 0 (0.0%) |
| 5 Years | 0 (0.0%) | 0 (0.0%) |
| 6 to 11 Years | 2 (1.5%) | 1 (0.5%) |
| 12 to 14 Years | 5 (5.9%) | 8 (8.4%) |
| 15 Years | 0 (0.0%) | 8 (25.8%) |
| 16 and 17 Years | 4 (6.1%) | 1 (1.3%) |
| 18 to 24 Years | 8 (4.5%) | 10 (6.7%) |
| 25 to 34 Years | 2 (0.9%) | 12 (4.8%) |
| 35 to 44 Years | 11 (4.6%) | 5 (1.9%) |
| 45 to 54 Years | 7 (2.6%) | 12 (4.5%) |
| 55 to 64 Years | 11 (2.9%) | 24 (6.4%) |
| 65 to 74 Years | 4 (1.4%) | 45 (14.8%) |
| 75 Years and over | 11 (5.4%) | 27 (9.7%) |
| Total | 65 (2.9%) | 153 (6.3%) |
Income Above Poverty by Sex and Age in Rooks County
According to the poverty statistics in Rooks County, males aged under 5 years and females aged under 5 years are the age groups that are most secure financially, with 100.0% of males and 100.0% of females in these age groups living above the poverty line.
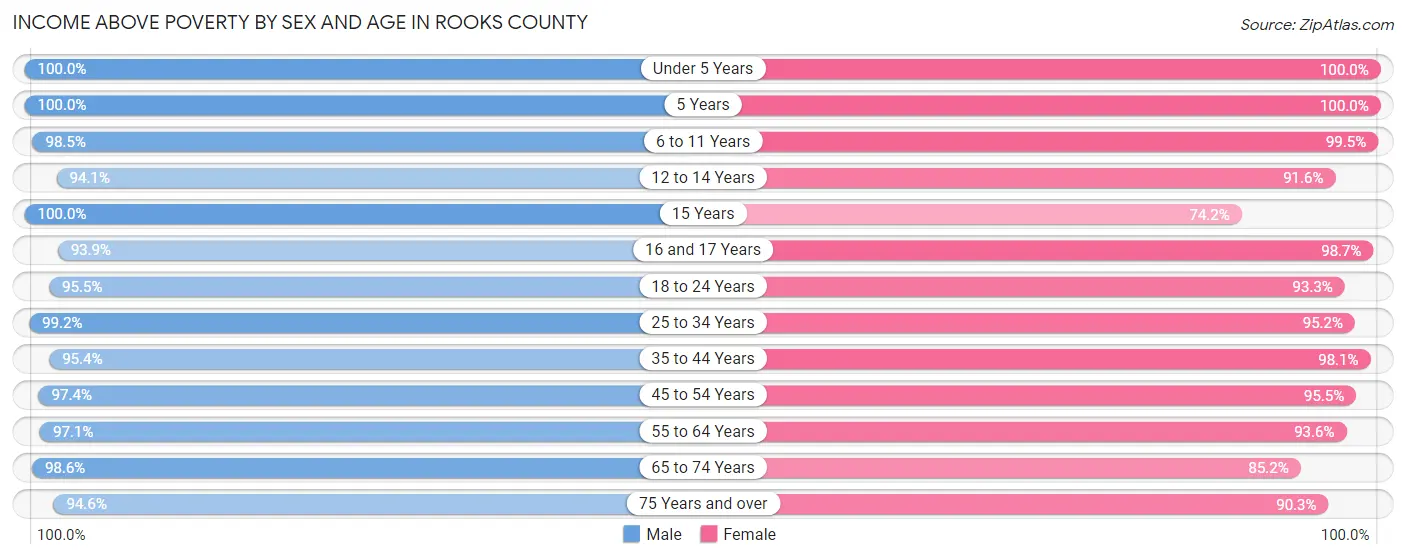
| Age Bracket | Male | Female |
| Under 5 Years | 120 (100.0%) | 132 (100.0%) |
| 5 Years | 58 (100.0%) | 5 (100.0%) |
| 6 to 11 Years | 132 (98.5%) | 207 (99.5%) |
| 12 to 14 Years | 79 (94.1%) | 87 (91.6%) |
| 15 Years | 21 (100.0%) | 23 (74.2%) |
| 16 and 17 Years | 61 (93.9%) | 73 (98.7%) |
| 18 to 24 Years | 168 (95.5%) | 140 (93.3%) |
| 25 to 34 Years | 232 (99.2%) | 239 (95.2%) |
| 35 to 44 Years | 229 (95.4%) | 257 (98.1%) |
| 45 to 54 Years | 260 (97.4%) | 252 (95.5%) |
| 55 to 64 Years | 371 (97.1%) | 353 (93.6%) |
| 65 to 74 Years | 287 (98.6%) | 258 (85.2%) |
| 75 Years and over | 194 (94.6%) | 251 (90.3%) |
| Total | 2,212 (97.2%) | 2,277 (93.7%) |
Income Below Poverty Among Married-Couple Families in Rooks County
The poverty statistics for married-couple families in Rooks County show that 0.8% or 10 of the total 1,202 families live below the poverty line. Families with 3 or 4 children have the highest poverty rate of 1.7%, comprising of 3 families. On the other hand, families with 1 or 2 children have the lowest poverty rate of 0.6%, which includes 2 families.
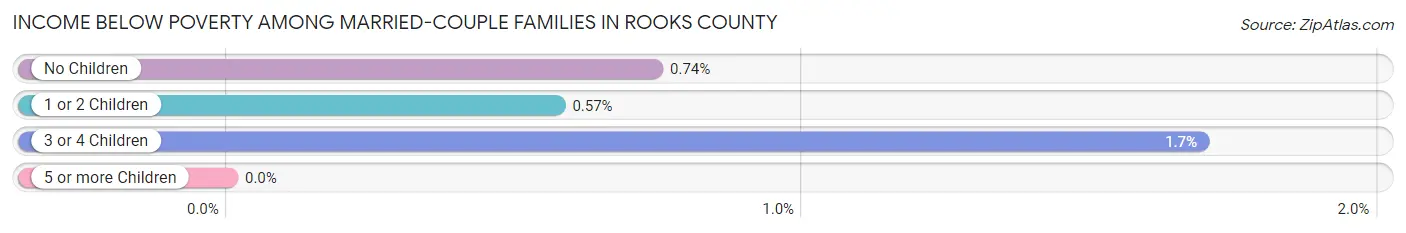
| Children | Above Poverty | Below Poverty |
| No Children | 670 (99.3%) | 5 (0.7%) |
| 1 or 2 Children | 348 (99.4%) | 2 (0.6%) |
| 3 or 4 Children | 174 (98.3%) | 3 (1.7%) |
| 5 or more Children | 0 (0.0%) | 0 (0.0%) |
| Total | 1,192 (99.2%) | 10 (0.8%) |
Income Below Poverty Among Single-Parent Households in Rooks County
According to the poverty data in Rooks County, 7.4% or 6 single-father households and 10.8% or 8 single-mother households are living below the poverty line. Among single-father households, those with no children have the highest poverty rate, with 6 households (20.0%) experiencing poverty. Likewise, among single-mother households, those with 1 or 2 children have the highest poverty rate, with 3 households (12.0%) falling below the poverty line.

| Children | Single Father | Single Mother |
| No Children | 6 (20.0%) | 2 (8.7%) |
| 1 or 2 Children | 0 (0.0%) | 3 (12.0%) |
| 3 or 4 Children | 0 (0.0%) | 3 (11.5%) |
| 5 or more Children | 0 (0.0%) | 0 (0.0%) |
| Total | 6 (7.4%) | 8 (10.8%) |
Income Below Poverty Among Married-Couple vs Single-Parent Households in Rooks County
The poverty data for Rooks County shows that 10 of the married-couple family households (0.8%) and 14 of the single-parent households (9.0%) are living below the poverty level. Within the married-couple family households, those with 3 or 4 children have the highest poverty rate, with 3 households (1.7%) falling below the poverty line. Among the single-parent households, those with no children have the highest poverty rate, with 8 household (15.1%) living below poverty.

| Children | Married-Couple Families | Single-Parent Households |
| No Children | 5 (0.7%) | 8 (15.1%) |
| 1 or 2 Children | 2 (0.6%) | 3 (4.0%) |
| 3 or 4 Children | 3 (1.7%) | 3 (11.1%) |
| 5 or more Children | 0 (0.0%) | 0 (0.0%) |
| Total | 10 (0.8%) | 14 (9.0%) |
Employment Characteristics in Rooks County
Employment by Class of Employer in Rooks County
Among the 2,412 employed individuals in Rooks County, private company employees (1,317 | 54.6%), local government employees (350 | 14.5%), and self-employed (not incorporated) (223 | 9.2%) make up the most common classes of employment.

| Employer Class | # Employees | % Employees |
| Private Company Employees | 1,317 | 54.6% |
| Self-Employed (Incorporated) | 98 | 4.1% |
| Self-Employed (Not Incorporated) | 223 | 9.2% |
| Not-for-profit Organizations | 216 | 9.0% |
| Local Government Employees | 350 | 14.5% |
| State Government Employees | 120 | 5.0% |
| Federal Government Employees | 86 | 3.6% |
| Unpaid Family Workers | 2 | 0.1% |
| Total | 2,412 | 100.0% |
Employment Status by Age in Rooks County
According to the labor force statistics for Rooks County, out of the total population over 16 years of age (4,022), 62.3% or 2,506 individuals are in the labor force, with 1.8% or 45 of them unemployed. The age group with the highest labor force participation rate is 45 to 54 years, with 83.9% or 468 individuals in the labor force. Within the labor force, the 60 to 64 years age range has the highest percentage of unemployed individuals, with 6.4% or 16 of them being unemployed.

| Age Bracket | In Labor Force | Unemployed |
| 16 to 19 Years | 135 (61.4%) | 0 (0.0%) |
| 20 to 24 Years | 193 (78.8%) | 5 (2.6%) |
| 25 to 29 Years | 222 (79.3%) | 0 (0.0%) |
| 30 to 34 Years | 229 (81.5%) | 2 (0.9%) |
| 35 to 44 Years | 440 (81.8%) | 18 (4.1%) |
| 45 to 54 Years | 468 (83.9%) | 0 (0.0%) |
| 55 to 59 Years | 341 (83.4%) | 0 (0.0%) |
| 60 to 64 Years | 249 (68.8%) | 16 (6.4%) |
| 65 to 74 Years | 176 (29.3%) | 3 (1.7%) |
| 75 Years and over | 54 (10.2%) | 0 (0.0%) |
| Total | 2,506 (62.3%) | 45 (1.8%) |
Employment Status by Educational Attainment in Rooks County
According to labor force statistics for Rooks County, 80.3% of individuals (1,950) out of the total population between 25 and 64 years of age (2,428) are in the labor force, with 1.8% or 35 of them being unemployed. The group with the highest labor force participation rate are those with the educational attainment of bachelor's degree or higher, with 89.1% or 497 individuals in the labor force. Within the labor force, individuals with less than high school education have the highest percentage of unemployment, with 11.0% or 10 of them being unemployed.
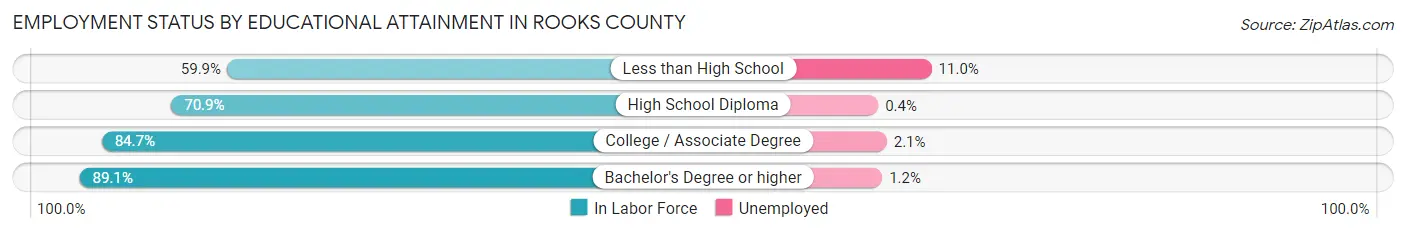
| Educational Attainment | In Labor Force | Unemployed |
| Less than High School | 91 (59.9%) | 17 (11.0%) |
| High School Diploma | 485 (70.9%) | 3 (0.4%) |
| College / Associate Degree | 876 (84.7%) | 22 (2.1%) |
| Bachelor's Degree or higher | 497 (89.1%) | 7 (1.2%) |
| Total | 1,950 (80.3%) | 44 (1.8%) |
Employment Occupations by Sex in Rooks County
Management, Business, Science and Arts Occupations
The most common Management, Business, Science and Arts occupations in Rooks County are Community & Social Service (288 | 11.7%), Management (256 | 10.4%), Education Instruction & Library (218 | 8.8%), Health Diagnosing & Treating (204 | 8.3%), and Health Technologists (141 | 5.7%).

Management, Business, Science and Arts Occupations by Sex
Within the Management, Business, Science and Arts occupations in Rooks County, the most male-oriented occupations are Architecture & Engineering (93.5%), Management (85.2%), and Computers, Engineering & Science (81.8%), while the most female-oriented occupations are Health Diagnosing & Treating (95.1%), Health Technologists (92.9%), and Education Instruction & Library (85.3%).
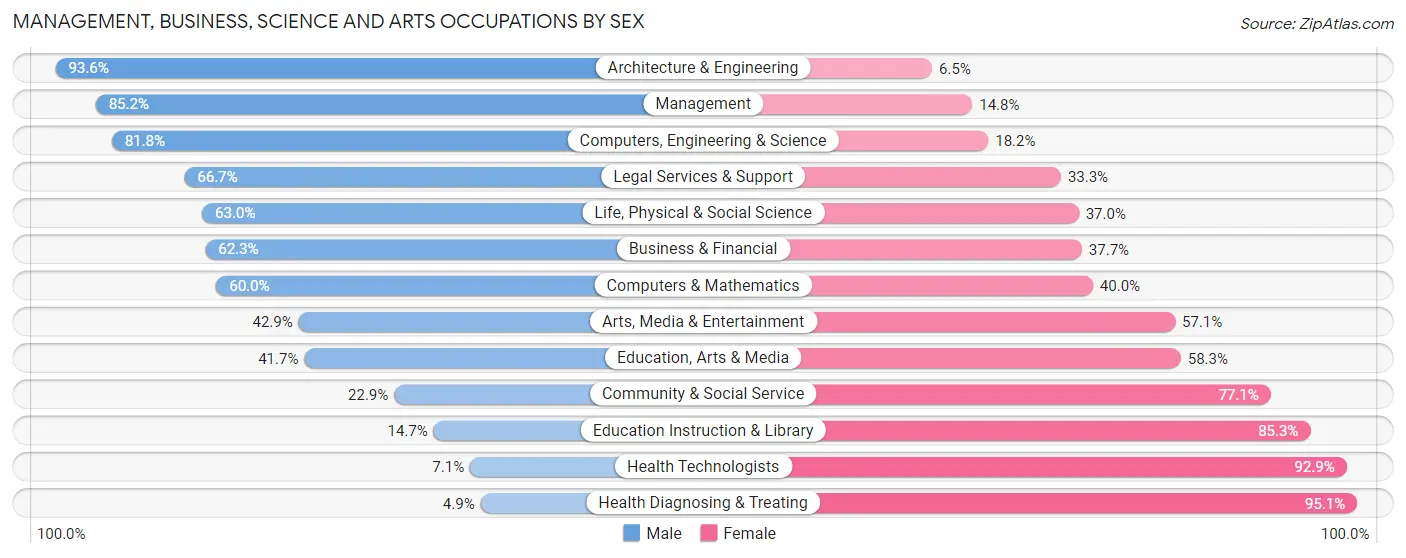
| Occupation | Male | Female |
| Management | 218 (85.2%) | 38 (14.8%) |
| Business & Financial | 38 (62.3%) | 23 (37.7%) |
| Computers, Engineering & Science | 81 (81.8%) | 18 (18.2%) |
| Computers & Mathematics | 6 (60.0%) | 4 (40.0%) |
| Architecture & Engineering | 58 (93.5%) | 4 (6.5%) |
| Life, Physical & Social Science | 17 (63.0%) | 10 (37.0%) |
| Community & Social Service | 66 (22.9%) | 222 (77.1%) |
| Education, Arts & Media | 10 (41.7%) | 14 (58.3%) |
| Legal Services & Support | 12 (66.7%) | 6 (33.3%) |
| Education Instruction & Library | 32 (14.7%) | 186 (85.3%) |
| Arts, Media & Entertainment | 12 (42.9%) | 16 (57.1%) |
| Health Diagnosing & Treating | 10 (4.9%) | 194 (95.1%) |
| Health Technologists | 10 (7.1%) | 131 (92.9%) |
| Total (Category) | 413 (45.5%) | 495 (54.5%) |
| Total (Overall) | 1,308 (53.1%) | 1,155 (46.9%) |
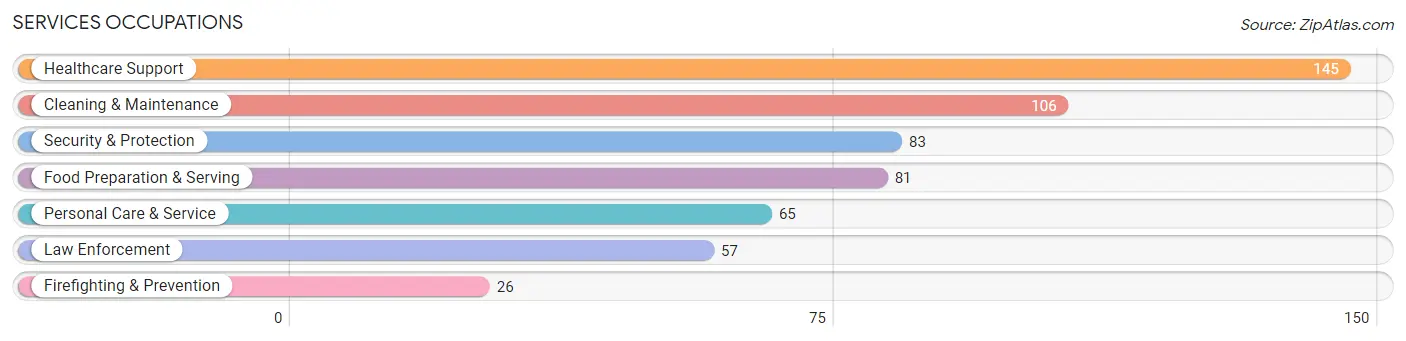
Services Occupations
The most common Services occupations in Rooks County are Healthcare Support (145 | 5.9%), Cleaning & Maintenance (106 | 4.3%), Security & Protection (83 | 3.4%), Food Preparation & Serving (81 | 3.3%), and Personal Care & Service (65 | 2.6%).
Services Occupations by Sex
Within the Services occupations in Rooks County, the most male-oriented occupations are Law Enforcement (96.5%), Security & Protection (66.3%), and Food Preparation & Serving (48.1%), while the most female-oriented occupations are Firefighting & Prevention (100.0%), Personal Care & Service (100.0%), and Healthcare Support (92.4%).
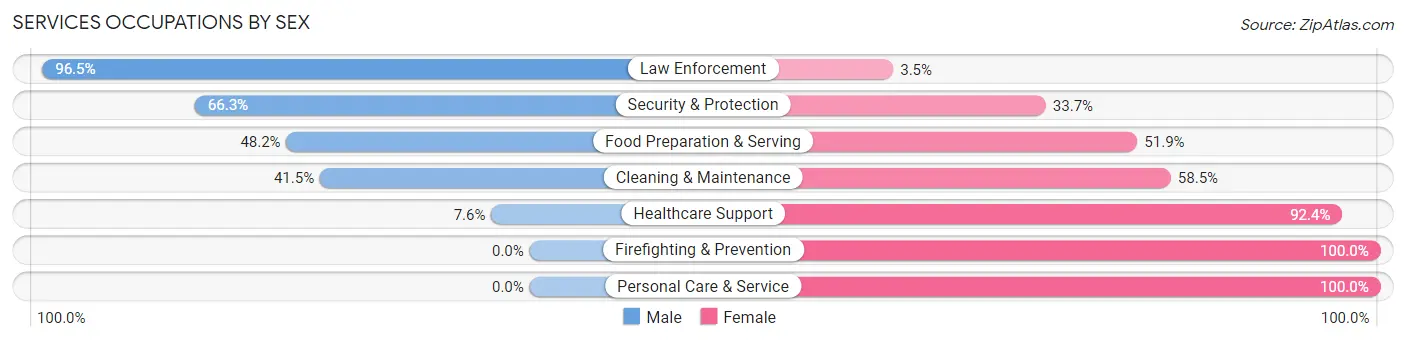
| Occupation | Male | Female |
| Healthcare Support | 11 (7.6%) | 134 (92.4%) |
| Security & Protection | 55 (66.3%) | 28 (33.7%) |
| Firefighting & Prevention | 0 (0.0%) | 26 (100.0%) |
| Law Enforcement | 55 (96.5%) | 2 (3.5%) |
| Food Preparation & Serving | 39 (48.1%) | 42 (51.8%) |
| Cleaning & Maintenance | 44 (41.5%) | 62 (58.5%) |
| Personal Care & Service | 0 (0.0%) | 65 (100.0%) |
| Total (Category) | 149 (31.0%) | 331 (69.0%) |
| Total (Overall) | 1,308 (53.1%) | 1,155 (46.9%) |
Sales and Office Occupations
The most common Sales and Office occupations in Rooks County are Office & Administration (268 | 10.9%), and Sales & Related (153 | 6.2%).

Sales and Office Occupations by Sex
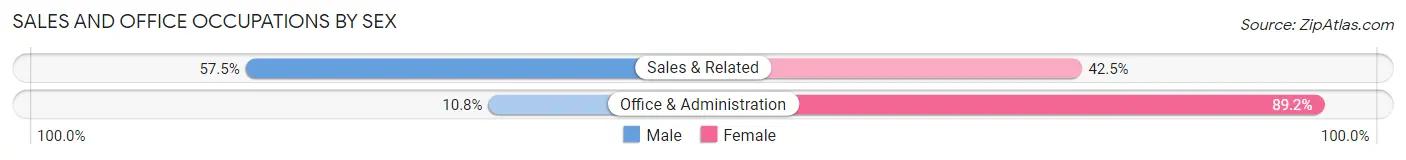
| Occupation | Male | Female |
| Sales & Related | 88 (57.5%) | 65 (42.5%) |
| Office & Administration | 29 (10.8%) | 239 (89.2%) |
| Total (Category) | 117 (27.8%) | 304 (72.2%) |
| Total (Overall) | 1,308 (53.1%) | 1,155 (46.9%) |
Natural Resources, Construction and Maintenance Occupations
The most common Natural Resources, Construction and Maintenance occupations in Rooks County are Installation, Maintenance & Repair (197 | 8.0%), Construction & Extraction (137 | 5.6%), and Farming, Fishing & Forestry (83 | 3.4%).
Natural Resources, Construction and Maintenance Occupations by Sex

| Occupation | Male | Female |
| Farming, Fishing & Forestry | 70 (84.3%) | 13 (15.7%) |
| Construction & Extraction | 137 (100.0%) | 0 (0.0%) |
| Installation, Maintenance & Repair | 197 (100.0%) | 0 (0.0%) |
| Total (Category) | 404 (96.9%) | 13 (3.1%) |
| Total (Overall) | 1,308 (53.1%) | 1,155 (46.9%) |
Production, Transportation and Moving Occupations
The most common Production, Transportation and Moving occupations in Rooks County are Production (98 | 4.0%), Material Moving (78 | 3.2%), and Transportation (61 | 2.5%).
Production, Transportation and Moving Occupations by Sex
| Occupation | Male | Female |
| Production | 96 (98.0%) | 2 (2.0%) |
| Transportation | 54 (88.5%) | 7 (11.5%) |
| Material Moving | 75 (96.2%) | 3 (3.8%) |
| Total (Category) | 225 (94.9%) | 12 (5.1%) |
| Total (Overall) | 1,308 (53.1%) | 1,155 (46.9%) |
Employment Industries by Sex in Rooks County
Employment Industries in Rooks County
The major employment industries in Rooks County include Health Care & Social Assistance (462 | 18.8%), Educational Services (282 | 11.5%), Retail Trade (209 | 8.5%), Agriculture, Fishing & Hunting (189 | 7.7%), and Mining, Quarrying, & Extraction (181 | 7.3%).
Employment Industries by Sex in Rooks County
The Rooks County industries that see more men than women are Utilities (100.0%), Mining, Quarrying, & Extraction (97.8%), and Manufacturing (95.0%), whereas the industries that tend to have a higher number of women are Health Care & Social Assistance (90.7%), Educational Services (79.4%), and Finance & Insurance (76.7%).
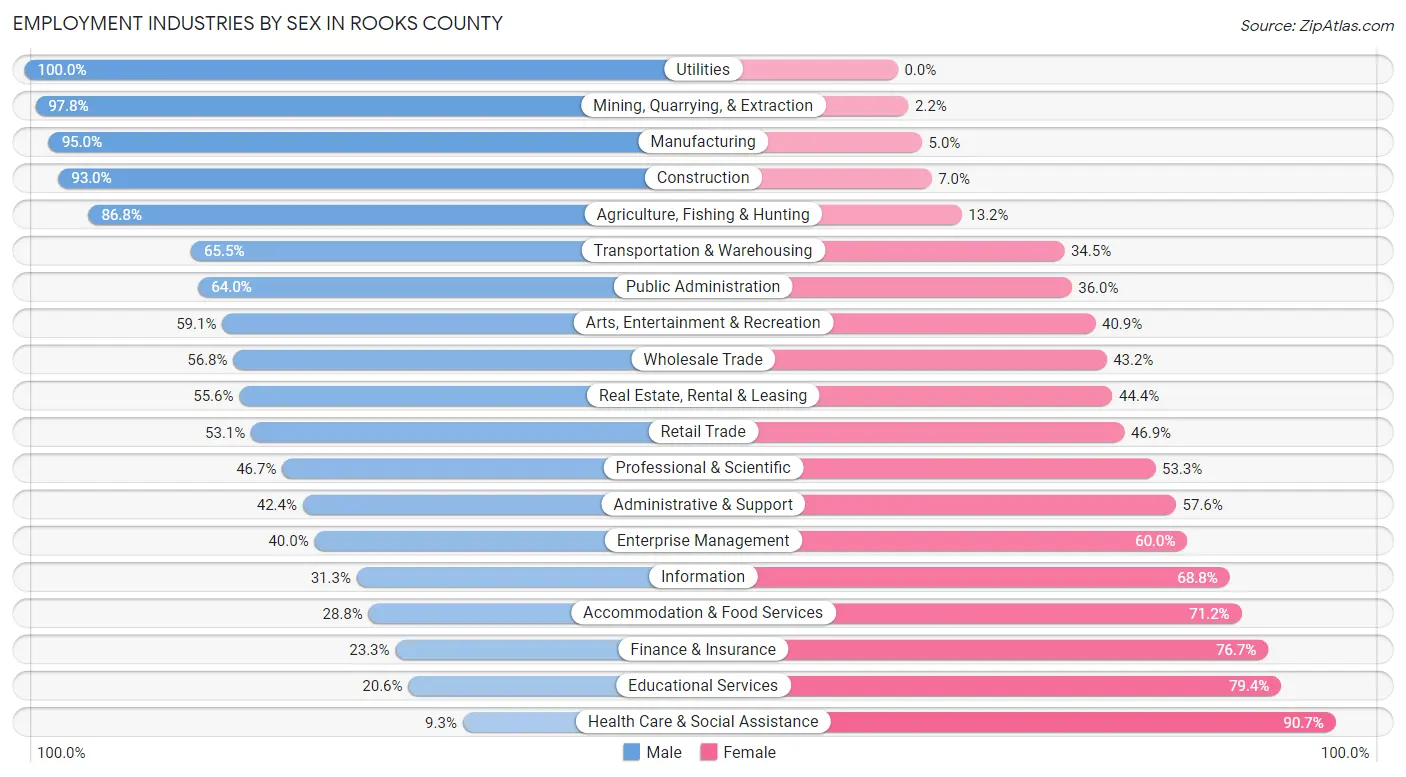
| Industry | Male | Female |
| Agriculture, Fishing & Hunting | 164 (86.8%) | 25 (13.2%) |
| Mining, Quarrying, & Extraction | 177 (97.8%) | 4 (2.2%) |
| Construction | 93 (93.0%) | 7 (7.0%) |
| Manufacturing | 171 (95.0%) | 9 (5.0%) |
| Wholesale Trade | 46 (56.8%) | 35 (43.2%) |
| Retail Trade | 111 (53.1%) | 98 (46.9%) |
| Transportation & Warehousing | 76 (65.5%) | 40 (34.5%) |
| Utilities | 35 (100.0%) | 0 (0.0%) |
| Information | 5 (31.2%) | 11 (68.8%) |
| Finance & Insurance | 10 (23.3%) | 33 (76.7%) |
| Real Estate, Rental & Leasing | 5 (55.6%) | 4 (44.4%) |
| Professional & Scientific | 21 (46.7%) | 24 (53.3%) |
| Enterprise Management | 4 (40.0%) | 6 (60.0%) |
| Administrative & Support | 28 (42.4%) | 38 (57.6%) |
| Educational Services | 58 (20.6%) | 224 (79.4%) |
| Health Care & Social Assistance | 43 (9.3%) | 419 (90.7%) |
| Arts, Entertainment & Recreation | 13 (59.1%) | 9 (40.9%) |
| Accommodation & Food Services | 17 (28.8%) | 42 (71.2%) |
| Public Administration | 105 (64.0%) | 59 (36.0%) |
| Total | 1,308 (53.1%) | 1,155 (46.9%) |
Education in Rooks County
School Enrollment in Rooks County
The most common levels of schooling among the 1,082 students in Rooks County are high school (283 | 26.2%), elementary school (236 | 21.8%), and middle school (209 | 19.3%).
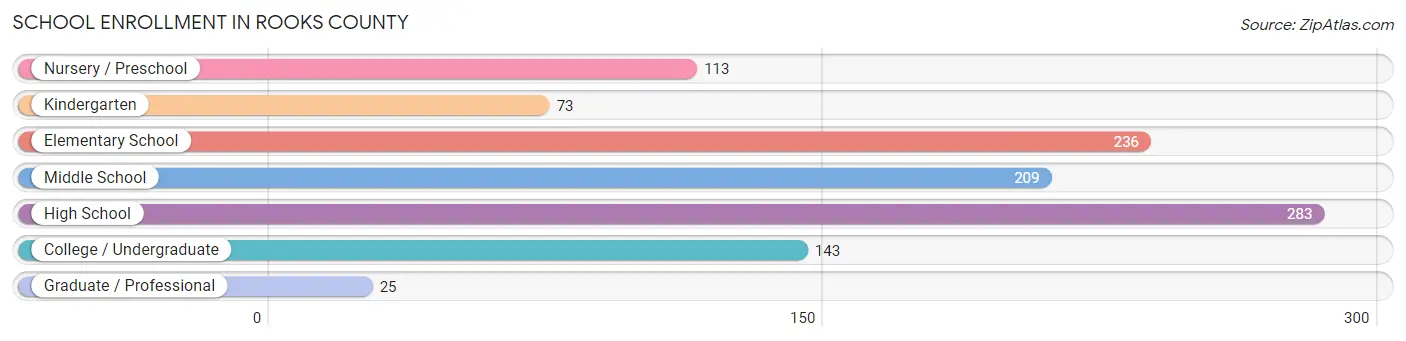
| School Level | # Students | % Students |
| Nursery / Preschool | 113 | 10.4% |
| Kindergarten | 73 | 6.8% |
| Elementary School | 236 | 21.8% |
| Middle School | 209 | 19.3% |
| High School | 283 | 26.2% |
| College / Undergraduate | 143 | 13.2% |
| Graduate / Professional | 25 | 2.3% |
| Total | 1,082 | 100.0% |
School Enrollment by Age by Funding Source in Rooks County
Out of a total of 1,082 students who are enrolled in schools in Rooks County, 121 (11.2%) attend a private institution, while the remaining 961 (88.8%) are enrolled in public schools. The age group of 35 years and over has the highest likelihood of being enrolled in private schools, with 13 (21.0% in the age bracket) enrolled. Conversely, the age group of 18 to 19 year olds has the lowest likelihood of being enrolled in a private school, with 76 (100.0% in the age bracket) attending a public institution.

| Age Bracket | Public School | Private School |
| 3 to 4 Year Olds | 95 (95.0%) | 5 (5.0%) |
| 5 to 9 Year Old | 254 (87.6%) | 36 (12.4%) |
| 10 to 14 Year Olds | 235 (86.7%) | 36 (13.3%) |
| 15 to 17 Year Olds | 154 (83.7%) | 30 (16.3%) |
| 18 to 19 Year Olds | 76 (100.0%) | 0 (0.0%) |
| 20 to 24 Year Olds | 54 (98.2%) | 1 (1.8%) |
| 25 to 34 Year Olds | 44 (100.0%) | 0 (0.0%) |
| 35 Years and over | 49 (79.0%) | 13 (21.0%) |
| Total | 961 (88.8%) | 121 (11.2%) |
Educational Attainment by Field of Study in Rooks County
Education (238 | 27.0%), business (135 | 15.3%), liberal arts & history (104 | 11.8%), bio, nature & agricultural (76 | 8.6%), and science & technology (67 | 7.6%) are the most common fields of study among 883 individuals in Rooks County who have obtained a bachelor's degree or higher.

| Field of Study | # Graduates | % Graduates |
| Computers & Mathematics | 12 | 1.4% |
| Bio, Nature & Agricultural | 76 | 8.6% |
| Physical & Health Sciences | 26 | 2.9% |
| Psychology | 32 | 3.6% |
| Social Sciences | 55 | 6.2% |
| Engineering | 15 | 1.7% |
| Multidisciplinary Studies | 8 | 0.9% |
| Science & Technology | 67 | 7.6% |
| Business | 135 | 15.3% |
| Education | 238 | 27.0% |
| Literature & Languages | 21 | 2.4% |
| Liberal Arts & History | 104 | 11.8% |
| Visual & Performing Arts | 19 | 2.1% |
| Communications | 13 | 1.5% |
| Arts & Humanities | 62 | 7.0% |
| Total | 883 | 100.0% |
Transportation & Commute in Rooks County
Vehicle Availability by Sex in Rooks County
The most prevalent vehicle ownership categories in Rooks County are males with 2 vehicles (491, accounting for 38.6%) and females with 2 vehicles (377, making up 43.1%).
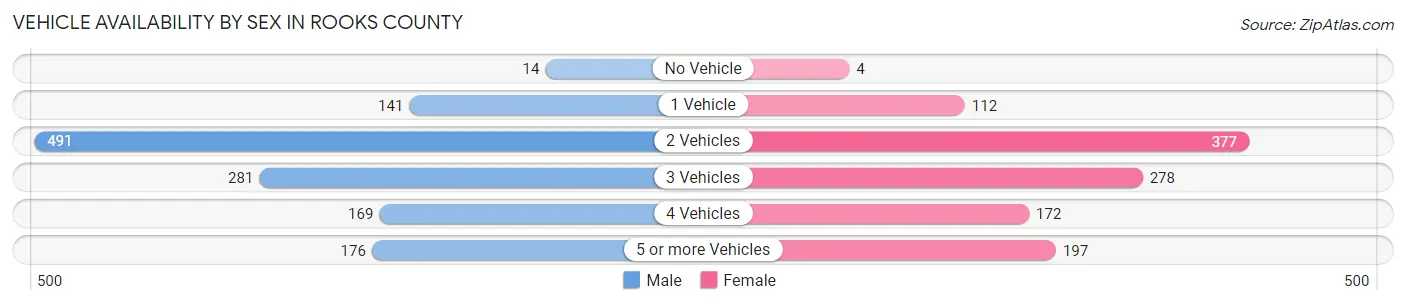
| Vehicles Available | Male | Female |
| No Vehicle | 14 (1.1%) | 4 (0.4%) |
| 1 Vehicle | 141 (11.1%) | 112 (9.8%) |
| 2 Vehicles | 491 (38.6%) | 377 (33.1%) |
| 3 Vehicles | 281 (22.1%) | 278 (24.4%) |
| 4 Vehicles | 169 (13.3%) | 172 (15.1%) |
| 5 or more Vehicles | 176 (13.8%) | 197 (17.3%) |
| Total | 1,272 (100.0%) | 1,140 (100.0%) |
Commute Time in Rooks County
The most frequently occuring commute durations in Rooks County are less than 5 minutes (579 commuters, 25.6%), 5 to 9 minutes (534 commuters, 23.6%), and 10 to 14 minutes (260 commuters, 11.5%).
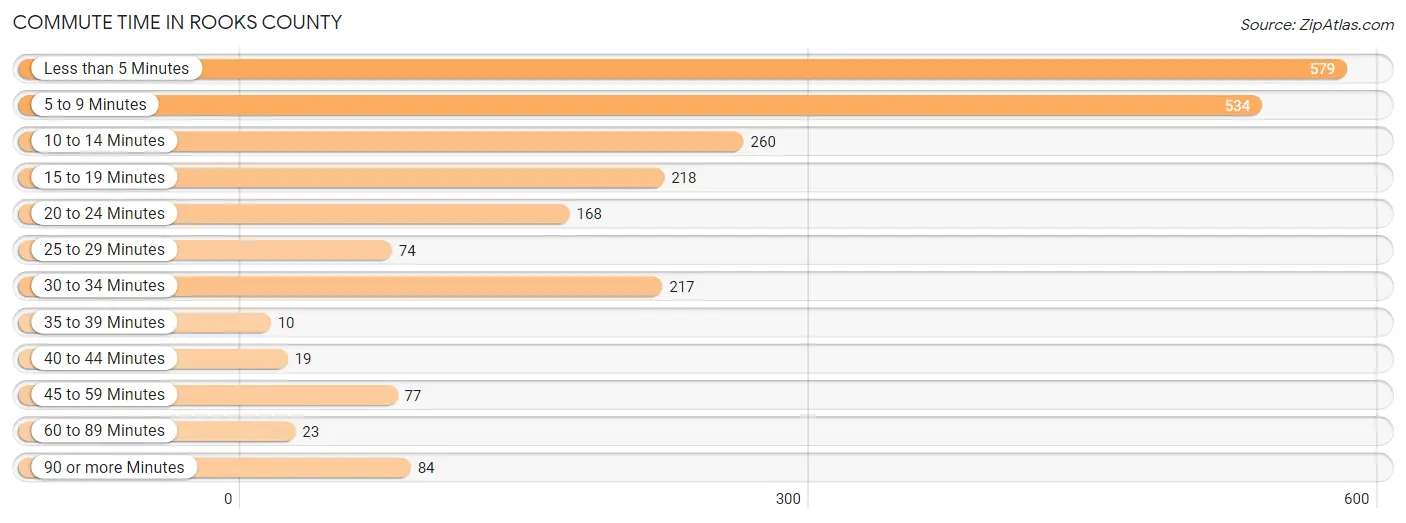
| Commute Time | # Commuters | % Commuters |
| Less than 5 Minutes | 579 | 25.6% |
| 5 to 9 Minutes | 534 | 23.6% |
| 10 to 14 Minutes | 260 | 11.5% |
| 15 to 19 Minutes | 218 | 9.6% |
| 20 to 24 Minutes | 168 | 7.4% |
| 25 to 29 Minutes | 74 | 3.3% |
| 30 to 34 Minutes | 217 | 9.6% |
| 35 to 39 Minutes | 10 | 0.4% |
| 40 to 44 Minutes | 19 | 0.8% |
| 45 to 59 Minutes | 77 | 3.4% |
| 60 to 89 Minutes | 23 | 1.0% |
| 90 or more Minutes | 84 | 3.7% |
Commute Time by Sex in Rooks County
The most common commute times in Rooks County are 5 to 9 minutes (284 commuters, 23.1%) for males and less than 5 minutes (346 commuters, 33.5%) for females.
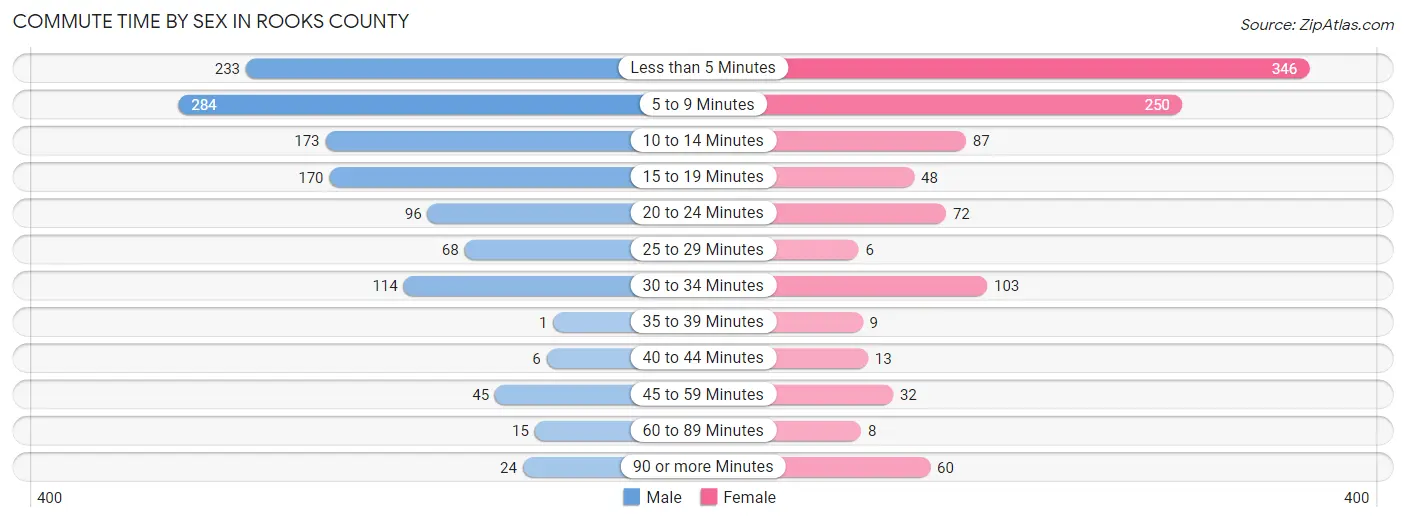
| Commute Time | Male | Female |
| Less than 5 Minutes | 233 (19.0%) | 346 (33.5%) |
| 5 to 9 Minutes | 284 (23.1%) | 250 (24.2%) |
| 10 to 14 Minutes | 173 (14.1%) | 87 (8.4%) |
| 15 to 19 Minutes | 170 (13.8%) | 48 (4.6%) |
| 20 to 24 Minutes | 96 (7.8%) | 72 (7.0%) |
| 25 to 29 Minutes | 68 (5.5%) | 6 (0.6%) |
| 30 to 34 Minutes | 114 (9.3%) | 103 (10.0%) |
| 35 to 39 Minutes | 1 (0.1%) | 9 (0.9%) |
| 40 to 44 Minutes | 6 (0.5%) | 13 (1.3%) |
| 45 to 59 Minutes | 45 (3.7%) | 32 (3.1%) |
| 60 to 89 Minutes | 15 (1.2%) | 8 (0.8%) |
| 90 or more Minutes | 24 (1.9%) | 60 (5.8%) |
Time of Departure to Work by Sex in Rooks County
The most frequent times of departure to work in Rooks County are 7:00 AM to 7:29 AM (291, 23.7%) for males and 7:30 AM to 7:59 AM (240, 23.2%) for females.
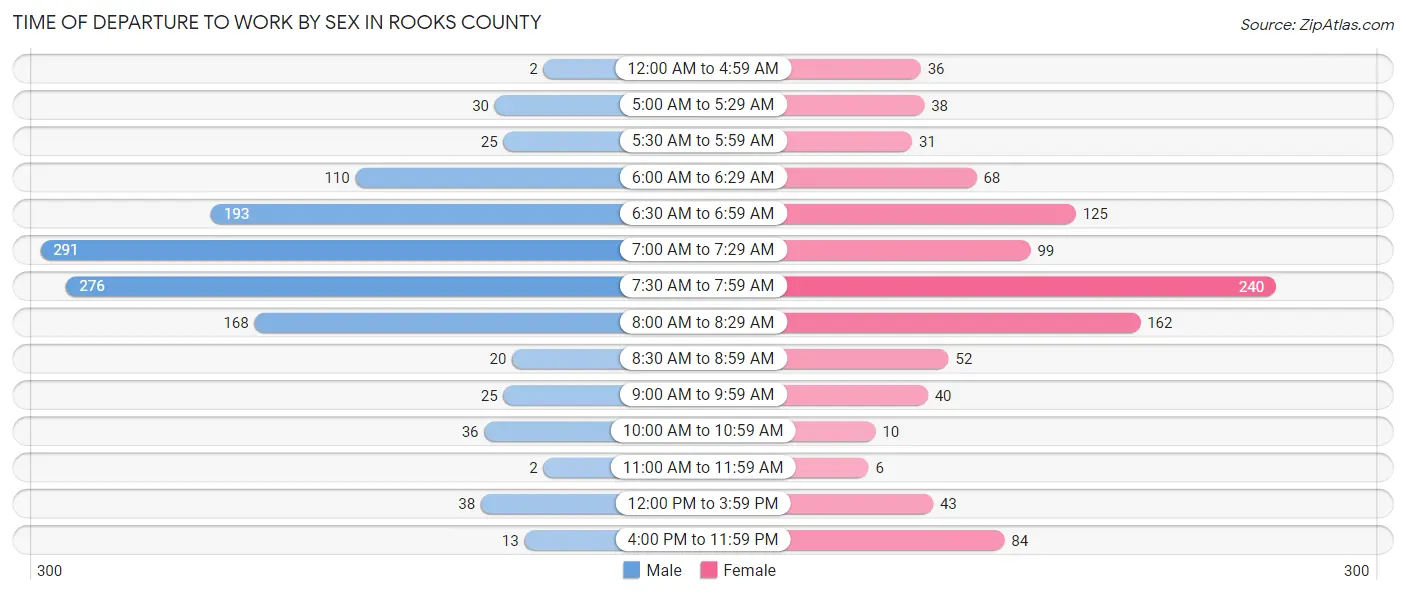
| Time of Departure | Male | Female |
| 12:00 AM to 4:59 AM | 2 (0.2%) | 36 (3.5%) |
| 5:00 AM to 5:29 AM | 30 (2.4%) | 38 (3.7%) |
| 5:30 AM to 5:59 AM | 25 (2.0%) | 31 (3.0%) |
| 6:00 AM to 6:29 AM | 110 (8.9%) | 68 (6.6%) |
| 6:30 AM to 6:59 AM | 193 (15.7%) | 125 (12.1%) |
| 7:00 AM to 7:29 AM | 291 (23.7%) | 99 (9.6%) |
| 7:30 AM to 7:59 AM | 276 (22.5%) | 240 (23.2%) |
| 8:00 AM to 8:29 AM | 168 (13.7%) | 162 (15.7%) |
| 8:30 AM to 8:59 AM | 20 (1.6%) | 52 (5.0%) |
| 9:00 AM to 9:59 AM | 25 (2.0%) | 40 (3.9%) |
| 10:00 AM to 10:59 AM | 36 (2.9%) | 10 (1.0%) |
| 11:00 AM to 11:59 AM | 2 (0.2%) | 6 (0.6%) |
| 12:00 PM to 3:59 PM | 38 (3.1%) | 43 (4.2%) |
| 4:00 PM to 11:59 PM | 13 (1.1%) | 84 (8.1%) |
| Total | 1,229 (100.0%) | 1,034 (100.0%) |
Housing Occupancy in Rooks County
Occupancy by Ownership in Rooks County
Of the total 2,127 dwellings in Rooks County, owner-occupied units account for 1,604 (75.4%), while renter-occupied units make up 523 (24.6%).
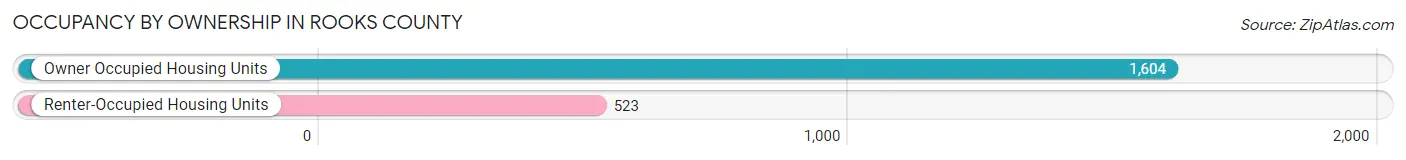
| Occupancy | # Housing Units | % Housing Units |
| Owner Occupied Housing Units | 1,604 | 75.4% |
| Renter-Occupied Housing Units | 523 | 24.6% |
| Total Occupied Housing Units | 2,127 | 100.0% |
Occupancy by Household Size in Rooks County
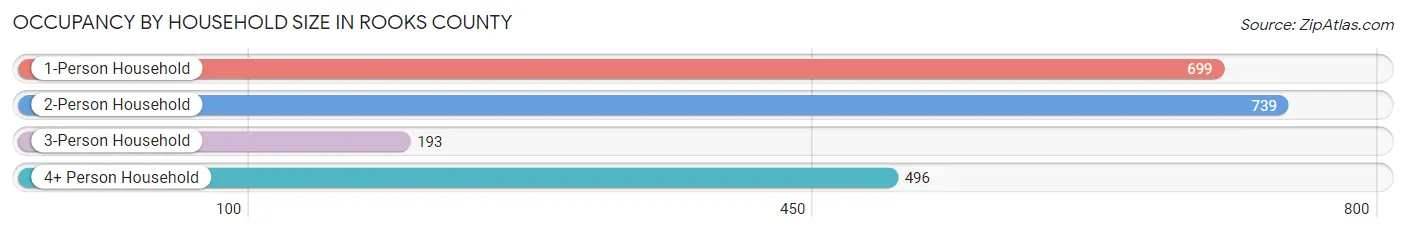
| Household Size | # Housing Units | % Housing Units |
| 1-Person Household | 699 | 32.9% |
| 2-Person Household | 739 | 34.7% |
| 3-Person Household | 193 | 9.1% |
| 4+ Person Household | 496 | 23.3% |
| Total Housing Units | 2,127 | 100.0% |
Occupancy by Ownership by Household Size in Rooks County
| Household Size | Owner-occupied | Renter-occupied |
| 1-Person Household | 416 (59.5%) | 283 (40.5%) |
| 2-Person Household | 617 (83.5%) | 122 (16.5%) |
| 3-Person Household | 181 (93.8%) | 12 (6.2%) |
| 4+ Person Household | 390 (78.6%) | 106 (21.4%) |
| Total Housing Units | 1,604 (75.4%) | 523 (24.6%) |
Occupancy by Educational Attainment in Rooks County

| Household Size | Owner-occupied | Renter-occupied |
| Less than High School | 97 (70.3%) | 41 (29.7%) |
| High School Diploma | 505 (80.2%) | 125 (19.8%) |
| College/Associate Degree | 607 (75.3%) | 199 (24.7%) |
| Bachelor's Degree or higher | 395 (71.4%) | 158 (28.6%) |
Occupancy by Age of Householder in Rooks County
| Age Bracket | # Households | % Households |
| Under 35 Years | 401 | 18.9% |
| 35 to 44 Years | 307 | 14.4% |
| 45 to 54 Years | 259 | 12.2% |
| 55 to 64 Years | 401 | 18.9% |
| 65 to 74 Years | 381 | 17.9% |
| 75 to 84 Years | 200 | 9.4% |
| 85 Years and Over | 178 | 8.4% |
| Total | 2,127 | 100.0% |
Housing Finances in Rooks County
Median Income by Occupancy in Rooks County
| Occupancy Type | # Households | Median Income |
| Owner-Occupied | 1,604 (75.4%) | $70,094 |
| Renter-Occupied | 523 (24.6%) | $49,306 |
| Average | 2,127 (100.0%) | $60,821 |
Occupancy by Householder Income Bracket in Rooks County
| Income Bracket | Owner-occupied | Renter-occupied |
| Less than $5,000 | 37 (2.3%) | 9 (1.7%) |
| $5,000 to $9,999 | 7 (0.4%) | 26 (5.0%) |
| $10,000 to $14,999 | 21 (1.3%) | 37 (7.1%) |
| $15,000 to $19,999 | 40 (2.5%) | 27 (5.2%) |
| $20,000 to $24,999 | 19 (1.2%) | 18 (3.4%) |
| $25,000 to $34,999 | 97 (6.0%) | 54 (10.3%) |
| $35,000 to $49,999 | 254 (15.8%) | 103 (19.7%) |
| $50,000 to $74,999 | 404 (25.2%) | 91 (17.4%) |
| $75,000 to $99,999 | 268 (16.7%) | 48 (9.2%) |
| $100,000 to $149,999 | 317 (19.8%) | 85 (16.3%) |
| $150,000 or more | 140 (8.7%) | 25 (4.8%) |
| Total | 1,604 (100.0%) | 523 (100.0%) |
Monthly Housing Cost Tiers in Rooks County
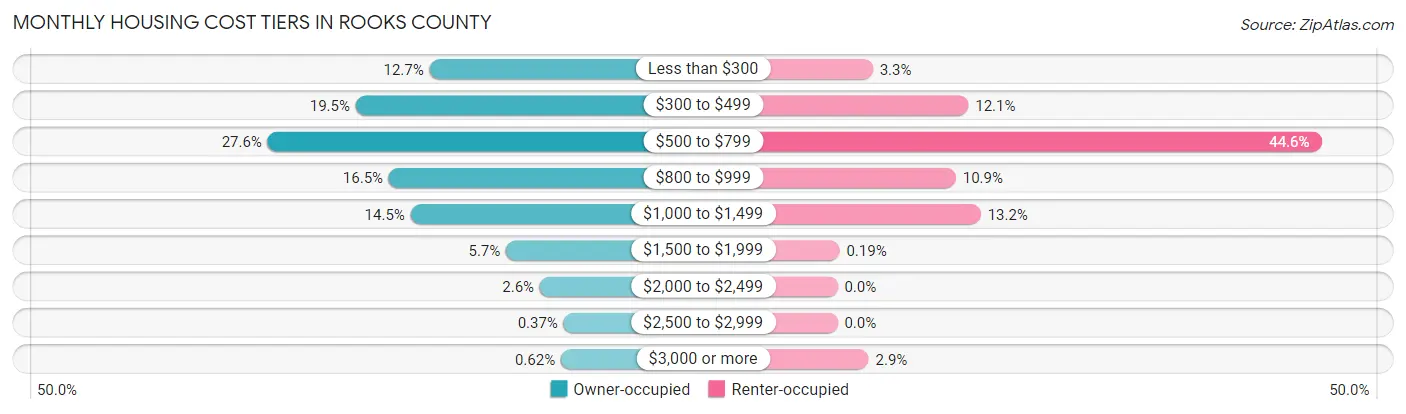
| Monthly Cost | Owner-occupied | Renter-occupied |
| Less than $300 | 204 (12.7%) | 17 (3.3%) |
| $300 to $499 | 313 (19.5%) | 63 (12.0%) |
| $500 to $799 | 443 (27.6%) | 233 (44.6%) |
| $800 to $999 | 264 (16.5%) | 57 (10.9%) |
| $1,000 to $1,499 | 232 (14.5%) | 69 (13.2%) |
| $1,500 to $1,999 | 91 (5.7%) | 1 (0.2%) |
| $2,000 to $2,499 | 41 (2.6%) | 0 (0.0%) |
| $2,500 to $2,999 | 6 (0.4%) | 0 (0.0%) |
| $3,000 or more | 10 (0.6%) | 15 (2.9%) |
| Total | 1,604 (100.0%) | 523 (100.0%) |
Physical Housing Characteristics in Rooks County
Housing Structures in Rooks County
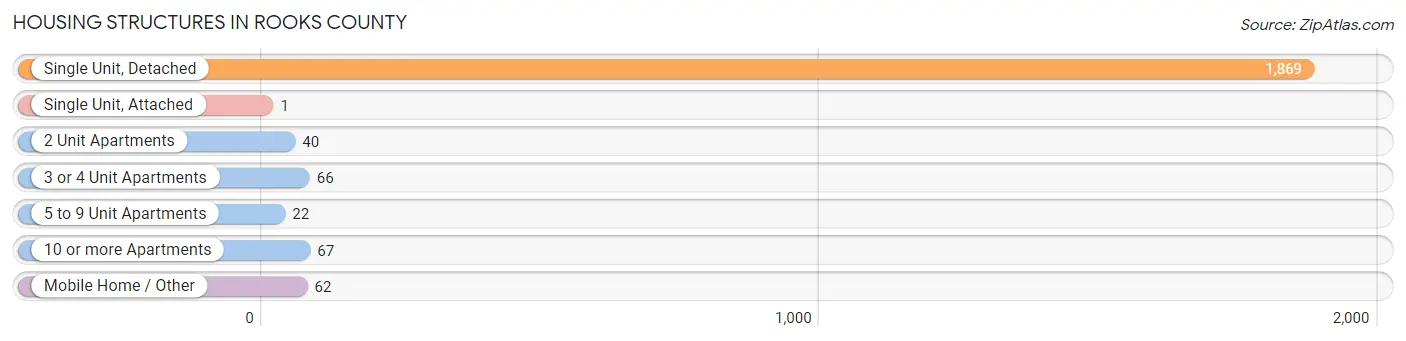
| Structure Type | # Housing Units | % Housing Units |
| Single Unit, Detached | 1,869 | 87.9% |
| Single Unit, Attached | 1 | 0.1% |
| 2 Unit Apartments | 40 | 1.9% |
| 3 or 4 Unit Apartments | 66 | 3.1% |
| 5 to 9 Unit Apartments | 22 | 1.0% |
| 10 or more Apartments | 67 | 3.2% |
| Mobile Home / Other | 62 | 2.9% |
| Total | 2,127 | 100.0% |
Housing Structures by Occupancy in Rooks County
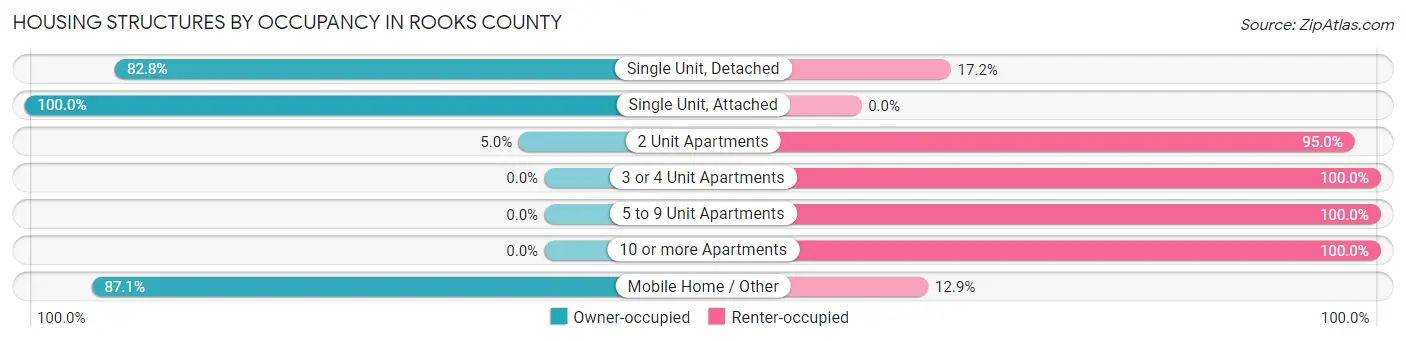
| Structure Type | Owner-occupied | Renter-occupied |
| Single Unit, Detached | 1,547 (82.8%) | 322 (17.2%) |
| Single Unit, Attached | 1 (100.0%) | 0 (0.0%) |
| 2 Unit Apartments | 2 (5.0%) | 38 (95.0%) |
| 3 or 4 Unit Apartments | 0 (0.0%) | 66 (100.0%) |
| 5 to 9 Unit Apartments | 0 (0.0%) | 22 (100.0%) |
| 10 or more Apartments | 0 (0.0%) | 67 (100.0%) |
| Mobile Home / Other | 54 (87.1%) | 8 (12.9%) |
| Total | 1,604 (75.4%) | 523 (24.6%) |
Housing Structures by Number of Rooms in Rooks County
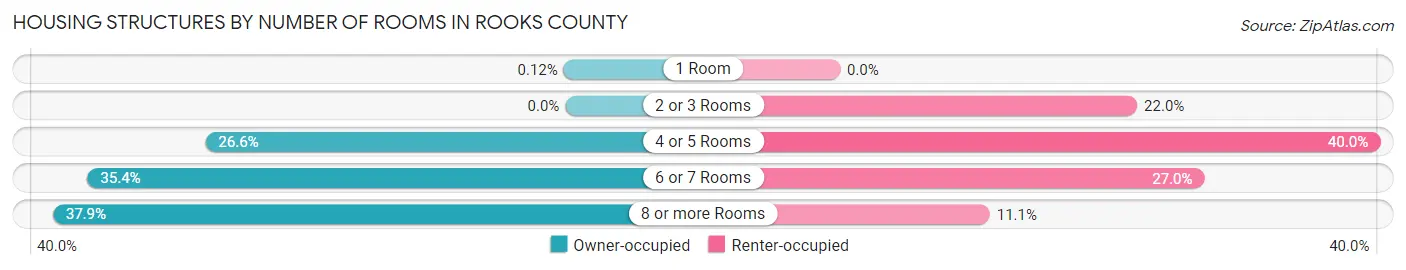
| Number of Rooms | Owner-occupied | Renter-occupied |
| 1 Room | 2 (0.1%) | 0 (0.0%) |
| 2 or 3 Rooms | 0 (0.0%) | 115 (22.0%) |
| 4 or 5 Rooms | 427 (26.6%) | 209 (40.0%) |
| 6 or 7 Rooms | 567 (35.3%) | 141 (27.0%) |
| 8 or more Rooms | 608 (37.9%) | 58 (11.1%) |
| Total | 1,604 (100.0%) | 523 (100.0%) |
Housing Structure by Heating Type in Rooks County
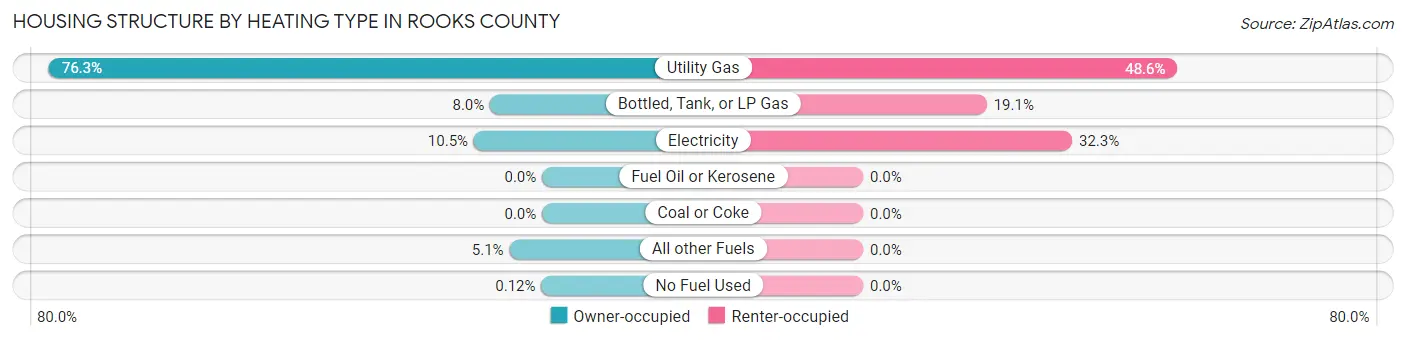
| Heating Type | Owner-occupied | Renter-occupied |
| Utility Gas | 1,223 (76.2%) | 254 (48.6%) |
| Bottled, Tank, or LP Gas | 129 (8.0%) | 100 (19.1%) |
| Electricity | 169 (10.5%) | 169 (32.3%) |
| Fuel Oil or Kerosene | 0 (0.0%) | 0 (0.0%) |
| Coal or Coke | 0 (0.0%) | 0 (0.0%) |
| All other Fuels | 81 (5.1%) | 0 (0.0%) |
| No Fuel Used | 2 (0.1%) | 0 (0.0%) |
| Total | 1,604 (100.0%) | 523 (100.0%) |
Household Vehicle Usage in Rooks County
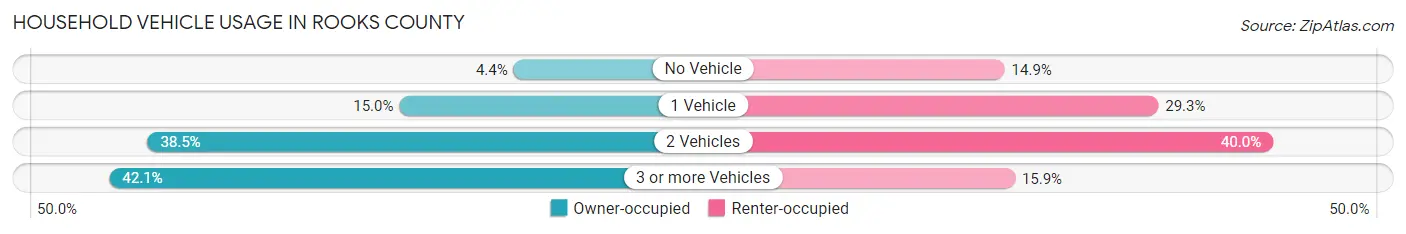
| Vehicles per Household | Owner-occupied | Renter-occupied |
| No Vehicle | 70 (4.4%) | 78 (14.9%) |
| 1 Vehicle | 241 (15.0%) | 153 (29.2%) |
| 2 Vehicles | 618 (38.5%) | 209 (40.0%) |
| 3 or more Vehicles | 675 (42.1%) | 83 (15.9%) |
| Total | 1,604 (100.0%) | 523 (100.0%) |
Real Estate & Mortgages in Rooks County
Real Estate and Mortgage Overview in Rooks County
| Characteristic | Without Mortgage | With Mortgage |
| Housing Units | 997 | 607 |
| Median Property Value | $86,600 | $89,600 |
| Median Household Income | $57,736 | $62 |
| Monthly Housing Costs | $497 | $10 |
| Real Estate Taxes | $1,429 | $11 |
Property Value by Mortgage Status in Rooks County
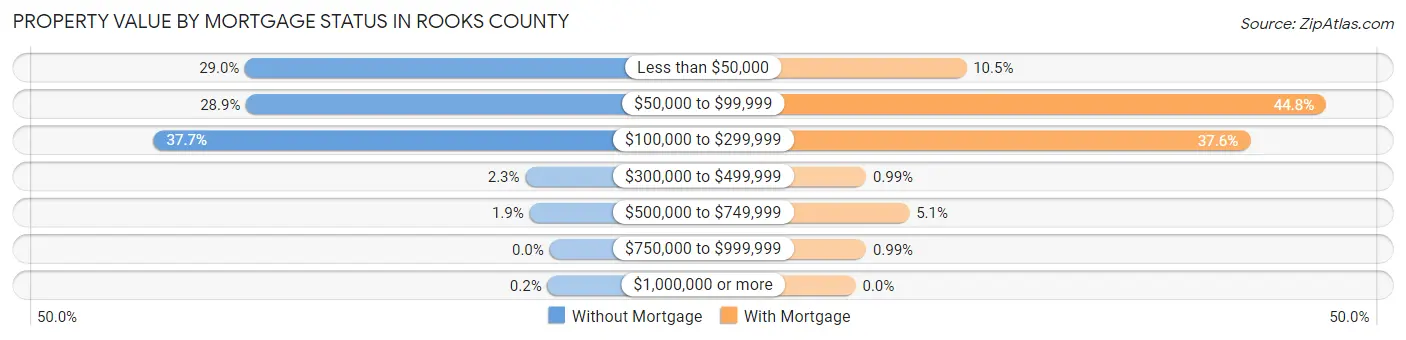
| Property Value | Without Mortgage | With Mortgage |
| Less than $50,000 | 289 (29.0%) | 64 (10.5%) |
| $50,000 to $99,999 | 288 (28.9%) | 272 (44.8%) |
| $100,000 to $299,999 | 376 (37.7%) | 228 (37.6%) |
| $300,000 to $499,999 | 23 (2.3%) | 6 (1.0%) |
| $500,000 to $749,999 | 19 (1.9%) | 31 (5.1%) |
| $750,000 to $999,999 | 0 (0.0%) | 6 (1.0%) |
| $1,000,000 or more | 2 (0.2%) | 0 (0.0%) |
| Total | 997 (100.0%) | 607 (100.0%) |
Household Income by Mortgage Status in Rooks County
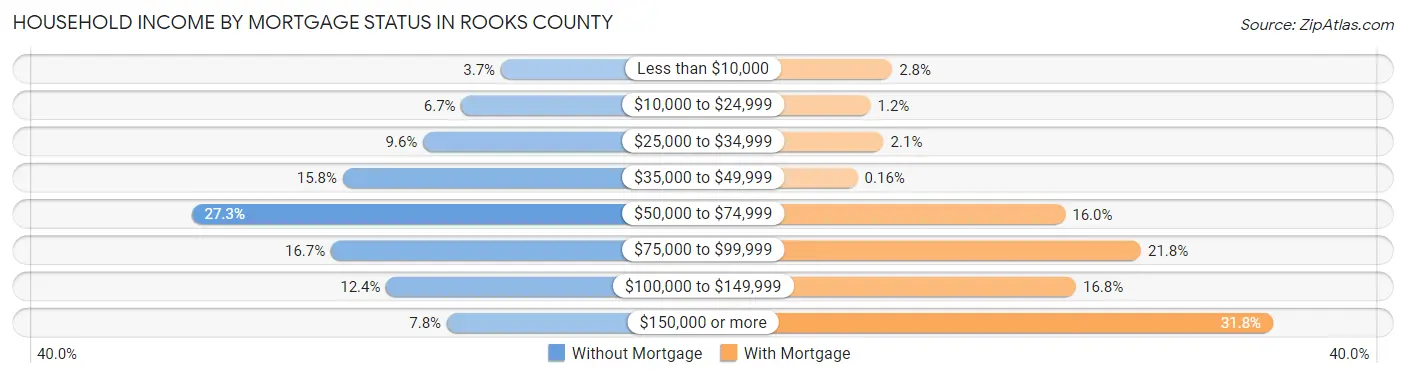
| Household Income | Without Mortgage | With Mortgage |
| Less than $10,000 | 37 (3.7%) | 17 (2.8%) |
| $10,000 to $24,999 | 67 (6.7%) | 7 (1.1%) |
| $25,000 to $34,999 | 96 (9.6%) | 13 (2.1%) |
| $35,000 to $49,999 | 157 (15.8%) | 1 (0.2%) |
| $50,000 to $74,999 | 272 (27.3%) | 97 (16.0%) |
| $75,000 to $99,999 | 166 (16.7%) | 132 (21.7%) |
| $100,000 to $149,999 | 124 (12.4%) | 102 (16.8%) |
| $150,000 or more | 78 (7.8%) | 193 (31.8%) |
| Total | 997 (100.0%) | 607 (100.0%) |
Property Value to Household Income Ratio in Rooks County
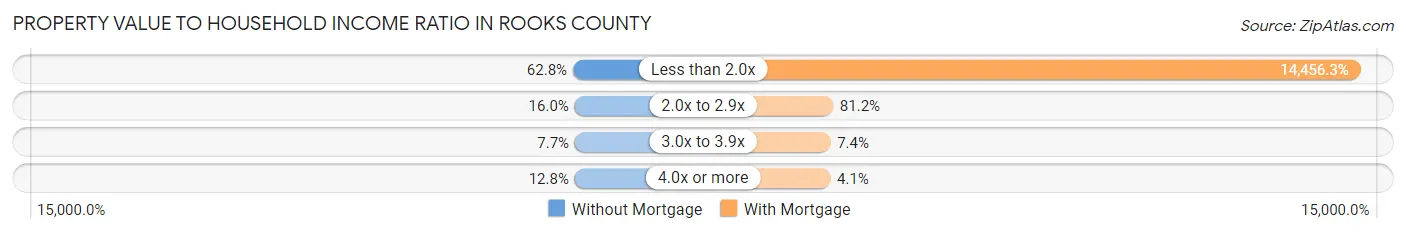
| Value-to-Income Ratio | Without Mortgage | With Mortgage |
| Less than 2.0x | 626 (62.8%) | 87,750 (14,456.3%) |
| 2.0x to 2.9x | 159 (16.0%) | 493 (81.2%) |
| 3.0x to 3.9x | 77 (7.7%) | 45 (7.4%) |
| 4.0x or more | 128 (12.8%) | 25 (4.1%) |
| Total | 997 (100.0%) | 607 (100.0%) |
Real Estate Taxes by Mortgage Status in Rooks County
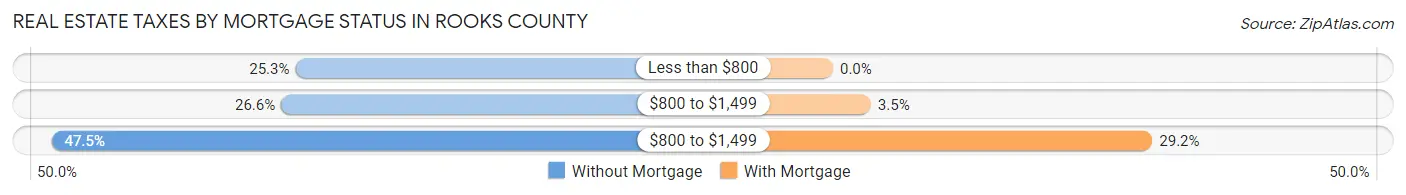
| Property Taxes | Without Mortgage | With Mortgage |
| Less than $800 | 252 (25.3%) | 0 (0.0%) |
| $800 to $1,499 | 265 (26.6%) | 21 (3.5%) |
| $800 to $1,499 | 474 (47.5%) | 177 (29.2%) |
| Total | 997 (100.0%) | 607 (100.0%) |
Health & Disability in Rooks County
Health Insurance Coverage by Age in Rooks County

| Age Bracket | With Coverage | Without Coverage |
| Under 6 Years | 328 (100.0%) | 0 (0.0%) |
| 6 to 18 Years | 780 (99.2%) | 6 (0.8%) |
| 19 to 25 Years | 251 (81.2%) | 58 (18.8%) |
| 26 to 34 Years | 374 (87.0%) | 56 (13.0%) |
| 35 to 44 Years | 475 (94.6%) | 27 (5.4%) |
| 45 to 54 Years | 485 (91.3%) | 46 (8.7%) |
| 55 to 64 Years | 713 (93.9%) | 46 (6.1%) |
| 65 to 74 Years | 582 (98.0%) | 12 (2.0%) |
| 75 Years and older | 483 (100.0%) | 0 (0.0%) |
| Total | 4,471 (94.7%) | 251 (5.3%) |
Health Insurance Coverage by Citizenship Status in Rooks County

| Citizenship Status | With Coverage | Without Coverage |
| Native Born | 328 (100.0%) | 0 (0.0%) |
| Foreign Born, Citizen | 780 (99.2%) | 6 (0.8%) |
| Foreign Born, not a Citizen | 251 (81.2%) | 58 (18.8%) |
Health Insurance Coverage by Household Income in Rooks County
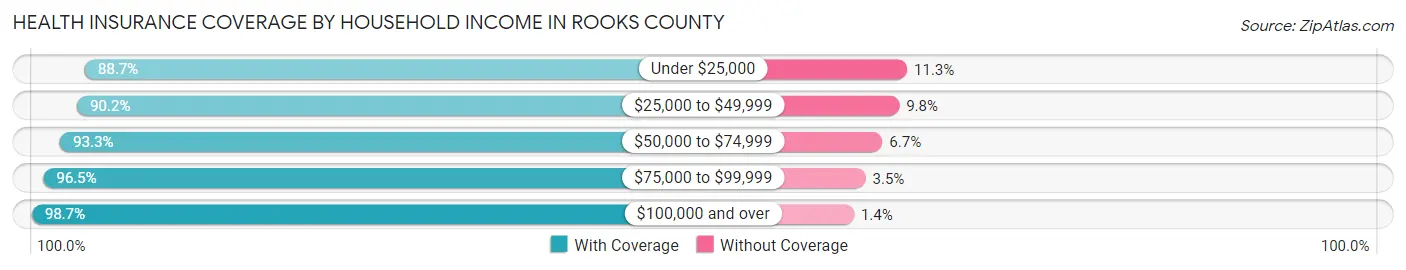
| Household Income | With Coverage | Without Coverage |
| Under $25,000 | 267 (88.7%) | 34 (11.3%) |
| $25,000 to $49,999 | 882 (90.2%) | 96 (9.8%) |
| $50,000 to $74,999 | 965 (93.3%) | 69 (6.7%) |
| $75,000 to $99,999 | 823 (96.5%) | 30 (3.5%) |
| $100,000 and over | 1,531 (98.7%) | 21 (1.3%) |
Public vs Private Health Insurance Coverage by Age in Rooks County

| Age Bracket | Public Insurance | Private Insurance |
| Under 6 | 129 (39.3%) | 245 (74.7%) |
| 6 to 18 Years | 353 (44.9%) | 483 (61.5%) |
| 19 to 25 Years | 42 (13.6%) | 229 (74.1%) |
| 25 to 34 Years | 33 (7.7%) | 351 (81.6%) |
| 35 to 44 Years | 83 (16.5%) | 426 (84.9%) |
| 45 to 54 Years | 48 (9.0%) | 465 (87.6%) |
| 55 to 64 Years | 137 (18.0%) | 662 (87.2%) |
| 65 to 74 Years | 576 (97.0%) | 277 (46.6%) |
| 75 Years and over | 483 (100.0%) | 343 (71.0%) |
| Total | 1,884 (39.9%) | 3,481 (73.7%) |
Disability Status by Sex by Age in Rooks County

| Age Bracket | Male | Female |
| Under 5 Years | 0 (0.0%) | 0 (0.0%) |
| 5 to 17 Years | 43 (11.8%) | 43 (10.4%) |
| 18 to 34 Years | 29 (7.1%) | 28 (7.0%) |
| 35 to 64 Years | 84 (9.5%) | 185 (20.5%) |
| 65 to 74 Years | 101 (34.7%) | 74 (24.4%) |
| 75 Years and over | 101 (49.3%) | 186 (66.9%) |
Disability Class by Sex by Age in Rooks County
Disability Class: Hearing Difficulty

| Age Bracket | Male | Female |
| Under 5 Years | 0 (0.0%) | 0 (0.0%) |
| 5 to 17 Years | 0 (0.0%) | 14 (3.4%) |
| 18 to 34 Years | 3 (0.7%) | 0 (0.0%) |
| 35 to 64 Years | 29 (3.3%) | 9 (1.0%) |
| 65 to 74 Years | 69 (23.7%) | 30 (9.9%) |
| 75 Years and over | 52 (25.4%) | 49 (17.6%) |
Disability Class: Vision Difficulty

| Age Bracket | Male | Female |
| Under 5 Years | 0 (0.0%) | 0 (0.0%) |
| 5 to 17 Years | 25 (6.9%) | 28 (6.8%) |
| 18 to 34 Years | 0 (0.0%) | 4 (1.0%) |
| 35 to 64 Years | 7 (0.8%) | 22 (2.4%) |
| 65 to 74 Years | 14 (4.8%) | 22 (7.3%) |
| 75 Years and over | 13 (6.3%) | 37 (13.3%) |
Disability Class: Cognitive Difficulty

| Age Bracket | Male | Female |
| 5 to 17 Years | 43 (11.8%) | 23 (5.6%) |
| 18 to 34 Years | 26 (6.3%) | 11 (2.7%) |
| 35 to 64 Years | 31 (3.5%) | 55 (6.1%) |
| 65 to 74 Years | 2 (0.7%) | 0 (0.0%) |
| 75 Years and over | 12 (5.9%) | 15 (5.4%) |
Disability Class: Ambulatory Difficulty
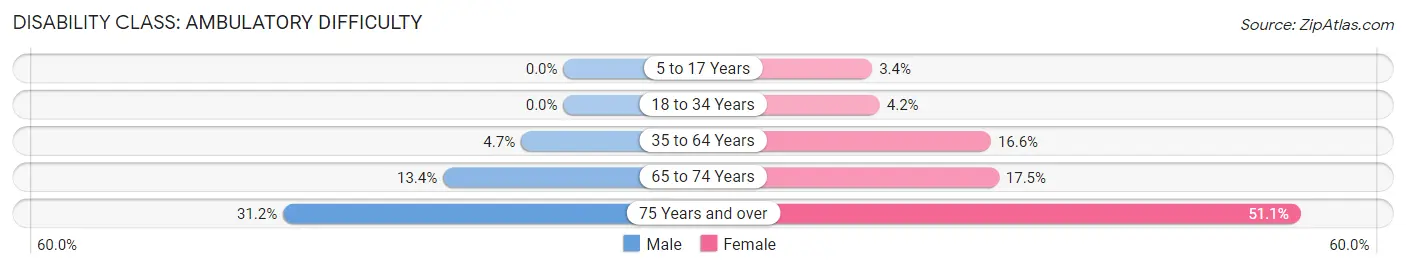
| Age Bracket | Male | Female |
| 5 to 17 Years | 0 (0.0%) | 14 (3.4%) |
| 18 to 34 Years | 0 (0.0%) | 17 (4.2%) |
| 35 to 64 Years | 42 (4.7%) | 150 (16.6%) |
| 65 to 74 Years | 39 (13.4%) | 53 (17.5%) |
| 75 Years and over | 64 (31.2%) | 142 (51.1%) |
Disability Class: Self-Care Difficulty
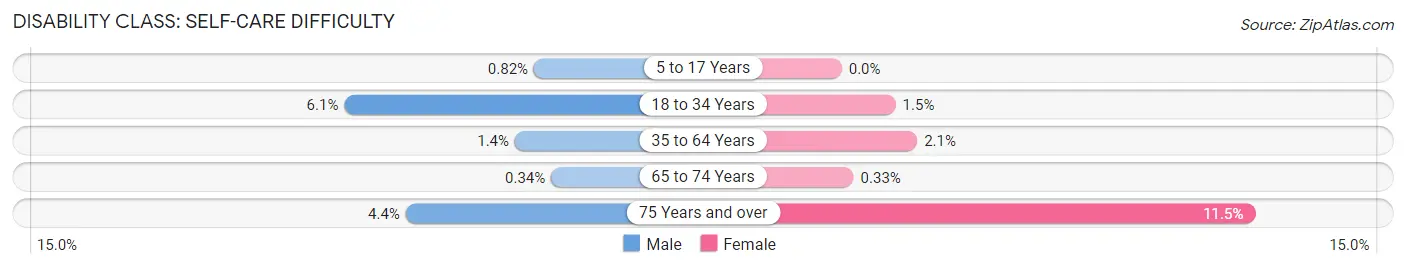
| Age Bracket | Male | Female |
| 5 to 17 Years | 3 (0.8%) | 0 (0.0%) |
| 18 to 34 Years | 25 (6.1%) | 6 (1.5%) |
| 35 to 64 Years | 12 (1.3%) | 19 (2.1%) |
| 65 to 74 Years | 1 (0.3%) | 1 (0.3%) |
| 75 Years and over | 9 (4.4%) | 32 (11.5%) |
Technology Access in Rooks County
Computing Device Access in Rooks County
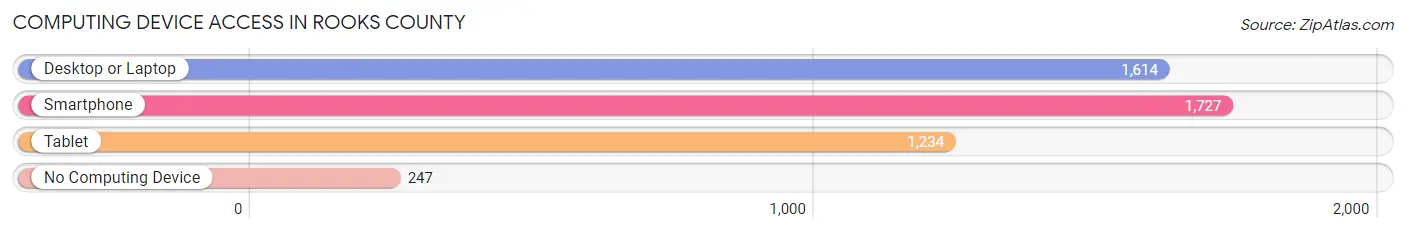
| Device Type | # Households | % Households |
| Desktop or Laptop | 1,614 | 75.9% |
| Smartphone | 1,727 | 81.2% |
| Tablet | 1,234 | 58.0% |
| No Computing Device | 247 | 11.6% |
| Total | 2,127 | 100.0% |
Internet Access in Rooks County
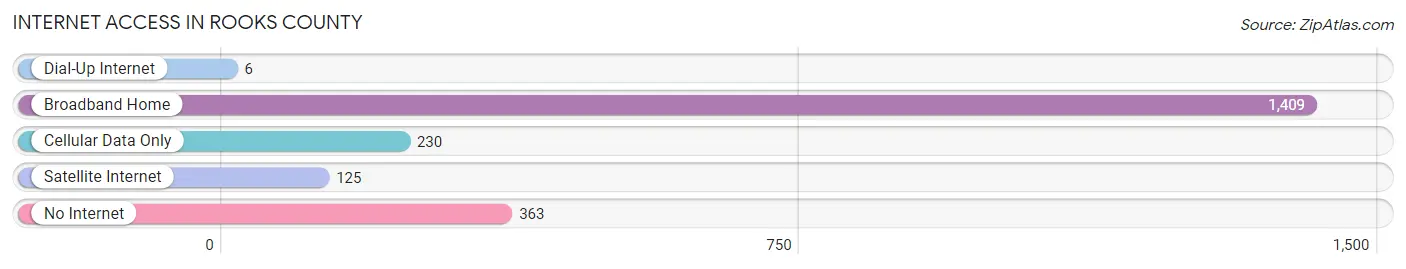
| Internet Type | # Households | % Households |
| Dial-Up Internet | 6 | 0.3% |
| Broadband Home | 1,409 | 66.2% |
| Cellular Data Only | 230 | 10.8% |
| Satellite Internet | 125 | 5.9% |
| No Internet | 363 | 17.1% |
| Total | 2,127 | 100.0% |
Rooks County Summary
Rooks County is located in the north-central part of the state of Kansas, and is bordered by Osborne, Smith, Ellis, and Phillips counties. The county seat is Stockton, and the county was named after John C. Rooks, a Union soldier who died in the Civil War. The county has a total area of 890 square miles, and a population of 5,181 as of the 2010 census.
History
Rooks County was established in 1867, and was originally part of Ellis County. The county was named after John C. Rooks, a Union soldier who died in the Civil War. The first settlers in the area were mostly German immigrants, who arrived in the late 1860s and early 1870s. The first post office in the county was established in 1871, and the first school was built in 1872.
The county was largely agricultural in the late 19th and early 20th centuries, with wheat, corn, and other grains being the main crops. The county also had a thriving livestock industry, with cattle, sheep, and hogs being raised in the area.
Geography
Rooks County is located in the north-central part of the state of Kansas, and is bordered by Osborne, Smith, Ellis, and Phillips counties. The county has a total area of 890 square miles, and is mostly flat, with some rolling hills in the eastern part of the county. The county is drained by the Solomon River, which flows through the county from north to south.
The county is home to several state parks, including Cedar Bluff State Park, which is located in the western part of the county. The park features a lake, camping, and hiking trails. The county also has several wildlife areas, including the Cedar Bluff Wildlife Area, which is located in the western part of the county.
Economy
Rooks County has a largely agricultural economy, with wheat, corn, and other grains being the main crops. The county also has a thriving livestock industry, with cattle, sheep, and hogs being raised in the area.
The county also has several manufacturing companies, including a furniture factory, a plastics factory, and a metal fabrication plant. The county also has several retail stores, including a grocery store, a hardware store, and a clothing store.
Demographics
As of the 2010 census, the population of Rooks County was 5,181. The racial makeup of the county was 95.3% White, 0.7% African American, 0.3% Native American, 0.2% Asian, 0.1% Pacific Islander, 1.7% from other races, and 1.9% from two or more races. Hispanic or Latino of any race were 3.2% of the population.
The median income for a household in the county was $41,944, and the median income for a family was $50,938. The per capita income for the county was $20,845. About 10.2% of families and 13.2% of the population were below the poverty line, including 17.2% of those under age 18 and 8.2% of those age 65 or over.
Common Questions
What is the Total Population of Rooks County?
Total Population of Rooks County is 4,925.
What is the Total Male Population of Rooks County?
Total Male Population of Rooks County is 2,442.
What is the Total Female Population of Rooks County?
Total Female Population of Rooks County is 2,483.
What is the Ratio of Males per 100 Females in Rooks County?
There are 98.35 Males per 100 Females in Rooks County.
What is the Ratio of Females per 100 Males in Rooks County?
There are 101.68 Females per 100 Males in Rooks County.
What is the Median Population Age in Rooks County?
Median Population Age in Rooks County is 44.9 Years.
What is the Average Family Size in Rooks County
Average Family Size in Rooks County is 2.8 People.
What is the Average Household Size in Rooks County
Average Household Size in Rooks County is 2.2 People.
What is Per Capita Income in Rooks County?
Per Capita income in Rooks County is $33,751.
What is the Median Family Income in Rooks County?
Median Family Income in Rooks County is $83,361.
What is the Median Household income in Rooks County?
Median Household Income in Rooks County is $60,821.
What is Income or Wage Gap in Rooks County?
Income or Wage Gap in Rooks County is 51.6%.
Women in Rooks County earn 48.4 cents for every dollar earned by a man.
What is Inequality or Gini Index in Rooks County?
Inequality or Gini Index in Rooks County is 0.37.
How Large is the Labor Force in Rooks County?
There are 2,506 People in the Labor Forcein in Rooks County.
What is the Percentage of People in the Labor Force in Rooks County?
62.3% of People are in the Labor Force in Rooks County.
What is the Unemployment Rate in Rooks County?
Unemployment Rate in Rooks County is 1.8%.