Riley County, KS
Riley County Map
Riley County Overview
72,105
TOTAL POPULATION
38,502
MALE POPULATION
33,603
FEMALE POPULATION
114.58
MALES / 100 FEMALES
87.28
FEMALES / 100 MALES
24.9
MEDIAN AGE
2.9
AVG FAMILY SIZE
2.3
AVG HOUSEHOLD SIZE
$33,147
PER CAPITA INCOME
$83,860
AVG FAMILY INCOME
$56,327
AVG HOUSEHOLD INCOME
42.0%
WAGE / INCOME GAP [ % ]
58.0¢/ $1
WAGE / INCOME GAP [ $ ]
$11,734
FAMILY INCOME DEFICIT
0.48
INEQUALITY / GINI INDEX
43,707
LABOR FORCE [ PEOPLE ]
70.7%
PERCENT IN LABOR FORCE
5.1%
UNEMPLOYMENT RATE
Riley County Area Codes
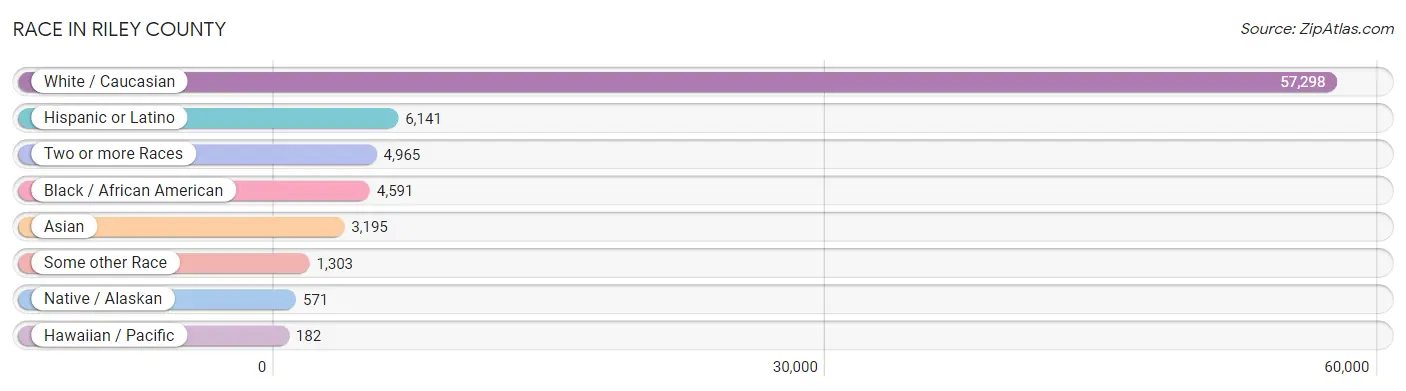
Race in Riley County
The most populous races in Riley County are White / Caucasian (57,298 | 79.5%), Hispanic or Latino (6,141 | 8.5%), and Two or more Races (4,965 | 6.9%).
| Race | # Population | % Population |
| Asian | 3,195 | 4.4% |
| Black / African American | 4,591 | 6.4% |
| Hawaiian / Pacific | 182 | 0.3% |
| Hispanic or Latino | 6,141 | 8.5% |
| Native / Alaskan | 571 | 0.8% |
| White / Caucasian | 57,298 | 79.5% |
| Two or more Races | 4,965 | 6.9% |
| Some other Race | 1,303 | 1.8% |
| Total | 72,105 | 100.0% |
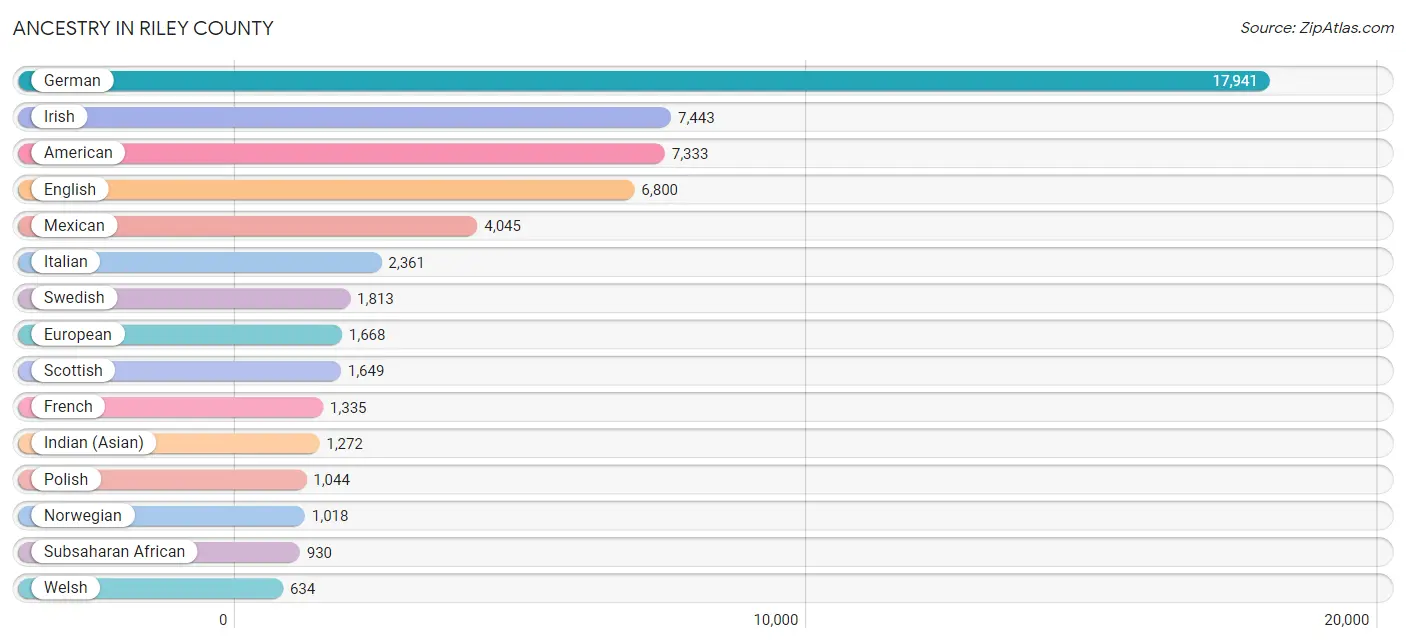
Ancestry in Riley County
The most populous ancestries reported in Riley County are German (17,941 | 24.9%), Irish (7,443 | 10.3%), American (7,333 | 10.2%), English (6,800 | 9.4%), and Mexican (4,045 | 5.6%), together accounting for 60.4% of all Riley County residents.
| Ancestry | # Population | % Population |
| African | 509 | 0.7% |
| Alaska Native | 14 | 0.0% |
| American | 7,333 | 10.2% |
| Apache | 56 | 0.1% |
| Arab | 410 | 0.6% |
| Argentinean | 21 | 0.0% |
| Austrian | 48 | 0.1% |
| Bangladeshi | 36 | 0.1% |
| Basque | 8 | 0.0% |
| Belgian | 245 | 0.3% |
| Belizean | 15 | 0.0% |
| Bhutanese | 335 | 0.5% |
| Blackfeet | 98 | 0.1% |
| Bolivian | 133 | 0.2% |
| Brazilian | 35 | 0.1% |
| British | 482 | 0.7% |
| Burmese | 476 | 0.7% |
| Cajun | 30 | 0.0% |
| Cambodian | 7 | 0.0% |
| Canadian | 89 | 0.1% |
| Central American | 555 | 0.8% |
| Central American Indian | 228 | 0.3% |
| Cherokee | 345 | 0.5% |
| Cheyenne | 15 | 0.0% |
| Chilean | 23 | 0.0% |
| Chippewa | 5 | 0.0% |
| Choctaw | 8 | 0.0% |
| Colombian | 22 | 0.0% |
| Comanche | 1 | 0.0% |
| Costa Rican | 18 | 0.0% |
| Creek | 11 | 0.0% |
| Croatian | 28 | 0.0% |
| Cuban | 349 | 0.5% |
| Czech | 608 | 0.8% |
| Czechoslovakian | 18 | 0.0% |
| Danish | 237 | 0.3% |
| Dominican | 37 | 0.1% |
| Dutch | 607 | 0.8% |
| Eastern European | 114 | 0.2% |
| Ecuadorian | 18 | 0.0% |
| Egyptian | 138 | 0.2% |
| English | 6,800 | 9.4% |
| Ethiopian | 232 | 0.3% |
| European | 1,668 | 2.3% |
| Filipino | 55 | 0.1% |
| Finnish | 58 | 0.1% |
| French | 1,335 | 1.8% |
| French Canadian | 244 | 0.3% |
| German | 17,941 | 24.9% |
| German Russian | 46 | 0.1% |
| Greek | 136 | 0.2% |
| Guatemalan | 77 | 0.1% |
| Honduran | 53 | 0.1% |
| Houma | 9 | 0.0% |
| Hungarian | 178 | 0.3% |
| Indian (Asian) | 1,272 | 1.8% |
| Iranian | 19 | 0.0% |
| Irish | 7,443 | 10.3% |
| Iroquois | 11 | 0.0% |
| Italian | 2,361 | 3.3% |
| Jamaican | 16 | 0.0% |
| Japanese | 65 | 0.1% |
| Jordanian | 27 | 0.0% |
| Kiowa | 35 | 0.1% |
| Korean | 527 | 0.7% |
| Laotian | 8 | 0.0% |
| Lebanese | 112 | 0.2% |
| Lithuanian | 169 | 0.2% |
| Luxembourger | 16 | 0.0% |
| Macedonian | 4 | 0.0% |
| Malaysian | 42 | 0.1% |
| Mexican | 4,045 | 5.6% |
| Mexican American Indian | 81 | 0.1% |
| Moroccan | 16 | 0.0% |
| Native Hawaiian | 173 | 0.2% |
| Navajo | 106 | 0.2% |
| Nicaraguan | 130 | 0.2% |
| Nigerian | 93 | 0.1% |
| Northern European | 167 | 0.2% |
| Norwegian | 1,018 | 1.4% |
| Osage | 7 | 0.0% |
| Ottawa | 9 | 0.0% |
| Pakistani | 88 | 0.1% |
| Panamanian | 45 | 0.1% |
| Paraguayan | 141 | 0.2% |
| Pennsylvania German | 23 | 0.0% |
| Peruvian | 54 | 0.1% |
| Pima | 33 | 0.1% |
| Polish | 1,044 | 1.5% |
| Portuguese | 19 | 0.0% |
| Potawatomi | 38 | 0.1% |
| Puerto Rican | 395 | 0.5% |
| Romanian | 13 | 0.0% |
| Russian | 517 | 0.7% |
| Salvadoran | 232 | 0.3% |
| Samoan | 145 | 0.2% |
| Scandinavian | 441 | 0.6% |
| Scotch-Irish | 533 | 0.7% |
| Scottish | 1,649 | 2.3% |
| Sioux | 47 | 0.1% |
| Slovak | 80 | 0.1% |
| South African | 28 | 0.0% |
| South American | 461 | 0.6% |
| Spaniard | 89 | 0.1% |
| Spanish | 79 | 0.1% |
| Sri Lankan | 550 | 0.8% |
| Subsaharan African | 930 | 1.3% |
| Sudanese | 55 | 0.1% |
| Swedish | 1,813 | 2.5% |
| Swiss | 206 | 0.3% |
| Thai | 402 | 0.6% |
| Trinidadian and Tobagonian | 42 | 0.1% |
| Turkish | 55 | 0.1% |
| Ukrainian | 118 | 0.2% |
| Uruguayan | 16 | 0.0% |
| Venezuelan | 33 | 0.1% |
| Vietnamese | 272 | 0.4% |
| Welsh | 634 | 0.9% |
| Yugoslavian | 25 | 0.0% | View All 119 Rows |
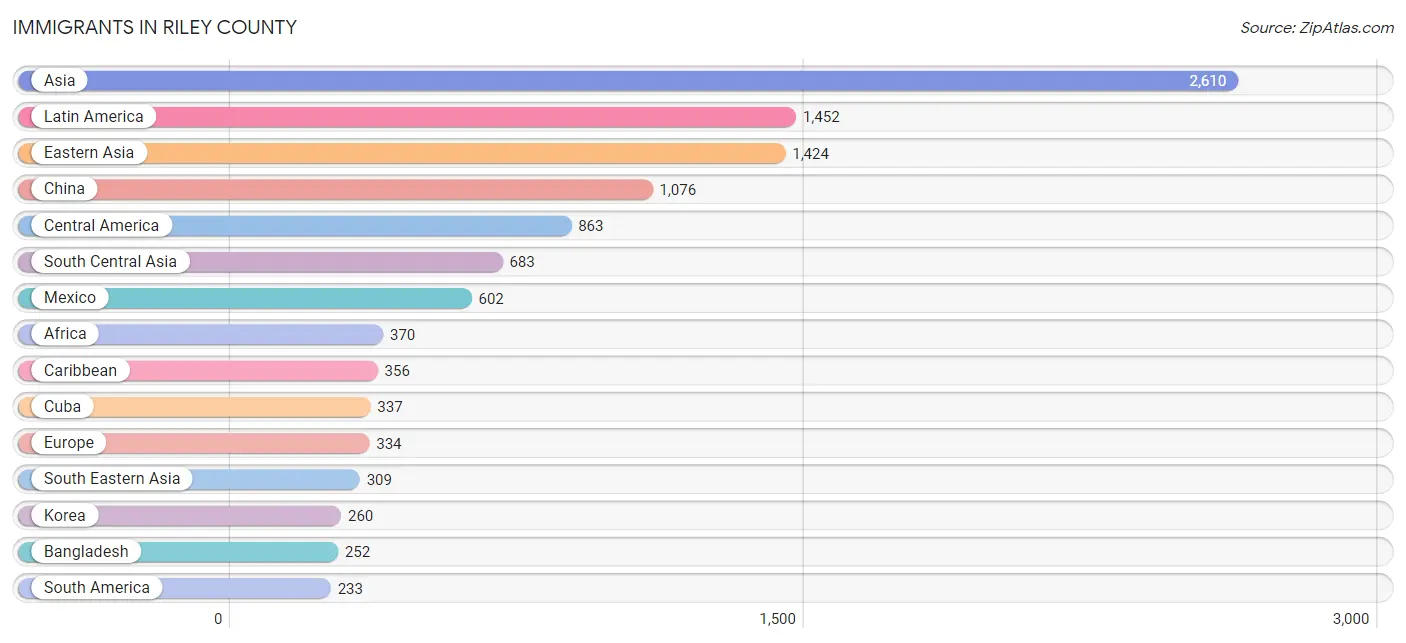
Immigrants in Riley County
The most numerous immigrant groups reported in Riley County came from Asia (2,610 | 3.6%), Latin America (1,452 | 2.0%), Eastern Asia (1,424 | 2.0%), China (1,076 | 1.5%), and Central America (863 | 1.2%), together accounting for 10.3% of all Riley County residents.
| Immigration Origin | # Population | % Population |
| Africa | 370 | 0.5% |
| Argentina | 21 | 0.0% |
| Asia | 2,610 | 3.6% |
| Australia | 10 | 0.0% |
| Bangladesh | 252 | 0.4% |
| Brazil | 38 | 0.1% |
| Canada | 76 | 0.1% |
| Caribbean | 356 | 0.5% |
| Central America | 863 | 1.2% |
| China | 1,076 | 1.5% |
| Colombia | 17 | 0.0% |
| Cuba | 337 | 0.5% |
| Eastern Africa | 202 | 0.3% |
| Eastern Asia | 1,424 | 2.0% |
| Eastern Europe | 144 | 0.2% |
| Ecuador | 18 | 0.0% |
| Egypt | 49 | 0.1% |
| El Salvador | 55 | 0.1% |
| Eritrea | 26 | 0.0% |
| Ethiopia | 176 | 0.2% |
| Europe | 334 | 0.5% |
| France | 10 | 0.0% |
| Germany | 125 | 0.2% |
| Guatemala | 37 | 0.1% |
| Honduras | 24 | 0.0% |
| Hong Kong | 4 | 0.0% |
| Hungary | 77 | 0.1% |
| India | 179 | 0.3% |
| Indonesia | 20 | 0.0% |
| Iran | 19 | 0.0% |
| Iraq | 60 | 0.1% |
| Jamaica | 16 | 0.0% |
| Japan | 88 | 0.1% |
| Jordan | 10 | 0.0% |
| Korea | 260 | 0.4% |
| Kuwait | 10 | 0.0% |
| Latin America | 1,452 | 2.0% |
| Lebanon | 20 | 0.0% |
| Lithuania | 6 | 0.0% |
| Mexico | 602 | 0.8% |
| Micronesia | 18 | 0.0% |
| Moldova | 12 | 0.0% |
| Nepal | 152 | 0.2% |
| Nicaragua | 130 | 0.2% |
| Nigeria | 63 | 0.1% |
| Northern Africa | 49 | 0.1% |
| Northern Europe | 55 | 0.1% |
| Norway | 26 | 0.0% |
| Oceania | 113 | 0.2% |
| Pakistan | 7 | 0.0% |
| Panama | 15 | 0.0% |
| Philippines | 117 | 0.2% |
| Romania | 13 | 0.0% |
| Saudi Arabia | 37 | 0.1% |
| South Africa | 14 | 0.0% |
| South America | 233 | 0.3% |
| South Central Asia | 683 | 0.9% |
| South Eastern Asia | 309 | 0.4% |
| Sri Lanka | 74 | 0.1% |
| Taiwan | 140 | 0.2% |
| Thailand | 56 | 0.1% |
| Trinidad and Tobago | 3 | 0.0% |
| Ukraine | 36 | 0.1% |
| Uruguay | 16 | 0.0% |
| Venezuela | 33 | 0.1% |
| Vietnam | 116 | 0.2% |
| Western Africa | 105 | 0.2% |
| Western Asia | 194 | 0.3% |
| Western Europe | 135 | 0.2% | View All 69 Rows |
Sex and Age in Riley County
Sex and Age in Riley County
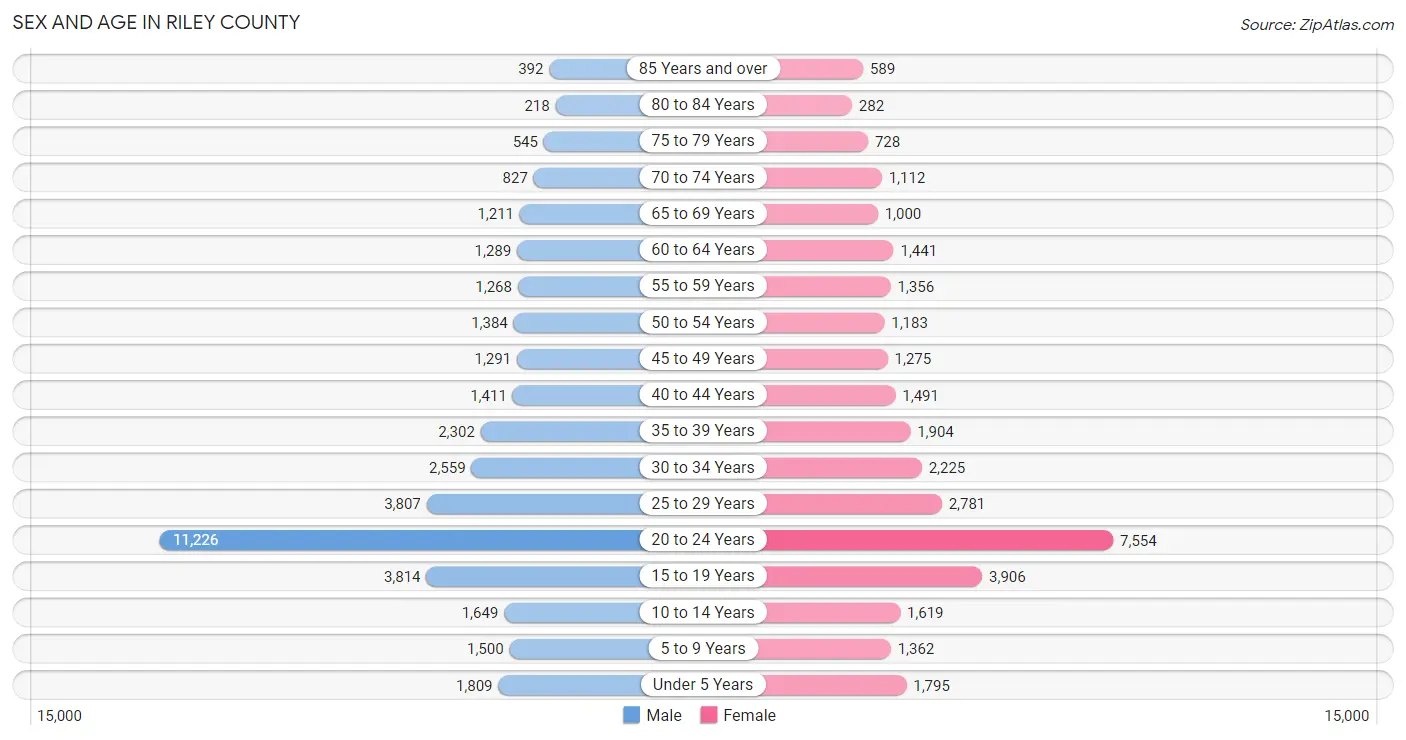
The most populous age groups in Riley County are 20 to 24 Years (11,226 | 29.2%) for men and 20 to 24 Years (7,554 | 22.5%) for women.
| Age Bracket | Male | Female |
| Under 5 Years | 1,809 (4.7%) | 1,795 (5.3%) |
| 5 to 9 Years | 1,500 (3.9%) | 1,362 (4.1%) |
| 10 to 14 Years | 1,649 (4.3%) | 1,619 (4.8%) |
| 15 to 19 Years | 3,814 (9.9%) | 3,906 (11.6%) |
| 20 to 24 Years | 11,226 (29.2%) | 7,554 (22.5%) |
| 25 to 29 Years | 3,807 (9.9%) | 2,781 (8.3%) |
| 30 to 34 Years | 2,559 (6.7%) | 2,225 (6.6%) |
| 35 to 39 Years | 2,302 (6.0%) | 1,904 (5.7%) |
| 40 to 44 Years | 1,411 (3.7%) | 1,491 (4.4%) |
| 45 to 49 Years | 1,291 (3.4%) | 1,275 (3.8%) |
| 50 to 54 Years | 1,384 (3.6%) | 1,183 (3.5%) |
| 55 to 59 Years | 1,268 (3.3%) | 1,356 (4.0%) |
| 60 to 64 Years | 1,289 (3.4%) | 1,441 (4.3%) |
| 65 to 69 Years | 1,211 (3.2%) | 1,000 (3.0%) |
| 70 to 74 Years | 827 (2.1%) | 1,112 (3.3%) |
| 75 to 79 Years | 545 (1.4%) | 728 (2.2%) |
| 80 to 84 Years | 218 (0.6%) | 282 (0.8%) |
| 85 Years and over | 392 (1.0%) | 589 (1.8%) |
| Total | 38,502 (100.0%) | 33,603 (100.0%) |
Families and Households in Riley County
Median Family Size in Riley County
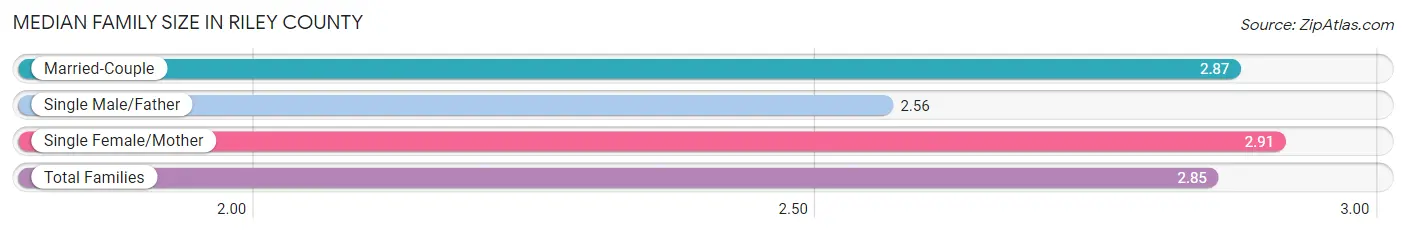
The median family size in Riley County is 2.85 persons per family, with single female/mother families (1,767 | 13.0%) accounting for the largest median family size of 2.91 persons per family. On the other hand, single male/father families (1,024 | 7.5%) represent the smallest median family size with 2.56 persons per family.
| Family Type | # Families | Family Size |
| Married-Couple | 10,836 (79.5%) | 2.87 |
| Single Male/Father | 1,024 (7.5%) | 2.56 |
| Single Female/Mother | 1,767 (13.0%) | 2.91 |
| Total Families | 13,627 (100.0%) | 2.85 |
Median Household Size in Riley County
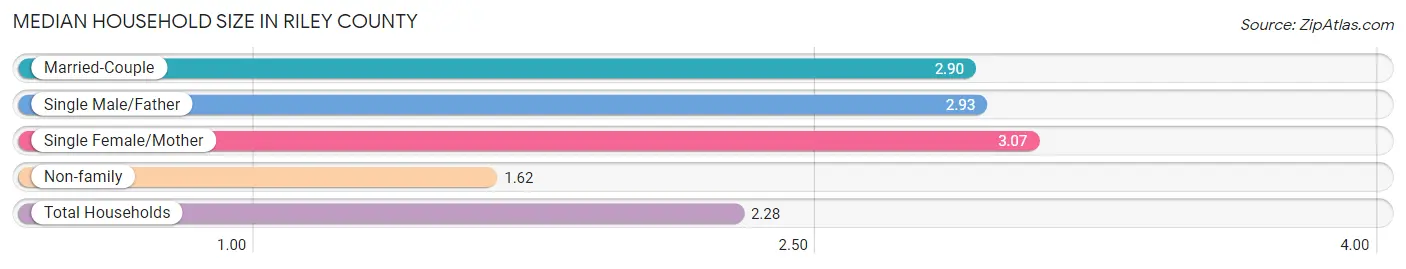
The median household size in Riley County is 2.28 persons per household, with single female/mother households (1,767 | 6.6%) accounting for the largest median household size of 3.07 persons per household. non-family households (13,138 | 49.1%) represent the smallest median household size with 1.62 persons per household.
| Household Type | # Households | Household Size |
| Married-Couple | 10,836 (40.5%) | 2.90 |
| Single Male/Father | 1,024 (3.8%) | 2.93 |
| Single Female/Mother | 1,767 (6.6%) | 3.07 |
| Non-family | 13,138 (49.1%) | 1.62 |
| Total Households | 26,765 (100.0%) | 2.28 |
Household Size by Marriage Status in Riley County
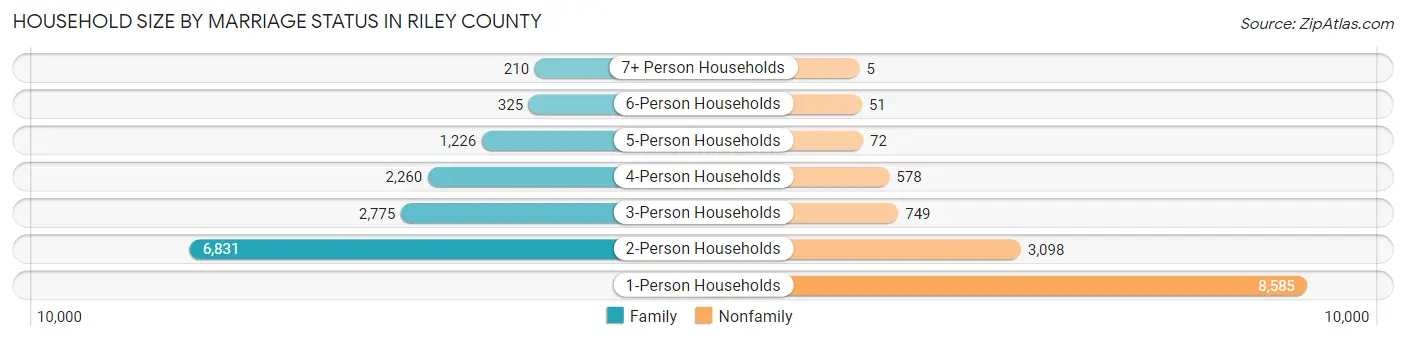
Out of a total of 26,765 households in Riley County, 13,627 (50.9%) are family households, while 13,138 (49.1%) are nonfamily households. The most numerous type of family households are 2-person households, comprising 6,831, and the most common type of nonfamily households are 1-person households, comprising 8,585.
| Household Size | Family Households | Nonfamily Households |
| 1-Person Households | - | 8,585 (32.1%) |
| 2-Person Households | 6,831 (25.5%) | 3,098 (11.6%) |
| 3-Person Households | 2,775 (10.4%) | 749 (2.8%) |
| 4-Person Households | 2,260 (8.4%) | 578 (2.2%) |
| 5-Person Households | 1,226 (4.6%) | 72 (0.3%) |
| 6-Person Households | 325 (1.2%) | 51 (0.2%) |
| 7+ Person Households | 210 (0.8%) | 5 (0.0%) |
| Total | 13,627 (50.9%) | 13,138 (49.1%) |
Female Fertility in Riley County
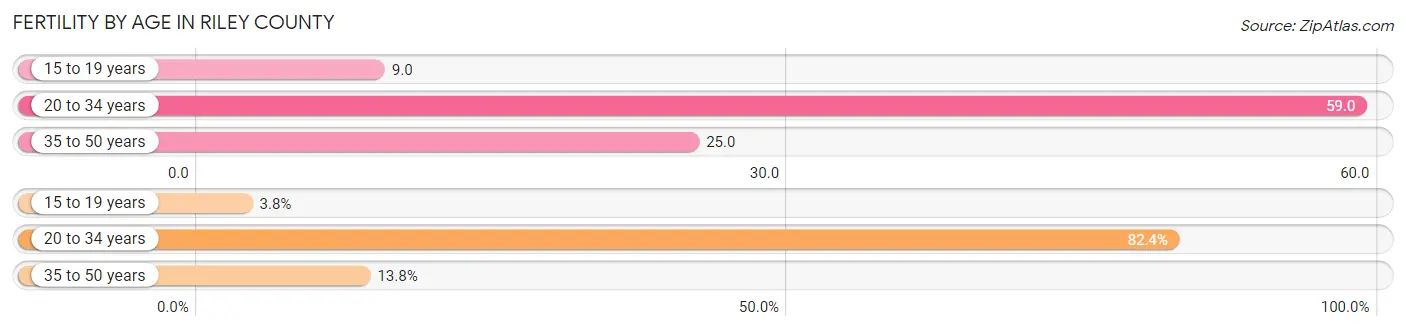
Fertility by Age in Riley County
Average fertility rate in Riley County is 42.0 births per 1,000 women. Women in the age bracket of 20 to 34 years have the highest fertility rate with 59.0 births per 1,000 women. Women in the age bracket of 20 to 34 years acount for 82.4% of all women with births.
| Age Bracket | Women with Births | Births / 1,000 Women |
| 15 to 19 years | 34 (3.8%) | 9.0 |
| 20 to 34 years | 742 (82.4%) | 59.0 |
| 35 to 50 years | 124 (13.8%) | 25.0 |
| Total | 900 (100.0%) | 42.0 |
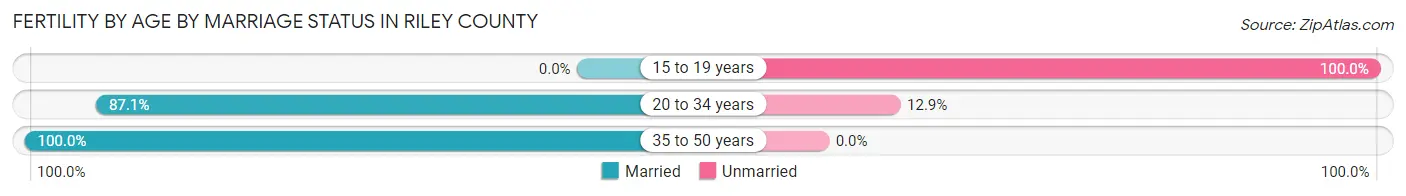
Fertility by Age by Marriage Status in Riley County
85.6% of women with births (900) in Riley County are married. The highest percentage of unmarried women with births falls into 15 to 19 years age bracket with 100.0% of them unmarried at the time of birth, while the lowest percentage of unmarried women with births belong to 35 to 50 years age bracket with 0.0% of them unmarried.
| Age Bracket | Married | Unmarried |
| 15 to 19 years | 0 (0.0%) | 34 (100.0%) |
| 20 to 34 years | 646 (87.1%) | 96 (12.9%) |
| 35 to 50 years | 124 (100.0%) | 0 (0.0%) |
| Total | 770 (85.6%) | 130 (14.4%) |
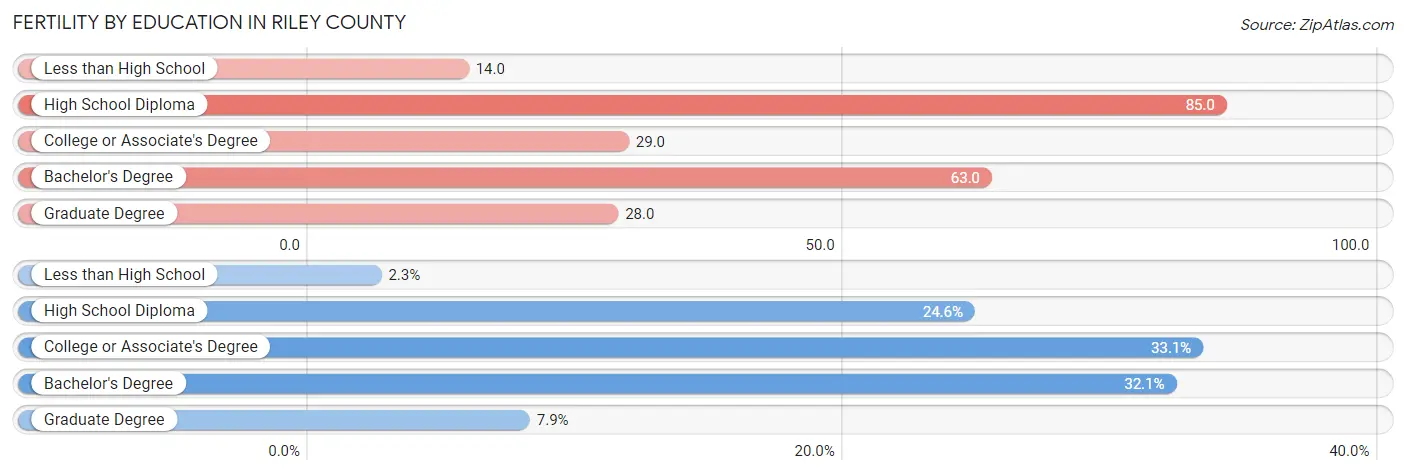
Fertility by Education in Riley County
Average fertility rate in Riley County is 42.0 births per 1,000 women. Women with the education attainment of high school diploma have the highest fertility rate of 85.0 births per 1,000 women, while women with the education attainment of less than high school have the lowest fertility at 14.0 births per 1,000 women. Women with the education attainment of college or associate's degree represent 33.1% of all women with births.
| Educational Attainment | Women with Births | Births / 1,000 Women |
| Less than High School | 21 (2.3%) | 14.0 |
| High School Diploma | 221 (24.6%) | 85.0 |
| College or Associate's Degree | 298 (33.1%) | 29.0 |
| Bachelor's Degree | 289 (32.1%) | 63.0 |
| Graduate Degree | 71 (7.9%) | 28.0 |
| Total | 900 (100.0%) | 42.0 |
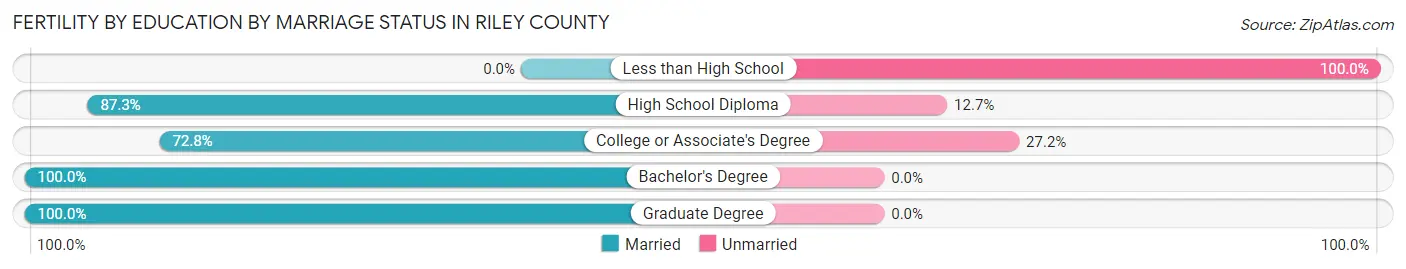
Fertility by Education by Marriage Status in Riley County
14.4% of women with births in Riley County are unmarried. Women with the educational attainment of bachelor's degree are most likely to be married with 100.0% of them married at childbirth, while women with the educational attainment of less than high school are least likely to be married with 100.0% of them unmarried at childbirth.
| Educational Attainment | Married | Unmarried |
| Less than High School | 0 (0.0%) | 21 (100.0%) |
| High School Diploma | 193 (87.3%) | 28 (12.7%) |
| College or Associate's Degree | 217 (72.8%) | 81 (27.2%) |
| Bachelor's Degree | 289 (100.0%) | 0 (0.0%) |
| Graduate Degree | 71 (100.0%) | 0 (0.0%) |
| Total | 770 (85.6%) | 130 (14.4%) |
Income in Riley County
Income Overview in Riley County
Per Capita Income in Riley County is $33,147, while median incomes of families and households are $83,860 and $56,327 respectively.
| Characteristic | Number | Measure |
| Per Capita Income | 72,105 | $33,147 |
| Median Family Income | 13,627 | $83,860 |
| Mean Family Income | 13,627 | $107,430 |
| Median Household Income | 26,765 | $56,327 |
| Mean Household Income | 26,765 | $79,585 |
| Income Deficit | 13,627 | $11,734 |
| Wage / Income Gap (%) | 72,105 | 41.96% |
| Wage / Income Gap ($) | 72,105 | 58.04¢ per $1 |
| Gini / Inequality Index | 72,105 | 0.48 |
Earnings by Sex in Riley County
Average Earnings in Riley County are $25,767, $30,061 for men and $17,448 for women, a difference of 42.0%.
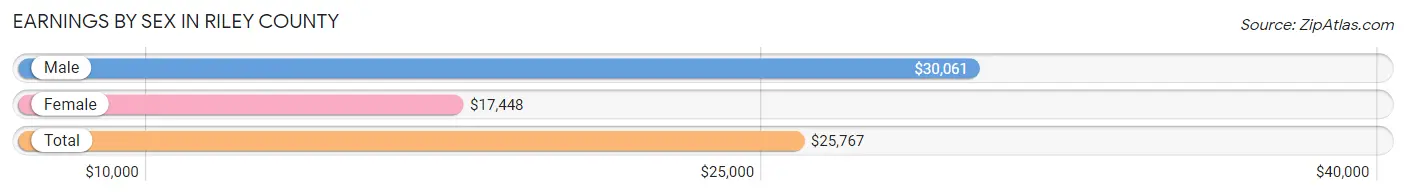
| Sex | Number | Average Earnings |
| Male | 27,980 (56.5%) | $30,061 |
| Female | 21,557 (43.5%) | $17,448 |
| Total | 49,537 (100.0%) | $25,767 |
Earnings by Sex by Income Bracket in Riley County
The most common earnings brackets in Riley County are $100,000+ for men (2,336 | 8.4%) and $2,500 to $4,999 for women (2,465 | 11.4%).
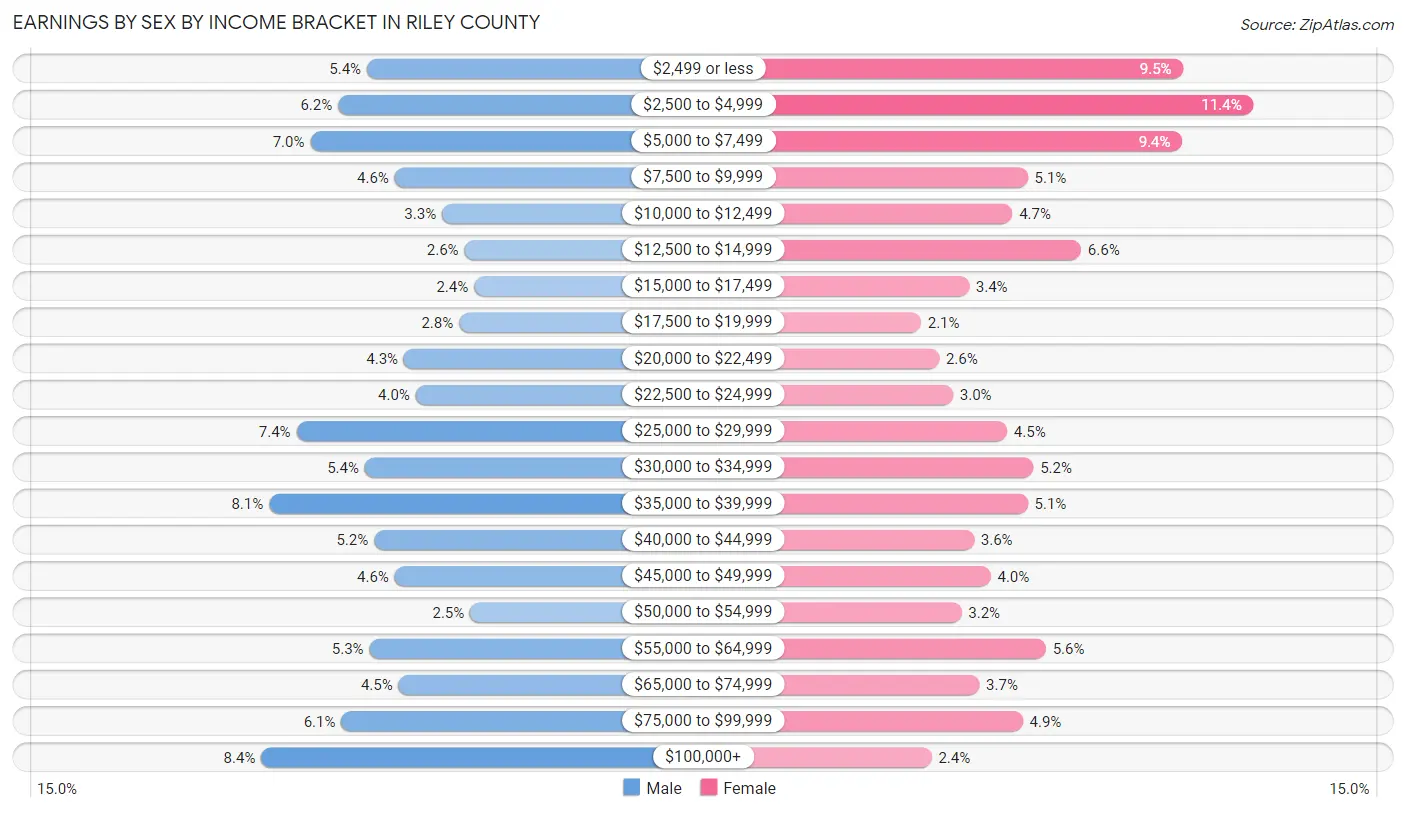
| Income | Male | Female |
| $2,499 or less | 1,505 (5.4%) | 2,040 (9.5%) |
| $2,500 to $4,999 | 1,731 (6.2%) | 2,465 (11.4%) |
| $5,000 to $7,499 | 1,951 (7.0%) | 2,033 (9.4%) |
| $7,500 to $9,999 | 1,287 (4.6%) | 1,095 (5.1%) |
| $10,000 to $12,499 | 915 (3.3%) | 1,003 (4.6%) |
| $12,500 to $14,999 | 740 (2.6%) | 1,419 (6.6%) |
| $15,000 to $17,499 | 664 (2.4%) | 739 (3.4%) |
| $17,500 to $19,999 | 781 (2.8%) | 448 (2.1%) |
| $20,000 to $22,499 | 1,215 (4.3%) | 558 (2.6%) |
| $22,500 to $24,999 | 1,123 (4.0%) | 643 (3.0%) |
| $25,000 to $29,999 | 2,059 (7.4%) | 969 (4.5%) |
| $30,000 to $34,999 | 1,521 (5.4%) | 1,129 (5.2%) |
| $35,000 to $39,999 | 2,275 (8.1%) | 1,096 (5.1%) |
| $40,000 to $44,999 | 1,448 (5.2%) | 769 (3.6%) |
| $45,000 to $49,999 | 1,287 (4.6%) | 871 (4.0%) |
| $50,000 to $54,999 | 695 (2.5%) | 695 (3.2%) |
| $55,000 to $64,999 | 1,486 (5.3%) | 1,206 (5.6%) |
| $65,000 to $74,999 | 1,255 (4.5%) | 802 (3.7%) |
| $75,000 to $99,999 | 1,706 (6.1%) | 1,065 (4.9%) |
| $100,000+ | 2,336 (8.4%) | 512 (2.4%) |
| Total | 27,980 (100.0%) | 21,557 (100.0%) |
Earnings by Sex by Educational Attainment in Riley County
Average earnings in Riley County are $47,250 for men and $39,243 for women, a difference of 17.0%. Men with an educational attainment of graduate degree enjoy the highest average annual earnings of $66,250, while those with less than high school education earn the least with $32,649. Women with an educational attainment of graduate degree earn the most with the average annual earnings of $57,004, while those with less than high school education have the smallest earnings of $13,283.
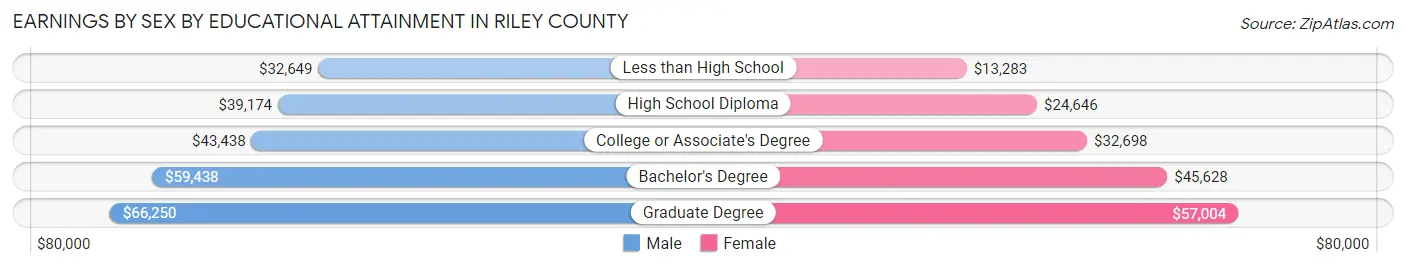
| Educational Attainment | Male Income | Female Income |
| Less than High School | $32,649 | $13,283 |
| High School Diploma | $39,174 | $24,646 |
| College or Associate's Degree | $43,438 | $32,698 |
| Bachelor's Degree | $59,438 | $45,628 |
| Graduate Degree | $66,250 | $57,004 |
| Total | $47,250 | $39,243 |
Family Income in Riley County
Family Income Brackets in Riley County
According to the Riley County family income data, there are 2,671 families falling into the $100,000 to $149,999 income range, which is the most common income bracket and makes up 19.6% of all families. Conversely, the $10,000 to $14,999 income bracket is the least frequent group with only 477 families (3.5%) belonging to this category.
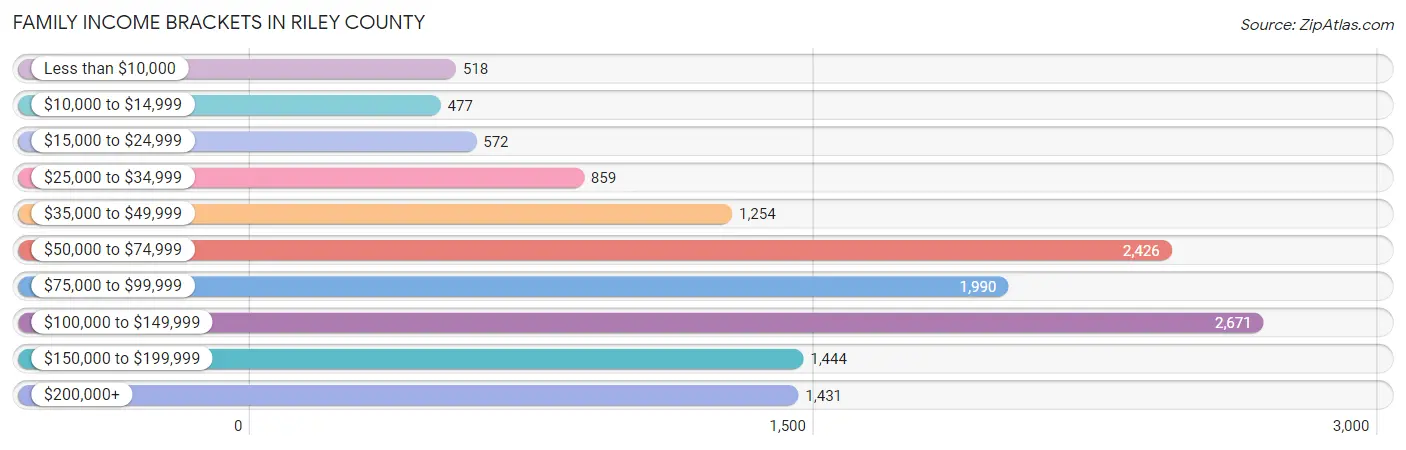
| Income Bracket | # Families | % Families |
| Less than $10,000 | 518 | 3.8% |
| $10,000 to $14,999 | 477 | 3.5% |
| $15,000 to $24,999 | 572 | 4.2% |
| $25,000 to $34,999 | 859 | 6.3% |
| $35,000 to $49,999 | 1,254 | 9.2% |
| $50,000 to $74,999 | 2,426 | 17.8% |
| $75,000 to $99,999 | 1,990 | 14.6% |
| $100,000 to $149,999 | 2,671 | 19.6% |
| $150,000 to $199,999 | 1,444 | 10.6% |
| $200,000+ | 1,431 | 10.5% |
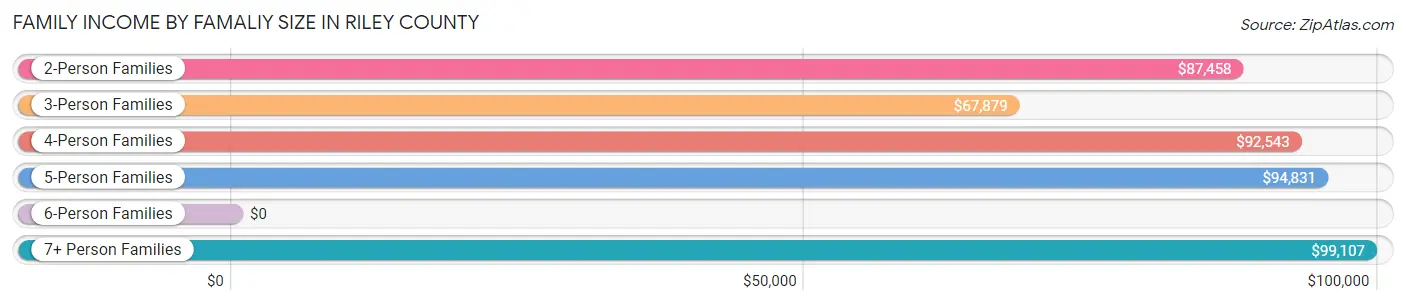
Family Income by Famaliy Size in Riley County
7+ person families (80 | 0.6%) account for the highest median family income in Riley County with $99,107 per family, while 2-person families (7,041 | 51.7%) have the highest median income of $43,729 per family member.
| Income Bracket | # Families | Median Income |
| 2-Person Families | 7,041 (51.7%) | $87,458 |
| 3-Person Families | 2,890 (21.2%) | $67,879 |
| 4-Person Families | 2,131 (15.6%) | $92,543 |
| 5-Person Families | 1,121 (8.2%) | $94,831 |
| 6-Person Families | 364 (2.7%) | $0 |
| 7+ Person Families | 80 (0.6%) | $99,107 |
| Total | 13,627 (100.0%) | $83,860 |
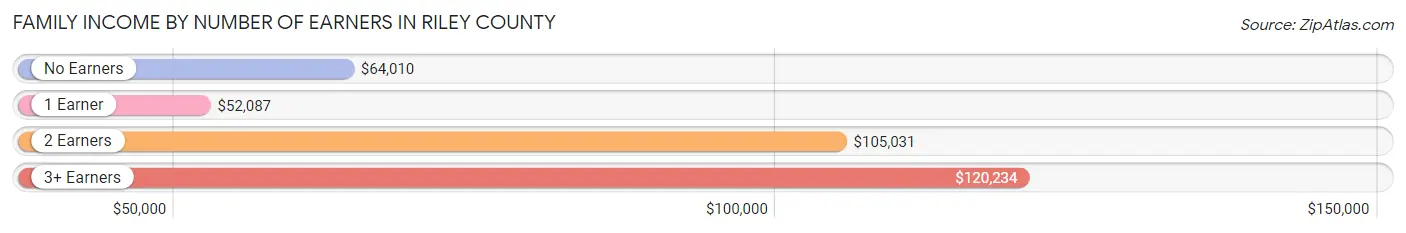
Family Income by Number of Earners in Riley County
The median family income in Riley County is $83,860, with families comprising 3+ earners (855) having the highest median family income of $120,234, while families with 1 earner (4,262) have the lowest median family income of $52,087, accounting for 6.3% and 31.3% of families, respectively.
| Number of Earners | # Families | Median Income |
| No Earners | 1,756 (12.9%) | $64,010 |
| 1 Earner | 4,262 (31.3%) | $52,087 |
| 2 Earners | 6,754 (49.6%) | $105,031 |
| 3+ Earners | 855 (6.3%) | $120,234 |
| Total | 13,627 (100.0%) | $83,860 |
Household Income in Riley County
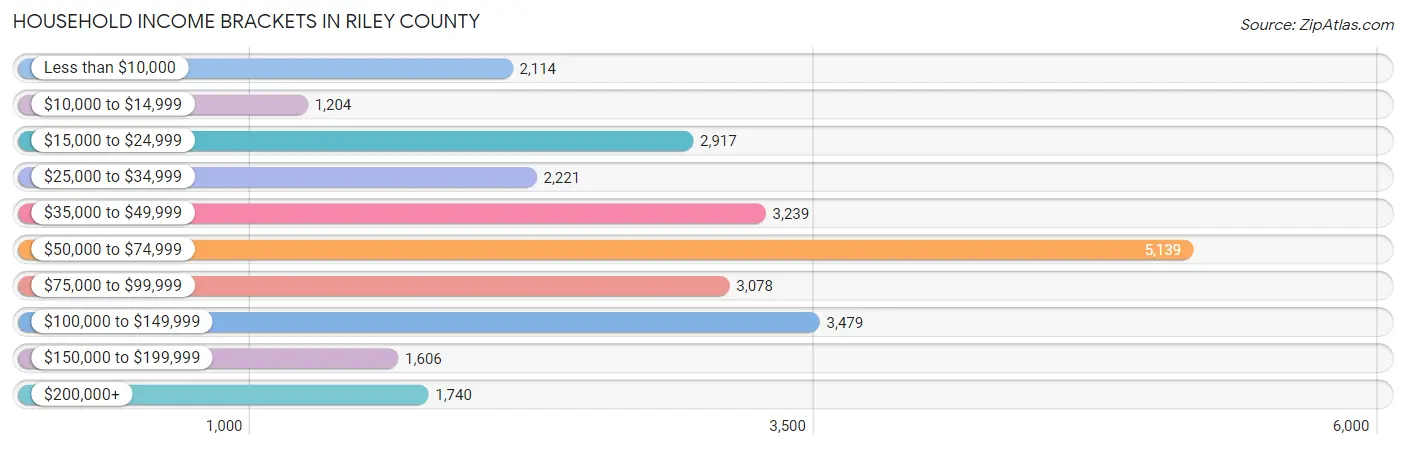
Household Income Brackets in Riley County
With 5,139 households falling in the category, the $50,000 to $74,999 income range is the most frequent in Riley County, accounting for 19.2% of all households. In contrast, only 1,204 households (4.5%) fall into the $10,000 to $14,999 income bracket, making it the least populous group.
| Income Bracket | # Households | % Households |
| Less than $10,000 | 2,114 | 7.9% |
| $10,000 to $14,999 | 1,204 | 4.5% |
| $15,000 to $24,999 | 2,917 | 10.9% |
| $25,000 to $34,999 | 2,221 | 8.3% |
| $35,000 to $49,999 | 3,239 | 12.1% |
| $50,000 to $74,999 | 5,139 | 19.2% |
| $75,000 to $99,999 | 3,078 | 11.5% |
| $100,000 to $149,999 | 3,479 | 13.0% |
| $150,000 to $199,999 | 1,606 | 6.0% |
| $200,000+ | 1,740 | 6.5% |
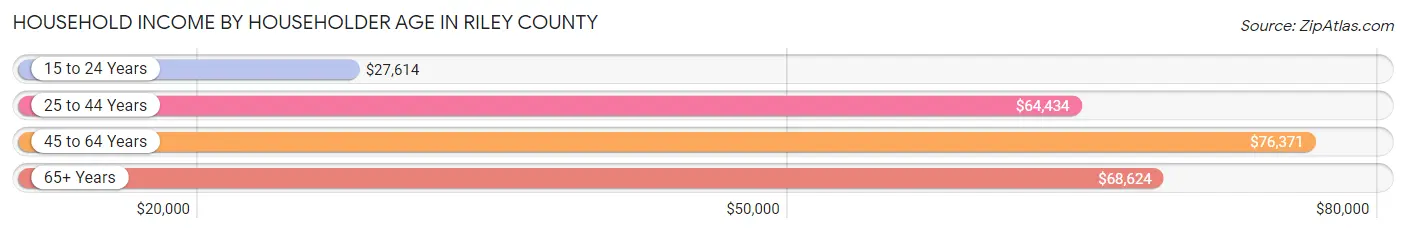
Household Income by Householder Age in Riley County
The median household income in Riley County is $56,327, with the highest median household income of $76,371 found in the 45 to 64 years age bracket for the primary householder. A total of 6,376 households (23.8%) fall into this category. Meanwhile, the 15 to 24 years age bracket for the primary householder has the lowest median household income of $27,614, with 6,091 households (22.8%) in this group.
| Income Bracket | # Households | Median Income |
| 15 to 24 Years | 6,091 (22.8%) | $27,614 |
| 25 to 44 Years | 9,992 (37.3%) | $64,434 |
| 45 to 64 Years | 6,376 (23.8%) | $76,371 |
| 65+ Years | 4,306 (16.1%) | $68,624 |
| Total | 26,765 (100.0%) | $56,327 |
Poverty in Riley County
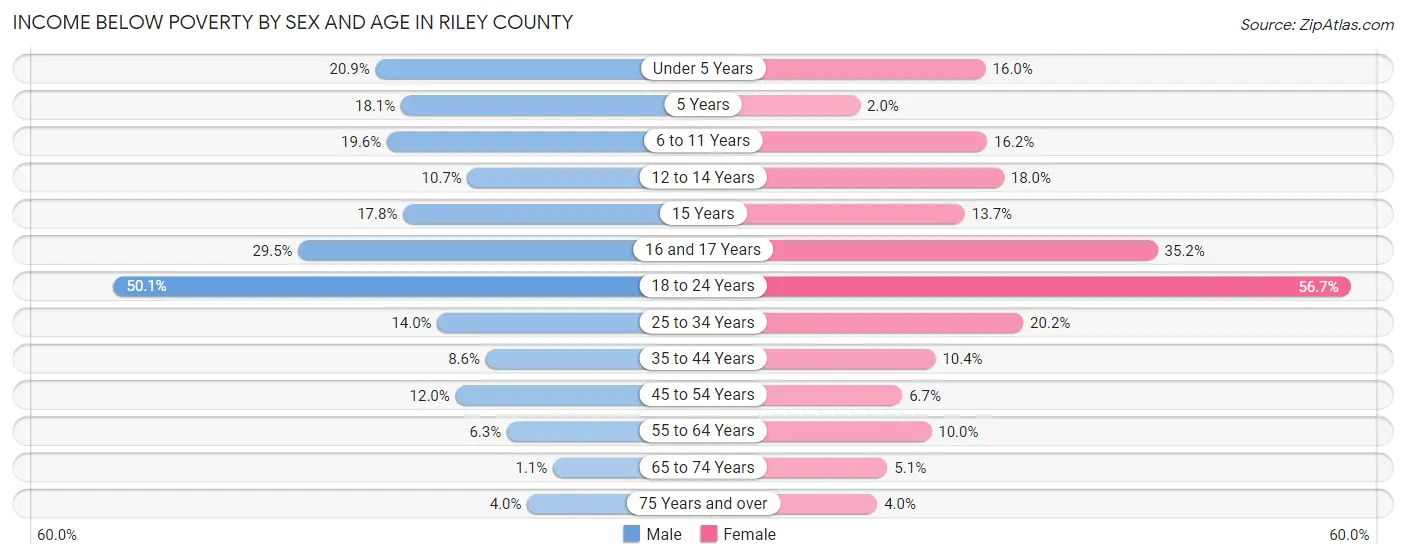
Income Below Poverty by Sex and Age in Riley County
With 21.9% poverty level for males and 23.6% for females among the residents of Riley County, 18 to 24 year old males and 18 to 24 year old females are the most vulnerable to poverty, with 4,162 males (50.1%) and 4,096 females (56.7%) in their respective age groups living below the poverty level.
| Age Bracket | Male | Female |
| Under 5 Years | 377 (20.9%) | 279 (16.0%) |
| 5 Years | 60 (18.1%) | 6 (2.0%) |
| 6 to 11 Years | 349 (19.6%) | 229 (16.2%) |
| 12 to 14 Years | 104 (10.7%) | 195 (18.0%) |
| 15 Years | 41 (17.8%) | 44 (13.7%) |
| 16 and 17 Years | 172 (29.5%) | 211 (35.2%) |
| 18 to 24 Years | 4,162 (50.1%) | 4,096 (56.7%) |
| 25 to 34 Years | 762 (14.0%) | 1,010 (20.2%) |
| 35 to 44 Years | 320 (8.6%) | 354 (10.4%) |
| 45 to 54 Years | 319 (12.0%) | 165 (6.7%) |
| 55 to 64 Years | 160 (6.3%) | 278 (10.0%) |
| 65 to 74 Years | 23 (1.1%) | 107 (5.1%) |
| 75 Years and over | 44 (4.0%) | 53 (4.0%) |
| Total | 6,893 (21.9%) | 7,027 (23.6%) |
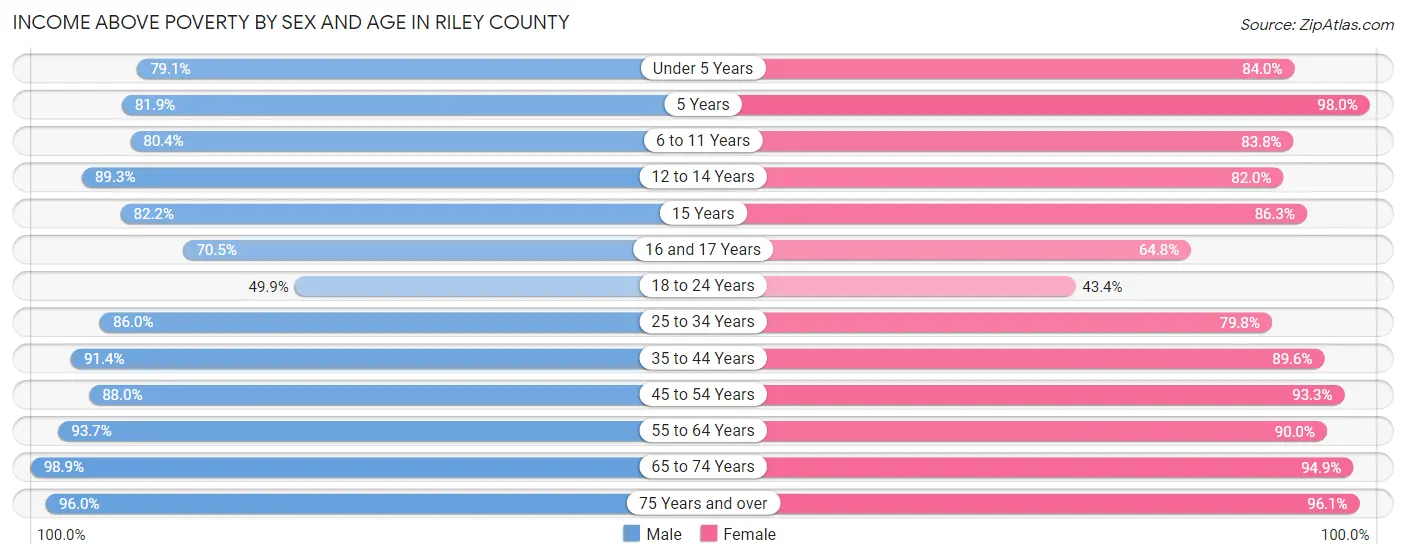
Income Above Poverty by Sex and Age in Riley County
According to the poverty statistics in Riley County, males aged 65 to 74 years and females aged 5 years are the age groups that are most secure financially, with 98.9% of males and 98.0% of females in these age groups living above the poverty line.
| Age Bracket | Male | Female |
| Under 5 Years | 1,426 (79.1%) | 1,463 (84.0%) |
| 5 Years | 272 (81.9%) | 288 (98.0%) |
| 6 to 11 Years | 1,429 (80.4%) | 1,186 (83.8%) |
| 12 to 14 Years | 872 (89.3%) | 886 (82.0%) |
| 15 Years | 189 (82.2%) | 277 (86.3%) |
| 16 and 17 Years | 411 (70.5%) | 389 (64.8%) |
| 18 to 24 Years | 4,145 (49.9%) | 3,134 (43.3%) |
| 25 to 34 Years | 4,673 (86.0%) | 3,990 (79.8%) |
| 35 to 44 Years | 3,382 (91.4%) | 3,041 (89.6%) |
| 45 to 54 Years | 2,339 (88.0%) | 2,288 (93.3%) |
| 55 to 64 Years | 2,393 (93.7%) | 2,510 (90.0%) |
| 65 to 74 Years | 1,999 (98.9%) | 1,998 (94.9%) |
| 75 Years and over | 1,052 (96.0%) | 1,289 (96.1%) |
| Total | 24,582 (78.1%) | 22,739 (76.4%) |
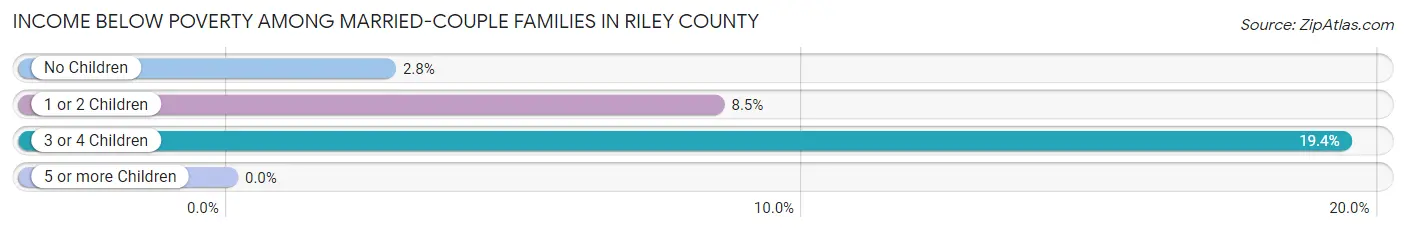
Income Below Poverty Among Married-Couple Families in Riley County
The poverty statistics for married-couple families in Riley County show that 6.0% or 650 of the total 10,836 families live below the poverty line. Families with 3 or 4 children have the highest poverty rate of 19.4%, comprising of 194 families. On the other hand, families with 5 or more children have the lowest poverty rate of 0.0%, which includes 0 families.
| Children | Above Poverty | Below Poverty |
| No Children | 6,374 (97.3%) | 180 (2.8%) |
| 1 or 2 Children | 2,981 (91.5%) | 276 (8.5%) |
| 3 or 4 Children | 807 (80.6%) | 194 (19.4%) |
| 5 or more Children | 24 (100.0%) | 0 (0.0%) |
| Total | 10,186 (94.0%) | 650 (6.0%) |
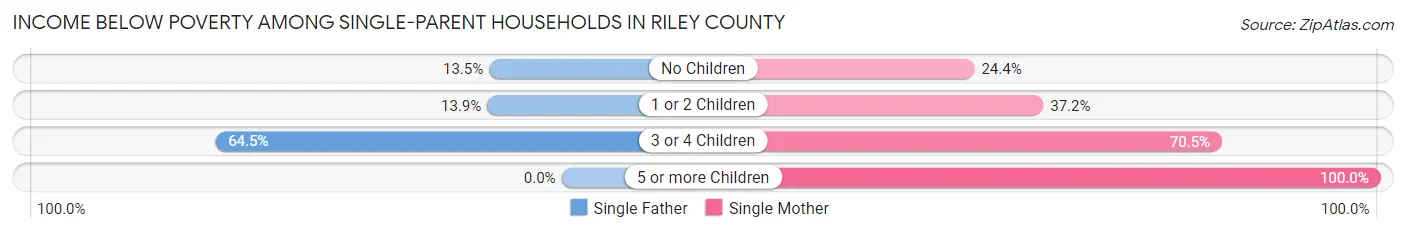
Income Below Poverty Among Single-Parent Households in Riley County
According to the poverty data in Riley County, 25.9% or 265 single-father households and 41.2% or 728 single-mother households are living below the poverty line. Among single-father households, those with 3 or 4 children have the highest poverty rate, with 158 households (64.5%) experiencing poverty. Likewise, among single-mother households, those with 5 or more children have the highest poverty rate, with 7 households (100.0%) falling below the poverty line.
| Children | Single Father | Single Mother |
| No Children | 34 (13.5%) | 96 (24.4%) |
| 1 or 2 Children | 73 (13.9%) | 377 (37.2%) |
| 3 or 4 Children | 158 (64.5%) | 248 (70.5%) |
| 5 or more Children | 0 (0.0%) | 7 (100.0%) |
| Total | 265 (25.9%) | 728 (41.2%) |
Income Below Poverty Among Married-Couple vs Single-Parent Households in Riley County
The poverty data for Riley County shows that 650 of the married-couple family households (6.0%) and 993 of the single-parent households (35.6%) are living below the poverty level. Within the married-couple family households, those with 3 or 4 children have the highest poverty rate, with 194 households (19.4%) falling below the poverty line. Among the single-parent households, those with 5 or more children have the highest poverty rate, with 7 household (100.0%) living below poverty.
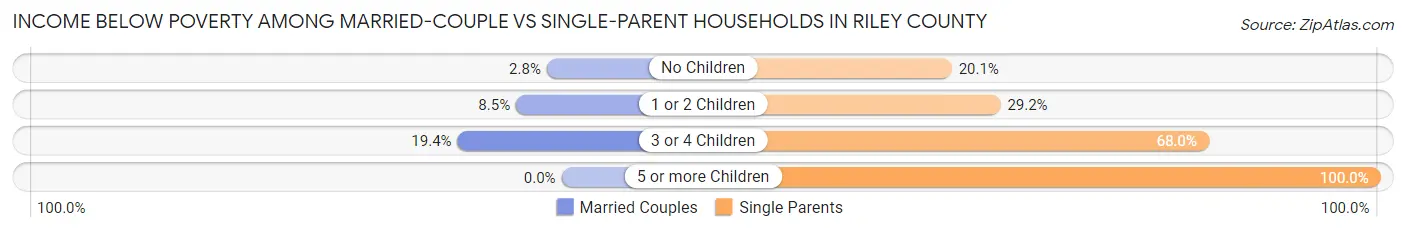
| Children | Married-Couple Families | Single-Parent Households |
| No Children | 180 (2.8%) | 130 (20.1%) |
| 1 or 2 Children | 276 (8.5%) | 450 (29.2%) |
| 3 or 4 Children | 194 (19.4%) | 406 (68.0%) |
| 5 or more Children | 0 (0.0%) | 7 (100.0%) |
| Total | 650 (6.0%) | 993 (35.6%) |
Employment Characteristics in Riley County
Employment by Class of Employer in Riley County
Among the 41,152 employed individuals in Riley County, private company employees (18,608 | 45.2%), federal government employees (8,006 | 19.5%), and state government employees (6,925 | 16.8%) make up the most common classes of employment.
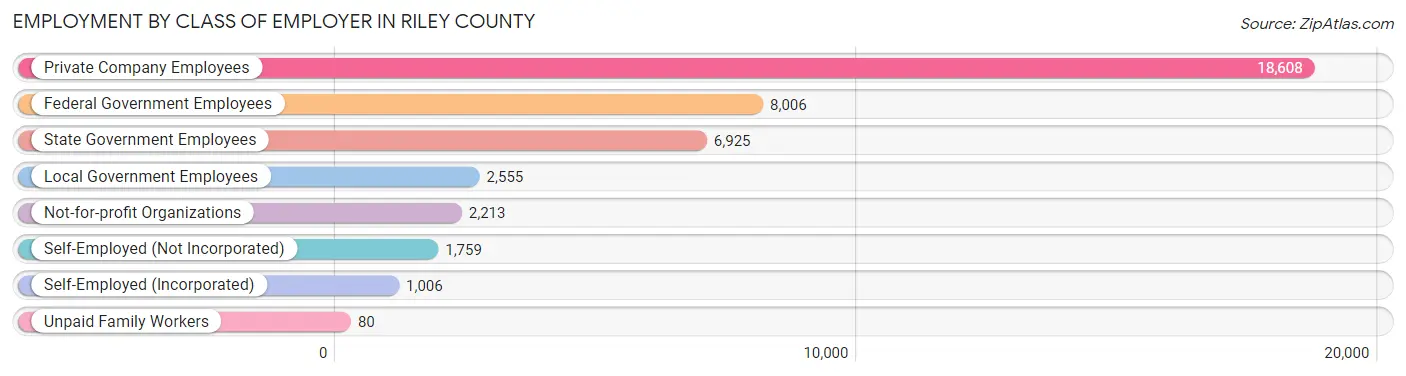
| Employer Class | # Employees | % Employees |
| Private Company Employees | 18,608 | 45.2% |
| Self-Employed (Incorporated) | 1,006 | 2.4% |
| Self-Employed (Not Incorporated) | 1,759 | 4.3% |
| Not-for-profit Organizations | 2,213 | 5.4% |
| Local Government Employees | 2,555 | 6.2% |
| State Government Employees | 6,925 | 16.8% |
| Federal Government Employees | 8,006 | 19.5% |
| Unpaid Family Workers | 80 | 0.2% |
| Total | 41,152 | 100.0% |
Employment Status by Age in Riley County
According to the labor force statistics for Riley County, out of the total population over 16 years of age (61,820), 70.7% or 43,707 individuals are in the labor force, with 5.1% or 2,229 of them unemployed. The age group with the highest labor force participation rate is 35 to 44 years, with 89.4% or 6,355 individuals in the labor force. Within the labor force, the 16 to 19 years age range has the highest percentage of unemployed individuals, with 13.2% or 421 of them being unemployed.
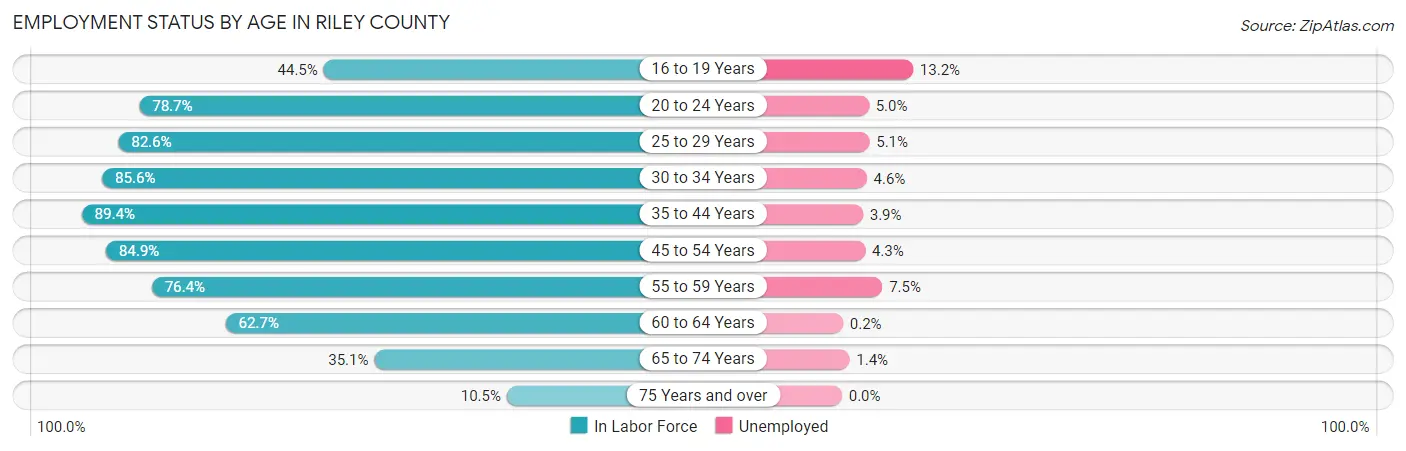
| Age Bracket | In Labor Force | Unemployed |
| 16 to 19 Years | 3,190 (44.5%) | 421 (13.2%) |
| 20 to 24 Years | 14,780 (78.7%) | 739 (5.0%) |
| 25 to 29 Years | 5,442 (82.6%) | 278 (5.1%) |
| 30 to 34 Years | 4,095 (85.6%) | 188 (4.6%) |
| 35 to 44 Years | 6,355 (89.4%) | 248 (3.9%) |
| 45 to 54 Years | 4,358 (84.9%) | 187 (4.3%) |
| 55 to 59 Years | 2,005 (76.4%) | 150 (7.5%) |
| 60 to 64 Years | 1,712 (62.7%) | 3 (0.2%) |
| 65 to 74 Years | 1,457 (35.1%) | 20 (1.4%) |
| 75 Years and over | 289 (10.5%) | 0 (0.0%) |
| Total | 43,707 (70.7%) | 2,229 (5.1%) |
Employment Status by Educational Attainment in Riley County
According to labor force statistics for Riley County, 82.8% of individuals (23,985) out of the total population between 25 and 64 years of age (28,967) are in the labor force, with 4.3% or 1,031 of them being unemployed. The group with the highest labor force participation rate are those with the educational attainment of bachelor's degree or higher, with 85.6% or 11,910 individuals in the labor force. Within the labor force, individuals with less than high school education have the highest percentage of unemployment, with 22.4% or 191 of them being unemployed.
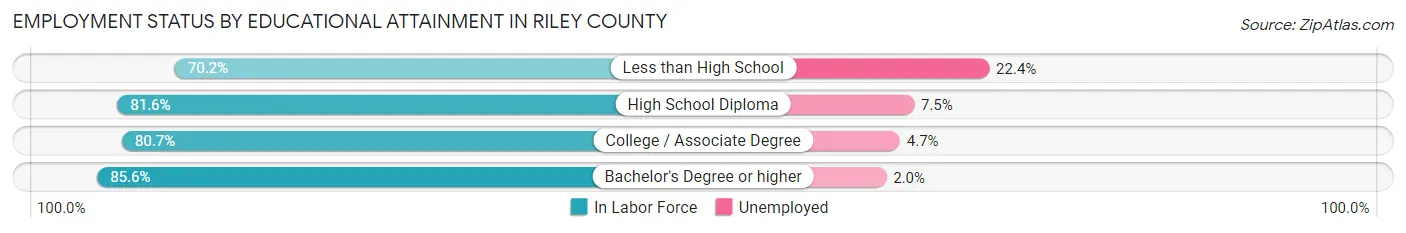
| Educational Attainment | In Labor Force | Unemployed |
| Less than High School | 852 (70.2%) | 272 (22.4%) |
| High School Diploma | 3,608 (81.6%) | 332 (7.5%) |
| College / Associate Degree | 7,601 (80.7%) | 443 (4.7%) |
| Bachelor's Degree or higher | 11,910 (85.6%) | 278 (2.0%) |
| Total | 23,985 (82.8%) | 1,246 (4.3%) |
Employment Occupations by Sex in Riley County
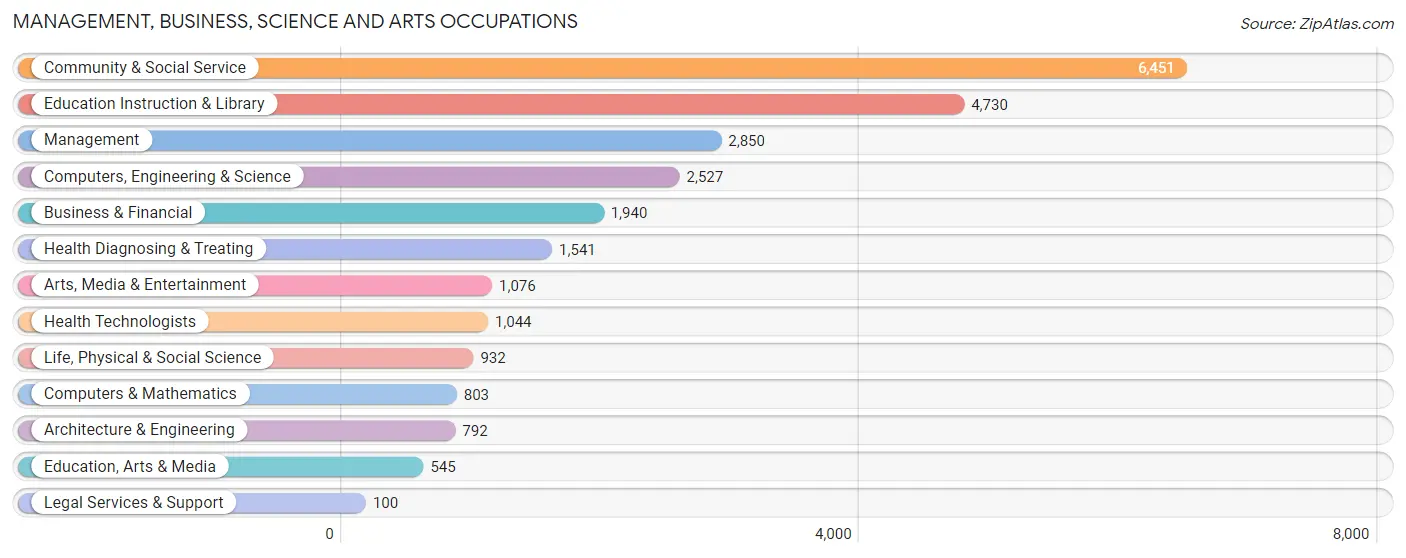
Management, Business, Science and Arts Occupations
The most common Management, Business, Science and Arts occupations in Riley County are Community & Social Service (6,451 | 18.3%), Education Instruction & Library (4,730 | 13.5%), Management (2,850 | 8.1%), Computers, Engineering & Science (2,527 | 7.2%), and Business & Financial (1,940 | 5.5%).
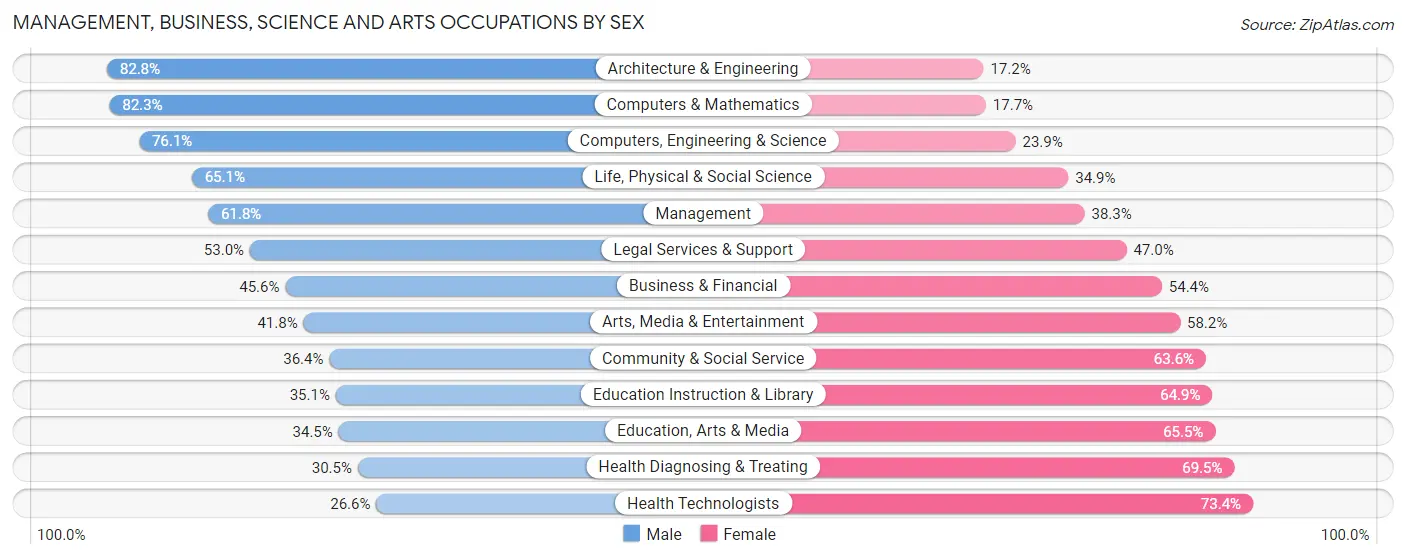
Management, Business, Science and Arts Occupations by Sex
Within the Management, Business, Science and Arts occupations in Riley County, the most male-oriented occupations are Architecture & Engineering (82.8%), Computers & Mathematics (82.3%), and Computers, Engineering & Science (76.1%), while the most female-oriented occupations are Health Technologists (73.4%), Health Diagnosing & Treating (69.5%), and Education, Arts & Media (65.5%).
| Occupation | Male | Female |
| Management | 1,760 (61.8%) | 1,090 (38.3%) |
| Business & Financial | 885 (45.6%) | 1,055 (54.4%) |
| Computers, Engineering & Science | 1,924 (76.1%) | 603 (23.9%) |
| Computers & Mathematics | 661 (82.3%) | 142 (17.7%) |
| Architecture & Engineering | 656 (82.8%) | 136 (17.2%) |
| Life, Physical & Social Science | 607 (65.1%) | 325 (34.9%) |
| Community & Social Service | 2,351 (36.4%) | 4,100 (63.6%) |
| Education, Arts & Media | 188 (34.5%) | 357 (65.5%) |
| Legal Services & Support | 53 (53.0%) | 47 (47.0%) |
| Education Instruction & Library | 1,660 (35.1%) | 3,070 (64.9%) |
| Arts, Media & Entertainment | 450 (41.8%) | 626 (58.2%) |
| Health Diagnosing & Treating | 470 (30.5%) | 1,071 (69.5%) |
| Health Technologists | 278 (26.6%) | 766 (73.4%) |
| Total (Category) | 7,390 (48.3%) | 7,919 (51.7%) |
| Total (Overall) | 18,009 (51.2%) | 17,140 (48.8%) |
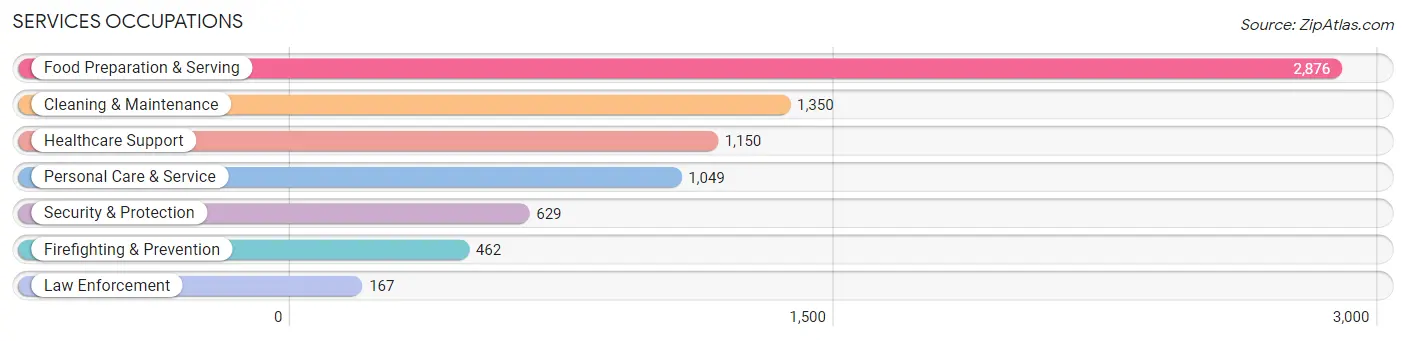
Services Occupations
The most common Services occupations in Riley County are Food Preparation & Serving (2,876 | 8.2%), Cleaning & Maintenance (1,350 | 3.8%), Healthcare Support (1,150 | 3.3%), Personal Care & Service (1,049 | 3.0%), and Security & Protection (629 | 1.8%).
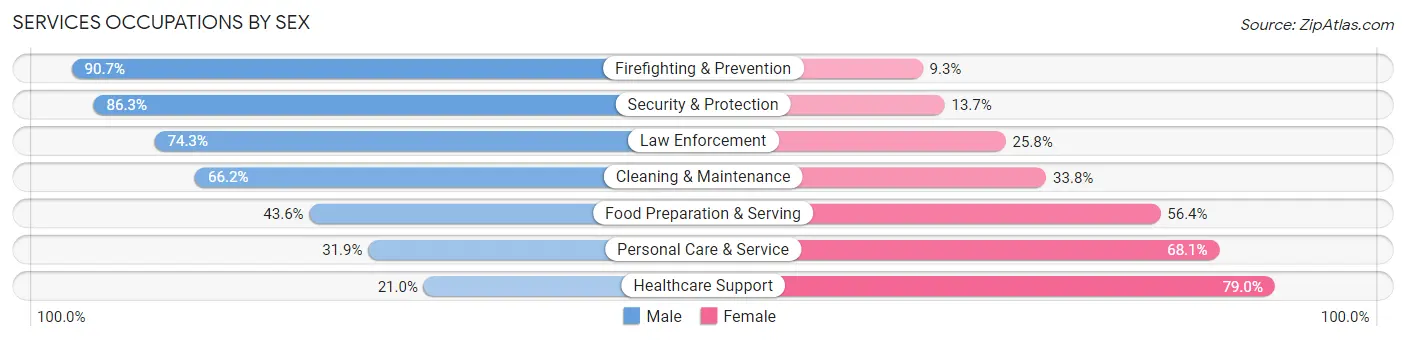
Services Occupations by Sex
Within the Services occupations in Riley County, the most male-oriented occupations are Firefighting & Prevention (90.7%), Security & Protection (86.3%), and Law Enforcement (74.3%), while the most female-oriented occupations are Healthcare Support (79.0%), Personal Care & Service (68.1%), and Food Preparation & Serving (56.4%).
| Occupation | Male | Female |
| Healthcare Support | 241 (21.0%) | 909 (79.0%) |
| Security & Protection | 543 (86.3%) | 86 (13.7%) |
| Firefighting & Prevention | 419 (90.7%) | 43 (9.3%) |
| Law Enforcement | 124 (74.3%) | 43 (25.8%) |
| Food Preparation & Serving | 1,254 (43.6%) | 1,622 (56.4%) |
| Cleaning & Maintenance | 894 (66.2%) | 456 (33.8%) |
| Personal Care & Service | 335 (31.9%) | 714 (68.1%) |
| Total (Category) | 3,267 (46.3%) | 3,787 (53.7%) |
| Total (Overall) | 18,009 (51.2%) | 17,140 (48.8%) |
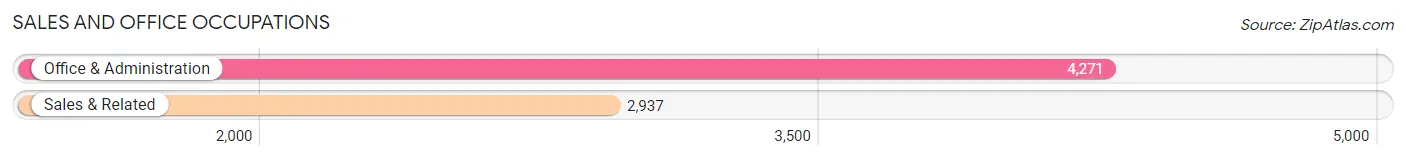
Sales and Office Occupations
The most common Sales and Office occupations in Riley County are Office & Administration (4,271 | 12.1%), and Sales & Related (2,937 | 8.4%).
Sales and Office Occupations by Sex
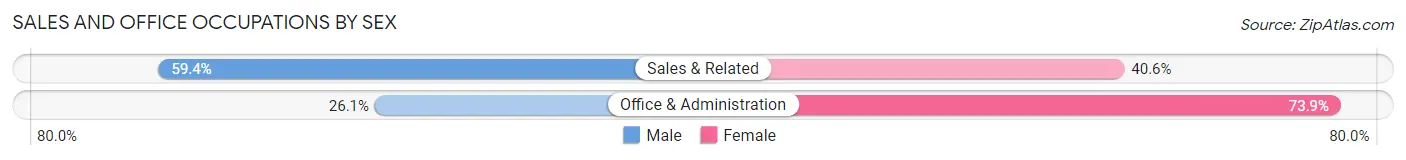
| Occupation | Male | Female |
| Sales & Related | 1,745 (59.4%) | 1,192 (40.6%) |
| Office & Administration | 1,115 (26.1%) | 3,156 (73.9%) |
| Total (Category) | 2,860 (39.7%) | 4,348 (60.3%) |
| Total (Overall) | 18,009 (51.2%) | 17,140 (48.8%) |
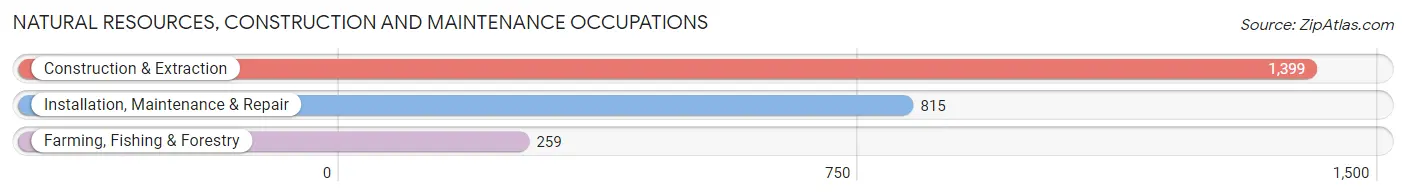
Natural Resources, Construction and Maintenance Occupations
The most common Natural Resources, Construction and Maintenance occupations in Riley County are Construction & Extraction (1,399 | 4.0%), Installation, Maintenance & Repair (815 | 2.3%), and Farming, Fishing & Forestry (259 | 0.7%).
Natural Resources, Construction and Maintenance Occupations by Sex
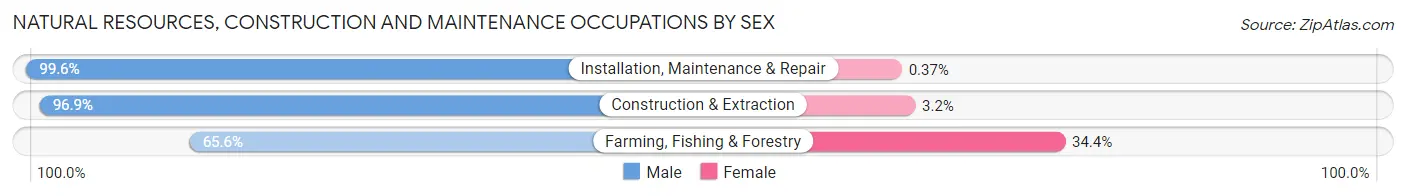
| Occupation | Male | Female |
| Farming, Fishing & Forestry | 170 (65.6%) | 89 (34.4%) |
| Construction & Extraction | 1,355 (96.9%) | 44 (3.2%) |
| Installation, Maintenance & Repair | 812 (99.6%) | 3 (0.4%) |
| Total (Category) | 2,337 (94.5%) | 136 (5.5%) |
| Total (Overall) | 18,009 (51.2%) | 17,140 (48.8%) |
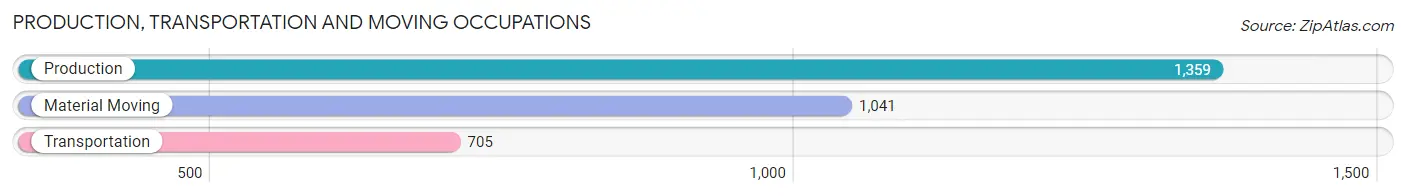
Production, Transportation and Moving Occupations
The most common Production, Transportation and Moving occupations in Riley County are Production (1,359 | 3.9%), Material Moving (1,041 | 3.0%), and Transportation (705 | 2.0%).
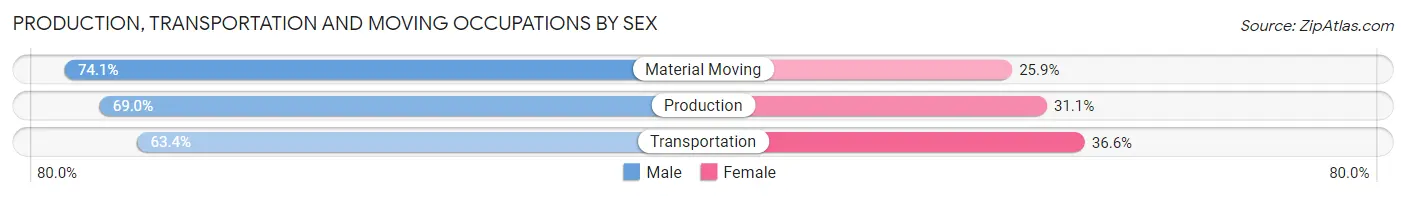
Production, Transportation and Moving Occupations by Sex
| Occupation | Male | Female |
| Production | 937 (69.0%) | 422 (31.0%) |
| Transportation | 447 (63.4%) | 258 (36.6%) |
| Material Moving | 771 (74.1%) | 270 (25.9%) |
| Total (Category) | 2,155 (69.4%) | 950 (30.6%) |
| Total (Overall) | 18,009 (51.2%) | 17,140 (48.8%) |
Employment Industries by Sex in Riley County
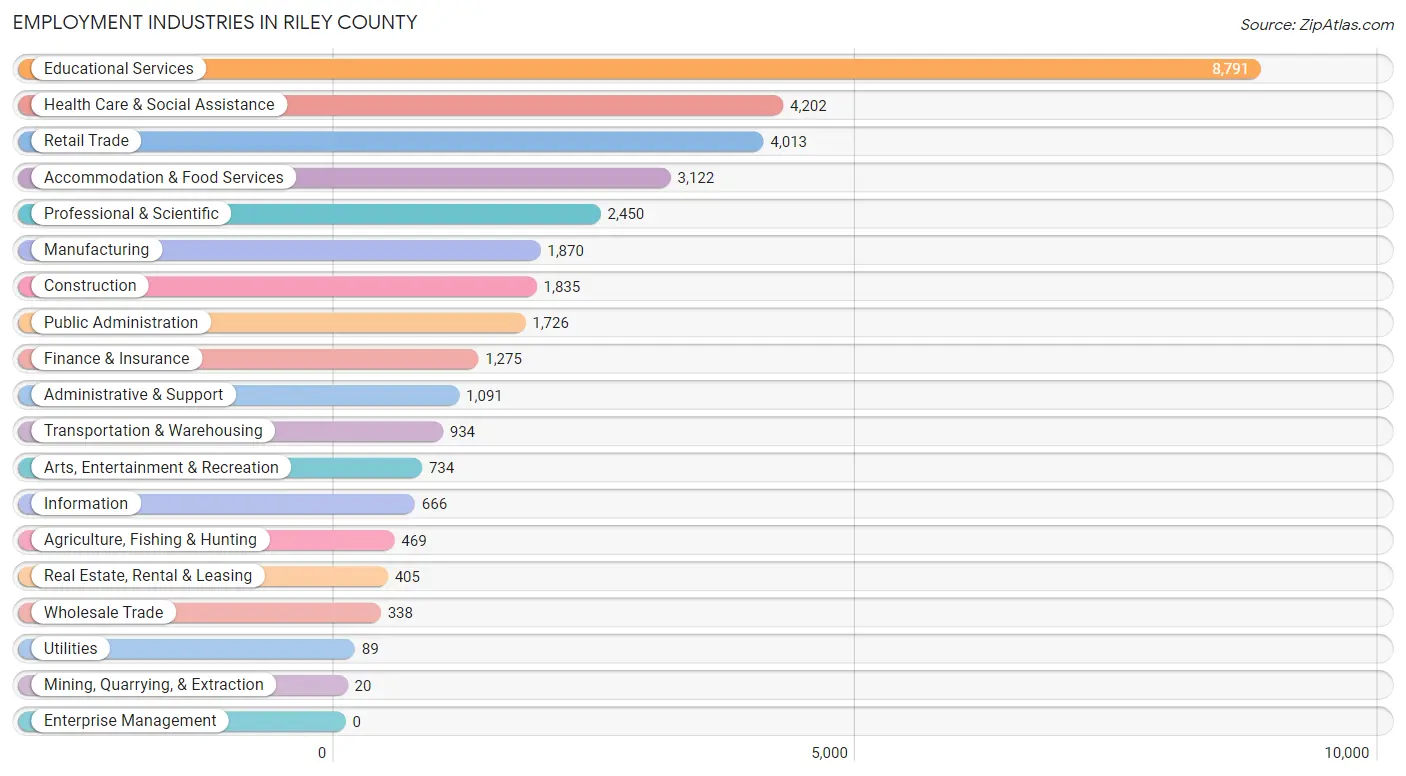
Employment Industries in Riley County
The major employment industries in Riley County include Educational Services (8,791 | 25.0%), Health Care & Social Assistance (4,202 | 11.9%), Retail Trade (4,013 | 11.4%), Accommodation & Food Services (3,122 | 8.9%), and Professional & Scientific (2,450 | 7.0%).
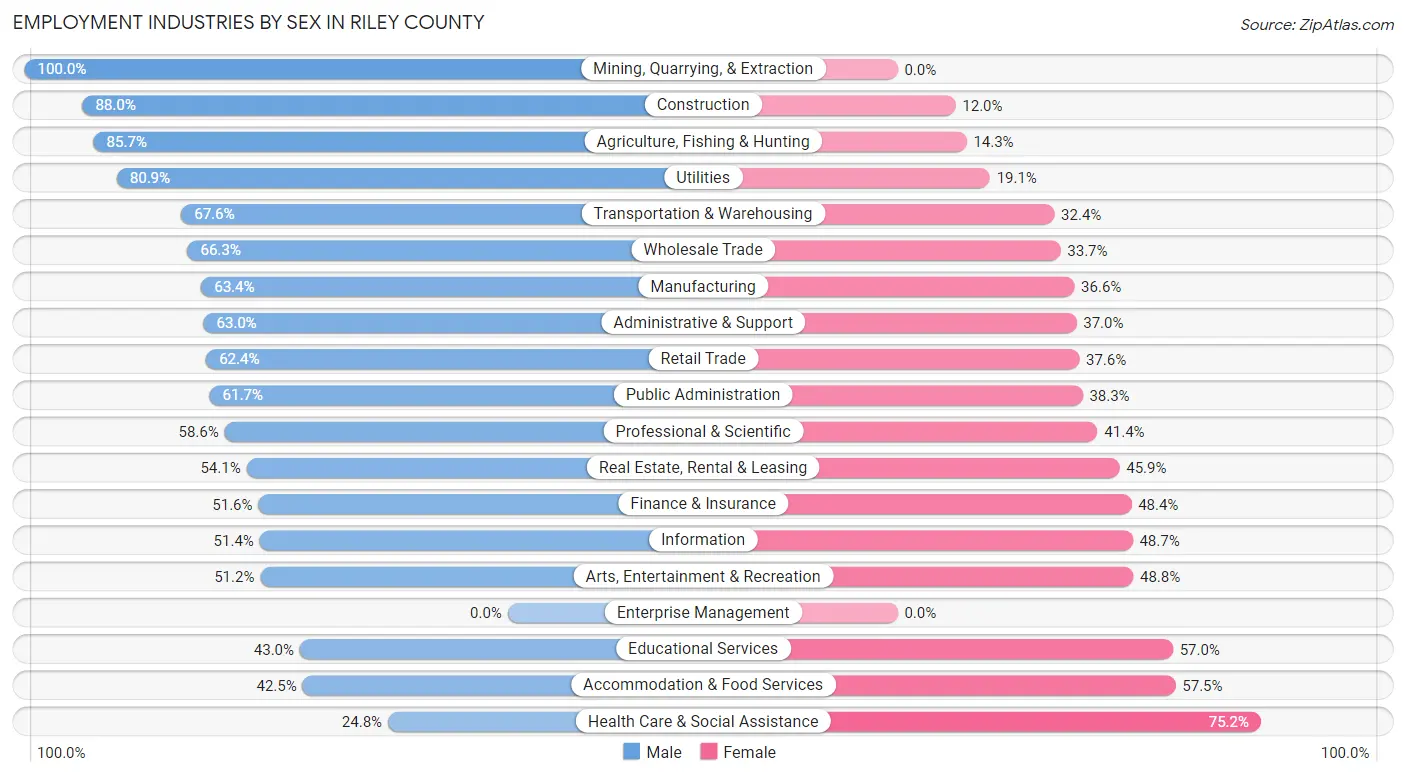
Employment Industries by Sex in Riley County
The Riley County industries that see more men than women are Mining, Quarrying, & Extraction (100.0%), Construction (88.0%), and Agriculture, Fishing & Hunting (85.7%), whereas the industries that tend to have a higher number of women are Health Care & Social Assistance (75.2%), Accommodation & Food Services (57.5%), and Educational Services (57.0%).
| Industry | Male | Female |
| Agriculture, Fishing & Hunting | 402 (85.7%) | 67 (14.3%) |
| Mining, Quarrying, & Extraction | 20 (100.0%) | 0 (0.0%) |
| Construction | 1,615 (88.0%) | 220 (12.0%) |
| Manufacturing | 1,186 (63.4%) | 684 (36.6%) |
| Wholesale Trade | 224 (66.3%) | 114 (33.7%) |
| Retail Trade | 2,504 (62.4%) | 1,509 (37.6%) |
| Transportation & Warehousing | 631 (67.6%) | 303 (32.4%) |
| Utilities | 72 (80.9%) | 17 (19.1%) |
| Information | 342 (51.3%) | 324 (48.6%) |
| Finance & Insurance | 658 (51.6%) | 617 (48.4%) |
| Real Estate, Rental & Leasing | 219 (54.1%) | 186 (45.9%) |
| Professional & Scientific | 1,436 (58.6%) | 1,014 (41.4%) |
| Enterprise Management | 0 (0.0%) | 0 (0.0%) |
| Administrative & Support | 687 (63.0%) | 404 (37.0%) |
| Educational Services | 3,782 (43.0%) | 5,009 (57.0%) |
| Health Care & Social Assistance | 1,042 (24.8%) | 3,160 (75.2%) |
| Arts, Entertainment & Recreation | 376 (51.2%) | 358 (48.8%) |
| Accommodation & Food Services | 1,326 (42.5%) | 1,796 (57.5%) |
| Public Administration | 1,065 (61.7%) | 661 (38.3%) |
| Total | 18,009 (51.2%) | 17,140 (48.8%) |
Education in Riley County
School Enrollment in Riley County
The most common levels of schooling among the 27,980 students in Riley County are college / undergraduate (16,261 | 58.1%), graduate / professional (3,000 | 10.7%), and middle school (2,665 | 9.5%).
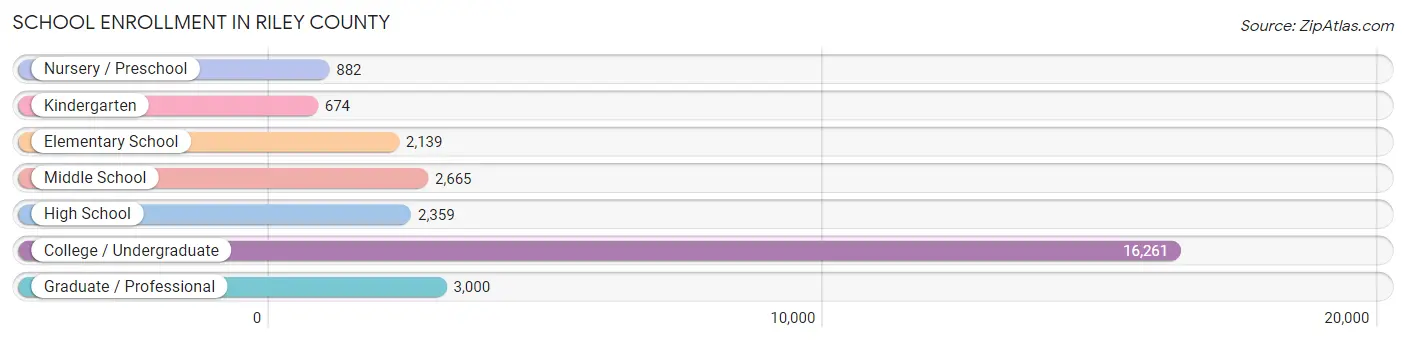
| School Level | # Students | % Students |
| Nursery / Preschool | 882 | 3.2% |
| Kindergarten | 674 | 2.4% |
| Elementary School | 2,139 | 7.6% |
| Middle School | 2,665 | 9.5% |
| High School | 2,359 | 8.4% |
| College / Undergraduate | 16,261 | 58.1% |
| Graduate / Professional | 3,000 | 10.7% |
| Total | 27,980 | 100.0% |
School Enrollment by Age by Funding Source in Riley County
Out of a total of 27,980 students who are enrolled in schools in Riley County, 1,623 (5.8%) attend a private institution, while the remaining 26,357 (94.2%) are enrolled in public schools. The age group of 3 to 4 year olds has the highest likelihood of being enrolled in private schools, with 172 (25.1% in the age bracket) enrolled. Conversely, the age group of 18 to 19 year olds has the lowest likelihood of being enrolled in a private school, with 5,282 (98.9% in the age bracket) attending a public institution.
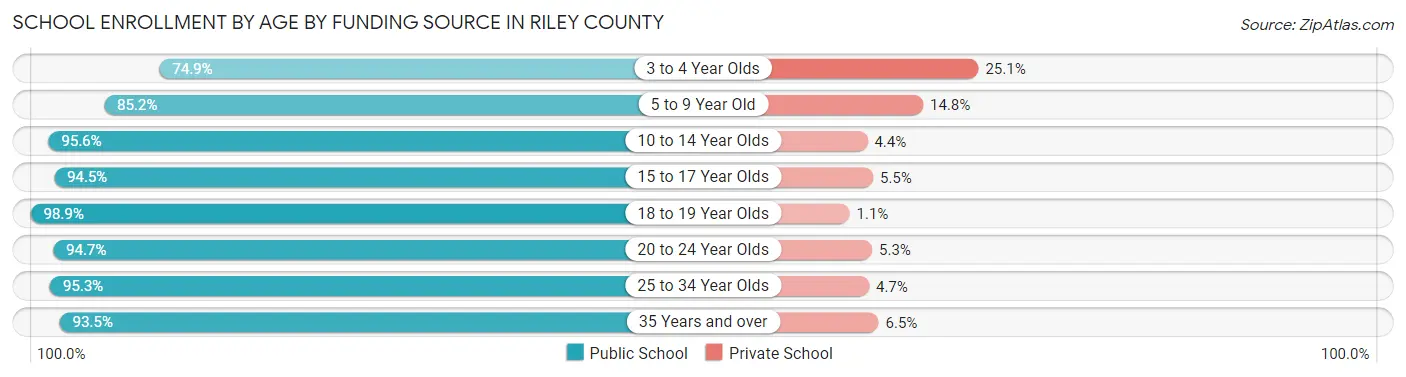
| Age Bracket | Public School | Private School |
| 3 to 4 Year Olds | 513 (74.9%) | 172 (25.1%) |
| 5 to 9 Year Old | 2,338 (85.2%) | 406 (14.8%) |
| 10 to 14 Year Olds | 2,979 (95.6%) | 138 (4.4%) |
| 15 to 17 Year Olds | 1,555 (94.5%) | 90 (5.5%) |
| 18 to 19 Year Olds | 5,282 (98.9%) | 59 (1.1%) |
| 20 to 24 Year Olds | 10,193 (94.7%) | 570 (5.3%) |
| 25 to 34 Year Olds | 2,282 (95.3%) | 113 (4.7%) |
| 35 Years and over | 1,206 (93.5%) | 84 (6.5%) |
| Total | 26,357 (94.2%) | 1,623 (5.8%) |
Educational Attainment by Field of Study in Riley County
Business (2,990 | 16.2%), education (2,732 | 14.8%), bio, nature & agricultural (2,633 | 14.3%), arts & humanities (1,551 | 8.4%), and science & technology (1,458 | 7.9%) are the most common fields of study among 18,448 individuals in Riley County who have obtained a bachelor's degree or higher.
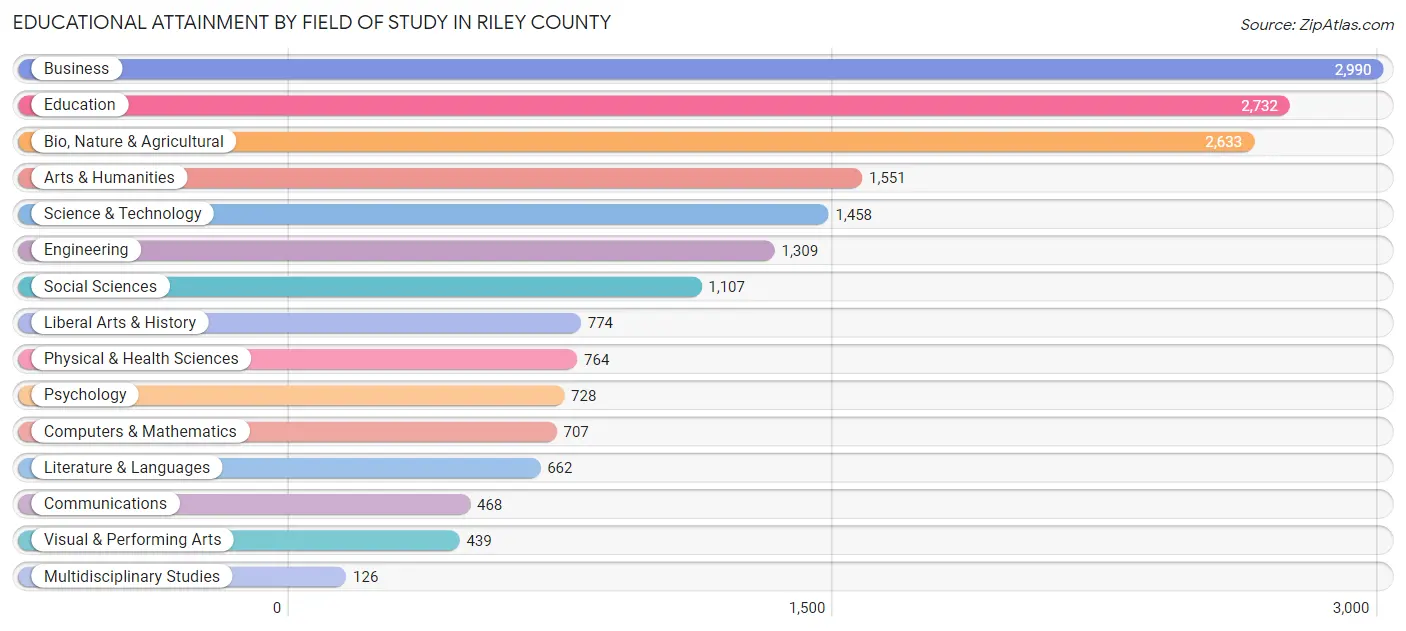
| Field of Study | # Graduates | % Graduates |
| Computers & Mathematics | 707 | 3.8% |
| Bio, Nature & Agricultural | 2,633 | 14.3% |
| Physical & Health Sciences | 764 | 4.1% |
| Psychology | 728 | 4.0% |
| Social Sciences | 1,107 | 6.0% |
| Engineering | 1,309 | 7.1% |
| Multidisciplinary Studies | 126 | 0.7% |
| Science & Technology | 1,458 | 7.9% |
| Business | 2,990 | 16.2% |
| Education | 2,732 | 14.8% |
| Literature & Languages | 662 | 3.6% |
| Liberal Arts & History | 774 | 4.2% |
| Visual & Performing Arts | 439 | 2.4% |
| Communications | 468 | 2.5% |
| Arts & Humanities | 1,551 | 8.4% |
| Total | 18,448 | 100.0% |
Transportation & Commute in Riley County
Vehicle Availability by Sex in Riley County
The most prevalent vehicle ownership categories in Riley County are males with 2 vehicles (8,015, accounting for 43.0%) and females with 2 vehicles (6,508, making up 51.5%).
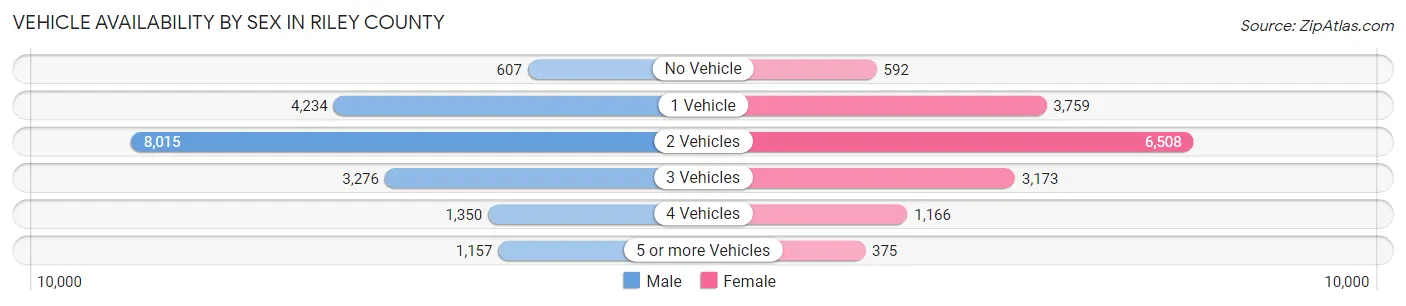
| Vehicles Available | Male | Female |
| No Vehicle | 607 (3.3%) | 592 (3.8%) |
| 1 Vehicle | 4,234 (22.7%) | 3,759 (24.1%) |
| 2 Vehicles | 8,015 (43.0%) | 6,508 (41.8%) |
| 3 Vehicles | 3,276 (17.6%) | 3,173 (20.4%) |
| 4 Vehicles | 1,350 (7.2%) | 1,166 (7.5%) |
| 5 or more Vehicles | 1,157 (6.2%) | 375 (2.4%) |
| Total | 18,639 (100.0%) | 15,573 (100.0%) |
Commute Time in Riley County
The most frequently occuring commute durations in Riley County are 5 to 9 minutes (11,080 commuters, 30.3%), 10 to 14 minutes (8,943 commuters, 24.5%), and 15 to 19 minutes (5,579 commuters, 15.3%).
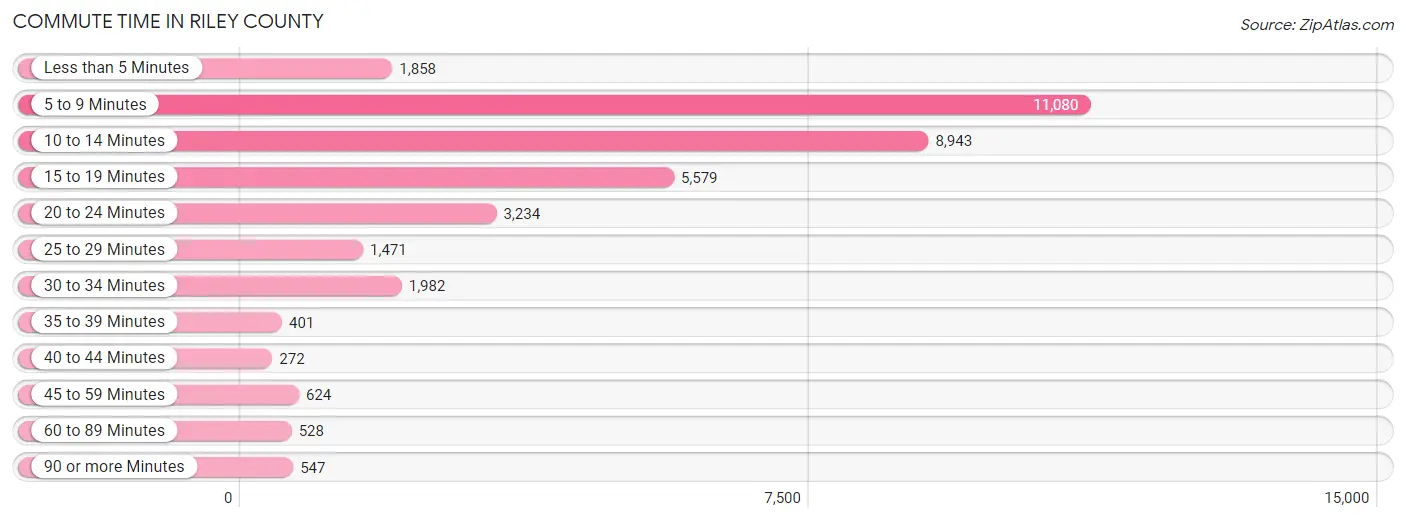
| Commute Time | # Commuters | % Commuters |
| Less than 5 Minutes | 1,858 | 5.1% |
| 5 to 9 Minutes | 11,080 | 30.3% |
| 10 to 14 Minutes | 8,943 | 24.5% |
| 15 to 19 Minutes | 5,579 | 15.3% |
| 20 to 24 Minutes | 3,234 | 8.9% |
| 25 to 29 Minutes | 1,471 | 4.0% |
| 30 to 34 Minutes | 1,982 | 5.4% |
| 35 to 39 Minutes | 401 | 1.1% |
| 40 to 44 Minutes | 272 | 0.7% |
| 45 to 59 Minutes | 624 | 1.7% |
| 60 to 89 Minutes | 528 | 1.5% |
| 90 or more Minutes | 547 | 1.5% |
Commute Time by Sex in Riley County
The most common commute times in Riley County are 5 to 9 minutes (7,344 commuters, 34.4%) for males and 10 to 14 minutes (4,268 commuters, 28.2%) for females.
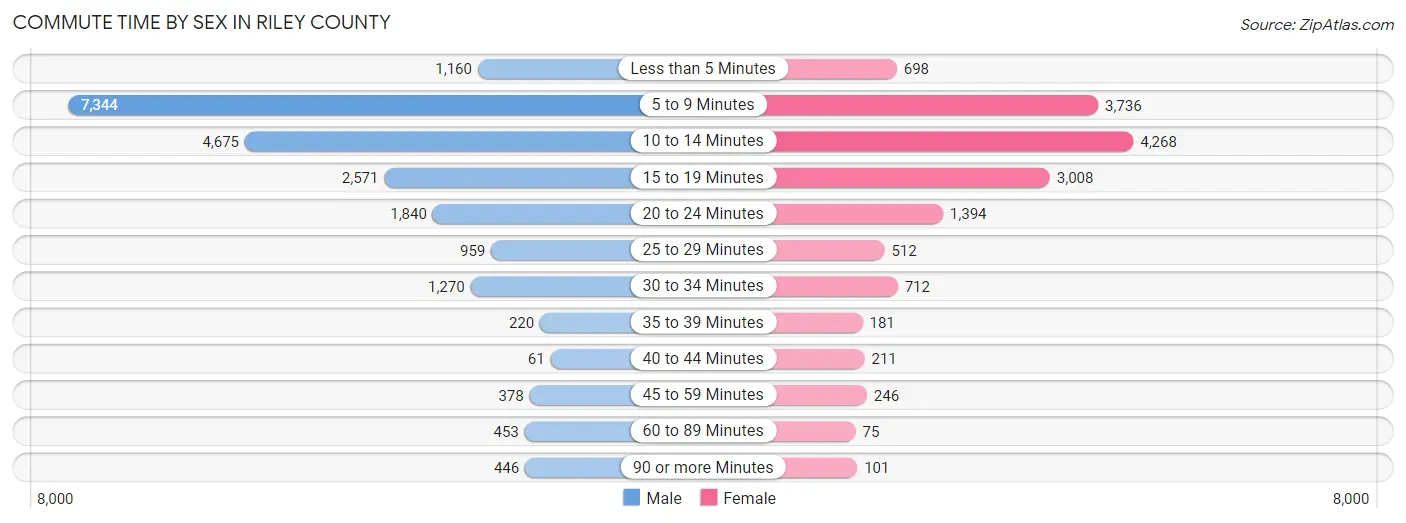
| Commute Time | Male | Female |
| Less than 5 Minutes | 1,160 (5.4%) | 698 (4.6%) |
| 5 to 9 Minutes | 7,344 (34.4%) | 3,736 (24.7%) |
| 10 to 14 Minutes | 4,675 (21.9%) | 4,268 (28.2%) |
| 15 to 19 Minutes | 2,571 (12.0%) | 3,008 (19.9%) |
| 20 to 24 Minutes | 1,840 (8.6%) | 1,394 (9.2%) |
| 25 to 29 Minutes | 959 (4.5%) | 512 (3.4%) |
| 30 to 34 Minutes | 1,270 (5.9%) | 712 (4.7%) |
| 35 to 39 Minutes | 220 (1.0%) | 181 (1.2%) |
| 40 to 44 Minutes | 61 (0.3%) | 211 (1.4%) |
| 45 to 59 Minutes | 378 (1.8%) | 246 (1.6%) |
| 60 to 89 Minutes | 453 (2.1%) | 75 (0.5%) |
| 90 or more Minutes | 446 (2.1%) | 101 (0.7%) |
Time of Departure to Work by Sex in Riley County
The most frequent times of departure to work in Riley County are 5:30 AM to 5:59 AM (4,064, 19.0%) for males and 7:30 AM to 7:59 AM (3,478, 23.0%) for females.
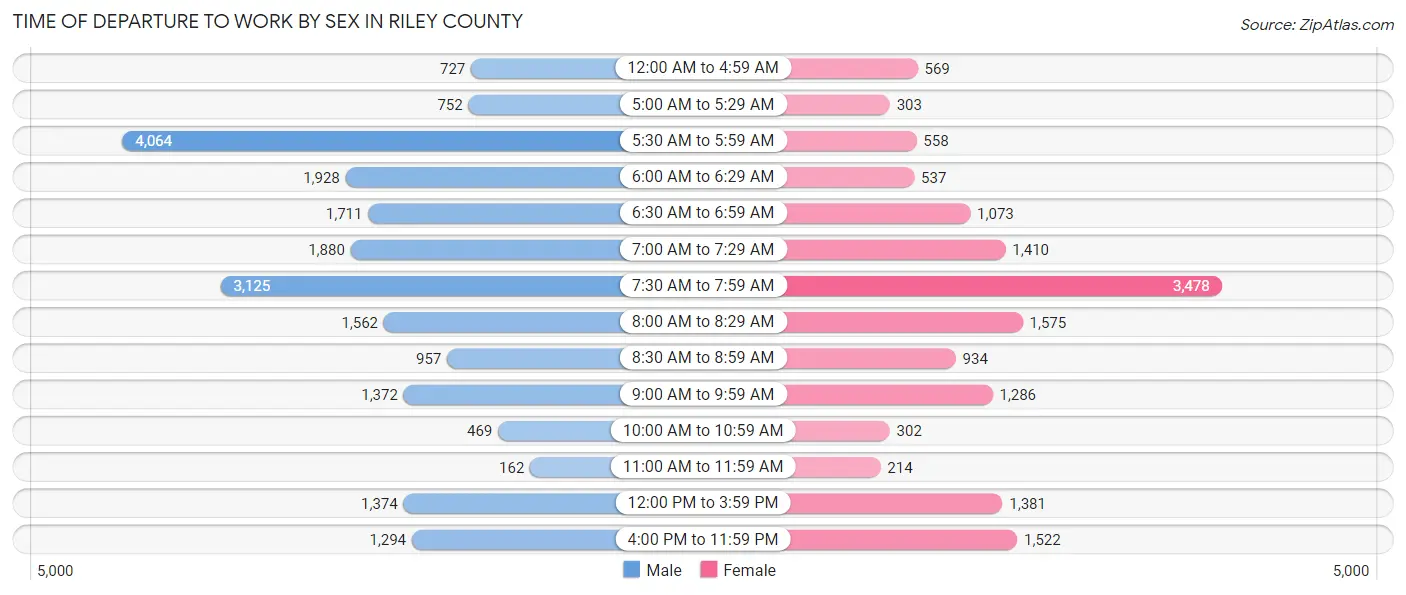
| Time of Departure | Male | Female |
| 12:00 AM to 4:59 AM | 727 (3.4%) | 569 (3.8%) |
| 5:00 AM to 5:29 AM | 752 (3.5%) | 303 (2.0%) |
| 5:30 AM to 5:59 AM | 4,064 (19.0%) | 558 (3.7%) |
| 6:00 AM to 6:29 AM | 1,928 (9.0%) | 537 (3.5%) |
| 6:30 AM to 6:59 AM | 1,711 (8.0%) | 1,073 (7.1%) |
| 7:00 AM to 7:29 AM | 1,880 (8.8%) | 1,410 (9.3%) |
| 7:30 AM to 7:59 AM | 3,125 (14.6%) | 3,478 (23.0%) |
| 8:00 AM to 8:29 AM | 1,562 (7.3%) | 1,575 (10.4%) |
| 8:30 AM to 8:59 AM | 957 (4.5%) | 934 (6.2%) |
| 9:00 AM to 9:59 AM | 1,372 (6.4%) | 1,286 (8.5%) |
| 10:00 AM to 10:59 AM | 469 (2.2%) | 302 (2.0%) |
| 11:00 AM to 11:59 AM | 162 (0.8%) | 214 (1.4%) |
| 12:00 PM to 3:59 PM | 1,374 (6.4%) | 1,381 (9.1%) |
| 4:00 PM to 11:59 PM | 1,294 (6.0%) | 1,522 (10.1%) |
| Total | 21,377 (100.0%) | 15,142 (100.0%) |
Housing Occupancy in Riley County
Occupancy by Ownership in Riley County
Of the total 26,765 dwellings in Riley County, owner-occupied units account for 11,789 (44.1%), while renter-occupied units make up 14,976 (55.9%).
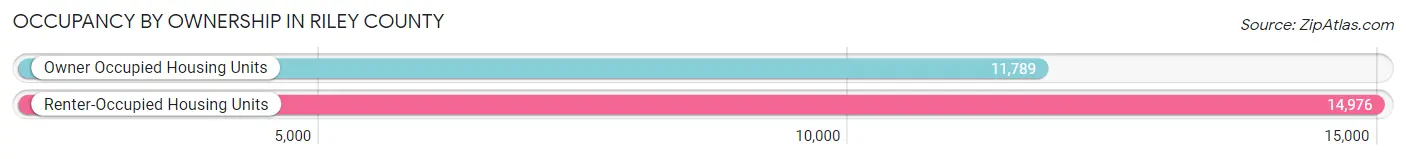
| Occupancy | # Housing Units | % Housing Units |
| Owner Occupied Housing Units | 11,789 | 44.1% |
| Renter-Occupied Housing Units | 14,976 | 55.9% |
| Total Occupied Housing Units | 26,765 | 100.0% |
Occupancy by Household Size in Riley County
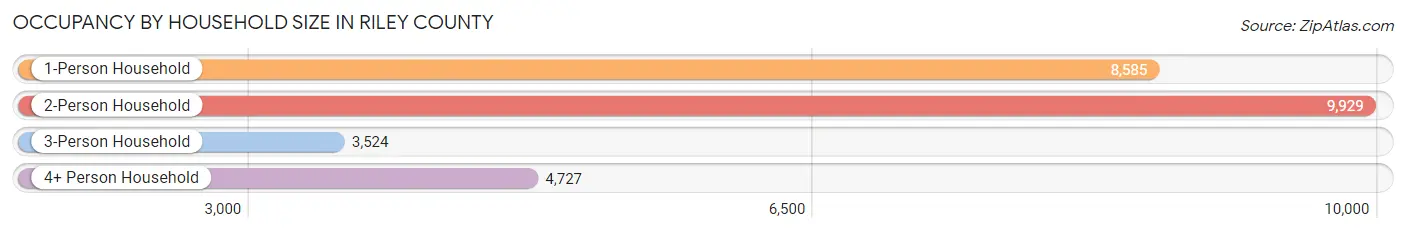
| Household Size | # Housing Units | % Housing Units |
| 1-Person Household | 8,585 | 32.1% |
| 2-Person Household | 9,929 | 37.1% |
| 3-Person Household | 3,524 | 13.2% |
| 4+ Person Household | 4,727 | 17.7% |
| Total Housing Units | 26,765 | 100.0% |
Occupancy by Ownership by Household Size in Riley County
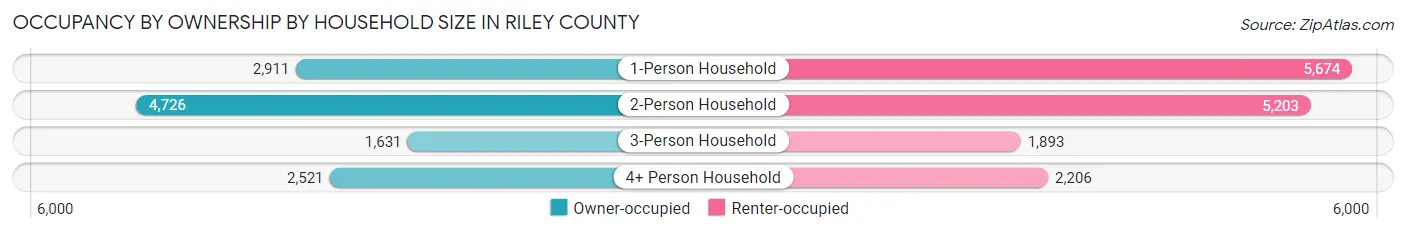
| Household Size | Owner-occupied | Renter-occupied |
| 1-Person Household | 2,911 (33.9%) | 5,674 (66.1%) |
| 2-Person Household | 4,726 (47.6%) | 5,203 (52.4%) |
| 3-Person Household | 1,631 (46.3%) | 1,893 (53.7%) |
| 4+ Person Household | 2,521 (53.3%) | 2,206 (46.7%) |
| Total Housing Units | 11,789 (44.1%) | 14,976 (55.9%) |
Occupancy by Educational Attainment in Riley County
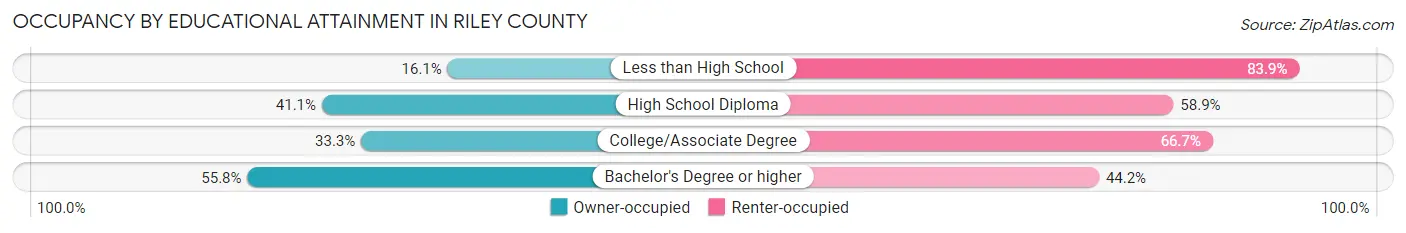
| Household Size | Owner-occupied | Renter-occupied |
| Less than High School | 141 (16.1%) | 733 (83.9%) |
| High School Diploma | 1,518 (41.1%) | 2,178 (58.9%) |
| College/Associate Degree | 3,336 (33.3%) | 6,689 (66.7%) |
| Bachelor's Degree or higher | 6,794 (55.8%) | 5,376 (44.2%) |
Occupancy by Age of Householder in Riley County
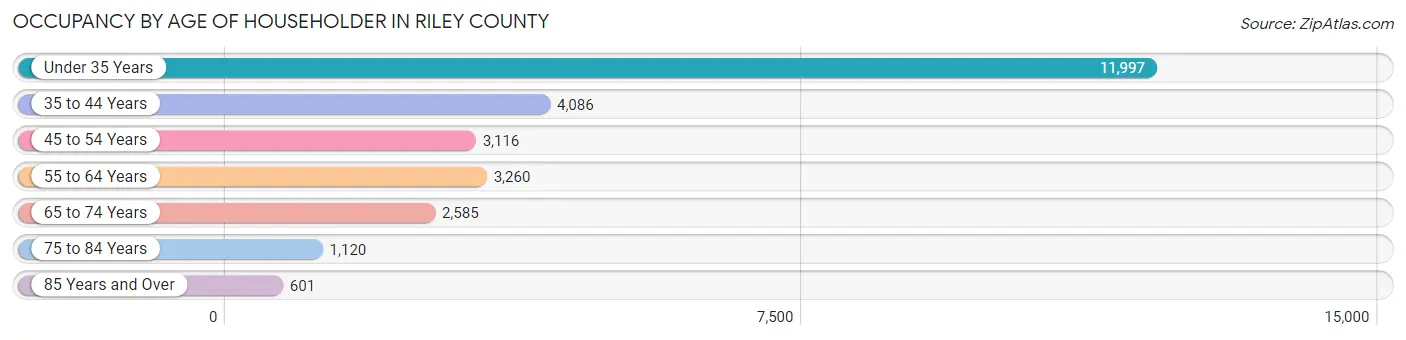
| Age Bracket | # Households | % Households |
| Under 35 Years | 11,997 | 44.8% |
| 35 to 44 Years | 4,086 | 15.3% |
| 45 to 54 Years | 3,116 | 11.6% |
| 55 to 64 Years | 3,260 | 12.2% |
| 65 to 74 Years | 2,585 | 9.7% |
| 75 to 84 Years | 1,120 | 4.2% |
| 85 Years and Over | 601 | 2.2% |
| Total | 26,765 | 100.0% |
Housing Finances in Riley County
Median Income by Occupancy in Riley County
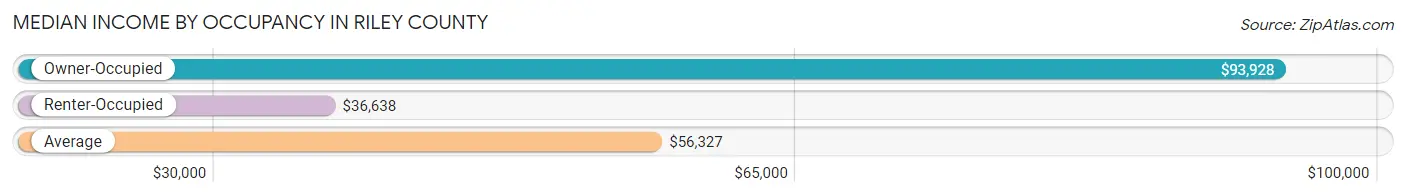
| Occupancy Type | # Households | Median Income |
| Owner-Occupied | 11,789 (44.1%) | $93,928 |
| Renter-Occupied | 14,976 (55.9%) | $36,638 |
| Average | 26,765 (100.0%) | $56,327 |
Occupancy by Householder Income Bracket in Riley County
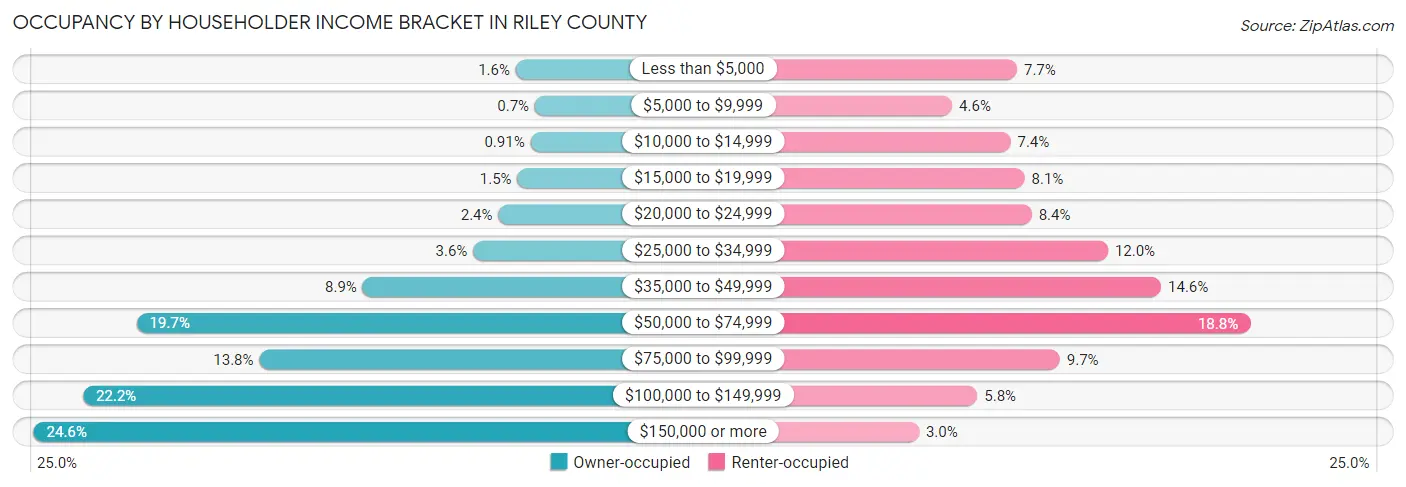
| Income Bracket | Owner-occupied | Renter-occupied |
| Less than $5,000 | 190 (1.6%) | 1,151 (7.7%) |
| $5,000 to $9,999 | 83 (0.7%) | 689 (4.6%) |
| $10,000 to $14,999 | 107 (0.9%) | 1,105 (7.4%) |
| $15,000 to $19,999 | 180 (1.5%) | 1,205 (8.1%) |
| $20,000 to $24,999 | 288 (2.4%) | 1,257 (8.4%) |
| $25,000 to $34,999 | 429 (3.6%) | 1,800 (12.0%) |
| $35,000 to $49,999 | 1,049 (8.9%) | 2,179 (14.5%) |
| $50,000 to $74,999 | 2,319 (19.7%) | 2,813 (18.8%) |
| $75,000 to $99,999 | 1,629 (13.8%) | 1,457 (9.7%) |
| $100,000 to $149,999 | 2,619 (22.2%) | 868 (5.8%) |
| $150,000 or more | 2,896 (24.6%) | 452 (3.0%) |
| Total | 11,789 (100.0%) | 14,976 (100.0%) |
Monthly Housing Cost Tiers in Riley County
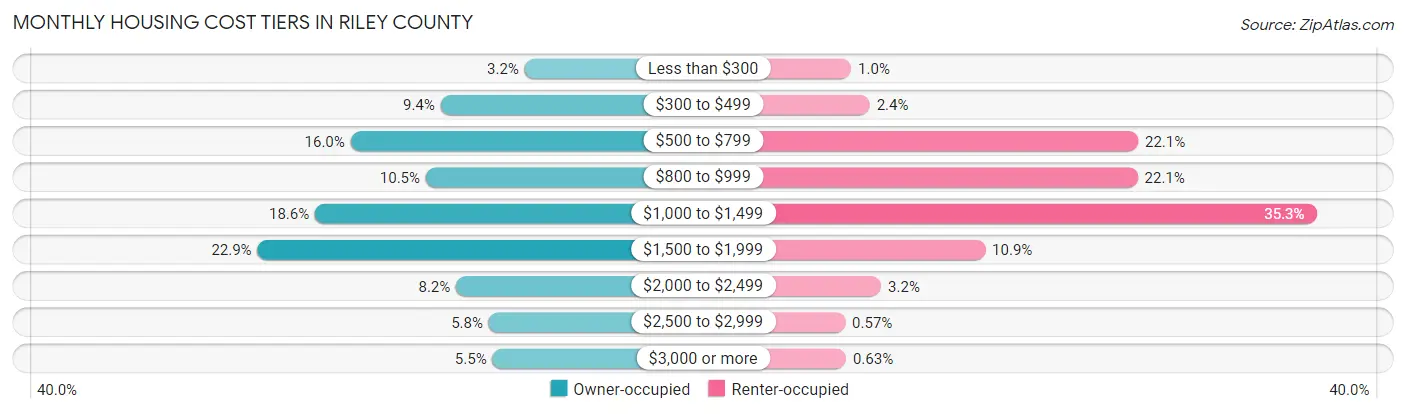
| Monthly Cost | Owner-occupied | Renter-occupied |
| Less than $300 | 374 (3.2%) | 151 (1.0%) |
| $300 to $499 | 1,103 (9.4%) | 357 (2.4%) |
| $500 to $799 | 1,885 (16.0%) | 3,316 (22.1%) |
| $800 to $999 | 1,232 (10.4%) | 3,311 (22.1%) |
| $1,000 to $1,499 | 2,194 (18.6%) | 5,282 (35.3%) |
| $1,500 to $1,999 | 2,694 (22.9%) | 1,630 (10.9%) |
| $2,000 to $2,499 | 969 (8.2%) | 482 (3.2%) |
| $2,500 to $2,999 | 685 (5.8%) | 85 (0.6%) |
| $3,000 or more | 653 (5.5%) | 95 (0.6%) |
| Total | 11,789 (100.0%) | 14,976 (100.0%) |
Physical Housing Characteristics in Riley County
Housing Structures in Riley County
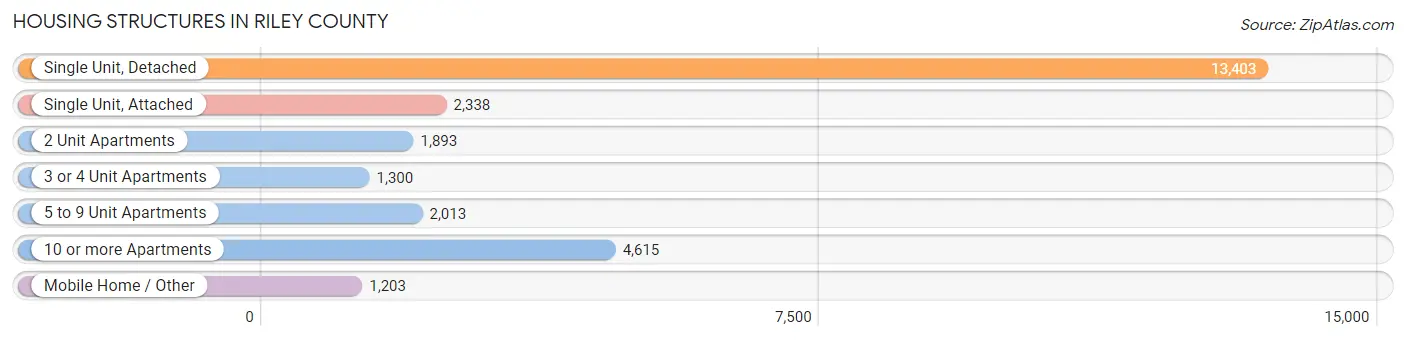
| Structure Type | # Housing Units | % Housing Units |
| Single Unit, Detached | 13,403 | 50.1% |
| Single Unit, Attached | 2,338 | 8.7% |
| 2 Unit Apartments | 1,893 | 7.1% |
| 3 or 4 Unit Apartments | 1,300 | 4.9% |
| 5 to 9 Unit Apartments | 2,013 | 7.5% |
| 10 or more Apartments | 4,615 | 17.2% |
| Mobile Home / Other | 1,203 | 4.5% |
| Total | 26,765 | 100.0% |
Housing Structures by Occupancy in Riley County
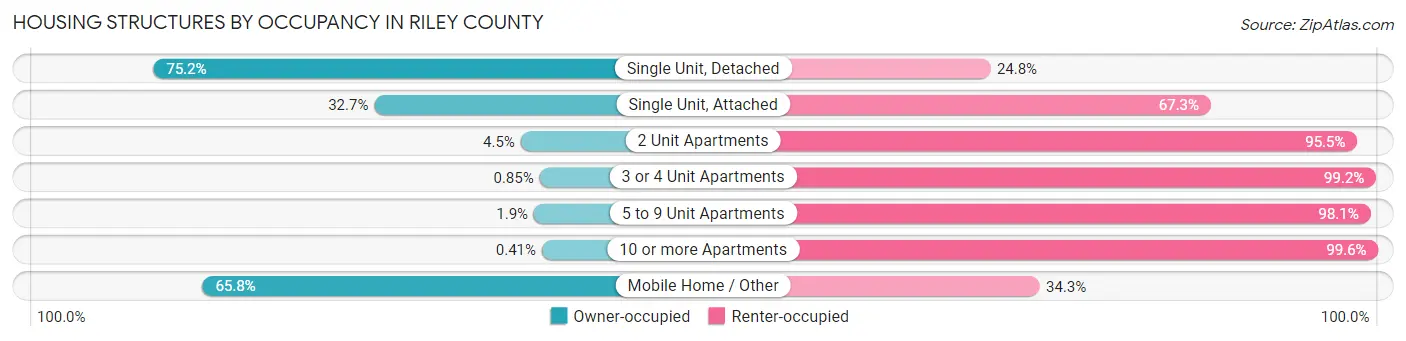
| Structure Type | Owner-occupied | Renter-occupied |
| Single Unit, Detached | 10,080 (75.2%) | 3,323 (24.8%) |
| Single Unit, Attached | 764 (32.7%) | 1,574 (67.3%) |
| 2 Unit Apartments | 85 (4.5%) | 1,808 (95.5%) |
| 3 or 4 Unit Apartments | 11 (0.9%) | 1,289 (99.2%) |
| 5 to 9 Unit Apartments | 39 (1.9%) | 1,974 (98.1%) |
| 10 or more Apartments | 19 (0.4%) | 4,596 (99.6%) |
| Mobile Home / Other | 791 (65.7%) | 412 (34.3%) |
| Total | 11,789 (44.1%) | 14,976 (55.9%) |
Housing Structures by Number of Rooms in Riley County
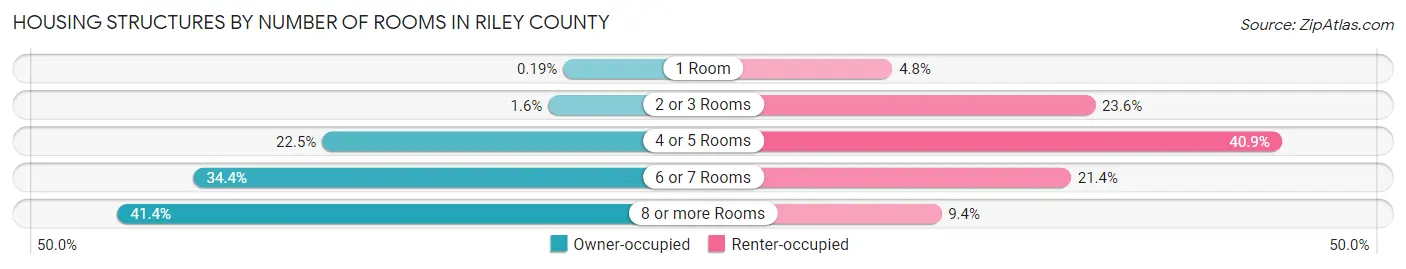
| Number of Rooms | Owner-occupied | Renter-occupied |
| 1 Room | 22 (0.2%) | 725 (4.8%) |
| 2 or 3 Rooms | 186 (1.6%) | 3,533 (23.6%) |
| 4 or 5 Rooms | 2,650 (22.5%) | 6,118 (40.8%) |
| 6 or 7 Rooms | 4,051 (34.4%) | 3,197 (21.3%) |
| 8 or more Rooms | 4,880 (41.4%) | 1,403 (9.4%) |
| Total | 11,789 (100.0%) | 14,976 (100.0%) |
Housing Structure by Heating Type in Riley County
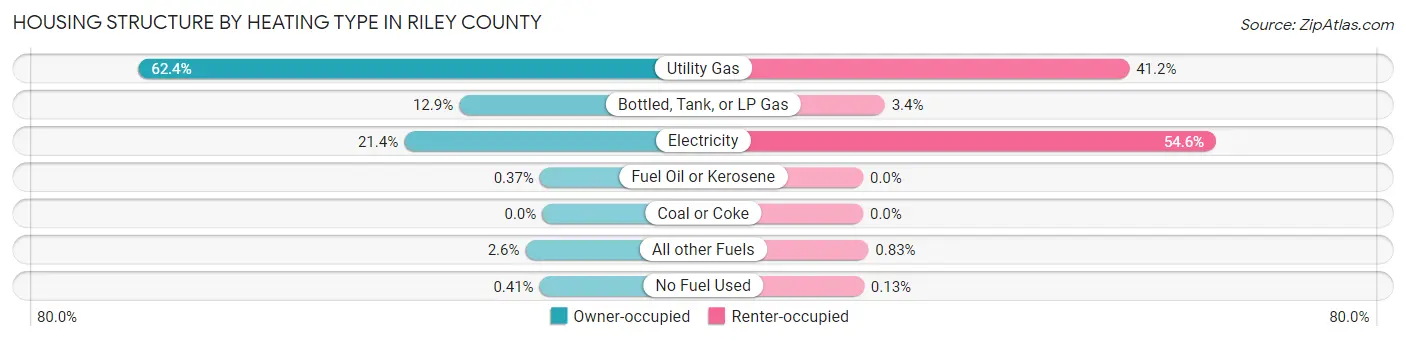
| Heating Type | Owner-occupied | Renter-occupied |
| Utility Gas | 7,359 (62.4%) | 6,162 (41.1%) |
| Bottled, Tank, or LP Gas | 1,515 (12.9%) | 502 (3.4%) |
| Electricity | 2,517 (21.3%) | 8,169 (54.5%) |
| Fuel Oil or Kerosene | 44 (0.4%) | 0 (0.0%) |
| Coal or Coke | 0 (0.0%) | 0 (0.0%) |
| All other Fuels | 306 (2.6%) | 124 (0.8%) |
| No Fuel Used | 48 (0.4%) | 19 (0.1%) |
| Total | 11,789 (100.0%) | 14,976 (100.0%) |
Household Vehicle Usage in Riley County
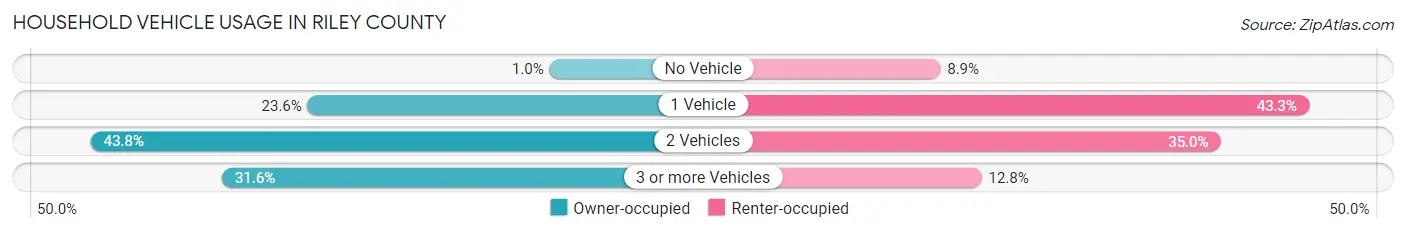
| Vehicles per Household | Owner-occupied | Renter-occupied |
| No Vehicle | 118 (1.0%) | 1,333 (8.9%) |
| 1 Vehicle | 2,780 (23.6%) | 6,485 (43.3%) |
| 2 Vehicles | 5,168 (43.8%) | 5,247 (35.0%) |
| 3 or more Vehicles | 3,723 (31.6%) | 1,911 (12.8%) |
| Total | 11,789 (100.0%) | 14,976 (100.0%) |
Real Estate & Mortgages in Riley County
Real Estate and Mortgage Overview in Riley County
| Characteristic | Without Mortgage | With Mortgage |
| Housing Units | 4,600 | 7,189 |
| Median Property Value | $203,700 | $247,000 |
| Median Household Income | $72,246 | $2,147 |
| Monthly Housing Costs | $652 | $653 |
| Real Estate Taxes | $3,165 | $77 |
Property Value by Mortgage Status in Riley County
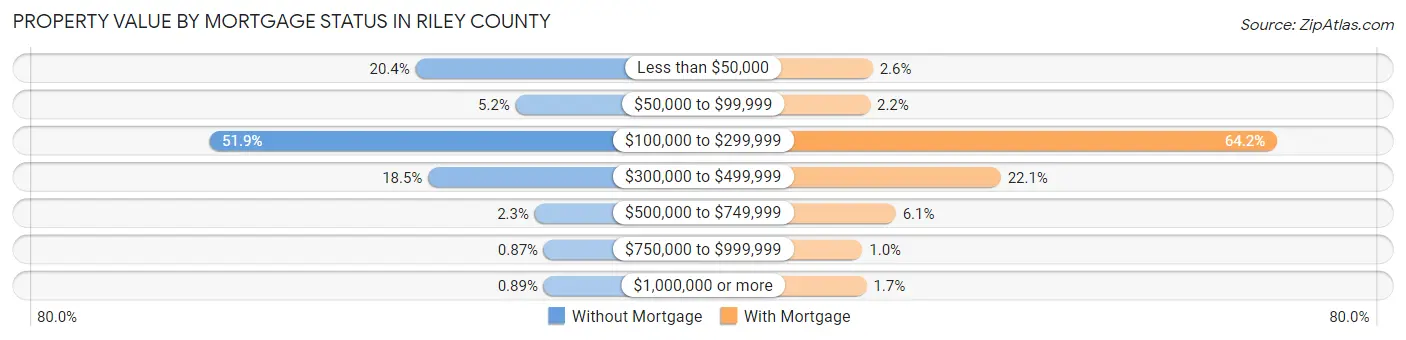
| Property Value | Without Mortgage | With Mortgage |
| Less than $50,000 | 940 (20.4%) | 188 (2.6%) |
| $50,000 to $99,999 | 238 (5.2%) | 159 (2.2%) |
| $100,000 to $299,999 | 2,386 (51.9%) | 4,618 (64.2%) |
| $300,000 to $499,999 | 851 (18.5%) | 1,590 (22.1%) |
| $500,000 to $749,999 | 104 (2.3%) | 440 (6.1%) |
| $750,000 to $999,999 | 40 (0.9%) | 75 (1.0%) |
| $1,000,000 or more | 41 (0.9%) | 119 (1.7%) |
| Total | 4,600 (100.0%) | 7,189 (100.0%) |
Household Income by Mortgage Status in Riley County
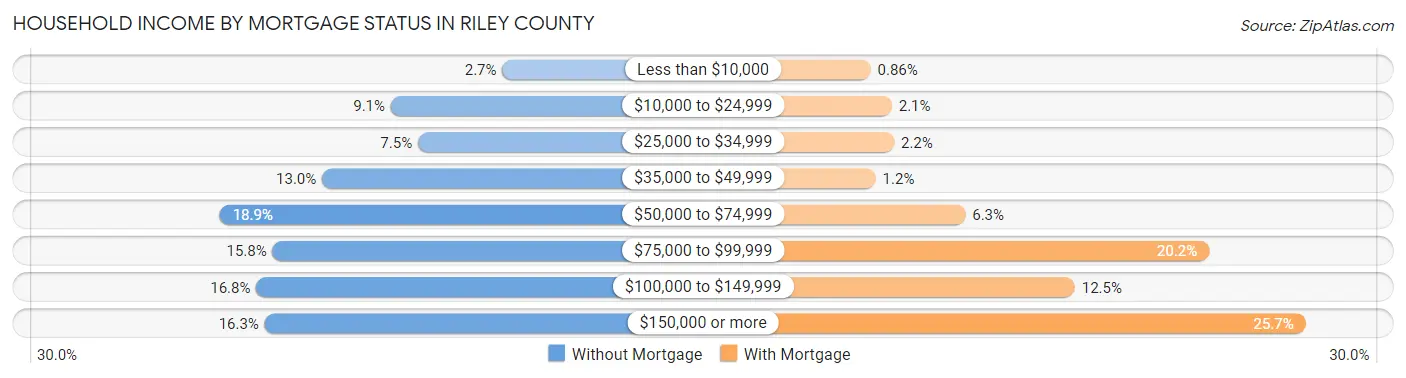
| Household Income | Without Mortgage | With Mortgage |
| Less than $10,000 | 124 (2.7%) | 62 (0.9%) |
| $10,000 to $24,999 | 417 (9.1%) | 149 (2.1%) |
| $25,000 to $34,999 | 346 (7.5%) | 158 (2.2%) |
| $35,000 to $49,999 | 598 (13.0%) | 83 (1.1%) |
| $50,000 to $74,999 | 867 (18.9%) | 451 (6.3%) |
| $75,000 to $99,999 | 728 (15.8%) | 1,452 (20.2%) |
| $100,000 to $149,999 | 771 (16.8%) | 901 (12.5%) |
| $150,000 or more | 749 (16.3%) | 1,848 (25.7%) |
| Total | 4,600 (100.0%) | 7,189 (100.0%) |
Property Value to Household Income Ratio in Riley County
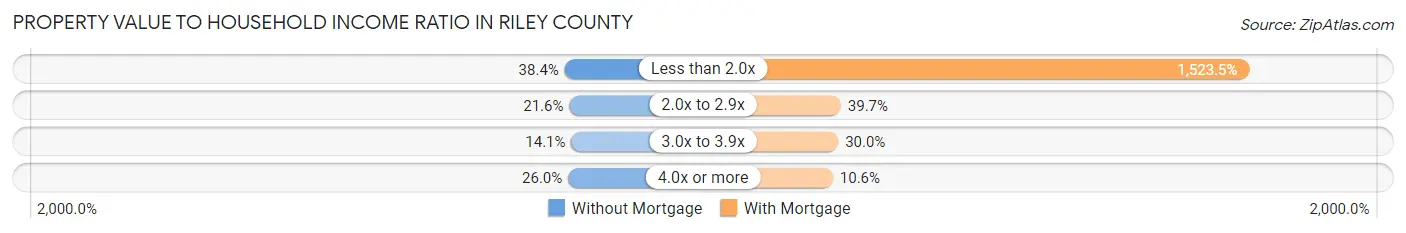
| Value-to-Income Ratio | Without Mortgage | With Mortgage |
| Less than 2.0x | 1,766 (38.4%) | 109,523 (1,523.5%) |
| 2.0x to 2.9x | 992 (21.6%) | 2,853 (39.7%) |
| 3.0x to 3.9x | 648 (14.1%) | 2,158 (30.0%) |
| 4.0x or more | 1,194 (26.0%) | 762 (10.6%) |
| Total | 4,600 (100.0%) | 7,189 (100.0%) |
Real Estate Taxes by Mortgage Status in Riley County
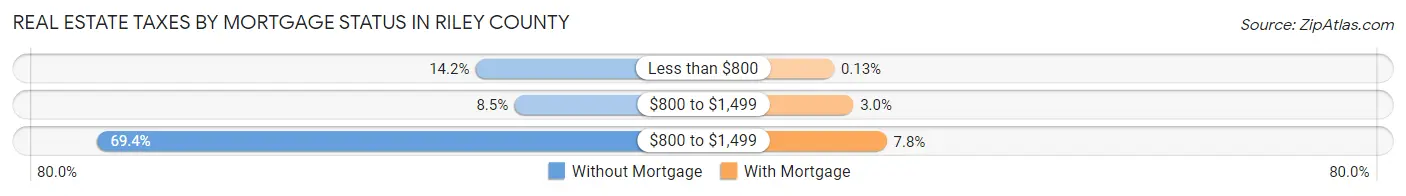
| Property Taxes | Without Mortgage | With Mortgage |
| Less than $800 | 651 (14.1%) | 9 (0.1%) |
| $800 to $1,499 | 390 (8.5%) | 212 (2.9%) |
| $800 to $1,499 | 3,190 (69.4%) | 562 (7.8%) |
| Total | 4,600 (100.0%) | 7,189 (100.0%) |
Health & Disability in Riley County
Health Insurance Coverage by Age in Riley County
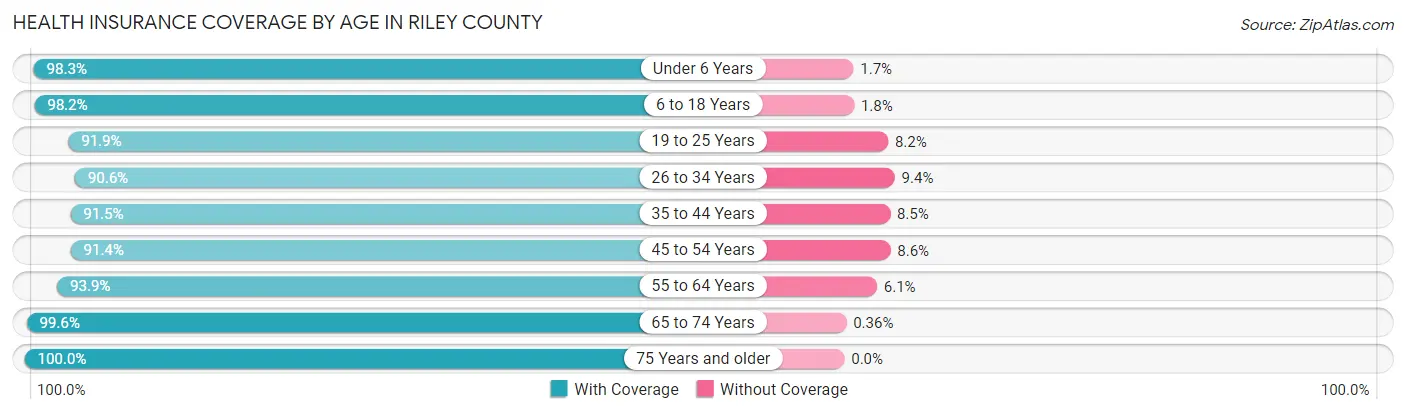
| Age Bracket | With Coverage | Without Coverage |
| Under 6 Years | 4,182 (98.3%) | 72 (1.7%) |
| 6 to 18 Years | 9,206 (98.2%) | 170 (1.8%) |
| 19 to 25 Years | 18,269 (91.8%) | 1,620 (8.2%) |
| 26 to 34 Years | 7,172 (90.6%) | 743 (9.4%) |
| 35 to 44 Years | 6,142 (91.5%) | 572 (8.5%) |
| 45 to 54 Years | 4,556 (91.4%) | 428 (8.6%) |
| 55 to 64 Years | 5,014 (93.9%) | 324 (6.1%) |
| 65 to 74 Years | 4,112 (99.6%) | 15 (0.4%) |
| 75 Years and older | 2,438 (100.0%) | 0 (0.0%) |
| Total | 61,091 (93.9%) | 3,944 (6.1%) |
Health Insurance Coverage by Citizenship Status in Riley County
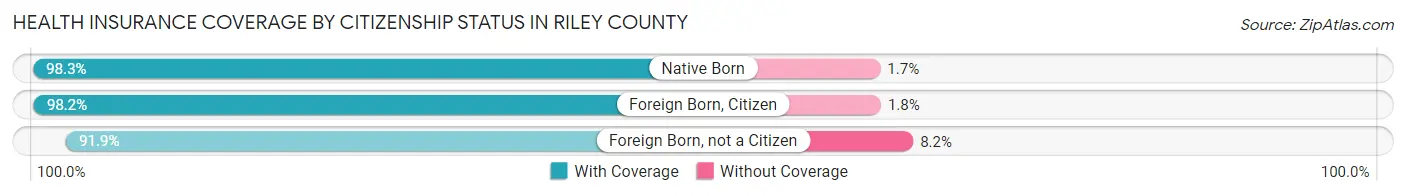
| Citizenship Status | With Coverage | Without Coverage |
| Native Born | 4,182 (98.3%) | 72 (1.7%) |
| Foreign Born, Citizen | 9,206 (98.2%) | 170 (1.8%) |
| Foreign Born, not a Citizen | 18,269 (91.8%) | 1,620 (8.2%) |
Health Insurance Coverage by Household Income in Riley County
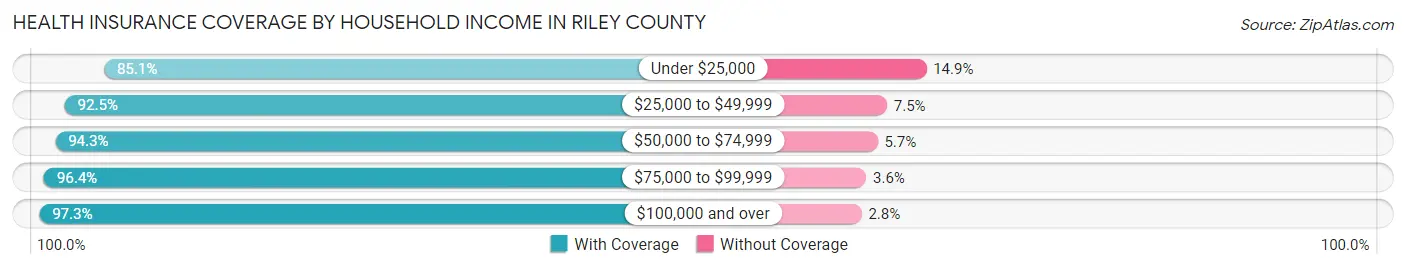
| Household Income | With Coverage | Without Coverage |
| Under $25,000 | 9,338 (85.1%) | 1,632 (14.9%) |
| $25,000 to $49,999 | 10,065 (92.5%) | 817 (7.5%) |
| $50,000 to $74,999 | 9,589 (94.3%) | 584 (5.7%) |
| $75,000 to $99,999 | 7,234 (96.4%) | 272 (3.6%) |
| $100,000 and over | 18,680 (97.3%) | 528 (2.8%) |
Public vs Private Health Insurance Coverage by Age in Riley County
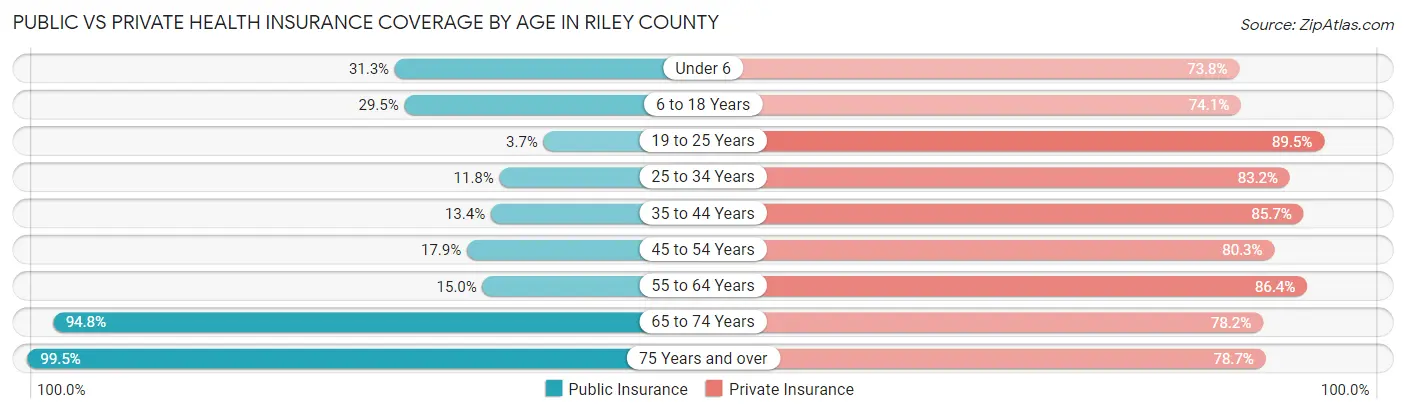
| Age Bracket | Public Insurance | Private Insurance |
| Under 6 | 1,330 (31.3%) | 3,139 (73.8%) |
| 6 to 18 Years | 2,763 (29.5%) | 6,947 (74.1%) |
| 19 to 25 Years | 725 (3.6%) | 17,806 (89.5%) |
| 25 to 34 Years | 936 (11.8%) | 6,582 (83.2%) |
| 35 to 44 Years | 902 (13.4%) | 5,755 (85.7%) |
| 45 to 54 Years | 891 (17.9%) | 4,001 (80.3%) |
| 55 to 64 Years | 800 (15.0%) | 4,610 (86.4%) |
| 65 to 74 Years | 3,911 (94.8%) | 3,227 (78.2%) |
| 75 Years and over | 2,425 (99.5%) | 1,918 (78.7%) |
| Total | 14,683 (22.6%) | 53,985 (83.0%) |
Disability Status by Sex by Age in Riley County
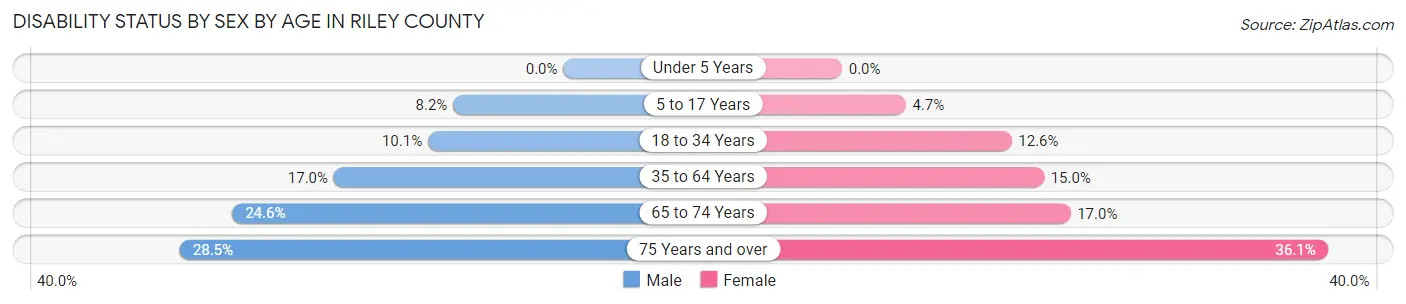
| Age Bracket | Male | Female |
| Under 5 Years | 0 (0.0%) | 0 (0.0%) |
| 5 to 17 Years | 324 (8.2%) | 185 (4.7%) |
| 18 to 34 Years | 1,489 (10.1%) | 1,906 (12.6%) |
| 35 to 64 Years | 1,444 (17.0%) | 1,283 (15.0%) |
| 65 to 74 Years | 497 (24.6%) | 357 (17.0%) |
| 75 Years and over | 312 (28.5%) | 484 (36.1%) |
Disability Class by Sex by Age in Riley County
Disability Class: Hearing Difficulty
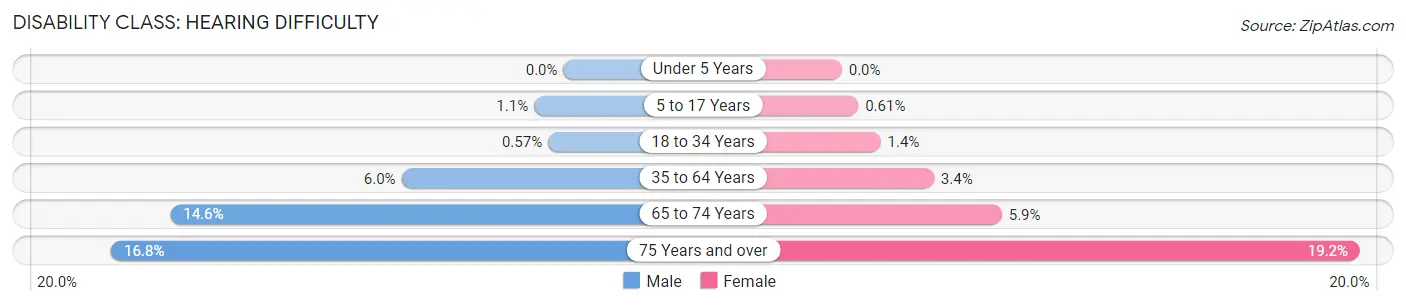
| Age Bracket | Male | Female |
| Under 5 Years | 0 (0.0%) | 0 (0.0%) |
| 5 to 17 Years | 43 (1.1%) | 24 (0.6%) |
| 18 to 34 Years | 85 (0.6%) | 218 (1.4%) |
| 35 to 64 Years | 509 (6.0%) | 293 (3.4%) |
| 65 to 74 Years | 295 (14.6%) | 125 (5.9%) |
| 75 Years and over | 184 (16.8%) | 258 (19.2%) |
Disability Class: Vision Difficulty

| Age Bracket | Male | Female |
| Under 5 Years | 0 (0.0%) | 0 (0.0%) |
| 5 to 17 Years | 22 (0.6%) | 53 (1.3%) |
| 18 to 34 Years | 333 (2.2%) | 552 (3.6%) |
| 35 to 64 Years | 169 (2.0%) | 299 (3.5%) |
| 65 to 74 Years | 138 (6.8%) | 105 (5.0%) |
| 75 Years and over | 44 (4.0%) | 103 (7.7%) |
Disability Class: Cognitive Difficulty
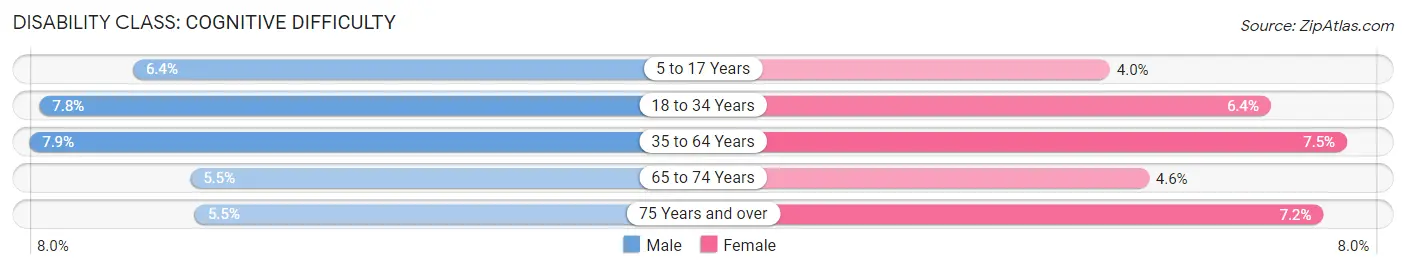
| Age Bracket | Male | Female |
| 5 to 17 Years | 253 (6.4%) | 156 (4.0%) |
| 18 to 34 Years | 1,153 (7.8%) | 965 (6.4%) |
| 35 to 64 Years | 672 (7.9%) | 642 (7.5%) |
| 65 to 74 Years | 112 (5.5%) | 96 (4.6%) |
| 75 Years and over | 60 (5.5%) | 96 (7.1%) |
Disability Class: Ambulatory Difficulty
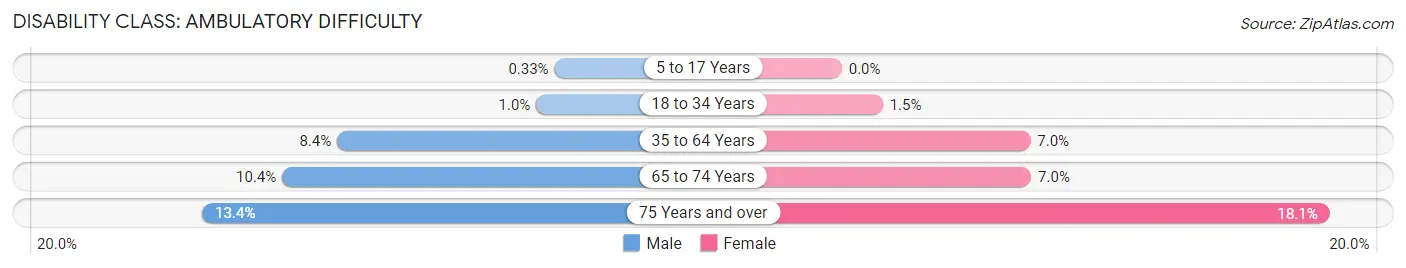
| Age Bracket | Male | Female |
| 5 to 17 Years | 13 (0.3%) | 0 (0.0%) |
| 18 to 34 Years | 150 (1.0%) | 230 (1.5%) |
| 35 to 64 Years | 712 (8.4%) | 599 (7.0%) |
| 65 to 74 Years | 211 (10.4%) | 148 (7.0%) |
| 75 Years and over | 147 (13.4%) | 243 (18.1%) |
Disability Class: Self-Care Difficulty
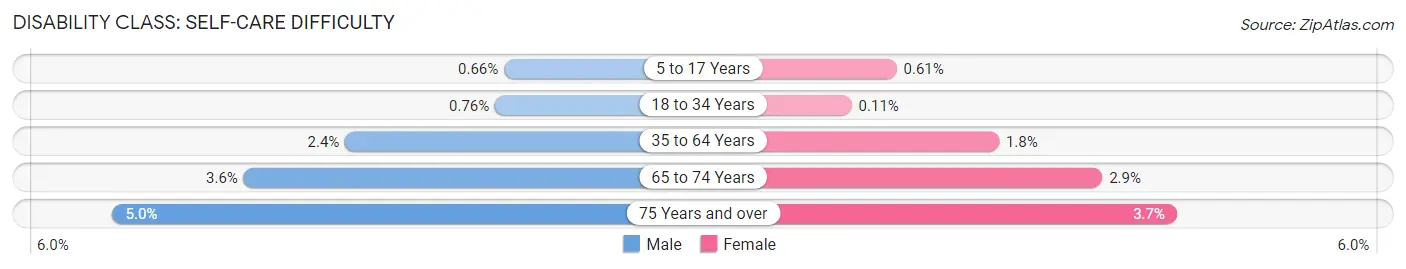
| Age Bracket | Male | Female |
| 5 to 17 Years | 26 (0.7%) | 24 (0.6%) |
| 18 to 34 Years | 113 (0.8%) | 16 (0.1%) |
| 35 to 64 Years | 206 (2.4%) | 150 (1.8%) |
| 65 to 74 Years | 72 (3.6%) | 61 (2.9%) |
| 75 Years and over | 55 (5.0%) | 50 (3.7%) |
Technology Access in Riley County
Computing Device Access in Riley County
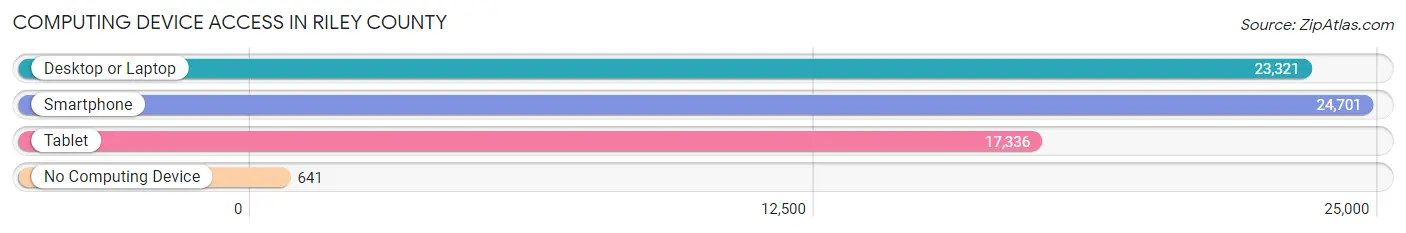
| Device Type | # Households | % Households |
| Desktop or Laptop | 23,321 | 87.1% |
| Smartphone | 24,701 | 92.3% |
| Tablet | 17,336 | 64.8% |
| No Computing Device | 641 | 2.4% |
| Total | 26,765 | 100.0% |
Internet Access in Riley County
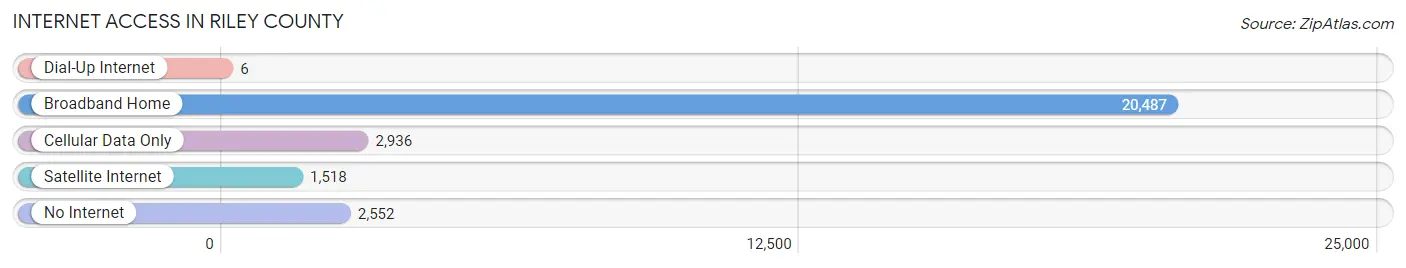
| Internet Type | # Households | % Households |
| Dial-Up Internet | 6 | 0.0% |
| Broadband Home | 20,487 | 76.5% |
| Cellular Data Only | 2,936 | 11.0% |
| Satellite Internet | 1,518 | 5.7% |
| No Internet | 2,552 | 9.5% |
| Total | 26,765 | 100.0% |
Riley County Summary
Riley County, Kansas is located in the northeastern part of the state and is part of the Manhattan metropolitan area. It is bordered by Pottawatomie County to the north, Wabaunsee County to the east, Geary County to the south, and Clay County to the west. The county seat is Manhattan, and the largest city is Manhattan. The county was named after Mexican-American War hero, Major Bennett Riley.
Geography
Riley County is located in the Flint Hills region of Kansas. The county has a total area of 576 square miles, of which 575 square miles is land and 1.2 square miles is water. The county is drained by the Big Blue River, which flows through the county from north to south. The county is also home to Tuttle Creek Lake, a reservoir created by the Tuttle Creek Dam.
The terrain of Riley County is mostly rolling hills, with some flat areas in the northern and western parts of the county. The highest point in the county is located in the northwest corner, at an elevation of 1,541 feet. The county is mostly covered in grassland, with some areas of woodland.
Demographics
As of the 2010 census, Riley County had a population of 71,115. The racial makeup of the county was 87.2% White, 5.7% Black or African American, 0.7% Native American, 3.2% Asian, 0.1% Pacific Islander, 1.3% from other races, and 2.0% from two or more races. Hispanic or Latino of any race were 4.7% of the population.
The median income for a household in the county was $45,945, and the median income for a family was $58,945. The per capita income for the county was $22,945. About 8.2% of families and 11.7% of the population were below the poverty line, including 15.2% of those under age 18 and 6.2% of those age 65 or over.
Economy
Riley County is home to several major employers, including Kansas State University, Fort Riley, and the Manhattan-Ogden School District. The county is also home to several manufacturing companies, including the Manhattan-based Cessna Aircraft Company.
Agriculture is also an important part of the county's economy. The county is home to several large farms, and the county's agricultural products include corn, soybeans, wheat, and hay.
History
Riley County was established in 1855 and was named after Major Bennett Riley, a Mexican-American War hero. The county was originally part of the Shawnee Indian Reservation, and the first settlers arrived in the area in the 1830s.
The county was home to several battles during the Civil War, including the Battle of Fort Riley in 1863. After the war, the county experienced a period of growth, and the city of Manhattan was founded in 1855.
In the late 19th century, the county was home to several large cattle ranches, and the county's economy was largely based on agriculture. In the early 20th century, the county experienced a period of industrial growth, and the city of Manhattan became an important center for manufacturing.
Today, Riley County is home to several major employers, including Kansas State University, Fort Riley, and the Manhattan-Ogden School District. The county is also home to several manufacturing companies, including the Manhattan-based Cessna Aircraft Company. Agriculture is also an important part of the county's economy, and the county's agricultural products include corn, soybeans, wheat, and hay.
Common Questions
What is the Total Population of Riley County?
Total Population of Riley County is 72,105.
What is the Total Male Population of Riley County?
Total Male Population of Riley County is 38,502.
What is the Total Female Population of Riley County?
Total Female Population of Riley County is 33,603.
What is the Ratio of Males per 100 Females in Riley County?
There are 114.58 Males per 100 Females in Riley County.
What is the Ratio of Females per 100 Males in Riley County?
There are 87.28 Females per 100 Males in Riley County.
What is the Median Population Age in Riley County?
Median Population Age in Riley County is 24.9 Years.
What is the Average Family Size in Riley County
Average Family Size in Riley County is 2.9 People.
What is the Average Household Size in Riley County
Average Household Size in Riley County is 2.3 People.
What is Per Capita Income in Riley County?
Per Capita income in Riley County is $33,147.
What is the Median Family Income in Riley County?
Median Family Income in Riley County is $83,860.
What is the Median Household income in Riley County?
Median Household Income in Riley County is $56,327.
What is Income or Wage Gap in Riley County?
Income or Wage Gap in Riley County is 42.0%.
Women in Riley County earn 58.0 cents for every dollar earned by a man.
What is Family Income Deficit in Riley County?
Family Income Deficit in Riley County is $11,734.
Families that are below poverty line in Riley County earn $11,734 less on average than the poverty threshold level.
What is Inequality or Gini Index in Riley County?
Inequality or Gini Index in Riley County is 0.48.
How Large is the Labor Force in Riley County?
There are 43,707 People in the Labor Forcein in Riley County.
What is the Percentage of People in the Labor Force in Riley County?
70.7% of People are in the Labor Force in Riley County.
What is the Unemployment Rate in Riley County?
Unemployment Rate in Riley County is 5.1%.