Reno County, KS
Reno County Overview
61,881
TOTAL POPULATION
31,255
MALE POPULATION
30,626
FEMALE POPULATION
102.05
MALES / 100 FEMALES
97.99
FEMALES / 100 MALES
40.5
MEDIAN AGE
3.0
AVG FAMILY SIZE
2.3
AVG HOUSEHOLD SIZE
$31,695
PER CAPITA INCOME
$74,490
AVG FAMILY INCOME
$57,390
AVG HOUSEHOLD INCOME
34.1%
WAGE / INCOME GAP [ % ]
65.9¢/ $1
WAGE / INCOME GAP [ $ ]
$9,321
FAMILY INCOME DEFICIT
0.44
INEQUALITY / GINI INDEX
30,673
LABOR FORCE [ PEOPLE ]
61.6%
PERCENT IN LABOR FORCE
4.2%
UNEMPLOYMENT RATE
Reno County Area Codes
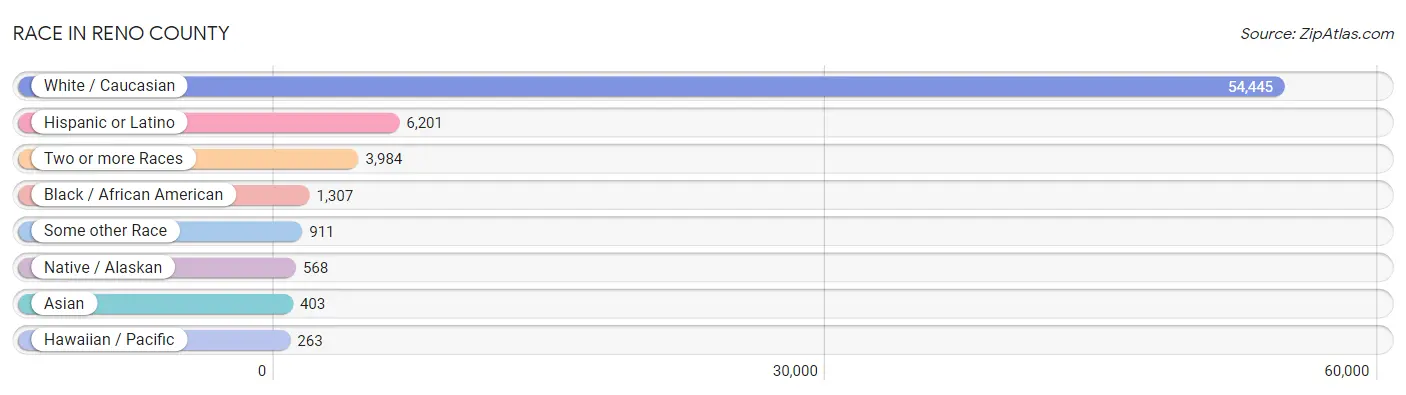
Race in Reno County
The most populous races in Reno County are White / Caucasian (54,445 | 88.0%), Hispanic or Latino (6,201 | 10.0%), and Two or more Races (3,984 | 6.4%).
| Race | # Population | % Population |
| Asian | 403 | 0.6% |
| Black / African American | 1,307 | 2.1% |
| Hawaiian / Pacific | 263 | 0.4% |
| Hispanic or Latino | 6,201 | 10.0% |
| Native / Alaskan | 568 | 0.9% |
| White / Caucasian | 54,445 | 88.0% |
| Two or more Races | 3,984 | 6.4% |
| Some other Race | 911 | 1.5% |
| Total | 61,881 | 100.0% |
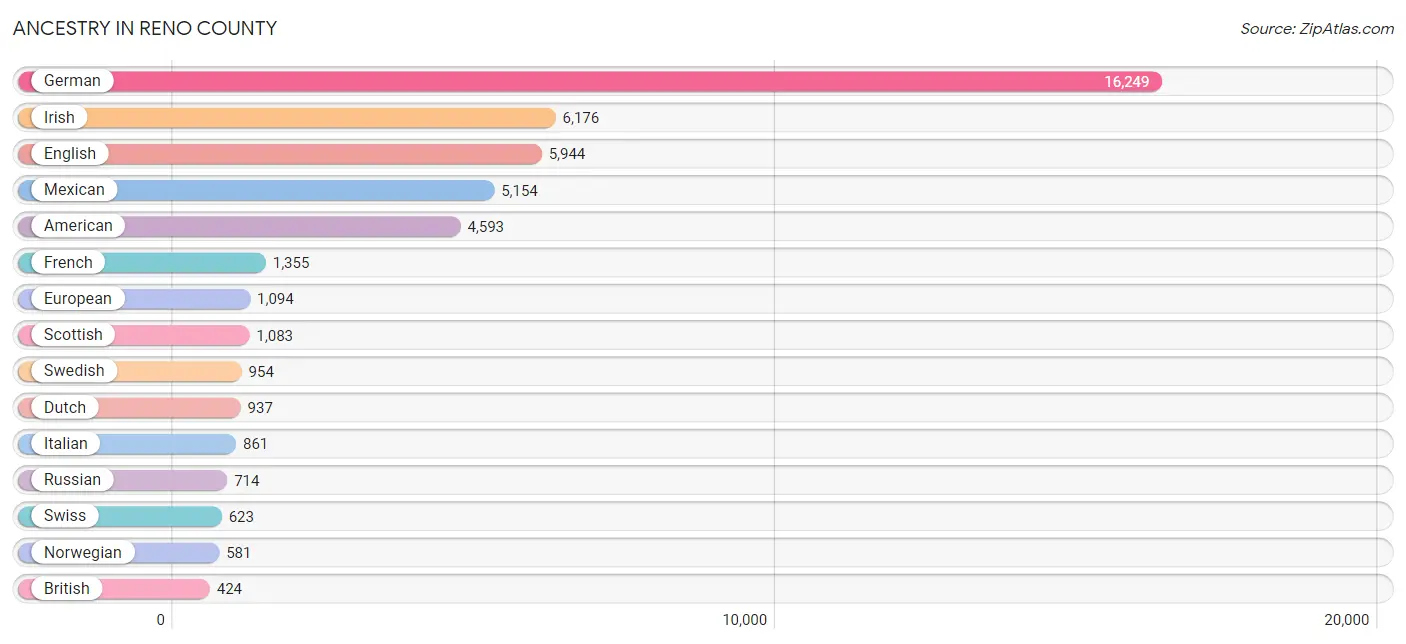
Ancestry in Reno County
The most populous ancestries reported in Reno County are German (16,249 | 26.3%), Irish (6,176 | 10.0%), English (5,944 | 9.6%), Mexican (5,154 | 8.3%), and American (4,593 | 7.4%), together accounting for 61.6% of all Reno County residents.
| Ancestry | # Population | % Population |
| African | 81 | 0.1% |
| American | 4,593 | 7.4% |
| Apache | 69 | 0.1% |
| Arab | 65 | 0.1% |
| Austrian | 43 | 0.1% |
| Basque | 33 | 0.1% |
| Belgian | 18 | 0.0% |
| Bhutanese | 87 | 0.1% |
| Blackfeet | 14 | 0.0% |
| Brazilian | 55 | 0.1% |
| British | 424 | 0.7% |
| Bulgarian | 4 | 0.0% |
| Burmese | 15 | 0.0% |
| Cajun | 18 | 0.0% |
| Canadian | 24 | 0.0% |
| Central American | 92 | 0.2% |
| Central American Indian | 19 | 0.0% |
| Cherokee | 304 | 0.5% |
| Cheyenne | 8 | 0.0% |
| Chickasaw | 34 | 0.1% |
| Chippewa | 1 | 0.0% |
| Choctaw | 221 | 0.4% |
| Comanche | 1 | 0.0% |
| Creek | 29 | 0.1% |
| Cuban | 49 | 0.1% |
| Czech | 372 | 0.6% |
| Czechoslovakian | 61 | 0.1% |
| Danish | 194 | 0.3% |
| Delaware | 39 | 0.1% |
| Dutch | 937 | 1.5% |
| Eastern European | 26 | 0.0% |
| English | 5,944 | 9.6% |
| European | 1,094 | 1.8% |
| Finnish | 22 | 0.0% |
| French | 1,355 | 2.2% |
| French Canadian | 84 | 0.1% |
| German | 16,249 | 26.3% |
| German Russian | 17 | 0.0% |
| Greek | 209 | 0.3% |
| Guatemalan | 7 | 0.0% |
| Honduran | 1 | 0.0% |
| Hungarian | 117 | 0.2% |
| Indian (Asian) | 307 | 0.5% |
| Irish | 6,176 | 10.0% |
| Iroquois | 16 | 0.0% |
| Italian | 861 | 1.4% |
| Jordanian | 27 | 0.0% |
| Korean | 97 | 0.2% |
| Latvian | 35 | 0.1% |
| Lebanese | 8 | 0.0% |
| Lithuanian | 4 | 0.0% |
| Mexican | 5,154 | 8.3% |
| Mexican American Indian | 75 | 0.1% |
| Moroccan | 14 | 0.0% |
| Navajo | 14 | 0.0% |
| Nicaraguan | 31 | 0.1% |
| Northern European | 59 | 0.1% |
| Norwegian | 581 | 0.9% |
| Osage | 48 | 0.1% |
| Palestinian | 43 | 0.1% |
| Pennsylvania German | 126 | 0.2% |
| Peruvian | 29 | 0.1% |
| Polish | 366 | 0.6% |
| Portuguese | 62 | 0.1% |
| Potawatomi | 133 | 0.2% |
| Puerto Rican | 198 | 0.3% |
| Romanian | 29 | 0.1% |
| Russian | 714 | 1.1% |
| Salvadoran | 53 | 0.1% |
| Samoan | 3 | 0.0% |
| Scandinavian | 112 | 0.2% |
| Scotch-Irish | 380 | 0.6% |
| Scottish | 1,083 | 1.8% |
| Seminole | 4 | 0.0% |
| Serbian | 7 | 0.0% |
| Sioux | 113 | 0.2% |
| Slovak | 13 | 0.0% |
| South American | 30 | 0.1% |
| South American Indian | 24 | 0.0% |
| Spaniard | 169 | 0.3% |
| Spanish | 405 | 0.6% |
| Sri Lankan | 49 | 0.1% |
| Subsaharan African | 88 | 0.1% |
| Swedish | 954 | 1.5% |
| Swiss | 623 | 1.0% |
| Thai | 28 | 0.1% |
| Tohono O'Odham | 122 | 0.2% |
| Ukrainian | 7 | 0.0% |
| Venezuelan | 1 | 0.0% |
| Welsh | 339 | 0.5% |
| Yugoslavian | 13 | 0.0% | View All 91 Rows |
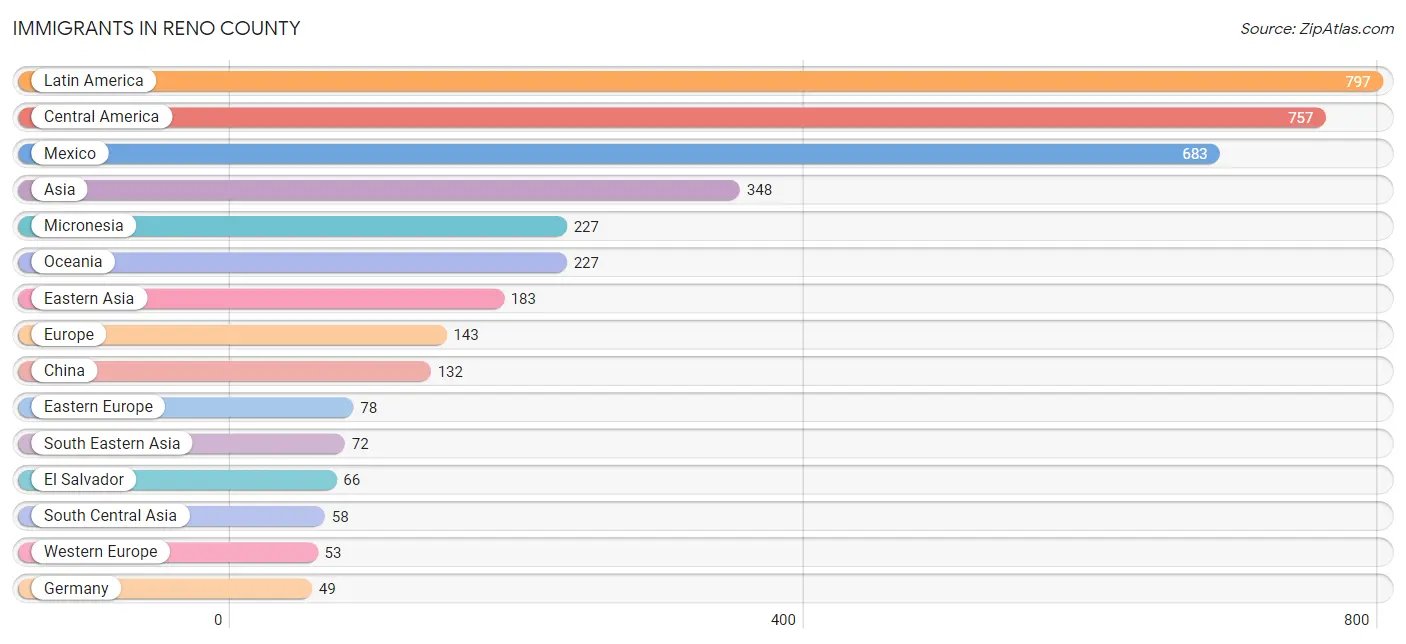
Immigrants in Reno County
The most numerous immigrant groups reported in Reno County came from Latin America (797 | 1.3%), Central America (757 | 1.2%), Mexico (683 | 1.1%), Asia (348 | 0.6%), and Micronesia (227 | 0.4%), together accounting for 4.5% of all Reno County residents.
| Immigration Origin | # Population | % Population |
| Asia | 348 | 0.6% |
| Brazil | 24 | 0.0% |
| Caribbean | 15 | 0.0% |
| Central America | 757 | 1.2% |
| China | 132 | 0.2% |
| Cuba | 8 | 0.0% |
| Eastern Asia | 183 | 0.3% |
| Eastern Europe | 78 | 0.1% |
| El Salvador | 66 | 0.1% |
| England | 2 | 0.0% |
| Europe | 143 | 0.2% |
| Germany | 49 | 0.1% |
| Guatemala | 7 | 0.0% |
| Honduras | 1 | 0.0% |
| India | 14 | 0.0% |
| Japan | 43 | 0.1% |
| Korea | 8 | 0.0% |
| Kuwait | 9 | 0.0% |
| Laos | 20 | 0.0% |
| Latin America | 797 | 1.3% |
| Latvia | 43 | 0.1% |
| Malaysia | 14 | 0.0% |
| Mexico | 683 | 1.1% |
| Micronesia | 227 | 0.4% |
| Netherlands | 4 | 0.0% |
| Northern Europe | 12 | 0.0% |
| Oceania | 227 | 0.4% |
| Pakistan | 44 | 0.1% |
| Philippines | 8 | 0.0% |
| Russia | 35 | 0.1% |
| Scotland | 5 | 0.0% |
| South America | 25 | 0.0% |
| South Central Asia | 58 | 0.1% |
| South Eastern Asia | 72 | 0.1% |
| Taiwan | 21 | 0.0% |
| Venezuela | 1 | 0.0% |
| Vietnam | 30 | 0.1% |
| Western Asia | 9 | 0.0% |
| Western Europe | 53 | 0.1% | View All 39 Rows |
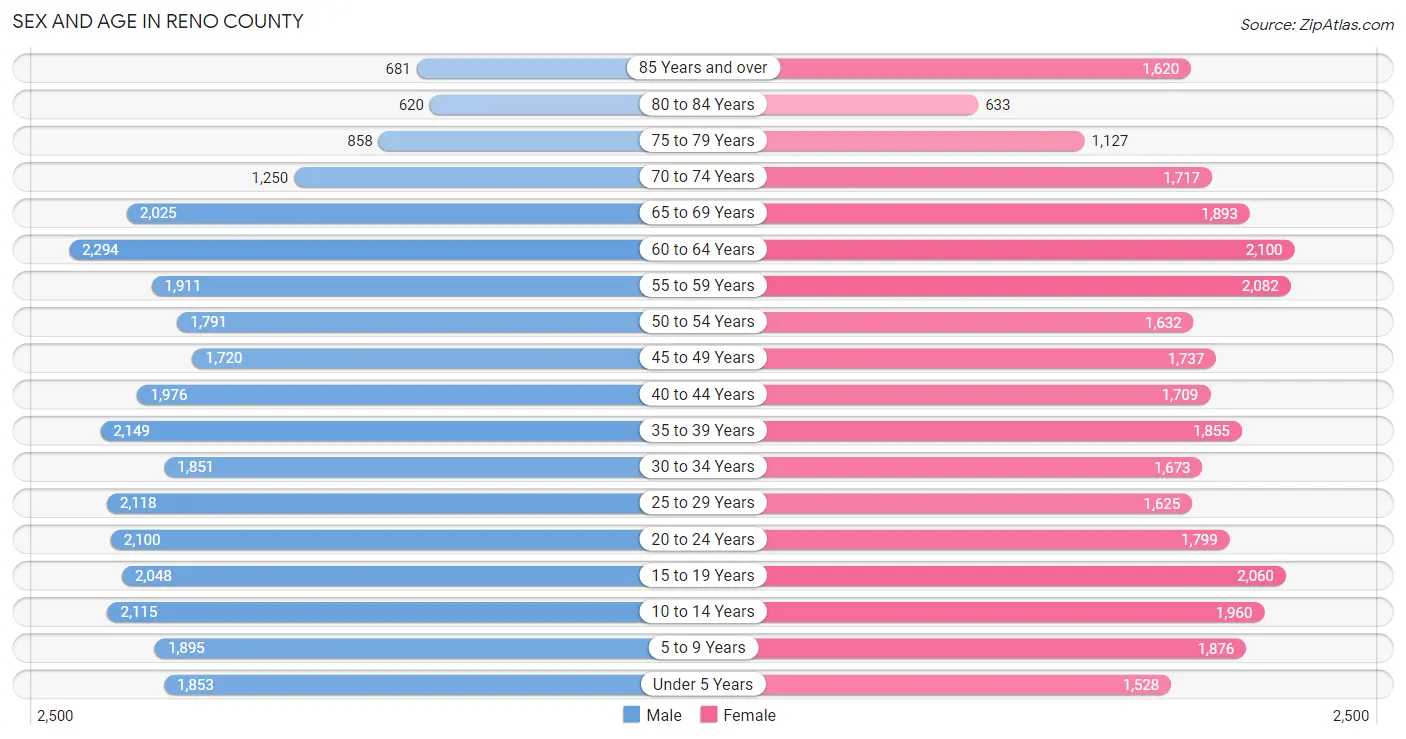
Sex and Age in Reno County
Sex and Age in Reno County
The most populous age groups in Reno County are 60 to 64 Years (2,294 | 7.3%) for men and 60 to 64 Years (2,100 | 6.9%) for women.
| Age Bracket | Male | Female |
| Under 5 Years | 1,853 (5.9%) | 1,528 (5.0%) |
| 5 to 9 Years | 1,895 (6.1%) | 1,876 (6.1%) |
| 10 to 14 Years | 2,115 (6.8%) | 1,960 (6.4%) |
| 15 to 19 Years | 2,048 (6.6%) | 2,060 (6.7%) |
| 20 to 24 Years | 2,100 (6.7%) | 1,799 (5.9%) |
| 25 to 29 Years | 2,118 (6.8%) | 1,625 (5.3%) |
| 30 to 34 Years | 1,851 (5.9%) | 1,673 (5.5%) |
| 35 to 39 Years | 2,149 (6.9%) | 1,855 (6.1%) |
| 40 to 44 Years | 1,976 (6.3%) | 1,709 (5.6%) |
| 45 to 49 Years | 1,720 (5.5%) | 1,737 (5.7%) |
| 50 to 54 Years | 1,791 (5.7%) | 1,632 (5.3%) |
| 55 to 59 Years | 1,911 (6.1%) | 2,082 (6.8%) |
| 60 to 64 Years | 2,294 (7.3%) | 2,100 (6.9%) |
| 65 to 69 Years | 2,025 (6.5%) | 1,893 (6.2%) |
| 70 to 74 Years | 1,250 (4.0%) | 1,717 (5.6%) |
| 75 to 79 Years | 858 (2.8%) | 1,127 (3.7%) |
| 80 to 84 Years | 620 (2.0%) | 633 (2.1%) |
| 85 Years and over | 681 (2.2%) | 1,620 (5.3%) |
| Total | 31,255 (100.0%) | 30,626 (100.0%) |
Families and Households in Reno County
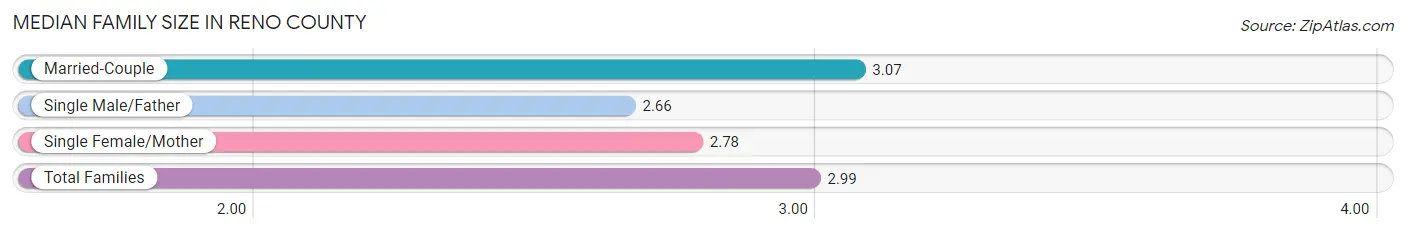
Median Family Size in Reno County
The median family size in Reno County is 2.99 persons per family, with married-couple families (11,434 | 75.2%) accounting for the largest median family size of 3.07 persons per family. On the other hand, single male/father families (1,103 | 7.2%) represent the smallest median family size with 2.66 persons per family.
| Family Type | # Families | Family Size |
| Married-Couple | 11,434 (75.2%) | 3.07 |
| Single Male/Father | 1,103 (7.2%) | 2.66 |
| Single Female/Mother | 2,670 (17.6%) | 2.78 |
| Total Families | 15,207 (100.0%) | 2.99 |
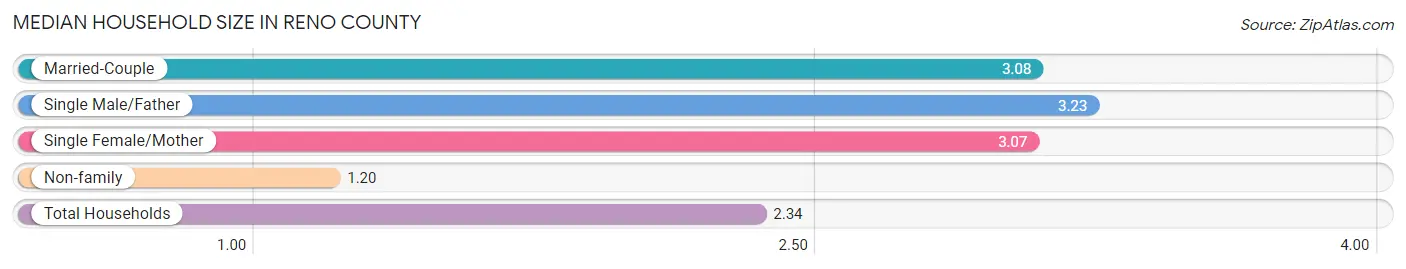
Median Household Size in Reno County
The median household size in Reno County is 2.34 persons per household, with single male/father households (1,103 | 4.4%) accounting for the largest median household size of 3.23 persons per household. non-family households (9,950 | 39.6%) represent the smallest median household size with 1.20 persons per household.
| Household Type | # Households | Household Size |
| Married-Couple | 11,434 (45.5%) | 3.08 |
| Single Male/Father | 1,103 (4.4%) | 3.23 |
| Single Female/Mother | 2,670 (10.6%) | 3.07 |
| Non-family | 9,950 (39.6%) | 1.20 |
| Total Households | 25,157 (100.0%) | 2.34 |
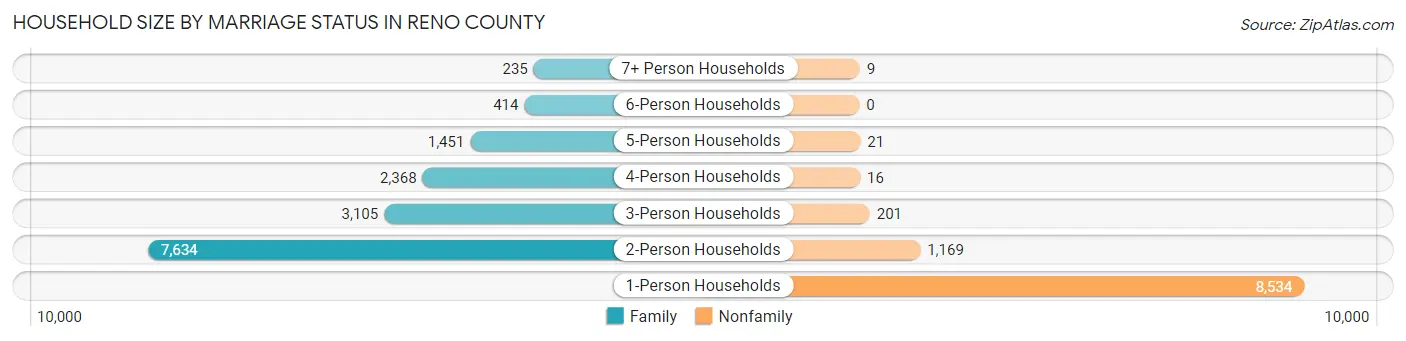
Household Size by Marriage Status in Reno County
Out of a total of 25,157 households in Reno County, 15,207 (60.5%) are family households, while 9,950 (39.6%) are nonfamily households. The most numerous type of family households are 2-person households, comprising 7,634, and the most common type of nonfamily households are 1-person households, comprising 8,534.
| Household Size | Family Households | Nonfamily Households |
| 1-Person Households | - | 8,534 (33.9%) |
| 2-Person Households | 7,634 (30.3%) | 1,169 (4.6%) |
| 3-Person Households | 3,105 (12.3%) | 201 (0.8%) |
| 4-Person Households | 2,368 (9.4%) | 16 (0.1%) |
| 5-Person Households | 1,451 (5.8%) | 21 (0.1%) |
| 6-Person Households | 414 (1.7%) | 0 (0.0%) |
| 7+ Person Households | 235 (0.9%) | 9 (0.0%) |
| Total | 15,207 (60.5%) | 9,950 (39.6%) |
Female Fertility in Reno County
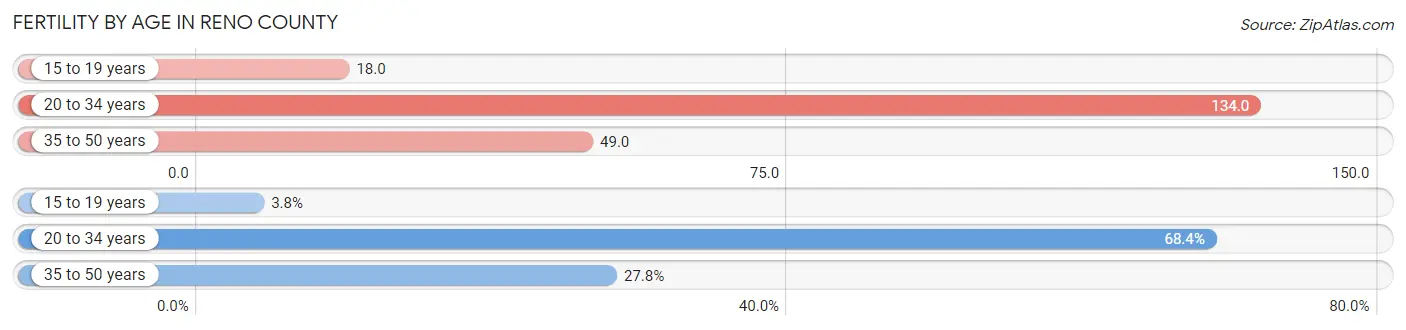
Fertility by Age in Reno County
Average fertility rate in Reno County is 78.0 births per 1,000 women. Women in the age bracket of 20 to 34 years have the highest fertility rate with 134.0 births per 1,000 women. Women in the age bracket of 20 to 34 years acount for 68.4% of all women with births.
| Age Bracket | Women with Births | Births / 1,000 Women |
| 15 to 19 years | 38 (3.8%) | 18.0 |
| 20 to 34 years | 683 (68.4%) | 134.0 |
| 35 to 50 years | 277 (27.8%) | 49.0 |
| Total | 998 (100.0%) | 78.0 |
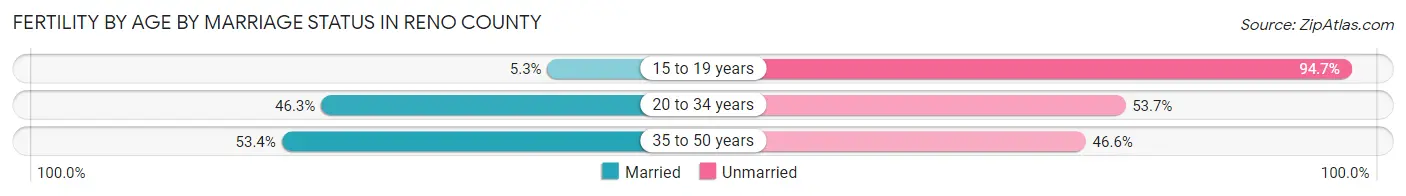
Fertility by Age by Marriage Status in Reno County
46.7% of women with births (998) in Reno County are married. The highest percentage of unmarried women with births falls into 15 to 19 years age bracket with 94.7% of them unmarried at the time of birth, while the lowest percentage of unmarried women with births belong to 35 to 50 years age bracket with 46.6% of them unmarried.
| Age Bracket | Married | Unmarried |
| 15 to 19 years | 2 (5.3%) | 36 (94.7%) |
| 20 to 34 years | 316 (46.3%) | 367 (53.7%) |
| 35 to 50 years | 148 (53.4%) | 129 (46.6%) |
| Total | 466 (46.7%) | 532 (53.3%) |
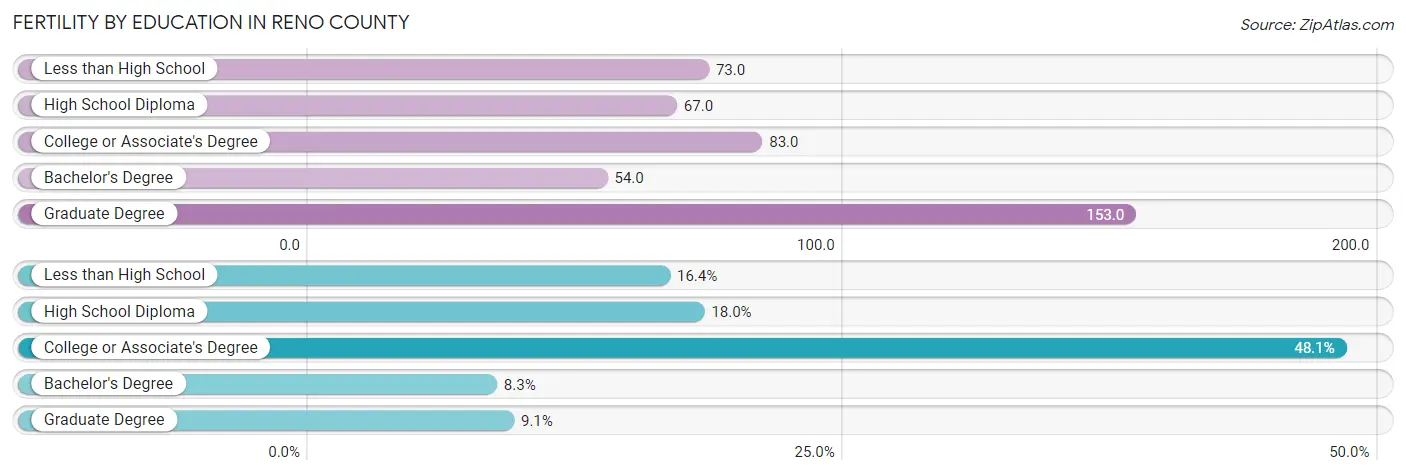
Fertility by Education in Reno County
Average fertility rate in Reno County is 78.0 births per 1,000 women. Women with the education attainment of graduate degree have the highest fertility rate of 153.0 births per 1,000 women, while women with the education attainment of bachelor's degree have the lowest fertility at 54.0 births per 1,000 women. Women with the education attainment of college or associate's degree represent 48.1% of all women with births.
| Educational Attainment | Women with Births | Births / 1,000 Women |
| Less than High School | 164 (16.4%) | 73.0 |
| High School Diploma | 180 (18.0%) | 67.0 |
| College or Associate's Degree | 480 (48.1%) | 83.0 |
| Bachelor's Degree | 83 (8.3%) | 54.0 |
| Graduate Degree | 91 (9.1%) | 153.0 |
| Total | 998 (100.0%) | 78.0 |
Fertility by Education by Marriage Status in Reno County
53.3% of women with births in Reno County are unmarried. Women with the educational attainment of graduate degree are most likely to be married with 100.0% of them married at childbirth, while women with the educational attainment of less than high school are least likely to be married with 78.0% of them unmarried at childbirth.
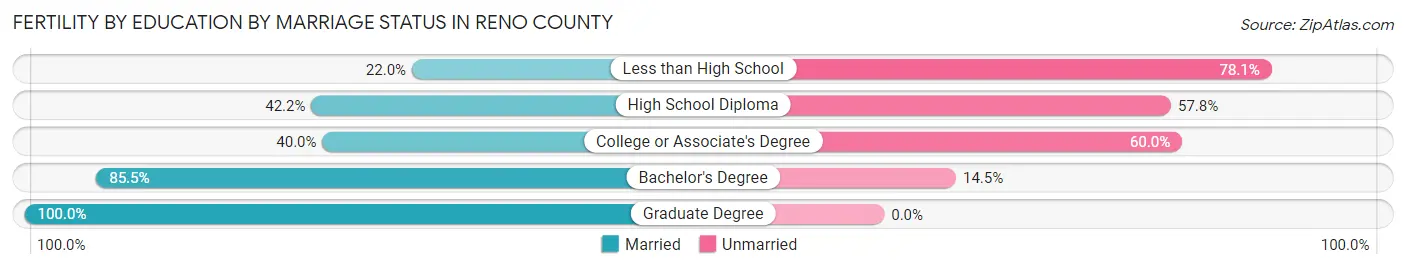
| Educational Attainment | Married | Unmarried |
| Less than High School | 36 (22.0%) | 128 (78.0%) |
| High School Diploma | 76 (42.2%) | 104 (57.8%) |
| College or Associate's Degree | 192 (40.0%) | 288 (60.0%) |
| Bachelor's Degree | 71 (85.5%) | 12 (14.5%) |
| Graduate Degree | 91 (100.0%) | 0 (0.0%) |
| Total | 466 (46.7%) | 532 (53.3%) |
Income in Reno County
Income Overview in Reno County
Per Capita Income in Reno County is $31,695, while median incomes of families and households are $74,490 and $57,390 respectively.
| Characteristic | Number | Measure |
| Per Capita Income | 61,881 | $31,695 |
| Median Family Income | 15,207 | $74,490 |
| Mean Family Income | 15,207 | $90,568 |
| Median Household Income | 25,157 | $57,390 |
| Mean Household Income | 25,157 | $74,762 |
| Income Deficit | 15,207 | $9,321 |
| Wage / Income Gap (%) | 61,881 | 34.09% |
| Wage / Income Gap ($) | 61,881 | 65.91¢ per $1 |
| Gini / Inequality Index | 61,881 | 0.44 |
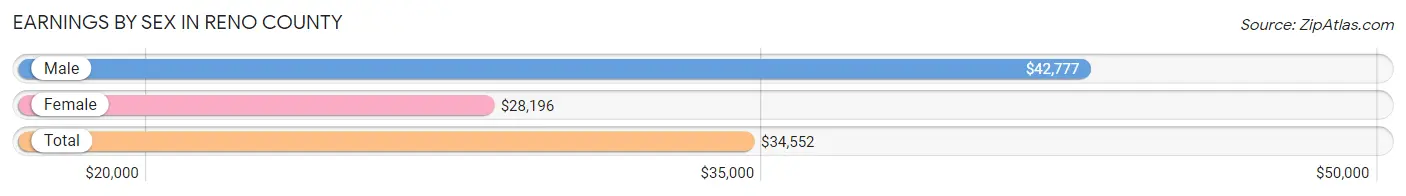
Earnings by Sex in Reno County
Average Earnings in Reno County are $34,552, $42,777 for men and $28,196 for women, a difference of 34.1%.
| Sex | Number | Average Earnings |
| Male | 18,195 (54.0%) | $42,777 |
| Female | 15,524 (46.0%) | $28,196 |
| Total | 33,719 (100.0%) | $34,552 |
Earnings by Sex by Income Bracket in Reno County
The most common earnings brackets in Reno County are $75,000 to $99,999 for men (2,078 | 11.4%) and $25,000 to $29,999 for women (1,494 | 9.6%).
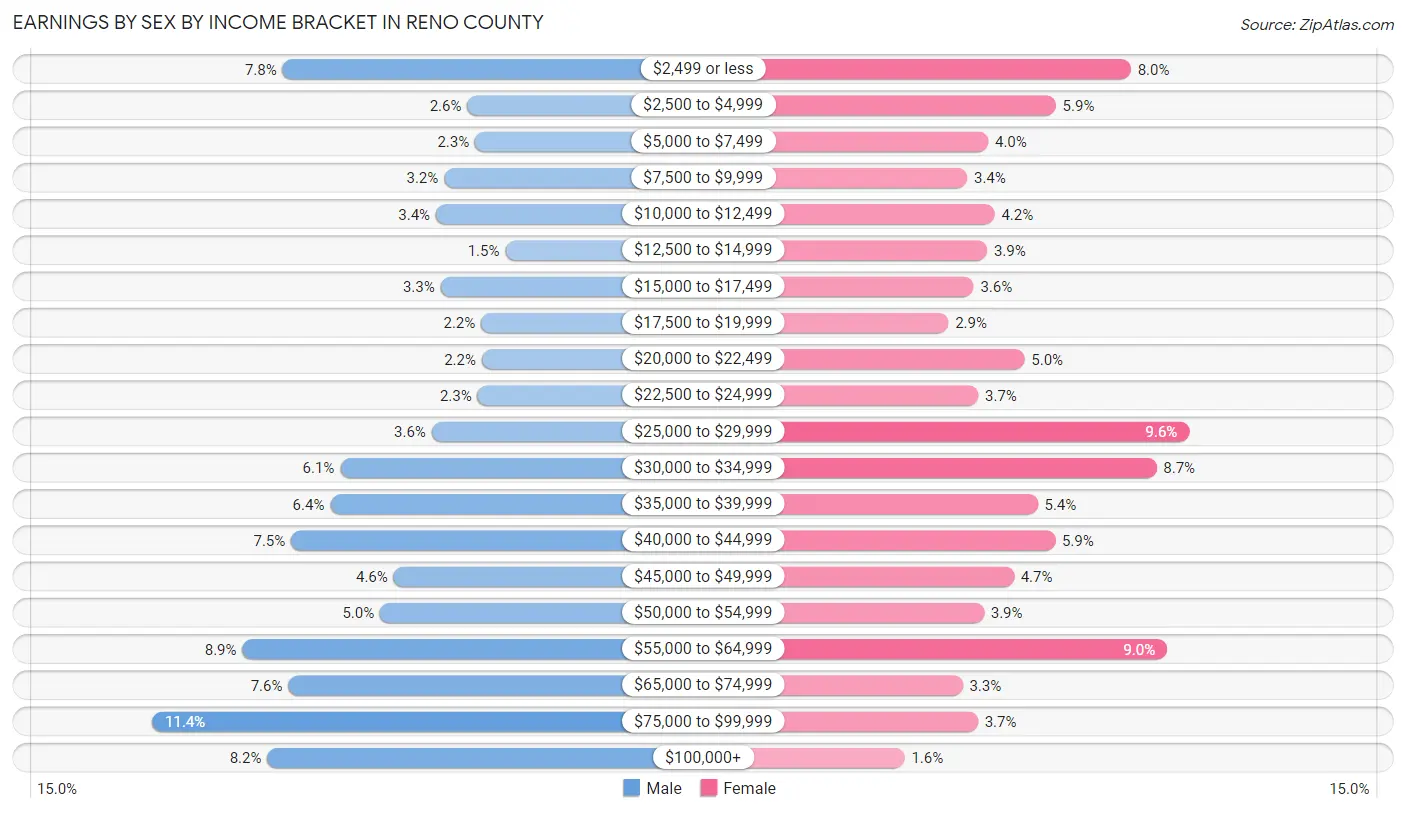
| Income | Male | Female |
| $2,499 or less | 1,410 (7.7%) | 1,239 (8.0%) |
| $2,500 to $4,999 | 466 (2.6%) | 912 (5.9%) |
| $5,000 to $7,499 | 425 (2.3%) | 617 (4.0%) |
| $7,500 to $9,999 | 584 (3.2%) | 524 (3.4%) |
| $10,000 to $12,499 | 625 (3.4%) | 644 (4.2%) |
| $12,500 to $14,999 | 271 (1.5%) | 612 (3.9%) |
| $15,000 to $17,499 | 603 (3.3%) | 552 (3.6%) |
| $17,500 to $19,999 | 395 (2.2%) | 443 (2.9%) |
| $20,000 to $22,499 | 391 (2.1%) | 774 (5.0%) |
| $22,500 to $24,999 | 413 (2.3%) | 573 (3.7%) |
| $25,000 to $29,999 | 648 (3.6%) | 1,494 (9.6%) |
| $30,000 to $34,999 | 1,115 (6.1%) | 1,351 (8.7%) |
| $35,000 to $39,999 | 1,166 (6.4%) | 832 (5.4%) |
| $40,000 to $44,999 | 1,367 (7.5%) | 908 (5.9%) |
| $45,000 to $49,999 | 842 (4.6%) | 728 (4.7%) |
| $50,000 to $54,999 | 911 (5.0%) | 597 (3.8%) |
| $55,000 to $64,999 | 1,616 (8.9%) | 1,397 (9.0%) |
| $65,000 to $74,999 | 1,381 (7.6%) | 505 (3.3%) |
| $75,000 to $99,999 | 2,078 (11.4%) | 571 (3.7%) |
| $100,000+ | 1,488 (8.2%) | 251 (1.6%) |
| Total | 18,195 (100.0%) | 15,524 (100.0%) |
Earnings by Sex by Educational Attainment in Reno County
Average earnings in Reno County are $46,793 for men and $31,584 for women, a difference of 32.5%. Men with an educational attainment of graduate degree enjoy the highest average annual earnings of $78,013, while those with less than high school education earn the least with $24,789. Women with an educational attainment of graduate degree earn the most with the average annual earnings of $57,083, while those with less than high school education have the smallest earnings of $22,386.
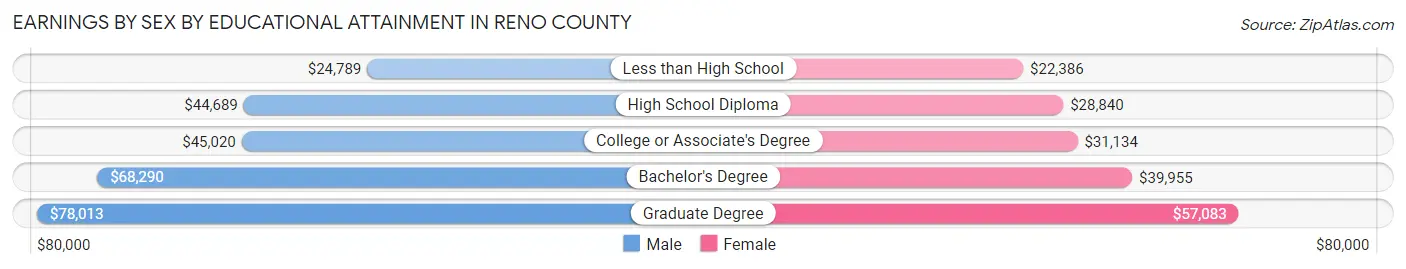
| Educational Attainment | Male Income | Female Income |
| Less than High School | $24,789 | $22,386 |
| High School Diploma | $44,689 | $28,840 |
| College or Associate's Degree | $45,020 | $31,134 |
| Bachelor's Degree | $68,290 | $39,955 |
| Graduate Degree | $78,013 | $57,083 |
| Total | $46,793 | $31,584 |
Family Income in Reno County
Family Income Brackets in Reno County
According to the Reno County family income data, there are 3,163 families falling into the $50,000 to $74,999 income range, which is the most common income bracket and makes up 20.8% of all families. Conversely, the $10,000 to $14,999 income bracket is the least frequent group with only 335 families (2.2%) belonging to this category.
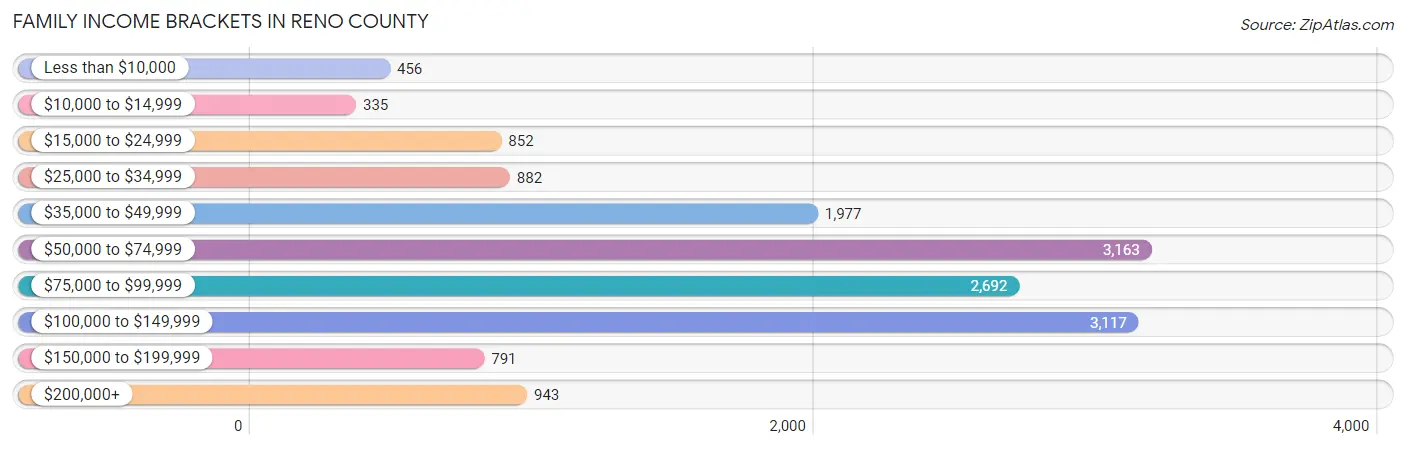
| Income Bracket | # Families | % Families |
| Less than $10,000 | 456 | 3.0% |
| $10,000 to $14,999 | 335 | 2.2% |
| $15,000 to $24,999 | 852 | 5.6% |
| $25,000 to $34,999 | 882 | 5.8% |
| $35,000 to $49,999 | 1,977 | 13.0% |
| $50,000 to $74,999 | 3,163 | 20.8% |
| $75,000 to $99,999 | 2,692 | 17.7% |
| $100,000 to $149,999 | 3,117 | 20.5% |
| $150,000 to $199,999 | 791 | 5.2% |
| $200,000+ | 943 | 6.2% |
Family Income by Famaliy Size in Reno County
4-person families (2,413 | 15.9%) account for the highest median family income in Reno County with $101,070 per family, while 2-person families (8,076 | 53.1%) have the highest median income of $32,287 per family member.
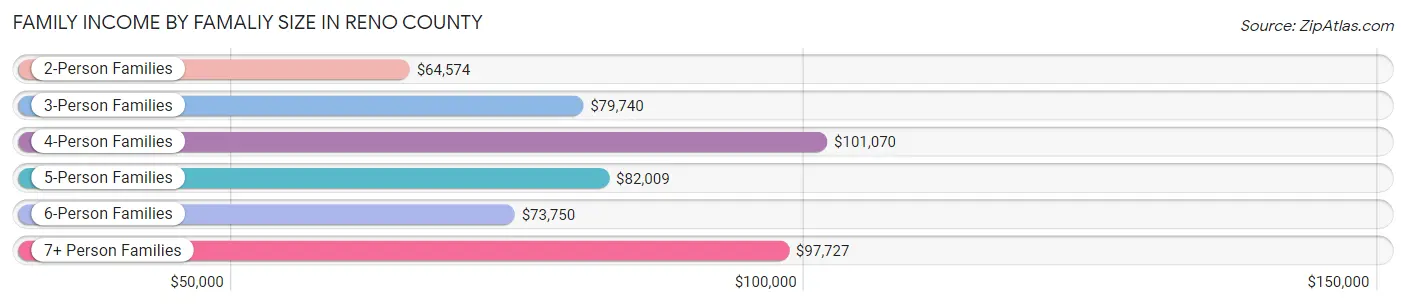
| Income Bracket | # Families | Median Income |
| 2-Person Families | 8,076 (53.1%) | $64,574 |
| 3-Person Families | 3,093 (20.3%) | $79,740 |
| 4-Person Families | 2,413 (15.9%) | $101,070 |
| 5-Person Families | 1,053 (6.9%) | $82,009 |
| 6-Person Families | 376 (2.5%) | $73,750 |
| 7+ Person Families | 196 (1.3%) | $97,727 |
| Total | 15,207 (100.0%) | $74,490 |
Family Income by Number of Earners in Reno County
The median family income in Reno County is $74,490, with families comprising 3+ earners (1,898) having the highest median family income of $121,923, while families with no earners (2,277) have the lowest median family income of $42,595, accounting for 12.5% and 15.0% of families, respectively.
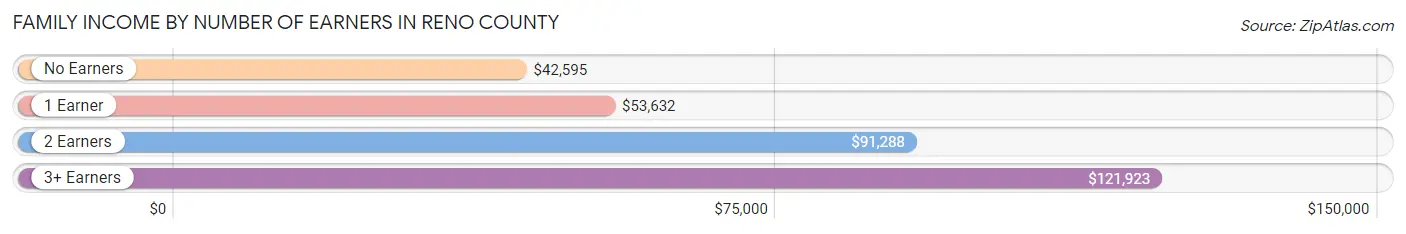
| Number of Earners | # Families | Median Income |
| No Earners | 2,277 (15.0%) | $42,595 |
| 1 Earner | 5,094 (33.5%) | $53,632 |
| 2 Earners | 5,938 (39.1%) | $91,288 |
| 3+ Earners | 1,898 (12.5%) | $121,923 |
| Total | 15,207 (100.0%) | $74,490 |
Household Income in Reno County
Household Income Brackets in Reno County
With 4,906 households falling in the category, the $50,000 to $74,999 income range is the most frequent in Reno County, accounting for 19.5% of all households. In contrast, only 981 households (3.9%) fall into the $150,000 to $199,999 income bracket, making it the least populous group.
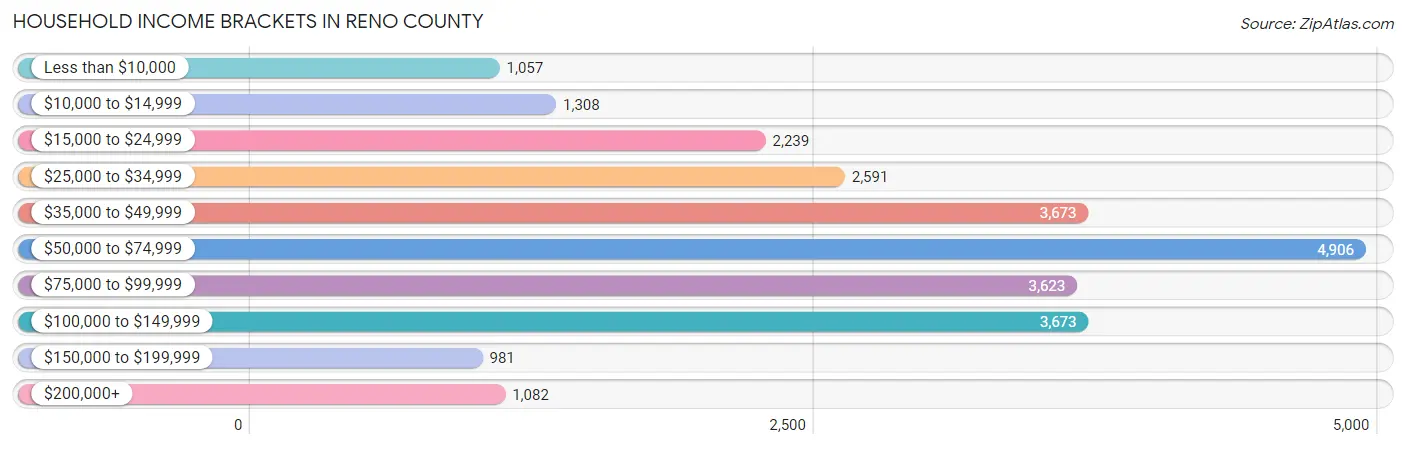
| Income Bracket | # Households | % Households |
| Less than $10,000 | 1,057 | 4.2% |
| $10,000 to $14,999 | 1,308 | 5.2% |
| $15,000 to $24,999 | 2,239 | 8.9% |
| $25,000 to $34,999 | 2,591 | 10.3% |
| $35,000 to $49,999 | 3,673 | 14.6% |
| $50,000 to $74,999 | 4,906 | 19.5% |
| $75,000 to $99,999 | 3,623 | 14.4% |
| $100,000 to $149,999 | 3,673 | 14.6% |
| $150,000 to $199,999 | 981 | 3.9% |
| $200,000+ | 1,082 | 4.3% |
Household Income by Householder Age in Reno County
The median household income in Reno County is $57,390, with the highest median household income of $78,494 found in the 45 to 64 years age bracket for the primary householder. A total of 8,610 households (34.2%) fall into this category. Meanwhile, the 15 to 24 years age bracket for the primary householder has the lowest median household income of $36,203, with 1,194 households (4.8%) in this group.
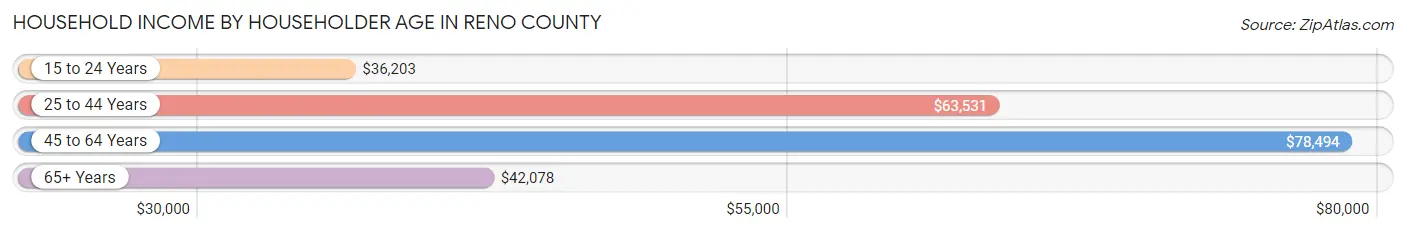
| Income Bracket | # Households | Median Income |
| 15 to 24 Years | 1,194 (4.8%) | $36,203 |
| 25 to 44 Years | 7,070 (28.1%) | $63,531 |
| 45 to 64 Years | 8,610 (34.2%) | $78,494 |
| 65+ Years | 8,283 (32.9%) | $42,078 |
| Total | 25,157 (100.0%) | $57,390 |
Poverty in Reno County
Income Below Poverty by Sex and Age in Reno County
With 10.4% poverty level for males and 14.2% for females among the residents of Reno County, under 5 year old males and 18 to 24 year old females are the most vulnerable to poverty, with 480 males (28.1%) and 964 females (39.3%) in their respective age groups living below the poverty level.
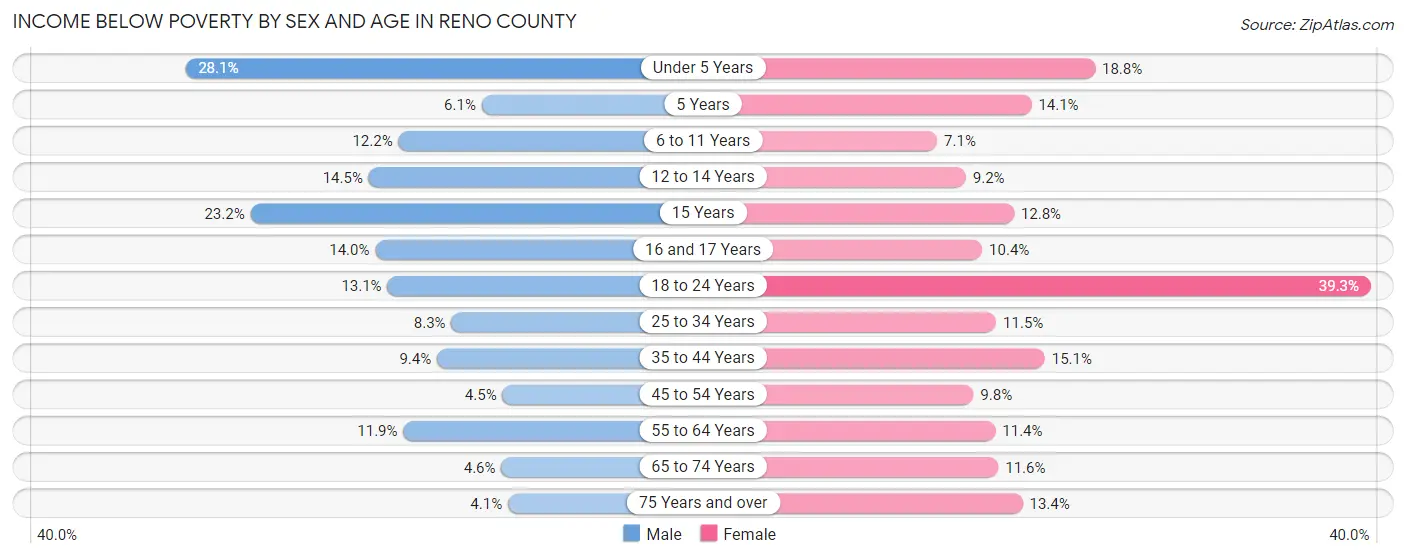
| Age Bracket | Male | Female |
| Under 5 Years | 480 (28.1%) | 264 (18.8%) |
| 5 Years | 14 (6.1%) | 77 (14.1%) |
| 6 to 11 Years | 296 (12.2%) | 136 (7.1%) |
| 12 to 14 Years | 191 (14.4%) | 116 (9.2%) |
| 15 Years | 118 (23.2%) | 45 (12.8%) |
| 16 and 17 Years | 99 (14.0%) | 101 (10.4%) |
| 18 to 24 Years | 334 (13.1%) | 964 (39.3%) |
| 25 to 34 Years | 280 (8.3%) | 378 (11.5%) |
| 35 to 44 Years | 335 (9.4%) | 537 (15.1%) |
| 45 to 54 Years | 146 (4.5%) | 329 (9.8%) |
| 55 to 64 Years | 473 (11.9%) | 476 (11.4%) |
| 65 to 74 Years | 149 (4.6%) | 419 (11.6%) |
| 75 Years and over | 81 (4.1%) | 405 (13.4%) |
| Total | 2,996 (10.4%) | 4,247 (14.2%) |
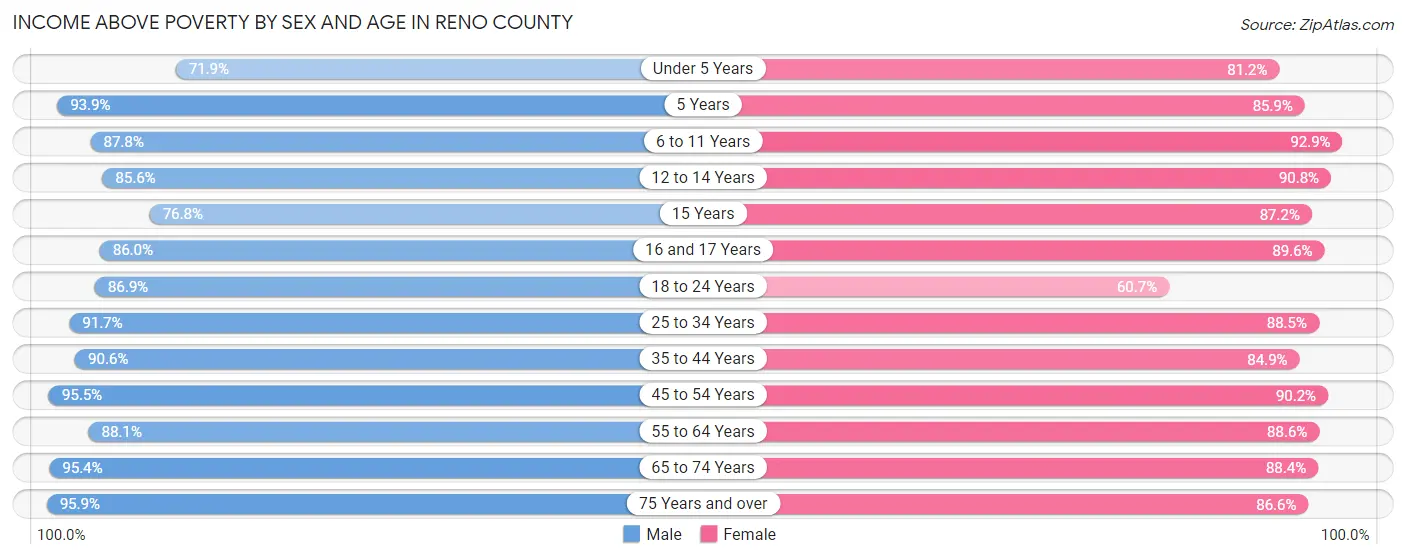
Income Above Poverty by Sex and Age in Reno County
According to the poverty statistics in Reno County, males aged 75 years and over and females aged 6 to 11 years are the age groups that are most secure financially, with 95.9% of males and 92.9% of females in these age groups living above the poverty line.
| Age Bracket | Male | Female |
| Under 5 Years | 1,230 (71.9%) | 1,140 (81.2%) |
| 5 Years | 217 (93.9%) | 470 (85.9%) |
| 6 to 11 Years | 2,122 (87.8%) | 1,786 (92.9%) |
| 12 to 14 Years | 1,131 (85.6%) | 1,144 (90.8%) |
| 15 Years | 390 (76.8%) | 307 (87.2%) |
| 16 and 17 Years | 610 (86.0%) | 868 (89.6%) |
| 18 to 24 Years | 2,224 (86.9%) | 1,490 (60.7%) |
| 25 to 34 Years | 3,088 (91.7%) | 2,920 (88.5%) |
| 35 to 44 Years | 3,238 (90.6%) | 3,027 (84.9%) |
| 45 to 54 Years | 3,084 (95.5%) | 3,040 (90.2%) |
| 55 to 64 Years | 3,509 (88.1%) | 3,698 (88.6%) |
| 65 to 74 Years | 3,092 (95.4%) | 3,186 (88.4%) |
| 75 Years and over | 1,890 (95.9%) | 2,613 (86.6%) |
| Total | 25,825 (89.6%) | 25,689 (85.8%) |
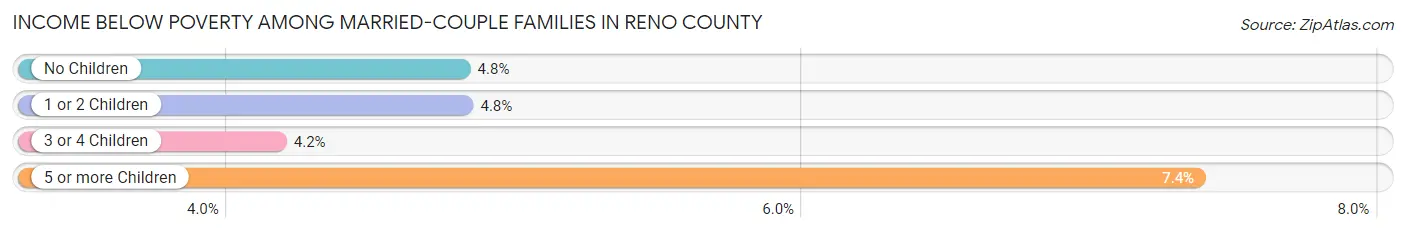
Income Below Poverty Among Married-Couple Families in Reno County
The poverty statistics for married-couple families in Reno County show that 4.8% or 546 of the total 11,434 families live below the poverty line. Families with 5 or more children have the highest poverty rate of 7.4%, comprising of 7 families. On the other hand, families with 3 or 4 children have the lowest poverty rate of 4.2%, which includes 42 families.
| Children | Above Poverty | Below Poverty |
| No Children | 6,853 (95.2%) | 346 (4.8%) |
| 1 or 2 Children | 2,982 (95.2%) | 151 (4.8%) |
| 3 or 4 Children | 965 (95.8%) | 42 (4.2%) |
| 5 or more Children | 88 (92.6%) | 7 (7.4%) |
| Total | 10,888 (95.2%) | 546 (4.8%) |
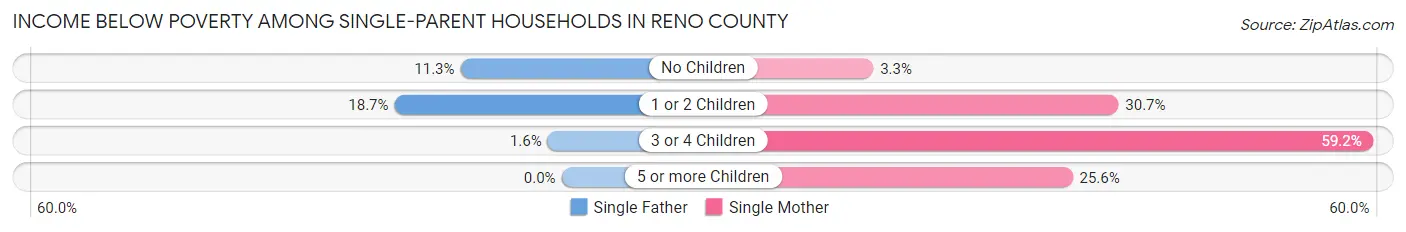
Income Below Poverty Among Single-Parent Households in Reno County
According to the poverty data in Reno County, 14.3% or 158 single-father households and 24.6% or 658 single-mother households are living below the poverty line. Among single-father households, those with 1 or 2 children have the highest poverty rate, with 116 households (18.7%) experiencing poverty. Likewise, among single-mother households, those with 3 or 4 children have the highest poverty rate, with 135 households (59.2%) falling below the poverty line.
| Children | Single Father | Single Mother |
| No Children | 40 (11.3%) | 27 (3.3%) |
| 1 or 2 Children | 116 (18.7%) | 485 (30.7%) |
| 3 or 4 Children | 2 (1.6%) | 135 (59.2%) |
| 5 or more Children | 0 (0.0%) | 11 (25.6%) |
| Total | 158 (14.3%) | 658 (24.6%) |
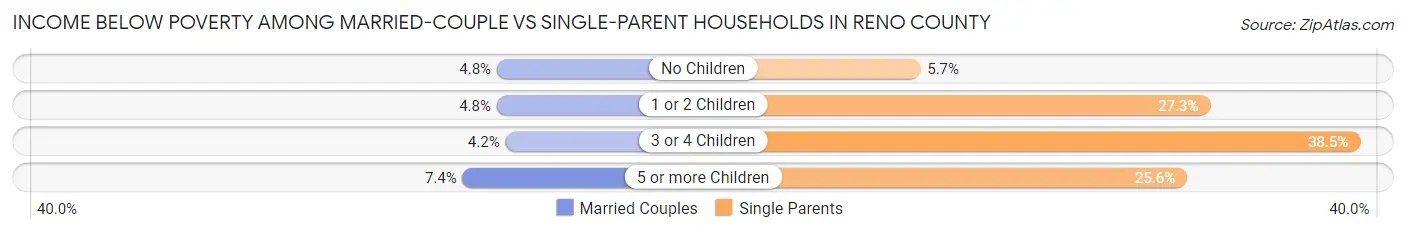
Income Below Poverty Among Married-Couple vs Single-Parent Households in Reno County
The poverty data for Reno County shows that 546 of the married-couple family households (4.8%) and 816 of the single-parent households (21.6%) are living below the poverty level. Within the married-couple family households, those with 5 or more children have the highest poverty rate, with 7 households (7.4%) falling below the poverty line. Among the single-parent households, those with 3 or 4 children have the highest poverty rate, with 137 household (38.5%) living below poverty.
| Children | Married-Couple Families | Single-Parent Households |
| No Children | 346 (4.8%) | 67 (5.7%) |
| 1 or 2 Children | 151 (4.8%) | 601 (27.3%) |
| 3 or 4 Children | 42 (4.2%) | 137 (38.5%) |
| 5 or more Children | 7 (7.4%) | 11 (25.6%) |
| Total | 546 (4.8%) | 816 (21.6%) |
Employment Characteristics in Reno County
Employment by Class of Employer in Reno County
Among the 28,709 employed individuals in Reno County, private company employees (19,018 | 66.2%), not-for-profit organizations (2,788 | 9.7%), and local government employees (2,466 | 8.6%) make up the most common classes of employment.
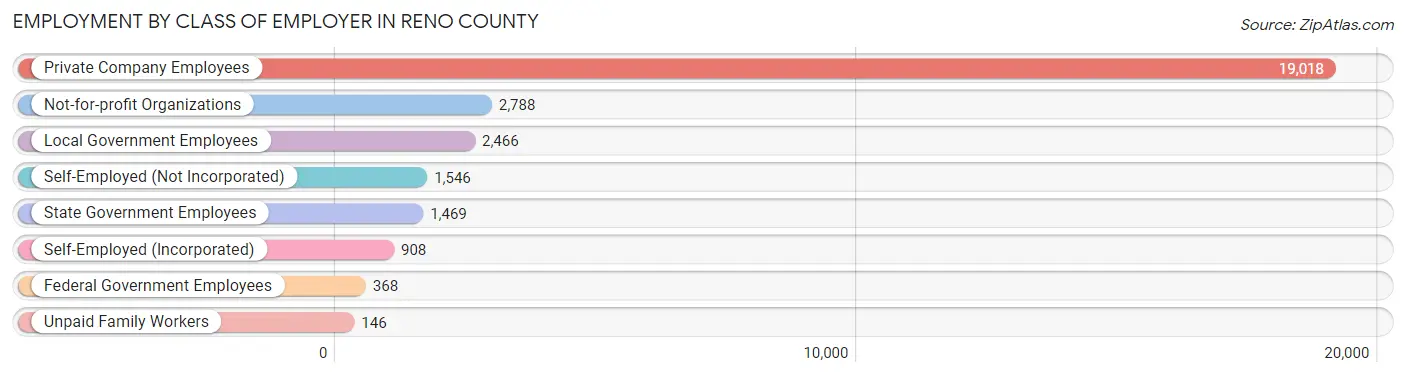
| Employer Class | # Employees | % Employees |
| Private Company Employees | 19,018 | 66.2% |
| Self-Employed (Incorporated) | 908 | 3.2% |
| Self-Employed (Not Incorporated) | 1,546 | 5.4% |
| Not-for-profit Organizations | 2,788 | 9.7% |
| Local Government Employees | 2,466 | 8.6% |
| State Government Employees | 1,469 | 5.1% |
| Federal Government Employees | 368 | 1.3% |
| Unpaid Family Workers | 146 | 0.5% |
| Total | 28,709 | 100.0% |
Employment Status by Age in Reno County
According to the labor force statistics for Reno County, out of the total population over 16 years of age (49,794), 61.6% or 30,673 individuals are in the labor force, with 4.2% or 1,288 of them unemployed. The age group with the highest labor force participation rate is 25 to 29 years, with 84.2% or 3,152 individuals in the labor force. Within the labor force, the 16 to 19 years age range has the highest percentage of unemployed individuals, with 11.7% or 206 of them being unemployed.
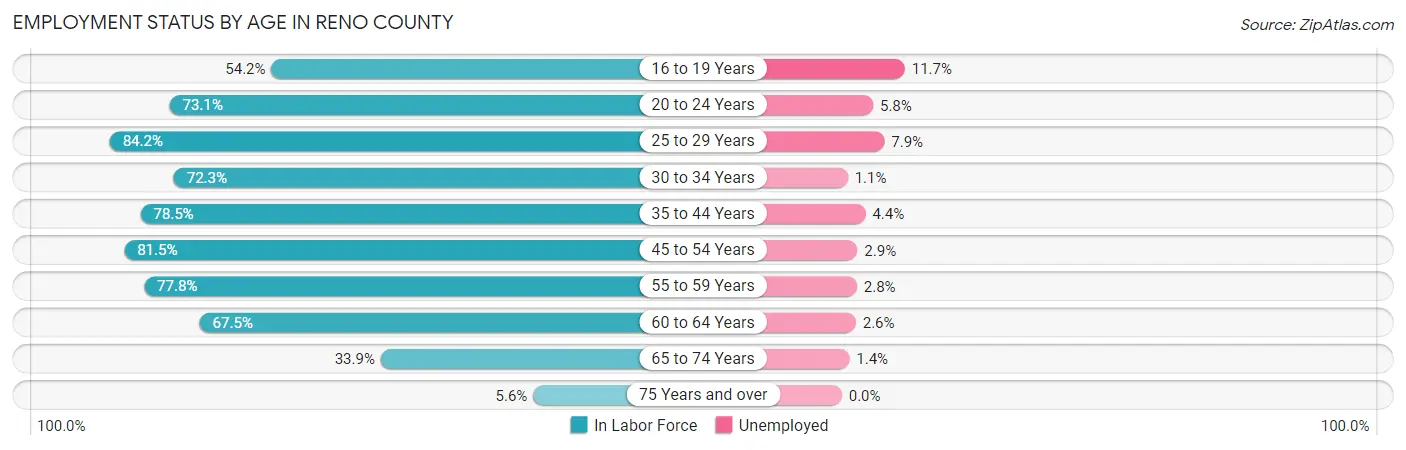
| Age Bracket | In Labor Force | Unemployed |
| 16 to 19 Years | 1,760 (54.2%) | 206 (11.7%) |
| 20 to 24 Years | 2,850 (73.1%) | 165 (5.8%) |
| 25 to 29 Years | 3,152 (84.2%) | 249 (7.9%) |
| 30 to 34 Years | 2,548 (72.3%) | 28 (1.1%) |
| 35 to 44 Years | 6,036 (78.5%) | 266 (4.4%) |
| 45 to 54 Years | 5,607 (81.5%) | 163 (2.9%) |
| 55 to 59 Years | 3,107 (77.8%) | 87 (2.8%) |
| 60 to 64 Years | 2,966 (67.5%) | 77 (2.6%) |
| 65 to 74 Years | 2,334 (33.9%) | 33 (1.4%) |
| 75 Years and over | 310 (5.6%) | 0 (0.0%) |
| Total | 30,673 (61.6%) | 1,288 (4.2%) |
Employment Status by Educational Attainment in Reno County
According to labor force statistics for Reno County, 77.5% of individuals (23,423) out of the total population between 25 and 64 years of age (30,223) are in the labor force, with 3.7% or 867 of them being unemployed. The group with the highest labor force participation rate are those with the educational attainment of bachelor's degree or higher, with 89.0% or 5,554 individuals in the labor force. Within the labor force, individuals with less than high school education have the highest percentage of unemployment, with 13.7% or 210 of them being unemployed.
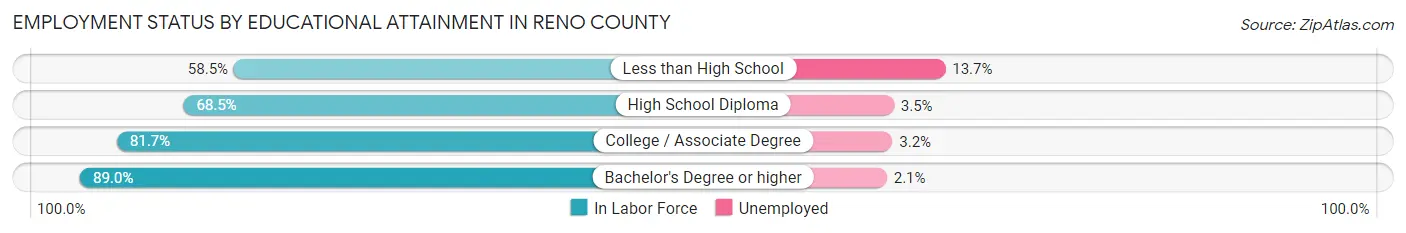
| Educational Attainment | In Labor Force | Unemployed |
| Less than High School | 1,530 (58.5%) | 358 (13.7%) |
| High School Diploma | 5,870 (68.5%) | 300 (3.5%) |
| College / Associate Degree | 10,456 (81.7%) | 410 (3.2%) |
| Bachelor's Degree or higher | 5,554 (89.0%) | 131 (2.1%) |
| Total | 23,423 (77.5%) | 1,118 (3.7%) |
Employment Occupations by Sex in Reno County
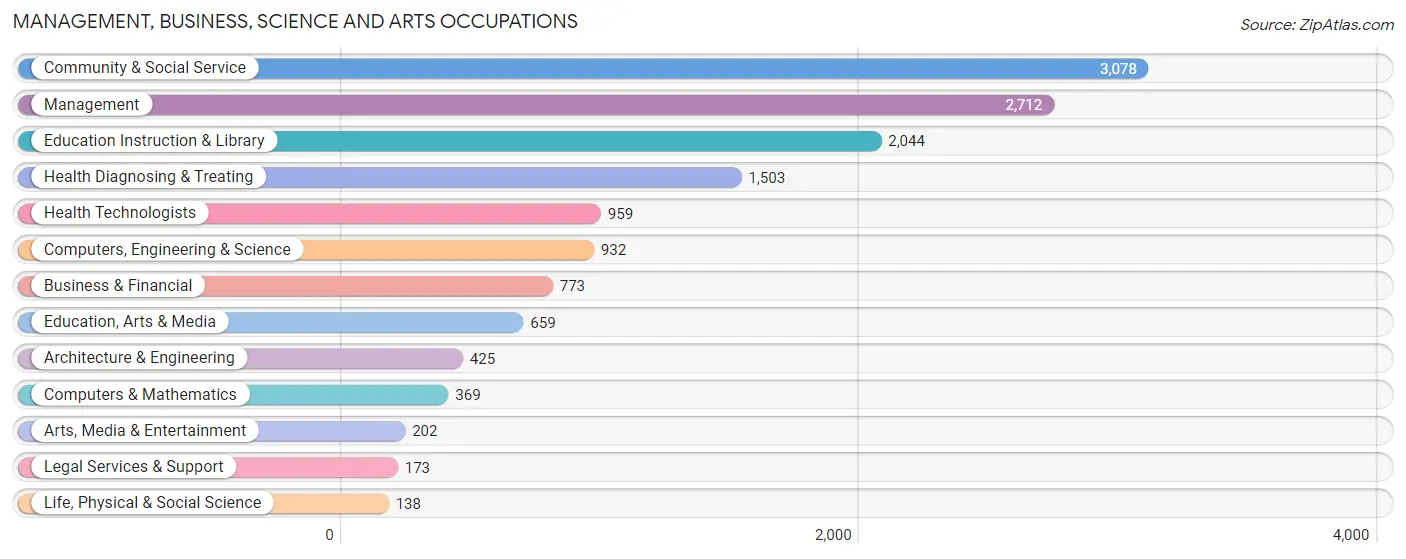
Management, Business, Science and Arts Occupations
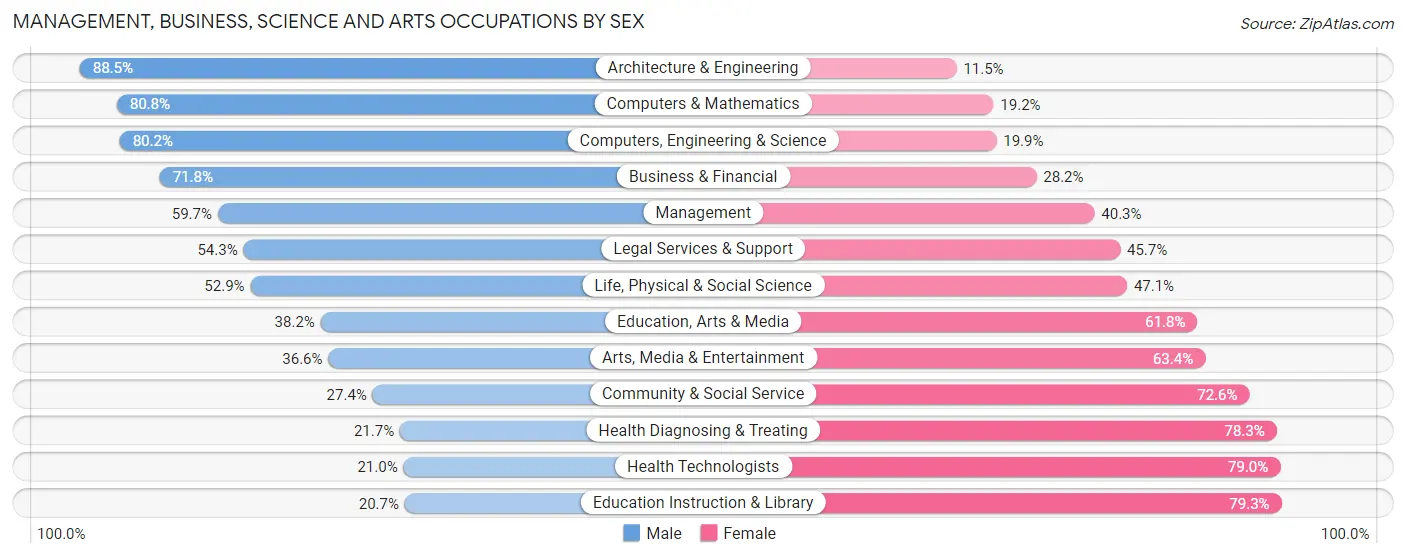
The most common Management, Business, Science and Arts occupations in Reno County are Community & Social Service (3,078 | 10.5%), Management (2,712 | 9.2%), Education Instruction & Library (2,044 | 7.0%), Health Diagnosing & Treating (1,503 | 5.1%), and Health Technologists (959 | 3.3%).
Management, Business, Science and Arts Occupations by Sex
Within the Management, Business, Science and Arts occupations in Reno County, the most male-oriented occupations are Architecture & Engineering (88.5%), Computers & Mathematics (80.8%), and Computers, Engineering & Science (80.1%), while the most female-oriented occupations are Education Instruction & Library (79.3%), Health Technologists (79.0%), and Health Diagnosing & Treating (78.3%).
| Occupation | Male | Female |
| Management | 1,619 (59.7%) | 1,093 (40.3%) |
| Business & Financial | 555 (71.8%) | 218 (28.2%) |
| Computers, Engineering & Science | 747 (80.1%) | 185 (19.9%) |
| Computers & Mathematics | 298 (80.8%) | 71 (19.2%) |
| Architecture & Engineering | 376 (88.5%) | 49 (11.5%) |
| Life, Physical & Social Science | 73 (52.9%) | 65 (47.1%) |
| Community & Social Service | 843 (27.4%) | 2,235 (72.6%) |
| Education, Arts & Media | 252 (38.2%) | 407 (61.8%) |
| Legal Services & Support | 94 (54.3%) | 79 (45.7%) |
| Education Instruction & Library | 423 (20.7%) | 1,621 (79.3%) |
| Arts, Media & Entertainment | 74 (36.6%) | 128 (63.4%) |
| Health Diagnosing & Treating | 326 (21.7%) | 1,177 (78.3%) |
| Health Technologists | 201 (21.0%) | 758 (79.0%) |
| Total (Category) | 4,090 (45.5%) | 4,908 (54.5%) |
| Total (Overall) | 15,250 (51.9%) | 14,110 (48.1%) |
Services Occupations
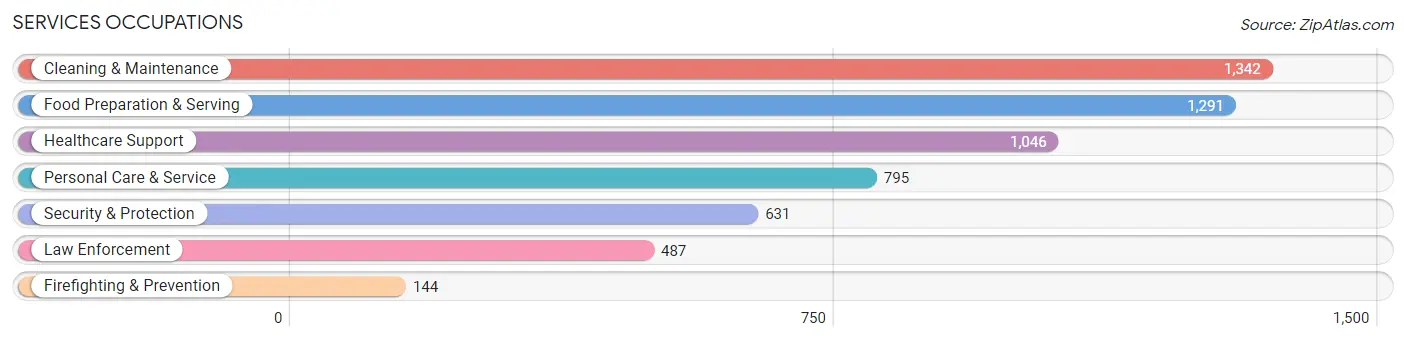
The most common Services occupations in Reno County are Cleaning & Maintenance (1,342 | 4.6%), Food Preparation & Serving (1,291 | 4.4%), Healthcare Support (1,046 | 3.6%), Personal Care & Service (795 | 2.7%), and Security & Protection (631 | 2.1%).
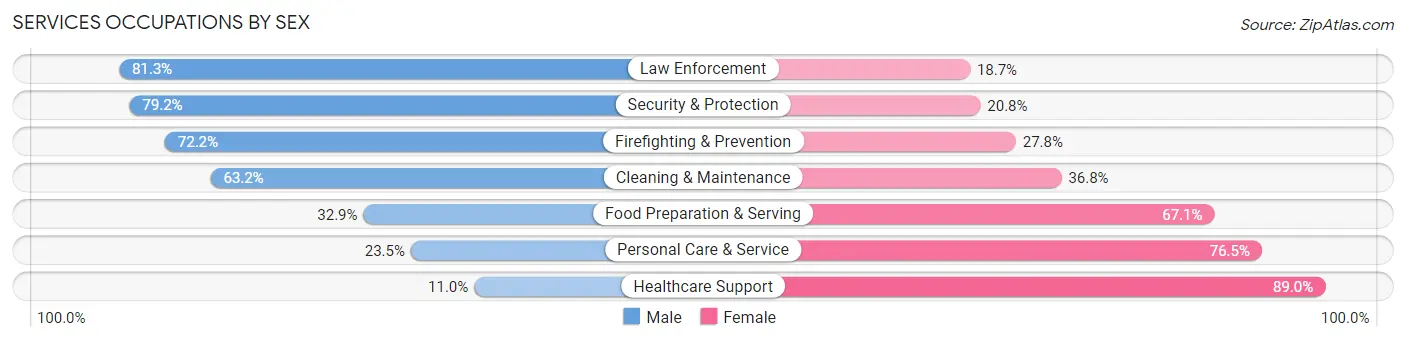
Services Occupations by Sex
Within the Services occupations in Reno County, the most male-oriented occupations are Law Enforcement (81.3%), Security & Protection (79.2%), and Firefighting & Prevention (72.2%), while the most female-oriented occupations are Healthcare Support (89.0%), Personal Care & Service (76.5%), and Food Preparation & Serving (67.1%).
| Occupation | Male | Female |
| Healthcare Support | 115 (11.0%) | 931 (89.0%) |
| Security & Protection | 500 (79.2%) | 131 (20.8%) |
| Firefighting & Prevention | 104 (72.2%) | 40 (27.8%) |
| Law Enforcement | 396 (81.3%) | 91 (18.7%) |
| Food Preparation & Serving | 425 (32.9%) | 866 (67.1%) |
| Cleaning & Maintenance | 848 (63.2%) | 494 (36.8%) |
| Personal Care & Service | 187 (23.5%) | 608 (76.5%) |
| Total (Category) | 2,075 (40.6%) | 3,030 (59.4%) |
| Total (Overall) | 15,250 (51.9%) | 14,110 (48.1%) |
Sales and Office Occupations
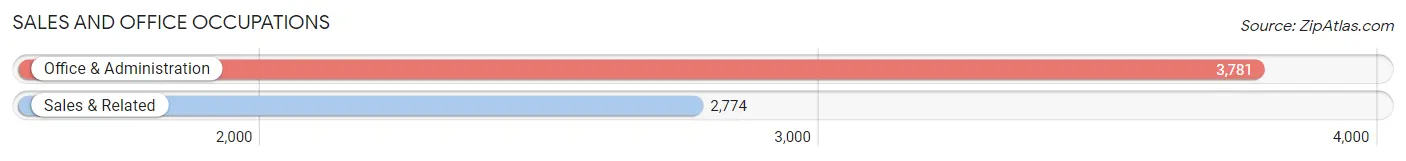
The most common Sales and Office occupations in Reno County are Office & Administration (3,781 | 12.9%), and Sales & Related (2,774 | 9.5%).
Sales and Office Occupations by Sex

| Occupation | Male | Female |
| Sales & Related | 1,124 (40.5%) | 1,650 (59.5%) |
| Office & Administration | 692 (18.3%) | 3,089 (81.7%) |
| Total (Category) | 1,816 (27.7%) | 4,739 (72.3%) |
| Total (Overall) | 15,250 (51.9%) | 14,110 (48.1%) |
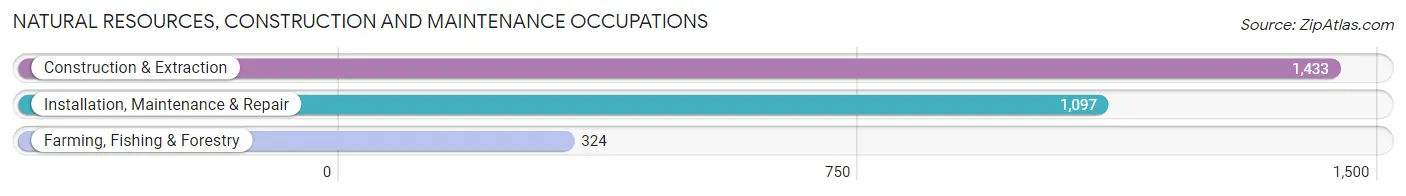
Natural Resources, Construction and Maintenance Occupations
The most common Natural Resources, Construction and Maintenance occupations in Reno County are Construction & Extraction (1,433 | 4.9%), Installation, Maintenance & Repair (1,097 | 3.7%), and Farming, Fishing & Forestry (324 | 1.1%).
Natural Resources, Construction and Maintenance Occupations by Sex
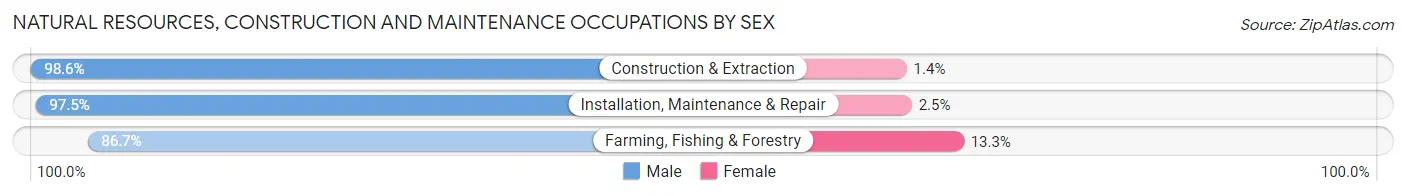
| Occupation | Male | Female |
| Farming, Fishing & Forestry | 281 (86.7%) | 43 (13.3%) |
| Construction & Extraction | 1,413 (98.6%) | 20 (1.4%) |
| Installation, Maintenance & Repair | 1,070 (97.5%) | 27 (2.5%) |
| Total (Category) | 2,764 (96.9%) | 90 (3.2%) |
| Total (Overall) | 15,250 (51.9%) | 14,110 (48.1%) |
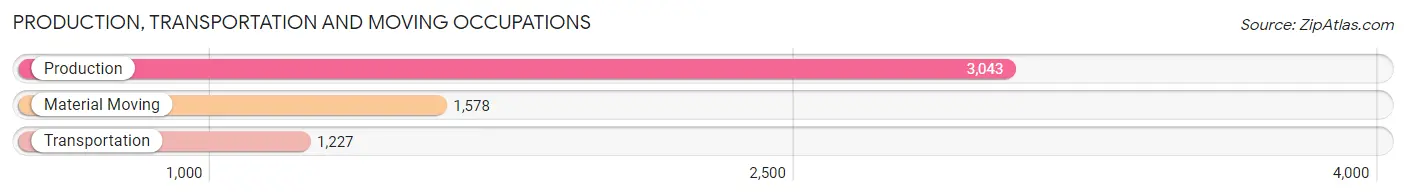
Production, Transportation and Moving Occupations
The most common Production, Transportation and Moving occupations in Reno County are Production (3,043 | 10.4%), Material Moving (1,578 | 5.4%), and Transportation (1,227 | 4.2%).
Production, Transportation and Moving Occupations by Sex
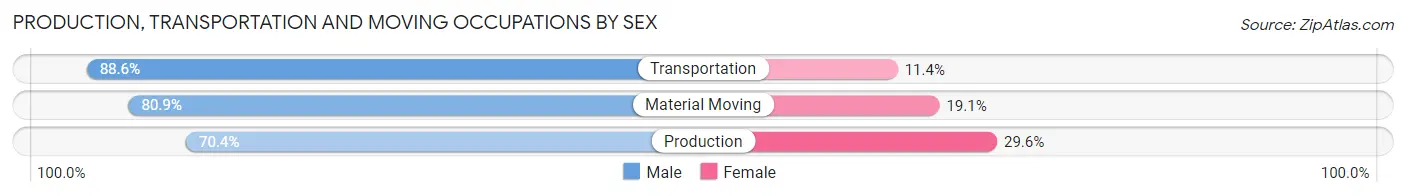
| Occupation | Male | Female |
| Production | 2,141 (70.4%) | 902 (29.6%) |
| Transportation | 1,087 (88.6%) | 140 (11.4%) |
| Material Moving | 1,277 (80.9%) | 301 (19.1%) |
| Total (Category) | 4,505 (77.0%) | 1,343 (23.0%) |
| Total (Overall) | 15,250 (51.9%) | 14,110 (48.1%) |
Employment Industries by Sex in Reno County
Employment Industries in Reno County
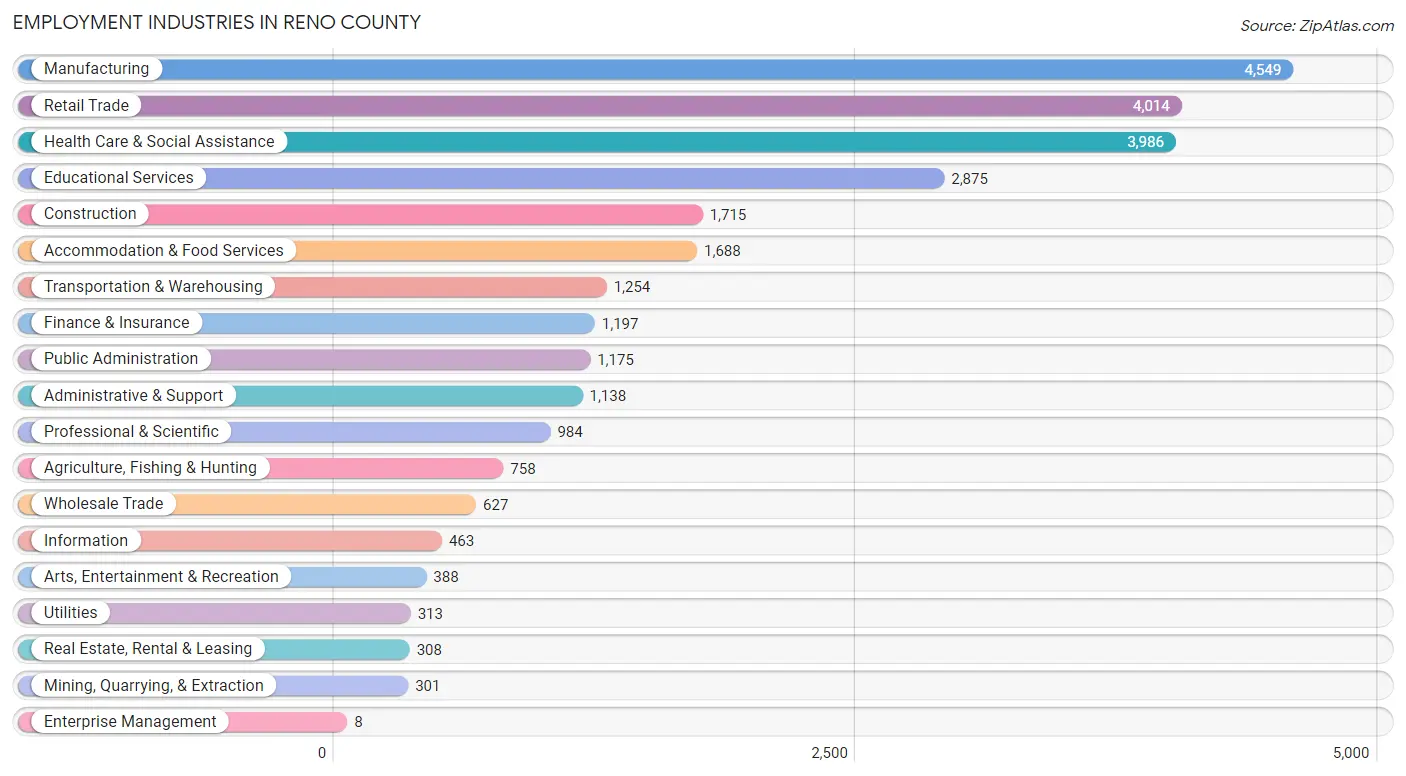
The major employment industries in Reno County include Manufacturing (4,549 | 15.5%), Retail Trade (4,014 | 13.7%), Health Care & Social Assistance (3,986 | 13.6%), Educational Services (2,875 | 9.8%), and Construction (1,715 | 5.8%).
Employment Industries by Sex in Reno County
The Reno County industries that see more men than women are Enterprise Management (100.0%), Utilities (94.6%), and Construction (91.4%), whereas the industries that tend to have a higher number of women are Health Care & Social Assistance (83.6%), Educational Services (73.7%), and Real Estate, Rental & Leasing (66.9%).
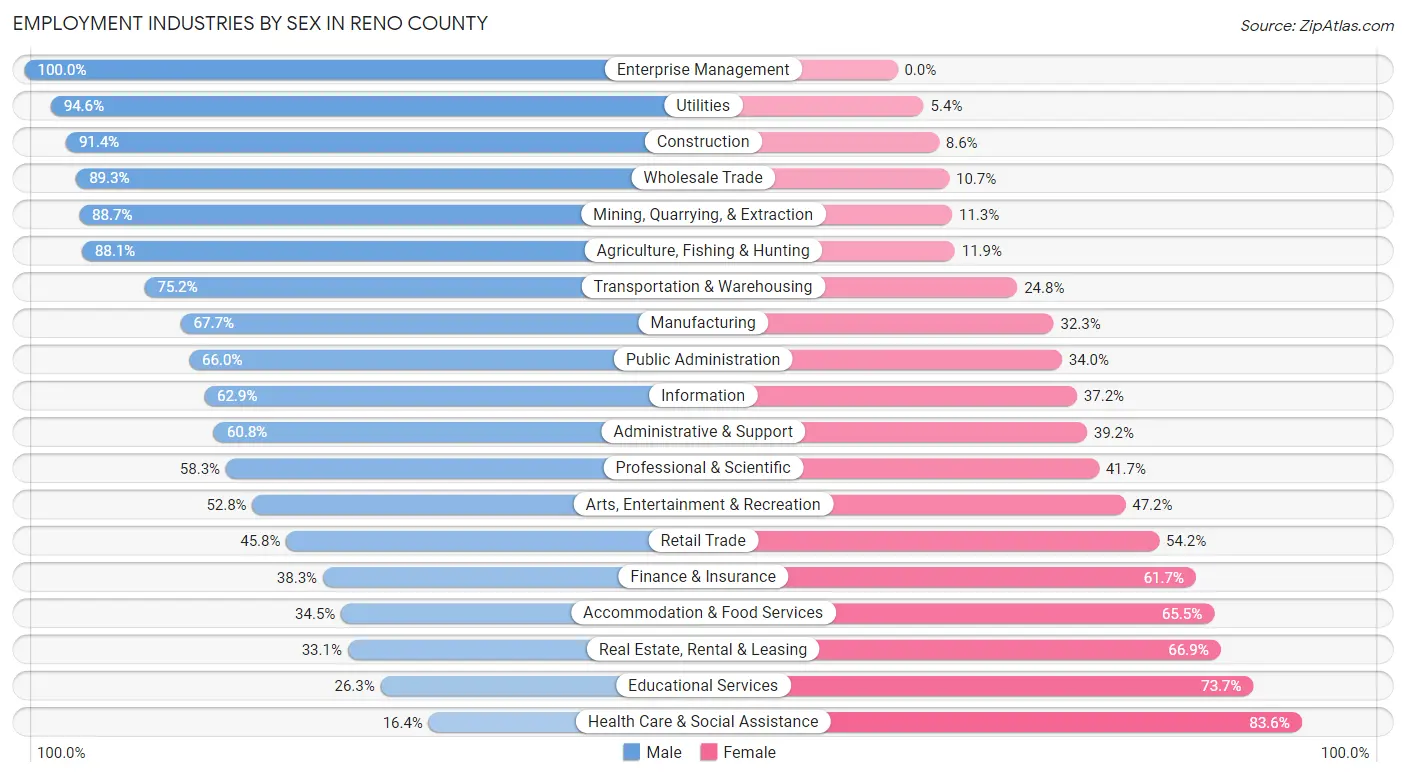
| Industry | Male | Female |
| Agriculture, Fishing & Hunting | 668 (88.1%) | 90 (11.9%) |
| Mining, Quarrying, & Extraction | 267 (88.7%) | 34 (11.3%) |
| Construction | 1,568 (91.4%) | 147 (8.6%) |
| Manufacturing | 3,079 (67.7%) | 1,470 (32.3%) |
| Wholesale Trade | 560 (89.3%) | 67 (10.7%) |
| Retail Trade | 1,840 (45.8%) | 2,174 (54.2%) |
| Transportation & Warehousing | 943 (75.2%) | 311 (24.8%) |
| Utilities | 296 (94.6%) | 17 (5.4%) |
| Information | 291 (62.8%) | 172 (37.1%) |
| Finance & Insurance | 458 (38.3%) | 739 (61.7%) |
| Real Estate, Rental & Leasing | 102 (33.1%) | 206 (66.9%) |
| Professional & Scientific | 574 (58.3%) | 410 (41.7%) |
| Enterprise Management | 8 (100.0%) | 0 (0.0%) |
| Administrative & Support | 692 (60.8%) | 446 (39.2%) |
| Educational Services | 757 (26.3%) | 2,118 (73.7%) |
| Health Care & Social Assistance | 652 (16.4%) | 3,334 (83.6%) |
| Arts, Entertainment & Recreation | 205 (52.8%) | 183 (47.2%) |
| Accommodation & Food Services | 582 (34.5%) | 1,106 (65.5%) |
| Public Administration | 775 (66.0%) | 400 (34.0%) |
| Total | 15,250 (51.9%) | 14,110 (48.1%) |
Education in Reno County
School Enrollment in Reno County
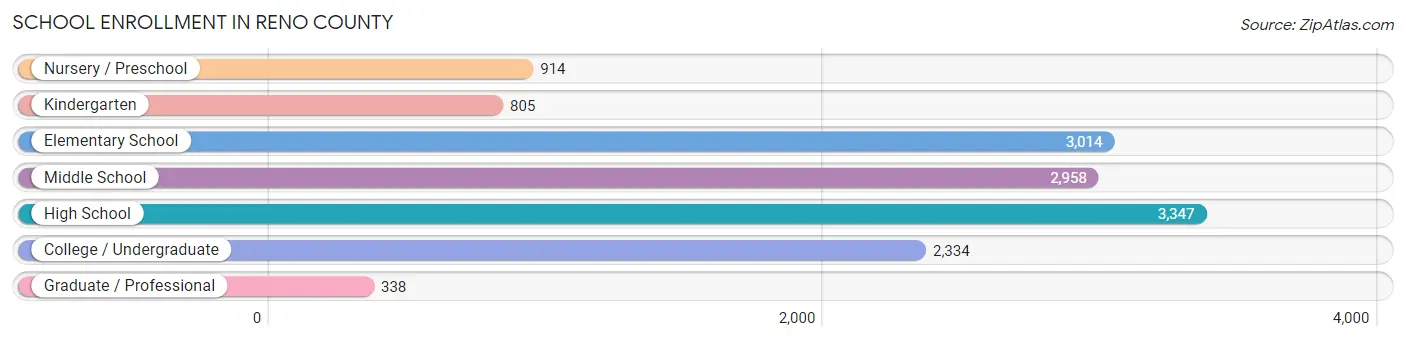
The most common levels of schooling among the 13,710 students in Reno County are high school (3,347 | 24.4%), elementary school (3,014 | 22.0%), and middle school (2,958 | 21.6%).
| School Level | # Students | % Students |
| Nursery / Preschool | 914 | 6.7% |
| Kindergarten | 805 | 5.9% |
| Elementary School | 3,014 | 22.0% |
| Middle School | 2,958 | 21.6% |
| High School | 3,347 | 24.4% |
| College / Undergraduate | 2,334 | 17.0% |
| Graduate / Professional | 338 | 2.5% |
| Total | 13,710 | 100.0% |
School Enrollment by Age by Funding Source in Reno County
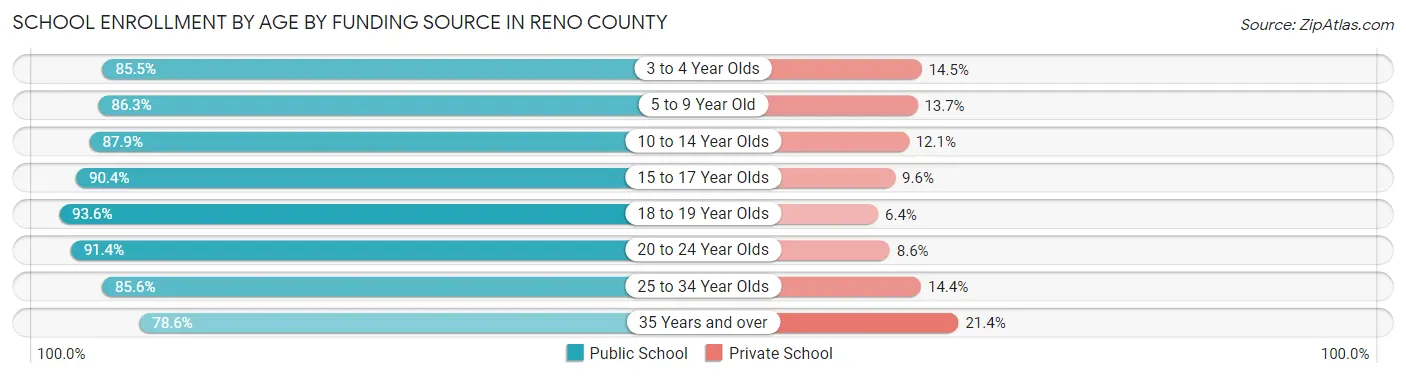
Out of a total of 13,710 students who are enrolled in schools in Reno County, 1,645 (12.0%) attend a private institution, while the remaining 12,065 (88.0%) are enrolled in public schools. The age group of 35 years and over has the highest likelihood of being enrolled in private schools, with 126 (21.4% in the age bracket) enrolled. Conversely, the age group of 18 to 19 year olds has the lowest likelihood of being enrolled in a private school, with 933 (93.6% in the age bracket) attending a public institution.
| Age Bracket | Public School | Private School |
| 3 to 4 Year Olds | 570 (85.5%) | 97 (14.5%) |
| 5 to 9 Year Old | 3,077 (86.3%) | 490 (13.7%) |
| 10 to 14 Year Olds | 3,438 (87.9%) | 474 (12.1%) |
| 15 to 17 Year Olds | 2,178 (90.4%) | 231 (9.6%) |
| 18 to 19 Year Olds | 933 (93.6%) | 64 (6.4%) |
| 20 to 24 Year Olds | 1,041 (91.4%) | 98 (8.6%) |
| 25 to 34 Year Olds | 368 (85.6%) | 62 (14.4%) |
| 35 Years and over | 463 (78.6%) | 126 (21.4%) |
| Total | 12,065 (88.0%) | 1,645 (12.0%) |
Educational Attainment by Field of Study in Reno County
Education (2,223 | 23.4%), business (1,552 | 16.3%), bio, nature & agricultural (885 | 9.3%), science & technology (773 | 8.1%), and liberal arts & history (672 | 7.1%) are the most common fields of study among 9,502 individuals in Reno County who have obtained a bachelor's degree or higher.
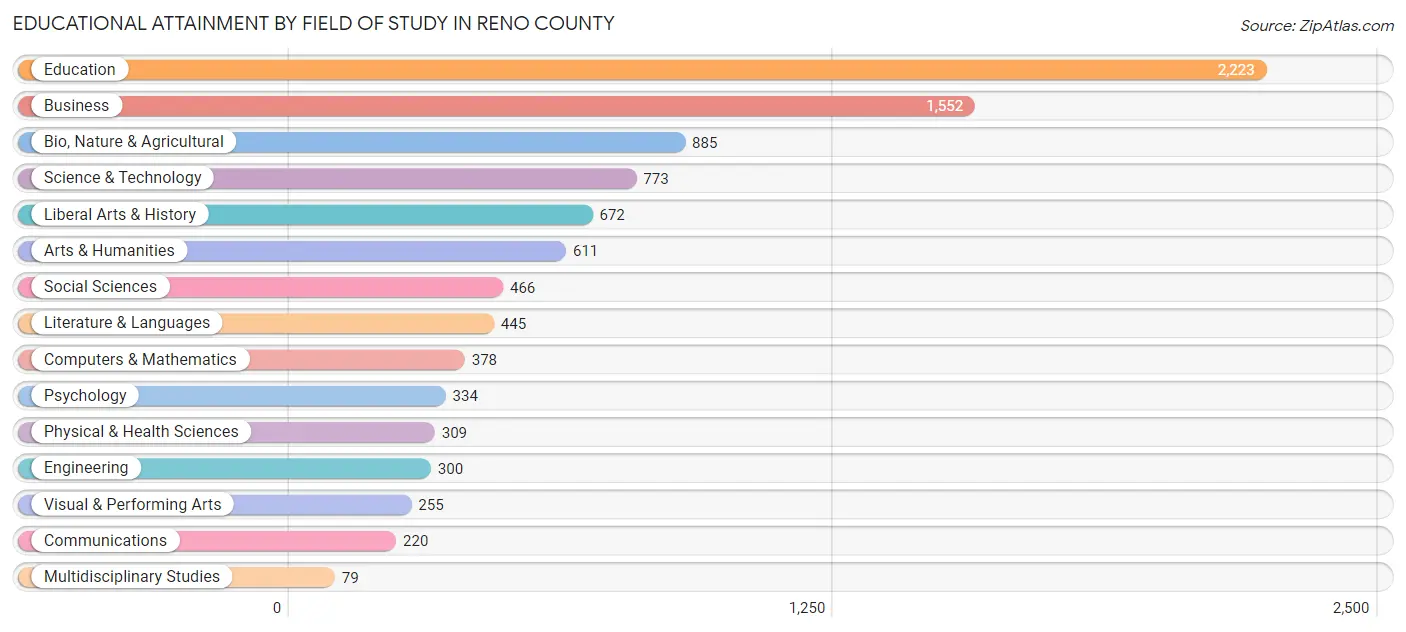
| Field of Study | # Graduates | % Graduates |
| Computers & Mathematics | 378 | 4.0% |
| Bio, Nature & Agricultural | 885 | 9.3% |
| Physical & Health Sciences | 309 | 3.3% |
| Psychology | 334 | 3.5% |
| Social Sciences | 466 | 4.9% |
| Engineering | 300 | 3.2% |
| Multidisciplinary Studies | 79 | 0.8% |
| Science & Technology | 773 | 8.1% |
| Business | 1,552 | 16.3% |
| Education | 2,223 | 23.4% |
| Literature & Languages | 445 | 4.7% |
| Liberal Arts & History | 672 | 7.1% |
| Visual & Performing Arts | 255 | 2.7% |
| Communications | 220 | 2.3% |
| Arts & Humanities | 611 | 6.4% |
| Total | 9,502 | 100.0% |
Transportation & Commute in Reno County
Vehicle Availability by Sex in Reno County
The most prevalent vehicle ownership categories in Reno County are males with 2 vehicles (5,135, accounting for 35.2%) and females with 2 vehicles (4,745, making up 36.9%).
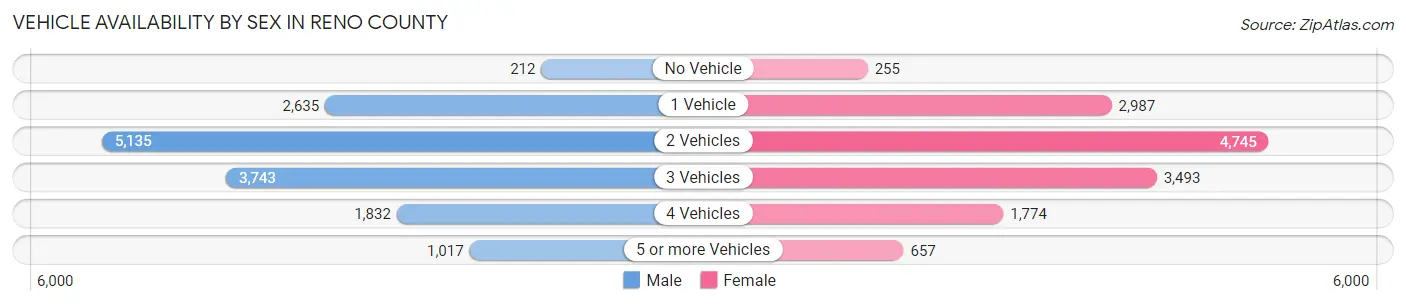
| Vehicles Available | Male | Female |
| No Vehicle | 212 (1.5%) | 255 (1.8%) |
| 1 Vehicle | 2,635 (18.1%) | 2,987 (21.5%) |
| 2 Vehicles | 5,135 (35.2%) | 4,745 (34.1%) |
| 3 Vehicles | 3,743 (25.7%) | 3,493 (25.1%) |
| 4 Vehicles | 1,832 (12.6%) | 1,774 (12.8%) |
| 5 or more Vehicles | 1,017 (7.0%) | 657 (4.7%) |
| Total | 14,574 (100.0%) | 13,911 (100.0%) |
Commute Time in Reno County
The most frequently occuring commute durations in Reno County are 10 to 14 minutes (6,926 commuters, 25.6%), 5 to 9 minutes (5,421 commuters, 20.0%), and 15 to 19 minutes (4,908 commuters, 18.1%).
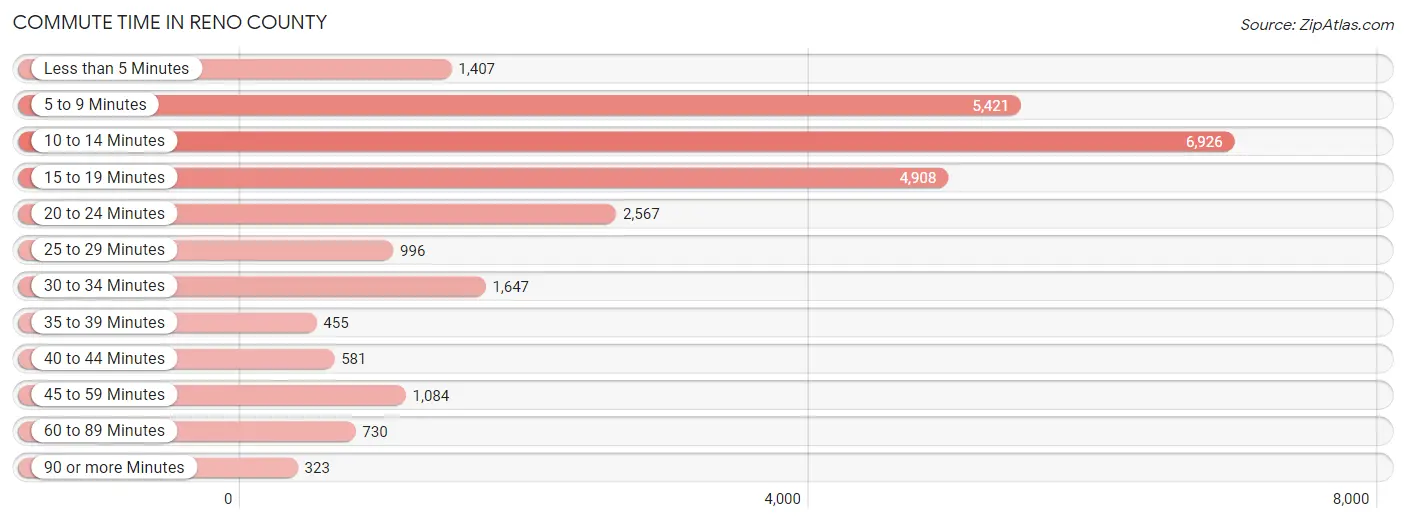
| Commute Time | # Commuters | % Commuters |
| Less than 5 Minutes | 1,407 | 5.2% |
| 5 to 9 Minutes | 5,421 | 20.0% |
| 10 to 14 Minutes | 6,926 | 25.6% |
| 15 to 19 Minutes | 4,908 | 18.1% |
| 20 to 24 Minutes | 2,567 | 9.5% |
| 25 to 29 Minutes | 996 | 3.7% |
| 30 to 34 Minutes | 1,647 | 6.1% |
| 35 to 39 Minutes | 455 | 1.7% |
| 40 to 44 Minutes | 581 | 2.1% |
| 45 to 59 Minutes | 1,084 | 4.0% |
| 60 to 89 Minutes | 730 | 2.7% |
| 90 or more Minutes | 323 | 1.2% |
Commute Time by Sex in Reno County
The most common commute times in Reno County are 10 to 14 minutes (3,225 commuters, 23.2%) for males and 10 to 14 minutes (3,701 commuters, 28.1%) for females.
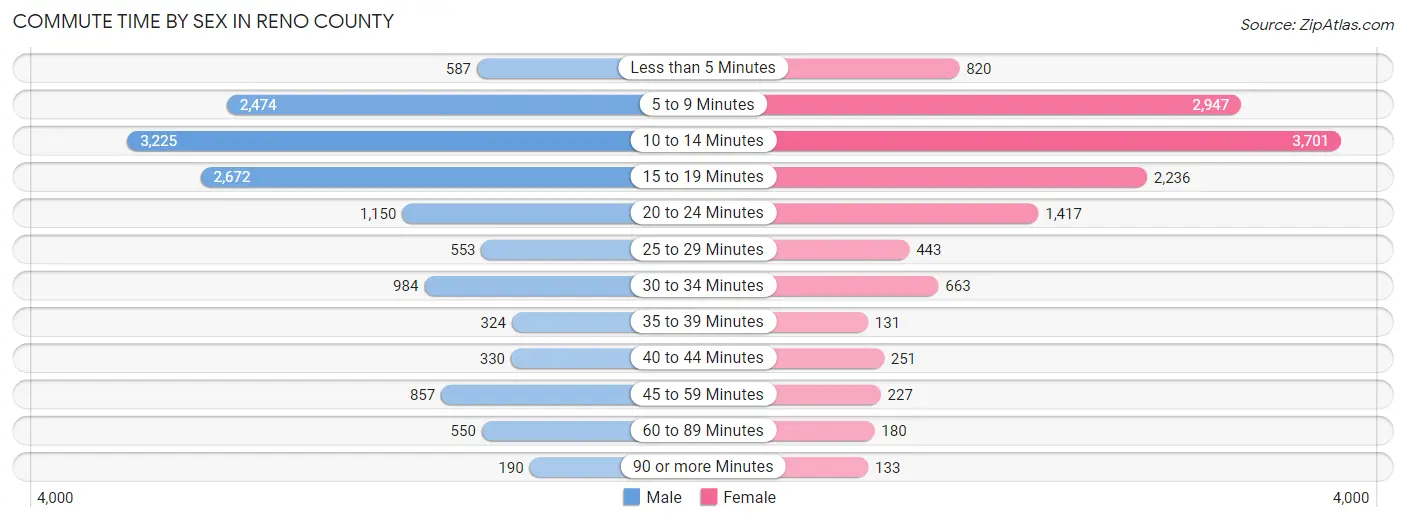
| Commute Time | Male | Female |
| Less than 5 Minutes | 587 (4.2%) | 820 (6.2%) |
| 5 to 9 Minutes | 2,474 (17.8%) | 2,947 (22.4%) |
| 10 to 14 Minutes | 3,225 (23.2%) | 3,701 (28.1%) |
| 15 to 19 Minutes | 2,672 (19.2%) | 2,236 (17.0%) |
| 20 to 24 Minutes | 1,150 (8.3%) | 1,417 (10.8%) |
| 25 to 29 Minutes | 553 (4.0%) | 443 (3.4%) |
| 30 to 34 Minutes | 984 (7.1%) | 663 (5.0%) |
| 35 to 39 Minutes | 324 (2.3%) | 131 (1.0%) |
| 40 to 44 Minutes | 330 (2.4%) | 251 (1.9%) |
| 45 to 59 Minutes | 857 (6.2%) | 227 (1.7%) |
| 60 to 89 Minutes | 550 (4.0%) | 180 (1.4%) |
| 90 or more Minutes | 190 (1.4%) | 133 (1.0%) |
Time of Departure to Work by Sex in Reno County
The most frequent times of departure to work in Reno County are 7:30 AM to 7:59 AM (2,358, 17.0%) for males and 7:30 AM to 7:59 AM (3,154, 24.0%) for females.
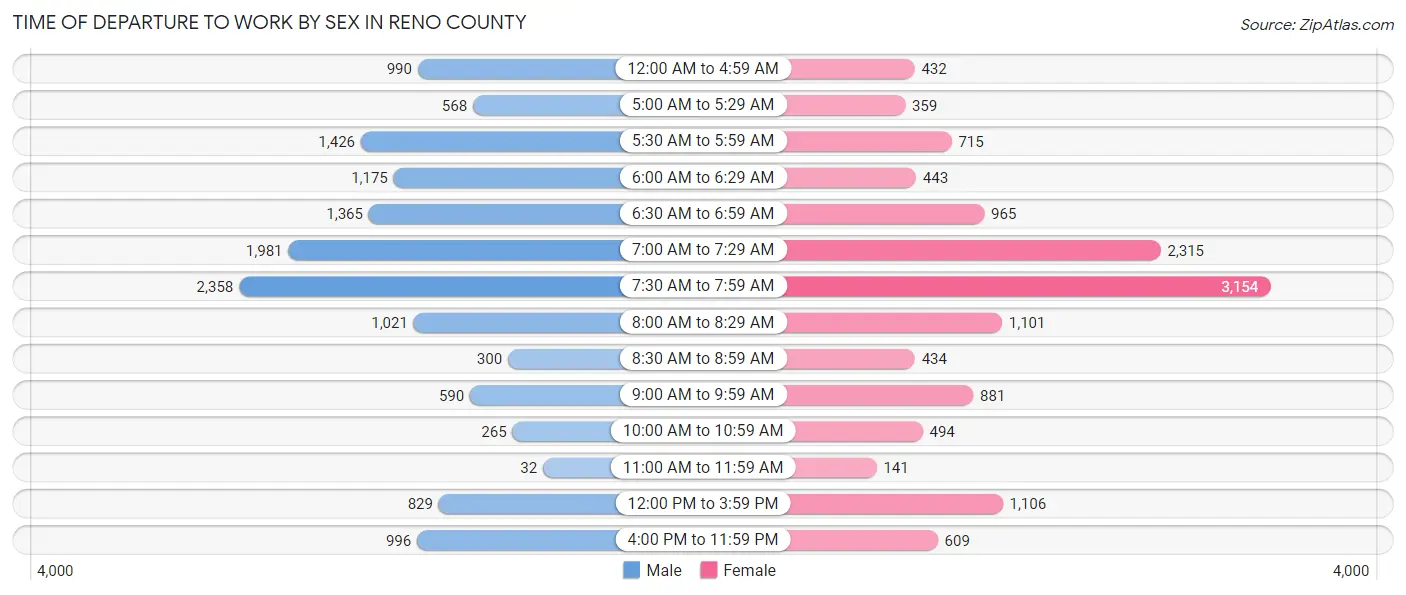
| Time of Departure | Male | Female |
| 12:00 AM to 4:59 AM | 990 (7.1%) | 432 (3.3%) |
| 5:00 AM to 5:29 AM | 568 (4.1%) | 359 (2.7%) |
| 5:30 AM to 5:59 AM | 1,426 (10.3%) | 715 (5.4%) |
| 6:00 AM to 6:29 AM | 1,175 (8.5%) | 443 (3.4%) |
| 6:30 AM to 6:59 AM | 1,365 (9.8%) | 965 (7.3%) |
| 7:00 AM to 7:29 AM | 1,981 (14.3%) | 2,315 (17.6%) |
| 7:30 AM to 7:59 AM | 2,358 (17.0%) | 3,154 (24.0%) |
| 8:00 AM to 8:29 AM | 1,021 (7.3%) | 1,101 (8.4%) |
| 8:30 AM to 8:59 AM | 300 (2.2%) | 434 (3.3%) |
| 9:00 AM to 9:59 AM | 590 (4.3%) | 881 (6.7%) |
| 10:00 AM to 10:59 AM | 265 (1.9%) | 494 (3.8%) |
| 11:00 AM to 11:59 AM | 32 (0.2%) | 141 (1.1%) |
| 12:00 PM to 3:59 PM | 829 (6.0%) | 1,106 (8.4%) |
| 4:00 PM to 11:59 PM | 996 (7.2%) | 609 (4.6%) |
| Total | 13,896 (100.0%) | 13,149 (100.0%) |
Housing Occupancy in Reno County
Occupancy by Ownership in Reno County
Of the total 25,157 dwellings in Reno County, owner-occupied units account for 17,690 (70.3%), while renter-occupied units make up 7,467 (29.7%).
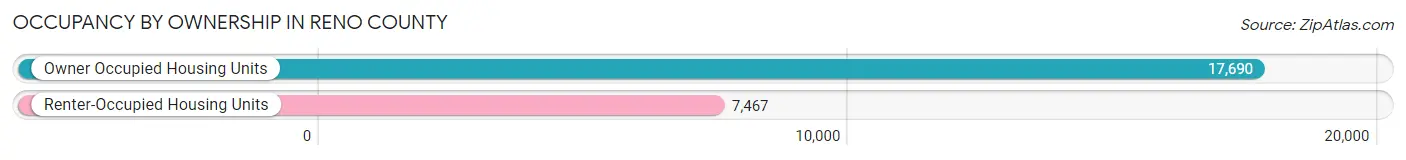
| Occupancy | # Housing Units | % Housing Units |
| Owner Occupied Housing Units | 17,690 | 70.3% |
| Renter-Occupied Housing Units | 7,467 | 29.7% |
| Total Occupied Housing Units | 25,157 | 100.0% |
Occupancy by Household Size in Reno County
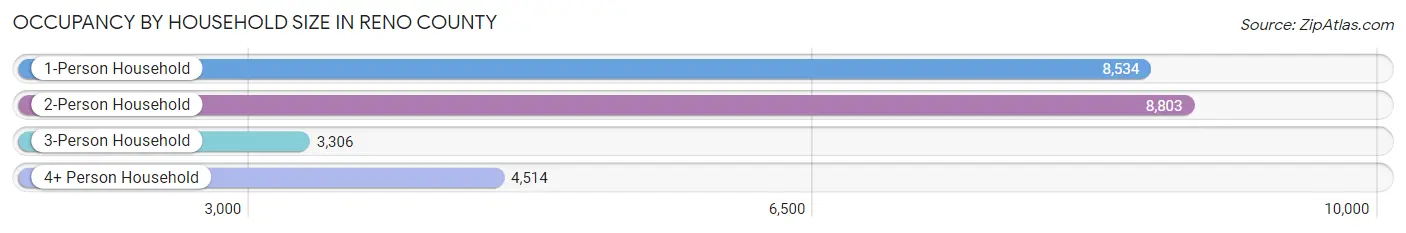
| Household Size | # Housing Units | % Housing Units |
| 1-Person Household | 8,534 | 33.9% |
| 2-Person Household | 8,803 | 35.0% |
| 3-Person Household | 3,306 | 13.1% |
| 4+ Person Household | 4,514 | 17.9% |
| Total Housing Units | 25,157 | 100.0% |
Occupancy by Ownership by Household Size in Reno County
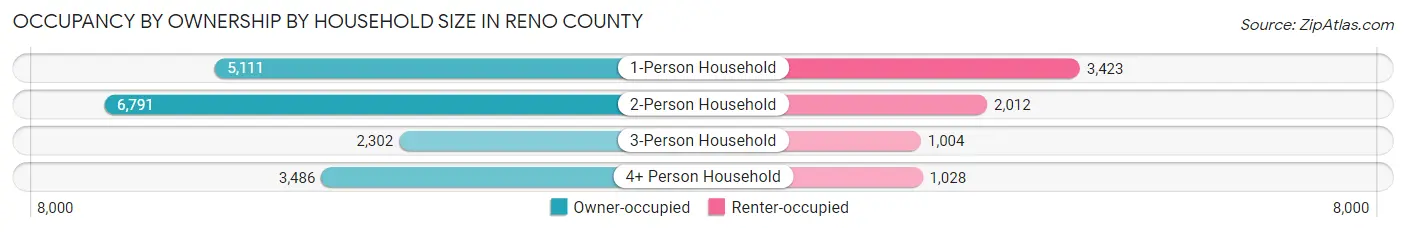
| Household Size | Owner-occupied | Renter-occupied |
| 1-Person Household | 5,111 (59.9%) | 3,423 (40.1%) |
| 2-Person Household | 6,791 (77.1%) | 2,012 (22.9%) |
| 3-Person Household | 2,302 (69.6%) | 1,004 (30.4%) |
| 4+ Person Household | 3,486 (77.2%) | 1,028 (22.8%) |
| Total Housing Units | 17,690 (70.3%) | 7,467 (29.7%) |
Occupancy by Educational Attainment in Reno County
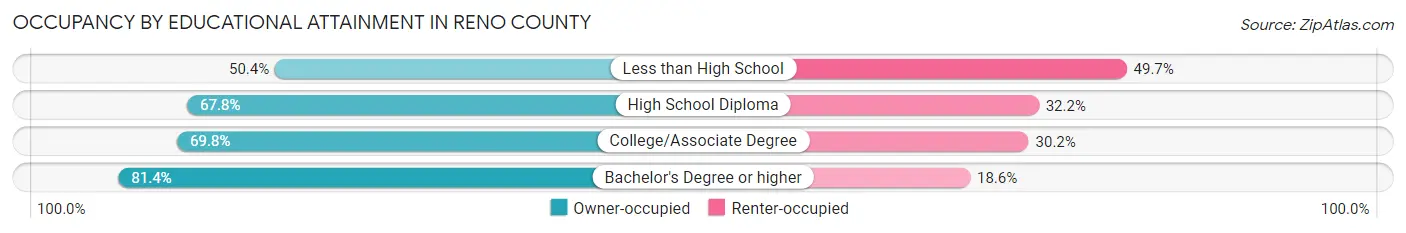
| Household Size | Owner-occupied | Renter-occupied |
| Less than High School | 936 (50.3%) | 923 (49.6%) |
| High School Diploma | 4,872 (67.8%) | 2,317 (32.2%) |
| College/Associate Degree | 7,383 (69.8%) | 3,198 (30.2%) |
| Bachelor's Degree or higher | 4,499 (81.4%) | 1,029 (18.6%) |
Occupancy by Age of Householder in Reno County
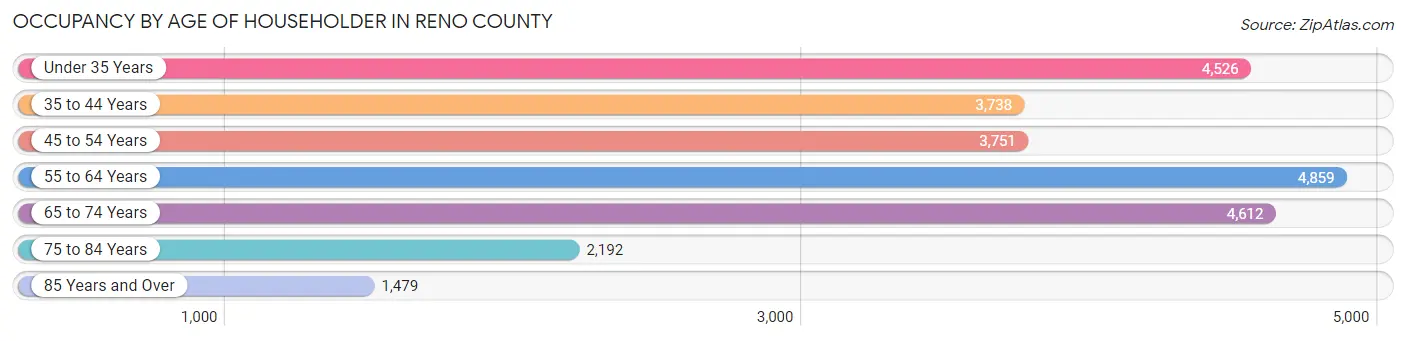
| Age Bracket | # Households | % Households |
| Under 35 Years | 4,526 | 18.0% |
| 35 to 44 Years | 3,738 | 14.9% |
| 45 to 54 Years | 3,751 | 14.9% |
| 55 to 64 Years | 4,859 | 19.3% |
| 65 to 74 Years | 4,612 | 18.3% |
| 75 to 84 Years | 2,192 | 8.7% |
| 85 Years and Over | 1,479 | 5.9% |
| Total | 25,157 | 100.0% |
Housing Finances in Reno County
Median Income by Occupancy in Reno County
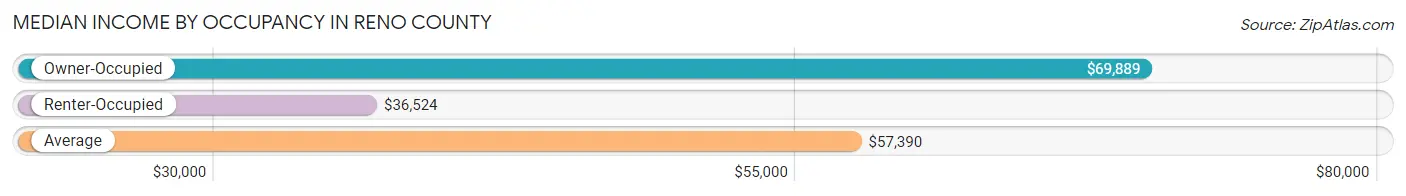
| Occupancy Type | # Households | Median Income |
| Owner-Occupied | 17,690 (70.3%) | $69,889 |
| Renter-Occupied | 7,467 (29.7%) | $36,524 |
| Average | 25,157 (100.0%) | $57,390 |
Occupancy by Householder Income Bracket in Reno County
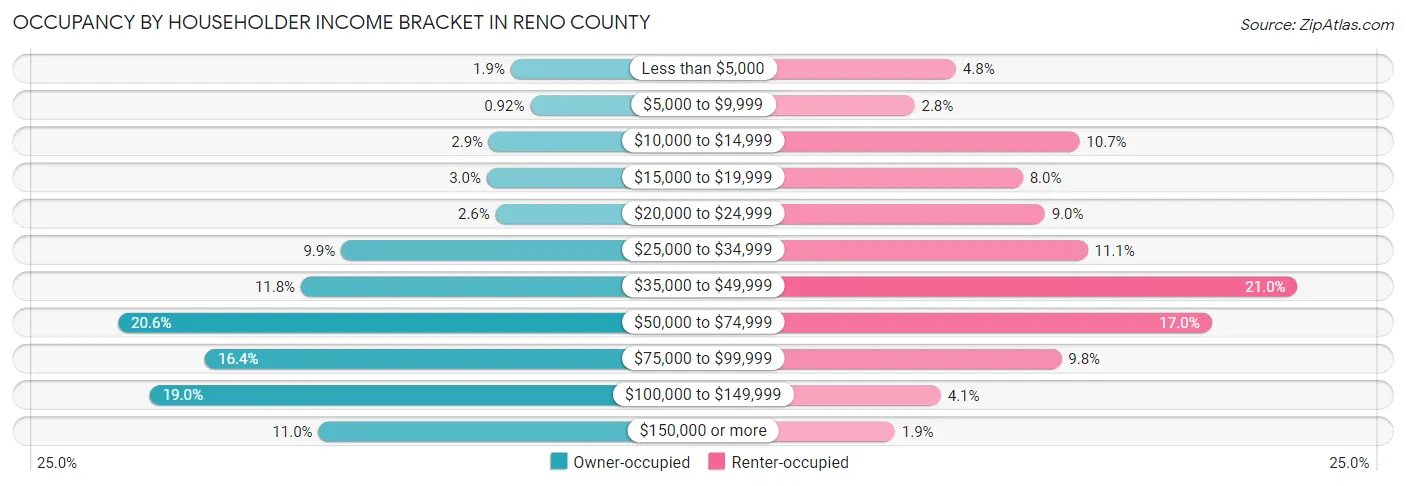
| Income Bracket | Owner-occupied | Renter-occupied |
| Less than $5,000 | 328 (1.8%) | 357 (4.8%) |
| $5,000 to $9,999 | 163 (0.9%) | 210 (2.8%) |
| $10,000 to $14,999 | 512 (2.9%) | 796 (10.7%) |
| $15,000 to $19,999 | 529 (3.0%) | 594 (8.0%) |
| $20,000 to $24,999 | 454 (2.6%) | 673 (9.0%) |
| $25,000 to $34,999 | 1,757 (9.9%) | 825 (11.1%) |
| $35,000 to $49,999 | 2,094 (11.8%) | 1,571 (21.0%) |
| $50,000 to $74,999 | 3,636 (20.5%) | 1,266 (17.0%) |
| $75,000 to $99,999 | 2,902 (16.4%) | 732 (9.8%) |
| $100,000 to $149,999 | 3,368 (19.0%) | 303 (4.1%) |
| $150,000 or more | 1,947 (11.0%) | 140 (1.9%) |
| Total | 17,690 (100.0%) | 7,467 (100.0%) |
Monthly Housing Cost Tiers in Reno County
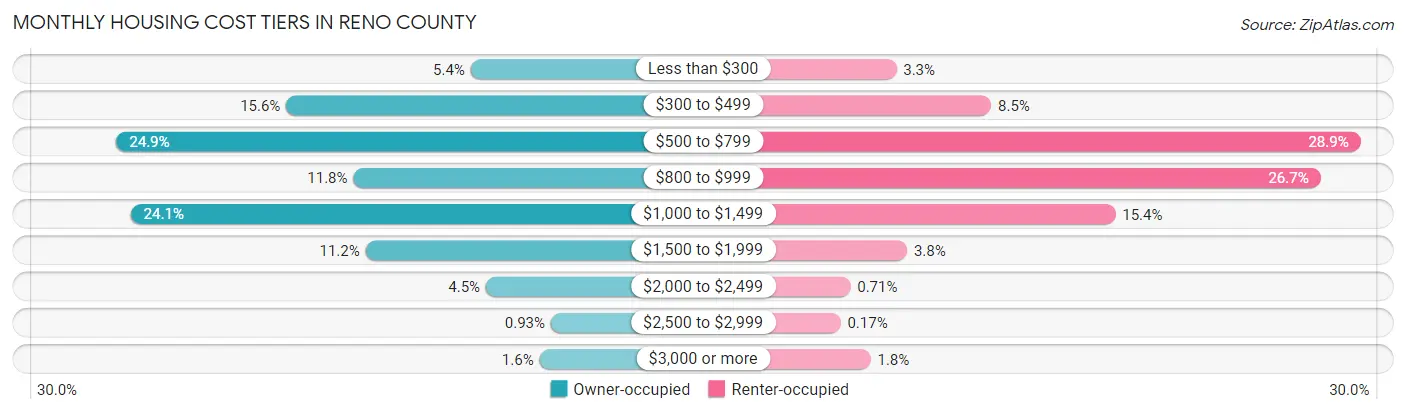
| Monthly Cost | Owner-occupied | Renter-occupied |
| Less than $300 | 948 (5.4%) | 243 (3.3%) |
| $300 to $499 | 2,751 (15.5%) | 634 (8.5%) |
| $500 to $799 | 4,411 (24.9%) | 2,157 (28.9%) |
| $800 to $999 | 2,094 (11.8%) | 1,992 (26.7%) |
| $1,000 to $1,499 | 4,270 (24.1%) | 1,146 (15.3%) |
| $1,500 to $1,999 | 1,976 (11.2%) | 287 (3.8%) |
| $2,000 to $2,499 | 799 (4.5%) | 53 (0.7%) |
| $2,500 to $2,999 | 165 (0.9%) | 13 (0.2%) |
| $3,000 or more | 276 (1.6%) | 137 (1.8%) |
| Total | 17,690 (100.0%) | 7,467 (100.0%) |
Physical Housing Characteristics in Reno County
Housing Structures in Reno County
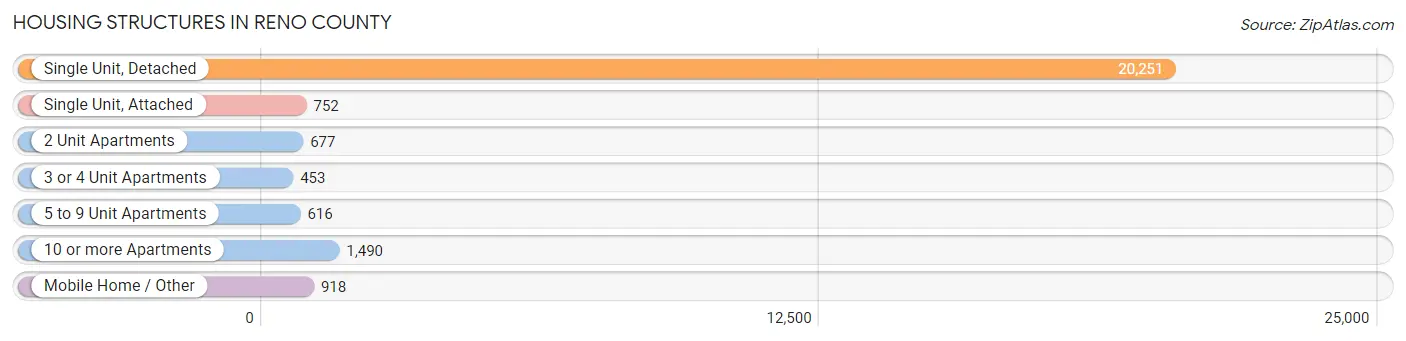
| Structure Type | # Housing Units | % Housing Units |
| Single Unit, Detached | 20,251 | 80.5% |
| Single Unit, Attached | 752 | 3.0% |
| 2 Unit Apartments | 677 | 2.7% |
| 3 or 4 Unit Apartments | 453 | 1.8% |
| 5 to 9 Unit Apartments | 616 | 2.5% |
| 10 or more Apartments | 1,490 | 5.9% |
| Mobile Home / Other | 918 | 3.6% |
| Total | 25,157 | 100.0% |
Housing Structures by Occupancy in Reno County
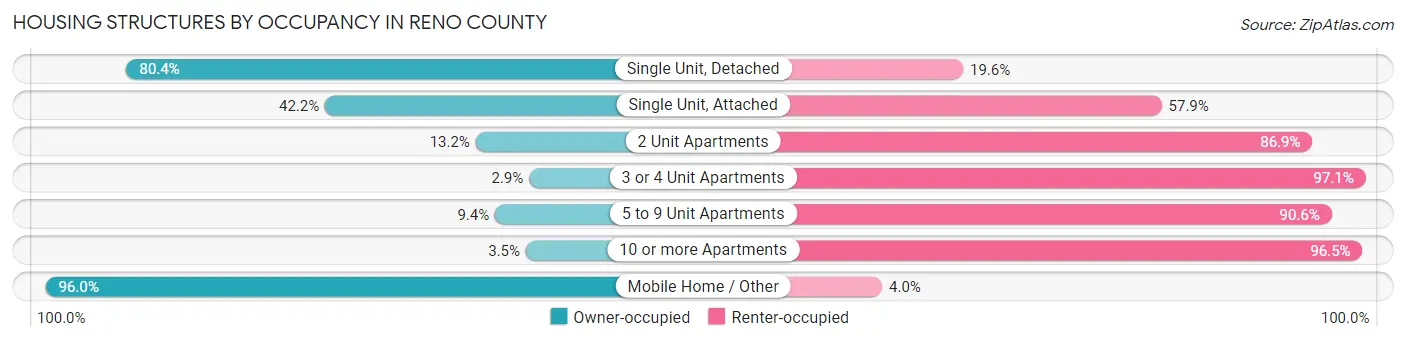
| Structure Type | Owner-occupied | Renter-occupied |
| Single Unit, Detached | 16,280 (80.4%) | 3,971 (19.6%) |
| Single Unit, Attached | 317 (42.1%) | 435 (57.9%) |
| 2 Unit Apartments | 89 (13.2%) | 588 (86.9%) |
| 3 or 4 Unit Apartments | 13 (2.9%) | 440 (97.1%) |
| 5 to 9 Unit Apartments | 58 (9.4%) | 558 (90.6%) |
| 10 or more Apartments | 52 (3.5%) | 1,438 (96.5%) |
| Mobile Home / Other | 881 (96.0%) | 37 (4.0%) |
| Total | 17,690 (70.3%) | 7,467 (29.7%) |
Housing Structures by Number of Rooms in Reno County
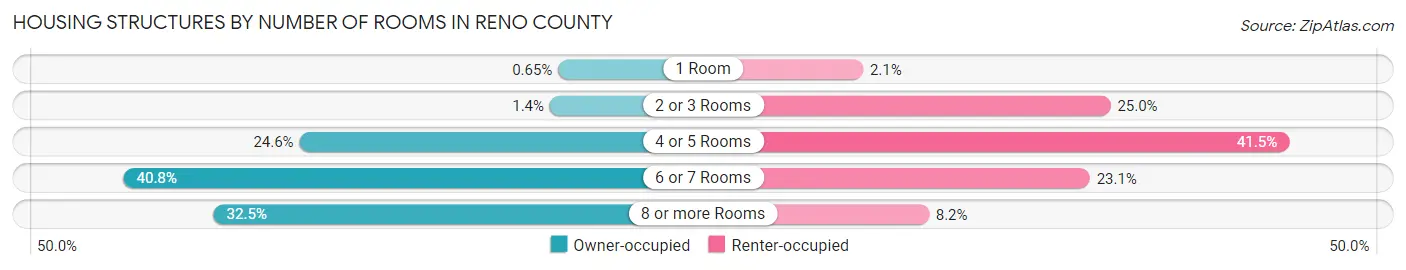
| Number of Rooms | Owner-occupied | Renter-occupied |
| 1 Room | 115 (0.6%) | 159 (2.1%) |
| 2 or 3 Rooms | 252 (1.4%) | 1,868 (25.0%) |
| 4 or 5 Rooms | 4,348 (24.6%) | 3,101 (41.5%) |
| 6 or 7 Rooms | 7,224 (40.8%) | 1,725 (23.1%) |
| 8 or more Rooms | 5,751 (32.5%) | 614 (8.2%) |
| Total | 17,690 (100.0%) | 7,467 (100.0%) |
Housing Structure by Heating Type in Reno County
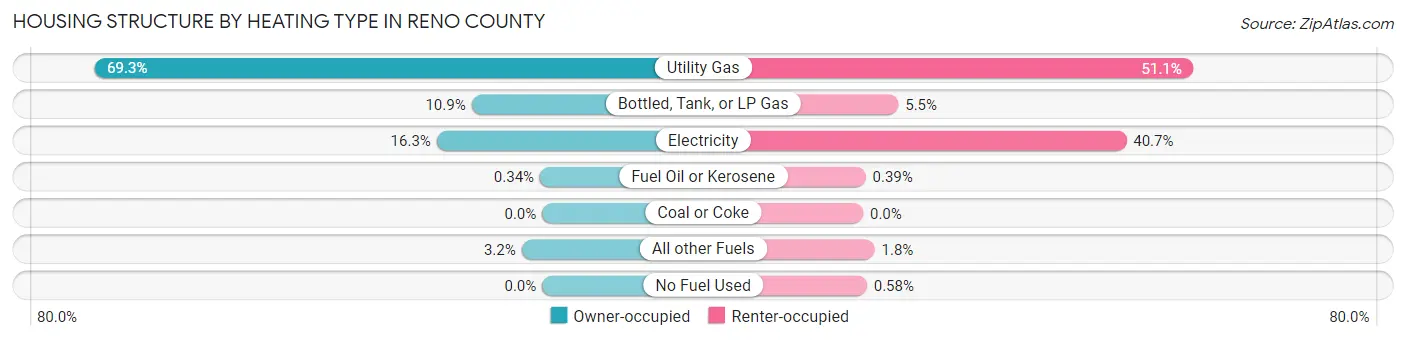
| Heating Type | Owner-occupied | Renter-occupied |
| Utility Gas | 12,253 (69.3%) | 3,816 (51.1%) |
| Bottled, Tank, or LP Gas | 1,931 (10.9%) | 407 (5.4%) |
| Electricity | 2,884 (16.3%) | 3,038 (40.7%) |
| Fuel Oil or Kerosene | 60 (0.3%) | 29 (0.4%) |
| Coal or Coke | 0 (0.0%) | 0 (0.0%) |
| All other Fuels | 562 (3.2%) | 134 (1.8%) |
| No Fuel Used | 0 (0.0%) | 43 (0.6%) |
| Total | 17,690 (100.0%) | 7,467 (100.0%) |
Household Vehicle Usage in Reno County
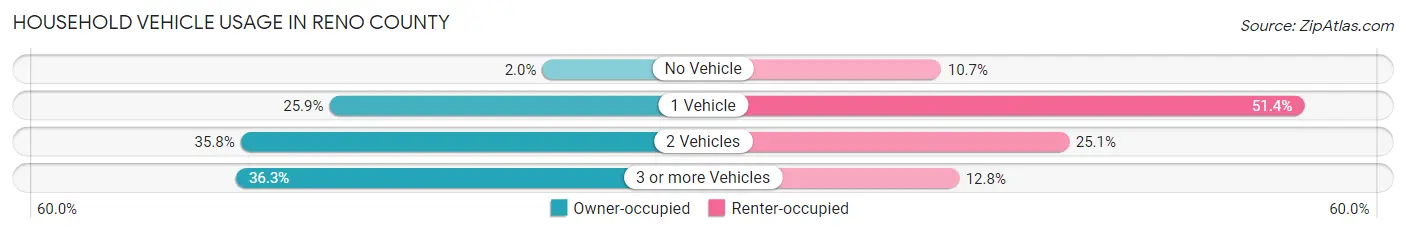
| Vehicles per Household | Owner-occupied | Renter-occupied |
| No Vehicle | 355 (2.0%) | 802 (10.7%) |
| 1 Vehicle | 4,576 (25.9%) | 3,840 (51.4%) |
| 2 Vehicles | 6,334 (35.8%) | 1,873 (25.1%) |
| 3 or more Vehicles | 6,425 (36.3%) | 952 (12.8%) |
| Total | 17,690 (100.0%) | 7,467 (100.0%) |
Real Estate & Mortgages in Reno County
Real Estate and Mortgage Overview in Reno County
| Characteristic | Without Mortgage | With Mortgage |
| Housing Units | 8,240 | 9,450 |
| Median Property Value | $102,000 | $129,400 |
| Median Household Income | $52,475 | $1,286 |
| Monthly Housing Costs | $530 | $271 |
| Real Estate Taxes | $1,766 | $99 |
Property Value by Mortgage Status in Reno County
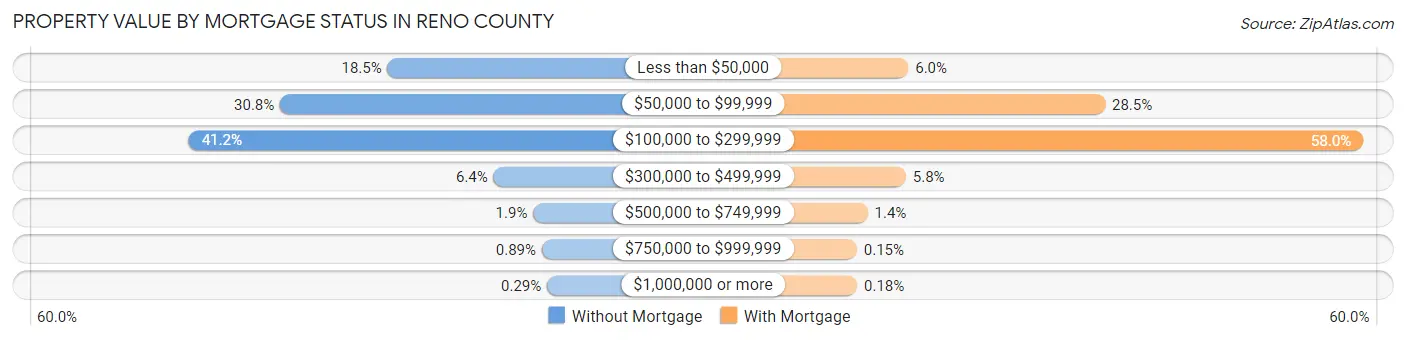
| Property Value | Without Mortgage | With Mortgage |
| Less than $50,000 | 1,526 (18.5%) | 570 (6.0%) |
| $50,000 to $99,999 | 2,538 (30.8%) | 2,694 (28.5%) |
| $100,000 to $299,999 | 3,398 (41.2%) | 5,482 (58.0%) |
| $300,000 to $499,999 | 527 (6.4%) | 543 (5.8%) |
| $500,000 to $749,999 | 154 (1.9%) | 130 (1.4%) |
| $750,000 to $999,999 | 73 (0.9%) | 14 (0.2%) |
| $1,000,000 or more | 24 (0.3%) | 17 (0.2%) |
| Total | 8,240 (100.0%) | 9,450 (100.0%) |
Household Income by Mortgage Status in Reno County
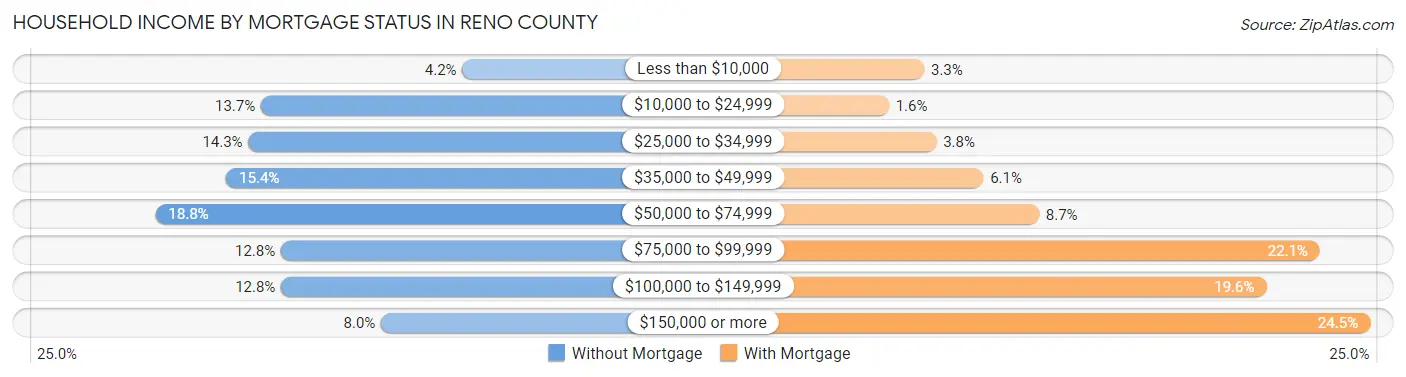
| Household Income | Without Mortgage | With Mortgage |
| Less than $10,000 | 342 (4.2%) | 308 (3.3%) |
| $10,000 to $24,999 | 1,132 (13.7%) | 149 (1.6%) |
| $25,000 to $34,999 | 1,182 (14.3%) | 363 (3.8%) |
| $35,000 to $49,999 | 1,269 (15.4%) | 575 (6.1%) |
| $50,000 to $74,999 | 1,547 (18.8%) | 825 (8.7%) |
| $75,000 to $99,999 | 1,054 (12.8%) | 2,089 (22.1%) |
| $100,000 to $149,999 | 1,053 (12.8%) | 1,848 (19.6%) |
| $150,000 or more | 661 (8.0%) | 2,315 (24.5%) |
| Total | 8,240 (100.0%) | 9,450 (100.0%) |
Property Value to Household Income Ratio in Reno County
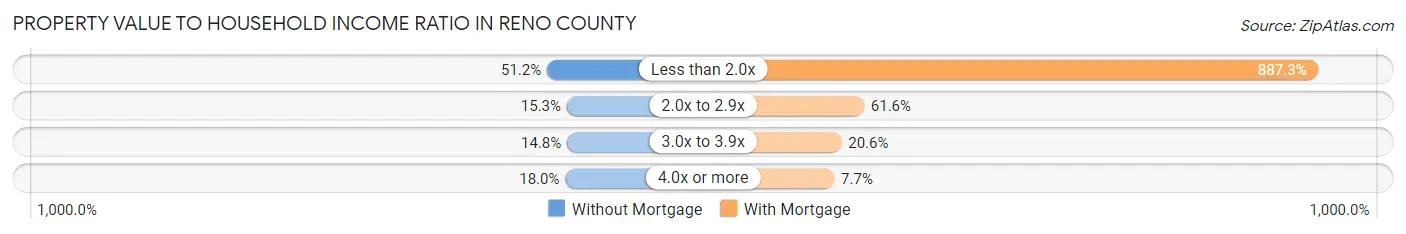
| Value-to-Income Ratio | Without Mortgage | With Mortgage |
| Less than 2.0x | 4,215 (51.1%) | 83,845 (887.3%) |
| 2.0x to 2.9x | 1,257 (15.2%) | 5,821 (61.6%) |
| 3.0x to 3.9x | 1,219 (14.8%) | 1,947 (20.6%) |
| 4.0x or more | 1,484 (18.0%) | 726 (7.7%) |
| Total | 8,240 (100.0%) | 9,450 (100.0%) |
Real Estate Taxes by Mortgage Status in Reno County
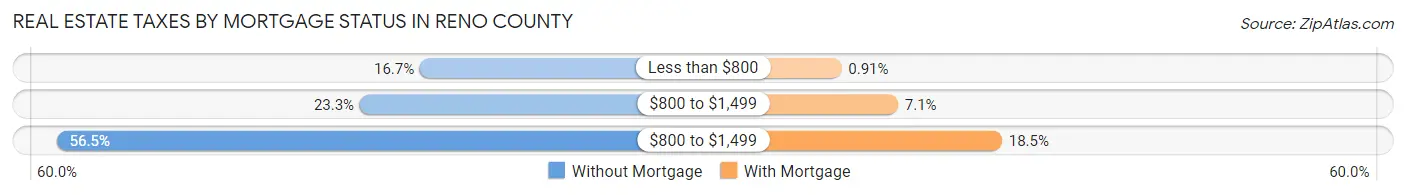
| Property Taxes | Without Mortgage | With Mortgage |
| Less than $800 | 1,373 (16.7%) | 86 (0.9%) |
| $800 to $1,499 | 1,916 (23.3%) | 671 (7.1%) |
| $800 to $1,499 | 4,655 (56.5%) | 1,747 (18.5%) |
| Total | 8,240 (100.0%) | 9,450 (100.0%) |
Health & Disability in Reno County
Health Insurance Coverage by Age in Reno County
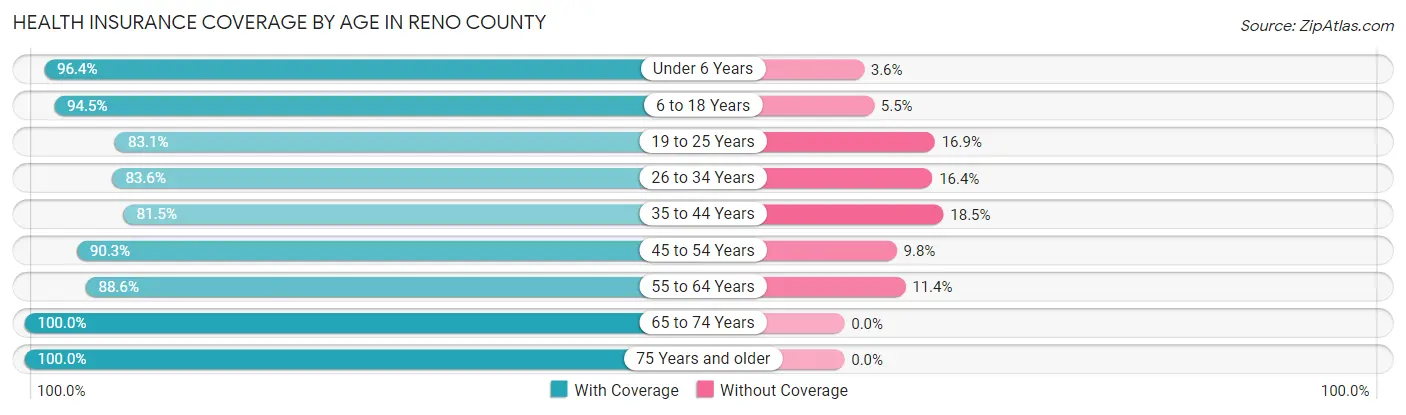
| Age Bracket | With Coverage | Without Coverage |
| Under 6 Years | 4,033 (96.4%) | 152 (3.6%) |
| 6 to 18 Years | 9,861 (94.5%) | 575 (5.5%) |
| 19 to 25 Years | 4,202 (83.1%) | 853 (16.9%) |
| 26 to 34 Years | 5,011 (83.6%) | 982 (16.4%) |
| 35 to 44 Years | 5,819 (81.5%) | 1,318 (18.5%) |
| 45 to 54 Years | 5,941 (90.2%) | 642 (9.8%) |
| 55 to 64 Years | 7,229 (88.6%) | 927 (11.4%) |
| 65 to 74 Years | 6,846 (100.0%) | 0 (0.0%) |
| 75 Years and older | 4,989 (100.0%) | 0 (0.0%) |
| Total | 53,931 (90.8%) | 5,449 (9.2%) |
Health Insurance Coverage by Citizenship Status in Reno County
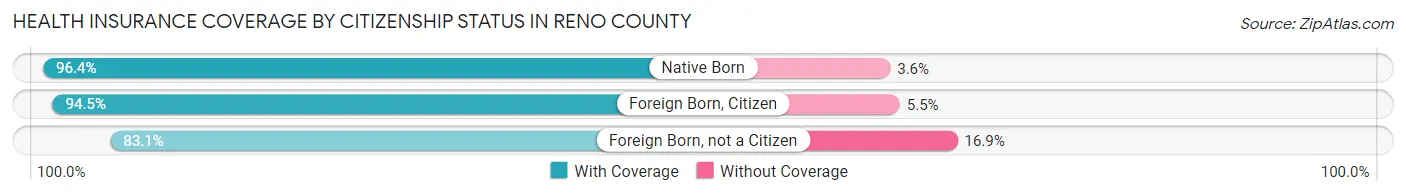
| Citizenship Status | With Coverage | Without Coverage |
| Native Born | 4,033 (96.4%) | 152 (3.6%) |
| Foreign Born, Citizen | 9,861 (94.5%) | 575 (5.5%) |
| Foreign Born, not a Citizen | 4,202 (83.1%) | 853 (16.9%) |
Health Insurance Coverage by Household Income in Reno County
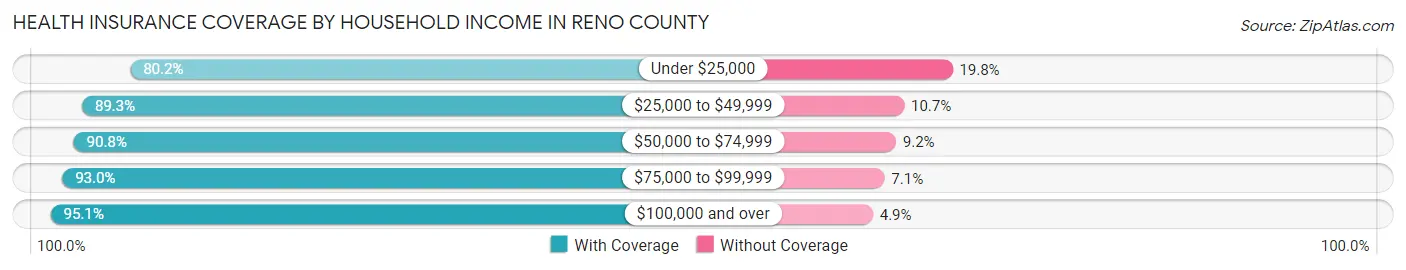
| Household Income | With Coverage | Without Coverage |
| Under $25,000 | 5,728 (80.2%) | 1,413 (19.8%) |
| $25,000 to $49,999 | 10,613 (89.3%) | 1,274 (10.7%) |
| $50,000 to $74,999 | 10,745 (90.8%) | 1,087 (9.2%) |
| $75,000 to $99,999 | 9,028 (92.9%) | 685 (7.0%) |
| $100,000 and over | 17,481 (95.1%) | 895 (4.9%) |
Public vs Private Health Insurance Coverage by Age in Reno County
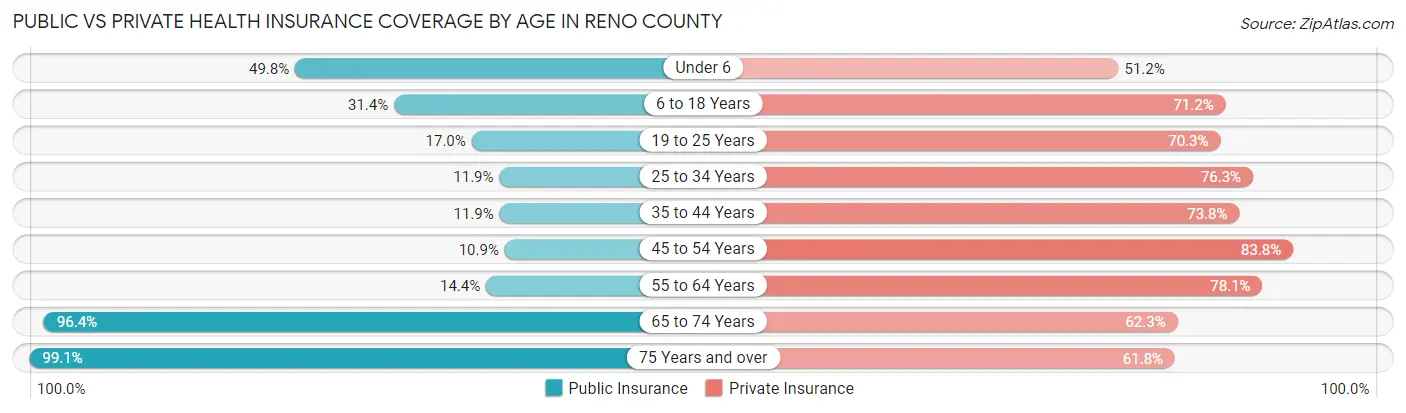
| Age Bracket | Public Insurance | Private Insurance |
| Under 6 | 2,084 (49.8%) | 2,142 (51.2%) |
| 6 to 18 Years | 3,279 (31.4%) | 7,431 (71.2%) |
| 19 to 25 Years | 861 (17.0%) | 3,551 (70.3%) |
| 25 to 34 Years | 712 (11.9%) | 4,573 (76.3%) |
| 35 to 44 Years | 846 (11.8%) | 5,266 (73.8%) |
| 45 to 54 Years | 716 (10.9%) | 5,513 (83.8%) |
| 55 to 64 Years | 1,170 (14.3%) | 6,367 (78.1%) |
| 65 to 74 Years | 6,600 (96.4%) | 4,265 (62.3%) |
| 75 Years and over | 4,944 (99.1%) | 3,084 (61.8%) |
| Total | 21,212 (35.7%) | 42,192 (71.1%) |
Disability Status by Sex by Age in Reno County
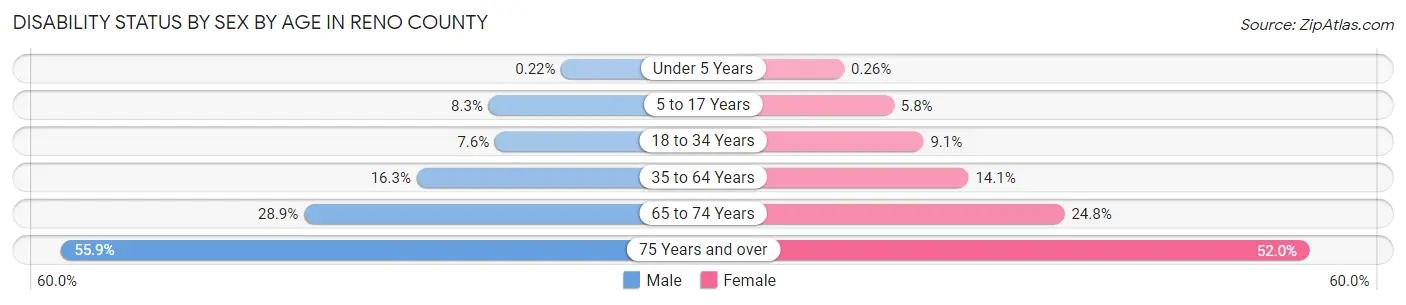
| Age Bracket | Male | Female |
| Under 5 Years | 4 (0.2%) | 4 (0.3%) |
| 5 to 17 Years | 434 (8.3%) | 299 (5.8%) |
| 18 to 34 Years | 462 (7.6%) | 531 (9.1%) |
| 35 to 64 Years | 1,759 (16.3%) | 1,567 (14.1%) |
| 65 to 74 Years | 936 (28.9%) | 894 (24.8%) |
| 75 Years and over | 1,102 (55.9%) | 1,570 (52.0%) |
Disability Class by Sex by Age in Reno County
Disability Class: Hearing Difficulty
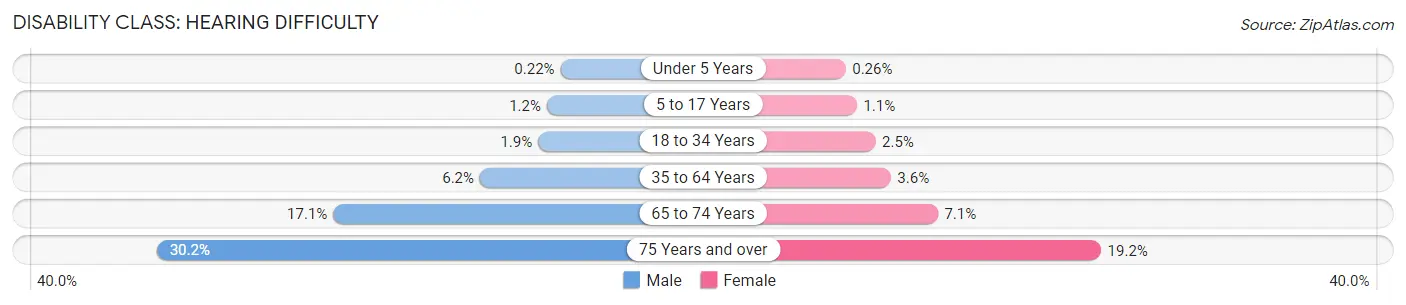
| Age Bracket | Male | Female |
| Under 5 Years | 4 (0.2%) | 4 (0.3%) |
| 5 to 17 Years | 64 (1.2%) | 56 (1.1%) |
| 18 to 34 Years | 114 (1.9%) | 144 (2.5%) |
| 35 to 64 Years | 668 (6.2%) | 401 (3.6%) |
| 65 to 74 Years | 554 (17.1%) | 256 (7.1%) |
| 75 Years and over | 595 (30.2%) | 580 (19.2%) |
Disability Class: Vision Difficulty
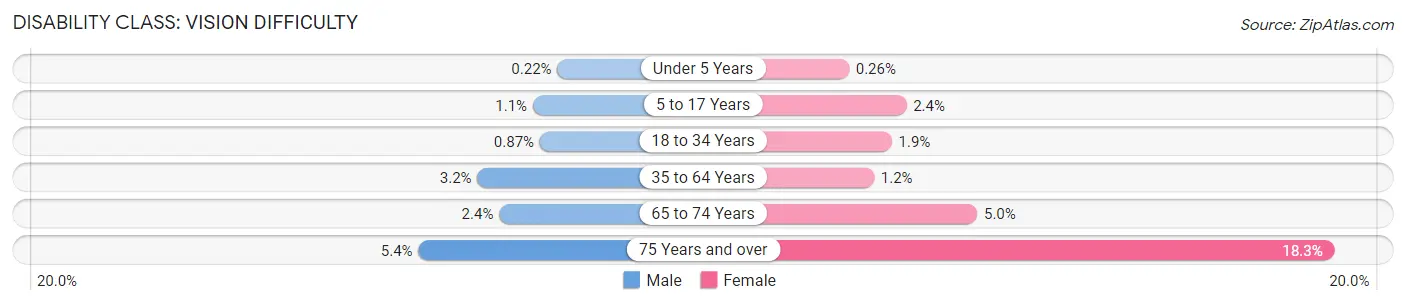
| Age Bracket | Male | Female |
| Under 5 Years | 4 (0.2%) | 4 (0.3%) |
| 5 to 17 Years | 59 (1.1%) | 123 (2.4%) |
| 18 to 34 Years | 53 (0.9%) | 108 (1.8%) |
| 35 to 64 Years | 344 (3.2%) | 132 (1.2%) |
| 65 to 74 Years | 77 (2.4%) | 181 (5.0%) |
| 75 Years and over | 106 (5.4%) | 552 (18.3%) |
Disability Class: Cognitive Difficulty
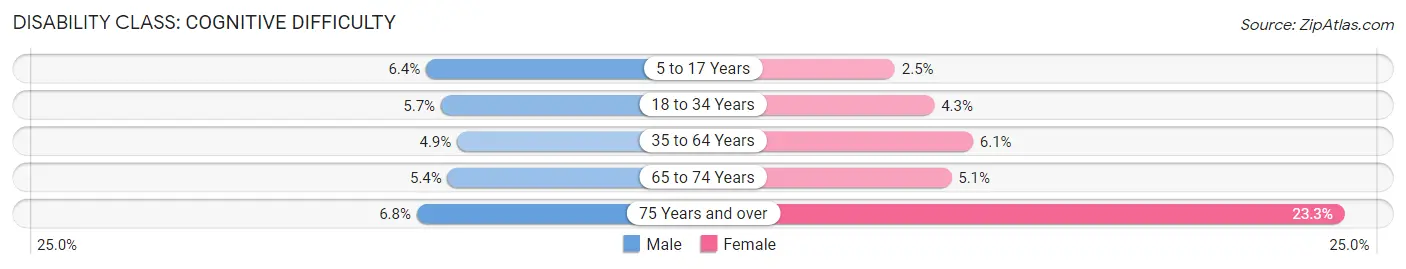
| Age Bracket | Male | Female |
| 5 to 17 Years | 333 (6.4%) | 127 (2.5%) |
| 18 to 34 Years | 345 (5.7%) | 250 (4.3%) |
| 35 to 64 Years | 531 (4.9%) | 675 (6.1%) |
| 65 to 74 Years | 174 (5.4%) | 183 (5.1%) |
| 75 Years and over | 134 (6.8%) | 704 (23.3%) |
Disability Class: Ambulatory Difficulty
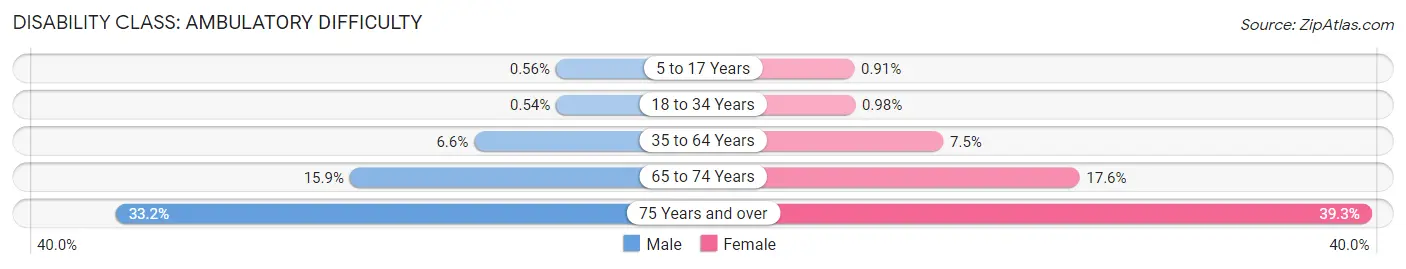
| Age Bracket | Male | Female |
| 5 to 17 Years | 29 (0.6%) | 47 (0.9%) |
| 18 to 34 Years | 33 (0.5%) | 57 (1.0%) |
| 35 to 64 Years | 714 (6.6%) | 835 (7.5%) |
| 65 to 74 Years | 514 (15.9%) | 636 (17.6%) |
| 75 Years and over | 655 (33.2%) | 1,187 (39.3%) |
Disability Class: Self-Care Difficulty
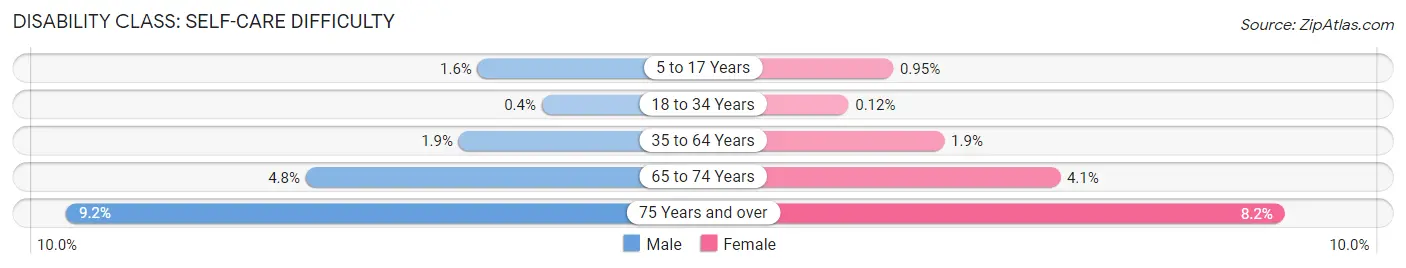
| Age Bracket | Male | Female |
| 5 to 17 Years | 83 (1.6%) | 49 (0.9%) |
| 18 to 34 Years | 24 (0.4%) | 7 (0.1%) |
| 35 to 64 Years | 209 (1.9%) | 211 (1.9%) |
| 65 to 74 Years | 155 (4.8%) | 146 (4.1%) |
| 75 Years and over | 182 (9.2%) | 248 (8.2%) |
Technology Access in Reno County
Computing Device Access in Reno County
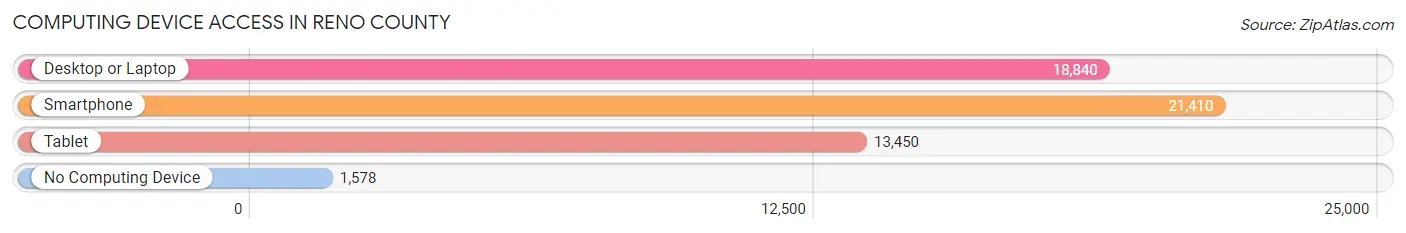
| Device Type | # Households | % Households |
| Desktop or Laptop | 18,840 | 74.9% |
| Smartphone | 21,410 | 85.1% |
| Tablet | 13,450 | 53.5% |
| No Computing Device | 1,578 | 6.3% |
| Total | 25,157 | 100.0% |
Internet Access in Reno County
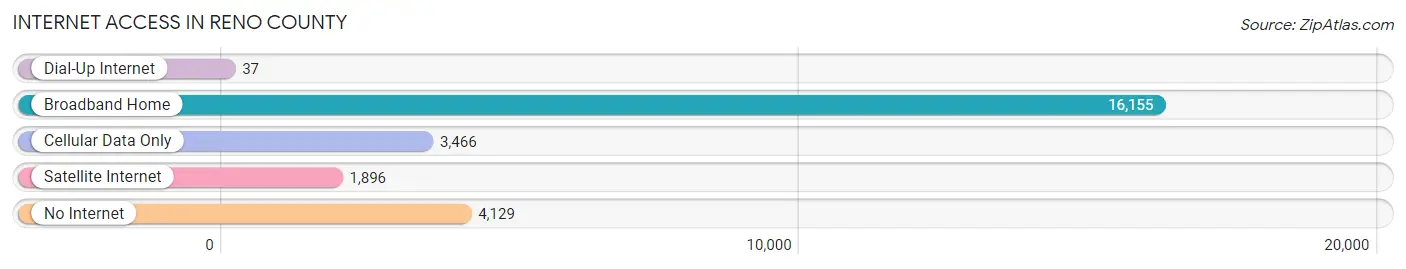
| Internet Type | # Households | % Households |
| Dial-Up Internet | 37 | 0.2% |
| Broadband Home | 16,155 | 64.2% |
| Cellular Data Only | 3,466 | 13.8% |
| Satellite Internet | 1,896 | 7.5% |
| No Internet | 4,129 | 16.4% |
| Total | 25,157 | 100.0% |
Reno County Summary
Reno County, Kansas is located in the south-central region of the state and is part of the Hutchinson Metropolitan Statistical Area. The county was established in 1873 and is named after Major General Jesse Lee Reno, a Union officer who was killed in the Civil War. Reno County is bordered by Rice County to the north, Stafford County to the east, Kingman County to the south, and Harvey and Sedgwick counties to the west. The county seat is Hutchinson, which is also the largest city in the county.
Geography
Reno County covers an area of 876 square miles and is located in the Great Plains region of the United States. The county is mostly flat with some rolling hills in the western part. The Arkansas River flows through the county from north to south, and there are several small lakes and ponds scattered throughout the county. The county is mostly covered in grassland, with some areas of cropland and woodlands. The average elevation is 1,400 feet above sea level.
Climate
Reno County has a humid continental climate, with hot summers and cold winters. The average annual temperature is 54°F, with an average high of 79°F in July and an average low of 28°F in January. The average annual precipitation is 28 inches, with most of it falling in the spring and summer months.
Demographics
As of the 2010 census, Reno County had a population of 64,511. The population was spread out with 24.3% under the age of 18, 8.2% from 18 to 24, 28.2% from 25 to 44, 24.2% from 45 to 64, and 15.1% who were 65 years of age or older. The median age was 37.4 years. The gender makeup of the county was 49.3% male and 50.7% female.
The racial makeup of the county was 87.2% White, 5.3% African American, 0.7% Native American, 1.3% Asian, 0.1% Pacific Islander, 3.2% from other races, and 2.2% from two or more races. Hispanic or Latino of any race were 8.2% of the population.
Economy
Reno County’s economy is largely based on agriculture, manufacturing, and services. The county’s major crops are wheat, corn, sorghum, and soybeans. The county is also home to several manufacturing companies, including Cargill, John Deere, and Tyson Foods. The county’s largest employers are Hutchinson Regional Medical Center, Hutchinson USD 308, and the City of Hutchinson.
The median household income in Reno County was $48,945 in 2018, and the median home value was $118,400. The unemployment rate was 3.2% in 2018.
Conclusion
Reno County is located in the south-central region of Kansas and is part of the Hutchinson Metropolitan Statistical Area. The county was established in 1873 and is named after Major General Jesse Lee Reno. Reno County covers an area of 876 square miles and has a humid continental climate. As of the 2010 census, the county had a population of 64,511. The county’s economy is largely based on agriculture, manufacturing, and services. The median household income in Reno County was $48,945 in 2018, and the median home value was $118,400.
Common Questions
What is the Total Population of Reno County?
Total Population of Reno County is 61,881.
What is the Total Male Population of Reno County?
Total Male Population of Reno County is 31,255.
What is the Total Female Population of Reno County?
Total Female Population of Reno County is 30,626.
What is the Ratio of Males per 100 Females in Reno County?
There are 102.05 Males per 100 Females in Reno County.
What is the Ratio of Females per 100 Males in Reno County?
There are 97.99 Females per 100 Males in Reno County.
What is the Median Population Age in Reno County?
Median Population Age in Reno County is 40.5 Years.
What is the Average Family Size in Reno County
Average Family Size in Reno County is 3.0 People.
What is the Average Household Size in Reno County
Average Household Size in Reno County is 2.3 People.
What is Per Capita Income in Reno County?
Per Capita income in Reno County is $31,695.
What is the Median Family Income in Reno County?
Median Family Income in Reno County is $74,490.
What is the Median Household income in Reno County?
Median Household Income in Reno County is $57,390.
What is Income or Wage Gap in Reno County?
Income or Wage Gap in Reno County is 34.1%.
Women in Reno County earn 65.9 cents for every dollar earned by a man.
What is Family Income Deficit in Reno County?
Family Income Deficit in Reno County is $9,321.
Families that are below poverty line in Reno County earn $9,321 less on average than the poverty threshold level.
What is Inequality or Gini Index in Reno County?
Inequality or Gini Index in Reno County is 0.44.
How Large is the Labor Force in Reno County?
There are 30,673 People in the Labor Forcein in Reno County.
What is the Percentage of People in the Labor Force in Reno County?
61.6% of People are in the Labor Force in Reno County.
What is the Unemployment Rate in Reno County?
Unemployment Rate in Reno County is 4.2%.