Pratt County, KS
Pratt County Map
Pratt County Overview
9,175
TOTAL POPULATION
4,607
MALE POPULATION
4,568
FEMALE POPULATION
100.85
MALES / 100 FEMALES
99.15
FEMALES / 100 MALES
37.6
MEDIAN AGE
3.1
AVG FAMILY SIZE
2.4
AVG HOUSEHOLD SIZE
$31,949
PER CAPITA INCOME
$79,076
AVG FAMILY INCOME
$61,685
AVG HOUSEHOLD INCOME
32.4%
WAGE / INCOME GAP [ % ]
67.6¢/ $1
WAGE / INCOME GAP [ $ ]
$8,171
FAMILY INCOME DEFICIT
0.44
INEQUALITY / GINI INDEX
4,443
LABOR FORCE [ PEOPLE ]
61.5%
PERCENT IN LABOR FORCE
3.6%
UNEMPLOYMENT RATE
Pratt County Area Codes
Race in Pratt County
The most populous races in Pratt County are White / Caucasian (8,257 | 90.0%), Hispanic or Latino (691 | 7.5%), and Two or more Races (559 | 6.1%).

| Race | # Population | % Population |
| Asian | 17 | 0.2% |
| Black / African American | 206 | 2.2% |
| Hawaiian / Pacific | 0 | 0.0% |
| Hispanic or Latino | 691 | 7.5% |
| Native / Alaskan | 97 | 1.1% |
| White / Caucasian | 8,257 | 90.0% |
| Two or more Races | 559 | 6.1% |
| Some other Race | 39 | 0.4% |
| Total | 9,175 | 100.0% |
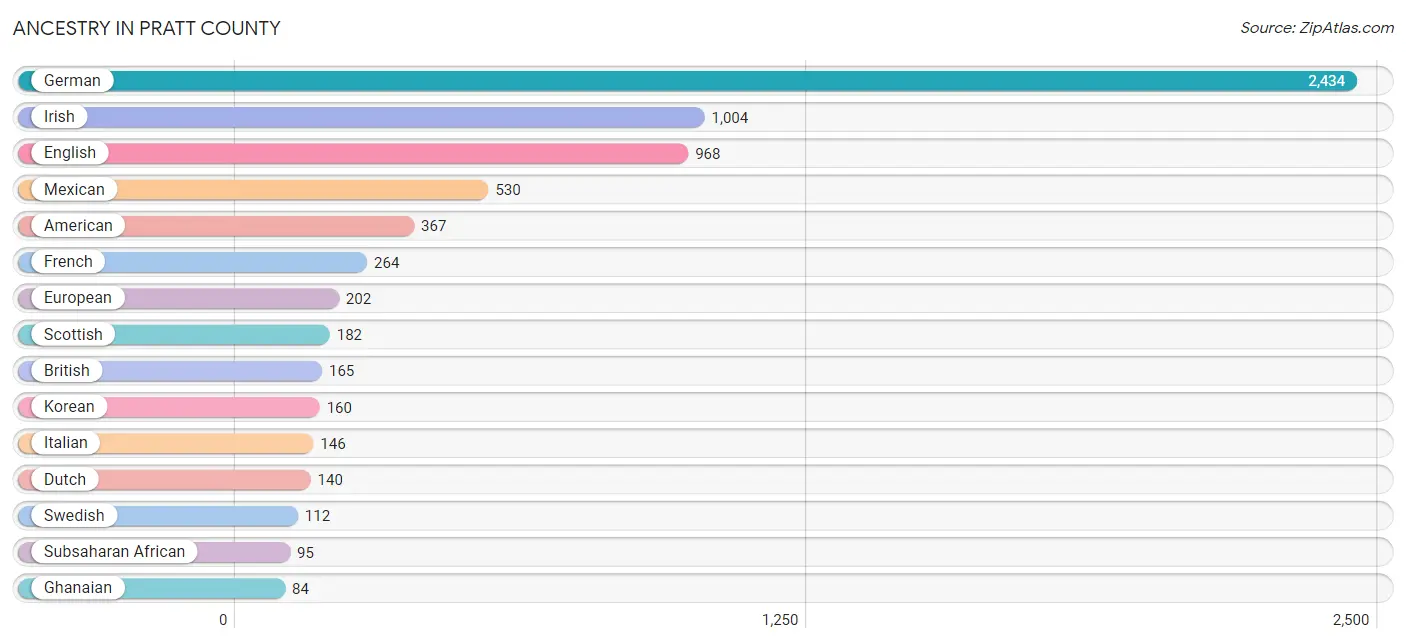
Ancestry in Pratt County
The most populous ancestries reported in Pratt County are German (2,434 | 26.5%), Irish (1,004 | 10.9%), English (968 | 10.5%), Mexican (530 | 5.8%), and American (367 | 4.0%), together accounting for 57.8% of all Pratt County residents.
| Ancestry | # Population | % Population |
| African | 1 | 0.0% |
| American | 367 | 4.0% |
| Apache | 1 | 0.0% |
| Australian | 1 | 0.0% |
| Austrian | 5 | 0.1% |
| Blackfeet | 1 | 0.0% |
| Brazilian | 7 | 0.1% |
| British | 165 | 1.8% |
| Cape Verdean | 10 | 0.1% |
| Central American | 83 | 0.9% |
| Cherokee | 41 | 0.4% |
| Chickasaw | 2 | 0.0% |
| Choctaw | 17 | 0.2% |
| Colombian | 1 | 0.0% |
| Comanche | 1 | 0.0% |
| Czech | 48 | 0.5% |
| Danish | 45 | 0.5% |
| Dutch | 140 | 1.5% |
| Eastern European | 9 | 0.1% |
| English | 968 | 10.5% |
| European | 202 | 2.2% |
| French | 264 | 2.9% |
| French Canadian | 3 | 0.0% |
| German | 2,434 | 26.5% |
| Ghanaian | 84 | 0.9% |
| Guatemalan | 23 | 0.3% |
| Honduran | 34 | 0.4% |
| Hungarian | 4 | 0.0% |
| Irish | 1,004 | 10.9% |
| Italian | 146 | 1.6% |
| Korean | 160 | 1.7% |
| Lithuanian | 11 | 0.1% |
| Mexican | 530 | 5.8% |
| Mexican American Indian | 81 | 0.9% |
| Native Hawaiian | 2 | 0.0% |
| Northern European | 17 | 0.2% |
| Norwegian | 20 | 0.2% |
| Osage | 5 | 0.1% |
| Pennsylvania German | 6 | 0.1% |
| Polish | 24 | 0.3% |
| Portuguese | 2 | 0.0% |
| Potawatomi | 10 | 0.1% |
| Russian | 17 | 0.2% |
| Salvadoran | 26 | 0.3% |
| Scandinavian | 7 | 0.1% |
| Scotch-Irish | 48 | 0.5% |
| Scottish | 182 | 2.0% |
| Sioux | 11 | 0.1% |
| Slovene | 1 | 0.0% |
| South American | 1 | 0.0% |
| Spanish | 56 | 0.6% |
| Sri Lankan | 30 | 0.3% |
| Subsaharan African | 95 | 1.0% |
| Swedish | 112 | 1.2% |
| Swiss | 27 | 0.3% |
| Welsh | 42 | 0.5% |
| Yup'ik | 1 | 0.0% | View All 57 Rows |
Immigrants in Pratt County
The most numerous immigrant groups reported in Pratt County came from Latin America (71 | 0.8%), Central America (64 | 0.7%), Mexico (38 | 0.4%), El Salvador (26 | 0.3%), and Europe (15 | 0.2%), together accounting for 2.3% of all Pratt County residents.

| Immigration Origin | # Population | % Population |
| Africa | 10 | 0.1% |
| Asia | 3 | 0.0% |
| Australia | 1 | 0.0% |
| Brazil | 7 | 0.1% |
| Central America | 64 | 0.7% |
| Eastern Europe | 9 | 0.1% |
| El Salvador | 26 | 0.3% |
| Europe | 15 | 0.2% |
| Germany | 6 | 0.1% |
| Latin America | 71 | 0.8% |
| Latvia | 9 | 0.1% |
| Mexico | 38 | 0.4% |
| Oceania | 1 | 0.0% |
| Philippines | 3 | 0.0% |
| South Africa | 10 | 0.1% |
| South America | 7 | 0.1% |
| South Eastern Asia | 3 | 0.0% |
| Western Europe | 6 | 0.1% | View All 18 Rows |
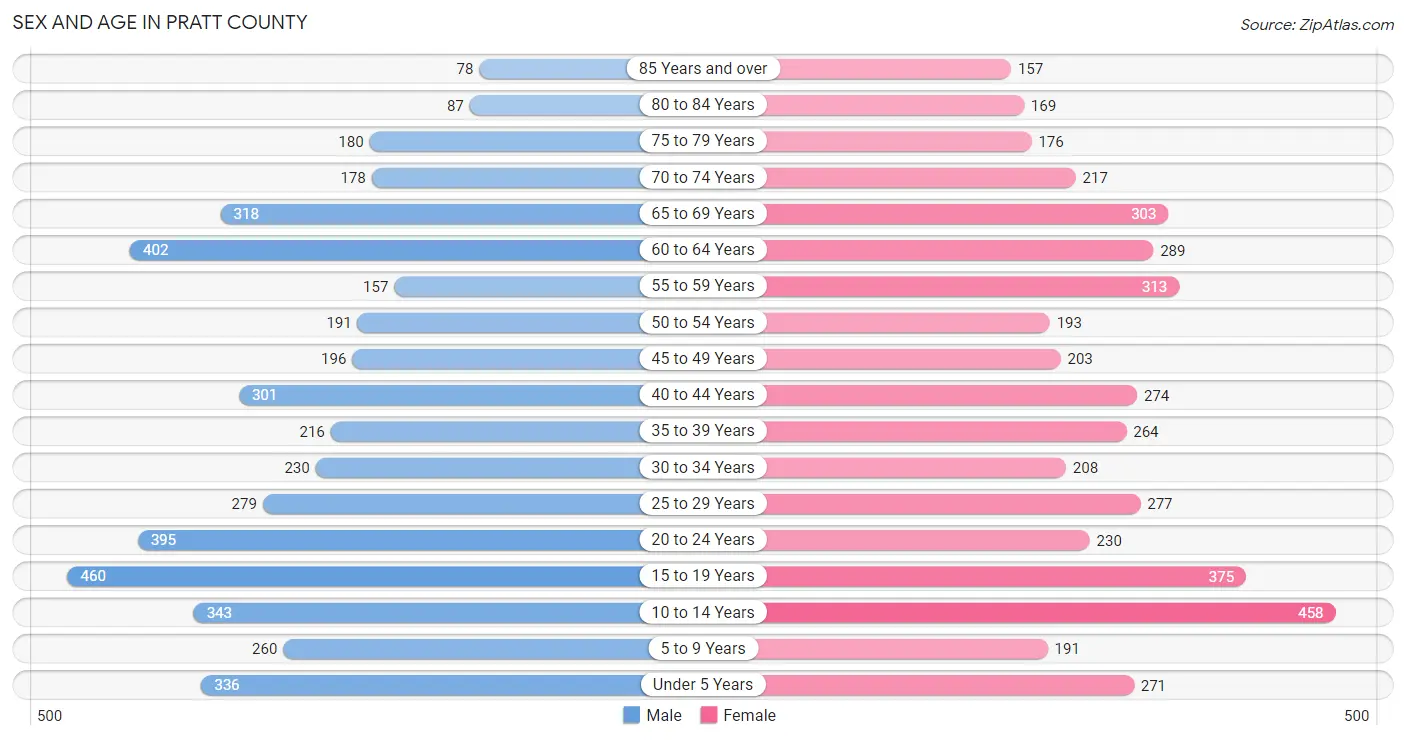
Sex and Age in Pratt County
Sex and Age in Pratt County
The most populous age groups in Pratt County are 15 to 19 Years (460 | 10.0%) for men and 10 to 14 Years (458 | 10.0%) for women.
| Age Bracket | Male | Female |
| Under 5 Years | 336 (7.3%) | 271 (5.9%) |
| 5 to 9 Years | 260 (5.6%) | 191 (4.2%) |
| 10 to 14 Years | 343 (7.4%) | 458 (10.0%) |
| 15 to 19 Years | 460 (10.0%) | 375 (8.2%) |
| 20 to 24 Years | 395 (8.6%) | 230 (5.0%) |
| 25 to 29 Years | 279 (6.1%) | 277 (6.1%) |
| 30 to 34 Years | 230 (5.0%) | 208 (4.5%) |
| 35 to 39 Years | 216 (4.7%) | 264 (5.8%) |
| 40 to 44 Years | 301 (6.5%) | 274 (6.0%) |
| 45 to 49 Years | 196 (4.3%) | 203 (4.4%) |
| 50 to 54 Years | 191 (4.2%) | 193 (4.2%) |
| 55 to 59 Years | 157 (3.4%) | 313 (6.9%) |
| 60 to 64 Years | 402 (8.7%) | 289 (6.3%) |
| 65 to 69 Years | 318 (6.9%) | 303 (6.6%) |
| 70 to 74 Years | 178 (3.9%) | 217 (4.8%) |
| 75 to 79 Years | 180 (3.9%) | 176 (3.8%) |
| 80 to 84 Years | 87 (1.9%) | 169 (3.7%) |
| 85 Years and over | 78 (1.7%) | 157 (3.4%) |
| Total | 4,607 (100.0%) | 4,568 (100.0%) |
Families and Households in Pratt County
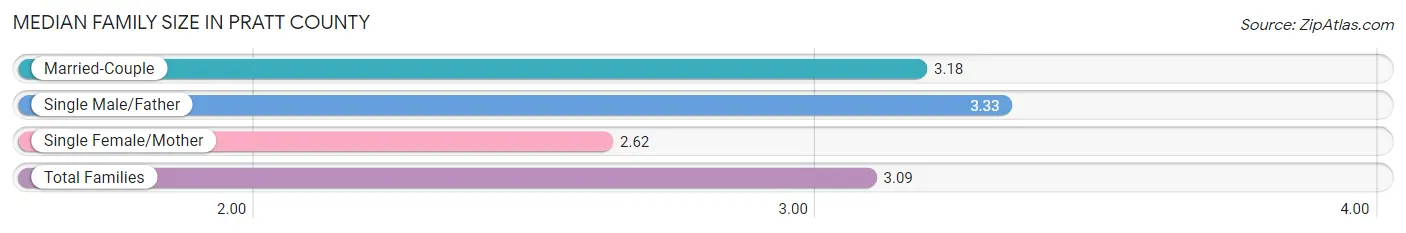
Median Family Size in Pratt County
The median family size in Pratt County is 3.09 persons per family, with single male/father families (197 | 9.2%) accounting for the largest median family size of 3.33 persons per family. On the other hand, single female/mother families (376 | 17.5%) represent the smallest median family size with 2.62 persons per family.
| Family Type | # Families | Family Size |
| Married-Couple | 1,576 (73.3%) | 3.18 |
| Single Male/Father | 197 (9.2%) | 3.33 |
| Single Female/Mother | 376 (17.5%) | 2.62 |
| Total Families | 2,149 (100.0%) | 3.09 |
Median Household Size in Pratt County
The median household size in Pratt County is 2.43 persons per household, with single male/father households (197 | 5.5%) accounting for the largest median household size of 4.04 persons per household. non-family households (1,431 | 40.0%) represent the smallest median household size with 1.23 persons per household.
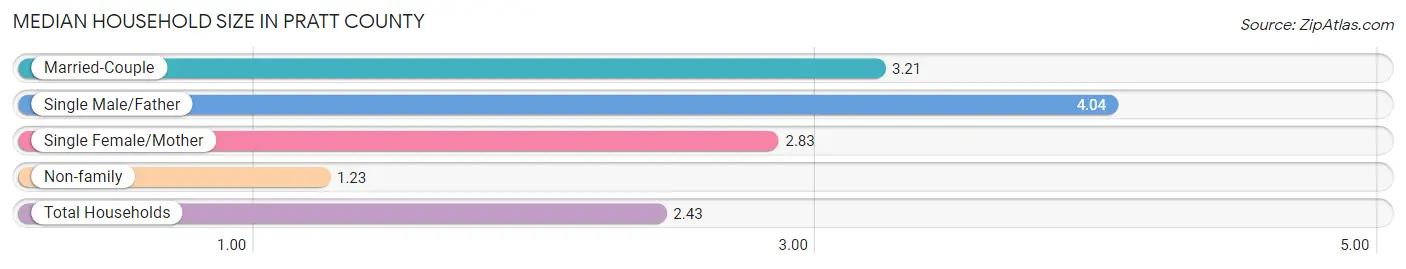
| Household Type | # Households | Household Size |
| Married-Couple | 1,576 (44.0%) | 3.21 |
| Single Male/Father | 197 (5.5%) | 4.04 |
| Single Female/Mother | 376 (10.5%) | 2.83 |
| Non-family | 1,431 (40.0%) | 1.23 |
| Total Households | 3,580 (100.0%) | 2.43 |
Household Size by Marriage Status in Pratt County
Out of a total of 3,580 households in Pratt County, 2,149 (60.0%) are family households, while 1,431 (40.0%) are nonfamily households. The most numerous type of family households are 2-person households, comprising 1,086, and the most common type of nonfamily households are 1-person households, comprising 1,190.

| Household Size | Family Households | Nonfamily Households |
| 1-Person Households | - | 1,190 (33.2%) |
| 2-Person Households | 1,086 (30.3%) | 232 (6.5%) |
| 3-Person Households | 422 (11.8%) | 9 (0.3%) |
| 4-Person Households | 391 (10.9%) | 0 (0.0%) |
| 5-Person Households | 158 (4.4%) | 0 (0.0%) |
| 6-Person Households | 33 (0.9%) | 0 (0.0%) |
| 7+ Person Households | 59 (1.7%) | 0 (0.0%) |
| Total | 2,149 (60.0%) | 1,431 (40.0%) |
Female Fertility in Pratt County
Fertility by Age in Pratt County
Average fertility rate in Pratt County is 33.0 births per 1,000 women. Women in the age bracket of 15 to 19 years have the highest fertility rate with 99.0 births per 1,000 women. Women in the age bracket of 15 to 19 years acount for 59.7% of all women with births.
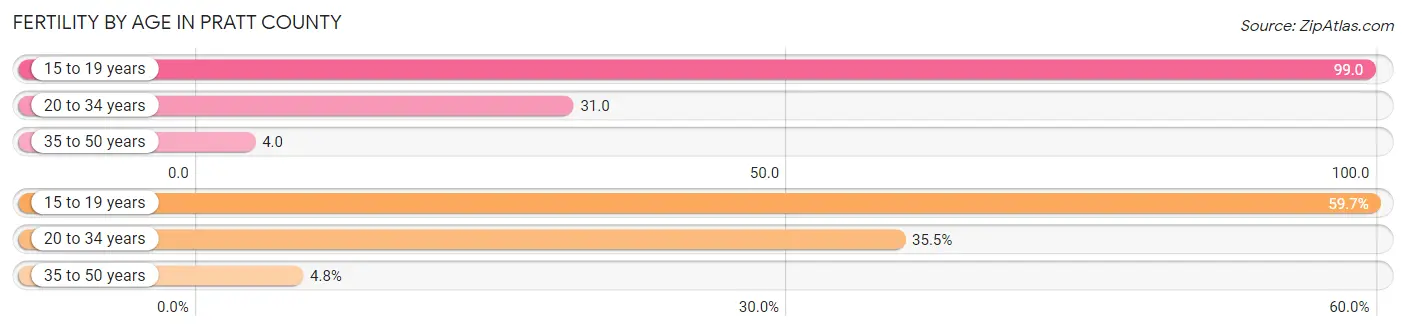
| Age Bracket | Women with Births | Births / 1,000 Women |
| 15 to 19 years | 37 (59.7%) | 99.0 |
| 20 to 34 years | 22 (35.5%) | 31.0 |
| 35 to 50 years | 3 (4.8%) | 4.0 |
| Total | 62 (100.0%) | 33.0 |
Fertility by Age by Marriage Status in Pratt County
40.3% of women with births (62) in Pratt County are married. The highest percentage of unmarried women with births falls into 15 to 19 years age bracket with 100.0% of them unmarried at the time of birth, while the lowest percentage of unmarried women with births belong to 20 to 34 years age bracket with 0.0% of them unmarried.
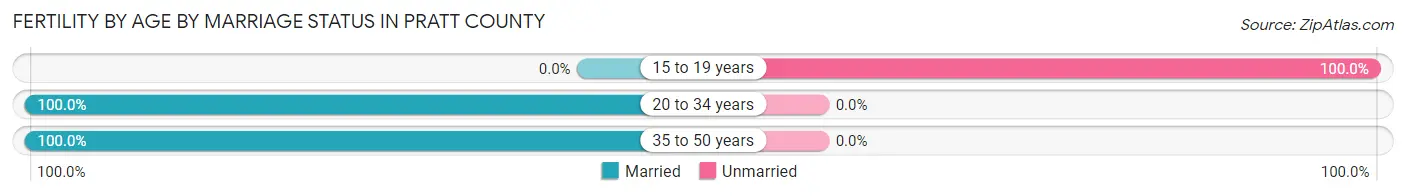
| Age Bracket | Married | Unmarried |
| 15 to 19 years | 0 (0.0%) | 37 (100.0%) |
| 20 to 34 years | 22 (100.0%) | 0 (0.0%) |
| 35 to 50 years | 3 (100.0%) | 0 (0.0%) |
| Total | 25 (40.3%) | 37 (59.7%) |
Fertility by Education in Pratt County

| Educational Attainment | Women with Births | Births / 1,000 Women |
| Less than High School | 1 (1.6%) | 3.0 |
| High School Diploma | 42 (67.7%) | 105.0 |
| College or Associate's Degree | 10 (16.1%) | 15.0 |
| Bachelor's Degree | 9 (14.5%) | 32.0 |
| Graduate Degree | 0 (0.0%) | 0.0 |
| Total | 62 (100.0%) | 33.0 |
Fertility by Education by Marriage Status in Pratt County
59.7% of women with births in Pratt County are unmarried. Women with the educational attainment of less than high school are most likely to be married with 100.0% of them married at childbirth, while women with the educational attainment of high school diploma are least likely to be married with 88.1% of them unmarried at childbirth.
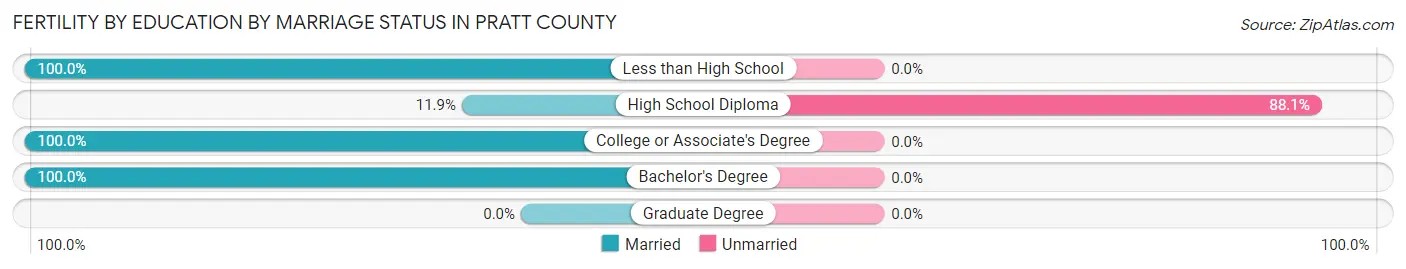
| Educational Attainment | Married | Unmarried |
| Less than High School | 1 (100.0%) | 0 (0.0%) |
| High School Diploma | 5 (11.9%) | 37 (88.1%) |
| College or Associate's Degree | 10 (100.0%) | 0 (0.0%) |
| Bachelor's Degree | 9 (100.0%) | 0 (0.0%) |
| Graduate Degree | 0 (0.0%) | 0 (0.0%) |
| Total | 25 (40.3%) | 37 (59.7%) |
Income in Pratt County
Income Overview in Pratt County
Per Capita Income in Pratt County is $31,949, while median incomes of families and households are $79,076 and $61,685 respectively.
| Characteristic | Number | Measure |
| Per Capita Income | 9,175 | $31,949 |
| Median Family Income | 2,149 | $79,076 |
| Mean Family Income | 2,149 | $102,054 |
| Median Household Income | 3,580 | $61,685 |
| Mean Household Income | 3,580 | $79,910 |
| Income Deficit | 2,149 | $8,171 |
| Wage / Income Gap (%) | 9,175 | 32.38% |
| Wage / Income Gap ($) | 9,175 | 67.62¢ per $1 |
| Gini / Inequality Index | 9,175 | 0.44 |
Earnings by Sex in Pratt County
Average Earnings in Pratt County are $30,399, $36,675 for men and $24,799 for women, a difference of 32.4%.
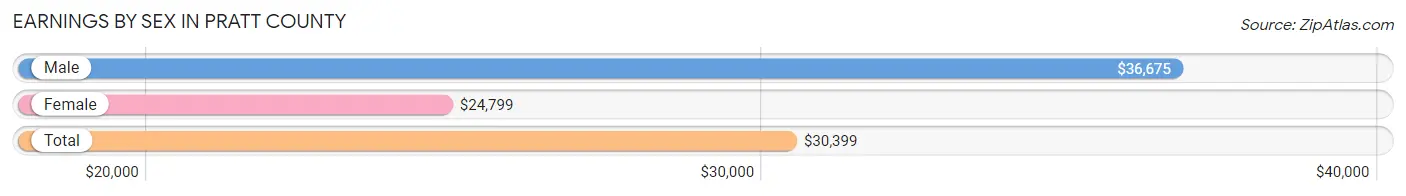
| Sex | Number | Average Earnings |
| Male | 2,719 (55.1%) | $36,675 |
| Female | 2,213 (44.9%) | $24,799 |
| Total | 4,932 (100.0%) | $30,399 |
Earnings by Sex by Income Bracket in Pratt County
The most common earnings brackets in Pratt County are $55,000 to $64,999 for men (289 | 10.6%) and $2,500 to $4,999 for women (207 | 9.3%).
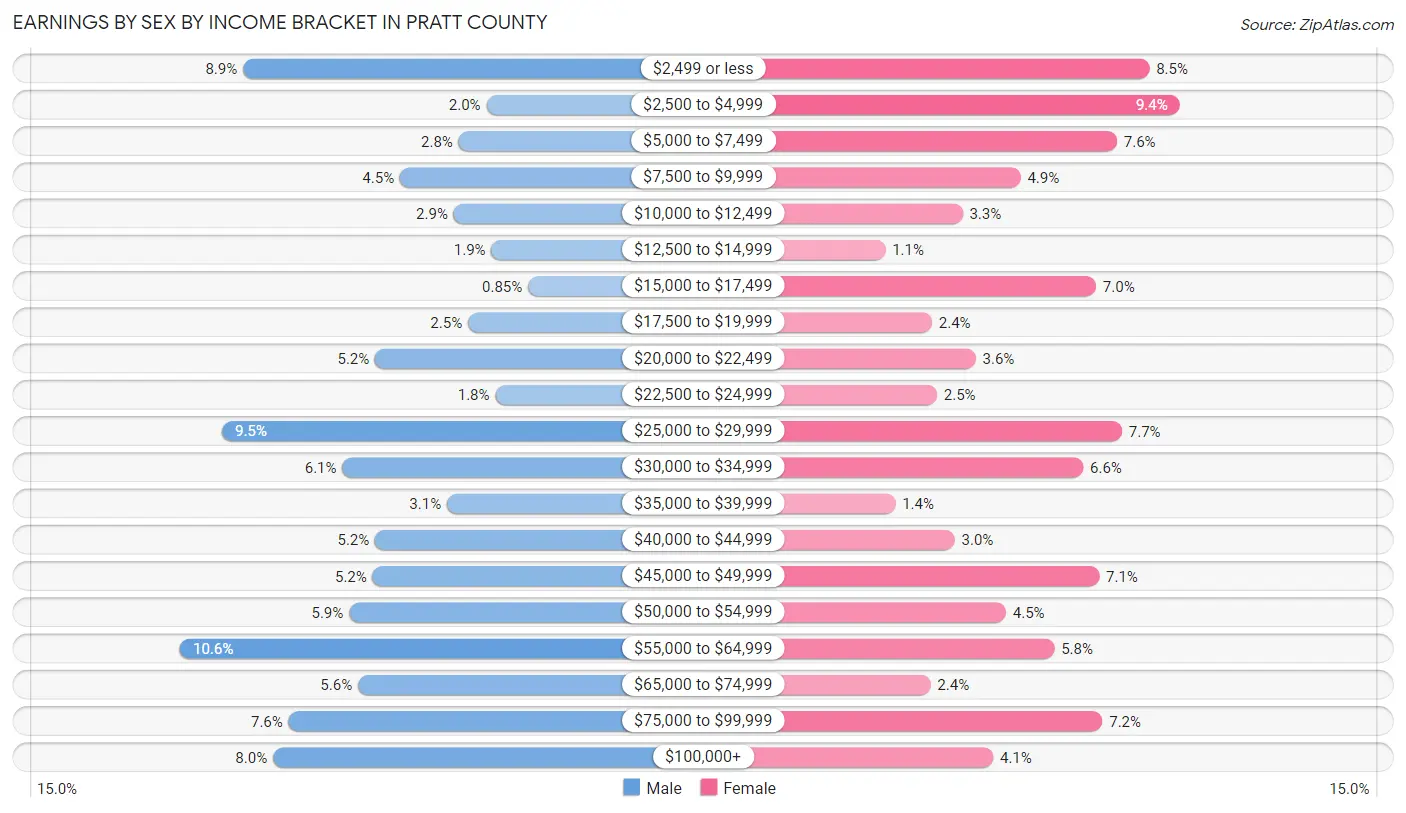
| Income | Male | Female |
| $2,499 or less | 241 (8.9%) | 188 (8.5%) |
| $2,500 to $4,999 | 55 (2.0%) | 207 (9.3%) |
| $5,000 to $7,499 | 76 (2.8%) | 168 (7.6%) |
| $7,500 to $9,999 | 121 (4.4%) | 108 (4.9%) |
| $10,000 to $12,499 | 80 (2.9%) | 72 (3.3%) |
| $12,500 to $14,999 | 51 (1.9%) | 24 (1.1%) |
| $15,000 to $17,499 | 23 (0.9%) | 155 (7.0%) |
| $17,500 to $19,999 | 69 (2.5%) | 53 (2.4%) |
| $20,000 to $22,499 | 140 (5.1%) | 80 (3.6%) |
| $22,500 to $24,999 | 48 (1.8%) | 56 (2.5%) |
| $25,000 to $29,999 | 257 (9.5%) | 171 (7.7%) |
| $30,000 to $34,999 | 165 (6.1%) | 147 (6.6%) |
| $35,000 to $39,999 | 85 (3.1%) | 30 (1.4%) |
| $40,000 to $44,999 | 140 (5.1%) | 67 (3.0%) |
| $45,000 to $49,999 | 142 (5.2%) | 157 (7.1%) |
| $50,000 to $54,999 | 160 (5.9%) | 99 (4.5%) |
| $55,000 to $64,999 | 289 (10.6%) | 129 (5.8%) |
| $65,000 to $74,999 | 153 (5.6%) | 52 (2.4%) |
| $75,000 to $99,999 | 206 (7.6%) | 159 (7.2%) |
| $100,000+ | 218 (8.0%) | 91 (4.1%) |
| Total | 2,719 (100.0%) | 2,213 (100.0%) |
Earnings by Sex by Educational Attainment in Pratt County
Average earnings in Pratt County are $47,373 for men and $31,162 for women, a difference of 34.2%. Men with an educational attainment of bachelor's degree enjoy the highest average annual earnings of $59,911, while those with high school diploma education earn the least with $37,778. Women with an educational attainment of graduate degree earn the most with the average annual earnings of $64,861, while those with high school diploma education have the smallest earnings of $18,643.

| Educational Attainment | Male Income | Female Income |
| Less than High School | $46,053 | $0 |
| High School Diploma | $37,778 | $18,643 |
| College or Associate's Degree | $50,216 | $29,107 |
| Bachelor's Degree | $59,911 | $43,500 |
| Graduate Degree | $59,408 | $64,861 |
| Total | $47,373 | $31,162 |
Family Income in Pratt County
Family Income Brackets in Pratt County
According to the Pratt County family income data, there are 466 families falling into the $100,000 to $149,999 income range, which is the most common income bracket and makes up 21.7% of all families. Conversely, the less than $10,000 income bracket is the least frequent group with only 32 families (1.5%) belonging to this category.

| Income Bracket | # Families | % Families |
| Less than $10,000 | 32 | 1.5% |
| $10,000 to $14,999 | 73 | 3.4% |
| $15,000 to $24,999 | 86 | 4.0% |
| $25,000 to $34,999 | 144 | 6.7% |
| $35,000 to $49,999 | 226 | 10.5% |
| $50,000 to $74,999 | 432 | 20.1% |
| $75,000 to $99,999 | 370 | 17.2% |
| $100,000 to $149,999 | 466 | 21.7% |
| $150,000 to $199,999 | 118 | 5.5% |
| $200,000+ | 202 | 9.4% |
Family Income by Famaliy Size in Pratt County
6-person families (22 | 1.0%) account for the highest median family income in Pratt County with $143,750 per family, while 2-person families (1,166 | 54.3%) have the highest median income of $38,084 per family member.
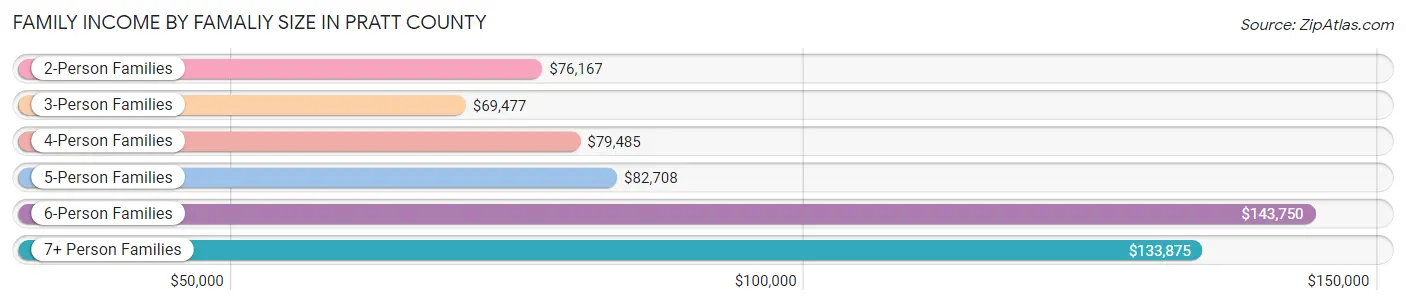
| Income Bracket | # Families | Median Income |
| 2-Person Families | 1,166 (54.3%) | $76,167 |
| 3-Person Families | 404 (18.8%) | $69,477 |
| 4-Person Families | 361 (16.8%) | $79,485 |
| 5-Person Families | 137 (6.4%) | $82,708 |
| 6-Person Families | 22 (1.0%) | $143,750 |
| 7+ Person Families | 59 (2.8%) | $133,875 |
| Total | 2,149 (100.0%) | $79,076 |
Family Income by Number of Earners in Pratt County
The median family income in Pratt County is $79,076, with families comprising 3+ earners (201) having the highest median family income of $124,732, while families with no earners (396) have the lowest median family income of $49,375, accounting for 9.3% and 18.4% of families, respectively.

| Number of Earners | # Families | Median Income |
| No Earners | 396 (18.4%) | $49,375 |
| 1 Earner | 616 (28.7%) | $55,000 |
| 2 Earners | 936 (43.6%) | $101,477 |
| 3+ Earners | 201 (9.3%) | $124,732 |
| Total | 2,149 (100.0%) | $79,076 |
Household Income in Pratt County
Household Income Brackets in Pratt County
With 813 households falling in the category, the $50,000 to $74,999 income range is the most frequent in Pratt County, accounting for 22.7% of all households. In contrast, only 125 households (3.5%) fall into the $150,000 to $199,999 income bracket, making it the least populous group.
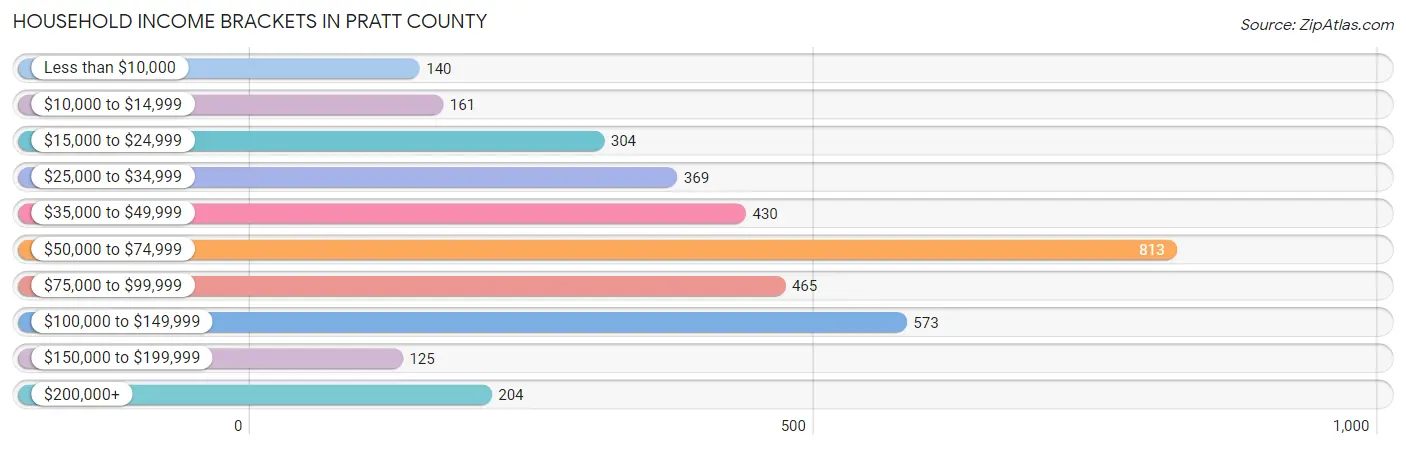
| Income Bracket | # Households | % Households |
| Less than $10,000 | 140 | 3.9% |
| $10,000 to $14,999 | 161 | 4.5% |
| $15,000 to $24,999 | 304 | 8.5% |
| $25,000 to $34,999 | 369 | 10.3% |
| $35,000 to $49,999 | 430 | 12.0% |
| $50,000 to $74,999 | 813 | 22.7% |
| $75,000 to $99,999 | 465 | 13.0% |
| $100,000 to $149,999 | 573 | 16.0% |
| $150,000 to $199,999 | 125 | 3.5% |
| $200,000+ | 204 | 5.7% |
Household Income by Householder Age in Pratt County
The median household income in Pratt County is $61,685, with the highest median household income of $74,336 found in the 25 to 44 years age bracket for the primary householder. A total of 1,041 households (29.1%) fall into this category. Meanwhile, the 15 to 24 years age bracket for the primary householder has the lowest median household income of $51,932, with 302 households (8.4%) in this group.
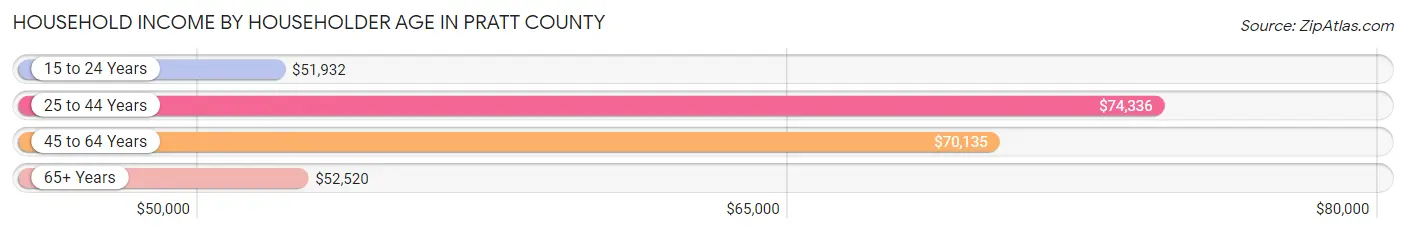
| Income Bracket | # Households | Median Income |
| 15 to 24 Years | 302 (8.4%) | $51,932 |
| 25 to 44 Years | 1,041 (29.1%) | $74,336 |
| 45 to 64 Years | 1,066 (29.8%) | $70,135 |
| 65+ Years | 1,171 (32.7%) | $52,520 |
| Total | 3,580 (100.0%) | $61,685 |
Poverty in Pratt County
Income Below Poverty by Sex and Age in Pratt County
With 9.5% poverty level for males and 13.8% for females among the residents of Pratt County, 5 year old males and 5 year old females are the most vulnerable to poverty, with 26 males (89.7%) and 33 females (53.2%) in their respective age groups living below the poverty level.
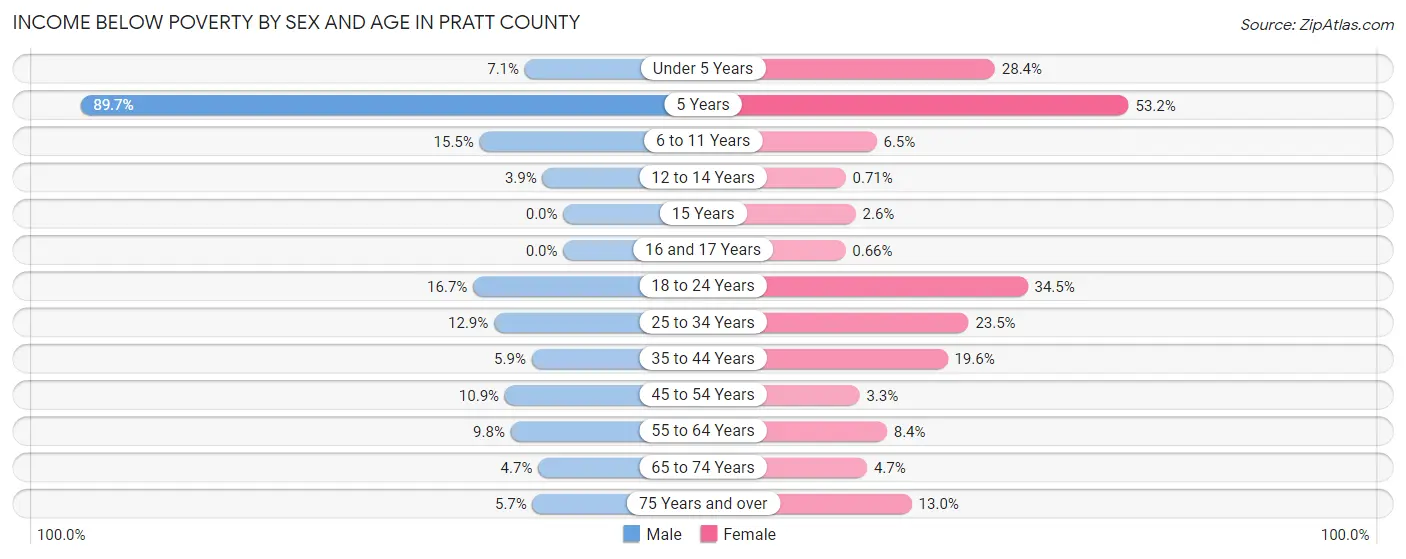
| Age Bracket | Male | Female |
| Under 5 Years | 24 (7.1%) | 77 (28.4%) |
| 5 Years | 26 (89.7%) | 33 (53.2%) |
| 6 to 11 Years | 53 (15.5%) | 16 (6.5%) |
| 12 to 14 Years | 9 (3.9%) | 2 (0.7%) |
| 15 Years | 0 (0.0%) | 1 (2.6%) |
| 16 and 17 Years | 0 (0.0%) | 1 (0.7%) |
| 18 to 24 Years | 72 (16.7%) | 100 (34.5%) |
| 25 to 34 Years | 64 (12.9%) | 114 (23.5%) |
| 35 to 44 Years | 29 (5.9%) | 104 (19.6%) |
| 45 to 54 Years | 42 (10.8%) | 13 (3.3%) |
| 55 to 64 Years | 52 (9.8%) | 49 (8.4%) |
| 65 to 74 Years | 23 (4.7%) | 24 (4.7%) |
| 75 Years and over | 18 (5.7%) | 59 (13.0%) |
| Total | 412 (9.5%) | 593 (13.8%) |
Income Above Poverty by Sex and Age in Pratt County
According to the poverty statistics in Pratt County, males aged 15 years and females aged 16 and 17 years are the age groups that are most secure financially, with 100.0% of males and 99.3% of females in these age groups living above the poverty line.
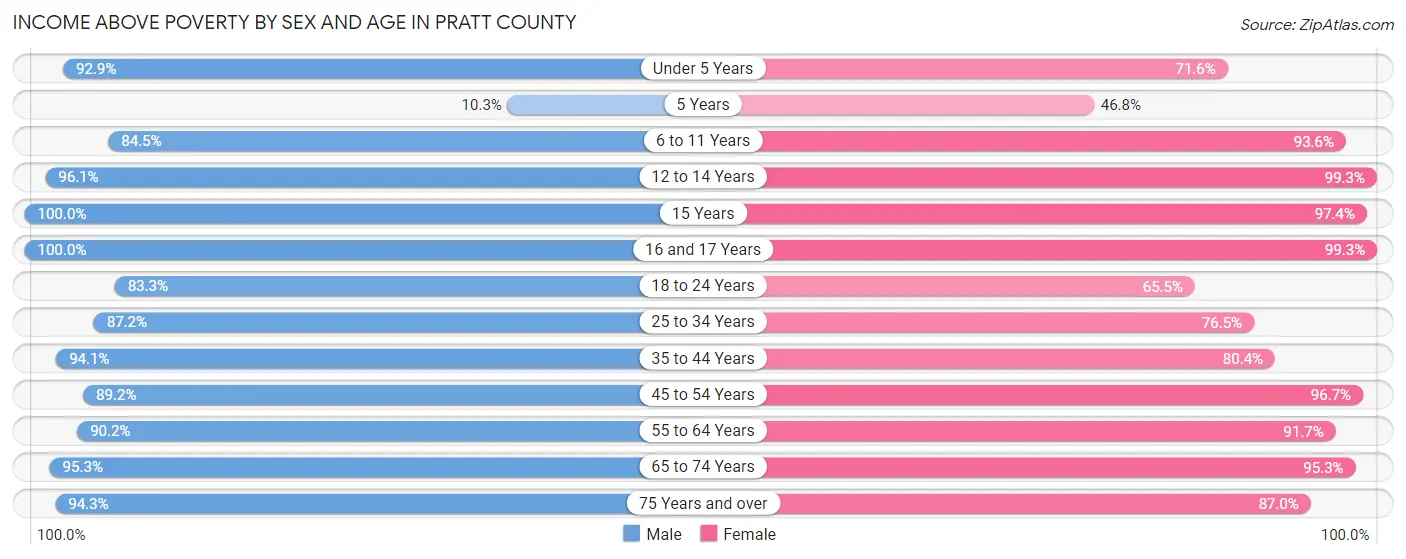
| Age Bracket | Male | Female |
| Under 5 Years | 312 (92.9%) | 194 (71.6%) |
| 5 Years | 3 (10.3%) | 29 (46.8%) |
| 6 to 11 Years | 288 (84.5%) | 232 (93.5%) |
| 12 to 14 Years | 224 (96.1%) | 280 (99.3%) |
| 15 Years | 52 (100.0%) | 38 (97.4%) |
| 16 and 17 Years | 205 (100.0%) | 151 (99.3%) |
| 18 to 24 Years | 358 (83.3%) | 190 (65.5%) |
| 25 to 34 Years | 434 (87.2%) | 371 (76.5%) |
| 35 to 44 Years | 465 (94.1%) | 426 (80.4%) |
| 45 to 54 Years | 345 (89.1%) | 383 (96.7%) |
| 55 to 64 Years | 480 (90.2%) | 538 (91.6%) |
| 65 to 74 Years | 471 (95.3%) | 490 (95.3%) |
| 75 Years and over | 298 (94.3%) | 396 (87.0%) |
| Total | 3,935 (90.5%) | 3,718 (86.2%) |
Income Below Poverty Among Married-Couple Families in Pratt County
The poverty statistics for married-couple families in Pratt County show that 4.4% or 69 of the total 1,576 families live below the poverty line. Families with 3 or 4 children have the highest poverty rate of 7.3%, comprising of 11 families. On the other hand, families with 5 or more children have the lowest poverty rate of 0.0%, which includes 0 families.
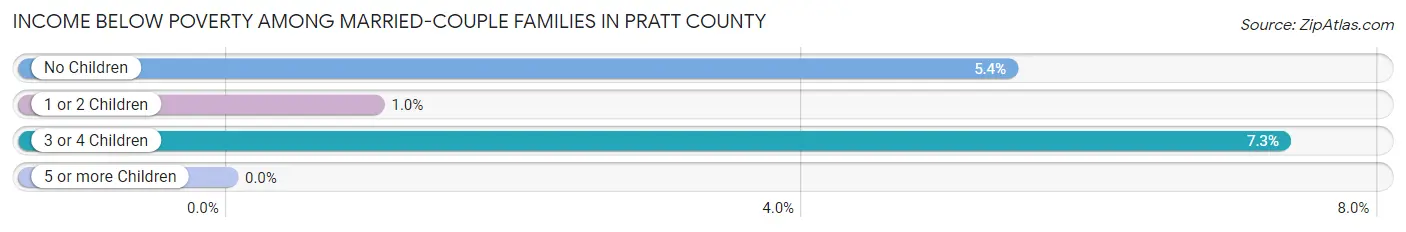
| Children | Above Poverty | Below Poverty |
| No Children | 940 (94.6%) | 54 (5.4%) |
| 1 or 2 Children | 387 (99.0%) | 4 (1.0%) |
| 3 or 4 Children | 139 (92.7%) | 11 (7.3%) |
| 5 or more Children | 41 (100.0%) | 0 (0.0%) |
| Total | 1,507 (95.6%) | 69 (4.4%) |
Income Below Poverty Among Single-Parent Households in Pratt County
According to the poverty data in Pratt County, 6.6% or 13 single-father households and 28.5% or 107 single-mother households are living below the poverty line. Among single-father households, those with no children have the highest poverty rate, with 12 households (38.7%) experiencing poverty. Likewise, among single-mother households, those with 3 or 4 children have the highest poverty rate, with 36 households (67.9%) falling below the poverty line.
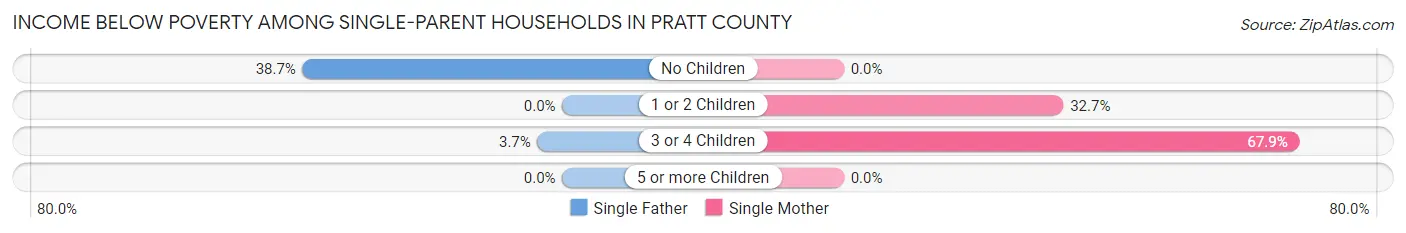
| Children | Single Father | Single Mother |
| No Children | 12 (38.7%) | 0 (0.0%) |
| 1 or 2 Children | 0 (0.0%) | 71 (32.7%) |
| 3 or 4 Children | 1 (3.7%) | 36 (67.9%) |
| 5 or more Children | 0 (0.0%) | 0 (0.0%) |
| Total | 13 (6.6%) | 107 (28.5%) |
Income Below Poverty Among Married-Couple vs Single-Parent Households in Pratt County
The poverty data for Pratt County shows that 69 of the married-couple family households (4.4%) and 120 of the single-parent households (20.9%) are living below the poverty level. Within the married-couple family households, those with 3 or 4 children have the highest poverty rate, with 11 households (7.3%) falling below the poverty line. Among the single-parent households, those with 3 or 4 children have the highest poverty rate, with 37 household (46.3%) living below poverty.
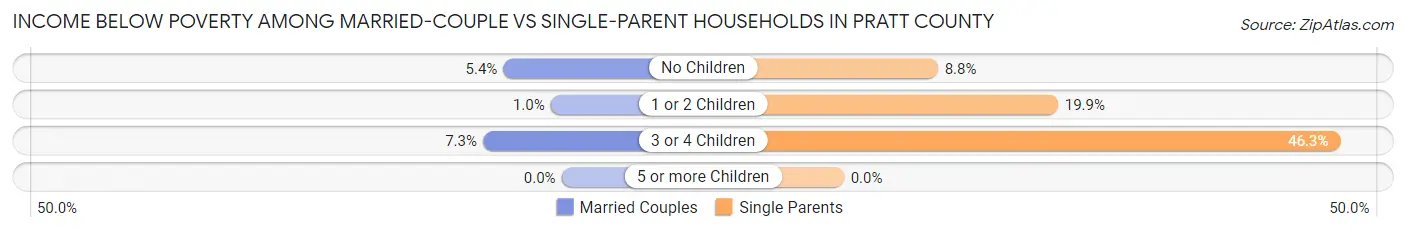
| Children | Married-Couple Families | Single-Parent Households |
| No Children | 54 (5.4%) | 12 (8.8%) |
| 1 or 2 Children | 4 (1.0%) | 71 (19.9%) |
| 3 or 4 Children | 11 (7.3%) | 37 (46.3%) |
| 5 or more Children | 0 (0.0%) | 0 (0.0%) |
| Total | 69 (4.4%) | 120 (20.9%) |
Employment Characteristics in Pratt County
Employment by Class of Employer in Pratt County
Among the 4,180 employed individuals in Pratt County, private company employees (2,741 | 65.6%), local government employees (416 | 10.0%), and not-for-profit organizations (316 | 7.6%) make up the most common classes of employment.

| Employer Class | # Employees | % Employees |
| Private Company Employees | 2,741 | 65.6% |
| Self-Employed (Incorporated) | 77 | 1.8% |
| Self-Employed (Not Incorporated) | 281 | 6.7% |
| Not-for-profit Organizations | 316 | 7.6% |
| Local Government Employees | 416 | 10.0% |
| State Government Employees | 230 | 5.5% |
| Federal Government Employees | 119 | 2.9% |
| Unpaid Family Workers | 0 | 0.0% |
| Total | 4,180 | 100.0% |
Employment Status by Age in Pratt County
According to the labor force statistics for Pratt County, out of the total population over 16 years of age (7,225), 61.5% or 4,443 individuals are in the labor force, with 3.6% or 160 of them unemployed. The age group with the highest labor force participation rate is 30 to 34 years, with 94.1% or 412 individuals in the labor force. Within the labor force, the 35 to 44 years age range has the highest percentage of unemployed individuals, with 6.9% or 57 of them being unemployed.
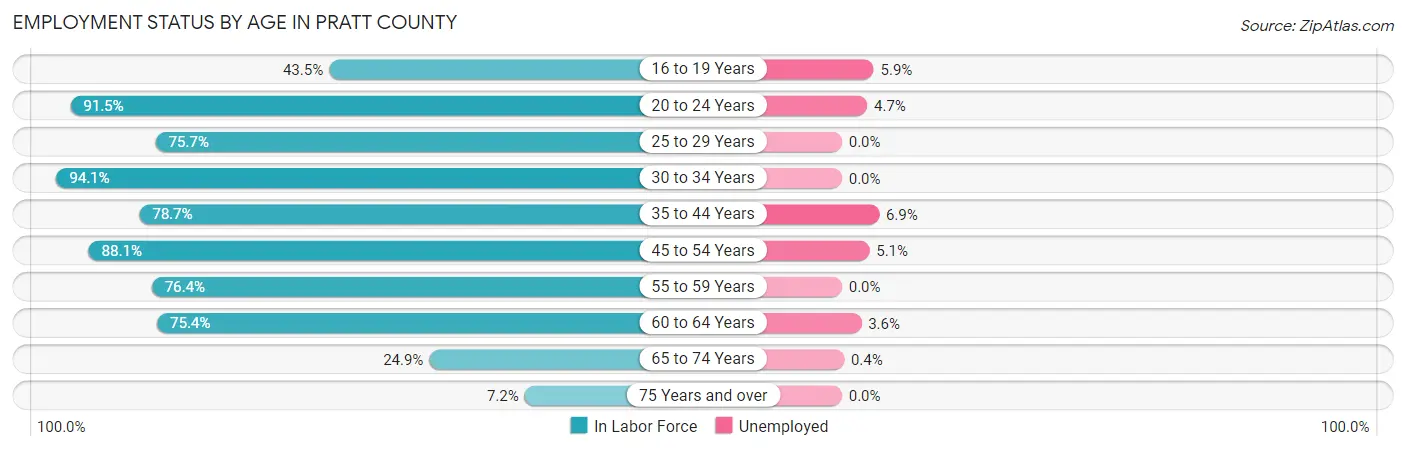
| Age Bracket | In Labor Force | Unemployed |
| 16 to 19 Years | 324 (43.5%) | 19 (5.9%) |
| 20 to 24 Years | 572 (91.5%) | 27 (4.7%) |
| 25 to 29 Years | 421 (75.7%) | 0 (0.0%) |
| 30 to 34 Years | 412 (94.1%) | 0 (0.0%) |
| 35 to 44 Years | 830 (78.7%) | 57 (6.9%) |
| 45 to 54 Years | 690 (88.1%) | 35 (5.1%) |
| 55 to 59 Years | 359 (76.4%) | 0 (0.0%) |
| 60 to 64 Years | 521 (75.4%) | 19 (3.6%) |
| 65 to 74 Years | 253 (24.9%) | 1 (0.4%) |
| 75 Years and over | 61 (7.2%) | 0 (0.0%) |
| Total | 4,443 (61.5%) | 160 (3.6%) |
Employment Status by Educational Attainment in Pratt County
According to labor force statistics for Pratt County, 81.0% of individuals (3,234) out of the total population between 25 and 64 years of age (3,993) are in the labor force, with 3.4% or 110 of them being unemployed. The group with the highest labor force participation rate are those with the educational attainment of bachelor's degree or higher, with 88.7% or 923 individuals in the labor force. Within the labor force, individuals with college / associate degree education have the highest percentage of unemployment, with 5.8% or 72 of them being unemployed.

| Educational Attainment | In Labor Force | Unemployed |
| Less than High School | 250 (78.4%) | 9 (2.8%) |
| High School Diploma | 827 (71.5%) | 29 (2.5%) |
| College / Associate Degree | 1,233 (83.5%) | 86 (5.8%) |
| Bachelor's Degree or higher | 923 (88.7%) | 14 (1.3%) |
| Total | 3,234 (81.0%) | 136 (3.4%) |
Employment Occupations by Sex in Pratt County
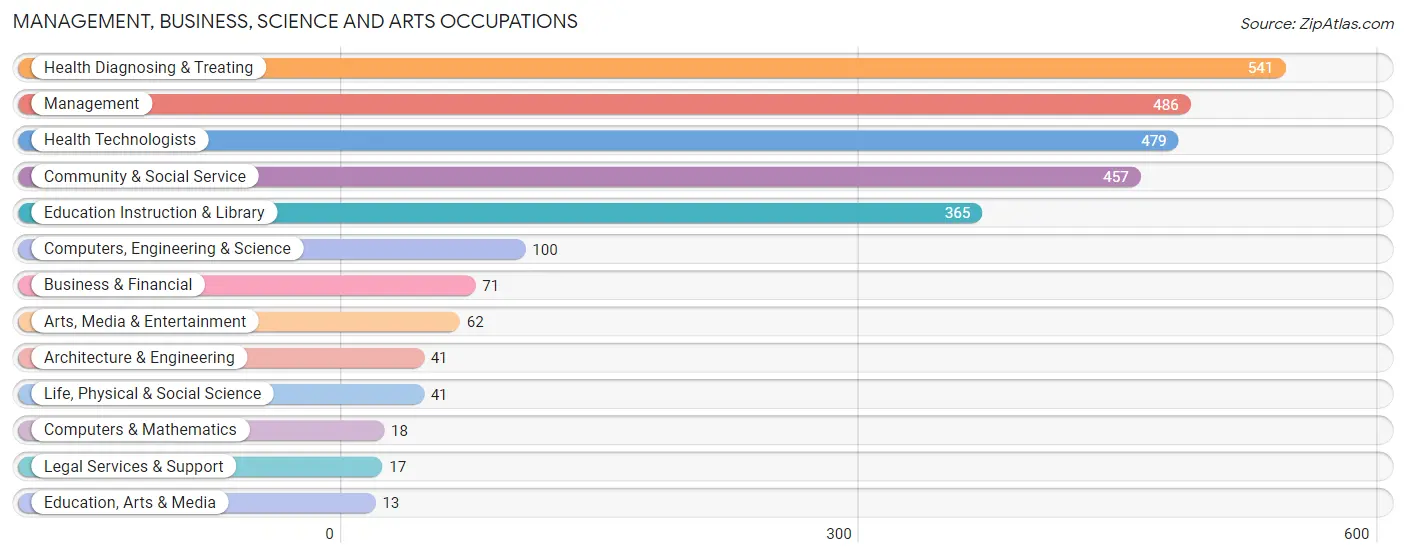
Management, Business, Science and Arts Occupations
The most common Management, Business, Science and Arts occupations in Pratt County are Health Diagnosing & Treating (541 | 12.6%), Management (486 | 11.4%), Health Technologists (479 | 11.2%), Community & Social Service (457 | 10.7%), and Education Instruction & Library (365 | 8.5%).
Management, Business, Science and Arts Occupations by Sex
Within the Management, Business, Science and Arts occupations in Pratt County, the most male-oriented occupations are Computers & Mathematics (100.0%), Life, Physical & Social Science (90.2%), and Computers, Engineering & Science (89.0%), while the most female-oriented occupations are Education Instruction & Library (87.9%), Community & Social Service (82.1%), and Business & Financial (73.2%).
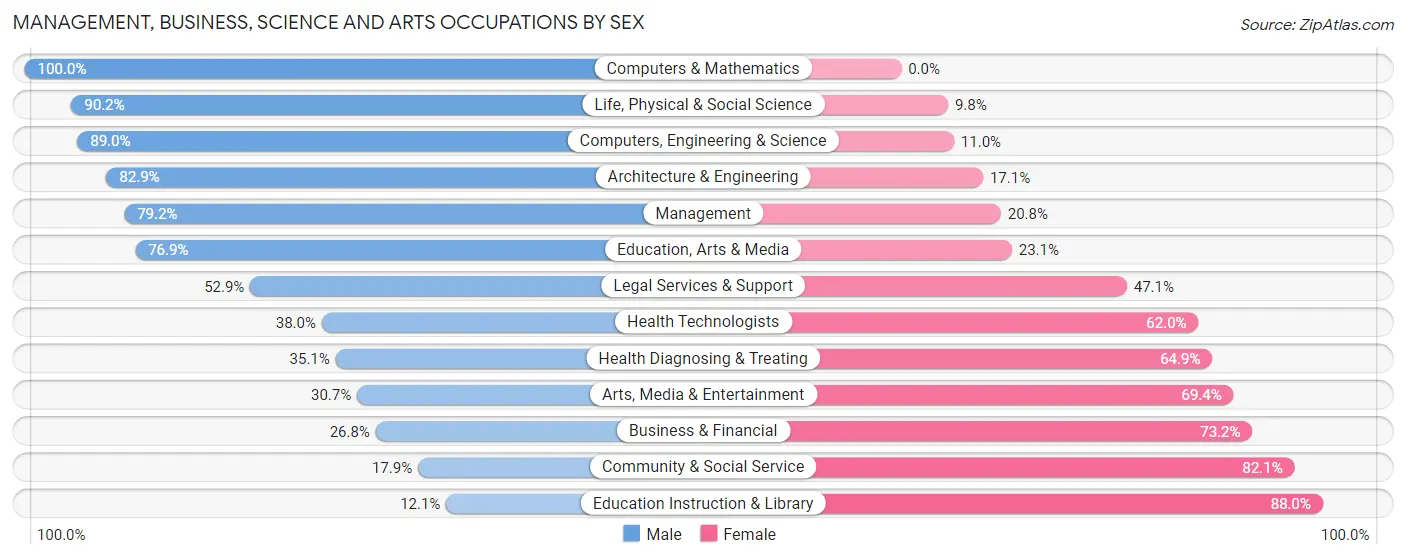
| Occupation | Male | Female |
| Management | 385 (79.2%) | 101 (20.8%) |
| Business & Financial | 19 (26.8%) | 52 (73.2%) |
| Computers, Engineering & Science | 89 (89.0%) | 11 (11.0%) |
| Computers & Mathematics | 18 (100.0%) | 0 (0.0%) |
| Architecture & Engineering | 34 (82.9%) | 7 (17.1%) |
| Life, Physical & Social Science | 37 (90.2%) | 4 (9.8%) |
| Community & Social Service | 82 (17.9%) | 375 (82.1%) |
| Education, Arts & Media | 10 (76.9%) | 3 (23.1%) |
| Legal Services & Support | 9 (52.9%) | 8 (47.1%) |
| Education Instruction & Library | 44 (12.0%) | 321 (87.9%) |
| Arts, Media & Entertainment | 19 (30.6%) | 43 (69.4%) |
| Health Diagnosing & Treating | 190 (35.1%) | 351 (64.9%) |
| Health Technologists | 182 (38.0%) | 297 (62.0%) |
| Total (Category) | 765 (46.2%) | 890 (53.8%) |
| Total (Overall) | 2,358 (55.0%) | 1,925 (45.0%) |
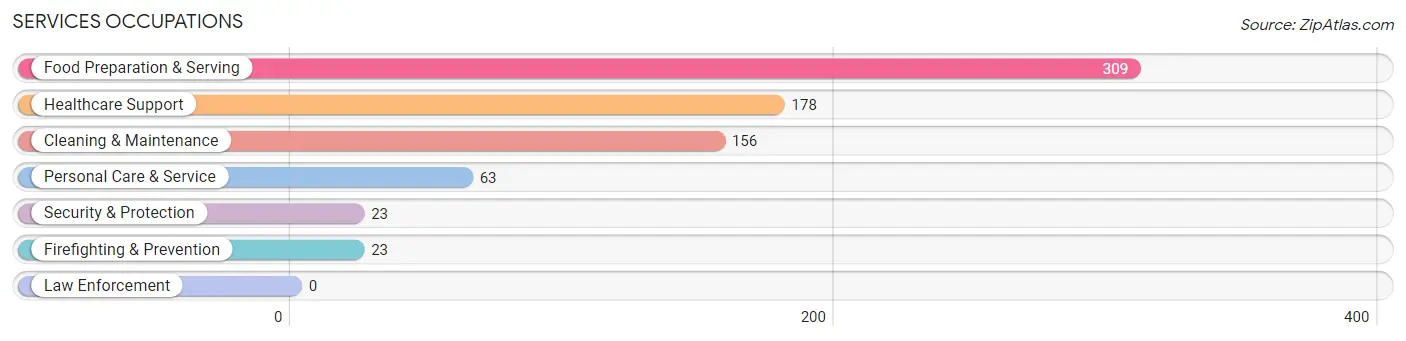
Services Occupations
The most common Services occupations in Pratt County are Food Preparation & Serving (309 | 7.2%), Healthcare Support (178 | 4.2%), Cleaning & Maintenance (156 | 3.6%), Personal Care & Service (63 | 1.5%), and Security & Protection (23 | 0.5%).
Services Occupations by Sex
Within the Services occupations in Pratt County, the most male-oriented occupations are Security & Protection (100.0%), Firefighting & Prevention (100.0%), and Cleaning & Maintenance (92.9%), while the most female-oriented occupations are Personal Care & Service (96.8%), Healthcare Support (80.3%), and Food Preparation & Serving (40.5%).
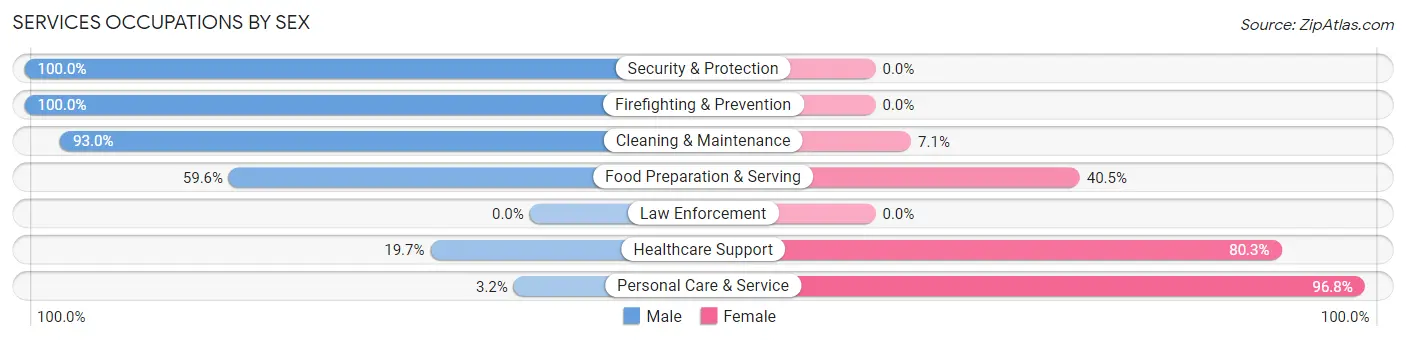
| Occupation | Male | Female |
| Healthcare Support | 35 (19.7%) | 143 (80.3%) |
| Security & Protection | 23 (100.0%) | 0 (0.0%) |
| Firefighting & Prevention | 23 (100.0%) | 0 (0.0%) |
| Law Enforcement | 0 (0.0%) | 0 (0.0%) |
| Food Preparation & Serving | 184 (59.6%) | 125 (40.5%) |
| Cleaning & Maintenance | 145 (92.9%) | 11 (7.0%) |
| Personal Care & Service | 2 (3.2%) | 61 (96.8%) |
| Total (Category) | 389 (53.4%) | 340 (46.6%) |
| Total (Overall) | 2,358 (55.0%) | 1,925 (45.0%) |
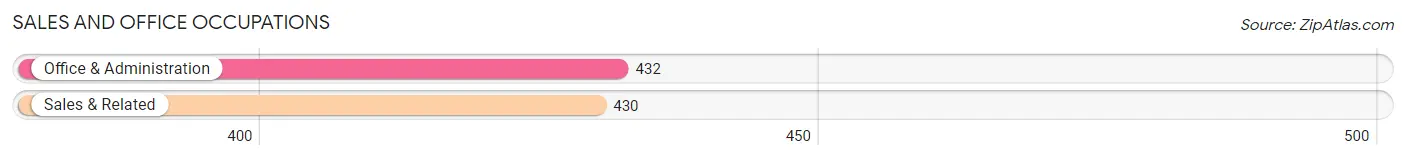
Sales and Office Occupations
The most common Sales and Office occupations in Pratt County are Office & Administration (432 | 10.1%), and Sales & Related (430 | 10.0%).
Sales and Office Occupations by Sex
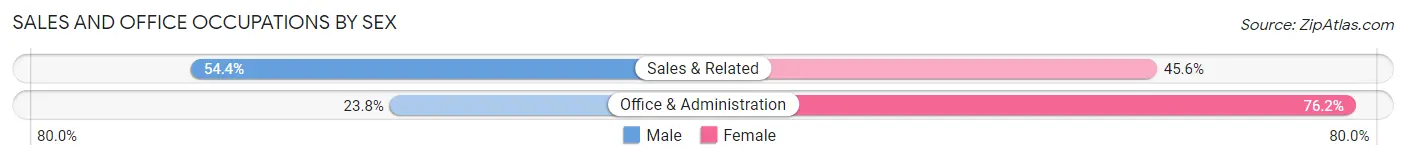
| Occupation | Male | Female |
| Sales & Related | 234 (54.4%) | 196 (45.6%) |
| Office & Administration | 103 (23.8%) | 329 (76.2%) |
| Total (Category) | 337 (39.1%) | 525 (60.9%) |
| Total (Overall) | 2,358 (55.0%) | 1,925 (45.0%) |
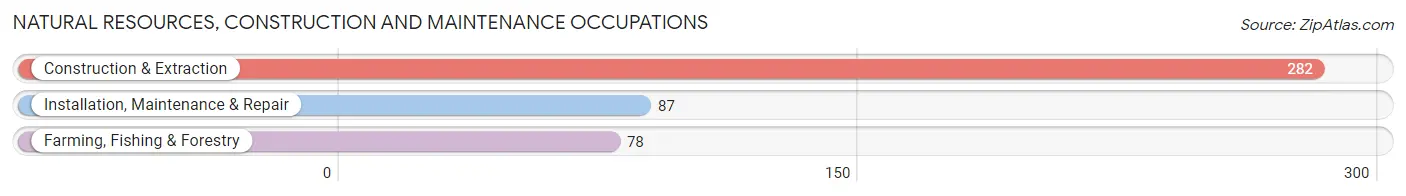
Natural Resources, Construction and Maintenance Occupations
The most common Natural Resources, Construction and Maintenance occupations in Pratt County are Construction & Extraction (282 | 6.6%), Installation, Maintenance & Repair (87 | 2.0%), and Farming, Fishing & Forestry (78 | 1.8%).
Natural Resources, Construction and Maintenance Occupations by Sex
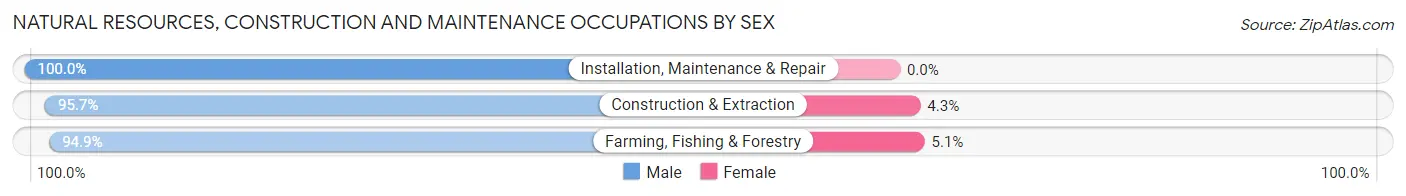
| Occupation | Male | Female |
| Farming, Fishing & Forestry | 74 (94.9%) | 4 (5.1%) |
| Construction & Extraction | 270 (95.7%) | 12 (4.3%) |
| Installation, Maintenance & Repair | 87 (100.0%) | 0 (0.0%) |
| Total (Category) | 431 (96.4%) | 16 (3.6%) |
| Total (Overall) | 2,358 (55.0%) | 1,925 (45.0%) |
Production, Transportation and Moving Occupations
The most common Production, Transportation and Moving occupations in Pratt County are Transportation (252 | 5.9%), Production (182 | 4.3%), and Material Moving (156 | 3.6%).
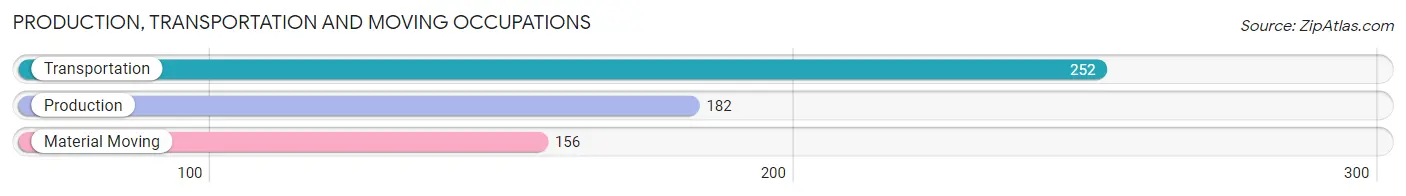
Production, Transportation and Moving Occupations by Sex
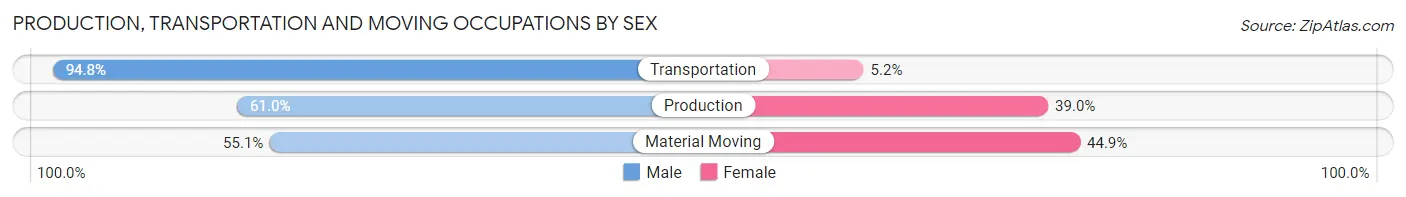
| Occupation | Male | Female |
| Production | 111 (61.0%) | 71 (39.0%) |
| Transportation | 239 (94.8%) | 13 (5.2%) |
| Material Moving | 86 (55.1%) | 70 (44.9%) |
| Total (Category) | 436 (73.9%) | 154 (26.1%) |
| Total (Overall) | 2,358 (55.0%) | 1,925 (45.0%) |
Employment Industries by Sex in Pratt County
Employment Industries in Pratt County
The major employment industries in Pratt County include Health Care & Social Assistance (709 | 16.6%), Retail Trade (623 | 14.5%), Educational Services (507 | 11.8%), Accommodation & Food Services (370 | 8.6%), and Transportation & Warehousing (293 | 6.8%).

Employment Industries by Sex in Pratt County
The Pratt County industries that see more men than women are Mining, Quarrying, & Extraction (98.6%), Agriculture, Fishing & Hunting (94.4%), and Construction (93.3%), whereas the industries that tend to have a higher number of women are Educational Services (80.9%), Finance & Insurance (75.0%), and Public Administration (69.1%).
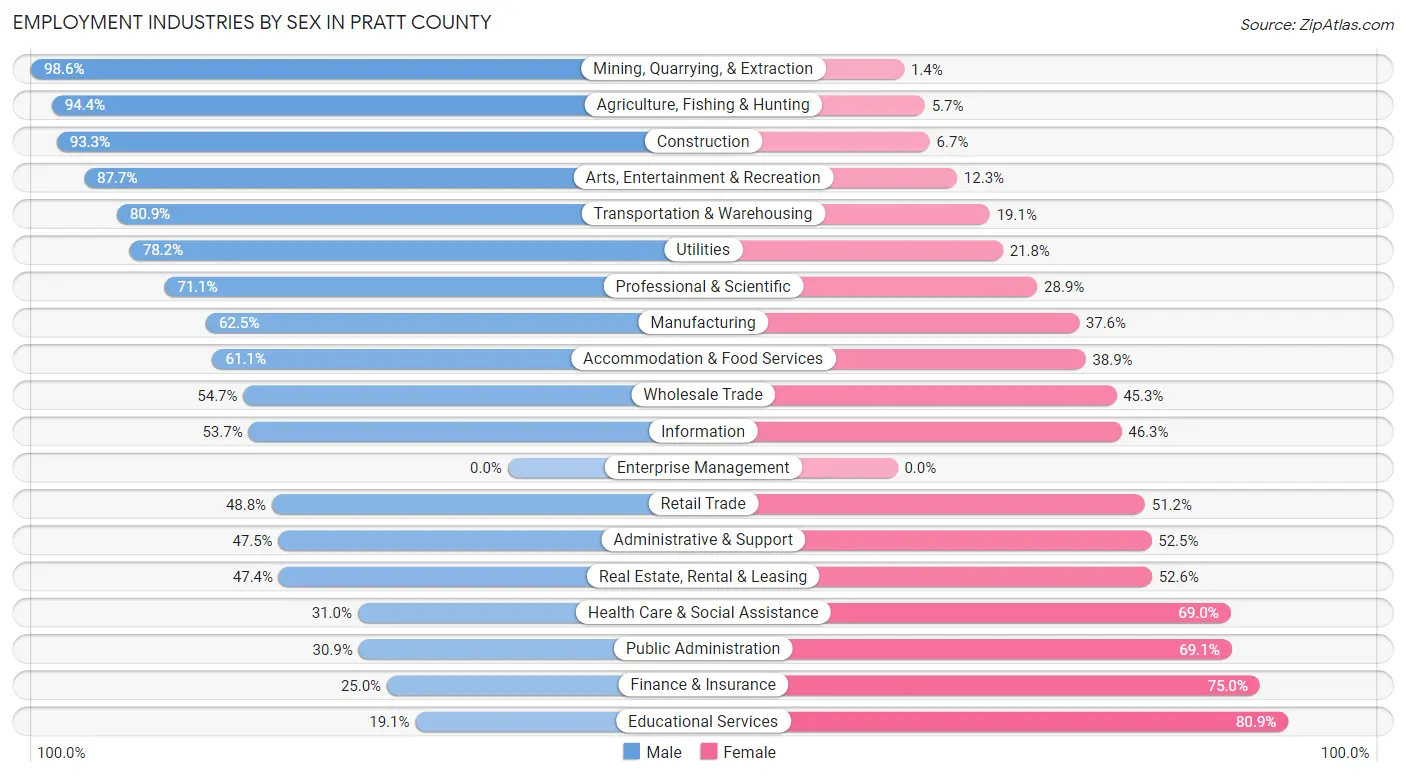
| Industry | Male | Female |
| Agriculture, Fishing & Hunting | 267 (94.4%) | 16 (5.7%) |
| Mining, Quarrying, & Extraction | 218 (98.6%) | 3 (1.4%) |
| Construction | 224 (93.3%) | 16 (6.7%) |
| Manufacturing | 143 (62.5%) | 86 (37.6%) |
| Wholesale Trade | 58 (54.7%) | 48 (45.3%) |
| Retail Trade | 304 (48.8%) | 319 (51.2%) |
| Transportation & Warehousing | 237 (80.9%) | 56 (19.1%) |
| Utilities | 61 (78.2%) | 17 (21.8%) |
| Information | 22 (53.7%) | 19 (46.3%) |
| Finance & Insurance | 20 (25.0%) | 60 (75.0%) |
| Real Estate, Rental & Leasing | 9 (47.4%) | 10 (52.6%) |
| Professional & Scientific | 59 (71.1%) | 24 (28.9%) |
| Enterprise Management | 0 (0.0%) | 0 (0.0%) |
| Administrative & Support | 28 (47.5%) | 31 (52.5%) |
| Educational Services | 97 (19.1%) | 410 (80.9%) |
| Health Care & Social Assistance | 220 (31.0%) | 489 (69.0%) |
| Arts, Entertainment & Recreation | 57 (87.7%) | 8 (12.3%) |
| Accommodation & Food Services | 226 (61.1%) | 144 (38.9%) |
| Public Administration | 50 (30.9%) | 112 (69.1%) |
| Total | 2,358 (55.0%) | 1,925 (45.0%) |
Education in Pratt County
School Enrollment in Pratt County
The most common levels of schooling among the 2,521 students in Pratt County are college / undergraduate (617 | 24.5%), middle school (599 | 23.8%), and high school (514 | 20.4%).

| School Level | # Students | % Students |
| Nursery / Preschool | 165 | 6.6% |
| Kindergarten | 71 | 2.8% |
| Elementary School | 417 | 16.5% |
| Middle School | 599 | 23.8% |
| High School | 514 | 20.4% |
| College / Undergraduate | 617 | 24.5% |
| Graduate / Professional | 138 | 5.5% |
| Total | 2,521 | 100.0% |
School Enrollment by Age by Funding Source in Pratt County
Out of a total of 2,521 students who are enrolled in schools in Pratt County, 270 (10.7%) attend a private institution, while the remaining 2,251 (89.3%) are enrolled in public schools. The age group of 20 to 24 year olds has the highest likelihood of being enrolled in private schools, with 114 (37.2% in the age bracket) enrolled. Conversely, the age group of 15 to 17 year olds has the lowest likelihood of being enrolled in a private school, with 418 (98.1% in the age bracket) attending a public institution.
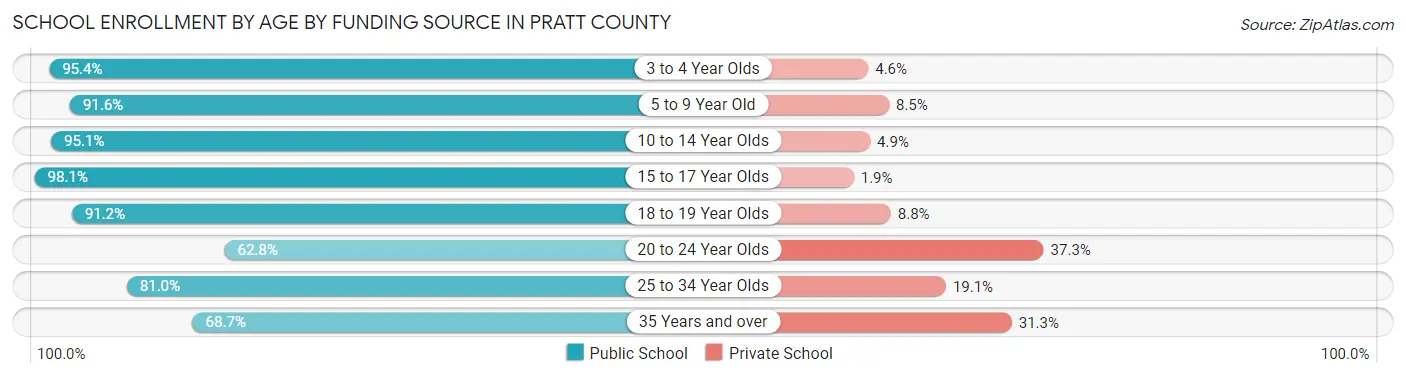
| Age Bracket | Public School | Private School |
| 3 to 4 Year Olds | 104 (95.4%) | 5 (4.6%) |
| 5 to 9 Year Old | 401 (91.5%) | 37 (8.5%) |
| 10 to 14 Year Olds | 733 (95.1%) | 38 (4.9%) |
| 15 to 17 Year Olds | 418 (98.1%) | 8 (1.9%) |
| 18 to 19 Year Olds | 301 (91.2%) | 29 (8.8%) |
| 20 to 24 Year Olds | 192 (62.7%) | 114 (37.2%) |
| 25 to 34 Year Olds | 34 (80.9%) | 8 (19.1%) |
| 35 Years and over | 68 (68.7%) | 31 (31.3%) |
| Total | 2,251 (89.3%) | 270 (10.7%) |
Educational Attainment by Field of Study in Pratt County
Education (397 | 22.8%), science & technology (341 | 19.6%), bio, nature & agricultural (320 | 18.4%), business (204 | 11.7%), and arts & humanities (81 | 4.7%) are the most common fields of study among 1,738 individuals in Pratt County who have obtained a bachelor's degree or higher.

| Field of Study | # Graduates | % Graduates |
| Computers & Mathematics | 13 | 0.7% |
| Bio, Nature & Agricultural | 320 | 18.4% |
| Physical & Health Sciences | 53 | 3.0% |
| Psychology | 59 | 3.4% |
| Social Sciences | 65 | 3.7% |
| Engineering | 39 | 2.2% |
| Multidisciplinary Studies | 4 | 0.2% |
| Science & Technology | 341 | 19.6% |
| Business | 204 | 11.7% |
| Education | 397 | 22.8% |
| Literature & Languages | 66 | 3.8% |
| Liberal Arts & History | 37 | 2.1% |
| Visual & Performing Arts | 21 | 1.2% |
| Communications | 38 | 2.2% |
| Arts & Humanities | 81 | 4.7% |
| Total | 1,738 | 100.0% |
Transportation & Commute in Pratt County
Vehicle Availability by Sex in Pratt County
The most prevalent vehicle ownership categories in Pratt County are males with 3 vehicles (839, accounting for 36.8%) and females with 3 vehicles (619, making up 46.8%).
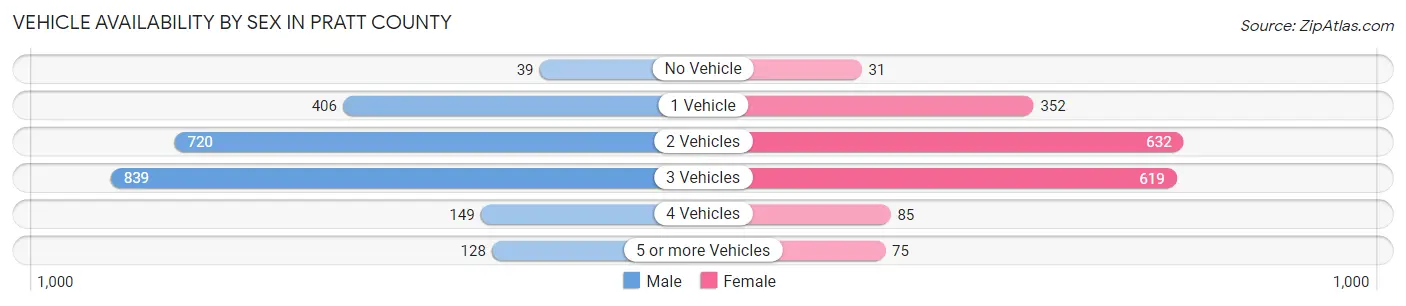
| Vehicles Available | Male | Female |
| No Vehicle | 39 (1.7%) | 31 (1.7%) |
| 1 Vehicle | 406 (17.8%) | 352 (19.6%) |
| 2 Vehicles | 720 (31.6%) | 632 (35.2%) |
| 3 Vehicles | 839 (36.8%) | 619 (34.5%) |
| 4 Vehicles | 149 (6.5%) | 85 (4.7%) |
| 5 or more Vehicles | 128 (5.6%) | 75 (4.2%) |
| Total | 2,281 (100.0%) | 1,794 (100.0%) |
Commute Time in Pratt County
The most frequently occuring commute durations in Pratt County are 5 to 9 minutes (1,634 commuters, 41.5%), 10 to 14 minutes (791 commuters, 20.1%), and less than 5 minutes (619 commuters, 15.7%).
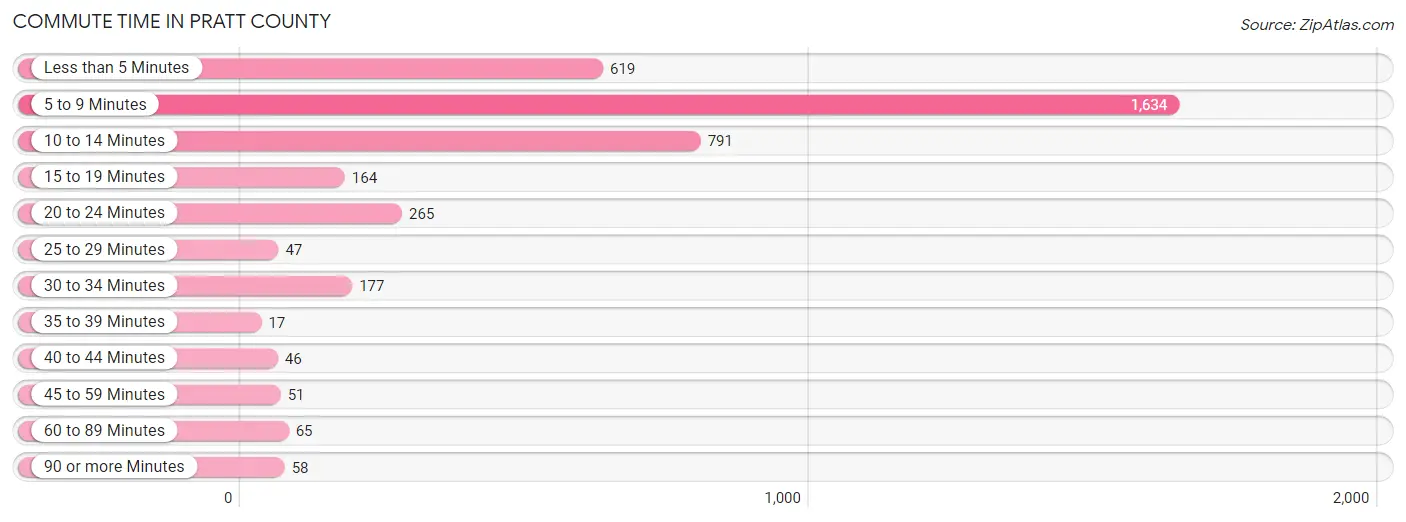
| Commute Time | # Commuters | % Commuters |
| Less than 5 Minutes | 619 | 15.7% |
| 5 to 9 Minutes | 1,634 | 41.5% |
| 10 to 14 Minutes | 791 | 20.1% |
| 15 to 19 Minutes | 164 | 4.2% |
| 20 to 24 Minutes | 265 | 6.7% |
| 25 to 29 Minutes | 47 | 1.2% |
| 30 to 34 Minutes | 177 | 4.5% |
| 35 to 39 Minutes | 17 | 0.4% |
| 40 to 44 Minutes | 46 | 1.2% |
| 45 to 59 Minutes | 51 | 1.3% |
| 60 to 89 Minutes | 65 | 1.7% |
| 90 or more Minutes | 58 | 1.5% |
Commute Time by Sex in Pratt County
The most common commute times in Pratt County are 5 to 9 minutes (1,013 commuters, 45.3%) for males and 5 to 9 minutes (621 commuters, 36.6%) for females.

| Commute Time | Male | Female |
| Less than 5 Minutes | 270 (12.1%) | 349 (20.6%) |
| 5 to 9 Minutes | 1,013 (45.3%) | 621 (36.6%) |
| 10 to 14 Minutes | 502 (22.4%) | 289 (17.0%) |
| 15 to 19 Minutes | 82 (3.7%) | 82 (4.8%) |
| 20 to 24 Minutes | 84 (3.7%) | 181 (10.7%) |
| 25 to 29 Minutes | 23 (1.0%) | 24 (1.4%) |
| 30 to 34 Minutes | 92 (4.1%) | 85 (5.0%) |
| 35 to 39 Minutes | 17 (0.8%) | 0 (0.0%) |
| 40 to 44 Minutes | 44 (2.0%) | 2 (0.1%) |
| 45 to 59 Minutes | 48 (2.1%) | 3 (0.2%) |
| 60 to 89 Minutes | 30 (1.3%) | 35 (2.1%) |
| 90 or more Minutes | 33 (1.5%) | 25 (1.5%) |
Time of Departure to Work by Sex in Pratt County
The most frequent times of departure to work in Pratt County are 7:30 AM to 7:59 AM (389, 17.4%) for males and 7:30 AM to 7:59 AM (413, 24.3%) for females.
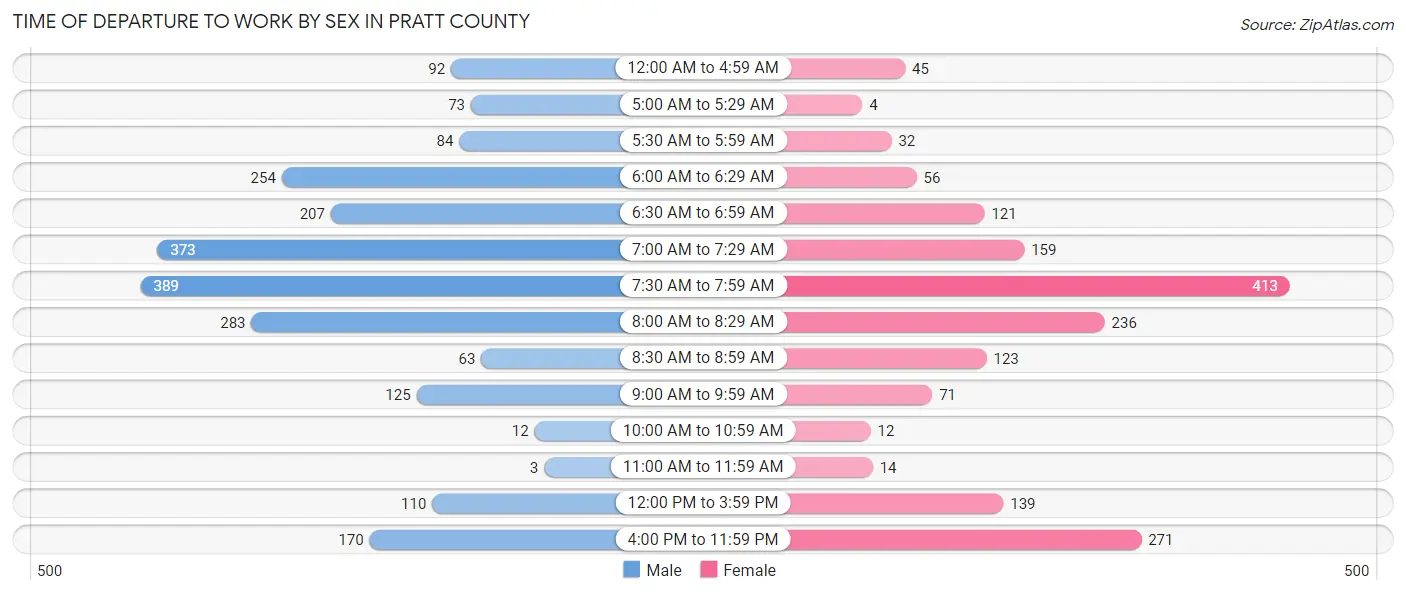
| Time of Departure | Male | Female |
| 12:00 AM to 4:59 AM | 92 (4.1%) | 45 (2.6%) |
| 5:00 AM to 5:29 AM | 73 (3.3%) | 4 (0.2%) |
| 5:30 AM to 5:59 AM | 84 (3.7%) | 32 (1.9%) |
| 6:00 AM to 6:29 AM | 254 (11.4%) | 56 (3.3%) |
| 6:30 AM to 6:59 AM | 207 (9.2%) | 121 (7.1%) |
| 7:00 AM to 7:29 AM | 373 (16.7%) | 159 (9.4%) |
| 7:30 AM to 7:59 AM | 389 (17.4%) | 413 (24.3%) |
| 8:00 AM to 8:29 AM | 283 (12.7%) | 236 (13.9%) |
| 8:30 AM to 8:59 AM | 63 (2.8%) | 123 (7.2%) |
| 9:00 AM to 9:59 AM | 125 (5.6%) | 71 (4.2%) |
| 10:00 AM to 10:59 AM | 12 (0.5%) | 12 (0.7%) |
| 11:00 AM to 11:59 AM | 3 (0.1%) | 14 (0.8%) |
| 12:00 PM to 3:59 PM | 110 (4.9%) | 139 (8.2%) |
| 4:00 PM to 11:59 PM | 170 (7.6%) | 271 (16.0%) |
| Total | 2,238 (100.0%) | 1,696 (100.0%) |
Housing Occupancy in Pratt County
Occupancy by Ownership in Pratt County
Of the total 3,580 dwellings in Pratt County, owner-occupied units account for 2,506 (70.0%), while renter-occupied units make up 1,074 (30.0%).

| Occupancy | # Housing Units | % Housing Units |
| Owner Occupied Housing Units | 2,506 | 70.0% |
| Renter-Occupied Housing Units | 1,074 | 30.0% |
| Total Occupied Housing Units | 3,580 | 100.0% |
Occupancy by Household Size in Pratt County
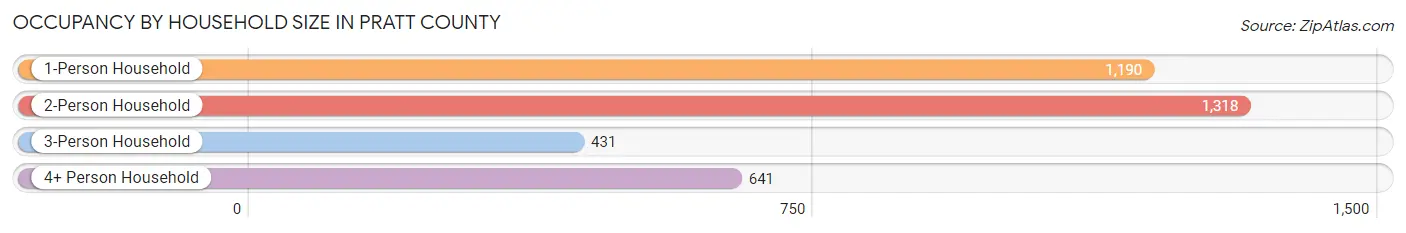
| Household Size | # Housing Units | % Housing Units |
| 1-Person Household | 1,190 | 33.2% |
| 2-Person Household | 1,318 | 36.8% |
| 3-Person Household | 431 | 12.0% |
| 4+ Person Household | 641 | 17.9% |
| Total Housing Units | 3,580 | 100.0% |
Occupancy by Ownership by Household Size in Pratt County
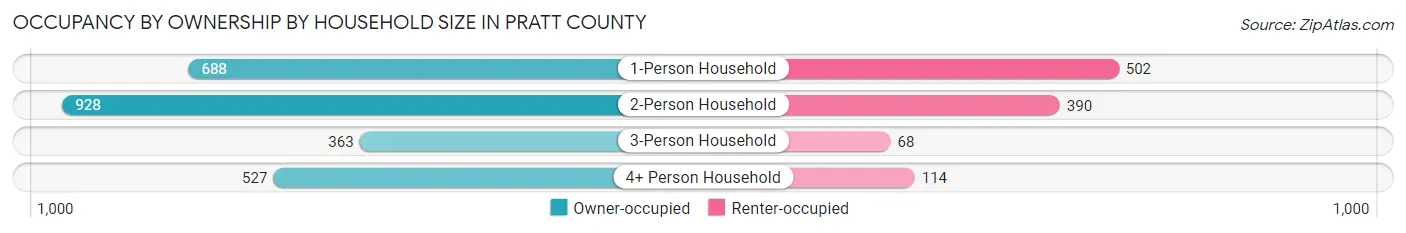
| Household Size | Owner-occupied | Renter-occupied |
| 1-Person Household | 688 (57.8%) | 502 (42.2%) |
| 2-Person Household | 928 (70.4%) | 390 (29.6%) |
| 3-Person Household | 363 (84.2%) | 68 (15.8%) |
| 4+ Person Household | 527 (82.2%) | 114 (17.8%) |
| Total Housing Units | 2,506 (70.0%) | 1,074 (30.0%) |
Occupancy by Educational Attainment in Pratt County
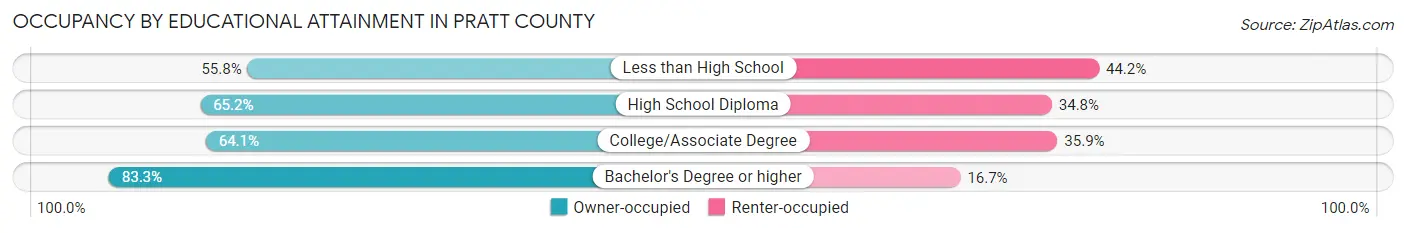
| Household Size | Owner-occupied | Renter-occupied |
| Less than High School | 144 (55.8%) | 114 (44.2%) |
| High School Diploma | 552 (65.2%) | 295 (34.8%) |
| College/Associate Degree | 838 (64.1%) | 470 (35.9%) |
| Bachelor's Degree or higher | 972 (83.3%) | 195 (16.7%) |
Occupancy by Age of Householder in Pratt County
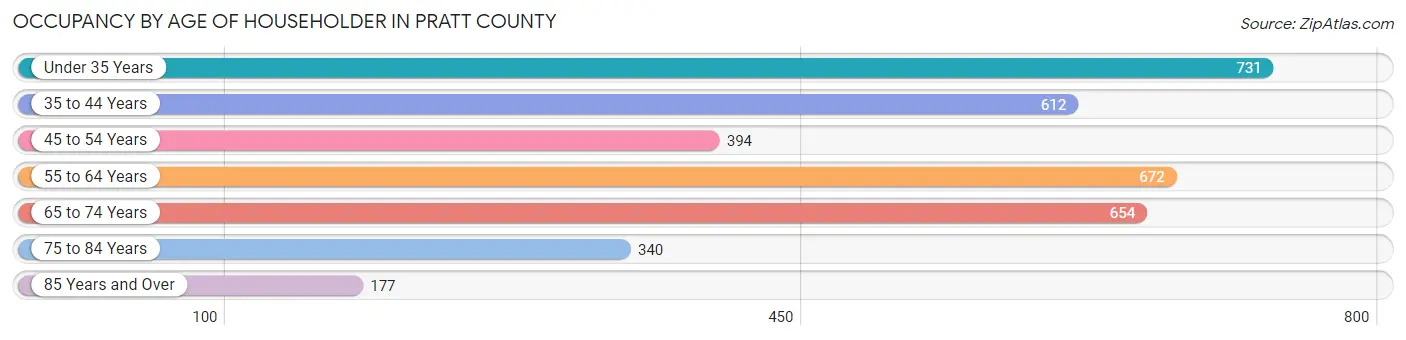
| Age Bracket | # Households | % Households |
| Under 35 Years | 731 | 20.4% |
| 35 to 44 Years | 612 | 17.1% |
| 45 to 54 Years | 394 | 11.0% |
| 55 to 64 Years | 672 | 18.8% |
| 65 to 74 Years | 654 | 18.3% |
| 75 to 84 Years | 340 | 9.5% |
| 85 Years and Over | 177 | 4.9% |
| Total | 3,580 | 100.0% |
Housing Finances in Pratt County
Median Income by Occupancy in Pratt County
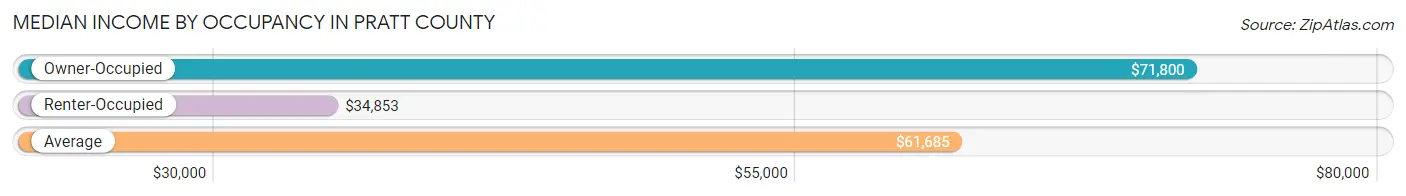
| Occupancy Type | # Households | Median Income |
| Owner-Occupied | 2,506 (70.0%) | $71,800 |
| Renter-Occupied | 1,074 (30.0%) | $34,853 |
| Average | 3,580 (100.0%) | $61,685 |
Occupancy by Householder Income Bracket in Pratt County
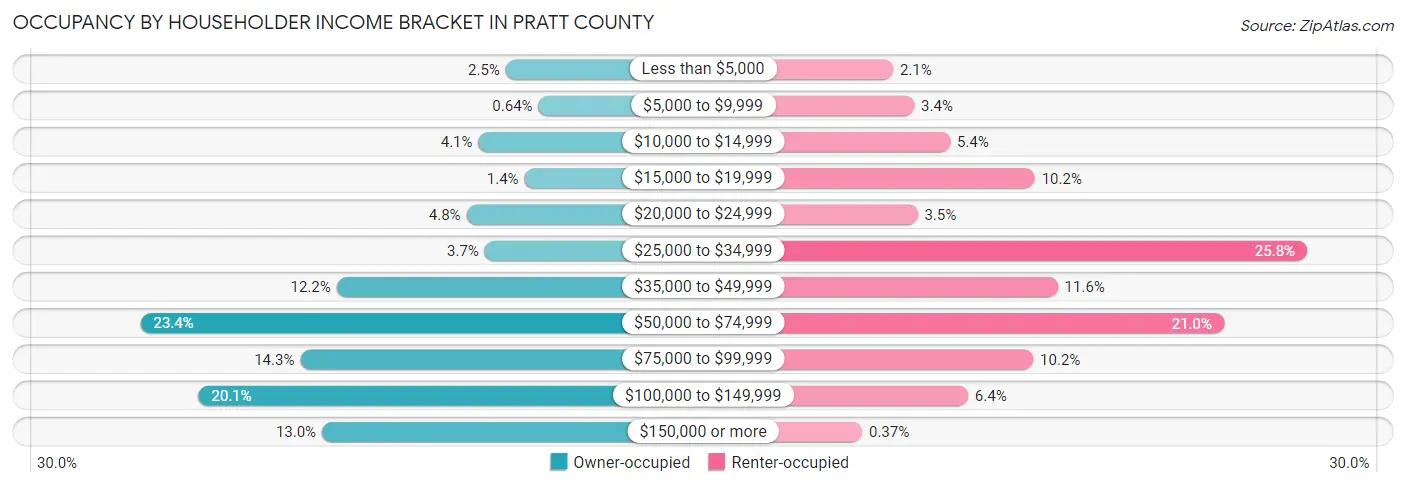
| Income Bracket | Owner-occupied | Renter-occupied |
| Less than $5,000 | 63 (2.5%) | 23 (2.1%) |
| $5,000 to $9,999 | 16 (0.6%) | 36 (3.4%) |
| $10,000 to $14,999 | 102 (4.1%) | 58 (5.4%) |
| $15,000 to $19,999 | 36 (1.4%) | 110 (10.2%) |
| $20,000 to $24,999 | 119 (4.8%) | 38 (3.5%) |
| $25,000 to $34,999 | 93 (3.7%) | 277 (25.8%) |
| $35,000 to $49,999 | 305 (12.2%) | 124 (11.6%) |
| $50,000 to $74,999 | 586 (23.4%) | 226 (21.0%) |
| $75,000 to $99,999 | 357 (14.2%) | 109 (10.2%) |
| $100,000 to $149,999 | 503 (20.1%) | 69 (6.4%) |
| $150,000 or more | 326 (13.0%) | 4 (0.4%) |
| Total | 2,506 (100.0%) | 1,074 (100.0%) |
Monthly Housing Cost Tiers in Pratt County
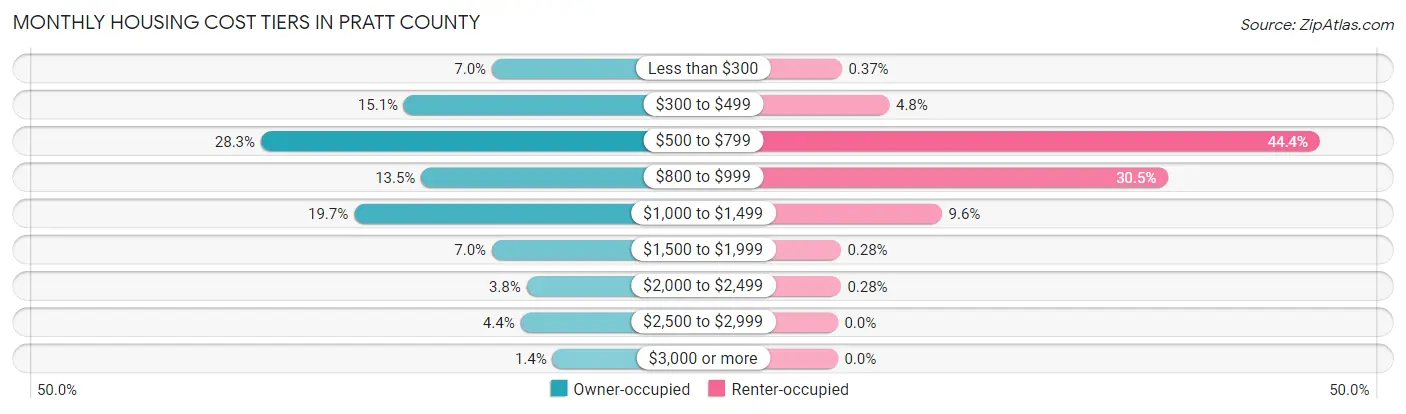
| Monthly Cost | Owner-occupied | Renter-occupied |
| Less than $300 | 175 (7.0%) | 4 (0.4%) |
| $300 to $499 | 378 (15.1%) | 51 (4.8%) |
| $500 to $799 | 708 (28.2%) | 477 (44.4%) |
| $800 to $999 | 338 (13.5%) | 327 (30.4%) |
| $1,000 to $1,499 | 493 (19.7%) | 103 (9.6%) |
| $1,500 to $1,999 | 175 (7.0%) | 3 (0.3%) |
| $2,000 to $2,499 | 95 (3.8%) | 3 (0.3%) |
| $2,500 to $2,999 | 109 (4.3%) | 0 (0.0%) |
| $3,000 or more | 35 (1.4%) | 0 (0.0%) |
| Total | 2,506 (100.0%) | 1,074 (100.0%) |
Physical Housing Characteristics in Pratt County
Housing Structures in Pratt County
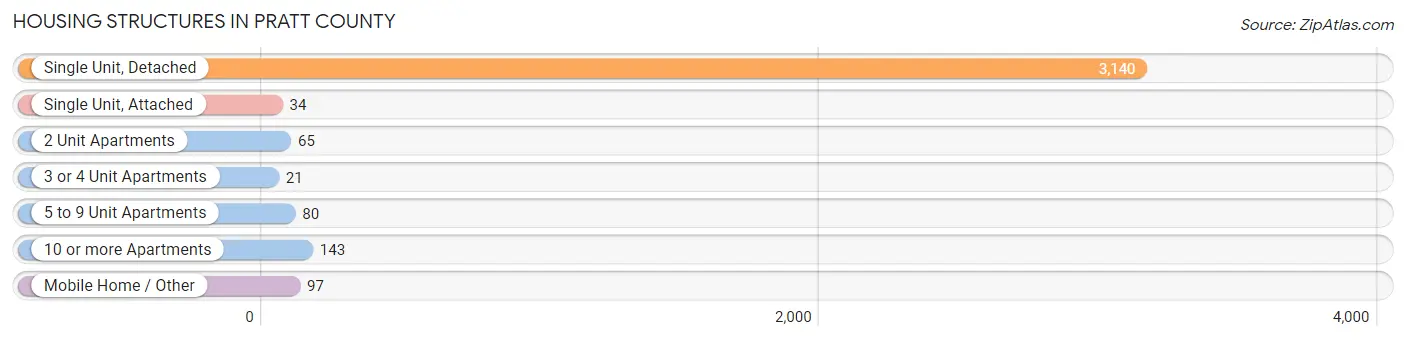
| Structure Type | # Housing Units | % Housing Units |
| Single Unit, Detached | 3,140 | 87.7% |
| Single Unit, Attached | 34 | 0.9% |
| 2 Unit Apartments | 65 | 1.8% |
| 3 or 4 Unit Apartments | 21 | 0.6% |
| 5 to 9 Unit Apartments | 80 | 2.2% |
| 10 or more Apartments | 143 | 4.0% |
| Mobile Home / Other | 97 | 2.7% |
| Total | 3,580 | 100.0% |
Housing Structures by Occupancy in Pratt County
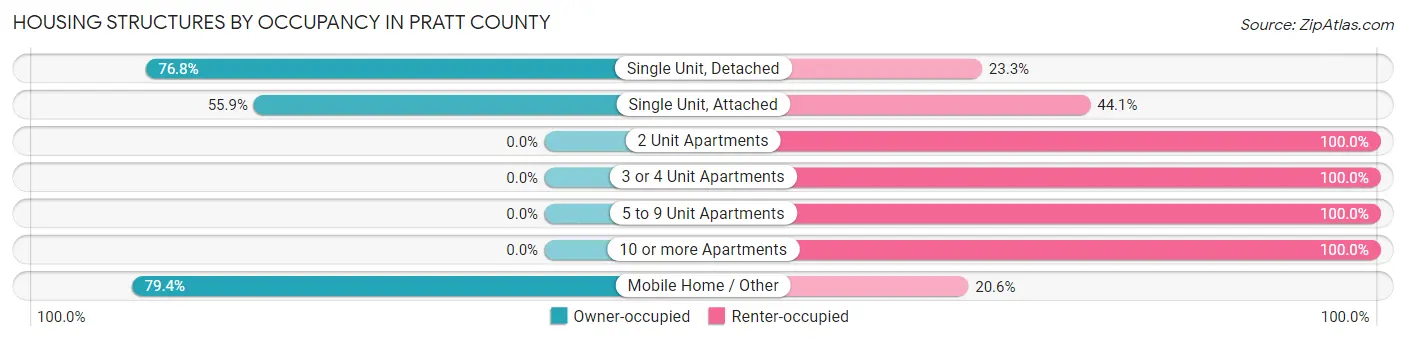
| Structure Type | Owner-occupied | Renter-occupied |
| Single Unit, Detached | 2,410 (76.7%) | 730 (23.3%) |
| Single Unit, Attached | 19 (55.9%) | 15 (44.1%) |
| 2 Unit Apartments | 0 (0.0%) | 65 (100.0%) |
| 3 or 4 Unit Apartments | 0 (0.0%) | 21 (100.0%) |
| 5 to 9 Unit Apartments | 0 (0.0%) | 80 (100.0%) |
| 10 or more Apartments | 0 (0.0%) | 143 (100.0%) |
| Mobile Home / Other | 77 (79.4%) | 20 (20.6%) |
| Total | 2,506 (70.0%) | 1,074 (30.0%) |
Housing Structures by Number of Rooms in Pratt County
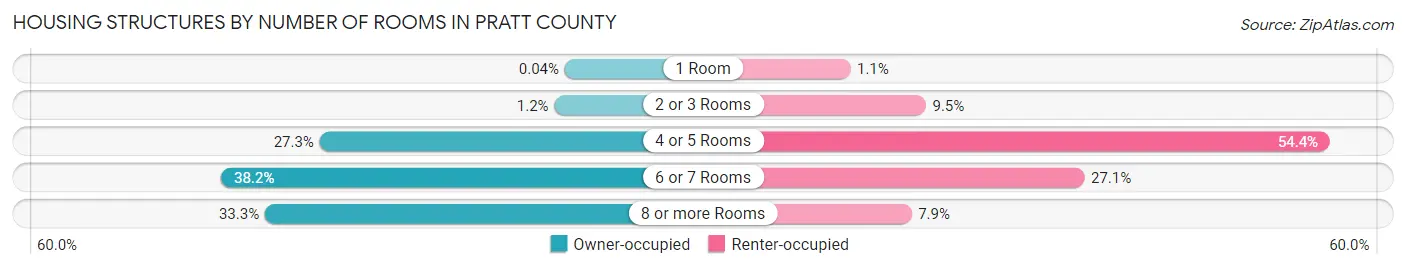
| Number of Rooms | Owner-occupied | Renter-occupied |
| 1 Room | 1 (0.0%) | 12 (1.1%) |
| 2 or 3 Rooms | 30 (1.2%) | 102 (9.5%) |
| 4 or 5 Rooms | 683 (27.3%) | 584 (54.4%) |
| 6 or 7 Rooms | 957 (38.2%) | 291 (27.1%) |
| 8 or more Rooms | 835 (33.3%) | 85 (7.9%) |
| Total | 2,506 (100.0%) | 1,074 (100.0%) |
Housing Structure by Heating Type in Pratt County
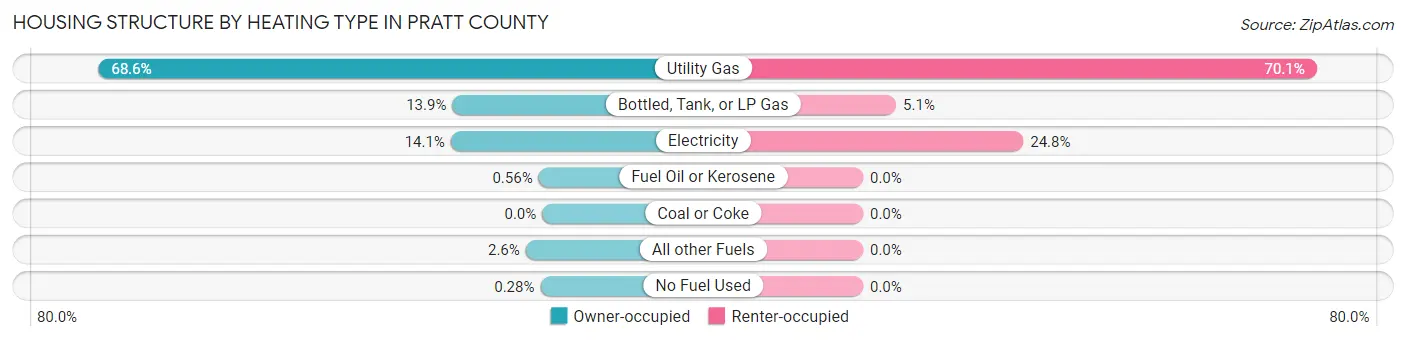
| Heating Type | Owner-occupied | Renter-occupied |
| Utility Gas | 1,719 (68.6%) | 753 (70.1%) |
| Bottled, Tank, or LP Gas | 348 (13.9%) | 55 (5.1%) |
| Electricity | 354 (14.1%) | 266 (24.8%) |
| Fuel Oil or Kerosene | 14 (0.6%) | 0 (0.0%) |
| Coal or Coke | 0 (0.0%) | 0 (0.0%) |
| All other Fuels | 64 (2.5%) | 0 (0.0%) |
| No Fuel Used | 7 (0.3%) | 0 (0.0%) |
| Total | 2,506 (100.0%) | 1,074 (100.0%) |
Household Vehicle Usage in Pratt County
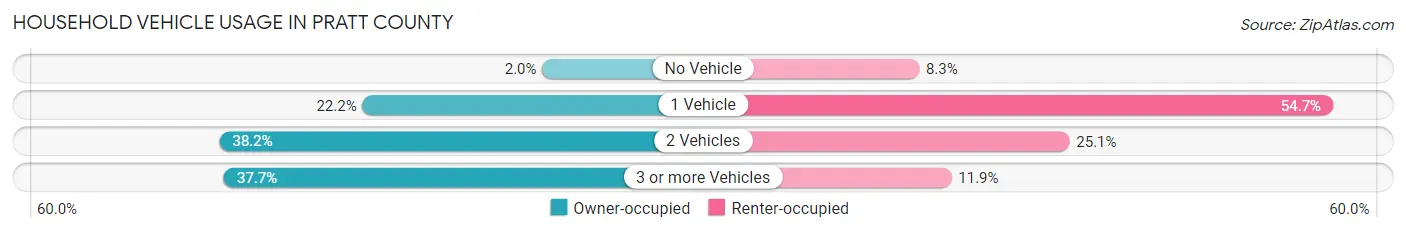
| Vehicles per Household | Owner-occupied | Renter-occupied |
| No Vehicle | 50 (2.0%) | 89 (8.3%) |
| 1 Vehicle | 555 (22.2%) | 587 (54.7%) |
| 2 Vehicles | 957 (38.2%) | 270 (25.1%) |
| 3 or more Vehicles | 944 (37.7%) | 128 (11.9%) |
| Total | 2,506 (100.0%) | 1,074 (100.0%) |
Real Estate & Mortgages in Pratt County
Real Estate and Mortgage Overview in Pratt County
| Characteristic | Without Mortgage | With Mortgage |
| Housing Units | 1,334 | 1,172 |
| Median Property Value | $110,000 | $113,500 |
| Median Household Income | $63,080 | $166 |
| Monthly Housing Costs | $547 | $35 |
| Real Estate Taxes | $1,987 | $3 |
Property Value by Mortgage Status in Pratt County

| Property Value | Without Mortgage | With Mortgage |
| Less than $50,000 | 196 (14.7%) | 71 (6.1%) |
| $50,000 to $99,999 | 400 (30.0%) | 468 (39.9%) |
| $100,000 to $299,999 | 619 (46.4%) | 469 (40.0%) |
| $300,000 to $499,999 | 81 (6.1%) | 120 (10.2%) |
| $500,000 to $749,999 | 8 (0.6%) | 39 (3.3%) |
| $750,000 to $999,999 | 30 (2.2%) | 5 (0.4%) |
| $1,000,000 or more | 0 (0.0%) | 0 (0.0%) |
| Total | 1,334 (100.0%) | 1,172 (100.0%) |
Household Income by Mortgage Status in Pratt County
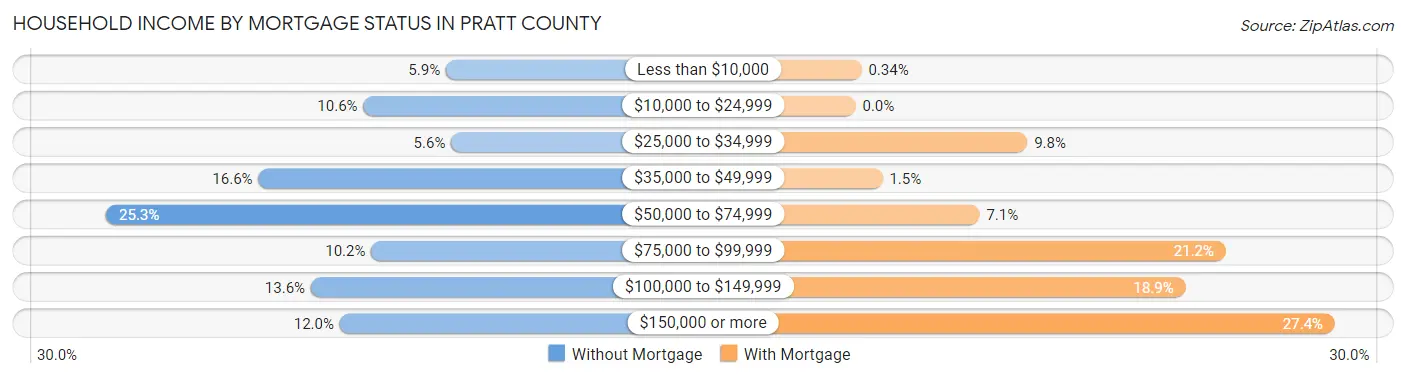
| Household Income | Without Mortgage | With Mortgage |
| Less than $10,000 | 79 (5.9%) | 4 (0.3%) |
| $10,000 to $24,999 | 142 (10.6%) | 0 (0.0%) |
| $25,000 to $34,999 | 75 (5.6%) | 115 (9.8%) |
| $35,000 to $49,999 | 222 (16.6%) | 18 (1.5%) |
| $50,000 to $74,999 | 338 (25.3%) | 83 (7.1%) |
| $75,000 to $99,999 | 136 (10.2%) | 248 (21.2%) |
| $100,000 to $149,999 | 182 (13.6%) | 221 (18.9%) |
| $150,000 or more | 160 (12.0%) | 321 (27.4%) |
| Total | 1,334 (100.0%) | 1,172 (100.0%) |
Property Value to Household Income Ratio in Pratt County
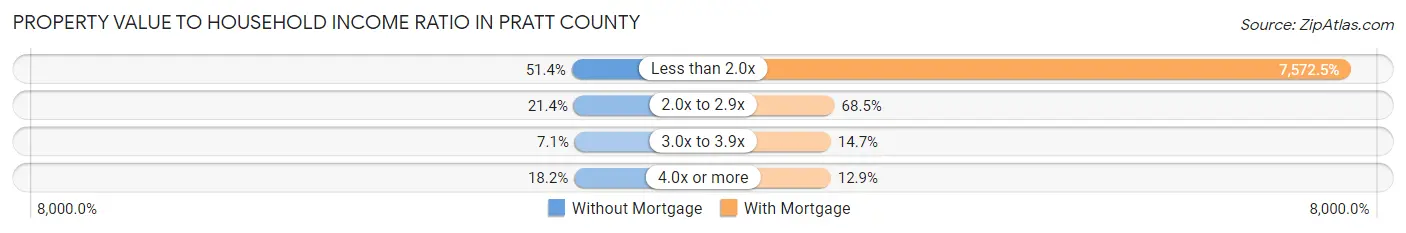
| Value-to-Income Ratio | Without Mortgage | With Mortgage |
| Less than 2.0x | 686 (51.4%) | 88,750 (7,572.5%) |
| 2.0x to 2.9x | 286 (21.4%) | 803 (68.5%) |
| 3.0x to 3.9x | 95 (7.1%) | 172 (14.7%) |
| 4.0x or more | 243 (18.2%) | 151 (12.9%) |
| Total | 1,334 (100.0%) | 1,172 (100.0%) |
Real Estate Taxes by Mortgage Status in Pratt County

| Property Taxes | Without Mortgage | With Mortgage |
| Less than $800 | 205 (15.4%) | 0 (0.0%) |
| $800 to $1,499 | 233 (17.5%) | 57 (4.9%) |
| $800 to $1,499 | 851 (63.8%) | 185 (15.8%) |
| Total | 1,334 (100.0%) | 1,172 (100.0%) |
Health & Disability in Pratt County
Health Insurance Coverage by Age in Pratt County
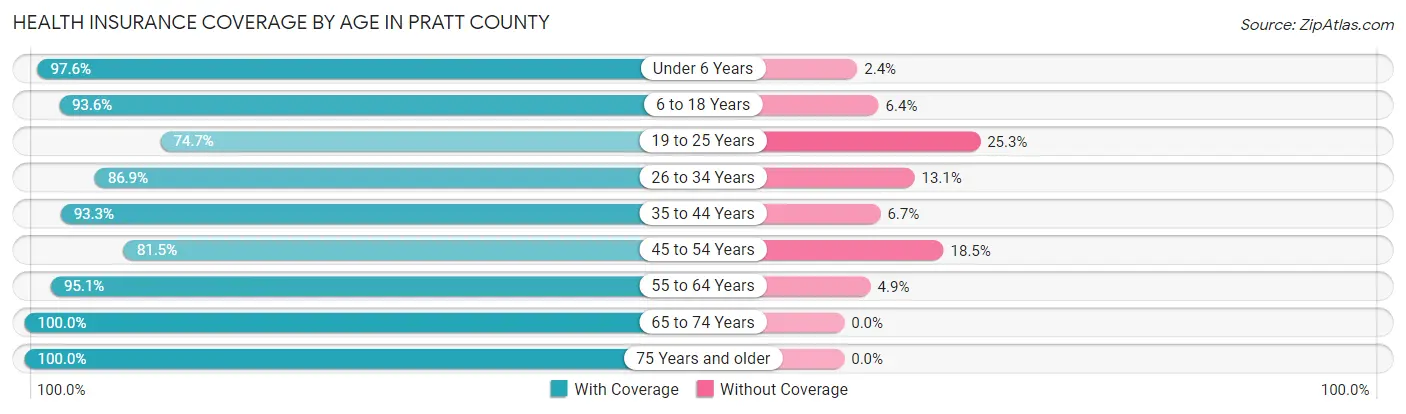
| Age Bracket | With Coverage | Without Coverage |
| Under 6 Years | 681 (97.6%) | 17 (2.4%) |
| 6 to 18 Years | 1,664 (93.6%) | 114 (6.4%) |
| 19 to 25 Years | 772 (74.7%) | 262 (25.3%) |
| 26 to 34 Years | 683 (86.9%) | 103 (13.1%) |
| 35 to 44 Years | 955 (93.3%) | 69 (6.7%) |
| 45 to 54 Years | 638 (81.5%) | 145 (18.5%) |
| 55 to 64 Years | 1,064 (95.1%) | 55 (4.9%) |
| 65 to 74 Years | 1,008 (100.0%) | 0 (0.0%) |
| 75 Years and older | 771 (100.0%) | 0 (0.0%) |
| Total | 8,236 (91.5%) | 765 (8.5%) |
Health Insurance Coverage by Citizenship Status in Pratt County
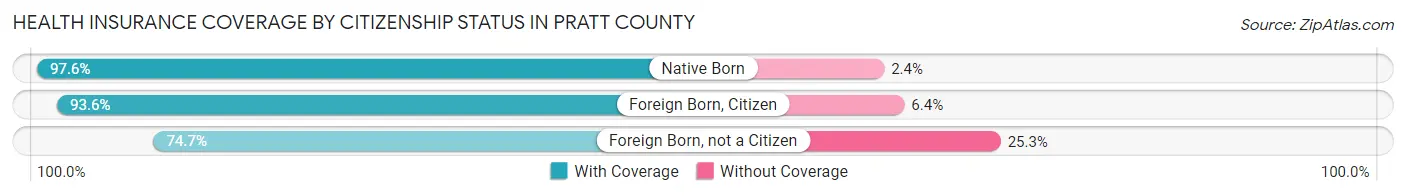
| Citizenship Status | With Coverage | Without Coverage |
| Native Born | 681 (97.6%) | 17 (2.4%) |
| Foreign Born, Citizen | 1,664 (93.6%) | 114 (6.4%) |
| Foreign Born, not a Citizen | 772 (74.7%) | 262 (25.3%) |
Health Insurance Coverage by Household Income in Pratt County
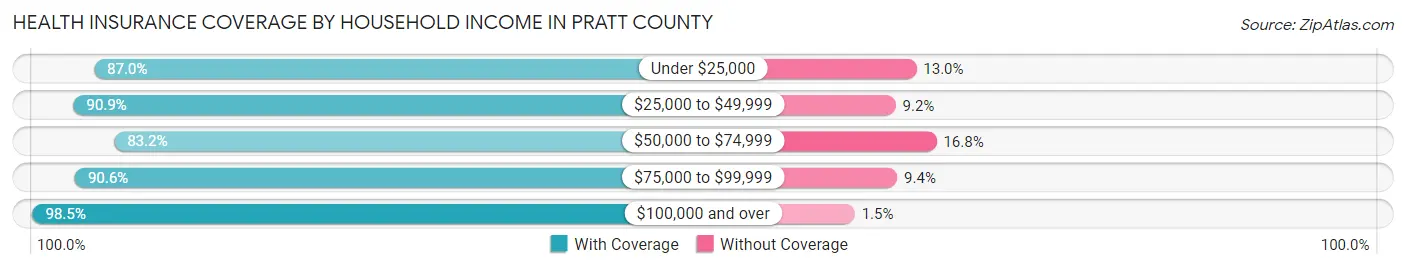
| Household Income | With Coverage | Without Coverage |
| Under $25,000 | 834 (87.0%) | 125 (13.0%) |
| $25,000 to $49,999 | 1,459 (90.8%) | 147 (9.1%) |
| $50,000 to $74,999 | 1,540 (83.2%) | 311 (16.8%) |
| $75,000 to $99,999 | 1,228 (90.6%) | 128 (9.4%) |
| $100,000 and over | 2,871 (98.5%) | 43 (1.5%) |
Public vs Private Health Insurance Coverage by Age in Pratt County

| Age Bracket | Public Insurance | Private Insurance |
| Under 6 | 274 (39.3%) | 411 (58.9%) |
| 6 to 18 Years | 524 (29.5%) | 1,252 (70.4%) |
| 19 to 25 Years | 82 (7.9%) | 717 (69.3%) |
| 25 to 34 Years | 108 (13.7%) | 618 (78.6%) |
| 35 to 44 Years | 176 (17.2%) | 821 (80.2%) |
| 45 to 54 Years | 80 (10.2%) | 592 (75.6%) |
| 55 to 64 Years | 162 (14.5%) | 966 (86.3%) |
| 65 to 74 Years | 1,001 (99.3%) | 721 (71.5%) |
| 75 Years and over | 771 (100.0%) | 626 (81.2%) |
| Total | 3,178 (35.3%) | 6,724 (74.7%) |
Disability Status by Sex by Age in Pratt County
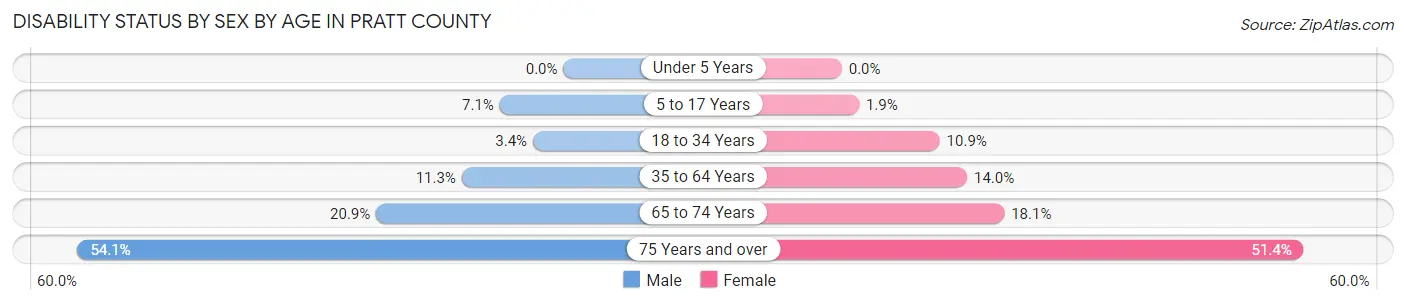
| Age Bracket | Male | Female |
| Under 5 Years | 0 (0.0%) | 0 (0.0%) |
| 5 to 17 Years | 61 (7.1%) | 16 (1.9%) |
| 18 to 34 Years | 37 (3.4%) | 98 (10.9%) |
| 35 to 64 Years | 160 (11.3%) | 211 (14.0%) |
| 65 to 74 Years | 103 (20.8%) | 93 (18.1%) |
| 75 Years and over | 171 (54.1%) | 234 (51.4%) |
Disability Class by Sex by Age in Pratt County
Disability Class: Hearing Difficulty
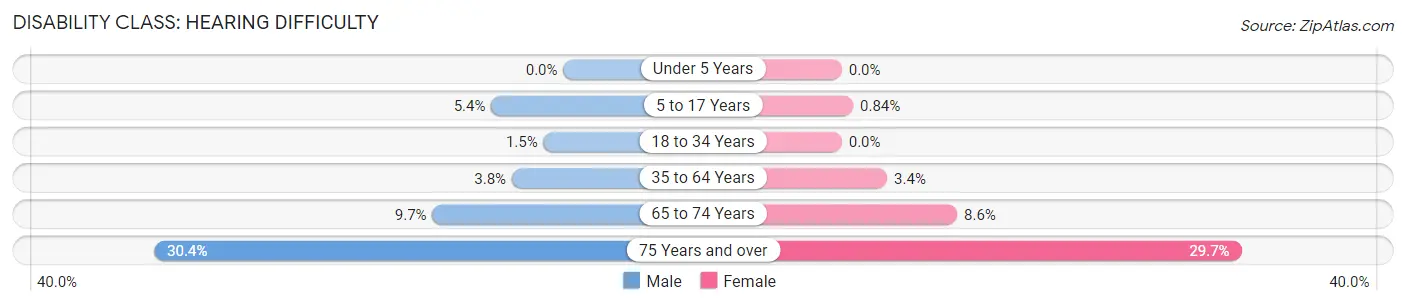
| Age Bracket | Male | Female |
| Under 5 Years | 0 (0.0%) | 0 (0.0%) |
| 5 to 17 Years | 46 (5.3%) | 7 (0.8%) |
| 18 to 34 Years | 16 (1.5%) | 0 (0.0%) |
| 35 to 64 Years | 54 (3.8%) | 51 (3.4%) |
| 65 to 74 Years | 48 (9.7%) | 44 (8.6%) |
| 75 Years and over | 96 (30.4%) | 135 (29.7%) |
Disability Class: Vision Difficulty
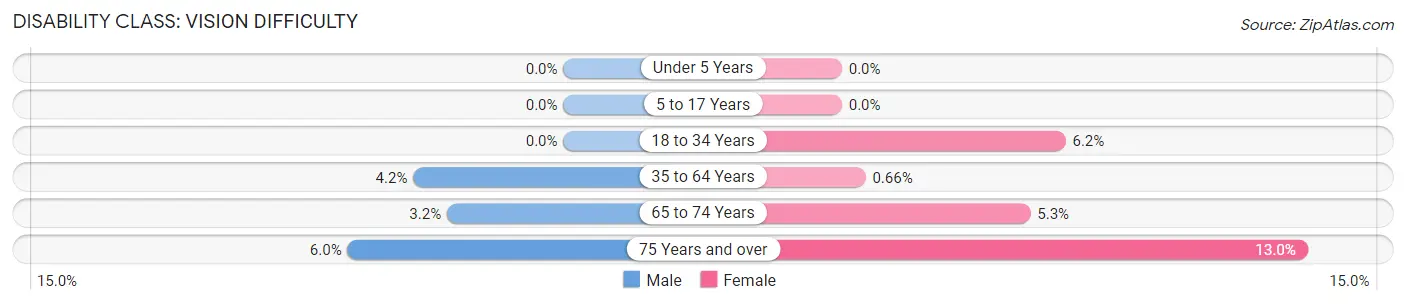
| Age Bracket | Male | Female |
| Under 5 Years | 0 (0.0%) | 0 (0.0%) |
| 5 to 17 Years | 0 (0.0%) | 0 (0.0%) |
| 18 to 34 Years | 0 (0.0%) | 56 (6.2%) |
| 35 to 64 Years | 59 (4.2%) | 10 (0.7%) |
| 65 to 74 Years | 16 (3.2%) | 27 (5.2%) |
| 75 Years and over | 19 (6.0%) | 59 (13.0%) |
Disability Class: Cognitive Difficulty
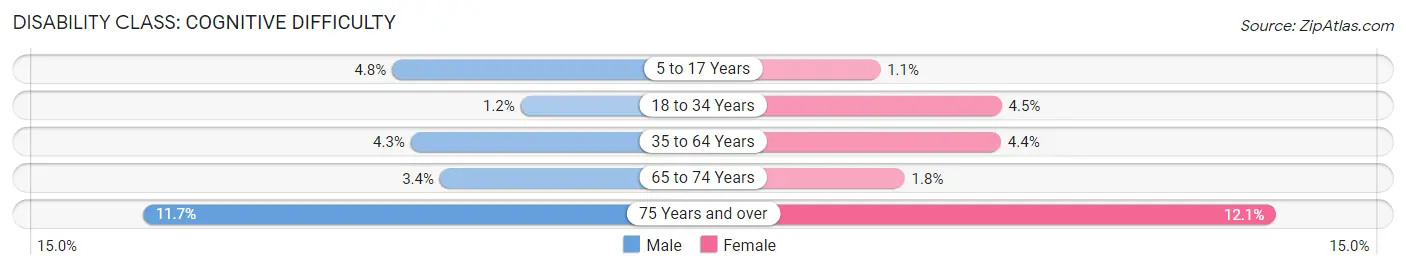
| Age Bracket | Male | Female |
| 5 to 17 Years | 41 (4.8%) | 9 (1.1%) |
| 18 to 34 Years | 13 (1.2%) | 40 (4.4%) |
| 35 to 64 Years | 60 (4.3%) | 67 (4.4%) |
| 65 to 74 Years | 17 (3.4%) | 9 (1.8%) |
| 75 Years and over | 37 (11.7%) | 55 (12.1%) |
Disability Class: Ambulatory Difficulty

| Age Bracket | Male | Female |
| 5 to 17 Years | 0 (0.0%) | 0 (0.0%) |
| 18 to 34 Years | 2 (0.2%) | 40 (4.4%) |
| 35 to 64 Years | 44 (3.1%) | 131 (8.7%) |
| 65 to 74 Years | 80 (16.2%) | 67 (13.0%) |
| 75 Years and over | 105 (33.2%) | 133 (29.2%) |
Disability Class: Self-Care Difficulty
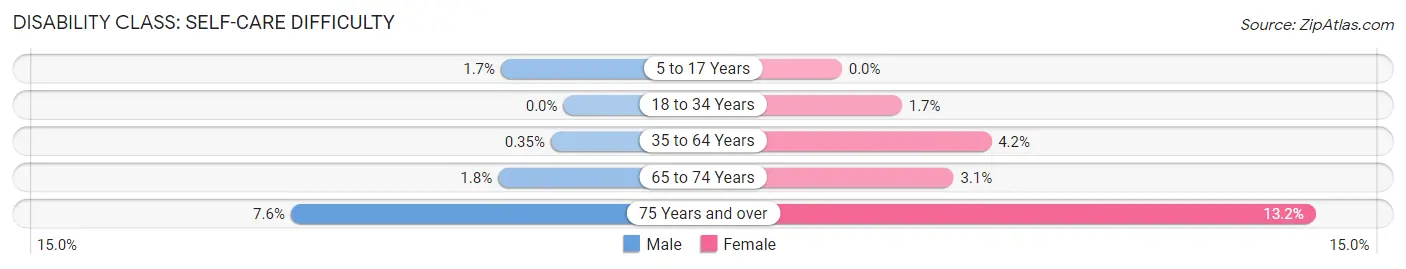
| Age Bracket | Male | Female |
| 5 to 17 Years | 15 (1.7%) | 0 (0.0%) |
| 18 to 34 Years | 0 (0.0%) | 15 (1.7%) |
| 35 to 64 Years | 5 (0.4%) | 63 (4.2%) |
| 65 to 74 Years | 9 (1.8%) | 16 (3.1%) |
| 75 Years and over | 24 (7.6%) | 60 (13.2%) |
Technology Access in Pratt County
Computing Device Access in Pratt County
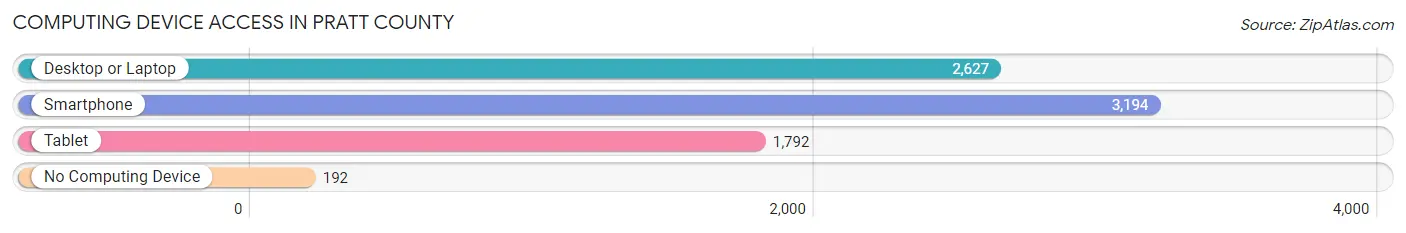
| Device Type | # Households | % Households |
| Desktop or Laptop | 2,627 | 73.4% |
| Smartphone | 3,194 | 89.2% |
| Tablet | 1,792 | 50.1% |
| No Computing Device | 192 | 5.4% |
| Total | 3,580 | 100.0% |
Internet Access in Pratt County
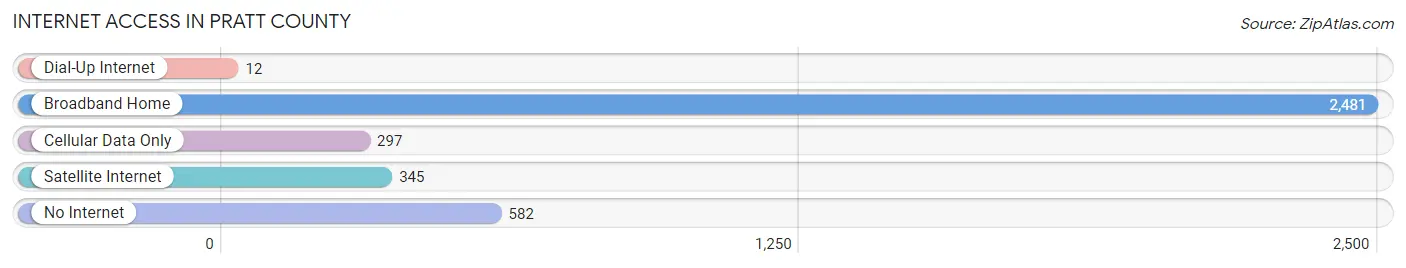
| Internet Type | # Households | % Households |
| Dial-Up Internet | 12 | 0.3% |
| Broadband Home | 2,481 | 69.3% |
| Cellular Data Only | 297 | 8.3% |
| Satellite Internet | 345 | 9.6% |
| No Internet | 582 | 16.3% |
| Total | 3,580 | 100.0% |
Pratt County Summary
Pratt County, Kansas is located in the south-central part of the state, and is bordered by Barber, Kingman, Reno, Stafford, and Rice counties. The county seat is Pratt, and the county was named after Caleb Pratt, a Union soldier who was killed in the Civil War. The county has a total area of 890 square miles, and a population of 9,656 as of the 2010 census.
Geography
Pratt County is located in the Great Plains region of the United States. The county is mostly flat, with some rolling hills in the western part of the county. The county is drained by the Ninnescah River, which flows through the county from north to south. The county is also home to several small lakes, including Lake Pratt, Lake McPherson, and Lake Pratt State Park.
The climate of Pratt County is characterized by hot, humid summers and cold, dry winters. The average annual temperature is around 54°F, and the average annual precipitation is around 28 inches.
Economy
The economy of Pratt County is largely based on agriculture. The county is home to several large farms, and the main crops grown in the county are wheat, corn, and soybeans. The county is also home to several small businesses, including a few restaurants, a few retail stores, and a few manufacturing companies.
The county is also home to several oil and gas wells, and the county is a major producer of oil and natural gas. The county is also home to several wind farms, and the county is a major producer of wind energy.
Demographics
As of the 2010 census, the population of Pratt County was 9,656. The racial makeup of the county was 95.3% White, 0.7% African American, 0.5% Native American, 0.3% Asian, 0.1% Pacific Islander, 1.7% from other races, and 1.3% from two or more races. Hispanic or Latino of any race were 3.3% of the population.
The median income for a household in the county was $41,945, and the median income for a family was $50,945. The per capita income for the county was $20,945. About 11.3% of families and 14.2% of the population were below the poverty line, including 19.2% of those under age 18 and 8.2% of those age 65 or over.
Conclusion
Pratt County, Kansas is a rural county located in the south-central part of the state. The county is mostly flat, with some rolling hills in the western part of the county. The economy of the county is largely based on agriculture, and the county is also a major producer of oil and natural gas. The population of the county is around 9,656, and the median income for a household is around $41,945.
Common Questions
What is the Total Population of Pratt County?
Total Population of Pratt County is 9,175.
What is the Total Male Population of Pratt County?
Total Male Population of Pratt County is 4,607.
What is the Total Female Population of Pratt County?
Total Female Population of Pratt County is 4,568.
What is the Ratio of Males per 100 Females in Pratt County?
There are 100.85 Males per 100 Females in Pratt County.
What is the Ratio of Females per 100 Males in Pratt County?
There are 99.15 Females per 100 Males in Pratt County.
What is the Median Population Age in Pratt County?
Median Population Age in Pratt County is 37.6 Years.
What is the Average Family Size in Pratt County
Average Family Size in Pratt County is 3.1 People.
What is the Average Household Size in Pratt County
Average Household Size in Pratt County is 2.4 People.
What is Per Capita Income in Pratt County?
Per Capita income in Pratt County is $31,949.
What is the Median Family Income in Pratt County?
Median Family Income in Pratt County is $79,076.
What is the Median Household income in Pratt County?
Median Household Income in Pratt County is $61,685.
What is Income or Wage Gap in Pratt County?
Income or Wage Gap in Pratt County is 32.4%.
Women in Pratt County earn 67.6 cents for every dollar earned by a man.
What is Family Income Deficit in Pratt County?
Family Income Deficit in Pratt County is $8,171.
Families that are below poverty line in Pratt County earn $8,171 less on average than the poverty threshold level.
What is Inequality or Gini Index in Pratt County?
Inequality or Gini Index in Pratt County is 0.44.
How Large is the Labor Force in Pratt County?
There are 4,443 People in the Labor Forcein in Pratt County.
What is the Percentage of People in the Labor Force in Pratt County?
61.5% of People are in the Labor Force in Pratt County.
What is the Unemployment Rate in Pratt County?
Unemployment Rate in Pratt County is 3.6%.