Pottawatomie County, KS
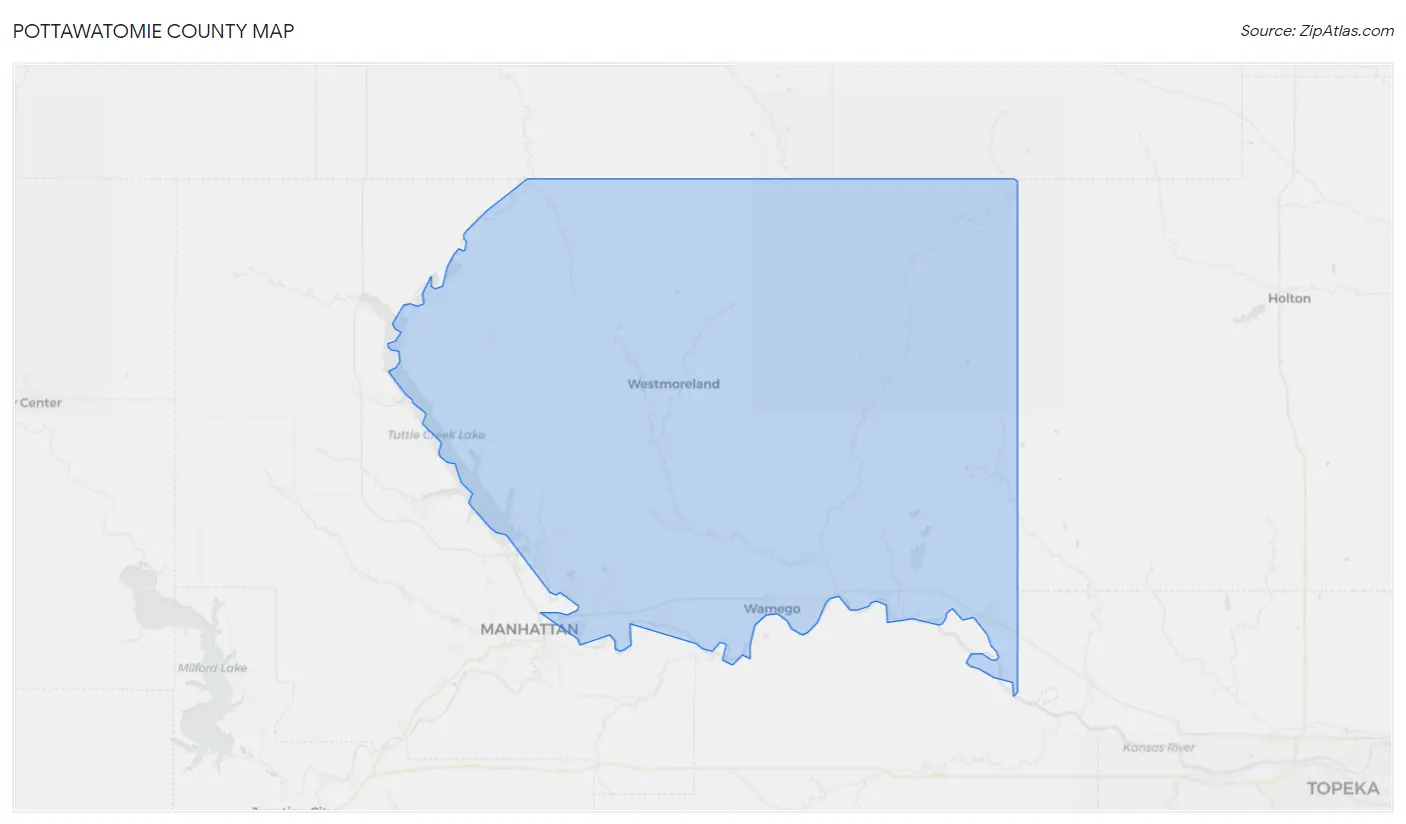
Pottawatomie County Map
Pottawatomie County Overview
25,482
TOTAL POPULATION
12,835
MALE POPULATION
12,647
FEMALE POPULATION
101.49
MALES / 100 FEMALES
98.54
FEMALES / 100 MALES
35.8
MEDIAN AGE
3.3
AVG FAMILY SIZE
2.8
AVG HOUSEHOLD SIZE
$35,715
PER CAPITA INCOME
$100,295
AVG FAMILY INCOME
$85,241
AVG HOUSEHOLD INCOME
39.4%
WAGE / INCOME GAP [ % ]
60.6¢/ $1
WAGE / INCOME GAP [ $ ]
0.39
INEQUALITY / GINI INDEX
12,761
LABOR FORCE [ PEOPLE ]
67.2%
PERCENT IN LABOR FORCE
1.9%
UNEMPLOYMENT RATE
Pottawatomie County Area Codes
Race in Pottawatomie County
The most populous races in Pottawatomie County are White / Caucasian (23,392 | 91.8%), Hispanic or Latino (1,373 | 5.4%), and Two or more Races (1,245 | 4.9%).
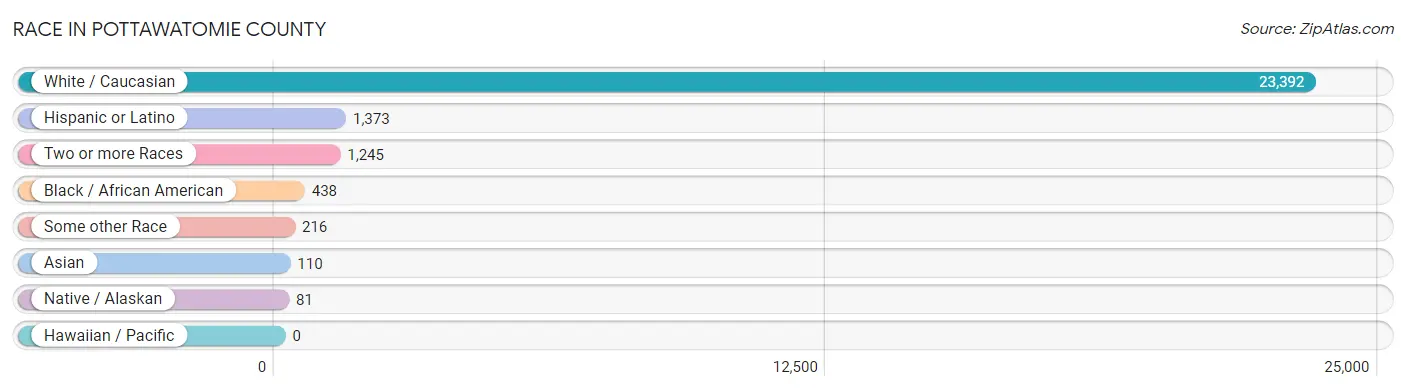
| Race | # Population | % Population |
| Asian | 110 | 0.4% |
| Black / African American | 438 | 1.7% |
| Hawaiian / Pacific | 0 | 0.0% |
| Hispanic or Latino | 1,373 | 5.4% |
| Native / Alaskan | 81 | 0.3% |
| White / Caucasian | 23,392 | 91.8% |
| Two or more Races | 1,245 | 4.9% |
| Some other Race | 216 | 0.9% |
| Total | 25,482 | 100.0% |
Ancestry in Pottawatomie County
The most populous ancestries reported in Pottawatomie County are German (8,458 | 33.2%), Irish (3,510 | 13.8%), English (3,361 | 13.2%), American (1,633 | 6.4%), and Mexican (951 | 3.7%), together accounting for 70.3% of all Pottawatomie County residents.
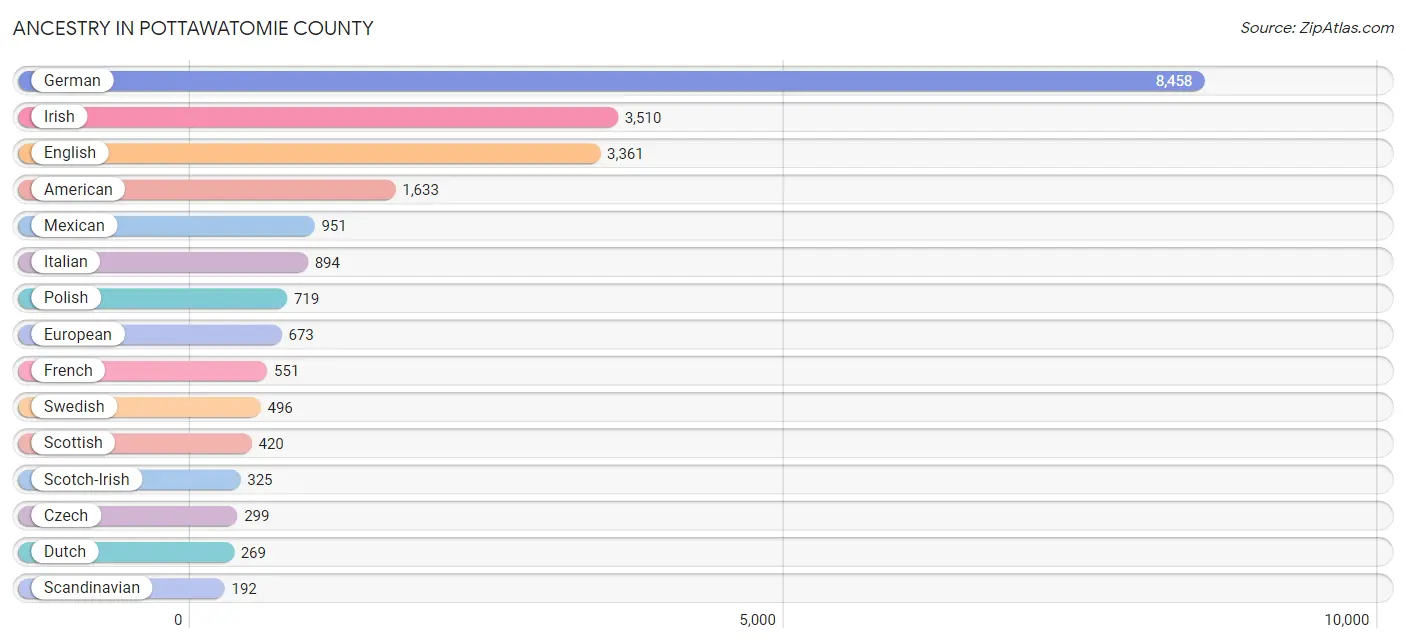
| Ancestry | # Population | % Population |
| African | 14 | 0.1% |
| American | 1,633 | 6.4% |
| Apache | 8 | 0.0% |
| Arab | 8 | 0.0% |
| Argentinean | 19 | 0.1% |
| Armenian | 7 | 0.0% |
| Austrian | 52 | 0.2% |
| Belgian | 29 | 0.1% |
| Bhutanese | 12 | 0.1% |
| Blackfeet | 15 | 0.1% |
| Brazilian | 29 | 0.1% |
| British | 145 | 0.6% |
| Burmese | 166 | 0.6% |
| Canadian | 17 | 0.1% |
| Celtic | 4 | 0.0% |
| Central American | 37 | 0.2% |
| Cherokee | 109 | 0.4% |
| Chippewa | 33 | 0.1% |
| Creek | 8 | 0.0% |
| Cuban | 70 | 0.3% |
| Czech | 299 | 1.2% |
| Czechoslovakian | 12 | 0.1% |
| Danish | 165 | 0.6% |
| Dutch | 269 | 1.1% |
| Eastern European | 46 | 0.2% |
| English | 3,361 | 13.2% |
| European | 673 | 2.6% |
| Finnish | 80 | 0.3% |
| French | 551 | 2.2% |
| French American Indian | 5 | 0.0% |
| French Canadian | 154 | 0.6% |
| German | 8,458 | 33.2% |
| German Russian | 35 | 0.1% |
| Greek | 1 | 0.0% |
| Guamanian / Chamorro | 2 | 0.0% |
| Guatemalan | 7 | 0.0% |
| Haitian | 23 | 0.1% |
| Hungarian | 128 | 0.5% |
| Indian (Asian) | 87 | 0.3% |
| Iranian | 4 | 0.0% |
| Irish | 3,510 | 13.8% |
| Italian | 894 | 3.5% |
| Japanese | 28 | 0.1% |
| Korean | 151 | 0.6% |
| Lebanese | 8 | 0.0% |
| Lithuanian | 15 | 0.1% |
| Luxembourger | 5 | 0.0% |
| Mexican | 951 | 3.7% |
| Mexican American Indian | 14 | 0.1% |
| Northern European | 11 | 0.0% |
| Norwegian | 176 | 0.7% |
| Ottawa | 6 | 0.0% |
| Pennsylvania German | 76 | 0.3% |
| Polish | 719 | 2.8% |
| Portuguese | 69 | 0.3% |
| Potawatomi | 75 | 0.3% |
| Puerto Rican | 30 | 0.1% |
| Romanian | 3 | 0.0% |
| Russian | 28 | 0.1% |
| Salvadoran | 30 | 0.1% |
| Scandinavian | 192 | 0.7% |
| Scotch-Irish | 325 | 1.3% |
| Scottish | 420 | 1.7% |
| Sioux | 7 | 0.0% |
| Slovak | 5 | 0.0% |
| South African | 4 | 0.0% |
| South American | 21 | 0.1% |
| Spaniard | 128 | 0.5% |
| Spanish | 136 | 0.5% |
| Subsaharan African | 18 | 0.1% |
| Swedish | 496 | 1.9% |
| Swiss | 176 | 0.7% |
| Ukrainian | 149 | 0.6% |
| Venezuelan | 2 | 0.0% |
| Welsh | 167 | 0.7% |
| Yugoslavian | 12 | 0.1% | View All 76 Rows |
Immigrants in Pottawatomie County
The most numerous immigrant groups reported in Pottawatomie County came from Latin America (256 | 1.0%), Central America (177 | 0.7%), Europe (149 | 0.6%), Mexico (144 | 0.6%), and Western Europe (117 | 0.5%), together accounting for 3.3% of all Pottawatomie County residents.
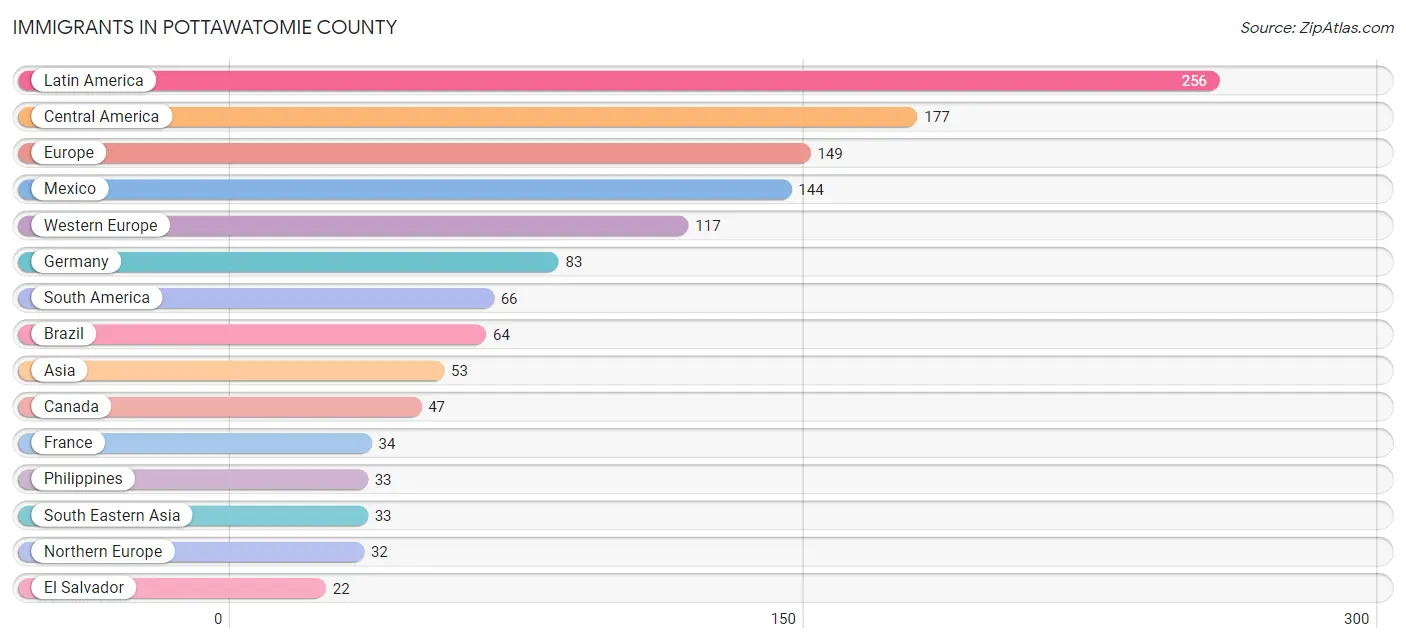
| Immigration Origin | # Population | % Population |
| Africa | 2 | 0.0% |
| Asia | 53 | 0.2% |
| Brazil | 64 | 0.3% |
| Canada | 47 | 0.2% |
| Caribbean | 13 | 0.1% |
| Central America | 177 | 0.7% |
| China | 8 | 0.0% |
| Eastern Asia | 16 | 0.1% |
| El Salvador | 22 | 0.1% |
| England | 16 | 0.1% |
| Europe | 149 | 0.6% |
| France | 34 | 0.1% |
| Germany | 83 | 0.3% |
| Haiti | 13 | 0.1% |
| Honduras | 11 | 0.0% |
| Iran | 4 | 0.0% |
| Korea | 8 | 0.0% |
| Latin America | 256 | 1.0% |
| Mexico | 144 | 0.6% |
| Northern Europe | 32 | 0.1% |
| Oceania | 21 | 0.1% |
| Philippines | 33 | 0.1% |
| Scotland | 3 | 0.0% |
| South Africa | 2 | 0.0% |
| South America | 66 | 0.3% |
| South Central Asia | 4 | 0.0% |
| South Eastern Asia | 33 | 0.1% |
| Venezuela | 2 | 0.0% |
| Western Europe | 117 | 0.5% | View All 29 Rows |
Sex and Age in Pottawatomie County
Sex and Age in Pottawatomie County
The most populous age groups in Pottawatomie County are 10 to 14 Years (1,167 | 9.1%) for men and 10 to 14 Years (1,116 | 8.8%) for women.
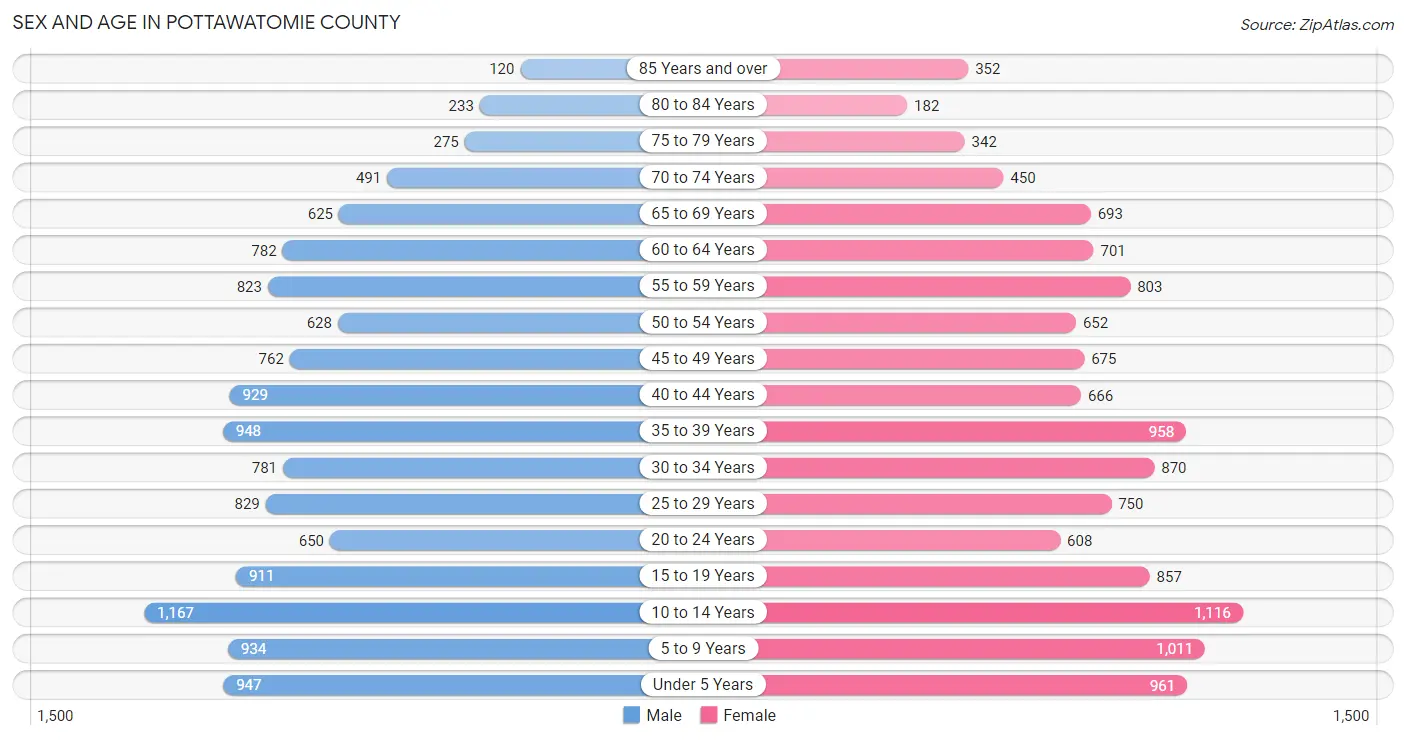
| Age Bracket | Male | Female |
| Under 5 Years | 947 (7.4%) | 961 (7.6%) |
| 5 to 9 Years | 934 (7.3%) | 1,011 (8.0%) |
| 10 to 14 Years | 1,167 (9.1%) | 1,116 (8.8%) |
| 15 to 19 Years | 911 (7.1%) | 857 (6.8%) |
| 20 to 24 Years | 650 (5.1%) | 608 (4.8%) |
| 25 to 29 Years | 829 (6.5%) | 750 (5.9%) |
| 30 to 34 Years | 781 (6.1%) | 870 (6.9%) |
| 35 to 39 Years | 948 (7.4%) | 958 (7.6%) |
| 40 to 44 Years | 929 (7.2%) | 666 (5.3%) |
| 45 to 49 Years | 762 (5.9%) | 675 (5.3%) |
| 50 to 54 Years | 628 (4.9%) | 652 (5.2%) |
| 55 to 59 Years | 823 (6.4%) | 803 (6.4%) |
| 60 to 64 Years | 782 (6.1%) | 701 (5.5%) |
| 65 to 69 Years | 625 (4.9%) | 693 (5.5%) |
| 70 to 74 Years | 491 (3.8%) | 450 (3.6%) |
| 75 to 79 Years | 275 (2.1%) | 342 (2.7%) |
| 80 to 84 Years | 233 (1.8%) | 182 (1.4%) |
| 85 Years and over | 120 (0.9%) | 352 (2.8%) |
| Total | 12,835 (100.0%) | 12,647 (100.0%) |
Families and Households in Pottawatomie County
Median Family Size in Pottawatomie County
The median family size in Pottawatomie County is 3.30 persons per family, with single male/father families (216 | 3.3%) accounting for the largest median family size of 3.56 persons per family. On the other hand, single female/mother families (568 | 8.6%) represent the smallest median family size with 2.89 persons per family.
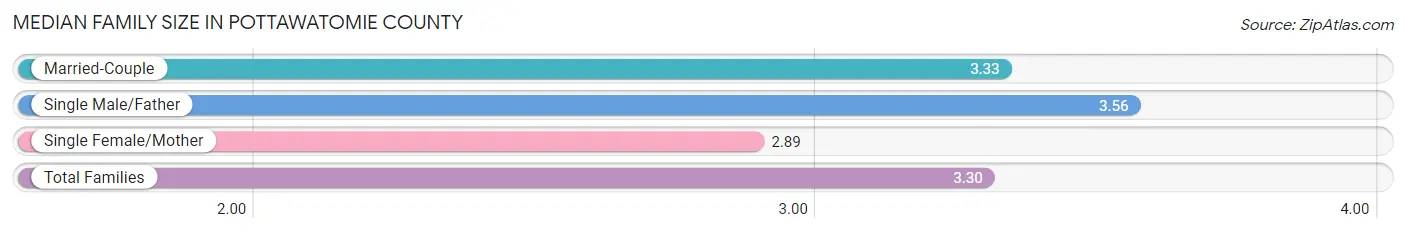
| Family Type | # Families | Family Size |
| Married-Couple | 5,827 (88.1%) | 3.33 |
| Single Male/Father | 216 (3.3%) | 3.56 |
| Single Female/Mother | 568 (8.6%) | 2.89 |
| Total Families | 6,611 (100.0%) | 3.30 |
Median Household Size in Pottawatomie County
The median household size in Pottawatomie County is 2.77 persons per household, with single male/father households (216 | 2.4%) accounting for the largest median household size of 4.25 persons per household. non-family households (2,443 | 27.0%) represent the smallest median household size with 1.18 persons per household.
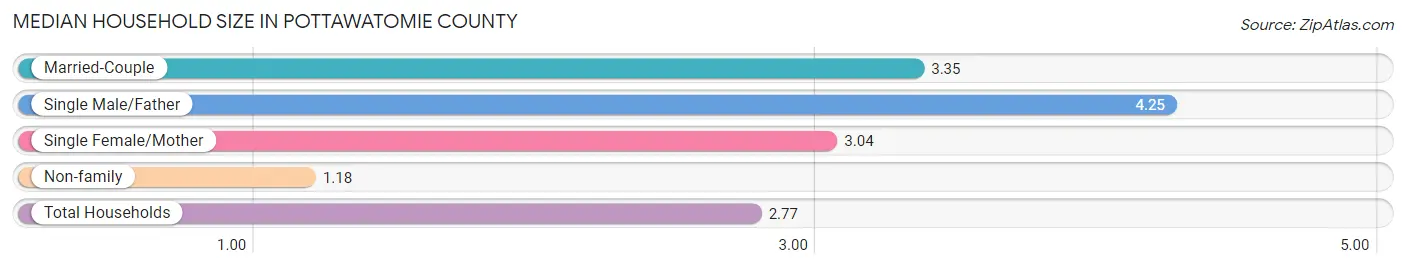
| Household Type | # Households | Household Size |
| Married-Couple | 5,827 (64.4%) | 3.35 |
| Single Male/Father | 216 (2.4%) | 4.25 |
| Single Female/Mother | 568 (6.3%) | 3.04 |
| Non-family | 2,443 (27.0%) | 1.18 |
| Total Households | 9,054 (100.0%) | 2.77 |
Household Size by Marriage Status in Pottawatomie County
Out of a total of 9,054 households in Pottawatomie County, 6,611 (73.0%) are family households, while 2,443 (27.0%) are nonfamily households. The most numerous type of family households are 2-person households, comprising 2,783, and the most common type of nonfamily households are 1-person households, comprising 2,120.
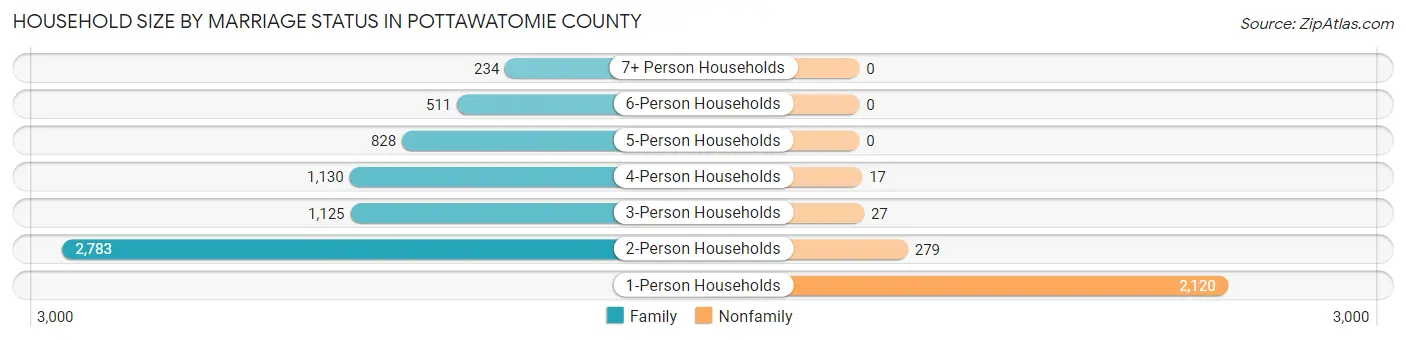
| Household Size | Family Households | Nonfamily Households |
| 1-Person Households | - | 2,120 (23.4%) |
| 2-Person Households | 2,783 (30.7%) | 279 (3.1%) |
| 3-Person Households | 1,125 (12.4%) | 27 (0.3%) |
| 4-Person Households | 1,130 (12.5%) | 17 (0.2%) |
| 5-Person Households | 828 (9.1%) | 0 (0.0%) |
| 6-Person Households | 511 (5.6%) | 0 (0.0%) |
| 7+ Person Households | 234 (2.6%) | 0 (0.0%) |
| Total | 6,611 (73.0%) | 2,443 (27.0%) |
Female Fertility in Pottawatomie County
Fertility by Age in Pottawatomie County
Average fertility rate in Pottawatomie County is 101.0 births per 1,000 women. Women in the age bracket of 20 to 34 years have the highest fertility rate with 138.0 births per 1,000 women. Women in the age bracket of 20 to 34 years acount for 55.1% of all women with births.
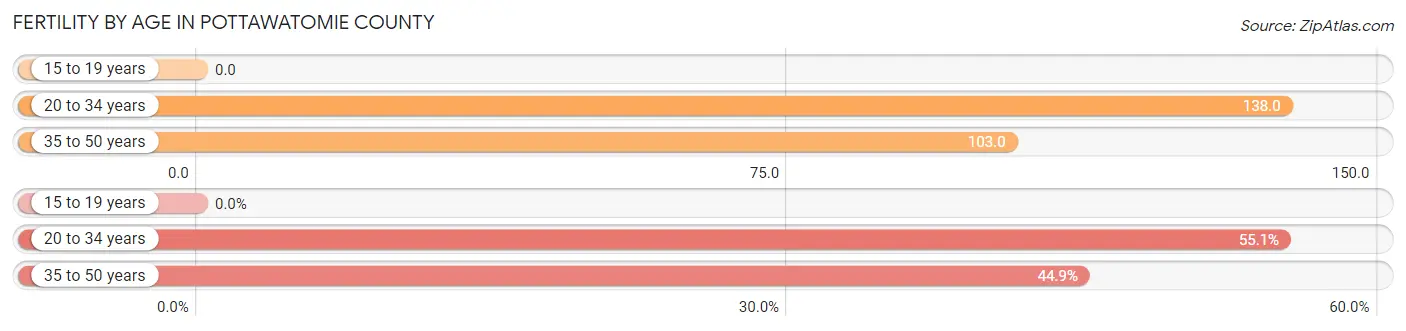
| Age Bracket | Women with Births | Births / 1,000 Women |
| 15 to 19 years | 0 (0.0%) | 0.0 |
| 20 to 34 years | 307 (55.1%) | 138.0 |
| 35 to 50 years | 250 (44.9%) | 103.0 |
| Total | 557 (100.0%) | 101.0 |
Fertility by Age by Marriage Status in Pottawatomie County
84.7% of women with births (557) in Pottawatomie County are married. The highest percentage of unmarried women with births falls into 20 to 34 years age bracket with 18.6% of them unmarried at the time of birth, while the lowest percentage of unmarried women with births belong to 35 to 50 years age bracket with 11.2% of them unmarried.
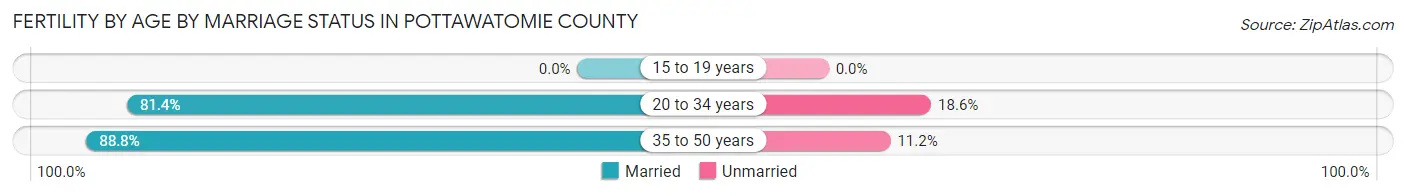
| Age Bracket | Married | Unmarried |
| 15 to 19 years | 0 (0.0%) | 0 (0.0%) |
| 20 to 34 years | 250 (81.4%) | 57 (18.6%) |
| 35 to 50 years | 222 (88.8%) | 28 (11.2%) |
| Total | 472 (84.7%) | 85 (15.3%) |
Fertility by Education in Pottawatomie County
Average fertility rate in Pottawatomie County is 101.0 births per 1,000 women. Women with the education attainment of high school diploma have the highest fertility rate of 209.0 births per 1,000 women, while women with the education attainment of less than high school have the lowest fertility at 23.0 births per 1,000 women. Women with the education attainment of college or associate's degree represent 39.0% of all women with births.
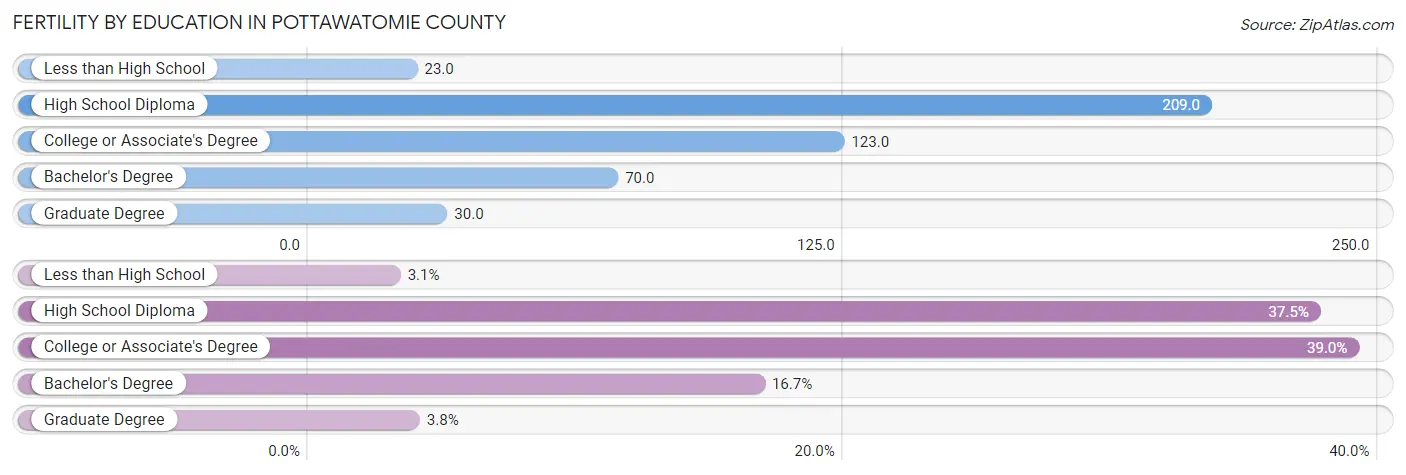
| Educational Attainment | Women with Births | Births / 1,000 Women |
| Less than High School | 17 (3.0%) | 23.0 |
| High School Diploma | 209 (37.5%) | 209.0 |
| College or Associate's Degree | 217 (39.0%) | 123.0 |
| Bachelor's Degree | 93 (16.7%) | 70.0 |
| Graduate Degree | 21 (3.8%) | 30.0 |
| Total | 557 (100.0%) | 101.0 |
Fertility by Education by Marriage Status in Pottawatomie County
15.3% of women with births in Pottawatomie County are unmarried. Women with the educational attainment of less than high school are most likely to be married with 100.0% of them married at childbirth, while women with the educational attainment of college or associate's degree are least likely to be married with 22.1% of them unmarried at childbirth.
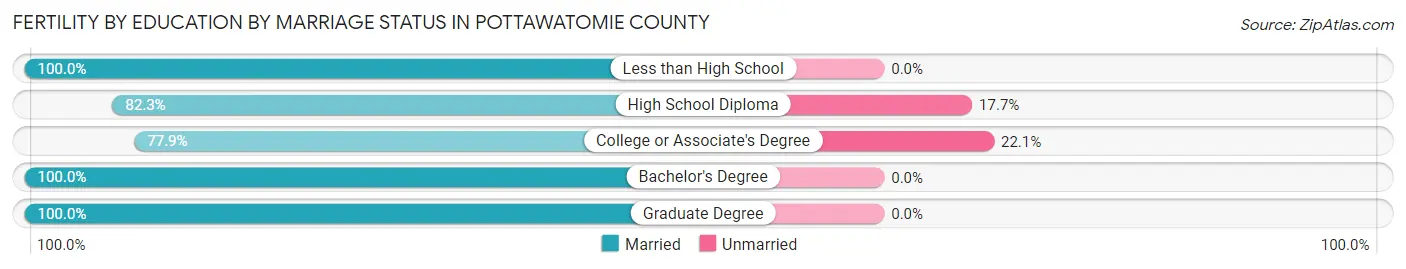
| Educational Attainment | Married | Unmarried |
| Less than High School | 17 (100.0%) | 0 (0.0%) |
| High School Diploma | 172 (82.3%) | 37 (17.7%) |
| College or Associate's Degree | 169 (77.9%) | 48 (22.1%) |
| Bachelor's Degree | 93 (100.0%) | 0 (0.0%) |
| Graduate Degree | 21 (100.0%) | 0 (0.0%) |
| Total | 472 (84.7%) | 85 (15.3%) |
Income in Pottawatomie County
Income Overview in Pottawatomie County
Per Capita Income in Pottawatomie County is $35,715, while median incomes of families and households are $100,295 and $85,241 respectively.
| Characteristic | Number | Measure |
| Per Capita Income | 25,482 | $35,715 |
| Median Family Income | 6,611 | $100,295 |
| Mean Family Income | 6,611 | $112,272 |
| Median Household Income | 9,054 | $85,241 |
| Mean Household Income | 9,054 | $97,130 |
| Income Deficit | 6,611 | $0 |
| Wage / Income Gap (%) | 25,482 | 39.43% |
| Wage / Income Gap ($) | 25,482 | 60.57¢ per $1 |
| Gini / Inequality Index | 25,482 | 0.39 |
Earnings by Sex in Pottawatomie County
Average Earnings in Pottawatomie County are $47,159, $57,560 for men and $34,863 for women, a difference of 39.4%.
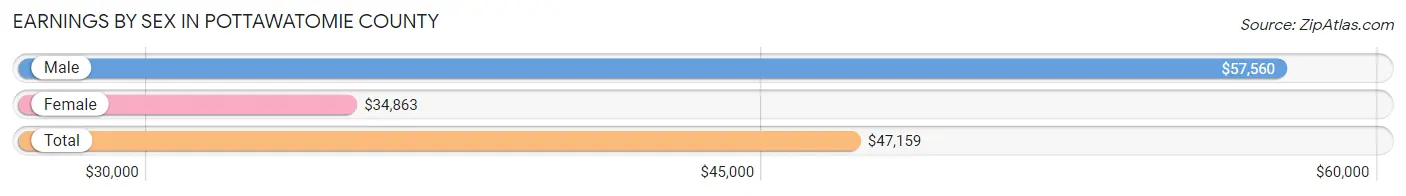
| Sex | Number | Average Earnings |
| Male | 7,467 (55.6%) | $57,560 |
| Female | 5,957 (44.4%) | $34,863 |
| Total | 13,424 (100.0%) | $47,159 |
Earnings by Sex by Income Bracket in Pottawatomie County
The most common earnings brackets in Pottawatomie County are $75,000 to $99,999 for men (1,265 | 16.9%) and $75,000 to $99,999 for women (597 | 10.0%).
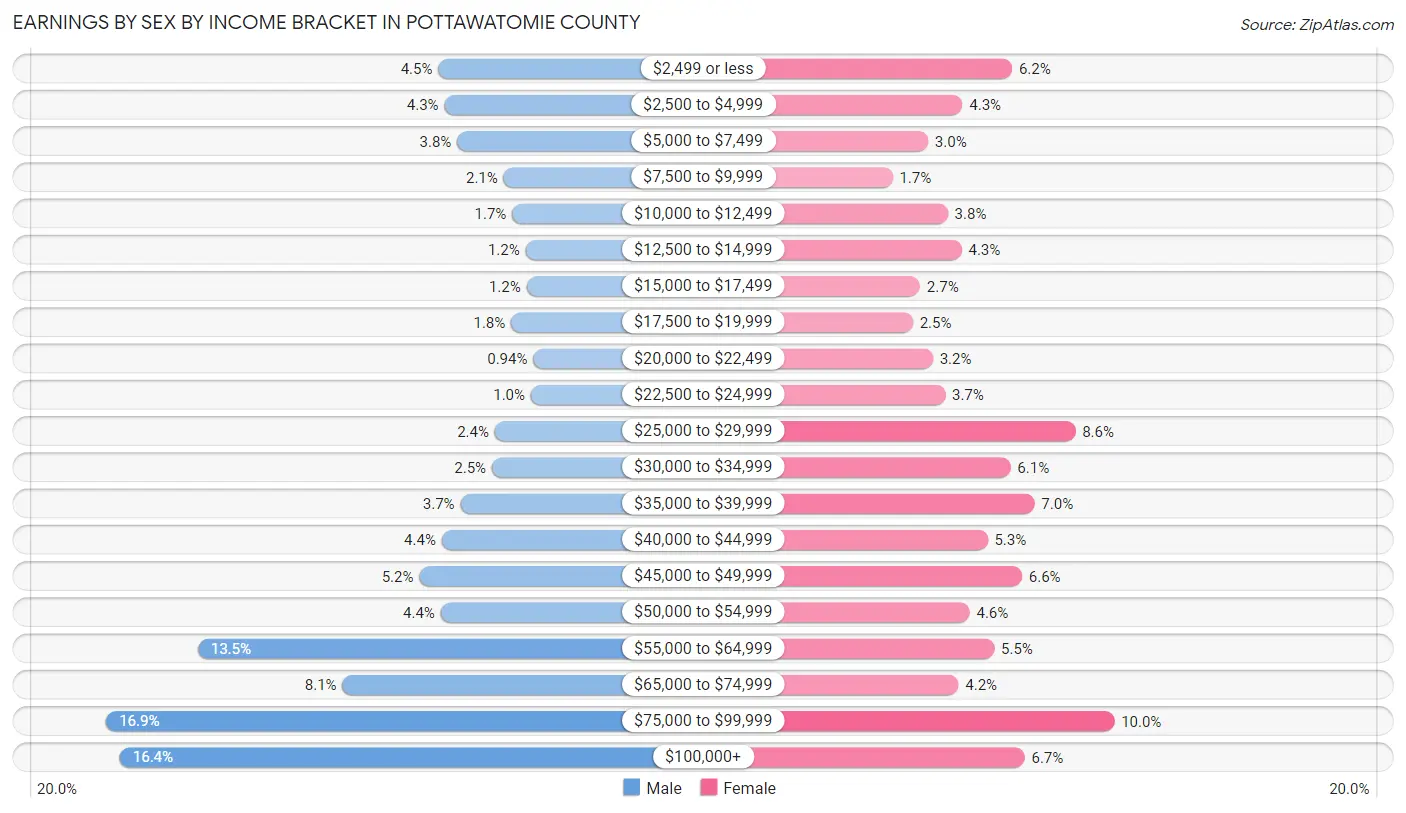
| Income | Male | Female |
| $2,499 or less | 336 (4.5%) | 369 (6.2%) |
| $2,500 to $4,999 | 319 (4.3%) | 258 (4.3%) |
| $5,000 to $7,499 | 283 (3.8%) | 181 (3.0%) |
| $7,500 to $9,999 | 153 (2.1%) | 102 (1.7%) |
| $10,000 to $12,499 | 129 (1.7%) | 225 (3.8%) |
| $12,500 to $14,999 | 92 (1.2%) | 256 (4.3%) |
| $15,000 to $17,499 | 89 (1.2%) | 163 (2.7%) |
| $17,500 to $19,999 | 132 (1.8%) | 147 (2.5%) |
| $20,000 to $22,499 | 70 (0.9%) | 192 (3.2%) |
| $22,500 to $24,999 | 77 (1.0%) | 219 (3.7%) |
| $25,000 to $29,999 | 178 (2.4%) | 510 (8.6%) |
| $30,000 to $34,999 | 186 (2.5%) | 365 (6.1%) |
| $35,000 to $39,999 | 274 (3.7%) | 419 (7.0%) |
| $40,000 to $44,999 | 326 (4.4%) | 314 (5.3%) |
| $45,000 to $49,999 | 389 (5.2%) | 391 (6.6%) |
| $50,000 to $54,999 | 329 (4.4%) | 274 (4.6%) |
| $55,000 to $64,999 | 1,009 (13.5%) | 329 (5.5%) |
| $65,000 to $74,999 | 604 (8.1%) | 249 (4.2%) |
| $75,000 to $99,999 | 1,265 (16.9%) | 597 (10.0%) |
| $100,000+ | 1,227 (16.4%) | 397 (6.7%) |
| Total | 7,467 (100.0%) | 5,957 (100.0%) |
Earnings by Sex by Educational Attainment in Pottawatomie County
Average earnings in Pottawatomie County are $62,826 for men and $39,865 for women, a difference of 36.5%. Men with an educational attainment of graduate degree enjoy the highest average annual earnings of $98,975, while those with less than high school education earn the least with $40,000. Women with an educational attainment of graduate degree earn the most with the average annual earnings of $75,391, while those with less than high school education have the smallest earnings of $28,790.
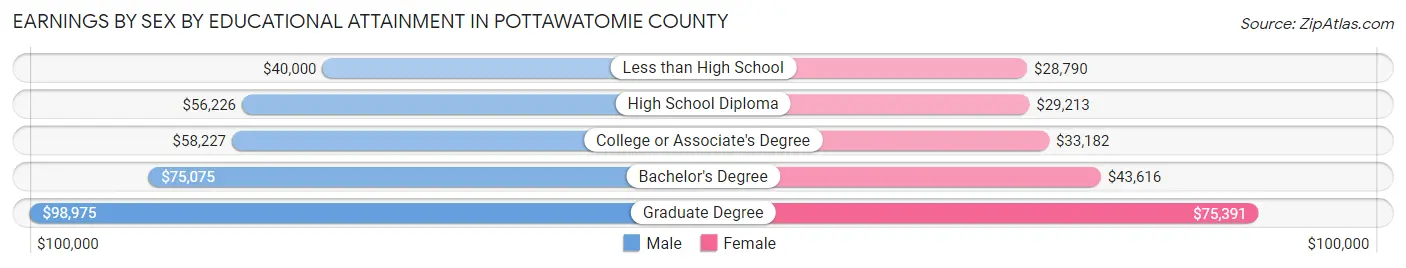
| Educational Attainment | Male Income | Female Income |
| Less than High School | $40,000 | $28,790 |
| High School Diploma | $56,226 | $29,213 |
| College or Associate's Degree | $58,227 | $33,182 |
| Bachelor's Degree | $75,075 | $43,616 |
| Graduate Degree | $98,975 | $75,391 |
| Total | $62,826 | $39,865 |
Family Income in Pottawatomie County
Family Income Brackets in Pottawatomie County
According to the Pottawatomie County family income data, there are 1,811 families falling into the $100,000 to $149,999 income range, which is the most common income bracket and makes up 27.4% of all families. Conversely, the less than $10,000 income bracket is the least frequent group with only 132 families (2.0%) belonging to this category.
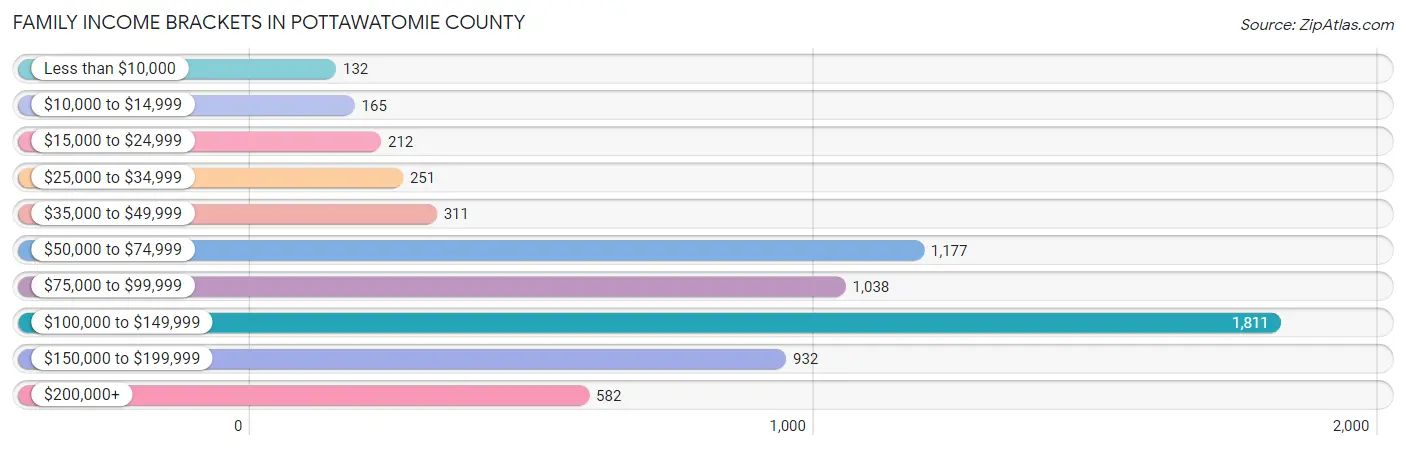
| Income Bracket | # Families | % Families |
| Less than $10,000 | 132 | 2.0% |
| $10,000 to $14,999 | 165 | 2.5% |
| $15,000 to $24,999 | 212 | 3.2% |
| $25,000 to $34,999 | 251 | 3.8% |
| $35,000 to $49,999 | 311 | 4.7% |
| $50,000 to $74,999 | 1,177 | 17.8% |
| $75,000 to $99,999 | 1,038 | 15.7% |
| $100,000 to $149,999 | 1,811 | 27.4% |
| $150,000 to $199,999 | 932 | 14.1% |
| $200,000+ | 582 | 8.8% |
Family Income by Famaliy Size in Pottawatomie County
5-person families (743 | 11.2%) account for the highest median family income in Pottawatomie County with $131,953 per family, while 2-person families (2,849 | 43.1%) have the highest median income of $46,484 per family member.
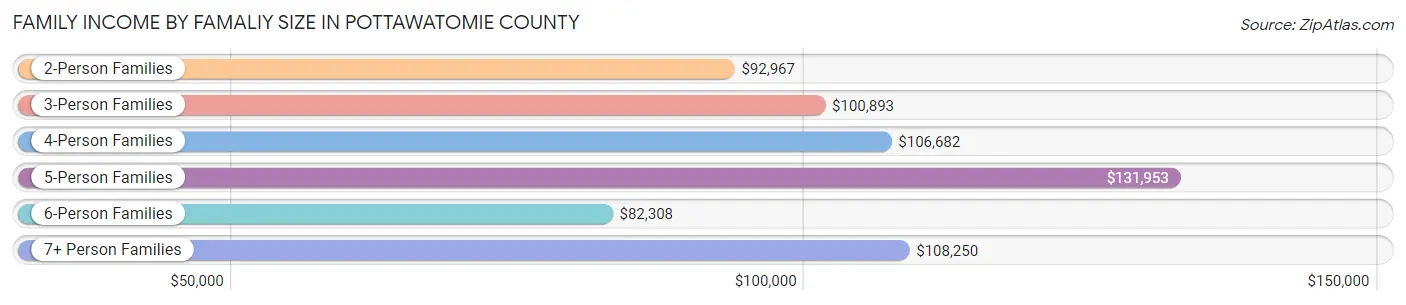
| Income Bracket | # Families | Median Income |
| 2-Person Families | 2,849 (43.1%) | $92,967 |
| 3-Person Families | 1,146 (17.3%) | $100,893 |
| 4-Person Families | 1,130 (17.1%) | $106,682 |
| 5-Person Families | 743 (11.2%) | $131,953 |
| 6-Person Families | 520 (7.9%) | $82,308 |
| 7+ Person Families | 223 (3.4%) | $108,250 |
| Total | 6,611 (100.0%) | $100,295 |
Family Income by Number of Earners in Pottawatomie County
The median family income in Pottawatomie County is $100,295, with families comprising 3+ earners (945) having the highest median family income of $149,583, while families with no earners (720) have the lowest median family income of $55,568, accounting for 14.3% and 10.9% of families, respectively.
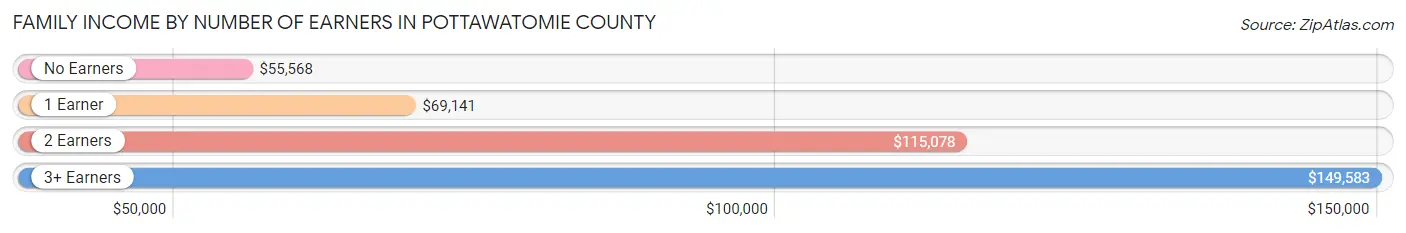
| Number of Earners | # Families | Median Income |
| No Earners | 720 (10.9%) | $55,568 |
| 1 Earner | 1,895 (28.7%) | $69,141 |
| 2 Earners | 3,051 (46.2%) | $115,078 |
| 3+ Earners | 945 (14.3%) | $149,583 |
| Total | 6,611 (100.0%) | $100,295 |
Household Income in Pottawatomie County
Household Income Brackets in Pottawatomie County
With 2,146 households falling in the category, the $100,000 to $149,999 income range is the most frequent in Pottawatomie County, accounting for 23.7% of all households. In contrast, only 235 households (2.6%) fall into the less than $10,000 income bracket, making it the least populous group.
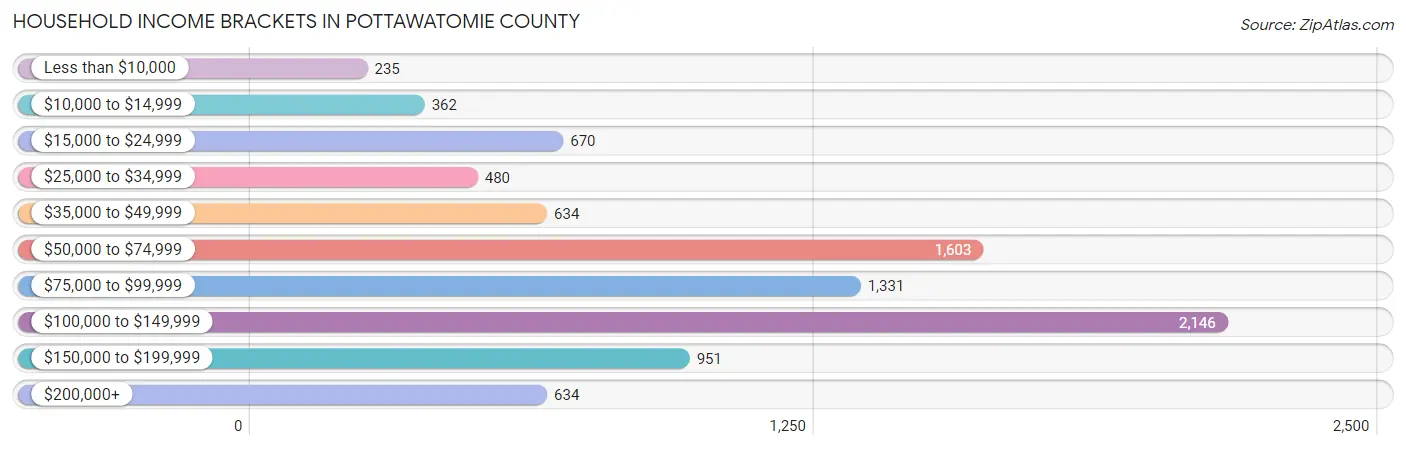
| Income Bracket | # Households | % Households |
| Less than $10,000 | 235 | 2.6% |
| $10,000 to $14,999 | 362 | 4.0% |
| $15,000 to $24,999 | 670 | 7.4% |
| $25,000 to $34,999 | 480 | 5.3% |
| $35,000 to $49,999 | 634 | 7.0% |
| $50,000 to $74,999 | 1,603 | 17.7% |
| $75,000 to $99,999 | 1,331 | 14.7% |
| $100,000 to $149,999 | 2,146 | 23.7% |
| $150,000 to $199,999 | 951 | 10.5% |
| $200,000+ | 634 | 7.0% |
Household Income by Householder Age in Pottawatomie County
The median household income in Pottawatomie County is $85,241, with the highest median household income of $100,833 found in the 45 to 64 years age bracket for the primary householder. A total of 3,144 households (34.7%) fall into this category. Meanwhile, the 65+ years age bracket for the primary householder has the lowest median household income of $48,899, with 2,354 households (26.0%) in this group.
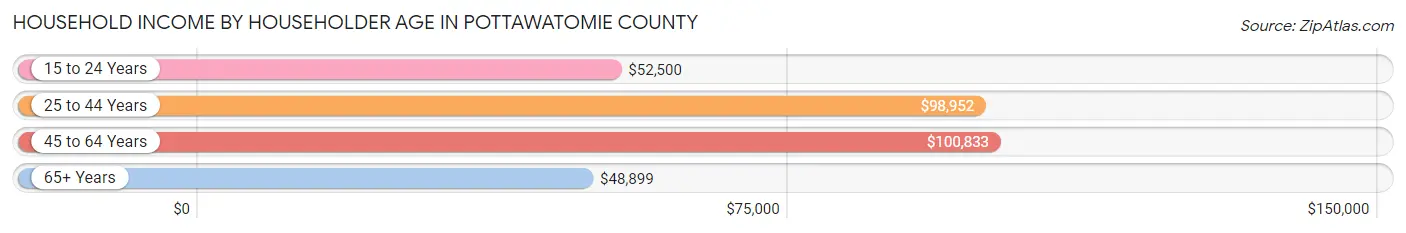
| Income Bracket | # Households | Median Income |
| 15 to 24 Years | 216 (2.4%) | $52,500 |
| 25 to 44 Years | 3,340 (36.9%) | $98,952 |
| 45 to 64 Years | 3,144 (34.7%) | $100,833 |
| 65+ Years | 2,354 (26.0%) | $48,899 |
| Total | 9,054 (100.0%) | $85,241 |
Poverty in Pottawatomie County
Income Below Poverty by Sex and Age in Pottawatomie County
With 4.9% poverty level for males and 9.7% for females among the residents of Pottawatomie County, under 5 year old males and 5 year old females are the most vulnerable to poverty, with 184 males (19.6%) and 78 females (36.6%) in their respective age groups living below the poverty level.
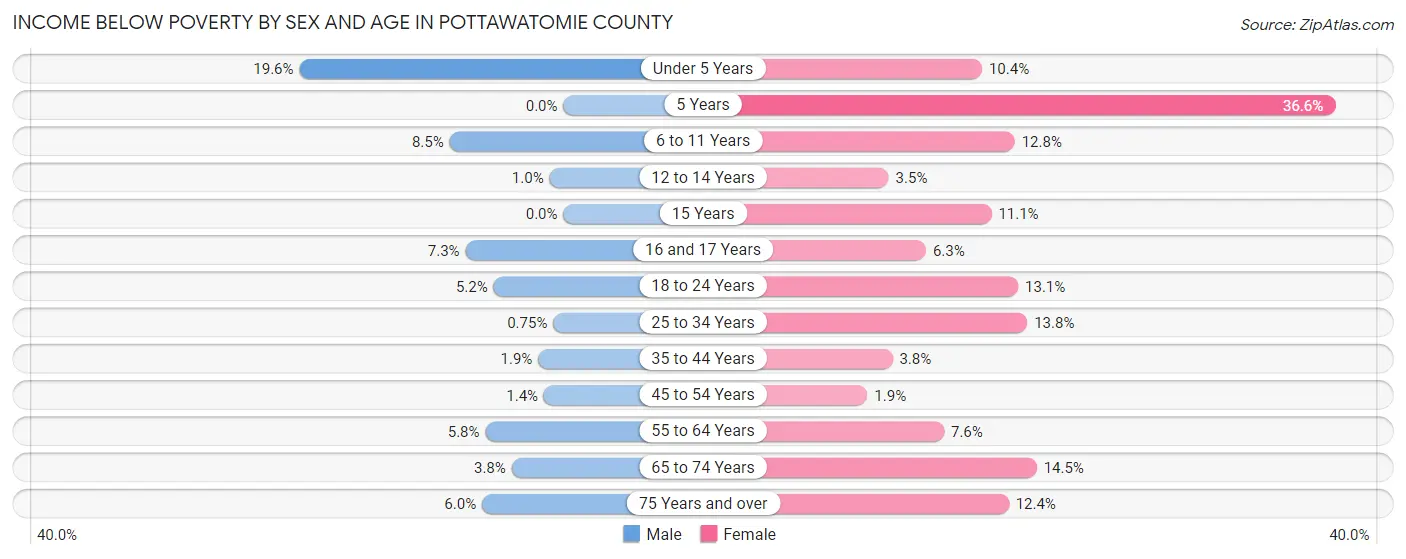
| Age Bracket | Male | Female |
| Under 5 Years | 184 (19.6%) | 100 (10.4%) |
| 5 Years | 0 (0.0%) | 78 (36.6%) |
| 6 to 11 Years | 106 (8.5%) | 165 (12.8%) |
| 12 to 14 Years | 7 (1.0%) | 21 (3.5%) |
| 15 Years | 0 (0.0%) | 26 (11.1%) |
| 16 and 17 Years | 36 (7.3%) | 23 (6.2%) |
| 18 to 24 Years | 46 (5.2%) | 113 (13.1%) |
| 25 to 34 Years | 12 (0.7%) | 223 (13.8%) |
| 35 to 44 Years | 35 (1.9%) | 61 (3.8%) |
| 45 to 54 Years | 20 (1.4%) | 25 (1.9%) |
| 55 to 64 Years | 90 (5.8%) | 114 (7.6%) |
| 65 to 74 Years | 42 (3.8%) | 160 (14.5%) |
| 75 Years and over | 36 (6.0%) | 98 (12.4%) |
| Total | 614 (4.9%) | 1,207 (9.7%) |
Income Above Poverty by Sex and Age in Pottawatomie County
According to the poverty statistics in Pottawatomie County, males aged 5 years and females aged 45 to 54 years are the age groups that are most secure financially, with 100.0% of males and 98.1% of females in these age groups living above the poverty line.
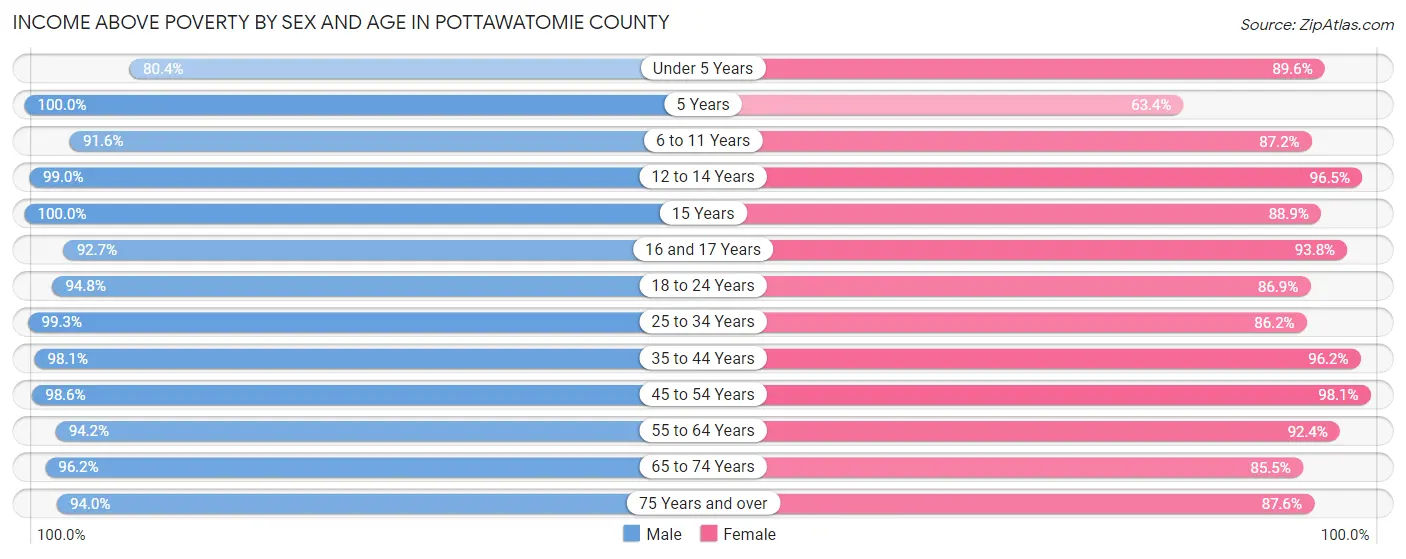
| Age Bracket | Male | Female |
| Under 5 Years | 755 (80.4%) | 861 (89.6%) |
| 5 Years | 157 (100.0%) | 135 (63.4%) |
| 6 to 11 Years | 1,148 (91.5%) | 1,120 (87.2%) |
| 12 to 14 Years | 674 (99.0%) | 582 (96.5%) |
| 15 Years | 123 (100.0%) | 208 (88.9%) |
| 16 and 17 Years | 459 (92.7%) | 345 (93.8%) |
| 18 to 24 Years | 842 (94.8%) | 750 (86.9%) |
| 25 to 34 Years | 1,586 (99.3%) | 1,397 (86.2%) |
| 35 to 44 Years | 1,833 (98.1%) | 1,563 (96.2%) |
| 45 to 54 Years | 1,367 (98.6%) | 1,291 (98.1%) |
| 55 to 64 Years | 1,464 (94.2%) | 1,388 (92.4%) |
| 65 to 74 Years | 1,053 (96.2%) | 946 (85.5%) |
| 75 Years and over | 560 (94.0%) | 693 (87.6%) |
| Total | 12,021 (95.1%) | 11,279 (90.3%) |
Income Below Poverty Among Married-Couple Families in Pottawatomie County
The poverty statistics for married-couple families in Pottawatomie County show that 1.9% or 113 of the total 5,827 families live below the poverty line. Families with 5 or more children have the highest poverty rate of 6.9%, comprising of 12 families. On the other hand, families with 3 or 4 children have the lowest poverty rate of 0.2%, which includes 2 families.
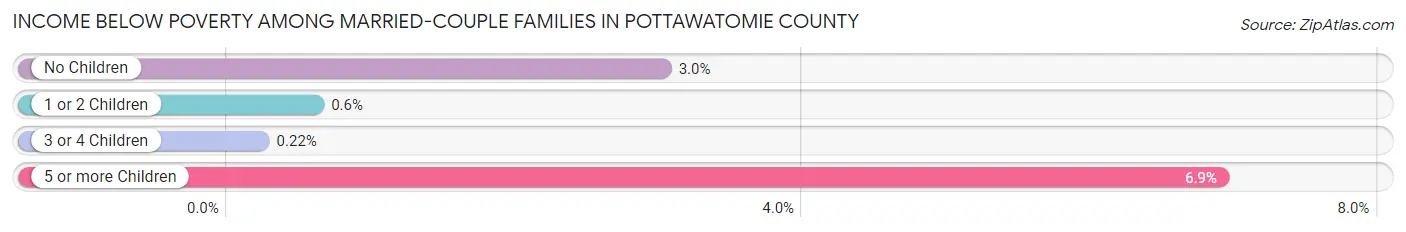
| Children | Above Poverty | Below Poverty |
| No Children | 2,827 (97.0%) | 88 (3.0%) |
| 1 or 2 Children | 1,837 (99.4%) | 11 (0.6%) |
| 3 or 4 Children | 888 (99.8%) | 2 (0.2%) |
| 5 or more Children | 162 (93.1%) | 12 (6.9%) |
| Total | 5,714 (98.1%) | 113 (1.9%) |
Income Below Poverty Among Single-Parent Households in Pottawatomie County
According to the poverty data in Pottawatomie County, 9.3% or 20 single-father households and 46.8% or 266 single-mother households are living below the poverty line. Among single-father households, those with 3 or 4 children have the highest poverty rate, with 20 households (24.7%) experiencing poverty. Likewise, among single-mother households, those with 5 or more children have the highest poverty rate, with 45 households (100.0%) falling below the poverty line.
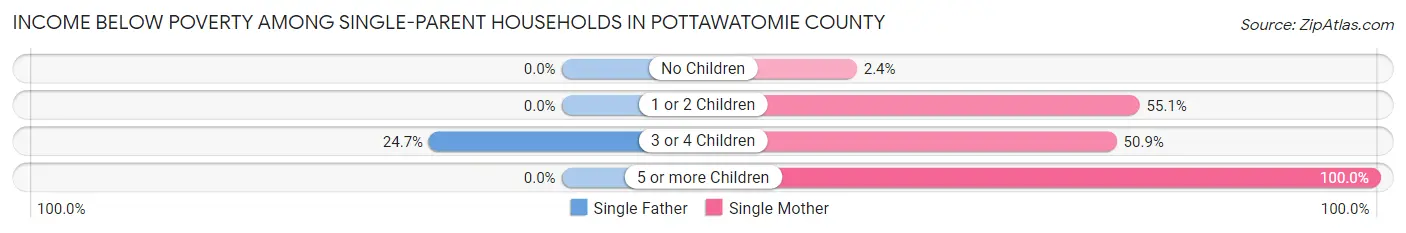
| Children | Single Father | Single Mother |
| No Children | 0 (0.0%) | 3 (2.4%) |
| 1 or 2 Children | 0 (0.0%) | 188 (55.1%) |
| 3 or 4 Children | 20 (24.7%) | 30 (50.8%) |
| 5 or more Children | 0 (0.0%) | 45 (100.0%) |
| Total | 20 (9.3%) | 266 (46.8%) |
Income Below Poverty Among Married-Couple vs Single-Parent Households in Pottawatomie County
The poverty data for Pottawatomie County shows that 113 of the married-couple family households (1.9%) and 286 of the single-parent households (36.5%) are living below the poverty level. Within the married-couple family households, those with 5 or more children have the highest poverty rate, with 12 households (6.9%) falling below the poverty line. Among the single-parent households, those with 5 or more children have the highest poverty rate, with 45 household (80.4%) living below poverty.
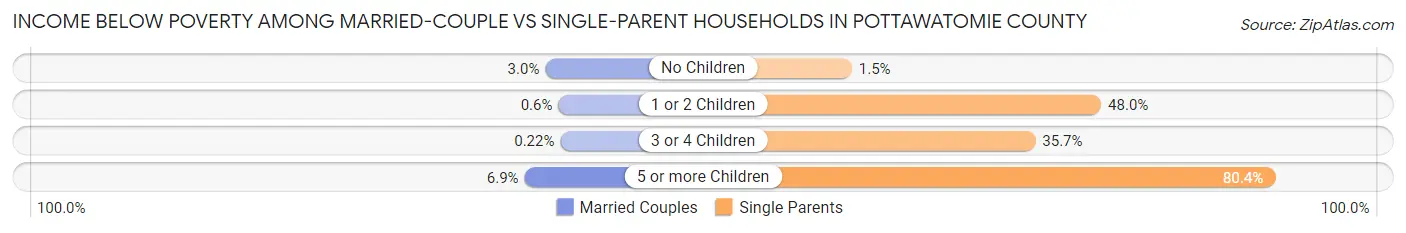
| Children | Married-Couple Families | Single-Parent Households |
| No Children | 88 (3.0%) | 3 (1.5%) |
| 1 or 2 Children | 11 (0.6%) | 188 (48.0%) |
| 3 or 4 Children | 2 (0.2%) | 50 (35.7%) |
| 5 or more Children | 12 (6.9%) | 45 (80.4%) |
| Total | 113 (1.9%) | 286 (36.5%) |
Employment Characteristics in Pottawatomie County
Employment by Class of Employer in Pottawatomie County
Among the 12,366 employed individuals in Pottawatomie County, private company employees (6,604 | 53.4%), state government employees (1,554 | 12.6%), and not-for-profit organizations (1,330 | 10.8%) make up the most common classes of employment.
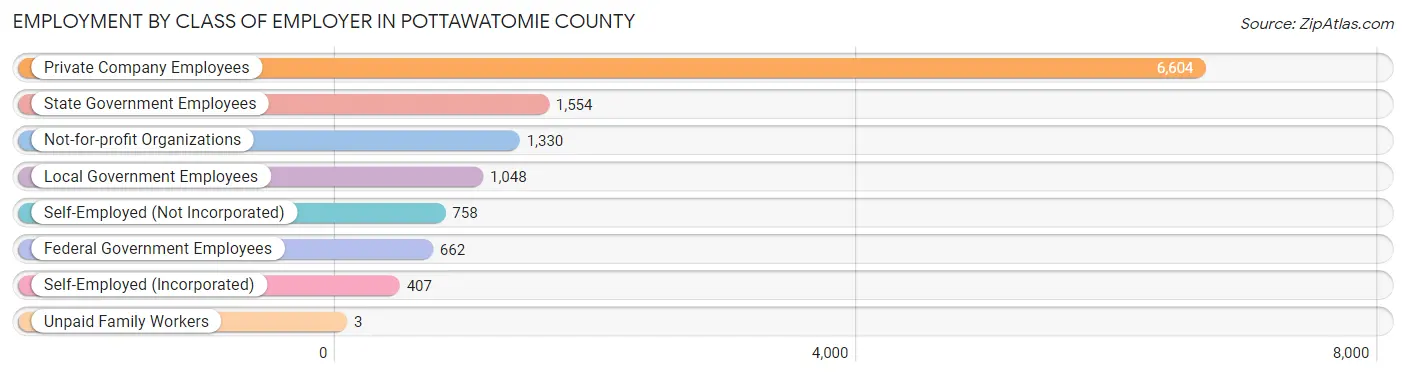
| Employer Class | # Employees | % Employees |
| Private Company Employees | 6,604 | 53.4% |
| Self-Employed (Incorporated) | 407 | 3.3% |
| Self-Employed (Not Incorporated) | 758 | 6.1% |
| Not-for-profit Organizations | 1,330 | 10.8% |
| Local Government Employees | 1,048 | 8.5% |
| State Government Employees | 1,554 | 12.6% |
| Federal Government Employees | 662 | 5.3% |
| Unpaid Family Workers | 3 | 0.0% |
| Total | 12,366 | 100.0% |
Employment Status by Age in Pottawatomie County
According to the labor force statistics for Pottawatomie County, out of the total population over 16 years of age (18,989), 67.2% or 12,761 individuals are in the labor force, with 1.9% or 242 of them unemployed. The age group with the highest labor force participation rate is 45 to 54 years, with 90.8% or 2,467 individuals in the labor force. Within the labor force, the 16 to 19 years age range has the highest percentage of unemployed individuals, with 7.0% or 52 of them being unemployed.
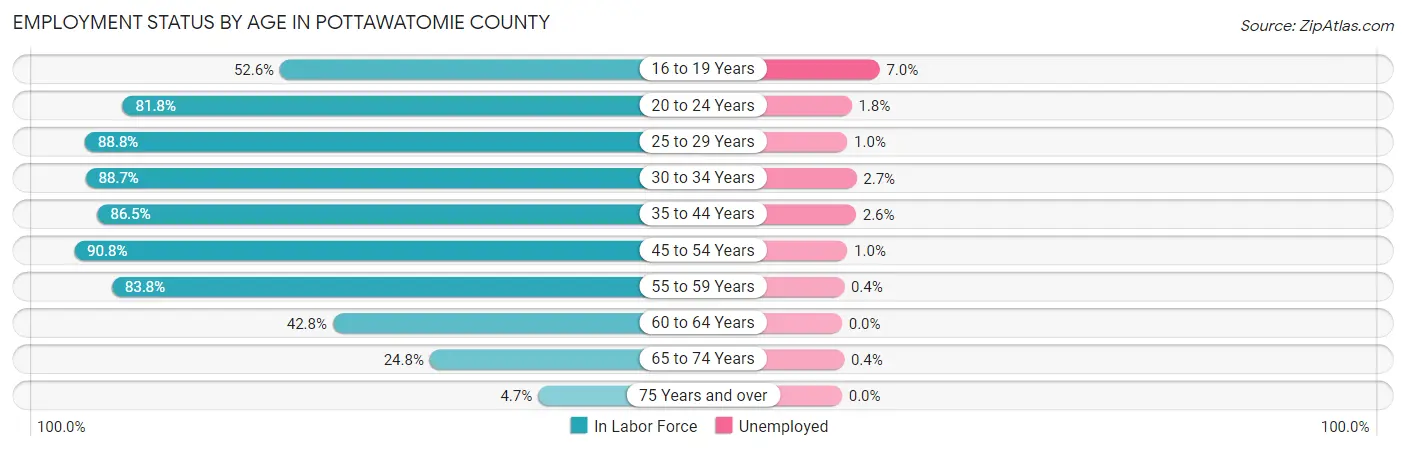
| Age Bracket | In Labor Force | Unemployed |
| 16 to 19 Years | 742 (52.6%) | 52 (7.0%) |
| 20 to 24 Years | 1,029 (81.8%) | 19 (1.8%) |
| 25 to 29 Years | 1,402 (88.8%) | 14 (1.0%) |
| 30 to 34 Years | 1,464 (88.7%) | 40 (2.7%) |
| 35 to 44 Years | 3,028 (86.5%) | 79 (2.6%) |
| 45 to 54 Years | 2,467 (90.8%) | 25 (1.0%) |
| 55 to 59 Years | 1,363 (83.8%) | 5 (0.4%) |
| 60 to 64 Years | 635 (42.8%) | 0 (0.0%) |
| 65 to 74 Years | 560 (24.8%) | 2 (0.4%) |
| 75 Years and over | 71 (4.7%) | 0 (0.0%) |
| Total | 12,761 (67.2%) | 242 (1.9%) |
Employment Status by Educational Attainment in Pottawatomie County
According to labor force statistics for Pottawatomie County, 82.5% of individuals (10,360) out of the total population between 25 and 64 years of age (12,557) are in the labor force, with 1.6% or 166 of them being unemployed. The group with the highest labor force participation rate are those with the educational attainment of bachelor's degree or higher, with 89.0% or 4,642 individuals in the labor force. Within the labor force, individuals with less than high school education have the highest percentage of unemployment, with 1.9% or 4 of them being unemployed.
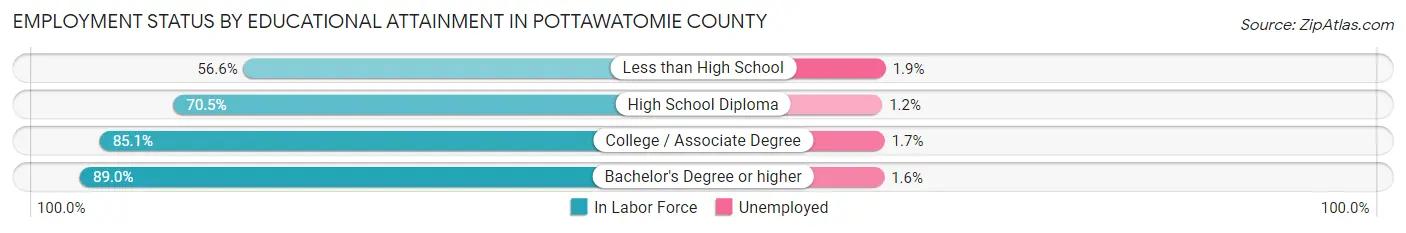
| Educational Attainment | In Labor Force | Unemployed |
| Less than High School | 209 (56.6%) | 7 (1.9%) |
| High School Diploma | 2,087 (70.5%) | 36 (1.2%) |
| College / Associate Degree | 3,414 (85.1%) | 68 (1.7%) |
| Bachelor's Degree or higher | 4,642 (89.0%) | 83 (1.6%) |
| Total | 10,360 (82.5%) | 201 (1.6%) |
Employment Occupations by Sex in Pottawatomie County
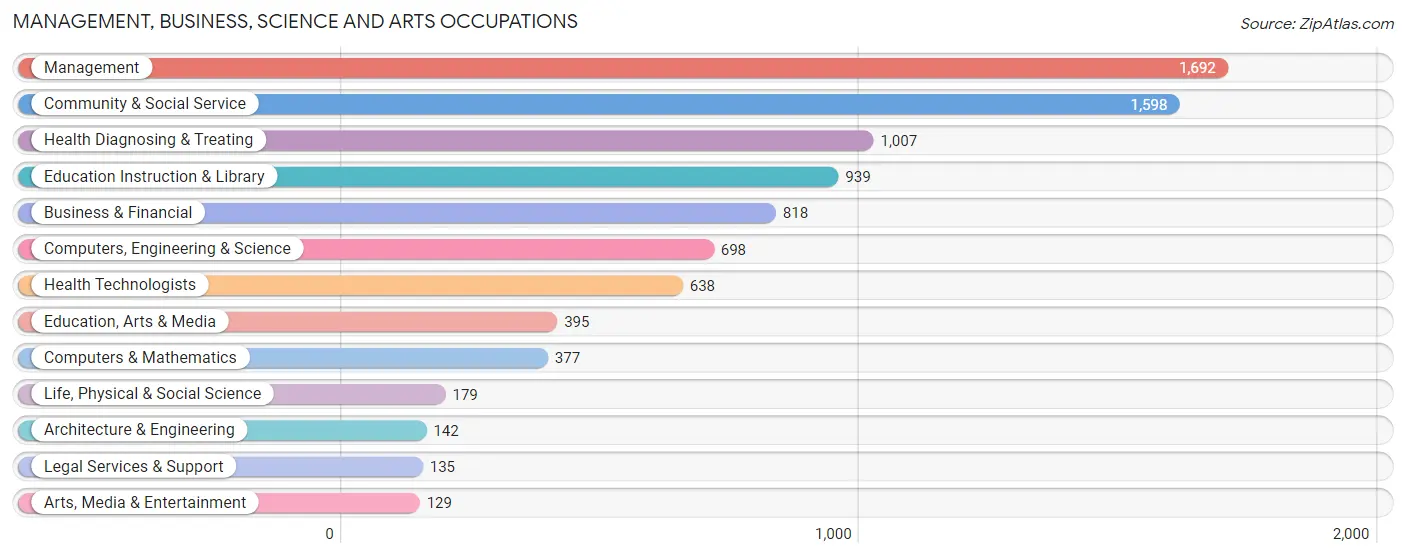
Management, Business, Science and Arts Occupations
The most common Management, Business, Science and Arts occupations in Pottawatomie County are Management (1,692 | 13.7%), Community & Social Service (1,598 | 12.9%), Health Diagnosing & Treating (1,007 | 8.2%), Education Instruction & Library (939 | 7.6%), and Business & Financial (818 | 6.6%).
Management, Business, Science and Arts Occupations by Sex
Within the Management, Business, Science and Arts occupations in Pottawatomie County, the most male-oriented occupations are Architecture & Engineering (86.6%), Computers & Mathematics (86.5%), and Arts, Media & Entertainment (84.5%), while the most female-oriented occupations are Legal Services & Support (100.0%), Health Technologists (77.1%), and Health Diagnosing & Treating (72.0%).
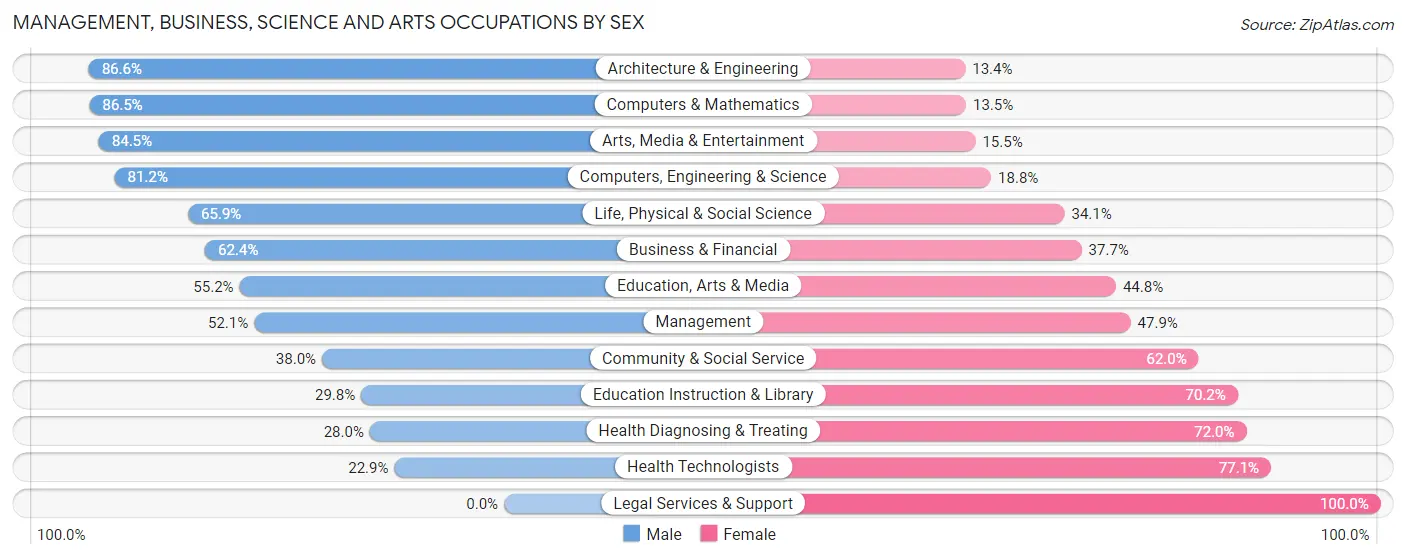
| Occupation | Male | Female |
| Management | 882 (52.1%) | 810 (47.9%) |
| Business & Financial | 510 (62.4%) | 308 (37.7%) |
| Computers, Engineering & Science | 567 (81.2%) | 131 (18.8%) |
| Computers & Mathematics | 326 (86.5%) | 51 (13.5%) |
| Architecture & Engineering | 123 (86.6%) | 19 (13.4%) |
| Life, Physical & Social Science | 118 (65.9%) | 61 (34.1%) |
| Community & Social Service | 607 (38.0%) | 991 (62.0%) |
| Education, Arts & Media | 218 (55.2%) | 177 (44.8%) |
| Legal Services & Support | 0 (0.0%) | 135 (100.0%) |
| Education Instruction & Library | 280 (29.8%) | 659 (70.2%) |
| Arts, Media & Entertainment | 109 (84.5%) | 20 (15.5%) |
| Health Diagnosing & Treating | 282 (28.0%) | 725 (72.0%) |
| Health Technologists | 146 (22.9%) | 492 (77.1%) |
| Total (Category) | 2,848 (49.0%) | 2,965 (51.0%) |
| Total (Overall) | 6,789 (54.9%) | 5,567 (45.1%) |
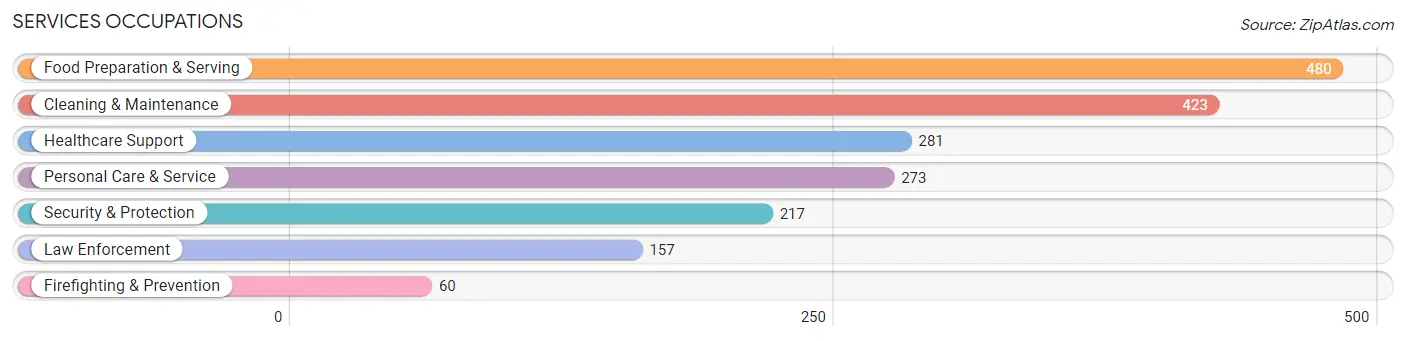
Services Occupations
The most common Services occupations in Pottawatomie County are Food Preparation & Serving (480 | 3.9%), Cleaning & Maintenance (423 | 3.4%), Healthcare Support (281 | 2.3%), Personal Care & Service (273 | 2.2%), and Security & Protection (217 | 1.8%).
Services Occupations by Sex
Within the Services occupations in Pottawatomie County, the most male-oriented occupations are Firefighting & Prevention (100.0%), Security & Protection (99.5%), and Law Enforcement (99.4%), while the most female-oriented occupations are Healthcare Support (85.4%), Personal Care & Service (84.6%), and Food Preparation & Serving (62.3%).
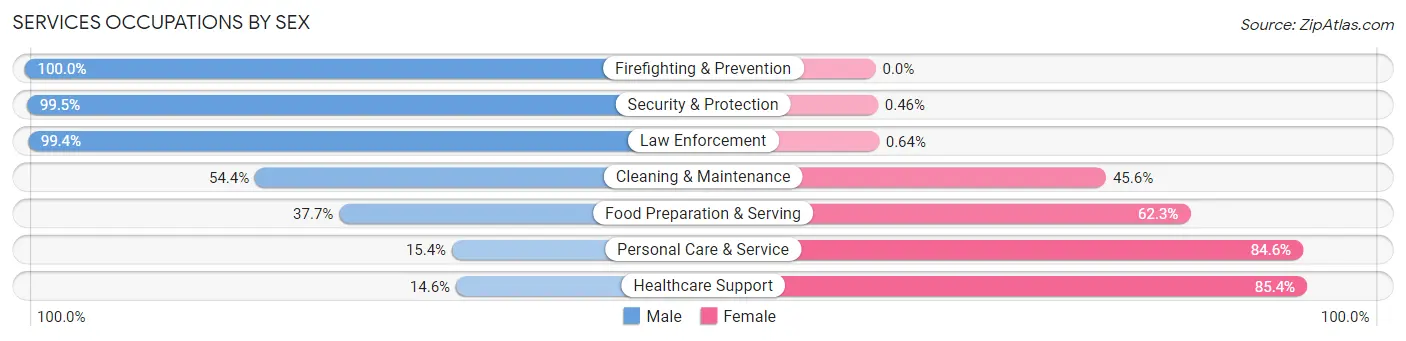
| Occupation | Male | Female |
| Healthcare Support | 41 (14.6%) | 240 (85.4%) |
| Security & Protection | 216 (99.5%) | 1 (0.5%) |
| Firefighting & Prevention | 60 (100.0%) | 0 (0.0%) |
| Law Enforcement | 156 (99.4%) | 1 (0.6%) |
| Food Preparation & Serving | 181 (37.7%) | 299 (62.3%) |
| Cleaning & Maintenance | 230 (54.4%) | 193 (45.6%) |
| Personal Care & Service | 42 (15.4%) | 231 (84.6%) |
| Total (Category) | 710 (42.4%) | 964 (57.6%) |
| Total (Overall) | 6,789 (54.9%) | 5,567 (45.1%) |
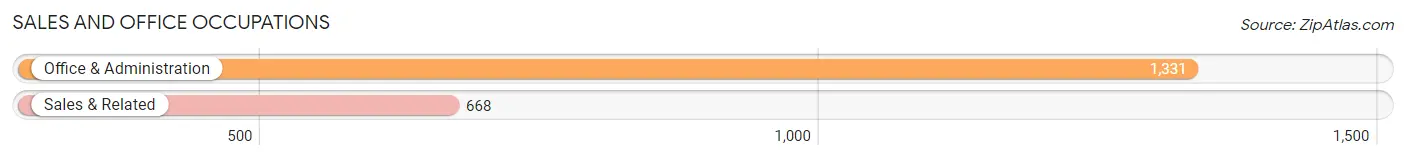
Sales and Office Occupations
The most common Sales and Office occupations in Pottawatomie County are Office & Administration (1,331 | 10.8%), and Sales & Related (668 | 5.4%).
Sales and Office Occupations by Sex
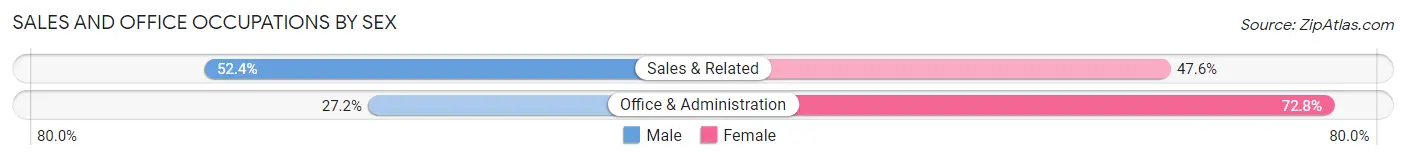
| Occupation | Male | Female |
| Sales & Related | 350 (52.4%) | 318 (47.6%) |
| Office & Administration | 362 (27.2%) | 969 (72.8%) |
| Total (Category) | 712 (35.6%) | 1,287 (64.4%) |
| Total (Overall) | 6,789 (54.9%) | 5,567 (45.1%) |
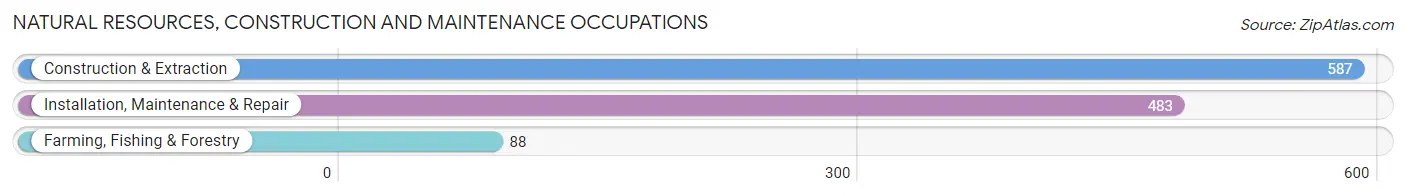
Natural Resources, Construction and Maintenance Occupations
The most common Natural Resources, Construction and Maintenance occupations in Pottawatomie County are Construction & Extraction (587 | 4.8%), Installation, Maintenance & Repair (483 | 3.9%), and Farming, Fishing & Forestry (88 | 0.7%).
Natural Resources, Construction and Maintenance Occupations by Sex
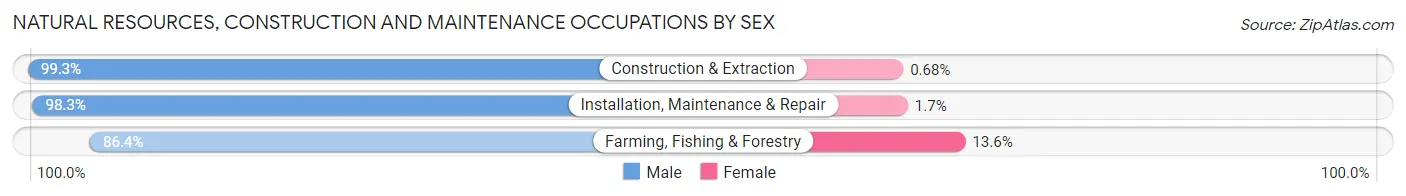
| Occupation | Male | Female |
| Farming, Fishing & Forestry | 76 (86.4%) | 12 (13.6%) |
| Construction & Extraction | 583 (99.3%) | 4 (0.7%) |
| Installation, Maintenance & Repair | 475 (98.3%) | 8 (1.7%) |
| Total (Category) | 1,134 (97.9%) | 24 (2.1%) |
| Total (Overall) | 6,789 (54.9%) | 5,567 (45.1%) |
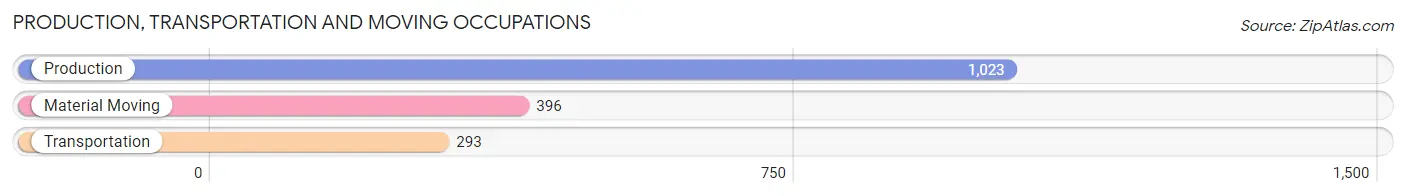
Production, Transportation and Moving Occupations
The most common Production, Transportation and Moving occupations in Pottawatomie County are Production (1,023 | 8.3%), Material Moving (396 | 3.2%), and Transportation (293 | 2.4%).
Production, Transportation and Moving Occupations by Sex
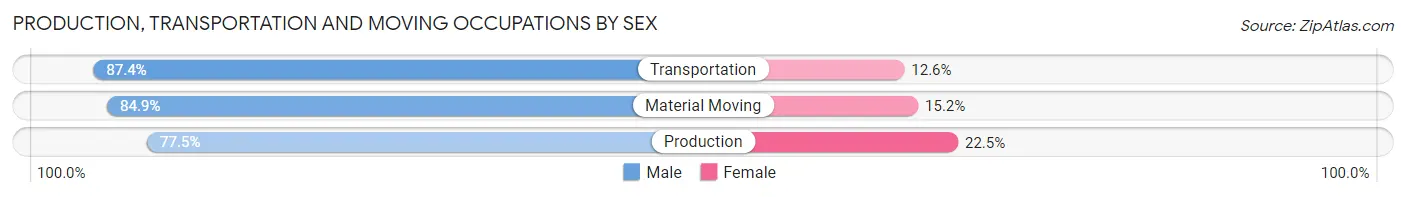
| Occupation | Male | Female |
| Production | 793 (77.5%) | 230 (22.5%) |
| Transportation | 256 (87.4%) | 37 (12.6%) |
| Material Moving | 336 (84.9%) | 60 (15.1%) |
| Total (Category) | 1,385 (80.9%) | 327 (19.1%) |
| Total (Overall) | 6,789 (54.9%) | 5,567 (45.1%) |
Employment Industries by Sex in Pottawatomie County
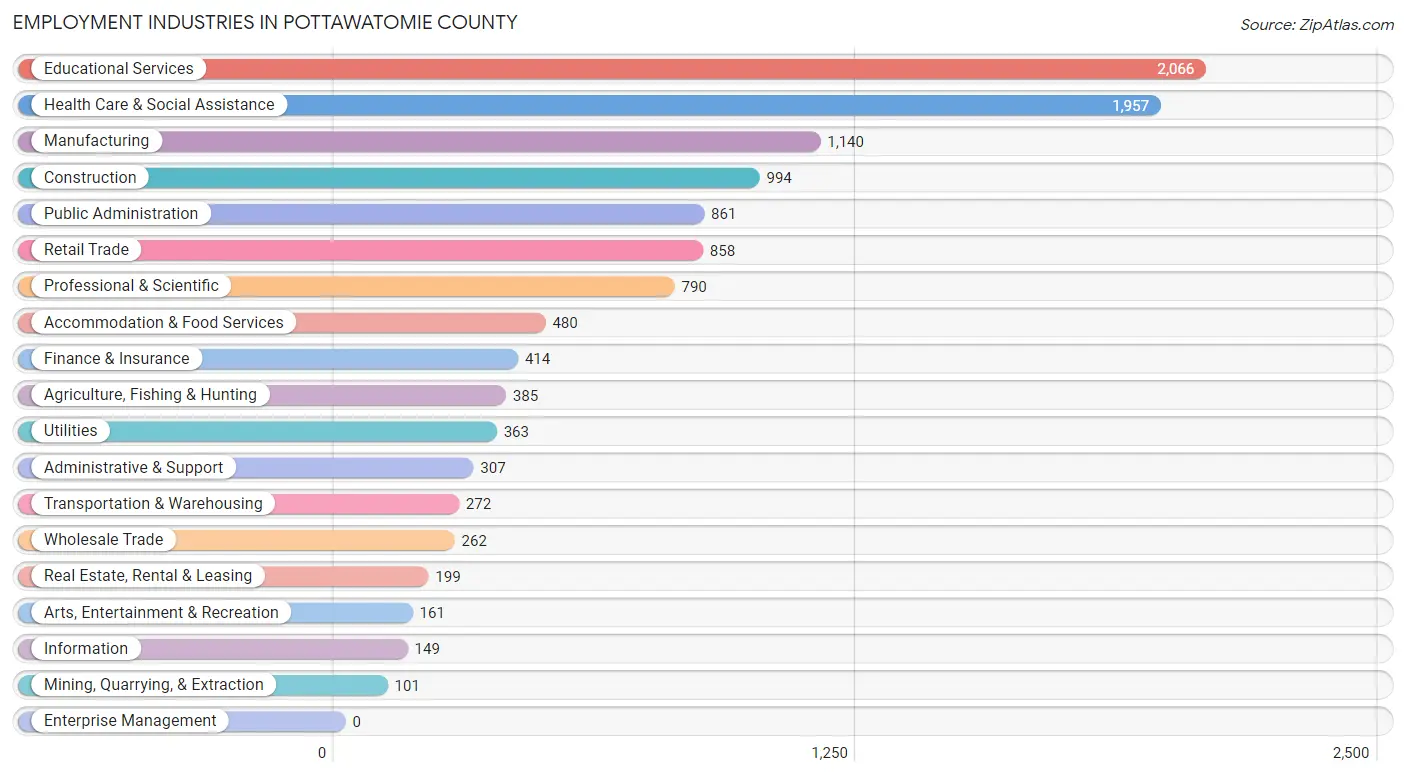
Employment Industries in Pottawatomie County
The major employment industries in Pottawatomie County include Educational Services (2,066 | 16.7%), Health Care & Social Assistance (1,957 | 15.8%), Manufacturing (1,140 | 9.2%), Construction (994 | 8.0%), and Public Administration (861 | 7.0%).
Employment Industries by Sex in Pottawatomie County
The Pottawatomie County industries that see more men than women are Utilities (98.1%), Construction (92.7%), and Transportation & Warehousing (85.3%), whereas the industries that tend to have a higher number of women are Health Care & Social Assistance (72.5%), Educational Services (63.5%), and Real Estate, Rental & Leasing (58.3%).
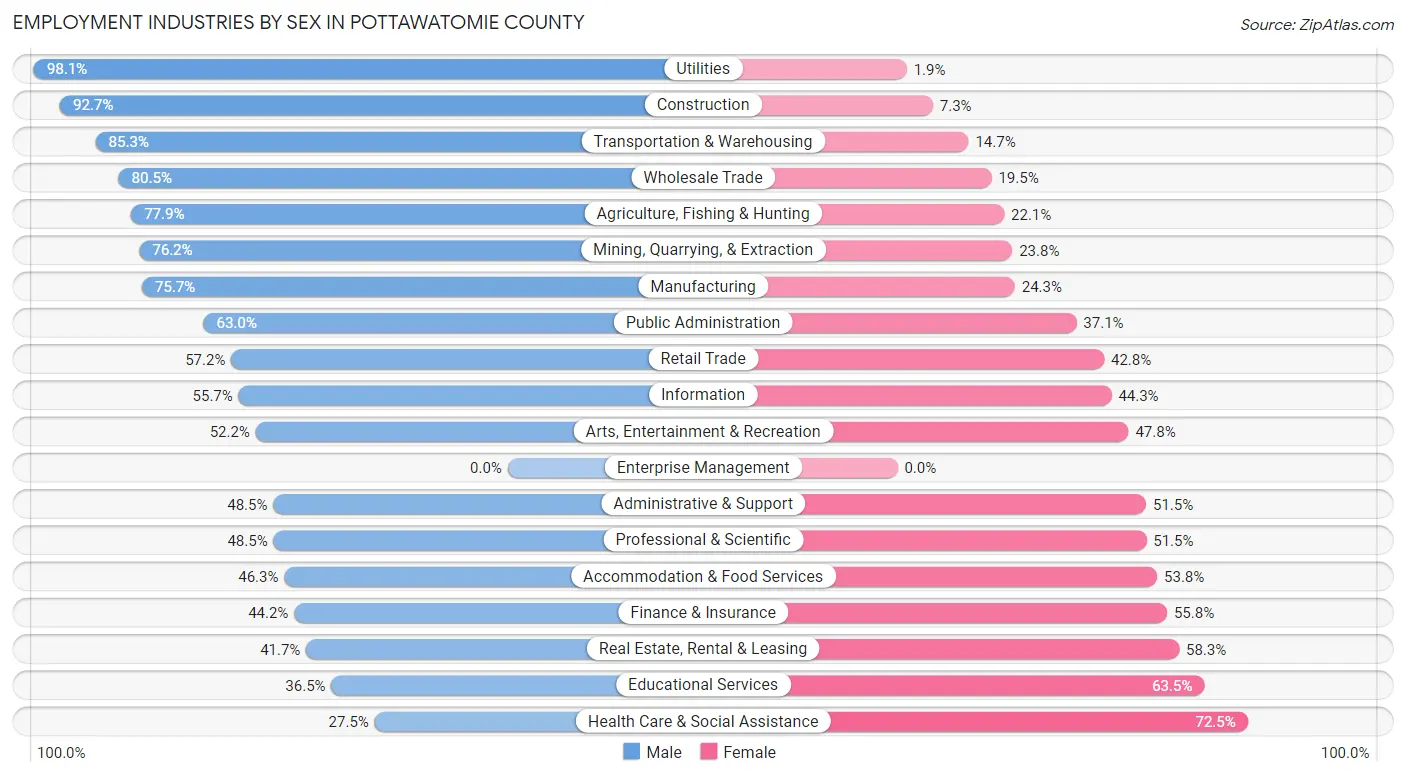
| Industry | Male | Female |
| Agriculture, Fishing & Hunting | 300 (77.9%) | 85 (22.1%) |
| Mining, Quarrying, & Extraction | 77 (76.2%) | 24 (23.8%) |
| Construction | 921 (92.7%) | 73 (7.3%) |
| Manufacturing | 863 (75.7%) | 277 (24.3%) |
| Wholesale Trade | 211 (80.5%) | 51 (19.5%) |
| Retail Trade | 491 (57.2%) | 367 (42.8%) |
| Transportation & Warehousing | 232 (85.3%) | 40 (14.7%) |
| Utilities | 356 (98.1%) | 7 (1.9%) |
| Information | 83 (55.7%) | 66 (44.3%) |
| Finance & Insurance | 183 (44.2%) | 231 (55.8%) |
| Real Estate, Rental & Leasing | 83 (41.7%) | 116 (58.3%) |
| Professional & Scientific | 383 (48.5%) | 407 (51.5%) |
| Enterprise Management | 0 (0.0%) | 0 (0.0%) |
| Administrative & Support | 149 (48.5%) | 158 (51.5%) |
| Educational Services | 754 (36.5%) | 1,312 (63.5%) |
| Health Care & Social Assistance | 539 (27.5%) | 1,418 (72.5%) |
| Arts, Entertainment & Recreation | 84 (52.2%) | 77 (47.8%) |
| Accommodation & Food Services | 222 (46.3%) | 258 (53.7%) |
| Public Administration | 542 (62.9%) | 319 (37.0%) |
| Total | 6,789 (54.9%) | 5,567 (45.1%) |
Education in Pottawatomie County
School Enrollment in Pottawatomie County
The most common levels of schooling among the 6,815 students in Pottawatomie County are middle school (1,754 | 25.7%), elementary school (1,663 | 24.4%), and high school (1,589 | 23.3%).
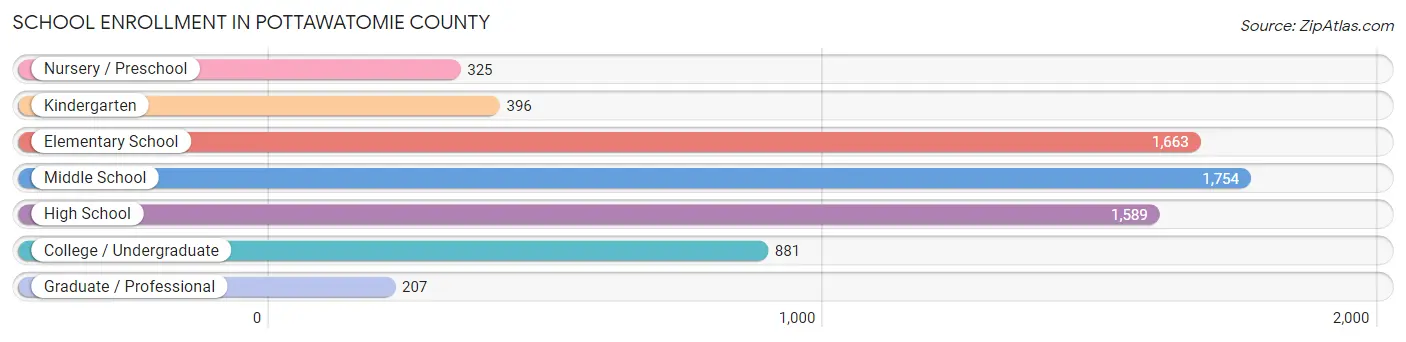
| School Level | # Students | % Students |
| Nursery / Preschool | 325 | 4.8% |
| Kindergarten | 396 | 5.8% |
| Elementary School | 1,663 | 24.4% |
| Middle School | 1,754 | 25.7% |
| High School | 1,589 | 23.3% |
| College / Undergraduate | 881 | 12.9% |
| Graduate / Professional | 207 | 3.0% |
| Total | 6,815 | 100.0% |
School Enrollment by Age by Funding Source in Pottawatomie County
Out of a total of 6,815 students who are enrolled in schools in Pottawatomie County, 1,118 (16.4%) attend a private institution, while the remaining 5,697 (83.6%) are enrolled in public schools. The age group of 35 years and over has the highest likelihood of being enrolled in private schools, with 74 (40.2% in the age bracket) enrolled. Conversely, the age group of 20 to 24 year olds has the lowest likelihood of being enrolled in a private school, with 376 (88.5% in the age bracket) attending a public institution.
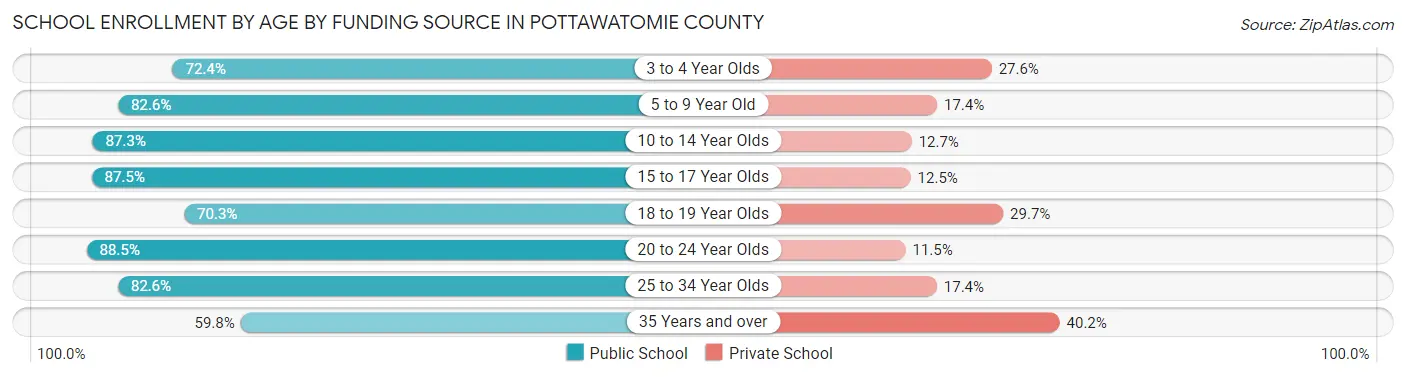
| Age Bracket | Public School | Private School |
| 3 to 4 Year Olds | 176 (72.4%) | 67 (27.6%) |
| 5 to 9 Year Old | 1,495 (82.6%) | 315 (17.4%) |
| 10 to 14 Year Olds | 1,965 (87.3%) | 285 (12.7%) |
| 15 to 17 Year Olds | 1,059 (87.5%) | 151 (12.5%) |
| 18 to 19 Year Olds | 317 (70.3%) | 134 (29.7%) |
| 20 to 24 Year Olds | 376 (88.5%) | 49 (11.5%) |
| 25 to 34 Year Olds | 200 (82.6%) | 42 (17.4%) |
| 35 Years and over | 110 (59.8%) | 74 (40.2%) |
| Total | 5,697 (83.6%) | 1,118 (16.4%) |
Educational Attainment by Field of Study in Pottawatomie County
Education (1,249 | 19.1%), business (1,128 | 17.2%), bio, nature & agricultural (850 | 13.0%), arts & humanities (611 | 9.3%), and science & technology (581 | 8.9%) are the most common fields of study among 6,538 individuals in Pottawatomie County who have obtained a bachelor's degree or higher.
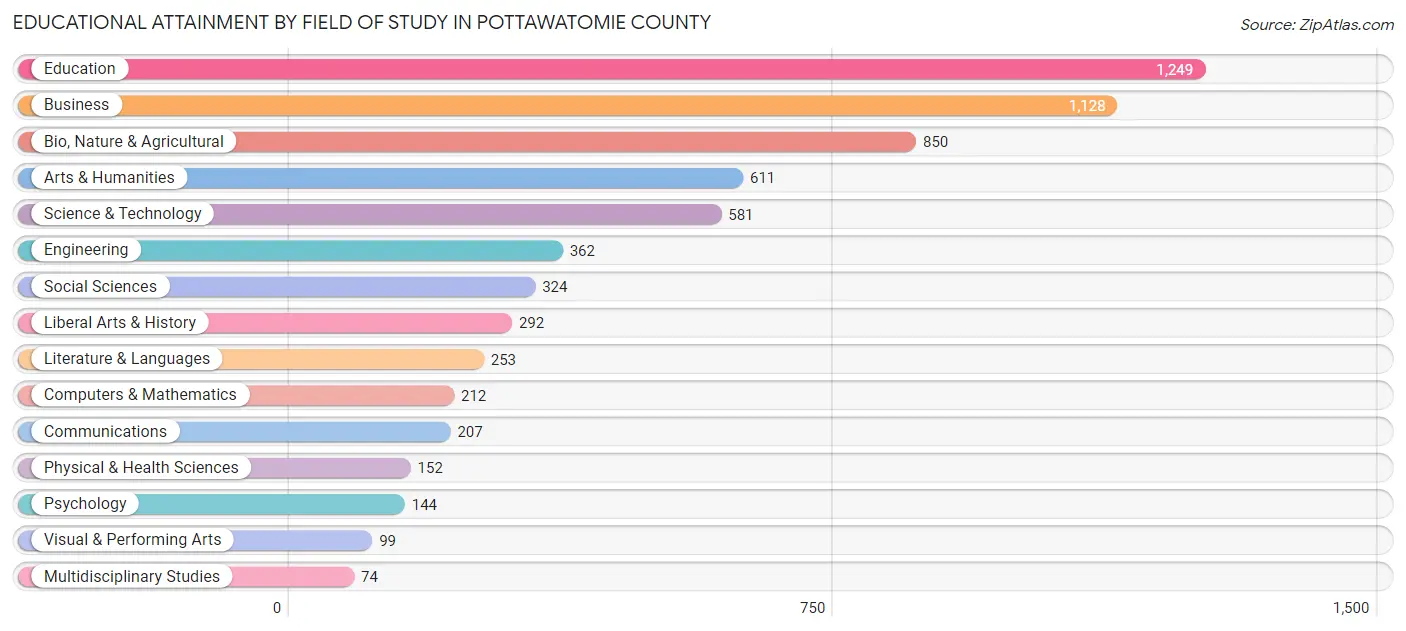
| Field of Study | # Graduates | % Graduates |
| Computers & Mathematics | 212 | 3.2% |
| Bio, Nature & Agricultural | 850 | 13.0% |
| Physical & Health Sciences | 152 | 2.3% |
| Psychology | 144 | 2.2% |
| Social Sciences | 324 | 5.0% |
| Engineering | 362 | 5.5% |
| Multidisciplinary Studies | 74 | 1.1% |
| Science & Technology | 581 | 8.9% |
| Business | 1,128 | 17.2% |
| Education | 1,249 | 19.1% |
| Literature & Languages | 253 | 3.9% |
| Liberal Arts & History | 292 | 4.5% |
| Visual & Performing Arts | 99 | 1.5% |
| Communications | 207 | 3.2% |
| Arts & Humanities | 611 | 9.3% |
| Total | 6,538 | 100.0% |
Transportation & Commute in Pottawatomie County
Vehicle Availability by Sex in Pottawatomie County
The most prevalent vehicle ownership categories in Pottawatomie County are males with 2 vehicles (2,677, accounting for 38.9%) and females with 2 vehicles (2,038, making up 49.4%).
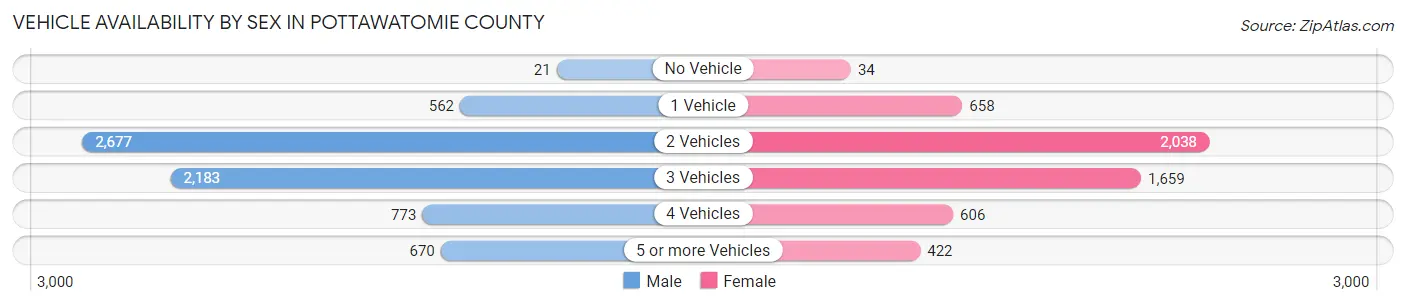
| Vehicles Available | Male | Female |
| No Vehicle | 21 (0.3%) | 34 (0.6%) |
| 1 Vehicle | 562 (8.2%) | 658 (12.1%) |
| 2 Vehicles | 2,677 (38.9%) | 2,038 (37.6%) |
| 3 Vehicles | 2,183 (31.7%) | 1,659 (30.6%) |
| 4 Vehicles | 773 (11.2%) | 606 (11.2%) |
| 5 or more Vehicles | 670 (9.7%) | 422 (7.8%) |
| Total | 6,886 (100.0%) | 5,417 (100.0%) |
Commute Time in Pottawatomie County
The most frequently occuring commute durations in Pottawatomie County are 15 to 19 minutes (1,900 commuters, 16.4%), 5 to 9 minutes (1,720 commuters, 14.9%), and 20 to 24 minutes (1,504 commuters, 13.0%).
| Commute Time | # Commuters | % Commuters |
| Less than 5 Minutes | 563 | 4.9% |
| 5 to 9 Minutes | 1,720 | 14.9% |
| 10 to 14 Minutes | 1,383 | 11.9% |
| 15 to 19 Minutes | 1,900 | 16.4% |
| 20 to 24 Minutes | 1,504 | 13.0% |
| 25 to 29 Minutes | 754 | 6.5% |
| 30 to 34 Minutes | 1,121 | 9.7% |
| 35 to 39 Minutes | 433 | 3.7% |
| 40 to 44 Minutes | 441 | 3.8% |
| 45 to 59 Minutes | 1,062 | 9.2% |
| 60 to 89 Minutes | 436 | 3.8% |
| 90 or more Minutes | 255 | 2.2% |
Commute Time by Sex in Pottawatomie County
The most common commute times in Pottawatomie County are 15 to 19 minutes (1,059 commuters, 16.3%) for males and 20 to 24 minutes (921 commuters, 18.2%) for females.
| Commute Time | Male | Female |
| Less than 5 Minutes | 250 (3.8%) | 313 (6.2%) |
| 5 to 9 Minutes | 975 (15.0%) | 745 (14.7%) |
| 10 to 14 Minutes | 674 (10.4%) | 709 (14.0%) |
| 15 to 19 Minutes | 1,059 (16.3%) | 841 (16.6%) |
| 20 to 24 Minutes | 583 (9.0%) | 921 (18.2%) |
| 25 to 29 Minutes | 494 (7.6%) | 260 (5.1%) |
| 30 to 34 Minutes | 778 (12.0%) | 343 (6.8%) |
| 35 to 39 Minutes | 220 (3.4%) | 213 (4.2%) |
| 40 to 44 Minutes | 200 (3.1%) | 241 (4.8%) |
| 45 to 59 Minutes | 702 (10.8%) | 360 (7.1%) |
| 60 to 89 Minutes | 364 (5.6%) | 72 (1.4%) |
| 90 or more Minutes | 208 (3.2%) | 47 (0.9%) |
Time of Departure to Work by Sex in Pottawatomie County
The most frequent times of departure to work in Pottawatomie County are 7:30 AM to 7:59 AM (1,160, 17.8%) for males and 7:30 AM to 7:59 AM (1,262, 24.9%) for females.
| Time of Departure | Male | Female |
| 12:00 AM to 4:59 AM | 336 (5.2%) | 126 (2.5%) |
| 5:00 AM to 5:29 AM | 222 (3.4%) | 69 (1.4%) |
| 5:30 AM to 5:59 AM | 477 (7.3%) | 130 (2.6%) |
| 6:00 AM to 6:29 AM | 745 (11.5%) | 470 (9.3%) |
| 6:30 AM to 6:59 AM | 958 (14.7%) | 537 (10.6%) |
| 7:00 AM to 7:29 AM | 762 (11.7%) | 1,149 (22.7%) |
| 7:30 AM to 7:59 AM | 1,160 (17.8%) | 1,262 (24.9%) |
| 8:00 AM to 8:29 AM | 696 (10.7%) | 487 (9.6%) |
| 8:30 AM to 8:59 AM | 227 (3.5%) | 133 (2.6%) |
| 9:00 AM to 9:59 AM | 131 (2.0%) | 244 (4.8%) |
| 10:00 AM to 10:59 AM | 21 (0.3%) | 126 (2.5%) |
| 11:00 AM to 11:59 AM | 1 (0.0%) | 32 (0.6%) |
| 12:00 PM to 3:59 PM | 418 (6.4%) | 114 (2.2%) |
| 4:00 PM to 11:59 PM | 353 (5.4%) | 186 (3.7%) |
| Total | 6,507 (100.0%) | 5,065 (100.0%) |
Housing Occupancy in Pottawatomie County
Occupancy by Ownership in Pottawatomie County
Of the total 9,054 dwellings in Pottawatomie County, owner-occupied units account for 7,217 (79.7%), while renter-occupied units make up 1,837 (20.3%).
| Occupancy | # Housing Units | % Housing Units |
| Owner Occupied Housing Units | 7,217 | 79.7% |
| Renter-Occupied Housing Units | 1,837 | 20.3% |
| Total Occupied Housing Units | 9,054 | 100.0% |
Occupancy by Household Size in Pottawatomie County
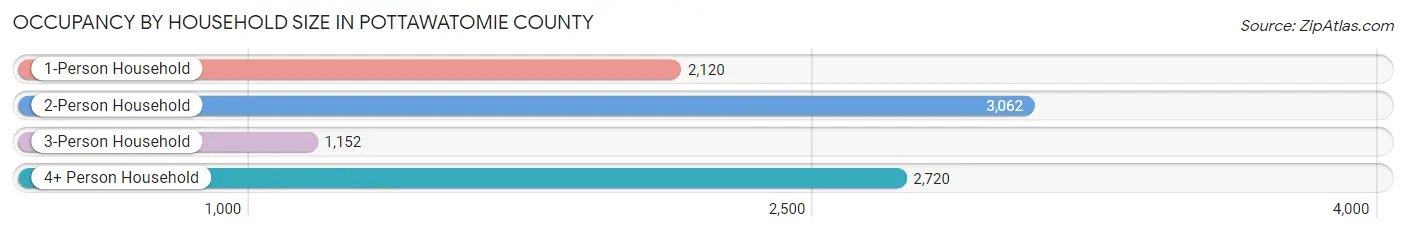
| Household Size | # Housing Units | % Housing Units |
| 1-Person Household | 2,120 | 23.4% |
| 2-Person Household | 3,062 | 33.8% |
| 3-Person Household | 1,152 | 12.7% |
| 4+ Person Household | 2,720 | 30.0% |
| Total Housing Units | 9,054 | 100.0% |
Occupancy by Ownership by Household Size in Pottawatomie County
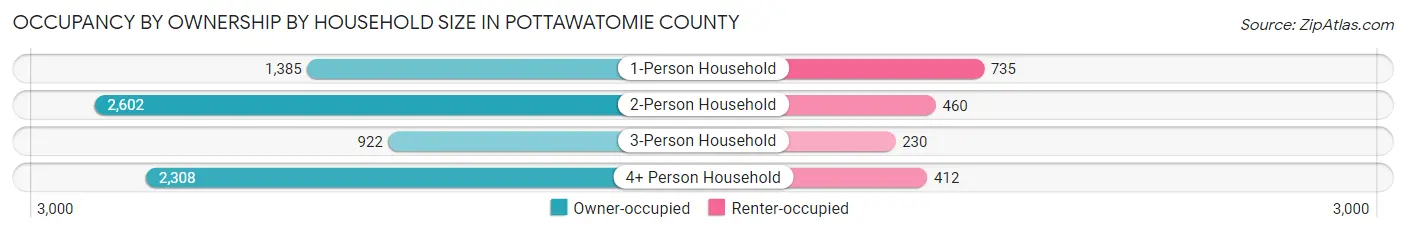
| Household Size | Owner-occupied | Renter-occupied |
| 1-Person Household | 1,385 (65.3%) | 735 (34.7%) |
| 2-Person Household | 2,602 (85.0%) | 460 (15.0%) |
| 3-Person Household | 922 (80.0%) | 230 (20.0%) |
| 4+ Person Household | 2,308 (84.9%) | 412 (15.1%) |
| Total Housing Units | 7,217 (79.7%) | 1,837 (20.3%) |
Occupancy by Educational Attainment in Pottawatomie County
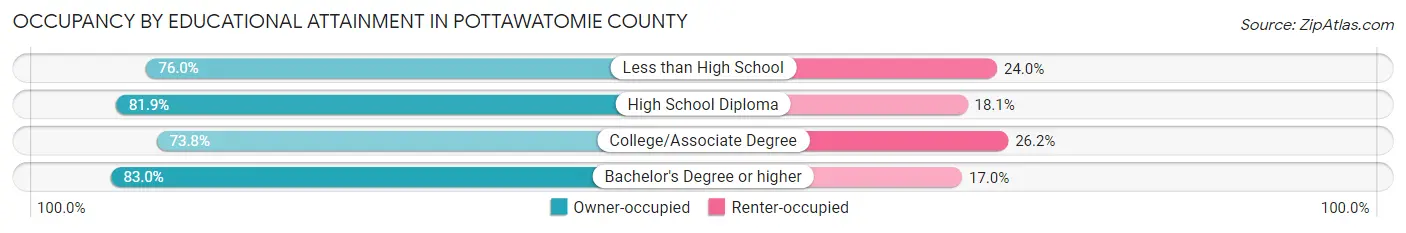
| Household Size | Owner-occupied | Renter-occupied |
| Less than High School | 219 (76.0%) | 69 (24.0%) |
| High School Diploma | 2,003 (81.9%) | 443 (18.1%) |
| College/Associate Degree | 2,008 (73.8%) | 712 (26.2%) |
| Bachelor's Degree or higher | 2,987 (83.0%) | 613 (17.0%) |
Occupancy by Age of Householder in Pottawatomie County
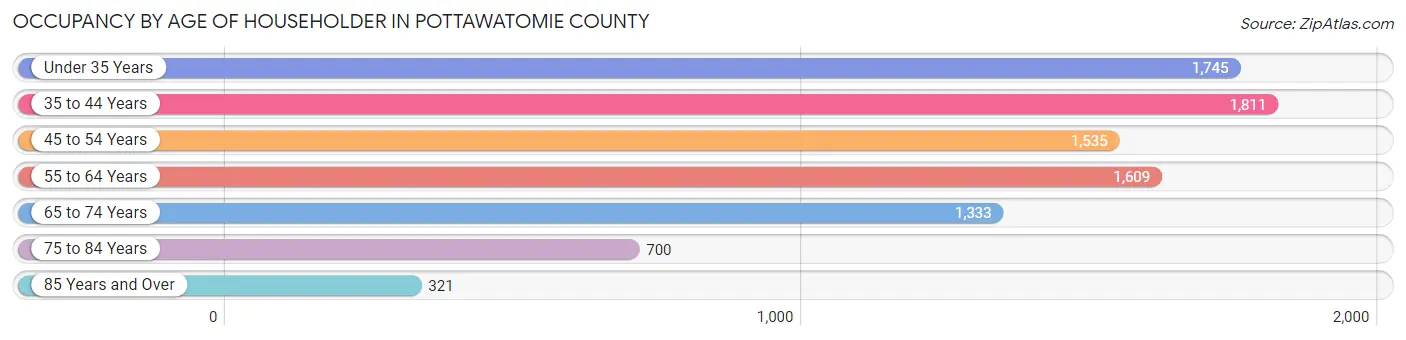
| Age Bracket | # Households | % Households |
| Under 35 Years | 1,745 | 19.3% |
| 35 to 44 Years | 1,811 | 20.0% |
| 45 to 54 Years | 1,535 | 17.0% |
| 55 to 64 Years | 1,609 | 17.8% |
| 65 to 74 Years | 1,333 | 14.7% |
| 75 to 84 Years | 700 | 7.7% |
| 85 Years and Over | 321 | 3.5% |
| Total | 9,054 | 100.0% |
Housing Finances in Pottawatomie County
Median Income by Occupancy in Pottawatomie County
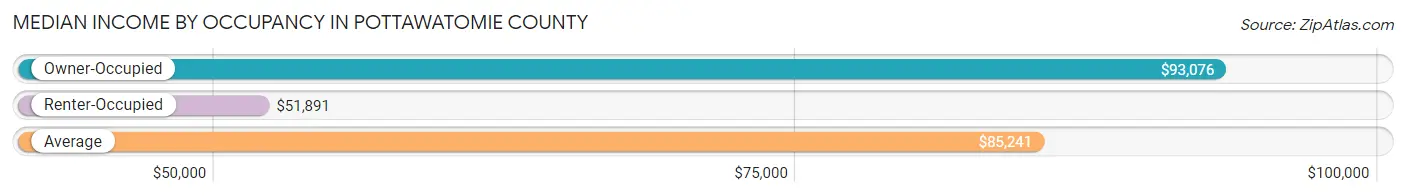
| Occupancy Type | # Households | Median Income |
| Owner-Occupied | 7,217 (79.7%) | $93,076 |
| Renter-Occupied | 1,837 (20.3%) | $51,891 |
| Average | 9,054 (100.0%) | $85,241 |
Occupancy by Householder Income Bracket in Pottawatomie County
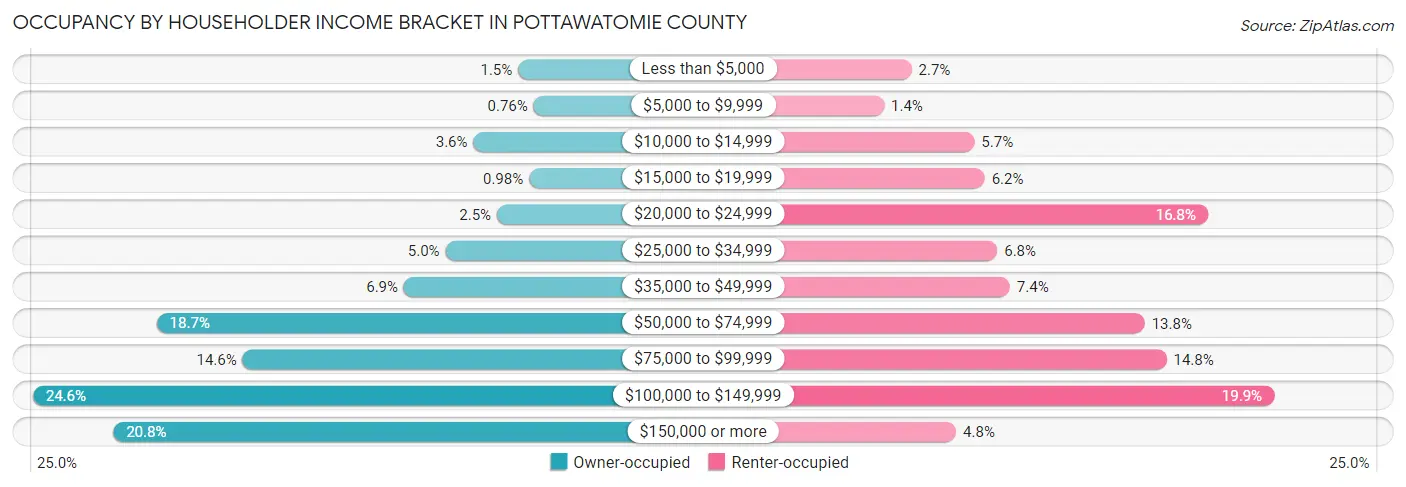
| Income Bracket | Owner-occupied | Renter-occupied |
| Less than $5,000 | 108 (1.5%) | 49 (2.7%) |
| $5,000 to $9,999 | 55 (0.8%) | 25 (1.4%) |
| $10,000 to $14,999 | 262 (3.6%) | 104 (5.7%) |
| $15,000 to $19,999 | 71 (1.0%) | 113 (6.1%) |
| $20,000 to $24,999 | 181 (2.5%) | 308 (16.8%) |
| $25,000 to $34,999 | 358 (5.0%) | 124 (6.8%) |
| $35,000 to $49,999 | 501 (6.9%) | 135 (7.3%) |
| $50,000 to $74,999 | 1,350 (18.7%) | 253 (13.8%) |
| $75,000 to $99,999 | 1,055 (14.6%) | 272 (14.8%) |
| $100,000 to $149,999 | 1,776 (24.6%) | 366 (19.9%) |
| $150,000 or more | 1,500 (20.8%) | 88 (4.8%) |
| Total | 7,217 (100.0%) | 1,837 (100.0%) |
Monthly Housing Cost Tiers in Pottawatomie County
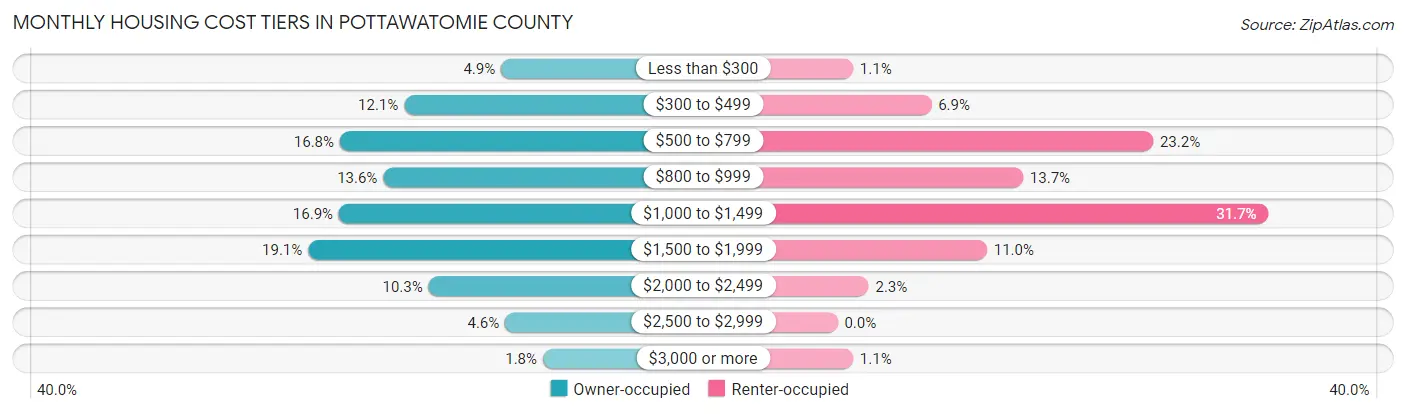
| Monthly Cost | Owner-occupied | Renter-occupied |
| Less than $300 | 354 (4.9%) | 21 (1.1%) |
| $300 to $499 | 870 (12.0%) | 127 (6.9%) |
| $500 to $799 | 1,211 (16.8%) | 427 (23.2%) |
| $800 to $999 | 981 (13.6%) | 251 (13.7%) |
| $1,000 to $1,499 | 1,216 (16.9%) | 583 (31.7%) |
| $1,500 to $1,999 | 1,380 (19.1%) | 202 (11.0%) |
| $2,000 to $2,499 | 740 (10.2%) | 42 (2.3%) |
| $2,500 to $2,999 | 333 (4.6%) | 0 (0.0%) |
| $3,000 or more | 132 (1.8%) | 21 (1.1%) |
| Total | 7,217 (100.0%) | 1,837 (100.0%) |
Physical Housing Characteristics in Pottawatomie County
Housing Structures in Pottawatomie County
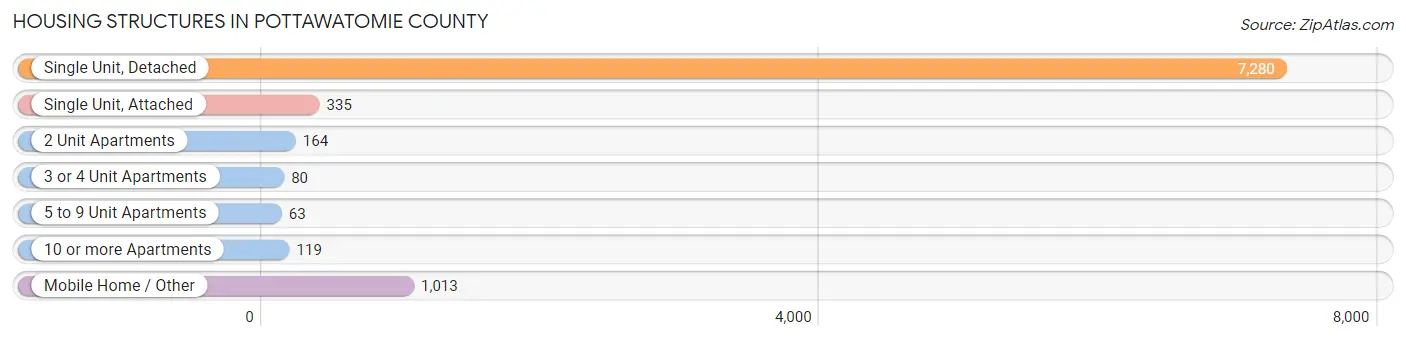
| Structure Type | # Housing Units | % Housing Units |
| Single Unit, Detached | 7,280 | 80.4% |
| Single Unit, Attached | 335 | 3.7% |
| 2 Unit Apartments | 164 | 1.8% |
| 3 or 4 Unit Apartments | 80 | 0.9% |
| 5 to 9 Unit Apartments | 63 | 0.7% |
| 10 or more Apartments | 119 | 1.3% |
| Mobile Home / Other | 1,013 | 11.2% |
| Total | 9,054 | 100.0% |
Housing Structures by Occupancy in Pottawatomie County
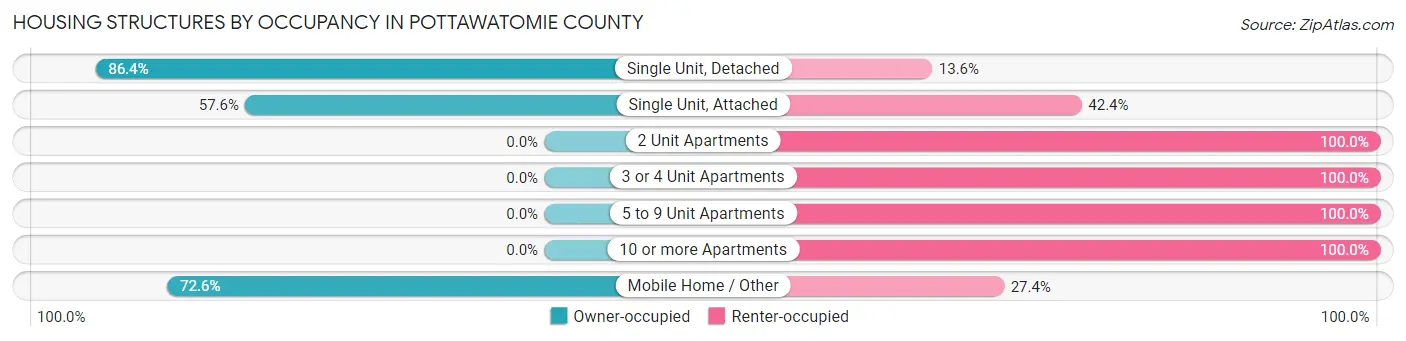
| Structure Type | Owner-occupied | Renter-occupied |
| Single Unit, Detached | 6,289 (86.4%) | 991 (13.6%) |
| Single Unit, Attached | 193 (57.6%) | 142 (42.4%) |
| 2 Unit Apartments | 0 (0.0%) | 164 (100.0%) |
| 3 or 4 Unit Apartments | 0 (0.0%) | 80 (100.0%) |
| 5 to 9 Unit Apartments | 0 (0.0%) | 63 (100.0%) |
| 10 or more Apartments | 0 (0.0%) | 119 (100.0%) |
| Mobile Home / Other | 735 (72.6%) | 278 (27.4%) |
| Total | 7,217 (79.7%) | 1,837 (20.3%) |
Housing Structures by Number of Rooms in Pottawatomie County
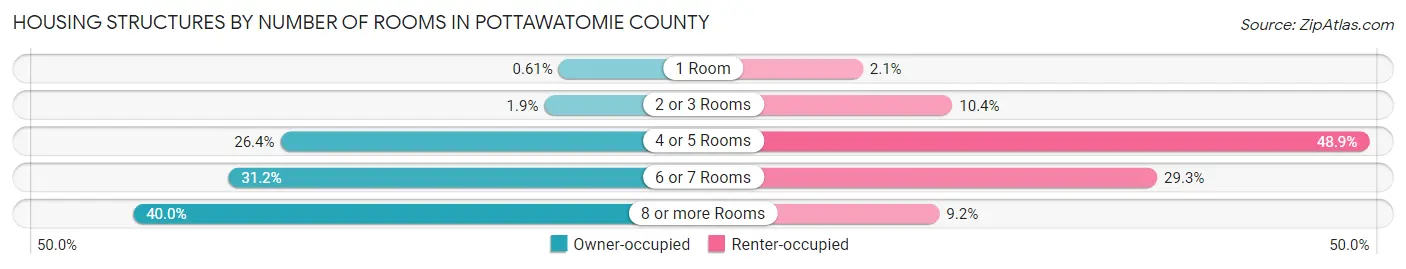
| Number of Rooms | Owner-occupied | Renter-occupied |
| 1 Room | 44 (0.6%) | 39 (2.1%) |
| 2 or 3 Rooms | 140 (1.9%) | 191 (10.4%) |
| 4 or 5 Rooms | 1,902 (26.4%) | 899 (48.9%) |
| 6 or 7 Rooms | 2,248 (31.1%) | 539 (29.3%) |
| 8 or more Rooms | 2,883 (40.0%) | 169 (9.2%) |
| Total | 7,217 (100.0%) | 1,837 (100.0%) |
Housing Structure by Heating Type in Pottawatomie County
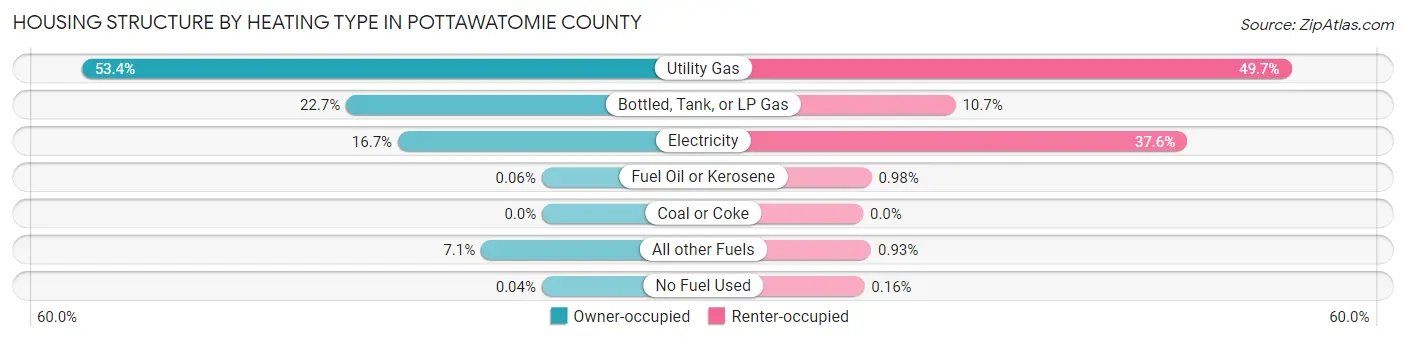
| Heating Type | Owner-occupied | Renter-occupied |
| Utility Gas | 3,852 (53.4%) | 912 (49.6%) |
| Bottled, Tank, or LP Gas | 1,640 (22.7%) | 197 (10.7%) |
| Electricity | 1,207 (16.7%) | 690 (37.6%) |
| Fuel Oil or Kerosene | 4 (0.1%) | 18 (1.0%) |
| Coal or Coke | 0 (0.0%) | 0 (0.0%) |
| All other Fuels | 511 (7.1%) | 17 (0.9%) |
| No Fuel Used | 3 (0.0%) | 3 (0.2%) |
| Total | 7,217 (100.0%) | 1,837 (100.0%) |
Household Vehicle Usage in Pottawatomie County
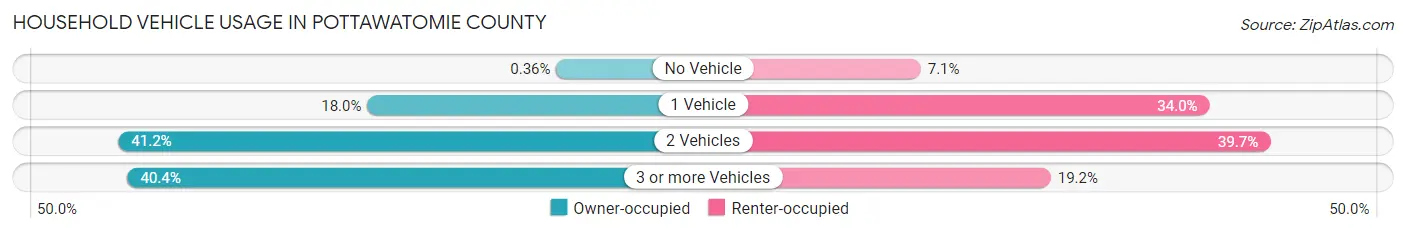
| Vehicles per Household | Owner-occupied | Renter-occupied |
| No Vehicle | 26 (0.4%) | 130 (7.1%) |
| 1 Vehicle | 1,300 (18.0%) | 625 (34.0%) |
| 2 Vehicles | 2,976 (41.2%) | 729 (39.7%) |
| 3 or more Vehicles | 2,915 (40.4%) | 353 (19.2%) |
| Total | 7,217 (100.0%) | 1,837 (100.0%) |
Real Estate & Mortgages in Pottawatomie County
Real Estate and Mortgage Overview in Pottawatomie County
| Characteristic | Without Mortgage | With Mortgage |
| Housing Units | 3,139 | 4,078 |
| Median Property Value | $191,100 | $241,900 |
| Median Household Income | $71,113 | $882 |
| Monthly Housing Costs | $619 | $112 |
| Real Estate Taxes | $1,906 | $126 |
Property Value by Mortgage Status in Pottawatomie County
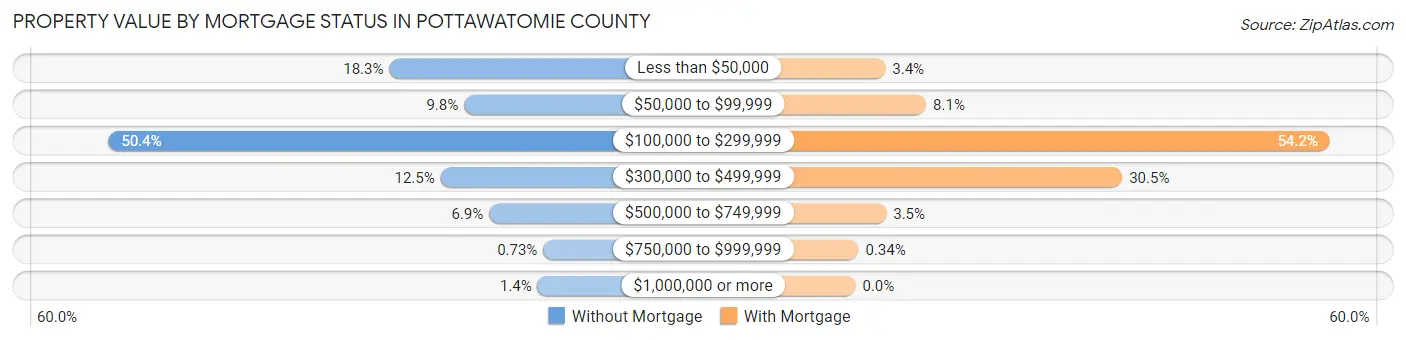
| Property Value | Without Mortgage | With Mortgage |
| Less than $50,000 | 575 (18.3%) | 139 (3.4%) |
| $50,000 to $99,999 | 307 (9.8%) | 329 (8.1%) |
| $100,000 to $299,999 | 1,583 (50.4%) | 2,210 (54.2%) |
| $300,000 to $499,999 | 391 (12.5%) | 1,243 (30.5%) |
| $500,000 to $749,999 | 217 (6.9%) | 143 (3.5%) |
| $750,000 to $999,999 | 23 (0.7%) | 14 (0.3%) |
| $1,000,000 or more | 43 (1.4%) | 0 (0.0%) |
| Total | 3,139 (100.0%) | 4,078 (100.0%) |
Household Income by Mortgage Status in Pottawatomie County
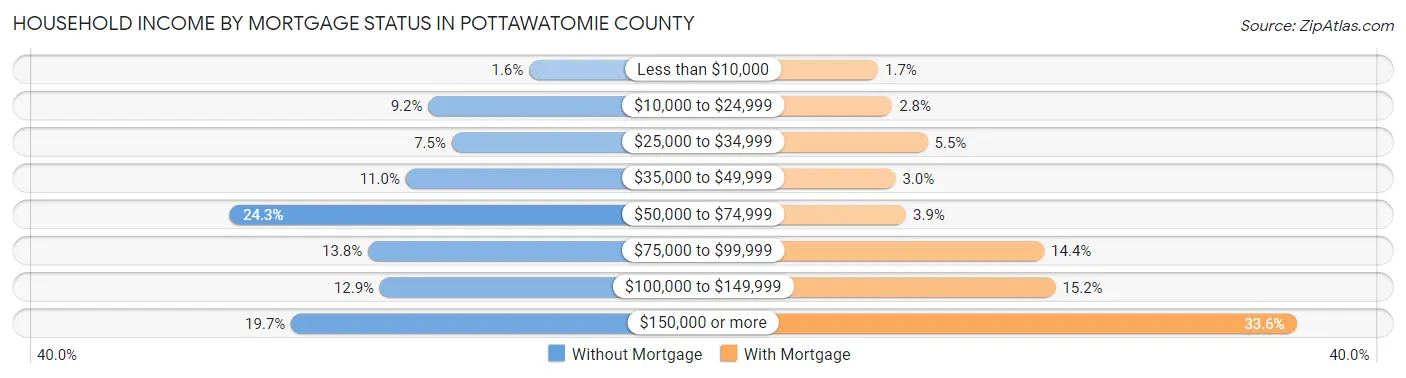
| Household Income | Without Mortgage | With Mortgage |
| Less than $10,000 | 49 (1.6%) | 70 (1.7%) |
| $10,000 to $24,999 | 290 (9.2%) | 114 (2.8%) |
| $25,000 to $34,999 | 234 (7.4%) | 224 (5.5%) |
| $35,000 to $49,999 | 344 (11.0%) | 124 (3.0%) |
| $50,000 to $74,999 | 764 (24.3%) | 157 (3.8%) |
| $75,000 to $99,999 | 434 (13.8%) | 586 (14.4%) |
| $100,000 to $149,999 | 406 (12.9%) | 621 (15.2%) |
| $150,000 or more | 618 (19.7%) | 1,370 (33.6%) |
| Total | 3,139 (100.0%) | 4,078 (100.0%) |
Property Value to Household Income Ratio in Pottawatomie County
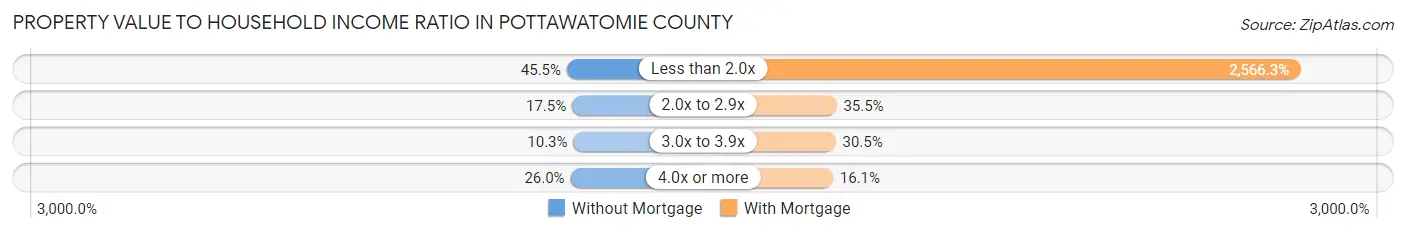
| Value-to-Income Ratio | Without Mortgage | With Mortgage |
| Less than 2.0x | 1,428 (45.5%) | 104,653 (2,566.3%) |
| 2.0x to 2.9x | 549 (17.5%) | 1,449 (35.5%) |
| 3.0x to 3.9x | 322 (10.3%) | 1,243 (30.5%) |
| 4.0x or more | 817 (26.0%) | 657 (16.1%) |
| Total | 3,139 (100.0%) | 4,078 (100.0%) |
Real Estate Taxes by Mortgage Status in Pottawatomie County
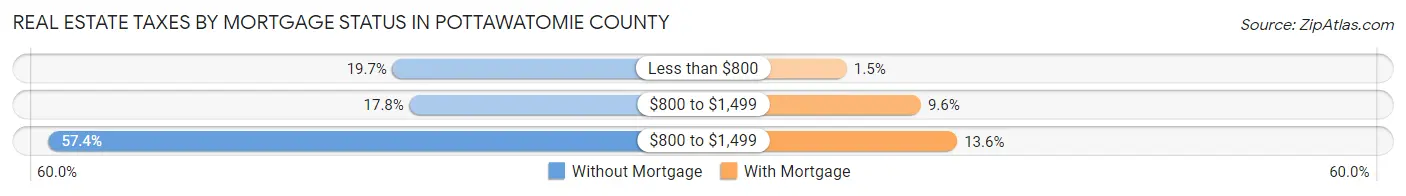
| Property Taxes | Without Mortgage | With Mortgage |
| Less than $800 | 617 (19.7%) | 62 (1.5%) |
| $800 to $1,499 | 559 (17.8%) | 393 (9.6%) |
| $800 to $1,499 | 1,801 (57.4%) | 555 (13.6%) |
| Total | 3,139 (100.0%) | 4,078 (100.0%) |
Health & Disability in Pottawatomie County
Health Insurance Coverage by Age in Pottawatomie County
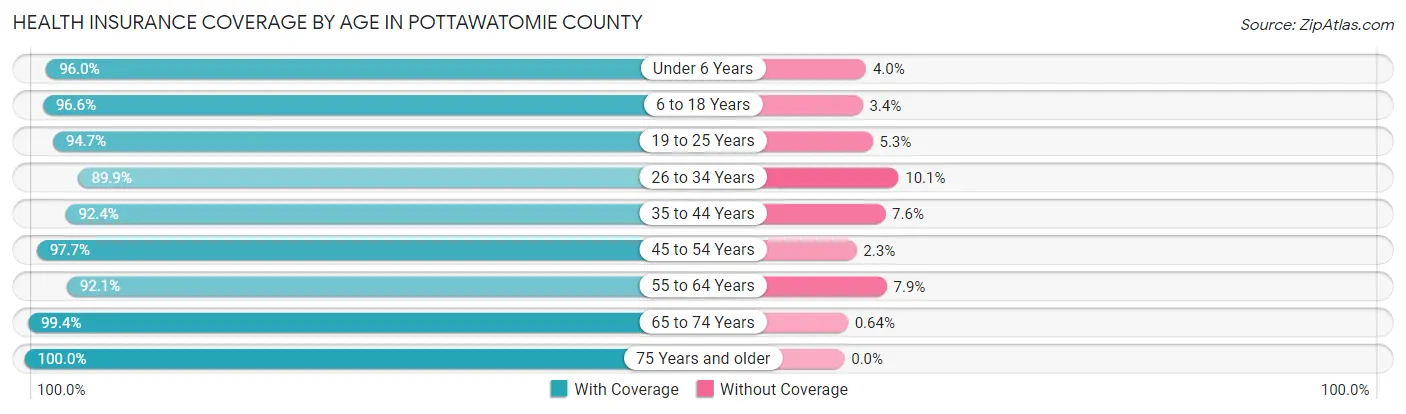
| Age Bracket | With Coverage | Without Coverage |
| Under 6 Years | 2,186 (96.0%) | 92 (4.0%) |
| 6 to 18 Years | 5,237 (96.6%) | 184 (3.4%) |
| 19 to 25 Years | 1,635 (94.7%) | 91 (5.3%) |
| 26 to 34 Years | 2,572 (89.9%) | 288 (10.1%) |
| 35 to 44 Years | 3,153 (92.4%) | 260 (7.6%) |
| 45 to 54 Years | 2,642 (97.7%) | 61 (2.3%) |
| 55 to 64 Years | 2,812 (92.1%) | 241 (7.9%) |
| 65 to 74 Years | 2,187 (99.4%) | 14 (0.6%) |
| 75 Years and older | 1,387 (100.0%) | 0 (0.0%) |
| Total | 23,811 (95.1%) | 1,231 (4.9%) |
Health Insurance Coverage by Citizenship Status in Pottawatomie County
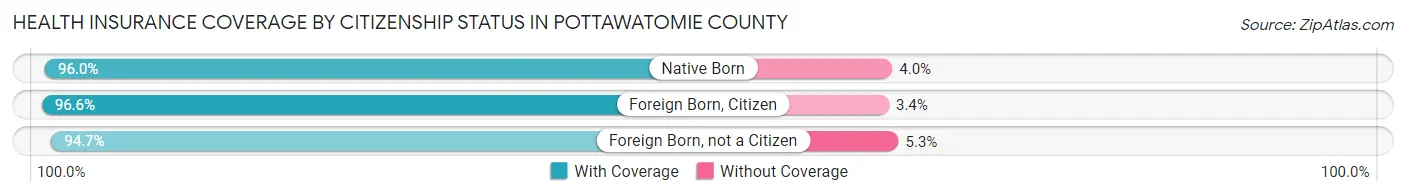
| Citizenship Status | With Coverage | Without Coverage |
| Native Born | 2,186 (96.0%) | 92 (4.0%) |
| Foreign Born, Citizen | 5,237 (96.6%) | 184 (3.4%) |
| Foreign Born, not a Citizen | 1,635 (94.7%) | 91 (5.3%) |
Health Insurance Coverage by Household Income in Pottawatomie County
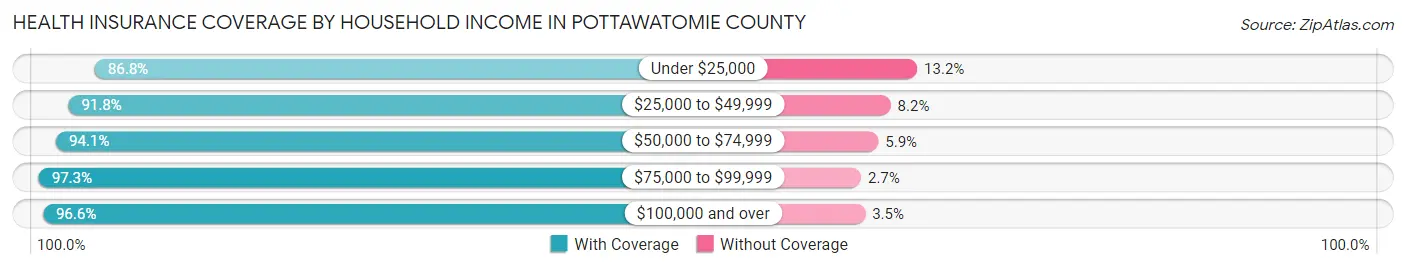
| Household Income | With Coverage | Without Coverage |
| Under $25,000 | 1,818 (86.8%) | 276 (13.2%) |
| $25,000 to $49,999 | 1,898 (91.8%) | 170 (8.2%) |
| $50,000 to $74,999 | 3,866 (94.1%) | 243 (5.9%) |
| $75,000 to $99,999 | 3,900 (97.3%) | 107 (2.7%) |
| $100,000 and over | 12,177 (96.6%) | 435 (3.5%) |
Public vs Private Health Insurance Coverage by Age in Pottawatomie County
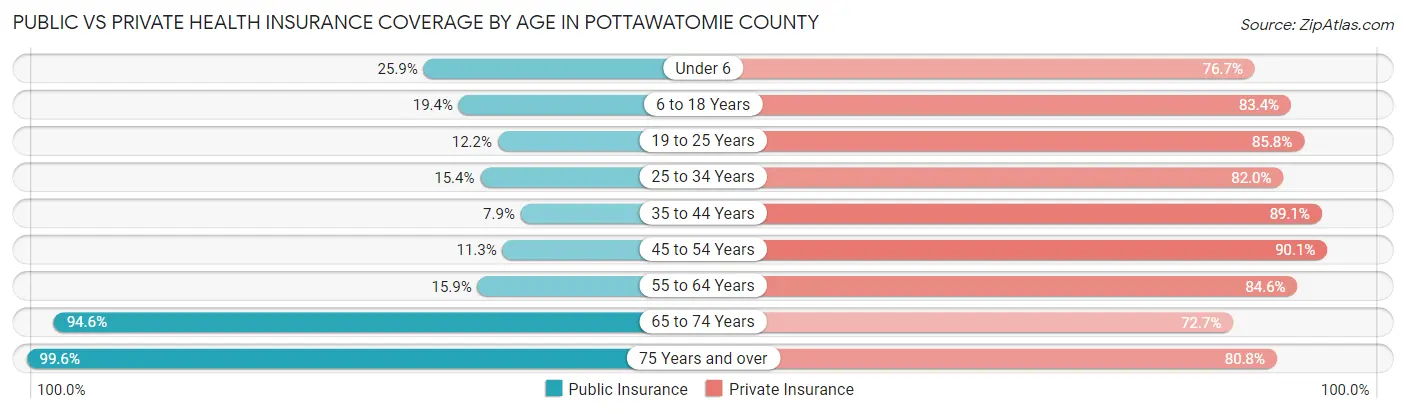
| Age Bracket | Public Insurance | Private Insurance |
| Under 6 | 591 (25.9%) | 1,746 (76.6%) |
| 6 to 18 Years | 1,052 (19.4%) | 4,519 (83.4%) |
| 19 to 25 Years | 210 (12.2%) | 1,481 (85.8%) |
| 25 to 34 Years | 441 (15.4%) | 2,344 (82.0%) |
| 35 to 44 Years | 270 (7.9%) | 3,040 (89.1%) |
| 45 to 54 Years | 305 (11.3%) | 2,435 (90.1%) |
| 55 to 64 Years | 486 (15.9%) | 2,582 (84.6%) |
| 65 to 74 Years | 2,082 (94.6%) | 1,599 (72.7%) |
| 75 Years and over | 1,382 (99.6%) | 1,120 (80.7%) |
| Total | 6,819 (27.2%) | 20,866 (83.3%) |
Disability Status by Sex by Age in Pottawatomie County
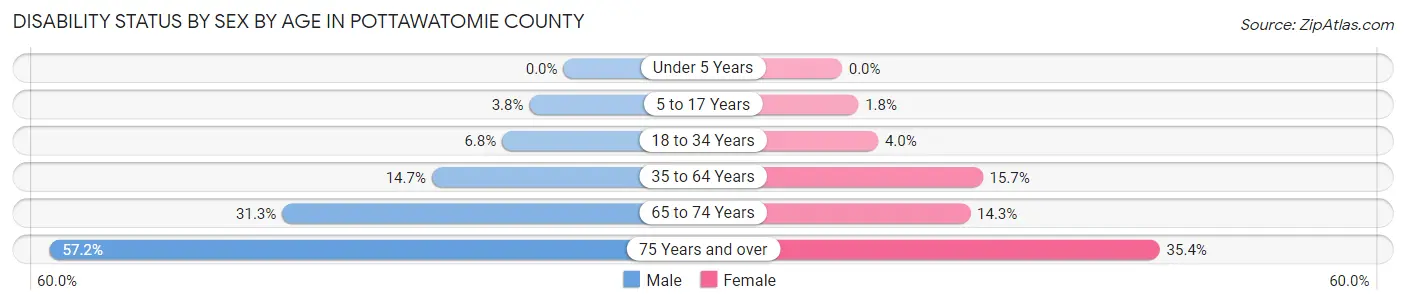
| Age Bracket | Male | Female |
| Under 5 Years | 0 (0.0%) | 0 (0.0%) |
| 5 to 17 Years | 103 (3.8%) | 50 (1.8%) |
| 18 to 34 Years | 167 (6.8%) | 100 (4.0%) |
| 35 to 64 Years | 693 (14.7%) | 696 (15.7%) |
| 65 to 74 Years | 343 (31.3%) | 158 (14.3%) |
| 75 Years and over | 341 (57.2%) | 280 (35.4%) |
Disability Class by Sex by Age in Pottawatomie County
Disability Class: Hearing Difficulty
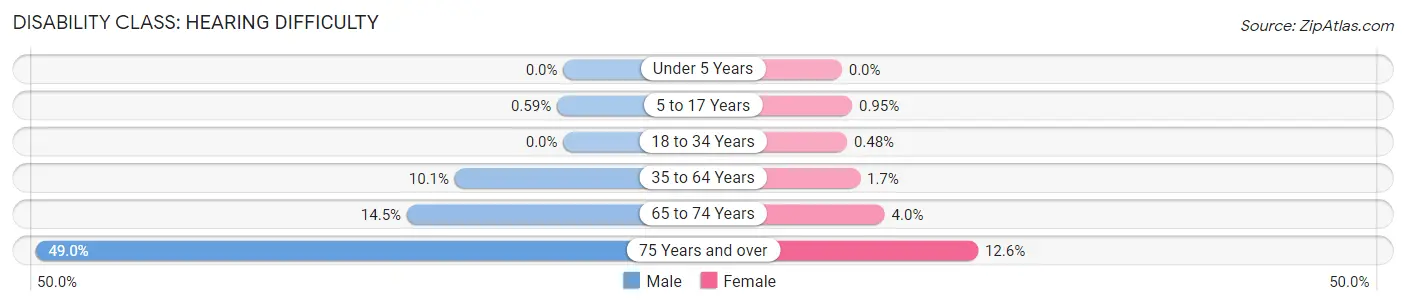
| Age Bracket | Male | Female |
| Under 5 Years | 0 (0.0%) | 0 (0.0%) |
| 5 to 17 Years | 16 (0.6%) | 26 (0.9%) |
| 18 to 34 Years | 0 (0.0%) | 12 (0.5%) |
| 35 to 64 Years | 476 (10.1%) | 75 (1.7%) |
| 65 to 74 Years | 159 (14.5%) | 44 (4.0%) |
| 75 Years and over | 292 (49.0%) | 100 (12.6%) |
Disability Class: Vision Difficulty
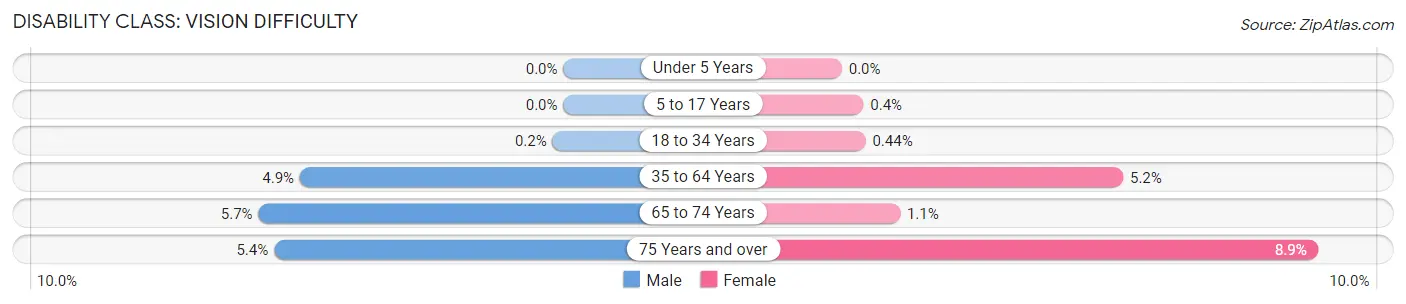
| Age Bracket | Male | Female |
| Under 5 Years | 0 (0.0%) | 0 (0.0%) |
| 5 to 17 Years | 0 (0.0%) | 11 (0.4%) |
| 18 to 34 Years | 5 (0.2%) | 11 (0.4%) |
| 35 to 64 Years | 231 (4.9%) | 232 (5.2%) |
| 65 to 74 Years | 62 (5.7%) | 12 (1.1%) |
| 75 Years and over | 32 (5.4%) | 70 (8.8%) |
Disability Class: Cognitive Difficulty
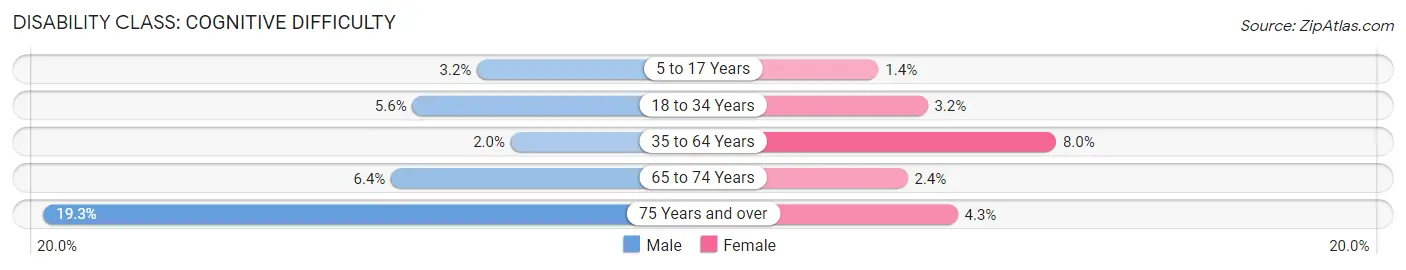
| Age Bracket | Male | Female |
| 5 to 17 Years | 87 (3.2%) | 37 (1.4%) |
| 18 to 34 Years | 137 (5.6%) | 79 (3.2%) |
| 35 to 64 Years | 92 (1.9%) | 353 (8.0%) |
| 65 to 74 Years | 70 (6.4%) | 27 (2.4%) |
| 75 Years and over | 115 (19.3%) | 34 (4.3%) |
Disability Class: Ambulatory Difficulty
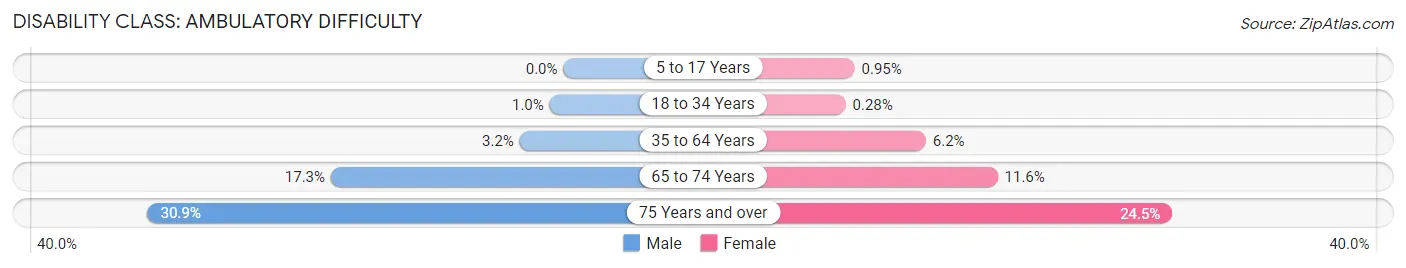
| Age Bracket | Male | Female |
| 5 to 17 Years | 0 (0.0%) | 26 (0.9%) |
| 18 to 34 Years | 25 (1.0%) | 7 (0.3%) |
| 35 to 64 Years | 153 (3.2%) | 277 (6.2%) |
| 65 to 74 Years | 189 (17.3%) | 128 (11.6%) |
| 75 Years and over | 184 (30.9%) | 194 (24.5%) |
Disability Class: Self-Care Difficulty
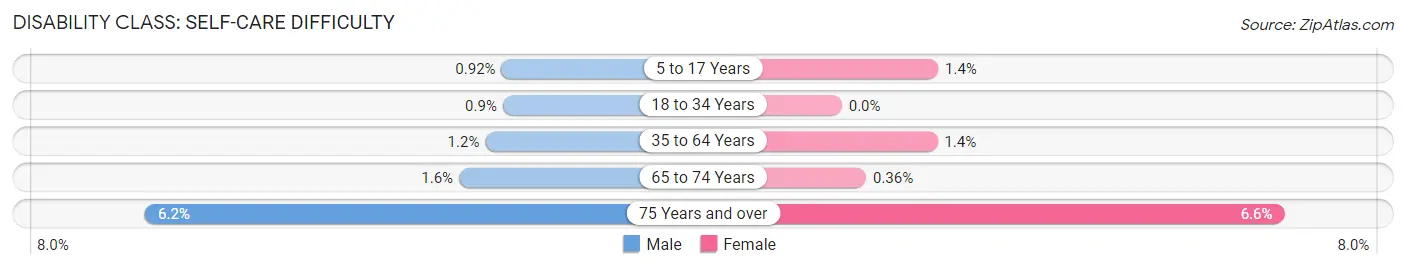
| Age Bracket | Male | Female |
| 5 to 17 Years | 25 (0.9%) | 39 (1.4%) |
| 18 to 34 Years | 22 (0.9%) | 0 (0.0%) |
| 35 to 64 Years | 55 (1.2%) | 63 (1.4%) |
| 65 to 74 Years | 17 (1.5%) | 4 (0.4%) |
| 75 Years and over | 37 (6.2%) | 52 (6.6%) |
Technology Access in Pottawatomie County
Computing Device Access in Pottawatomie County
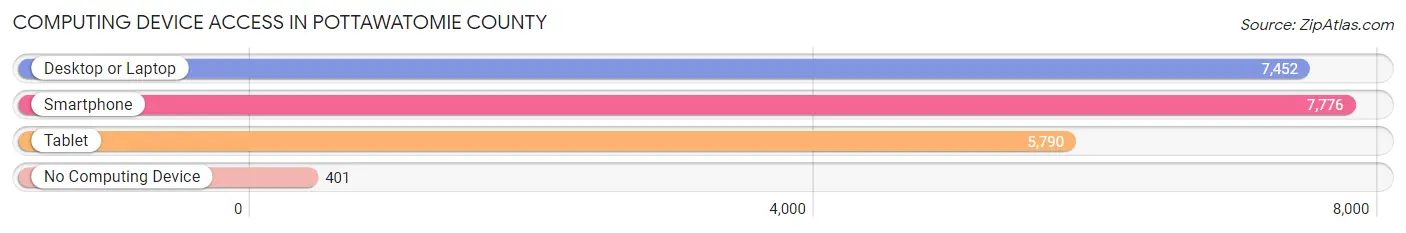
| Device Type | # Households | % Households |
| Desktop or Laptop | 7,452 | 82.3% |
| Smartphone | 7,776 | 85.9% |
| Tablet | 5,790 | 63.9% |
| No Computing Device | 401 | 4.4% |
| Total | 9,054 | 100.0% |
Internet Access in Pottawatomie County
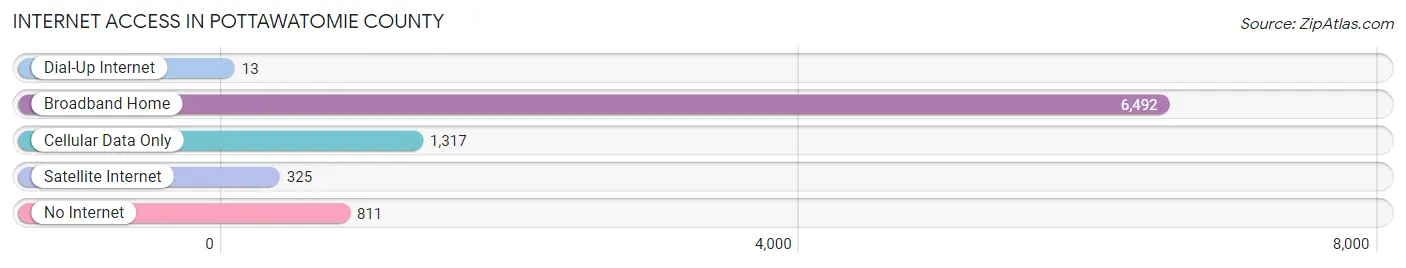
| Internet Type | # Households | % Households |
| Dial-Up Internet | 13 | 0.1% |
| Broadband Home | 6,492 | 71.7% |
| Cellular Data Only | 1,317 | 14.5% |
| Satellite Internet | 325 | 3.6% |
| No Internet | 811 | 9.0% |
| Total | 9,054 | 100.0% |
Pottawatomie County Summary
Pottawatomie County is located in the northeastern part of the state of Kansas. It is bordered by Marshall, Riley, Wabaunsee, and Jackson counties. The county seat is Westmoreland, and the largest city is St. Marys. The county was named after the Pottawatomie Native American tribe.
Geography
Pottawatomie County covers an area of 576 square miles. It is mostly flat, with some rolling hills in the western part of the county. The county is drained by the Big Blue River, which flows through the center of the county. The county is also home to several small lakes, including Lake Pottawatomie, Lake St. Marys, and Lake Wabaunsee.
The county is mostly rural, with the majority of the population living in small towns and villages. The largest city in the county is St. Marys, with a population of 2,845 in 2000. Other towns and villages include Westmoreland, Louisville, Onaga, and Wamego.
Climate
Pottawatomie County has a humid continental climate, with hot summers and cold winters. The average annual temperature is 54°F, and the average annual precipitation is 33 inches.
Demographics
In 2000, the population of Pottawatomie County was 15,845. The population was spread out, with 24.3% under the age of 18, 8.2% from 18 to 24, 28.2% from 25 to 44, 24.2% from 45 to 64, and 14.1% who were 65 years of age or older. The median age was 38 years.
The racial makeup of the county was 97.2% White, 0.3% African American, 0.4% Native American, 0.3% Asian, 0.1% Pacific Islander, 0.5% from other races, and 1.2% from two or more races. Hispanic or Latino of any race were 1.7% of the population.
The median income for a household in the county was $37,945, and the median income for a family was $45,938. Males had a median income of $32,917 versus $22,917 for females. The per capita income for the county was $17,945. About 8.2% of families and 11.2% of the population were below the poverty line, including 14.2% of those under age 18 and 8.2% of those age 65 or over.
Economy
The economy of Pottawatomie County is largely based on agriculture. The county is home to several large farms, and the main crops grown are corn, soybeans, and wheat. The county is also home to several small businesses, including manufacturing, retail, and service industries.
The county is home to several educational institutions, including the University of Kansas, Kansas State University, and Washburn University. The county is also home to several museums, including the Pottawatomie County Historical Museum and the St. Marys Museum.
Conclusion
Pottawatomie County is a rural county located in the northeastern part of Kansas. It is home to several small towns and villages, and the economy is largely based on agriculture. The county is also home to several educational institutions and museums. The population of the county was 15,845 in 2000, and the median income for a household was $37,945.
Common Questions
What is the Total Population of Pottawatomie County?
Total Population of Pottawatomie County is 25,482.
What is the Total Male Population of Pottawatomie County?
Total Male Population of Pottawatomie County is 12,835.
What is the Total Female Population of Pottawatomie County?
Total Female Population of Pottawatomie County is 12,647.
What is the Ratio of Males per 100 Females in Pottawatomie County?
There are 101.49 Males per 100 Females in Pottawatomie County.
What is the Ratio of Females per 100 Males in Pottawatomie County?
There are 98.54 Females per 100 Males in Pottawatomie County.
What is the Median Population Age in Pottawatomie County?
Median Population Age in Pottawatomie County is 35.8 Years.
What is the Average Family Size in Pottawatomie County
Average Family Size in Pottawatomie County is 3.3 People.
What is the Average Household Size in Pottawatomie County
Average Household Size in Pottawatomie County is 2.8 People.
What is Per Capita Income in Pottawatomie County?
Per Capita income in Pottawatomie County is $35,715.
What is the Median Family Income in Pottawatomie County?
Median Family Income in Pottawatomie County is $100,295.
What is the Median Household income in Pottawatomie County?
Median Household Income in Pottawatomie County is $85,241.
What is Income or Wage Gap in Pottawatomie County?
Income or Wage Gap in Pottawatomie County is 39.4%.
Women in Pottawatomie County earn 60.6 cents for every dollar earned by a man.
What is Inequality or Gini Index in Pottawatomie County?
Inequality or Gini Index in Pottawatomie County is 0.39.
How Large is the Labor Force in Pottawatomie County?
There are 12,761 People in the Labor Forcein in Pottawatomie County.
What is the Percentage of People in the Labor Force in Pottawatomie County?
67.2% of People are in the Labor Force in Pottawatomie County.
What is the Unemployment Rate in Pottawatomie County?
Unemployment Rate in Pottawatomie County is 1.9%.