Phillips County, KS
Phillips County Map
Phillips County Overview
4,960
TOTAL POPULATION
2,526
MALE POPULATION
2,434
FEMALE POPULATION
103.78
MALES / 100 FEMALES
96.36
FEMALES / 100 MALES
44.9
MEDIAN AGE
3.0
AVG FAMILY SIZE
2.2
AVG HOUSEHOLD SIZE
$34,396
PER CAPITA INCOME
$72,042
AVG FAMILY INCOME
$57,611
AVG HOUSEHOLD INCOME
38.7%
WAGE / INCOME GAP [ % ]
61.3¢/ $1
WAGE / INCOME GAP [ $ ]
$10,958
FAMILY INCOME DEFICIT
0.44
INEQUALITY / GINI INDEX
2,417
LABOR FORCE [ PEOPLE ]
60.2%
PERCENT IN LABOR FORCE
4.0%
UNEMPLOYMENT RATE
Phillips County Area Codes
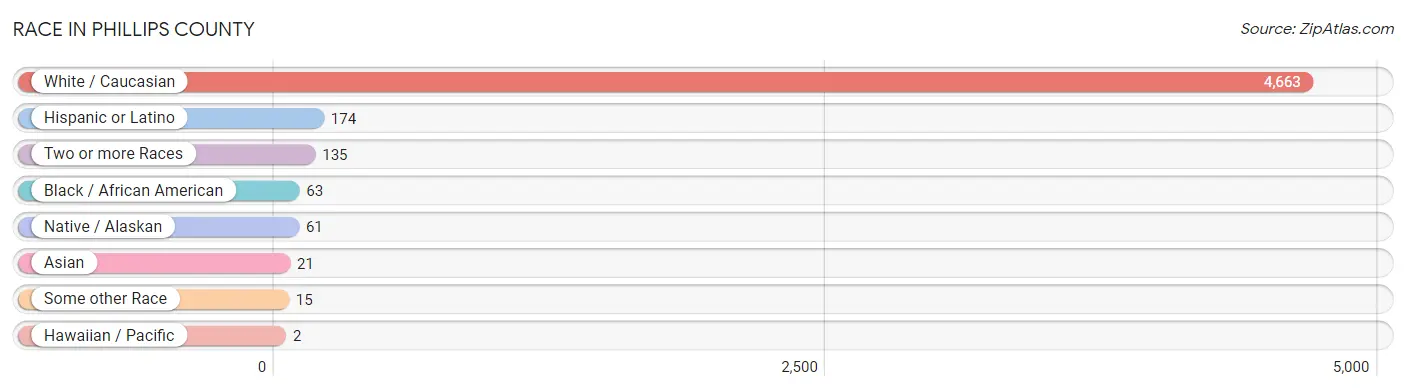
Race in Phillips County
The most populous races in Phillips County are White / Caucasian (4,663 | 94.0%), Hispanic or Latino (174 | 3.5%), and Two or more Races (135 | 2.7%).
| Race | # Population | % Population |
| Asian | 21 | 0.4% |
| Black / African American | 63 | 1.3% |
| Hawaiian / Pacific | 2 | 0.0% |
| Hispanic or Latino | 174 | 3.5% |
| Native / Alaskan | 61 | 1.2% |
| White / Caucasian | 4,663 | 94.0% |
| Two or more Races | 135 | 2.7% |
| Some other Race | 15 | 0.3% |
| Total | 4,960 | 100.0% |
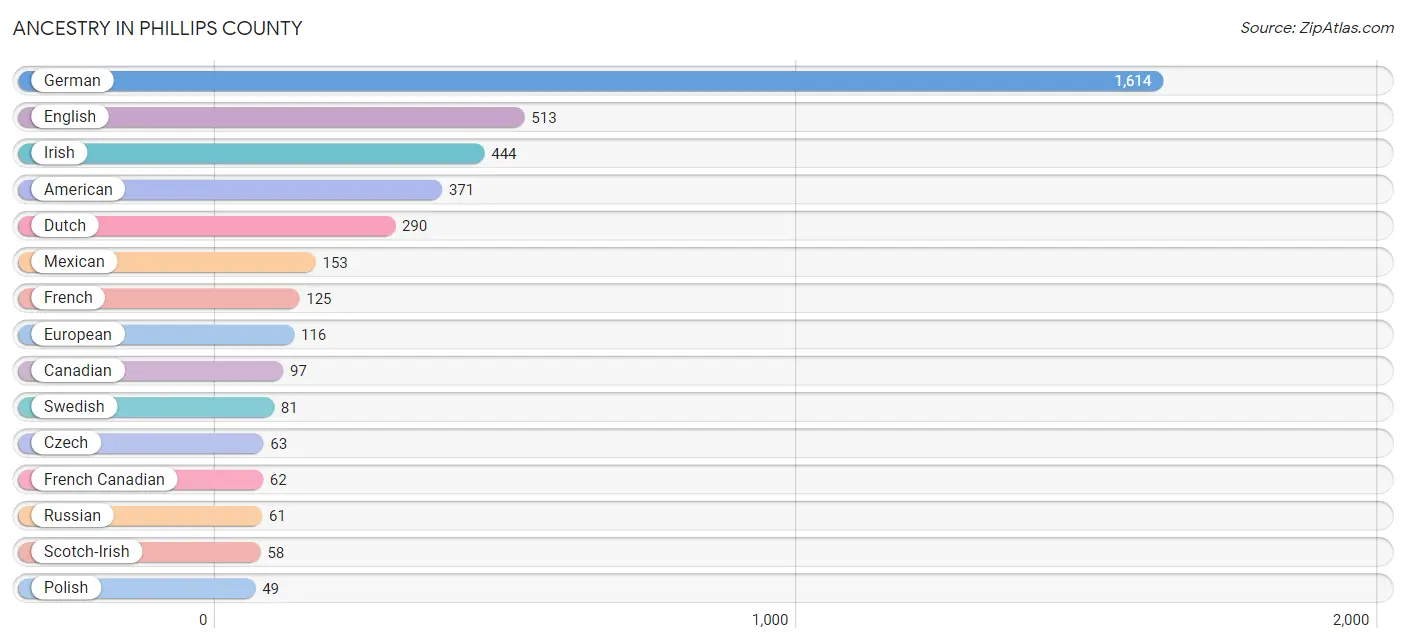
Ancestry in Phillips County
The most populous ancestries reported in Phillips County are German (1,614 | 32.5%), English (513 | 10.3%), Irish (444 | 8.9%), American (371 | 7.5%), and Dutch (290 | 5.9%), together accounting for 65.2% of all Phillips County residents.
| Ancestry | # Population | % Population |
| American | 371 | 7.5% |
| Austrian | 5 | 0.1% |
| Belgian | 3 | 0.1% |
| British | 33 | 0.7% |
| Burmese | 5 | 0.1% |
| Canadian | 97 | 2.0% |
| Cherokee | 6 | 0.1% |
| Choctaw | 48 | 1.0% |
| Czech | 63 | 1.3% |
| Danish | 28 | 0.6% |
| Dutch | 290 | 5.9% |
| Eastern European | 8 | 0.2% |
| English | 513 | 10.3% |
| European | 116 | 2.3% |
| French | 125 | 2.5% |
| French Canadian | 62 | 1.3% |
| German | 1,614 | 32.5% |
| German Russian | 6 | 0.1% |
| Greek | 2 | 0.0% |
| Guamanian / Chamorro | 2 | 0.0% |
| Indian (Asian) | 6 | 0.1% |
| Irish | 444 | 8.9% |
| Italian | 24 | 0.5% |
| Jamaican | 3 | 0.1% |
| Korean | 21 | 0.4% |
| Mexican | 153 | 3.1% |
| Northern European | 23 | 0.5% |
| Norwegian | 37 | 0.7% |
| Pennsylvania German | 24 | 0.5% |
| Polish | 49 | 1.0% |
| Pueblo | 6 | 0.1% |
| Puerto Rican | 11 | 0.2% |
| Romanian | 7 | 0.1% |
| Russian | 61 | 1.2% |
| Scandinavian | 32 | 0.6% |
| Scotch-Irish | 58 | 1.2% |
| Scottish | 48 | 1.0% |
| Sioux | 1 | 0.0% |
| Slovak | 8 | 0.2% |
| Swedish | 81 | 1.6% |
| Swiss | 8 | 0.2% |
| Welsh | 27 | 0.5% | View All 42 Rows |
Immigrants in Phillips County
The most numerous immigrant groups reported in Phillips County came from Central America (23 | 0.5%), Latin America (23 | 0.5%), Asia (22 | 0.4%), Mexico (18 | 0.4%), and Philippines (13 | 0.3%), together accounting for 2.0% of all Phillips County residents.

| Immigration Origin | # Population | % Population |
| Africa | 3 | 0.1% |
| Asia | 22 | 0.4% |
| Canada | 3 | 0.1% |
| Central America | 23 | 0.5% |
| China | 6 | 0.1% |
| Eastern Asia | 9 | 0.2% |
| Guatemala | 5 | 0.1% |
| Korea | 3 | 0.1% |
| Latin America | 23 | 0.5% |
| Mexico | 18 | 0.4% |
| Philippines | 13 | 0.3% |
| South Africa | 3 | 0.1% |
| South Eastern Asia | 13 | 0.3% | View All 13 Rows |
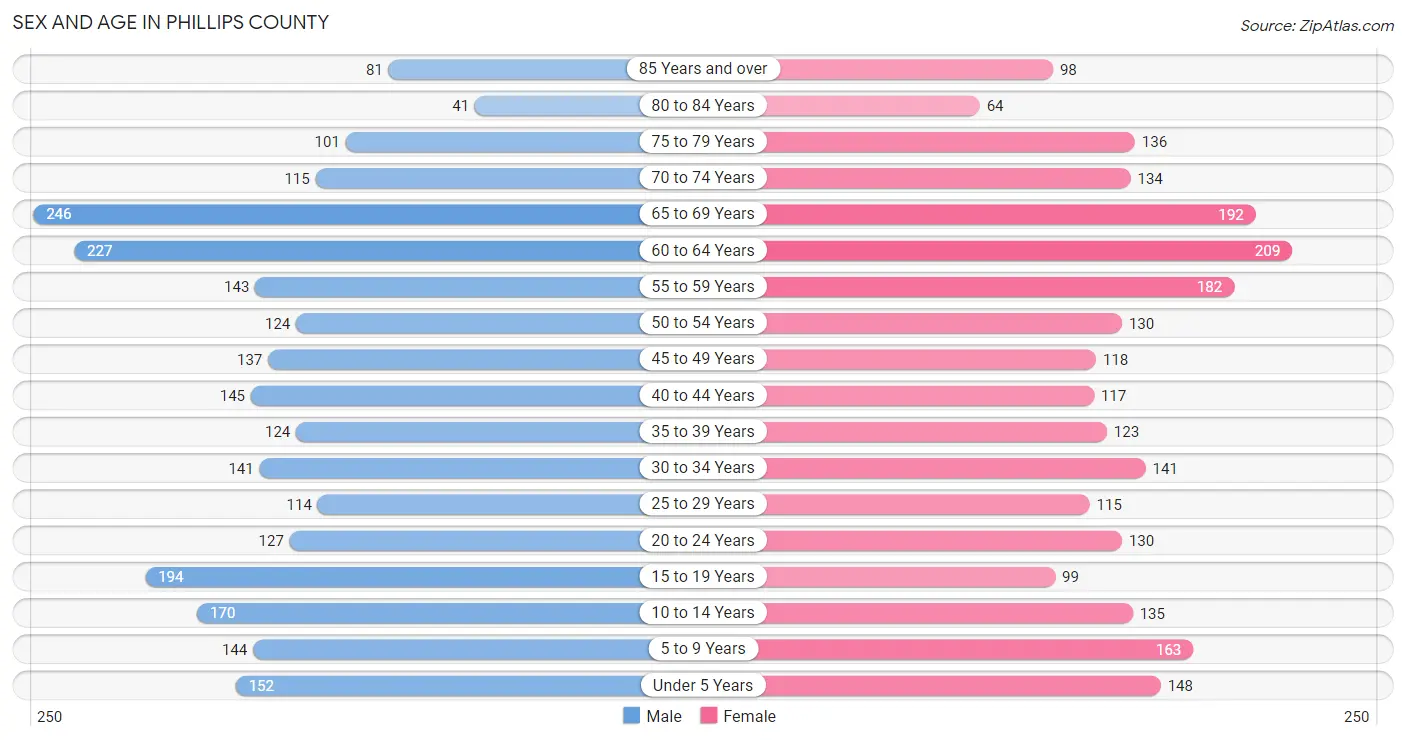
Sex and Age in Phillips County
Sex and Age in Phillips County
The most populous age groups in Phillips County are 65 to 69 Years (246 | 9.7%) for men and 60 to 64 Years (209 | 8.6%) for women.
| Age Bracket | Male | Female |
| Under 5 Years | 152 (6.0%) | 148 (6.1%) |
| 5 to 9 Years | 144 (5.7%) | 163 (6.7%) |
| 10 to 14 Years | 170 (6.7%) | 135 (5.6%) |
| 15 to 19 Years | 194 (7.7%) | 99 (4.1%) |
| 20 to 24 Years | 127 (5.0%) | 130 (5.3%) |
| 25 to 29 Years | 114 (4.5%) | 115 (4.7%) |
| 30 to 34 Years | 141 (5.6%) | 141 (5.8%) |
| 35 to 39 Years | 124 (4.9%) | 123 (5.1%) |
| 40 to 44 Years | 145 (5.7%) | 117 (4.8%) |
| 45 to 49 Years | 137 (5.4%) | 118 (4.9%) |
| 50 to 54 Years | 124 (4.9%) | 130 (5.3%) |
| 55 to 59 Years | 143 (5.7%) | 182 (7.5%) |
| 60 to 64 Years | 227 (9.0%) | 209 (8.6%) |
| 65 to 69 Years | 246 (9.7%) | 192 (7.9%) |
| 70 to 74 Years | 115 (4.5%) | 134 (5.5%) |
| 75 to 79 Years | 101 (4.0%) | 136 (5.6%) |
| 80 to 84 Years | 41 (1.6%) | 64 (2.6%) |
| 85 Years and over | 81 (3.2%) | 98 (4.0%) |
| Total | 2,526 (100.0%) | 2,434 (100.0%) |
Families and Households in Phillips County
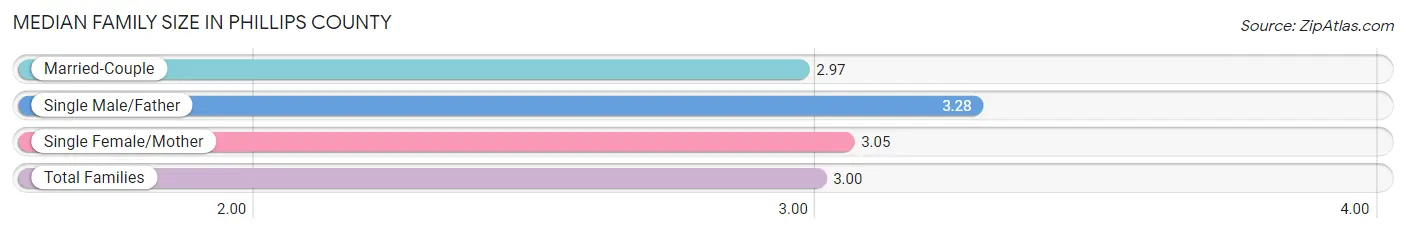
Median Family Size in Phillips County
The median family size in Phillips County is 3.00 persons per family, with single male/father families (74 | 6.0%) accounting for the largest median family size of 3.28 persons per family. On the other hand, married-couple families (994 | 80.2%) represent the smallest median family size with 2.97 persons per family.
| Family Type | # Families | Family Size |
| Married-Couple | 994 (80.2%) | 2.97 |
| Single Male/Father | 74 (6.0%) | 3.28 |
| Single Female/Mother | 171 (13.8%) | 3.05 |
| Total Families | 1,239 (100.0%) | 3.00 |
Median Household Size in Phillips County
The median household size in Phillips County is 2.23 persons per household, with single male/father households (74 | 3.4%) accounting for the largest median household size of 3.58 persons per household. non-family households (952 | 43.4%) represent the smallest median household size with 1.13 persons per household.

| Household Type | # Households | Household Size |
| Married-Couple | 994 (45.4%) | 2.99 |
| Single Male/Father | 74 (3.4%) | 3.58 |
| Single Female/Mother | 171 (7.8%) | 3.32 |
| Non-family | 952 (43.4%) | 1.13 |
| Total Households | 2,191 (100.0%) | 2.23 |
Household Size by Marriage Status in Phillips County
Out of a total of 2,191 households in Phillips County, 1,239 (56.6%) are family households, while 952 (43.4%) are nonfamily households. The most numerous type of family households are 2-person households, comprising 718, and the most common type of nonfamily households are 1-person households, comprising 854.

| Household Size | Family Households | Nonfamily Households |
| 1-Person Households | - | 854 (39.0%) |
| 2-Person Households | 718 (32.8%) | 89 (4.1%) |
| 3-Person Households | 200 (9.1%) | 6 (0.3%) |
| 4-Person Households | 117 (5.3%) | 3 (0.1%) |
| 5-Person Households | 124 (5.7%) | 0 (0.0%) |
| 6-Person Households | 66 (3.0%) | 0 (0.0%) |
| 7+ Person Households | 14 (0.6%) | 0 (0.0%) |
| Total | 1,239 (56.6%) | 952 (43.4%) |
Female Fertility in Phillips County
Fertility by Age in Phillips County
Average fertility rate in Phillips County is 87.0 births per 1,000 women. Women in the age bracket of 20 to 34 years have the highest fertility rate with 176.0 births per 1,000 women. Women in the age bracket of 20 to 34 years acount for 90.7% of all women with births.

| Age Bracket | Women with Births | Births / 1,000 Women |
| 15 to 19 years | 0 (0.0%) | 0.0 |
| 20 to 34 years | 68 (90.7%) | 176.0 |
| 35 to 50 years | 7 (9.3%) | 19.0 |
| Total | 75 (100.0%) | 87.0 |
Fertility by Age by Marriage Status in Phillips County
78.7% of women with births (75) in Phillips County are married. The highest percentage of unmarried women with births falls into 20 to 34 years age bracket with 23.5% of them unmarried at the time of birth, while the lowest percentage of unmarried women with births belong to 35 to 50 years age bracket with 0.0% of them unmarried.

| Age Bracket | Married | Unmarried |
| 15 to 19 years | 0 (0.0%) | 0 (0.0%) |
| 20 to 34 years | 52 (76.5%) | 16 (23.5%) |
| 35 to 50 years | 7 (100.0%) | 0 (0.0%) |
| Total | 59 (78.7%) | 16 (21.3%) |
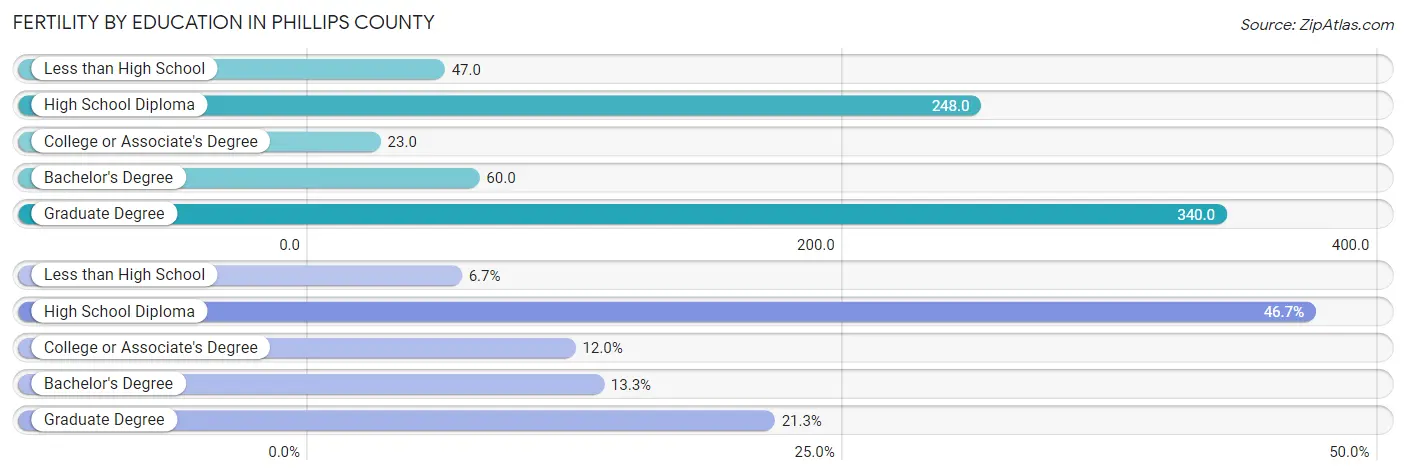
Fertility by Education in Phillips County
Average fertility rate in Phillips County is 87.0 births per 1,000 women. Women with the education attainment of graduate degree have the highest fertility rate of 340.0 births per 1,000 women, while women with the education attainment of college or associate's degree have the lowest fertility at 23.0 births per 1,000 women. Women with the education attainment of high school diploma represent 46.7% of all women with births.
| Educational Attainment | Women with Births | Births / 1,000 Women |
| Less than High School | 5 (6.7%) | 47.0 |
| High School Diploma | 35 (46.7%) | 248.0 |
| College or Associate's Degree | 9 (12.0%) | 23.0 |
| Bachelor's Degree | 10 (13.3%) | 60.0 |
| Graduate Degree | 16 (21.3%) | 340.0 |
| Total | 75 (100.0%) | 87.0 |
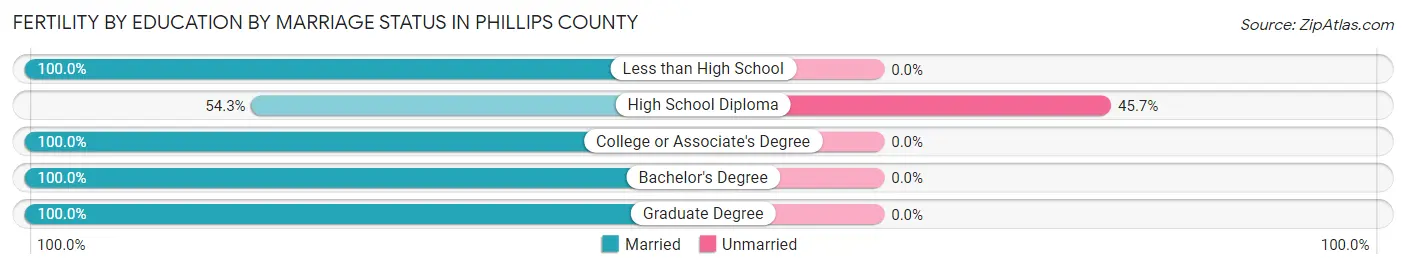
Fertility by Education by Marriage Status in Phillips County
21.3% of women with births in Phillips County are unmarried. Women with the educational attainment of less than high school are most likely to be married with 100.0% of them married at childbirth, while women with the educational attainment of high school diploma are least likely to be married with 45.7% of them unmarried at childbirth.
| Educational Attainment | Married | Unmarried |
| Less than High School | 5 (100.0%) | 0 (0.0%) |
| High School Diploma | 19 (54.3%) | 16 (45.7%) |
| College or Associate's Degree | 9 (100.0%) | 0 (0.0%) |
| Bachelor's Degree | 10 (100.0%) | 0 (0.0%) |
| Graduate Degree | 16 (100.0%) | 0 (0.0%) |
| Total | 59 (78.7%) | 16 (21.3%) |
Income in Phillips County
Income Overview in Phillips County
Per Capita Income in Phillips County is $34,396, while median incomes of families and households are $72,042 and $57,611 respectively.
| Characteristic | Number | Measure |
| Per Capita Income | 4,960 | $34,396 |
| Median Family Income | 1,239 | $72,042 |
| Mean Family Income | 1,239 | $94,325 |
| Median Household Income | 2,191 | $57,611 |
| Mean Household Income | 2,191 | $74,849 |
| Income Deficit | 1,239 | $10,958 |
| Wage / Income Gap (%) | 4,960 | 38.73% |
| Wage / Income Gap ($) | 4,960 | 61.27¢ per $1 |
| Gini / Inequality Index | 4,960 | 0.44 |
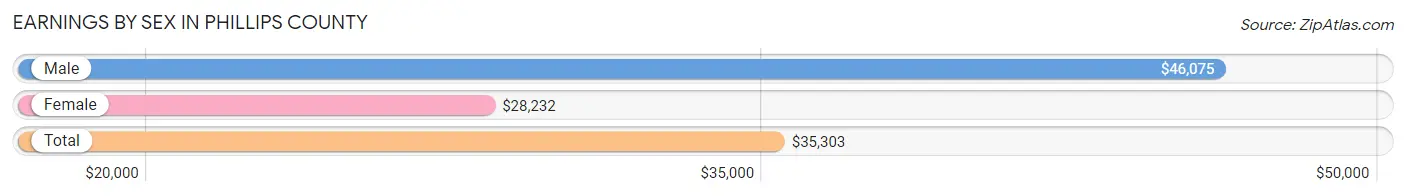
Earnings by Sex in Phillips County
Average Earnings in Phillips County are $35,303, $46,075 for men and $28,232 for women, a difference of 38.7%.
| Sex | Number | Average Earnings |
| Male | 1,320 (51.4%) | $46,075 |
| Female | 1,249 (48.6%) | $28,232 |
| Total | 2,569 (100.0%) | $35,303 |
Earnings by Sex by Income Bracket in Phillips County
The most common earnings brackets in Phillips County are $100,000+ for men (172 | 13.0%) and $2,499 or less for women (164 | 13.1%).

| Income | Male | Female |
| $2,499 or less | 69 (5.2%) | 164 (13.1%) |
| $2,500 to $4,999 | 28 (2.1%) | 27 (2.2%) |
| $5,000 to $7,499 | 50 (3.8%) | 56 (4.5%) |
| $7,500 to $9,999 | 75 (5.7%) | 82 (6.6%) |
| $10,000 to $12,499 | 48 (3.6%) | 40 (3.2%) |
| $12,500 to $14,999 | 13 (1.0%) | 39 (3.1%) |
| $15,000 to $17,499 | 26 (2.0%) | 26 (2.1%) |
| $17,500 to $19,999 | 23 (1.7%) | 20 (1.6%) |
| $20,000 to $22,499 | 36 (2.7%) | 64 (5.1%) |
| $22,500 to $24,999 | 15 (1.1%) | 31 (2.5%) |
| $25,000 to $29,999 | 72 (5.4%) | 125 (10.0%) |
| $30,000 to $34,999 | 72 (5.4%) | 71 (5.7%) |
| $35,000 to $39,999 | 43 (3.3%) | 92 (7.4%) |
| $40,000 to $44,999 | 44 (3.3%) | 45 (3.6%) |
| $45,000 to $49,999 | 131 (9.9%) | 65 (5.2%) |
| $50,000 to $54,999 | 62 (4.7%) | 54 (4.3%) |
| $55,000 to $64,999 | 116 (8.8%) | 125 (10.0%) |
| $65,000 to $74,999 | 70 (5.3%) | 10 (0.8%) |
| $75,000 to $99,999 | 155 (11.7%) | 88 (7.0%) |
| $100,000+ | 172 (13.0%) | 25 (2.0%) |
| Total | 1,320 (100.0%) | 1,249 (100.0%) |
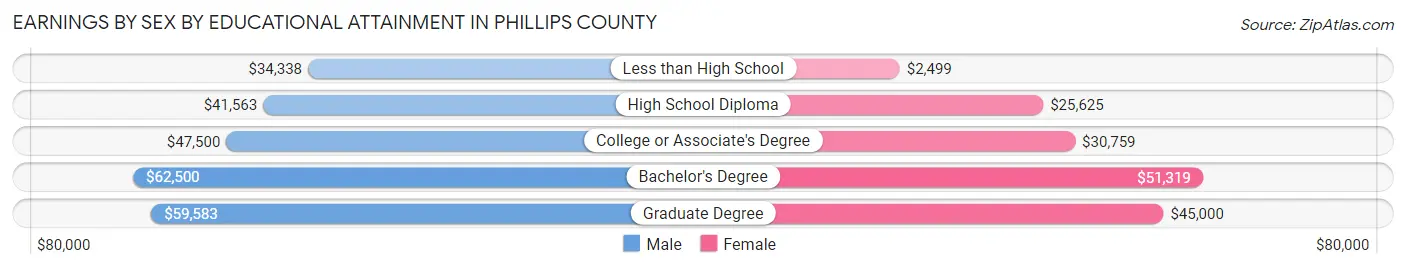
Earnings by Sex by Educational Attainment in Phillips County
Average earnings in Phillips County are $48,906 for men and $30,744 for women, a difference of 37.1%. Men with an educational attainment of bachelor's degree enjoy the highest average annual earnings of $62,500, while those with less than high school education earn the least with $34,338. Women with an educational attainment of bachelor's degree earn the most with the average annual earnings of $51,319, while those with less than high school education have the smallest earnings of $2,499.
| Educational Attainment | Male Income | Female Income |
| Less than High School | $34,338 | $2,499 |
| High School Diploma | $41,563 | $25,625 |
| College or Associate's Degree | $47,500 | $30,759 |
| Bachelor's Degree | $62,500 | $51,319 |
| Graduate Degree | $59,583 | $45,000 |
| Total | $48,906 | $30,744 |
Family Income in Phillips County
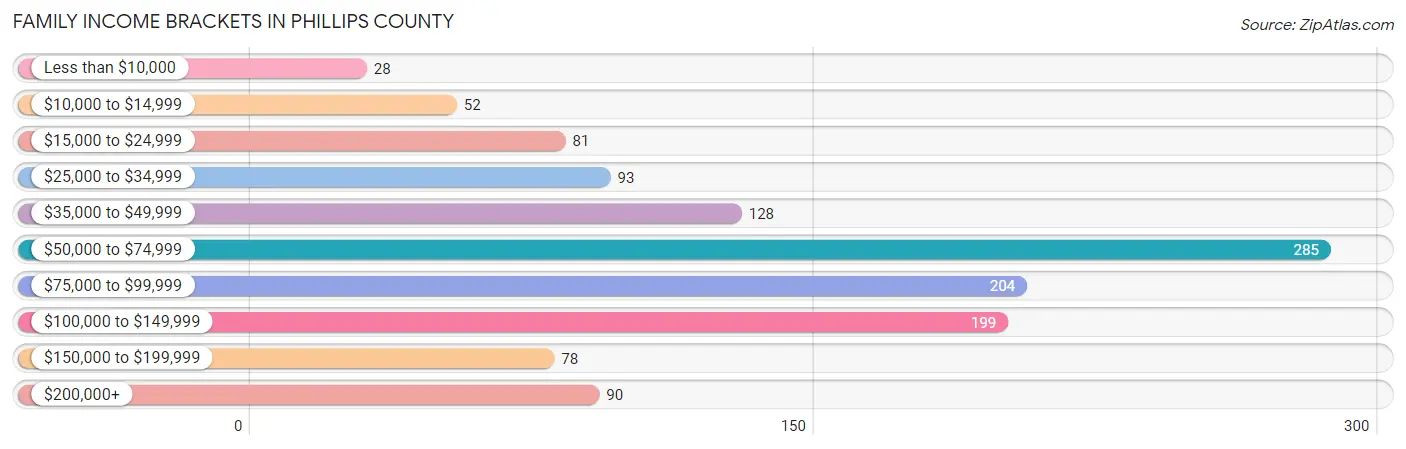
Family Income Brackets in Phillips County
According to the Phillips County family income data, there are 285 families falling into the $50,000 to $74,999 income range, which is the most common income bracket and makes up 23.0% of all families. Conversely, the less than $10,000 income bracket is the least frequent group with only 28 families (2.3%) belonging to this category.
| Income Bracket | # Families | % Families |
| Less than $10,000 | 28 | 2.3% |
| $10,000 to $14,999 | 52 | 4.2% |
| $15,000 to $24,999 | 81 | 6.5% |
| $25,000 to $34,999 | 93 | 7.5% |
| $35,000 to $49,999 | 128 | 10.3% |
| $50,000 to $74,999 | 285 | 23.0% |
| $75,000 to $99,999 | 204 | 16.5% |
| $100,000 to $149,999 | 199 | 16.1% |
| $150,000 to $199,999 | 78 | 6.3% |
| $200,000+ | 90 | 7.3% |
Family Income by Famaliy Size in Phillips County
6-person families (34 | 2.7%) account for the highest median family income in Phillips County with $117,917 per family, while 2-person families (725 | 58.5%) have the highest median income of $33,807 per family member.

| Income Bracket | # Families | Median Income |
| 2-Person Families | 725 (58.5%) | $67,614 |
| 3-Person Families | 216 (17.4%) | $74,444 |
| 4-Person Families | 109 (8.8%) | $77,202 |
| 5-Person Families | 152 (12.3%) | $0 |
| 6-Person Families | 34 (2.7%) | $117,917 |
| 7+ Person Families | 3 (0.2%) | $0 |
| Total | 1,239 (100.0%) | $72,042 |
Family Income by Number of Earners in Phillips County
The median family income in Phillips County is $72,042, with families comprising 3+ earners (128) having the highest median family income of $122,600, while families with no earners (234) have the lowest median family income of $37,400, accounting for 10.3% and 18.9% of families, respectively.
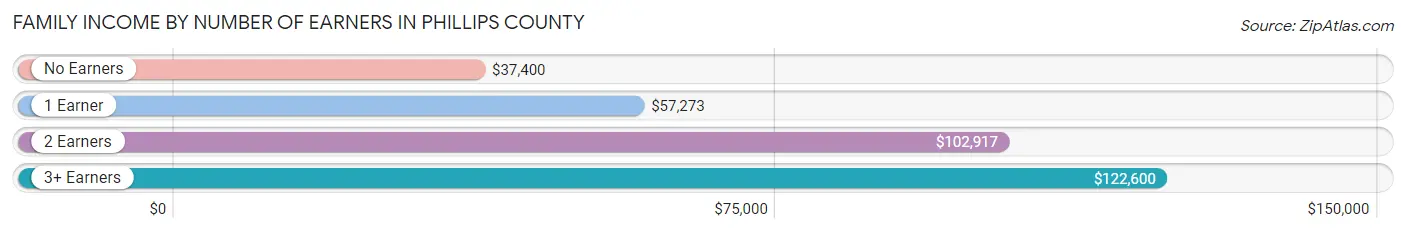
| Number of Earners | # Families | Median Income |
| No Earners | 234 (18.9%) | $37,400 |
| 1 Earner | 410 (33.1%) | $57,273 |
| 2 Earners | 467 (37.7%) | $102,917 |
| 3+ Earners | 128 (10.3%) | $122,600 |
| Total | 1,239 (100.0%) | $72,042 |
Household Income in Phillips County
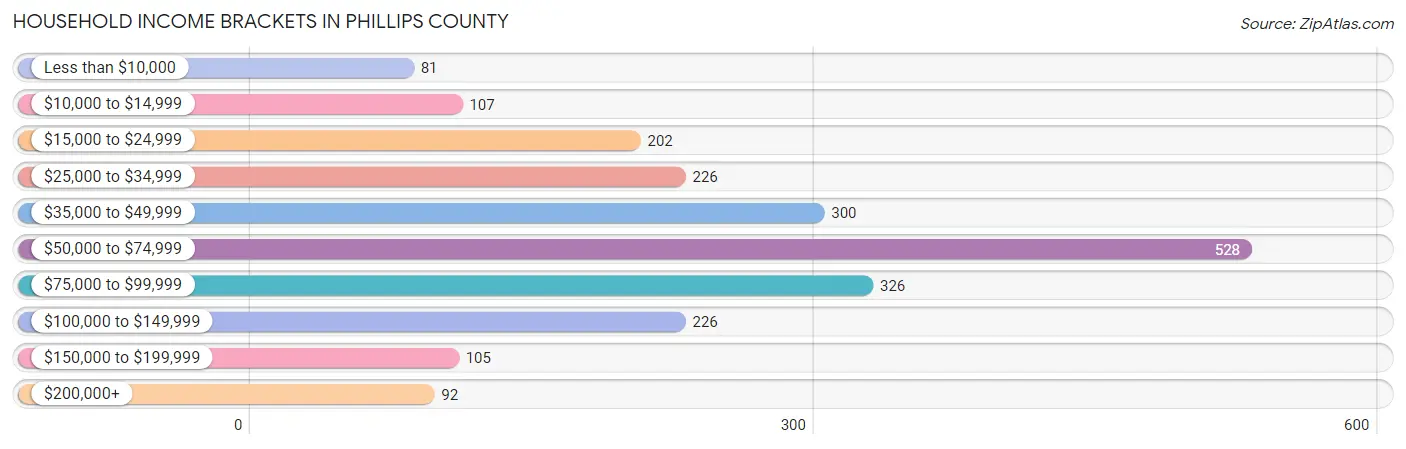
Household Income Brackets in Phillips County
With 528 households falling in the category, the $50,000 to $74,999 income range is the most frequent in Phillips County, accounting for 24.1% of all households. In contrast, only 81 households (3.7%) fall into the less than $10,000 income bracket, making it the least populous group.
| Income Bracket | # Households | % Households |
| Less than $10,000 | 81 | 3.7% |
| $10,000 to $14,999 | 107 | 4.9% |
| $15,000 to $24,999 | 202 | 9.2% |
| $25,000 to $34,999 | 226 | 10.3% |
| $35,000 to $49,999 | 300 | 13.7% |
| $50,000 to $74,999 | 528 | 24.1% |
| $75,000 to $99,999 | 326 | 14.9% |
| $100,000 to $149,999 | 226 | 10.3% |
| $150,000 to $199,999 | 105 | 4.8% |
| $200,000+ | 92 | 4.2% |
Household Income by Householder Age in Phillips County
The median household income in Phillips County is $57,611, with the highest median household income of $67,857 found in the 25 to 44 years age bracket for the primary householder. A total of 608 households (27.8%) fall into this category. Meanwhile, the 65+ years age bracket for the primary householder has the lowest median household income of $42,143, with 720 households (32.9%) in this group.
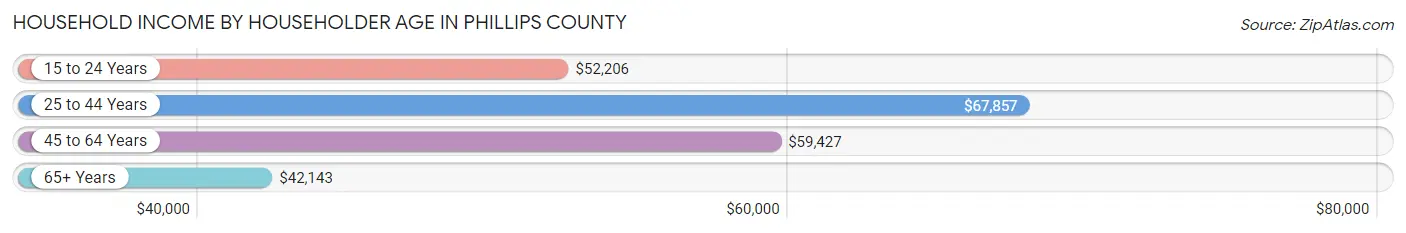
| Income Bracket | # Households | Median Income |
| 15 to 24 Years | 106 (4.8%) | $52,206 |
| 25 to 44 Years | 608 (27.8%) | $67,857 |
| 45 to 64 Years | 757 (34.5%) | $59,427 |
| 65+ Years | 720 (32.9%) | $42,143 |
| Total | 2,191 (100.0%) | $57,611 |
Poverty in Phillips County
Income Below Poverty by Sex and Age in Phillips County
With 17.0% poverty level for males and 15.8% for females among the residents of Phillips County, 6 to 11 year old males and 5 year old females are the most vulnerable to poverty, with 100 males (51.8%) and 19 females (48.7%) in their respective age groups living below the poverty level.
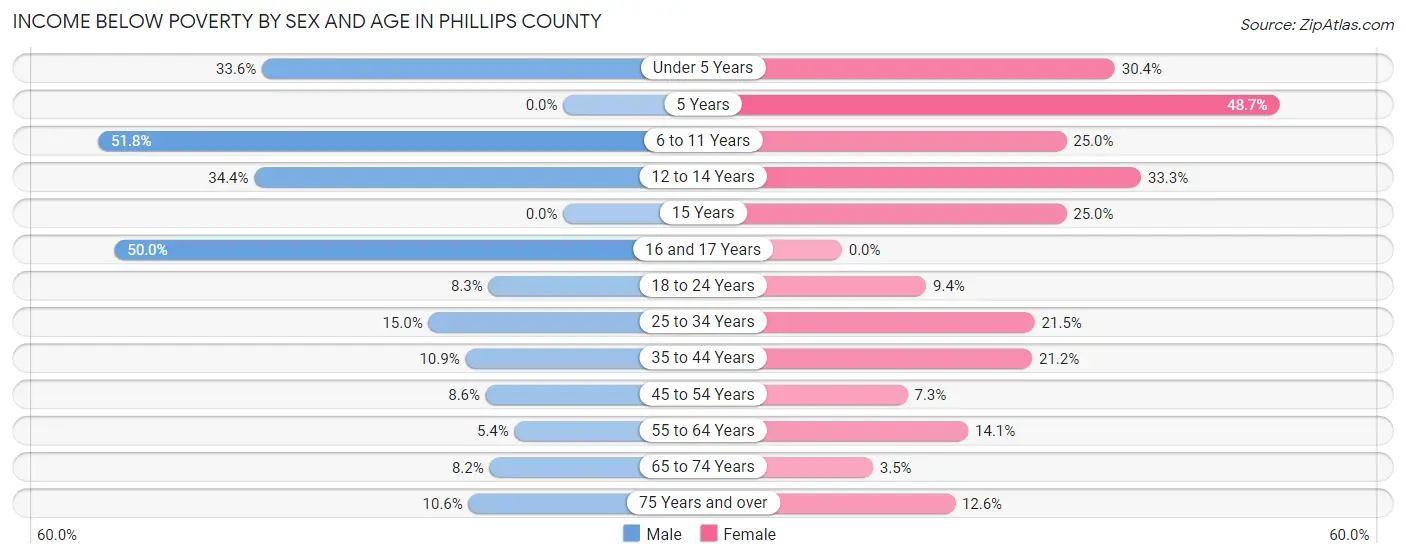
| Age Bracket | Male | Female |
| Under 5 Years | 51 (33.6%) | 45 (30.4%) |
| 5 Years | 0 (0.0%) | 19 (48.7%) |
| 6 to 11 Years | 100 (51.8%) | 45 (25.0%) |
| 12 to 14 Years | 32 (34.4%) | 24 (33.3%) |
| 15 Years | 0 (0.0%) | 4 (25.0%) |
| 16 and 17 Years | 65 (50.0%) | 0 (0.0%) |
| 18 to 24 Years | 14 (8.3%) | 17 (9.4%) |
| 25 to 34 Years | 38 (15.0%) | 55 (21.5%) |
| 35 to 44 Years | 29 (10.9%) | 50 (21.2%) |
| 45 to 54 Years | 22 (8.6%) | 18 (7.3%) |
| 55 to 64 Years | 20 (5.4%) | 55 (14.1%) |
| 65 to 74 Years | 29 (8.2%) | 11 (3.5%) |
| 75 Years and over | 23 (10.5%) | 33 (12.6%) |
| Total | 423 (17.0%) | 376 (15.8%) |
Income Above Poverty by Sex and Age in Phillips County
According to the poverty statistics in Phillips County, males aged 5 years and females aged 16 and 17 years are the age groups that are most secure financially, with 100.0% of males and 100.0% of females in these age groups living above the poverty line.
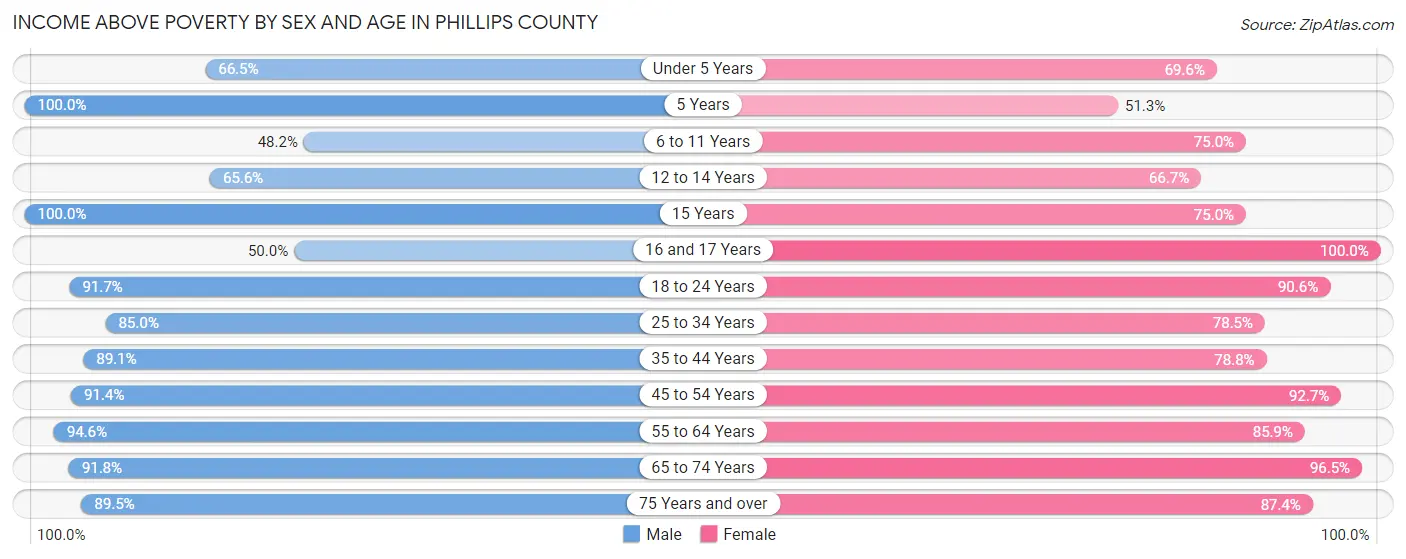
| Age Bracket | Male | Female |
| Under 5 Years | 101 (66.4%) | 103 (69.6%) |
| 5 Years | 22 (100.0%) | 20 (51.3%) |
| 6 to 11 Years | 93 (48.2%) | 135 (75.0%) |
| 12 to 14 Years | 61 (65.6%) | 48 (66.7%) |
| 15 Years | 17 (100.0%) | 12 (75.0%) |
| 16 and 17 Years | 65 (50.0%) | 31 (100.0%) |
| 18 to 24 Years | 154 (91.7%) | 164 (90.6%) |
| 25 to 34 Years | 215 (85.0%) | 201 (78.5%) |
| 35 to 44 Years | 237 (89.1%) | 186 (78.8%) |
| 45 to 54 Years | 233 (91.4%) | 228 (92.7%) |
| 55 to 64 Years | 348 (94.6%) | 336 (85.9%) |
| 65 to 74 Years | 324 (91.8%) | 307 (96.5%) |
| 75 Years and over | 195 (89.4%) | 229 (87.4%) |
| Total | 2,065 (83.0%) | 2,000 (84.2%) |
Income Below Poverty Among Married-Couple Families in Phillips County
The poverty statistics for married-couple families in Phillips County show that 4.8% or 48 of the total 994 families live below the poverty line. Families with 3 or 4 children have the highest poverty rate of 21.0%, comprising of 21 families. On the other hand, families with 5 or more children have the lowest poverty rate of 0.0%, which includes 0 families.
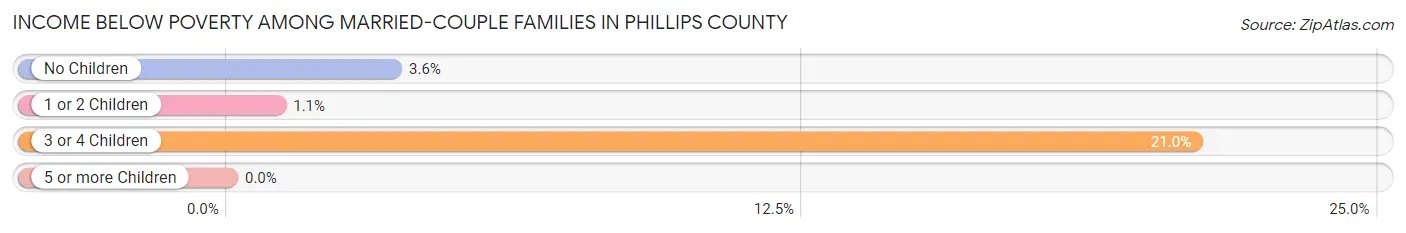
| Children | Above Poverty | Below Poverty |
| No Children | 676 (96.4%) | 25 (3.6%) |
| 1 or 2 Children | 188 (99.0%) | 2 (1.1%) |
| 3 or 4 Children | 79 (79.0%) | 21 (21.0%) |
| 5 or more Children | 3 (100.0%) | 0 (0.0%) |
| Total | 946 (95.2%) | 48 (4.8%) |
Income Below Poverty Among Single-Parent Households in Phillips County
According to the poverty data in Phillips County, 63.5% or 47 single-father households and 45.0% or 77 single-mother households are living below the poverty line. Among single-father households, those with 3 or 4 children have the highest poverty rate, with 27 households (77.1%) experiencing poverty. Likewise, among single-mother households, those with 3 or 4 children have the highest poverty rate, with 43 households (100.0%) falling below the poverty line.
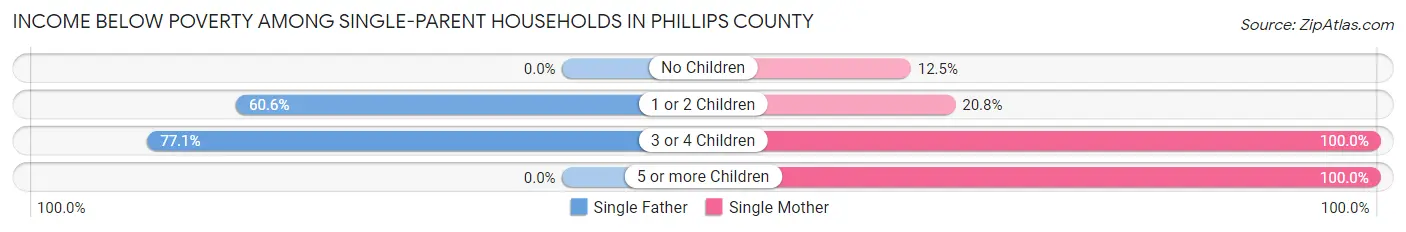
| Children | Single Father | Single Mother |
| No Children | 0 (0.0%) | 2 (12.5%) |
| 1 or 2 Children | 20 (60.6%) | 21 (20.8%) |
| 3 or 4 Children | 27 (77.1%) | 43 (100.0%) |
| 5 or more Children | 0 (0.0%) | 11 (100.0%) |
| Total | 47 (63.5%) | 77 (45.0%) |
Income Below Poverty Among Married-Couple vs Single-Parent Households in Phillips County
The poverty data for Phillips County shows that 48 of the married-couple family households (4.8%) and 124 of the single-parent households (50.6%) are living below the poverty level. Within the married-couple family households, those with 3 or 4 children have the highest poverty rate, with 21 households (21.0%) falling below the poverty line. Among the single-parent households, those with 5 or more children have the highest poverty rate, with 11 household (100.0%) living below poverty.

| Children | Married-Couple Families | Single-Parent Households |
| No Children | 25 (3.6%) | 2 (9.1%) |
| 1 or 2 Children | 2 (1.1%) | 41 (30.6%) |
| 3 or 4 Children | 21 (21.0%) | 70 (89.7%) |
| 5 or more Children | 0 (0.0%) | 11 (100.0%) |
| Total | 48 (4.8%) | 124 (50.6%) |
Employment Characteristics in Phillips County
Employment by Class of Employer in Phillips County
Among the 2,260 employed individuals in Phillips County, private company employees (1,184 | 52.4%), local government employees (386 | 17.1%), and self-employed (not incorporated) (219 | 9.7%) make up the most common classes of employment.
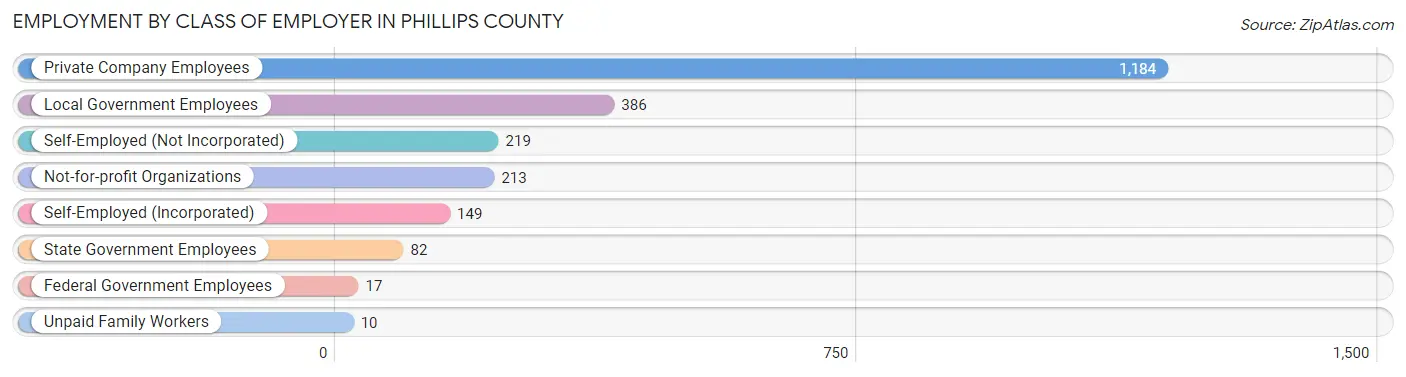
| Employer Class | # Employees | % Employees |
| Private Company Employees | 1,184 | 52.4% |
| Self-Employed (Incorporated) | 149 | 6.6% |
| Self-Employed (Not Incorporated) | 219 | 9.7% |
| Not-for-profit Organizations | 213 | 9.4% |
| Local Government Employees | 386 | 17.1% |
| State Government Employees | 82 | 3.6% |
| Federal Government Employees | 17 | 0.7% |
| Unpaid Family Workers | 10 | 0.4% |
| Total | 2,260 | 100.0% |
Employment Status by Age in Phillips County
According to the labor force statistics for Phillips County, out of the total population over 16 years of age (4,015), 60.2% or 2,417 individuals are in the labor force, with 4.0% or 97 of them unemployed. The age group with the highest labor force participation rate is 30 to 34 years, with 92.6% or 261 individuals in the labor force. Within the labor force, the 16 to 19 years age range has the highest percentage of unemployed individuals, with 12.9% or 21 of them being unemployed.
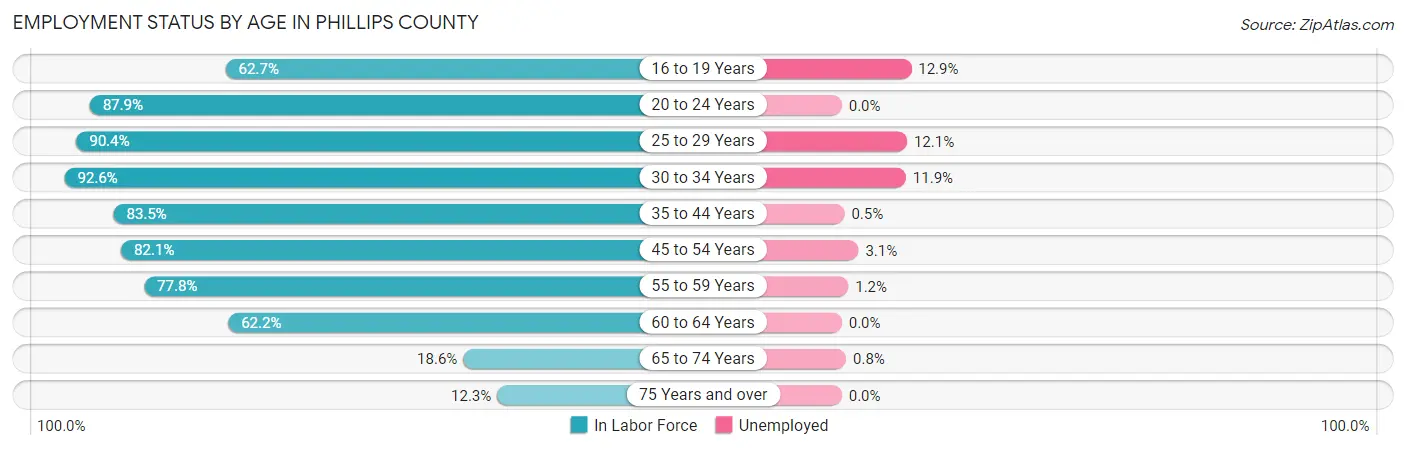
| Age Bracket | In Labor Force | Unemployed |
| 16 to 19 Years | 163 (62.7%) | 21 (12.9%) |
| 20 to 24 Years | 226 (87.9%) | 0 (0.0%) |
| 25 to 29 Years | 207 (90.4%) | 25 (12.1%) |
| 30 to 34 Years | 261 (92.6%) | 31 (11.9%) |
| 35 to 44 Years | 425 (83.5%) | 2 (0.5%) |
| 45 to 54 Years | 418 (82.1%) | 13 (3.1%) |
| 55 to 59 Years | 253 (77.8%) | 3 (1.2%) |
| 60 to 64 Years | 271 (62.2%) | 0 (0.0%) |
| 65 to 74 Years | 128 (18.6%) | 1 (0.8%) |
| 75 Years and over | 64 (12.3%) | 0 (0.0%) |
| Total | 2,417 (60.2%) | 97 (4.0%) |
Employment Status by Educational Attainment in Phillips County
According to labor force statistics for Phillips County, 80.1% of individuals (1,834) out of the total population between 25 and 64 years of age (2,290) are in the labor force, with 4.0% or 73 of them being unemployed. The group with the highest labor force participation rate are those with the educational attainment of bachelor's degree or higher, with 90.1% or 498 individuals in the labor force. Within the labor force, individuals with high school diploma education have the highest percentage of unemployment, with 9.7% or 41 of them being unemployed.
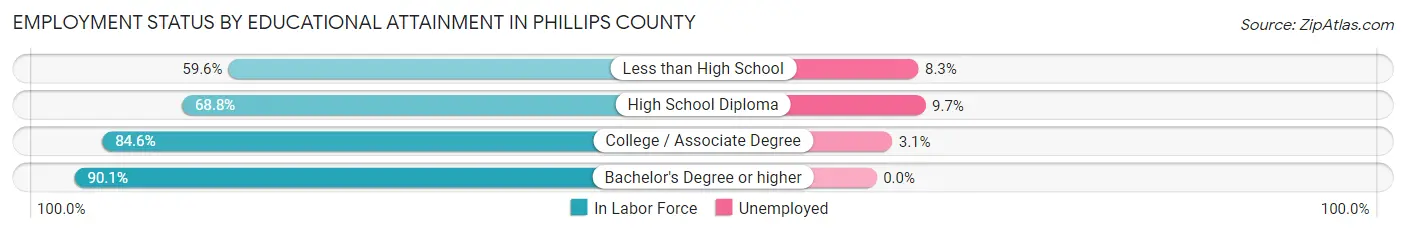
| Educational Attainment | In Labor Force | Unemployed |
| Less than High School | 84 (59.6%) | 12 (8.3%) |
| High School Diploma | 421 (68.8%) | 59 (9.7%) |
| College / Associate Degree | 832 (84.6%) | 31 (3.1%) |
| Bachelor's Degree or higher | 498 (90.1%) | 0 (0.0%) |
| Total | 1,834 (80.1%) | 92 (4.0%) |
Employment Occupations by Sex in Phillips County
Management, Business, Science and Arts Occupations
The most common Management, Business, Science and Arts occupations in Phillips County are Management (282 | 12.2%), Community & Social Service (274 | 11.8%), Health Diagnosing & Treating (270 | 11.6%), Education Instruction & Library (241 | 10.4%), and Health Technologists (124 | 5.3%).

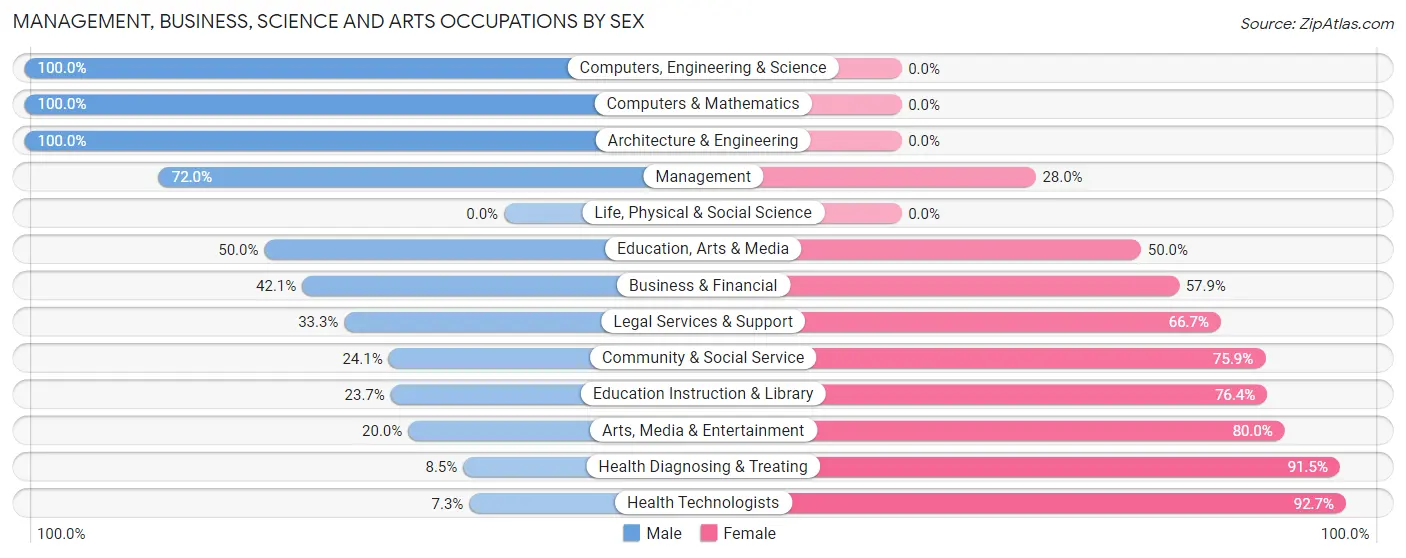
Management, Business, Science and Arts Occupations by Sex
Within the Management, Business, Science and Arts occupations in Phillips County, the most male-oriented occupations are Computers, Engineering & Science (100.0%), Computers & Mathematics (100.0%), and Architecture & Engineering (100.0%), while the most female-oriented occupations are Health Technologists (92.7%), Health Diagnosing & Treating (91.5%), and Arts, Media & Entertainment (80.0%).
| Occupation | Male | Female |
| Management | 203 (72.0%) | 79 (28.0%) |
| Business & Financial | 24 (42.1%) | 33 (57.9%) |
| Computers, Engineering & Science | 63 (100.0%) | 0 (0.0%) |
| Computers & Mathematics | 26 (100.0%) | 0 (0.0%) |
| Architecture & Engineering | 37 (100.0%) | 0 (0.0%) |
| Life, Physical & Social Science | 0 (0.0%) | 0 (0.0%) |
| Community & Social Service | 66 (24.1%) | 208 (75.9%) |
| Education, Arts & Media | 2 (50.0%) | 2 (50.0%) |
| Legal Services & Support | 3 (33.3%) | 6 (66.7%) |
| Education Instruction & Library | 57 (23.6%) | 184 (76.3%) |
| Arts, Media & Entertainment | 4 (20.0%) | 16 (80.0%) |
| Health Diagnosing & Treating | 23 (8.5%) | 247 (91.5%) |
| Health Technologists | 9 (7.3%) | 115 (92.7%) |
| Total (Category) | 379 (40.1%) | 567 (59.9%) |
| Total (Overall) | 1,244 (53.6%) | 1,076 (46.4%) |
Services Occupations
The most common Services occupations in Phillips County are Healthcare Support (129 | 5.6%), Food Preparation & Serving (98 | 4.2%), Cleaning & Maintenance (82 | 3.5%), Personal Care & Service (51 | 2.2%), and Security & Protection (22 | 0.9%).

Services Occupations by Sex
Within the Services occupations in Phillips County, the most male-oriented occupations are Firefighting & Prevention (100.0%), Security & Protection (77.3%), and Law Enforcement (73.7%), while the most female-oriented occupations are Healthcare Support (93.0%), Personal Care & Service (86.3%), and Food Preparation & Serving (39.8%).

| Occupation | Male | Female |
| Healthcare Support | 9 (7.0%) | 120 (93.0%) |
| Security & Protection | 17 (77.3%) | 5 (22.7%) |
| Firefighting & Prevention | 3 (100.0%) | 0 (0.0%) |
| Law Enforcement | 14 (73.7%) | 5 (26.3%) |
| Food Preparation & Serving | 59 (60.2%) | 39 (39.8%) |
| Cleaning & Maintenance | 57 (69.5%) | 25 (30.5%) |
| Personal Care & Service | 7 (13.7%) | 44 (86.3%) |
| Total (Category) | 149 (39.0%) | 233 (61.0%) |
| Total (Overall) | 1,244 (53.6%) | 1,076 (46.4%) |
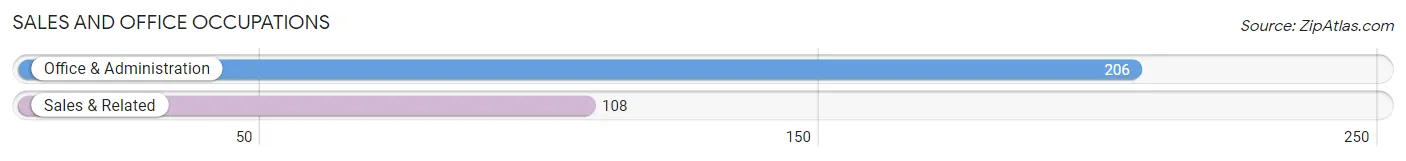
Sales and Office Occupations
The most common Sales and Office occupations in Phillips County are Office & Administration (206 | 8.9%), and Sales & Related (108 | 4.7%).
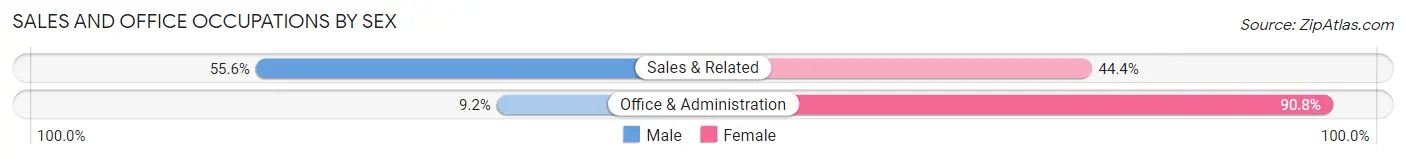
Sales and Office Occupations by Sex
| Occupation | Male | Female |
| Sales & Related | 60 (55.6%) | 48 (44.4%) |
| Office & Administration | 19 (9.2%) | 187 (90.8%) |
| Total (Category) | 79 (25.2%) | 235 (74.8%) |
| Total (Overall) | 1,244 (53.6%) | 1,076 (46.4%) |
Natural Resources, Construction and Maintenance Occupations
The most common Natural Resources, Construction and Maintenance occupations in Phillips County are Farming, Fishing & Forestry (157 | 6.8%), Construction & Extraction (100 | 4.3%), and Installation, Maintenance & Repair (77 | 3.3%).
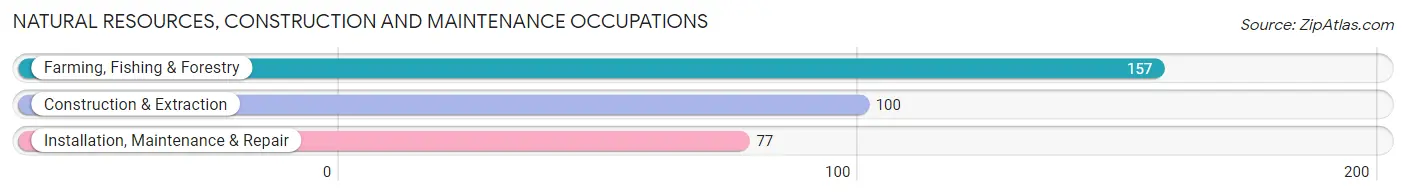
Natural Resources, Construction and Maintenance Occupations by Sex
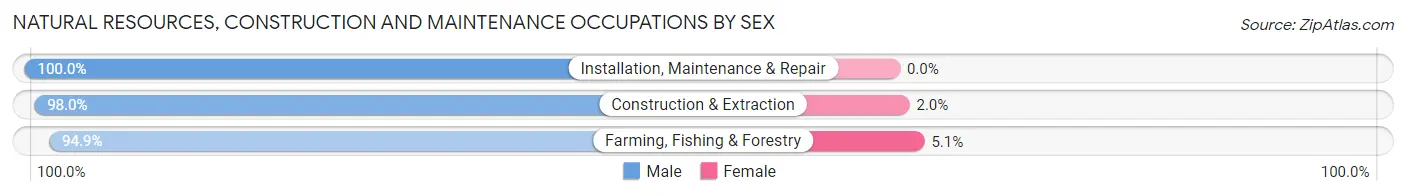
| Occupation | Male | Female |
| Farming, Fishing & Forestry | 149 (94.9%) | 8 (5.1%) |
| Construction & Extraction | 98 (98.0%) | 2 (2.0%) |
| Installation, Maintenance & Repair | 77 (100.0%) | 0 (0.0%) |
| Total (Category) | 324 (97.0%) | 10 (3.0%) |
| Total (Overall) | 1,244 (53.6%) | 1,076 (46.4%) |
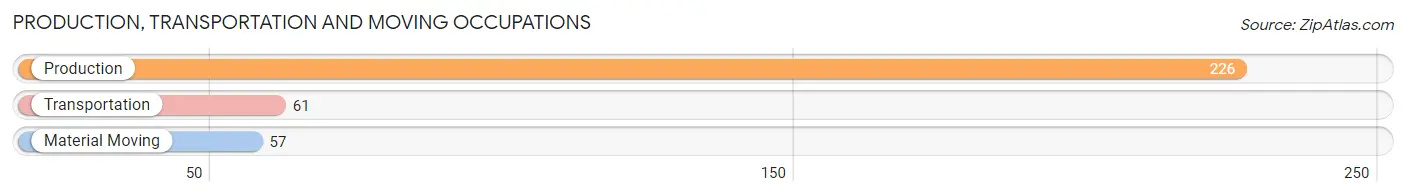
Production, Transportation and Moving Occupations
The most common Production, Transportation and Moving occupations in Phillips County are Production (226 | 9.7%), Transportation (61 | 2.6%), and Material Moving (57 | 2.5%).
Production, Transportation and Moving Occupations by Sex
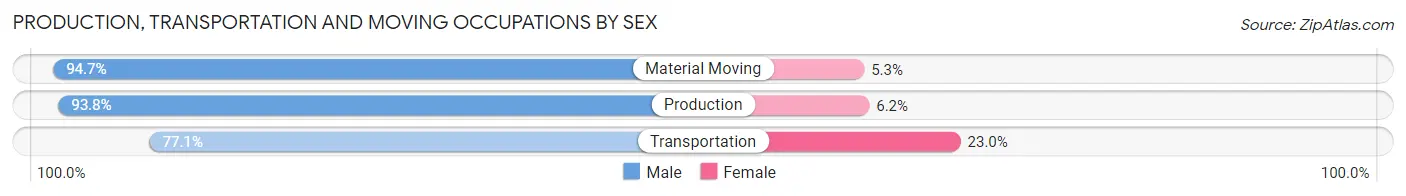
| Occupation | Male | Female |
| Production | 212 (93.8%) | 14 (6.2%) |
| Transportation | 47 (77.0%) | 14 (23.0%) |
| Material Moving | 54 (94.7%) | 3 (5.3%) |
| Total (Category) | 313 (91.0%) | 31 (9.0%) |
| Total (Overall) | 1,244 (53.6%) | 1,076 (46.4%) |
Employment Industries by Sex in Phillips County
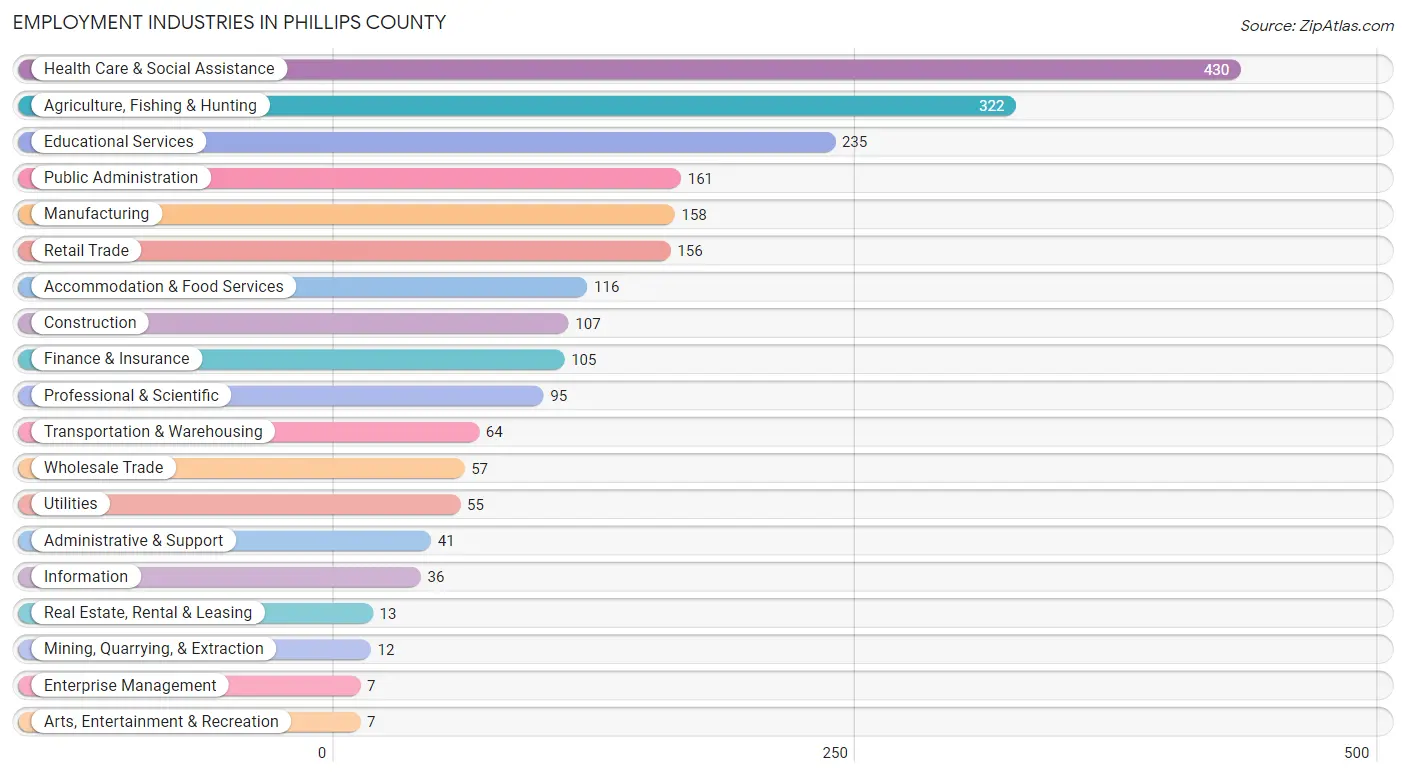
Employment Industries in Phillips County
The major employment industries in Phillips County include Health Care & Social Assistance (430 | 18.5%), Agriculture, Fishing & Hunting (322 | 13.9%), Educational Services (235 | 10.1%), Public Administration (161 | 6.9%), and Manufacturing (158 | 6.8%).
Employment Industries by Sex in Phillips County
The Phillips County industries that see more men than women are Mining, Quarrying, & Extraction (100.0%), Construction (100.0%), and Utilities (100.0%), whereas the industries that tend to have a higher number of women are Real Estate, Rental & Leasing (100.0%), Health Care & Social Assistance (92.6%), and Public Administration (78.3%).

| Industry | Male | Female |
| Agriculture, Fishing & Hunting | 290 (90.1%) | 32 (9.9%) |
| Mining, Quarrying, & Extraction | 12 (100.0%) | 0 (0.0%) |
| Construction | 107 (100.0%) | 0 (0.0%) |
| Manufacturing | 149 (94.3%) | 9 (5.7%) |
| Wholesale Trade | 54 (94.7%) | 3 (5.3%) |
| Retail Trade | 91 (58.3%) | 65 (41.7%) |
| Transportation & Warehousing | 44 (68.8%) | 20 (31.2%) |
| Utilities | 55 (100.0%) | 0 (0.0%) |
| Information | 14 (38.9%) | 22 (61.1%) |
| Finance & Insurance | 38 (36.2%) | 67 (63.8%) |
| Real Estate, Rental & Leasing | 0 (0.0%) | 13 (100.0%) |
| Professional & Scientific | 37 (39.0%) | 58 (61.1%) |
| Enterprise Management | 7 (100.0%) | 0 (0.0%) |
| Administrative & Support | 26 (63.4%) | 15 (36.6%) |
| Educational Services | 70 (29.8%) | 165 (70.2%) |
| Health Care & Social Assistance | 32 (7.4%) | 398 (92.6%) |
| Arts, Entertainment & Recreation | 6 (85.7%) | 1 (14.3%) |
| Accommodation & Food Services | 59 (50.9%) | 57 (49.1%) |
| Public Administration | 35 (21.7%) | 126 (78.3%) |
| Total | 1,244 (53.6%) | 1,076 (46.4%) |
Education in Phillips County
School Enrollment in Phillips County
The most common levels of schooling among the 1,013 students in Phillips County are elementary school (257 | 25.4%), high school (248 | 24.5%), and middle school (247 | 24.4%).

| School Level | # Students | % Students |
| Nursery / Preschool | 89 | 8.8% |
| Kindergarten | 41 | 4.1% |
| Elementary School | 257 | 25.4% |
| Middle School | 247 | 24.4% |
| High School | 248 | 24.5% |
| College / Undergraduate | 109 | 10.8% |
| Graduate / Professional | 22 | 2.2% |
| Total | 1,013 | 100.0% |
School Enrollment by Age by Funding Source in Phillips County
Out of a total of 1,013 students who are enrolled in schools in Phillips County, 37 (3.7%) attend a private institution, while the remaining 976 (96.3%) are enrolled in public schools. The age group of 35 years and over has the highest likelihood of being enrolled in private schools, with 5 (16.1% in the age bracket) enrolled. Conversely, the age group of 15 to 17 year olds has the lowest likelihood of being enrolled in a private school, with 176 (100.0% in the age bracket) attending a public institution.
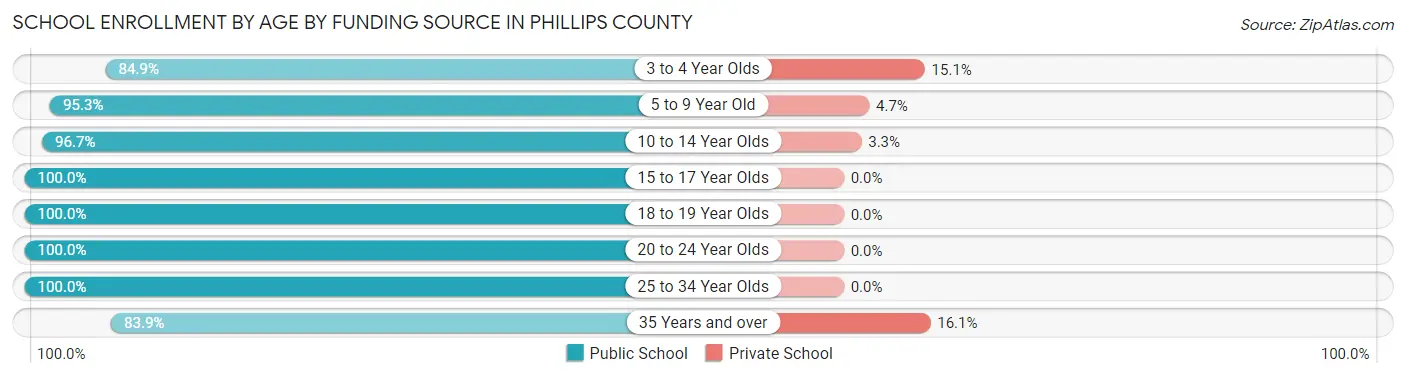
| Age Bracket | Public School | Private School |
| 3 to 4 Year Olds | 45 (84.9%) | 8 (15.1%) |
| 5 to 9 Year Old | 282 (95.3%) | 14 (4.7%) |
| 10 to 14 Year Olds | 295 (96.7%) | 10 (3.3%) |
| 15 to 17 Year Olds | 176 (100.0%) | 0 (0.0%) |
| 18 to 19 Year Olds | 76 (100.0%) | 0 (0.0%) |
| 20 to 24 Year Olds | 64 (100.0%) | 0 (0.0%) |
| 25 to 34 Year Olds | 12 (100.0%) | 0 (0.0%) |
| 35 Years and over | 26 (83.9%) | 5 (16.1%) |
| Total | 976 (96.3%) | 37 (3.7%) |
Educational Attainment by Field of Study in Phillips County
Education (217 | 28.9%), business (164 | 21.9%), bio, nature & agricultural (112 | 14.9%), science & technology (92 | 12.3%), and communications (31 | 4.1%) are the most common fields of study among 750 individuals in Phillips County who have obtained a bachelor's degree or higher.
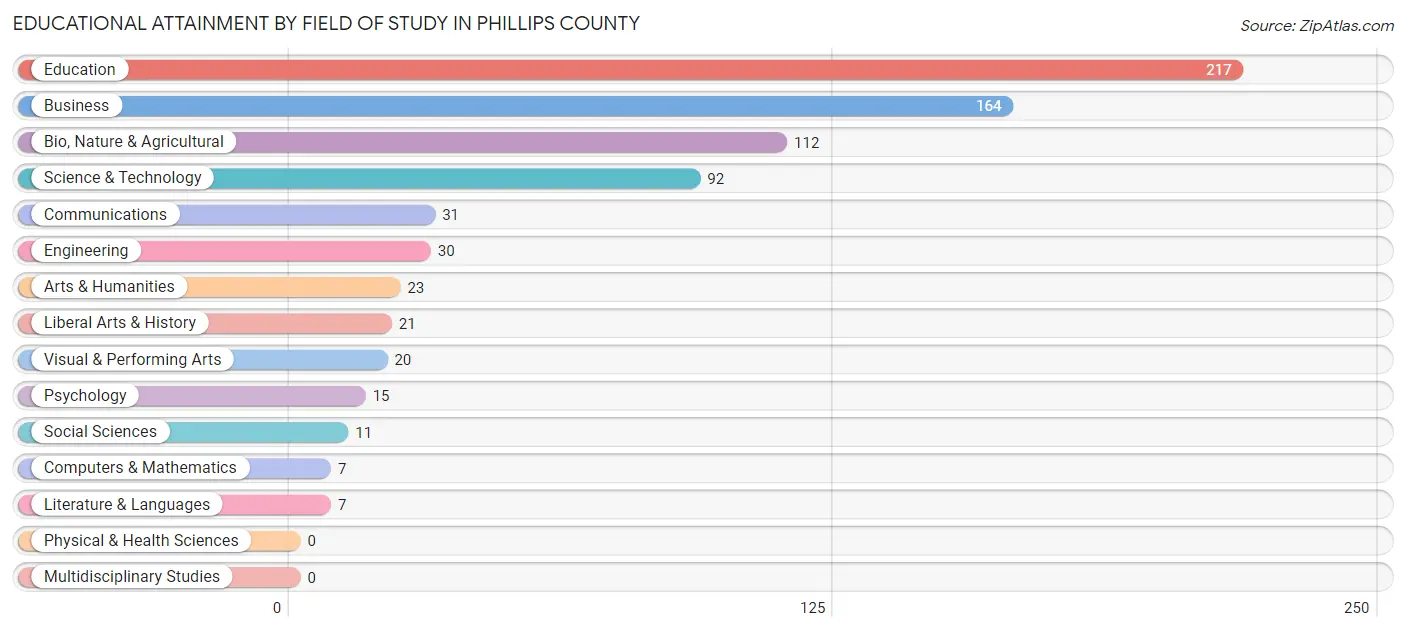
| Field of Study | # Graduates | % Graduates |
| Computers & Mathematics | 7 | 0.9% |
| Bio, Nature & Agricultural | 112 | 14.9% |
| Physical & Health Sciences | 0 | 0.0% |
| Psychology | 15 | 2.0% |
| Social Sciences | 11 | 1.5% |
| Engineering | 30 | 4.0% |
| Multidisciplinary Studies | 0 | 0.0% |
| Science & Technology | 92 | 12.3% |
| Business | 164 | 21.9% |
| Education | 217 | 28.9% |
| Literature & Languages | 7 | 0.9% |
| Liberal Arts & History | 21 | 2.8% |
| Visual & Performing Arts | 20 | 2.7% |
| Communications | 31 | 4.1% |
| Arts & Humanities | 23 | 3.1% |
| Total | 750 | 100.0% |
Transportation & Commute in Phillips County
Vehicle Availability by Sex in Phillips County
The most prevalent vehicle ownership categories in Phillips County are males with 2 vehicles (503, accounting for 40.8%) and females with 2 vehicles (274, making up 49.0%).
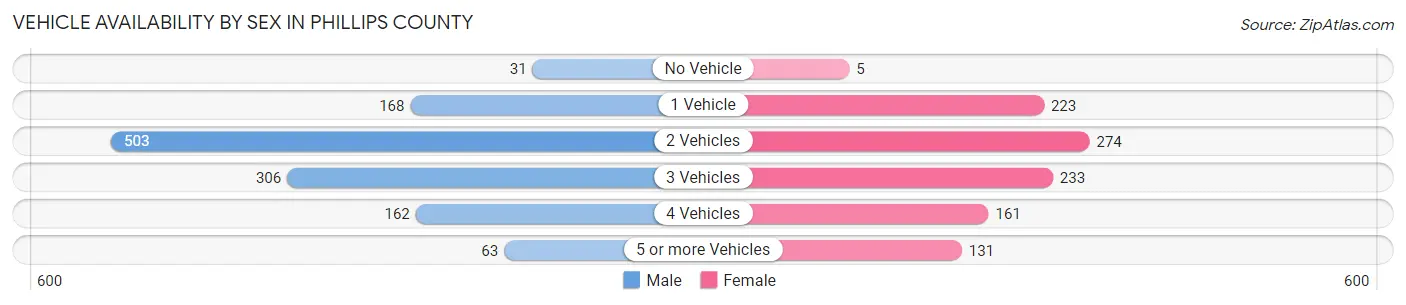
| Vehicles Available | Male | Female |
| No Vehicle | 31 (2.5%) | 5 (0.5%) |
| 1 Vehicle | 168 (13.6%) | 223 (21.7%) |
| 2 Vehicles | 503 (40.8%) | 274 (26.7%) |
| 3 Vehicles | 306 (24.8%) | 233 (22.7%) |
| 4 Vehicles | 162 (13.1%) | 161 (15.7%) |
| 5 or more Vehicles | 63 (5.1%) | 131 (12.8%) |
| Total | 1,233 (100.0%) | 1,027 (100.0%) |
Commute Time in Phillips County
The most frequently occuring commute durations in Phillips County are 5 to 9 minutes (489 commuters, 22.9%), less than 5 minutes (456 commuters, 21.3%), and 10 to 14 minutes (344 commuters, 16.1%).

| Commute Time | # Commuters | % Commuters |
| Less than 5 Minutes | 456 | 21.3% |
| 5 to 9 Minutes | 489 | 22.9% |
| 10 to 14 Minutes | 344 | 16.1% |
| 15 to 19 Minutes | 135 | 6.3% |
| 20 to 24 Minutes | 200 | 9.4% |
| 25 to 29 Minutes | 28 | 1.3% |
| 30 to 34 Minutes | 252 | 11.8% |
| 35 to 39 Minutes | 56 | 2.6% |
| 40 to 44 Minutes | 50 | 2.3% |
| 45 to 59 Minutes | 5 | 0.2% |
| 60 to 89 Minutes | 51 | 2.4% |
| 90 or more Minutes | 71 | 3.3% |
Commute Time by Sex in Phillips County
The most common commute times in Phillips County are less than 5 minutes (261 commuters, 22.5%) for males and 5 to 9 minutes (243 commuters, 24.9%) for females.
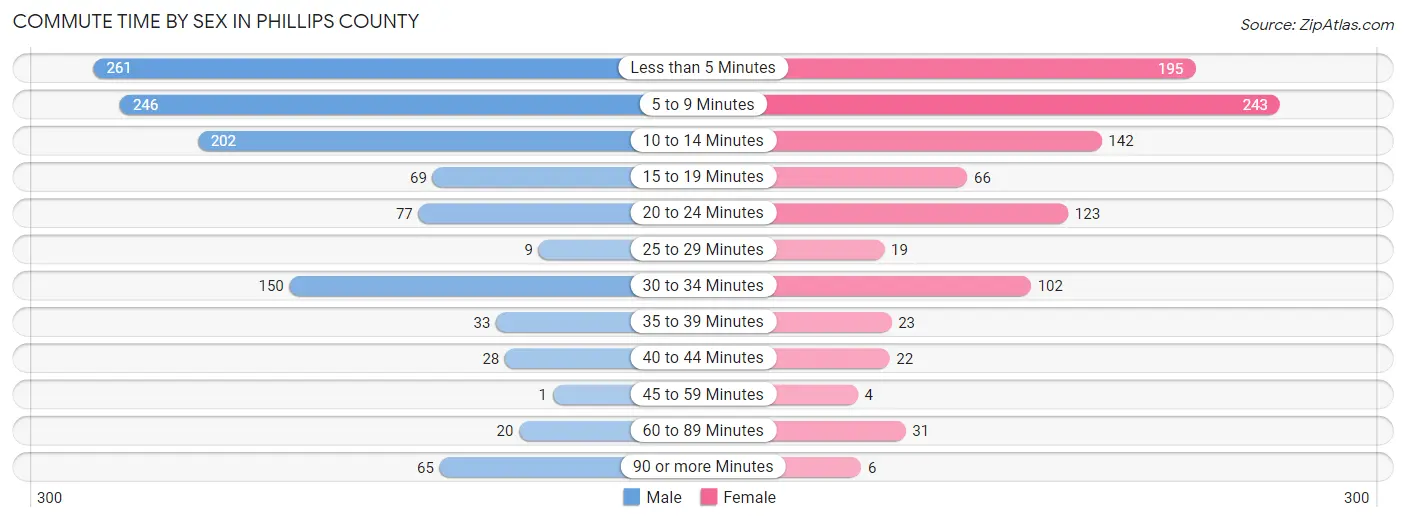
| Commute Time | Male | Female |
| Less than 5 Minutes | 261 (22.5%) | 195 (20.0%) |
| 5 to 9 Minutes | 246 (21.2%) | 243 (24.9%) |
| 10 to 14 Minutes | 202 (17.4%) | 142 (14.5%) |
| 15 to 19 Minutes | 69 (5.9%) | 66 (6.8%) |
| 20 to 24 Minutes | 77 (6.6%) | 123 (12.6%) |
| 25 to 29 Minutes | 9 (0.8%) | 19 (1.9%) |
| 30 to 34 Minutes | 150 (12.9%) | 102 (10.4%) |
| 35 to 39 Minutes | 33 (2.8%) | 23 (2.4%) |
| 40 to 44 Minutes | 28 (2.4%) | 22 (2.2%) |
| 45 to 59 Minutes | 1 (0.1%) | 4 (0.4%) |
| 60 to 89 Minutes | 20 (1.7%) | 31 (3.2%) |
| 90 or more Minutes | 65 (5.6%) | 6 (0.6%) |
Time of Departure to Work by Sex in Phillips County
The most frequent times of departure to work in Phillips County are 7:00 AM to 7:29 AM (226, 19.5%) for males and 7:30 AM to 7:59 AM (350, 35.9%) for females.
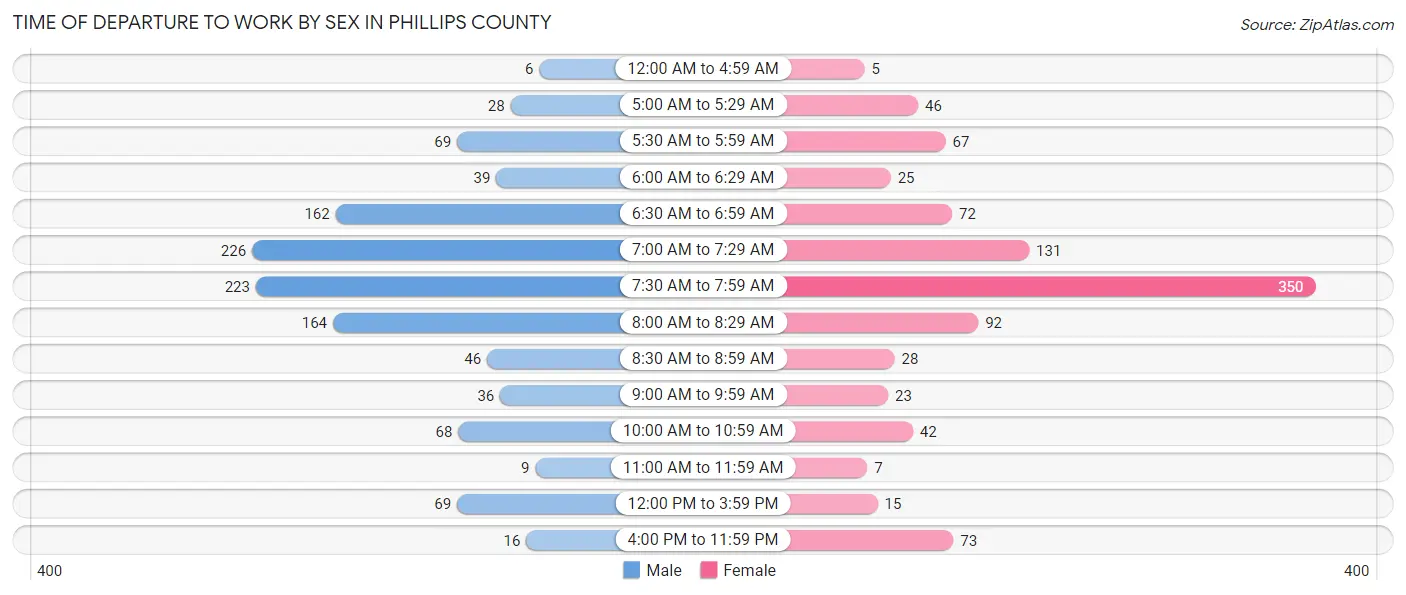
| Time of Departure | Male | Female |
| 12:00 AM to 4:59 AM | 6 (0.5%) | 5 (0.5%) |
| 5:00 AM to 5:29 AM | 28 (2.4%) | 46 (4.7%) |
| 5:30 AM to 5:59 AM | 69 (5.9%) | 67 (6.9%) |
| 6:00 AM to 6:29 AM | 39 (3.4%) | 25 (2.6%) |
| 6:30 AM to 6:59 AM | 162 (14.0%) | 72 (7.4%) |
| 7:00 AM to 7:29 AM | 226 (19.5%) | 131 (13.4%) |
| 7:30 AM to 7:59 AM | 223 (19.2%) | 350 (35.9%) |
| 8:00 AM to 8:29 AM | 164 (14.1%) | 92 (9.4%) |
| 8:30 AM to 8:59 AM | 46 (4.0%) | 28 (2.9%) |
| 9:00 AM to 9:59 AM | 36 (3.1%) | 23 (2.4%) |
| 10:00 AM to 10:59 AM | 68 (5.9%) | 42 (4.3%) |
| 11:00 AM to 11:59 AM | 9 (0.8%) | 7 (0.7%) |
| 12:00 PM to 3:59 PM | 69 (5.9%) | 15 (1.5%) |
| 4:00 PM to 11:59 PM | 16 (1.4%) | 73 (7.5%) |
| Total | 1,161 (100.0%) | 976 (100.0%) |
Housing Occupancy in Phillips County
Occupancy by Ownership in Phillips County
Of the total 2,191 dwellings in Phillips County, owner-occupied units account for 1,591 (72.6%), while renter-occupied units make up 600 (27.4%).
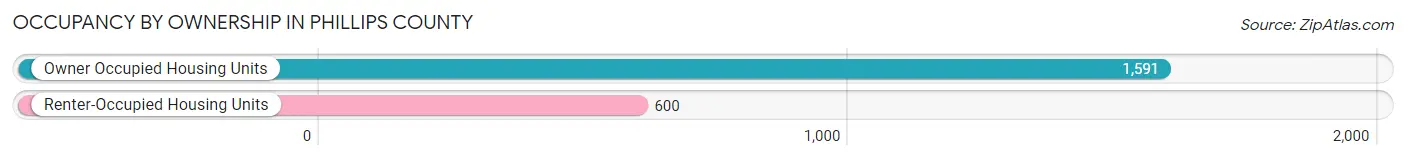
| Occupancy | # Housing Units | % Housing Units |
| Owner Occupied Housing Units | 1,591 | 72.6% |
| Renter-Occupied Housing Units | 600 | 27.4% |
| Total Occupied Housing Units | 2,191 | 100.0% |
Occupancy by Household Size in Phillips County

| Household Size | # Housing Units | % Housing Units |
| 1-Person Household | 854 | 39.0% |
| 2-Person Household | 807 | 36.8% |
| 3-Person Household | 206 | 9.4% |
| 4+ Person Household | 324 | 14.8% |
| Total Housing Units | 2,191 | 100.0% |
Occupancy by Ownership by Household Size in Phillips County
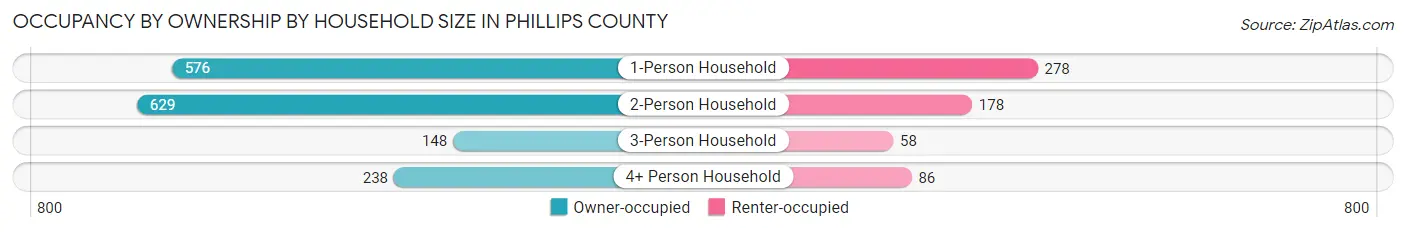
| Household Size | Owner-occupied | Renter-occupied |
| 1-Person Household | 576 (67.4%) | 278 (32.6%) |
| 2-Person Household | 629 (77.9%) | 178 (22.1%) |
| 3-Person Household | 148 (71.8%) | 58 (28.2%) |
| 4+ Person Household | 238 (73.5%) | 86 (26.5%) |
| Total Housing Units | 1,591 (72.6%) | 600 (27.4%) |
Occupancy by Educational Attainment in Phillips County

| Household Size | Owner-occupied | Renter-occupied |
| Less than High School | 52 (36.1%) | 92 (63.9%) |
| High School Diploma | 603 (76.9%) | 181 (23.1%) |
| College/Associate Degree | 608 (70.9%) | 250 (29.1%) |
| Bachelor's Degree or higher | 328 (81.0%) | 77 (19.0%) |
Occupancy by Age of Householder in Phillips County
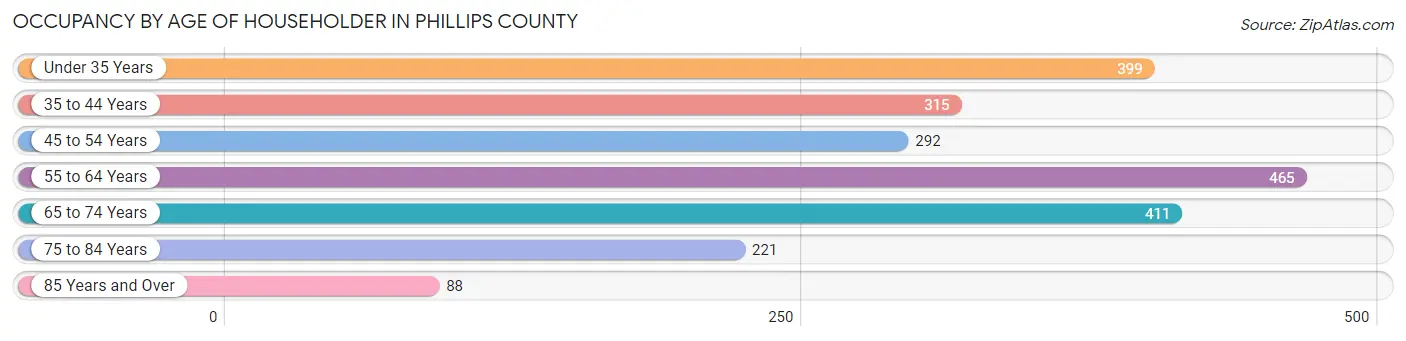
| Age Bracket | # Households | % Households |
| Under 35 Years | 399 | 18.2% |
| 35 to 44 Years | 315 | 14.4% |
| 45 to 54 Years | 292 | 13.3% |
| 55 to 64 Years | 465 | 21.2% |
| 65 to 74 Years | 411 | 18.8% |
| 75 to 84 Years | 221 | 10.1% |
| 85 Years and Over | 88 | 4.0% |
| Total | 2,191 | 100.0% |
Housing Finances in Phillips County
Median Income by Occupancy in Phillips County

| Occupancy Type | # Households | Median Income |
| Owner-Occupied | 1,591 (72.6%) | $68,389 |
| Renter-Occupied | 600 (27.4%) | $36,774 |
| Average | 2,191 (100.0%) | $57,611 |
Occupancy by Householder Income Bracket in Phillips County

| Income Bracket | Owner-occupied | Renter-occupied |
| Less than $5,000 | 24 (1.5%) | 34 (5.7%) |
| $5,000 to $9,999 | 13 (0.8%) | 9 (1.5%) |
| $10,000 to $14,999 | 46 (2.9%) | 61 (10.2%) |
| $15,000 to $19,999 | 51 (3.2%) | 23 (3.8%) |
| $20,000 to $24,999 | 89 (5.6%) | 39 (6.5%) |
| $25,000 to $34,999 | 114 (7.2%) | 112 (18.7%) |
| $35,000 to $49,999 | 183 (11.5%) | 117 (19.5%) |
| $50,000 to $74,999 | 380 (23.9%) | 147 (24.5%) |
| $75,000 to $99,999 | 295 (18.5%) | 31 (5.2%) |
| $100,000 to $149,999 | 213 (13.4%) | 13 (2.2%) |
| $150,000 or more | 183 (11.5%) | 14 (2.3%) |
| Total | 1,591 (100.0%) | 600 (100.0%) |
Monthly Housing Cost Tiers in Phillips County

| Monthly Cost | Owner-occupied | Renter-occupied |
| Less than $300 | 210 (13.2%) | 21 (3.5%) |
| $300 to $499 | 291 (18.3%) | 98 (16.3%) |
| $500 to $799 | 445 (28.0%) | 256 (42.7%) |
| $800 to $999 | 244 (15.3%) | 78 (13.0%) |
| $1,000 to $1,499 | 256 (16.1%) | 30 (5.0%) |
| $1,500 to $1,999 | 98 (6.2%) | 13 (2.2%) |
| $2,000 to $2,499 | 38 (2.4%) | 0 (0.0%) |
| $2,500 to $2,999 | 9 (0.6%) | 0 (0.0%) |
| $3,000 or more | 0 (0.0%) | 0 (0.0%) |
| Total | 1,591 (100.0%) | 600 (100.0%) |
Physical Housing Characteristics in Phillips County
Housing Structures in Phillips County

| Structure Type | # Housing Units | % Housing Units |
| Single Unit, Detached | 1,878 | 85.7% |
| Single Unit, Attached | 14 | 0.6% |
| 2 Unit Apartments | 19 | 0.9% |
| 3 or 4 Unit Apartments | 60 | 2.7% |
| 5 to 9 Unit Apartments | 57 | 2.6% |
| 10 or more Apartments | 58 | 2.6% |
| Mobile Home / Other | 105 | 4.8% |
| Total | 2,191 | 100.0% |
Housing Structures by Occupancy in Phillips County

| Structure Type | Owner-occupied | Renter-occupied |
| Single Unit, Detached | 1,495 (79.6%) | 383 (20.4%) |
| Single Unit, Attached | 8 (57.1%) | 6 (42.9%) |
| 2 Unit Apartments | 0 (0.0%) | 19 (100.0%) |
| 3 or 4 Unit Apartments | 4 (6.7%) | 56 (93.3%) |
| 5 to 9 Unit Apartments | 1 (1.8%) | 56 (98.3%) |
| 10 or more Apartments | 0 (0.0%) | 58 (100.0%) |
| Mobile Home / Other | 83 (79.0%) | 22 (20.9%) |
| Total | 1,591 (72.6%) | 600 (27.4%) |
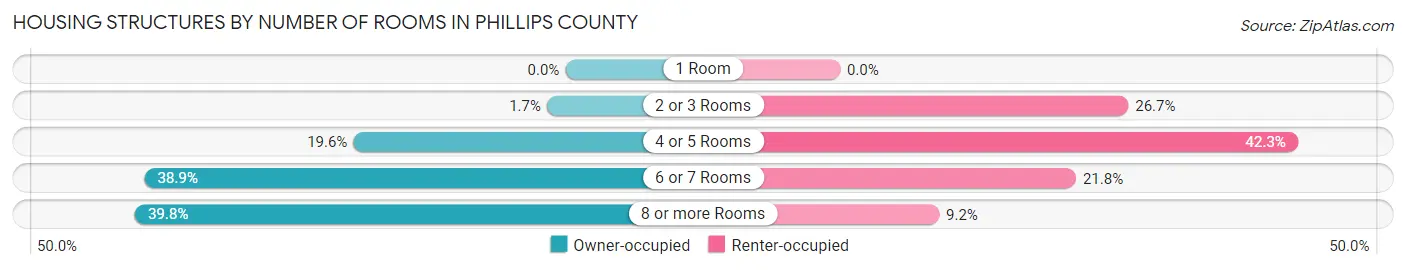
Housing Structures by Number of Rooms in Phillips County
| Number of Rooms | Owner-occupied | Renter-occupied |
| 1 Room | 0 (0.0%) | 0 (0.0%) |
| 2 or 3 Rooms | 27 (1.7%) | 160 (26.7%) |
| 4 or 5 Rooms | 312 (19.6%) | 254 (42.3%) |
| 6 or 7 Rooms | 619 (38.9%) | 131 (21.8%) |
| 8 or more Rooms | 633 (39.8%) | 55 (9.2%) |
| Total | 1,591 (100.0%) | 600 (100.0%) |
Housing Structure by Heating Type in Phillips County
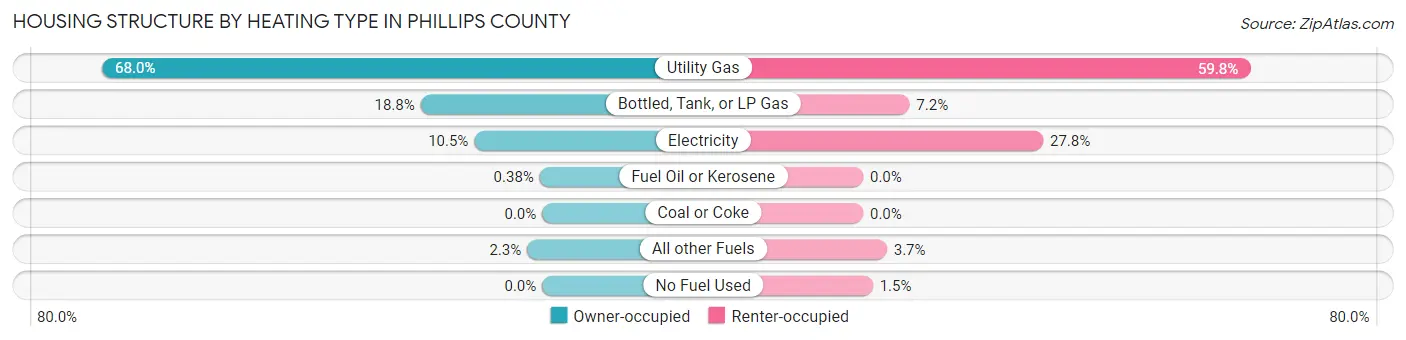
| Heating Type | Owner-occupied | Renter-occupied |
| Utility Gas | 1,082 (68.0%) | 359 (59.8%) |
| Bottled, Tank, or LP Gas | 299 (18.8%) | 43 (7.2%) |
| Electricity | 167 (10.5%) | 167 (27.8%) |
| Fuel Oil or Kerosene | 6 (0.4%) | 0 (0.0%) |
| Coal or Coke | 0 (0.0%) | 0 (0.0%) |
| All other Fuels | 37 (2.3%) | 22 (3.7%) |
| No Fuel Used | 0 (0.0%) | 9 (1.5%) |
| Total | 1,591 (100.0%) | 600 (100.0%) |
Household Vehicle Usage in Phillips County
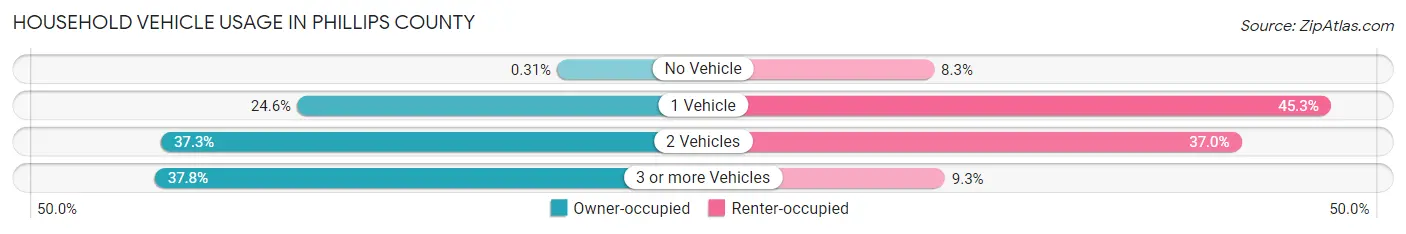
| Vehicles per Household | Owner-occupied | Renter-occupied |
| No Vehicle | 5 (0.3%) | 50 (8.3%) |
| 1 Vehicle | 391 (24.6%) | 272 (45.3%) |
| 2 Vehicles | 593 (37.3%) | 222 (37.0%) |
| 3 or more Vehicles | 602 (37.8%) | 56 (9.3%) |
| Total | 1,591 (100.0%) | 600 (100.0%) |
Real Estate & Mortgages in Phillips County
Real Estate and Mortgage Overview in Phillips County
| Characteristic | Without Mortgage | With Mortgage |
| Housing Units | 894 | 697 |
| Median Property Value | $87,600 | $100,100 |
| Median Household Income | $64,674 | $77 |
| Monthly Housing Costs | $499 | $0 |
| Real Estate Taxes | $1,370 | $23 |
Property Value by Mortgage Status in Phillips County
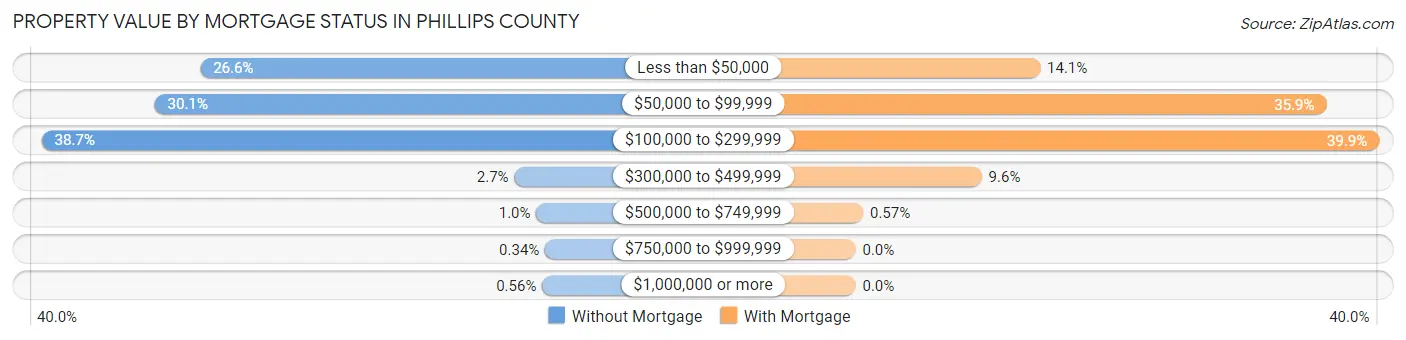
| Property Value | Without Mortgage | With Mortgage |
| Less than $50,000 | 238 (26.6%) | 98 (14.1%) |
| $50,000 to $99,999 | 269 (30.1%) | 250 (35.9%) |
| $100,000 to $299,999 | 346 (38.7%) | 278 (39.9%) |
| $300,000 to $499,999 | 24 (2.7%) | 67 (9.6%) |
| $500,000 to $749,999 | 9 (1.0%) | 4 (0.6%) |
| $750,000 to $999,999 | 3 (0.3%) | 0 (0.0%) |
| $1,000,000 or more | 5 (0.6%) | 0 (0.0%) |
| Total | 894 (100.0%) | 697 (100.0%) |
Household Income by Mortgage Status in Phillips County

| Household Income | Without Mortgage | With Mortgage |
| Less than $10,000 | 34 (3.8%) | 6 (0.9%) |
| $10,000 to $24,999 | 62 (6.9%) | 3 (0.4%) |
| $25,000 to $34,999 | 91 (10.2%) | 124 (17.8%) |
| $35,000 to $49,999 | 99 (11.1%) | 23 (3.3%) |
| $50,000 to $74,999 | 272 (30.4%) | 84 (12.0%) |
| $75,000 to $99,999 | 129 (14.4%) | 108 (15.5%) |
| $100,000 to $149,999 | 101 (11.3%) | 166 (23.8%) |
| $150,000 or more | 106 (11.9%) | 112 (16.1%) |
| Total | 894 (100.0%) | 697 (100.0%) |
Property Value to Household Income Ratio in Phillips County

| Value-to-Income Ratio | Without Mortgage | With Mortgage |
| Less than 2.0x | 599 (67.0%) | 75,560 (10,840.7%) |
| 2.0x to 2.9x | 103 (11.5%) | 400 (57.4%) |
| 3.0x to 3.9x | 75 (8.4%) | 163 (23.4%) |
| 4.0x or more | 117 (13.1%) | 32 (4.6%) |
| Total | 894 (100.0%) | 697 (100.0%) |
Real Estate Taxes by Mortgage Status in Phillips County

| Property Taxes | Without Mortgage | With Mortgage |
| Less than $800 | 300 (33.6%) | 0 (0.0%) |
| $800 to $1,499 | 174 (19.5%) | 100 (14.3%) |
| $800 to $1,499 | 411 (46.0%) | 163 (23.4%) |
| Total | 894 (100.0%) | 697 (100.0%) |
Health & Disability in Phillips County
Health Insurance Coverage by Age in Phillips County

| Age Bracket | With Coverage | Without Coverage |
| Under 6 Years | 350 (97.0%) | 11 (3.0%) |
| 6 to 18 Years | 812 (97.8%) | 18 (2.2%) |
| 19 to 25 Years | 243 (72.1%) | 94 (27.9%) |
| 26 to 34 Years | 365 (83.7%) | 71 (16.3%) |
| 35 to 44 Years | 474 (94.4%) | 28 (5.6%) |
| 45 to 54 Years | 469 (93.6%) | 32 (6.4%) |
| 55 to 64 Years | 634 (83.5%) | 125 (16.5%) |
| 65 to 74 Years | 671 (100.0%) | 0 (0.0%) |
| 75 Years and older | 480 (100.0%) | 0 (0.0%) |
| Total | 4,498 (92.2%) | 379 (7.8%) |
Health Insurance Coverage by Citizenship Status in Phillips County

| Citizenship Status | With Coverage | Without Coverage |
| Native Born | 350 (97.0%) | 11 (3.0%) |
| Foreign Born, Citizen | 812 (97.8%) | 18 (2.2%) |
| Foreign Born, not a Citizen | 243 (72.1%) | 94 (27.9%) |
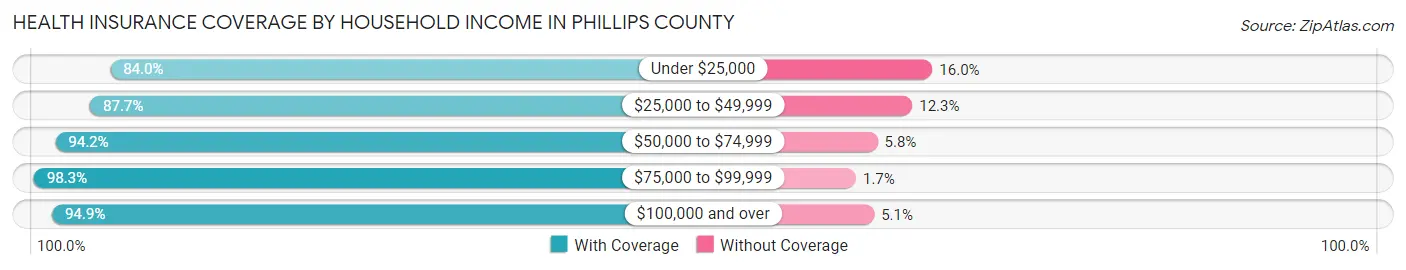
Health Insurance Coverage by Household Income in Phillips County
| Household Income | With Coverage | Without Coverage |
| Under $25,000 | 560 (84.0%) | 107 (16.0%) |
| $25,000 to $49,999 | 886 (87.7%) | 124 (12.3%) |
| $50,000 to $74,999 | 1,061 (94.2%) | 65 (5.8%) |
| $75,000 to $99,999 | 680 (98.3%) | 12 (1.7%) |
| $100,000 and over | 1,311 (94.9%) | 71 (5.1%) |
Public vs Private Health Insurance Coverage by Age in Phillips County

| Age Bracket | Public Insurance | Private Insurance |
| Under 6 | 158 (43.8%) | 218 (60.4%) |
| 6 to 18 Years | 318 (38.3%) | 499 (60.1%) |
| 19 to 25 Years | 30 (8.9%) | 235 (69.7%) |
| 25 to 34 Years | 36 (8.3%) | 345 (79.1%) |
| 35 to 44 Years | 39 (7.8%) | 447 (89.0%) |
| 45 to 54 Years | 53 (10.6%) | 423 (84.4%) |
| 55 to 64 Years | 114 (15.0%) | 577 (76.0%) |
| 65 to 74 Years | 654 (97.5%) | 335 (49.9%) |
| 75 Years and over | 480 (100.0%) | 291 (60.6%) |
| Total | 1,882 (38.6%) | 3,370 (69.1%) |
Disability Status by Sex by Age in Phillips County
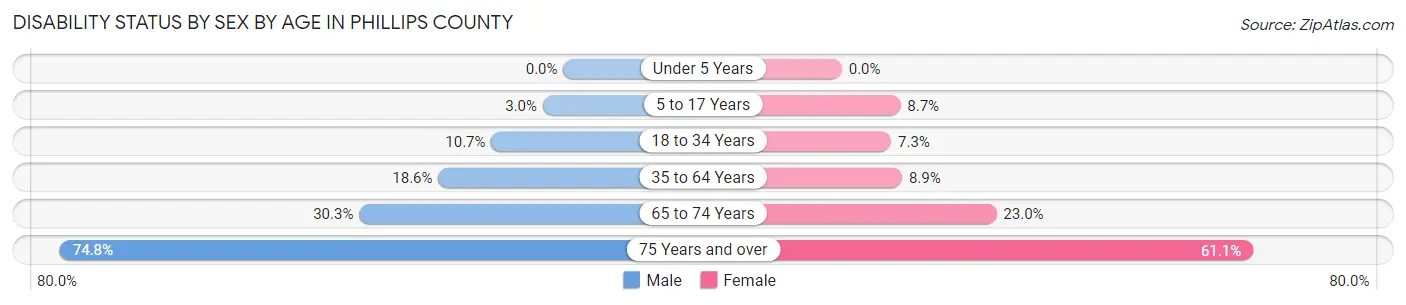
| Age Bracket | Male | Female |
| Under 5 Years | 0 (0.0%) | 0 (0.0%) |
| 5 to 17 Years | 14 (3.0%) | 30 (8.7%) |
| 18 to 34 Years | 45 (10.7%) | 32 (7.3%) |
| 35 to 64 Years | 165 (18.6%) | 78 (8.9%) |
| 65 to 74 Years | 107 (30.3%) | 73 (23.0%) |
| 75 Years and over | 163 (74.8%) | 160 (61.1%) |
Disability Class by Sex by Age in Phillips County
Disability Class: Hearing Difficulty
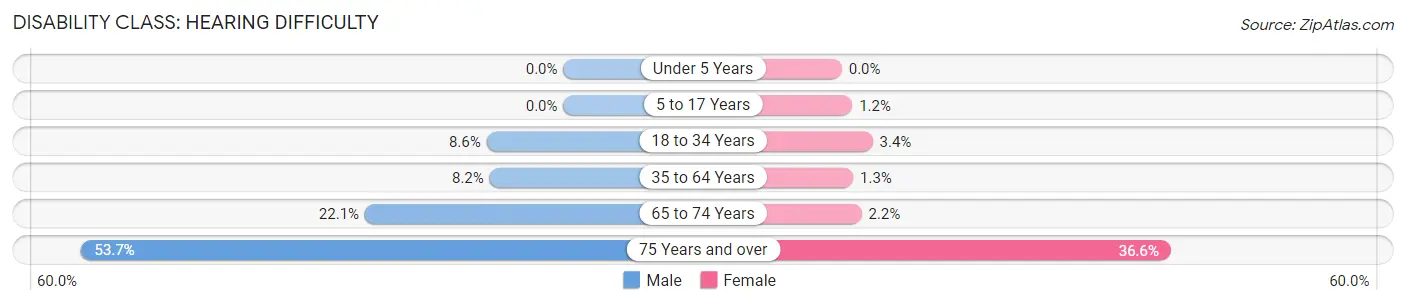
| Age Bracket | Male | Female |
| Under 5 Years | 0 (0.0%) | 0 (0.0%) |
| 5 to 17 Years | 0 (0.0%) | 4 (1.2%) |
| 18 to 34 Years | 36 (8.6%) | 15 (3.4%) |
| 35 to 64 Years | 73 (8.2%) | 11 (1.3%) |
| 65 to 74 Years | 78 (22.1%) | 7 (2.2%) |
| 75 Years and over | 117 (53.7%) | 96 (36.6%) |
Disability Class: Vision Difficulty
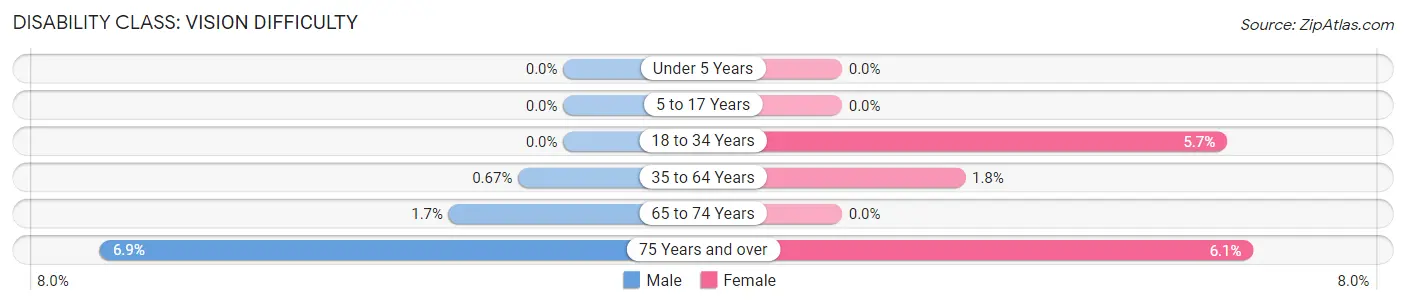
| Age Bracket | Male | Female |
| Under 5 Years | 0 (0.0%) | 0 (0.0%) |
| 5 to 17 Years | 0 (0.0%) | 0 (0.0%) |
| 18 to 34 Years | 0 (0.0%) | 25 (5.7%) |
| 35 to 64 Years | 6 (0.7%) | 16 (1.8%) |
| 65 to 74 Years | 6 (1.7%) | 0 (0.0%) |
| 75 Years and over | 15 (6.9%) | 16 (6.1%) |
Disability Class: Cognitive Difficulty

| Age Bracket | Male | Female |
| 5 to 17 Years | 2 (0.4%) | 26 (7.5%) |
| 18 to 34 Years | 3 (0.7%) | 19 (4.3%) |
| 35 to 64 Years | 61 (6.9%) | 32 (3.7%) |
| 65 to 74 Years | 2 (0.6%) | 7 (2.2%) |
| 75 Years and over | 26 (11.9%) | 23 (8.8%) |
Disability Class: Ambulatory Difficulty
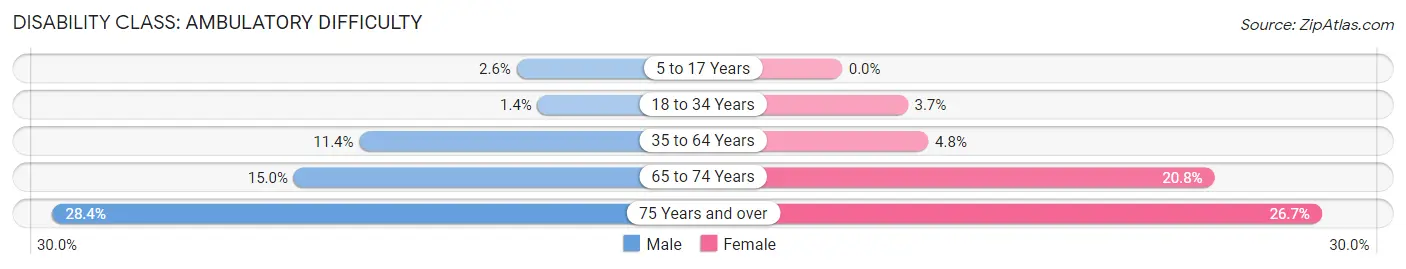
| Age Bracket | Male | Female |
| 5 to 17 Years | 12 (2.6%) | 0 (0.0%) |
| 18 to 34 Years | 6 (1.4%) | 16 (3.7%) |
| 35 to 64 Years | 101 (11.4%) | 42 (4.8%) |
| 65 to 74 Years | 53 (15.0%) | 66 (20.7%) |
| 75 Years and over | 62 (28.4%) | 70 (26.7%) |
Disability Class: Self-Care Difficulty
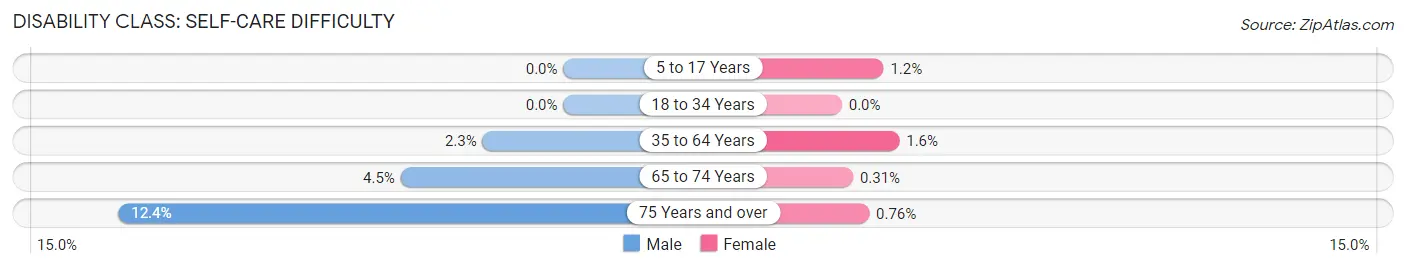
| Age Bracket | Male | Female |
| 5 to 17 Years | 0 (0.0%) | 4 (1.2%) |
| 18 to 34 Years | 0 (0.0%) | 0 (0.0%) |
| 35 to 64 Years | 20 (2.2%) | 14 (1.6%) |
| 65 to 74 Years | 16 (4.5%) | 1 (0.3%) |
| 75 Years and over | 27 (12.4%) | 2 (0.8%) |
Technology Access in Phillips County
Computing Device Access in Phillips County
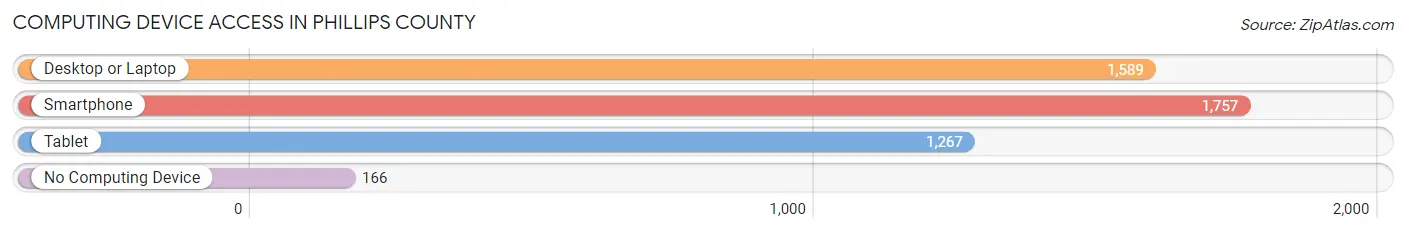
| Device Type | # Households | % Households |
| Desktop or Laptop | 1,589 | 72.5% |
| Smartphone | 1,757 | 80.2% |
| Tablet | 1,267 | 57.8% |
| No Computing Device | 166 | 7.6% |
| Total | 2,191 | 100.0% |
Internet Access in Phillips County
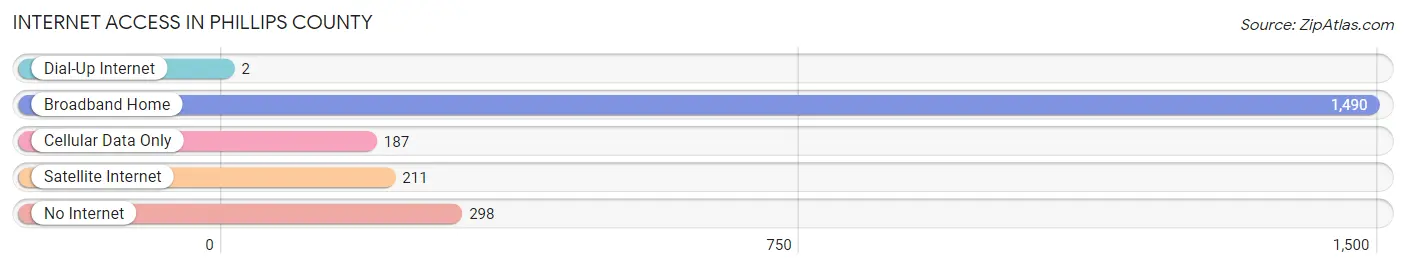
| Internet Type | # Households | % Households |
| Dial-Up Internet | 2 | 0.1% |
| Broadband Home | 1,490 | 68.0% |
| Cellular Data Only | 187 | 8.5% |
| Satellite Internet | 211 | 9.6% |
| No Internet | 298 | 13.6% |
| Total | 2,191 | 100.0% |
Phillips County Summary
Phillips County, Kansas is located in the northwest corner of the state and is bordered by Nebraska to the north and Colorado to the west. The county seat is Phillipsburg, and the county has a population of 5,543 as of the 2010 census. The county was named after William A. Phillips, a prominent Kansas politician and newspaper editor.
Phillips County is part of the High Plains region of Kansas, and is characterized by rolling hills and flat plains. The county is home to several rivers, including the Republican River, the Smoky Hill River, and the Solomon River. The county is also home to several lakes, including Cedar Bluff Reservoir, Kirwin Reservoir, and Webster Reservoir.
The economy of Phillips County is largely based on agriculture. The county is home to a variety of crops, including corn, wheat, sorghum, soybeans, and alfalfa. Livestock production is also important to the county’s economy, with cattle, hogs, and sheep being raised in the area. The county is also home to several oil and gas fields, which provide jobs and revenue to the county.
Phillips County is home to several small towns, including Phillipsburg, Glade, and Kirwin. The county seat, Phillipsburg, is home to the Phillips County Museum, which houses artifacts and exhibits related to the county’s history. The county is also home to several parks, including Cedar Bluff State Park, Kirwin National Wildlife Refuge, and Webster State Park.
The demographics of Phillips County are largely rural and white. The population is predominantly white, with a small percentage of African Americans, Hispanics, and Native Americans. The median household income in the county is $41,845, and the median home value is $87,400. The unemployment rate in the county is 4.2%, which is slightly lower than the national average.
Phillips County is a rural county with a rich history and a strong agricultural economy. The county is home to several small towns, parks, and museums, and is a great place to live and work. The county’s demographics are largely rural and white, and the median household income and home value are both slightly lower than the national average. Phillips County is a great place to call home, and offers a variety of opportunities for those looking to live and work in the area.
Common Questions
What is the Total Population of Phillips County?
Total Population of Phillips County is 4,960.
What is the Total Male Population of Phillips County?
Total Male Population of Phillips County is 2,526.
What is the Total Female Population of Phillips County?
Total Female Population of Phillips County is 2,434.
What is the Ratio of Males per 100 Females in Phillips County?
There are 103.78 Males per 100 Females in Phillips County.
What is the Ratio of Females per 100 Males in Phillips County?
There are 96.36 Females per 100 Males in Phillips County.
What is the Median Population Age in Phillips County?
Median Population Age in Phillips County is 44.9 Years.
What is the Average Family Size in Phillips County
Average Family Size in Phillips County is 3.0 People.
What is the Average Household Size in Phillips County
Average Household Size in Phillips County is 2.2 People.
What is Per Capita Income in Phillips County?
Per Capita income in Phillips County is $34,396.
What is the Median Family Income in Phillips County?
Median Family Income in Phillips County is $72,042.
What is the Median Household income in Phillips County?
Median Household Income in Phillips County is $57,611.
What is Income or Wage Gap in Phillips County?
Income or Wage Gap in Phillips County is 38.7%.
Women in Phillips County earn 61.3 cents for every dollar earned by a man.
What is Family Income Deficit in Phillips County?
Family Income Deficit in Phillips County is $10,958.
Families that are below poverty line in Phillips County earn $10,958 less on average than the poverty threshold level.
What is Inequality or Gini Index in Phillips County?
Inequality or Gini Index in Phillips County is 0.44.
How Large is the Labor Force in Phillips County?
There are 2,417 People in the Labor Forcein in Phillips County.
What is the Percentage of People in the Labor Force in Phillips County?
60.2% of People are in the Labor Force in Phillips County.
What is the Unemployment Rate in Phillips County?
Unemployment Rate in Phillips County is 4.0%.