Osborne County, KS
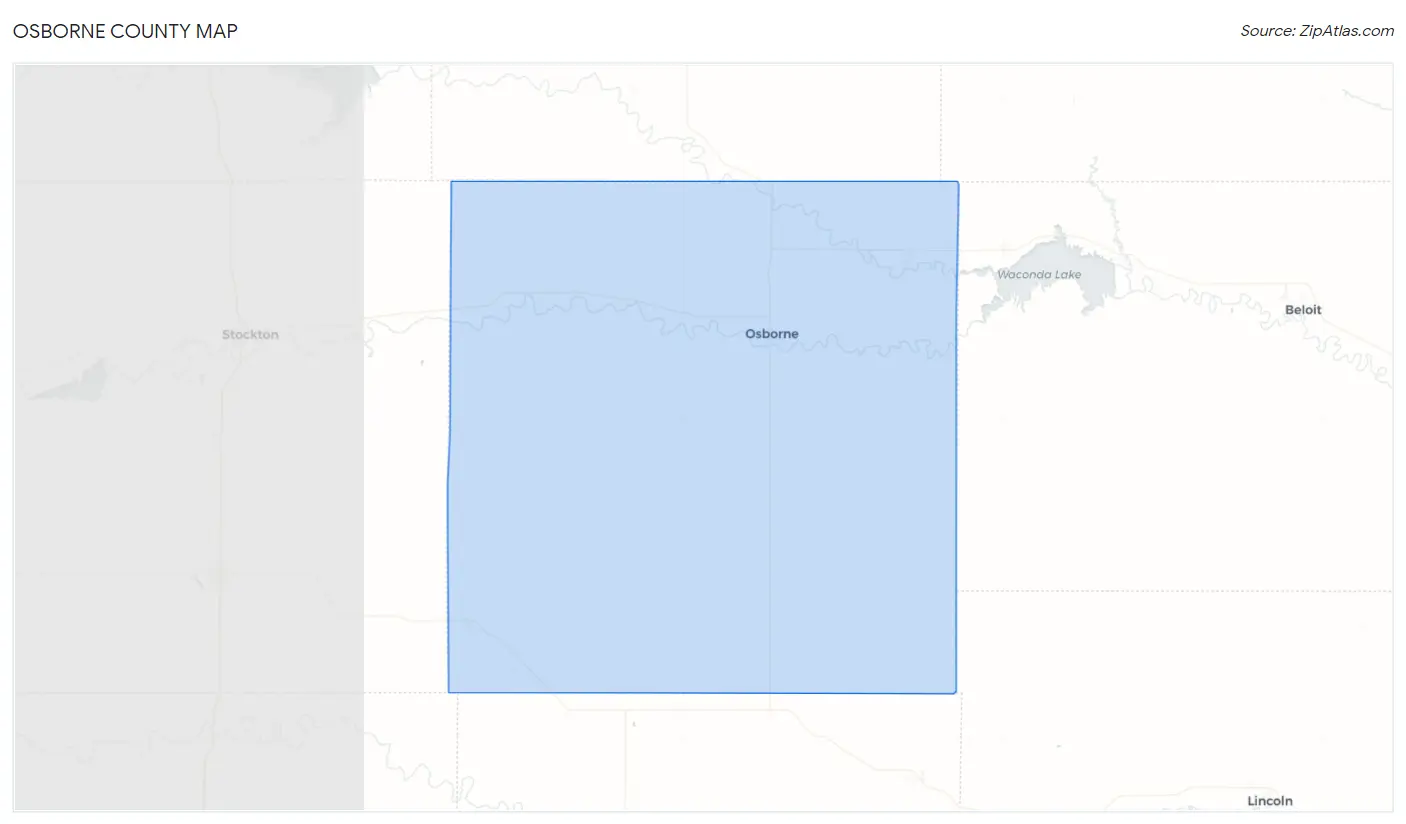
Osborne County Map
Osborne County Overview
3,493
TOTAL POPULATION
1,757
MALE POPULATION
1,736
FEMALE POPULATION
101.21
MALES / 100 FEMALES
98.80
FEMALES / 100 MALES
46.4
MEDIAN AGE
2.7
AVG FAMILY SIZE
2.1
AVG HOUSEHOLD SIZE
$34,669
PER CAPITA INCOME
$74,868
AVG FAMILY INCOME
$58,750
AVG HOUSEHOLD INCOME
42.6%
WAGE / INCOME GAP [ % ]
57.4¢/ $1
WAGE / INCOME GAP [ $ ]
0.44
INEQUALITY / GINI INDEX
1,864
LABOR FORCE [ PEOPLE ]
65.9%
PERCENT IN LABOR FORCE
1.7%
UNEMPLOYMENT RATE
Osborne County Area Codes
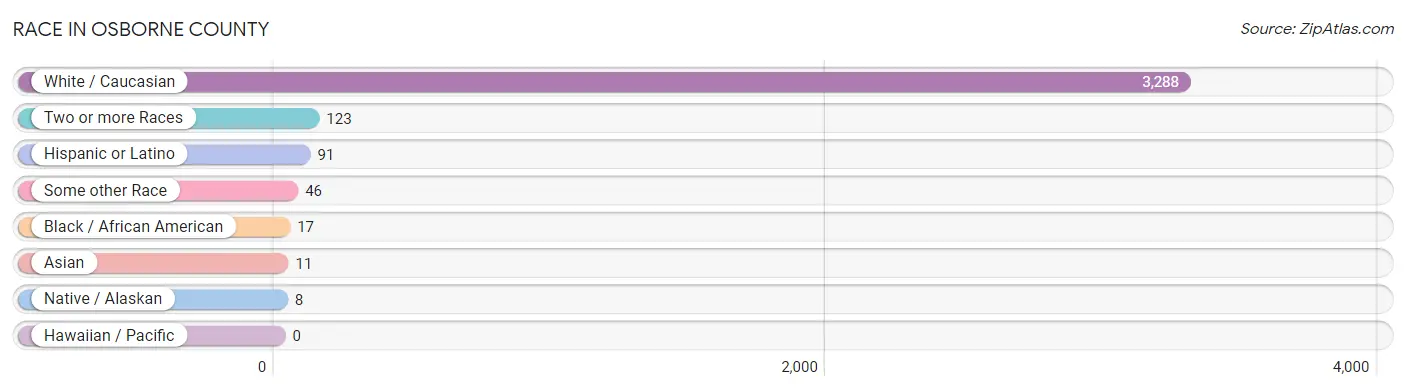
Race in Osborne County
The most populous races in Osborne County are White / Caucasian (3,288 | 94.1%), Two or more Races (123 | 3.5%), and Hispanic or Latino (91 | 2.6%).
| Race | # Population | % Population |
| Asian | 11 | 0.3% |
| Black / African American | 17 | 0.5% |
| Hawaiian / Pacific | 0 | 0.0% |
| Hispanic or Latino | 91 | 2.6% |
| Native / Alaskan | 8 | 0.2% |
| White / Caucasian | 3,288 | 94.1% |
| Two or more Races | 123 | 3.5% |
| Some other Race | 46 | 1.3% |
| Total | 3,493 | 100.0% |
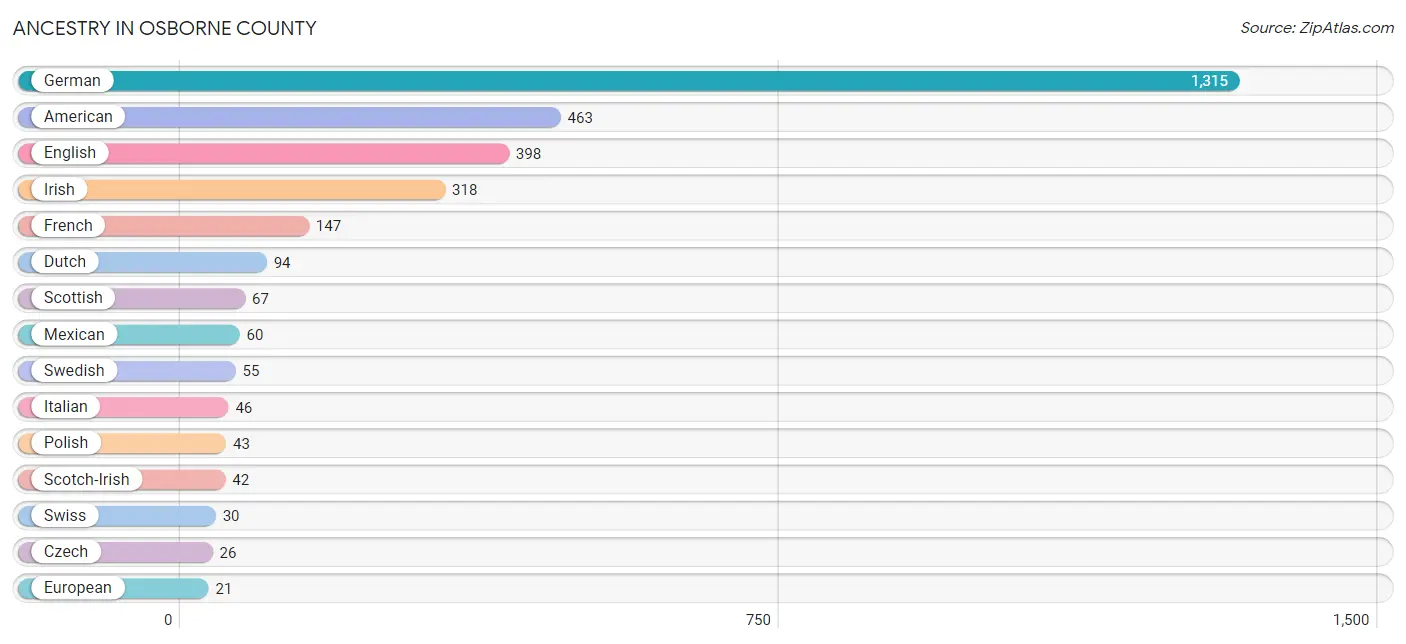
Ancestry in Osborne County
The most populous ancestries reported in Osborne County are German (1,315 | 37.7%), American (463 | 13.3%), English (398 | 11.4%), Irish (318 | 9.1%), and French (147 | 4.2%), together accounting for 75.6% of all Osborne County residents.
| Ancestry | # Population | % Population |
| American | 463 | 13.3% |
| Bhutanese | 7 | 0.2% |
| Blackfeet | 5 | 0.1% |
| British | 20 | 0.6% |
| Burmese | 8 | 0.2% |
| Central American | 13 | 0.4% |
| Cherokee | 14 | 0.4% |
| Choctaw | 8 | 0.2% |
| Comanche | 7 | 0.2% |
| Czech | 26 | 0.7% |
| Czechoslovakian | 6 | 0.2% |
| Danish | 14 | 0.4% |
| Dutch | 94 | 2.7% |
| English | 398 | 11.4% |
| European | 21 | 0.6% |
| Finnish | 3 | 0.1% |
| French | 147 | 4.2% |
| French Canadian | 18 | 0.5% |
| German | 1,315 | 37.7% |
| Guatemalan | 12 | 0.3% |
| Honduran | 1 | 0.0% |
| Indian (Asian) | 9 | 0.3% |
| Irish | 318 | 9.1% |
| Italian | 46 | 1.3% |
| Korean | 2 | 0.1% |
| Luxembourger | 5 | 0.1% |
| Mexican | 60 | 1.7% |
| Northern European | 2 | 0.1% |
| Norwegian | 6 | 0.2% |
| Pennsylvania German | 1 | 0.0% |
| Polish | 43 | 1.2% |
| Portuguese | 4 | 0.1% |
| Pueblo | 5 | 0.1% |
| Russian | 12 | 0.3% |
| Scotch-Irish | 42 | 1.2% |
| Scottish | 67 | 1.9% |
| Slavic | 3 | 0.1% |
| Spaniard | 2 | 0.1% |
| Spanish | 16 | 0.5% |
| Swedish | 55 | 1.6% |
| Swiss | 30 | 0.9% |
| Thai | 2 | 0.1% |
| Welsh | 19 | 0.5% | View All 43 Rows |
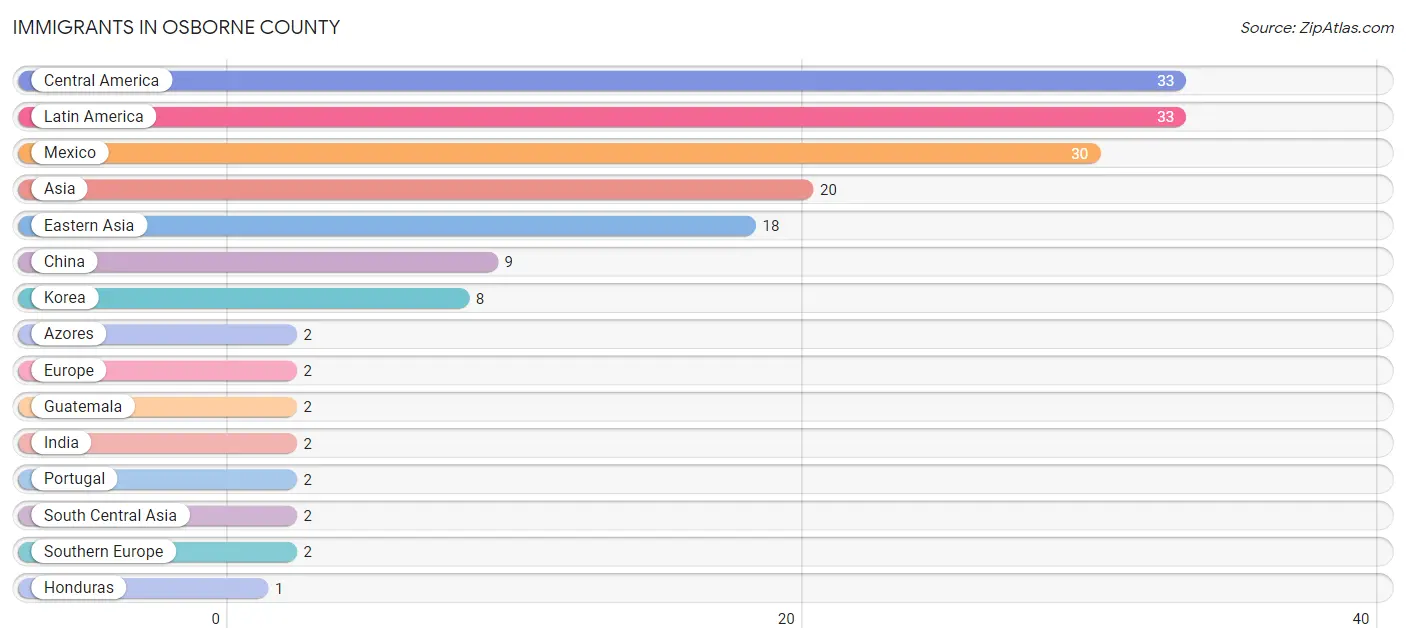
Immigrants in Osborne County
The most numerous immigrant groups reported in Osborne County came from Central America (33 | 0.9%), Latin America (33 | 0.9%), Mexico (30 | 0.9%), Asia (20 | 0.6%), and Eastern Asia (18 | 0.5%), together accounting for 3.8% of all Osborne County residents.
| Immigration Origin | # Population | % Population |
| Asia | 20 | 0.6% |
| Azores | 2 | 0.1% |
| Central America | 33 | 0.9% |
| China | 9 | 0.3% |
| Eastern Asia | 18 | 0.5% |
| Europe | 2 | 0.1% |
| Guatemala | 2 | 0.1% |
| Honduras | 1 | 0.0% |
| India | 2 | 0.1% |
| Japan | 1 | 0.0% |
| Korea | 8 | 0.2% |
| Latin America | 33 | 0.9% |
| Mexico | 30 | 0.9% |
| Portugal | 2 | 0.1% |
| South Central Asia | 2 | 0.1% |
| Southern Europe | 2 | 0.1% | View All 16 Rows |
Sex and Age in Osborne County
Sex and Age in Osborne County
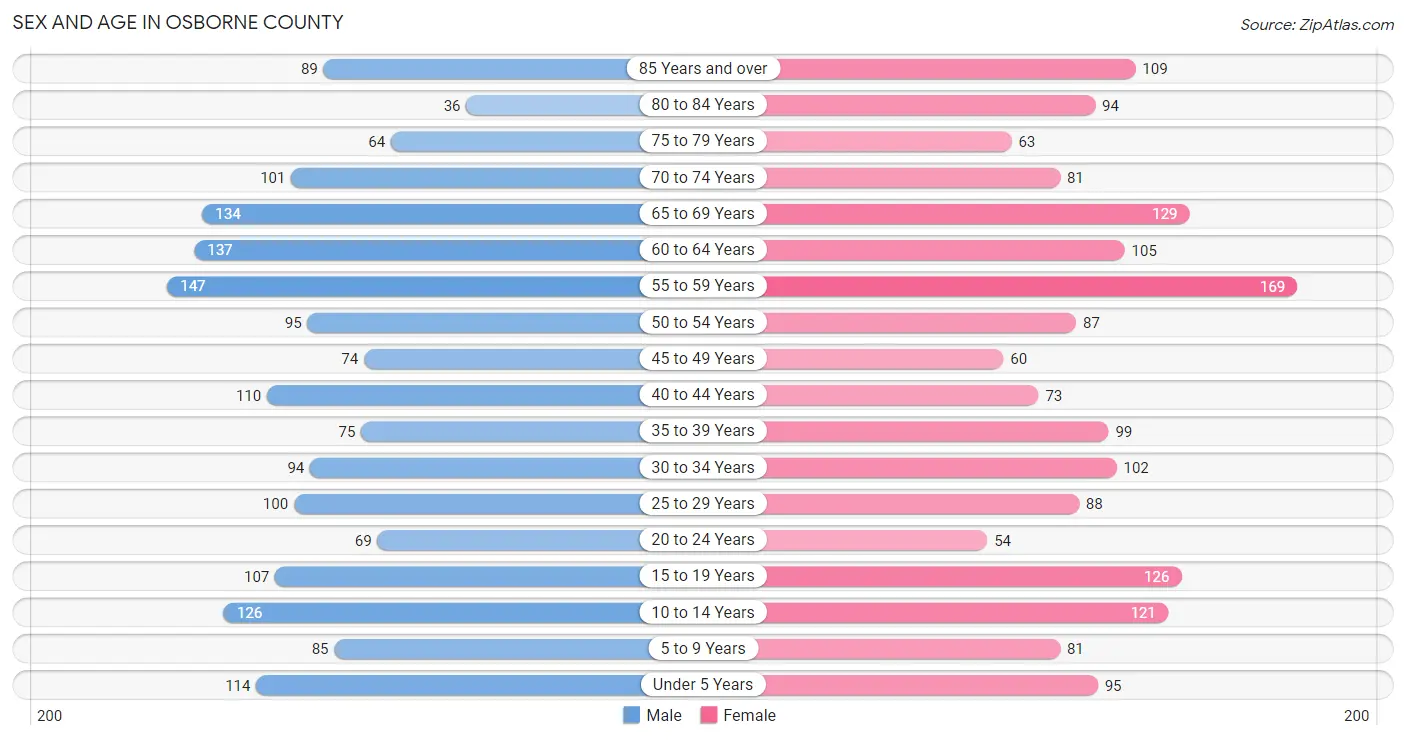
The most populous age groups in Osborne County are 55 to 59 Years (147 | 8.4%) for men and 55 to 59 Years (169 | 9.7%) for women.
| Age Bracket | Male | Female |
| Under 5 Years | 114 (6.5%) | 95 (5.5%) |
| 5 to 9 Years | 85 (4.8%) | 81 (4.7%) |
| 10 to 14 Years | 126 (7.2%) | 121 (7.0%) |
| 15 to 19 Years | 107 (6.1%) | 126 (7.3%) |
| 20 to 24 Years | 69 (3.9%) | 54 (3.1%) |
| 25 to 29 Years | 100 (5.7%) | 88 (5.1%) |
| 30 to 34 Years | 94 (5.3%) | 102 (5.9%) |
| 35 to 39 Years | 75 (4.3%) | 99 (5.7%) |
| 40 to 44 Years | 110 (6.3%) | 73 (4.2%) |
| 45 to 49 Years | 74 (4.2%) | 60 (3.5%) |
| 50 to 54 Years | 95 (5.4%) | 87 (5.0%) |
| 55 to 59 Years | 147 (8.4%) | 169 (9.7%) |
| 60 to 64 Years | 137 (7.8%) | 105 (6.0%) |
| 65 to 69 Years | 134 (7.6%) | 129 (7.4%) |
| 70 to 74 Years | 101 (5.8%) | 81 (4.7%) |
| 75 to 79 Years | 64 (3.6%) | 63 (3.6%) |
| 80 to 84 Years | 36 (2.1%) | 94 (5.4%) |
| 85 Years and over | 89 (5.1%) | 109 (6.3%) |
| Total | 1,757 (100.0%) | 1,736 (100.0%) |
Families and Households in Osborne County
Median Family Size in Osborne County
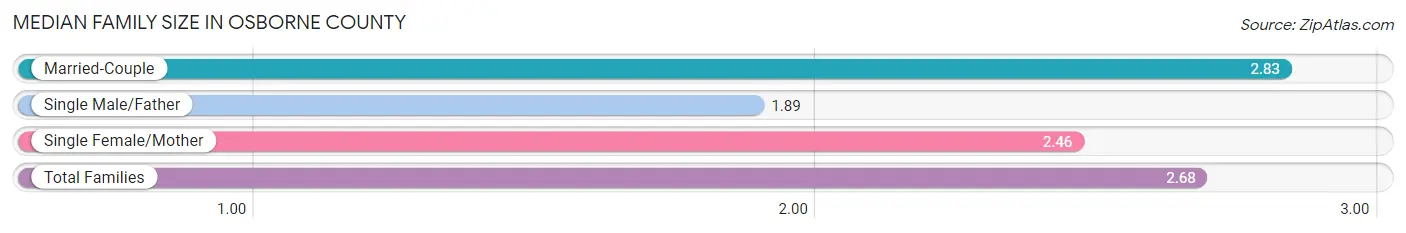
The median family size in Osborne County is 2.68 persons per family, with married-couple families (731 | 75.7%) accounting for the largest median family size of 2.83 persons per family. On the other hand, single male/father families (102 | 10.6%) represent the smallest median family size with 1.89 persons per family.
| Family Type | # Families | Family Size |
| Married-Couple | 731 (75.7%) | 2.83 |
| Single Male/Father | 102 (10.6%) | 1.89 |
| Single Female/Mother | 133 (13.8%) | 2.46 |
| Total Families | 966 (100.0%) | 2.68 |
Median Household Size in Osborne County
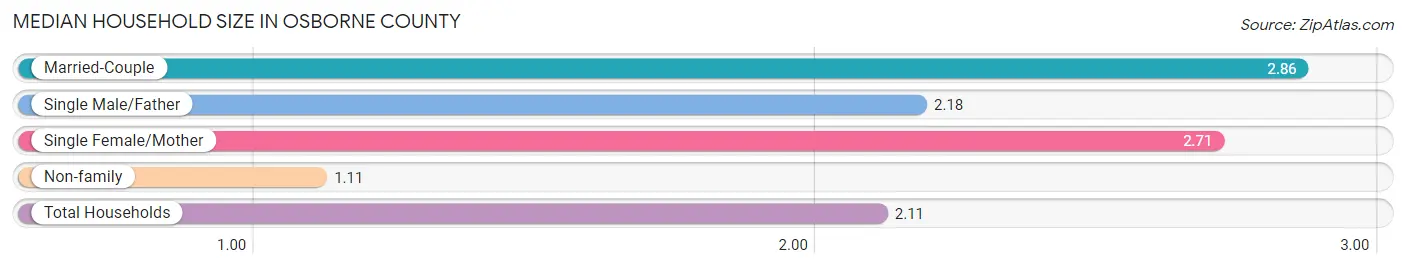
The median household size in Osborne County is 2.11 persons per household, with married-couple households (731 | 45.6%) accounting for the largest median household size of 2.86 persons per household. non-family households (638 | 39.8%) represent the smallest median household size with 1.11 persons per household.
| Household Type | # Households | Household Size |
| Married-Couple | 731 (45.6%) | 2.86 |
| Single Male/Father | 102 (6.4%) | 2.18 |
| Single Female/Mother | 133 (8.3%) | 2.71 |
| Non-family | 638 (39.8%) | 1.11 |
| Total Households | 1,604 (100.0%) | 2.11 |
Household Size by Marriage Status in Osborne County
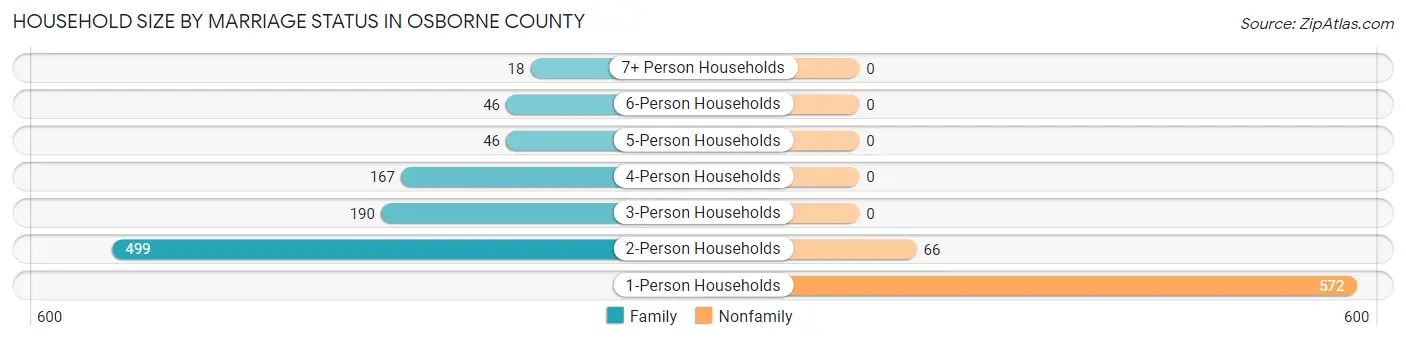
Out of a total of 1,604 households in Osborne County, 966 (60.2%) are family households, while 638 (39.8%) are nonfamily households. The most numerous type of family households are 2-person households, comprising 499, and the most common type of nonfamily households are 1-person households, comprising 572.
| Household Size | Family Households | Nonfamily Households |
| 1-Person Households | - | 572 (35.7%) |
| 2-Person Households | 499 (31.1%) | 66 (4.1%) |
| 3-Person Households | 190 (11.8%) | 0 (0.0%) |
| 4-Person Households | 167 (10.4%) | 0 (0.0%) |
| 5-Person Households | 46 (2.9%) | 0 (0.0%) |
| 6-Person Households | 46 (2.9%) | 0 (0.0%) |
| 7+ Person Households | 18 (1.1%) | 0 (0.0%) |
| Total | 966 (60.2%) | 638 (39.8%) |
Female Fertility in Osborne County
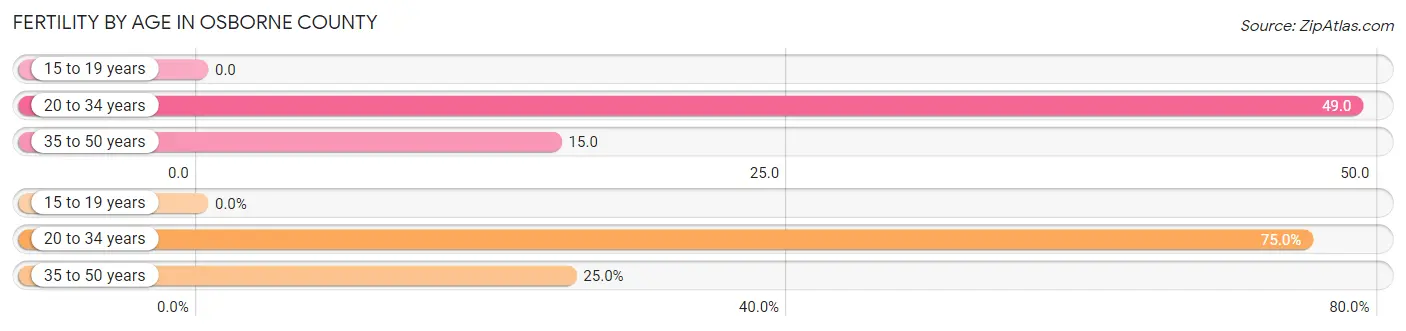
Fertility by Age in Osborne County
Average fertility rate in Osborne County is 25.0 births per 1,000 women. Women in the age bracket of 20 to 34 years have the highest fertility rate with 49.0 births per 1,000 women. Women in the age bracket of 20 to 34 years acount for 75.0% of all women with births.
| Age Bracket | Women with Births | Births / 1,000 Women |
| 15 to 19 years | 0 (0.0%) | 0.0 |
| 20 to 34 years | 12 (75.0%) | 49.0 |
| 35 to 50 years | 4 (25.0%) | 15.0 |
| Total | 16 (100.0%) | 25.0 |
Fertility by Age by Marriage Status in Osborne County

| Age Bracket | Married | Unmarried |
| 15 to 19 years | 0 (0.0%) | 0 (0.0%) |
| 20 to 34 years | 12 (100.0%) | 0 (0.0%) |
| 35 to 50 years | 4 (100.0%) | 0 (0.0%) |
| Total | 16 (100.0%) | 0 (0.0%) |
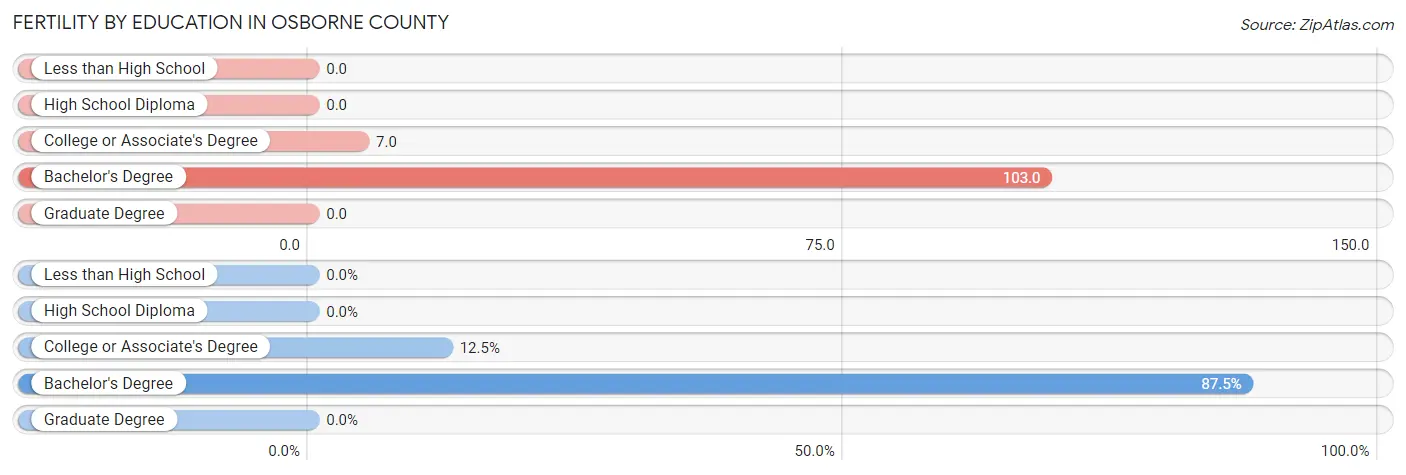
Fertility by Education in Osborne County
| Educational Attainment | Women with Births | Births / 1,000 Women |
| Less than High School | 0 (0.0%) | 0.0 |
| High School Diploma | 0 (0.0%) | 0.0 |
| College or Associate's Degree | 2 (12.5%) | 7.0 |
| Bachelor's Degree | 14 (87.5%) | 103.0 |
| Graduate Degree | 0 (0.0%) | 0.0 |
| Total | 16 (100.0%) | 25.0 |
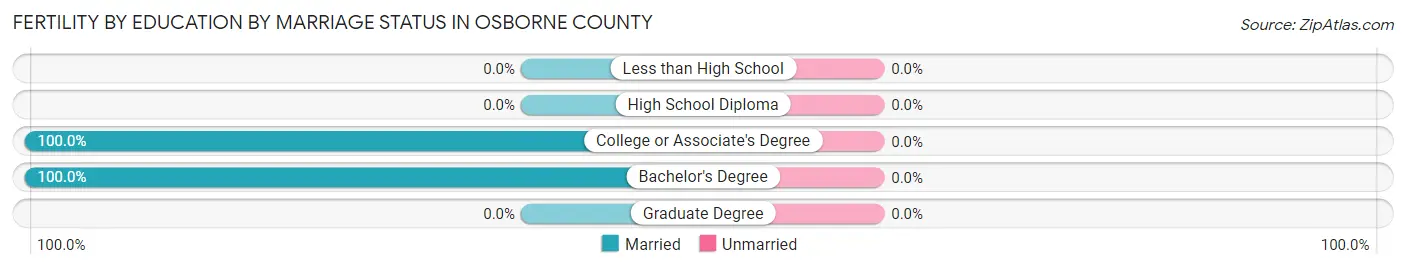
Fertility by Education by Marriage Status in Osborne County
| Educational Attainment | Married | Unmarried |
| Less than High School | 0 (0.0%) | 0 (0.0%) |
| High School Diploma | 0 (0.0%) | 0 (0.0%) |
| College or Associate's Degree | 2 (100.0%) | 0 (0.0%) |
| Bachelor's Degree | 14 (100.0%) | 0 (0.0%) |
| Graduate Degree | 0 (0.0%) | 0 (0.0%) |
| Total | 16 (100.0%) | 0 (0.0%) |
Income in Osborne County
Income Overview in Osborne County
Per Capita Income in Osborne County is $34,669, while median incomes of families and households are $74,868 and $58,750 respectively.
| Characteristic | Number | Measure |
| Per Capita Income | 3,493 | $34,669 |
| Median Family Income | 966 | $74,868 |
| Mean Family Income | 966 | $92,273 |
| Median Household Income | 1,604 | $58,750 |
| Mean Household Income | 1,604 | $73,819 |
| Income Deficit | 966 | $0 |
| Wage / Income Gap (%) | 3,493 | 42.55% |
| Wage / Income Gap ($) | 3,493 | 57.45¢ per $1 |
| Gini / Inequality Index | 3,493 | 0.44 |
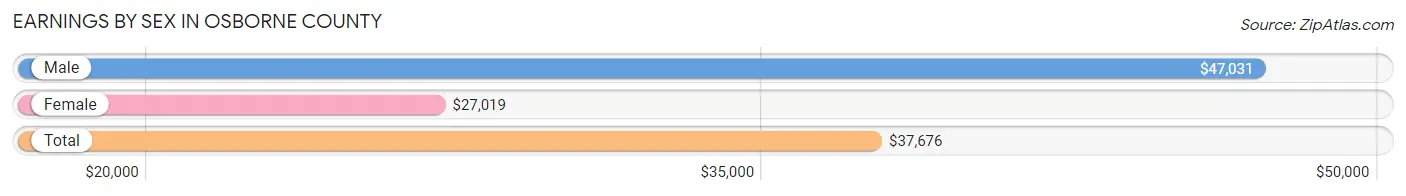
Earnings by Sex in Osborne County
Average Earnings in Osborne County are $37,676, $47,031 for men and $27,019 for women, a difference of 42.5%.
| Sex | Number | Average Earnings |
| Male | 998 (50.2%) | $47,031 |
| Female | 988 (49.7%) | $27,019 |
| Total | 1,986 (100.0%) | $37,676 |
Earnings by Sex by Income Bracket in Osborne County
The most common earnings brackets in Osborne County are $55,000 to $64,999 for men (133 | 13.3%) and $75,000 to $99,999 for women (85 | 8.6%).
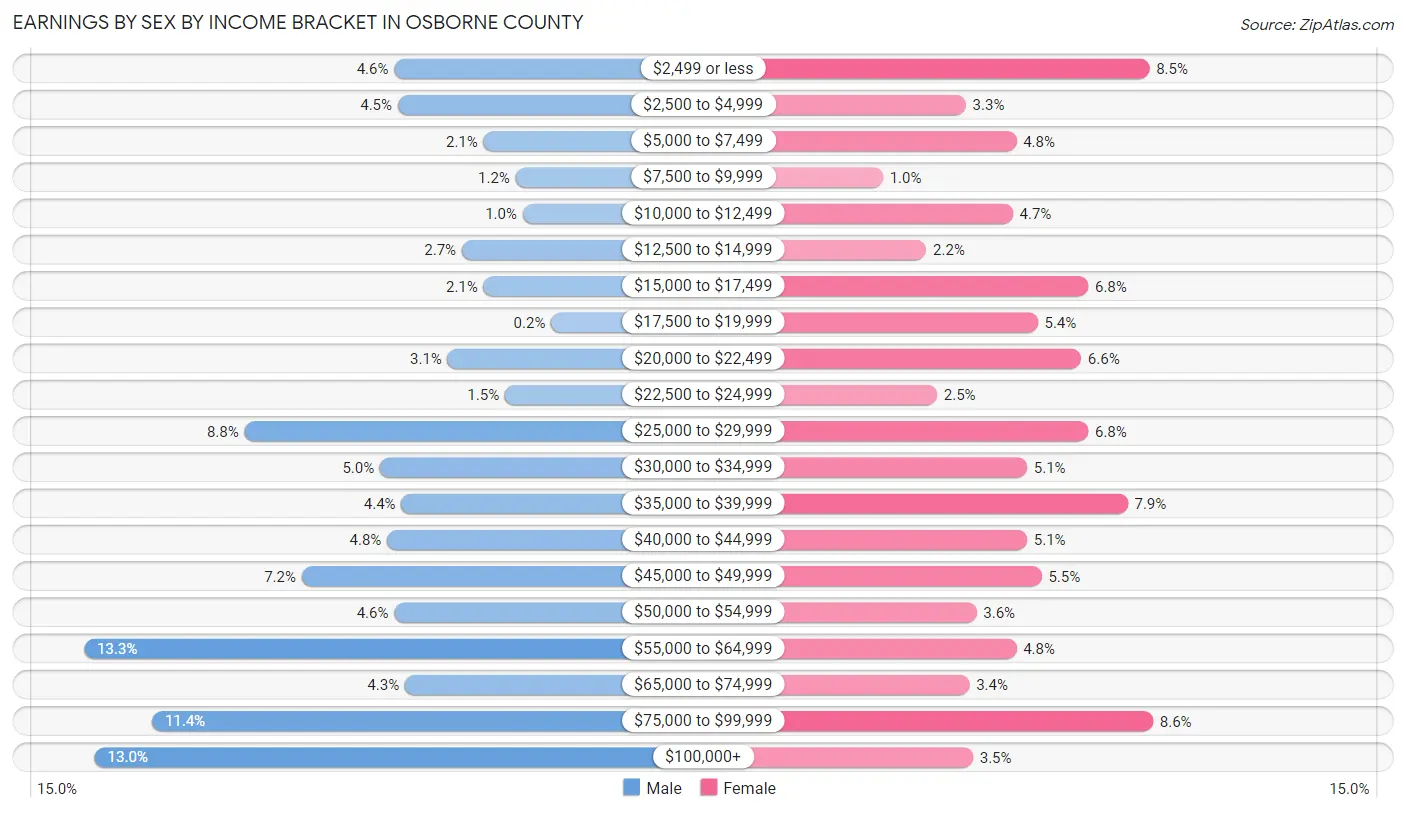
| Income | Male | Female |
| $2,499 or less | 46 (4.6%) | 84 (8.5%) |
| $2,500 to $4,999 | 45 (4.5%) | 33 (3.3%) |
| $5,000 to $7,499 | 21 (2.1%) | 47 (4.8%) |
| $7,500 to $9,999 | 12 (1.2%) | 10 (1.0%) |
| $10,000 to $12,499 | 10 (1.0%) | 46 (4.7%) |
| $12,500 to $14,999 | 27 (2.7%) | 22 (2.2%) |
| $15,000 to $17,499 | 21 (2.1%) | 67 (6.8%) |
| $17,500 to $19,999 | 2 (0.2%) | 53 (5.4%) |
| $20,000 to $22,499 | 31 (3.1%) | 65 (6.6%) |
| $22,500 to $24,999 | 15 (1.5%) | 25 (2.5%) |
| $25,000 to $29,999 | 88 (8.8%) | 67 (6.8%) |
| $30,000 to $34,999 | 50 (5.0%) | 50 (5.1%) |
| $35,000 to $39,999 | 44 (4.4%) | 78 (7.9%) |
| $40,000 to $44,999 | 48 (4.8%) | 50 (5.1%) |
| $45,000 to $49,999 | 72 (7.2%) | 54 (5.5%) |
| $50,000 to $54,999 | 46 (4.6%) | 36 (3.6%) |
| $55,000 to $64,999 | 133 (13.3%) | 47 (4.8%) |
| $65,000 to $74,999 | 43 (4.3%) | 34 (3.4%) |
| $75,000 to $99,999 | 114 (11.4%) | 85 (8.6%) |
| $100,000+ | 130 (13.0%) | 35 (3.5%) |
| Total | 998 (100.0%) | 988 (100.0%) |
Earnings by Sex by Educational Attainment in Osborne County
Average earnings in Osborne County are $51,875 for men and $31,406 for women, a difference of 39.5%. Men with an educational attainment of graduate degree enjoy the highest average annual earnings of $90,417, while those with less than high school education earn the least with $43,333. Women with an educational attainment of graduate degree earn the most with the average annual earnings of $59,231, while those with less than high school education have the smallest earnings of $21,250.
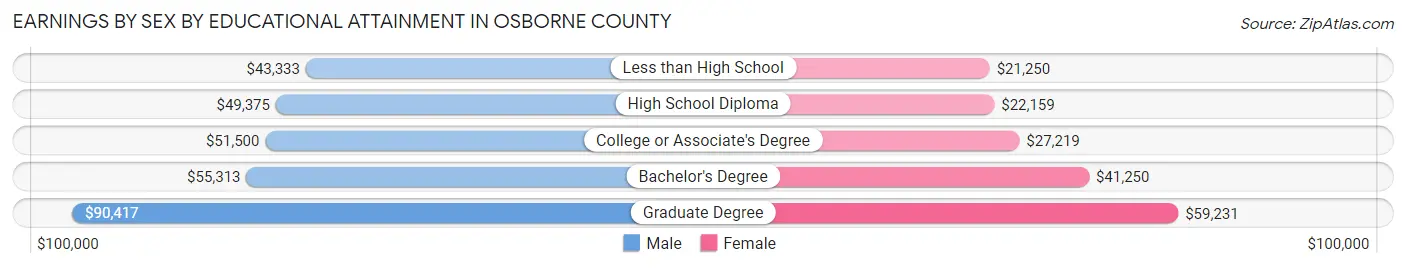
| Educational Attainment | Male Income | Female Income |
| Less than High School | $43,333 | $21,250 |
| High School Diploma | $49,375 | $22,159 |
| College or Associate's Degree | $51,500 | $27,219 |
| Bachelor's Degree | $55,313 | $41,250 |
| Graduate Degree | $90,417 | $59,231 |
| Total | $51,875 | $31,406 |
Family Income in Osborne County
Family Income Brackets in Osborne County
According to the Osborne County family income data, there are 187 families falling into the $50,000 to $74,999 income range, which is the most common income bracket and makes up 19.4% of all families. Conversely, the $10,000 to $14,999 income bracket is the least frequent group with only 14 families (1.5%) belonging to this category.
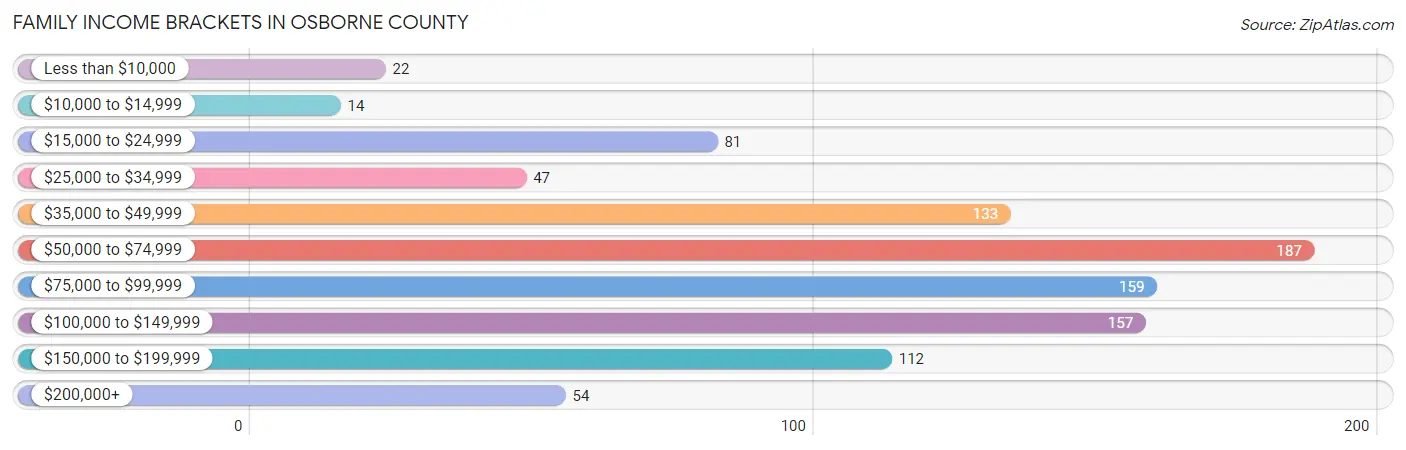
| Income Bracket | # Families | % Families |
| Less than $10,000 | 22 | 2.3% |
| $10,000 to $14,999 | 14 | 1.4% |
| $15,000 to $24,999 | 81 | 8.4% |
| $25,000 to $34,999 | 47 | 4.9% |
| $35,000 to $49,999 | 133 | 13.8% |
| $50,000 to $74,999 | 187 | 19.4% |
| $75,000 to $99,999 | 159 | 16.5% |
| $100,000 to $149,999 | 157 | 16.3% |
| $150,000 to $199,999 | 112 | 11.6% |
| $200,000+ | 54 | 5.6% |
Family Income by Famaliy Size in Osborne County
7+ person families (11 | 1.1%) account for the highest median family income in Osborne County with $162,813 per family, while 2-person families (540 | 55.9%) have the highest median income of $32,554 per family member.
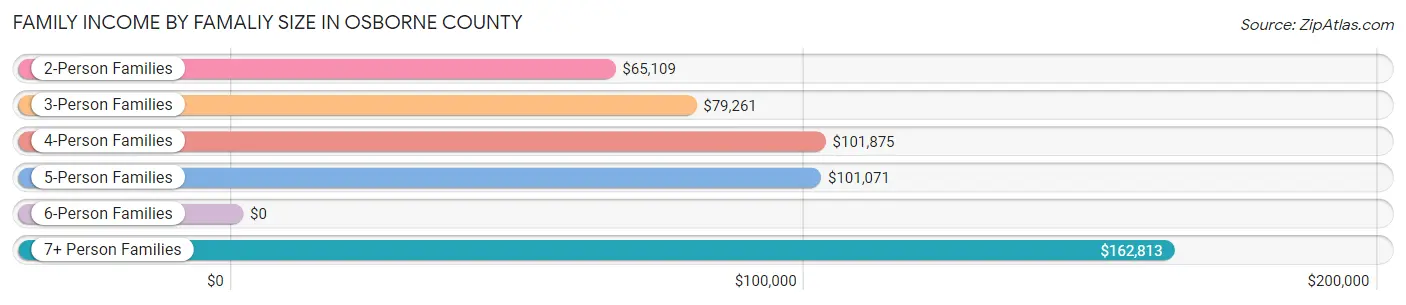
| Income Bracket | # Families | Median Income |
| 2-Person Families | 540 (55.9%) | $65,109 |
| 3-Person Families | 201 (20.8%) | $79,261 |
| 4-Person Families | 119 (12.3%) | $101,875 |
| 5-Person Families | 60 (6.2%) | $101,071 |
| 6-Person Families | 35 (3.6%) | $0 |
| 7+ Person Families | 11 (1.1%) | $162,813 |
| Total | 966 (100.0%) | $74,868 |
Family Income by Number of Earners in Osborne County
The median family income in Osborne County is $74,868, with families comprising 2 earners (466) having the highest median family income of $101,618, while families with no earners (143) have the lowest median family income of $44,219, accounting for 48.2% and 14.8% of families, respectively.
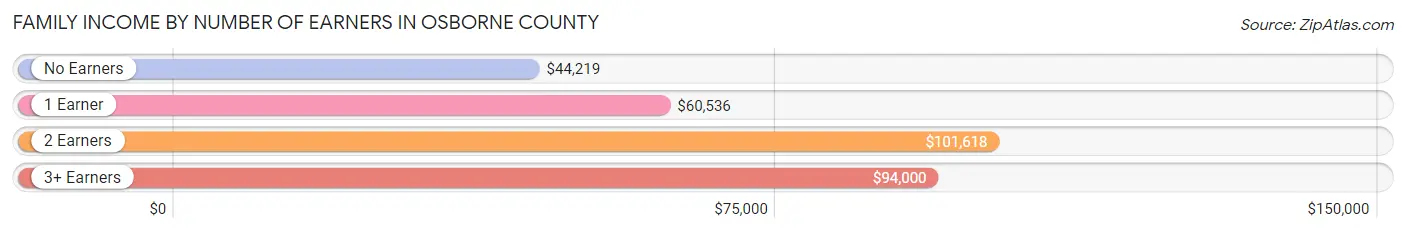
| Number of Earners | # Families | Median Income |
| No Earners | 143 (14.8%) | $44,219 |
| 1 Earner | 277 (28.7%) | $60,536 |
| 2 Earners | 466 (48.2%) | $101,618 |
| 3+ Earners | 80 (8.3%) | $94,000 |
| Total | 966 (100.0%) | $74,868 |
Household Income in Osborne County
Household Income Brackets in Osborne County
With 281 households falling in the category, the $75,000 to $99,999 income range is the most frequent in Osborne County, accounting for 17.5% of all households. In contrast, only 56 households (3.5%) fall into the $200,000+ income bracket, making it the least populous group.

| Income Bracket | # Households | % Households |
| Less than $10,000 | 66 | 4.1% |
| $10,000 to $14,999 | 93 | 5.8% |
| $15,000 to $24,999 | 180 | 11.2% |
| $25,000 to $34,999 | 181 | 11.3% |
| $35,000 to $49,999 | 225 | 14.0% |
| $50,000 to $74,999 | 205 | 12.8% |
| $75,000 to $99,999 | 281 | 17.5% |
| $100,000 to $149,999 | 197 | 12.3% |
| $150,000 to $199,999 | 124 | 7.7% |
| $200,000+ | 56 | 3.5% |
Household Income by Householder Age in Osborne County
The median household income in Osborne County is $58,750, with the highest median household income of $79,643 found in the 25 to 44 years age bracket for the primary householder. A total of 400 households (24.9%) fall into this category. Meanwhile, the 15 to 24 years age bracket for the primary householder has the lowest median household income of $32,757, with 97 households (6.0%) in this group.
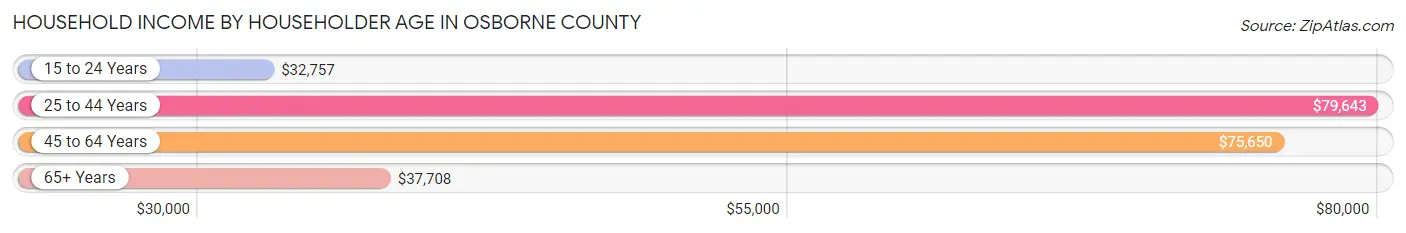
| Income Bracket | # Households | Median Income |
| 15 to 24 Years | 97 (6.0%) | $32,757 |
| 25 to 44 Years | 400 (24.9%) | $79,643 |
| 45 to 64 Years | 547 (34.1%) | $75,650 |
| 65+ Years | 560 (34.9%) | $37,708 |
| Total | 1,604 (100.0%) | $58,750 |
Poverty in Osborne County
Income Below Poverty by Sex and Age in Osborne County
With 9.9% poverty level for males and 17.0% for females among the residents of Osborne County, 15 year old males and 16 and 17 year old females are the most vulnerable to poverty, with 9 males (32.1%) and 19 females (42.2%) in their respective age groups living below the poverty level.
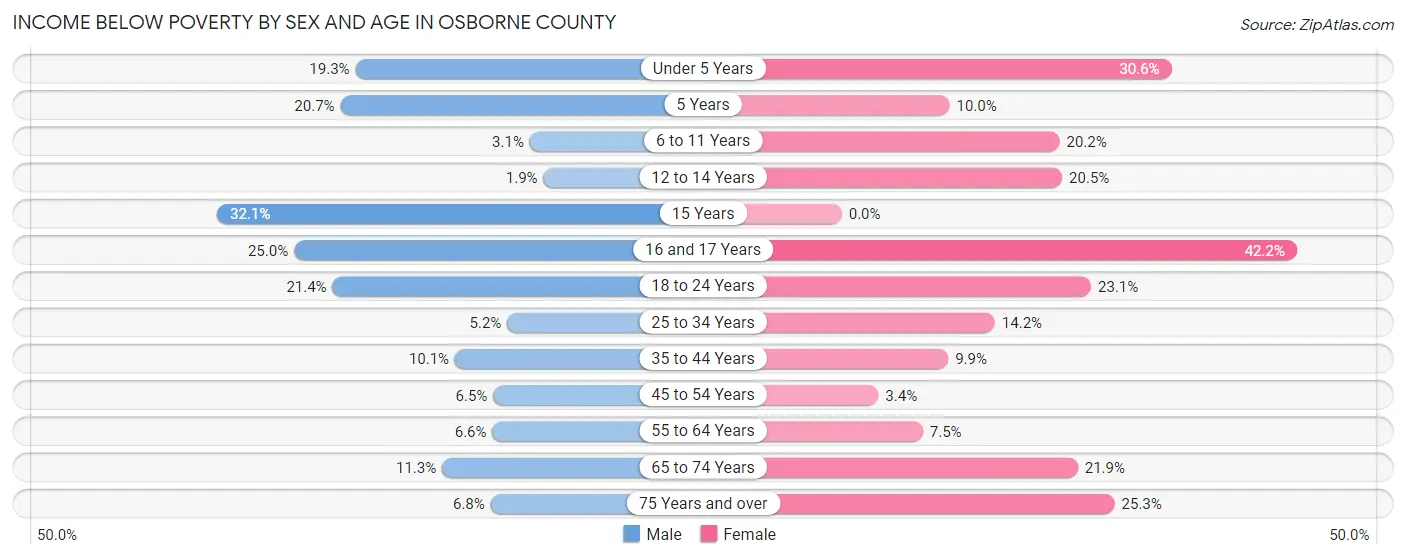
| Age Bracket | Male | Female |
| Under 5 Years | 22 (19.3%) | 26 (30.6%) |
| 5 Years | 6 (20.7%) | 2 (10.0%) |
| 6 to 11 Years | 4 (3.1%) | 19 (20.2%) |
| 12 to 14 Years | 1 (1.8%) | 18 (20.4%) |
| 15 Years | 9 (32.1%) | 0 (0.0%) |
| 16 and 17 Years | 9 (25.0%) | 19 (42.2%) |
| 18 to 24 Years | 24 (21.4%) | 28 (23.1%) |
| 25 to 34 Years | 10 (5.2%) | 27 (14.2%) |
| 35 to 44 Years | 18 (10.1%) | 17 (9.9%) |
| 45 to 54 Years | 11 (6.5%) | 5 (3.4%) |
| 55 to 64 Years | 18 (6.6%) | 20 (7.5%) |
| 65 to 74 Years | 25 (11.3%) | 46 (21.9%) |
| 75 Years and over | 11 (6.8%) | 59 (25.3%) |
| Total | 168 (9.9%) | 286 (17.0%) |
Income Above Poverty by Sex and Age in Osborne County
According to the poverty statistics in Osborne County, males aged 12 to 14 years and females aged 15 years are the age groups that are most secure financially, with 98.2% of males and 100.0% of females in these age groups living above the poverty line.
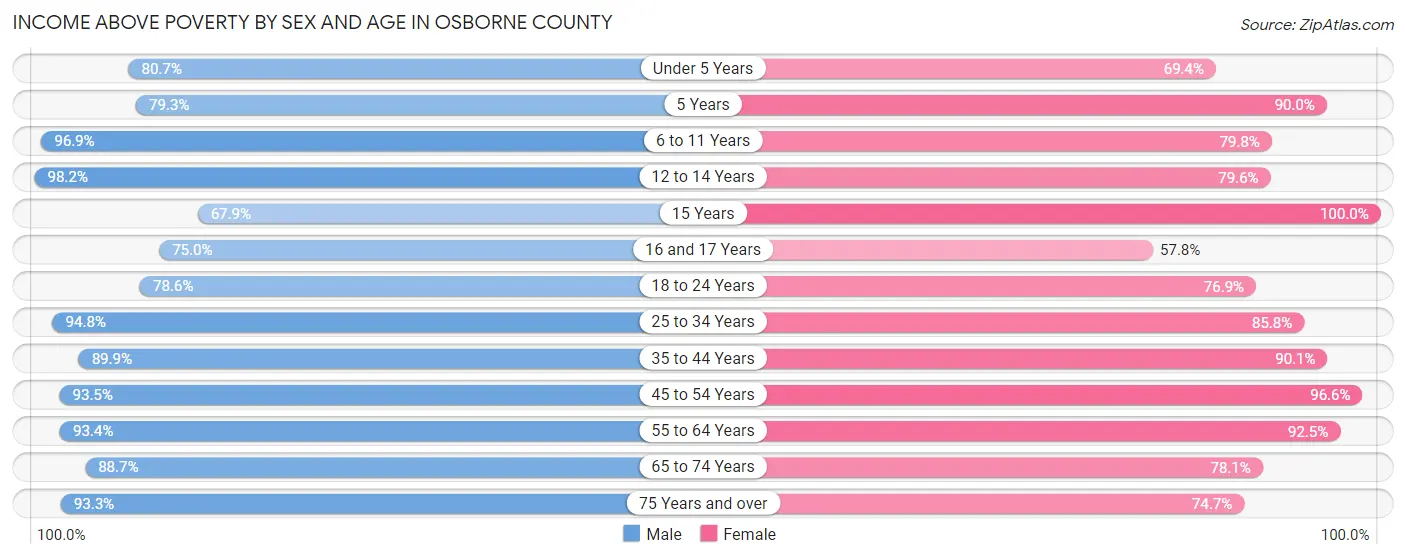
| Age Bracket | Male | Female |
| Under 5 Years | 92 (80.7%) | 59 (69.4%) |
| 5 Years | 23 (79.3%) | 18 (90.0%) |
| 6 to 11 Years | 124 (96.9%) | 75 (79.8%) |
| 12 to 14 Years | 53 (98.2%) | 70 (79.5%) |
| 15 Years | 19 (67.9%) | 14 (100.0%) |
| 16 and 17 Years | 27 (75.0%) | 26 (57.8%) |
| 18 to 24 Years | 88 (78.6%) | 93 (76.9%) |
| 25 to 34 Years | 182 (94.8%) | 163 (85.8%) |
| 35 to 44 Years | 161 (89.9%) | 155 (90.1%) |
| 45 to 54 Years | 158 (93.5%) | 142 (96.6%) |
| 55 to 64 Years | 255 (93.4%) | 246 (92.5%) |
| 65 to 74 Years | 197 (88.7%) | 164 (78.1%) |
| 75 Years and over | 152 (93.2%) | 174 (74.7%) |
| Total | 1,531 (90.1%) | 1,399 (83.0%) |
Income Below Poverty Among Married-Couple Families in Osborne County
The poverty statistics for married-couple families in Osborne County show that 4.5% or 33 of the total 731 families live below the poverty line. Families with 3 or 4 children have the highest poverty rate of 15.1%, comprising of 13 families. On the other hand, families with 5 or more children have the lowest poverty rate of 0.0%, which includes 0 families.
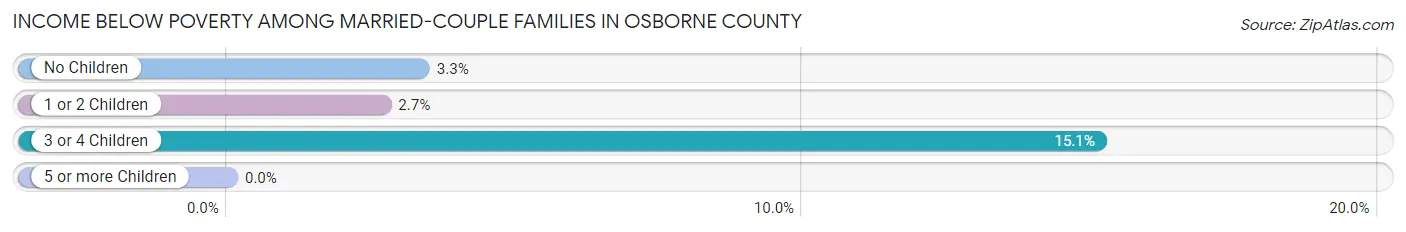
| Children | Above Poverty | Below Poverty |
| No Children | 434 (96.7%) | 15 (3.3%) |
| 1 or 2 Children | 182 (97.3%) | 5 (2.7%) |
| 3 or 4 Children | 73 (84.9%) | 13 (15.1%) |
| 5 or more Children | 9 (100.0%) | 0 (0.0%) |
| Total | 698 (95.5%) | 33 (4.5%) |
Income Below Poverty Among Single-Parent Households in Osborne County
According to the poverty data in Osborne County, 11.8% or 12 single-father households and 30.1% or 40 single-mother households are living below the poverty line. Among single-father households, those with 1 or 2 children have the highest poverty rate, with 10 households (13.7%) experiencing poverty. Likewise, among single-mother households, those with 3 or 4 children have the highest poverty rate, with 3 households (100.0%) falling below the poverty line.
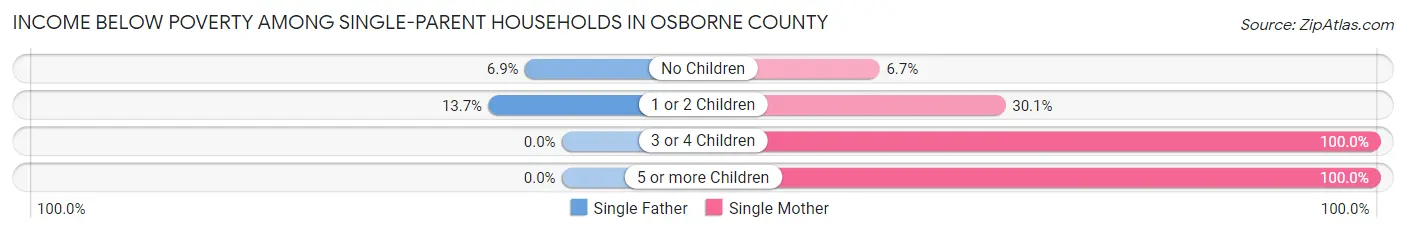
| Children | Single Father | Single Mother |
| No Children | 2 (6.9%) | 2 (6.7%) |
| 1 or 2 Children | 10 (13.7%) | 28 (30.1%) |
| 3 or 4 Children | 0 (0.0%) | 3 (100.0%) |
| 5 or more Children | 0 (0.0%) | 7 (100.0%) |
| Total | 12 (11.8%) | 40 (30.1%) |
Income Below Poverty Among Married-Couple vs Single-Parent Households in Osborne County
The poverty data for Osborne County shows that 33 of the married-couple family households (4.5%) and 52 of the single-parent households (22.1%) are living below the poverty level. Within the married-couple family households, those with 3 or 4 children have the highest poverty rate, with 13 households (15.1%) falling below the poverty line. Among the single-parent households, those with 3 or 4 children have the highest poverty rate, with 3 household (100.0%) living below poverty.
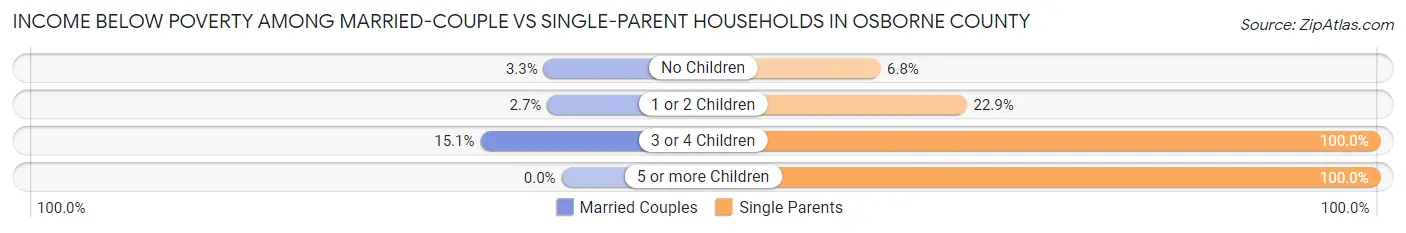
| Children | Married-Couple Families | Single-Parent Households |
| No Children | 15 (3.3%) | 4 (6.8%) |
| 1 or 2 Children | 5 (2.7%) | 38 (22.9%) |
| 3 or 4 Children | 13 (15.1%) | 3 (100.0%) |
| 5 or more Children | 0 (0.0%) | 7 (100.0%) |
| Total | 33 (4.5%) | 52 (22.1%) |
Employment Characteristics in Osborne County
Employment by Class of Employer in Osborne County
Among the 1,815 employed individuals in Osborne County, private company employees (956 | 52.7%), local government employees (342 | 18.8%), and self-employed (not incorporated) (265 | 14.6%) make up the most common classes of employment.
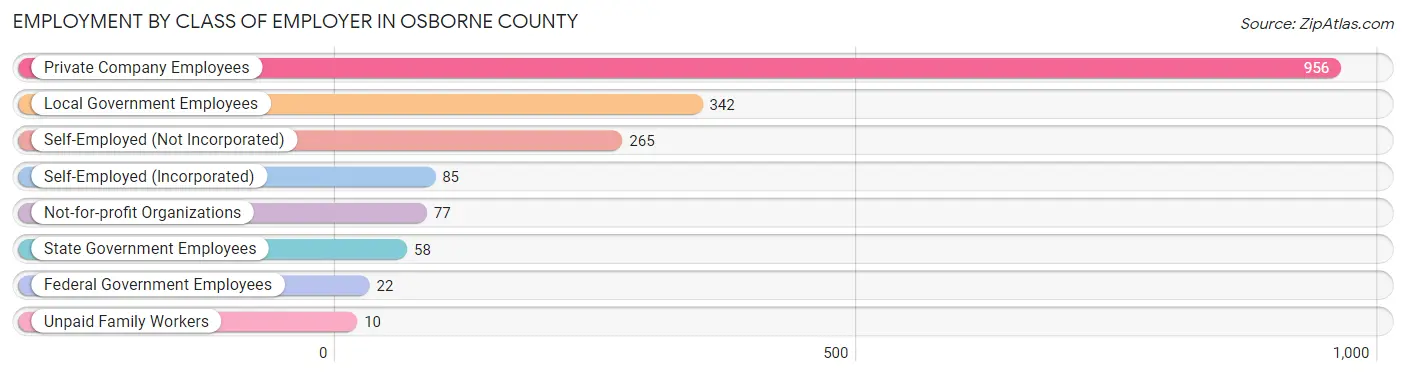
| Employer Class | # Employees | % Employees |
| Private Company Employees | 956 | 52.7% |
| Self-Employed (Incorporated) | 85 | 4.7% |
| Self-Employed (Not Incorporated) | 265 | 14.6% |
| Not-for-profit Organizations | 77 | 4.2% |
| Local Government Employees | 342 | 18.8% |
| State Government Employees | 58 | 3.2% |
| Federal Government Employees | 22 | 1.2% |
| Unpaid Family Workers | 10 | 0.5% |
| Total | 1,815 | 100.0% |
Employment Status by Age in Osborne County
According to the labor force statistics for Osborne County, out of the total population over 16 years of age (2,829), 65.9% or 1,864 individuals are in the labor force, with 1.7% or 32 of them unemployed. The age group with the highest labor force participation rate is 25 to 29 years, with 92.0% or 173 individuals in the labor force. Within the labor force, the 25 to 29 years age range has the highest percentage of unemployed individuals, with 6.9% or 12 of them being unemployed.
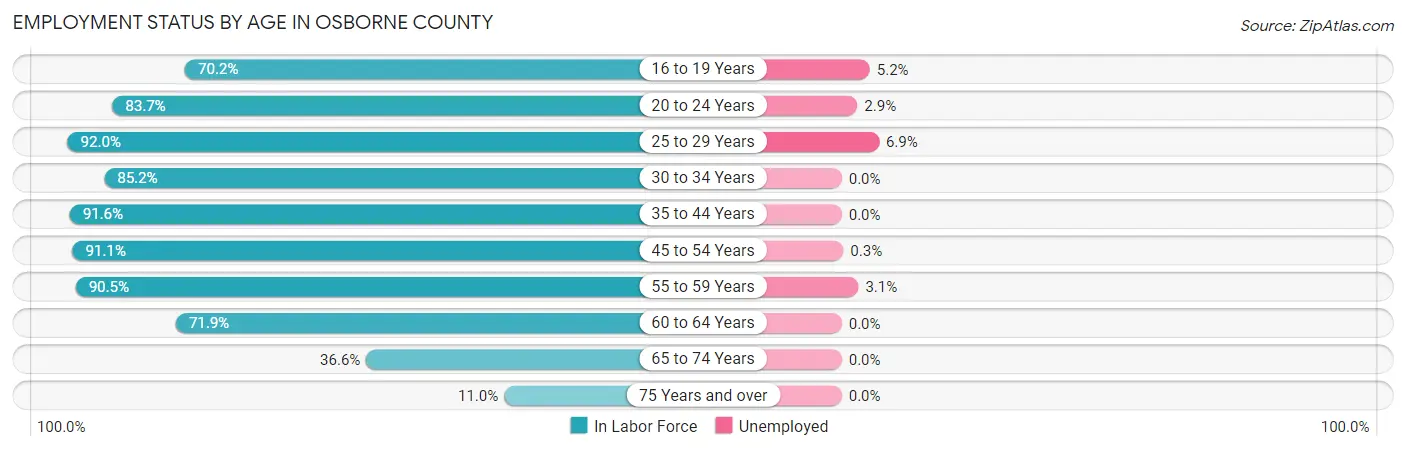
| Age Bracket | In Labor Force | Unemployed |
| 16 to 19 Years | 134 (70.2%) | 7 (5.2%) |
| 20 to 24 Years | 103 (83.7%) | 3 (2.9%) |
| 25 to 29 Years | 173 (92.0%) | 12 (6.9%) |
| 30 to 34 Years | 167 (85.2%) | 0 (0.0%) |
| 35 to 44 Years | 327 (91.6%) | 0 (0.0%) |
| 45 to 54 Years | 288 (91.1%) | 1 (0.3%) |
| 55 to 59 Years | 286 (90.5%) | 9 (3.1%) |
| 60 to 64 Years | 174 (71.9%) | 0 (0.0%) |
| 65 to 74 Years | 163 (36.6%) | 0 (0.0%) |
| 75 Years and over | 50 (11.0%) | 0 (0.0%) |
| Total | 1,864 (65.9%) | 32 (1.7%) |
Employment Status by Educational Attainment in Osborne County
According to labor force statistics for Osborne County, 87.6% of individuals (1,415) out of the total population between 25 and 64 years of age (1,615) are in the labor force, with 1.6% or 23 of them being unemployed. The group with the highest labor force participation rate are those with the educational attainment of bachelor's degree or higher, with 94.1% or 398 individuals in the labor force. Within the labor force, individuals with less than high school education have the highest percentage of unemployment, with 8.6% or 3 of them being unemployed.
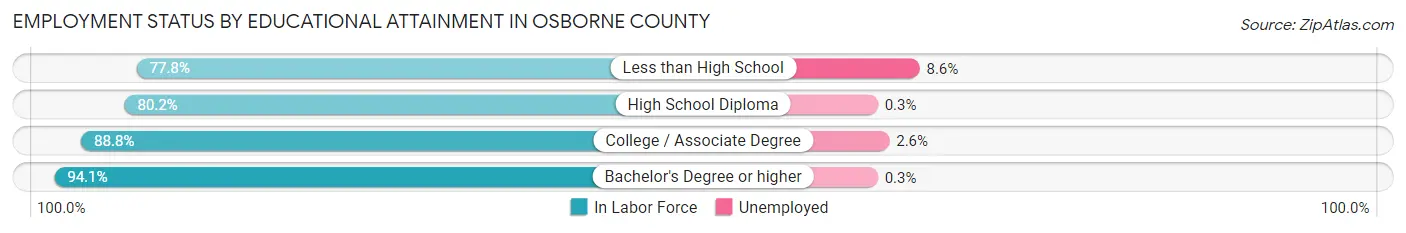
| Educational Attainment | In Labor Force | Unemployed |
| Less than High School | 35 (77.8%) | 4 (8.6%) |
| High School Diploma | 340 (80.2%) | 1 (0.3%) |
| College / Associate Degree | 642 (88.8%) | 19 (2.6%) |
| Bachelor's Degree or higher | 398 (94.1%) | 1 (0.3%) |
| Total | 1,415 (87.6%) | 26 (1.6%) |
Employment Occupations by Sex in Osborne County
Management, Business, Science and Arts Occupations
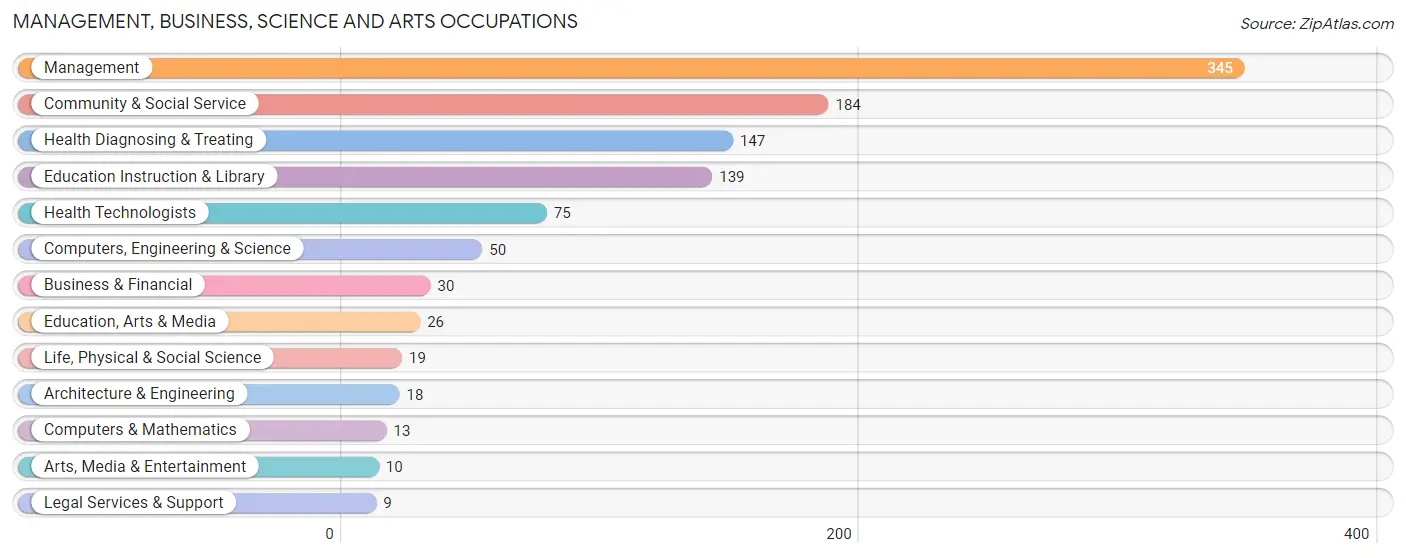
The most common Management, Business, Science and Arts occupations in Osborne County are Management (345 | 18.8%), Community & Social Service (184 | 10.0%), Health Diagnosing & Treating (147 | 8.0%), Education Instruction & Library (139 | 7.6%), and Health Technologists (75 | 4.1%).
Management, Business, Science and Arts Occupations by Sex
Within the Management, Business, Science and Arts occupations in Osborne County, the most male-oriented occupations are Computers & Mathematics (100.0%), Architecture & Engineering (100.0%), and Computers, Engineering & Science (82.0%), while the most female-oriented occupations are Health Diagnosing & Treating (87.1%), Health Technologists (84.0%), and Education Instruction & Library (82.7%).

| Occupation | Male | Female |
| Management | 267 (77.4%) | 78 (22.6%) |
| Business & Financial | 10 (33.3%) | 20 (66.7%) |
| Computers, Engineering & Science | 41 (82.0%) | 9 (18.0%) |
| Computers & Mathematics | 13 (100.0%) | 0 (0.0%) |
| Architecture & Engineering | 18 (100.0%) | 0 (0.0%) |
| Life, Physical & Social Science | 10 (52.6%) | 9 (47.4%) |
| Community & Social Service | 49 (26.6%) | 135 (73.4%) |
| Education, Arts & Media | 16 (61.5%) | 10 (38.5%) |
| Legal Services & Support | 6 (66.7%) | 3 (33.3%) |
| Education Instruction & Library | 24 (17.3%) | 115 (82.7%) |
| Arts, Media & Entertainment | 3 (30.0%) | 7 (70.0%) |
| Health Diagnosing & Treating | 19 (12.9%) | 128 (87.1%) |
| Health Technologists | 12 (16.0%) | 63 (84.0%) |
| Total (Category) | 386 (51.1%) | 370 (48.9%) |
| Total (Overall) | 937 (51.1%) | 896 (48.9%) |
Services Occupations
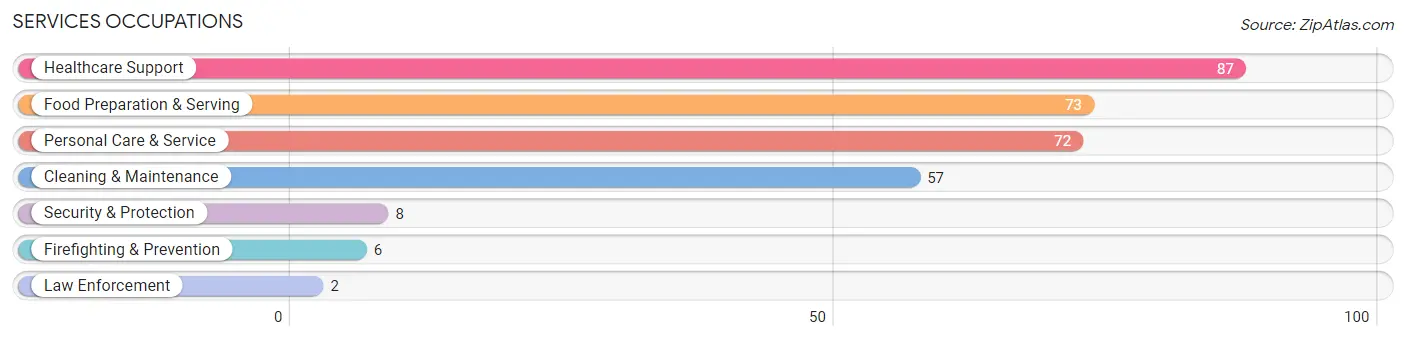
The most common Services occupations in Osborne County are Healthcare Support (87 | 4.8%), Food Preparation & Serving (73 | 4.0%), Personal Care & Service (72 | 3.9%), Cleaning & Maintenance (57 | 3.1%), and Security & Protection (8 | 0.4%).
Services Occupations by Sex
Within the Services occupations in Osborne County, the most male-oriented occupations are Law Enforcement (100.0%), Security & Protection (87.5%), and Cleaning & Maintenance (84.2%), while the most female-oriented occupations are Personal Care & Service (100.0%), Healthcare Support (85.1%), and Food Preparation & Serving (74.0%).
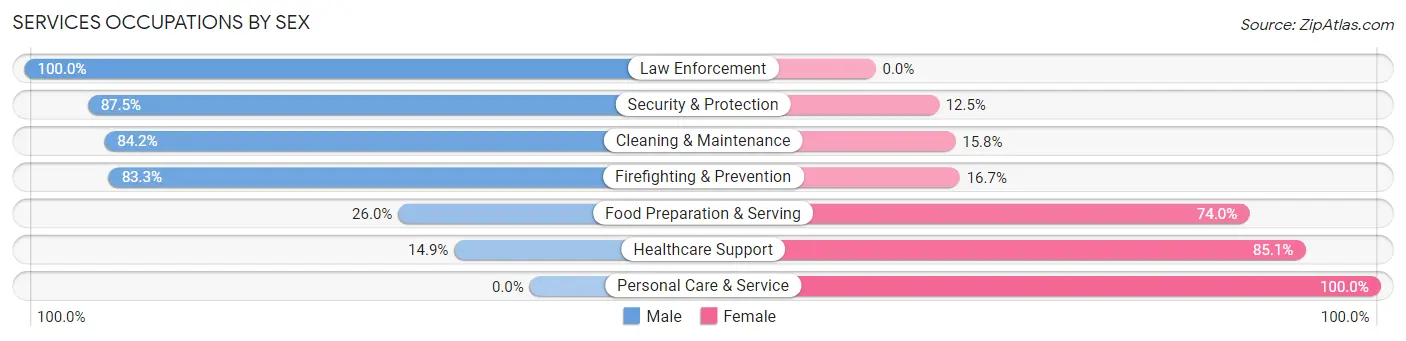
| Occupation | Male | Female |
| Healthcare Support | 13 (14.9%) | 74 (85.1%) |
| Security & Protection | 7 (87.5%) | 1 (12.5%) |
| Firefighting & Prevention | 5 (83.3%) | 1 (16.7%) |
| Law Enforcement | 2 (100.0%) | 0 (0.0%) |
| Food Preparation & Serving | 19 (26.0%) | 54 (74.0%) |
| Cleaning & Maintenance | 48 (84.2%) | 9 (15.8%) |
| Personal Care & Service | 0 (0.0%) | 72 (100.0%) |
| Total (Category) | 87 (29.3%) | 210 (70.7%) |
| Total (Overall) | 937 (51.1%) | 896 (48.9%) |
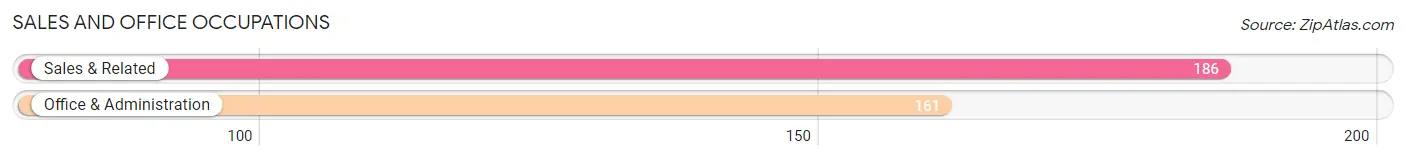
Sales and Office Occupations
The most common Sales and Office occupations in Osborne County are Sales & Related (186 | 10.2%), and Office & Administration (161 | 8.8%).
Sales and Office Occupations by Sex
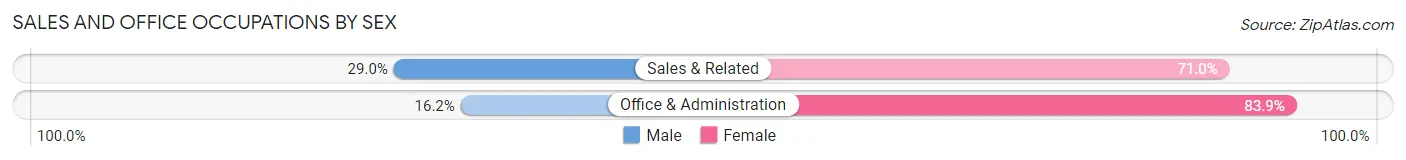
| Occupation | Male | Female |
| Sales & Related | 54 (29.0%) | 132 (71.0%) |
| Office & Administration | 26 (16.2%) | 135 (83.9%) |
| Total (Category) | 80 (23.1%) | 267 (76.9%) |
| Total (Overall) | 937 (51.1%) | 896 (48.9%) |
Natural Resources, Construction and Maintenance Occupations
The most common Natural Resources, Construction and Maintenance occupations in Osborne County are Construction & Extraction (84 | 4.6%), Installation, Maintenance & Repair (73 | 4.0%), and Farming, Fishing & Forestry (59 | 3.2%).
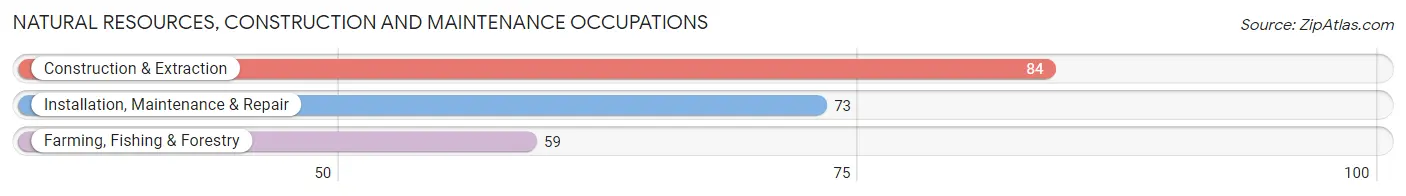
Natural Resources, Construction and Maintenance Occupations by Sex
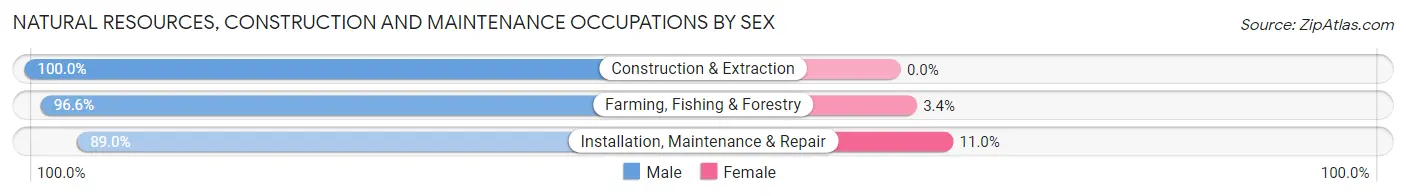
| Occupation | Male | Female |
| Farming, Fishing & Forestry | 57 (96.6%) | 2 (3.4%) |
| Construction & Extraction | 84 (100.0%) | 0 (0.0%) |
| Installation, Maintenance & Repair | 65 (89.0%) | 8 (11.0%) |
| Total (Category) | 206 (95.4%) | 10 (4.6%) |
| Total (Overall) | 937 (51.1%) | 896 (48.9%) |
Production, Transportation and Moving Occupations
The most common Production, Transportation and Moving occupations in Osborne County are Production (118 | 6.4%), Material Moving (53 | 2.9%), and Transportation (46 | 2.5%).
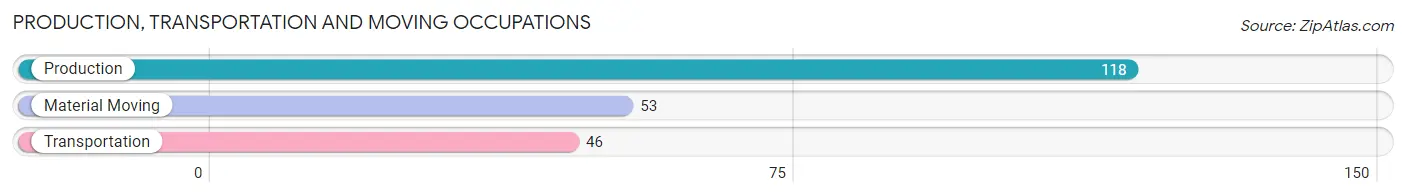
Production, Transportation and Moving Occupations by Sex
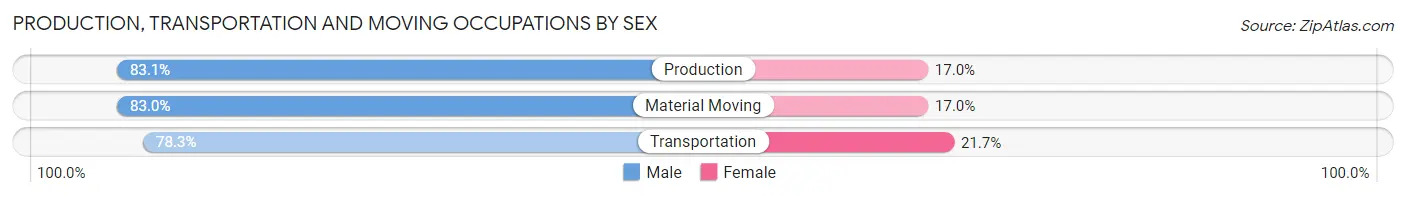
| Occupation | Male | Female |
| Production | 98 (83.1%) | 20 (17.0%) |
| Transportation | 36 (78.3%) | 10 (21.7%) |
| Material Moving | 44 (83.0%) | 9 (17.0%) |
| Total (Category) | 178 (82.0%) | 39 (18.0%) |
| Total (Overall) | 937 (51.1%) | 896 (48.9%) |
Employment Industries by Sex in Osborne County
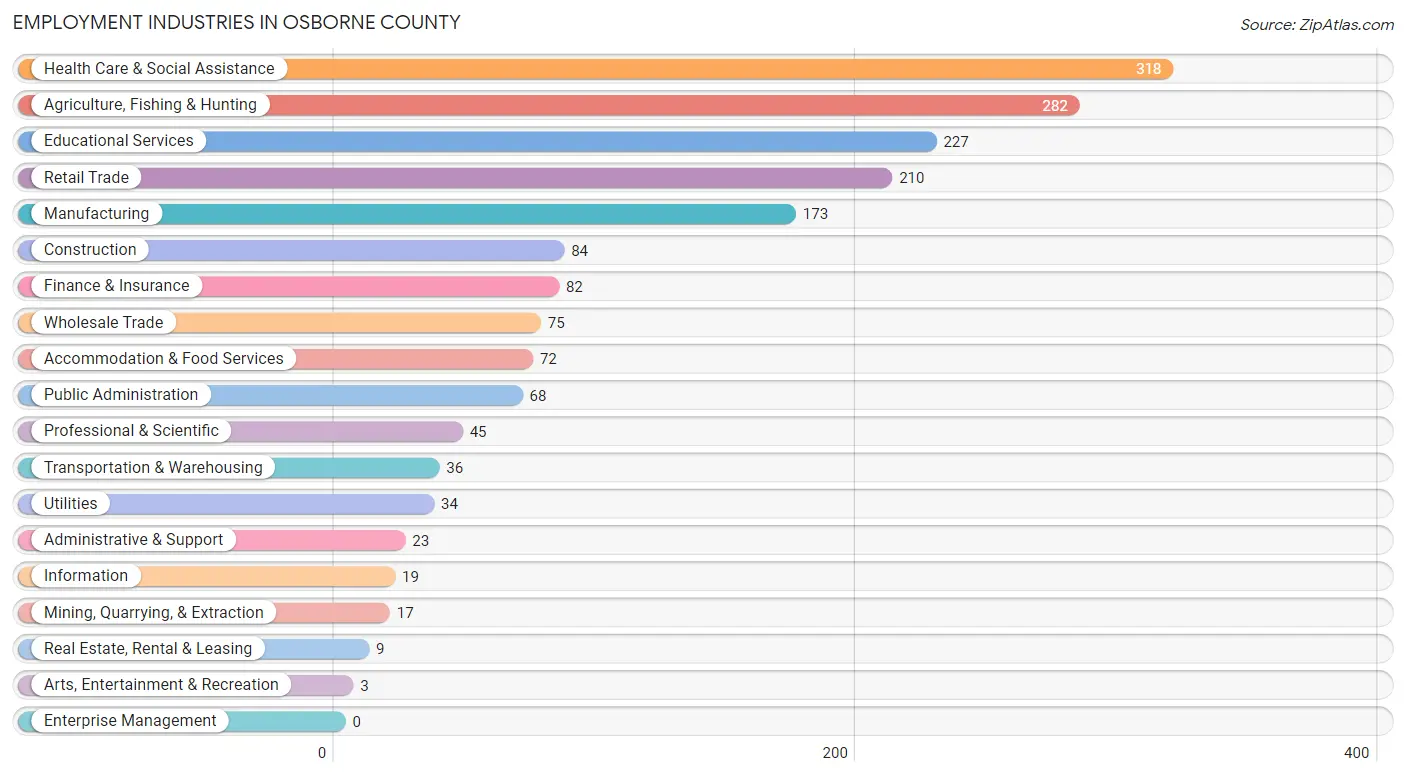
Employment Industries in Osborne County
The major employment industries in Osborne County include Health Care & Social Assistance (318 | 17.3%), Agriculture, Fishing & Hunting (282 | 15.4%), Educational Services (227 | 12.4%), Retail Trade (210 | 11.5%), and Manufacturing (173 | 9.4%).
Employment Industries by Sex in Osborne County
The Osborne County industries that see more men than women are Mining, Quarrying, & Extraction (100.0%), Real Estate, Rental & Leasing (100.0%), and Arts, Entertainment & Recreation (100.0%), whereas the industries that tend to have a higher number of women are Health Care & Social Assistance (91.2%), Finance & Insurance (81.7%), and Educational Services (80.6%).
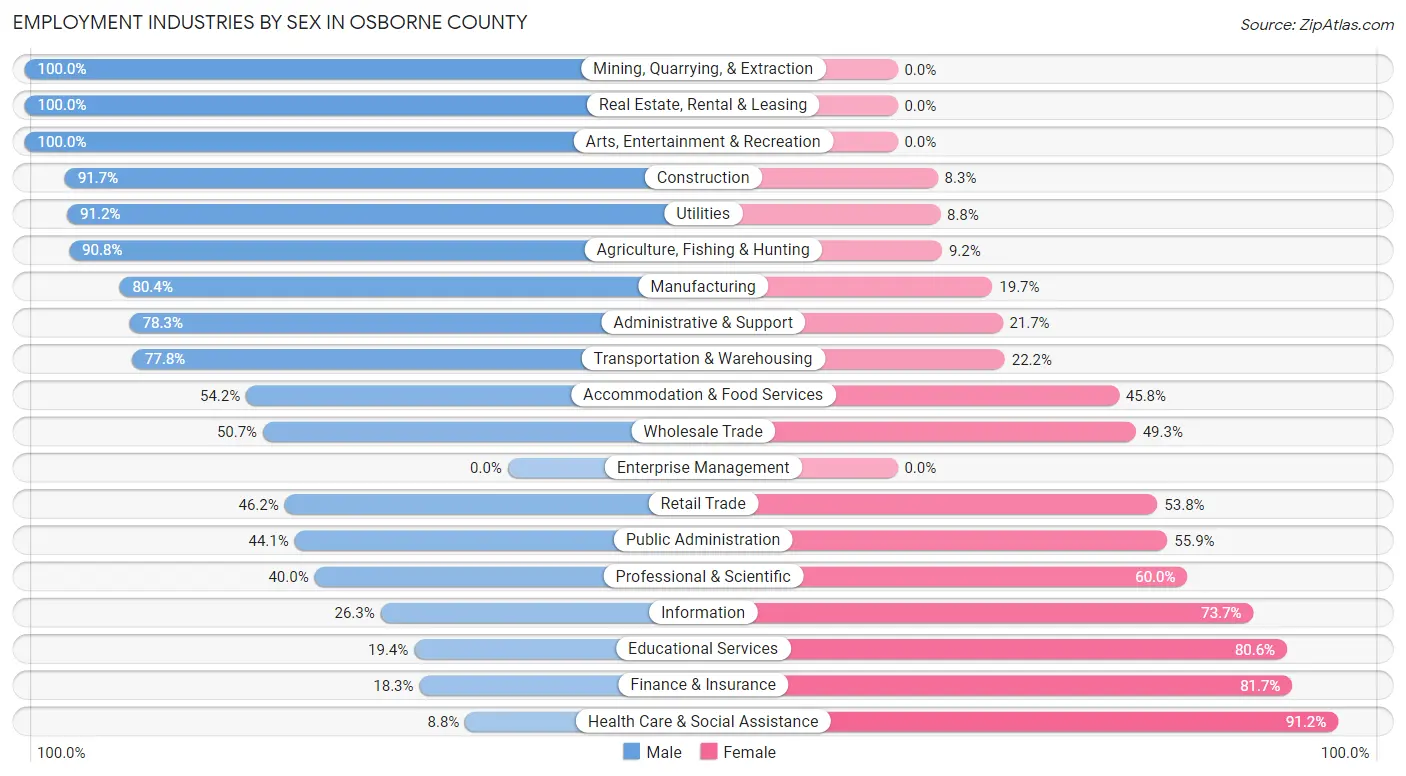
| Industry | Male | Female |
| Agriculture, Fishing & Hunting | 256 (90.8%) | 26 (9.2%) |
| Mining, Quarrying, & Extraction | 17 (100.0%) | 0 (0.0%) |
| Construction | 77 (91.7%) | 7 (8.3%) |
| Manufacturing | 139 (80.3%) | 34 (19.7%) |
| Wholesale Trade | 38 (50.7%) | 37 (49.3%) |
| Retail Trade | 97 (46.2%) | 113 (53.8%) |
| Transportation & Warehousing | 28 (77.8%) | 8 (22.2%) |
| Utilities | 31 (91.2%) | 3 (8.8%) |
| Information | 5 (26.3%) | 14 (73.7%) |
| Finance & Insurance | 15 (18.3%) | 67 (81.7%) |
| Real Estate, Rental & Leasing | 9 (100.0%) | 0 (0.0%) |
| Professional & Scientific | 18 (40.0%) | 27 (60.0%) |
| Enterprise Management | 0 (0.0%) | 0 (0.0%) |
| Administrative & Support | 18 (78.3%) | 5 (21.7%) |
| Educational Services | 44 (19.4%) | 183 (80.6%) |
| Health Care & Social Assistance | 28 (8.8%) | 290 (91.2%) |
| Arts, Entertainment & Recreation | 3 (100.0%) | 0 (0.0%) |
| Accommodation & Food Services | 39 (54.2%) | 33 (45.8%) |
| Public Administration | 30 (44.1%) | 38 (55.9%) |
| Total | 937 (51.1%) | 896 (48.9%) |
Education in Osborne County
School Enrollment in Osborne County
The most common levels of schooling among the 670 students in Osborne County are middle school (191 | 28.5%), high school (151 | 22.5%), and elementary school (130 | 19.4%).
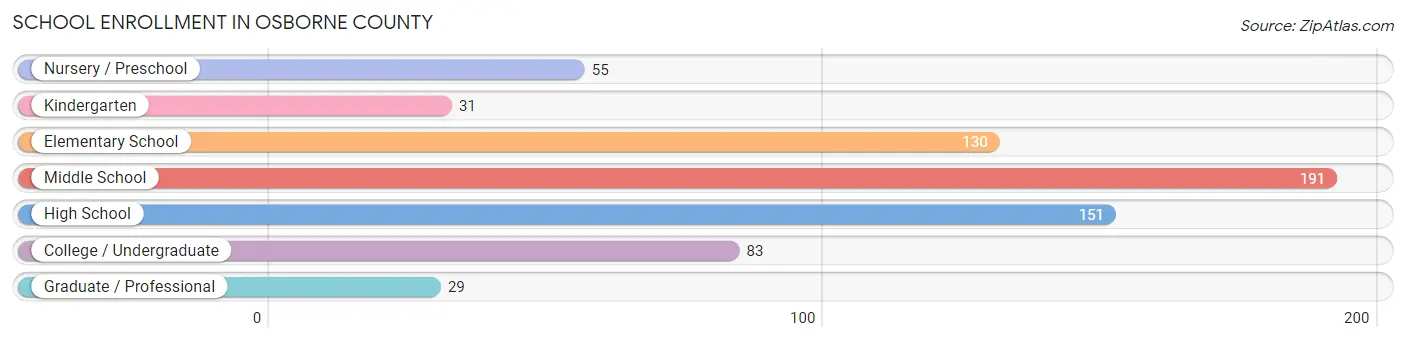
| School Level | # Students | % Students |
| Nursery / Preschool | 55 | 8.2% |
| Kindergarten | 31 | 4.6% |
| Elementary School | 130 | 19.4% |
| Middle School | 191 | 28.5% |
| High School | 151 | 22.5% |
| College / Undergraduate | 83 | 12.4% |
| Graduate / Professional | 29 | 4.3% |
| Total | 670 | 100.0% |
School Enrollment by Age by Funding Source in Osborne County
Out of a total of 670 students who are enrolled in schools in Osborne County, 25 (3.7%) attend a private institution, while the remaining 645 (96.3%) are enrolled in public schools. The age group of 35 years and over has the highest likelihood of being enrolled in private schools, with 4 (11.8% in the age bracket) enrolled. Conversely, the age group of 3 to 4 year olds has the lowest likelihood of being enrolled in a private school, with 32 (100.0% in the age bracket) attending a public institution.

| Age Bracket | Public School | Private School |
| 3 to 4 Year Olds | 32 (100.0%) | 0 (0.0%) |
| 5 to 9 Year Old | 152 (95.6%) | 7 (4.4%) |
| 10 to 14 Year Olds | 236 (95.6%) | 11 (4.4%) |
| 15 to 17 Year Olds | 113 (99.1%) | 1 (0.9%) |
| 18 to 19 Year Olds | 30 (93.8%) | 2 (6.2%) |
| 20 to 24 Year Olds | 22 (100.0%) | 0 (0.0%) |
| 25 to 34 Year Olds | 30 (100.0%) | 0 (0.0%) |
| 35 Years and over | 30 (88.2%) | 4 (11.8%) |
| Total | 645 (96.3%) | 25 (3.7%) |
Educational Attainment by Field of Study in Osborne County
Education (193 | 30.9%), bio, nature & agricultural (96 | 15.4%), science & technology (66 | 10.6%), business (65 | 10.4%), and arts & humanities (48 | 7.7%) are the most common fields of study among 624 individuals in Osborne County who have obtained a bachelor's degree or higher.
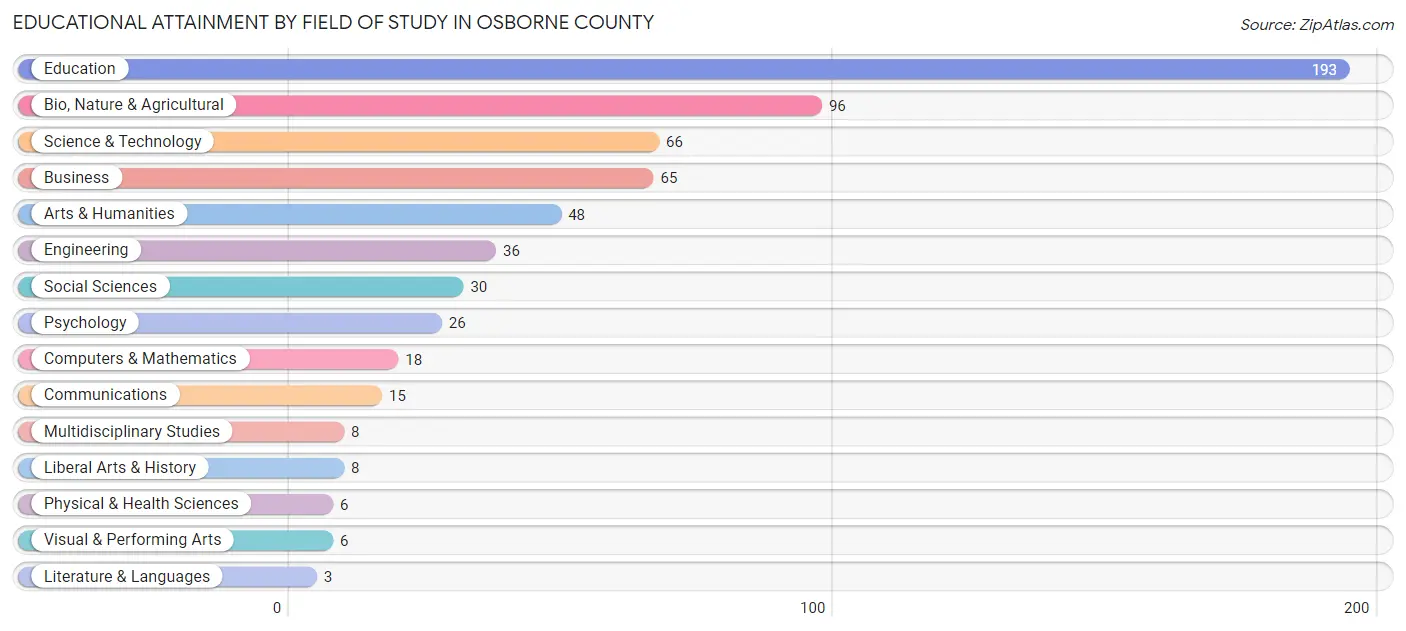
| Field of Study | # Graduates | % Graduates |
| Computers & Mathematics | 18 | 2.9% |
| Bio, Nature & Agricultural | 96 | 15.4% |
| Physical & Health Sciences | 6 | 1.0% |
| Psychology | 26 | 4.2% |
| Social Sciences | 30 | 4.8% |
| Engineering | 36 | 5.8% |
| Multidisciplinary Studies | 8 | 1.3% |
| Science & Technology | 66 | 10.6% |
| Business | 65 | 10.4% |
| Education | 193 | 30.9% |
| Literature & Languages | 3 | 0.5% |
| Liberal Arts & History | 8 | 1.3% |
| Visual & Performing Arts | 6 | 1.0% |
| Communications | 15 | 2.4% |
| Arts & Humanities | 48 | 7.7% |
| Total | 624 | 100.0% |
Transportation & Commute in Osborne County
Vehicle Availability by Sex in Osborne County
The most prevalent vehicle ownership categories in Osborne County are males with 2 vehicles (370, accounting for 39.7%) and females with 2 vehicles (282, making up 42.1%).
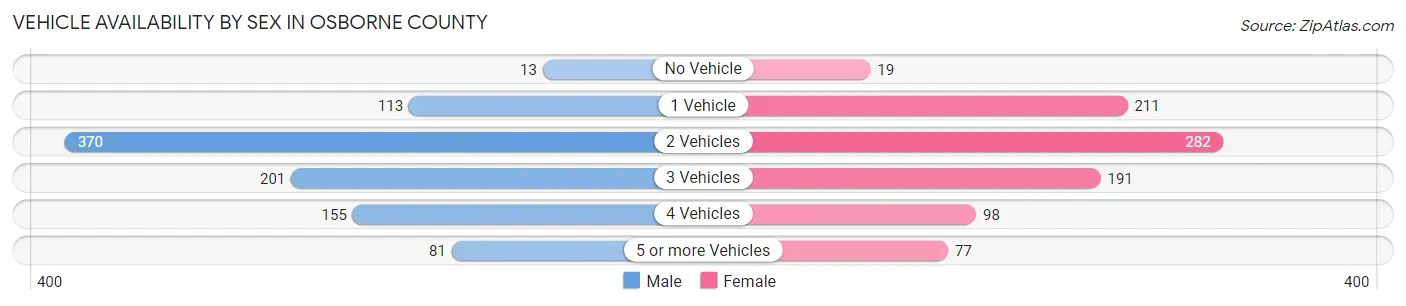
| Vehicles Available | Male | Female |
| No Vehicle | 13 (1.4%) | 19 (2.2%) |
| 1 Vehicle | 113 (12.1%) | 211 (24.0%) |
| 2 Vehicles | 370 (39.7%) | 282 (32.1%) |
| 3 Vehicles | 201 (21.5%) | 191 (21.7%) |
| 4 Vehicles | 155 (16.6%) | 98 (11.2%) |
| 5 or more Vehicles | 81 (8.7%) | 77 (8.8%) |
| Total | 933 (100.0%) | 878 (100.0%) |
Commute Time in Osborne County
The most frequently occuring commute durations in Osborne County are 5 to 9 minutes (686 commuters, 39.9%), less than 5 minutes (364 commuters, 21.2%), and 10 to 14 minutes (160 commuters, 9.3%).
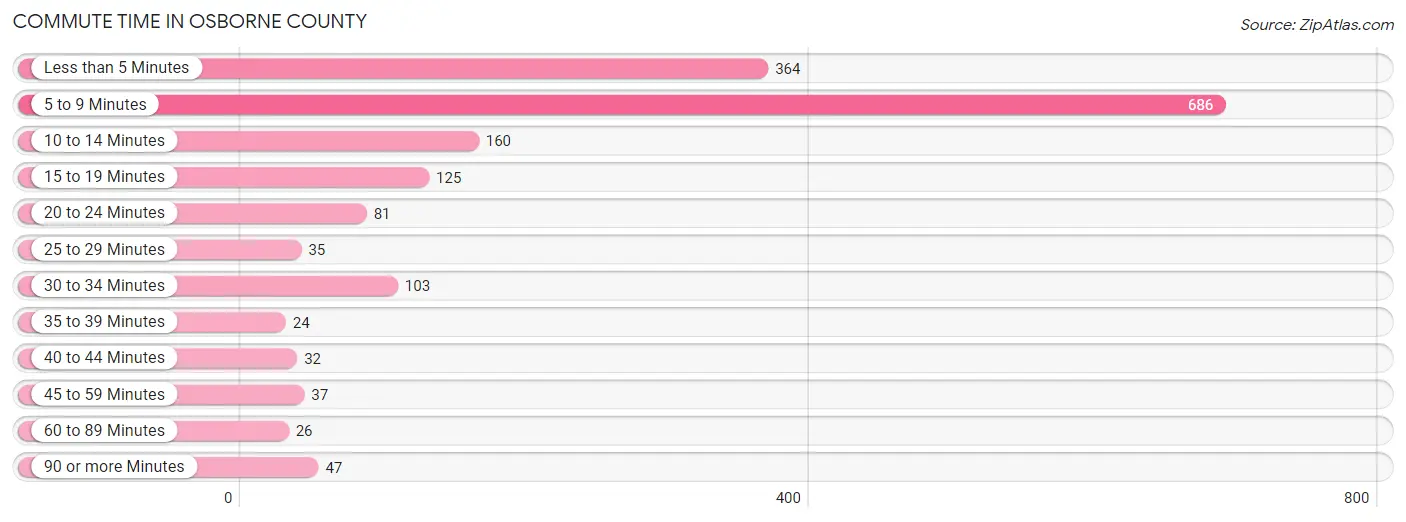
| Commute Time | # Commuters | % Commuters |
| Less than 5 Minutes | 364 | 21.2% |
| 5 to 9 Minutes | 686 | 39.9% |
| 10 to 14 Minutes | 160 | 9.3% |
| 15 to 19 Minutes | 125 | 7.3% |
| 20 to 24 Minutes | 81 | 4.7% |
| 25 to 29 Minutes | 35 | 2.0% |
| 30 to 34 Minutes | 103 | 6.0% |
| 35 to 39 Minutes | 24 | 1.4% |
| 40 to 44 Minutes | 32 | 1.9% |
| 45 to 59 Minutes | 37 | 2.1% |
| 60 to 89 Minutes | 26 | 1.5% |
| 90 or more Minutes | 47 | 2.7% |
Commute Time by Sex in Osborne County
The most common commute times in Osborne County are 5 to 9 minutes (346 commuters, 38.2%) for males and 5 to 9 minutes (340 commuters, 41.8%) for females.
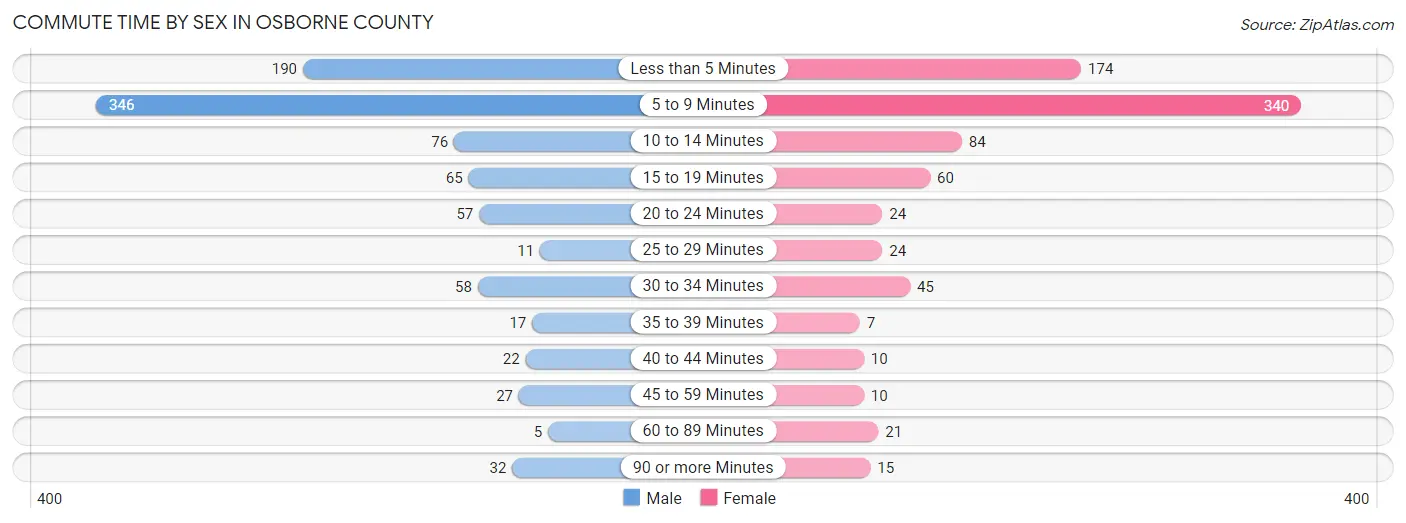
| Commute Time | Male | Female |
| Less than 5 Minutes | 190 (21.0%) | 174 (21.4%) |
| 5 to 9 Minutes | 346 (38.2%) | 340 (41.8%) |
| 10 to 14 Minutes | 76 (8.4%) | 84 (10.3%) |
| 15 to 19 Minutes | 65 (7.2%) | 60 (7.4%) |
| 20 to 24 Minutes | 57 (6.3%) | 24 (2.9%) |
| 25 to 29 Minutes | 11 (1.2%) | 24 (2.9%) |
| 30 to 34 Minutes | 58 (6.4%) | 45 (5.5%) |
| 35 to 39 Minutes | 17 (1.9%) | 7 (0.9%) |
| 40 to 44 Minutes | 22 (2.4%) | 10 (1.2%) |
| 45 to 59 Minutes | 27 (3.0%) | 10 (1.2%) |
| 60 to 89 Minutes | 5 (0.5%) | 21 (2.6%) |
| 90 or more Minutes | 32 (3.5%) | 15 (1.8%) |
Time of Departure to Work by Sex in Osborne County
The most frequent times of departure to work in Osborne County are 7:30 AM to 7:59 AM (209, 23.1%) for males and 7:30 AM to 7:59 AM (242, 29.7%) for females.
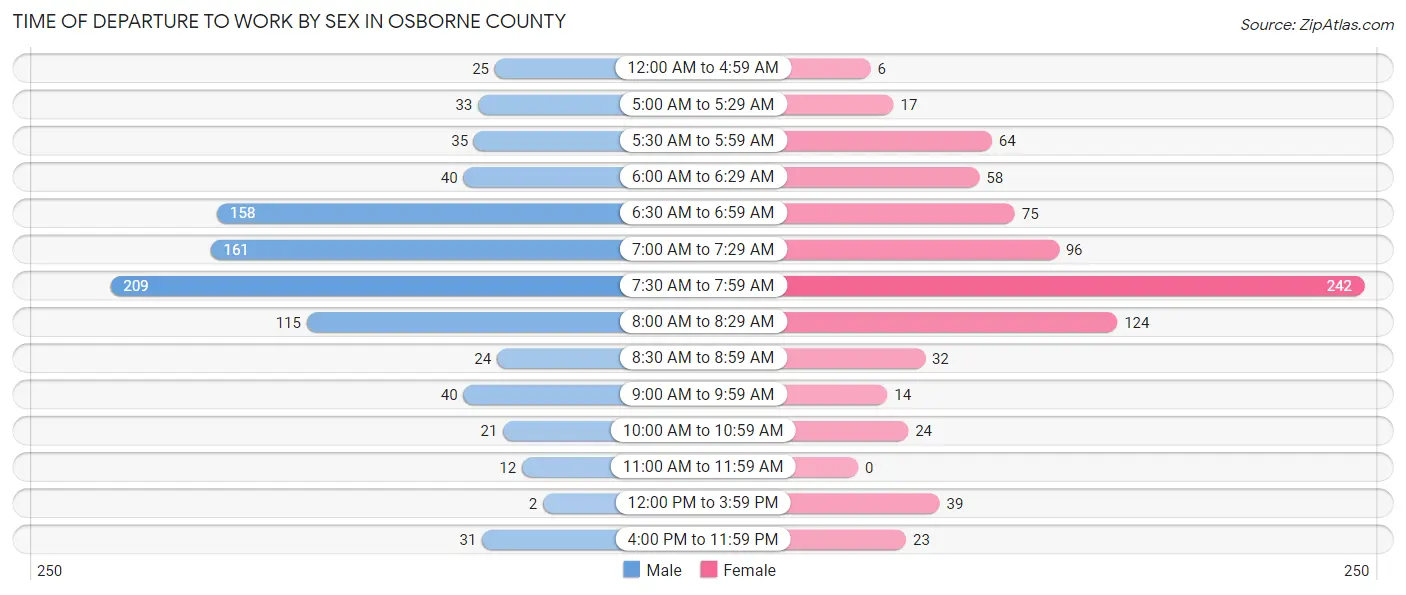
| Time of Departure | Male | Female |
| 12:00 AM to 4:59 AM | 25 (2.8%) | 6 (0.7%) |
| 5:00 AM to 5:29 AM | 33 (3.6%) | 17 (2.1%) |
| 5:30 AM to 5:59 AM | 35 (3.9%) | 64 (7.9%) |
| 6:00 AM to 6:29 AM | 40 (4.4%) | 58 (7.1%) |
| 6:30 AM to 6:59 AM | 158 (17.4%) | 75 (9.2%) |
| 7:00 AM to 7:29 AM | 161 (17.8%) | 96 (11.8%) |
| 7:30 AM to 7:59 AM | 209 (23.1%) | 242 (29.7%) |
| 8:00 AM to 8:29 AM | 115 (12.7%) | 124 (15.2%) |
| 8:30 AM to 8:59 AM | 24 (2.6%) | 32 (3.9%) |
| 9:00 AM to 9:59 AM | 40 (4.4%) | 14 (1.7%) |
| 10:00 AM to 10:59 AM | 21 (2.3%) | 24 (2.9%) |
| 11:00 AM to 11:59 AM | 12 (1.3%) | 0 (0.0%) |
| 12:00 PM to 3:59 PM | 2 (0.2%) | 39 (4.8%) |
| 4:00 PM to 11:59 PM | 31 (3.4%) | 23 (2.8%) |
| Total | 906 (100.0%) | 814 (100.0%) |
Housing Occupancy in Osborne County
Occupancy by Ownership in Osborne County
Of the total 1,604 dwellings in Osborne County, owner-occupied units account for 1,216 (75.8%), while renter-occupied units make up 388 (24.2%).
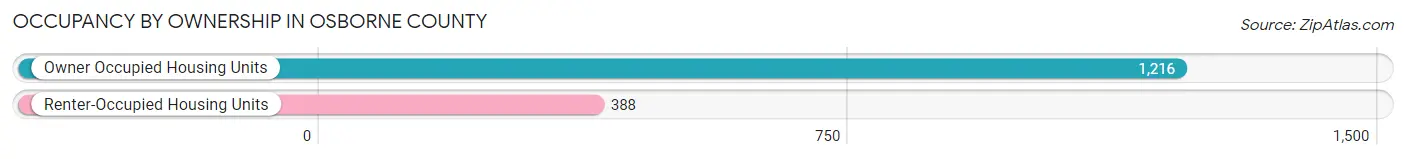
| Occupancy | # Housing Units | % Housing Units |
| Owner Occupied Housing Units | 1,216 | 75.8% |
| Renter-Occupied Housing Units | 388 | 24.2% |
| Total Occupied Housing Units | 1,604 | 100.0% |
Occupancy by Household Size in Osborne County
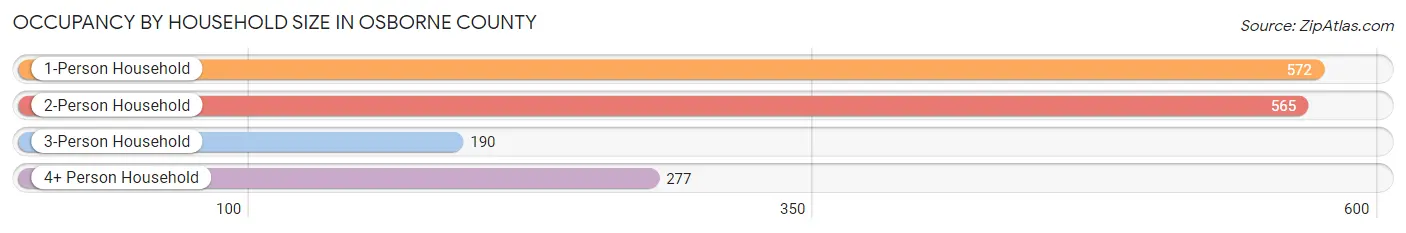
| Household Size | # Housing Units | % Housing Units |
| 1-Person Household | 572 | 35.7% |
| 2-Person Household | 565 | 35.2% |
| 3-Person Household | 190 | 11.8% |
| 4+ Person Household | 277 | 17.3% |
| Total Housing Units | 1,604 | 100.0% |
Occupancy by Ownership by Household Size in Osborne County
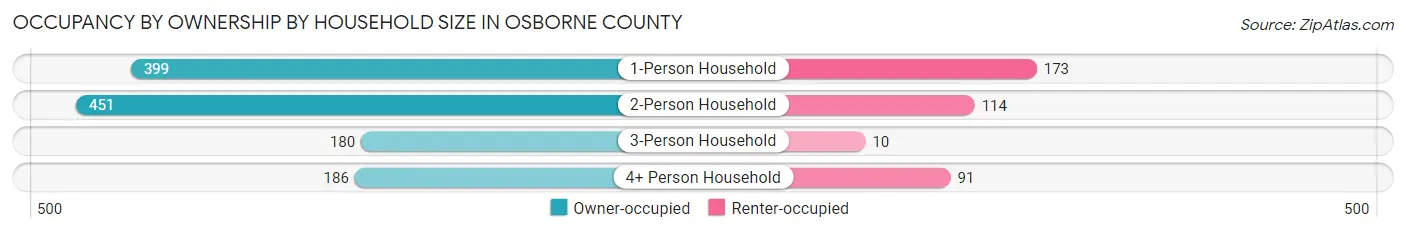
| Household Size | Owner-occupied | Renter-occupied |
| 1-Person Household | 399 (69.8%) | 173 (30.2%) |
| 2-Person Household | 451 (79.8%) | 114 (20.2%) |
| 3-Person Household | 180 (94.7%) | 10 (5.3%) |
| 4+ Person Household | 186 (67.1%) | 91 (32.9%) |
| Total Housing Units | 1,216 (75.8%) | 388 (24.2%) |
Occupancy by Educational Attainment in Osborne County
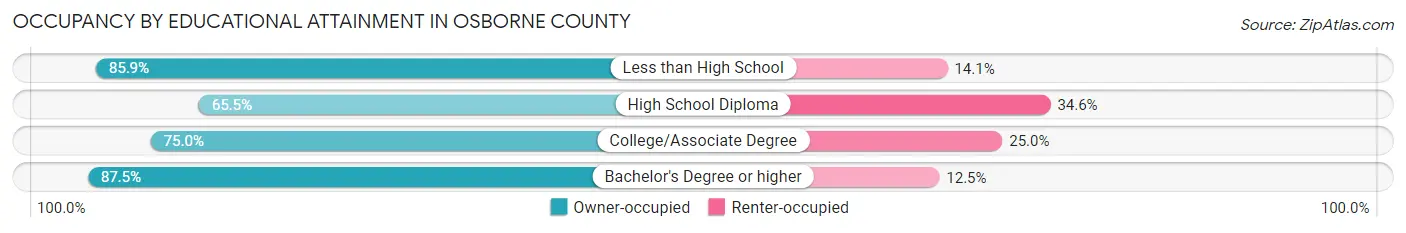
| Household Size | Owner-occupied | Renter-occupied |
| Less than High School | 85 (85.9%) | 14 (14.1%) |
| High School Diploma | 305 (65.4%) | 161 (34.5%) |
| College/Associate Degree | 498 (75.0%) | 166 (25.0%) |
| Bachelor's Degree or higher | 328 (87.5%) | 47 (12.5%) |
Occupancy by Age of Householder in Osborne County
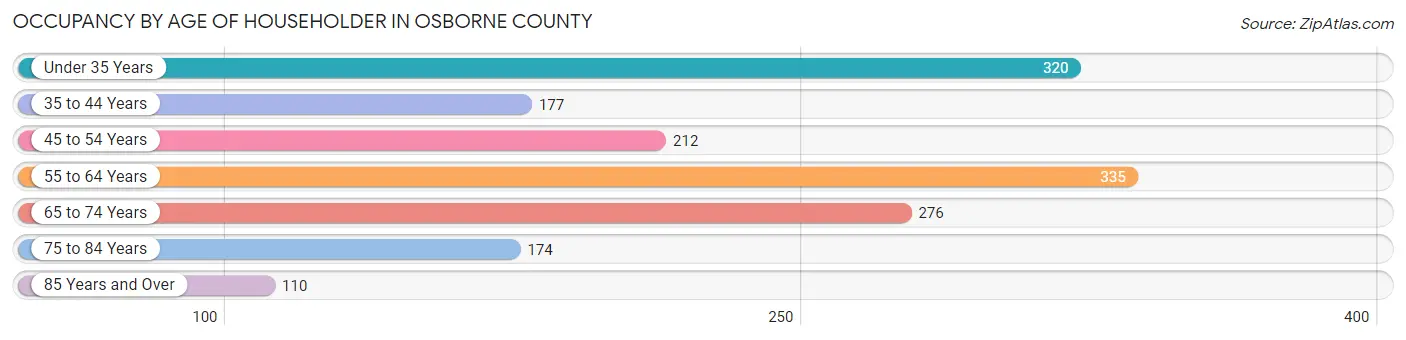
| Age Bracket | # Households | % Households |
| Under 35 Years | 320 | 20.0% |
| 35 to 44 Years | 177 | 11.0% |
| 45 to 54 Years | 212 | 13.2% |
| 55 to 64 Years | 335 | 20.9% |
| 65 to 74 Years | 276 | 17.2% |
| 75 to 84 Years | 174 | 10.8% |
| 85 Years and Over | 110 | 6.9% |
| Total | 1,604 | 100.0% |
Housing Finances in Osborne County
Median Income by Occupancy in Osborne County

| Occupancy Type | # Households | Median Income |
| Owner-Occupied | 1,216 (75.8%) | $70,000 |
| Renter-Occupied | 388 (24.2%) | $30,729 |
| Average | 1,604 (100.0%) | $58,750 |
Occupancy by Householder Income Bracket in Osborne County
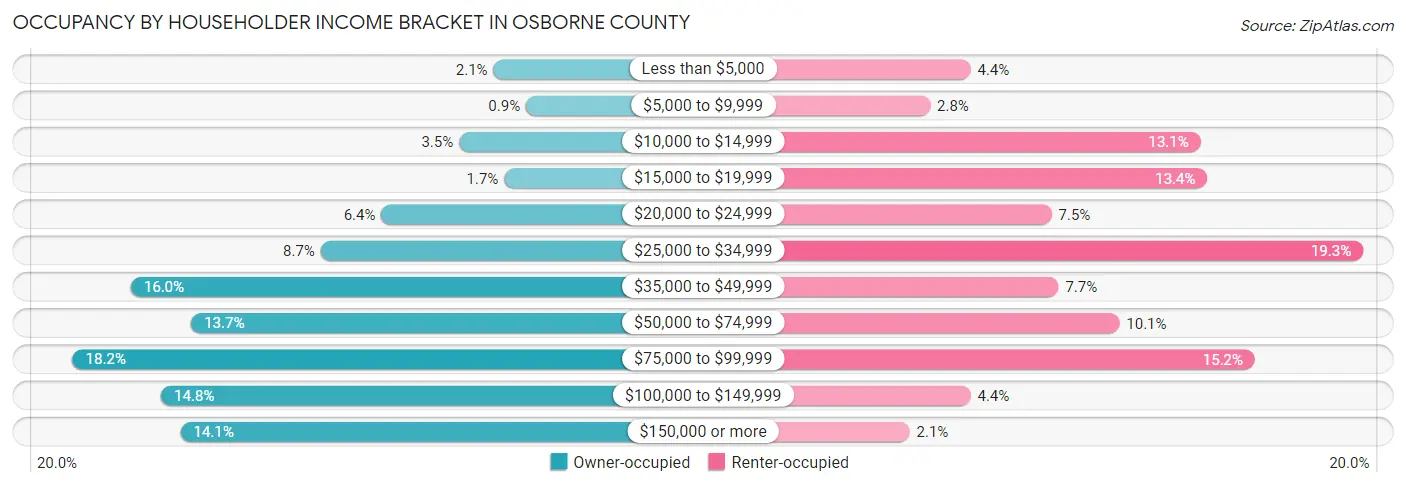
| Income Bracket | Owner-occupied | Renter-occupied |
| Less than $5,000 | 26 (2.1%) | 17 (4.4%) |
| $5,000 to $9,999 | 11 (0.9%) | 11 (2.8%) |
| $10,000 to $14,999 | 42 (3.5%) | 51 (13.1%) |
| $15,000 to $19,999 | 21 (1.7%) | 52 (13.4%) |
| $20,000 to $24,999 | 78 (6.4%) | 29 (7.5%) |
| $25,000 to $34,999 | 106 (8.7%) | 75 (19.3%) |
| $35,000 to $49,999 | 194 (16.0%) | 30 (7.7%) |
| $50,000 to $74,999 | 166 (13.7%) | 39 (10.1%) |
| $75,000 to $99,999 | 221 (18.2%) | 59 (15.2%) |
| $100,000 to $149,999 | 180 (14.8%) | 17 (4.4%) |
| $150,000 or more | 171 (14.1%) | 8 (2.1%) |
| Total | 1,216 (100.0%) | 388 (100.0%) |
Monthly Housing Cost Tiers in Osborne County
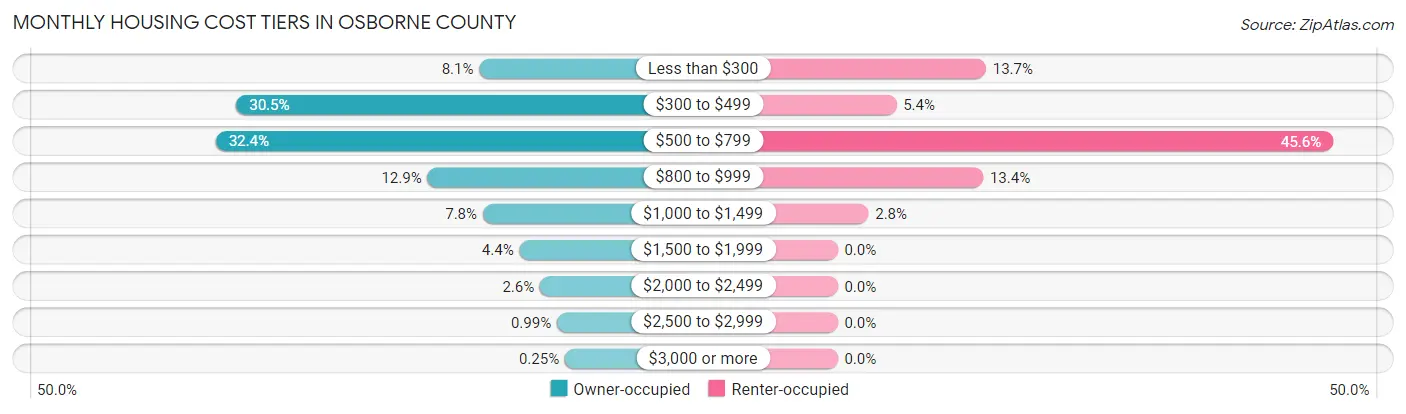
| Monthly Cost | Owner-occupied | Renter-occupied |
| Less than $300 | 99 (8.1%) | 53 (13.7%) |
| $300 to $499 | 371 (30.5%) | 21 (5.4%) |
| $500 to $799 | 394 (32.4%) | 177 (45.6%) |
| $800 to $999 | 157 (12.9%) | 52 (13.4%) |
| $1,000 to $1,499 | 95 (7.8%) | 11 (2.8%) |
| $1,500 to $1,999 | 54 (4.4%) | 0 (0.0%) |
| $2,000 to $2,499 | 31 (2.5%) | 0 (0.0%) |
| $2,500 to $2,999 | 12 (1.0%) | 0 (0.0%) |
| $3,000 or more | 3 (0.3%) | 0 (0.0%) |
| Total | 1,216 (100.0%) | 388 (100.0%) |
Physical Housing Characteristics in Osborne County
Housing Structures in Osborne County
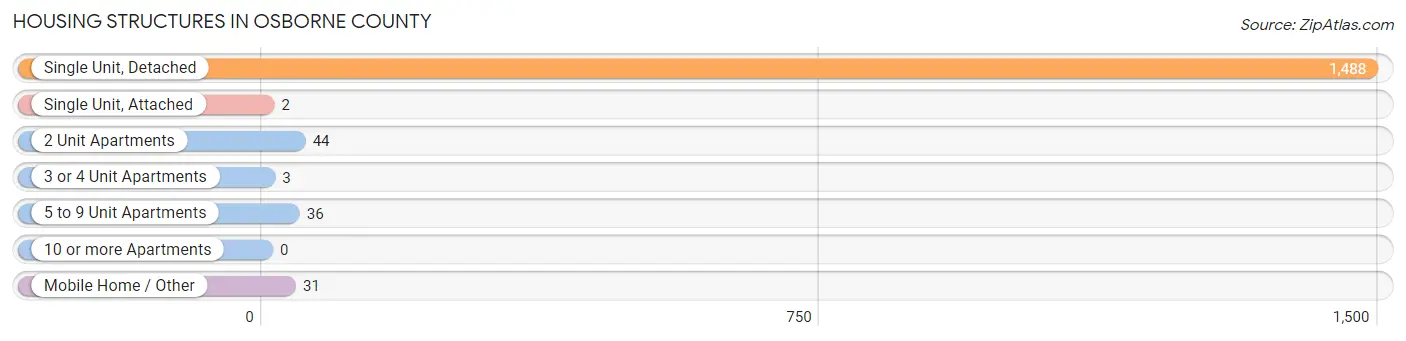
| Structure Type | # Housing Units | % Housing Units |
| Single Unit, Detached | 1,488 | 92.8% |
| Single Unit, Attached | 2 | 0.1% |
| 2 Unit Apartments | 44 | 2.7% |
| 3 or 4 Unit Apartments | 3 | 0.2% |
| 5 to 9 Unit Apartments | 36 | 2.2% |
| 10 or more Apartments | 0 | 0.0% |
| Mobile Home / Other | 31 | 1.9% |
| Total | 1,604 | 100.0% |
Housing Structures by Occupancy in Osborne County
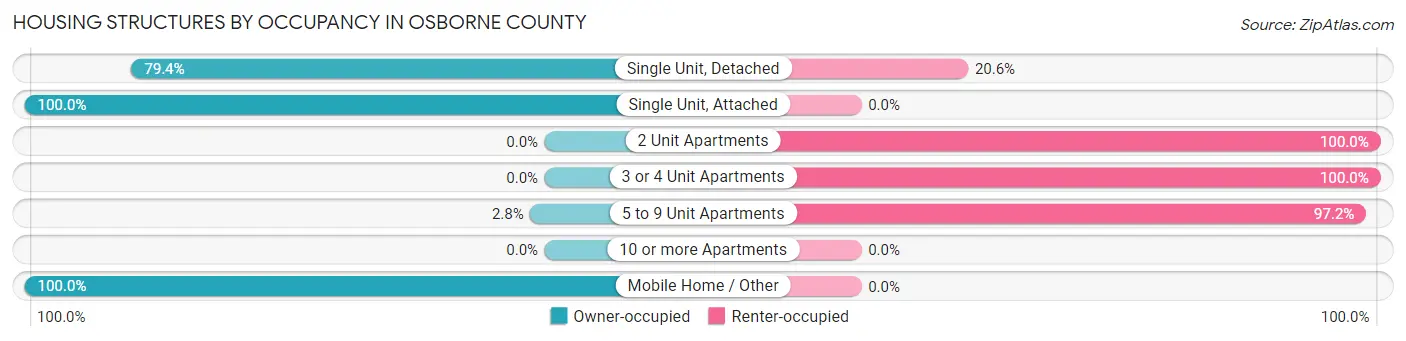
| Structure Type | Owner-occupied | Renter-occupied |
| Single Unit, Detached | 1,182 (79.4%) | 306 (20.6%) |
| Single Unit, Attached | 2 (100.0%) | 0 (0.0%) |
| 2 Unit Apartments | 0 (0.0%) | 44 (100.0%) |
| 3 or 4 Unit Apartments | 0 (0.0%) | 3 (100.0%) |
| 5 to 9 Unit Apartments | 1 (2.8%) | 35 (97.2%) |
| 10 or more Apartments | 0 (0.0%) | 0 (0.0%) |
| Mobile Home / Other | 31 (100.0%) | 0 (0.0%) |
| Total | 1,216 (75.8%) | 388 (24.2%) |
Housing Structures by Number of Rooms in Osborne County
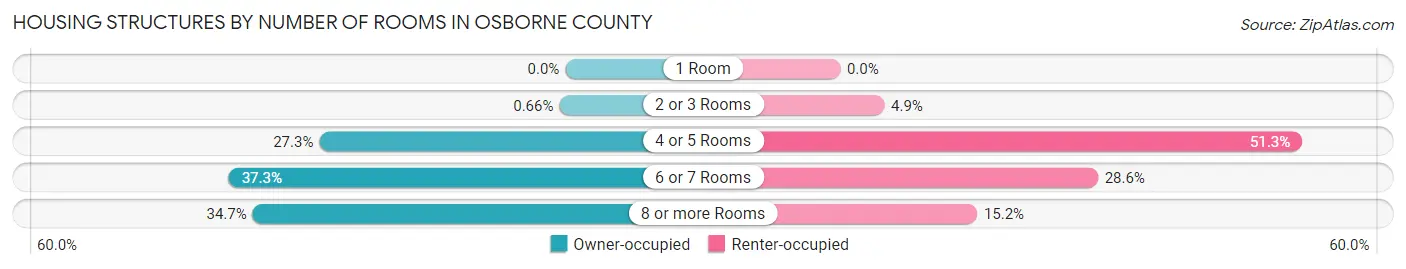
| Number of Rooms | Owner-occupied | Renter-occupied |
| 1 Room | 0 (0.0%) | 0 (0.0%) |
| 2 or 3 Rooms | 8 (0.7%) | 19 (4.9%) |
| 4 or 5 Rooms | 332 (27.3%) | 199 (51.3%) |
| 6 or 7 Rooms | 454 (37.3%) | 111 (28.6%) |
| 8 or more Rooms | 422 (34.7%) | 59 (15.2%) |
| Total | 1,216 (100.0%) | 388 (100.0%) |
Housing Structure by Heating Type in Osborne County
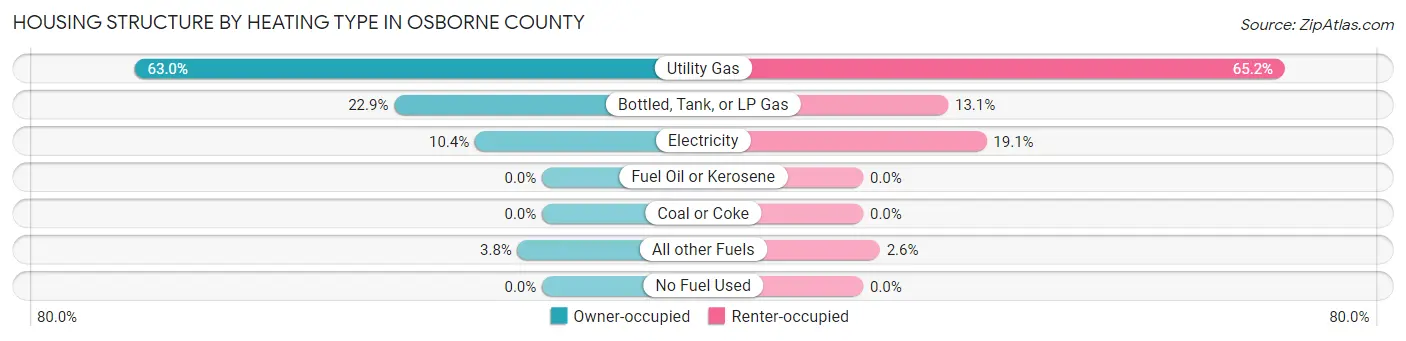
| Heating Type | Owner-occupied | Renter-occupied |
| Utility Gas | 766 (63.0%) | 253 (65.2%) |
| Bottled, Tank, or LP Gas | 278 (22.9%) | 51 (13.1%) |
| Electricity | 126 (10.4%) | 74 (19.1%) |
| Fuel Oil or Kerosene | 0 (0.0%) | 0 (0.0%) |
| Coal or Coke | 0 (0.0%) | 0 (0.0%) |
| All other Fuels | 46 (3.8%) | 10 (2.6%) |
| No Fuel Used | 0 (0.0%) | 0 (0.0%) |
| Total | 1,216 (100.0%) | 388 (100.0%) |
Household Vehicle Usage in Osborne County
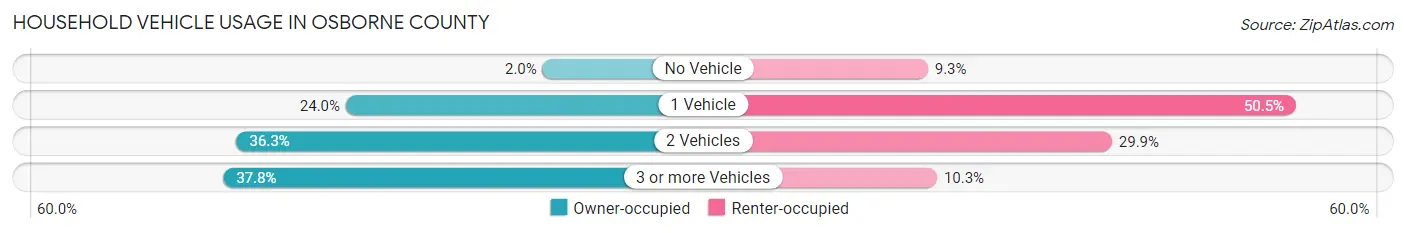
| Vehicles per Household | Owner-occupied | Renter-occupied |
| No Vehicle | 24 (2.0%) | 36 (9.3%) |
| 1 Vehicle | 292 (24.0%) | 196 (50.5%) |
| 2 Vehicles | 441 (36.3%) | 116 (29.9%) |
| 3 or more Vehicles | 459 (37.8%) | 40 (10.3%) |
| Total | 1,216 (100.0%) | 388 (100.0%) |
Real Estate & Mortgages in Osborne County
Real Estate and Mortgage Overview in Osborne County
| Characteristic | Without Mortgage | With Mortgage |
| Housing Units | 791 | 425 |
| Median Property Value | $75,800 | $86,500 |
| Median Household Income | $55,341 | $87 |
| Monthly Housing Costs | $473 | $0 |
| Real Estate Taxes | $1,344 | $1 |
Property Value by Mortgage Status in Osborne County
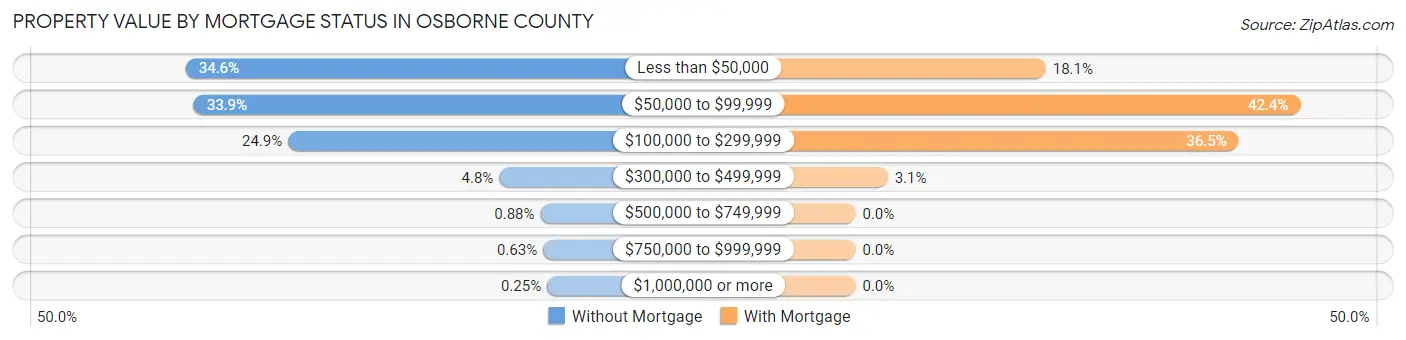
| Property Value | Without Mortgage | With Mortgage |
| Less than $50,000 | 274 (34.6%) | 77 (18.1%) |
| $50,000 to $99,999 | 268 (33.9%) | 180 (42.3%) |
| $100,000 to $299,999 | 197 (24.9%) | 155 (36.5%) |
| $300,000 to $499,999 | 38 (4.8%) | 13 (3.1%) |
| $500,000 to $749,999 | 7 (0.9%) | 0 (0.0%) |
| $750,000 to $999,999 | 5 (0.6%) | 0 (0.0%) |
| $1,000,000 or more | 2 (0.3%) | 0 (0.0%) |
| Total | 791 (100.0%) | 425 (100.0%) |
Household Income by Mortgage Status in Osborne County
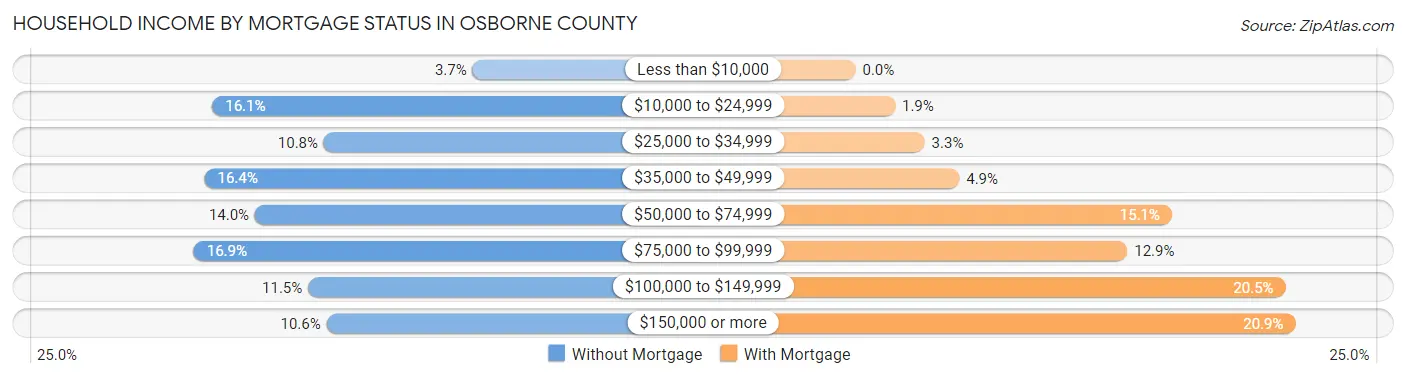
| Household Income | Without Mortgage | With Mortgage |
| Less than $10,000 | 29 (3.7%) | 0 (0.0%) |
| $10,000 to $24,999 | 127 (16.1%) | 8 (1.9%) |
| $25,000 to $34,999 | 85 (10.7%) | 14 (3.3%) |
| $35,000 to $49,999 | 130 (16.4%) | 21 (4.9%) |
| $50,000 to $74,999 | 111 (14.0%) | 64 (15.1%) |
| $75,000 to $99,999 | 134 (16.9%) | 55 (12.9%) |
| $100,000 to $149,999 | 91 (11.5%) | 87 (20.5%) |
| $150,000 or more | 84 (10.6%) | 89 (20.9%) |
| Total | 791 (100.0%) | 425 (100.0%) |
Property Value to Household Income Ratio in Osborne County
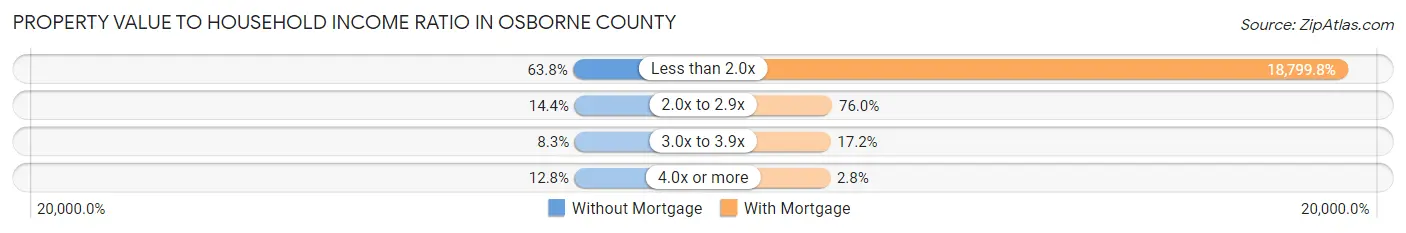
| Value-to-Income Ratio | Without Mortgage | With Mortgage |
| Less than 2.0x | 505 (63.8%) | 79,899 (18,799.8%) |
| 2.0x to 2.9x | 114 (14.4%) | 323 (76.0%) |
| 3.0x to 3.9x | 66 (8.3%) | 73 (17.2%) |
| 4.0x or more | 101 (12.8%) | 12 (2.8%) |
| Total | 791 (100.0%) | 425 (100.0%) |
Real Estate Taxes by Mortgage Status in Osborne County
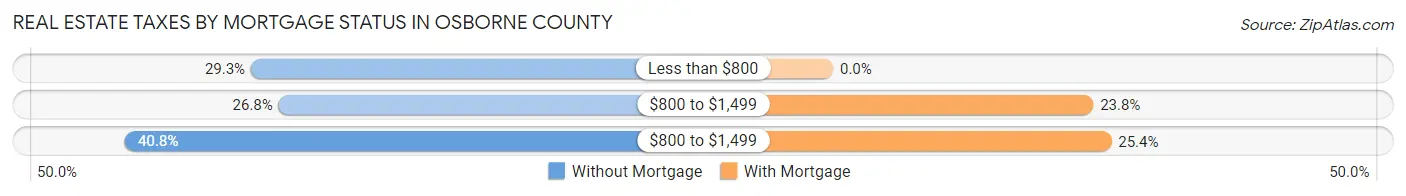
| Property Taxes | Without Mortgage | With Mortgage |
| Less than $800 | 232 (29.3%) | 0 (0.0%) |
| $800 to $1,499 | 212 (26.8%) | 101 (23.8%) |
| $800 to $1,499 | 323 (40.8%) | 108 (25.4%) |
| Total | 791 (100.0%) | 425 (100.0%) |
Health & Disability in Osborne County
Health Insurance Coverage by Age in Osborne County
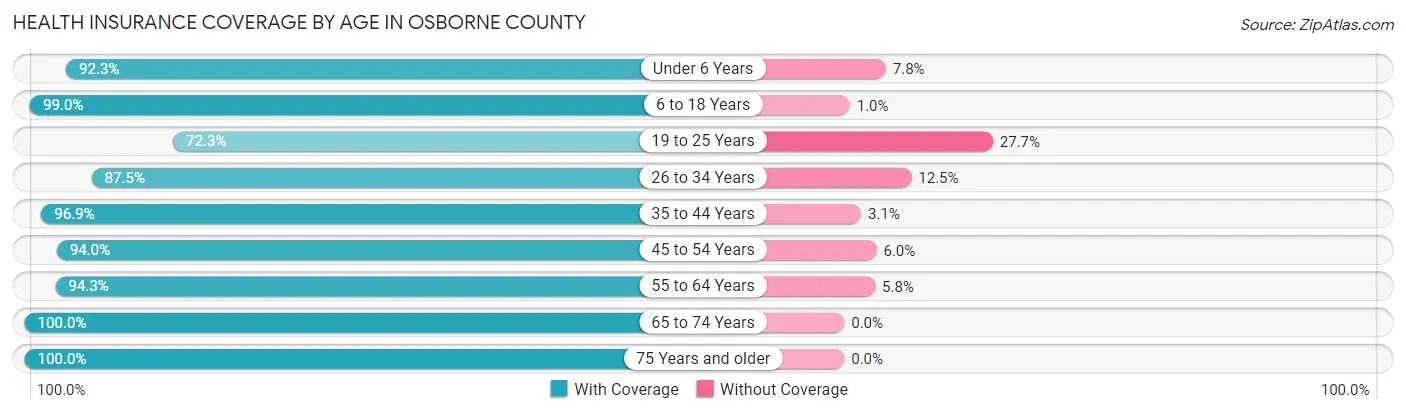
| Age Bracket | With Coverage | Without Coverage |
| Under 6 Years | 238 (92.2%) | 20 (7.7%) |
| 6 to 18 Years | 487 (99.0%) | 5 (1.0%) |
| 19 to 25 Years | 175 (72.3%) | 67 (27.7%) |
| 26 to 34 Years | 322 (87.5%) | 46 (12.5%) |
| 35 to 44 Years | 340 (96.9%) | 11 (3.1%) |
| 45 to 54 Years | 297 (94.0%) | 19 (6.0%) |
| 55 to 64 Years | 508 (94.3%) | 31 (5.8%) |
| 65 to 74 Years | 432 (100.0%) | 0 (0.0%) |
| 75 Years and older | 396 (100.0%) | 0 (0.0%) |
| Total | 3,195 (94.1%) | 199 (5.9%) |
Health Insurance Coverage by Citizenship Status in Osborne County
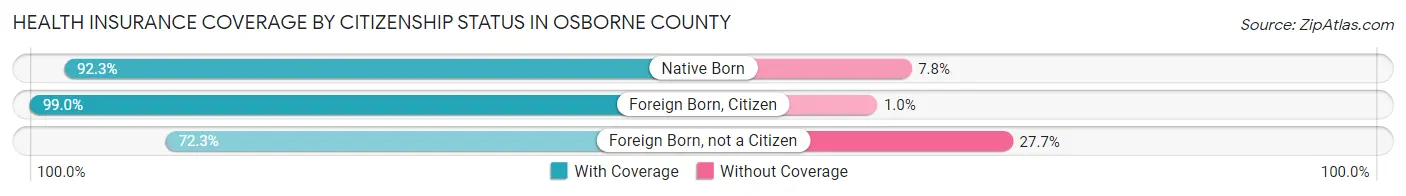
| Citizenship Status | With Coverage | Without Coverage |
| Native Born | 238 (92.2%) | 20 (7.7%) |
| Foreign Born, Citizen | 487 (99.0%) | 5 (1.0%) |
| Foreign Born, not a Citizen | 175 (72.3%) | 67 (27.7%) |
Health Insurance Coverage by Household Income in Osborne County

| Household Income | With Coverage | Without Coverage |
| Under $25,000 | 429 (85.8%) | 71 (14.2%) |
| $25,000 to $49,999 | 644 (93.1%) | 48 (6.9%) |
| $50,000 to $74,999 | 461 (91.3%) | 44 (8.7%) |
| $75,000 to $99,999 | 571 (97.8%) | 13 (2.2%) |
| $100,000 and over | 1,083 (98.3%) | 19 (1.7%) |
Public vs Private Health Insurance Coverage by Age in Osborne County
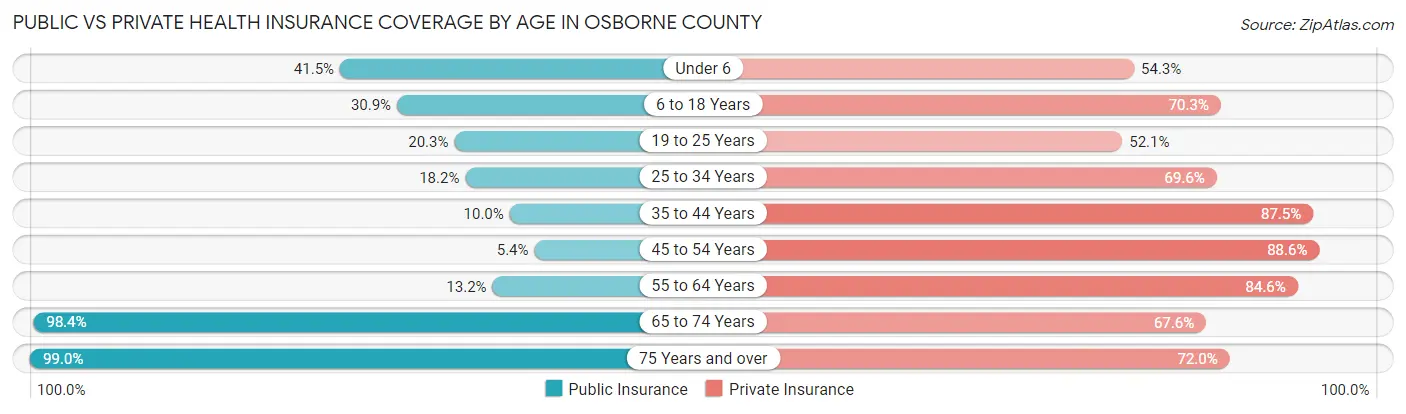
| Age Bracket | Public Insurance | Private Insurance |
| Under 6 | 107 (41.5%) | 140 (54.3%) |
| 6 to 18 Years | 152 (30.9%) | 346 (70.3%) |
| 19 to 25 Years | 49 (20.3%) | 126 (52.1%) |
| 25 to 34 Years | 67 (18.2%) | 256 (69.6%) |
| 35 to 44 Years | 35 (10.0%) | 307 (87.5%) |
| 45 to 54 Years | 17 (5.4%) | 280 (88.6%) |
| 55 to 64 Years | 71 (13.2%) | 456 (84.6%) |
| 65 to 74 Years | 425 (98.4%) | 292 (67.6%) |
| 75 Years and over | 392 (99.0%) | 285 (72.0%) |
| Total | 1,315 (38.7%) | 2,488 (73.3%) |
Disability Status by Sex by Age in Osborne County
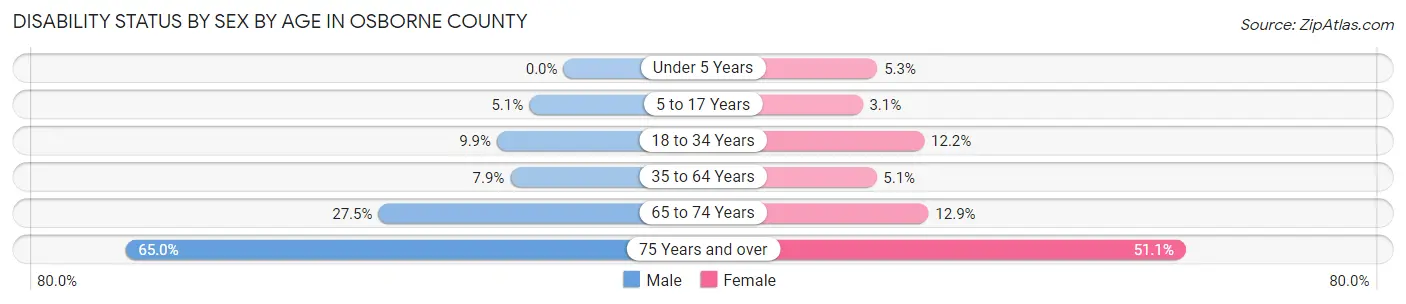
| Age Bracket | Male | Female |
| Under 5 Years | 0 (0.0%) | 5 (5.3%) |
| 5 to 17 Years | 14 (5.1%) | 8 (3.1%) |
| 18 to 34 Years | 30 (9.9%) | 38 (12.2%) |
| 35 to 64 Years | 49 (7.9%) | 30 (5.1%) |
| 65 to 74 Years | 61 (27.5%) | 27 (12.9%) |
| 75 Years and over | 106 (65.0%) | 119 (51.1%) |
Disability Class by Sex by Age in Osborne County
Disability Class: Hearing Difficulty
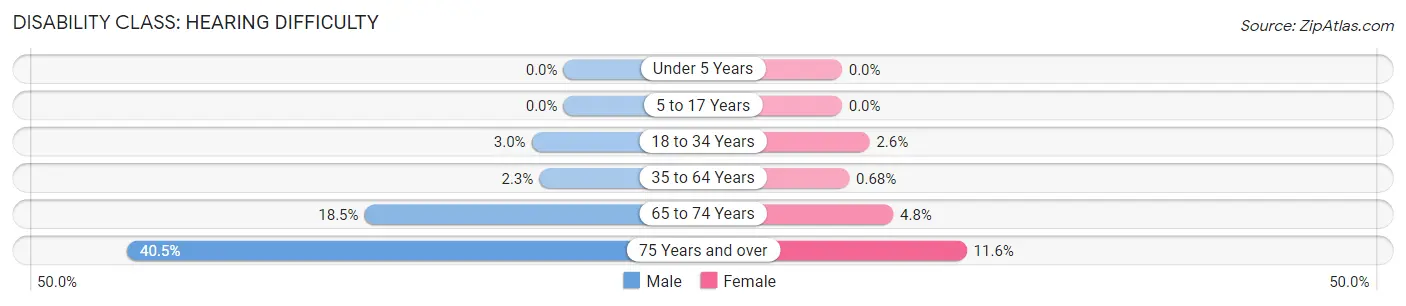
| Age Bracket | Male | Female |
| Under 5 Years | 0 (0.0%) | 0 (0.0%) |
| 5 to 17 Years | 0 (0.0%) | 0 (0.0%) |
| 18 to 34 Years | 9 (3.0%) | 8 (2.6%) |
| 35 to 64 Years | 14 (2.2%) | 4 (0.7%) |
| 65 to 74 Years | 41 (18.5%) | 10 (4.8%) |
| 75 Years and over | 66 (40.5%) | 27 (11.6%) |
Disability Class: Vision Difficulty
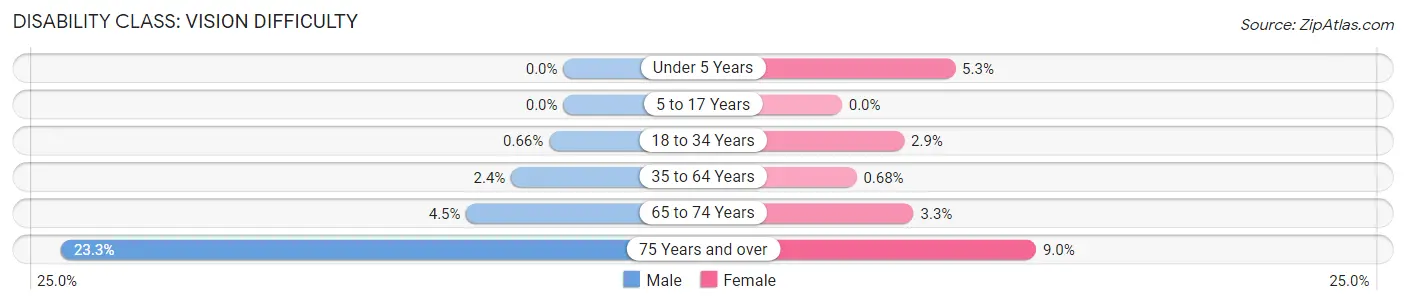
| Age Bracket | Male | Female |
| Under 5 Years | 0 (0.0%) | 5 (5.3%) |
| 5 to 17 Years | 0 (0.0%) | 0 (0.0%) |
| 18 to 34 Years | 2 (0.7%) | 9 (2.9%) |
| 35 to 64 Years | 15 (2.4%) | 4 (0.7%) |
| 65 to 74 Years | 10 (4.5%) | 7 (3.3%) |
| 75 Years and over | 38 (23.3%) | 21 (9.0%) |
Disability Class: Cognitive Difficulty
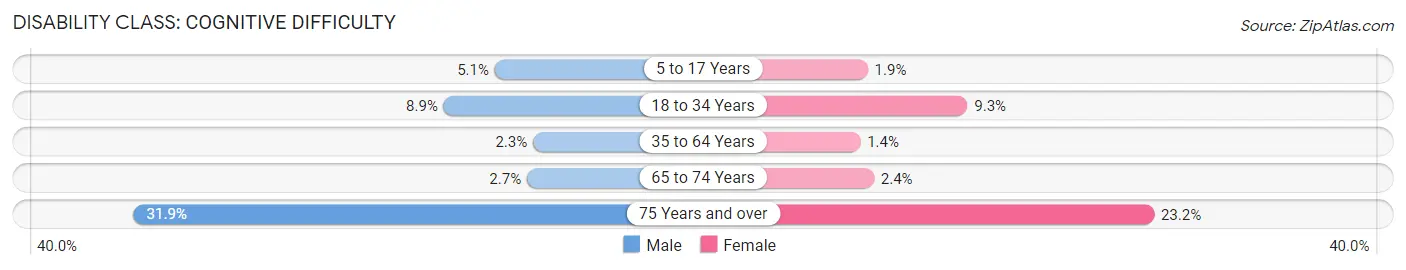
| Age Bracket | Male | Female |
| 5 to 17 Years | 14 (5.1%) | 5 (1.9%) |
| 18 to 34 Years | 27 (8.9%) | 29 (9.3%) |
| 35 to 64 Years | 14 (2.2%) | 8 (1.4%) |
| 65 to 74 Years | 6 (2.7%) | 5 (2.4%) |
| 75 Years and over | 52 (31.9%) | 54 (23.2%) |
Disability Class: Ambulatory Difficulty
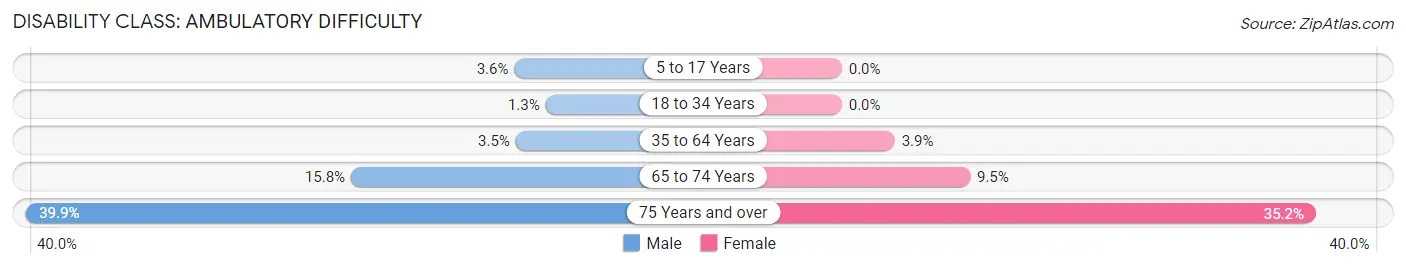
| Age Bracket | Male | Female |
| 5 to 17 Years | 10 (3.6%) | 0 (0.0%) |
| 18 to 34 Years | 4 (1.3%) | 0 (0.0%) |
| 35 to 64 Years | 22 (3.5%) | 23 (3.9%) |
| 65 to 74 Years | 35 (15.8%) | 20 (9.5%) |
| 75 Years and over | 65 (39.9%) | 82 (35.2%) |
Disability Class: Self-Care Difficulty
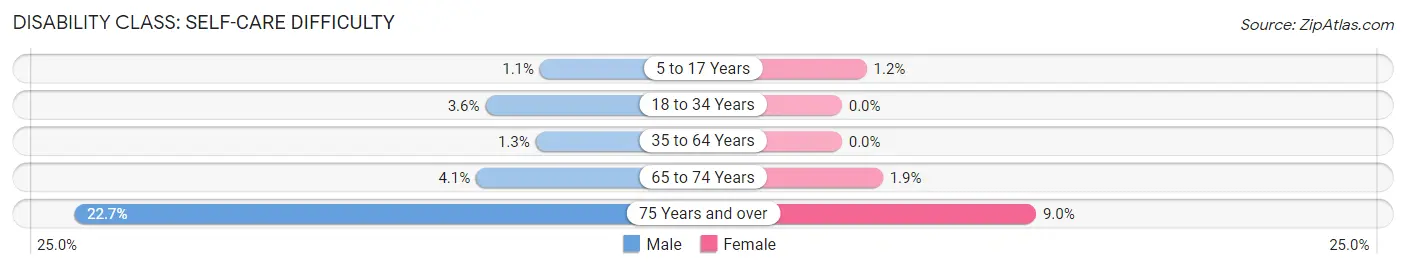
| Age Bracket | Male | Female |
| 5 to 17 Years | 3 (1.1%) | 3 (1.1%) |
| 18 to 34 Years | 11 (3.6%) | 0 (0.0%) |
| 35 to 64 Years | 8 (1.3%) | 0 (0.0%) |
| 65 to 74 Years | 9 (4.1%) | 4 (1.9%) |
| 75 Years and over | 37 (22.7%) | 21 (9.0%) |
Technology Access in Osborne County
Computing Device Access in Osborne County
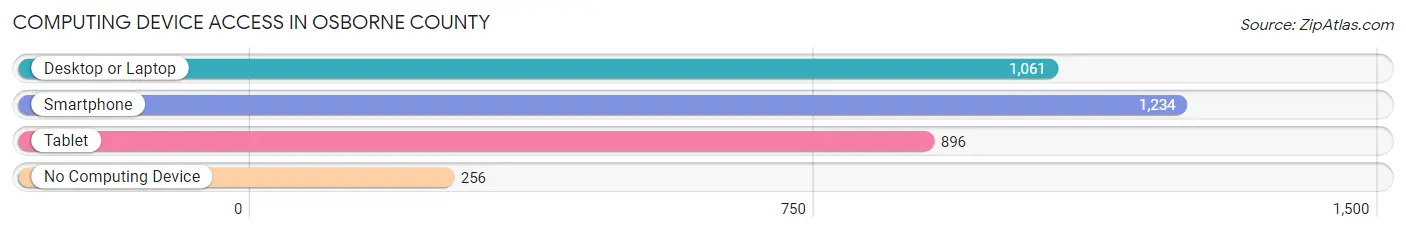
| Device Type | # Households | % Households |
| Desktop or Laptop | 1,061 | 66.1% |
| Smartphone | 1,234 | 76.9% |
| Tablet | 896 | 55.9% |
| No Computing Device | 256 | 16.0% |
| Total | 1,604 | 100.0% |
Internet Access in Osborne County
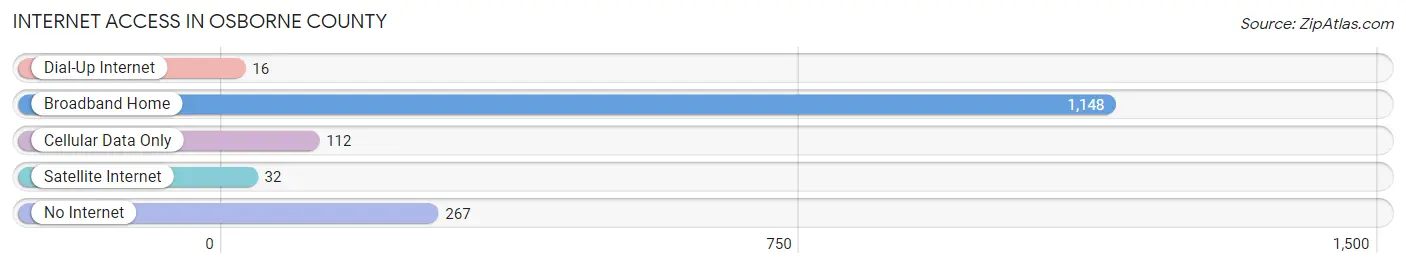
| Internet Type | # Households | % Households |
| Dial-Up Internet | 16 | 1.0% |
| Broadband Home | 1,148 | 71.6% |
| Cellular Data Only | 112 | 7.0% |
| Satellite Internet | 32 | 2.0% |
| No Internet | 267 | 16.7% |
| Total | 1,604 | 100.0% |
Osborne County Summary
Osborne County is located in the north-central region of Kansas, and is part of the Saline River Valley. It is bordered by Mitchell County to the north, Smith County to the east, Rooks County to the south, and Phillips County to the west. The county seat is Osborne, and the county has a total area of 876 square miles, of which 875 square miles is land and 1 square mile is water.
Osborne County was established in 1867 and named after Vincent B. Osborne, a prominent early settler. The county was originally part of the unorganized territory of the Kansas Territory, and was organized in 1872. The first settlers arrived in the area in the late 1860s, and the county was officially organized in 1872.
The economy of Osborne County is largely based on agriculture, with wheat, corn, and soybeans being the primary crops. Other crops grown in the county include sorghum, sunflowers, and alfalfa. Livestock production is also important to the county's economy, with cattle, hogs, and sheep being the primary animals raised.
The population of Osborne County was 3,845 in 2000, with a population density of 4.4 people per square mile. The median household income was $35,938, and the median family income was $43,938. The per capita income was $17,845. The unemployment rate was 3.7%.
The racial makeup of the county was 97.7% White, 0.3% African American, 0.3% Native American, 0.2% Asian, 0.1% Pacific Islander, 0.3% from other races, and 1.1% from two or more races. Hispanic or Latino of any race were 1.2% of the population.
The largest ancestry groups in Osborne County were German (37.2%), English (17.2%), Irish (14.2%), and American (10.2%). The median age was 41.2 years, and the population was spread out with 25.2% under the age of 18, 6.2% from 18 to 24, 25.2% from 25 to 44, 25.2% from 45 to 64, and 18.2% who were 65 years of age or older.
Osborne County is served by two school districts, Osborne USD 392 and Downs-Lakeside USD 393. There are two public libraries in the county, the Osborne County Library and the Downs Public Library. The county is also home to several museums, including the Osborne County Historical Museum, the Osborne County Museum of Natural History, and the Osborne County Museum of Art.
Osborne County is served by two hospitals, Osborne County Memorial Hospital and Osborne County Medical Center. The county is also served by several radio and television stations, including KKCI-FM, KKCI-AM, and KKCI-TV.
Osborne County is a rural county with a strong agricultural base. The county is home to a variety of businesses, including farming, ranching, manufacturing, and retail. The county is also home to several recreational activities, including hunting, fishing, camping, and hiking. The county is served by two school districts, two public libraries, and several museums. The county is also served by two hospitals and several radio and television stations.
Common Questions
What is the Total Population of Osborne County?
Total Population of Osborne County is 3,493.
What is the Total Male Population of Osborne County?
Total Male Population of Osborne County is 1,757.
What is the Total Female Population of Osborne County?
Total Female Population of Osborne County is 1,736.
What is the Ratio of Males per 100 Females in Osborne County?
There are 101.21 Males per 100 Females in Osborne County.
What is the Ratio of Females per 100 Males in Osborne County?
There are 98.80 Females per 100 Males in Osborne County.
What is the Median Population Age in Osborne County?
Median Population Age in Osborne County is 46.4 Years.
What is the Average Family Size in Osborne County
Average Family Size in Osborne County is 2.7 People.
What is the Average Household Size in Osborne County
Average Household Size in Osborne County is 2.1 People.
What is Per Capita Income in Osborne County?
Per Capita income in Osborne County is $34,669.
What is the Median Family Income in Osborne County?
Median Family Income in Osborne County is $74,868.
What is the Median Household income in Osborne County?
Median Household Income in Osborne County is $58,750.
What is Income or Wage Gap in Osborne County?
Income or Wage Gap in Osborne County is 42.6%.
Women in Osborne County earn 57.4 cents for every dollar earned by a man.
What is Inequality or Gini Index in Osborne County?
Inequality or Gini Index in Osborne County is 0.44.
How Large is the Labor Force in Osborne County?
There are 1,864 People in the Labor Forcein in Osborne County.
What is the Percentage of People in the Labor Force in Osborne County?
65.9% of People are in the Labor Force in Osborne County.
What is the Unemployment Rate in Osborne County?
Unemployment Rate in Osborne County is 1.7%.