Norton County, KS
Norton County Map

Norton County Overview
5,431
TOTAL POPULATION
3,053
MALE POPULATION
2,378
FEMALE POPULATION
128.39
MALES / 100 FEMALES
77.89
FEMALES / 100 MALES
40.4
MEDIAN AGE
3.2
AVG FAMILY SIZE
2.4
AVG HOUSEHOLD SIZE
$28,514
PER CAPITA INCOME
$75,597
AVG FAMILY INCOME
$52,710
AVG HOUSEHOLD INCOME
28.6%
WAGE / INCOME GAP [ % ]
71.4¢/ $1
WAGE / INCOME GAP [ $ ]
$13,262
FAMILY INCOME DEFICIT
0.46
INEQUALITY / GINI INDEX
2,191
LABOR FORCE [ PEOPLE ]
48.3%
PERCENT IN LABOR FORCE
1.4%
UNEMPLOYMENT RATE
Norton County Area Codes
Race in Norton County
The most populous races in Norton County are White / Caucasian (4,896 | 90.1%), Hispanic or Latino (311 | 5.7%), and Two or more Races (222 | 4.1%).
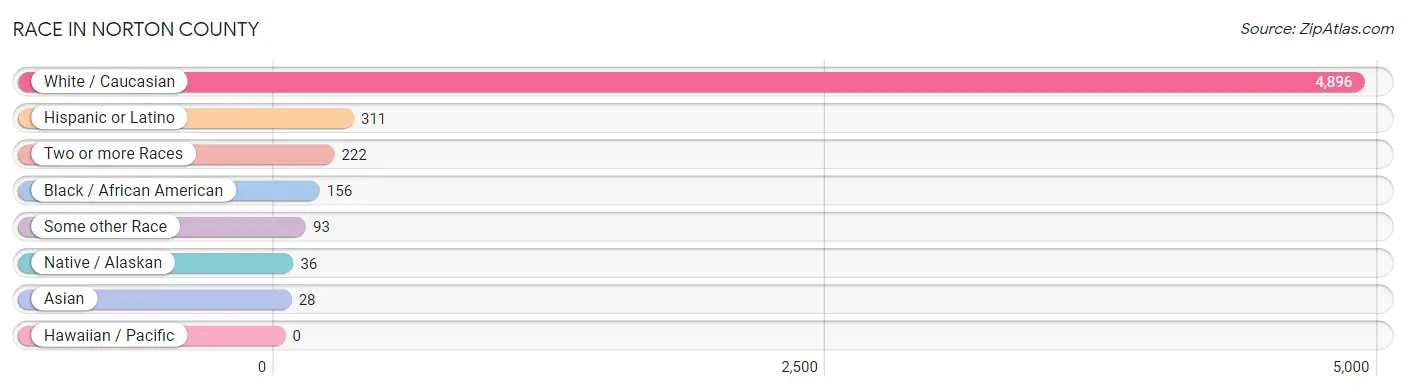
| Race | # Population | % Population |
| Asian | 28 | 0.5% |
| Black / African American | 156 | 2.9% |
| Hawaiian / Pacific | 0 | 0.0% |
| Hispanic or Latino | 311 | 5.7% |
| Native / Alaskan | 36 | 0.7% |
| White / Caucasian | 4,896 | 90.1% |
| Two or more Races | 222 | 4.1% |
| Some other Race | 93 | 1.7% |
| Total | 5,431 | 100.0% |
Ancestry in Norton County
The most populous ancestries reported in Norton County are German (1,608 | 29.6%), English (832 | 15.3%), Irish (510 | 9.4%), Mexican (290 | 5.3%), and American (240 | 4.4%), together accounting for 64.1% of all Norton County residents.
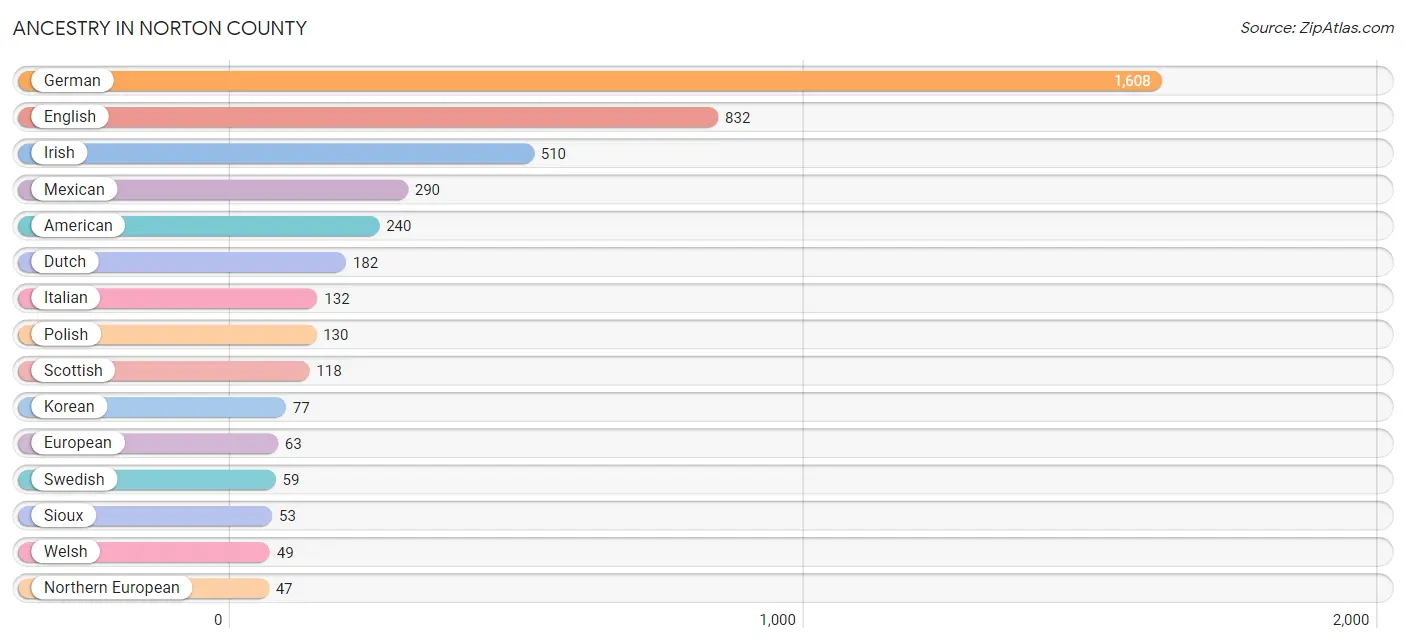
| Ancestry | # Population | % Population |
| American | 240 | 4.4% |
| Arab | 5 | 0.1% |
| Austrian | 2 | 0.0% |
| Cherokee | 35 | 0.6% |
| Czech | 19 | 0.4% |
| Danish | 2 | 0.0% |
| Dutch | 182 | 3.4% |
| English | 832 | 15.3% |
| European | 63 | 1.2% |
| French | 41 | 0.7% |
| French Canadian | 2 | 0.0% |
| German | 1,608 | 29.6% |
| Indian (Asian) | 4 | 0.1% |
| Irish | 510 | 9.4% |
| Iroquois | 15 | 0.3% |
| Israeli | 7 | 0.1% |
| Italian | 132 | 2.4% |
| Korean | 77 | 1.4% |
| Mexican | 290 | 5.3% |
| Moroccan | 5 | 0.1% |
| Native Hawaiian | 5 | 0.1% |
| Navajo | 6 | 0.1% |
| Northern European | 47 | 0.9% |
| Norwegian | 26 | 0.5% |
| Pennsylvania German | 1 | 0.0% |
| Polish | 130 | 2.4% |
| Puerto Rican | 14 | 0.3% |
| Scotch-Irish | 35 | 0.6% |
| Scottish | 118 | 2.2% |
| Sioux | 53 | 1.0% |
| Swedish | 59 | 1.1% |
| Swiss | 20 | 0.4% |
| Ukrainian | 2 | 0.0% |
| Welsh | 49 | 0.9% | View All 34 Rows |
Immigrants in Norton County
The most numerous immigrant groups reported in Norton County came from Central America (52 | 1.0%), Latin America (52 | 1.0%), Mexico (52 | 1.0%), Asia (28 | 0.5%), and Philippines (27 | 0.5%), together accounting for 3.9% of all Norton County residents.
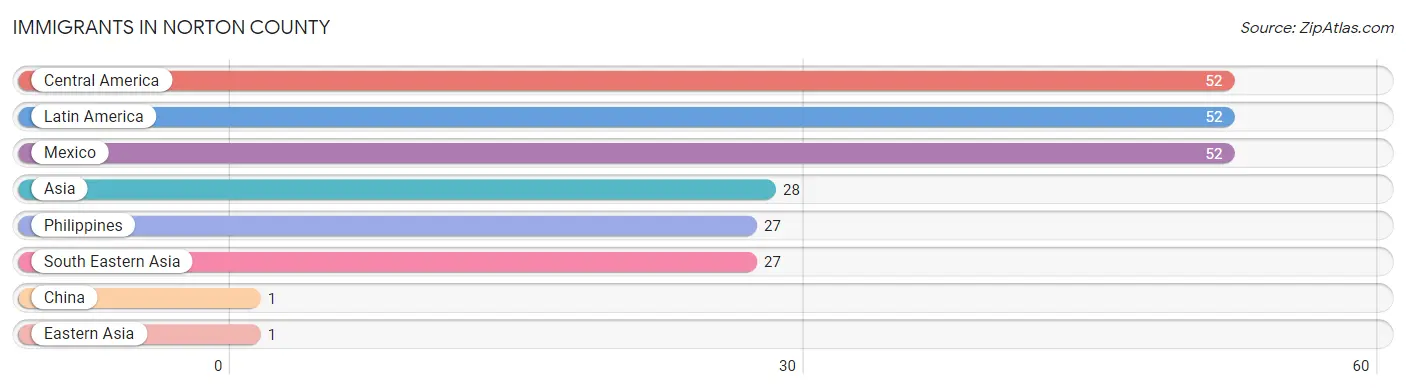
| Immigration Origin | # Population | % Population |
| Asia | 28 | 0.5% |
| Central America | 52 | 1.0% |
| China | 1 | 0.0% |
| Eastern Asia | 1 | 0.0% |
| Latin America | 52 | 1.0% |
| Mexico | 52 | 1.0% |
| Philippines | 27 | 0.5% |
| South Eastern Asia | 27 | 0.5% | View All 8 Rows |
Sex and Age in Norton County
Sex and Age in Norton County
The most populous age groups in Norton County are 30 to 34 Years (296 | 9.7%) for men and 60 to 64 Years (266 | 11.2%) for women.
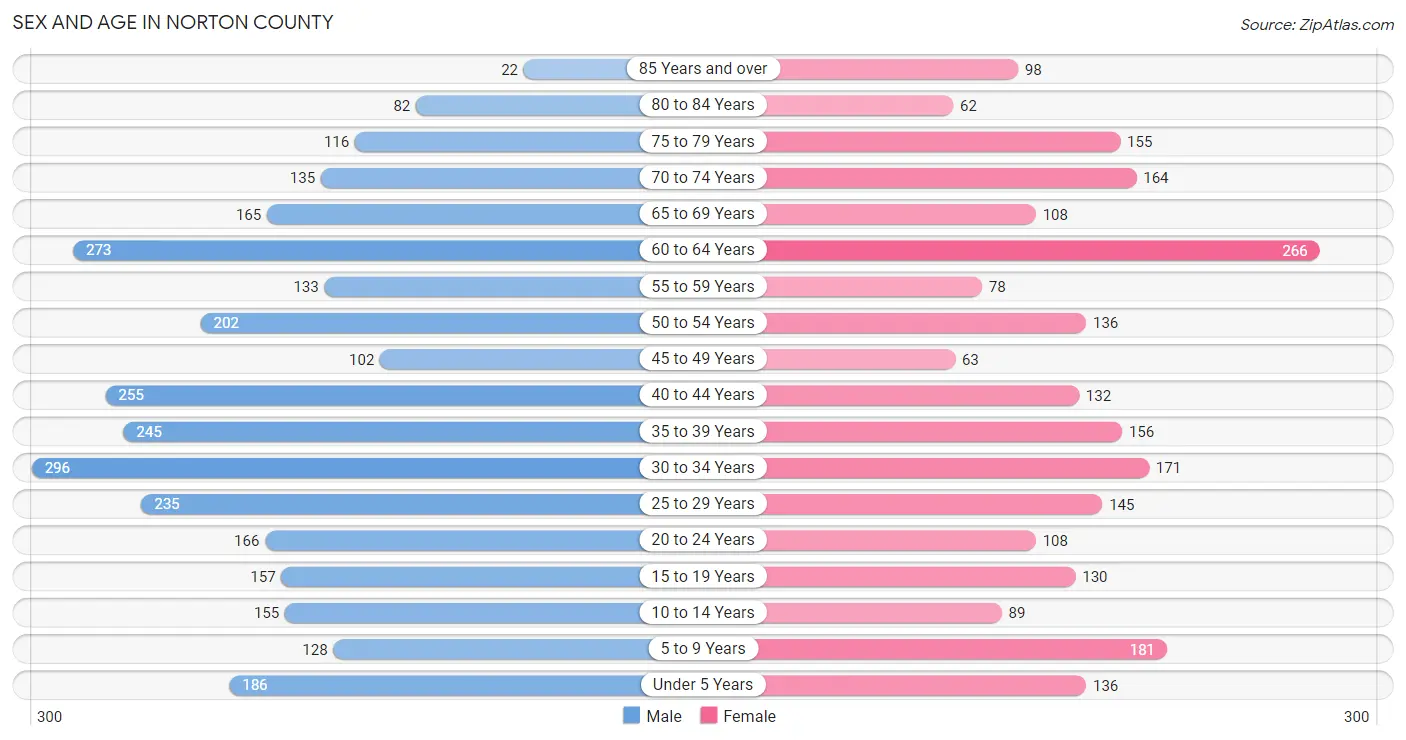
| Age Bracket | Male | Female |
| Under 5 Years | 186 (6.1%) | 136 (5.7%) |
| 5 to 9 Years | 128 (4.2%) | 181 (7.6%) |
| 10 to 14 Years | 155 (5.1%) | 89 (3.7%) |
| 15 to 19 Years | 157 (5.1%) | 130 (5.5%) |
| 20 to 24 Years | 166 (5.4%) | 108 (4.5%) |
| 25 to 29 Years | 235 (7.7%) | 145 (6.1%) |
| 30 to 34 Years | 296 (9.7%) | 171 (7.2%) |
| 35 to 39 Years | 245 (8.0%) | 156 (6.6%) |
| 40 to 44 Years | 255 (8.4%) | 132 (5.6%) |
| 45 to 49 Years | 102 (3.3%) | 63 (2.6%) |
| 50 to 54 Years | 202 (6.6%) | 136 (5.7%) |
| 55 to 59 Years | 133 (4.4%) | 78 (3.3%) |
| 60 to 64 Years | 273 (8.9%) | 266 (11.2%) |
| 65 to 69 Years | 165 (5.4%) | 108 (4.5%) |
| 70 to 74 Years | 135 (4.4%) | 164 (6.9%) |
| 75 to 79 Years | 116 (3.8%) | 155 (6.5%) |
| 80 to 84 Years | 82 (2.7%) | 62 (2.6%) |
| 85 Years and over | 22 (0.7%) | 98 (4.1%) |
| Total | 3,053 (100.0%) | 2,378 (100.0%) |
Families and Households in Norton County
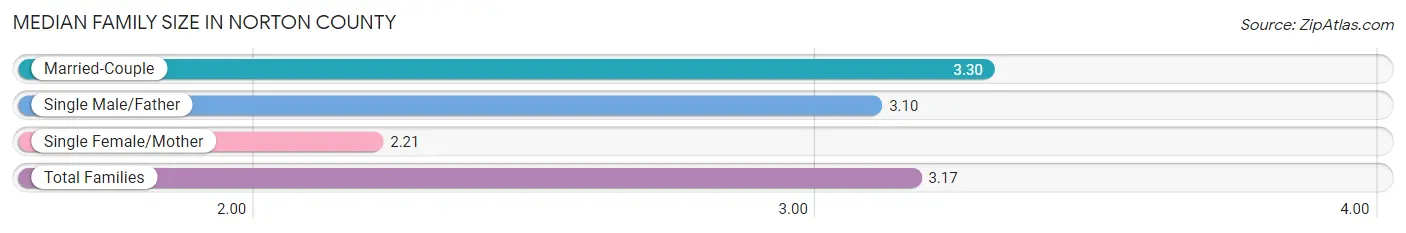
Median Family Size in Norton County
The median family size in Norton County is 3.17 persons per family, with married-couple families (889 | 81.2%) accounting for the largest median family size of 3.3 persons per family. On the other hand, single female/mother families (119 | 10.9%) represent the smallest median family size with 2.21 persons per family.
| Family Type | # Families | Family Size |
| Married-Couple | 889 (81.2%) | 3.30 |
| Single Male/Father | 87 (8.0%) | 3.10 |
| Single Female/Mother | 119 (10.9%) | 2.21 |
| Total Families | 1,095 (100.0%) | 3.17 |
Median Household Size in Norton County
The median household size in Norton County is 2.38 persons per household, with married-couple households (889 | 47.3%) accounting for the largest median household size of 3.32 persons per household. non-family households (786 | 41.8%) represent the smallest median household size with 1.16 persons per household.

| Household Type | # Households | Household Size |
| Married-Couple | 889 (47.3%) | 3.32 |
| Single Male/Father | 87 (4.6%) | 3.25 |
| Single Female/Mother | 119 (6.3%) | 2.72 |
| Non-family | 786 (41.8%) | 1.16 |
| Total Households | 1,881 (100.0%) | 2.38 |
Household Size by Marriage Status in Norton County
Out of a total of 1,881 households in Norton County, 1,095 (58.2%) are family households, while 786 (41.8%) are nonfamily households. The most numerous type of family households are 2-person households, comprising 482, and the most common type of nonfamily households are 1-person households, comprising 673.

| Household Size | Family Households | Nonfamily Households |
| 1-Person Households | - | 673 (35.8%) |
| 2-Person Households | 482 (25.6%) | 108 (5.7%) |
| 3-Person Households | 152 (8.1%) | 5 (0.3%) |
| 4-Person Households | 227 (12.1%) | 0 (0.0%) |
| 5-Person Households | 150 (8.0%) | 0 (0.0%) |
| 6-Person Households | 70 (3.7%) | 0 (0.0%) |
| 7+ Person Households | 14 (0.7%) | 0 (0.0%) |
| Total | 1,095 (58.2%) | 786 (41.8%) |
Female Fertility in Norton County
Fertility by Age in Norton County
Average fertility rate in Norton County is 51.0 births per 1,000 women. Women in the age bracket of 20 to 34 years have the highest fertility rate with 108.0 births per 1,000 women. Women in the age bracket of 20 to 34 years acount for 100.0% of all women with births.
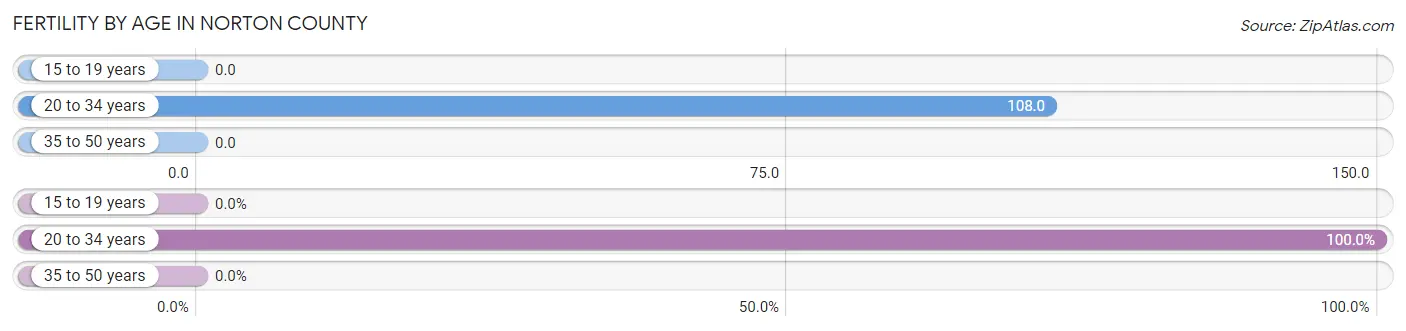
| Age Bracket | Women with Births | Births / 1,000 Women |
| 15 to 19 years | 0 (0.0%) | 0.0 |
| 20 to 34 years | 46 (100.0%) | 108.0 |
| 35 to 50 years | 0 (0.0%) | 0.0 |
| Total | 46 (100.0%) | 51.0 |
Fertility by Age by Marriage Status in Norton County
80.4% of women with births (46) in Norton County are married. The highest percentage of unmarried women with births falls into 20 to 34 years age bracket with 19.6% of them unmarried at the time of birth, while the lowest percentage of unmarried women with births belong to 20 to 34 years age bracket with 19.6% of them unmarried.

| Age Bracket | Married | Unmarried |
| 15 to 19 years | 0 (0.0%) | 0 (0.0%) |
| 20 to 34 years | 37 (80.4%) | 9 (19.6%) |
| 35 to 50 years | 0 (0.0%) | 0 (0.0%) |
| Total | 37 (80.4%) | 9 (19.6%) |
Fertility by Education in Norton County
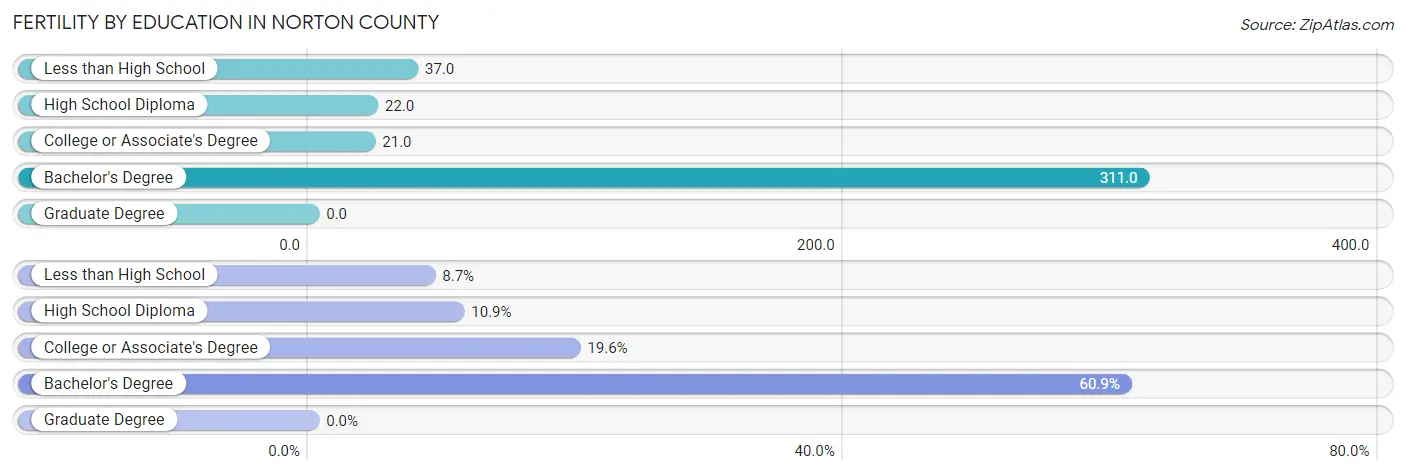
| Educational Attainment | Women with Births | Births / 1,000 Women |
| Less than High School | 4 (8.7%) | 37.0 |
| High School Diploma | 5 (10.9%) | 22.0 |
| College or Associate's Degree | 9 (19.6%) | 21.0 |
| Bachelor's Degree | 28 (60.9%) | 311.0 |
| Graduate Degree | 0 (0.0%) | 0.0 |
| Total | 46 (100.0%) | 51.0 |
Fertility by Education by Marriage Status in Norton County
19.6% of women with births in Norton County are unmarried. Women with the educational attainment of college or associate's degree are most likely to be married with 100.0% of them married at childbirth, while women with the educational attainment of less than high school are least likely to be married with 100.0% of them unmarried at childbirth.
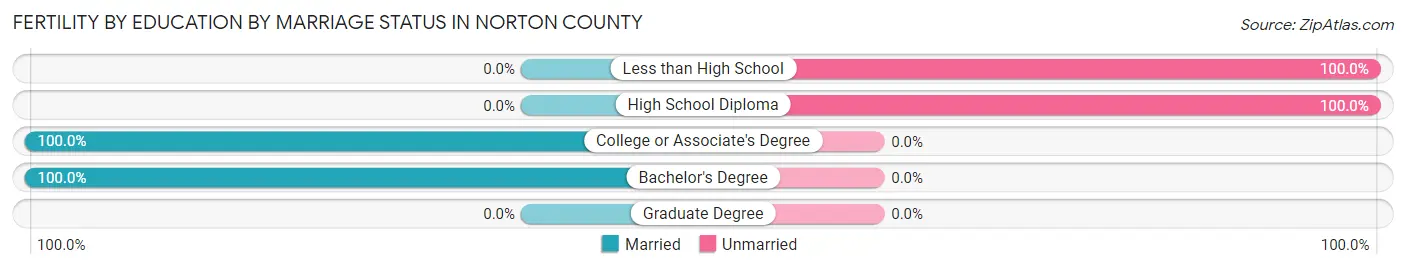
| Educational Attainment | Married | Unmarried |
| Less than High School | 0 (0.0%) | 4 (100.0%) |
| High School Diploma | 0 (0.0%) | 5 (100.0%) |
| College or Associate's Degree | 9 (100.0%) | 0 (0.0%) |
| Bachelor's Degree | 28 (100.0%) | 0 (0.0%) |
| Graduate Degree | 0 (0.0%) | 0 (0.0%) |
| Total | 37 (80.4%) | 9 (19.6%) |
Income in Norton County
Income Overview in Norton County
Per Capita Income in Norton County is $28,514, while median incomes of families and households are $75,597 and $52,710 respectively.
| Characteristic | Number | Measure |
| Per Capita Income | 5,431 | $28,514 |
| Median Family Income | 1,095 | $75,597 |
| Mean Family Income | 1,095 | $96,432 |
| Median Household Income | 1,881 | $52,710 |
| Mean Household Income | 1,881 | $72,782 |
| Income Deficit | 1,095 | $13,262 |
| Wage / Income Gap (%) | 5,431 | 28.61% |
| Wage / Income Gap ($) | 5,431 | 71.39¢ per $1 |
| Gini / Inequality Index | 5,431 | 0.46 |
Earnings by Sex in Norton County
Average Earnings in Norton County are $25,060, $19,531 for men and $27,358 for women, a difference of 28.6%.
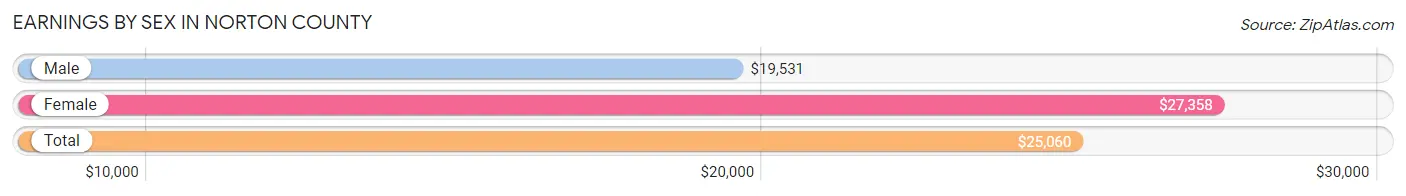
| Sex | Number | Average Earnings |
| Male | 1,788 (61.5%) | $19,531 |
| Female | 1,119 (38.5%) | $27,358 |
| Total | 2,907 (100.0%) | $25,060 |
Earnings by Sex by Income Bracket in Norton County
The most common earnings brackets in Norton County are $2,499 or less for men (203 | 11.4%) and $40,000 to $44,999 for women (235 | 21.0%).
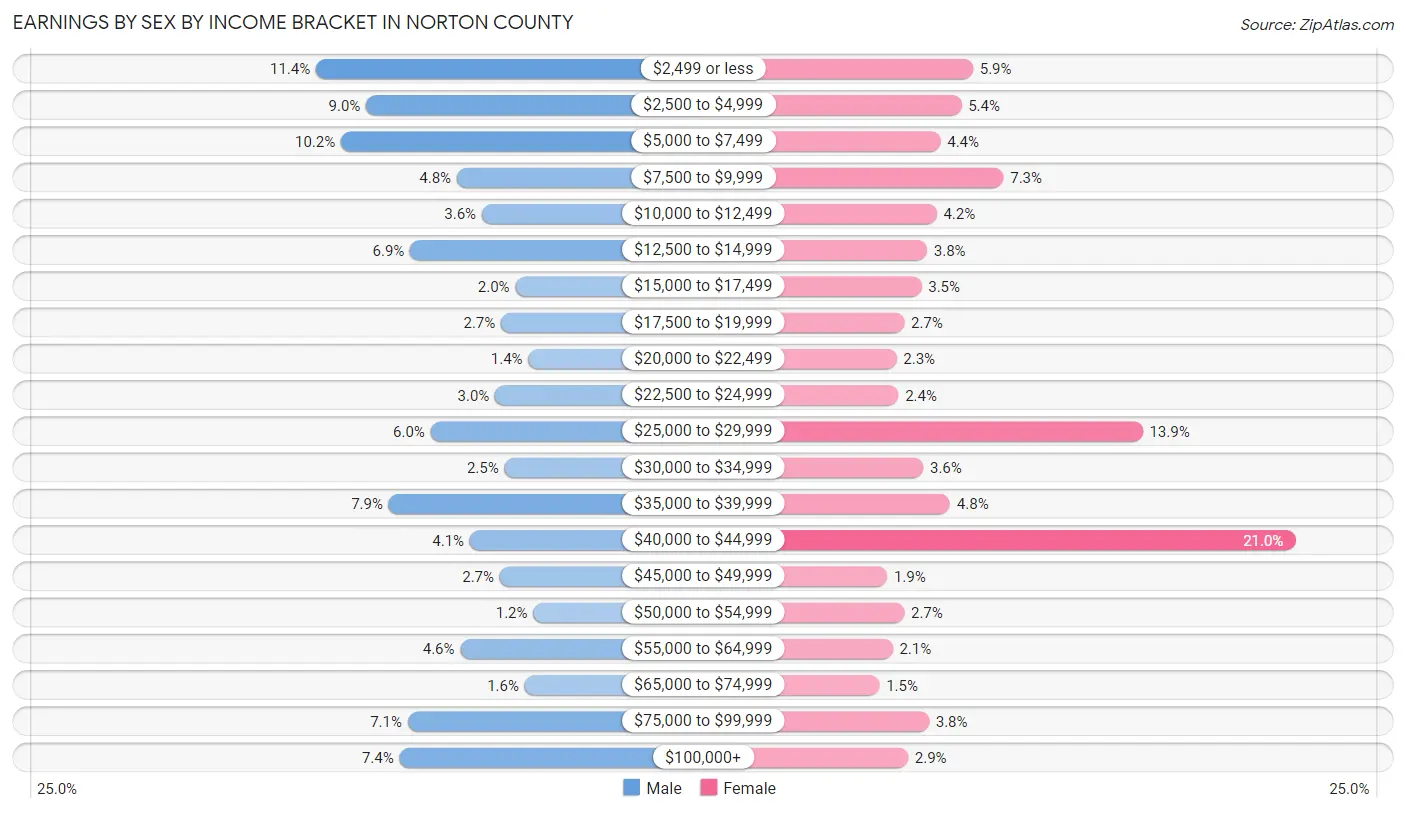
| Income | Male | Female |
| $2,499 or less | 203 (11.4%) | 66 (5.9%) |
| $2,500 to $4,999 | 161 (9.0%) | 60 (5.4%) |
| $5,000 to $7,499 | 182 (10.2%) | 49 (4.4%) |
| $7,500 to $9,999 | 85 (4.8%) | 82 (7.3%) |
| $10,000 to $12,499 | 64 (3.6%) | 47 (4.2%) |
| $12,500 to $14,999 | 124 (6.9%) | 42 (3.7%) |
| $15,000 to $17,499 | 36 (2.0%) | 39 (3.5%) |
| $17,500 to $19,999 | 48 (2.7%) | 30 (2.7%) |
| $20,000 to $22,499 | 25 (1.4%) | 26 (2.3%) |
| $22,500 to $24,999 | 53 (3.0%) | 27 (2.4%) |
| $25,000 to $29,999 | 107 (6.0%) | 155 (13.9%) |
| $30,000 to $34,999 | 45 (2.5%) | 40 (3.6%) |
| $35,000 to $39,999 | 142 (7.9%) | 54 (4.8%) |
| $40,000 to $44,999 | 74 (4.1%) | 235 (21.0%) |
| $45,000 to $49,999 | 49 (2.7%) | 21 (1.9%) |
| $50,000 to $54,999 | 21 (1.2%) | 30 (2.7%) |
| $55,000 to $64,999 | 82 (4.6%) | 24 (2.1%) |
| $65,000 to $74,999 | 28 (1.6%) | 17 (1.5%) |
| $75,000 to $99,999 | 126 (7.0%) | 43 (3.8%) |
| $100,000+ | 133 (7.4%) | 32 (2.9%) |
| Total | 1,788 (100.0%) | 1,119 (100.0%) |
Earnings by Sex by Educational Attainment in Norton County
Average earnings in Norton County are $25,945 for men and $30,347 for women, a difference of 14.5%. Men with an educational attainment of graduate degree enjoy the highest average annual earnings of $95,625, while those with high school diploma education earn the least with $19,766. Women with an educational attainment of bachelor's degree earn the most with the average annual earnings of $41,750, while those with high school diploma education have the smallest earnings of $28,171.

| Educational Attainment | Male Income | Female Income |
| Less than High School | - | - |
| High School Diploma | $19,766 | $28,171 |
| College or Associate's Degree | $43,250 | $28,824 |
| Bachelor's Degree | $37,216 | $41,750 |
| Graduate Degree | $95,625 | $41,250 |
| Total | $25,945 | $30,347 |
Family Income in Norton County
Family Income Brackets in Norton County
According to the Norton County family income data, there are 206 families falling into the $35,000 to $49,999 income range, which is the most common income bracket and makes up 18.8% of all families. Conversely, the $10,000 to $14,999 income bracket is the least frequent group with only 18 families (1.6%) belonging to this category.
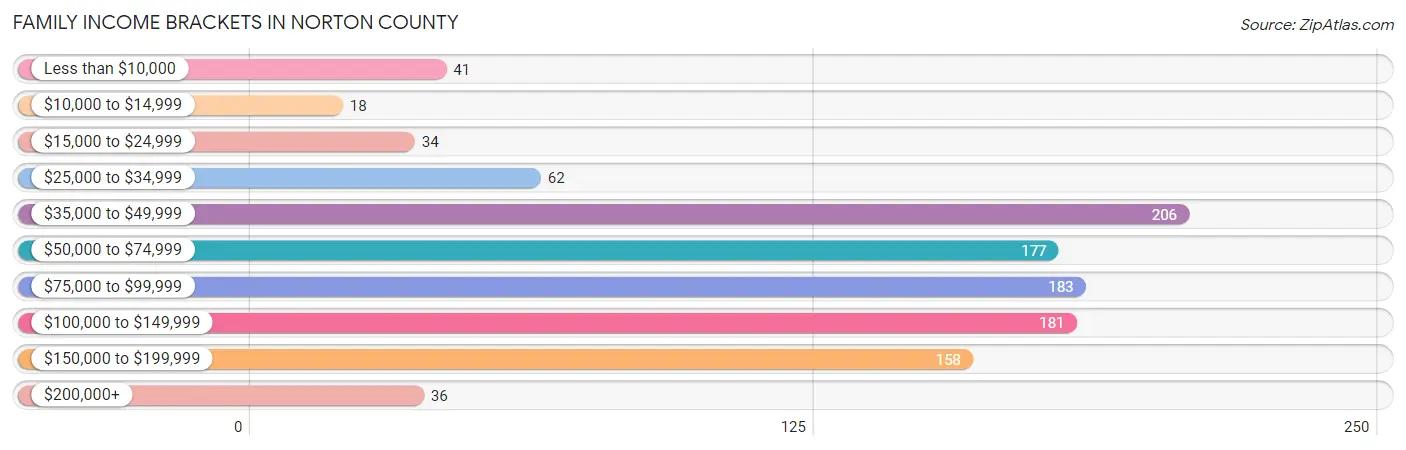
| Income Bracket | # Families | % Families |
| Less than $10,000 | 41 | 3.7% |
| $10,000 to $14,999 | 18 | 1.6% |
| $15,000 to $24,999 | 34 | 3.1% |
| $25,000 to $34,999 | 62 | 5.7% |
| $35,000 to $49,999 | 206 | 18.8% |
| $50,000 to $74,999 | 177 | 16.2% |
| $75,000 to $99,999 | 183 | 16.7% |
| $100,000 to $149,999 | 181 | 16.5% |
| $150,000 to $199,999 | 158 | 14.4% |
| $200,000+ | 36 | 3.3% |
Family Income by Famaliy Size in Norton County
5-person families (154 | 14.1%) account for the highest median family income in Norton County with $116,364 per family, while 2-person families (501 | 45.8%) have the highest median income of $26,891 per family member.
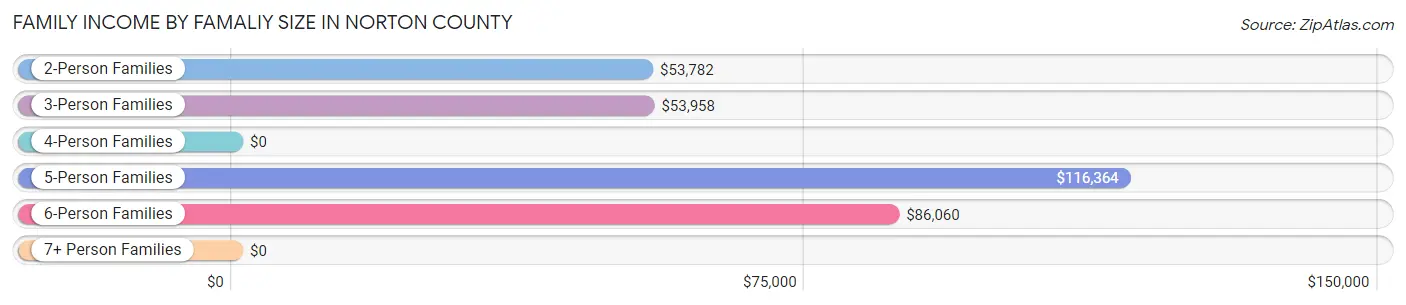
| Income Bracket | # Families | Median Income |
| 2-Person Families | 501 (45.8%) | $53,782 |
| 3-Person Families | 146 (13.3%) | $53,958 |
| 4-Person Families | 227 (20.7%) | $0 |
| 5-Person Families | 154 (14.1%) | $116,364 |
| 6-Person Families | 53 (4.8%) | $86,060 |
| 7+ Person Families | 14 (1.3%) | $0 |
| Total | 1,095 (100.0%) | $75,597 |
Family Income by Number of Earners in Norton County
The median family income in Norton County is $75,597, with families comprising 3+ earners (82) having the highest median family income of $93,571, while families with 1 earner (234) have the lowest median family income of $29,783, accounting for 7.5% and 21.4% of families, respectively.
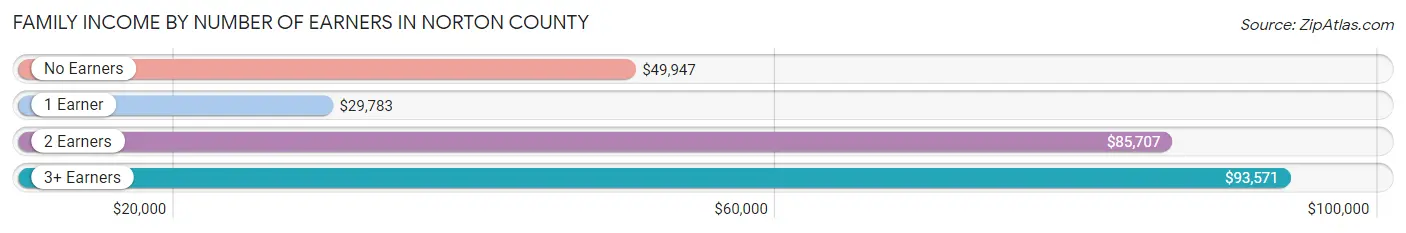
| Number of Earners | # Families | Median Income |
| No Earners | 195 (17.8%) | $49,947 |
| 1 Earner | 234 (21.4%) | $29,783 |
| 2 Earners | 584 (53.3%) | $85,707 |
| 3+ Earners | 82 (7.5%) | $93,571 |
| Total | 1,095 (100.0%) | $75,597 |
Household Income in Norton County
Household Income Brackets in Norton County
With 357 households falling in the category, the $35,000 to $49,999 income range is the most frequent in Norton County, accounting for 19.0% of all households. In contrast, only 38 households (2.0%) fall into the $200,000+ income bracket, making it the least populous group.
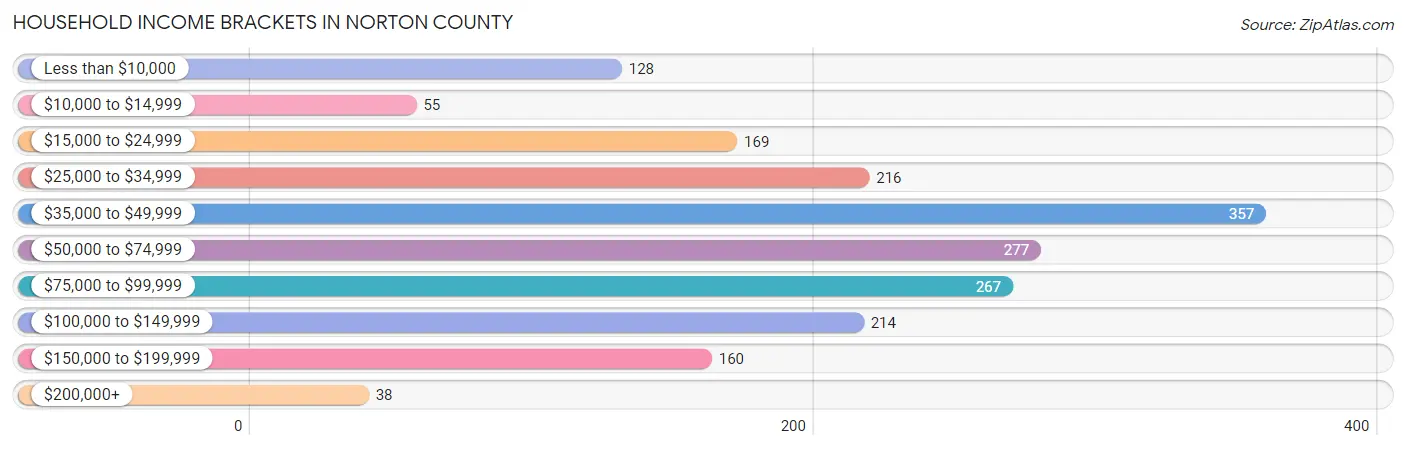
| Income Bracket | # Households | % Households |
| Less than $10,000 | 128 | 6.8% |
| $10,000 to $14,999 | 55 | 2.9% |
| $15,000 to $24,999 | 169 | 9.0% |
| $25,000 to $34,999 | 216 | 11.5% |
| $35,000 to $49,999 | 357 | 19.0% |
| $50,000 to $74,999 | 277 | 14.7% |
| $75,000 to $99,999 | 267 | 14.2% |
| $100,000 to $149,999 | 214 | 11.4% |
| $150,000 to $199,999 | 160 | 8.5% |
| $200,000+ | 38 | 2.0% |
Household Income by Householder Age in Norton County
The median household income in Norton County is $52,710, with the highest median household income of $55,677 found in the 45 to 64 years age bracket for the primary householder. A total of 579 households (30.8%) fall into this category. Meanwhile, the 15 to 24 years age bracket for the primary householder has the lowest median household income of $0, with 56 households (3.0%) in this group.

| Income Bracket | # Households | Median Income |
| 15 to 24 Years | 56 (3.0%) | $0 |
| 25 to 44 Years | 633 (33.7%) | $54,870 |
| 45 to 64 Years | 579 (30.8%) | $55,677 |
| 65+ Years | 613 (32.6%) | $46,958 |
| Total | 1,881 (100.0%) | $52,710 |
Poverty in Norton County
Income Below Poverty by Sex and Age in Norton County
With 5.5% poverty level for males and 13.1% for females among the residents of Norton County, under 5 year old males and 18 to 24 year old females are the most vulnerable to poverty, with 23 males (12.4%) and 50 females (36.5%) in their respective age groups living below the poverty level.
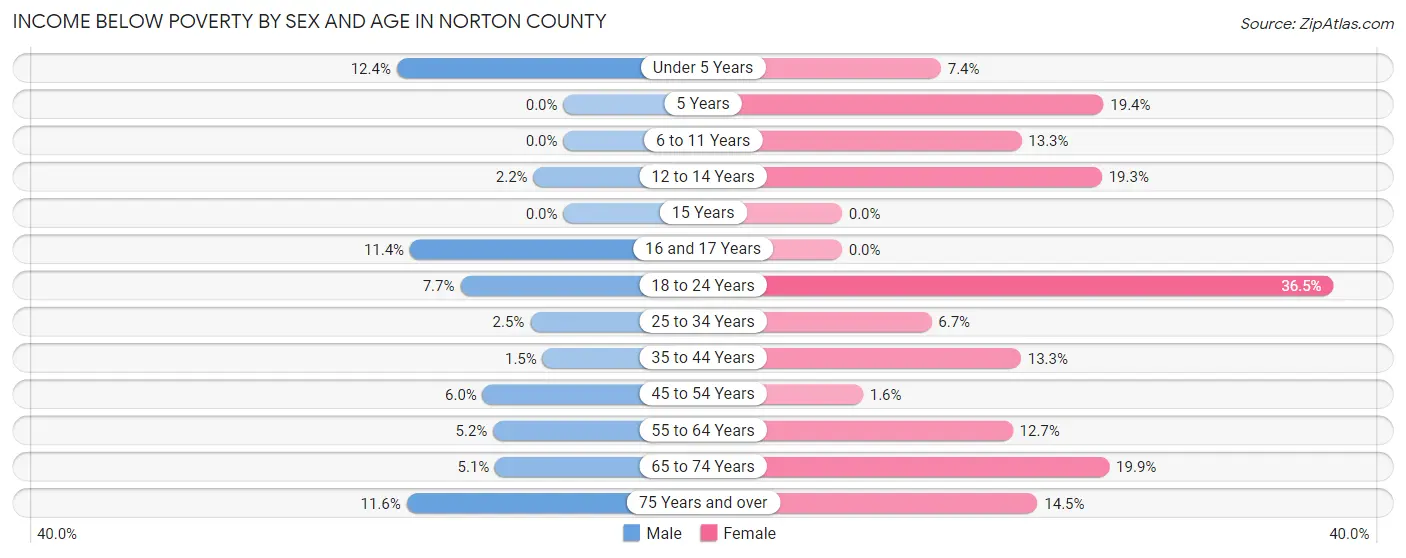
| Age Bracket | Male | Female |
| Under 5 Years | 23 (12.4%) | 10 (7.3%) |
| 5 Years | 0 (0.0%) | 20 (19.4%) |
| 6 to 11 Years | 0 (0.0%) | 14 (13.3%) |
| 12 to 14 Years | 2 (2.2%) | 11 (19.3%) |
| 15 Years | 0 (0.0%) | 0 (0.0%) |
| 16 and 17 Years | 9 (11.4%) | 0 (0.0%) |
| 18 to 24 Years | 14 (7.6%) | 50 (36.5%) |
| 25 to 34 Years | 6 (2.5%) | 21 (6.7%) |
| 35 to 44 Years | 4 (1.5%) | 38 (13.3%) |
| 45 to 54 Years | 10 (6.0%) | 3 (1.6%) |
| 55 to 64 Years | 17 (5.2%) | 43 (12.7%) |
| 65 to 74 Years | 13 (5.1%) | 54 (19.9%) |
| 75 Years and over | 22 (11.6%) | 36 (14.5%) |
| Total | 120 (5.5%) | 300 (13.1%) |
Income Above Poverty by Sex and Age in Norton County
According to the poverty statistics in Norton County, males aged 5 years and females aged 15 years are the age groups that are most secure financially, with 100.0% of males and 100.0% of females in these age groups living above the poverty line.

| Age Bracket | Male | Female |
| Under 5 Years | 163 (87.6%) | 126 (92.6%) |
| 5 Years | 14 (100.0%) | 83 (80.6%) |
| 6 to 11 Years | 176 (100.0%) | 91 (86.7%) |
| 12 to 14 Years | 88 (97.8%) | 46 (80.7%) |
| 15 Years | 0 (0.0%) | 19 (100.0%) |
| 16 and 17 Years | 70 (88.6%) | 82 (100.0%) |
| 18 to 24 Years | 169 (92.3%) | 87 (63.5%) |
| 25 to 34 Years | 238 (97.5%) | 295 (93.3%) |
| 35 to 44 Years | 255 (98.5%) | 248 (86.7%) |
| 45 to 54 Years | 157 (94.0%) | 189 (98.4%) |
| 55 to 64 Years | 309 (94.8%) | 296 (87.3%) |
| 65 to 74 Years | 244 (94.9%) | 218 (80.1%) |
| 75 Years and over | 167 (88.4%) | 212 (85.5%) |
| Total | 2,050 (94.5%) | 1,992 (86.9%) |
Income Below Poverty Among Married-Couple Families in Norton County
The poverty statistics for married-couple families in Norton County show that 2.7% or 24 of the total 889 families live below the poverty line. Families with no children have the highest poverty rate of 4.2%, comprising of 17 families. On the other hand, families with 5 or more children have the lowest poverty rate of 0.0%, which includes 0 families.
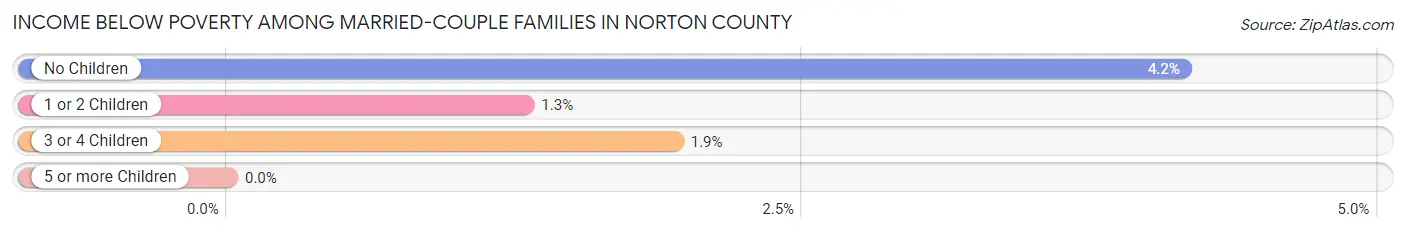
| Children | Above Poverty | Below Poverty |
| No Children | 393 (95.9%) | 17 (4.2%) |
| 1 or 2 Children | 307 (98.7%) | 4 (1.3%) |
| 3 or 4 Children | 152 (98.1%) | 3 (1.9%) |
| 5 or more Children | 13 (100.0%) | 0 (0.0%) |
| Total | 865 (97.3%) | 24 (2.7%) |
Income Below Poverty Among Single-Parent Households in Norton County
According to the poverty data in Norton County, 8.1% or 7 single-father households and 38.7% or 46 single-mother households are living below the poverty line. Among single-father households, those with 1 or 2 children have the highest poverty rate, with 1 households (100.0%) experiencing poverty. Likewise, among single-mother households, those with 3 or 4 children have the highest poverty rate, with 17 households (94.4%) falling below the poverty line.
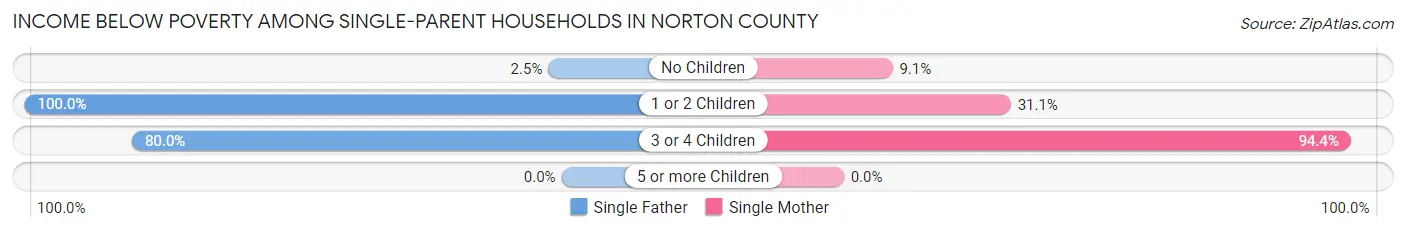
| Children | Single Father | Single Mother |
| No Children | 2 (2.5%) | 1 (9.1%) |
| 1 or 2 Children | 1 (100.0%) | 28 (31.1%) |
| 3 or 4 Children | 4 (80.0%) | 17 (94.4%) |
| 5 or more Children | 0 (0.0%) | 0 (0.0%) |
| Total | 7 (8.1%) | 46 (38.7%) |
Income Below Poverty Among Married-Couple vs Single-Parent Households in Norton County
The poverty data for Norton County shows that 24 of the married-couple family households (2.7%) and 53 of the single-parent households (25.7%) are living below the poverty level. Within the married-couple family households, those with no children have the highest poverty rate, with 17 households (4.2%) falling below the poverty line. Among the single-parent households, those with 3 or 4 children have the highest poverty rate, with 21 household (91.3%) living below poverty.
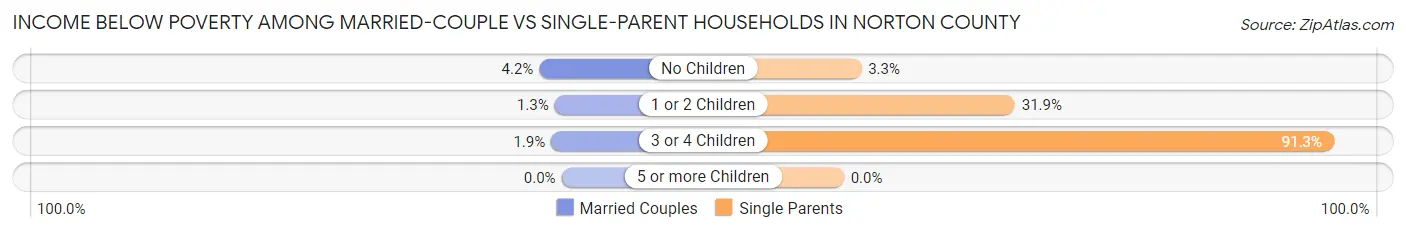
| Children | Married-Couple Families | Single-Parent Households |
| No Children | 17 (4.2%) | 3 (3.3%) |
| 1 or 2 Children | 4 (1.3%) | 29 (31.9%) |
| 3 or 4 Children | 3 (1.9%) | 21 (91.3%) |
| 5 or more Children | 0 (0.0%) | 0 (0.0%) |
| Total | 24 (2.7%) | 53 (25.7%) |
Employment Characteristics in Norton County
Employment by Class of Employer in Norton County
Among the 2,071 employed individuals in Norton County, private company employees (1,375 | 66.4%), not-for-profit organizations (212 | 10.2%), and state government employees (141 | 6.8%) make up the most common classes of employment.
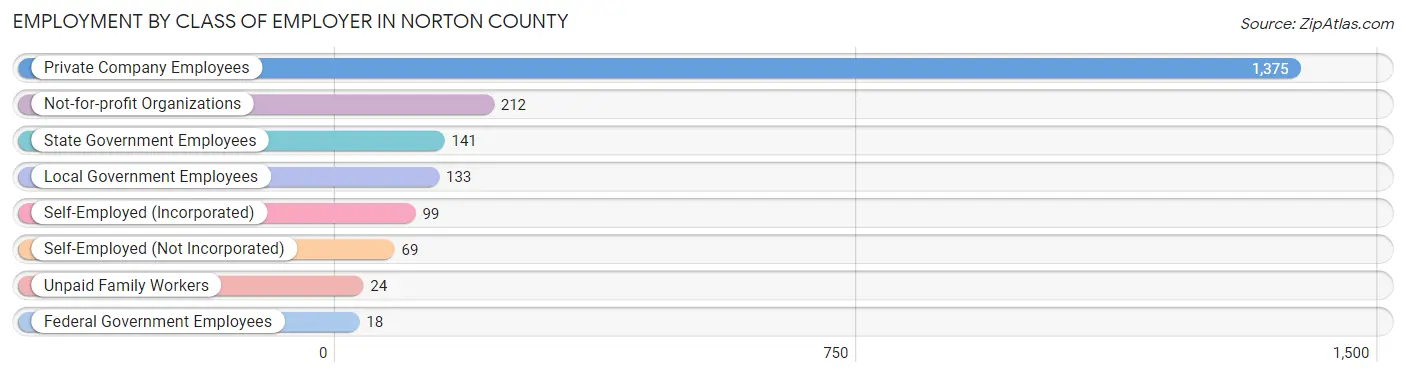
| Employer Class | # Employees | % Employees |
| Private Company Employees | 1,375 | 66.4% |
| Self-Employed (Incorporated) | 99 | 4.8% |
| Self-Employed (Not Incorporated) | 69 | 3.3% |
| Not-for-profit Organizations | 212 | 10.2% |
| Local Government Employees | 133 | 6.4% |
| State Government Employees | 141 | 6.8% |
| Federal Government Employees | 18 | 0.9% |
| Unpaid Family Workers | 24 | 1.2% |
| Total | 2,071 | 100.0% |
Employment Status by Age in Norton County
According to the labor force statistics for Norton County, out of the total population over 16 years of age (4,537), 48.3% or 2,191 individuals are in the labor force, with 1.4% or 31 of them unemployed. The age group with the highest labor force participation rate is 20 to 24 years, with 68.6% or 188 individuals in the labor force. Within the labor force, the 16 to 19 years age range has the highest percentage of unemployed individuals, with 7.6% or 11 of them being unemployed.
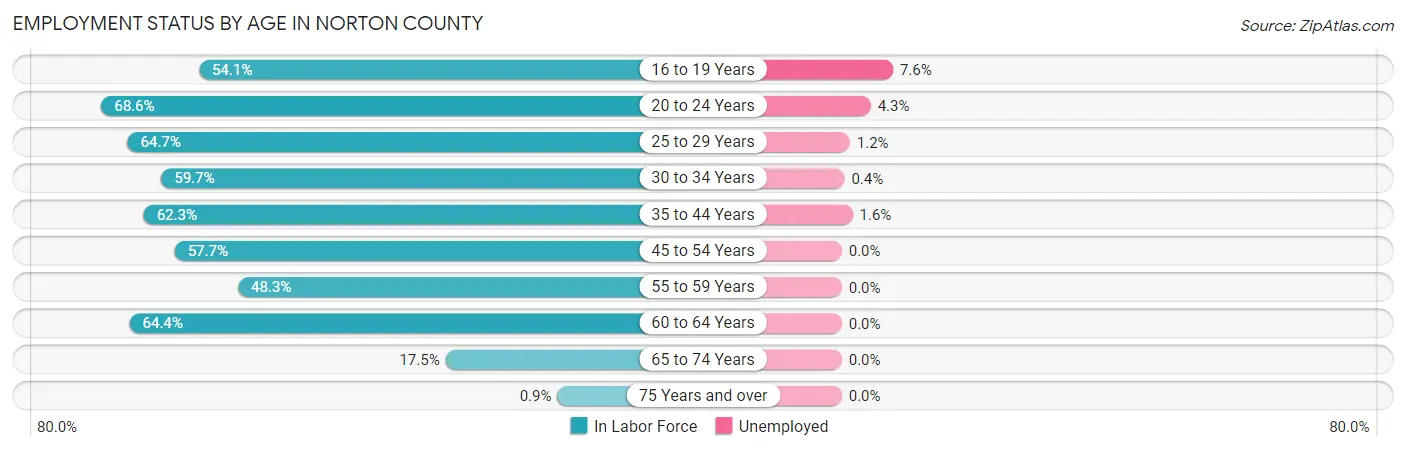
| Age Bracket | In Labor Force | Unemployed |
| 16 to 19 Years | 145 (54.1%) | 11 (7.6%) |
| 20 to 24 Years | 188 (68.6%) | 8 (4.3%) |
| 25 to 29 Years | 246 (64.7%) | 3 (1.2%) |
| 30 to 34 Years | 279 (59.7%) | 1 (0.4%) |
| 35 to 44 Years | 491 (62.3%) | 8 (1.6%) |
| 45 to 54 Years | 290 (57.7%) | 0 (0.0%) |
| 55 to 59 Years | 102 (48.3%) | 0 (0.0%) |
| 60 to 64 Years | 347 (64.4%) | 0 (0.0%) |
| 65 to 74 Years | 100 (17.5%) | 0 (0.0%) |
| 75 Years and over | 5 (0.9%) | 0 (0.0%) |
| Total | 2,191 (48.3%) | 31 (1.4%) |
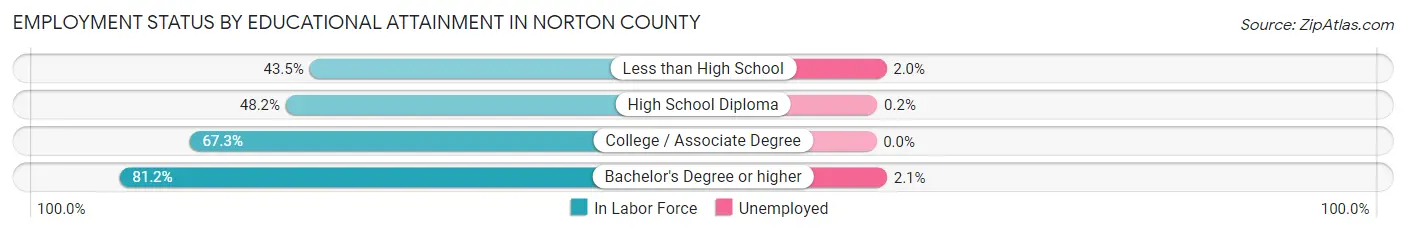
Employment Status by Educational Attainment in Norton County
According to labor force statistics for Norton County, 60.8% of individuals (1,756) out of the total population between 25 and 64 years of age (2,888) are in the labor force, with 0.7% or 12 of them being unemployed. The group with the highest labor force participation rate are those with the educational attainment of bachelor's degree or higher, with 81.2% or 379 individuals in the labor force. Within the labor force, individuals with bachelor's degree or higher education have the highest percentage of unemployment, with 2.1% or 8 of them being unemployed.
| Educational Attainment | In Labor Force | Unemployed |
| Less than High School | 147 (43.5%) | 7 (2.0%) |
| High School Diploma | 435 (48.2%) | 2 (0.2%) |
| College / Associate Degree | 794 (67.3%) | 0 (0.0%) |
| Bachelor's Degree or higher | 379 (81.2%) | 10 (2.1%) |
| Total | 1,756 (60.8%) | 20 (0.7%) |
Employment Occupations by Sex in Norton County
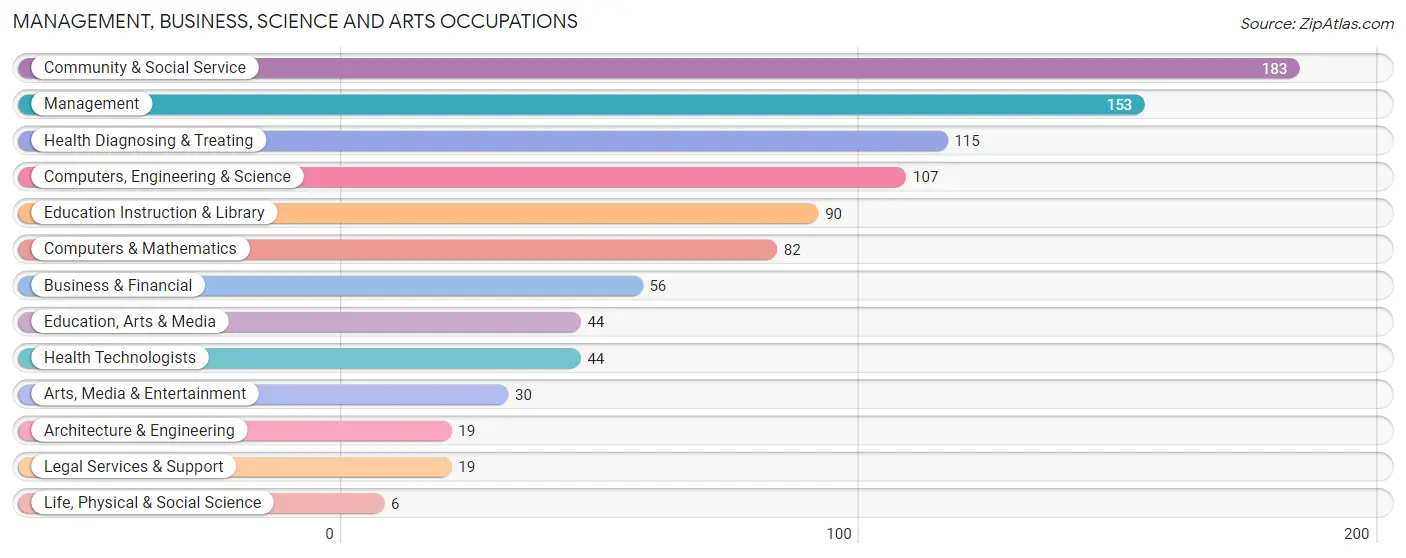
Management, Business, Science and Arts Occupations
The most common Management, Business, Science and Arts occupations in Norton County are Community & Social Service (183 | 8.5%), Management (153 | 7.1%), Health Diagnosing & Treating (115 | 5.3%), Computers, Engineering & Science (107 | 5.0%), and Education Instruction & Library (90 | 4.2%).
Management, Business, Science and Arts Occupations by Sex
Within the Management, Business, Science and Arts occupations in Norton County, the most male-oriented occupations are Computers & Mathematics (100.0%), Architecture & Engineering (100.0%), and Legal Services & Support (100.0%), while the most female-oriented occupations are Life, Physical & Social Science (100.0%), Arts, Media & Entertainment (100.0%), and Education Instruction & Library (92.2%).

| Occupation | Male | Female |
| Management | 89 (58.2%) | 64 (41.8%) |
| Business & Financial | 12 (21.4%) | 44 (78.6%) |
| Computers, Engineering & Science | 101 (94.4%) | 6 (5.6%) |
| Computers & Mathematics | 82 (100.0%) | 0 (0.0%) |
| Architecture & Engineering | 19 (100.0%) | 0 (0.0%) |
| Life, Physical & Social Science | 0 (0.0%) | 6 (100.0%) |
| Community & Social Service | 67 (36.6%) | 116 (63.4%) |
| Education, Arts & Media | 41 (93.2%) | 3 (6.8%) |
| Legal Services & Support | 19 (100.0%) | 0 (0.0%) |
| Education Instruction & Library | 7 (7.8%) | 83 (92.2%) |
| Arts, Media & Entertainment | 0 (0.0%) | 30 (100.0%) |
| Health Diagnosing & Treating | 53 (46.1%) | 62 (53.9%) |
| Health Technologists | 6 (13.6%) | 38 (86.4%) |
| Total (Category) | 322 (52.4%) | 292 (47.6%) |
| Total (Overall) | 1,118 (51.7%) | 1,044 (48.3%) |
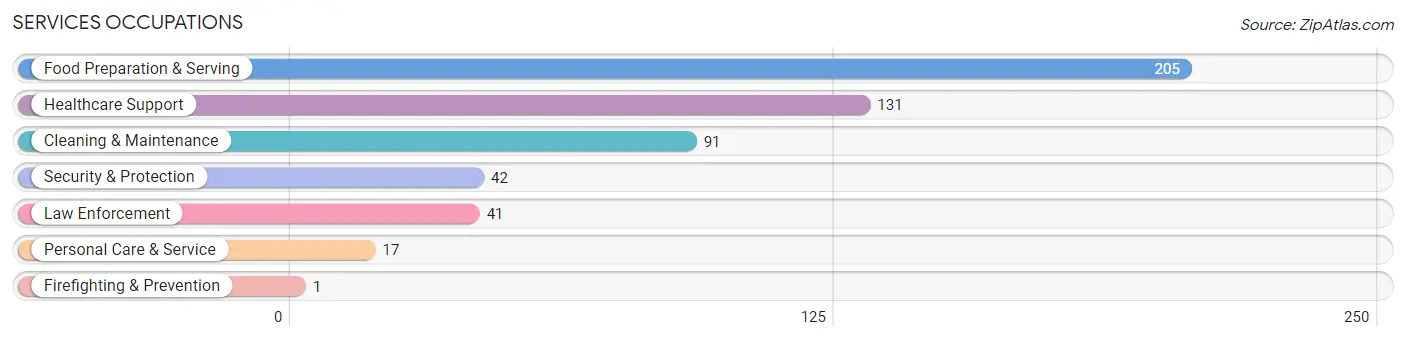
Services Occupations
The most common Services occupations in Norton County are Food Preparation & Serving (205 | 9.5%), Healthcare Support (131 | 6.1%), Cleaning & Maintenance (91 | 4.2%), Security & Protection (42 | 1.9%), and Law Enforcement (41 | 1.9%).
Services Occupations by Sex
Within the Services occupations in Norton County, the most male-oriented occupations are Firefighting & Prevention (100.0%), Cleaning & Maintenance (97.8%), and Security & Protection (95.2%), while the most female-oriented occupations are Personal Care & Service (100.0%), Healthcare Support (87.8%), and Food Preparation & Serving (69.8%).
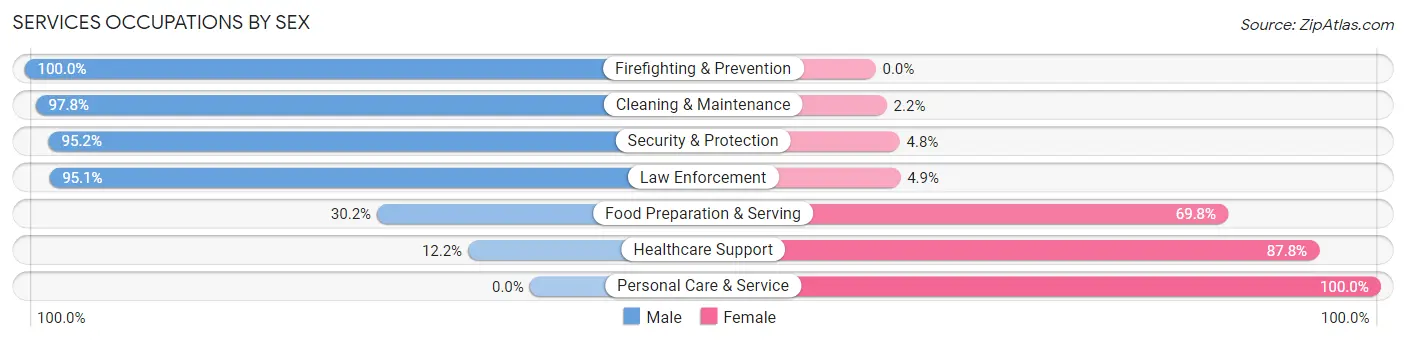
| Occupation | Male | Female |
| Healthcare Support | 16 (12.2%) | 115 (87.8%) |
| Security & Protection | 40 (95.2%) | 2 (4.8%) |
| Firefighting & Prevention | 1 (100.0%) | 0 (0.0%) |
| Law Enforcement | 39 (95.1%) | 2 (4.9%) |
| Food Preparation & Serving | 62 (30.2%) | 143 (69.8%) |
| Cleaning & Maintenance | 89 (97.8%) | 2 (2.2%) |
| Personal Care & Service | 0 (0.0%) | 17 (100.0%) |
| Total (Category) | 207 (42.6%) | 279 (57.4%) |
| Total (Overall) | 1,118 (51.7%) | 1,044 (48.3%) |
Sales and Office Occupations
The most common Sales and Office occupations in Norton County are Office & Administration (377 | 17.4%), and Sales & Related (180 | 8.3%).

Sales and Office Occupations by Sex
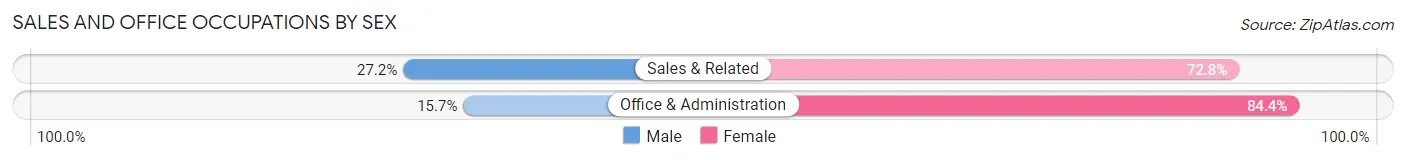
| Occupation | Male | Female |
| Sales & Related | 49 (27.2%) | 131 (72.8%) |
| Office & Administration | 59 (15.7%) | 318 (84.4%) |
| Total (Category) | 108 (19.4%) | 449 (80.6%) |
| Total (Overall) | 1,118 (51.7%) | 1,044 (48.3%) |
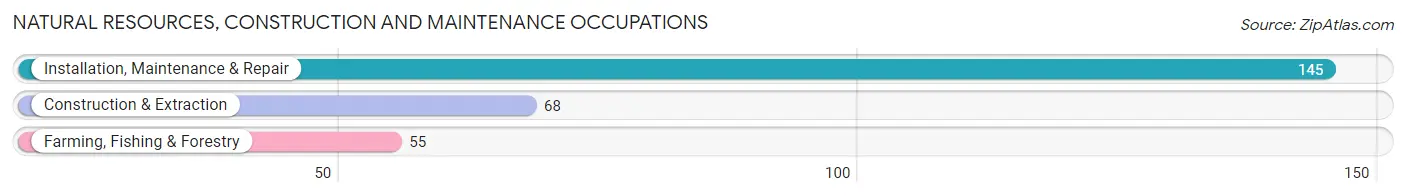
Natural Resources, Construction and Maintenance Occupations
The most common Natural Resources, Construction and Maintenance occupations in Norton County are Installation, Maintenance & Repair (145 | 6.7%), Construction & Extraction (68 | 3.2%), and Farming, Fishing & Forestry (55 | 2.5%).
Natural Resources, Construction and Maintenance Occupations by Sex
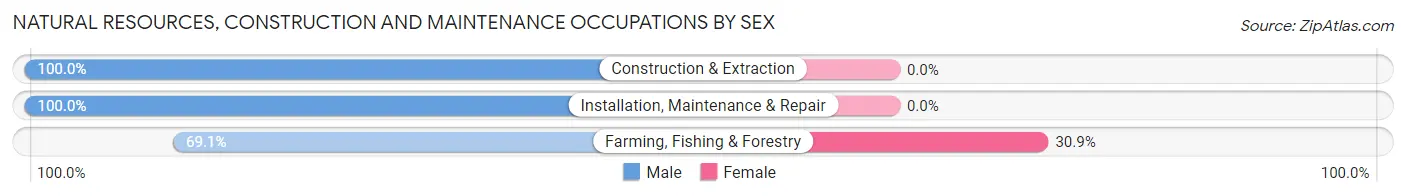
| Occupation | Male | Female |
| Farming, Fishing & Forestry | 38 (69.1%) | 17 (30.9%) |
| Construction & Extraction | 68 (100.0%) | 0 (0.0%) |
| Installation, Maintenance & Repair | 145 (100.0%) | 0 (0.0%) |
| Total (Category) | 251 (93.7%) | 17 (6.3%) |
| Total (Overall) | 1,118 (51.7%) | 1,044 (48.3%) |
Production, Transportation and Moving Occupations
The most common Production, Transportation and Moving occupations in Norton County are Production (151 | 7.0%), Transportation (68 | 3.2%), and Material Moving (18 | 0.8%).
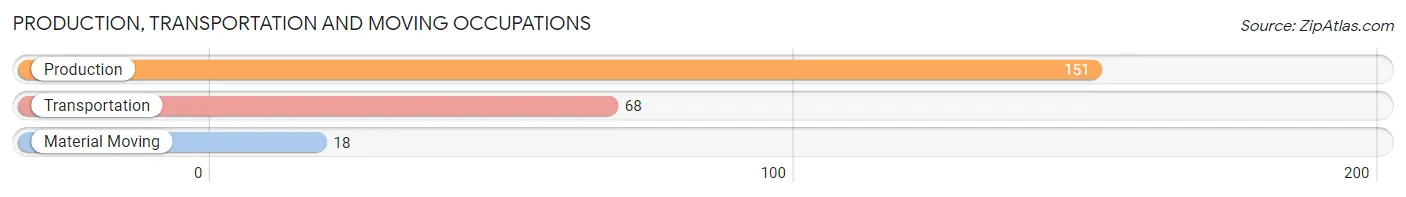
Production, Transportation and Moving Occupations by Sex
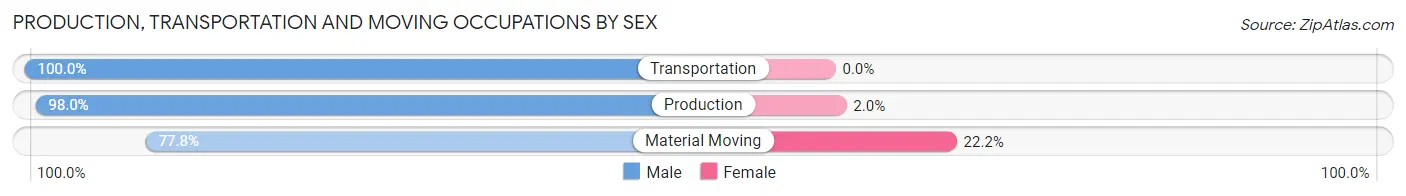
| Occupation | Male | Female |
| Production | 148 (98.0%) | 3 (2.0%) |
| Transportation | 68 (100.0%) | 0 (0.0%) |
| Material Moving | 14 (77.8%) | 4 (22.2%) |
| Total (Category) | 230 (97.1%) | 7 (2.9%) |
| Total (Overall) | 1,118 (51.7%) | 1,044 (48.3%) |
Employment Industries by Sex in Norton County
Employment Industries in Norton County
The major employment industries in Norton County include Health Care & Social Assistance (504 | 23.3%), Manufacturing (325 | 15.0%), Finance & Insurance (164 | 7.6%), Retail Trade (162 | 7.5%), and Accommodation & Food Services (134 | 6.2%).

Employment Industries by Sex in Norton County
The Norton County industries that see more men than women are Construction (100.0%), Enterprise Management (100.0%), and Transportation & Warehousing (93.3%), whereas the industries that tend to have a higher number of women are Utilities (100.0%), Arts, Entertainment & Recreation (100.0%), and Finance & Insurance (92.1%).
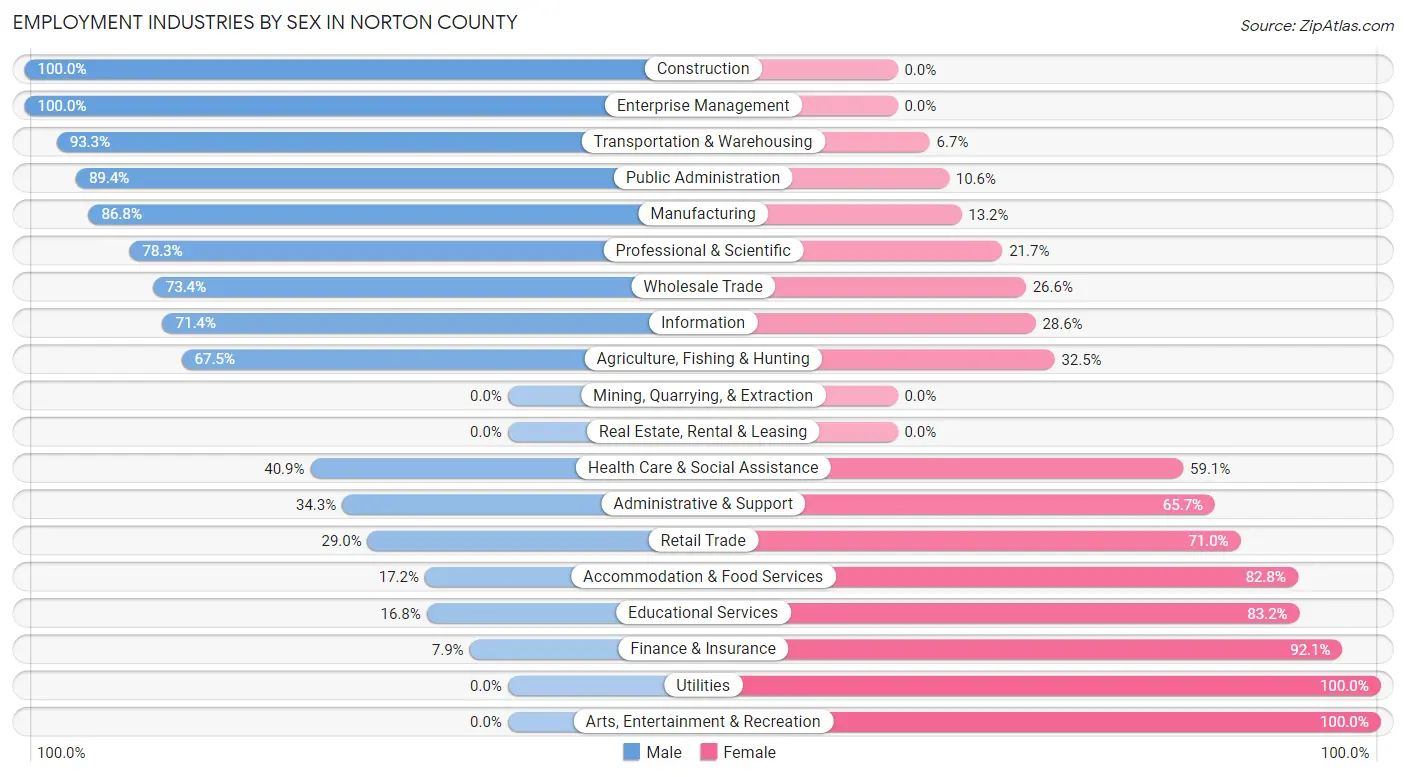
| Industry | Male | Female |
| Agriculture, Fishing & Hunting | 81 (67.5%) | 39 (32.5%) |
| Mining, Quarrying, & Extraction | 0 (0.0%) | 0 (0.0%) |
| Construction | 105 (100.0%) | 0 (0.0%) |
| Manufacturing | 282 (86.8%) | 43 (13.2%) |
| Wholesale Trade | 47 (73.4%) | 17 (26.6%) |
| Retail Trade | 47 (29.0%) | 115 (71.0%) |
| Transportation & Warehousing | 28 (93.3%) | 2 (6.7%) |
| Utilities | 0 (0.0%) | 68 (100.0%) |
| Information | 35 (71.4%) | 14 (28.6%) |
| Finance & Insurance | 13 (7.9%) | 151 (92.1%) |
| Real Estate, Rental & Leasing | 0 (0.0%) | 0 (0.0%) |
| Professional & Scientific | 65 (78.3%) | 18 (21.7%) |
| Enterprise Management | 16 (100.0%) | 0 (0.0%) |
| Administrative & Support | 12 (34.3%) | 23 (65.7%) |
| Educational Services | 22 (16.8%) | 109 (83.2%) |
| Health Care & Social Assistance | 206 (40.9%) | 298 (59.1%) |
| Arts, Entertainment & Recreation | 0 (0.0%) | 1 (100.0%) |
| Accommodation & Food Services | 23 (17.2%) | 111 (82.8%) |
| Public Administration | 84 (89.4%) | 10 (10.6%) |
| Total | 1,118 (51.7%) | 1,044 (48.3%) |
Education in Norton County
School Enrollment in Norton County
The most common levels of schooling among the 852 students in Norton County are middle school (210 | 24.6%), high school (199 | 23.4%), and elementary school (189 | 22.2%).
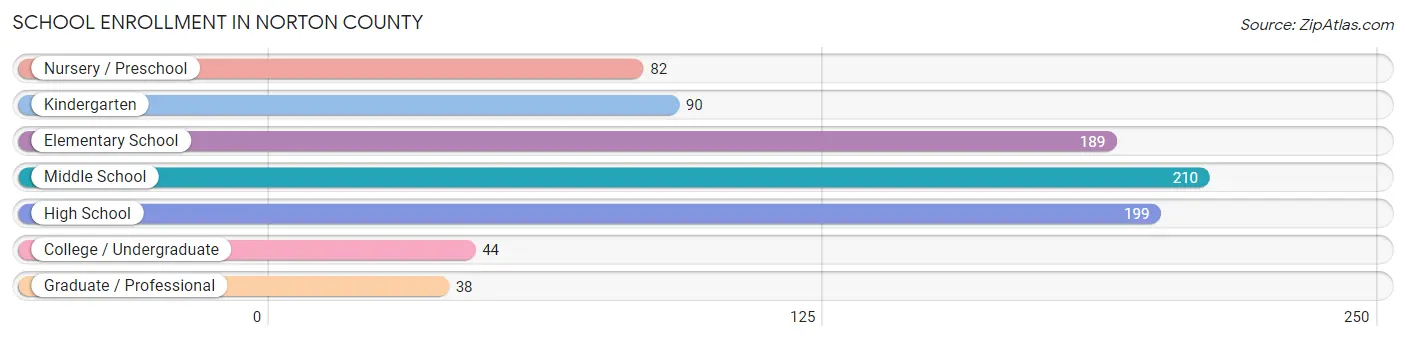
| School Level | # Students | % Students |
| Nursery / Preschool | 82 | 9.6% |
| Kindergarten | 90 | 10.6% |
| Elementary School | 189 | 22.2% |
| Middle School | 210 | 24.6% |
| High School | 199 | 23.4% |
| College / Undergraduate | 44 | 5.2% |
| Graduate / Professional | 38 | 4.5% |
| Total | 852 | 100.0% |
School Enrollment by Age by Funding Source in Norton County
Out of a total of 852 students who are enrolled in schools in Norton County, 92 (10.8%) attend a private institution, while the remaining 760 (89.2%) are enrolled in public schools. The age group of 3 to 4 year olds has the highest likelihood of being enrolled in private schools, with 7 (25.9% in the age bracket) enrolled. Conversely, the age group of 15 to 17 year olds has the lowest likelihood of being enrolled in a private school, with 162 (100.0% in the age bracket) attending a public institution.
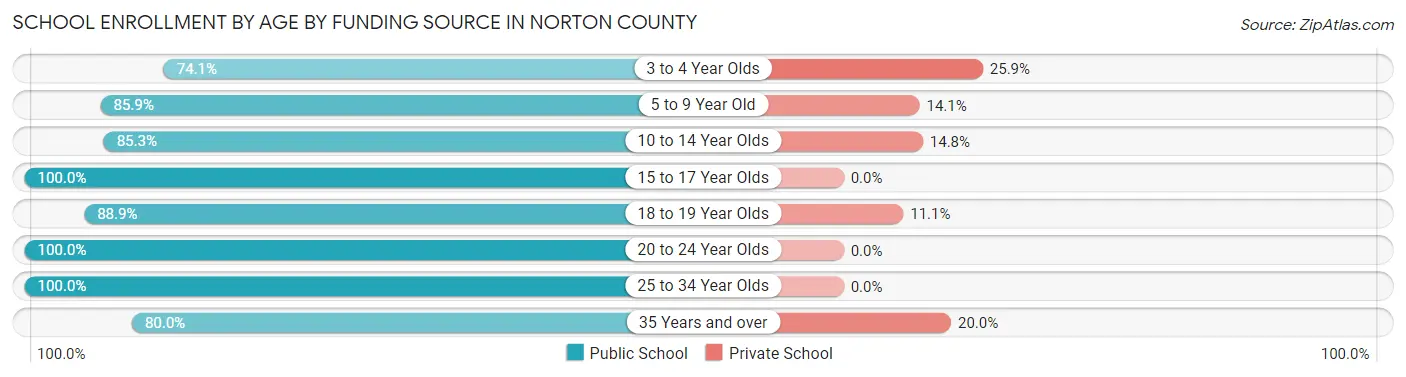
| Age Bracket | Public School | Private School |
| 3 to 4 Year Olds | 20 (74.1%) | 7 (25.9%) |
| 5 to 9 Year Old | 261 (85.9%) | 43 (14.1%) |
| 10 to 14 Year Olds | 208 (85.3%) | 36 (14.7%) |
| 15 to 17 Year Olds | 162 (100.0%) | 0 (0.0%) |
| 18 to 19 Year Olds | 8 (88.9%) | 1 (11.1%) |
| 20 to 24 Year Olds | 36 (100.0%) | 0 (0.0%) |
| 25 to 34 Year Olds | 45 (100.0%) | 0 (0.0%) |
| 35 Years and over | 20 (80.0%) | 5 (20.0%) |
| Total | 760 (89.2%) | 92 (10.8%) |
Educational Attainment by Field of Study in Norton County
Education (289 | 33.3%), liberal arts & history (107 | 12.3%), business (94 | 10.8%), science & technology (84 | 9.7%), and engineering (68 | 7.8%) are the most common fields of study among 869 individuals in Norton County who have obtained a bachelor's degree or higher.
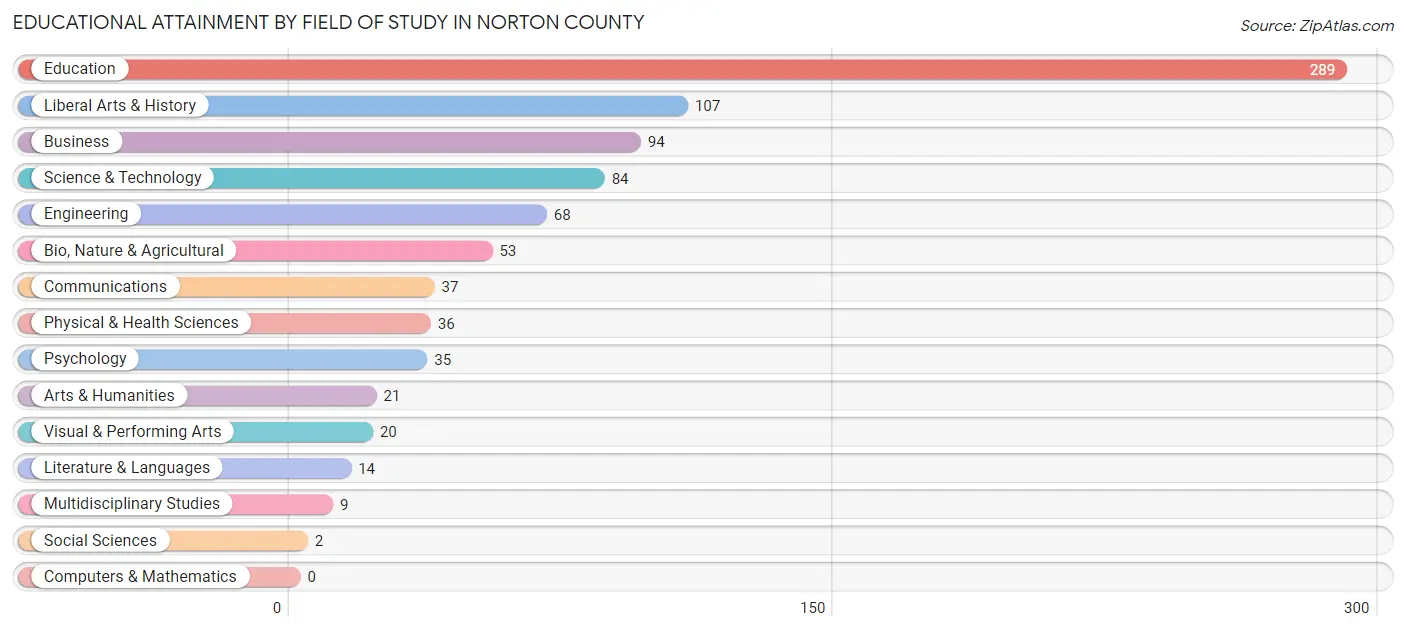
| Field of Study | # Graduates | % Graduates |
| Computers & Mathematics | 0 | 0.0% |
| Bio, Nature & Agricultural | 53 | 6.1% |
| Physical & Health Sciences | 36 | 4.1% |
| Psychology | 35 | 4.0% |
| Social Sciences | 2 | 0.2% |
| Engineering | 68 | 7.8% |
| Multidisciplinary Studies | 9 | 1.0% |
| Science & Technology | 84 | 9.7% |
| Business | 94 | 10.8% |
| Education | 289 | 33.3% |
| Literature & Languages | 14 | 1.6% |
| Liberal Arts & History | 107 | 12.3% |
| Visual & Performing Arts | 20 | 2.3% |
| Communications | 37 | 4.3% |
| Arts & Humanities | 21 | 2.4% |
| Total | 869 | 100.0% |
Transportation & Commute in Norton County
Vehicle Availability by Sex in Norton County
The most prevalent vehicle ownership categories in Norton County are males with 2 vehicles (418, accounting for 39.7%) and females with 2 vehicles (254, making up 41.1%).

| Vehicles Available | Male | Female |
| No Vehicle | 5 (0.5%) | 2 (0.2%) |
| 1 Vehicle | 93 (8.8%) | 291 (28.6%) |
| 2 Vehicles | 418 (39.7%) | 254 (24.9%) |
| 3 Vehicles | 264 (25.1%) | 194 (19.1%) |
| 4 Vehicles | 173 (16.4%) | 198 (19.5%) |
| 5 or more Vehicles | 100 (9.5%) | 79 (7.8%) |
| Total | 1,053 (100.0%) | 1,018 (100.0%) |
Commute Time in Norton County
The most frequently occuring commute durations in Norton County are less than 5 minutes (553 commuters, 29.2%), 5 to 9 minutes (481 commuters, 25.4%), and 10 to 14 minutes (336 commuters, 17.7%).
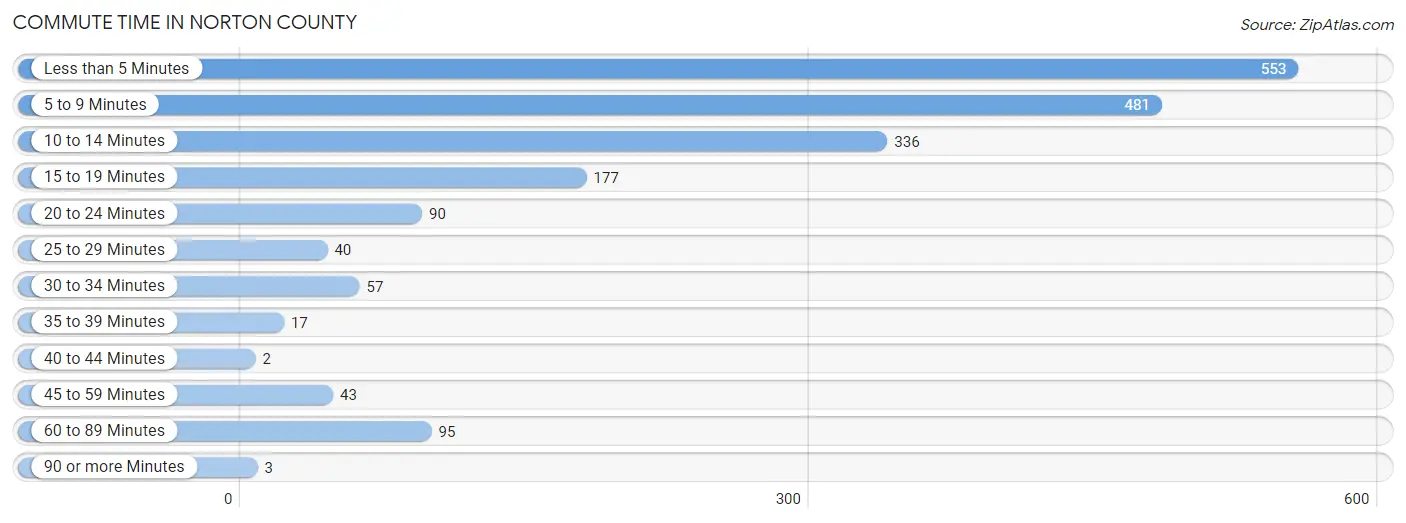
| Commute Time | # Commuters | % Commuters |
| Less than 5 Minutes | 553 | 29.2% |
| 5 to 9 Minutes | 481 | 25.4% |
| 10 to 14 Minutes | 336 | 17.7% |
| 15 to 19 Minutes | 177 | 9.3% |
| 20 to 24 Minutes | 90 | 4.8% |
| 25 to 29 Minutes | 40 | 2.1% |
| 30 to 34 Minutes | 57 | 3.0% |
| 35 to 39 Minutes | 17 | 0.9% |
| 40 to 44 Minutes | 2 | 0.1% |
| 45 to 59 Minutes | 43 | 2.3% |
| 60 to 89 Minutes | 95 | 5.0% |
| 90 or more Minutes | 3 | 0.2% |
Commute Time by Sex in Norton County
The most common commute times in Norton County are less than 5 minutes (369 commuters, 38.2%) for males and 5 to 9 minutes (246 commuters, 26.5%) for females.
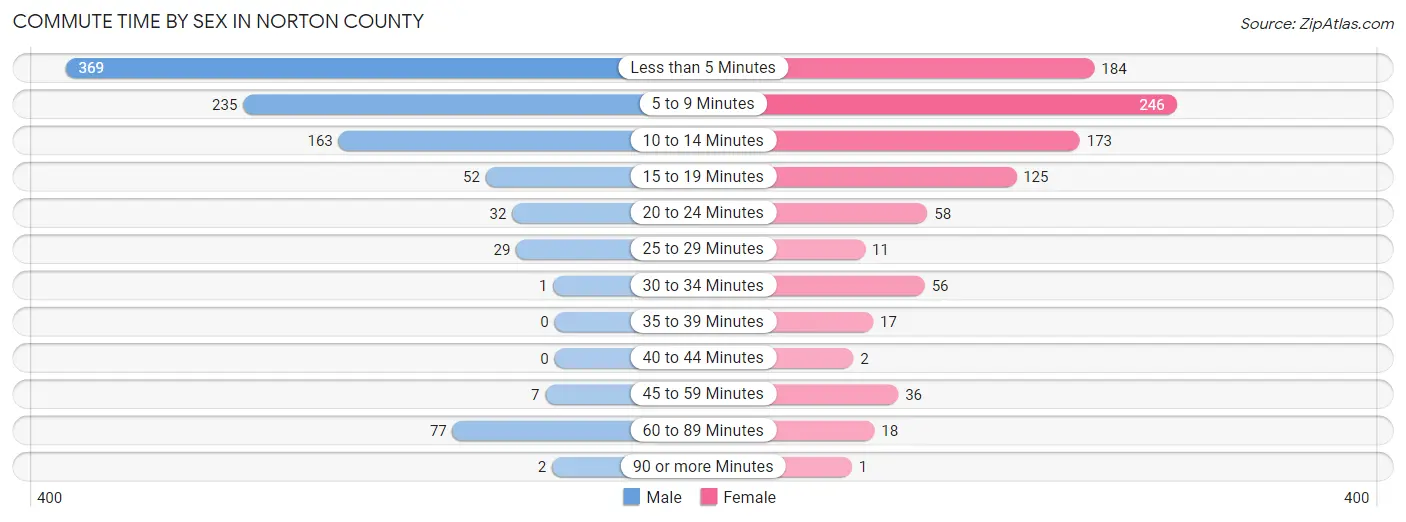
| Commute Time | Male | Female |
| Less than 5 Minutes | 369 (38.2%) | 184 (19.9%) |
| 5 to 9 Minutes | 235 (24.3%) | 246 (26.5%) |
| 10 to 14 Minutes | 163 (16.9%) | 173 (18.7%) |
| 15 to 19 Minutes | 52 (5.4%) | 125 (13.5%) |
| 20 to 24 Minutes | 32 (3.3%) | 58 (6.3%) |
| 25 to 29 Minutes | 29 (3.0%) | 11 (1.2%) |
| 30 to 34 Minutes | 1 (0.1%) | 56 (6.0%) |
| 35 to 39 Minutes | 0 (0.0%) | 17 (1.8%) |
| 40 to 44 Minutes | 0 (0.0%) | 2 (0.2%) |
| 45 to 59 Minutes | 7 (0.7%) | 36 (3.9%) |
| 60 to 89 Minutes | 77 (8.0%) | 18 (1.9%) |
| 90 or more Minutes | 2 (0.2%) | 1 (0.1%) |
Time of Departure to Work by Sex in Norton County
The most frequent times of departure to work in Norton County are 7:00 AM to 7:29 AM (274, 28.3%) for males and 7:30 AM to 7:59 AM (375, 40.5%) for females.
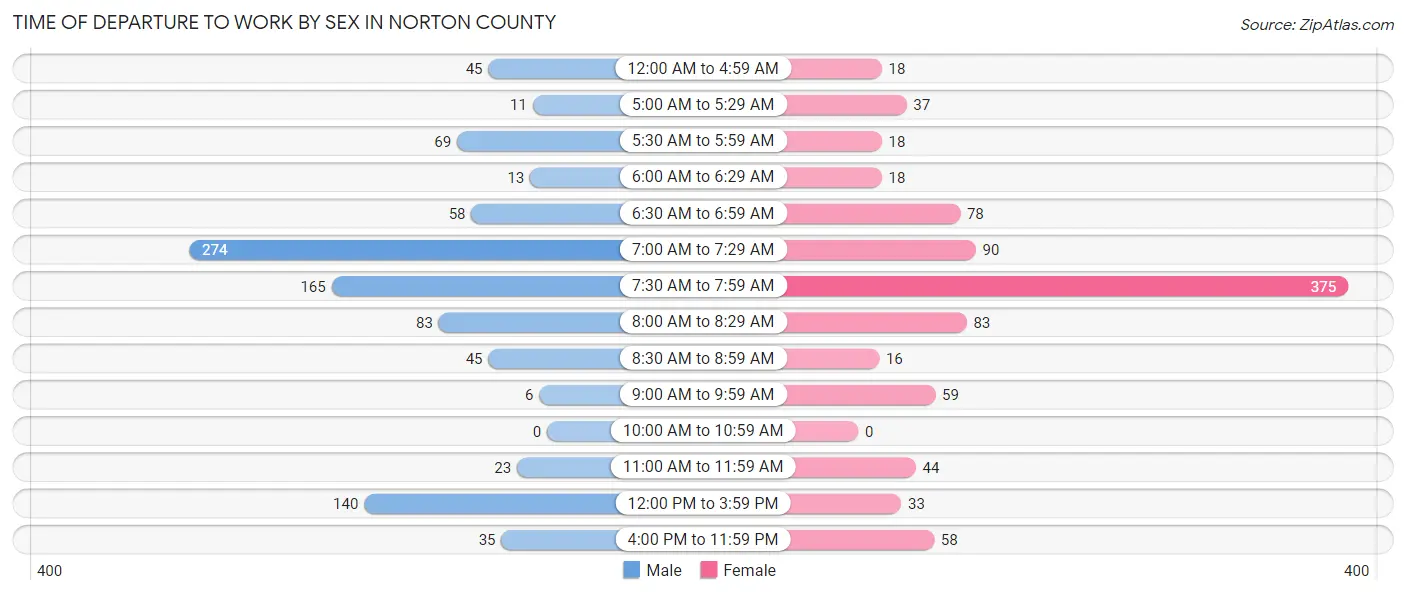
| Time of Departure | Male | Female |
| 12:00 AM to 4:59 AM | 45 (4.6%) | 18 (1.9%) |
| 5:00 AM to 5:29 AM | 11 (1.1%) | 37 (4.0%) |
| 5:30 AM to 5:59 AM | 69 (7.1%) | 18 (1.9%) |
| 6:00 AM to 6:29 AM | 13 (1.3%) | 18 (1.9%) |
| 6:30 AM to 6:59 AM | 58 (6.0%) | 78 (8.4%) |
| 7:00 AM to 7:29 AM | 274 (28.3%) | 90 (9.7%) |
| 7:30 AM to 7:59 AM | 165 (17.1%) | 375 (40.5%) |
| 8:00 AM to 8:29 AM | 83 (8.6%) | 83 (8.9%) |
| 8:30 AM to 8:59 AM | 45 (4.6%) | 16 (1.7%) |
| 9:00 AM to 9:59 AM | 6 (0.6%) | 59 (6.4%) |
| 10:00 AM to 10:59 AM | 0 (0.0%) | 0 (0.0%) |
| 11:00 AM to 11:59 AM | 23 (2.4%) | 44 (4.8%) |
| 12:00 PM to 3:59 PM | 140 (14.5%) | 33 (3.6%) |
| 4:00 PM to 11:59 PM | 35 (3.6%) | 58 (6.3%) |
| Total | 967 (100.0%) | 927 (100.0%) |
Housing Occupancy in Norton County
Occupancy by Ownership in Norton County
Of the total 1,881 dwellings in Norton County, owner-occupied units account for 1,432 (76.1%), while renter-occupied units make up 449 (23.9%).

| Occupancy | # Housing Units | % Housing Units |
| Owner Occupied Housing Units | 1,432 | 76.1% |
| Renter-Occupied Housing Units | 449 | 23.9% |
| Total Occupied Housing Units | 1,881 | 100.0% |
Occupancy by Household Size in Norton County
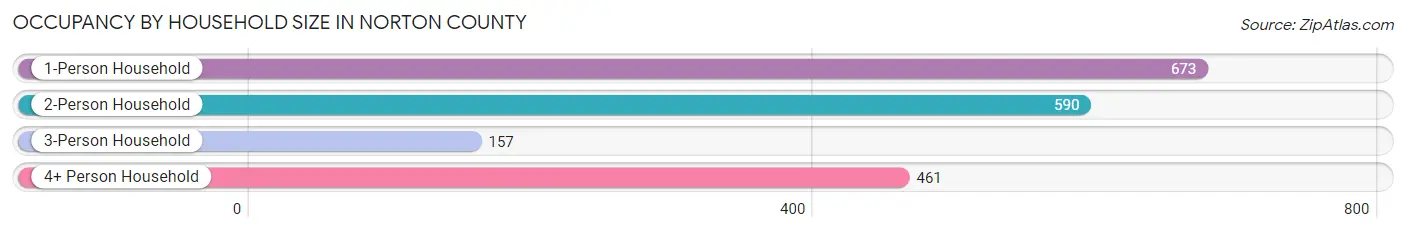
| Household Size | # Housing Units | % Housing Units |
| 1-Person Household | 673 | 35.8% |
| 2-Person Household | 590 | 31.4% |
| 3-Person Household | 157 | 8.4% |
| 4+ Person Household | 461 | 24.5% |
| Total Housing Units | 1,881 | 100.0% |
Occupancy by Ownership by Household Size in Norton County
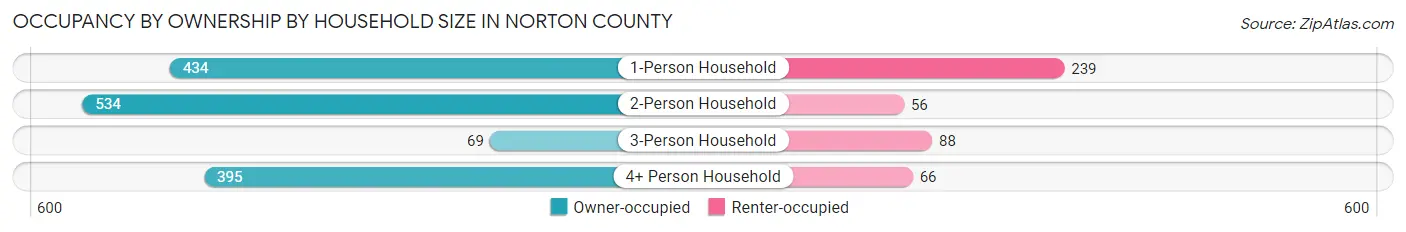
| Household Size | Owner-occupied | Renter-occupied |
| 1-Person Household | 434 (64.5%) | 239 (35.5%) |
| 2-Person Household | 534 (90.5%) | 56 (9.5%) |
| 3-Person Household | 69 (44.0%) | 88 (56.0%) |
| 4+ Person Household | 395 (85.7%) | 66 (14.3%) |
| Total Housing Units | 1,432 (76.1%) | 449 (23.9%) |
Occupancy by Educational Attainment in Norton County
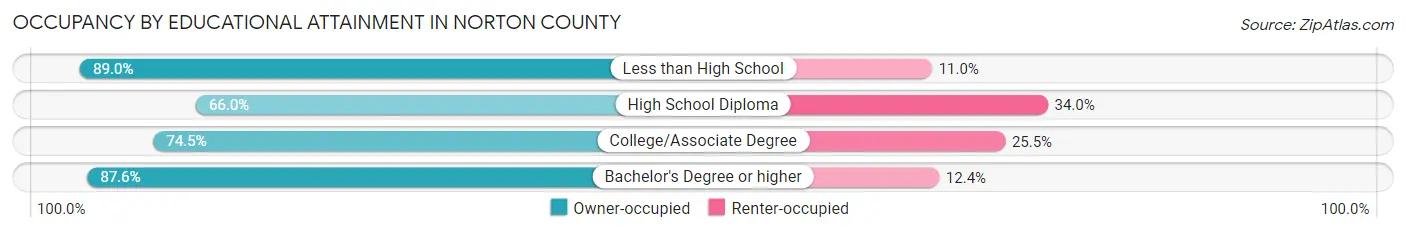
| Household Size | Owner-occupied | Renter-occupied |
| Less than High School | 97 (89.0%) | 12 (11.0%) |
| High School Diploma | 340 (66.0%) | 175 (34.0%) |
| College/Associate Degree | 601 (74.5%) | 206 (25.5%) |
| Bachelor's Degree or higher | 394 (87.6%) | 56 (12.4%) |
Occupancy by Age of Householder in Norton County

| Age Bracket | # Households | % Households |
| Under 35 Years | 288 | 15.3% |
| 35 to 44 Years | 401 | 21.3% |
| 45 to 54 Years | 172 | 9.1% |
| 55 to 64 Years | 407 | 21.6% |
| 65 to 74 Years | 332 | 17.6% |
| 75 to 84 Years | 229 | 12.2% |
| 85 Years and Over | 52 | 2.8% |
| Total | 1,881 | 100.0% |
Housing Finances in Norton County
Median Income by Occupancy in Norton County
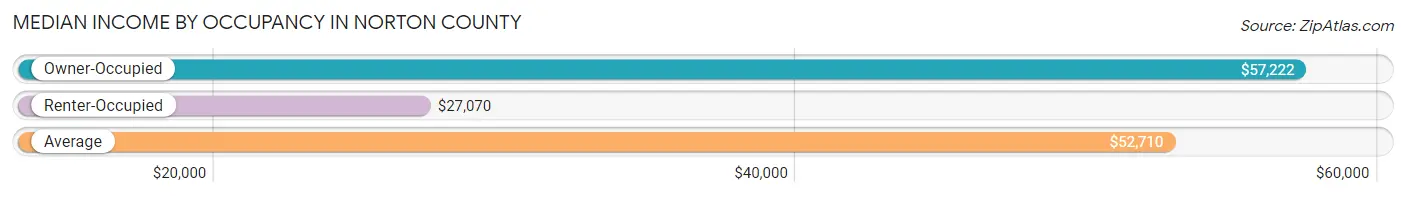
| Occupancy Type | # Households | Median Income |
| Owner-Occupied | 1,432 (76.1%) | $57,222 |
| Renter-Occupied | 449 (23.9%) | $27,070 |
| Average | 1,881 (100.0%) | $52,710 |
Occupancy by Householder Income Bracket in Norton County
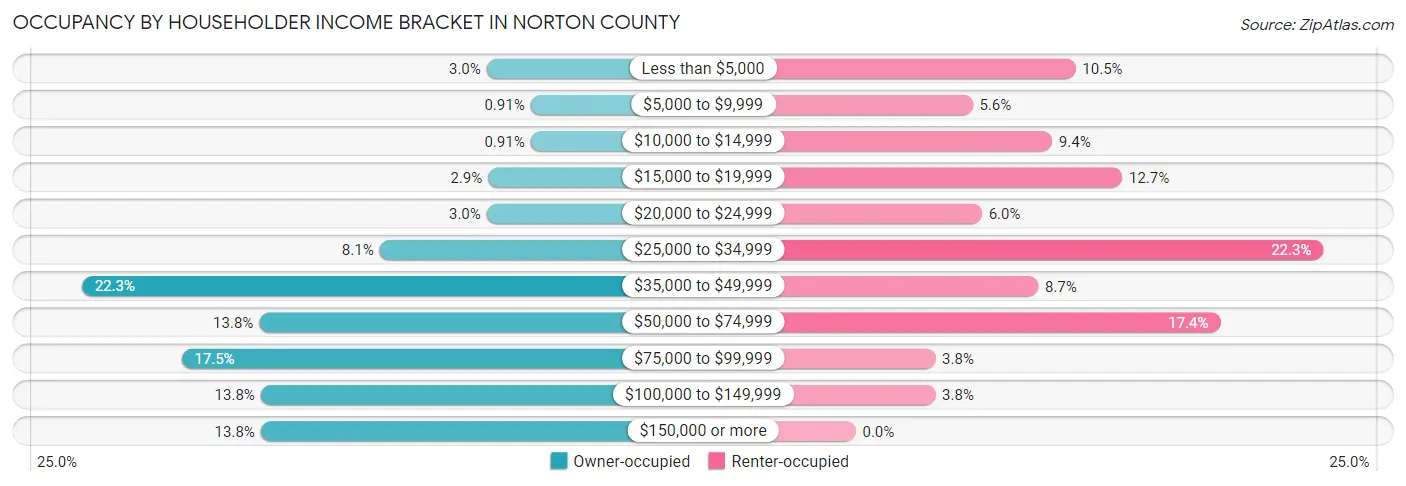
| Income Bracket | Owner-occupied | Renter-occupied |
| Less than $5,000 | 43 (3.0%) | 47 (10.5%) |
| $5,000 to $9,999 | 13 (0.9%) | 25 (5.6%) |
| $10,000 to $14,999 | 13 (0.9%) | 42 (9.3%) |
| $15,000 to $19,999 | 42 (2.9%) | 57 (12.7%) |
| $20,000 to $24,999 | 43 (3.0%) | 27 (6.0%) |
| $25,000 to $34,999 | 116 (8.1%) | 100 (22.3%) |
| $35,000 to $49,999 | 319 (22.3%) | 39 (8.7%) |
| $50,000 to $74,999 | 198 (13.8%) | 78 (17.4%) |
| $75,000 to $99,999 | 251 (17.5%) | 17 (3.8%) |
| $100,000 to $149,999 | 197 (13.8%) | 17 (3.8%) |
| $150,000 or more | 197 (13.8%) | 0 (0.0%) |
| Total | 1,432 (100.0%) | 449 (100.0%) |
Monthly Housing Cost Tiers in Norton County
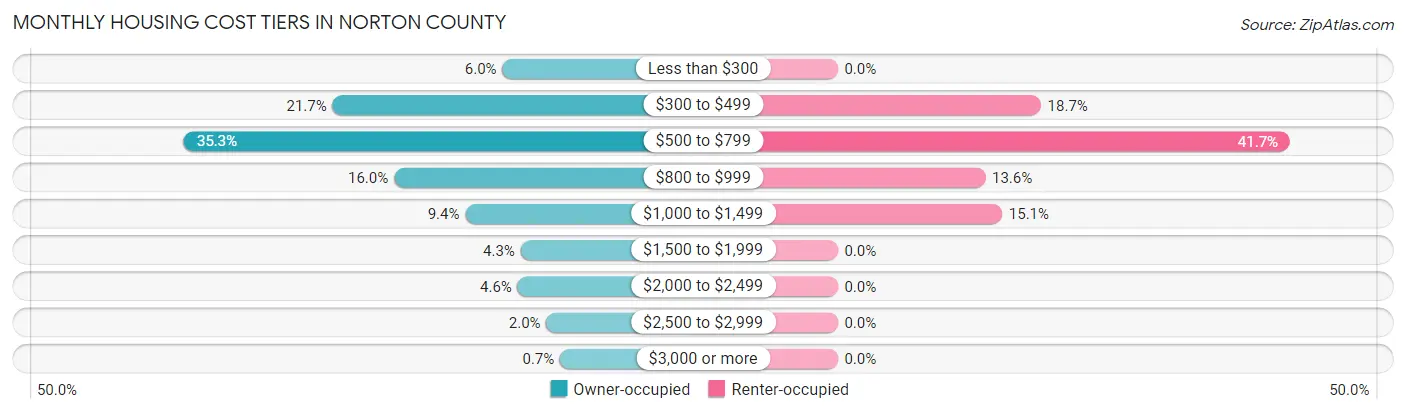
| Monthly Cost | Owner-occupied | Renter-occupied |
| Less than $300 | 86 (6.0%) | 0 (0.0%) |
| $300 to $499 | 310 (21.6%) | 84 (18.7%) |
| $500 to $799 | 506 (35.3%) | 187 (41.6%) |
| $800 to $999 | 229 (16.0%) | 61 (13.6%) |
| $1,000 to $1,499 | 135 (9.4%) | 68 (15.1%) |
| $1,500 to $1,999 | 62 (4.3%) | 0 (0.0%) |
| $2,000 to $2,499 | 66 (4.6%) | 0 (0.0%) |
| $2,500 to $2,999 | 28 (2.0%) | 0 (0.0%) |
| $3,000 or more | 10 (0.7%) | 0 (0.0%) |
| Total | 1,432 (100.0%) | 449 (100.0%) |
Physical Housing Characteristics in Norton County
Housing Structures in Norton County
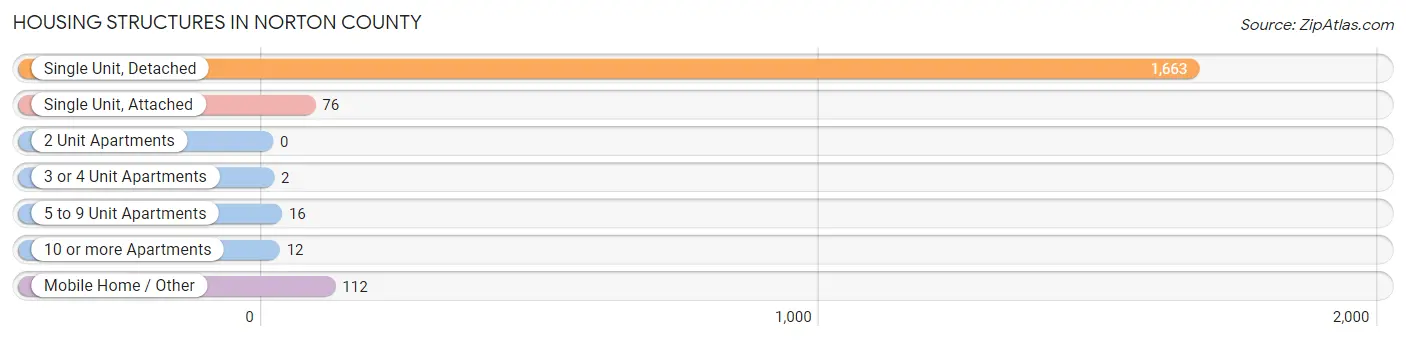
| Structure Type | # Housing Units | % Housing Units |
| Single Unit, Detached | 1,663 | 88.4% |
| Single Unit, Attached | 76 | 4.0% |
| 2 Unit Apartments | 0 | 0.0% |
| 3 or 4 Unit Apartments | 2 | 0.1% |
| 5 to 9 Unit Apartments | 16 | 0.9% |
| 10 or more Apartments | 12 | 0.6% |
| Mobile Home / Other | 112 | 5.9% |
| Total | 1,881 | 100.0% |
Housing Structures by Occupancy in Norton County
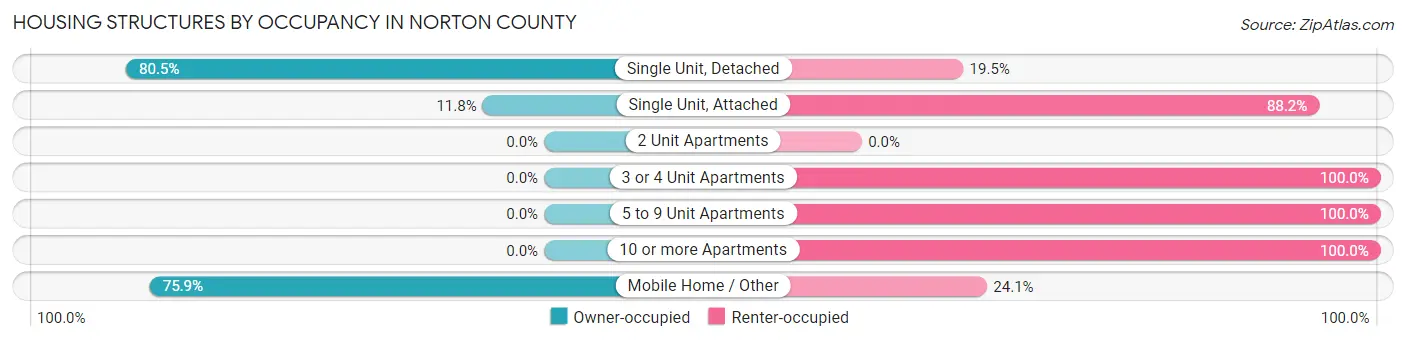
| Structure Type | Owner-occupied | Renter-occupied |
| Single Unit, Detached | 1,338 (80.5%) | 325 (19.5%) |
| Single Unit, Attached | 9 (11.8%) | 67 (88.2%) |
| 2 Unit Apartments | 0 (0.0%) | 0 (0.0%) |
| 3 or 4 Unit Apartments | 0 (0.0%) | 2 (100.0%) |
| 5 to 9 Unit Apartments | 0 (0.0%) | 16 (100.0%) |
| 10 or more Apartments | 0 (0.0%) | 12 (100.0%) |
| Mobile Home / Other | 85 (75.9%) | 27 (24.1%) |
| Total | 1,432 (76.1%) | 449 (23.9%) |
Housing Structures by Number of Rooms in Norton County

| Number of Rooms | Owner-occupied | Renter-occupied |
| 1 Room | 0 (0.0%) | 0 (0.0%) |
| 2 or 3 Rooms | 12 (0.8%) | 44 (9.8%) |
| 4 or 5 Rooms | 313 (21.9%) | 248 (55.2%) |
| 6 or 7 Rooms | 426 (29.7%) | 35 (7.8%) |
| 8 or more Rooms | 681 (47.6%) | 122 (27.2%) |
| Total | 1,432 (100.0%) | 449 (100.0%) |
Housing Structure by Heating Type in Norton County

| Heating Type | Owner-occupied | Renter-occupied |
| Utility Gas | 942 (65.8%) | 355 (79.1%) |
| Bottled, Tank, or LP Gas | 373 (26.1%) | 33 (7.3%) |
| Electricity | 84 (5.9%) | 49 (10.9%) |
| Fuel Oil or Kerosene | 2 (0.1%) | 0 (0.0%) |
| Coal or Coke | 0 (0.0%) | 0 (0.0%) |
| All other Fuels | 10 (0.7%) | 12 (2.7%) |
| No Fuel Used | 21 (1.5%) | 0 (0.0%) |
| Total | 1,432 (100.0%) | 449 (100.0%) |
Household Vehicle Usage in Norton County
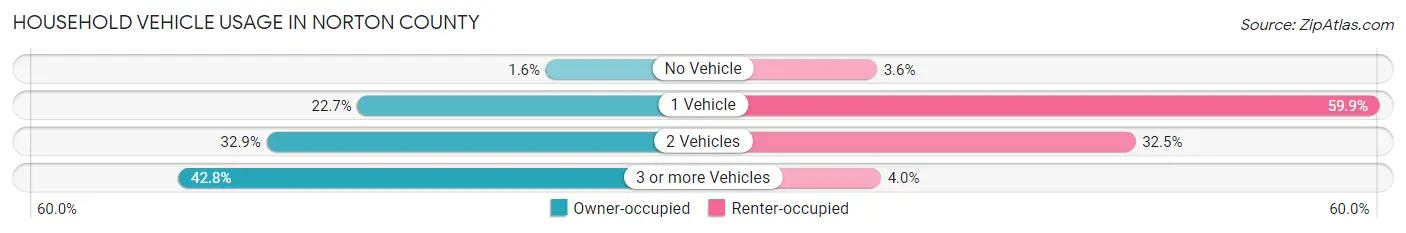
| Vehicles per Household | Owner-occupied | Renter-occupied |
| No Vehicle | 23 (1.6%) | 16 (3.6%) |
| 1 Vehicle | 325 (22.7%) | 269 (59.9%) |
| 2 Vehicles | 471 (32.9%) | 146 (32.5%) |
| 3 or more Vehicles | 613 (42.8%) | 18 (4.0%) |
| Total | 1,432 (100.0%) | 449 (100.0%) |
Real Estate & Mortgages in Norton County
Real Estate and Mortgage Overview in Norton County
| Characteristic | Without Mortgage | With Mortgage |
| Housing Units | 859 | 573 |
| Median Property Value | $105,800 | $118,600 |
| Median Household Income | $52,785 | $121 |
| Monthly Housing Costs | $528 | $9 |
| Real Estate Taxes | $1,785 | $35 |
Property Value by Mortgage Status in Norton County
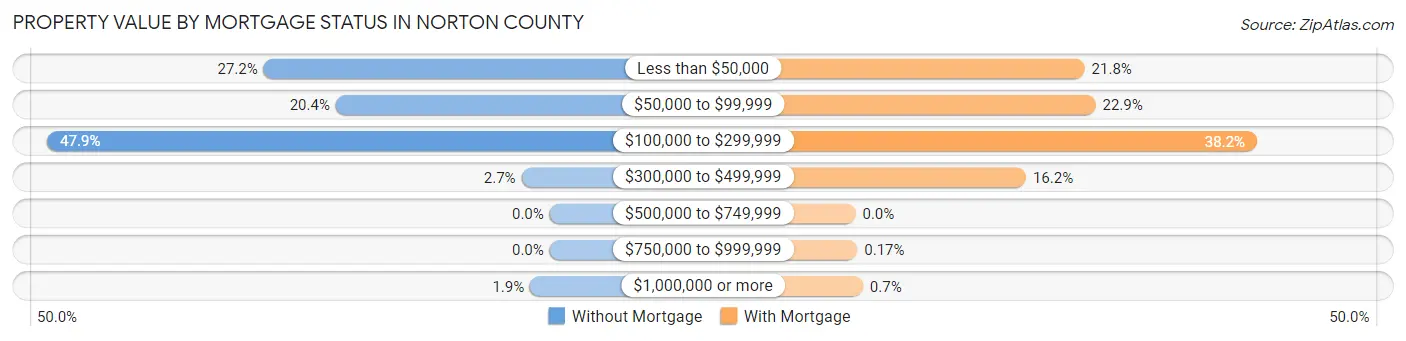
| Property Value | Without Mortgage | With Mortgage |
| Less than $50,000 | 234 (27.2%) | 125 (21.8%) |
| $50,000 to $99,999 | 175 (20.4%) | 131 (22.9%) |
| $100,000 to $299,999 | 411 (47.8%) | 219 (38.2%) |
| $300,000 to $499,999 | 23 (2.7%) | 93 (16.2%) |
| $500,000 to $749,999 | 0 (0.0%) | 0 (0.0%) |
| $750,000 to $999,999 | 0 (0.0%) | 1 (0.2%) |
| $1,000,000 or more | 16 (1.9%) | 4 (0.7%) |
| Total | 859 (100.0%) | 573 (100.0%) |
Household Income by Mortgage Status in Norton County
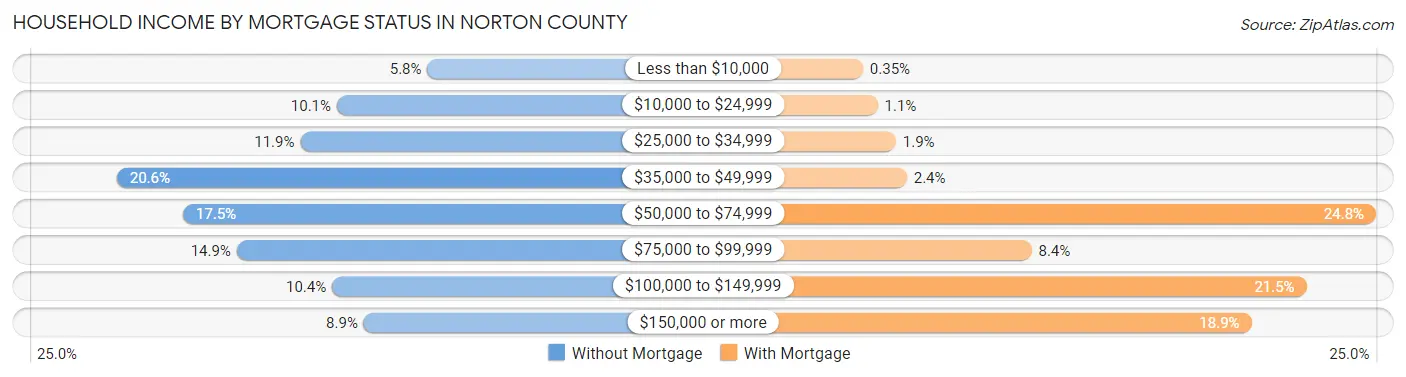
| Household Income | Without Mortgage | With Mortgage |
| Less than $10,000 | 50 (5.8%) | 2 (0.4%) |
| $10,000 to $24,999 | 87 (10.1%) | 6 (1.1%) |
| $25,000 to $34,999 | 102 (11.9%) | 11 (1.9%) |
| $35,000 to $49,999 | 177 (20.6%) | 14 (2.4%) |
| $50,000 to $74,999 | 150 (17.5%) | 142 (24.8%) |
| $75,000 to $99,999 | 128 (14.9%) | 48 (8.4%) |
| $100,000 to $149,999 | 89 (10.4%) | 123 (21.5%) |
| $150,000 or more | 76 (8.8%) | 108 (18.9%) |
| Total | 859 (100.0%) | 573 (100.0%) |
Property Value to Household Income Ratio in Norton County
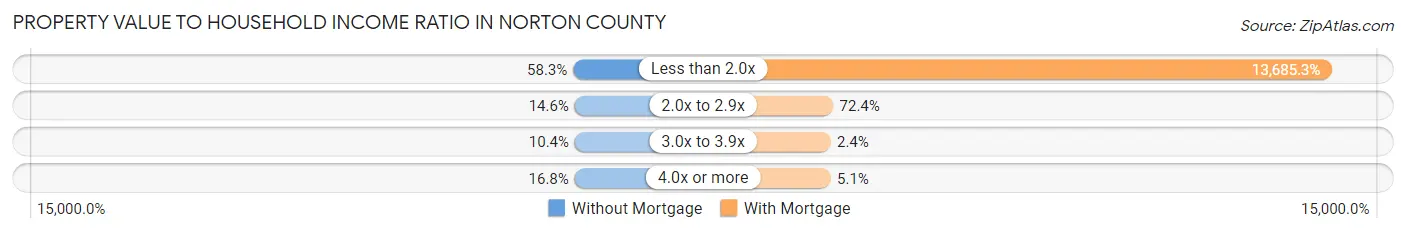
| Value-to-Income Ratio | Without Mortgage | With Mortgage |
| Less than 2.0x | 501 (58.3%) | 78,417 (13,685.3%) |
| 2.0x to 2.9x | 125 (14.5%) | 415 (72.4%) |
| 3.0x to 3.9x | 89 (10.4%) | 14 (2.4%) |
| 4.0x or more | 144 (16.8%) | 29 (5.1%) |
| Total | 859 (100.0%) | 573 (100.0%) |
Real Estate Taxes by Mortgage Status in Norton County
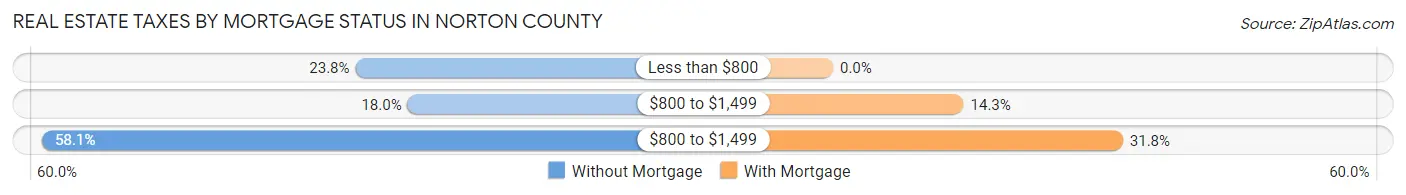
| Property Taxes | Without Mortgage | With Mortgage |
| Less than $800 | 204 (23.7%) | 0 (0.0%) |
| $800 to $1,499 | 155 (18.0%) | 82 (14.3%) |
| $800 to $1,499 | 499 (58.1%) | 182 (31.8%) |
| Total | 859 (100.0%) | 573 (100.0%) |
Health & Disability in Norton County
Health Insurance Coverage by Age in Norton County
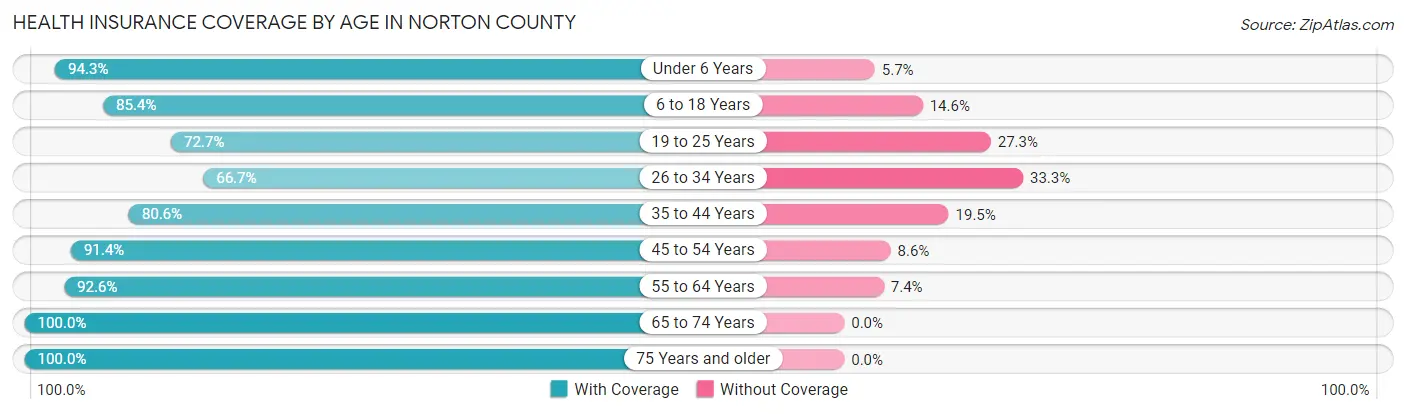
| Age Bracket | With Coverage | Without Coverage |
| Under 6 Years | 414 (94.3%) | 25 (5.7%) |
| 6 to 18 Years | 531 (85.4%) | 91 (14.6%) |
| 19 to 25 Years | 298 (72.7%) | 112 (27.3%) |
| 26 to 34 Years | 308 (66.7%) | 154 (33.3%) |
| 35 to 44 Years | 439 (80.5%) | 106 (19.5%) |
| 45 to 54 Years | 328 (91.4%) | 31 (8.6%) |
| 55 to 64 Years | 616 (92.6%) | 49 (7.4%) |
| 65 to 74 Years | 529 (100.0%) | 0 (0.0%) |
| 75 Years and older | 437 (100.0%) | 0 (0.0%) |
| Total | 3,900 (87.3%) | 568 (12.7%) |
Health Insurance Coverage by Citizenship Status in Norton County
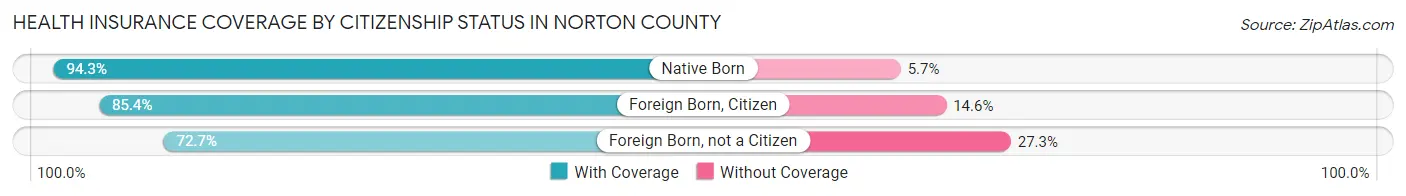
| Citizenship Status | With Coverage | Without Coverage |
| Native Born | 414 (94.3%) | 25 (5.7%) |
| Foreign Born, Citizen | 531 (85.4%) | 91 (14.6%) |
| Foreign Born, not a Citizen | 298 (72.7%) | 112 (27.3%) |
Health Insurance Coverage by Household Income in Norton County
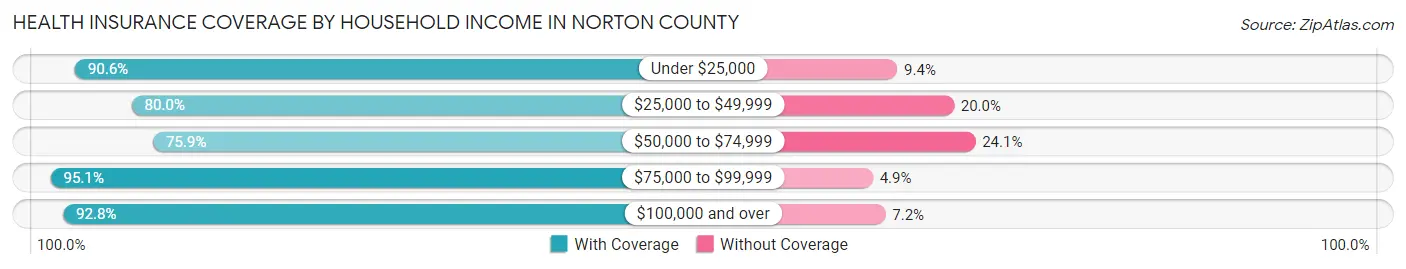
| Household Income | With Coverage | Without Coverage |
| Under $25,000 | 442 (90.6%) | 46 (9.4%) |
| $25,000 to $49,999 | 886 (80.0%) | 222 (20.0%) |
| $50,000 to $74,999 | 505 (75.9%) | 160 (24.1%) |
| $75,000 to $99,999 | 783 (95.1%) | 40 (4.9%) |
| $100,000 and over | 1,284 (92.8%) | 100 (7.2%) |
Public vs Private Health Insurance Coverage by Age in Norton County
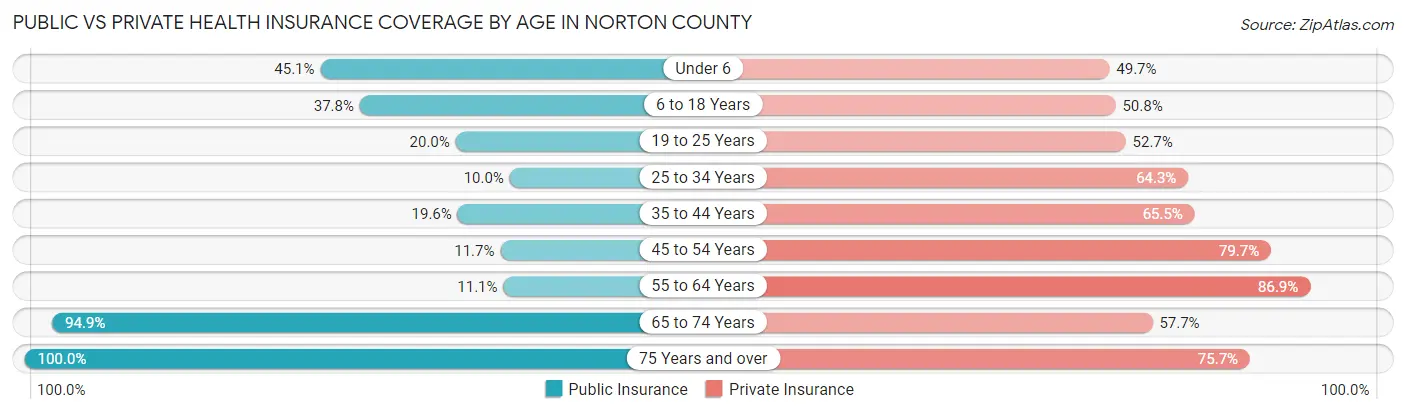
| Age Bracket | Public Insurance | Private Insurance |
| Under 6 | 198 (45.1%) | 218 (49.7%) |
| 6 to 18 Years | 235 (37.8%) | 316 (50.8%) |
| 19 to 25 Years | 82 (20.0%) | 216 (52.7%) |
| 25 to 34 Years | 46 (10.0%) | 297 (64.3%) |
| 35 to 44 Years | 107 (19.6%) | 357 (65.5%) |
| 45 to 54 Years | 42 (11.7%) | 286 (79.7%) |
| 55 to 64 Years | 74 (11.1%) | 578 (86.9%) |
| 65 to 74 Years | 502 (94.9%) | 305 (57.7%) |
| 75 Years and over | 437 (100.0%) | 331 (75.7%) |
| Total | 1,723 (38.6%) | 2,904 (65.0%) |
Disability Status by Sex by Age in Norton County

| Age Bracket | Male | Female |
| Under 5 Years | 0 (0.0%) | 0 (0.0%) |
| 5 to 17 Years | 74 (20.4%) | 36 (9.8%) |
| 18 to 34 Years | 44 (10.3%) | 29 (6.4%) |
| 35 to 64 Years | 91 (12.1%) | 149 (18.2%) |
| 65 to 74 Years | 87 (33.9%) | 59 (21.7%) |
| 75 Years and over | 49 (25.9%) | 83 (33.5%) |
Disability Class by Sex by Age in Norton County
Disability Class: Hearing Difficulty
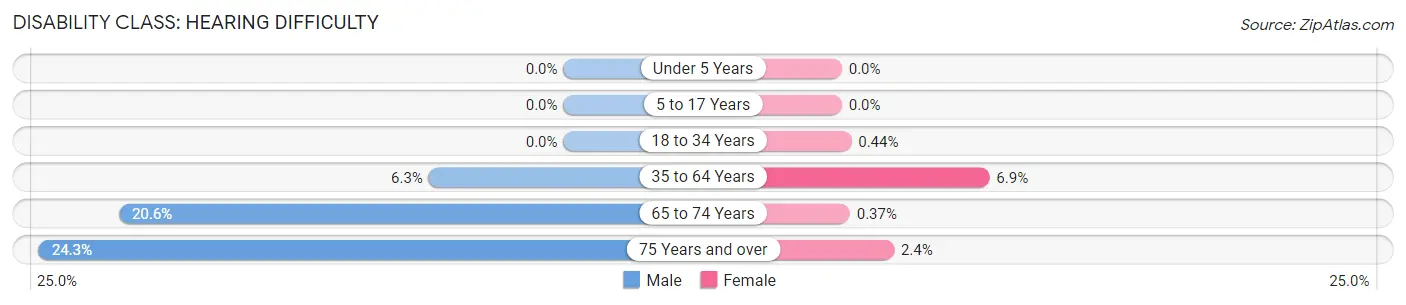
| Age Bracket | Male | Female |
| Under 5 Years | 0 (0.0%) | 0 (0.0%) |
| 5 to 17 Years | 0 (0.0%) | 0 (0.0%) |
| 18 to 34 Years | 0 (0.0%) | 2 (0.4%) |
| 35 to 64 Years | 47 (6.2%) | 56 (6.9%) |
| 65 to 74 Years | 53 (20.6%) | 1 (0.4%) |
| 75 Years and over | 46 (24.3%) | 6 (2.4%) |
Disability Class: Vision Difficulty
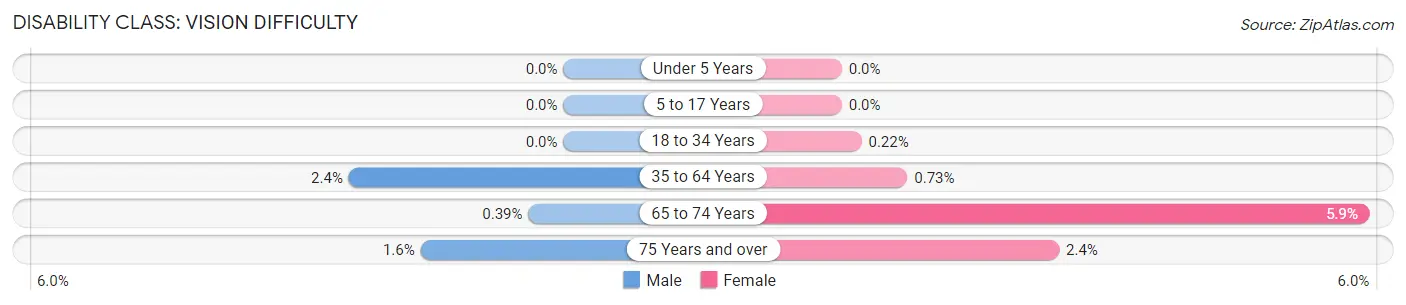
| Age Bracket | Male | Female |
| Under 5 Years | 0 (0.0%) | 0 (0.0%) |
| 5 to 17 Years | 0 (0.0%) | 0 (0.0%) |
| 18 to 34 Years | 0 (0.0%) | 1 (0.2%) |
| 35 to 64 Years | 18 (2.4%) | 6 (0.7%) |
| 65 to 74 Years | 1 (0.4%) | 16 (5.9%) |
| 75 Years and over | 3 (1.6%) | 6 (2.4%) |
Disability Class: Cognitive Difficulty
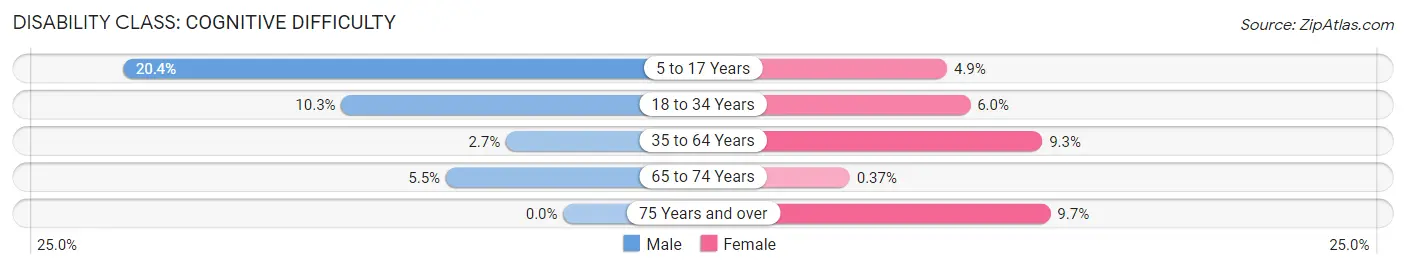
| Age Bracket | Male | Female |
| 5 to 17 Years | 74 (20.4%) | 18 (4.9%) |
| 18 to 34 Years | 44 (10.3%) | 27 (6.0%) |
| 35 to 64 Years | 20 (2.7%) | 76 (9.3%) |
| 65 to 74 Years | 14 (5.4%) | 1 (0.4%) |
| 75 Years and over | 0 (0.0%) | 24 (9.7%) |
Disability Class: Ambulatory Difficulty
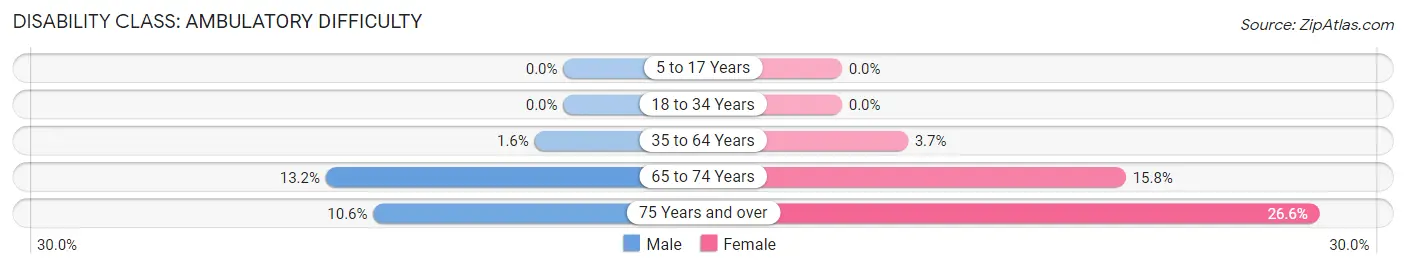
| Age Bracket | Male | Female |
| 5 to 17 Years | 0 (0.0%) | 0 (0.0%) |
| 18 to 34 Years | 0 (0.0%) | 0 (0.0%) |
| 35 to 64 Years | 12 (1.6%) | 30 (3.7%) |
| 65 to 74 Years | 34 (13.2%) | 43 (15.8%) |
| 75 Years and over | 20 (10.6%) | 66 (26.6%) |
Disability Class: Self-Care Difficulty

| Age Bracket | Male | Female |
| 5 to 17 Years | 36 (9.9%) | 0 (0.0%) |
| 18 to 34 Years | 0 (0.0%) | 0 (0.0%) |
| 35 to 64 Years | 9 (1.2%) | 1 (0.1%) |
| 65 to 74 Years | 1 (0.4%) | 30 (11.0%) |
| 75 Years and over | 1 (0.5%) | 16 (6.5%) |
Technology Access in Norton County
Computing Device Access in Norton County
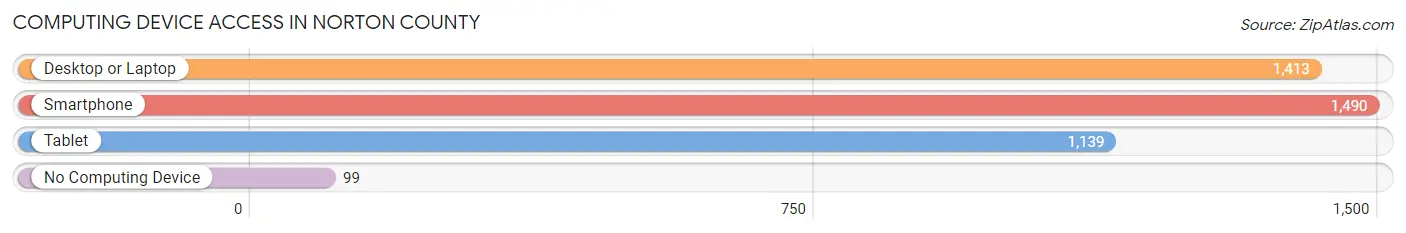
| Device Type | # Households | % Households |
| Desktop or Laptop | 1,413 | 75.1% |
| Smartphone | 1,490 | 79.2% |
| Tablet | 1,139 | 60.6% |
| No Computing Device | 99 | 5.3% |
| Total | 1,881 | 100.0% |
Internet Access in Norton County
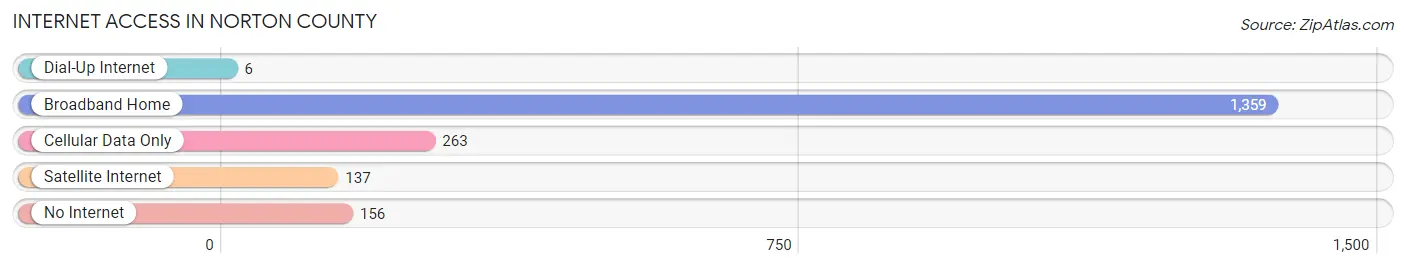
| Internet Type | # Households | % Households |
| Dial-Up Internet | 6 | 0.3% |
| Broadband Home | 1,359 | 72.3% |
| Cellular Data Only | 263 | 14.0% |
| Satellite Internet | 137 | 7.3% |
| No Internet | 156 | 8.3% |
| Total | 1,881 | 100.0% |
Norton County Summary
Norton County is located in the northwest corner of Kansas, and is bordered by Nebraska to the north, Phillips County to the east, Decatur County to the south, and Cheyenne County, Colorado to the west. The county seat is Norton, and the county was named after Orloff Norton, a Union Army officer who was killed in the Civil War. The county has a total area of 890 square miles, and a population of 5,817 as of the 2010 census.
Geography
Norton County is located in the High Plains region of the Great Plains, and is characterized by rolling hills and flat plains. The county is drained by the Republican River, which flows through the county from north to south. The county is also home to several small lakes, including Norton Lake, which is located in the northern part of the county. The county is mostly rural, with the majority of the population living in the small towns of Norton, Almena, and Lenora.
Climate
Norton County has a semi-arid climate, with hot summers and cold winters. The average annual temperature is 54°F, and the average annual precipitation is 20.5 inches. The county is prone to severe weather, including tornadoes, hail, and thunderstorms.
Economy
Norton County's economy is largely based on agriculture, with the majority of the population employed in farming and ranching. The county is also home to several small businesses, including a few restaurants, a grocery store, and a few retail stores. The county is also home to a few manufacturing companies, including a concrete plant and a wind turbine manufacturer.
Demographics
As of the 2010 census, the population of Norton County was 5,817, with a population density of 6.5 people per square mile. The racial makeup of the county was 95.3% White, 0.3% African American, 0.7% Native American, 0.2% Asian, 0.1% Pacific Islander, 1.7% from other races, and 1.9% from two or more races. Hispanic or Latino of any race were 4.2% of the population.
The median income for a household in the county was $37,917, and the median income for a family was $45,938. The per capita income for the county was $18,845. About 11.2% of families and 14.2% of the population were below the poverty line, including 17.2% of those under age 18 and 11.2% of those age 65 or over.
Education
Norton County is served by the Norton Community Unified School District, which includes Norton High School, Norton Middle School, and Norton Elementary School. The county is also home to several private schools, including Norton Christian Academy and Norton Bible Academy. The county is also home to a branch of the North Central Kansas Technical College.
Common Questions
What is the Total Population of Norton County?
Total Population of Norton County is 5,431.
What is the Total Male Population of Norton County?
Total Male Population of Norton County is 3,053.
What is the Total Female Population of Norton County?
Total Female Population of Norton County is 2,378.
What is the Ratio of Males per 100 Females in Norton County?
There are 128.39 Males per 100 Females in Norton County.
What is the Ratio of Females per 100 Males in Norton County?
There are 77.89 Females per 100 Males in Norton County.
What is the Median Population Age in Norton County?
Median Population Age in Norton County is 40.4 Years.
What is the Average Family Size in Norton County
Average Family Size in Norton County is 3.2 People.
What is the Average Household Size in Norton County
Average Household Size in Norton County is 2.4 People.
What is Per Capita Income in Norton County?
Per Capita income in Norton County is $28,514.
What is the Median Family Income in Norton County?
Median Family Income in Norton County is $75,597.
What is the Median Household income in Norton County?
Median Household Income in Norton County is $52,710.
What is Income or Wage Gap in Norton County?
Income or Wage Gap in Norton County is 28.6%.
Women in Norton County earn 71.4 cents for every dollar earned by a man.
What is Family Income Deficit in Norton County?
Family Income Deficit in Norton County is $13,262.
Families that are below poverty line in Norton County earn $13,262 less on average than the poverty threshold level.
What is Inequality or Gini Index in Norton County?
Inequality or Gini Index in Norton County is 0.46.
How Large is the Labor Force in Norton County?
There are 2,191 People in the Labor Forcein in Norton County.
What is the Percentage of People in the Labor Force in Norton County?
48.3% of People are in the Labor Force in Norton County.
What is the Unemployment Rate in Norton County?
Unemployment Rate in Norton County is 1.4%.