Montgomery County, KS
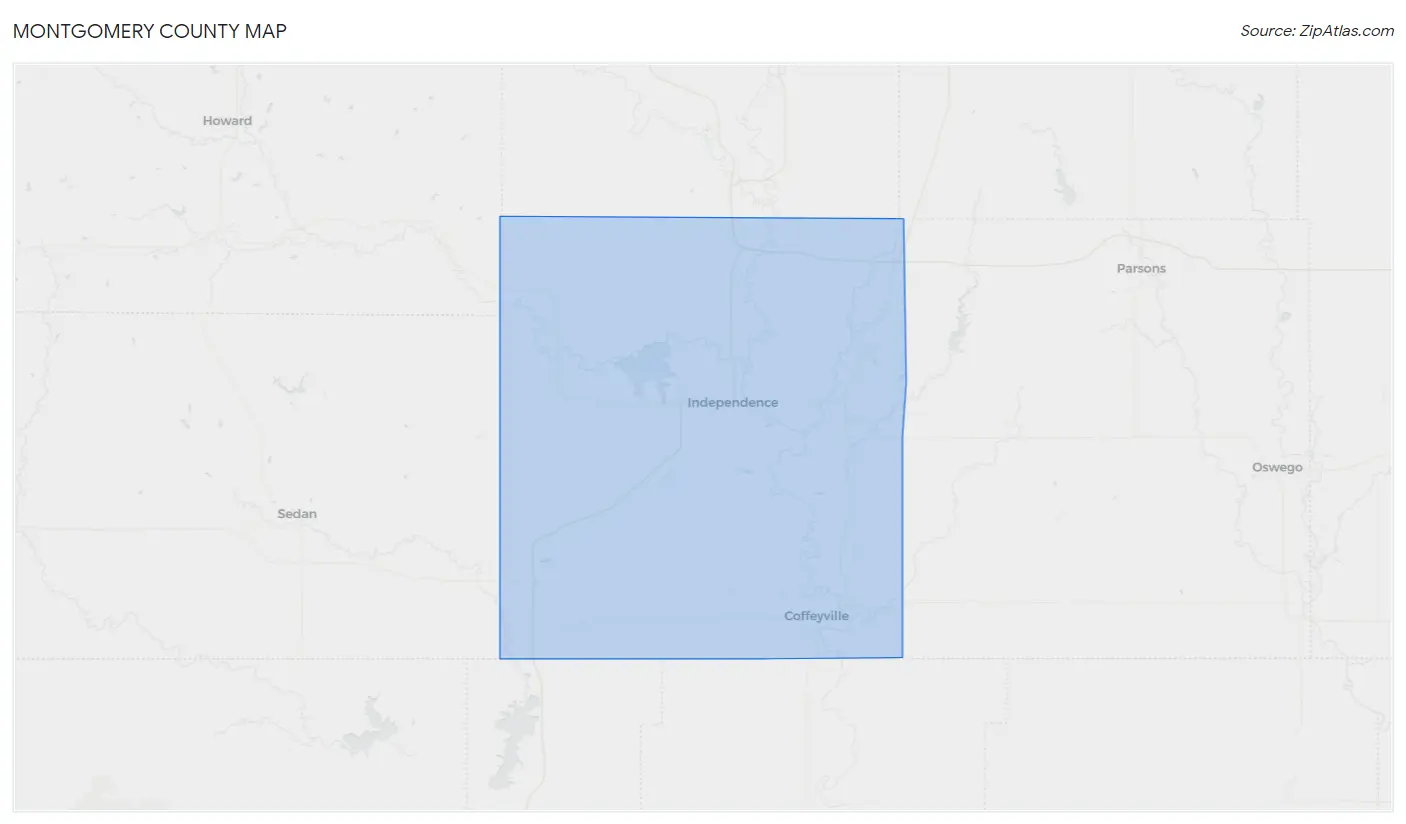
Montgomery County Map
Montgomery County Overview
31,448
TOTAL POPULATION
15,848
MALE POPULATION
15,600
FEMALE POPULATION
101.59
MALES / 100 FEMALES
98.44
FEMALES / 100 MALES
40.2
MEDIAN AGE
3.1
AVG FAMILY SIZE
2.4
AVG HOUSEHOLD SIZE
$28,270
PER CAPITA INCOME
$65,582
AVG FAMILY INCOME
$51,513
AVG HOUSEHOLD INCOME
40.1%
WAGE / INCOME GAP [ % ]
59.9¢/ $1
WAGE / INCOME GAP [ $ ]
$9,905
FAMILY INCOME DEFICIT
0.43
INEQUALITY / GINI INDEX
14,419
LABOR FORCE [ PEOPLE ]
57.7%
PERCENT IN LABOR FORCE
4.7%
UNEMPLOYMENT RATE
Montgomery County Area Codes
Race in Montgomery County
The most populous races in Montgomery County are White / Caucasian (25,416 | 80.8%), Two or more Races (2,781 | 8.8%), and Hispanic or Latino (2,326 | 7.4%).
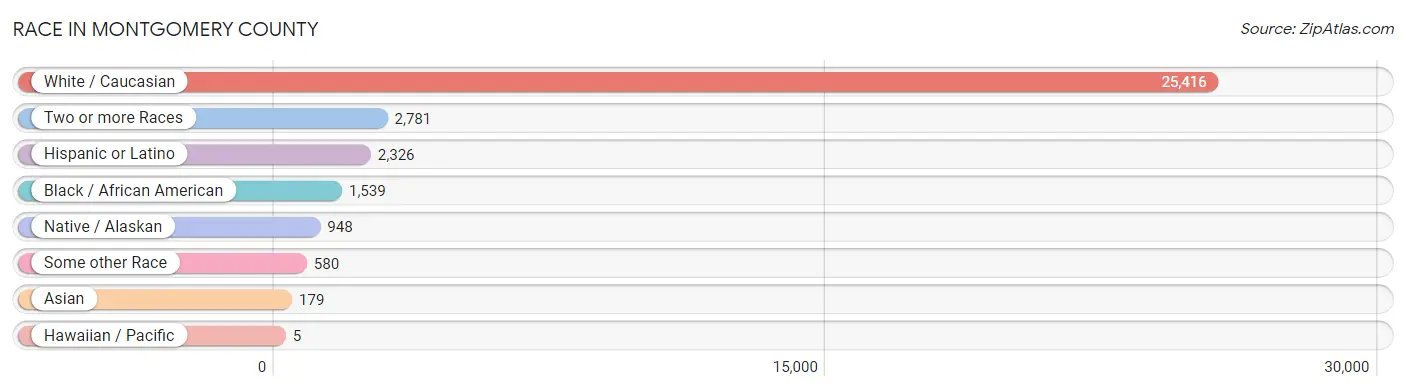
| Race | # Population | % Population |
| Asian | 179 | 0.6% |
| Black / African American | 1,539 | 4.9% |
| Hawaiian / Pacific | 5 | 0.0% |
| Hispanic or Latino | 2,326 | 7.4% |
| Native / Alaskan | 948 | 3.0% |
| White / Caucasian | 25,416 | 80.8% |
| Two or more Races | 2,781 | 8.8% |
| Some other Race | 580 | 1.8% |
| Total | 31,448 | 100.0% |
Ancestry in Montgomery County
The most populous ancestries reported in Montgomery County are German (5,644 | 17.9%), Irish (4,130 | 13.1%), English (3,747 | 11.9%), American (2,857 | 9.1%), and Mexican (1,806 | 5.7%), together accounting for 57.8% of all Montgomery County residents.
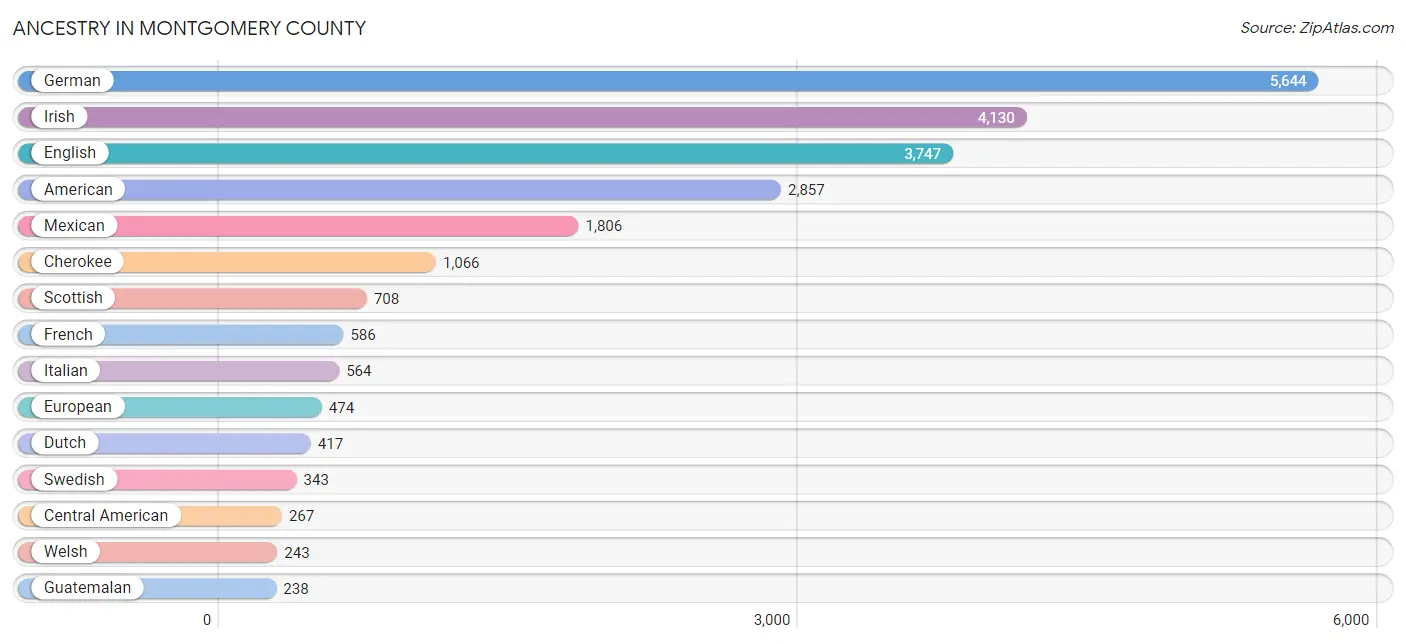
| Ancestry | # Population | % Population |
| African | 191 | 0.6% |
| American | 2,857 | 9.1% |
| Apache | 12 | 0.0% |
| Arab | 14 | 0.0% |
| Armenian | 18 | 0.1% |
| Australian | 18 | 0.1% |
| Austrian | 13 | 0.0% |
| Bangladeshi | 50 | 0.2% |
| Belgian | 26 | 0.1% |
| Bhutanese | 138 | 0.4% |
| Blackfeet | 14 | 0.0% |
| British | 168 | 0.5% |
| Burmese | 9 | 0.0% |
| Cajun | 1 | 0.0% |
| Canadian | 31 | 0.1% |
| Celtic | 5 | 0.0% |
| Central American | 267 | 0.9% |
| Central American Indian | 71 | 0.2% |
| Cherokee | 1,066 | 3.4% |
| Chickasaw | 54 | 0.2% |
| Choctaw | 46 | 0.2% |
| Colombian | 2 | 0.0% |
| Comanche | 9 | 0.0% |
| Creek | 77 | 0.2% |
| Czech | 104 | 0.3% |
| Czechoslovakian | 13 | 0.0% |
| Danish | 43 | 0.1% |
| Delaware | 152 | 0.5% |
| Dutch | 417 | 1.3% |
| Eastern European | 67 | 0.2% |
| English | 3,747 | 11.9% |
| European | 474 | 1.5% |
| Finnish | 113 | 0.4% |
| French | 586 | 1.9% |
| French American Indian | 2 | 0.0% |
| French Canadian | 99 | 0.3% |
| German | 5,644 | 17.9% |
| Greek | 25 | 0.1% |
| Guatemalan | 238 | 0.8% |
| Haitian | 21 | 0.1% |
| Honduran | 8 | 0.0% |
| Hungarian | 24 | 0.1% |
| Indian (Asian) | 18 | 0.1% |
| Irish | 4,130 | 13.1% |
| Iroquois | 9 | 0.0% |
| Italian | 564 | 1.8% |
| Jamaican | 15 | 0.1% |
| Korean | 106 | 0.3% |
| Lebanese | 14 | 0.0% |
| Mexican | 1,806 | 5.7% |
| Native Hawaiian | 53 | 0.2% |
| Nicaraguan | 11 | 0.0% |
| Northern European | 19 | 0.1% |
| Norwegian | 180 | 0.6% |
| Osage | 225 | 0.7% |
| Pakistani | 4 | 0.0% |
| Pennsylvania German | 7 | 0.0% |
| Polish | 162 | 0.5% |
| Portuguese | 22 | 0.1% |
| Potawatomi | 26 | 0.1% |
| Puerto Rican | 152 | 0.5% |
| Romanian | 4 | 0.0% |
| Russian | 56 | 0.2% |
| Salvadoran | 10 | 0.0% |
| Scandinavian | 117 | 0.4% |
| Scotch-Irish | 175 | 0.6% |
| Scottish | 708 | 2.2% |
| Shoshone | 3 | 0.0% |
| Sioux | 80 | 0.3% |
| Slovak | 10 | 0.0% |
| South African | 4 | 0.0% |
| South American | 51 | 0.2% |
| Sri Lankan | 32 | 0.1% |
| Subsaharan African | 195 | 0.6% |
| Swedish | 343 | 1.1% |
| Swiss | 49 | 0.2% |
| Thai | 17 | 0.1% |
| Tlingit-Haida | 10 | 0.0% |
| Venezuelan | 49 | 0.2% |
| Welsh | 243 | 0.8% |
| West Indian | 3 | 0.0% | View All 81 Rows |
Immigrants in Montgomery County
The most numerous immigrant groups reported in Montgomery County came from Latin America (372 | 1.2%), Central America (317 | 1.0%), Mexico (233 | 0.7%), Asia (76 | 0.2%), and Guatemala (61 | 0.2%), together accounting for 3.4% of all Montgomery County residents.
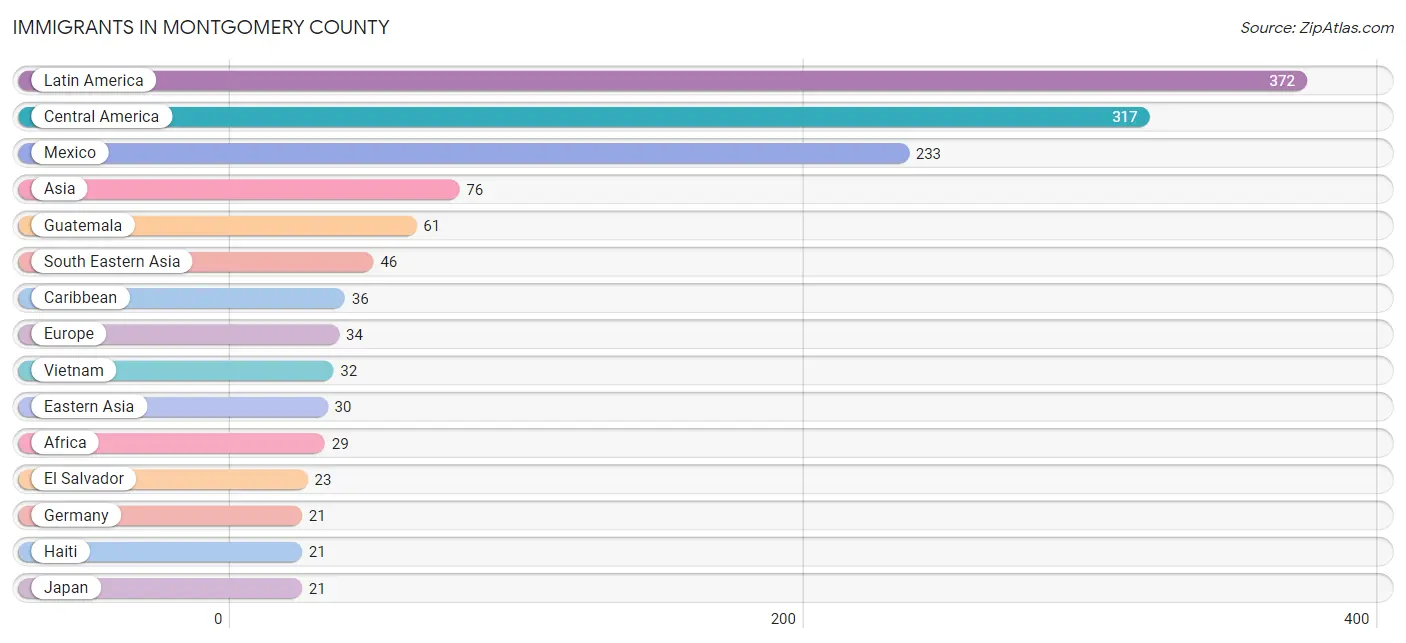
| Immigration Origin | # Population | % Population |
| Africa | 29 | 0.1% |
| Asia | 76 | 0.2% |
| Australia | 18 | 0.1% |
| Cameroon | 20 | 0.1% |
| Canada | 12 | 0.0% |
| Caribbean | 36 | 0.1% |
| Central America | 317 | 1.0% |
| Eastern Asia | 30 | 0.1% |
| El Salvador | 23 | 0.1% |
| England | 13 | 0.0% |
| Europe | 34 | 0.1% |
| Germany | 21 | 0.1% |
| Guatemala | 61 | 0.2% |
| Haiti | 21 | 0.1% |
| Jamaica | 15 | 0.1% |
| Japan | 21 | 0.1% |
| Korea | 9 | 0.0% |
| Latin America | 372 | 1.2% |
| Mexico | 233 | 0.7% |
| Middle Africa | 20 | 0.1% |
| Northern Europe | 13 | 0.0% |
| Oceania | 18 | 0.1% |
| Philippines | 14 | 0.0% |
| South Africa | 4 | 0.0% |
| South America | 19 | 0.1% |
| South Eastern Asia | 46 | 0.2% |
| Venezuela | 19 | 0.1% |
| Vietnam | 32 | 0.1% |
| Western Africa | 5 | 0.0% |
| Western Europe | 21 | 0.1% | View All 30 Rows |
Sex and Age in Montgomery County
Sex and Age in Montgomery County
The most populous age groups in Montgomery County are 15 to 19 Years (1,286 | 8.1%) for men and 60 to 64 Years (1,204 | 7.7%) for women.
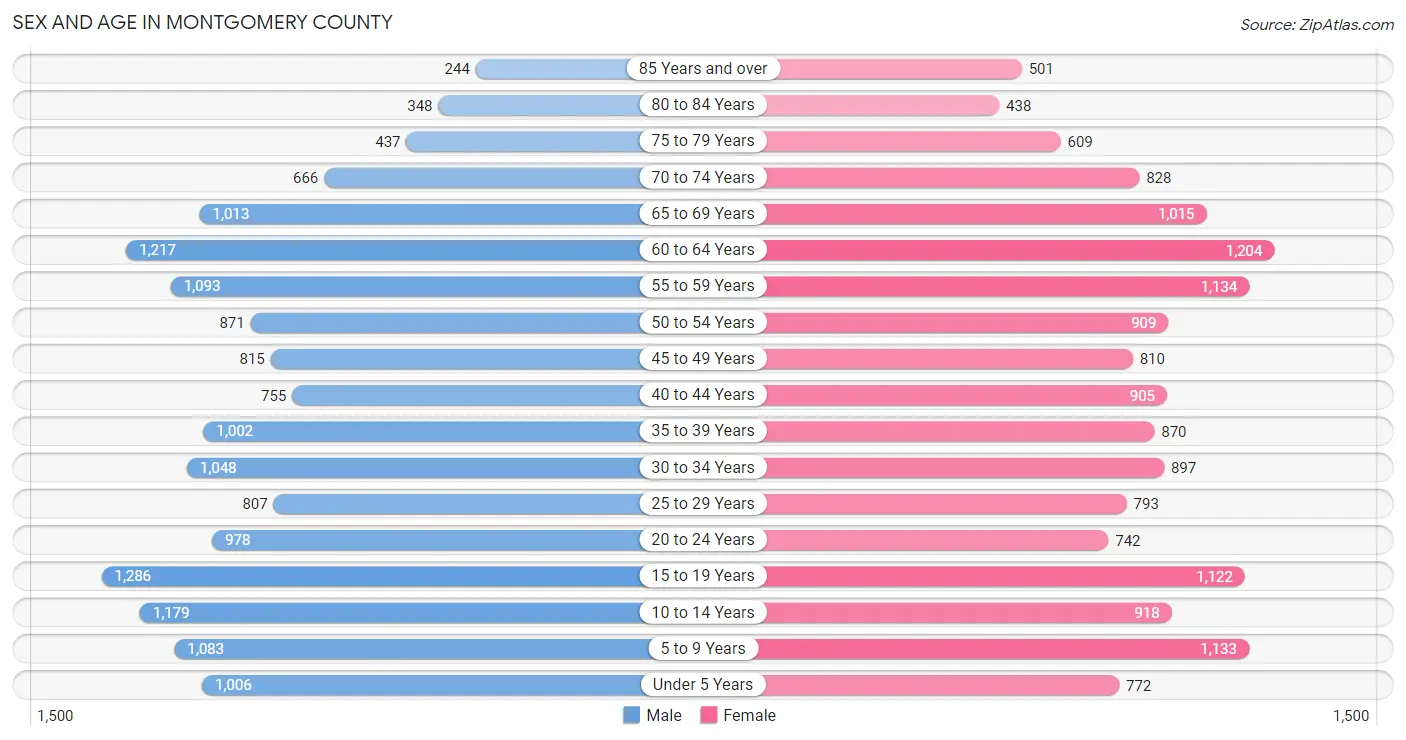
| Age Bracket | Male | Female |
| Under 5 Years | 1,006 (6.4%) | 772 (5.0%) |
| 5 to 9 Years | 1,083 (6.8%) | 1,133 (7.3%) |
| 10 to 14 Years | 1,179 (7.4%) | 918 (5.9%) |
| 15 to 19 Years | 1,286 (8.1%) | 1,122 (7.2%) |
| 20 to 24 Years | 978 (6.2%) | 742 (4.8%) |
| 25 to 29 Years | 807 (5.1%) | 793 (5.1%) |
| 30 to 34 Years | 1,048 (6.6%) | 897 (5.8%) |
| 35 to 39 Years | 1,002 (6.3%) | 870 (5.6%) |
| 40 to 44 Years | 755 (4.8%) | 905 (5.8%) |
| 45 to 49 Years | 815 (5.1%) | 810 (5.2%) |
| 50 to 54 Years | 871 (5.5%) | 909 (5.8%) |
| 55 to 59 Years | 1,093 (6.9%) | 1,134 (7.3%) |
| 60 to 64 Years | 1,217 (7.7%) | 1,204 (7.7%) |
| 65 to 69 Years | 1,013 (6.4%) | 1,015 (6.5%) |
| 70 to 74 Years | 666 (4.2%) | 828 (5.3%) |
| 75 to 79 Years | 437 (2.8%) | 609 (3.9%) |
| 80 to 84 Years | 348 (2.2%) | 438 (2.8%) |
| 85 Years and over | 244 (1.5%) | 501 (3.2%) |
| Total | 15,848 (100.0%) | 15,600 (100.0%) |
Families and Households in Montgomery County
Median Family Size in Montgomery County
The median family size in Montgomery County is 3.11 persons per family, with single female/mother families (1,614 | 20.9%) accounting for the largest median family size of 3.21 persons per family. On the other hand, married-couple families (5,616 | 72.6%) represent the smallest median family size with 3.09 persons per family.
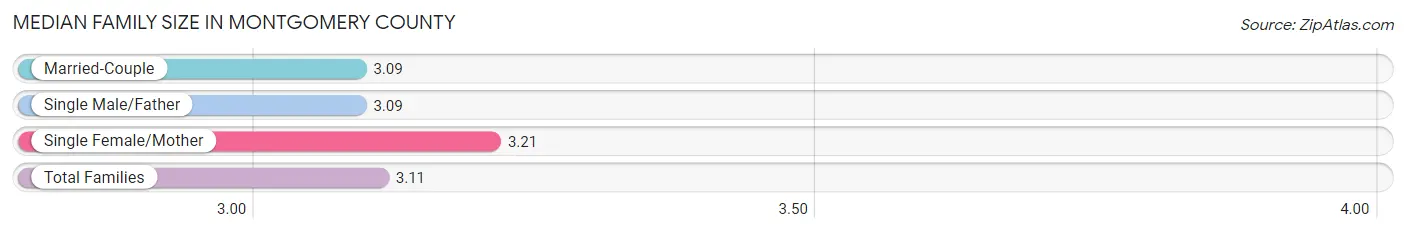
| Family Type | # Families | Family Size |
| Married-Couple | 5,616 (72.6%) | 3.09 |
| Single Male/Father | 506 (6.5%) | 3.09 |
| Single Female/Mother | 1,614 (20.9%) | 3.21 |
| Total Families | 7,736 (100.0%) | 3.11 |
Median Household Size in Montgomery County
The median household size in Montgomery County is 2.40 persons per household, with single male/father households (506 | 4.0%) accounting for the largest median household size of 3.49 persons per household. non-family households (4,946 | 39.0%) represent the smallest median household size with 1.14 persons per household.
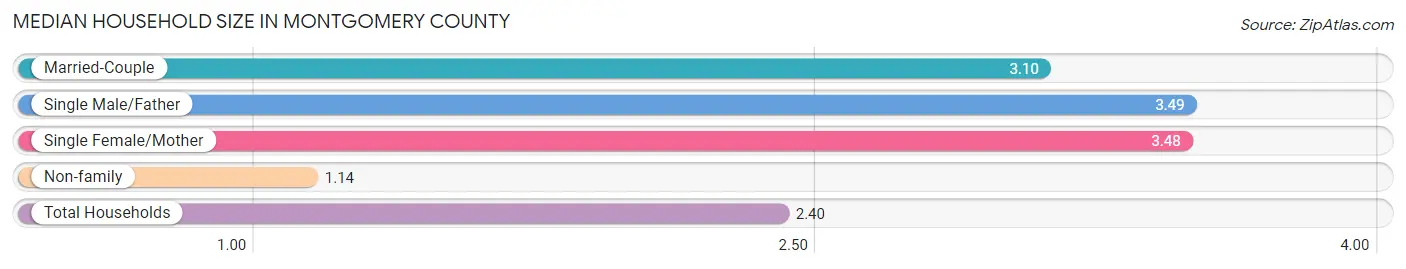
| Household Type | # Households | Household Size |
| Married-Couple | 5,616 (44.3%) | 3.10 |
| Single Male/Father | 506 (4.0%) | 3.49 |
| Single Female/Mother | 1,614 (12.7%) | 3.48 |
| Non-family | 4,946 (39.0%) | 1.14 |
| Total Households | 12,682 (100.0%) | 2.40 |
Household Size by Marriage Status in Montgomery County
Out of a total of 12,682 households in Montgomery County, 7,736 (61.0%) are family households, while 4,946 (39.0%) are nonfamily households. The most numerous type of family households are 2-person households, comprising 4,058, and the most common type of nonfamily households are 1-person households, comprising 4,363.
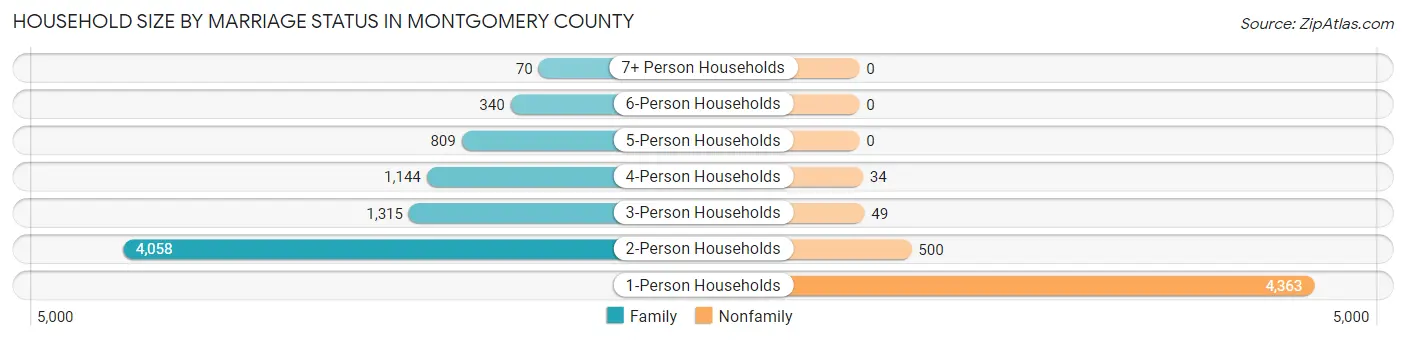
| Household Size | Family Households | Nonfamily Households |
| 1-Person Households | - | 4,363 (34.4%) |
| 2-Person Households | 4,058 (32.0%) | 500 (3.9%) |
| 3-Person Households | 1,315 (10.4%) | 49 (0.4%) |
| 4-Person Households | 1,144 (9.0%) | 34 (0.3%) |
| 5-Person Households | 809 (6.4%) | 0 (0.0%) |
| 6-Person Households | 340 (2.7%) | 0 (0.0%) |
| 7+ Person Households | 70 (0.5%) | 0 (0.0%) |
| Total | 7,736 (61.0%) | 4,946 (39.0%) |
Female Fertility in Montgomery County
Fertility by Age in Montgomery County
Average fertility rate in Montgomery County is 32.0 births per 1,000 women. Women in the age bracket of 20 to 34 years have the highest fertility rate with 61.0 births per 1,000 women. Women in the age bracket of 20 to 34 years acount for 72.6% of all women with births.
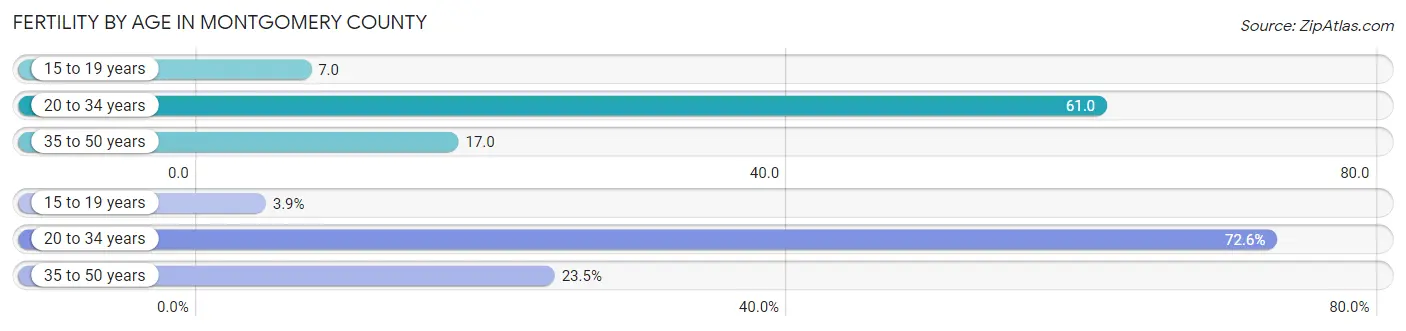
| Age Bracket | Women with Births | Births / 1,000 Women |
| 15 to 19 years | 8 (3.9%) | 7.0 |
| 20 to 34 years | 148 (72.6%) | 61.0 |
| 35 to 50 years | 48 (23.5%) | 17.0 |
| Total | 204 (100.0%) | 32.0 |
Fertility by Age by Marriage Status in Montgomery County
77.5% of women with births (204) in Montgomery County are married. The highest percentage of unmarried women with births falls into 15 to 19 years age bracket with 75.0% of them unmarried at the time of birth, while the lowest percentage of unmarried women with births belong to 20 to 34 years age bracket with 14.9% of them unmarried.
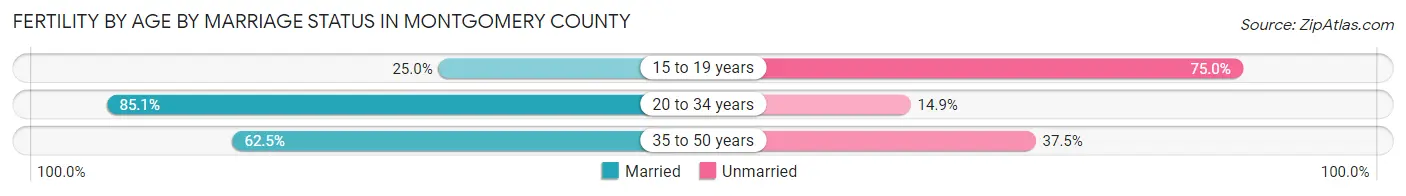
| Age Bracket | Married | Unmarried |
| 15 to 19 years | 2 (25.0%) | 6 (75.0%) |
| 20 to 34 years | 126 (85.1%) | 22 (14.9%) |
| 35 to 50 years | 30 (62.5%) | 18 (37.5%) |
| Total | 158 (77.4%) | 46 (22.6%) |
Fertility by Education in Montgomery County
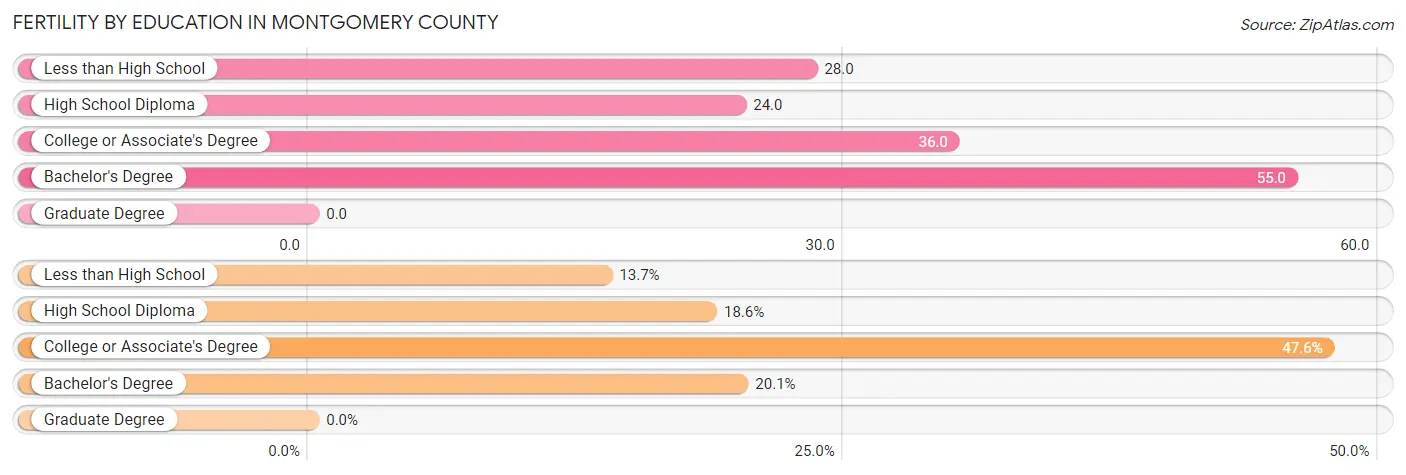
| Educational Attainment | Women with Births | Births / 1,000 Women |
| Less than High School | 28 (13.7%) | 28.0 |
| High School Diploma | 38 (18.6%) | 24.0 |
| College or Associate's Degree | 97 (47.5%) | 36.0 |
| Bachelor's Degree | 41 (20.1%) | 55.0 |
| Graduate Degree | 0 (0.0%) | 0.0 |
| Total | 204 (100.0%) | 32.0 |
Fertility by Education by Marriage Status in Montgomery County
22.6% of women with births in Montgomery County are unmarried. Women with the educational attainment of high school diploma are most likely to be married with 100.0% of them married at childbirth, while women with the educational attainment of less than high school are least likely to be married with 50.0% of them unmarried at childbirth.
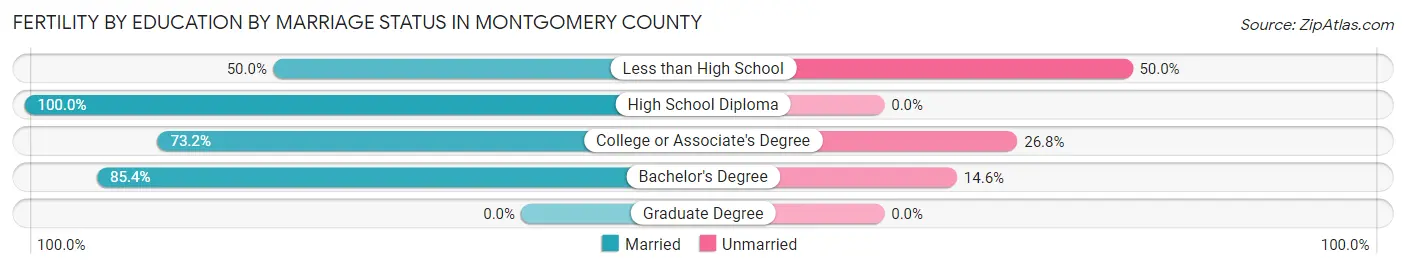
| Educational Attainment | Married | Unmarried |
| Less than High School | 14 (50.0%) | 14 (50.0%) |
| High School Diploma | 38 (100.0%) | 0 (0.0%) |
| College or Associate's Degree | 71 (73.2%) | 26 (26.8%) |
| Bachelor's Degree | 35 (85.4%) | 6 (14.6%) |
| Graduate Degree | 0 (0.0%) | 0 (0.0%) |
| Total | 158 (77.4%) | 46 (22.6%) |
Income in Montgomery County
Income Overview in Montgomery County
Per Capita Income in Montgomery County is $28,270, while median incomes of families and households are $65,582 and $51,513 respectively.
| Characteristic | Number | Measure |
| Per Capita Income | 31,448 | $28,270 |
| Median Family Income | 7,736 | $65,582 |
| Mean Family Income | 7,736 | $80,505 |
| Median Household Income | 12,682 | $51,513 |
| Mean Household Income | 12,682 | $66,032 |
| Income Deficit | 7,736 | $9,905 |
| Wage / Income Gap (%) | 31,448 | 40.14% |
| Wage / Income Gap ($) | 31,448 | 59.86¢ per $1 |
| Gini / Inequality Index | 31,448 | 0.43 |
Earnings by Sex in Montgomery County
Average Earnings in Montgomery County are $31,490, $40,062 for men and $23,983 for women, a difference of 40.1%.
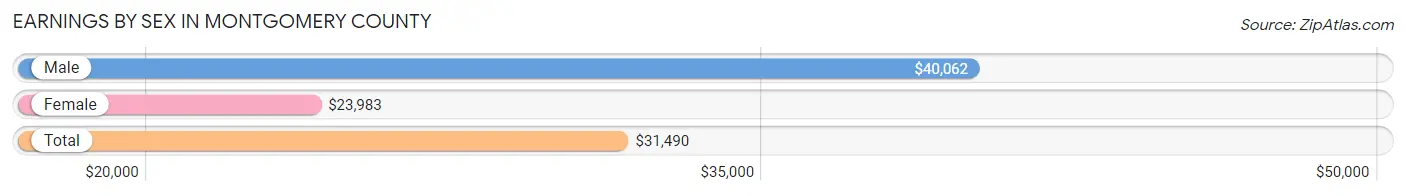
| Sex | Number | Average Earnings |
| Male | 8,139 (52.8%) | $40,062 |
| Female | 7,275 (47.2%) | $23,983 |
| Total | 15,414 (100.0%) | $31,490 |
Earnings by Sex by Income Bracket in Montgomery County
The most common earnings brackets in Montgomery County are $75,000 to $99,999 for men (966 | 11.9%) and $2,499 or less for women (711 | 9.8%).
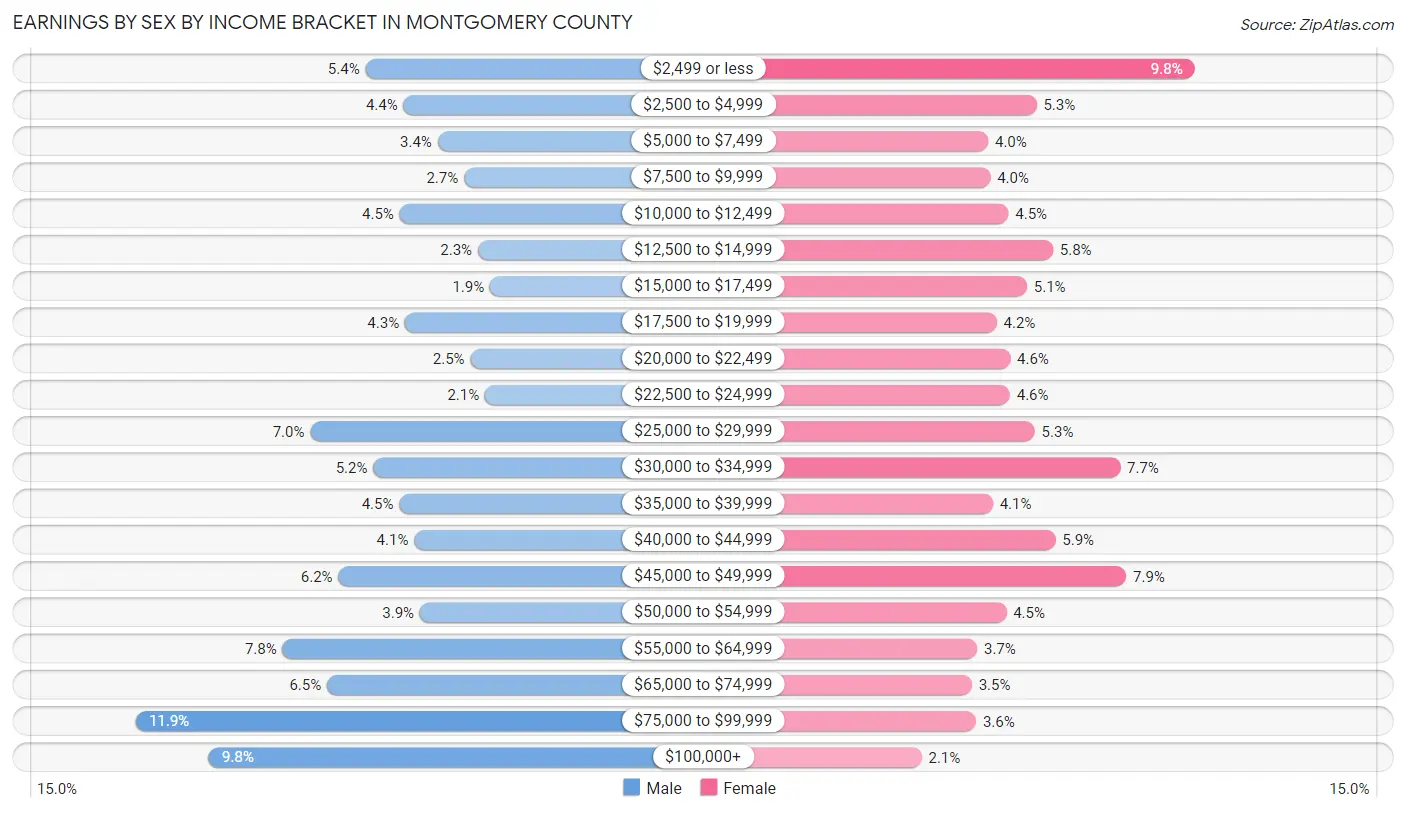
| Income | Male | Female |
| $2,499 or less | 441 (5.4%) | 711 (9.8%) |
| $2,500 to $4,999 | 354 (4.3%) | 388 (5.3%) |
| $5,000 to $7,499 | 276 (3.4%) | 289 (4.0%) |
| $7,500 to $9,999 | 216 (2.6%) | 293 (4.0%) |
| $10,000 to $12,499 | 363 (4.5%) | 330 (4.5%) |
| $12,500 to $14,999 | 184 (2.3%) | 421 (5.8%) |
| $15,000 to $17,499 | 156 (1.9%) | 368 (5.1%) |
| $17,500 to $19,999 | 351 (4.3%) | 306 (4.2%) |
| $20,000 to $22,499 | 201 (2.5%) | 334 (4.6%) |
| $22,500 to $24,999 | 168 (2.1%) | 333 (4.6%) |
| $25,000 to $29,999 | 567 (7.0%) | 384 (5.3%) |
| $30,000 to $34,999 | 423 (5.2%) | 559 (7.7%) |
| $35,000 to $39,999 | 364 (4.5%) | 298 (4.1%) |
| $40,000 to $44,999 | 330 (4.1%) | 426 (5.9%) |
| $45,000 to $49,999 | 503 (6.2%) | 571 (7.9%) |
| $50,000 to $54,999 | 317 (3.9%) | 326 (4.5%) |
| $55,000 to $64,999 | 631 (7.7%) | 266 (3.7%) |
| $65,000 to $74,999 | 529 (6.5%) | 255 (3.5%) |
| $75,000 to $99,999 | 966 (11.9%) | 264 (3.6%) |
| $100,000+ | 799 (9.8%) | 153 (2.1%) |
| Total | 8,139 (100.0%) | 7,275 (100.0%) |
Earnings by Sex by Educational Attainment in Montgomery County
Average earnings in Montgomery County are $46,350 for men and $30,053 for women, a difference of 35.2%. Men with an educational attainment of bachelor's degree enjoy the highest average annual earnings of $68,500, while those with less than high school education earn the least with $33,828. Women with an educational attainment of bachelor's degree earn the most with the average annual earnings of $46,237, while those with high school diploma education have the smallest earnings of $20,120.
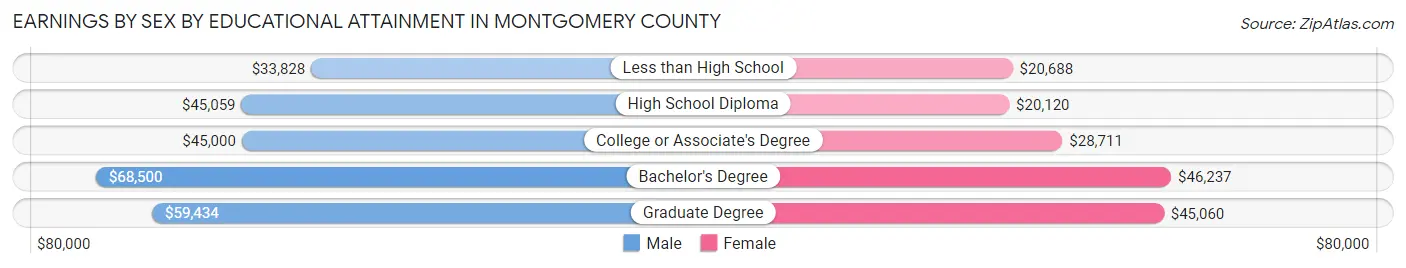
| Educational Attainment | Male Income | Female Income |
| Less than High School | $33,828 | $20,688 |
| High School Diploma | $45,059 | $20,120 |
| College or Associate's Degree | $45,000 | $28,711 |
| Bachelor's Degree | $68,500 | $46,237 |
| Graduate Degree | $59,434 | $45,060 |
| Total | $46,350 | $30,053 |
Family Income in Montgomery County
Family Income Brackets in Montgomery County
According to the Montgomery County family income data, there are 1,849 families falling into the $50,000 to $74,999 income range, which is the most common income bracket and makes up 23.9% of all families. Conversely, the $10,000 to $14,999 income bracket is the least frequent group with only 186 families (2.4%) belonging to this category.
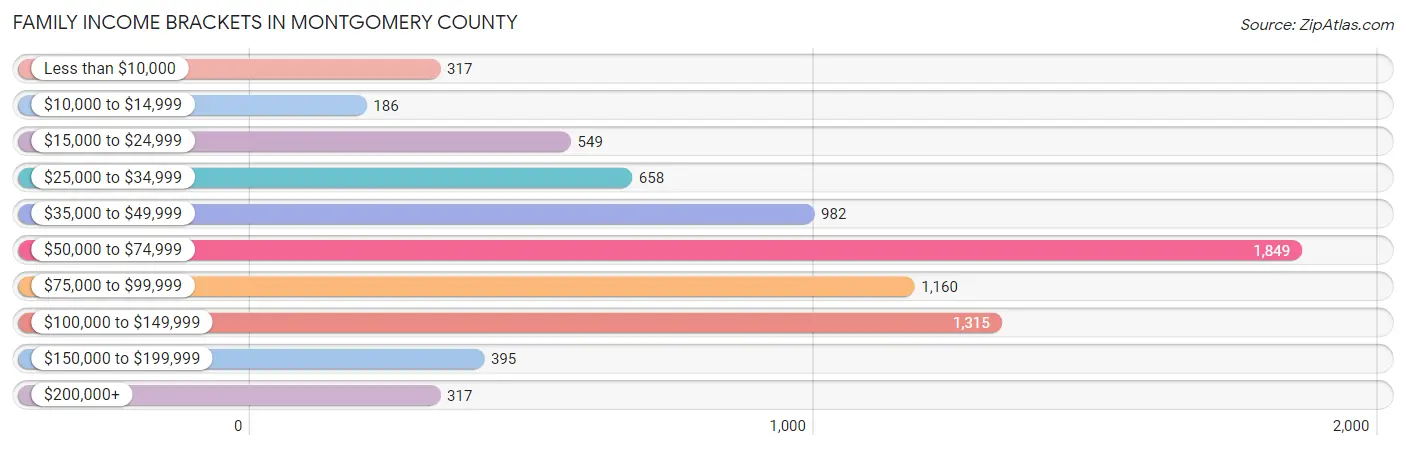
| Income Bracket | # Families | % Families |
| Less than $10,000 | 317 | 4.1% |
| $10,000 to $14,999 | 186 | 2.4% |
| $15,000 to $24,999 | 549 | 7.1% |
| $25,000 to $34,999 | 658 | 8.5% |
| $35,000 to $49,999 | 982 | 12.7% |
| $50,000 to $74,999 | 1,849 | 23.9% |
| $75,000 to $99,999 | 1,160 | 15.0% |
| $100,000 to $149,999 | 1,315 | 17.0% |
| $150,000 to $199,999 | 395 | 5.1% |
| $200,000+ | 317 | 4.1% |
Family Income by Famaliy Size in Montgomery County
6-person families (238 | 3.1%) account for the highest median family income in Montgomery County with $95,000 per family, while 2-person families (4,269 | 55.2%) have the highest median income of $29,930 per family member.
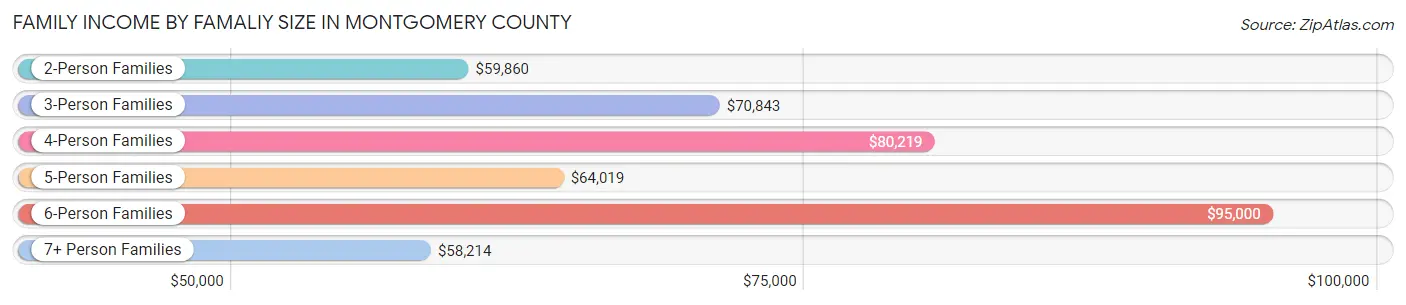
| Income Bracket | # Families | Median Income |
| 2-Person Families | 4,269 (55.2%) | $59,860 |
| 3-Person Families | 1,251 (16.2%) | $70,843 |
| 4-Person Families | 1,115 (14.4%) | $80,219 |
| 5-Person Families | 807 (10.4%) | $64,019 |
| 6-Person Families | 238 (3.1%) | $95,000 |
| 7+ Person Families | 56 (0.7%) | $58,214 |
| Total | 7,736 (100.0%) | $65,582 |
Family Income by Number of Earners in Montgomery County
The median family income in Montgomery County is $65,582, with families comprising 3+ earners (511) having the highest median family income of $125,302, while families with no earners (1,165) have the lowest median family income of $35,898, accounting for 6.6% and 15.1% of families, respectively.
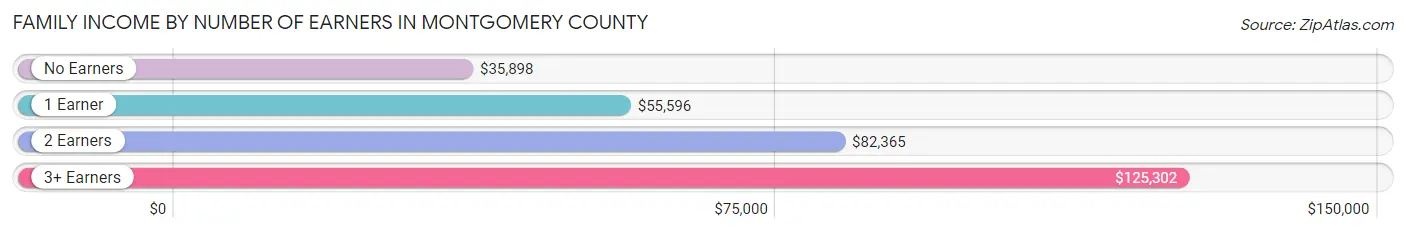
| Number of Earners | # Families | Median Income |
| No Earners | 1,165 (15.1%) | $35,898 |
| 1 Earner | 2,963 (38.3%) | $55,596 |
| 2 Earners | 3,097 (40.0%) | $82,365 |
| 3+ Earners | 511 (6.6%) | $125,302 |
| Total | 7,736 (100.0%) | $65,582 |
Household Income in Montgomery County
Household Income Brackets in Montgomery County
With 2,727 households falling in the category, the $50,000 to $74,999 income range is the most frequent in Montgomery County, accounting for 21.5% of all households. In contrast, only 393 households (3.1%) fall into the $200,000+ income bracket, making it the least populous group.
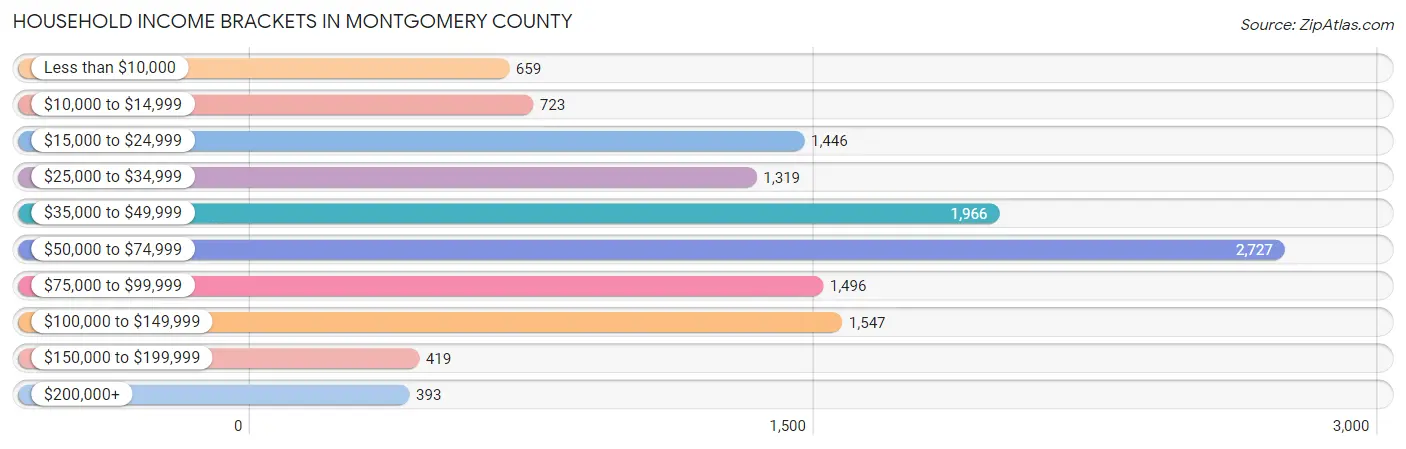
| Income Bracket | # Households | % Households |
| Less than $10,000 | 659 | 5.2% |
| $10,000 to $14,999 | 723 | 5.7% |
| $15,000 to $24,999 | 1,446 | 11.4% |
| $25,000 to $34,999 | 1,319 | 10.4% |
| $35,000 to $49,999 | 1,966 | 15.5% |
| $50,000 to $74,999 | 2,727 | 21.5% |
| $75,000 to $99,999 | 1,496 | 11.8% |
| $100,000 to $149,999 | 1,547 | 12.2% |
| $150,000 to $199,999 | 419 | 3.3% |
| $200,000+ | 393 | 3.1% |
Household Income by Householder Age in Montgomery County
The median household income in Montgomery County is $51,513, with the highest median household income of $61,835 found in the 45 to 64 years age bracket for the primary householder. A total of 4,666 households (36.8%) fall into this category. Meanwhile, the 15 to 24 years age bracket for the primary householder has the lowest median household income of $22,336, with 455 households (3.6%) in this group.
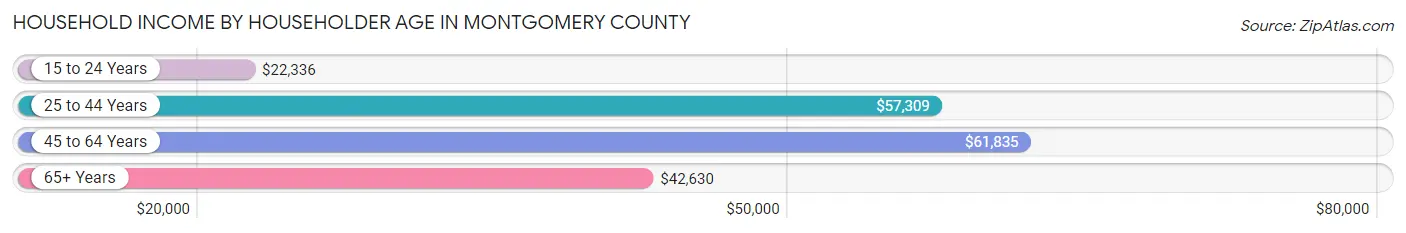
| Income Bracket | # Households | Median Income |
| 15 to 24 Years | 455 (3.6%) | $22,336 |
| 25 to 44 Years | 3,401 (26.8%) | $57,309 |
| 45 to 64 Years | 4,666 (36.8%) | $61,835 |
| 65+ Years | 4,160 (32.8%) | $42,630 |
| Total | 12,682 (100.0%) | $51,513 |
Poverty in Montgomery County
Income Below Poverty by Sex and Age in Montgomery County
With 14.4% poverty level for males and 19.5% for females among the residents of Montgomery County, 5 year old males and 18 to 24 year old females are the most vulnerable to poverty, with 69 males (31.7%) and 398 females (42.4%) in their respective age groups living below the poverty level.
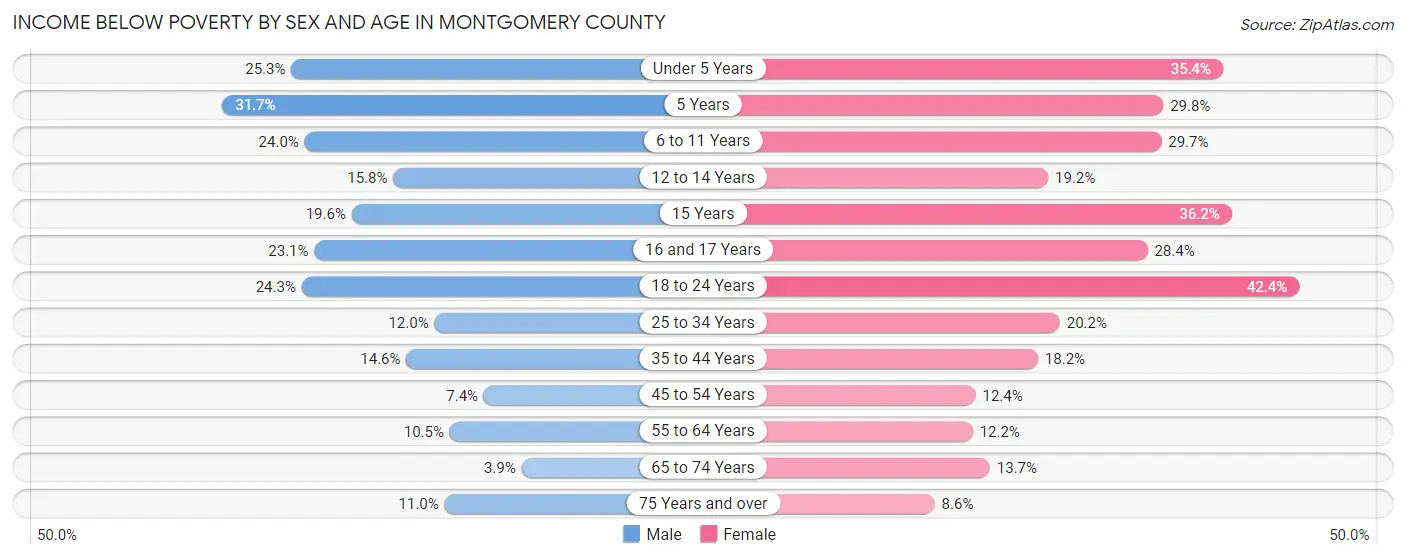
| Age Bracket | Male | Female |
| Under 5 Years | 254 (25.3%) | 273 (35.4%) |
| 5 Years | 69 (31.7%) | 71 (29.8%) |
| 6 to 11 Years | 279 (24.0%) | 357 (29.6%) |
| 12 to 14 Years | 136 (15.8%) | 113 (19.2%) |
| 15 Years | 33 (19.6%) | 72 (36.2%) |
| 16 and 17 Years | 141 (23.1%) | 122 (28.4%) |
| 18 to 24 Years | 302 (24.3%) | 398 (42.4%) |
| 25 to 34 Years | 218 (12.0%) | 338 (20.2%) |
| 35 to 44 Years | 254 (14.6%) | 321 (18.2%) |
| 45 to 54 Years | 123 (7.4%) | 213 (12.4%) |
| 55 to 64 Years | 238 (10.5%) | 284 (12.1%) |
| 65 to 74 Years | 65 (3.9%) | 245 (13.7%) |
| 75 Years and over | 108 (11.0%) | 119 (8.6%) |
| Total | 2,220 (14.4%) | 2,926 (19.5%) |
Income Above Poverty by Sex and Age in Montgomery County
According to the poverty statistics in Montgomery County, males aged 65 to 74 years and females aged 75 years and over are the age groups that are most secure financially, with 96.1% of males and 91.4% of females in these age groups living above the poverty line.
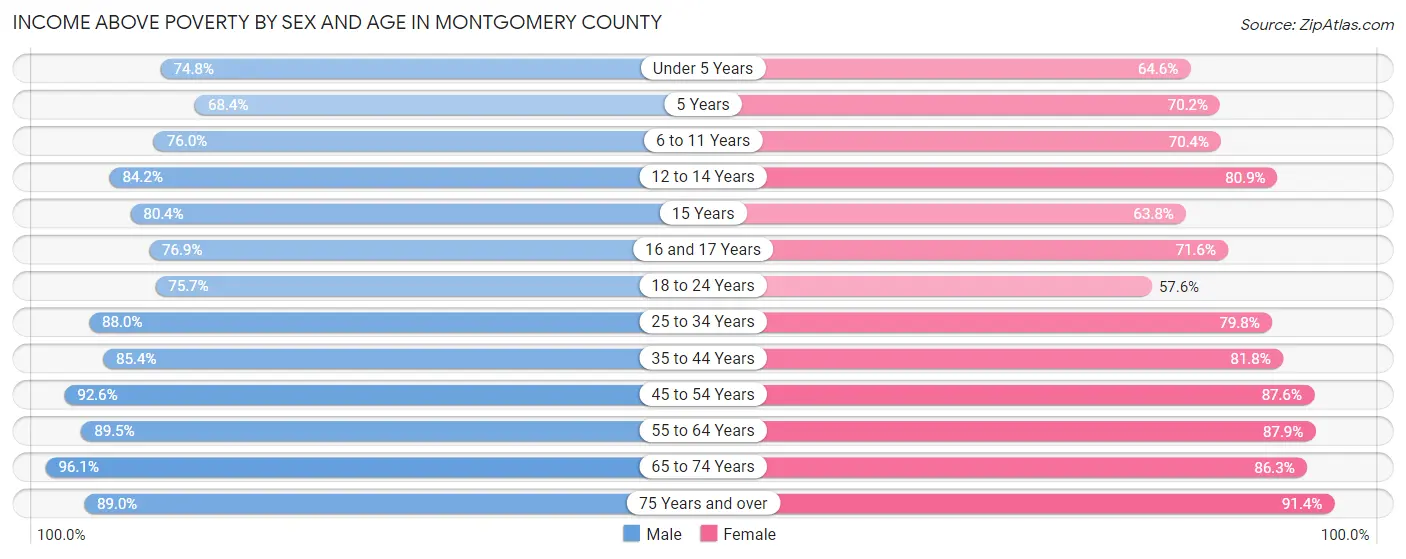
| Age Bracket | Male | Female |
| Under 5 Years | 752 (74.8%) | 499 (64.6%) |
| 5 Years | 149 (68.3%) | 167 (70.2%) |
| 6 to 11 Years | 883 (76.0%) | 847 (70.4%) |
| 12 to 14 Years | 726 (84.2%) | 477 (80.8%) |
| 15 Years | 135 (80.4%) | 127 (63.8%) |
| 16 and 17 Years | 469 (76.9%) | 308 (71.6%) |
| 18 to 24 Years | 942 (75.7%) | 540 (57.6%) |
| 25 to 34 Years | 1,604 (88.0%) | 1,333 (79.8%) |
| 35 to 44 Years | 1,489 (85.4%) | 1,443 (81.8%) |
| 45 to 54 Years | 1,547 (92.6%) | 1,503 (87.6%) |
| 55 to 64 Years | 2,019 (89.5%) | 2,054 (87.8%) |
| 65 to 74 Years | 1,612 (96.1%) | 1,538 (86.3%) |
| 75 Years and over | 872 (89.0%) | 1,262 (91.4%) |
| Total | 13,199 (85.6%) | 12,098 (80.5%) |
Income Below Poverty Among Married-Couple Families in Montgomery County
The poverty statistics for married-couple families in Montgomery County show that 6.2% or 350 of the total 5,616 families live below the poverty line. Families with 5 or more children have the highest poverty rate of 80.0%, comprising of 16 families. On the other hand, families with 1 or 2 children have the lowest poverty rate of 2.7%, which includes 37 families.
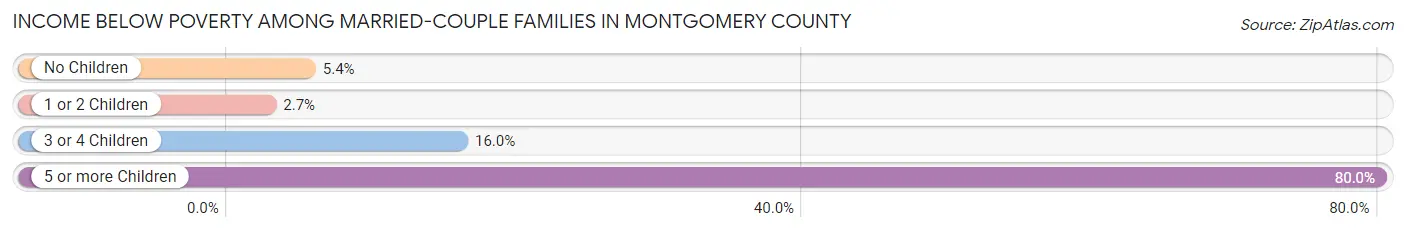
| Children | Above Poverty | Below Poverty |
| No Children | 3,366 (94.6%) | 193 (5.4%) |
| 1 or 2 Children | 1,351 (97.3%) | 37 (2.7%) |
| 3 or 4 Children | 545 (84.0%) | 104 (16.0%) |
| 5 or more Children | 4 (20.0%) | 16 (80.0%) |
| Total | 5,266 (93.8%) | 350 (6.2%) |
Income Below Poverty Among Single-Parent Households in Montgomery County
According to the poverty data in Montgomery County, 22.7% or 115 single-father households and 28.9% or 466 single-mother households are living below the poverty line. Among single-father households, those with 3 or 4 children have the highest poverty rate, with 14 households (31.8%) experiencing poverty. Likewise, among single-mother households, those with 5 or more children have the highest poverty rate, with 16 households (100.0%) falling below the poverty line.
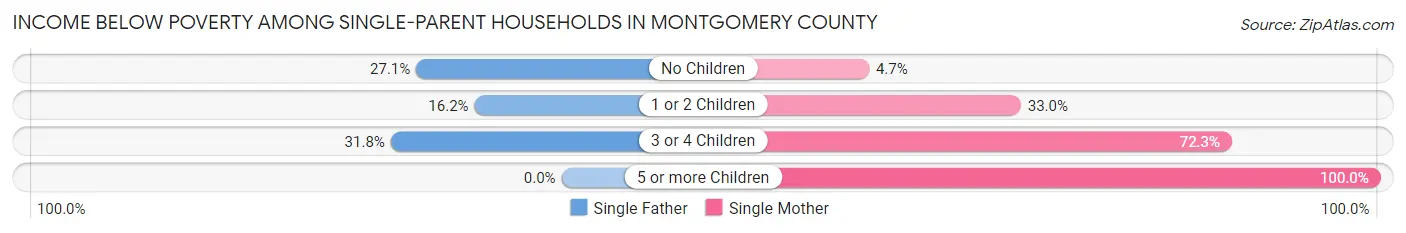
| Children | Single Father | Single Mother |
| No Children | 65 (27.1%) | 28 (4.7%) |
| 1 or 2 Children | 36 (16.2%) | 255 (33.0%) |
| 3 or 4 Children | 14 (31.8%) | 167 (72.3%) |
| 5 or more Children | 0 (0.0%) | 16 (100.0%) |
| Total | 115 (22.7%) | 466 (28.9%) |
Income Below Poverty Among Married-Couple vs Single-Parent Households in Montgomery County
The poverty data for Montgomery County shows that 350 of the married-couple family households (6.2%) and 581 of the single-parent households (27.4%) are living below the poverty level. Within the married-couple family households, those with 5 or more children have the highest poverty rate, with 16 households (80.0%) falling below the poverty line. Among the single-parent households, those with 5 or more children have the highest poverty rate, with 16 household (100.0%) living below poverty.
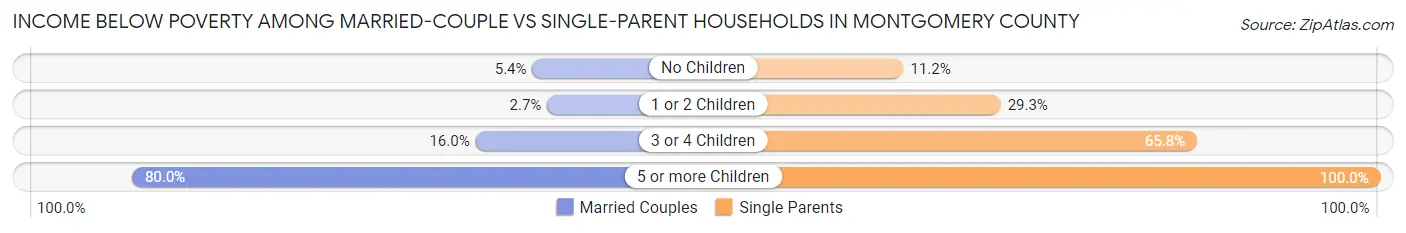
| Children | Married-Couple Families | Single-Parent Households |
| No Children | 193 (5.4%) | 93 (11.2%) |
| 1 or 2 Children | 37 (2.7%) | 291 (29.2%) |
| 3 or 4 Children | 104 (16.0%) | 181 (65.8%) |
| 5 or more Children | 16 (80.0%) | 16 (100.0%) |
| Total | 350 (6.2%) | 581 (27.4%) |
Employment Characteristics in Montgomery County
Employment by Class of Employer in Montgomery County
Among the 13,540 employed individuals in Montgomery County, private company employees (8,793 | 64.9%), local government employees (1,333 | 9.8%), and not-for-profit organizations (1,138 | 8.4%) make up the most common classes of employment.
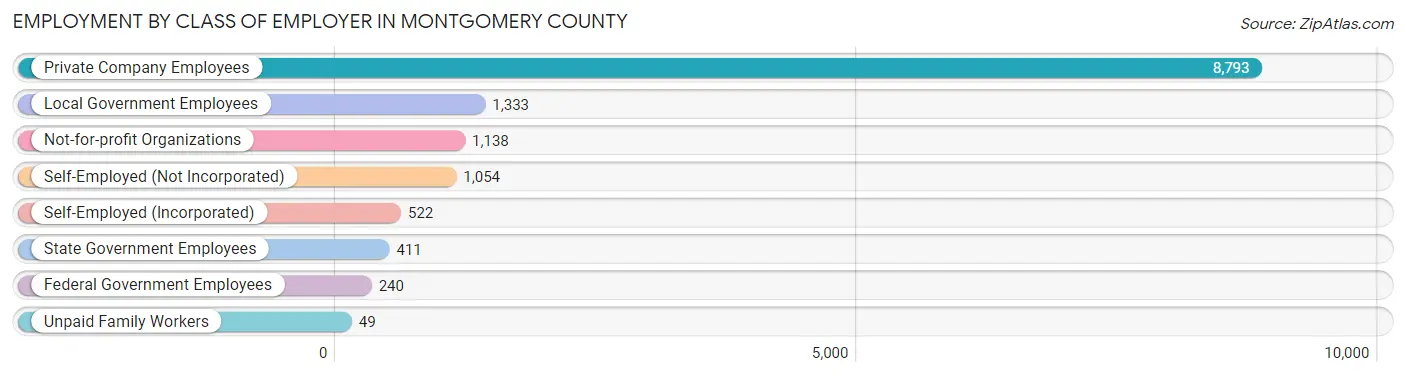
| Employer Class | # Employees | % Employees |
| Private Company Employees | 8,793 | 64.9% |
| Self-Employed (Incorporated) | 522 | 3.9% |
| Self-Employed (Not Incorporated) | 1,054 | 7.8% |
| Not-for-profit Organizations | 1,138 | 8.4% |
| Local Government Employees | 1,333 | 9.8% |
| State Government Employees | 411 | 3.0% |
| Federal Government Employees | 240 | 1.8% |
| Unpaid Family Workers | 49 | 0.4% |
| Total | 13,540 | 100.0% |
Employment Status by Age in Montgomery County
According to the labor force statistics for Montgomery County, out of the total population over 16 years of age (24,990), 57.7% or 14,419 individuals are in the labor force, with 4.7% or 678 of them unemployed. The age group with the highest labor force participation rate is 25 to 29 years, with 82.5% or 1,320 individuals in the labor force. Within the labor force, the 16 to 19 years age range has the highest percentage of unemployed individuals, with 13.3% or 104 of them being unemployed.
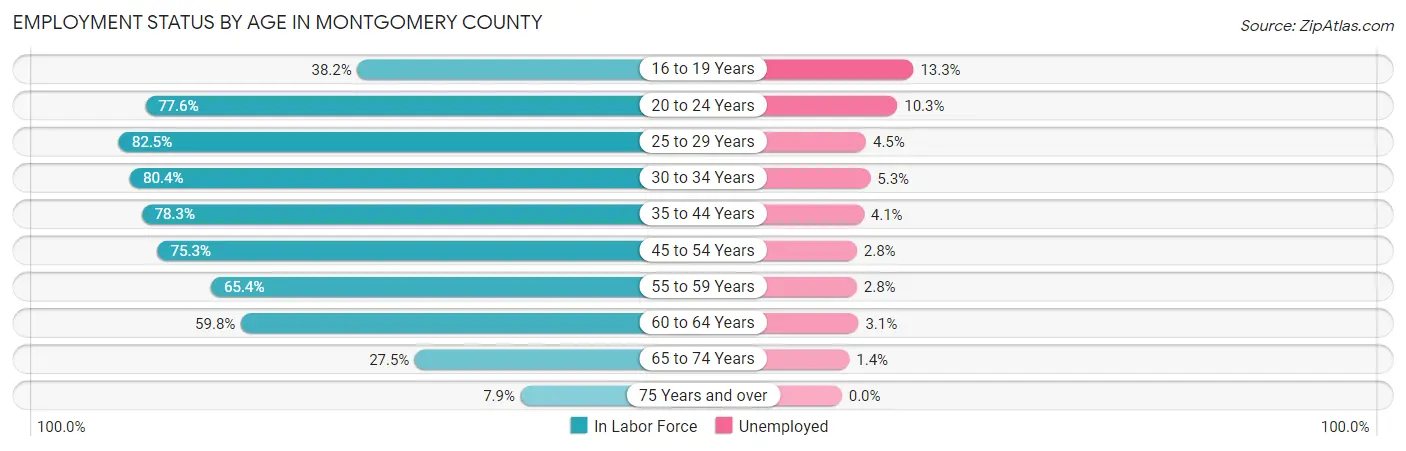
| Age Bracket | In Labor Force | Unemployed |
| 16 to 19 Years | 780 (38.2%) | 104 (13.3%) |
| 20 to 24 Years | 1,335 (77.6%) | 138 (10.3%) |
| 25 to 29 Years | 1,320 (82.5%) | 59 (4.5%) |
| 30 to 34 Years | 1,564 (80.4%) | 83 (5.3%) |
| 35 to 44 Years | 2,766 (78.3%) | 113 (4.1%) |
| 45 to 54 Years | 2,564 (75.3%) | 72 (2.8%) |
| 55 to 59 Years | 1,456 (65.4%) | 41 (2.8%) |
| 60 to 64 Years | 1,448 (59.8%) | 45 (3.1%) |
| 65 to 74 Years | 969 (27.5%) | 14 (1.4%) |
| 75 Years and over | 204 (7.9%) | 0 (0.0%) |
| Total | 14,419 (57.7%) | 678 (4.7%) |
Employment Status by Educational Attainment in Montgomery County
According to labor force statistics for Montgomery County, 73.5% of individuals (11,121) out of the total population between 25 and 64 years of age (15,130) are in the labor force, with 3.7% or 411 of them being unemployed. The group with the highest labor force participation rate are those with the educational attainment of college / associate degree, with 79.4% or 4,608 individuals in the labor force. Within the labor force, individuals with less than high school education have the highest percentage of unemployment, with 10.2% or 98 of them being unemployed.
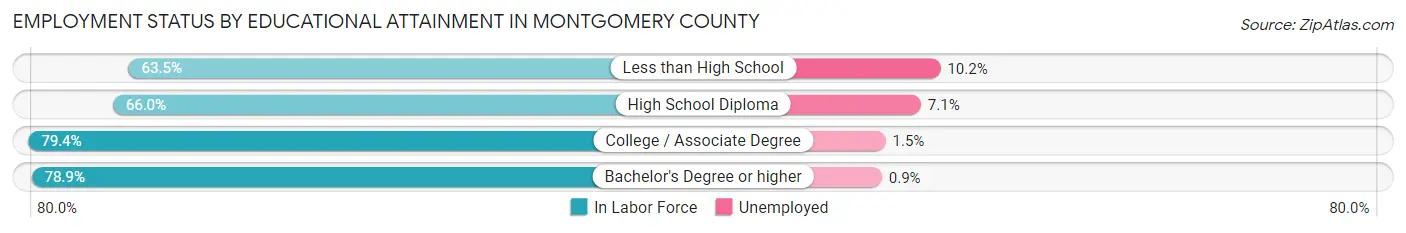
| Educational Attainment | In Labor Force | Unemployed |
| Less than High School | 959 (63.5%) | 154 (10.2%) |
| High School Diploma | 3,172 (66.0%) | 341 (7.1%) |
| College / Associate Degree | 4,608 (79.4%) | 87 (1.5%) |
| Bachelor's Degree or higher | 2,375 (78.9%) | 27 (0.9%) |
| Total | 11,121 (73.5%) | 560 (3.7%) |
Employment Occupations by Sex in Montgomery County
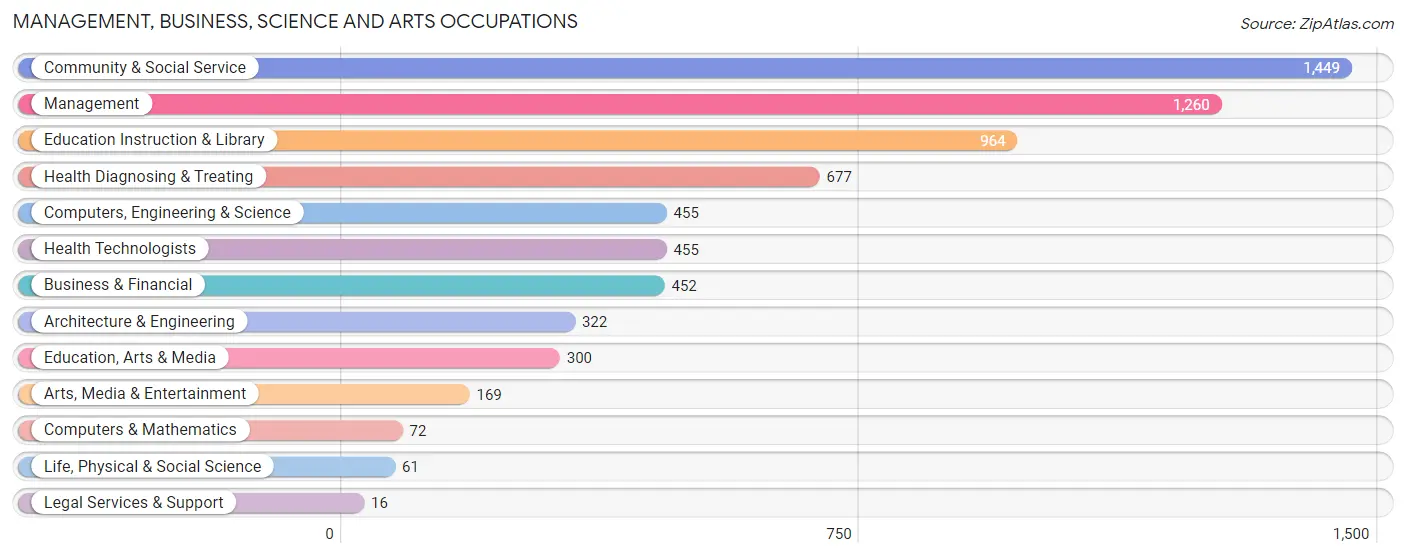
Management, Business, Science and Arts Occupations
The most common Management, Business, Science and Arts occupations in Montgomery County are Community & Social Service (1,449 | 10.6%), Management (1,260 | 9.2%), Education Instruction & Library (964 | 7.0%), Health Diagnosing & Treating (677 | 4.9%), and Computers, Engineering & Science (455 | 3.3%).
Management, Business, Science and Arts Occupations by Sex
Within the Management, Business, Science and Arts occupations in Montgomery County, the most male-oriented occupations are Life, Physical & Social Science (96.7%), Architecture & Engineering (93.8%), and Computers, Engineering & Science (90.3%), while the most female-oriented occupations are Education Instruction & Library (82.5%), Community & Social Service (75.0%), and Health Diagnosing & Treating (72.2%).
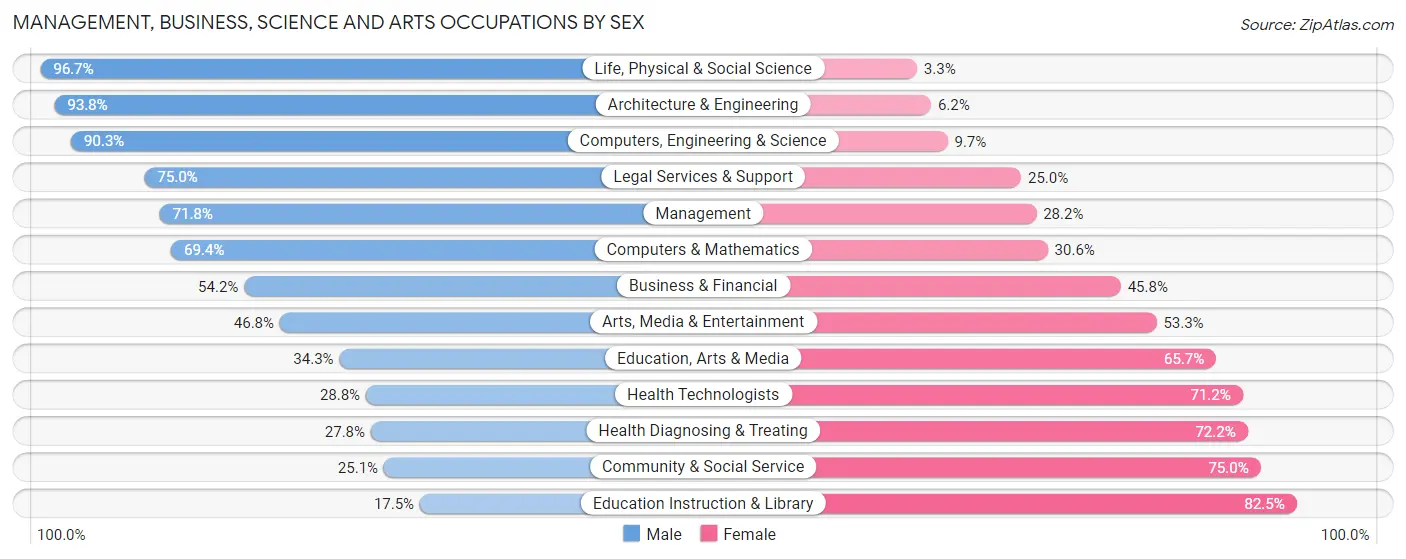
| Occupation | Male | Female |
| Management | 905 (71.8%) | 355 (28.2%) |
| Business & Financial | 245 (54.2%) | 207 (45.8%) |
| Computers, Engineering & Science | 411 (90.3%) | 44 (9.7%) |
| Computers & Mathematics | 50 (69.4%) | 22 (30.6%) |
| Architecture & Engineering | 302 (93.8%) | 20 (6.2%) |
| Life, Physical & Social Science | 59 (96.7%) | 2 (3.3%) |
| Community & Social Service | 363 (25.1%) | 1,086 (75.0%) |
| Education, Arts & Media | 103 (34.3%) | 197 (65.7%) |
| Legal Services & Support | 12 (75.0%) | 4 (25.0%) |
| Education Instruction & Library | 169 (17.5%) | 795 (82.5%) |
| Arts, Media & Entertainment | 79 (46.8%) | 90 (53.2%) |
| Health Diagnosing & Treating | 188 (27.8%) | 489 (72.2%) |
| Health Technologists | 131 (28.8%) | 324 (71.2%) |
| Total (Category) | 2,112 (49.2%) | 2,181 (50.8%) |
| Total (Overall) | 7,207 (52.6%) | 6,496 (47.4%) |
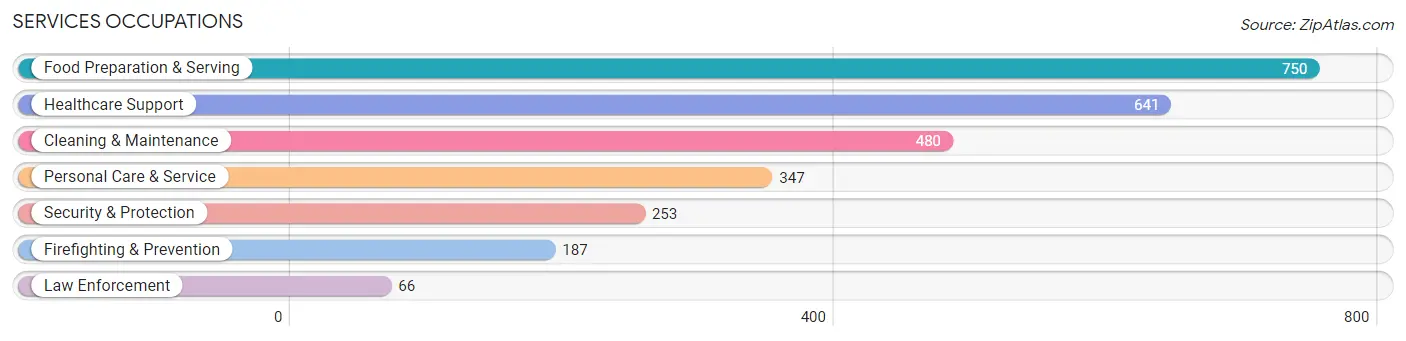
Services Occupations
The most common Services occupations in Montgomery County are Food Preparation & Serving (750 | 5.5%), Healthcare Support (641 | 4.7%), Cleaning & Maintenance (480 | 3.5%), Personal Care & Service (347 | 2.5%), and Security & Protection (253 | 1.8%).
Services Occupations by Sex
Within the Services occupations in Montgomery County, the most male-oriented occupations are Law Enforcement (83.3%), Security & Protection (83.0%), and Firefighting & Prevention (82.9%), while the most female-oriented occupations are Personal Care & Service (92.2%), Healthcare Support (90.9%), and Food Preparation & Serving (55.6%).
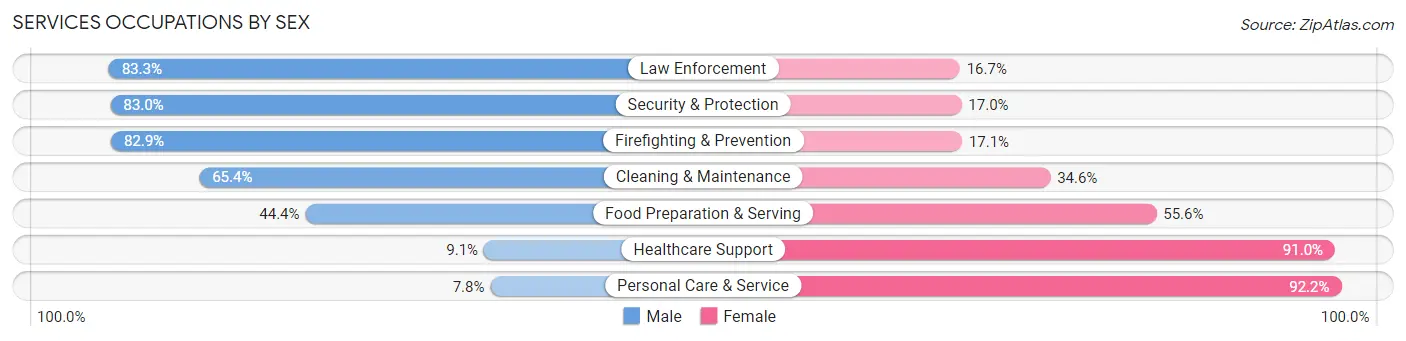
| Occupation | Male | Female |
| Healthcare Support | 58 (9.0%) | 583 (90.9%) |
| Security & Protection | 210 (83.0%) | 43 (17.0%) |
| Firefighting & Prevention | 155 (82.9%) | 32 (17.1%) |
| Law Enforcement | 55 (83.3%) | 11 (16.7%) |
| Food Preparation & Serving | 333 (44.4%) | 417 (55.6%) |
| Cleaning & Maintenance | 314 (65.4%) | 166 (34.6%) |
| Personal Care & Service | 27 (7.8%) | 320 (92.2%) |
| Total (Category) | 942 (38.1%) | 1,529 (61.9%) |
| Total (Overall) | 7,207 (52.6%) | 6,496 (47.4%) |
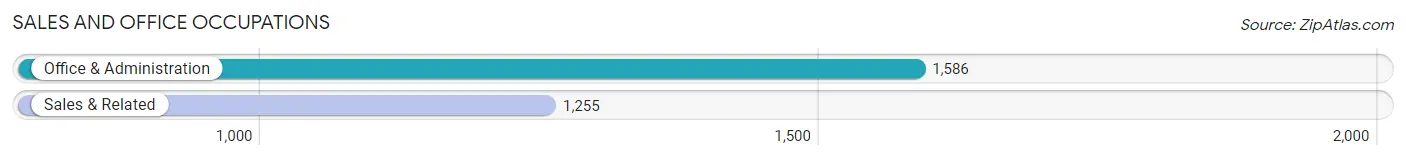
Sales and Office Occupations
The most common Sales and Office occupations in Montgomery County are Office & Administration (1,586 | 11.6%), and Sales & Related (1,255 | 9.2%).
Sales and Office Occupations by Sex
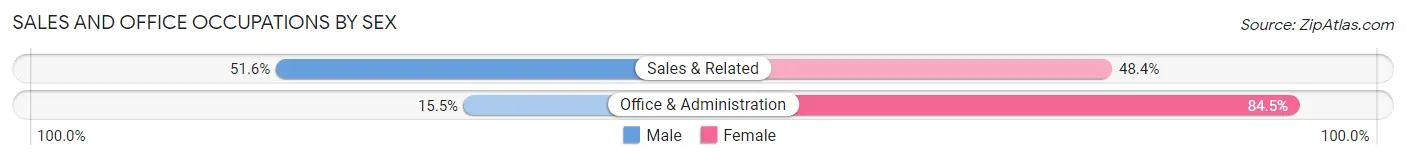
| Occupation | Male | Female |
| Sales & Related | 648 (51.6%) | 607 (48.4%) |
| Office & Administration | 246 (15.5%) | 1,340 (84.5%) |
| Total (Category) | 894 (31.5%) | 1,947 (68.5%) |
| Total (Overall) | 7,207 (52.6%) | 6,496 (47.4%) |
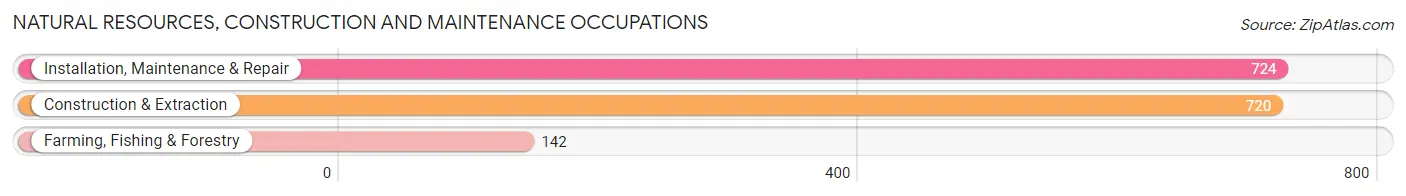
Natural Resources, Construction and Maintenance Occupations
The most common Natural Resources, Construction and Maintenance occupations in Montgomery County are Installation, Maintenance & Repair (724 | 5.3%), Construction & Extraction (720 | 5.2%), and Farming, Fishing & Forestry (142 | 1.0%).
Natural Resources, Construction and Maintenance Occupations by Sex
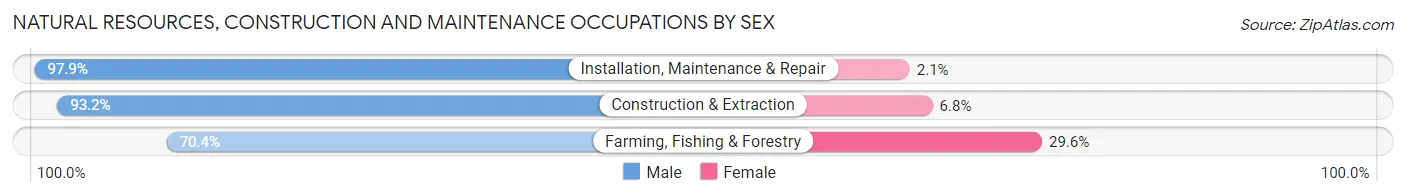
| Occupation | Male | Female |
| Farming, Fishing & Forestry | 100 (70.4%) | 42 (29.6%) |
| Construction & Extraction | 671 (93.2%) | 49 (6.8%) |
| Installation, Maintenance & Repair | 709 (97.9%) | 15 (2.1%) |
| Total (Category) | 1,480 (93.3%) | 106 (6.7%) |
| Total (Overall) | 7,207 (52.6%) | 6,496 (47.4%) |
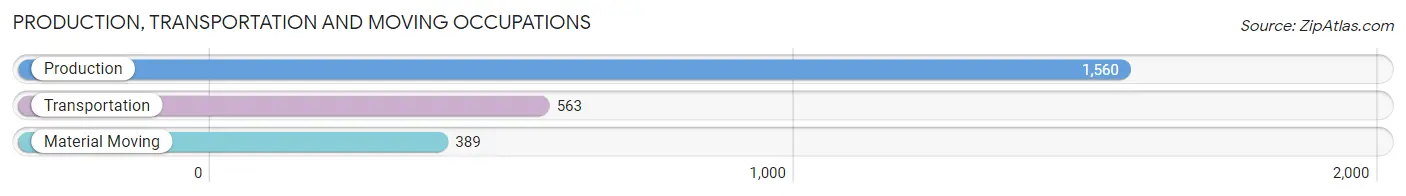
Production, Transportation and Moving Occupations
The most common Production, Transportation and Moving occupations in Montgomery County are Production (1,560 | 11.4%), Transportation (563 | 4.1%), and Material Moving (389 | 2.8%).
Production, Transportation and Moving Occupations by Sex
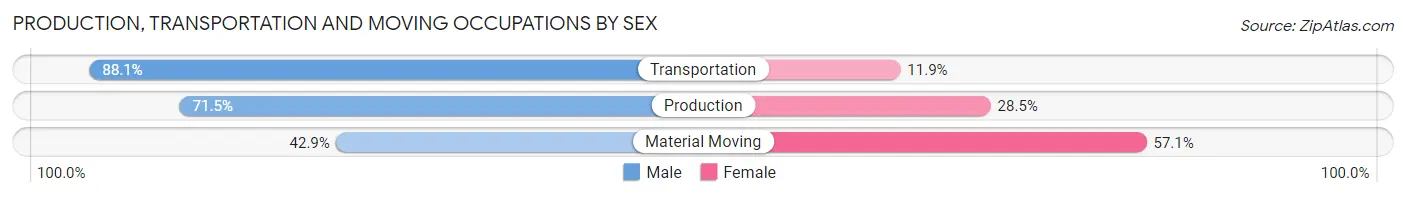
| Occupation | Male | Female |
| Production | 1,116 (71.5%) | 444 (28.5%) |
| Transportation | 496 (88.1%) | 67 (11.9%) |
| Material Moving | 167 (42.9%) | 222 (57.1%) |
| Total (Category) | 1,779 (70.8%) | 733 (29.2%) |
| Total (Overall) | 7,207 (52.6%) | 6,496 (47.4%) |
Employment Industries by Sex in Montgomery County
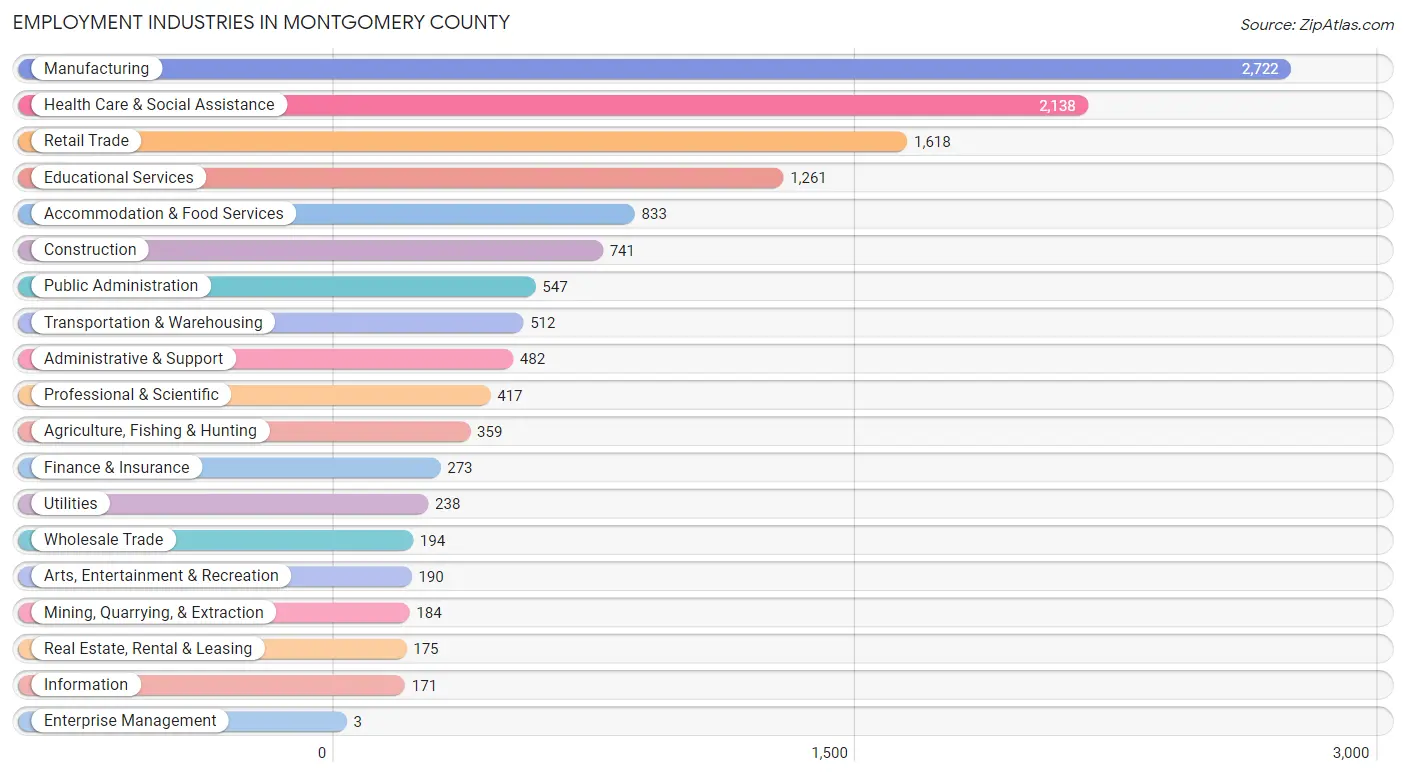
Employment Industries in Montgomery County
The major employment industries in Montgomery County include Manufacturing (2,722 | 19.9%), Health Care & Social Assistance (2,138 | 15.6%), Retail Trade (1,618 | 11.8%), Educational Services (1,261 | 9.2%), and Accommodation & Food Services (833 | 6.1%).
Employment Industries by Sex in Montgomery County
The Montgomery County industries that see more men than women are Enterprise Management (100.0%), Wholesale Trade (96.4%), and Construction (92.0%), whereas the industries that tend to have a higher number of women are Health Care & Social Assistance (84.4%), Finance & Insurance (82.4%), and Educational Services (77.8%).
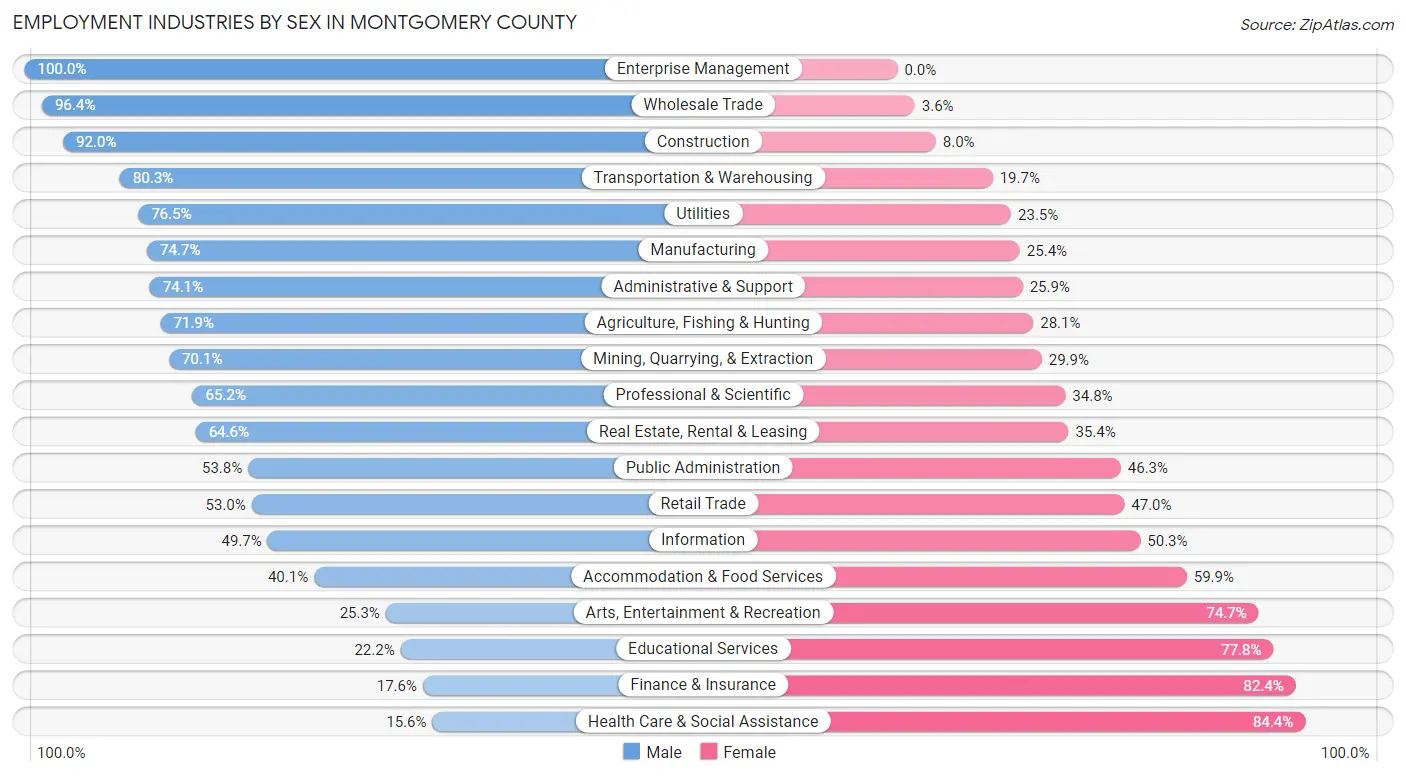
| Industry | Male | Female |
| Agriculture, Fishing & Hunting | 258 (71.9%) | 101 (28.1%) |
| Mining, Quarrying, & Extraction | 129 (70.1%) | 55 (29.9%) |
| Construction | 682 (92.0%) | 59 (8.0%) |
| Manufacturing | 2,032 (74.7%) | 690 (25.4%) |
| Wholesale Trade | 187 (96.4%) | 7 (3.6%) |
| Retail Trade | 858 (53.0%) | 760 (47.0%) |
| Transportation & Warehousing | 411 (80.3%) | 101 (19.7%) |
| Utilities | 182 (76.5%) | 56 (23.5%) |
| Information | 85 (49.7%) | 86 (50.3%) |
| Finance & Insurance | 48 (17.6%) | 225 (82.4%) |
| Real Estate, Rental & Leasing | 113 (64.6%) | 62 (35.4%) |
| Professional & Scientific | 272 (65.2%) | 145 (34.8%) |
| Enterprise Management | 3 (100.0%) | 0 (0.0%) |
| Administrative & Support | 357 (74.1%) | 125 (25.9%) |
| Educational Services | 280 (22.2%) | 981 (77.8%) |
| Health Care & Social Assistance | 334 (15.6%) | 1,804 (84.4%) |
| Arts, Entertainment & Recreation | 48 (25.3%) | 142 (74.7%) |
| Accommodation & Food Services | 334 (40.1%) | 499 (59.9%) |
| Public Administration | 294 (53.7%) | 253 (46.3%) |
| Total | 7,207 (52.6%) | 6,496 (47.4%) |
Education in Montgomery County
School Enrollment in Montgomery County
The most common levels of schooling among the 7,914 students in Montgomery County are middle school (1,779 | 22.5%), high school (1,717 | 21.7%), and elementary school (1,632 | 20.6%).
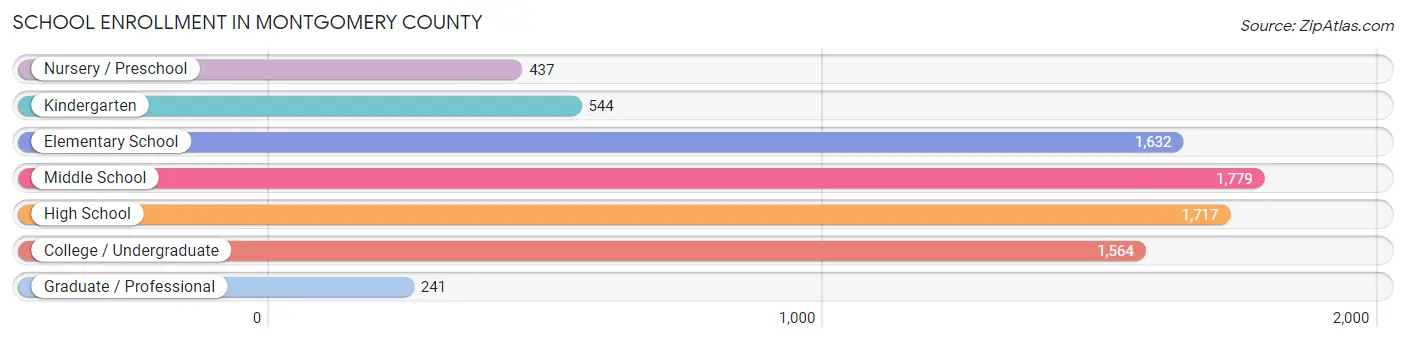
| School Level | # Students | % Students |
| Nursery / Preschool | 437 | 5.5% |
| Kindergarten | 544 | 6.9% |
| Elementary School | 1,632 | 20.6% |
| Middle School | 1,779 | 22.5% |
| High School | 1,717 | 21.7% |
| College / Undergraduate | 1,564 | 19.8% |
| Graduate / Professional | 241 | 3.0% |
| Total | 7,914 | 100.0% |
School Enrollment by Age by Funding Source in Montgomery County
Out of a total of 7,914 students who are enrolled in schools in Montgomery County, 1,163 (14.7%) attend a private institution, while the remaining 6,751 (85.3%) are enrolled in public schools. The age group of 3 to 4 year olds has the highest likelihood of being enrolled in private schools, with 80 (26.1% in the age bracket) enrolled. Conversely, the age group of 18 to 19 year olds has the lowest likelihood of being enrolled in a private school, with 700 (95.4% in the age bracket) attending a public institution.
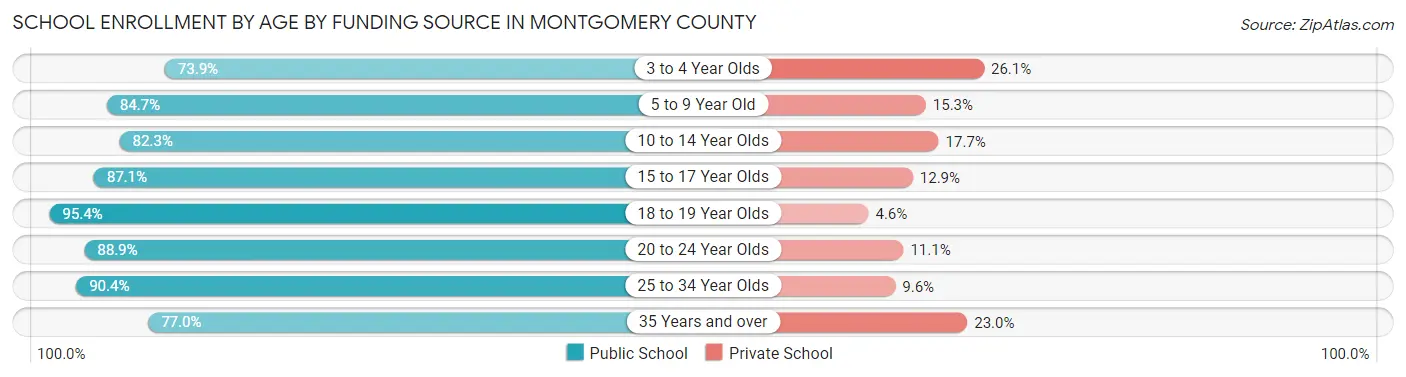
| Age Bracket | Public School | Private School |
| 3 to 4 Year Olds | 226 (73.9%) | 80 (26.1%) |
| 5 to 9 Year Old | 1,814 (84.7%) | 328 (15.3%) |
| 10 to 14 Year Olds | 1,717 (82.3%) | 369 (17.7%) |
| 15 to 17 Year Olds | 1,162 (87.1%) | 172 (12.9%) |
| 18 to 19 Year Olds | 700 (95.4%) | 34 (4.6%) |
| 20 to 24 Year Olds | 614 (88.9%) | 77 (11.1%) |
| 25 to 34 Year Olds | 263 (90.4%) | 28 (9.6%) |
| 35 Years and over | 254 (77.0%) | 76 (23.0%) |
| Total | 6,751 (85.3%) | 1,163 (14.7%) |
Educational Attainment by Field of Study in Montgomery County
Education (1,386 | 30.9%), science & technology (613 | 13.7%), business (612 | 13.6%), bio, nature & agricultural (461 | 10.3%), and arts & humanities (232 | 5.2%) are the most common fields of study among 4,490 individuals in Montgomery County who have obtained a bachelor's degree or higher.
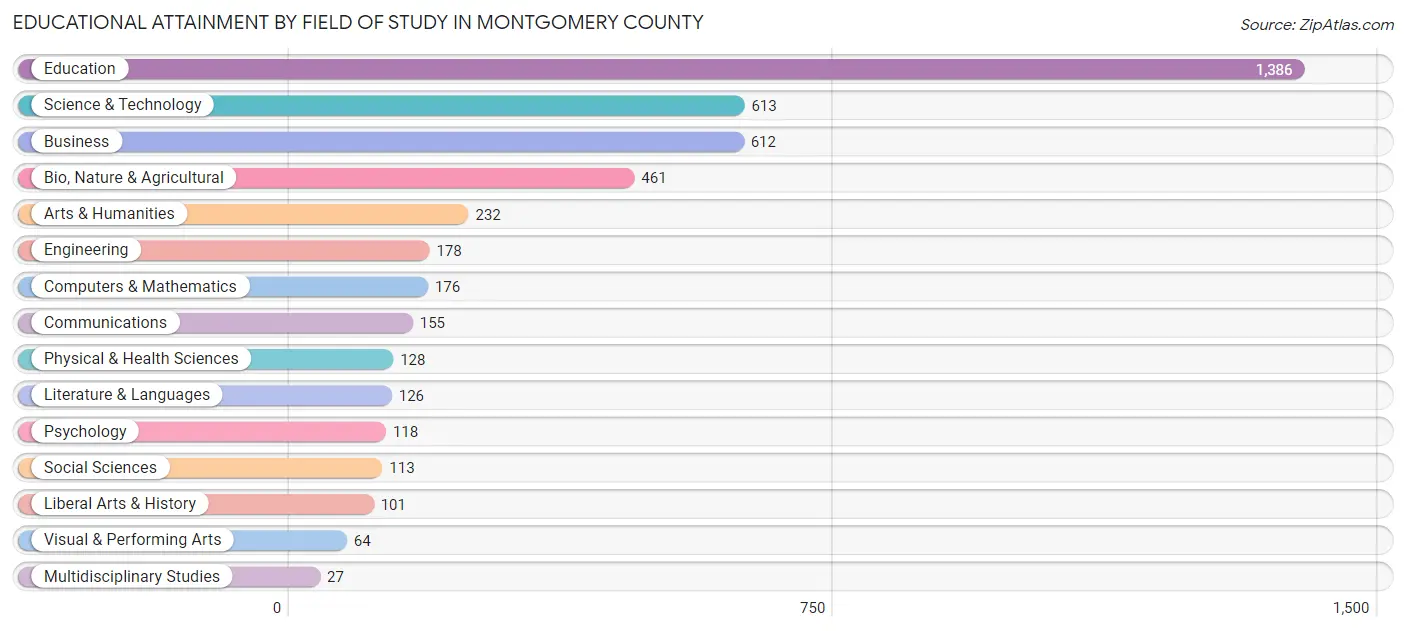
| Field of Study | # Graduates | % Graduates |
| Computers & Mathematics | 176 | 3.9% |
| Bio, Nature & Agricultural | 461 | 10.3% |
| Physical & Health Sciences | 128 | 2.9% |
| Psychology | 118 | 2.6% |
| Social Sciences | 113 | 2.5% |
| Engineering | 178 | 4.0% |
| Multidisciplinary Studies | 27 | 0.6% |
| Science & Technology | 613 | 13.7% |
| Business | 612 | 13.6% |
| Education | 1,386 | 30.9% |
| Literature & Languages | 126 | 2.8% |
| Liberal Arts & History | 101 | 2.2% |
| Visual & Performing Arts | 64 | 1.4% |
| Communications | 155 | 3.5% |
| Arts & Humanities | 232 | 5.2% |
| Total | 4,490 | 100.0% |
Transportation & Commute in Montgomery County
Vehicle Availability by Sex in Montgomery County
The most prevalent vehicle ownership categories in Montgomery County are males with 2 vehicles (2,801, accounting for 39.5%) and females with 2 vehicles (2,319, making up 44.7%).
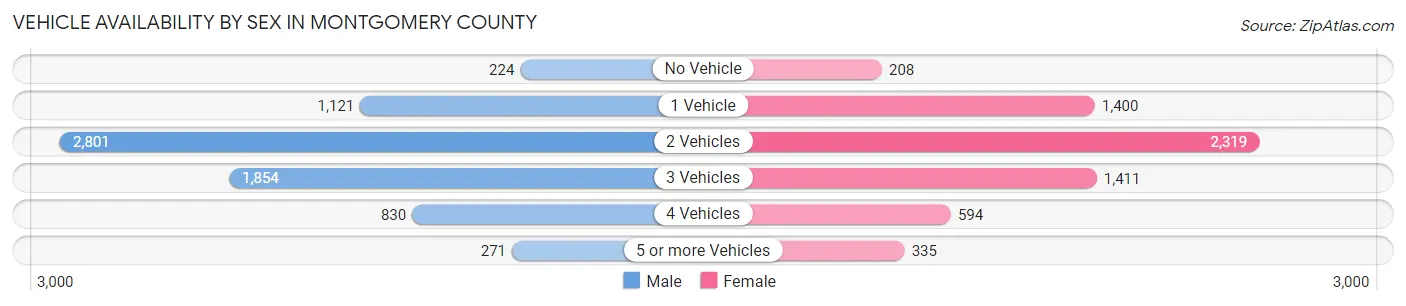
| Vehicles Available | Male | Female |
| No Vehicle | 224 (3.2%) | 208 (3.3%) |
| 1 Vehicle | 1,121 (15.8%) | 1,400 (22.3%) |
| 2 Vehicles | 2,801 (39.5%) | 2,319 (37.0%) |
| 3 Vehicles | 1,854 (26.1%) | 1,411 (22.5%) |
| 4 Vehicles | 830 (11.7%) | 594 (9.5%) |
| 5 or more Vehicles | 271 (3.8%) | 335 (5.3%) |
| Total | 7,101 (100.0%) | 6,267 (100.0%) |
Commute Time in Montgomery County
The most frequently occuring commute durations in Montgomery County are 5 to 9 minutes (3,541 commuters, 27.1%), 10 to 14 minutes (2,500 commuters, 19.1%), and 20 to 24 minutes (1,571 commuters, 12.0%).
| Commute Time | # Commuters | % Commuters |
| Less than 5 Minutes | 1,070 | 8.2% |
| 5 to 9 Minutes | 3,541 | 27.1% |
| 10 to 14 Minutes | 2,500 | 19.1% |
| 15 to 19 Minutes | 1,560 | 11.9% |
| 20 to 24 Minutes | 1,571 | 12.0% |
| 25 to 29 Minutes | 610 | 4.7% |
| 30 to 34 Minutes | 796 | 6.1% |
| 35 to 39 Minutes | 147 | 1.1% |
| 40 to 44 Minutes | 368 | 2.8% |
| 45 to 59 Minutes | 477 | 3.6% |
| 60 to 89 Minutes | 191 | 1.5% |
| 90 or more Minutes | 246 | 1.9% |
Commute Time by Sex in Montgomery County
The most common commute times in Montgomery County are 5 to 9 minutes (1,691 commuters, 24.3%) for males and 5 to 9 minutes (1,850 commuters, 30.2%) for females.
| Commute Time | Male | Female |
| Less than 5 Minutes | 417 (6.0%) | 653 (10.7%) |
| 5 to 9 Minutes | 1,691 (24.3%) | 1,850 (30.2%) |
| 10 to 14 Minutes | 1,425 (20.5%) | 1,075 (17.5%) |
| 15 to 19 Minutes | 746 (10.7%) | 814 (13.3%) |
| 20 to 24 Minutes | 989 (14.2%) | 582 (9.5%) |
| 25 to 29 Minutes | 494 (7.1%) | 116 (1.9%) |
| 30 to 34 Minutes | 457 (6.6%) | 339 (5.5%) |
| 35 to 39 Minutes | 73 (1.1%) | 74 (1.2%) |
| 40 to 44 Minutes | 195 (2.8%) | 173 (2.8%) |
| 45 to 59 Minutes | 247 (3.5%) | 230 (3.7%) |
| 60 to 89 Minutes | 92 (1.3%) | 99 (1.6%) |
| 90 or more Minutes | 124 (1.8%) | 122 (2.0%) |
Time of Departure to Work by Sex in Montgomery County
The most frequent times of departure to work in Montgomery County are 6:30 AM to 6:59 AM (1,066, 15.3%) for males and 7:30 AM to 7:59 AM (1,250, 20.4%) for females.
| Time of Departure | Male | Female |
| 12:00 AM to 4:59 AM | 639 (9.2%) | 356 (5.8%) |
| 5:00 AM to 5:29 AM | 507 (7.3%) | 241 (3.9%) |
| 5:30 AM to 5:59 AM | 616 (8.9%) | 393 (6.4%) |
| 6:00 AM to 6:29 AM | 538 (7.7%) | 150 (2.5%) |
| 6:30 AM to 6:59 AM | 1,066 (15.3%) | 365 (6.0%) |
| 7:00 AM to 7:29 AM | 1,046 (15.0%) | 968 (15.8%) |
| 7:30 AM to 7:59 AM | 733 (10.5%) | 1,250 (20.4%) |
| 8:00 AM to 8:29 AM | 394 (5.7%) | 621 (10.1%) |
| 8:30 AM to 8:59 AM | 80 (1.1%) | 148 (2.4%) |
| 9:00 AM to 9:59 AM | 218 (3.1%) | 385 (6.3%) |
| 10:00 AM to 10:59 AM | 124 (1.8%) | 200 (3.3%) |
| 11:00 AM to 11:59 AM | 51 (0.7%) | 80 (1.3%) |
| 12:00 PM to 3:59 PM | 455 (6.6%) | 593 (9.7%) |
| 4:00 PM to 11:59 PM | 483 (7.0%) | 377 (6.1%) |
| Total | 6,950 (100.0%) | 6,127 (100.0%) |
Housing Occupancy in Montgomery County
Occupancy by Ownership in Montgomery County
Of the total 12,682 dwellings in Montgomery County, owner-occupied units account for 9,204 (72.6%), while renter-occupied units make up 3,478 (27.4%).
| Occupancy | # Housing Units | % Housing Units |
| Owner Occupied Housing Units | 9,204 | 72.6% |
| Renter-Occupied Housing Units | 3,478 | 27.4% |
| Total Occupied Housing Units | 12,682 | 100.0% |
Occupancy by Household Size in Montgomery County
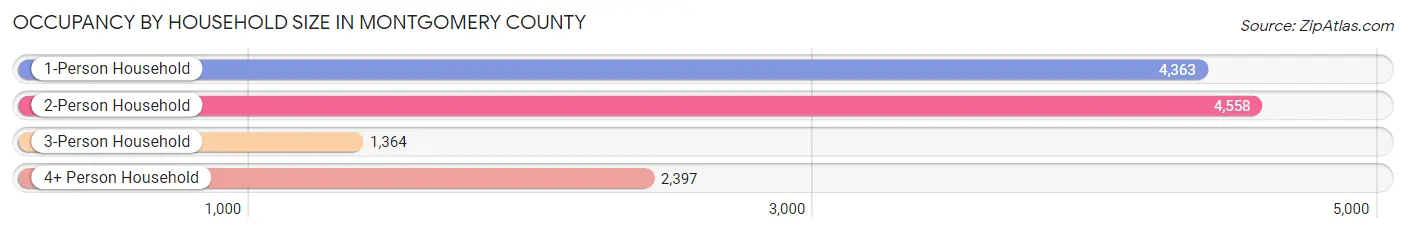
| Household Size | # Housing Units | % Housing Units |
| 1-Person Household | 4,363 | 34.4% |
| 2-Person Household | 4,558 | 35.9% |
| 3-Person Household | 1,364 | 10.8% |
| 4+ Person Household | 2,397 | 18.9% |
| Total Housing Units | 12,682 | 100.0% |
Occupancy by Ownership by Household Size in Montgomery County
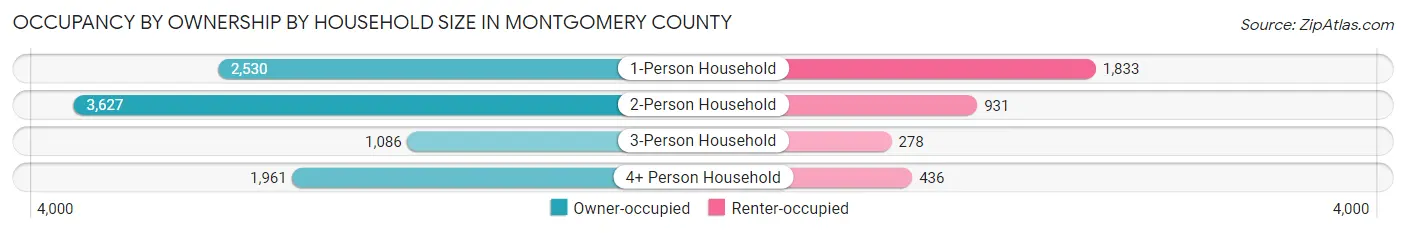
| Household Size | Owner-occupied | Renter-occupied |
| 1-Person Household | 2,530 (58.0%) | 1,833 (42.0%) |
| 2-Person Household | 3,627 (79.6%) | 931 (20.4%) |
| 3-Person Household | 1,086 (79.6%) | 278 (20.4%) |
| 4+ Person Household | 1,961 (81.8%) | 436 (18.2%) |
| Total Housing Units | 9,204 (72.6%) | 3,478 (27.4%) |
Occupancy by Educational Attainment in Montgomery County
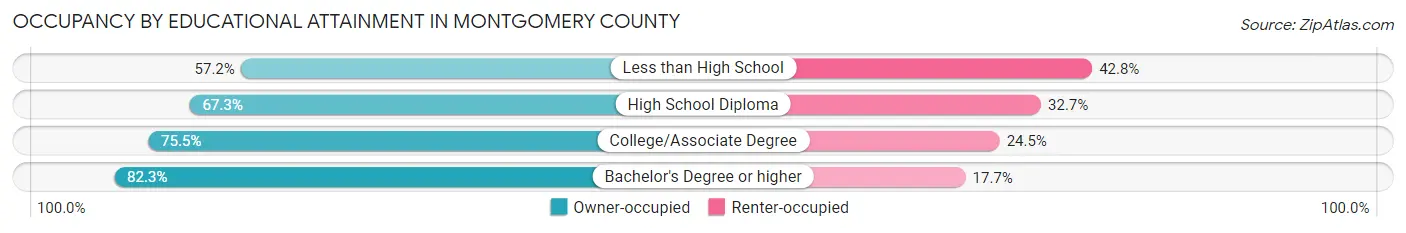
| Household Size | Owner-occupied | Renter-occupied |
| Less than High School | 714 (57.2%) | 535 (42.8%) |
| High School Diploma | 2,711 (67.3%) | 1,317 (32.7%) |
| College/Associate Degree | 3,497 (75.5%) | 1,134 (24.5%) |
| Bachelor's Degree or higher | 2,282 (82.3%) | 492 (17.7%) |
Occupancy by Age of Householder in Montgomery County
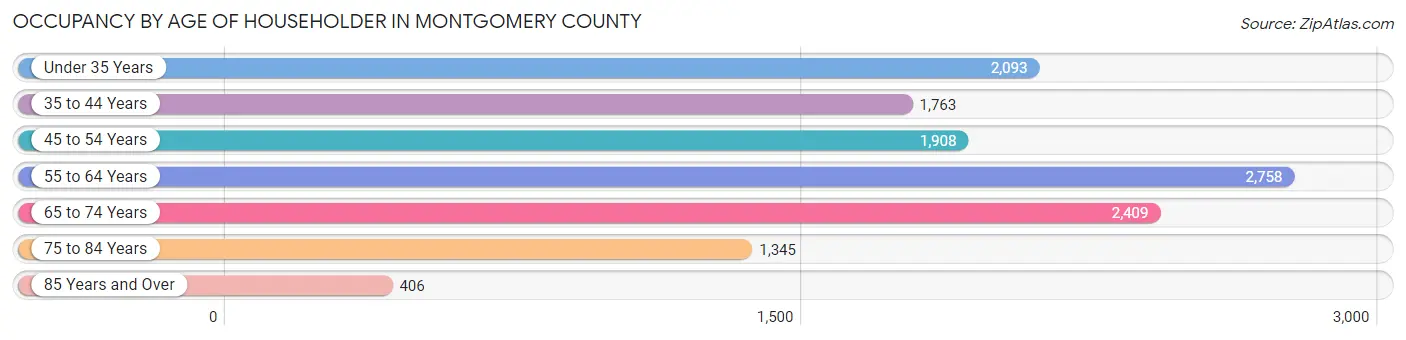
| Age Bracket | # Households | % Households |
| Under 35 Years | 2,093 | 16.5% |
| 35 to 44 Years | 1,763 | 13.9% |
| 45 to 54 Years | 1,908 | 15.0% |
| 55 to 64 Years | 2,758 | 21.7% |
| 65 to 74 Years | 2,409 | 19.0% |
| 75 to 84 Years | 1,345 | 10.6% |
| 85 Years and Over | 406 | 3.2% |
| Total | 12,682 | 100.0% |
Housing Finances in Montgomery County
Median Income by Occupancy in Montgomery County
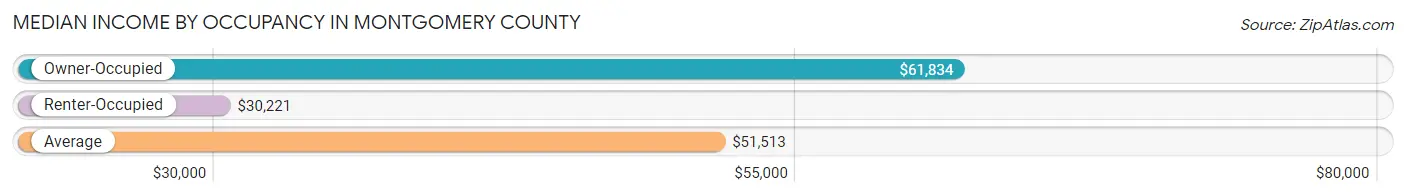
| Occupancy Type | # Households | Median Income |
| Owner-Occupied | 9,204 (72.6%) | $61,834 |
| Renter-Occupied | 3,478 (27.4%) | $30,221 |
| Average | 12,682 (100.0%) | $51,513 |
Occupancy by Householder Income Bracket in Montgomery County
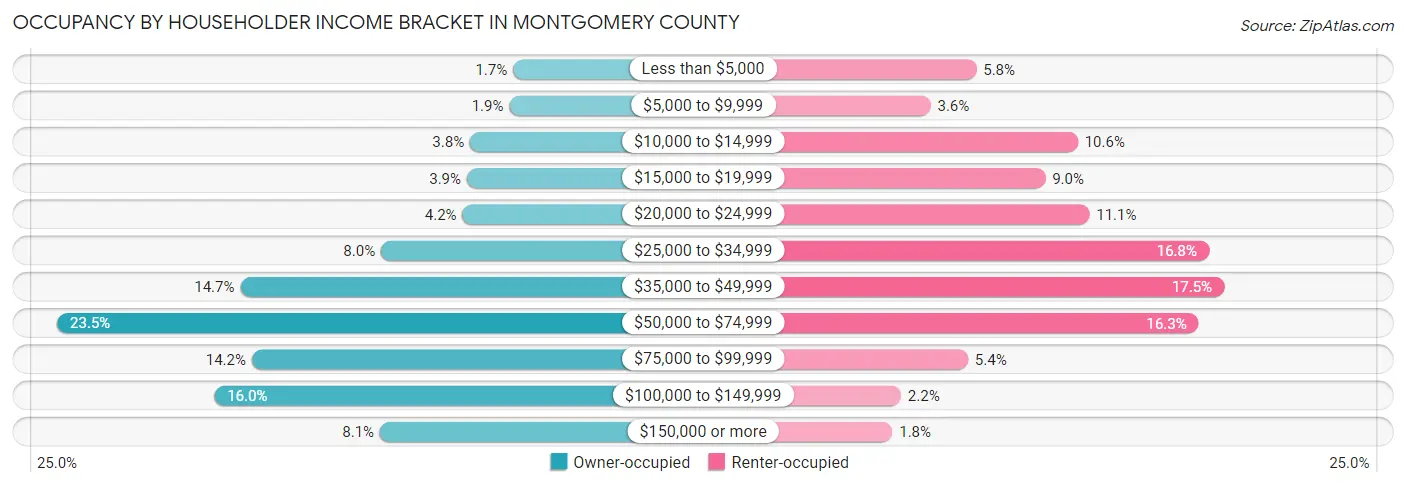
| Income Bracket | Owner-occupied | Renter-occupied |
| Less than $5,000 | 160 (1.7%) | 200 (5.8%) |
| $5,000 to $9,999 | 177 (1.9%) | 124 (3.6%) |
| $10,000 to $14,999 | 349 (3.8%) | 368 (10.6%) |
| $15,000 to $19,999 | 363 (3.9%) | 314 (9.0%) |
| $20,000 to $24,999 | 382 (4.2%) | 387 (11.1%) |
| $25,000 to $34,999 | 739 (8.0%) | 585 (16.8%) |
| $35,000 to $49,999 | 1,356 (14.7%) | 610 (17.5%) |
| $50,000 to $74,999 | 2,159 (23.5%) | 568 (16.3%) |
| $75,000 to $99,999 | 1,305 (14.2%) | 186 (5.3%) |
| $100,000 to $149,999 | 1,470 (16.0%) | 75 (2.2%) |
| $150,000 or more | 744 (8.1%) | 61 (1.8%) |
| Total | 9,204 (100.0%) | 3,478 (100.0%) |
Monthly Housing Cost Tiers in Montgomery County
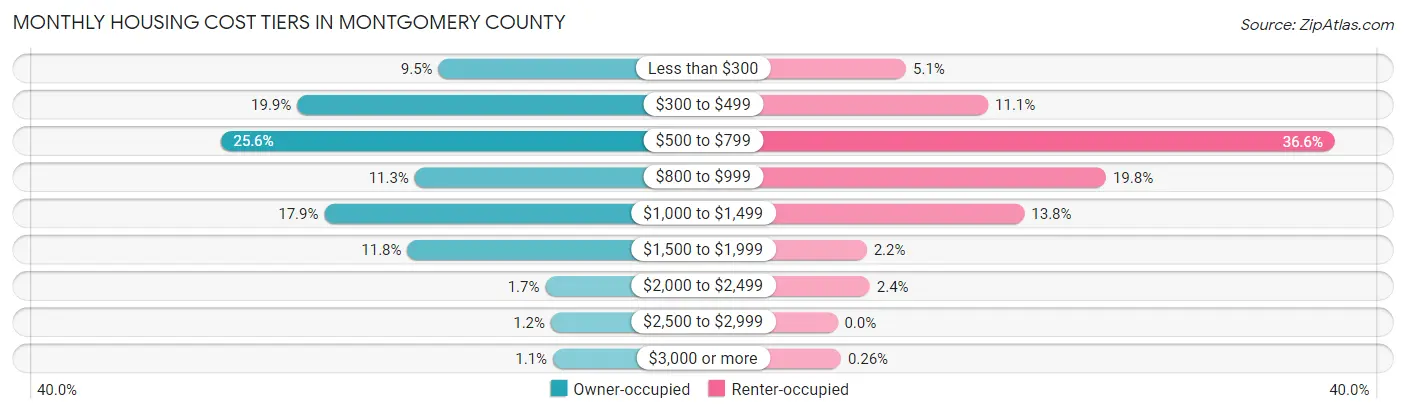
| Monthly Cost | Owner-occupied | Renter-occupied |
| Less than $300 | 876 (9.5%) | 176 (5.1%) |
| $300 to $499 | 1,834 (19.9%) | 386 (11.1%) |
| $500 to $799 | 2,354 (25.6%) | 1,274 (36.6%) |
| $800 to $999 | 1,037 (11.3%) | 688 (19.8%) |
| $1,000 to $1,499 | 1,650 (17.9%) | 479 (13.8%) |
| $1,500 to $1,999 | 1,087 (11.8%) | 75 (2.2%) |
| $2,000 to $2,499 | 152 (1.7%) | 83 (2.4%) |
| $2,500 to $2,999 | 114 (1.2%) | 0 (0.0%) |
| $3,000 or more | 100 (1.1%) | 9 (0.3%) |
| Total | 9,204 (100.0%) | 3,478 (100.0%) |
Physical Housing Characteristics in Montgomery County
Housing Structures in Montgomery County
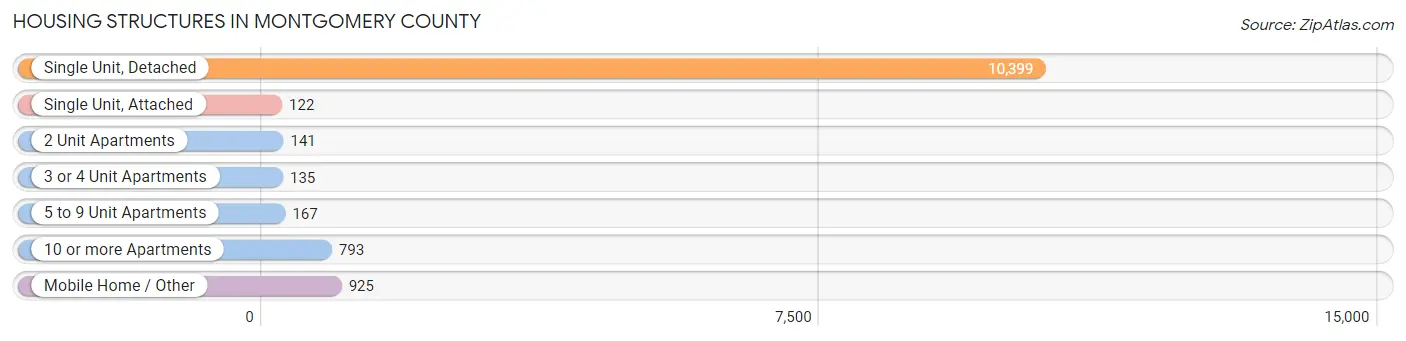
| Structure Type | # Housing Units | % Housing Units |
| Single Unit, Detached | 10,399 | 82.0% |
| Single Unit, Attached | 122 | 1.0% |
| 2 Unit Apartments | 141 | 1.1% |
| 3 or 4 Unit Apartments | 135 | 1.1% |
| 5 to 9 Unit Apartments | 167 | 1.3% |
| 10 or more Apartments | 793 | 6.2% |
| Mobile Home / Other | 925 | 7.3% |
| Total | 12,682 | 100.0% |
Housing Structures by Occupancy in Montgomery County
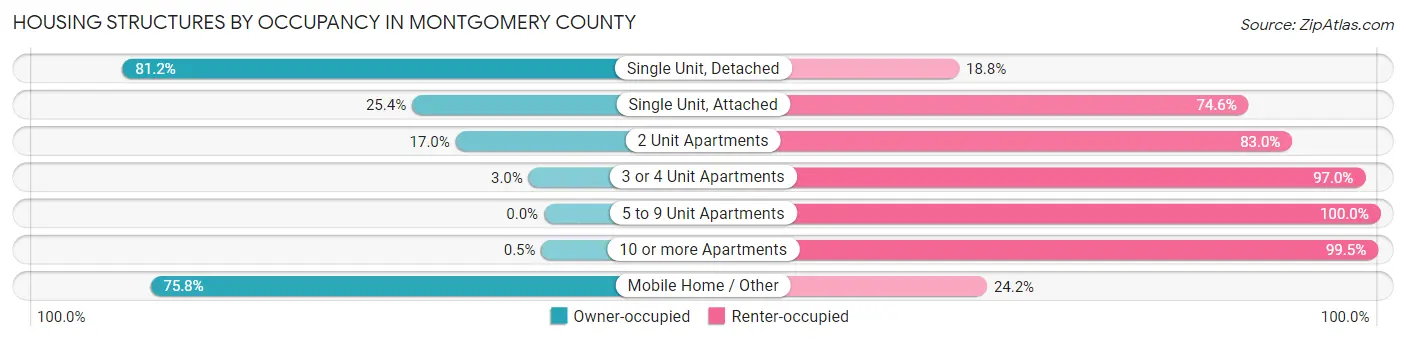
| Structure Type | Owner-occupied | Renter-occupied |
| Single Unit, Detached | 8,440 (81.2%) | 1,959 (18.8%) |
| Single Unit, Attached | 31 (25.4%) | 91 (74.6%) |
| 2 Unit Apartments | 24 (17.0%) | 117 (83.0%) |
| 3 or 4 Unit Apartments | 4 (3.0%) | 131 (97.0%) |
| 5 to 9 Unit Apartments | 0 (0.0%) | 167 (100.0%) |
| 10 or more Apartments | 4 (0.5%) | 789 (99.5%) |
| Mobile Home / Other | 701 (75.8%) | 224 (24.2%) |
| Total | 9,204 (72.6%) | 3,478 (27.4%) |
Housing Structures by Number of Rooms in Montgomery County
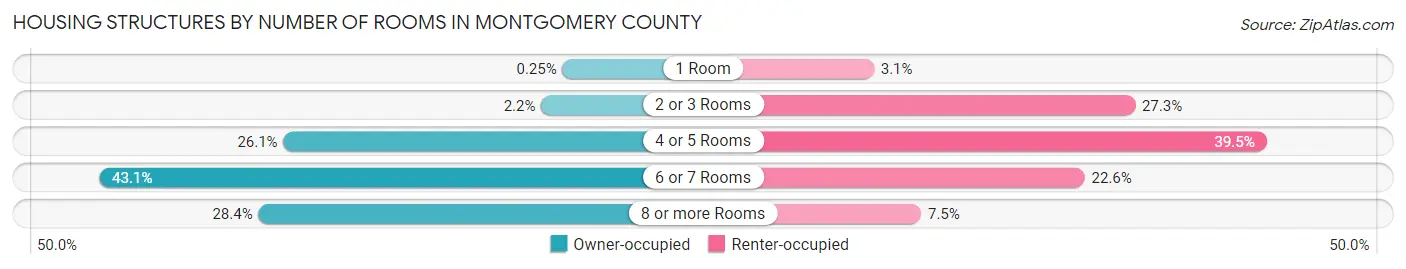
| Number of Rooms | Owner-occupied | Renter-occupied |
| 1 Room | 23 (0.3%) | 109 (3.1%) |
| 2 or 3 Rooms | 203 (2.2%) | 949 (27.3%) |
| 4 or 5 Rooms | 2,399 (26.1%) | 1,372 (39.5%) |
| 6 or 7 Rooms | 3,968 (43.1%) | 787 (22.6%) |
| 8 or more Rooms | 2,611 (28.4%) | 261 (7.5%) |
| Total | 9,204 (100.0%) | 3,478 (100.0%) |
Housing Structure by Heating Type in Montgomery County
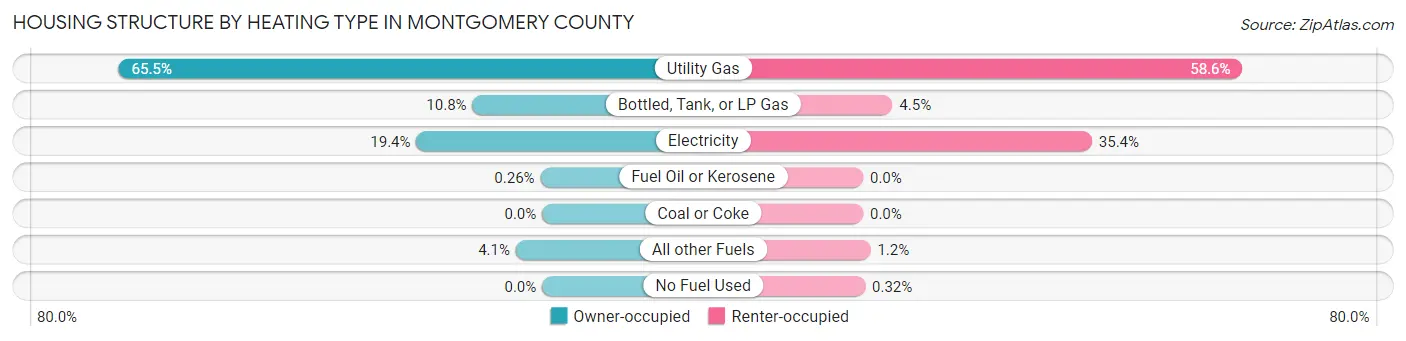
| Heating Type | Owner-occupied | Renter-occupied |
| Utility Gas | 6,025 (65.5%) | 2,039 (58.6%) |
| Bottled, Tank, or LP Gas | 991 (10.8%) | 158 (4.5%) |
| Electricity | 1,789 (19.4%) | 1,230 (35.4%) |
| Fuel Oil or Kerosene | 24 (0.3%) | 0 (0.0%) |
| Coal or Coke | 0 (0.0%) | 0 (0.0%) |
| All other Fuels | 375 (4.1%) | 40 (1.1%) |
| No Fuel Used | 0 (0.0%) | 11 (0.3%) |
| Total | 9,204 (100.0%) | 3,478 (100.0%) |
Household Vehicle Usage in Montgomery County

| Vehicles per Household | Owner-occupied | Renter-occupied |
| No Vehicle | 323 (3.5%) | 718 (20.6%) |
| 1 Vehicle | 2,263 (24.6%) | 1,766 (50.8%) |
| 2 Vehicles | 3,670 (39.9%) | 732 (21.0%) |
| 3 or more Vehicles | 2,948 (32.0%) | 262 (7.5%) |
| Total | 9,204 (100.0%) | 3,478 (100.0%) |
Real Estate & Mortgages in Montgomery County
Real Estate and Mortgage Overview in Montgomery County
| Characteristic | Without Mortgage | With Mortgage |
| Housing Units | 5,031 | 4,173 |
| Median Property Value | $70,900 | $112,000 |
| Median Household Income | $51,279 | $432 |
| Monthly Housing Costs | $497 | $100 |
| Real Estate Taxes | $1,275 | $0 |
Property Value by Mortgage Status in Montgomery County
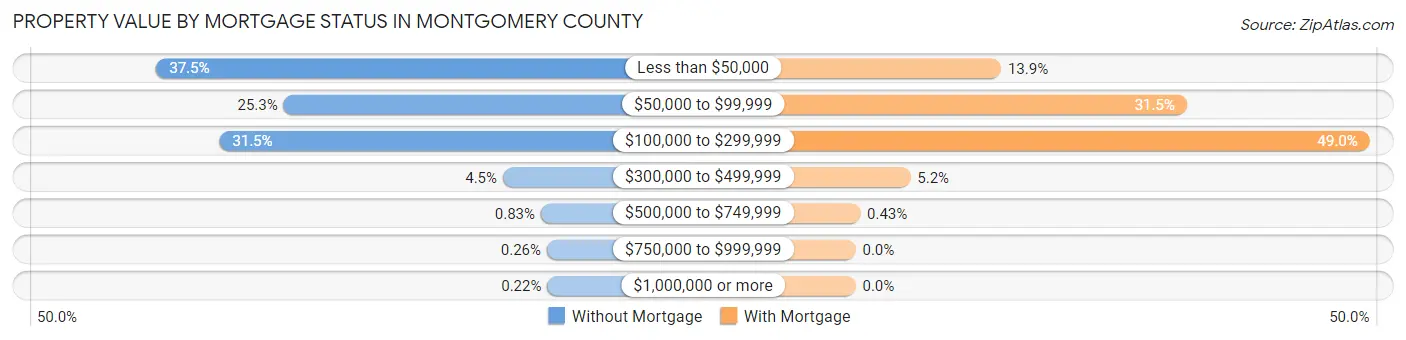
| Property Value | Without Mortgage | With Mortgage |
| Less than $50,000 | 1,884 (37.4%) | 578 (13.9%) |
| $50,000 to $99,999 | 1,275 (25.3%) | 1,316 (31.5%) |
| $100,000 to $299,999 | 1,582 (31.5%) | 2,043 (49.0%) |
| $300,000 to $499,999 | 224 (4.4%) | 218 (5.2%) |
| $500,000 to $749,999 | 42 (0.8%) | 18 (0.4%) |
| $750,000 to $999,999 | 13 (0.3%) | 0 (0.0%) |
| $1,000,000 or more | 11 (0.2%) | 0 (0.0%) |
| Total | 5,031 (100.0%) | 4,173 (100.0%) |
Household Income by Mortgage Status in Montgomery County
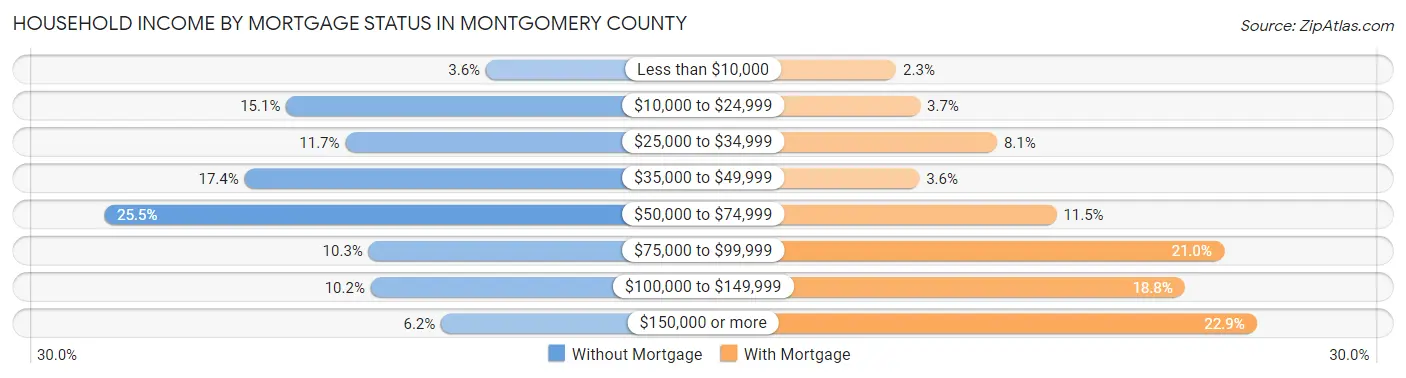
| Household Income | Without Mortgage | With Mortgage |
| Less than $10,000 | 183 (3.6%) | 97 (2.3%) |
| $10,000 to $24,999 | 757 (15.0%) | 154 (3.7%) |
| $25,000 to $34,999 | 587 (11.7%) | 337 (8.1%) |
| $35,000 to $49,999 | 877 (17.4%) | 152 (3.6%) |
| $50,000 to $74,999 | 1,281 (25.5%) | 479 (11.5%) |
| $75,000 to $99,999 | 520 (10.3%) | 878 (21.0%) |
| $100,000 to $149,999 | 514 (10.2%) | 785 (18.8%) |
| $150,000 or more | 312 (6.2%) | 956 (22.9%) |
| Total | 5,031 (100.0%) | 4,173 (100.0%) |
Property Value to Household Income Ratio in Montgomery County
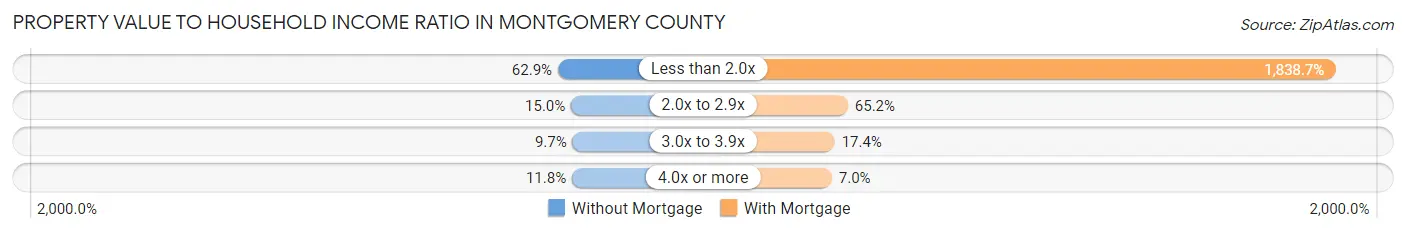
| Value-to-Income Ratio | Without Mortgage | With Mortgage |
| Less than 2.0x | 3,166 (62.9%) | 76,730 (1,838.7%) |
| 2.0x to 2.9x | 753 (15.0%) | 2,722 (65.2%) |
| 3.0x to 3.9x | 486 (9.7%) | 724 (17.3%) |
| 4.0x or more | 595 (11.8%) | 290 (7.0%) |
| Total | 5,031 (100.0%) | 4,173 (100.0%) |
Real Estate Taxes by Mortgage Status in Montgomery County
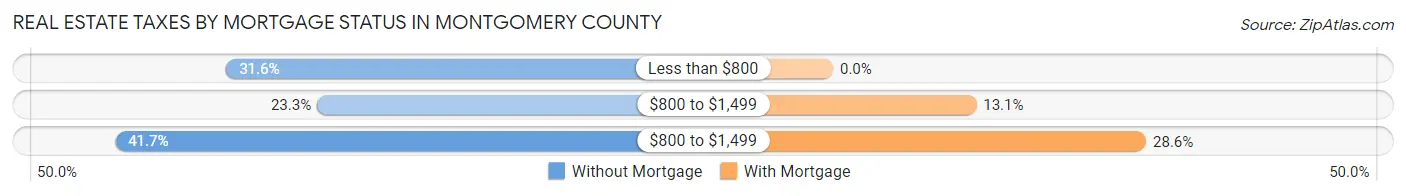
| Property Taxes | Without Mortgage | With Mortgage |
| Less than $800 | 1,589 (31.6%) | 0 (0.0%) |
| $800 to $1,499 | 1,172 (23.3%) | 546 (13.1%) |
| $800 to $1,499 | 2,099 (41.7%) | 1,193 (28.6%) |
| Total | 5,031 (100.0%) | 4,173 (100.0%) |
Health & Disability in Montgomery County
Health Insurance Coverage by Age in Montgomery County
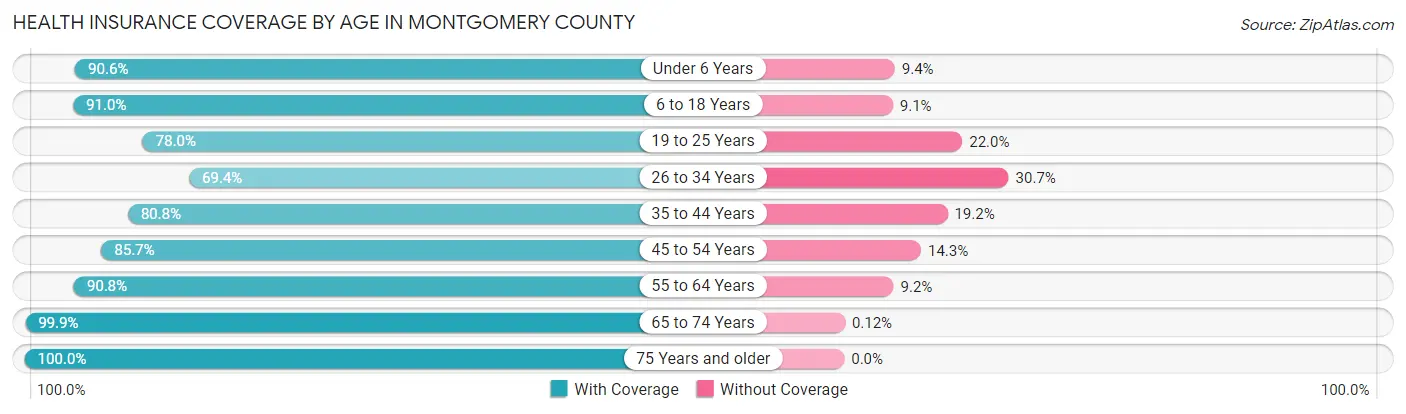
| Age Bracket | With Coverage | Without Coverage |
| Under 6 Years | 2,026 (90.6%) | 211 (9.4%) |
| 6 to 18 Years | 5,226 (90.9%) | 520 (9.0%) |
| 19 to 25 Years | 1,920 (78.0%) | 542 (22.0%) |
| 26 to 34 Years | 2,249 (69.4%) | 994 (30.6%) |
| 35 to 44 Years | 2,821 (80.8%) | 672 (19.2%) |
| 45 to 54 Years | 2,901 (85.7%) | 485 (14.3%) |
| 55 to 64 Years | 4,158 (90.8%) | 421 (9.2%) |
| 65 to 74 Years | 3,456 (99.9%) | 4 (0.1%) |
| 75 Years and older | 2,361 (100.0%) | 0 (0.0%) |
| Total | 27,118 (87.6%) | 3,849 (12.4%) |
Health Insurance Coverage by Citizenship Status in Montgomery County
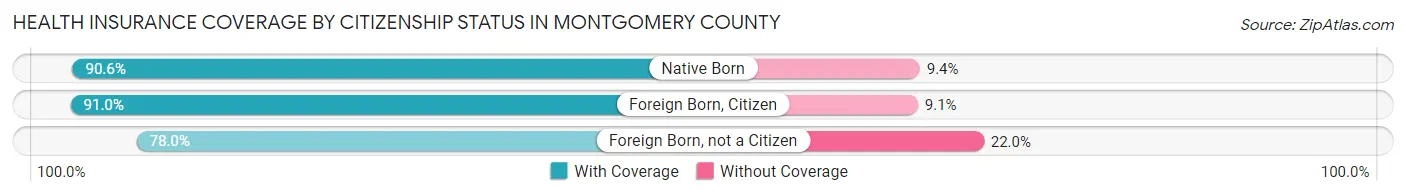
| Citizenship Status | With Coverage | Without Coverage |
| Native Born | 2,026 (90.6%) | 211 (9.4%) |
| Foreign Born, Citizen | 5,226 (90.9%) | 520 (9.0%) |
| Foreign Born, not a Citizen | 1,920 (78.0%) | 542 (22.0%) |
Health Insurance Coverage by Household Income in Montgomery County
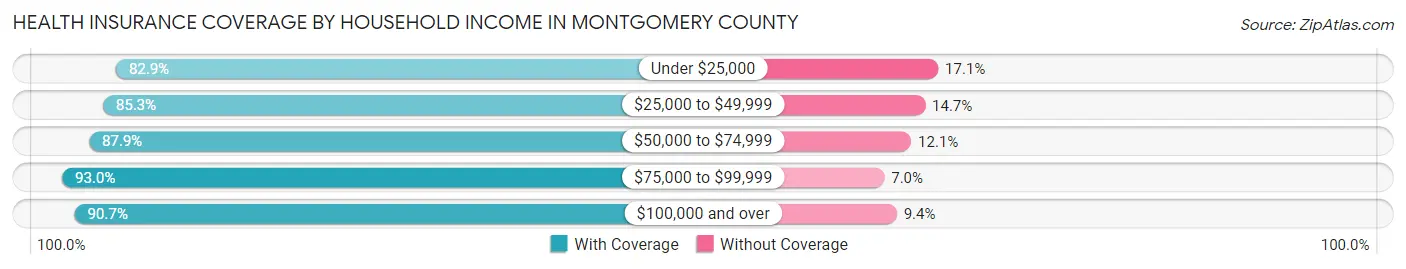
| Household Income | With Coverage | Without Coverage |
| Under $25,000 | 4,193 (82.9%) | 866 (17.1%) |
| $25,000 to $49,999 | 5,689 (85.3%) | 978 (14.7%) |
| $50,000 to $74,999 | 6,244 (87.9%) | 856 (12.1%) |
| $75,000 to $99,999 | 3,680 (93.0%) | 278 (7.0%) |
| $100,000 and over | 6,933 (90.6%) | 715 (9.3%) |
Public vs Private Health Insurance Coverage by Age in Montgomery County
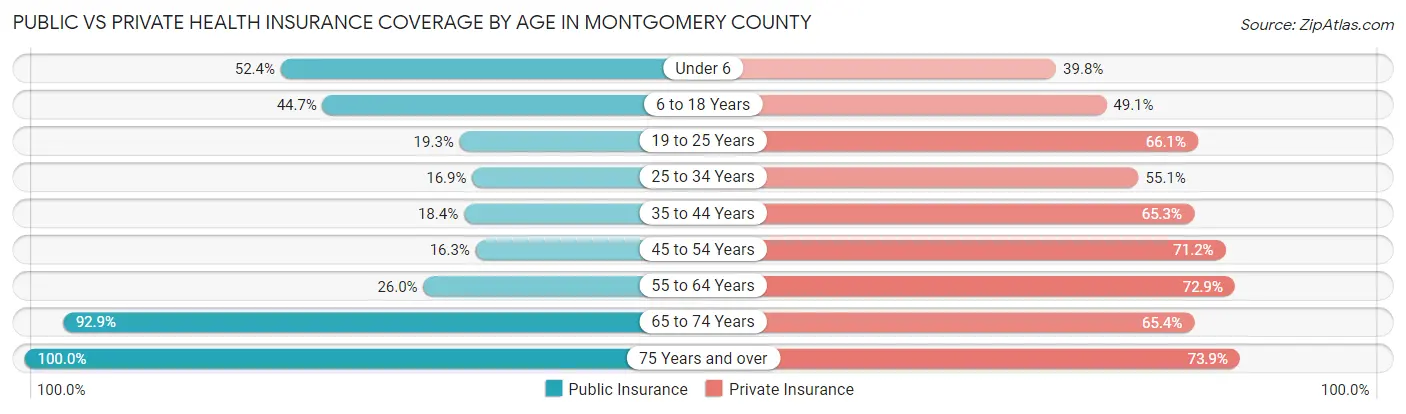
| Age Bracket | Public Insurance | Private Insurance |
| Under 6 | 1,173 (52.4%) | 890 (39.8%) |
| 6 to 18 Years | 2,567 (44.7%) | 2,822 (49.1%) |
| 19 to 25 Years | 474 (19.3%) | 1,627 (66.1%) |
| 25 to 34 Years | 548 (16.9%) | 1,787 (55.1%) |
| 35 to 44 Years | 644 (18.4%) | 2,282 (65.3%) |
| 45 to 54 Years | 551 (16.3%) | 2,411 (71.2%) |
| 55 to 64 Years | 1,189 (26.0%) | 3,340 (72.9%) |
| 65 to 74 Years | 3,215 (92.9%) | 2,263 (65.4%) |
| 75 Years and over | 2,361 (100.0%) | 1,744 (73.9%) |
| Total | 12,722 (41.1%) | 19,166 (61.9%) |
Disability Status by Sex by Age in Montgomery County
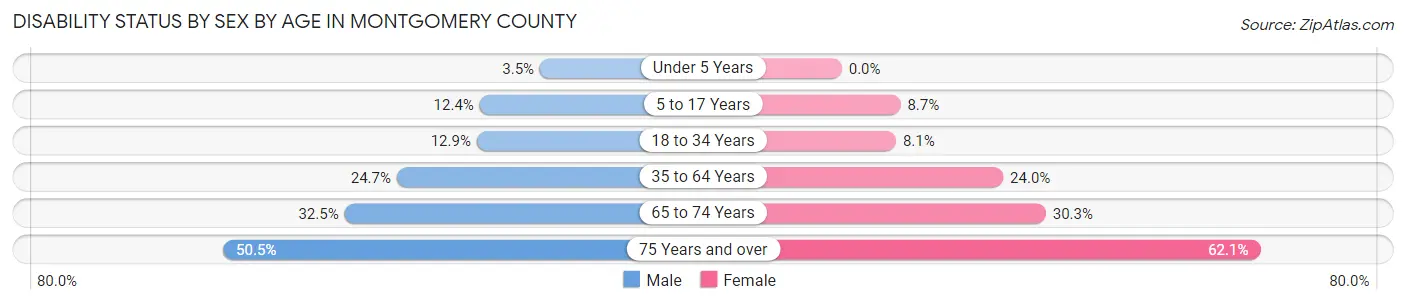
| Age Bracket | Male | Female |
| Under 5 Years | 35 (3.5%) | 0 (0.0%) |
| 5 to 17 Years | 378 (12.4%) | 233 (8.7%) |
| 18 to 34 Years | 423 (12.9%) | 234 (8.1%) |
| 35 to 64 Years | 1,402 (24.7%) | 1,387 (24.0%) |
| 65 to 74 Years | 545 (32.5%) | 540 (30.3%) |
| 75 Years and over | 495 (50.5%) | 858 (62.1%) |
Disability Class by Sex by Age in Montgomery County
Disability Class: Hearing Difficulty
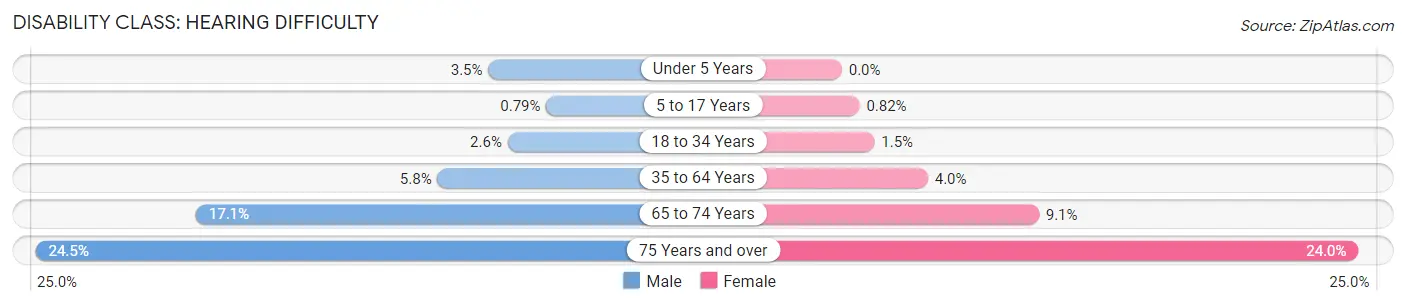
| Age Bracket | Male | Female |
| Under 5 Years | 35 (3.5%) | 0 (0.0%) |
| 5 to 17 Years | 24 (0.8%) | 22 (0.8%) |
| 18 to 34 Years | 85 (2.6%) | 44 (1.5%) |
| 35 to 64 Years | 331 (5.8%) | 231 (4.0%) |
| 65 to 74 Years | 286 (17.1%) | 163 (9.1%) |
| 75 Years and over | 240 (24.5%) | 331 (24.0%) |
Disability Class: Vision Difficulty
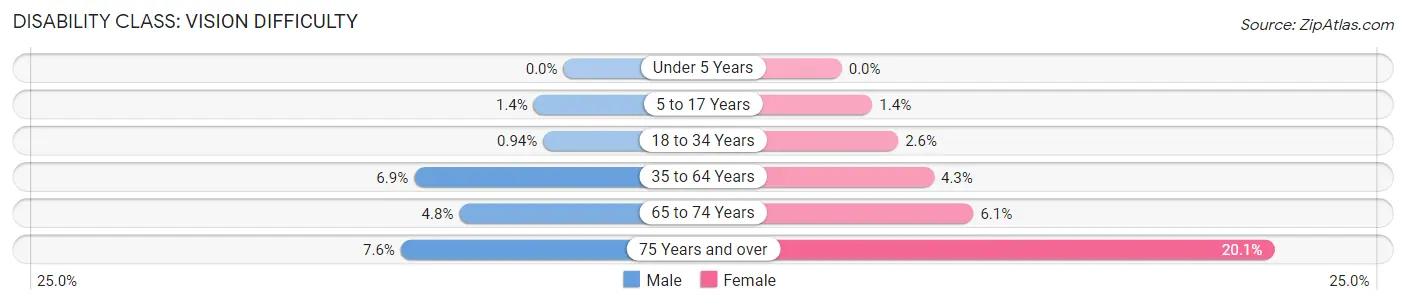
| Age Bracket | Male | Female |
| Under 5 Years | 0 (0.0%) | 0 (0.0%) |
| 5 to 17 Years | 42 (1.4%) | 38 (1.4%) |
| 18 to 34 Years | 31 (0.9%) | 76 (2.6%) |
| 35 to 64 Years | 393 (6.9%) | 248 (4.3%) |
| 65 to 74 Years | 81 (4.8%) | 109 (6.1%) |
| 75 Years and over | 74 (7.5%) | 277 (20.1%) |
Disability Class: Cognitive Difficulty
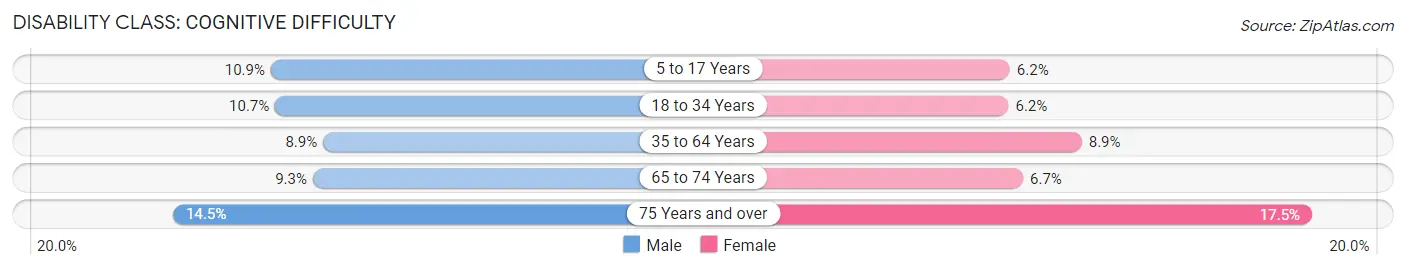
| Age Bracket | Male | Female |
| 5 to 17 Years | 330 (10.9%) | 167 (6.2%) |
| 18 to 34 Years | 352 (10.7%) | 180 (6.2%) |
| 35 to 64 Years | 506 (8.9%) | 516 (8.9%) |
| 65 to 74 Years | 156 (9.3%) | 120 (6.7%) |
| 75 Years and over | 142 (14.5%) | 241 (17.4%) |
Disability Class: Ambulatory Difficulty
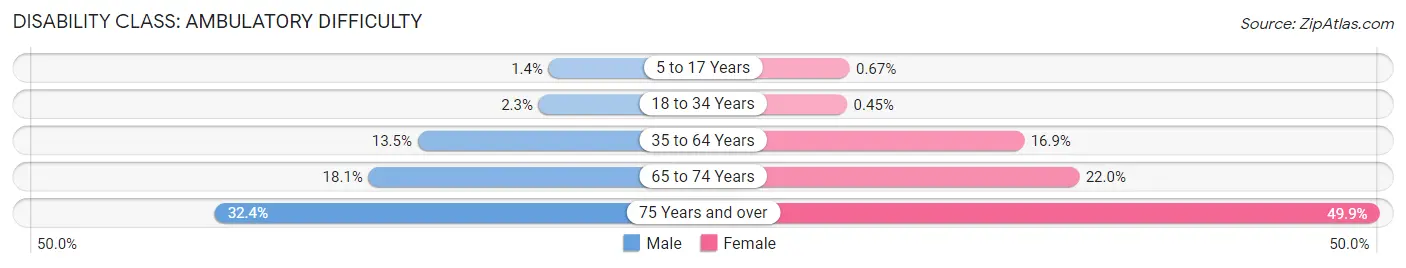
| Age Bracket | Male | Female |
| 5 to 17 Years | 41 (1.3%) | 18 (0.7%) |
| 18 to 34 Years | 75 (2.3%) | 13 (0.4%) |
| 35 to 64 Years | 766 (13.5%) | 977 (16.9%) |
| 65 to 74 Years | 303 (18.1%) | 392 (22.0%) |
| 75 Years and over | 317 (32.4%) | 689 (49.9%) |
Disability Class: Self-Care Difficulty
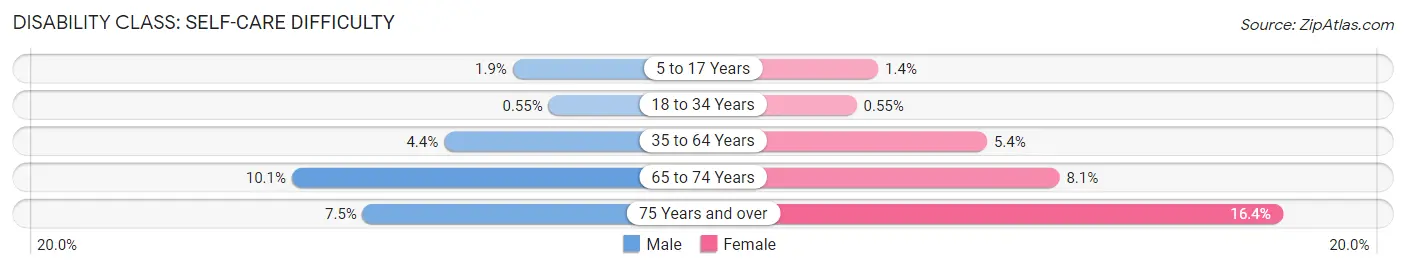
| Age Bracket | Male | Female |
| 5 to 17 Years | 57 (1.9%) | 36 (1.3%) |
| 18 to 34 Years | 18 (0.5%) | 16 (0.5%) |
| 35 to 64 Years | 251 (4.4%) | 312 (5.4%) |
| 65 to 74 Years | 169 (10.1%) | 144 (8.1%) |
| 75 Years and over | 73 (7.4%) | 226 (16.4%) |
Technology Access in Montgomery County
Computing Device Access in Montgomery County
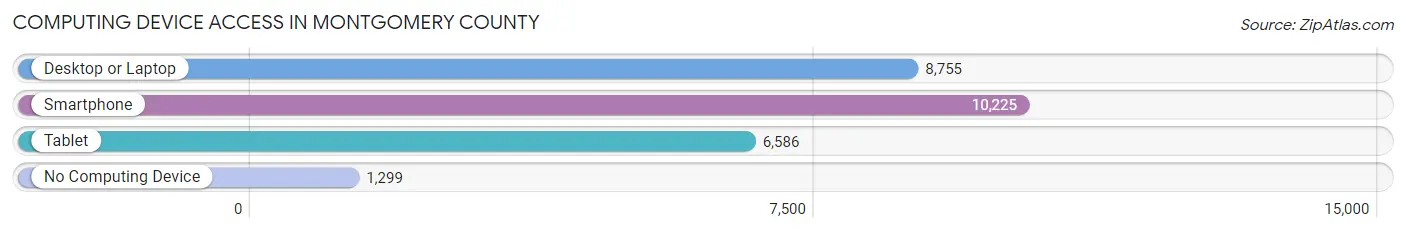
| Device Type | # Households | % Households |
| Desktop or Laptop | 8,755 | 69.0% |
| Smartphone | 10,225 | 80.6% |
| Tablet | 6,586 | 51.9% |
| No Computing Device | 1,299 | 10.2% |
| Total | 12,682 | 100.0% |
Internet Access in Montgomery County
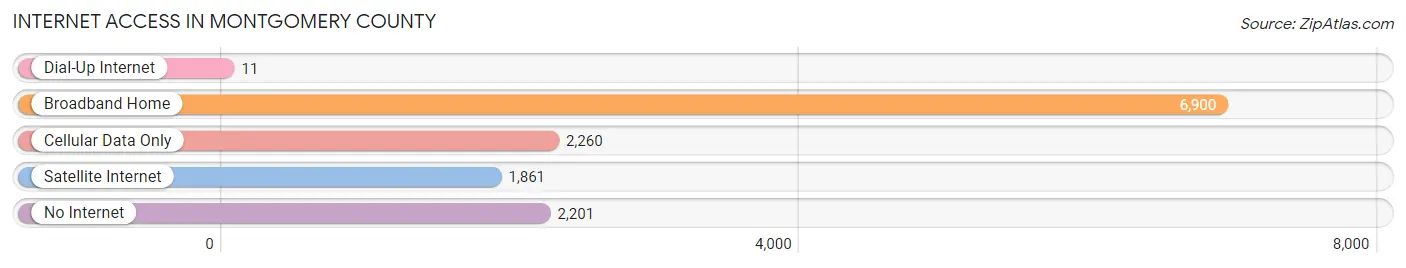
| Internet Type | # Households | % Households |
| Dial-Up Internet | 11 | 0.1% |
| Broadband Home | 6,900 | 54.4% |
| Cellular Data Only | 2,260 | 17.8% |
| Satellite Internet | 1,861 | 14.7% |
| No Internet | 2,201 | 17.4% |
| Total | 12,682 | 100.0% |
Montgomery County Summary
Montgomery County, Kansas is located in the southeastern corner of the state and is part of the Flint Hills region. It is bordered by Coffey County to the north, Wilson County to the east, Labette County to the south, and Greenwood County to the west. The county seat is Independence, and the largest city is Cherryvale. The county was named for Richard Montgomery, an American Revolutionary War general.
Geography
Montgomery County covers an area of 576 square miles and is located in the Osage Plains region of Kansas. The county is mostly flat, with some rolling hills in the northern and western parts. The county is drained by the Verdigris River, which flows through the center of the county. The county is mostly covered in grassland, with some areas of woodland in the northern and western parts.
Climate
Montgomery County has a humid continental climate, with hot summers and cold winters. The average annual temperature is around 54°F, with an average high of around 79°F in the summer and an average low of around 28°F in the winter. The average annual precipitation is around 34 inches, with most of it falling in the spring and summer months.
Demographics
As of the 2010 census, Montgomery County had a population of 35,471. The racial makeup of the county was 94.2% White, 1.3% African American, 0.7% Native American, 0.4% Asian, 0.1% Pacific Islander, 1.7% from other races, and 1.6% from two or more races. Hispanic or Latino of any race were 4.2% of the population.
Economy
Agriculture is the main economic activity in Montgomery County. The county is home to many farms, which produce wheat, corn, soybeans, and other crops. Cattle ranching is also an important part of the local economy.
The county is also home to several manufacturing companies, including a steel mill, a paper mill, and a plastics plant. The county also has a large tourism industry, with many visitors coming to the area to enjoy the natural beauty of the Flint Hills.
History
Montgomery County was established in 1867 and was named for Richard Montgomery, an American Revolutionary War general. The county was originally part of the Osage Indian Reservation, which was established in 1825. The county was opened to settlement in 1867, and the first settlers arrived in the area in 1868.
The county was originally an agricultural area, with many settlers raising cattle and growing wheat, corn, and other crops. The county was also home to several coal mines, which provided employment for many of the residents.
In the early 20th century, the county began to diversify its economy, with the establishment of several manufacturing companies. The county also became a popular tourist destination, with many visitors coming to the area to enjoy the natural beauty of the Flint Hills.
Today, Montgomery County is a thriving agricultural and industrial area. The county is home to many farms, which produce wheat, corn, soybeans, and other crops. The county is also home to several manufacturing companies, which provide employment for many of the residents. The county is also a popular tourist destination, with many visitors coming to the area to enjoy the natural beauty of the Flint Hills.
Common Questions
What is the Total Population of Montgomery County?
Total Population of Montgomery County is 31,448.
What is the Total Male Population of Montgomery County?
Total Male Population of Montgomery County is 15,848.
What is the Total Female Population of Montgomery County?
Total Female Population of Montgomery County is 15,600.
What is the Ratio of Males per 100 Females in Montgomery County?
There are 101.59 Males per 100 Females in Montgomery County.
What is the Ratio of Females per 100 Males in Montgomery County?
There are 98.44 Females per 100 Males in Montgomery County.
What is the Median Population Age in Montgomery County?
Median Population Age in Montgomery County is 40.2 Years.
What is the Average Family Size in Montgomery County
Average Family Size in Montgomery County is 3.1 People.
What is the Average Household Size in Montgomery County
Average Household Size in Montgomery County is 2.4 People.
What is Per Capita Income in Montgomery County?
Per Capita income in Montgomery County is $28,270.
What is the Median Family Income in Montgomery County?
Median Family Income in Montgomery County is $65,582.
What is the Median Household income in Montgomery County?
Median Household Income in Montgomery County is $51,513.
What is Income or Wage Gap in Montgomery County?
Income or Wage Gap in Montgomery County is 40.1%.
Women in Montgomery County earn 59.9 cents for every dollar earned by a man.
What is Family Income Deficit in Montgomery County?
Family Income Deficit in Montgomery County is $9,905.
Families that are below poverty line in Montgomery County earn $9,905 less on average than the poverty threshold level.
What is Inequality or Gini Index in Montgomery County?
Inequality or Gini Index in Montgomery County is 0.43.
How Large is the Labor Force in Montgomery County?
There are 14,419 People in the Labor Forcein in Montgomery County.
What is the Percentage of People in the Labor Force in Montgomery County?
57.7% of People are in the Labor Force in Montgomery County.
What is the Unemployment Rate in Montgomery County?
Unemployment Rate in Montgomery County is 4.7%.