Miami County, KS
Miami County Map
Miami County Overview
34,312
TOTAL POPULATION
17,443
MALE POPULATION
16,869
FEMALE POPULATION
103.40
MALES / 100 FEMALES
96.71
FEMALES / 100 MALES
42.5
MEDIAN AGE
3.0
AVG FAMILY SIZE
2.5
AVG HOUSEHOLD SIZE
$40,169
PER CAPITA INCOME
$101,265
AVG FAMILY INCOME
$85,564
AVG HOUSEHOLD INCOME
34.6%
WAGE / INCOME GAP [ % ]
65.4¢/ $1
WAGE / INCOME GAP [ $ ]
$8,611
FAMILY INCOME DEFICIT
0.40
INEQUALITY / GINI INDEX
17,654
LABOR FORCE [ PEOPLE ]
64.7%
PERCENT IN LABOR FORCE
2.8%
UNEMPLOYMENT RATE
Miami County Area Codes
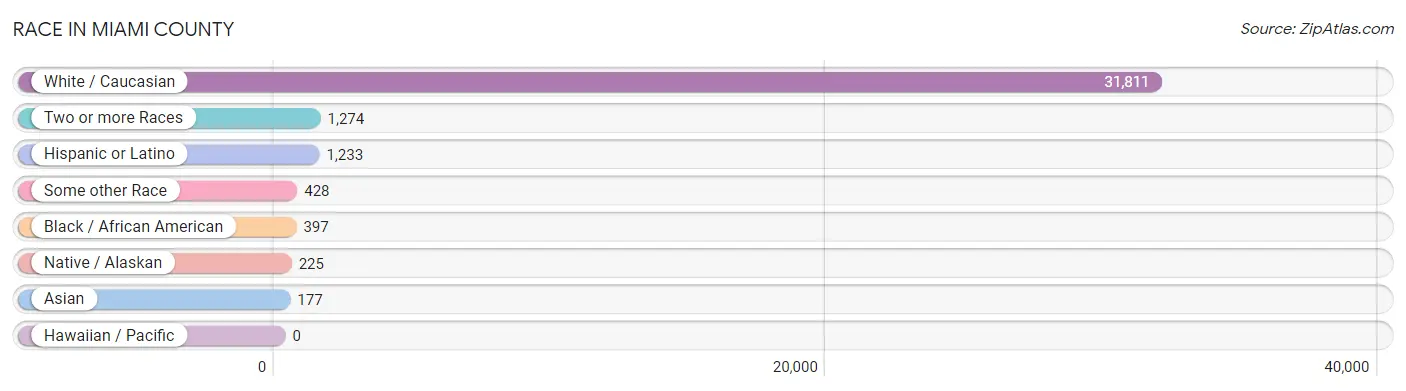
Race in Miami County
The most populous races in Miami County are White / Caucasian (31,811 | 92.7%), Two or more Races (1,274 | 3.7%), and Hispanic or Latino (1,233 | 3.6%).
| Race | # Population | % Population |
| Asian | 177 | 0.5% |
| Black / African American | 397 | 1.2% |
| Hawaiian / Pacific | 0 | 0.0% |
| Hispanic or Latino | 1,233 | 3.6% |
| Native / Alaskan | 225 | 0.7% |
| White / Caucasian | 31,811 | 92.7% |
| Two or more Races | 1,274 | 3.7% |
| Some other Race | 428 | 1.3% |
| Total | 34,312 | 100.0% |
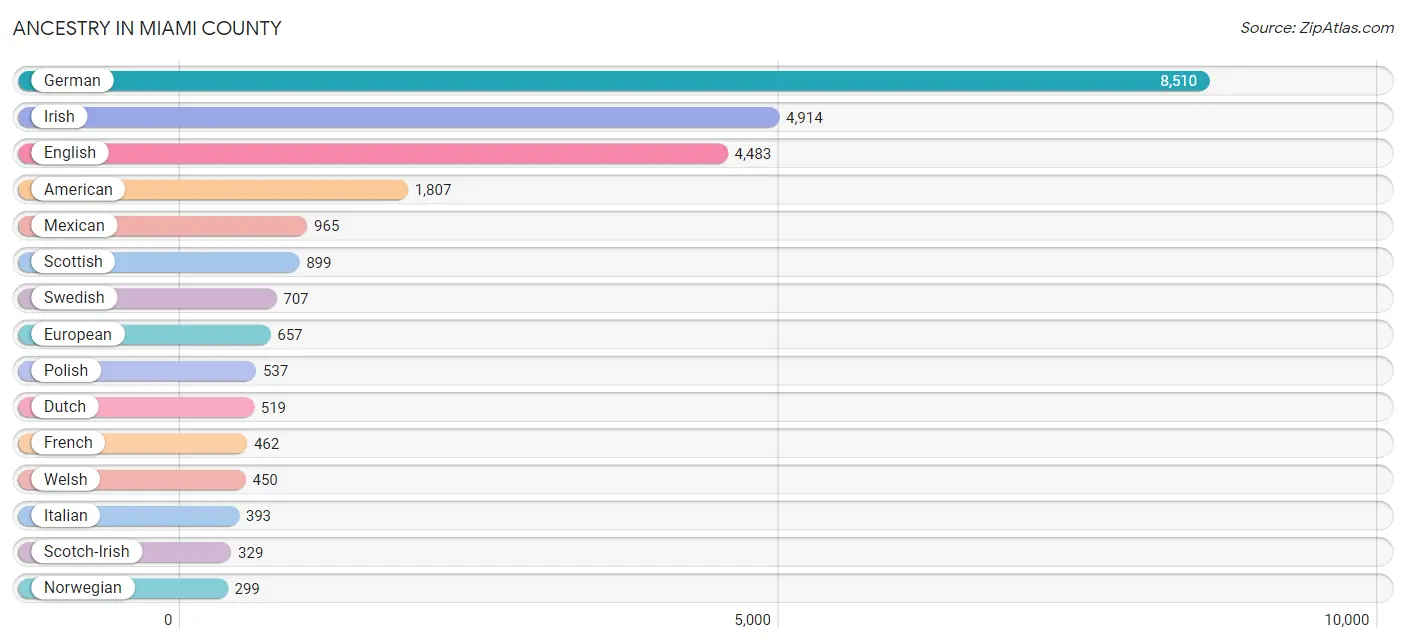
Ancestry in Miami County
The most populous ancestries reported in Miami County are German (8,510 | 24.8%), Irish (4,914 | 14.3%), English (4,483 | 13.1%), American (1,807 | 5.3%), and Mexican (965 | 2.8%), together accounting for 60.3% of all Miami County residents.
| Ancestry | # Population | % Population |
| African | 12 | 0.0% |
| Alsatian | 9 | 0.0% |
| American | 1,807 | 5.3% |
| Arab | 56 | 0.2% |
| Argentinean | 1 | 0.0% |
| Australian | 5 | 0.0% |
| Austrian | 6 | 0.0% |
| Belgian | 46 | 0.1% |
| Bhutanese | 19 | 0.1% |
| Blackfeet | 34 | 0.1% |
| British | 93 | 0.3% |
| Central American | 34 | 0.1% |
| Central American Indian | 38 | 0.1% |
| Cherokee | 85 | 0.3% |
| Choctaw | 4 | 0.0% |
| Cree | 13 | 0.0% |
| Creek | 18 | 0.1% |
| Croatian | 264 | 0.8% |
| Crow | 59 | 0.2% |
| Cuban | 1 | 0.0% |
| Czech | 42 | 0.1% |
| Czechoslovakian | 5 | 0.0% |
| Danish | 124 | 0.4% |
| Delaware | 11 | 0.0% |
| Dutch | 519 | 1.5% |
| Eastern European | 82 | 0.2% |
| English | 4,483 | 13.1% |
| European | 657 | 1.9% |
| Finnish | 8 | 0.0% |
| French | 462 | 1.3% |
| French American Indian | 17 | 0.1% |
| French Canadian | 42 | 0.1% |
| German | 8,510 | 24.8% |
| Greek | 44 | 0.1% |
| Guatemalan | 34 | 0.1% |
| Icelander | 22 | 0.1% |
| Indian (Asian) | 116 | 0.3% |
| Iraqi | 44 | 0.1% |
| Irish | 4,914 | 14.3% |
| Iroquois | 8 | 0.0% |
| Italian | 393 | 1.1% |
| Korean | 87 | 0.3% |
| Lithuanian | 8 | 0.0% |
| Luxembourger | 4 | 0.0% |
| Mexican | 965 | 2.8% |
| Mexican American Indian | 11 | 0.0% |
| Northern European | 37 | 0.1% |
| Norwegian | 299 | 0.9% |
| Pakistani | 43 | 0.1% |
| Pennsylvania German | 6 | 0.0% |
| Polish | 537 | 1.6% |
| Portuguese | 18 | 0.1% |
| Puerto Rican | 46 | 0.1% |
| Romanian | 50 | 0.2% |
| Russian | 35 | 0.1% |
| Scandinavian | 106 | 0.3% |
| Scotch-Irish | 329 | 1.0% |
| Scottish | 899 | 2.6% |
| Serbian | 9 | 0.0% |
| Slavic | 8 | 0.0% |
| Slovene | 1 | 0.0% |
| Somali | 2 | 0.0% |
| South American | 1 | 0.0% |
| Spaniard | 33 | 0.1% |
| Spanish | 73 | 0.2% |
| Subsaharan African | 14 | 0.0% |
| Swedish | 707 | 2.1% |
| Swiss | 80 | 0.2% |
| Syrian | 7 | 0.0% |
| Thai | 37 | 0.1% |
| Ukrainian | 77 | 0.2% |
| Welsh | 450 | 1.3% | View All 72 Rows |
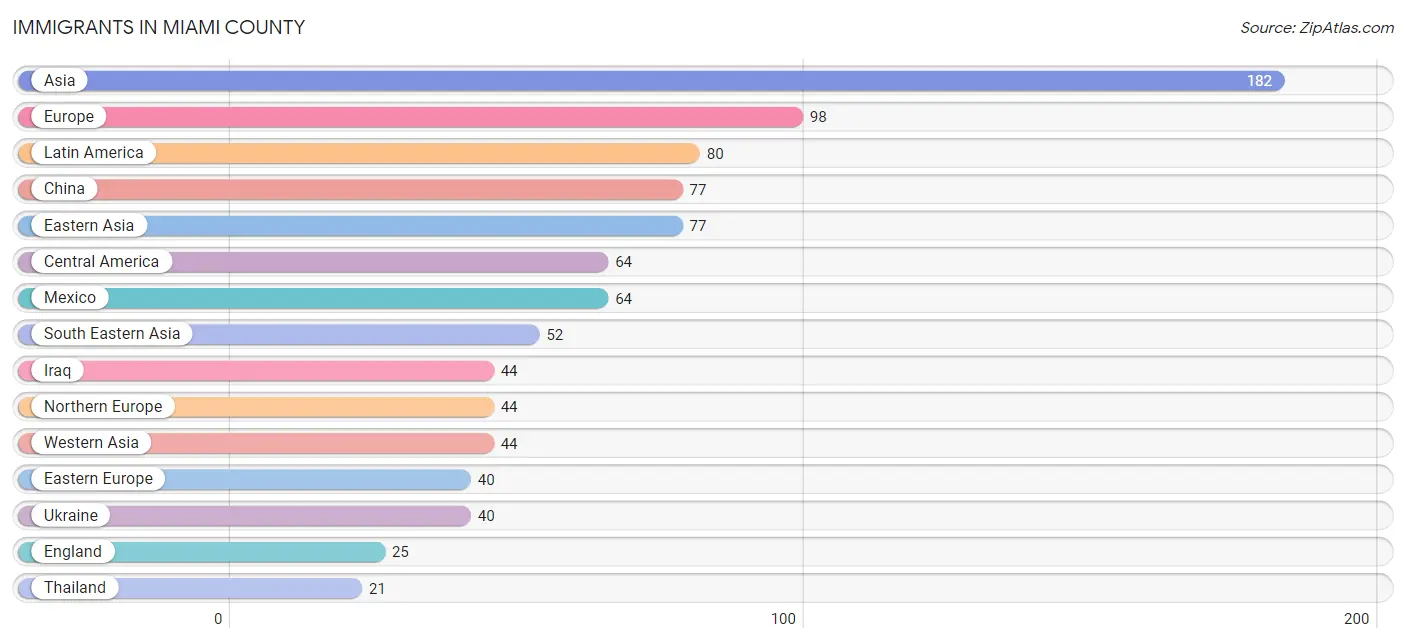
Immigrants in Miami County
The most numerous immigrant groups reported in Miami County came from Asia (182 | 0.5%), Europe (98 | 0.3%), Latin America (80 | 0.2%), China (77 | 0.2%), and Eastern Asia (77 | 0.2%), together accounting for 1.5% of all Miami County residents.
| Immigration Origin | # Population | % Population |
| Africa | 18 | 0.1% |
| Asia | 182 | 0.5% |
| Australia | 5 | 0.0% |
| Brazil | 15 | 0.0% |
| Caribbean | 1 | 0.0% |
| Central America | 64 | 0.2% |
| China | 77 | 0.2% |
| Cuba | 1 | 0.0% |
| Eastern Africa | 4 | 0.0% |
| Eastern Asia | 77 | 0.2% |
| Eastern Europe | 40 | 0.1% |
| England | 25 | 0.1% |
| Europe | 98 | 0.3% |
| Germany | 8 | 0.0% |
| India | 9 | 0.0% |
| Iraq | 44 | 0.1% |
| Italy | 6 | 0.0% |
| Kenya | 4 | 0.0% |
| Laos | 14 | 0.0% |
| Latin America | 80 | 0.2% |
| Mexico | 64 | 0.2% |
| Northern Europe | 44 | 0.1% |
| Oceania | 5 | 0.0% |
| Philippines | 3 | 0.0% |
| South Africa | 14 | 0.0% |
| South America | 15 | 0.0% |
| South Central Asia | 9 | 0.0% |
| South Eastern Asia | 52 | 0.2% |
| Southern Europe | 6 | 0.0% |
| Thailand | 21 | 0.1% |
| Ukraine | 40 | 0.1% |
| Vietnam | 14 | 0.0% |
| Western Asia | 44 | 0.1% |
| Western Europe | 8 | 0.0% | View All 34 Rows |
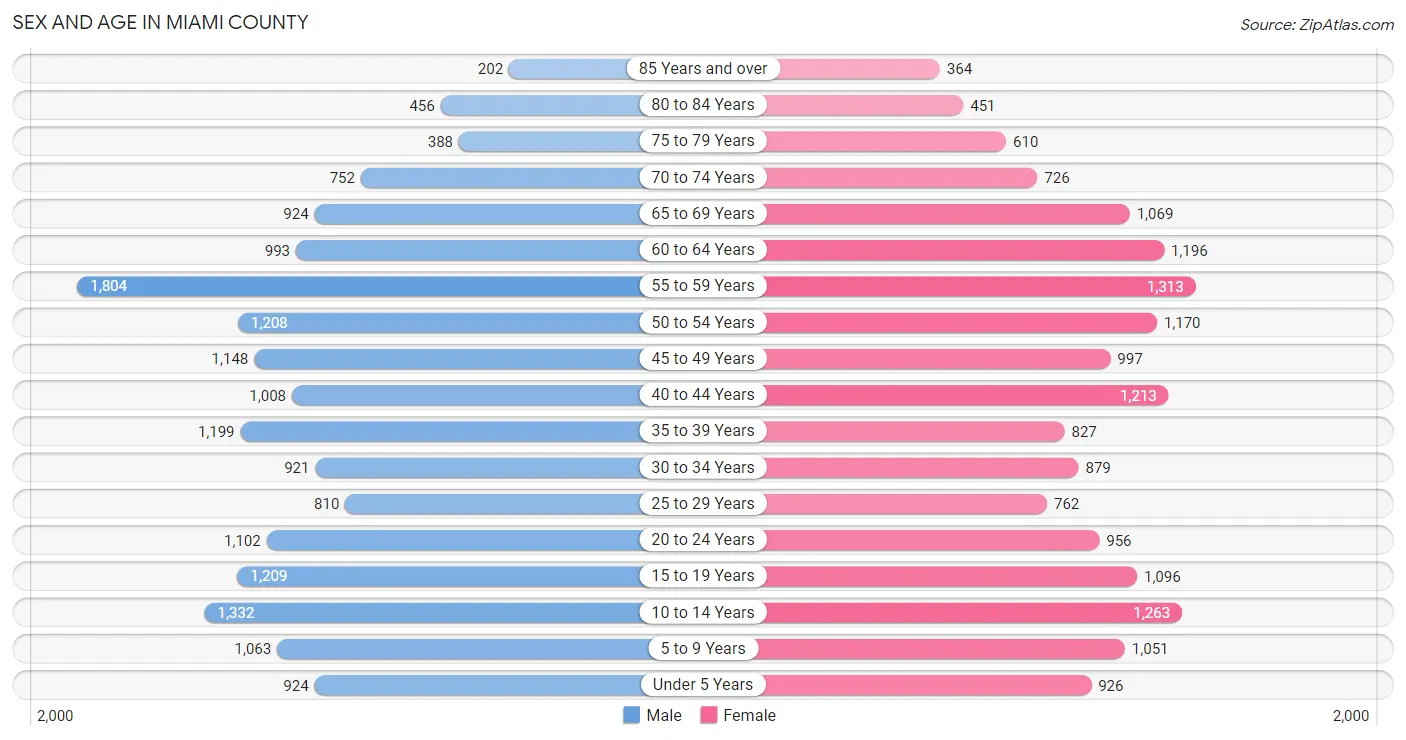
Sex and Age in Miami County
Sex and Age in Miami County
The most populous age groups in Miami County are 55 to 59 Years (1,804 | 10.3%) for men and 55 to 59 Years (1,313 | 7.8%) for women.
| Age Bracket | Male | Female |
| Under 5 Years | 924 (5.3%) | 926 (5.5%) |
| 5 to 9 Years | 1,063 (6.1%) | 1,051 (6.2%) |
| 10 to 14 Years | 1,332 (7.6%) | 1,263 (7.5%) |
| 15 to 19 Years | 1,209 (6.9%) | 1,096 (6.5%) |
| 20 to 24 Years | 1,102 (6.3%) | 956 (5.7%) |
| 25 to 29 Years | 810 (4.6%) | 762 (4.5%) |
| 30 to 34 Years | 921 (5.3%) | 879 (5.2%) |
| 35 to 39 Years | 1,199 (6.9%) | 827 (4.9%) |
| 40 to 44 Years | 1,008 (5.8%) | 1,213 (7.2%) |
| 45 to 49 Years | 1,148 (6.6%) | 997 (5.9%) |
| 50 to 54 Years | 1,208 (6.9%) | 1,170 (6.9%) |
| 55 to 59 Years | 1,804 (10.3%) | 1,313 (7.8%) |
| 60 to 64 Years | 993 (5.7%) | 1,196 (7.1%) |
| 65 to 69 Years | 924 (5.3%) | 1,069 (6.3%) |
| 70 to 74 Years | 752 (4.3%) | 726 (4.3%) |
| 75 to 79 Years | 388 (2.2%) | 610 (3.6%) |
| 80 to 84 Years | 456 (2.6%) | 451 (2.7%) |
| 85 Years and over | 202 (1.2%) | 364 (2.2%) |
| Total | 17,443 (100.0%) | 16,869 (100.0%) |
Families and Households in Miami County
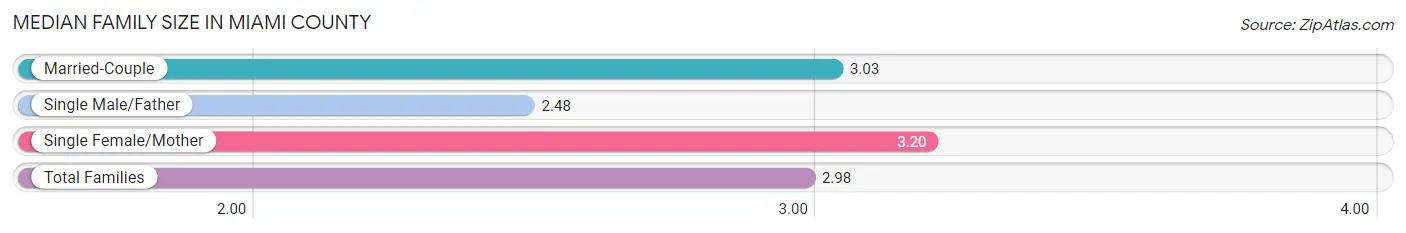
Median Family Size in Miami County
The median family size in Miami County is 2.98 persons per family, with single female/mother families (955 | 10.1%) accounting for the largest median family size of 3.2 persons per family. On the other hand, single male/father families (1,025 | 10.8%) represent the smallest median family size with 2.48 persons per family.
| Family Type | # Families | Family Size |
| Married-Couple | 7,523 (79.2%) | 3.03 |
| Single Male/Father | 1,025 (10.8%) | 2.48 |
| Single Female/Mother | 955 (10.1%) | 3.20 |
| Total Families | 9,503 (100.0%) | 2.98 |
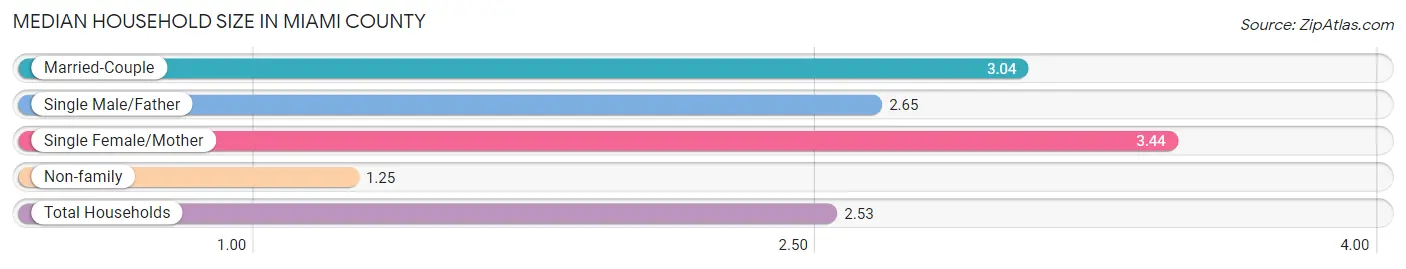
Median Household Size in Miami County
The median household size in Miami County is 2.53 persons per household, with single female/mother households (955 | 7.2%) accounting for the largest median household size of 3.44 persons per household. non-family households (3,736 | 28.2%) represent the smallest median household size with 1.25 persons per household.
| Household Type | # Households | Household Size |
| Married-Couple | 7,523 (56.8%) | 3.04 |
| Single Male/Father | 1,025 (7.7%) | 2.65 |
| Single Female/Mother | 955 (7.2%) | 3.44 |
| Non-family | 3,736 (28.2%) | 1.25 |
| Total Households | 13,239 (100.0%) | 2.53 |
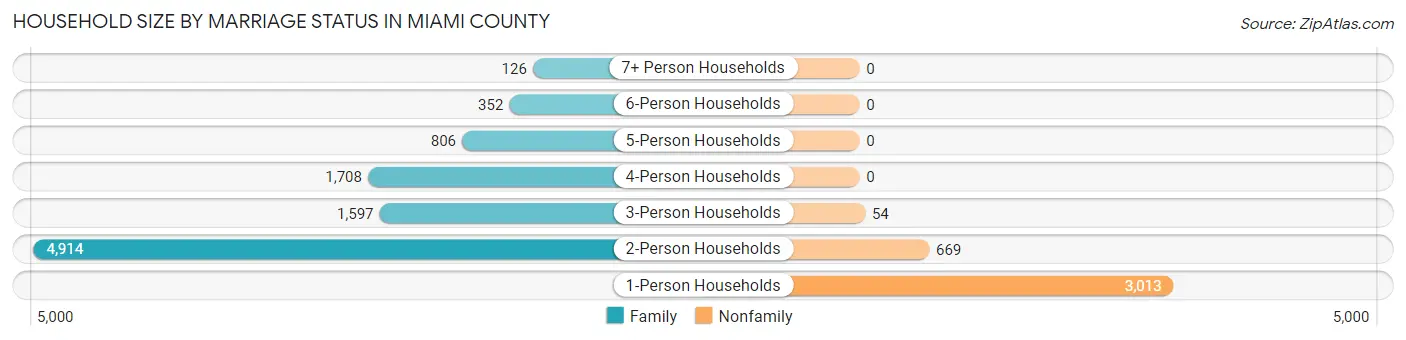
Household Size by Marriage Status in Miami County
Out of a total of 13,239 households in Miami County, 9,503 (71.8%) are family households, while 3,736 (28.2%) are nonfamily households. The most numerous type of family households are 2-person households, comprising 4,914, and the most common type of nonfamily households are 1-person households, comprising 3,013.
| Household Size | Family Households | Nonfamily Households |
| 1-Person Households | - | 3,013 (22.8%) |
| 2-Person Households | 4,914 (37.1%) | 669 (5.1%) |
| 3-Person Households | 1,597 (12.1%) | 54 (0.4%) |
| 4-Person Households | 1,708 (12.9%) | 0 (0.0%) |
| 5-Person Households | 806 (6.1%) | 0 (0.0%) |
| 6-Person Households | 352 (2.7%) | 0 (0.0%) |
| 7+ Person Households | 126 (0.9%) | 0 (0.0%) |
| Total | 9,503 (71.8%) | 3,736 (28.2%) |
Female Fertility in Miami County
Fertility by Age in Miami County
Average fertility rate in Miami County is 50.0 births per 1,000 women. Women in the age bracket of 20 to 34 years have the highest fertility rate with 111.0 births per 1,000 women. Women in the age bracket of 20 to 34 years acount for 83.0% of all women with births.
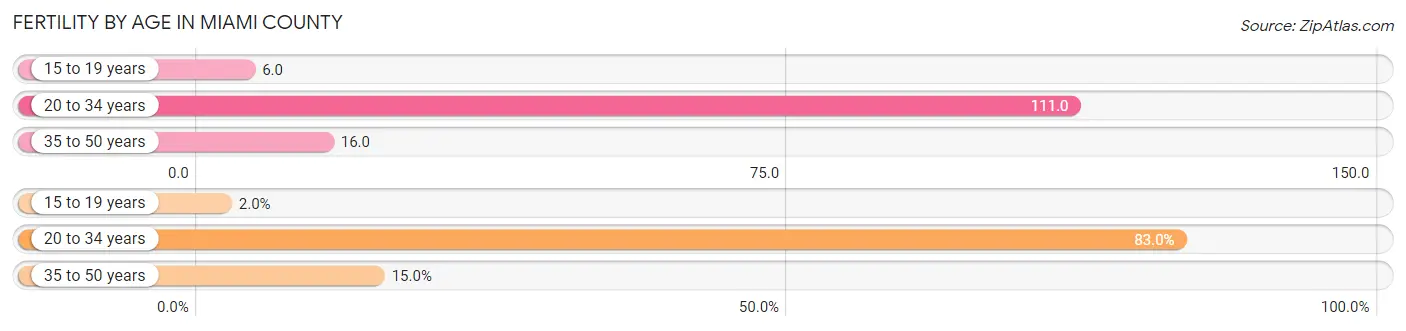
| Age Bracket | Women with Births | Births / 1,000 Women |
| 15 to 19 years | 7 (2.0%) | 6.0 |
| 20 to 34 years | 288 (83.0%) | 111.0 |
| 35 to 50 years | 52 (15.0%) | 16.0 |
| Total | 347 (100.0%) | 50.0 |
Fertility by Age by Marriage Status in Miami County
77.8% of women with births (347) in Miami County are married. The highest percentage of unmarried women with births falls into 15 to 19 years age bracket with 100.0% of them unmarried at the time of birth, while the lowest percentage of unmarried women with births belong to 20 to 34 years age bracket with 18.4% of them unmarried.
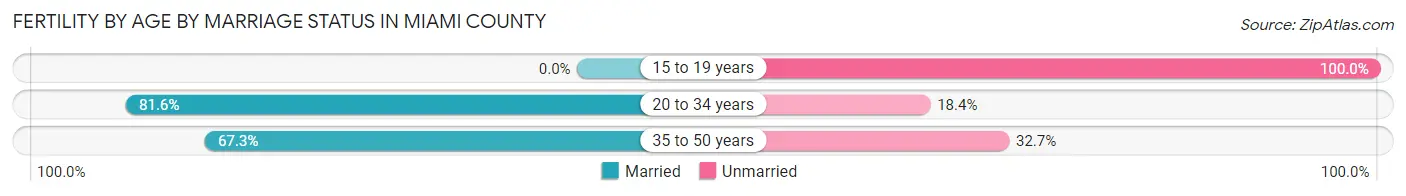
| Age Bracket | Married | Unmarried |
| 15 to 19 years | 0 (0.0%) | 7 (100.0%) |
| 20 to 34 years | 235 (81.6%) | 53 (18.4%) |
| 35 to 50 years | 35 (67.3%) | 17 (32.7%) |
| Total | 270 (77.8%) | 77 (22.2%) |
Fertility by Education in Miami County
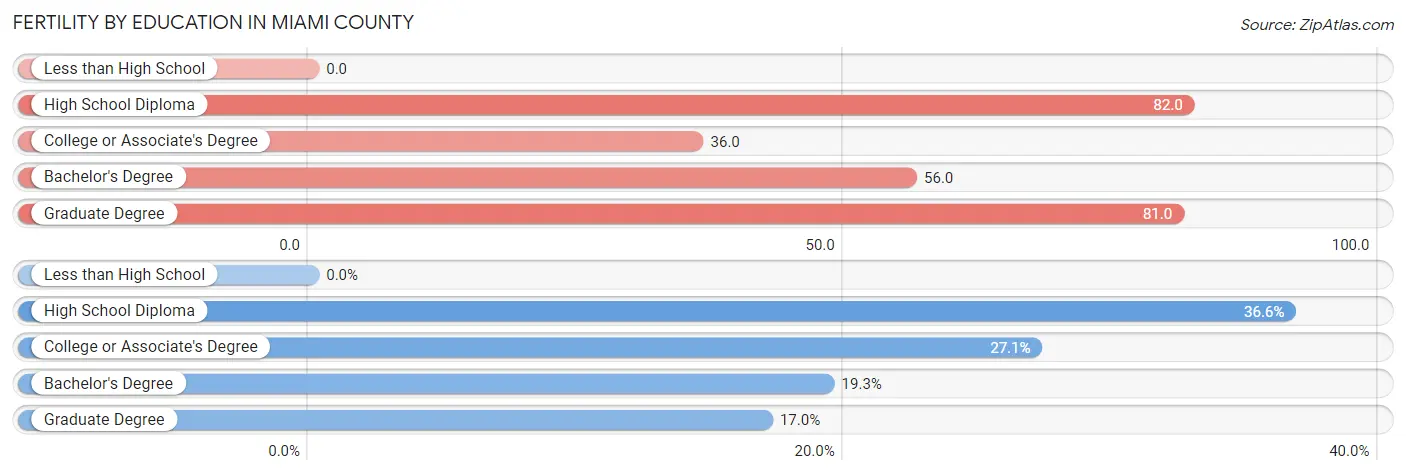
| Educational Attainment | Women with Births | Births / 1,000 Women |
| Less than High School | 0 (0.0%) | 0.0 |
| High School Diploma | 127 (36.6%) | 82.0 |
| College or Associate's Degree | 94 (27.1%) | 36.0 |
| Bachelor's Degree | 67 (19.3%) | 56.0 |
| Graduate Degree | 59 (17.0%) | 81.0 |
| Total | 347 (100.0%) | 50.0 |
Fertility by Education by Marriage Status in Miami County
22.2% of women with births in Miami County are unmarried. Women with the educational attainment of graduate degree are most likely to be married with 100.0% of them married at childbirth, while women with the educational attainment of college or associate's degree are least likely to be married with 39.4% of them unmarried at childbirth.
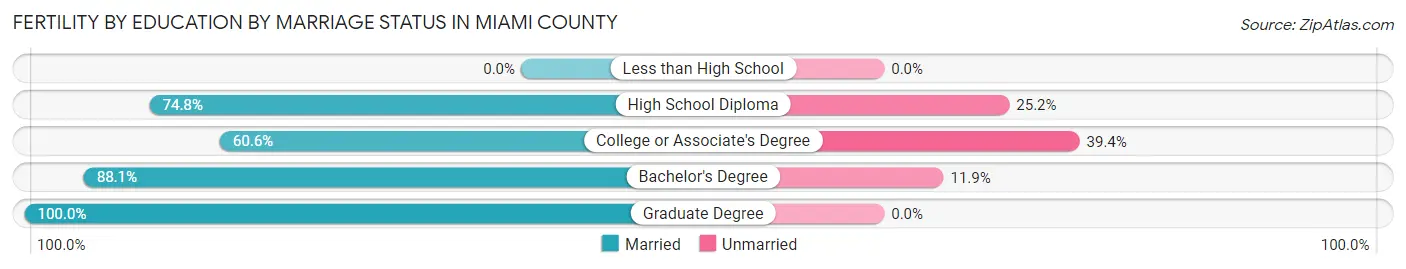
| Educational Attainment | Married | Unmarried |
| Less than High School | 0 (0.0%) | 0 (0.0%) |
| High School Diploma | 95 (74.8%) | 32 (25.2%) |
| College or Associate's Degree | 57 (60.6%) | 37 (39.4%) |
| Bachelor's Degree | 59 (88.1%) | 8 (11.9%) |
| Graduate Degree | 59 (100.0%) | 0 (0.0%) |
| Total | 270 (77.8%) | 77 (22.2%) |
Income in Miami County
Income Overview in Miami County
Per Capita Income in Miami County is $40,169, while median incomes of families and households are $101,265 and $85,564 respectively.
| Characteristic | Number | Measure |
| Per Capita Income | 34,312 | $40,169 |
| Median Family Income | 9,503 | $101,265 |
| Mean Family Income | 9,503 | $119,853 |
| Median Household Income | 13,239 | $85,564 |
| Mean Household Income | 13,239 | $102,739 |
| Income Deficit | 9,503 | $8,611 |
| Wage / Income Gap (%) | 34,312 | 34.56% |
| Wage / Income Gap ($) | 34,312 | 65.44¢ per $1 |
| Gini / Inequality Index | 34,312 | 0.40 |
Earnings by Sex in Miami County
Average Earnings in Miami County are $45,703, $57,197 for men and $37,428 for women, a difference of 34.6%.
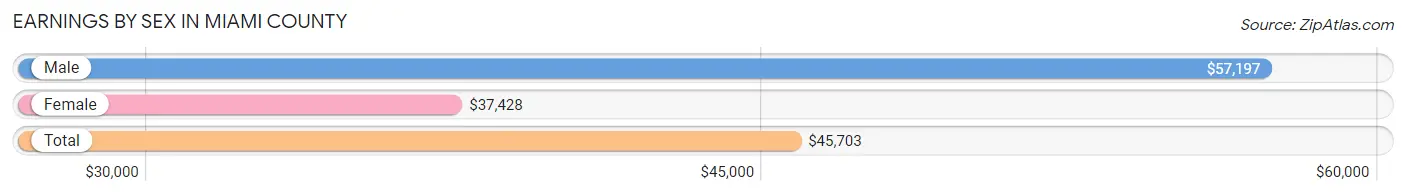
| Sex | Number | Average Earnings |
| Male | 9,819 (53.0%) | $57,197 |
| Female | 8,699 (47.0%) | $37,428 |
| Total | 18,518 (100.0%) | $45,703 |
Earnings by Sex by Income Bracket in Miami County
The most common earnings brackets in Miami County are $100,000+ for men (1,703 | 17.3%) and $100,000+ for women (718 | 8.3%).
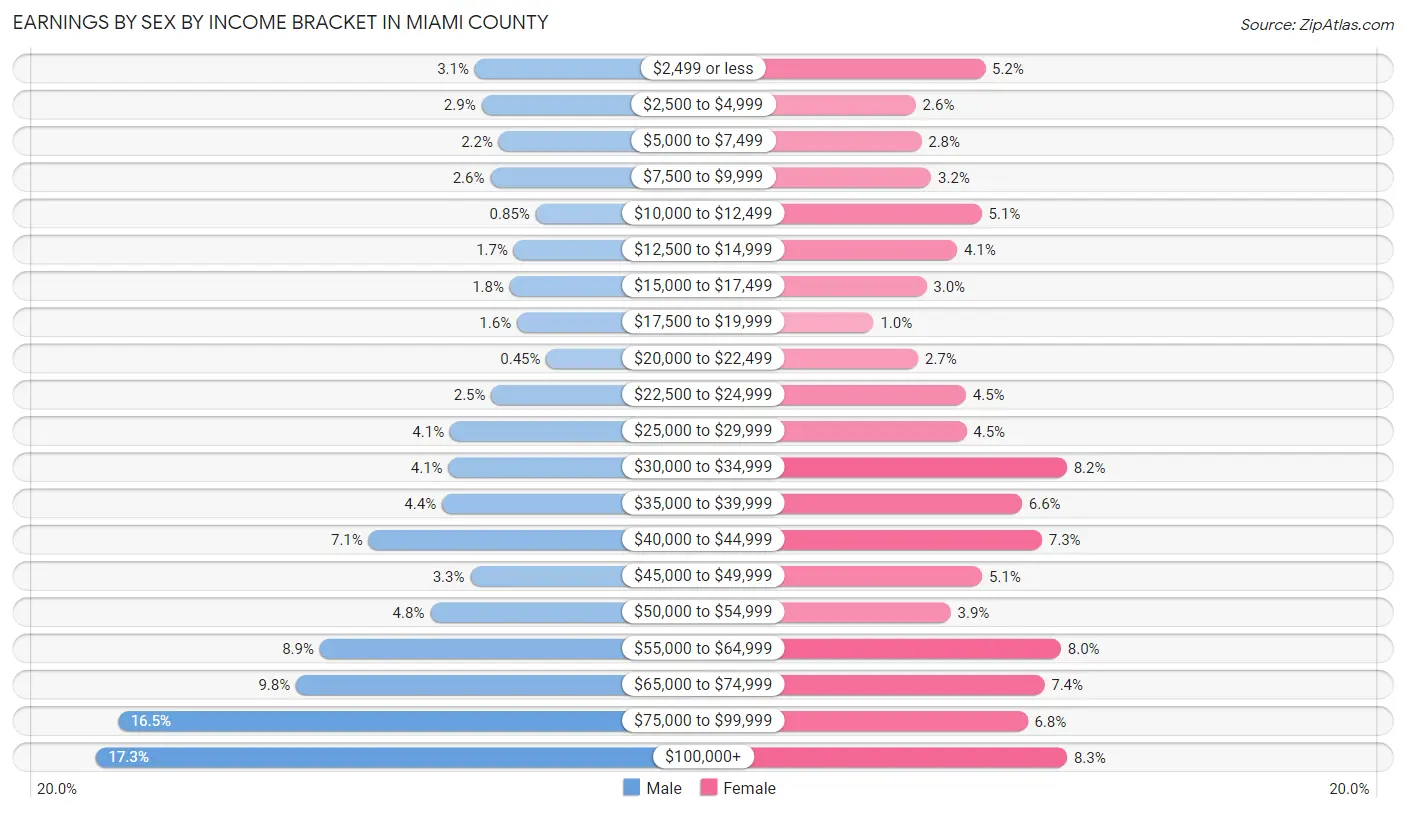
| Income | Male | Female |
| $2,499 or less | 307 (3.1%) | 451 (5.2%) |
| $2,500 to $4,999 | 283 (2.9%) | 224 (2.6%) |
| $5,000 to $7,499 | 219 (2.2%) | 243 (2.8%) |
| $7,500 to $9,999 | 250 (2.5%) | 275 (3.2%) |
| $10,000 to $12,499 | 83 (0.9%) | 439 (5.1%) |
| $12,500 to $14,999 | 164 (1.7%) | 359 (4.1%) |
| $15,000 to $17,499 | 179 (1.8%) | 259 (3.0%) |
| $17,500 to $19,999 | 152 (1.5%) | 87 (1.0%) |
| $20,000 to $22,499 | 44 (0.4%) | 232 (2.7%) |
| $22,500 to $24,999 | 246 (2.5%) | 388 (4.5%) |
| $25,000 to $29,999 | 399 (4.1%) | 390 (4.5%) |
| $30,000 to $34,999 | 405 (4.1%) | 717 (8.2%) |
| $35,000 to $39,999 | 428 (4.4%) | 571 (6.6%) |
| $40,000 to $44,999 | 698 (7.1%) | 636 (7.3%) |
| $45,000 to $49,999 | 324 (3.3%) | 441 (5.1%) |
| $50,000 to $54,999 | 471 (4.8%) | 338 (3.9%) |
| $55,000 to $64,999 | 878 (8.9%) | 698 (8.0%) |
| $65,000 to $74,999 | 965 (9.8%) | 644 (7.4%) |
| $75,000 to $99,999 | 1,621 (16.5%) | 589 (6.8%) |
| $100,000+ | 1,703 (17.3%) | 718 (8.3%) |
| Total | 9,819 (100.0%) | 8,699 (100.0%) |
Earnings by Sex by Educational Attainment in Miami County
Average earnings in Miami County are $65,357 for men and $42,428 for women, a difference of 35.1%. Men with an educational attainment of bachelor's degree enjoy the highest average annual earnings of $75,932, while those with high school diploma education earn the least with $55,258. Women with an educational attainment of graduate degree earn the most with the average annual earnings of $61,422, while those with high school diploma education have the smallest earnings of $32,781.
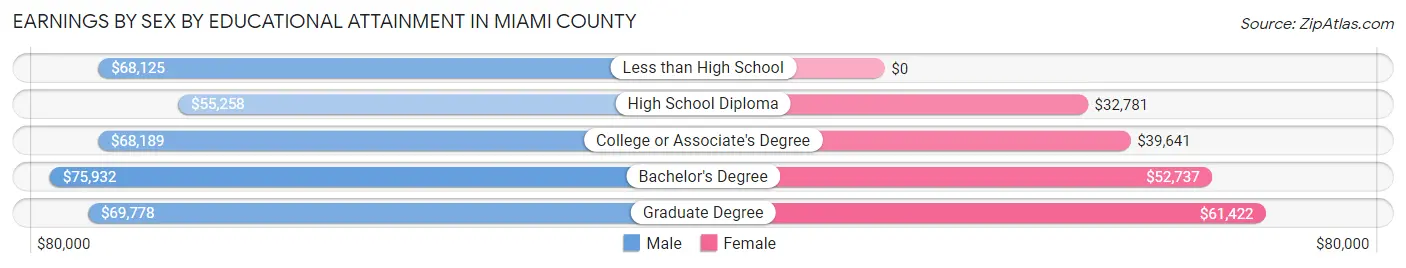
| Educational Attainment | Male Income | Female Income |
| Less than High School | $68,125 | $0 |
| High School Diploma | $55,258 | $32,781 |
| College or Associate's Degree | $68,189 | $39,641 |
| Bachelor's Degree | $75,932 | $52,737 |
| Graduate Degree | $69,778 | $61,422 |
| Total | $65,357 | $42,428 |
Family Income in Miami County
Family Income Brackets in Miami County
According to the Miami County family income data, there are 2,385 families falling into the $100,000 to $149,999 income range, which is the most common income bracket and makes up 25.1% of all families. Conversely, the less than $10,000 income bracket is the least frequent group with only 105 families (1.1%) belonging to this category.
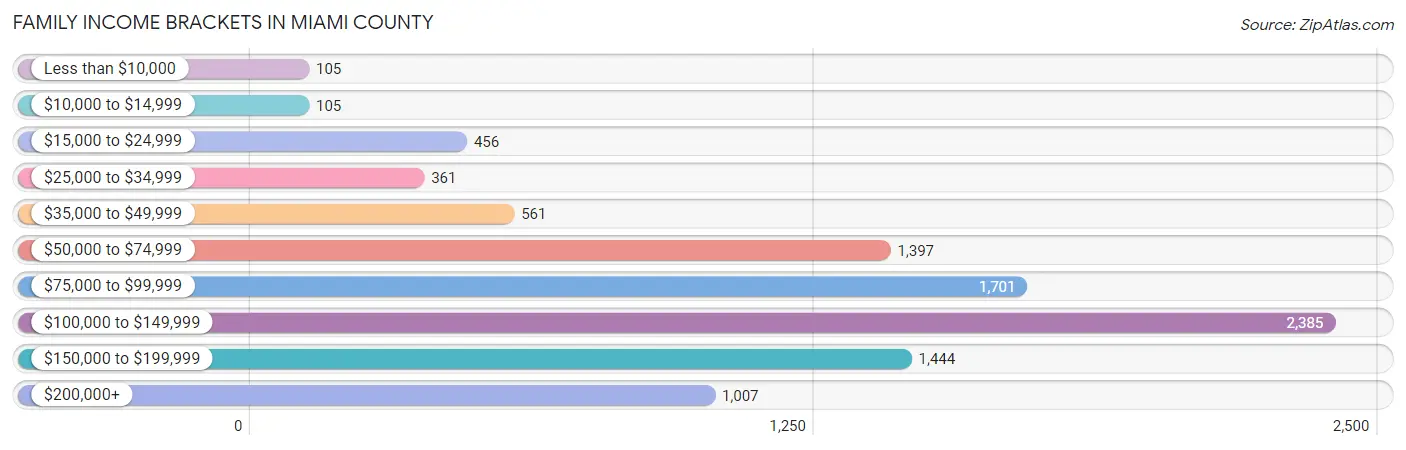
| Income Bracket | # Families | % Families |
| Less than $10,000 | 105 | 1.1% |
| $10,000 to $14,999 | 105 | 1.1% |
| $15,000 to $24,999 | 456 | 4.8% |
| $25,000 to $34,999 | 361 | 3.8% |
| $35,000 to $49,999 | 561 | 5.9% |
| $50,000 to $74,999 | 1,397 | 14.7% |
| $75,000 to $99,999 | 1,701 | 17.9% |
| $100,000 to $149,999 | 2,385 | 25.1% |
| $150,000 to $199,999 | 1,444 | 15.2% |
| $200,000+ | 1,007 | 10.6% |
Family Income by Famaliy Size in Miami County
3-person families (1,421 | 14.9%) account for the highest median family income in Miami County with $124,306 per family, while 2-person families (5,174 | 54.4%) have the highest median income of $41,760 per family member.
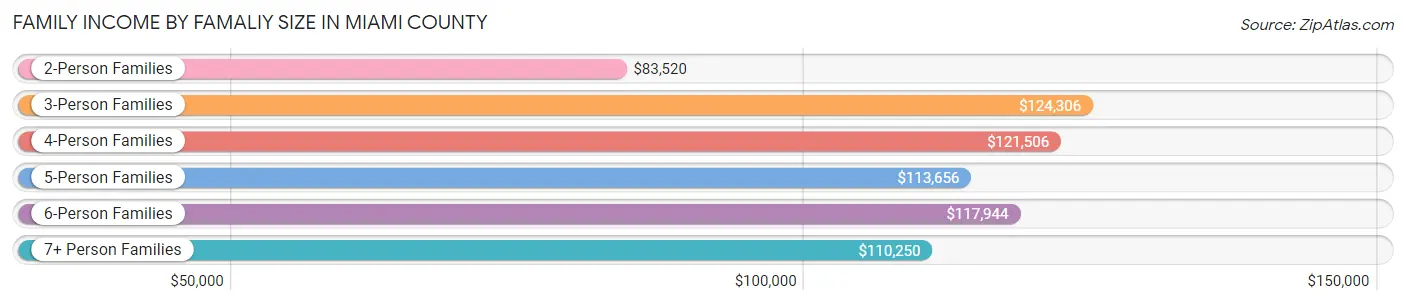
| Income Bracket | # Families | Median Income |
| 2-Person Families | 5,174 (54.4%) | $83,520 |
| 3-Person Families | 1,421 (14.9%) | $124,306 |
| 4-Person Families | 1,683 (17.7%) | $121,506 |
| 5-Person Families | 781 (8.2%) | $113,656 |
| 6-Person Families | 353 (3.7%) | $117,944 |
| 7+ Person Families | 91 (1.0%) | $110,250 |
| Total | 9,503 (100.0%) | $101,265 |
Family Income by Number of Earners in Miami County
The median family income in Miami County is $101,265, with families comprising 3+ earners (1,043) having the highest median family income of $144,292, while families with no earners (1,452) have the lowest median family income of $52,500, accounting for 11.0% and 15.3% of families, respectively.
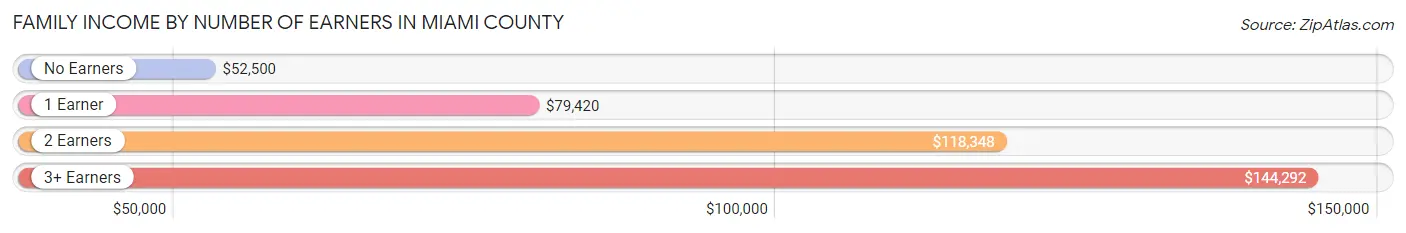
| Number of Earners | # Families | Median Income |
| No Earners | 1,452 (15.3%) | $52,500 |
| 1 Earner | 2,543 (26.8%) | $79,420 |
| 2 Earners | 4,465 (47.0%) | $118,348 |
| 3+ Earners | 1,043 (11.0%) | $144,292 |
| Total | 9,503 (100.0%) | $101,265 |
Household Income in Miami County
Household Income Brackets in Miami County
With 2,807 households falling in the category, the $100,000 to $149,999 income range is the most frequent in Miami County, accounting for 21.2% of all households. In contrast, only 252 households (1.9%) fall into the $10,000 to $14,999 income bracket, making it the least populous group.
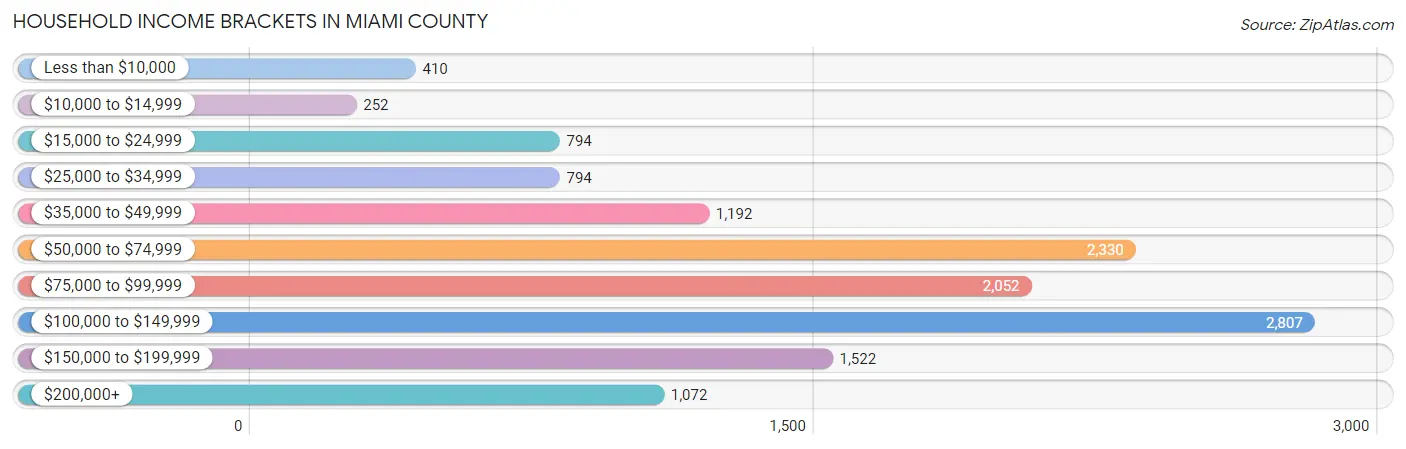
| Income Bracket | # Households | % Households |
| Less than $10,000 | 410 | 3.1% |
| $10,000 to $14,999 | 252 | 1.9% |
| $15,000 to $24,999 | 794 | 6.0% |
| $25,000 to $34,999 | 794 | 6.0% |
| $35,000 to $49,999 | 1,192 | 9.0% |
| $50,000 to $74,999 | 2,330 | 17.6% |
| $75,000 to $99,999 | 2,052 | 15.5% |
| $100,000 to $149,999 | 2,807 | 21.2% |
| $150,000 to $199,999 | 1,522 | 11.5% |
| $200,000+ | 1,072 | 8.1% |
Household Income by Householder Age in Miami County
The median household income in Miami County is $85,564, with the highest median household income of $104,352 found in the 25 to 44 years age bracket for the primary householder. A total of 3,378 households (25.5%) fall into this category. Meanwhile, the 65+ years age bracket for the primary householder has the lowest median household income of $58,406, with 3,876 households (29.3%) in this group.
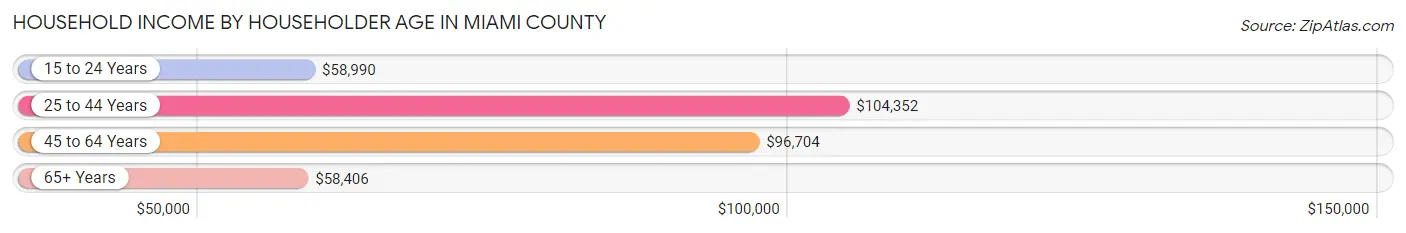
| Income Bracket | # Households | Median Income |
| 15 to 24 Years | 507 (3.8%) | $58,990 |
| 25 to 44 Years | 3,378 (25.5%) | $104,352 |
| 45 to 64 Years | 5,478 (41.4%) | $96,704 |
| 65+ Years | 3,876 (29.3%) | $58,406 |
| Total | 13,239 (100.0%) | $85,564 |
Poverty in Miami County
Income Below Poverty by Sex and Age in Miami County
With 5.4% poverty level for males and 8.5% for females among the residents of Miami County, 6 to 11 year old males and 75 year old and over females are the most vulnerable to poverty, with 143 males (10.3%) and 335 females (24.8%) in their respective age groups living below the poverty level.
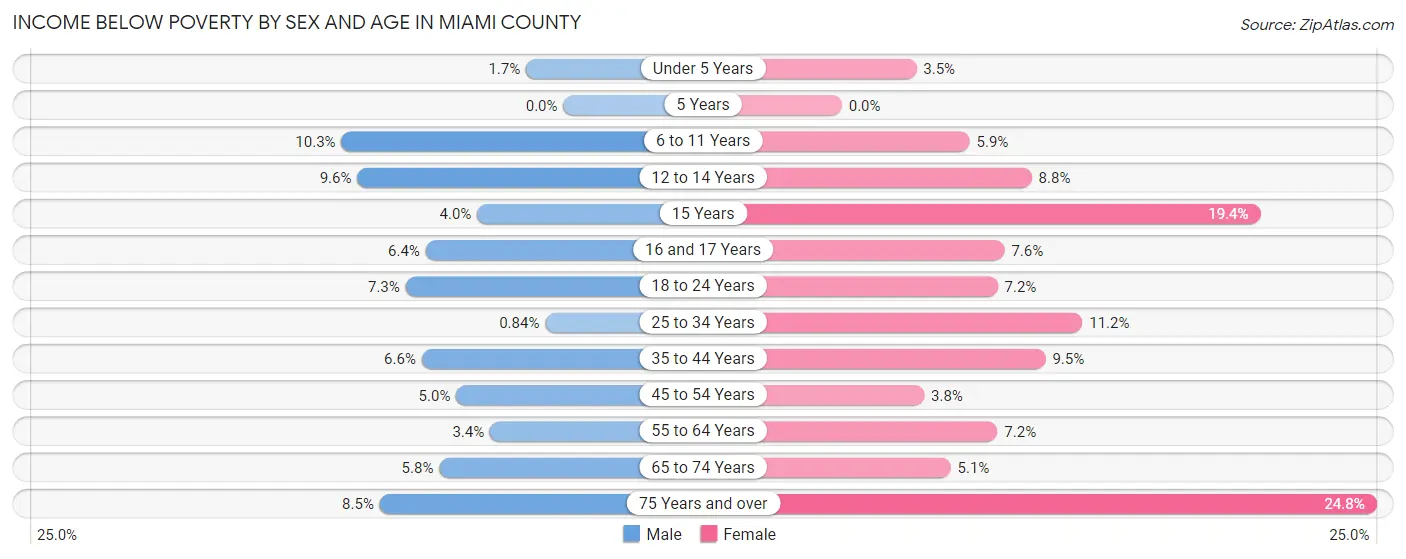
| Age Bracket | Male | Female |
| Under 5 Years | 16 (1.7%) | 32 (3.5%) |
| 5 Years | 0 (0.0%) | 0 (0.0%) |
| 6 to 11 Years | 143 (10.3%) | 81 (5.9%) |
| 12 to 14 Years | 72 (9.6%) | 69 (8.8%) |
| 15 Years | 9 (4.0%) | 47 (19.4%) |
| 16 and 17 Years | 35 (6.4%) | 38 (7.5%) |
| 18 to 24 Years | 109 (7.3%) | 94 (7.2%) |
| 25 to 34 Years | 14 (0.8%) | 182 (11.2%) |
| 35 to 44 Years | 142 (6.6%) | 192 (9.5%) |
| 45 to 54 Years | 114 (5.0%) | 82 (3.8%) |
| 55 to 64 Years | 91 (3.4%) | 180 (7.2%) |
| 65 to 74 Years | 94 (5.8%) | 88 (5.1%) |
| 75 Years and over | 88 (8.5%) | 335 (24.8%) |
| Total | 927 (5.4%) | 1,420 (8.5%) |
Income Above Poverty by Sex and Age in Miami County
According to the poverty statistics in Miami County, males aged 5 years and females aged 5 years are the age groups that are most secure financially, with 100.0% of males and 100.0% of females in these age groups living above the poverty line.
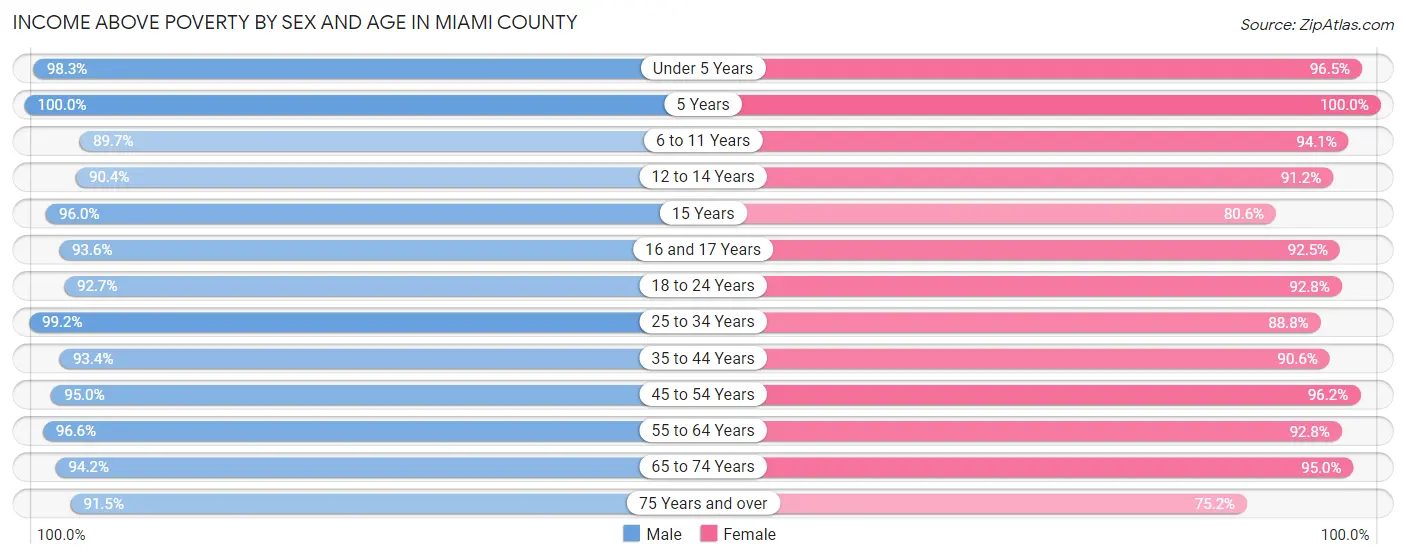
| Age Bracket | Male | Female |
| Under 5 Years | 908 (98.3%) | 892 (96.5%) |
| 5 Years | 212 (100.0%) | 156 (100.0%) |
| 6 to 11 Years | 1,246 (89.7%) | 1,284 (94.1%) |
| 12 to 14 Years | 681 (90.4%) | 714 (91.2%) |
| 15 Years | 216 (96.0%) | 195 (80.6%) |
| 16 and 17 Years | 513 (93.6%) | 465 (92.4%) |
| 18 to 24 Years | 1,381 (92.7%) | 1,207 (92.8%) |
| 25 to 34 Years | 1,657 (99.2%) | 1,449 (88.8%) |
| 35 to 44 Years | 2,020 (93.4%) | 1,840 (90.5%) |
| 45 to 54 Years | 2,182 (95.0%) | 2,067 (96.2%) |
| 55 to 64 Years | 2,585 (96.6%) | 2,312 (92.8%) |
| 65 to 74 Years | 1,537 (94.2%) | 1,656 (95.0%) |
| 75 Years and over | 945 (91.5%) | 1,015 (75.2%) |
| Total | 16,083 (94.6%) | 15,252 (91.5%) |
Income Below Poverty Among Married-Couple Families in Miami County
The poverty statistics for married-couple families in Miami County show that 3.8% or 288 of the total 7,523 families live below the poverty line. Families with no children have the highest poverty rate of 5.6%, comprising of 266 families. On the other hand, families with 1 or 2 children have the lowest poverty rate of 0.0%, which includes 0 families.
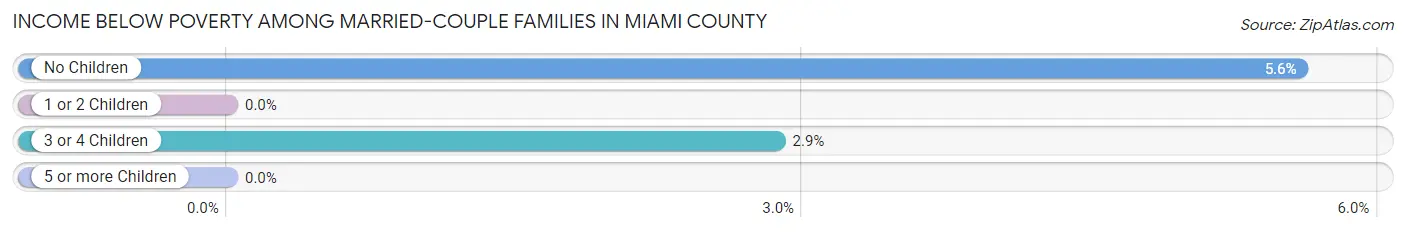
| Children | Above Poverty | Below Poverty |
| No Children | 4,490 (94.4%) | 266 (5.6%) |
| 1 or 2 Children | 1,931 (100.0%) | 0 (0.0%) |
| 3 or 4 Children | 747 (97.1%) | 22 (2.9%) |
| 5 or more Children | 67 (100.0%) | 0 (0.0%) |
| Total | 7,235 (96.2%) | 288 (3.8%) |
Income Below Poverty Among Single-Parent Households in Miami County
According to the poverty data in Miami County, 7.0% or 72 single-father households and 11.3% or 108 single-mother households are living below the poverty line. Among single-father households, those with 3 or 4 children have the highest poverty rate, with 49 households (47.6%) experiencing poverty. Likewise, among single-mother households, those with 5 or more children have the highest poverty rate, with 21 households (75.0%) falling below the poverty line.
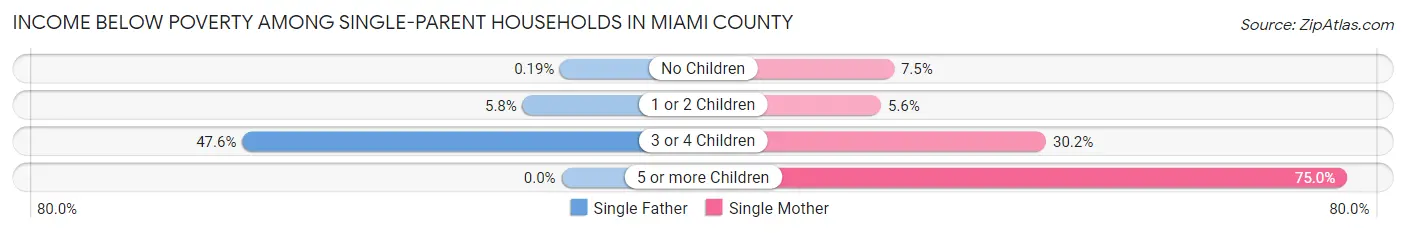
| Children | Single Father | Single Mother |
| No Children | 1 (0.2%) | 17 (7.5%) |
| 1 or 2 Children | 22 (5.8%) | 32 (5.6%) |
| 3 or 4 Children | 49 (47.6%) | 38 (30.2%) |
| 5 or more Children | 0 (0.0%) | 21 (75.0%) |
| Total | 72 (7.0%) | 108 (11.3%) |
Income Below Poverty Among Married-Couple vs Single-Parent Households in Miami County
The poverty data for Miami County shows that 288 of the married-couple family households (3.8%) and 180 of the single-parent households (9.1%) are living below the poverty level. Within the married-couple family households, those with no children have the highest poverty rate, with 266 households (5.6%) falling below the poverty line. Among the single-parent households, those with 5 or more children have the highest poverty rate, with 21 household (43.8%) living below poverty.
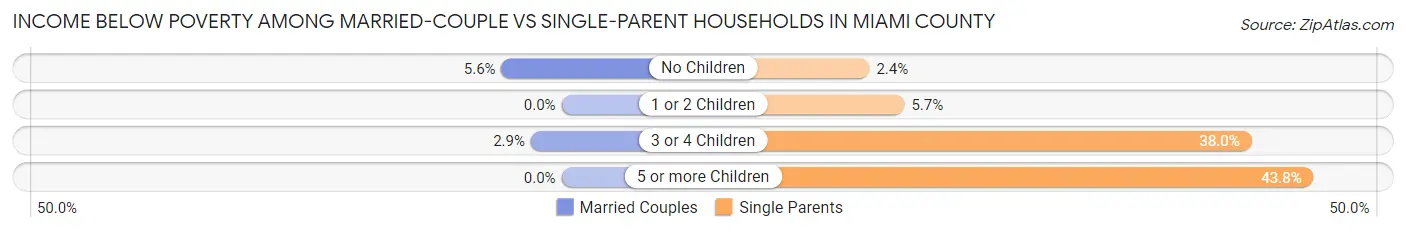
| Children | Married-Couple Families | Single-Parent Households |
| No Children | 266 (5.6%) | 18 (2.4%) |
| 1 or 2 Children | 0 (0.0%) | 54 (5.7%) |
| 3 or 4 Children | 22 (2.9%) | 87 (38.0%) |
| 5 or more Children | 0 (0.0%) | 21 (43.8%) |
| Total | 288 (3.8%) | 180 (9.1%) |
Employment Characteristics in Miami County
Employment by Class of Employer in Miami County
Among the 16,970 employed individuals in Miami County, private company employees (11,781 | 69.4%), local government employees (1,702 | 10.0%), and not-for-profit organizations (1,014 | 6.0%) make up the most common classes of employment.
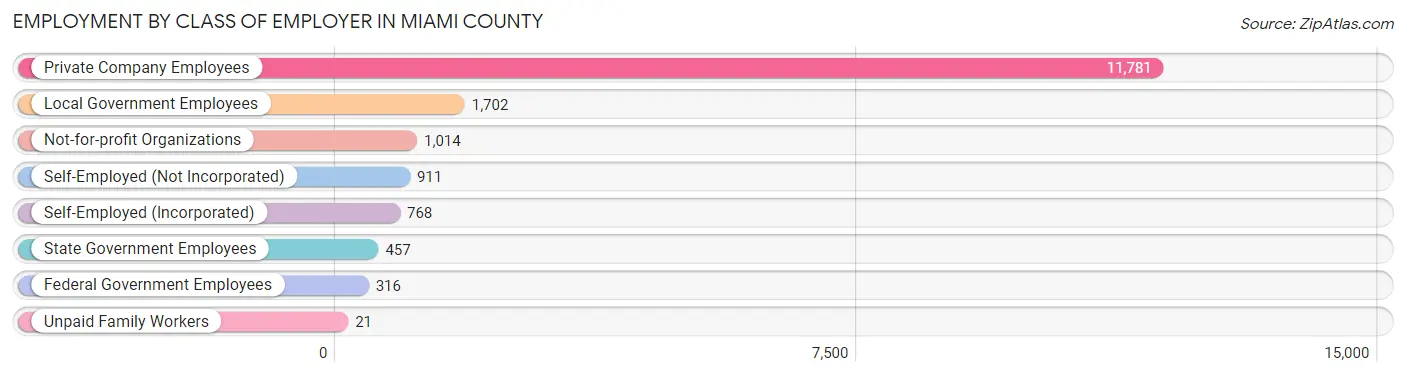
| Employer Class | # Employees | % Employees |
| Private Company Employees | 11,781 | 69.4% |
| Self-Employed (Incorporated) | 768 | 4.5% |
| Self-Employed (Not Incorporated) | 911 | 5.4% |
| Not-for-profit Organizations | 1,014 | 6.0% |
| Local Government Employees | 1,702 | 10.0% |
| State Government Employees | 457 | 2.7% |
| Federal Government Employees | 316 | 1.9% |
| Unpaid Family Workers | 21 | 0.1% |
| Total | 16,970 | 100.0% |
Employment Status by Age in Miami County
According to the labor force statistics for Miami County, out of the total population over 16 years of age (27,286), 64.7% or 17,654 individuals are in the labor force, with 2.8% or 494 of them unemployed. The age group with the highest labor force participation rate is 30 to 34 years, with 92.3% or 1,661 individuals in the labor force. Within the labor force, the 16 to 19 years age range has the highest percentage of unemployed individuals, with 5.7% or 53 of them being unemployed.
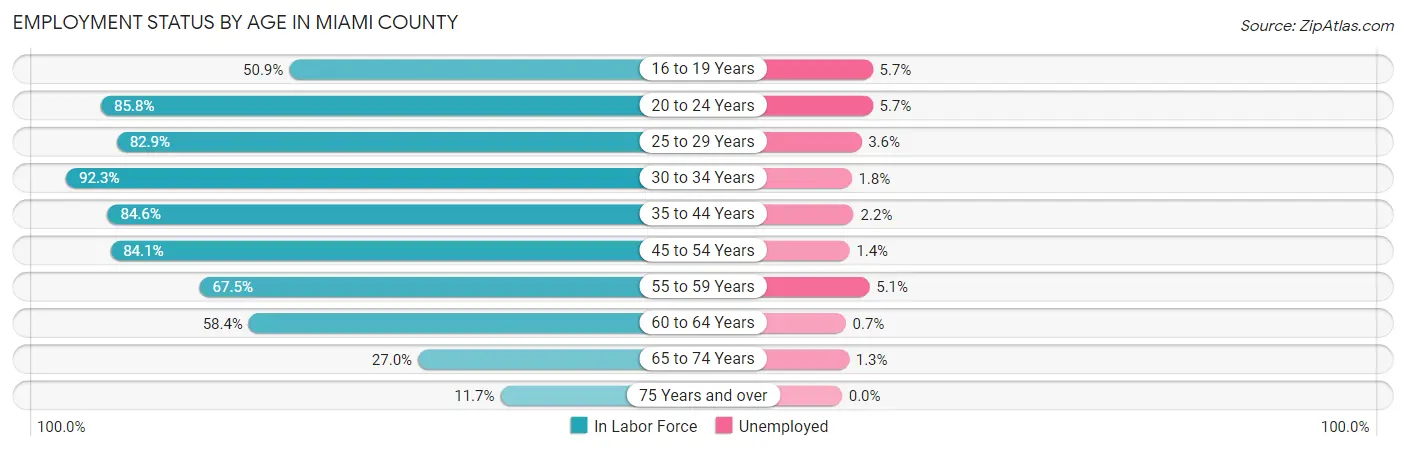
| Age Bracket | In Labor Force | Unemployed |
| 16 to 19 Years | 936 (50.9%) | 53 (5.7%) |
| 20 to 24 Years | 1,766 (85.8%) | 101 (5.7%) |
| 25 to 29 Years | 1,303 (82.9%) | 47 (3.6%) |
| 30 to 34 Years | 1,661 (92.3%) | 30 (1.8%) |
| 35 to 44 Years | 3,593 (84.6%) | 79 (2.2%) |
| 45 to 54 Years | 3,804 (84.1%) | 53 (1.4%) |
| 55 to 59 Years | 2,104 (67.5%) | 107 (5.1%) |
| 60 to 64 Years | 1,278 (58.4%) | 9 (0.7%) |
| 65 to 74 Years | 937 (27.0%) | 12 (1.3%) |
| 75 Years and over | 289 (11.7%) | 0 (0.0%) |
| Total | 17,654 (64.7%) | 494 (2.8%) |
Employment Status by Educational Attainment in Miami County
According to labor force statistics for Miami County, 78.7% of individuals (13,732) out of the total population between 25 and 64 years of age (17,448) are in the labor force, with 2.4% or 330 of them being unemployed. The group with the highest labor force participation rate are those with the educational attainment of bachelor's degree or higher, with 89.3% or 4,937 individuals in the labor force. Within the labor force, individuals with high school diploma education have the highest percentage of unemployment, with 5.4% or 191 of them being unemployed.
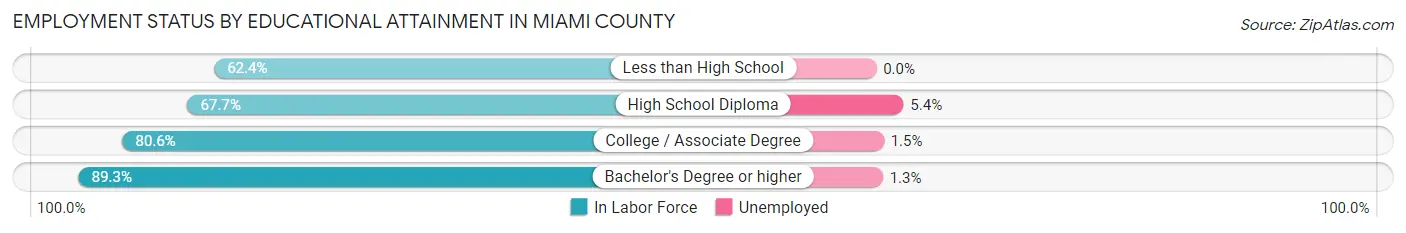
| Educational Attainment | In Labor Force | Unemployed |
| Less than High School | 450 (62.4%) | 0 (0.0%) |
| High School Diploma | 3,529 (67.7%) | 282 (5.4%) |
| College / Associate Degree | 4,824 (80.6%) | 90 (1.5%) |
| Bachelor's Degree or higher | 4,937 (89.3%) | 72 (1.3%) |
| Total | 13,732 (78.7%) | 419 (2.4%) |
Employment Occupations by Sex in Miami County
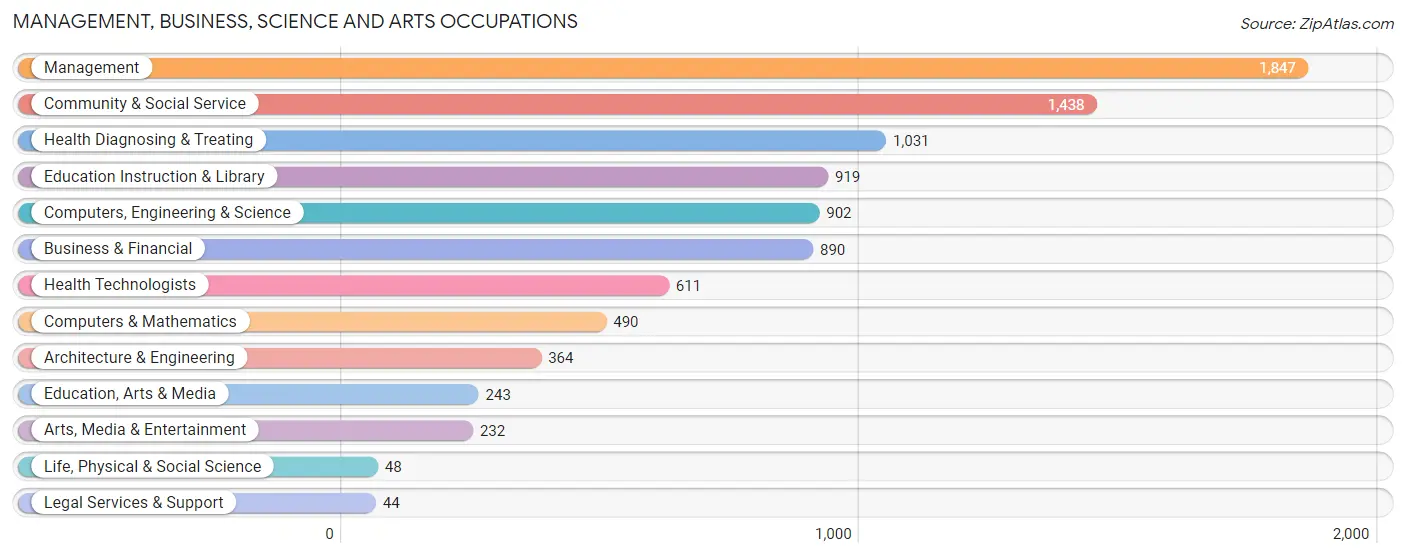
Management, Business, Science and Arts Occupations
The most common Management, Business, Science and Arts occupations in Miami County are Management (1,847 | 10.8%), Community & Social Service (1,438 | 8.4%), Health Diagnosing & Treating (1,031 | 6.0%), Education Instruction & Library (919 | 5.4%), and Computers, Engineering & Science (902 | 5.3%).
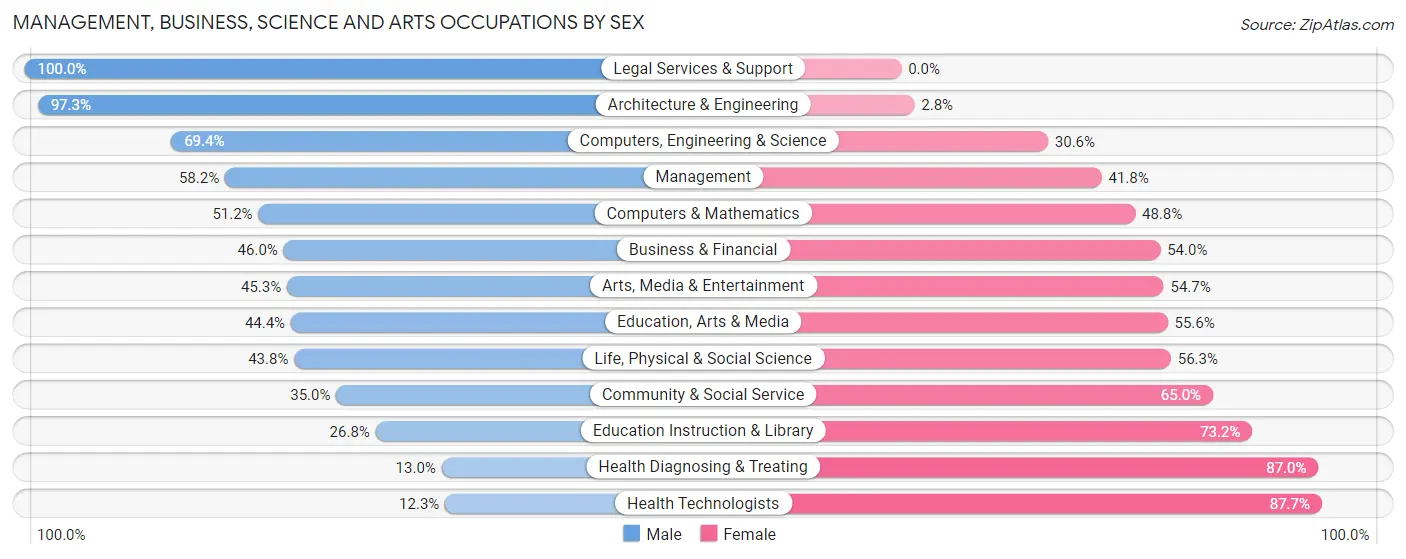
Management, Business, Science and Arts Occupations by Sex
Within the Management, Business, Science and Arts occupations in Miami County, the most male-oriented occupations are Legal Services & Support (100.0%), Architecture & Engineering (97.3%), and Computers, Engineering & Science (69.4%), while the most female-oriented occupations are Health Technologists (87.7%), Health Diagnosing & Treating (87.0%), and Education Instruction & Library (73.2%).
| Occupation | Male | Female |
| Management | 1,075 (58.2%) | 772 (41.8%) |
| Business & Financial | 409 (46.0%) | 481 (54.0%) |
| Computers, Engineering & Science | 626 (69.4%) | 276 (30.6%) |
| Computers & Mathematics | 251 (51.2%) | 239 (48.8%) |
| Architecture & Engineering | 354 (97.3%) | 10 (2.8%) |
| Life, Physical & Social Science | 21 (43.8%) | 27 (56.2%) |
| Community & Social Service | 503 (35.0%) | 935 (65.0%) |
| Education, Arts & Media | 108 (44.4%) | 135 (55.6%) |
| Legal Services & Support | 44 (100.0%) | 0 (0.0%) |
| Education Instruction & Library | 246 (26.8%) | 673 (73.2%) |
| Arts, Media & Entertainment | 105 (45.3%) | 127 (54.7%) |
| Health Diagnosing & Treating | 134 (13.0%) | 897 (87.0%) |
| Health Technologists | 75 (12.3%) | 536 (87.7%) |
| Total (Category) | 2,747 (45.0%) | 3,361 (55.0%) |
| Total (Overall) | 9,131 (53.4%) | 7,973 (46.6%) |
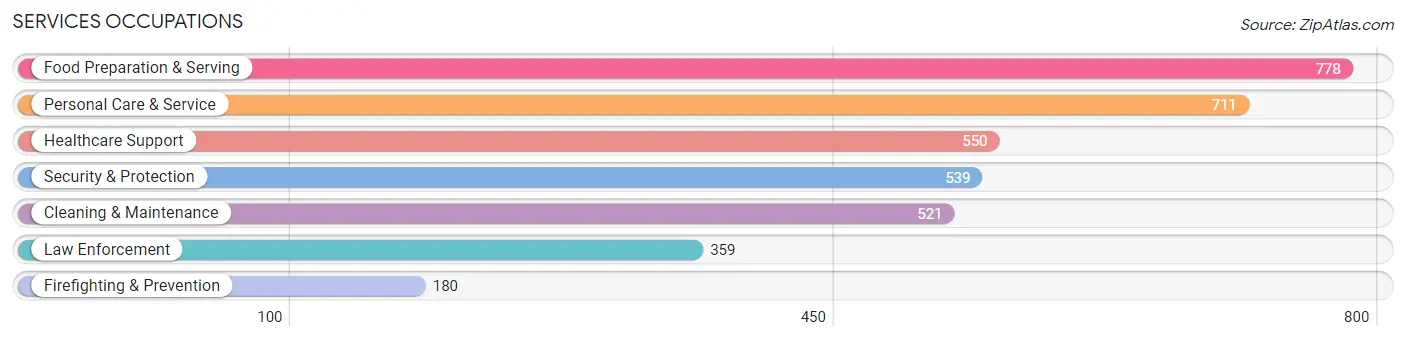
Services Occupations
The most common Services occupations in Miami County are Food Preparation & Serving (778 | 4.5%), Personal Care & Service (711 | 4.2%), Healthcare Support (550 | 3.2%), Security & Protection (539 | 3.2%), and Cleaning & Maintenance (521 | 3.0%).
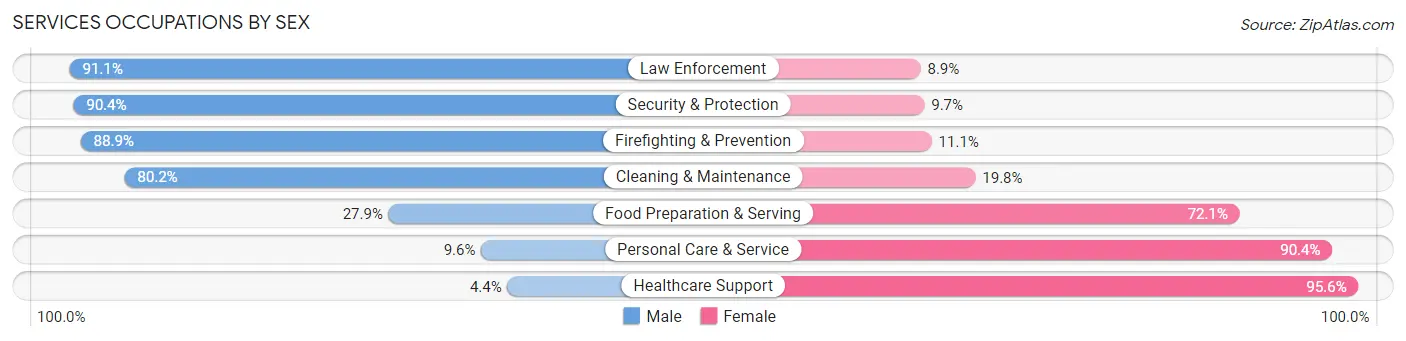
Services Occupations by Sex
Within the Services occupations in Miami County, the most male-oriented occupations are Law Enforcement (91.1%), Security & Protection (90.3%), and Firefighting & Prevention (88.9%), while the most female-oriented occupations are Healthcare Support (95.6%), Personal Care & Service (90.4%), and Food Preparation & Serving (72.1%).
| Occupation | Male | Female |
| Healthcare Support | 24 (4.4%) | 526 (95.6%) |
| Security & Protection | 487 (90.3%) | 52 (9.7%) |
| Firefighting & Prevention | 160 (88.9%) | 20 (11.1%) |
| Law Enforcement | 327 (91.1%) | 32 (8.9%) |
| Food Preparation & Serving | 217 (27.9%) | 561 (72.1%) |
| Cleaning & Maintenance | 418 (80.2%) | 103 (19.8%) |
| Personal Care & Service | 68 (9.6%) | 643 (90.4%) |
| Total (Category) | 1,214 (39.2%) | 1,885 (60.8%) |
| Total (Overall) | 9,131 (53.4%) | 7,973 (46.6%) |
Sales and Office Occupations
The most common Sales and Office occupations in Miami County are Sales & Related (2,052 | 12.0%), and Office & Administration (1,820 | 10.6%).
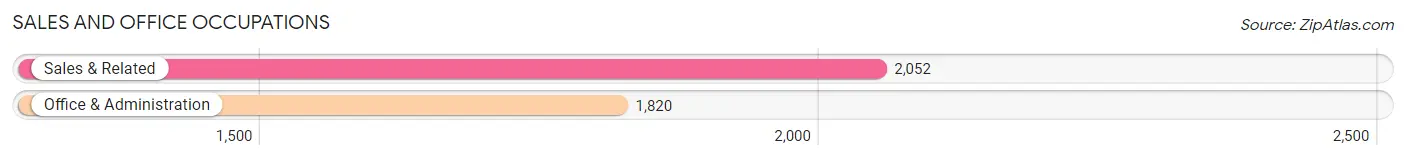
Sales and Office Occupations by Sex

| Occupation | Male | Female |
| Sales & Related | 1,354 (66.0%) | 698 (34.0%) |
| Office & Administration | 274 (15.0%) | 1,546 (85.0%) |
| Total (Category) | 1,628 (42.0%) | 2,244 (58.0%) |
| Total (Overall) | 9,131 (53.4%) | 7,973 (46.6%) |
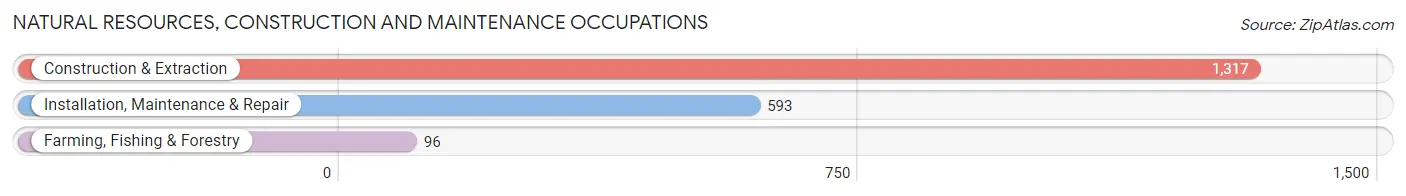
Natural Resources, Construction and Maintenance Occupations
The most common Natural Resources, Construction and Maintenance occupations in Miami County are Construction & Extraction (1,317 | 7.7%), Installation, Maintenance & Repair (593 | 3.5%), and Farming, Fishing & Forestry (96 | 0.6%).
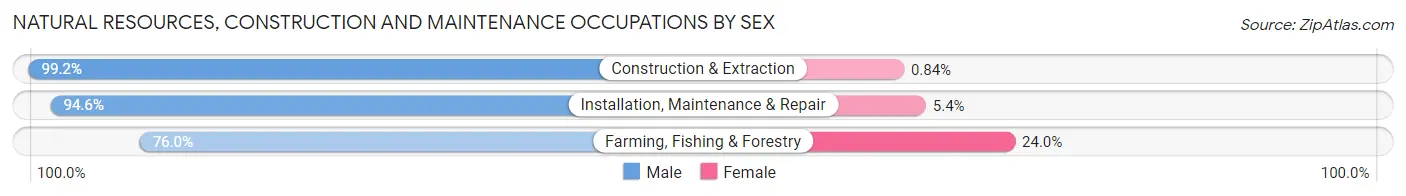
Natural Resources, Construction and Maintenance Occupations by Sex
| Occupation | Male | Female |
| Farming, Fishing & Forestry | 73 (76.0%) | 23 (24.0%) |
| Construction & Extraction | 1,306 (99.2%) | 11 (0.8%) |
| Installation, Maintenance & Repair | 561 (94.6%) | 32 (5.4%) |
| Total (Category) | 1,940 (96.7%) | 66 (3.3%) |
| Total (Overall) | 9,131 (53.4%) | 7,973 (46.6%) |
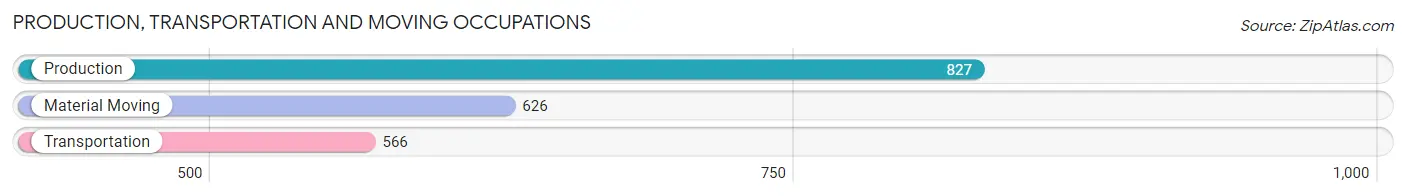
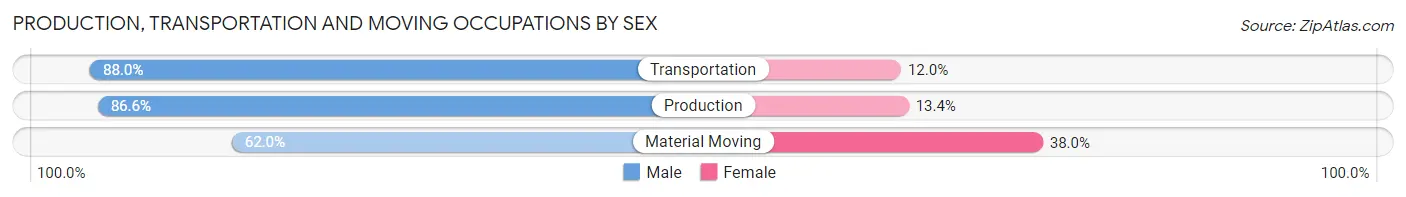
Production, Transportation and Moving Occupations
The most common Production, Transportation and Moving occupations in Miami County are Production (827 | 4.8%), Material Moving (626 | 3.7%), and Transportation (566 | 3.3%).
Production, Transportation and Moving Occupations by Sex
| Occupation | Male | Female |
| Production | 716 (86.6%) | 111 (13.4%) |
| Transportation | 498 (88.0%) | 68 (12.0%) |
| Material Moving | 388 (62.0%) | 238 (38.0%) |
| Total (Category) | 1,602 (79.3%) | 417 (20.6%) |
| Total (Overall) | 9,131 (53.4%) | 7,973 (46.6%) |
Employment Industries by Sex in Miami County
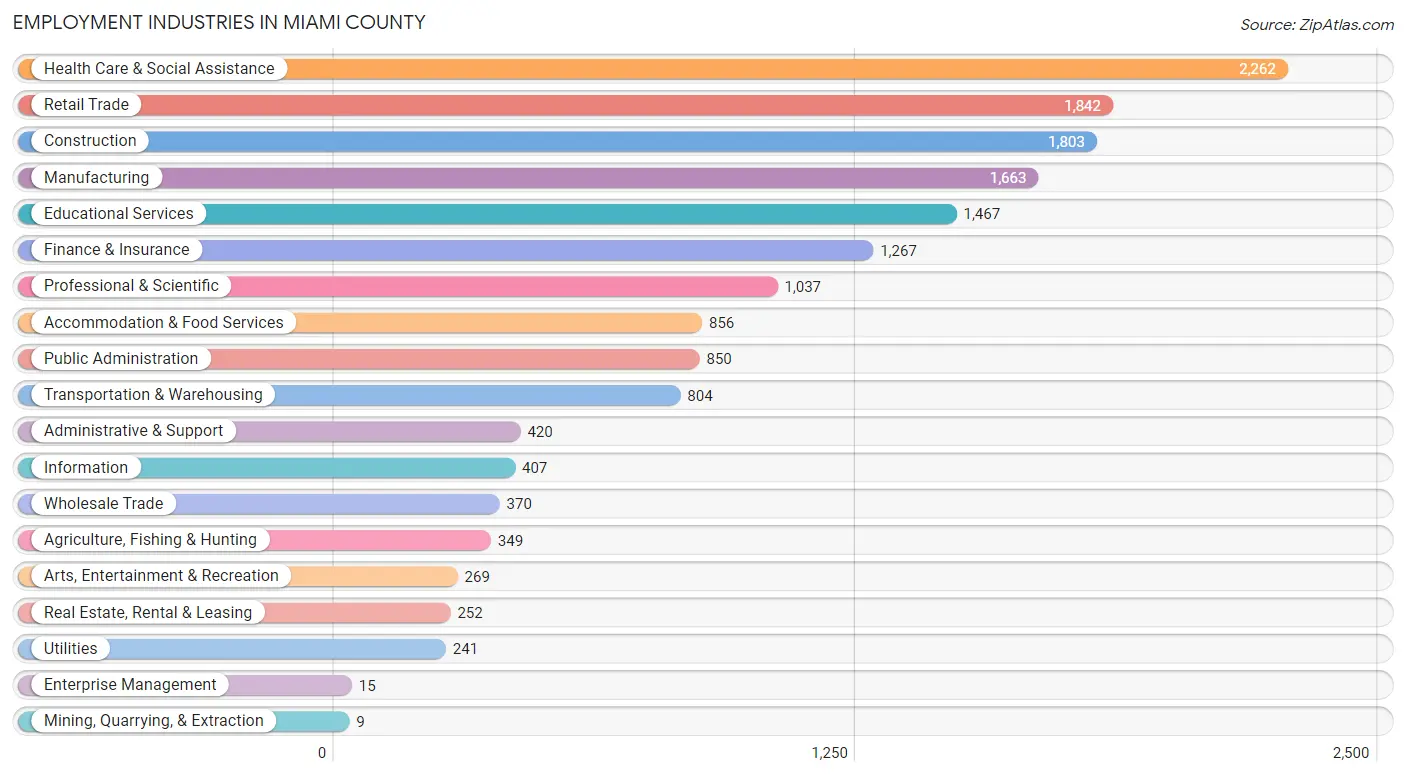
Employment Industries in Miami County
The major employment industries in Miami County include Health Care & Social Assistance (2,262 | 13.2%), Retail Trade (1,842 | 10.8%), Construction (1,803 | 10.5%), Manufacturing (1,663 | 9.7%), and Educational Services (1,467 | 8.6%).
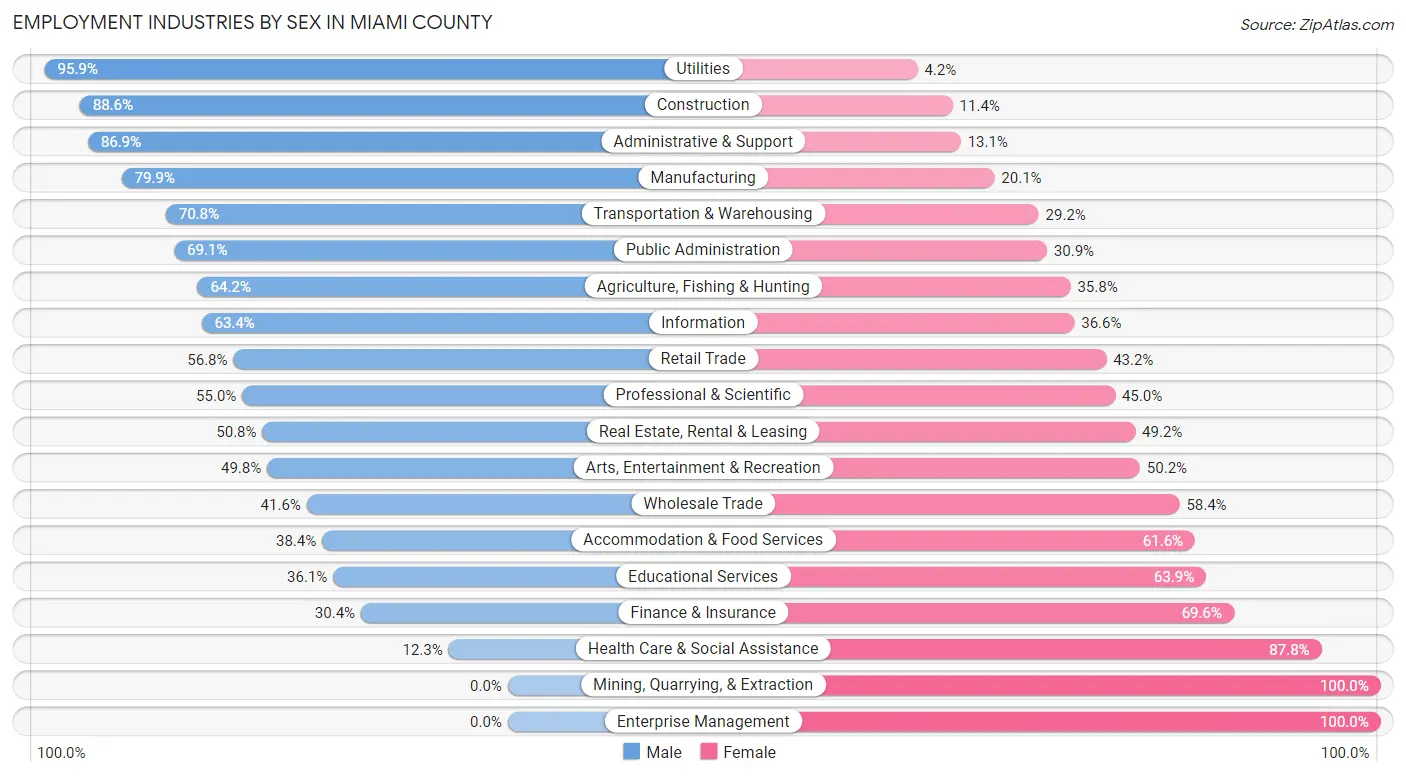
Employment Industries by Sex in Miami County
The Miami County industries that see more men than women are Utilities (95.9%), Construction (88.6%), and Administrative & Support (86.9%), whereas the industries that tend to have a higher number of women are Mining, Quarrying, & Extraction (100.0%), Enterprise Management (100.0%), and Health Care & Social Assistance (87.7%).
| Industry | Male | Female |
| Agriculture, Fishing & Hunting | 224 (64.2%) | 125 (35.8%) |
| Mining, Quarrying, & Extraction | 0 (0.0%) | 9 (100.0%) |
| Construction | 1,597 (88.6%) | 206 (11.4%) |
| Manufacturing | 1,329 (79.9%) | 334 (20.1%) |
| Wholesale Trade | 154 (41.6%) | 216 (58.4%) |
| Retail Trade | 1,046 (56.8%) | 796 (43.2%) |
| Transportation & Warehousing | 569 (70.8%) | 235 (29.2%) |
| Utilities | 231 (95.9%) | 10 (4.2%) |
| Information | 258 (63.4%) | 149 (36.6%) |
| Finance & Insurance | 385 (30.4%) | 882 (69.6%) |
| Real Estate, Rental & Leasing | 128 (50.8%) | 124 (49.2%) |
| Professional & Scientific | 570 (55.0%) | 467 (45.0%) |
| Enterprise Management | 0 (0.0%) | 15 (100.0%) |
| Administrative & Support | 365 (86.9%) | 55 (13.1%) |
| Educational Services | 530 (36.1%) | 937 (63.9%) |
| Health Care & Social Assistance | 277 (12.2%) | 1,985 (87.7%) |
| Arts, Entertainment & Recreation | 134 (49.8%) | 135 (50.2%) |
| Accommodation & Food Services | 329 (38.4%) | 527 (61.6%) |
| Public Administration | 587 (69.1%) | 263 (30.9%) |
| Total | 9,131 (53.4%) | 7,973 (46.6%) |
Education in Miami County
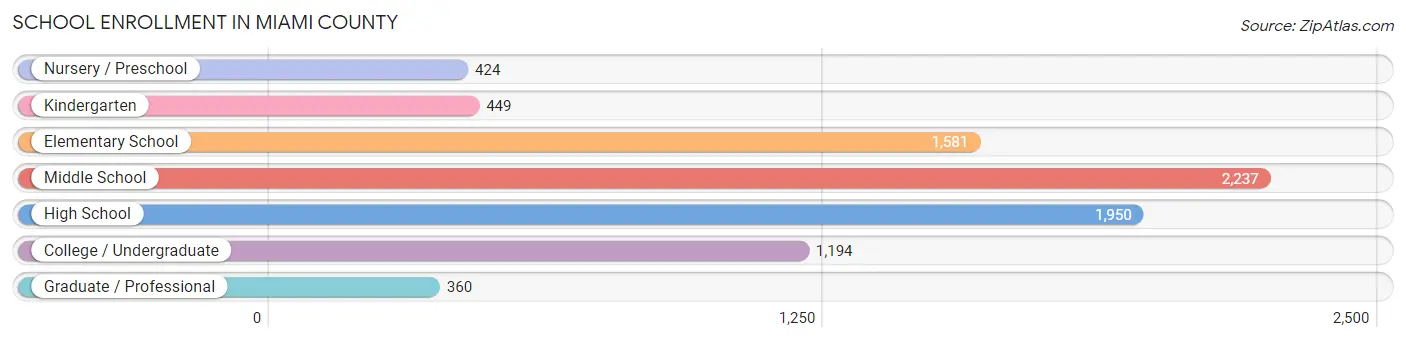
School Enrollment in Miami County
The most common levels of schooling among the 8,195 students in Miami County are middle school (2,237 | 27.3%), high school (1,950 | 23.8%), and elementary school (1,581 | 19.3%).
| School Level | # Students | % Students |
| Nursery / Preschool | 424 | 5.2% |
| Kindergarten | 449 | 5.5% |
| Elementary School | 1,581 | 19.3% |
| Middle School | 2,237 | 27.3% |
| High School | 1,950 | 23.8% |
| College / Undergraduate | 1,194 | 14.6% |
| Graduate / Professional | 360 | 4.4% |
| Total | 8,195 | 100.0% |
School Enrollment by Age by Funding Source in Miami County
Out of a total of 8,195 students who are enrolled in schools in Miami County, 869 (10.6%) attend a private institution, while the remaining 7,326 (89.4%) are enrolled in public schools. The age group of 25 to 34 year olds has the highest likelihood of being enrolled in private schools, with 107 (44.0% in the age bracket) enrolled. Conversely, the age group of 15 to 17 year olds has the lowest likelihood of being enrolled in a private school, with 1,427 (97.0% in the age bracket) attending a public institution.
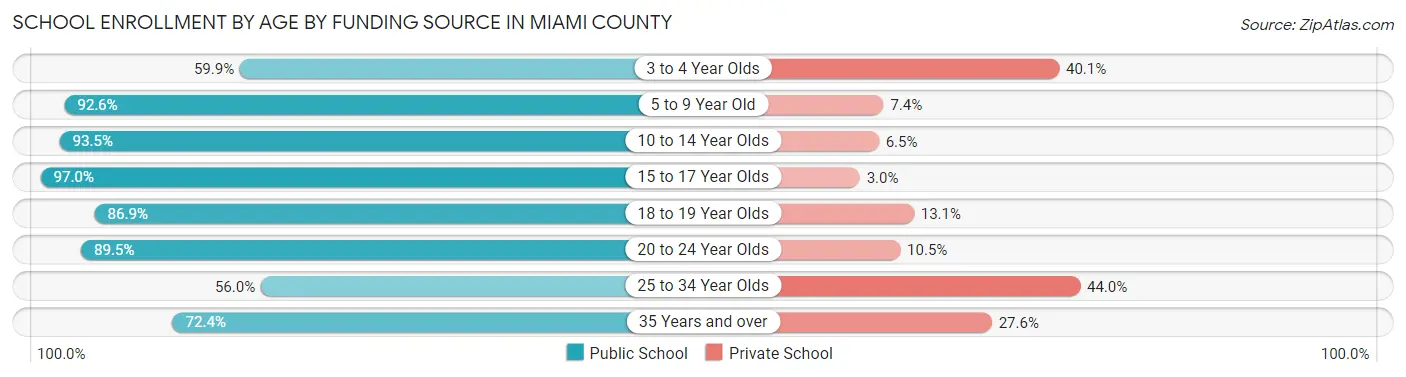
| Age Bracket | Public School | Private School |
| 3 to 4 Year Olds | 203 (59.9%) | 136 (40.1%) |
| 5 to 9 Year Old | 1,838 (92.6%) | 147 (7.4%) |
| 10 to 14 Year Olds | 2,350 (93.5%) | 164 (6.5%) |
| 15 to 17 Year Olds | 1,427 (97.0%) | 44 (3.0%) |
| 18 to 19 Year Olds | 486 (86.9%) | 73 (13.1%) |
| 20 to 24 Year Olds | 519 (89.5%) | 61 (10.5%) |
| 25 to 34 Year Olds | 136 (56.0%) | 107 (44.0%) |
| 35 Years and over | 365 (72.4%) | 139 (27.6%) |
| Total | 7,326 (89.4%) | 869 (10.6%) |
Educational Attainment by Field of Study in Miami County
Business (1,569 | 19.9%), education (1,266 | 16.0%), science & technology (1,143 | 14.5%), arts & humanities (674 | 8.5%), and bio, nature & agricultural (621 | 7.9%) are the most common fields of study among 7,893 individuals in Miami County who have obtained a bachelor's degree or higher.
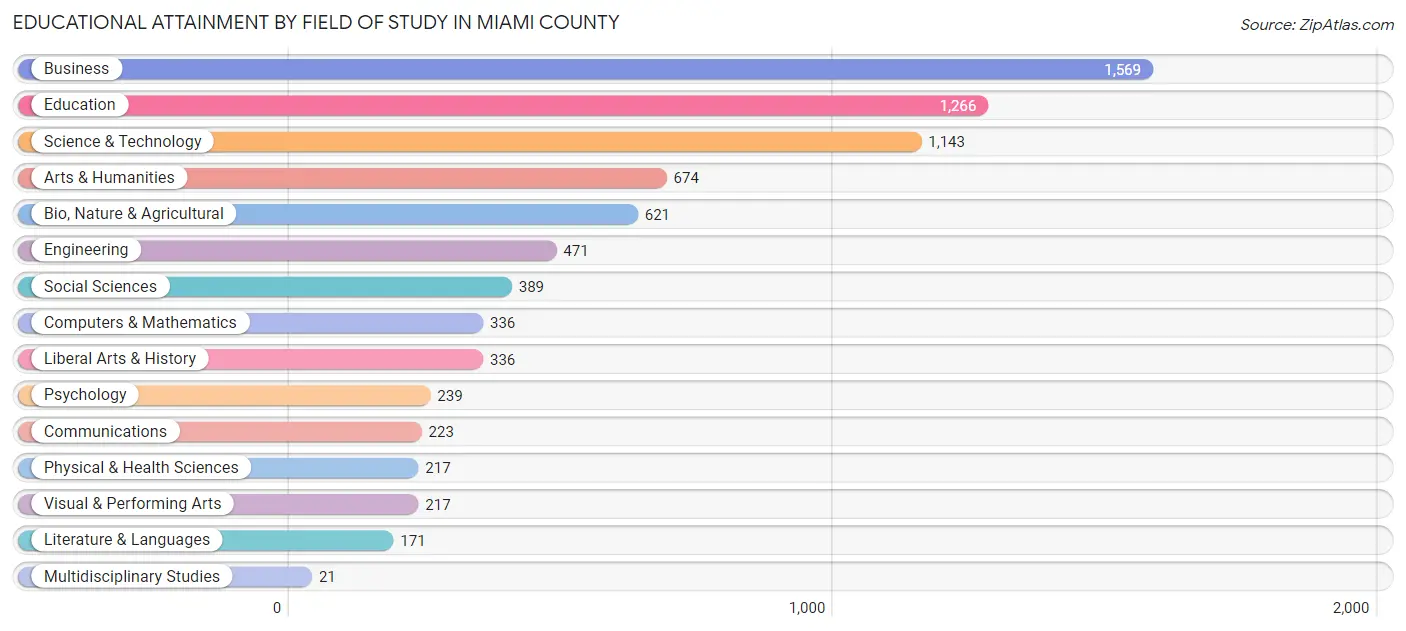
| Field of Study | # Graduates | % Graduates |
| Computers & Mathematics | 336 | 4.3% |
| Bio, Nature & Agricultural | 621 | 7.9% |
| Physical & Health Sciences | 217 | 2.8% |
| Psychology | 239 | 3.0% |
| Social Sciences | 389 | 4.9% |
| Engineering | 471 | 6.0% |
| Multidisciplinary Studies | 21 | 0.3% |
| Science & Technology | 1,143 | 14.5% |
| Business | 1,569 | 19.9% |
| Education | 1,266 | 16.0% |
| Literature & Languages | 171 | 2.2% |
| Liberal Arts & History | 336 | 4.3% |
| Visual & Performing Arts | 217 | 2.8% |
| Communications | 223 | 2.8% |
| Arts & Humanities | 674 | 8.5% |
| Total | 7,893 | 100.0% |
Transportation & Commute in Miami County
Vehicle Availability by Sex in Miami County
The most prevalent vehicle ownership categories in Miami County are males with 2 vehicles (3,363, accounting for 36.9%) and females with 2 vehicles (2,654, making up 42.8%).
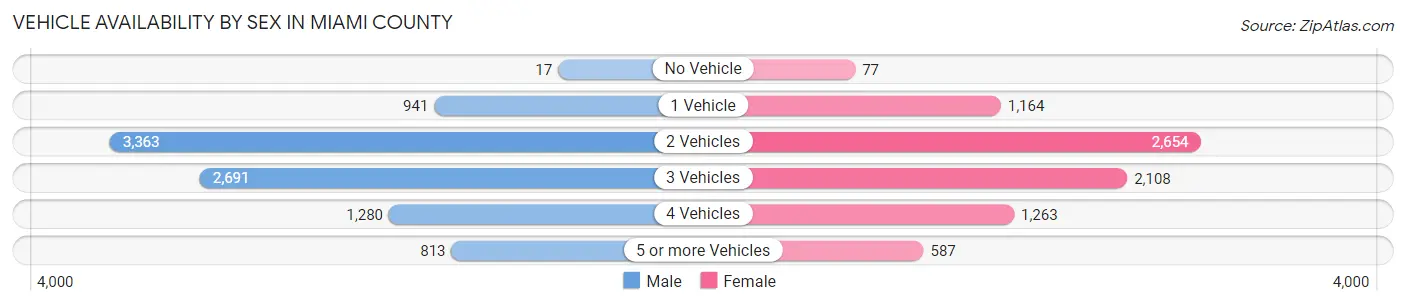
| Vehicles Available | Male | Female |
| No Vehicle | 17 (0.2%) | 77 (1.0%) |
| 1 Vehicle | 941 (10.3%) | 1,164 (14.8%) |
| 2 Vehicles | 3,363 (36.9%) | 2,654 (33.8%) |
| 3 Vehicles | 2,691 (29.6%) | 2,108 (26.8%) |
| 4 Vehicles | 1,280 (14.1%) | 1,263 (16.1%) |
| 5 or more Vehicles | 813 (8.9%) | 587 (7.5%) |
| Total | 9,105 (100.0%) | 7,853 (100.0%) |
Commute Time in Miami County
The most frequently occuring commute durations in Miami County are 30 to 34 minutes (2,879 commuters, 19.1%), 45 to 59 minutes (1,976 commuters, 13.1%), and 20 to 24 minutes (1,707 commuters, 11.4%).
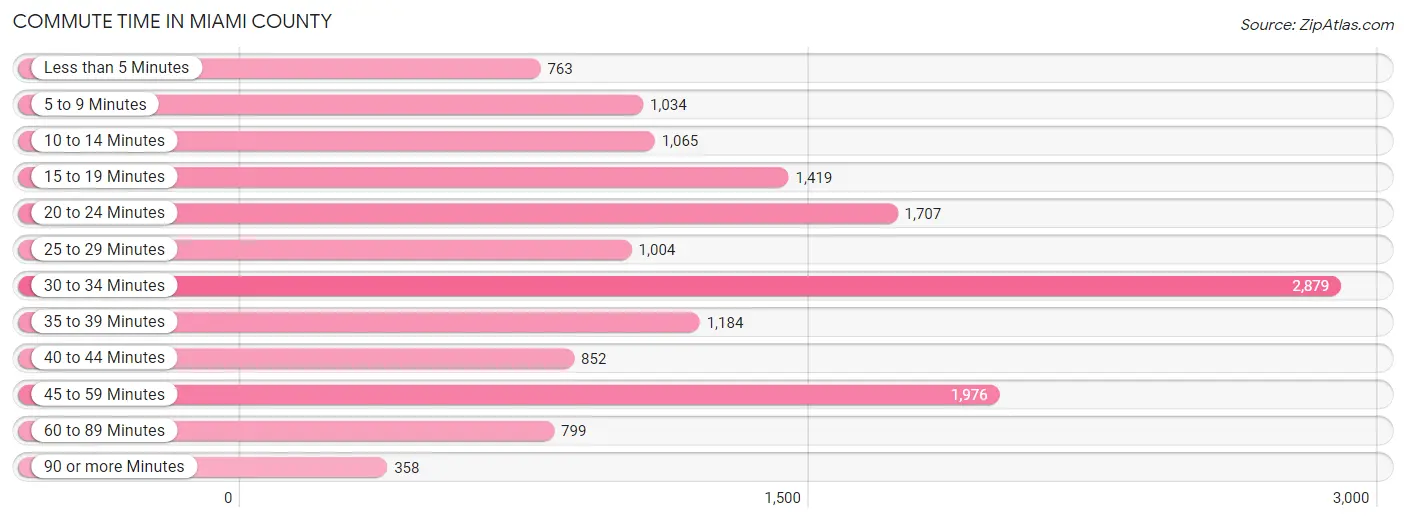
| Commute Time | # Commuters | % Commuters |
| Less than 5 Minutes | 763 | 5.1% |
| 5 to 9 Minutes | 1,034 | 6.9% |
| 10 to 14 Minutes | 1,065 | 7.1% |
| 15 to 19 Minutes | 1,419 | 9.4% |
| 20 to 24 Minutes | 1,707 | 11.4% |
| 25 to 29 Minutes | 1,004 | 6.7% |
| 30 to 34 Minutes | 2,879 | 19.1% |
| 35 to 39 Minutes | 1,184 | 7.9% |
| 40 to 44 Minutes | 852 | 5.7% |
| 45 to 59 Minutes | 1,976 | 13.1% |
| 60 to 89 Minutes | 799 | 5.3% |
| 90 or more Minutes | 358 | 2.4% |
Commute Time by Sex in Miami County
The most common commute times in Miami County are 30 to 34 minutes (1,870 commuters, 22.8%) for males and 20 to 24 minutes (1,014 commuters, 14.8%) for females.
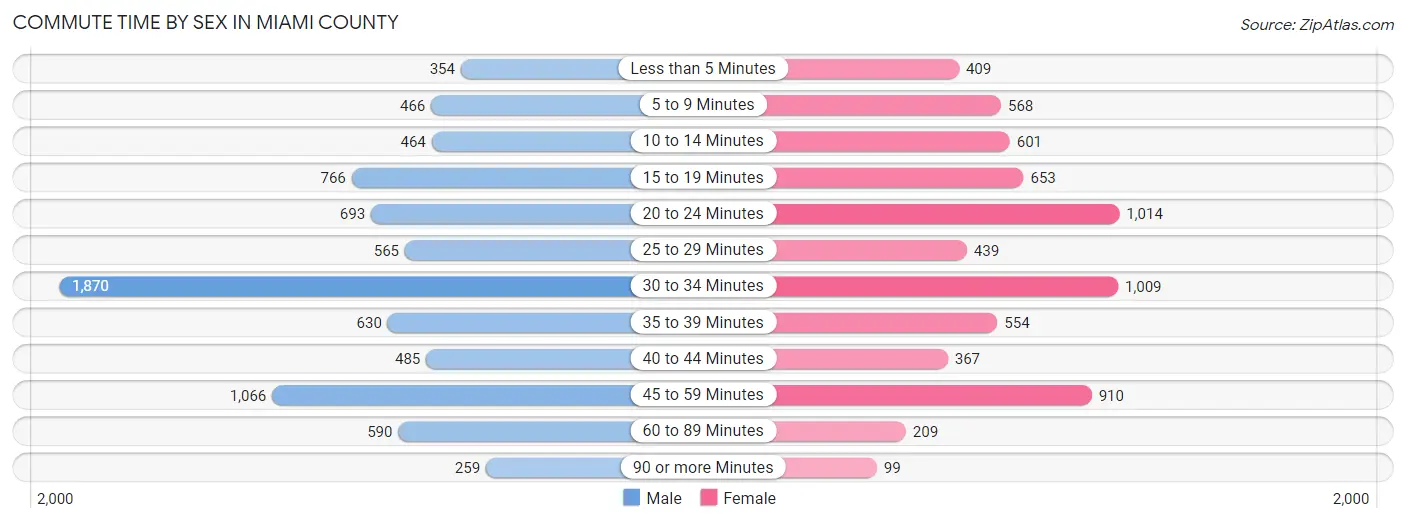
| Commute Time | Male | Female |
| Less than 5 Minutes | 354 (4.3%) | 409 (6.0%) |
| 5 to 9 Minutes | 466 (5.7%) | 568 (8.3%) |
| 10 to 14 Minutes | 464 (5.7%) | 601 (8.8%) |
| 15 to 19 Minutes | 766 (9.3%) | 653 (9.6%) |
| 20 to 24 Minutes | 693 (8.4%) | 1,014 (14.8%) |
| 25 to 29 Minutes | 565 (6.9%) | 439 (6.4%) |
| 30 to 34 Minutes | 1,870 (22.8%) | 1,009 (14.8%) |
| 35 to 39 Minutes | 630 (7.7%) | 554 (8.1%) |
| 40 to 44 Minutes | 485 (5.9%) | 367 (5.4%) |
| 45 to 59 Minutes | 1,066 (13.0%) | 910 (13.3%) |
| 60 to 89 Minutes | 590 (7.2%) | 209 (3.1%) |
| 90 or more Minutes | 259 (3.2%) | 99 (1.5%) |
Time of Departure to Work by Sex in Miami County
The most frequent times of departure to work in Miami County are 7:00 AM to 7:29 AM (1,263, 15.4%) for males and 7:00 AM to 7:29 AM (1,571, 23.0%) for females.
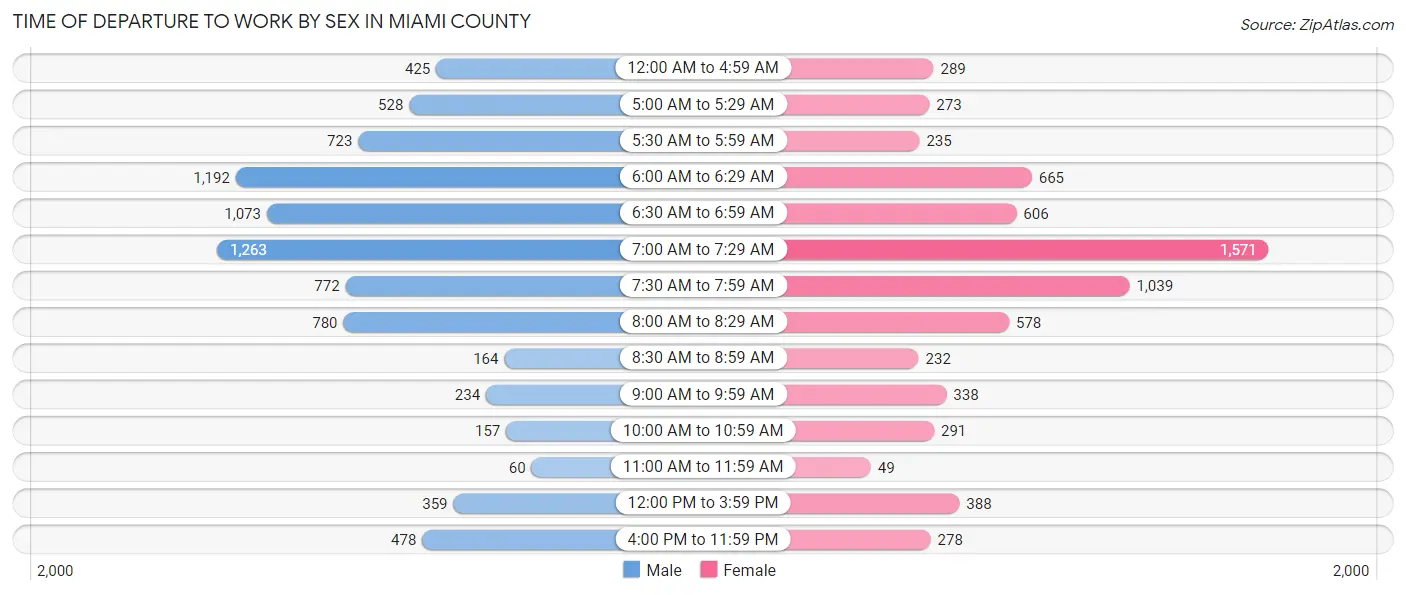
| Time of Departure | Male | Female |
| 12:00 AM to 4:59 AM | 425 (5.2%) | 289 (4.2%) |
| 5:00 AM to 5:29 AM | 528 (6.4%) | 273 (4.0%) |
| 5:30 AM to 5:59 AM | 723 (8.8%) | 235 (3.4%) |
| 6:00 AM to 6:29 AM | 1,192 (14.5%) | 665 (9.7%) |
| 6:30 AM to 6:59 AM | 1,073 (13.1%) | 606 (8.9%) |
| 7:00 AM to 7:29 AM | 1,263 (15.4%) | 1,571 (23.0%) |
| 7:30 AM to 7:59 AM | 772 (9.4%) | 1,039 (15.2%) |
| 8:00 AM to 8:29 AM | 780 (9.5%) | 578 (8.5%) |
| 8:30 AM to 8:59 AM | 164 (2.0%) | 232 (3.4%) |
| 9:00 AM to 9:59 AM | 234 (2.9%) | 338 (5.0%) |
| 10:00 AM to 10:59 AM | 157 (1.9%) | 291 (4.3%) |
| 11:00 AM to 11:59 AM | 60 (0.7%) | 49 (0.7%) |
| 12:00 PM to 3:59 PM | 359 (4.4%) | 388 (5.7%) |
| 4:00 PM to 11:59 PM | 478 (5.8%) | 278 (4.1%) |
| Total | 8,208 (100.0%) | 6,832 (100.0%) |
Housing Occupancy in Miami County
Occupancy by Ownership in Miami County
Of the total 13,239 dwellings in Miami County, owner-occupied units account for 10,508 (79.4%), while renter-occupied units make up 2,731 (20.6%).
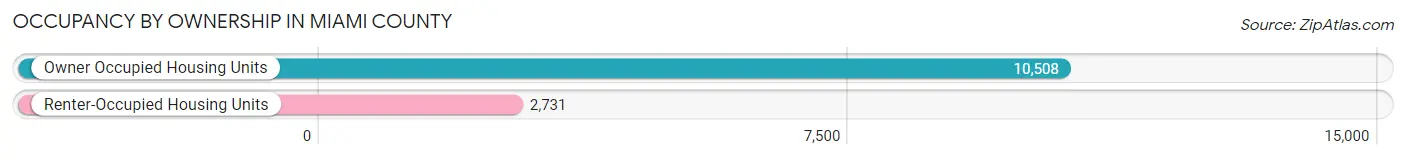
| Occupancy | # Housing Units | % Housing Units |
| Owner Occupied Housing Units | 10,508 | 79.4% |
| Renter-Occupied Housing Units | 2,731 | 20.6% |
| Total Occupied Housing Units | 13,239 | 100.0% |
Occupancy by Household Size in Miami County
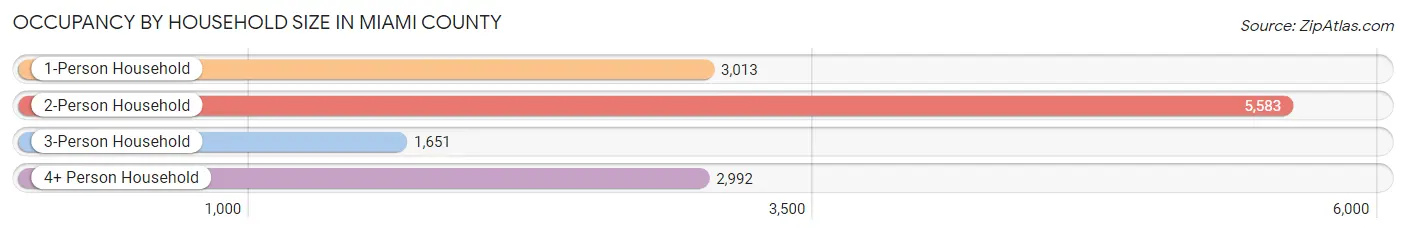
| Household Size | # Housing Units | % Housing Units |
| 1-Person Household | 3,013 | 22.8% |
| 2-Person Household | 5,583 | 42.2% |
| 3-Person Household | 1,651 | 12.5% |
| 4+ Person Household | 2,992 | 22.6% |
| Total Housing Units | 13,239 | 100.0% |
Occupancy by Ownership by Household Size in Miami County
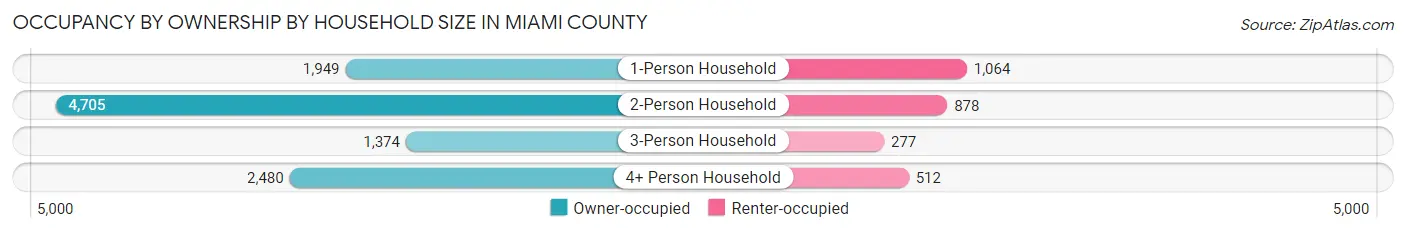
| Household Size | Owner-occupied | Renter-occupied |
| 1-Person Household | 1,949 (64.7%) | 1,064 (35.3%) |
| 2-Person Household | 4,705 (84.3%) | 878 (15.7%) |
| 3-Person Household | 1,374 (83.2%) | 277 (16.8%) |
| 4+ Person Household | 2,480 (82.9%) | 512 (17.1%) |
| Total Housing Units | 10,508 (79.4%) | 2,731 (20.6%) |
Occupancy by Educational Attainment in Miami County
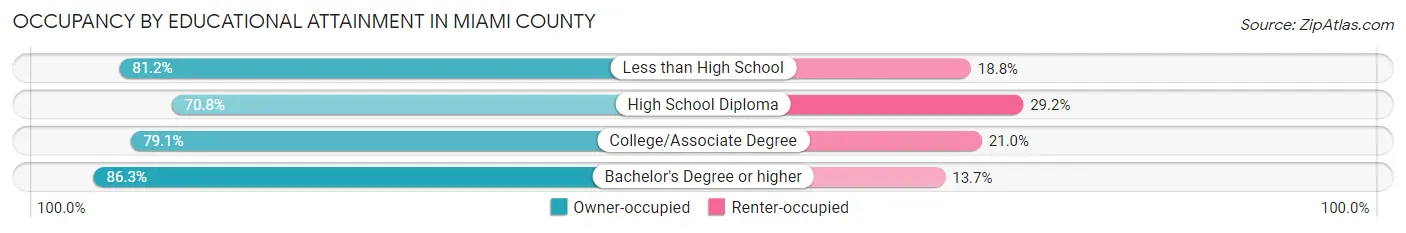
| Household Size | Owner-occupied | Renter-occupied |
| Less than High School | 398 (81.2%) | 92 (18.8%) |
| High School Diploma | 2,573 (70.8%) | 1,059 (29.2%) |
| College/Associate Degree | 3,611 (79.0%) | 957 (20.9%) |
| Bachelor's Degree or higher | 3,926 (86.3%) | 623 (13.7%) |
Occupancy by Age of Householder in Miami County
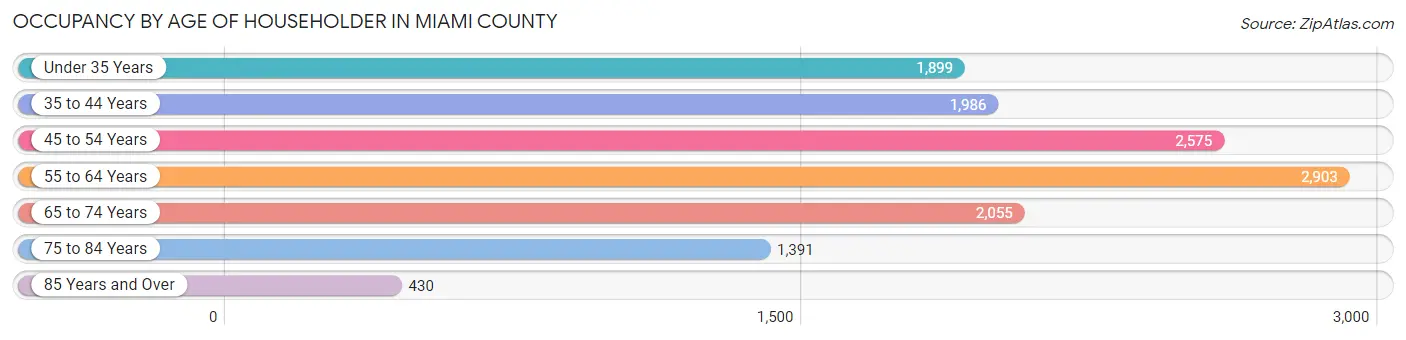
| Age Bracket | # Households | % Households |
| Under 35 Years | 1,899 | 14.3% |
| 35 to 44 Years | 1,986 | 15.0% |
| 45 to 54 Years | 2,575 | 19.5% |
| 55 to 64 Years | 2,903 | 21.9% |
| 65 to 74 Years | 2,055 | 15.5% |
| 75 to 84 Years | 1,391 | 10.5% |
| 85 Years and Over | 430 | 3.3% |
| Total | 13,239 | 100.0% |
Housing Finances in Miami County
Median Income by Occupancy in Miami County
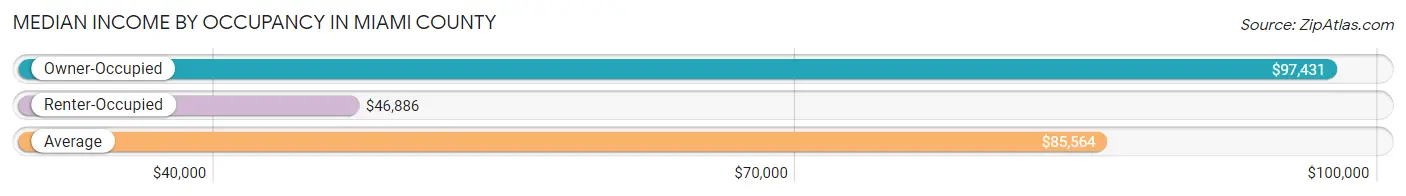
| Occupancy Type | # Households | Median Income |
| Owner-Occupied | 10,508 (79.4%) | $97,431 |
| Renter-Occupied | 2,731 (20.6%) | $46,886 |
| Average | 13,239 (100.0%) | $85,564 |
Occupancy by Householder Income Bracket in Miami County
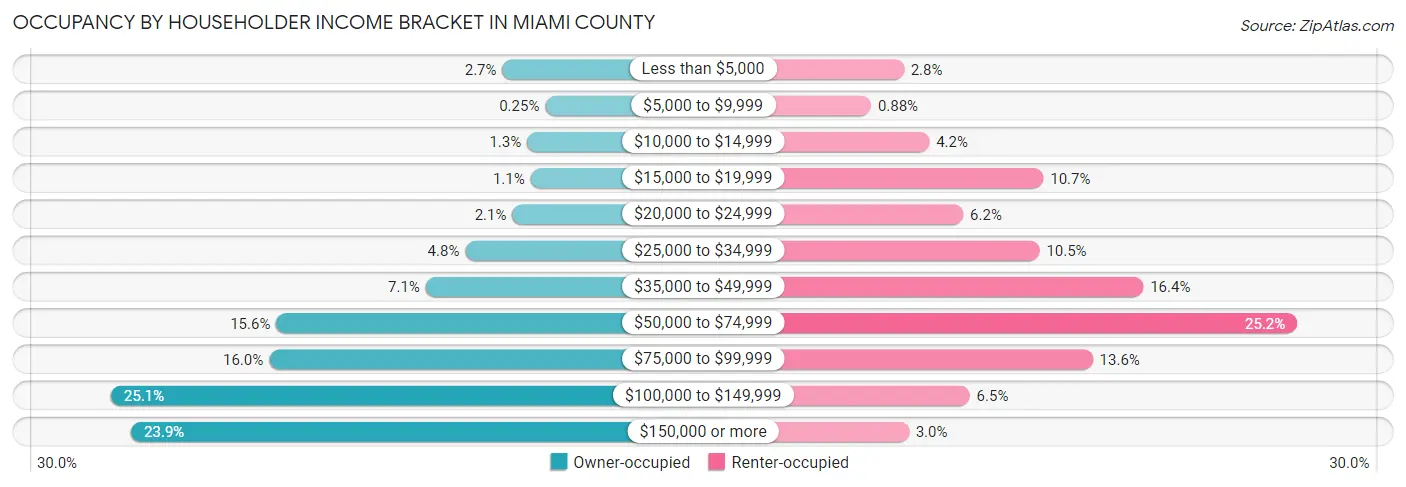
| Income Bracket | Owner-occupied | Renter-occupied |
| Less than $5,000 | 284 (2.7%) | 75 (2.8%) |
| $5,000 to $9,999 | 26 (0.3%) | 24 (0.9%) |
| $10,000 to $14,999 | 136 (1.3%) | 115 (4.2%) |
| $15,000 to $19,999 | 115 (1.1%) | 293 (10.7%) |
| $20,000 to $24,999 | 224 (2.1%) | 168 (6.1%) |
| $25,000 to $34,999 | 507 (4.8%) | 287 (10.5%) |
| $35,000 to $49,999 | 744 (7.1%) | 449 (16.4%) |
| $50,000 to $74,999 | 1,641 (15.6%) | 689 (25.2%) |
| $75,000 to $99,999 | 1,684 (16.0%) | 370 (13.6%) |
| $100,000 to $149,999 | 2,634 (25.1%) | 178 (6.5%) |
| $150,000 or more | 2,513 (23.9%) | 83 (3.0%) |
| Total | 10,508 (100.0%) | 2,731 (100.0%) |
Monthly Housing Cost Tiers in Miami County
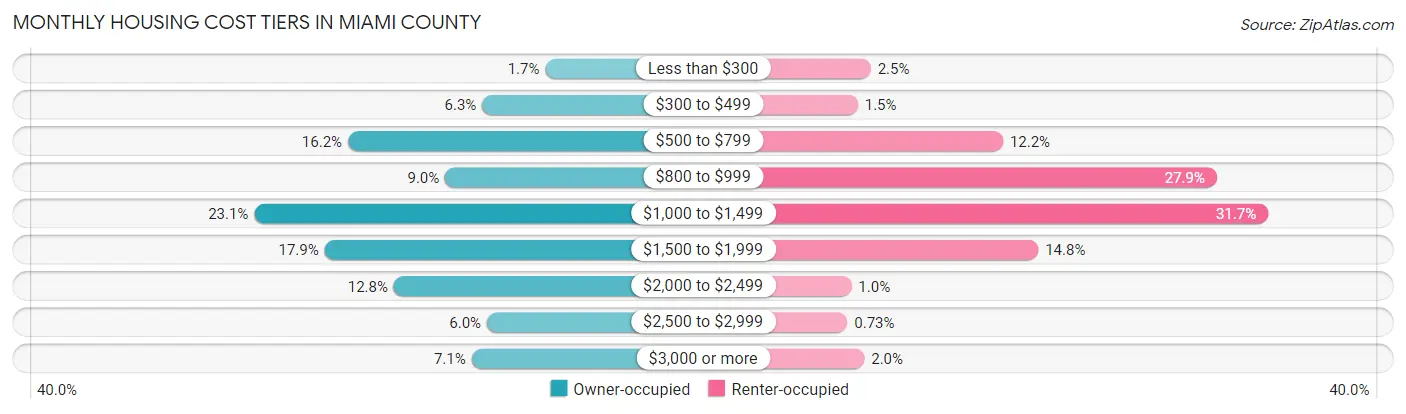
| Monthly Cost | Owner-occupied | Renter-occupied |
| Less than $300 | 173 (1.7%) | 67 (2.5%) |
| $300 to $499 | 662 (6.3%) | 41 (1.5%) |
| $500 to $799 | 1,701 (16.2%) | 333 (12.2%) |
| $800 to $999 | 949 (9.0%) | 763 (27.9%) |
| $1,000 to $1,499 | 2,426 (23.1%) | 866 (31.7%) |
| $1,500 to $1,999 | 1,882 (17.9%) | 404 (14.8%) |
| $2,000 to $2,499 | 1,346 (12.8%) | 28 (1.0%) |
| $2,500 to $2,999 | 625 (5.9%) | 20 (0.7%) |
| $3,000 or more | 744 (7.1%) | 54 (2.0%) |
| Total | 10,508 (100.0%) | 2,731 (100.0%) |
Physical Housing Characteristics in Miami County
Housing Structures in Miami County
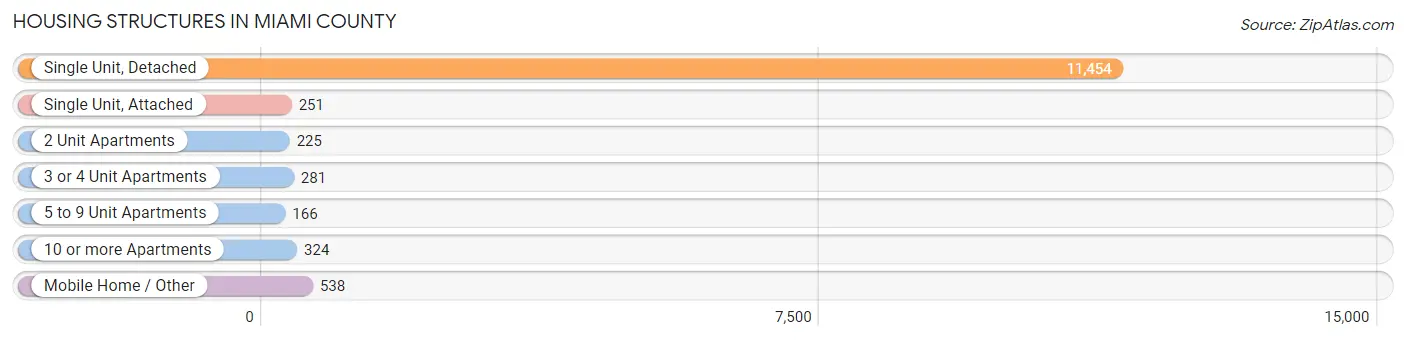
| Structure Type | # Housing Units | % Housing Units |
| Single Unit, Detached | 11,454 | 86.5% |
| Single Unit, Attached | 251 | 1.9% |
| 2 Unit Apartments | 225 | 1.7% |
| 3 or 4 Unit Apartments | 281 | 2.1% |
| 5 to 9 Unit Apartments | 166 | 1.3% |
| 10 or more Apartments | 324 | 2.5% |
| Mobile Home / Other | 538 | 4.1% |
| Total | 13,239 | 100.0% |
Housing Structures by Occupancy in Miami County
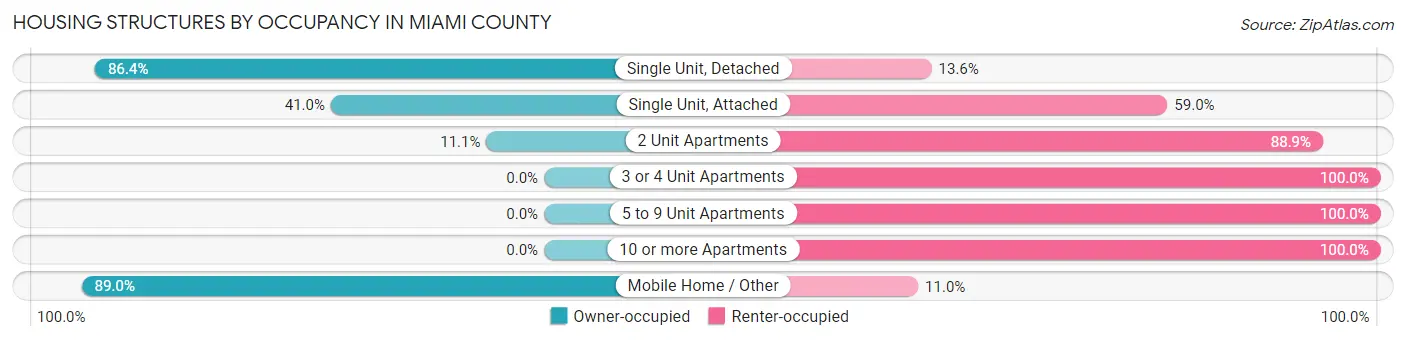
| Structure Type | Owner-occupied | Renter-occupied |
| Single Unit, Detached | 9,901 (86.4%) | 1,553 (13.6%) |
| Single Unit, Attached | 103 (41.0%) | 148 (59.0%) |
| 2 Unit Apartments | 25 (11.1%) | 200 (88.9%) |
| 3 or 4 Unit Apartments | 0 (0.0%) | 281 (100.0%) |
| 5 to 9 Unit Apartments | 0 (0.0%) | 166 (100.0%) |
| 10 or more Apartments | 0 (0.0%) | 324 (100.0%) |
| Mobile Home / Other | 479 (89.0%) | 59 (11.0%) |
| Total | 10,508 (79.4%) | 2,731 (20.6%) |
Housing Structures by Number of Rooms in Miami County
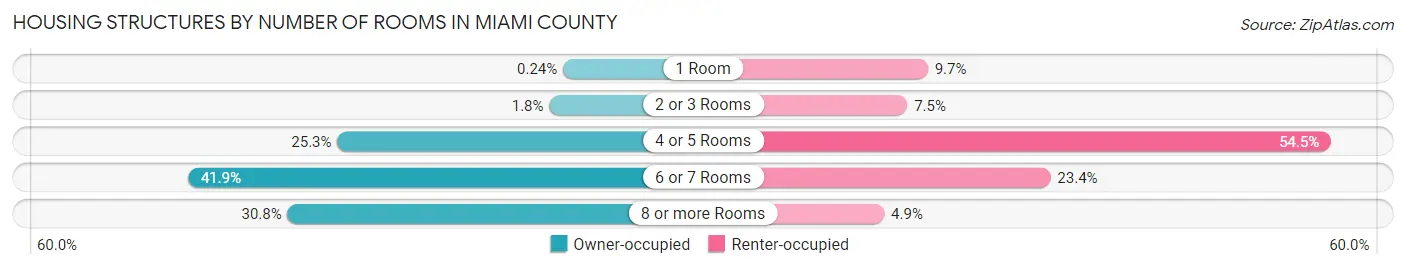
| Number of Rooms | Owner-occupied | Renter-occupied |
| 1 Room | 25 (0.2%) | 266 (9.7%) |
| 2 or 3 Rooms | 185 (1.8%) | 204 (7.5%) |
| 4 or 5 Rooms | 2,657 (25.3%) | 1,489 (54.5%) |
| 6 or 7 Rooms | 4,402 (41.9%) | 638 (23.4%) |
| 8 or more Rooms | 3,239 (30.8%) | 134 (4.9%) |
| Total | 10,508 (100.0%) | 2,731 (100.0%) |
Housing Structure by Heating Type in Miami County
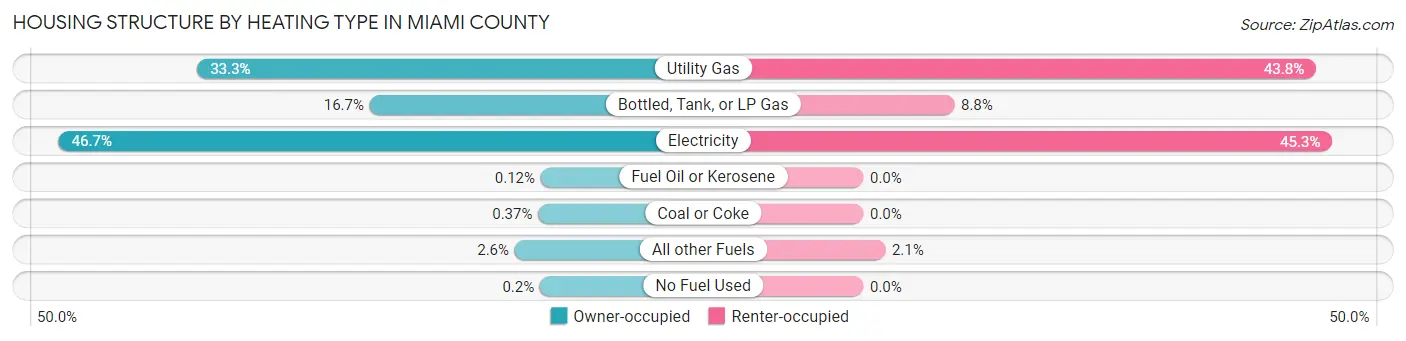
| Heating Type | Owner-occupied | Renter-occupied |
| Utility Gas | 3,501 (33.3%) | 1,195 (43.8%) |
| Bottled, Tank, or LP Gas | 1,750 (16.7%) | 240 (8.8%) |
| Electricity | 4,908 (46.7%) | 1,238 (45.3%) |
| Fuel Oil or Kerosene | 13 (0.1%) | 0 (0.0%) |
| Coal or Coke | 39 (0.4%) | 0 (0.0%) |
| All other Fuels | 276 (2.6%) | 58 (2.1%) |
| No Fuel Used | 21 (0.2%) | 0 (0.0%) |
| Total | 10,508 (100.0%) | 2,731 (100.0%) |
Household Vehicle Usage in Miami County
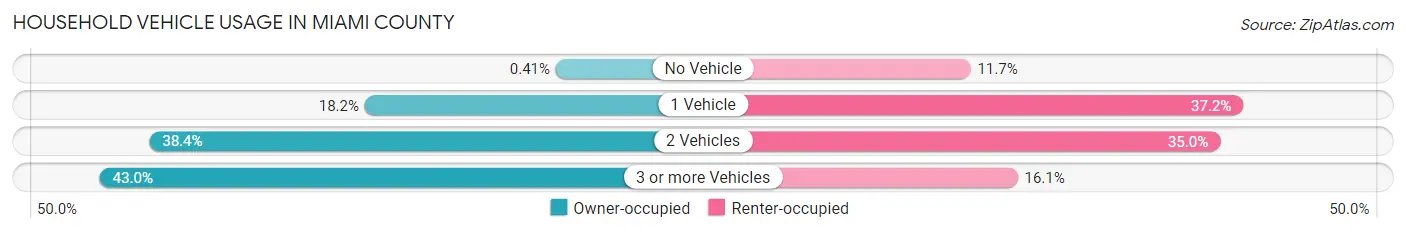
| Vehicles per Household | Owner-occupied | Renter-occupied |
| No Vehicle | 43 (0.4%) | 320 (11.7%) |
| 1 Vehicle | 1,917 (18.2%) | 1,015 (37.2%) |
| 2 Vehicles | 4,031 (38.4%) | 956 (35.0%) |
| 3 or more Vehicles | 4,517 (43.0%) | 440 (16.1%) |
| Total | 10,508 (100.0%) | 2,731 (100.0%) |
Real Estate & Mortgages in Miami County
Real Estate and Mortgage Overview in Miami County
| Characteristic | Without Mortgage | With Mortgage |
| Housing Units | 3,692 | 6,816 |
| Median Property Value | $225,300 | $265,300 |
| Median Household Income | $79,006 | $1,927 |
| Monthly Housing Costs | $685 | $744 |
| Real Estate Taxes | $3,056 | $117 |
Property Value by Mortgage Status in Miami County
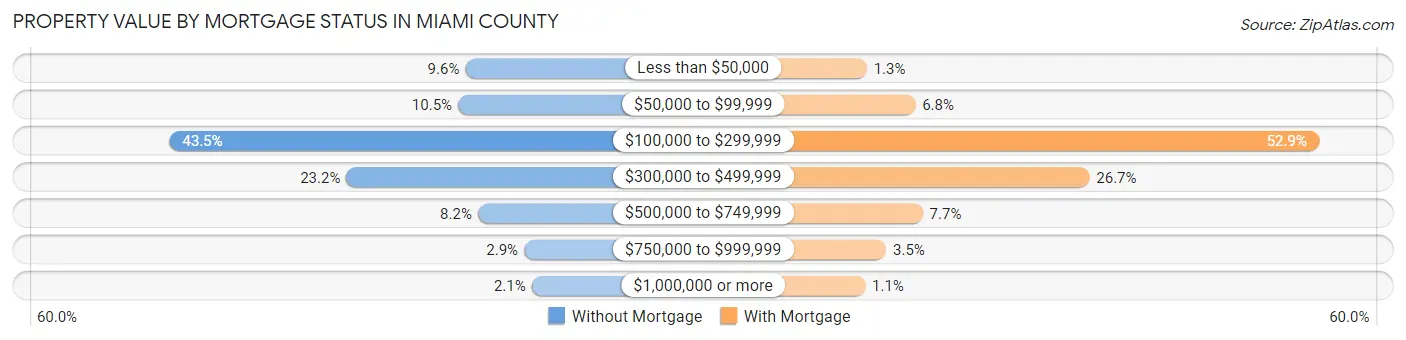
| Property Value | Without Mortgage | With Mortgage |
| Less than $50,000 | 356 (9.6%) | 87 (1.3%) |
| $50,000 to $99,999 | 387 (10.5%) | 465 (6.8%) |
| $100,000 to $299,999 | 1,604 (43.4%) | 3,608 (52.9%) |
| $300,000 to $499,999 | 858 (23.2%) | 1,821 (26.7%) |
| $500,000 to $749,999 | 303 (8.2%) | 523 (7.7%) |
| $750,000 to $999,999 | 108 (2.9%) | 238 (3.5%) |
| $1,000,000 or more | 76 (2.1%) | 74 (1.1%) |
| Total | 3,692 (100.0%) | 6,816 (100.0%) |
Household Income by Mortgage Status in Miami County
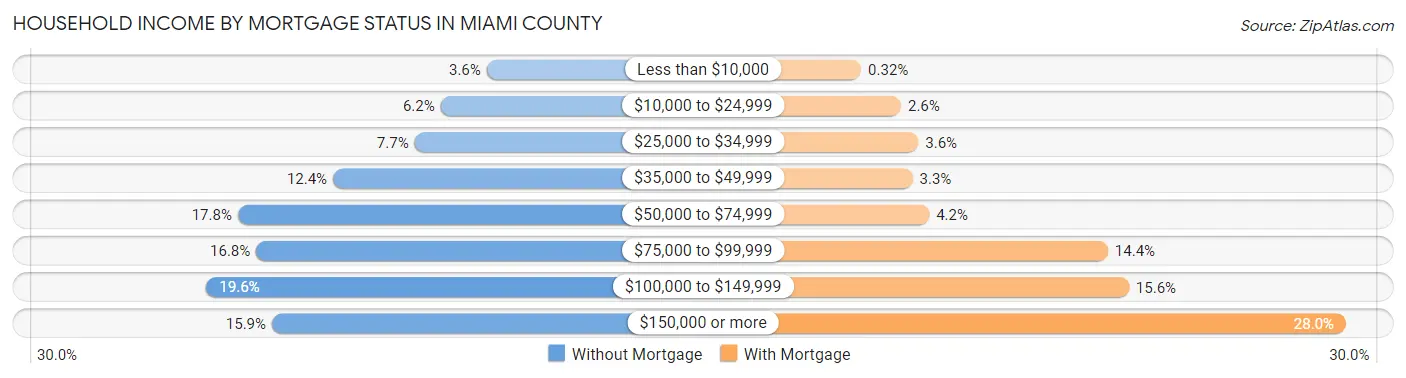
| Household Income | Without Mortgage | With Mortgage |
| Less than $10,000 | 133 (3.6%) | 22 (0.3%) |
| $10,000 to $24,999 | 230 (6.2%) | 177 (2.6%) |
| $25,000 to $34,999 | 285 (7.7%) | 245 (3.6%) |
| $35,000 to $49,999 | 457 (12.4%) | 222 (3.3%) |
| $50,000 to $74,999 | 658 (17.8%) | 287 (4.2%) |
| $75,000 to $99,999 | 619 (16.8%) | 983 (14.4%) |
| $100,000 to $149,999 | 724 (19.6%) | 1,065 (15.6%) |
| $150,000 or more | 586 (15.9%) | 1,910 (28.0%) |
| Total | 3,692 (100.0%) | 6,816 (100.0%) |
Property Value to Household Income Ratio in Miami County
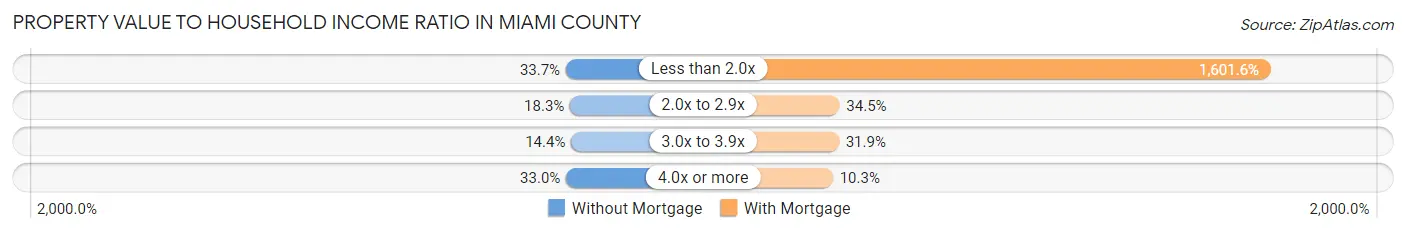
| Value-to-Income Ratio | Without Mortgage | With Mortgage |
| Less than 2.0x | 1,245 (33.7%) | 109,167 (1,601.6%) |
| 2.0x to 2.9x | 677 (18.3%) | 2,350 (34.5%) |
| 3.0x to 3.9x | 533 (14.4%) | 2,177 (31.9%) |
| 4.0x or more | 1,217 (33.0%) | 701 (10.3%) |
| Total | 3,692 (100.0%) | 6,816 (100.0%) |
Real Estate Taxes by Mortgage Status in Miami County
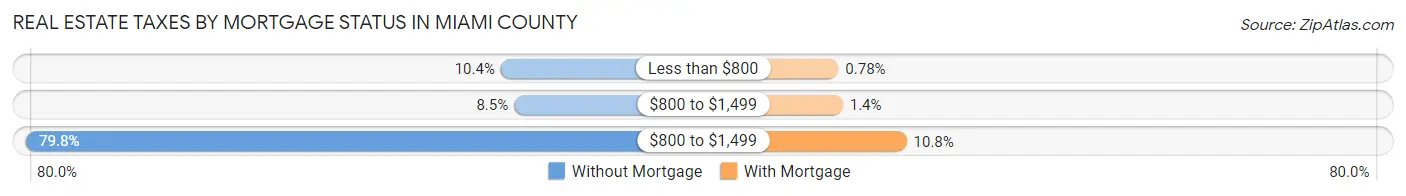
| Property Taxes | Without Mortgage | With Mortgage |
| Less than $800 | 385 (10.4%) | 53 (0.8%) |
| $800 to $1,499 | 313 (8.5%) | 97 (1.4%) |
| $800 to $1,499 | 2,945 (79.8%) | 733 (10.7%) |
| Total | 3,692 (100.0%) | 6,816 (100.0%) |
Health & Disability in Miami County
Health Insurance Coverage by Age in Miami County
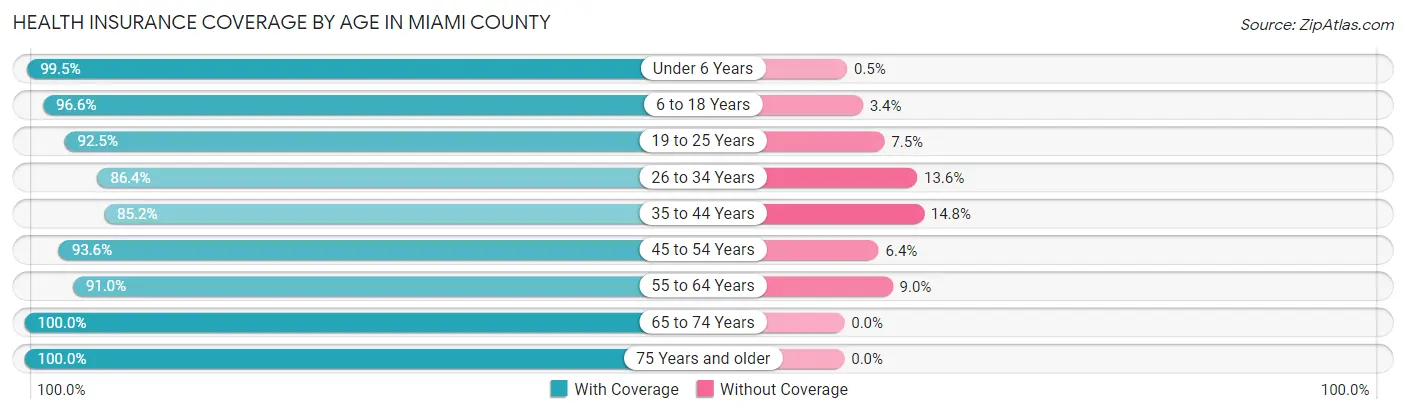
| Age Bracket | With Coverage | Without Coverage |
| Under 6 Years | 2,207 (99.5%) | 11 (0.5%) |
| 6 to 18 Years | 5,984 (96.6%) | 213 (3.4%) |
| 19 to 25 Years | 2,550 (92.5%) | 206 (7.5%) |
| 26 to 34 Years | 2,515 (86.4%) | 395 (13.6%) |
| 35 to 44 Years | 3,572 (85.2%) | 622 (14.8%) |
| 45 to 54 Years | 4,161 (93.6%) | 284 (6.4%) |
| 55 to 64 Years | 4,694 (91.0%) | 465 (9.0%) |
| 65 to 74 Years | 3,375 (100.0%) | 0 (0.0%) |
| 75 Years and older | 2,383 (100.0%) | 0 (0.0%) |
| Total | 31,441 (93.5%) | 2,196 (6.5%) |
Health Insurance Coverage by Citizenship Status in Miami County
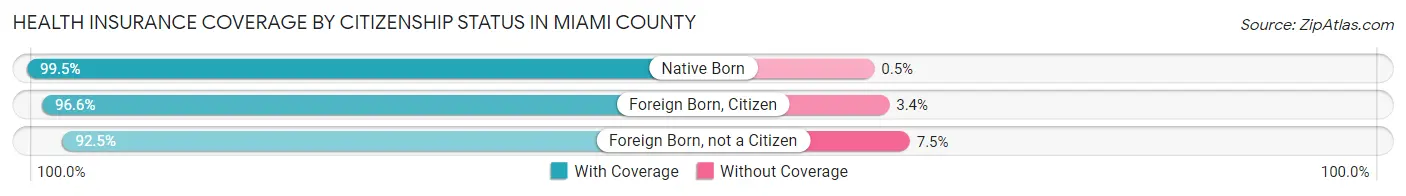
| Citizenship Status | With Coverage | Without Coverage |
| Native Born | 2,207 (99.5%) | 11 (0.5%) |
| Foreign Born, Citizen | 5,984 (96.6%) | 213 (3.4%) |
| Foreign Born, not a Citizen | 2,550 (92.5%) | 206 (7.5%) |
Health Insurance Coverage by Household Income in Miami County
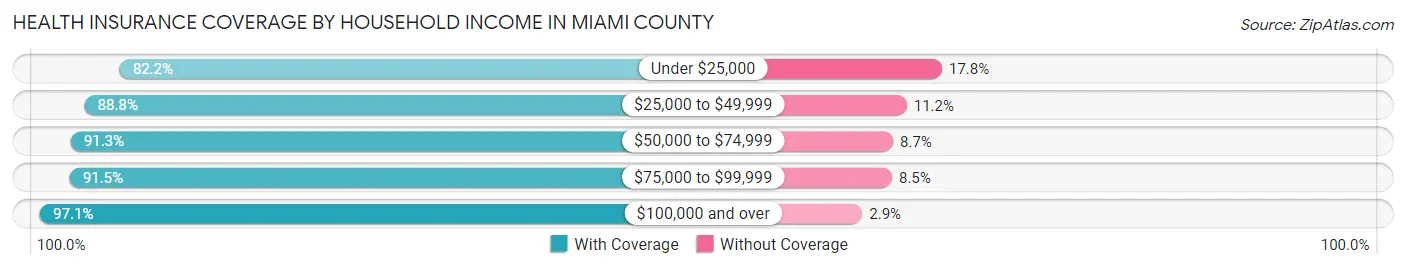
| Household Income | With Coverage | Without Coverage |
| Under $25,000 | 1,819 (82.2%) | 395 (17.8%) |
| $25,000 to $49,999 | 2,954 (88.8%) | 374 (11.2%) |
| $50,000 to $74,999 | 4,448 (91.3%) | 422 (8.7%) |
| $75,000 to $99,999 | 5,447 (91.5%) | 505 (8.5%) |
| $100,000 and over | 16,603 (97.1%) | 499 (2.9%) |
Public vs Private Health Insurance Coverage by Age in Miami County
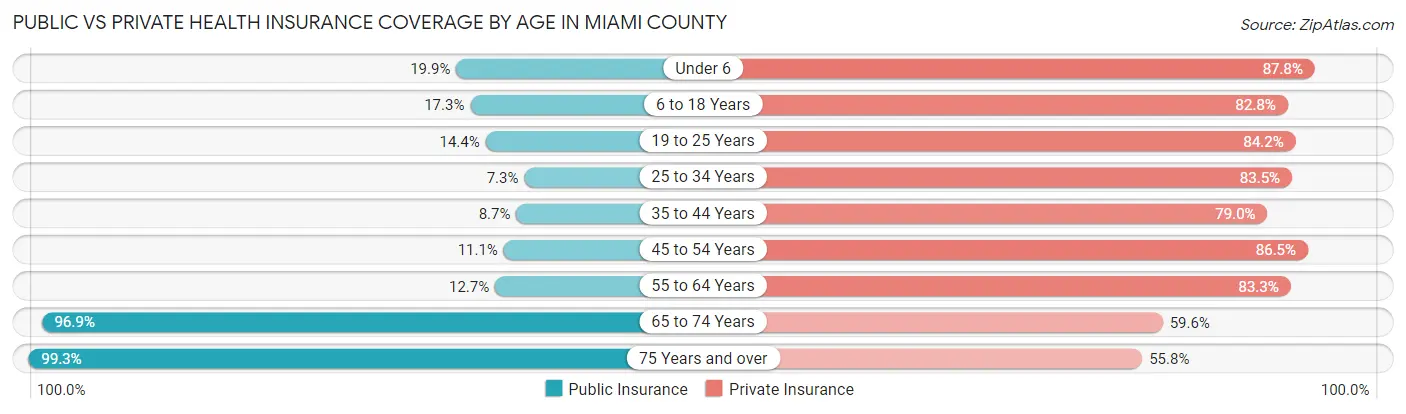
| Age Bracket | Public Insurance | Private Insurance |
| Under 6 | 441 (19.9%) | 1,947 (87.8%) |
| 6 to 18 Years | 1,071 (17.3%) | 5,128 (82.8%) |
| 19 to 25 Years | 398 (14.4%) | 2,321 (84.2%) |
| 25 to 34 Years | 211 (7.2%) | 2,431 (83.5%) |
| 35 to 44 Years | 366 (8.7%) | 3,313 (79.0%) |
| 45 to 54 Years | 492 (11.1%) | 3,845 (86.5%) |
| 55 to 64 Years | 654 (12.7%) | 4,297 (83.3%) |
| 65 to 74 Years | 3,269 (96.9%) | 2,010 (59.6%) |
| 75 Years and over | 2,366 (99.3%) | 1,329 (55.8%) |
| Total | 9,268 (27.6%) | 26,621 (79.1%) |
Disability Status by Sex by Age in Miami County
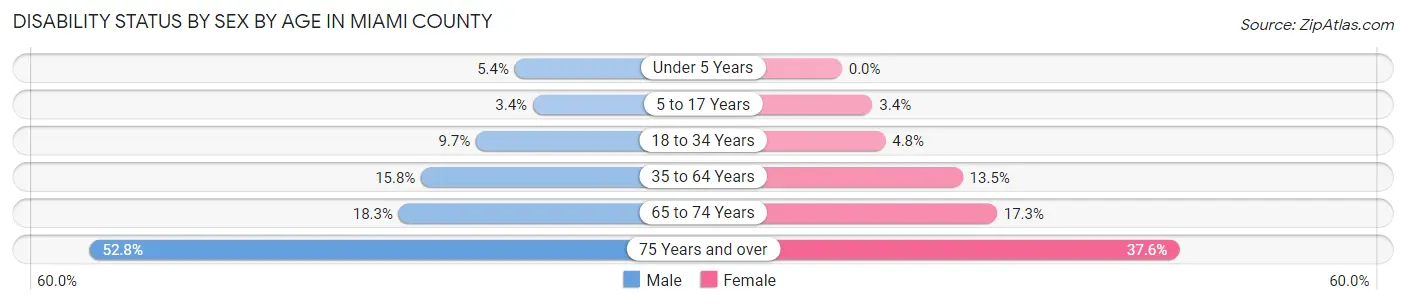
| Age Bracket | Male | Female |
| Under 5 Years | 50 (5.4%) | 0 (0.0%) |
| 5 to 17 Years | 107 (3.4%) | 104 (3.4%) |
| 18 to 34 Years | 301 (9.7%) | 142 (4.8%) |
| 35 to 64 Years | 1,129 (15.8%) | 897 (13.5%) |
| 65 to 74 Years | 299 (18.3%) | 301 (17.3%) |
| 75 Years and over | 545 (52.8%) | 507 (37.6%) |
Disability Class by Sex by Age in Miami County
Disability Class: Hearing Difficulty
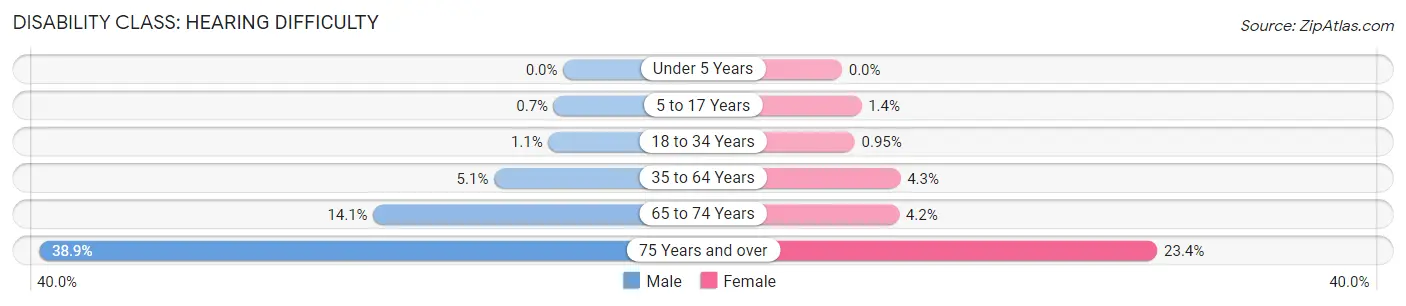
| Age Bracket | Male | Female |
| Under 5 Years | 0 (0.0%) | 0 (0.0%) |
| 5 to 17 Years | 22 (0.7%) | 44 (1.4%) |
| 18 to 34 Years | 34 (1.1%) | 28 (0.9%) |
| 35 to 64 Years | 366 (5.1%) | 289 (4.3%) |
| 65 to 74 Years | 230 (14.1%) | 74 (4.2%) |
| 75 Years and over | 402 (38.9%) | 316 (23.4%) |
Disability Class: Vision Difficulty
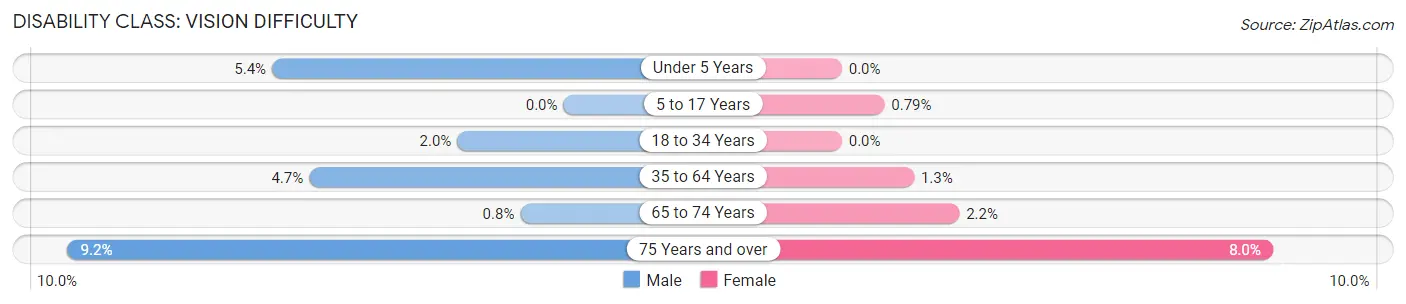
| Age Bracket | Male | Female |
| Under 5 Years | 50 (5.4%) | 0 (0.0%) |
| 5 to 17 Years | 0 (0.0%) | 24 (0.8%) |
| 18 to 34 Years | 61 (2.0%) | 0 (0.0%) |
| 35 to 64 Years | 337 (4.7%) | 89 (1.3%) |
| 65 to 74 Years | 13 (0.8%) | 38 (2.2%) |
| 75 Years and over | 95 (9.2%) | 108 (8.0%) |
Disability Class: Cognitive Difficulty
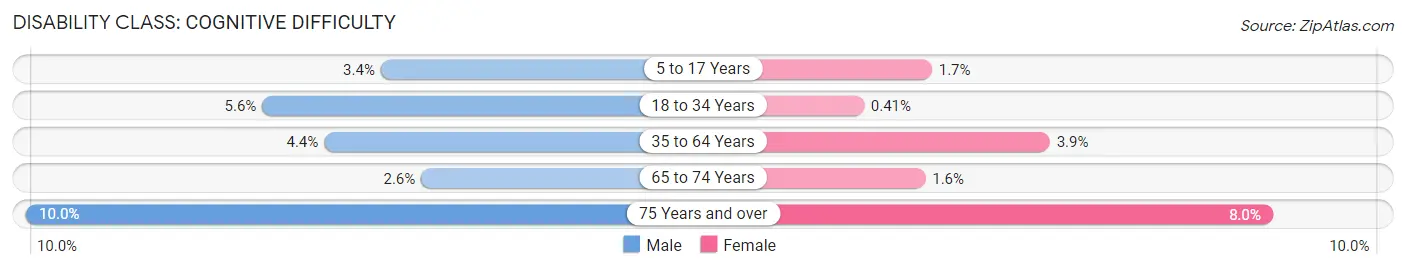
| Age Bracket | Male | Female |
| 5 to 17 Years | 107 (3.4%) | 51 (1.7%) |
| 18 to 34 Years | 173 (5.6%) | 12 (0.4%) |
| 35 to 64 Years | 317 (4.4%) | 257 (3.9%) |
| 65 to 74 Years | 43 (2.6%) | 27 (1.5%) |
| 75 Years and over | 103 (10.0%) | 108 (8.0%) |
Disability Class: Ambulatory Difficulty
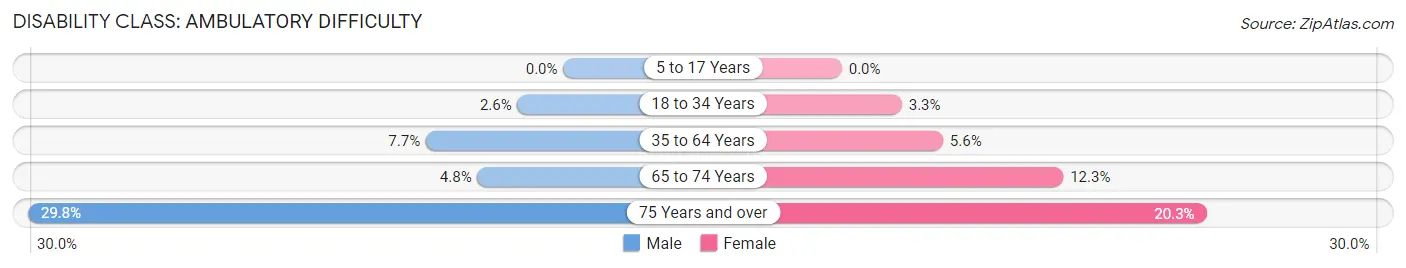
| Age Bracket | Male | Female |
| 5 to 17 Years | 0 (0.0%) | 0 (0.0%) |
| 18 to 34 Years | 79 (2.5%) | 98 (3.3%) |
| 35 to 64 Years | 546 (7.6%) | 375 (5.6%) |
| 65 to 74 Years | 78 (4.8%) | 215 (12.3%) |
| 75 Years and over | 308 (29.8%) | 274 (20.3%) |
Disability Class: Self-Care Difficulty
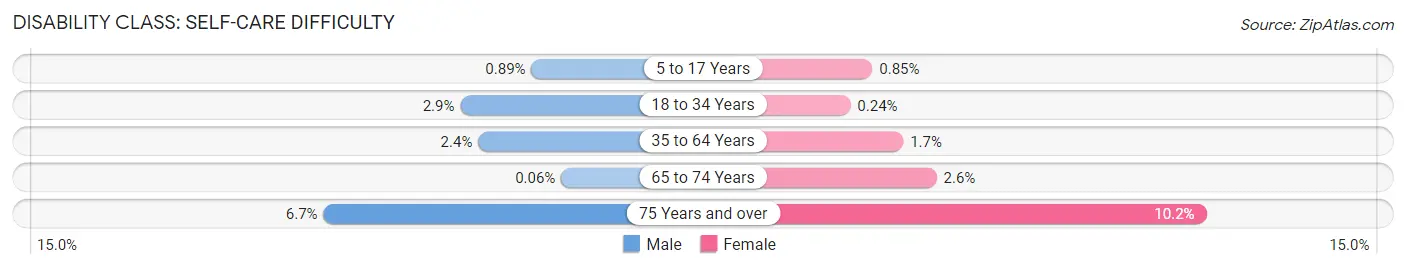
| Age Bracket | Male | Female |
| 5 to 17 Years | 28 (0.9%) | 26 (0.9%) |
| 18 to 34 Years | 89 (2.9%) | 7 (0.2%) |
| 35 to 64 Years | 169 (2.4%) | 114 (1.7%) |
| 65 to 74 Years | 1 (0.1%) | 46 (2.6%) |
| 75 Years and over | 69 (6.7%) | 137 (10.2%) |
Technology Access in Miami County
Computing Device Access in Miami County
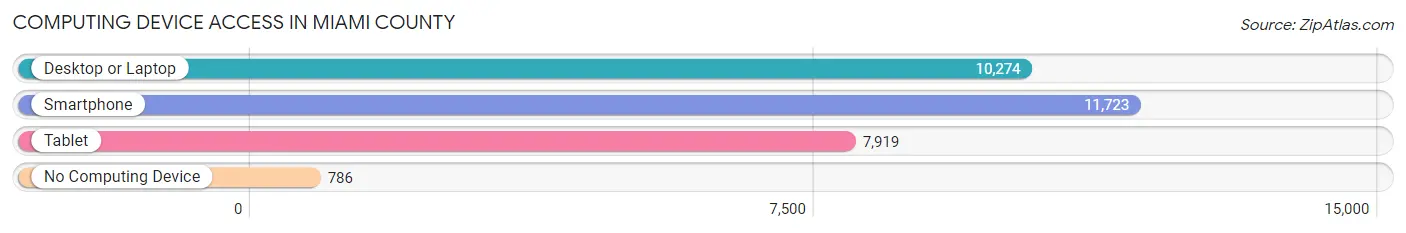
| Device Type | # Households | % Households |
| Desktop or Laptop | 10,274 | 77.6% |
| Smartphone | 11,723 | 88.5% |
| Tablet | 7,919 | 59.8% |
| No Computing Device | 786 | 5.9% |
| Total | 13,239 | 100.0% |
Internet Access in Miami County
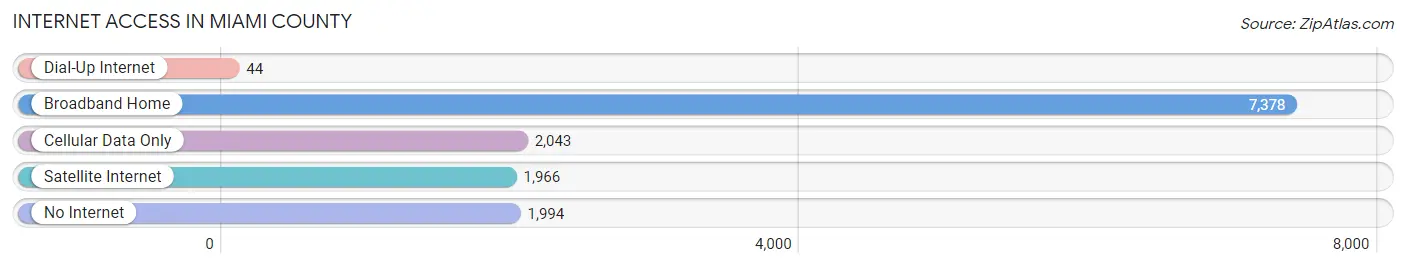
| Internet Type | # Households | % Households |
| Dial-Up Internet | 44 | 0.3% |
| Broadband Home | 7,378 | 55.7% |
| Cellular Data Only | 2,043 | 15.4% |
| Satellite Internet | 1,966 | 14.8% |
| No Internet | 1,994 | 15.1% |
| Total | 13,239 | 100.0% |
Miami County Summary
History
Miami County, Kansas is located in the east-central part of the state and is part of the Kansas City metropolitan area. The county was established in 1855 and named after the Miami Native American tribe. The county seat is Paola, which was founded in 1857.
The first settlers in the area were mostly of German and Irish descent. They were attracted to the area by the fertile soil and the abundance of natural resources. The county was an important agricultural center in the 19th century, and the county seat of Paola was a major trading center.
The county was also an important stop on the Santa Fe Trail, which was used by settlers and traders traveling between Missouri and New Mexico. The trail was used until the late 19th century, when the railroad replaced it as the main form of transportation.
The county was also home to several Native American tribes, including the Miami, Osage, and Shawnee. The tribes were forcibly removed from the area in the 1830s and 1840s, and the land was opened up for settlement.
Geography
Miami County is located in east-central Kansas and is part of the Kansas City metropolitan area. The county covers an area of 576 square miles and is bordered by Johnson County to the north, Franklin County to the east, Linn County to the south, and Anderson and Coffey counties to the west.
The county is mostly flat, with some rolling hills in the northern and eastern parts. The county is drained by the Marais des Cygnes River, which flows through the county from north to south. The county is also home to several small lakes, including Lake Miola and Lake Pomona.
The county is mostly rural, with the majority of the population living in small towns and rural areas. The largest city in the county is Paola, which is the county seat. Other cities in the county include Osawatomie, Louisburg, and Fontana.
Economy
Miami County is primarily an agricultural county, with the majority of the population employed in farming and related industries. The county is home to several large farms, and the main crops grown in the county are corn, soybeans, wheat, and hay.
The county is also home to several manufacturing companies, including a large poultry processing plant and a furniture factory. The county is also home to several small businesses, including restaurants, retail stores, and service providers.
The county is also home to several tourist attractions, including the Miami County Historical Museum and the Miami County Fairgrounds. The county is also home to several parks, including the Miami County Park and the Osawatomie State Park.
Demographics
As of the 2010 census, the population of Miami County was 33,061. The population is mostly white (90.2%), with small percentages of African Americans (2.3%), Hispanics (2.2%), and Asians (1.2%). The median household income in the county is $50,845, and the median home value is $128,400.
The county is home to several colleges and universities, including the University of Kansas, Kansas State University, and Johnson County Community College. The county is also home to several public schools, including Paola High School, Osawatomie High School, and Louisburg High School.
Common Questions
What is the Total Population of Miami County?
Total Population of Miami County is 34,312.
What is the Total Male Population of Miami County?
Total Male Population of Miami County is 17,443.
What is the Total Female Population of Miami County?
Total Female Population of Miami County is 16,869.
What is the Ratio of Males per 100 Females in Miami County?
There are 103.40 Males per 100 Females in Miami County.
What is the Ratio of Females per 100 Males in Miami County?
There are 96.71 Females per 100 Males in Miami County.
What is the Median Population Age in Miami County?
Median Population Age in Miami County is 42.5 Years.
What is the Average Family Size in Miami County
Average Family Size in Miami County is 3.0 People.
What is the Average Household Size in Miami County
Average Household Size in Miami County is 2.5 People.
What is Per Capita Income in Miami County?
Per Capita income in Miami County is $40,169.
What is the Median Family Income in Miami County?
Median Family Income in Miami County is $101,265.
What is the Median Household income in Miami County?
Median Household Income in Miami County is $85,564.
What is Income or Wage Gap in Miami County?
Income or Wage Gap in Miami County is 34.6%.
Women in Miami County earn 65.4 cents for every dollar earned by a man.
What is Family Income Deficit in Miami County?
Family Income Deficit in Miami County is $8,611.
Families that are below poverty line in Miami County earn $8,611 less on average than the poverty threshold level.
What is Inequality or Gini Index in Miami County?
Inequality or Gini Index in Miami County is 0.40.
How Large is the Labor Force in Miami County?
There are 17,654 People in the Labor Forcein in Miami County.
What is the Percentage of People in the Labor Force in Miami County?
64.7% of People are in the Labor Force in Miami County.
What is the Unemployment Rate in Miami County?
Unemployment Rate in Miami County is 2.8%.