Lyon County, KS
Lyon County Map
Lyon County Overview
32,182
TOTAL POPULATION
15,699
MALE POPULATION
16,483
FEMALE POPULATION
95.24
MALES / 100 FEMALES
104.99
FEMALES / 100 MALES
32.9
MEDIAN AGE
3.0
AVG FAMILY SIZE
2.4
AVG HOUSEHOLD SIZE
$29,425
PER CAPITA INCOME
$74,923
AVG FAMILY INCOME
$56,415
AVG HOUSEHOLD INCOME
39.8%
WAGE / INCOME GAP [ % ]
60.2¢/ $1
WAGE / INCOME GAP [ $ ]
$11,341
FAMILY INCOME DEFICIT
0.43
INEQUALITY / GINI INDEX
17,608
LABOR FORCE [ PEOPLE ]
68.2%
PERCENT IN LABOR FORCE
2.7%
UNEMPLOYMENT RATE
Lyon County Area Codes
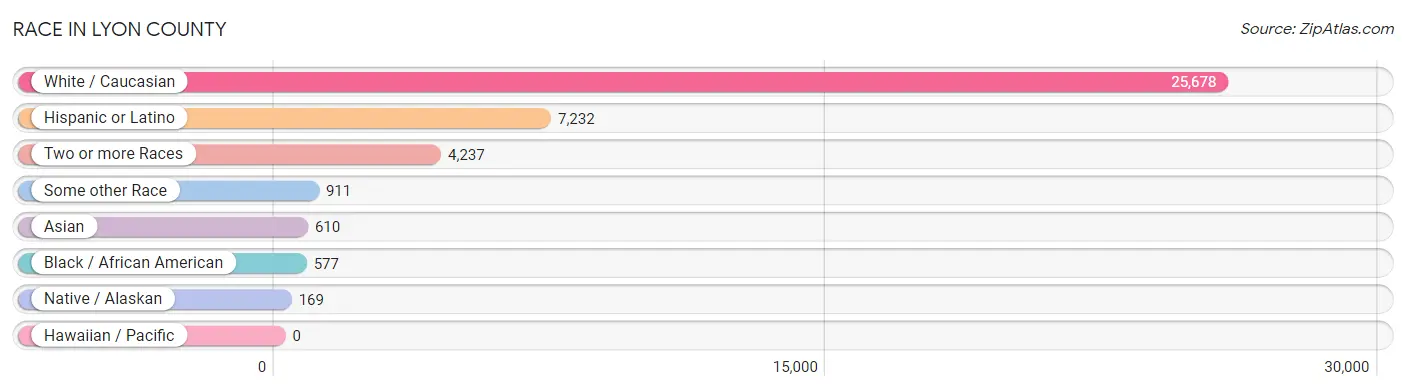
Race in Lyon County
The most populous races in Lyon County are White / Caucasian (25,678 | 79.8%), Hispanic or Latino (7,232 | 22.5%), and Two or more Races (4,237 | 13.2%).
| Race | # Population | % Population |
| Asian | 610 | 1.9% |
| Black / African American | 577 | 1.8% |
| Hawaiian / Pacific | 0 | 0.0% |
| Hispanic or Latino | 7,232 | 22.5% |
| Native / Alaskan | 169 | 0.5% |
| White / Caucasian | 25,678 | 79.8% |
| Two or more Races | 4,237 | 13.2% |
| Some other Race | 911 | 2.8% |
| Total | 32,182 | 100.0% |
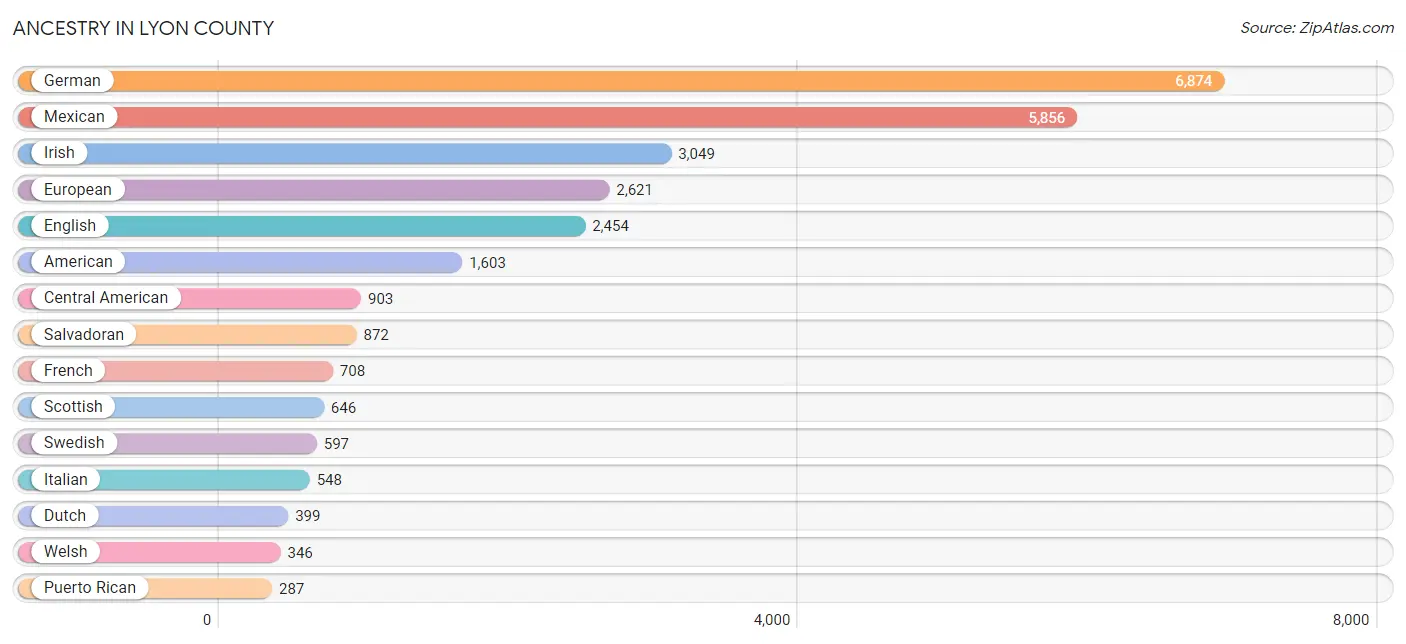
Ancestry in Lyon County
The most populous ancestries reported in Lyon County are German (6,874 | 21.4%), Mexican (5,856 | 18.2%), Irish (3,049 | 9.5%), European (2,621 | 8.1%), and English (2,454 | 7.6%), together accounting for 64.8% of all Lyon County residents.
| Ancestry | # Population | % Population |
| African | 6 | 0.0% |
| Albanian | 2 | 0.0% |
| American | 1,603 | 5.0% |
| Austrian | 89 | 0.3% |
| Bhutanese | 143 | 0.4% |
| Blackfeet | 25 | 0.1% |
| Bolivian | 7 | 0.0% |
| British | 115 | 0.4% |
| Burmese | 7 | 0.0% |
| Canadian | 10 | 0.0% |
| Central American | 903 | 2.8% |
| Cherokee | 240 | 0.7% |
| Chippewa | 15 | 0.1% |
| Choctaw | 18 | 0.1% |
| Costa Rican | 1 | 0.0% |
| Creek | 1 | 0.0% |
| Croatian | 55 | 0.2% |
| Cuban | 58 | 0.2% |
| Czech | 128 | 0.4% |
| Czechoslovakian | 23 | 0.1% |
| Danish | 115 | 0.4% |
| Delaware | 46 | 0.1% |
| Dutch | 399 | 1.2% |
| Eastern European | 56 | 0.2% |
| English | 2,454 | 7.6% |
| European | 2,621 | 8.1% |
| French | 708 | 2.2% |
| French American Indian | 2 | 0.0% |
| French Canadian | 74 | 0.2% |
| German | 6,874 | 21.4% |
| Guatemalan | 30 | 0.1% |
| Hungarian | 50 | 0.2% |
| Indian (Asian) | 136 | 0.4% |
| Irish | 3,049 | 9.5% |
| Iroquois | 1 | 0.0% |
| Italian | 548 | 1.7% |
| Kiowa | 1 | 0.0% |
| Korean | 243 | 0.8% |
| Luxembourger | 8 | 0.0% |
| Malaysian | 46 | 0.1% |
| Mexican | 5,856 | 18.2% |
| Mexican American Indian | 119 | 0.4% |
| Navajo | 10 | 0.0% |
| Nigerian | 10 | 0.0% |
| Northern European | 10 | 0.0% |
| Norwegian | 156 | 0.5% |
| Osage | 89 | 0.3% |
| Pakistani | 28 | 0.1% |
| Pennsylvania German | 36 | 0.1% |
| Peruvian | 22 | 0.1% |
| Polish | 193 | 0.6% |
| Potawatomi | 15 | 0.1% |
| Pueblo | 17 | 0.1% |
| Puerto Rican | 287 | 0.9% |
| Russian | 34 | 0.1% |
| Salvadoran | 872 | 2.7% |
| Scandinavian | 31 | 0.1% |
| Scotch-Irish | 139 | 0.4% |
| Scottish | 646 | 2.0% |
| Sioux | 8 | 0.0% |
| South American | 62 | 0.2% |
| Spaniard | 50 | 0.2% |
| Spanish | 9 | 0.0% |
| Sri Lankan | 187 | 0.6% |
| Subsaharan African | 16 | 0.1% |
| Swedish | 597 | 1.9% |
| Swiss | 141 | 0.4% |
| Thai | 207 | 0.6% |
| Venezuelan | 33 | 0.1% |
| Welsh | 346 | 1.1% | View All 70 Rows |
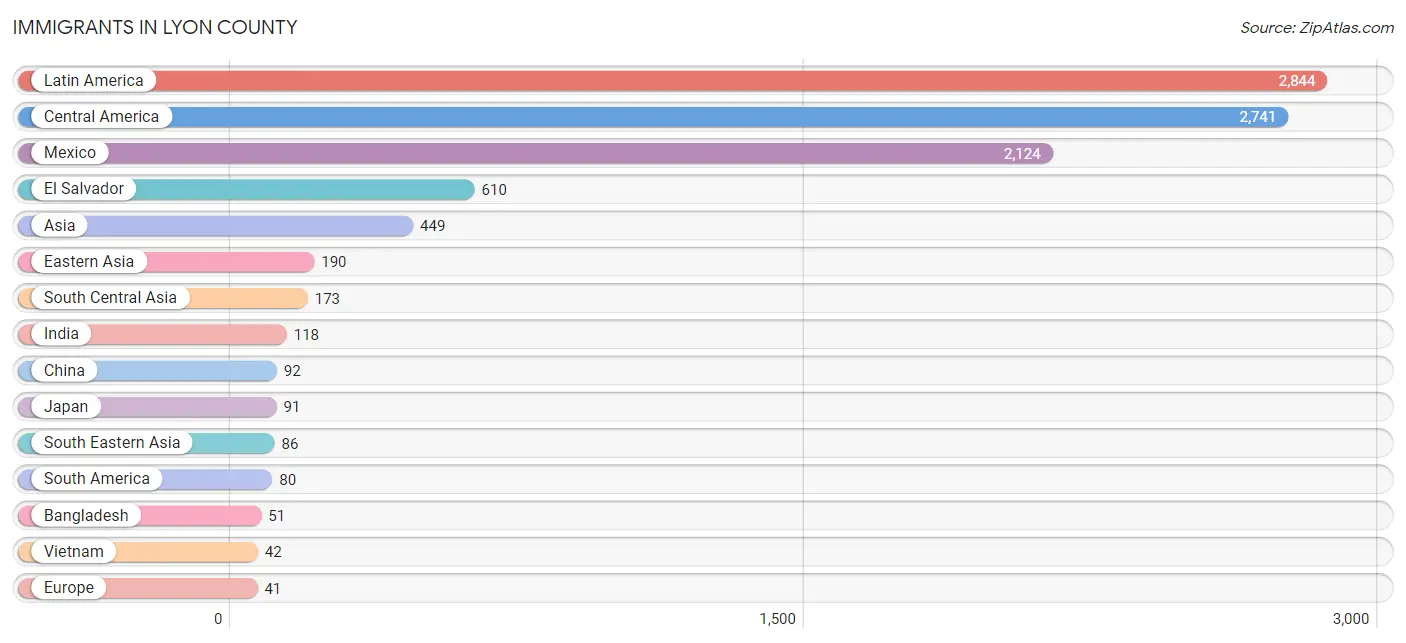
Immigrants in Lyon County
The most numerous immigrant groups reported in Lyon County came from Latin America (2,844 | 8.8%), Central America (2,741 | 8.5%), Mexico (2,124 | 6.6%), El Salvador (610 | 1.9%), and Asia (449 | 1.4%), together accounting for 27.3% of all Lyon County residents.
| Immigration Origin | # Population | % Population |
| Africa | 10 | 0.0% |
| Asia | 449 | 1.4% |
| Bahamas | 5 | 0.0% |
| Bangladesh | 51 | 0.2% |
| Bolivia | 7 | 0.0% |
| Caribbean | 23 | 0.1% |
| Central America | 2,741 | 8.5% |
| China | 92 | 0.3% |
| Costa Rica | 1 | 0.0% |
| Cuba | 11 | 0.0% |
| Eastern Asia | 190 | 0.6% |
| Eastern Europe | 10 | 0.0% |
| Ecuador | 17 | 0.1% |
| El Salvador | 610 | 1.9% |
| England | 1 | 0.0% |
| Europe | 41 | 0.1% |
| Germany | 30 | 0.1% |
| Guatemala | 6 | 0.0% |
| India | 118 | 0.4% |
| Japan | 91 | 0.3% |
| Korea | 7 | 0.0% |
| Laos | 20 | 0.1% |
| Latin America | 2,844 | 8.8% |
| Mexico | 2,124 | 6.6% |
| Nigeria | 10 | 0.0% |
| Northern Europe | 1 | 0.0% |
| Peru | 23 | 0.1% |
| Philippines | 24 | 0.1% |
| Russia | 10 | 0.0% |
| South America | 80 | 0.3% |
| South Central Asia | 173 | 0.5% |
| South Eastern Asia | 86 | 0.3% |
| Sri Lanka | 4 | 0.0% |
| Venezuela | 33 | 0.1% |
| Vietnam | 42 | 0.1% |
| Western Africa | 10 | 0.0% |
| Western Europe | 30 | 0.1% | View All 37 Rows |
Sex and Age in Lyon County
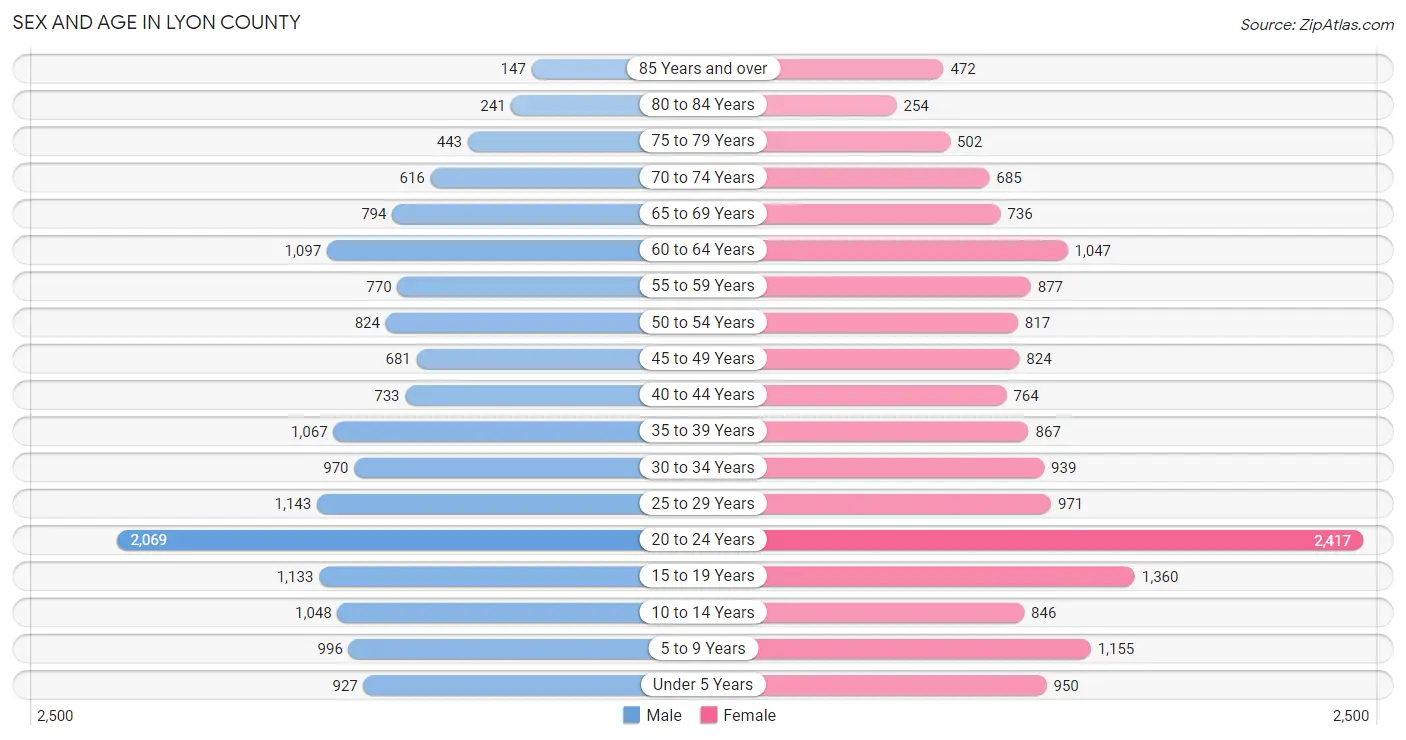
Sex and Age in Lyon County
The most populous age groups in Lyon County are 20 to 24 Years (2,069 | 13.2%) for men and 20 to 24 Years (2,417 | 14.7%) for women.
| Age Bracket | Male | Female |
| Under 5 Years | 927 (5.9%) | 950 (5.8%) |
| 5 to 9 Years | 996 (6.3%) | 1,155 (7.0%) |
| 10 to 14 Years | 1,048 (6.7%) | 846 (5.1%) |
| 15 to 19 Years | 1,133 (7.2%) | 1,360 (8.3%) |
| 20 to 24 Years | 2,069 (13.2%) | 2,417 (14.7%) |
| 25 to 29 Years | 1,143 (7.3%) | 971 (5.9%) |
| 30 to 34 Years | 970 (6.2%) | 939 (5.7%) |
| 35 to 39 Years | 1,067 (6.8%) | 867 (5.3%) |
| 40 to 44 Years | 733 (4.7%) | 764 (4.6%) |
| 45 to 49 Years | 681 (4.3%) | 824 (5.0%) |
| 50 to 54 Years | 824 (5.2%) | 817 (5.0%) |
| 55 to 59 Years | 770 (4.9%) | 877 (5.3%) |
| 60 to 64 Years | 1,097 (7.0%) | 1,047 (6.4%) |
| 65 to 69 Years | 794 (5.1%) | 736 (4.5%) |
| 70 to 74 Years | 616 (3.9%) | 685 (4.2%) |
| 75 to 79 Years | 443 (2.8%) | 502 (3.0%) |
| 80 to 84 Years | 241 (1.5%) | 254 (1.5%) |
| 85 Years and over | 147 (0.9%) | 472 (2.9%) |
| Total | 15,699 (100.0%) | 16,483 (100.0%) |
Families and Households in Lyon County
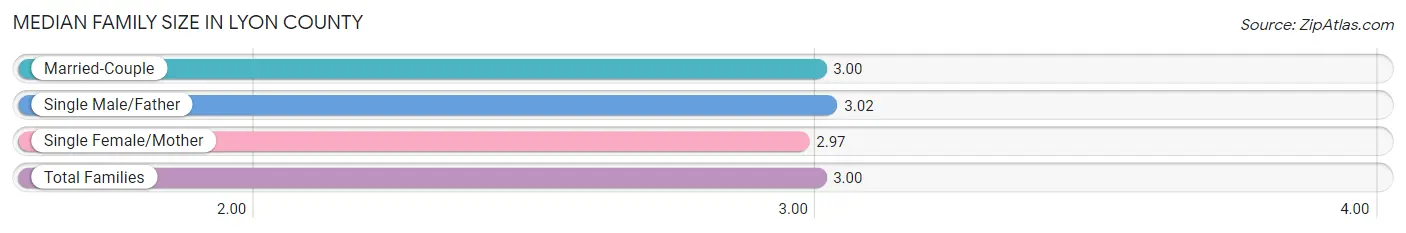
Median Family Size in Lyon County
The median family size in Lyon County is 3.00 persons per family, with single male/father families (649 | 8.6%) accounting for the largest median family size of 3.02 persons per family. On the other hand, single female/mother families (1,037 | 13.7%) represent the smallest median family size with 2.97 persons per family.
| Family Type | # Families | Family Size |
| Married-Couple | 5,900 (77.8%) | 3.00 |
| Single Male/Father | 649 (8.6%) | 3.02 |
| Single Female/Mother | 1,037 (13.7%) | 2.97 |
| Total Families | 7,586 (100.0%) | 3.00 |
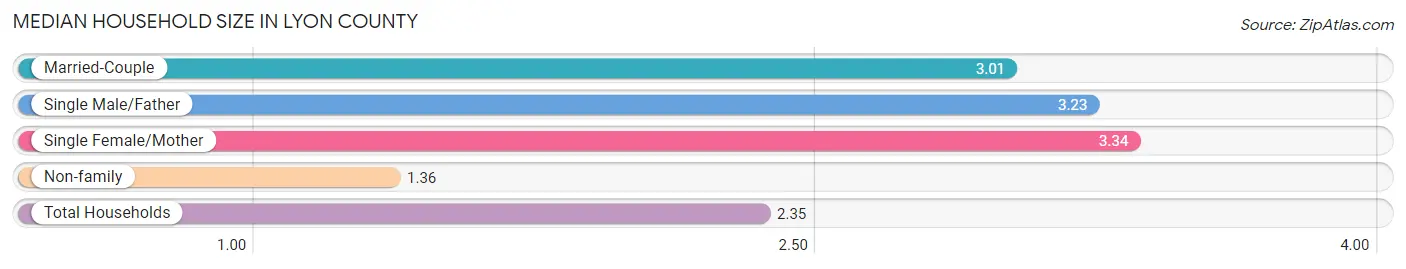
Median Household Size in Lyon County
The median household size in Lyon County is 2.35 persons per household, with single female/mother households (1,037 | 7.8%) accounting for the largest median household size of 3.34 persons per household. non-family households (5,637 | 42.6%) represent the smallest median household size with 1.36 persons per household.
| Household Type | # Households | Household Size |
| Married-Couple | 5,900 (44.6%) | 3.01 |
| Single Male/Father | 649 (4.9%) | 3.23 |
| Single Female/Mother | 1,037 (7.8%) | 3.34 |
| Non-family | 5,637 (42.6%) | 1.36 |
| Total Households | 13,223 (100.0%) | 2.35 |
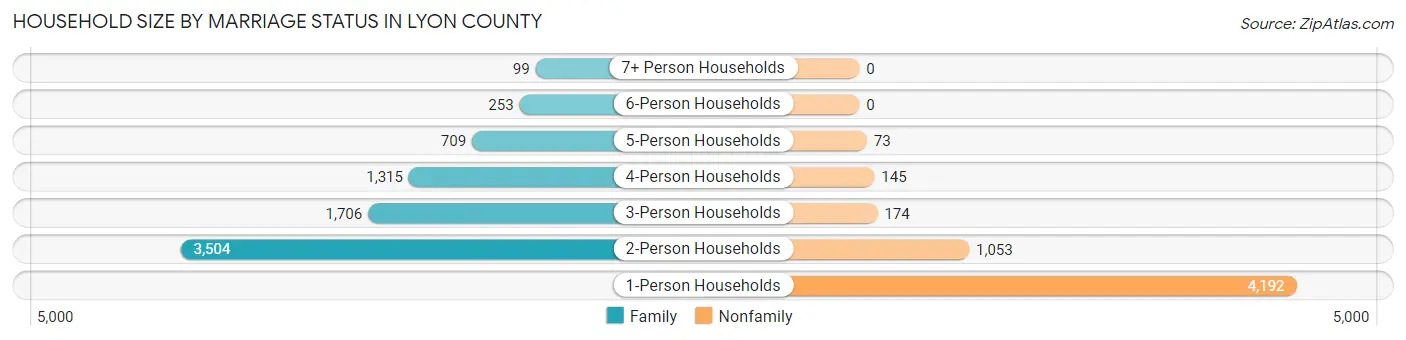
Household Size by Marriage Status in Lyon County
Out of a total of 13,223 households in Lyon County, 7,586 (57.4%) are family households, while 5,637 (42.6%) are nonfamily households. The most numerous type of family households are 2-person households, comprising 3,504, and the most common type of nonfamily households are 1-person households, comprising 4,192.
| Household Size | Family Households | Nonfamily Households |
| 1-Person Households | - | 4,192 (31.7%) |
| 2-Person Households | 3,504 (26.5%) | 1,053 (8.0%) |
| 3-Person Households | 1,706 (12.9%) | 174 (1.3%) |
| 4-Person Households | 1,315 (9.9%) | 145 (1.1%) |
| 5-Person Households | 709 (5.4%) | 73 (0.5%) |
| 6-Person Households | 253 (1.9%) | 0 (0.0%) |
| 7+ Person Households | 99 (0.7%) | 0 (0.0%) |
| Total | 7,586 (57.4%) | 5,637 (42.6%) |
Female Fertility in Lyon County
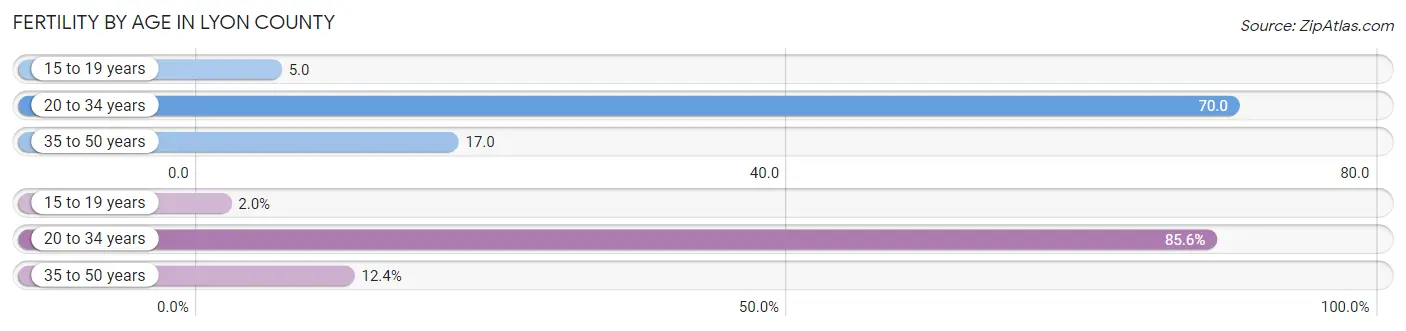
Fertility by Age in Lyon County
Average fertility rate in Lyon County is 42.0 births per 1,000 women. Women in the age bracket of 20 to 34 years have the highest fertility rate with 70.0 births per 1,000 women. Women in the age bracket of 20 to 34 years acount for 85.6% of all women with births.
| Age Bracket | Women with Births | Births / 1,000 Women |
| 15 to 19 years | 7 (2.0%) | 5.0 |
| 20 to 34 years | 303 (85.6%) | 70.0 |
| 35 to 50 years | 44 (12.4%) | 17.0 |
| Total | 354 (100.0%) | 42.0 |
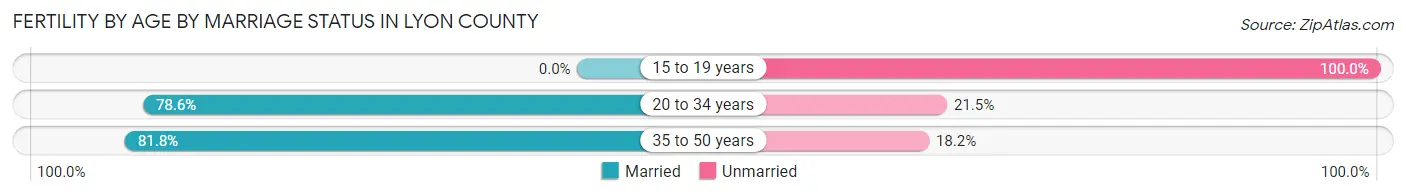
Fertility by Age by Marriage Status in Lyon County
77.4% of women with births (354) in Lyon County are married. The highest percentage of unmarried women with births falls into 15 to 19 years age bracket with 100.0% of them unmarried at the time of birth, while the lowest percentage of unmarried women with births belong to 35 to 50 years age bracket with 18.2% of them unmarried.
| Age Bracket | Married | Unmarried |
| 15 to 19 years | 0 (0.0%) | 7 (100.0%) |
| 20 to 34 years | 238 (78.5%) | 65 (21.4%) |
| 35 to 50 years | 36 (81.8%) | 8 (18.2%) |
| Total | 274 (77.4%) | 80 (22.6%) |
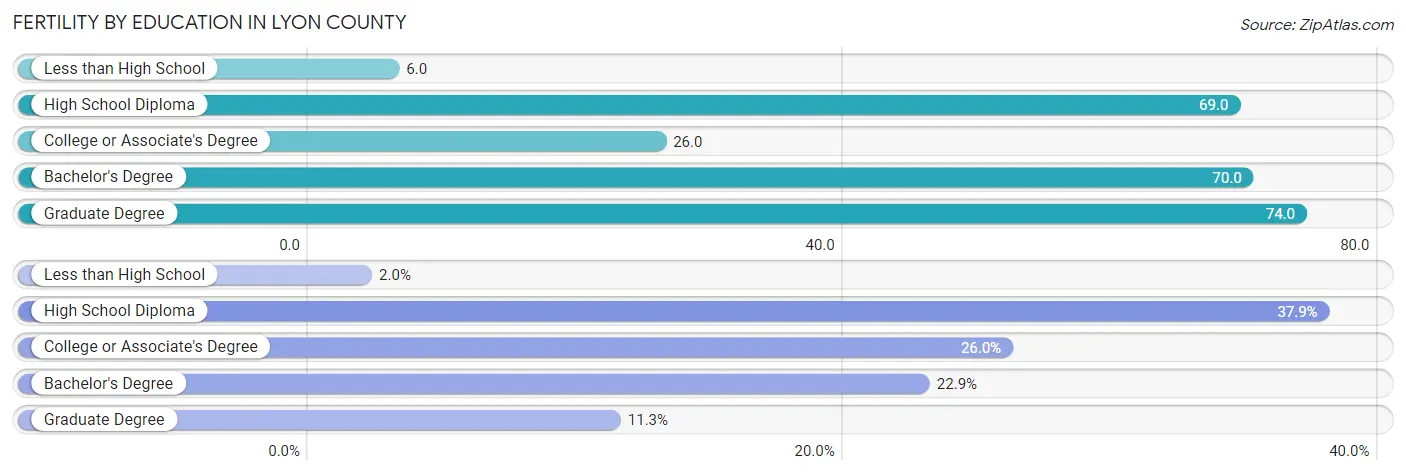
Fertility by Education in Lyon County
Average fertility rate in Lyon County is 42.0 births per 1,000 women. Women with the education attainment of graduate degree have the highest fertility rate of 74.0 births per 1,000 women, while women with the education attainment of less than high school have the lowest fertility at 6.0 births per 1,000 women. Women with the education attainment of high school diploma represent 37.9% of all women with births.
| Educational Attainment | Women with Births | Births / 1,000 Women |
| Less than High School | 7 (2.0%) | 6.0 |
| High School Diploma | 134 (37.9%) | 69.0 |
| College or Associate's Degree | 92 (26.0%) | 26.0 |
| Bachelor's Degree | 81 (22.9%) | 70.0 |
| Graduate Degree | 40 (11.3%) | 74.0 |
| Total | 354 (100.0%) | 42.0 |
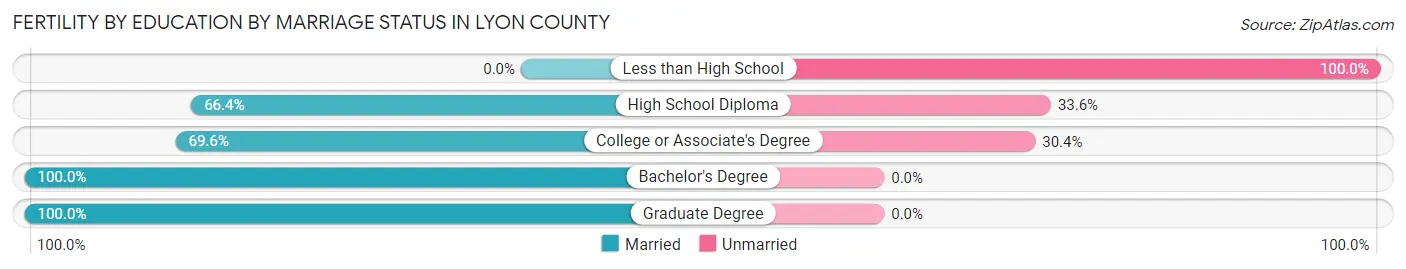
Fertility by Education by Marriage Status in Lyon County
22.6% of women with births in Lyon County are unmarried. Women with the educational attainment of bachelor's degree are most likely to be married with 100.0% of them married at childbirth, while women with the educational attainment of less than high school are least likely to be married with 100.0% of them unmarried at childbirth.
| Educational Attainment | Married | Unmarried |
| Less than High School | 0 (0.0%) | 7 (100.0%) |
| High School Diploma | 89 (66.4%) | 45 (33.6%) |
| College or Associate's Degree | 64 (69.6%) | 28 (30.4%) |
| Bachelor's Degree | 81 (100.0%) | 0 (0.0%) |
| Graduate Degree | 40 (100.0%) | 0 (0.0%) |
| Total | 274 (77.4%) | 80 (22.6%) |
Income in Lyon County
Income Overview in Lyon County
Per Capita Income in Lyon County is $29,425, while median incomes of families and households are $74,923 and $56,415 respectively.
| Characteristic | Number | Measure |
| Per Capita Income | 32,182 | $29,425 |
| Median Family Income | 7,586 | $74,923 |
| Mean Family Income | 7,586 | $90,599 |
| Median Household Income | 13,223 | $56,415 |
| Mean Household Income | 13,223 | $71,990 |
| Income Deficit | 7,586 | $11,341 |
| Wage / Income Gap (%) | 32,182 | 39.83% |
| Wage / Income Gap ($) | 32,182 | 60.17¢ per $1 |
| Gini / Inequality Index | 32,182 | 0.43 |
Earnings by Sex in Lyon County
Average Earnings in Lyon County are $31,475, $38,003 for men and $22,868 for women, a difference of 39.8%.
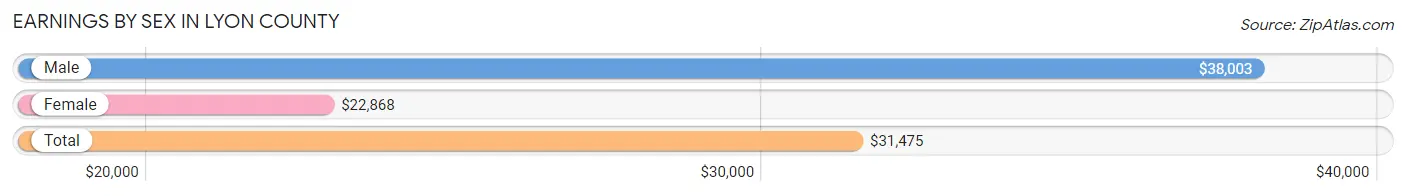
| Sex | Number | Average Earnings |
| Male | 9,701 (51.4%) | $38,003 |
| Female | 9,177 (48.6%) | $22,868 |
| Total | 18,878 (100.0%) | $31,475 |
Earnings by Sex by Income Bracket in Lyon County
The most common earnings brackets in Lyon County are $30,000 to $34,999 for men (965 | 10.0%) and $2,499 or less for women (919 | 10.0%).
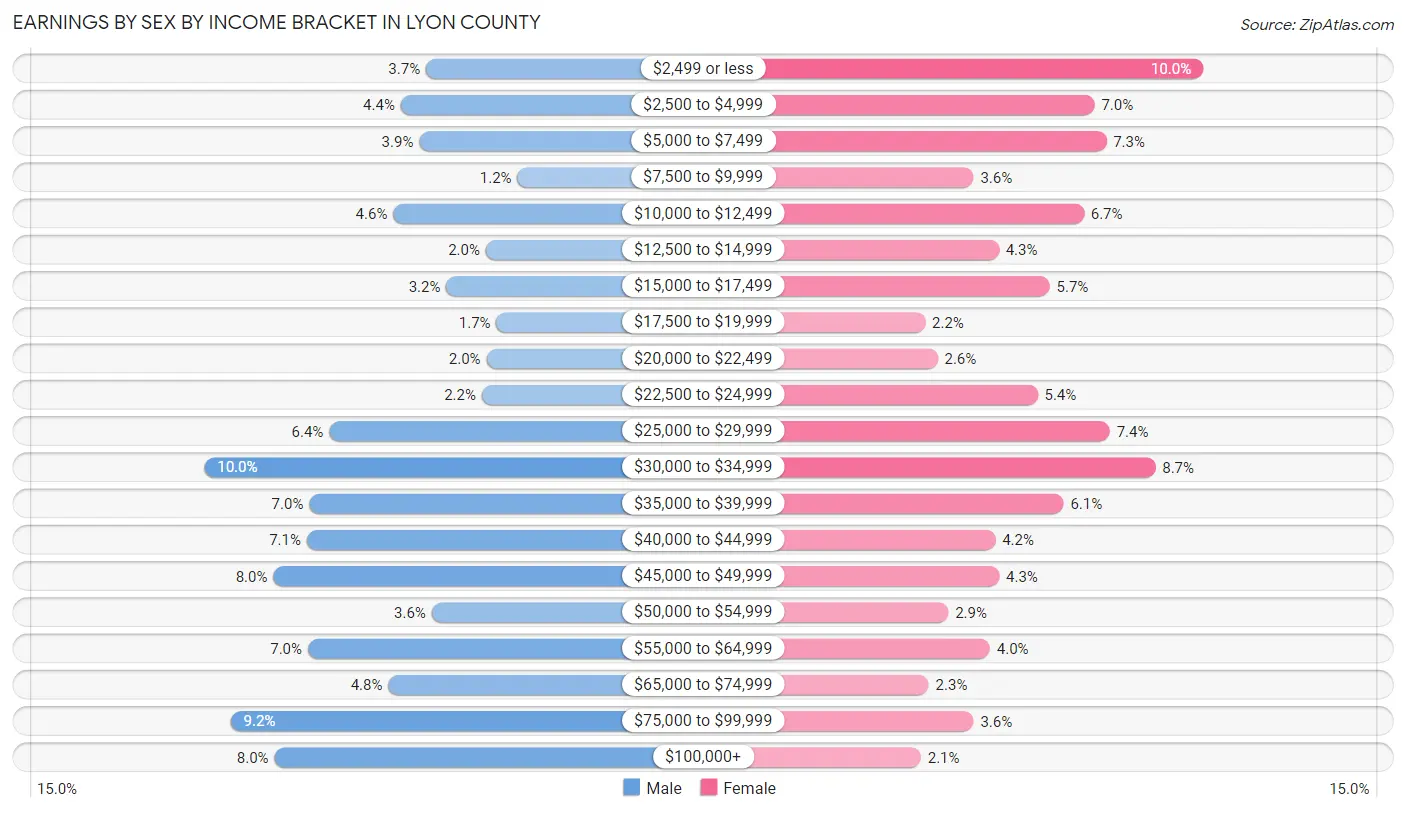
| Income | Male | Female |
| $2,499 or less | 361 (3.7%) | 919 (10.0%) |
| $2,500 to $4,999 | 430 (4.4%) | 639 (7.0%) |
| $5,000 to $7,499 | 379 (3.9%) | 669 (7.3%) |
| $7,500 to $9,999 | 112 (1.1%) | 327 (3.6%) |
| $10,000 to $12,499 | 450 (4.6%) | 611 (6.7%) |
| $12,500 to $14,999 | 198 (2.0%) | 392 (4.3%) |
| $15,000 to $17,499 | 306 (3.2%) | 523 (5.7%) |
| $17,500 to $19,999 | 169 (1.7%) | 202 (2.2%) |
| $20,000 to $22,499 | 196 (2.0%) | 234 (2.5%) |
| $22,500 to $24,999 | 209 (2.1%) | 492 (5.4%) |
| $25,000 to $29,999 | 625 (6.4%) | 678 (7.4%) |
| $30,000 to $34,999 | 965 (10.0%) | 796 (8.7%) |
| $35,000 to $39,999 | 679 (7.0%) | 559 (6.1%) |
| $40,000 to $44,999 | 686 (7.1%) | 383 (4.2%) |
| $45,000 to $49,999 | 777 (8.0%) | 393 (4.3%) |
| $50,000 to $54,999 | 345 (3.6%) | 262 (2.9%) |
| $55,000 to $64,999 | 683 (7.0%) | 369 (4.0%) |
| $65,000 to $74,999 | 464 (4.8%) | 211 (2.3%) |
| $75,000 to $99,999 | 893 (9.2%) | 327 (3.6%) |
| $100,000+ | 774 (8.0%) | 191 (2.1%) |
| Total | 9,701 (100.0%) | 9,177 (100.0%) |
Earnings by Sex by Educational Attainment in Lyon County
Average earnings in Lyon County are $46,078 for men and $32,301 for women, a difference of 29.9%. Men with an educational attainment of graduate degree enjoy the highest average annual earnings of $69,432, while those with less than high school education earn the least with $33,932. Women with an educational attainment of graduate degree earn the most with the average annual earnings of $55,573, while those with high school diploma education have the smallest earnings of $25,704.
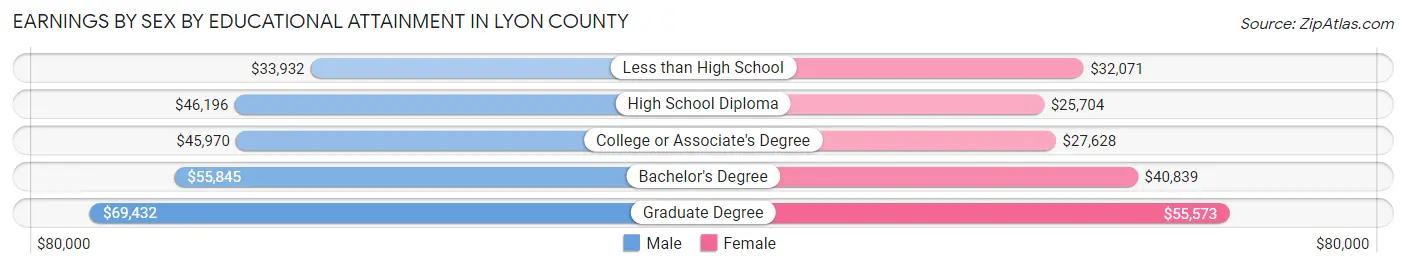
| Educational Attainment | Male Income | Female Income |
| Less than High School | $33,932 | $32,071 |
| High School Diploma | $46,196 | $25,704 |
| College or Associate's Degree | $45,970 | $27,628 |
| Bachelor's Degree | $55,845 | $40,839 |
| Graduate Degree | $69,432 | $55,573 |
| Total | $46,078 | $32,301 |
Family Income in Lyon County
Family Income Brackets in Lyon County
According to the Lyon County family income data, there are 1,548 families falling into the $50,000 to $74,999 income range, which is the most common income bracket and makes up 20.4% of all families. Conversely, the $10,000 to $14,999 income bracket is the least frequent group with only 83 families (1.1%) belonging to this category.
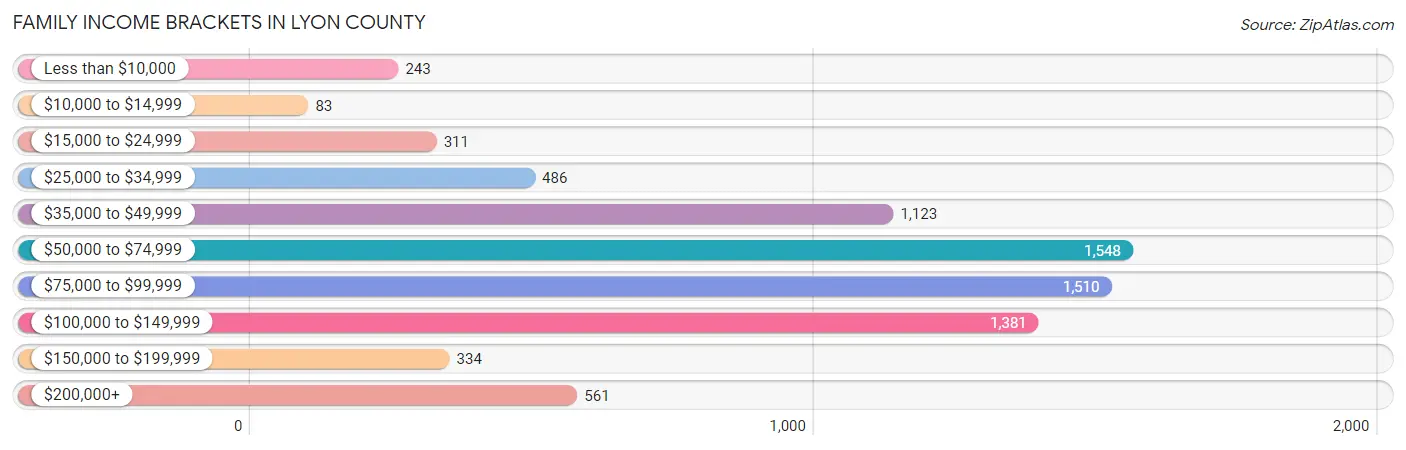
| Income Bracket | # Families | % Families |
| Less than $10,000 | 243 | 3.2% |
| $10,000 to $14,999 | 83 | 1.1% |
| $15,000 to $24,999 | 311 | 4.1% |
| $25,000 to $34,999 | 486 | 6.4% |
| $35,000 to $49,999 | 1,123 | 14.8% |
| $50,000 to $74,999 | 1,548 | 20.4% |
| $75,000 to $99,999 | 1,510 | 19.9% |
| $100,000 to $149,999 | 1,381 | 18.2% |
| $150,000 to $199,999 | 334 | 4.4% |
| $200,000+ | 561 | 7.4% |
Family Income by Famaliy Size in Lyon County
6-person families (219 | 2.9%) account for the highest median family income in Lyon County with $222,774 per family, while 6-person families (219 | 2.9%) have the highest median income of $37,129 per family member.
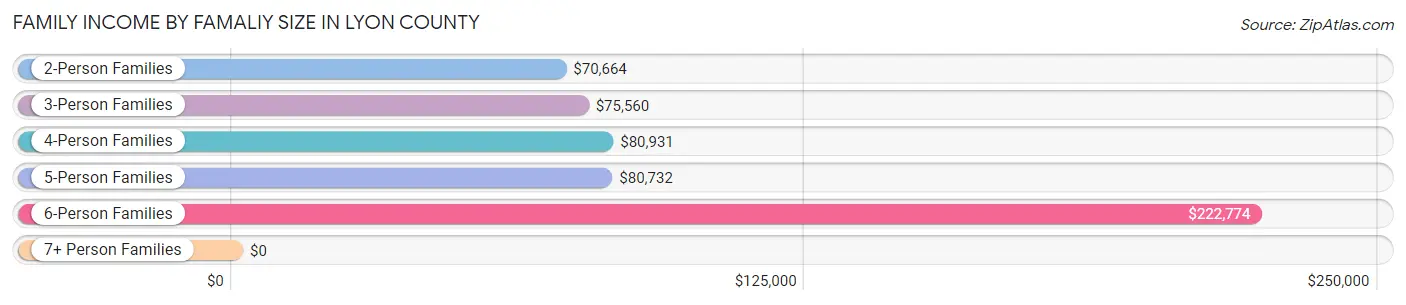
| Income Bracket | # Families | Median Income |
| 2-Person Families | 3,828 (50.5%) | $70,664 |
| 3-Person Families | 1,523 (20.1%) | $75,560 |
| 4-Person Families | 1,304 (17.2%) | $80,931 |
| 5-Person Families | 627 (8.3%) | $80,732 |
| 6-Person Families | 219 (2.9%) | $222,774 |
| 7+ Person Families | 85 (1.1%) | $0 |
| Total | 7,586 (100.0%) | $74,923 |
Family Income by Number of Earners in Lyon County
The median family income in Lyon County is $74,923, with families comprising 3+ earners (874) having the highest median family income of $105,321, while families with 1 earner (2,096) have the lowest median family income of $50,050, accounting for 11.5% and 27.6% of families, respectively.
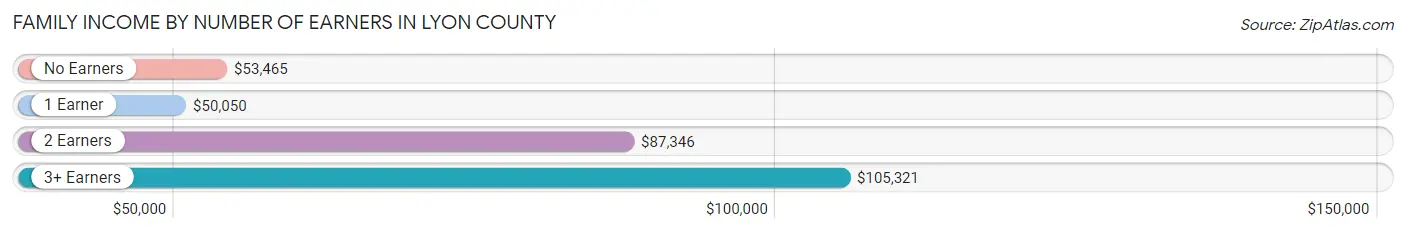
| Number of Earners | # Families | Median Income |
| No Earners | 972 (12.8%) | $53,465 |
| 1 Earner | 2,096 (27.6%) | $50,050 |
| 2 Earners | 3,644 (48.0%) | $87,346 |
| 3+ Earners | 874 (11.5%) | $105,321 |
| Total | 7,586 (100.0%) | $74,923 |
Household Income in Lyon County
Household Income Brackets in Lyon County
With 2,578 households falling in the category, the $50,000 to $74,999 income range is the most frequent in Lyon County, accounting for 19.5% of all households. In contrast, only 423 households (3.2%) fall into the $150,000 to $199,999 income bracket, making it the least populous group.
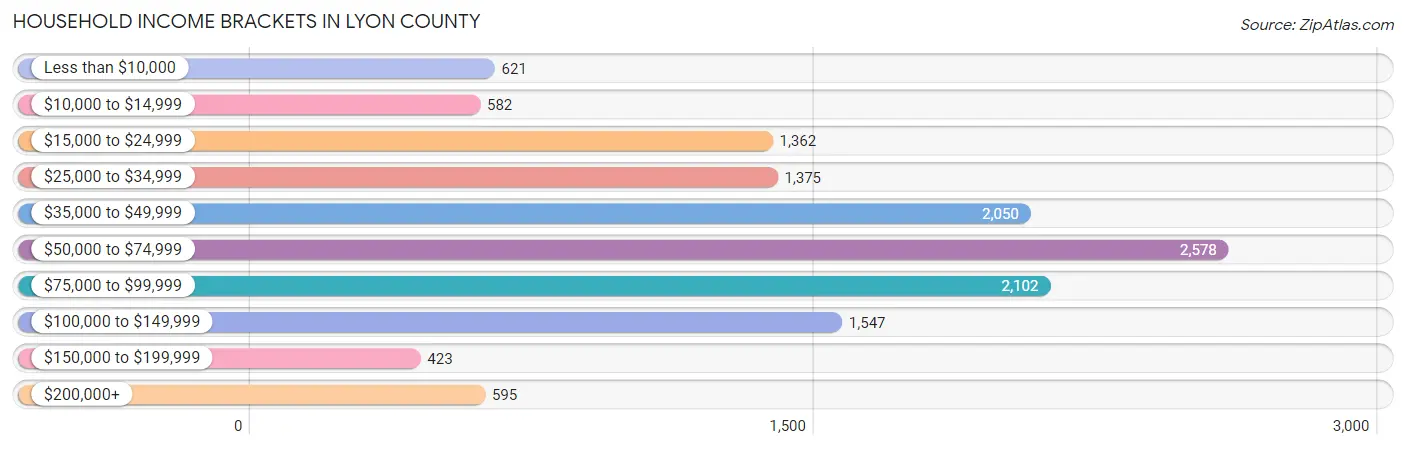
| Income Bracket | # Households | % Households |
| Less than $10,000 | 621 | 4.7% |
| $10,000 to $14,999 | 582 | 4.4% |
| $15,000 to $24,999 | 1,362 | 10.3% |
| $25,000 to $34,999 | 1,375 | 10.4% |
| $35,000 to $49,999 | 2,050 | 15.5% |
| $50,000 to $74,999 | 2,578 | 19.5% |
| $75,000 to $99,999 | 2,102 | 15.9% |
| $100,000 to $149,999 | 1,547 | 11.7% |
| $150,000 to $199,999 | 423 | 3.2% |
| $200,000+ | 595 | 4.5% |
Household Income by Householder Age in Lyon County
The median household income in Lyon County is $56,415, with the highest median household income of $70,906 found in the 45 to 64 years age bracket for the primary householder. A total of 3,935 households (29.8%) fall into this category. Meanwhile, the 15 to 24 years age bracket for the primary householder has the lowest median household income of $33,193, with 2,219 households (16.8%) in this group.
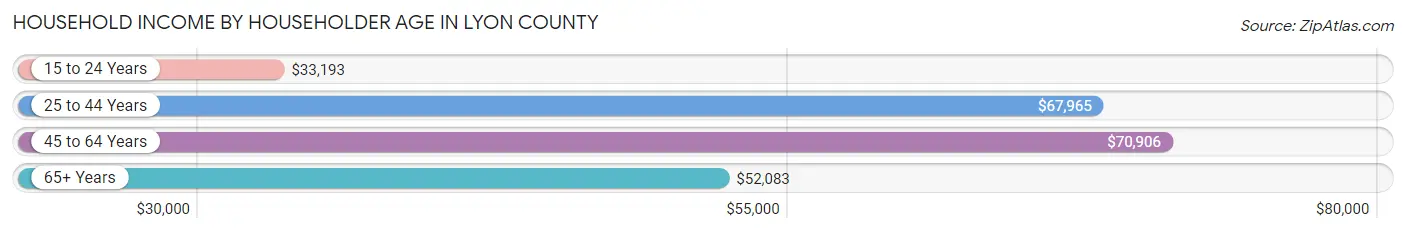
| Income Bracket | # Households | Median Income |
| 15 to 24 Years | 2,219 (16.8%) | $33,193 |
| 25 to 44 Years | 4,123 (31.2%) | $67,965 |
| 45 to 64 Years | 3,935 (29.8%) | $70,906 |
| 65+ Years | 2,946 (22.3%) | $52,083 |
| Total | 13,223 (100.0%) | $56,415 |
Poverty in Lyon County
Income Below Poverty by Sex and Age in Lyon County
With 14.8% poverty level for males and 17.6% for females among the residents of Lyon County, 18 to 24 year old males and 18 to 24 year old females are the most vulnerable to poverty, with 740 males (31.1%) and 1,385 females (51.9%) in their respective age groups living below the poverty level.
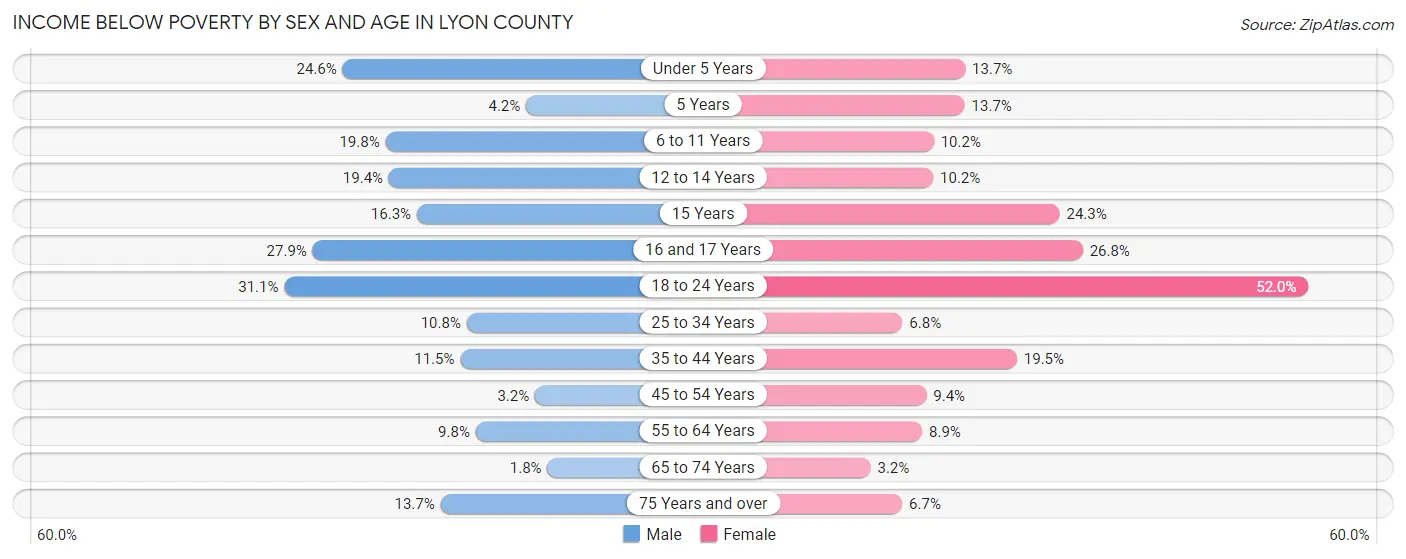
| Age Bracket | Male | Female |
| Under 5 Years | 227 (24.6%) | 130 (13.7%) |
| 5 Years | 8 (4.2%) | 29 (13.7%) |
| 6 to 11 Years | 248 (19.8%) | 120 (10.2%) |
| 12 to 14 Years | 109 (19.4%) | 59 (10.2%) |
| 15 Years | 23 (16.3%) | 73 (24.2%) |
| 16 and 17 Years | 129 (27.9%) | 77 (26.8%) |
| 18 to 24 Years | 740 (31.1%) | 1,385 (51.9%) |
| 25 to 34 Years | 225 (10.8%) | 128 (6.8%) |
| 35 to 44 Years | 205 (11.5%) | 317 (19.5%) |
| 45 to 54 Years | 47 (3.2%) | 154 (9.4%) |
| 55 to 64 Years | 181 (9.8%) | 172 (8.9%) |
| 65 to 74 Years | 25 (1.8%) | 45 (3.2%) |
| 75 Years and over | 106 (13.7%) | 72 (6.7%) |
| Total | 2,273 (14.8%) | 2,761 (17.6%) |
Income Above Poverty by Sex and Age in Lyon County
According to the poverty statistics in Lyon County, males aged 65 to 74 years and females aged 65 to 74 years are the age groups that are most secure financially, with 98.2% of males and 96.8% of females in these age groups living above the poverty line.
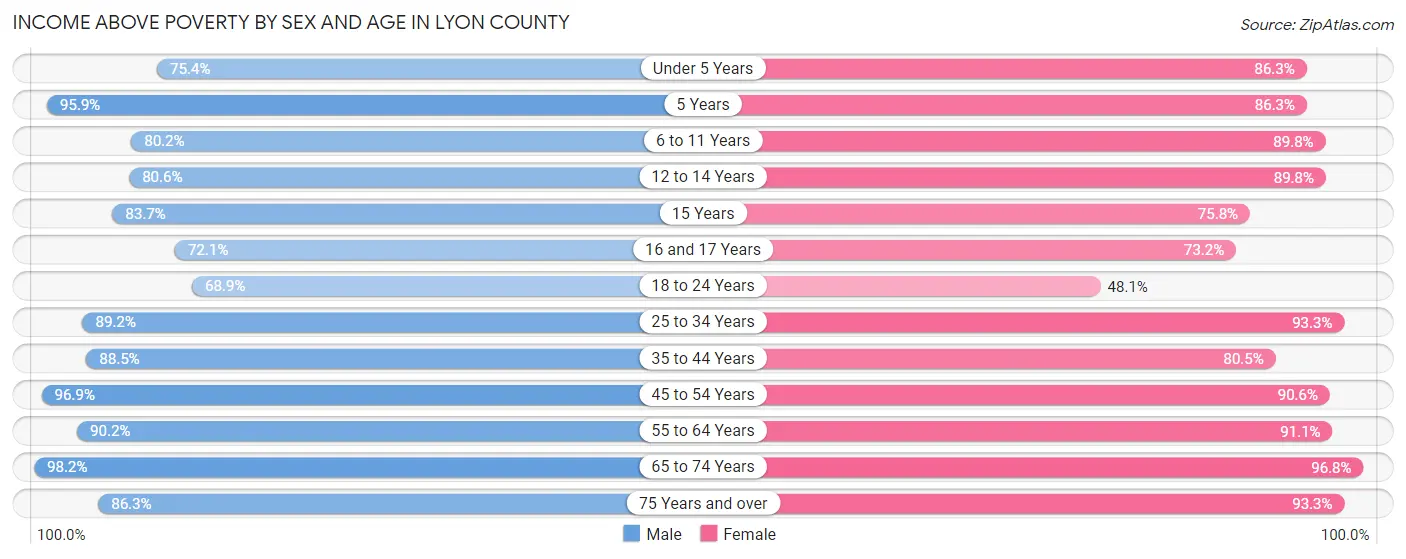
| Age Bracket | Male | Female |
| Under 5 Years | 696 (75.4%) | 816 (86.3%) |
| 5 Years | 185 (95.9%) | 183 (86.3%) |
| 6 to 11 Years | 1,004 (80.2%) | 1,052 (89.8%) |
| 12 to 14 Years | 452 (80.6%) | 521 (89.8%) |
| 15 Years | 118 (83.7%) | 228 (75.7%) |
| 16 and 17 Years | 333 (72.1%) | 210 (73.2%) |
| 18 to 24 Years | 1,641 (68.9%) | 1,281 (48.0%) |
| 25 to 34 Years | 1,866 (89.2%) | 1,769 (93.2%) |
| 35 to 44 Years | 1,580 (88.5%) | 1,309 (80.5%) |
| 45 to 54 Years | 1,444 (96.9%) | 1,480 (90.6%) |
| 55 to 64 Years | 1,674 (90.2%) | 1,751 (91.1%) |
| 65 to 74 Years | 1,385 (98.2%) | 1,362 (96.8%) |
| 75 Years and over | 669 (86.3%) | 999 (93.3%) |
| Total | 13,047 (85.2%) | 12,961 (82.4%) |
Income Below Poverty Among Married-Couple Families in Lyon County
The poverty statistics for married-couple families in Lyon County show that 4.0% or 238 of the total 5,900 families live below the poverty line. Families with 5 or more children have the highest poverty rate of 91.9%, comprising of 57 families. On the other hand, families with 1 or 2 children have the lowest poverty rate of 1.0%, which includes 18 families.
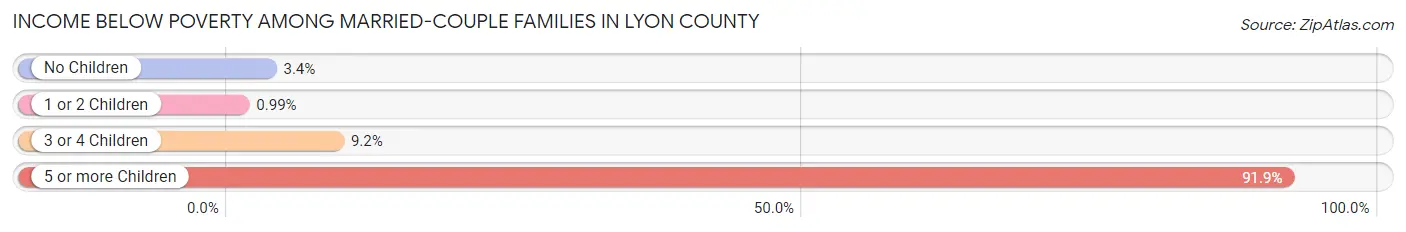
| Children | Above Poverty | Below Poverty |
| No Children | 3,430 (96.7%) | 119 (3.4%) |
| 1 or 2 Children | 1,794 (99.0%) | 18 (1.0%) |
| 3 or 4 Children | 433 (90.8%) | 44 (9.2%) |
| 5 or more Children | 5 (8.1%) | 57 (91.9%) |
| Total | 5,662 (96.0%) | 238 (4.0%) |
Income Below Poverty Among Single-Parent Households in Lyon County
According to the poverty data in Lyon County, 20.6% or 134 single-father households and 28.2% or 292 single-mother households are living below the poverty line. Among single-father households, those with 3 or 4 children have the highest poverty rate, with 28 households (30.8%) experiencing poverty. Likewise, among single-mother households, those with 3 or 4 children have the highest poverty rate, with 68 households (51.1%) falling below the poverty line.
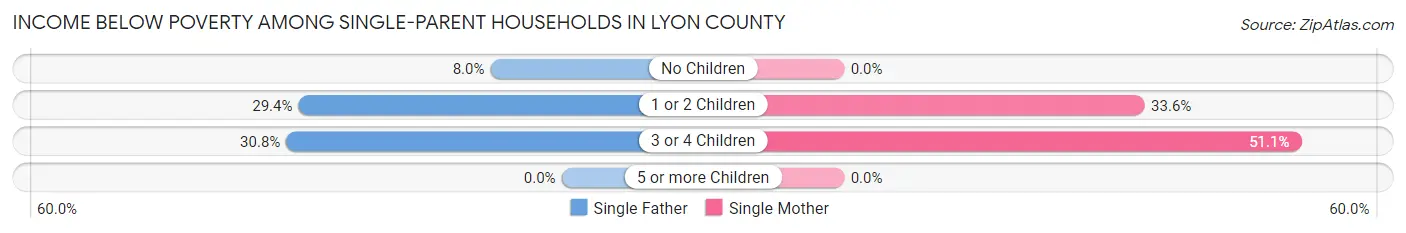
| Children | Single Father | Single Mother |
| No Children | 21 (8.0%) | 0 (0.0%) |
| 1 or 2 Children | 85 (29.4%) | 224 (33.6%) |
| 3 or 4 Children | 28 (30.8%) | 68 (51.1%) |
| 5 or more Children | 0 (0.0%) | 0 (0.0%) |
| Total | 134 (20.6%) | 292 (28.2%) |
Income Below Poverty Among Married-Couple vs Single-Parent Households in Lyon County
The poverty data for Lyon County shows that 238 of the married-couple family households (4.0%) and 426 of the single-parent households (25.3%) are living below the poverty level. Within the married-couple family households, those with 5 or more children have the highest poverty rate, with 57 households (91.9%) falling below the poverty line. Among the single-parent households, those with 3 or 4 children have the highest poverty rate, with 96 household (42.9%) living below poverty.
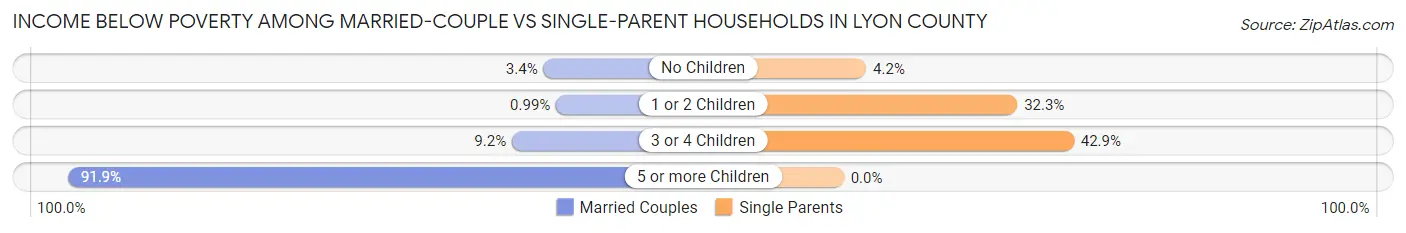
| Children | Married-Couple Families | Single-Parent Households |
| No Children | 119 (3.4%) | 21 (4.2%) |
| 1 or 2 Children | 18 (1.0%) | 309 (32.3%) |
| 3 or 4 Children | 44 (9.2%) | 96 (42.9%) |
| 5 or more Children | 57 (91.9%) | 0 (0.0%) |
| Total | 238 (4.0%) | 426 (25.3%) |
Employment Characteristics in Lyon County
Employment by Class of Employer in Lyon County
Among the 16,237 employed individuals in Lyon County, private company employees (10,738 | 66.1%), not-for-profit organizations (1,377 | 8.5%), and state government employees (1,362 | 8.4%) make up the most common classes of employment.
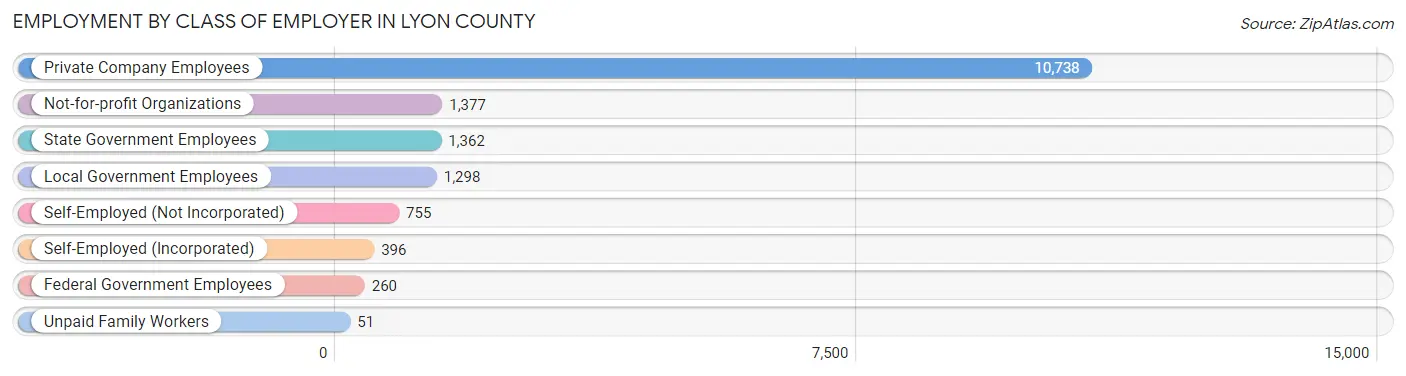
| Employer Class | # Employees | % Employees |
| Private Company Employees | 10,738 | 66.1% |
| Self-Employed (Incorporated) | 396 | 2.4% |
| Self-Employed (Not Incorporated) | 755 | 4.6% |
| Not-for-profit Organizations | 1,377 | 8.5% |
| Local Government Employees | 1,298 | 8.0% |
| State Government Employees | 1,362 | 8.4% |
| Federal Government Employees | 260 | 1.6% |
| Unpaid Family Workers | 51 | 0.3% |
| Total | 16,237 | 100.0% |
Employment Status by Age in Lyon County
According to the labor force statistics for Lyon County, out of the total population over 16 years of age (25,818), 68.2% or 17,608 individuals are in the labor force, with 2.7% or 475 of them unemployed. The age group with the highest labor force participation rate is 35 to 44 years, with 88.7% or 3,043 individuals in the labor force. Within the labor force, the 75 years and over age range has the highest percentage of unemployed individuals, with 20.8% or 15 of them being unemployed.
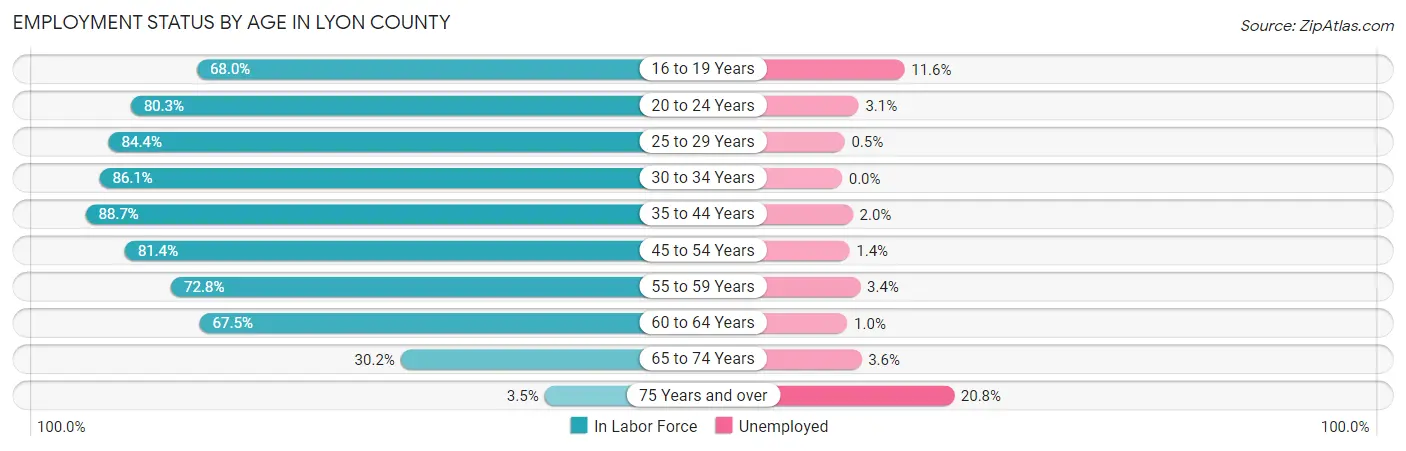
| Age Bracket | In Labor Force | Unemployed |
| 16 to 19 Years | 1,395 (68.0%) | 162 (11.6%) |
| 20 to 24 Years | 3,602 (80.3%) | 112 (3.1%) |
| 25 to 29 Years | 1,784 (84.4%) | 9 (0.5%) |
| 30 to 34 Years | 1,644 (86.1%) | 0 (0.0%) |
| 35 to 44 Years | 3,043 (88.7%) | 61 (2.0%) |
| 45 to 54 Years | 2,561 (81.4%) | 36 (1.4%) |
| 55 to 59 Years | 1,199 (72.8%) | 41 (3.4%) |
| 60 to 64 Years | 1,447 (67.5%) | 14 (1.0%) |
| 65 to 74 Years | 855 (30.2%) | 31 (3.6%) |
| 75 Years and over | 72 (3.5%) | 15 (20.8%) |
| Total | 17,608 (68.2%) | 475 (2.7%) |
Employment Status by Educational Attainment in Lyon County
According to labor force statistics for Lyon County, 81.2% of individuals (11,685) out of the total population between 25 and 64 years of age (14,391) are in the labor force, with 1.4% or 164 of them being unemployed. The group with the highest labor force participation rate are those with the educational attainment of bachelor's degree or higher, with 85.6% or 3,290 individuals in the labor force. Within the labor force, individuals with less than high school education have the highest percentage of unemployment, with 5.0% or 68 of them being unemployed.
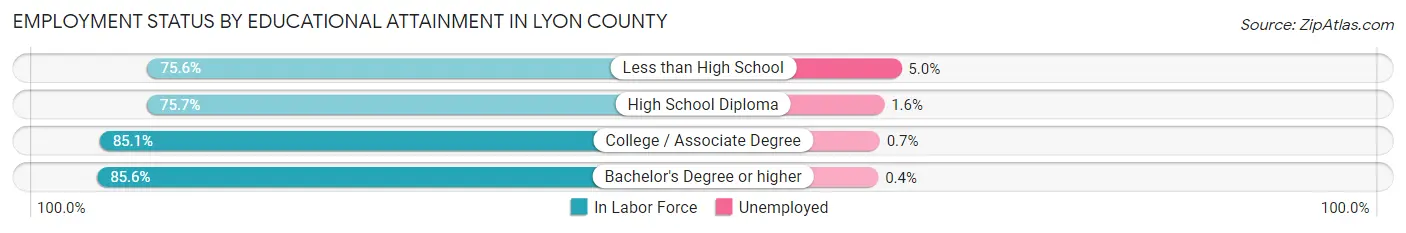
| Educational Attainment | In Labor Force | Unemployed |
| Less than High School | 1,352 (75.6%) | 89 (5.0%) |
| High School Diploma | 3,361 (75.7%) | 71 (1.6%) |
| College / Associate Degree | 3,676 (85.1%) | 30 (0.7%) |
| Bachelor's Degree or higher | 3,290 (85.6%) | 15 (0.4%) |
| Total | 11,685 (81.2%) | 201 (1.4%) |
Employment Occupations by Sex in Lyon County
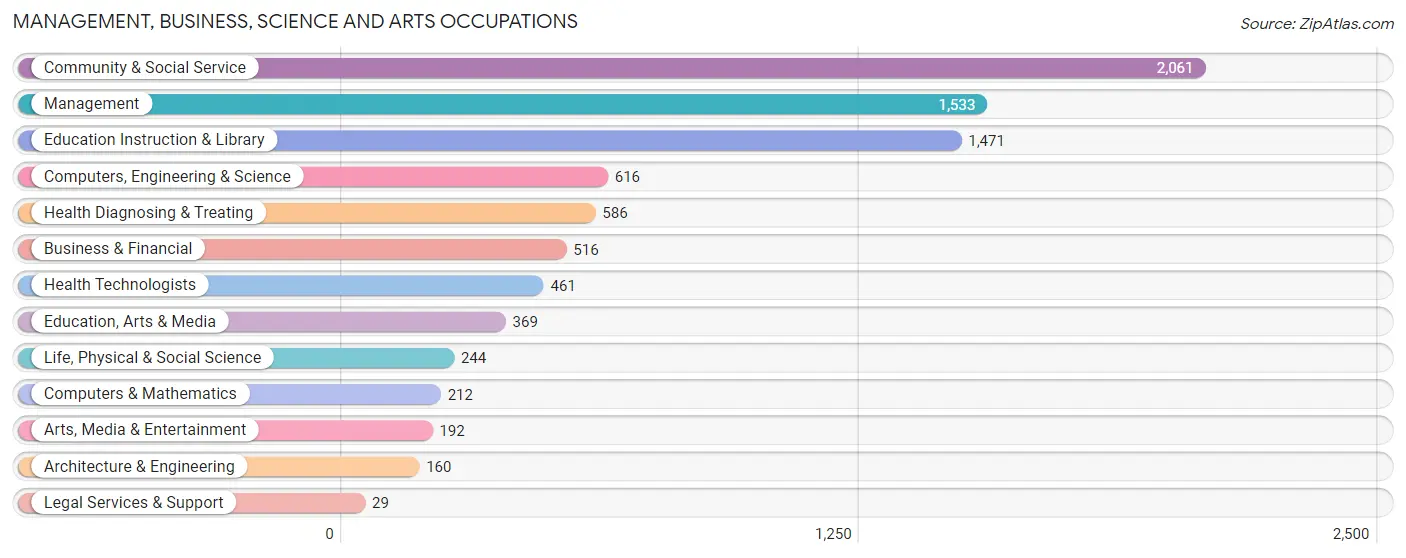
Management, Business, Science and Arts Occupations
The most common Management, Business, Science and Arts occupations in Lyon County are Community & Social Service (2,061 | 12.1%), Management (1,533 | 9.0%), Education Instruction & Library (1,471 | 8.6%), Computers, Engineering & Science (616 | 3.6%), and Health Diagnosing & Treating (586 | 3.4%).
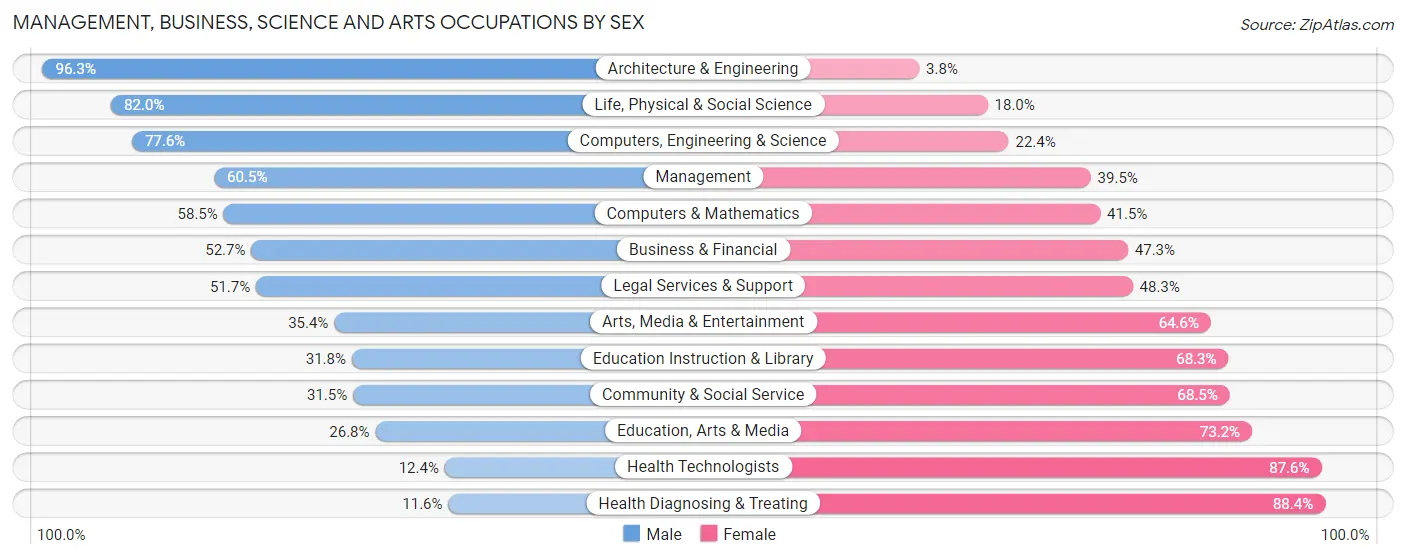
Management, Business, Science and Arts Occupations by Sex
Within the Management, Business, Science and Arts occupations in Lyon County, the most male-oriented occupations are Architecture & Engineering (96.3%), Life, Physical & Social Science (82.0%), and Computers, Engineering & Science (77.6%), while the most female-oriented occupations are Health Diagnosing & Treating (88.4%), Health Technologists (87.6%), and Education, Arts & Media (73.2%).
| Occupation | Male | Female |
| Management | 927 (60.5%) | 606 (39.5%) |
| Business & Financial | 272 (52.7%) | 244 (47.3%) |
| Computers, Engineering & Science | 478 (77.6%) | 138 (22.4%) |
| Computers & Mathematics | 124 (58.5%) | 88 (41.5%) |
| Architecture & Engineering | 154 (96.3%) | 6 (3.7%) |
| Life, Physical & Social Science | 200 (82.0%) | 44 (18.0%) |
| Community & Social Service | 649 (31.5%) | 1,412 (68.5%) |
| Education, Arts & Media | 99 (26.8%) | 270 (73.2%) |
| Legal Services & Support | 15 (51.7%) | 14 (48.3%) |
| Education Instruction & Library | 467 (31.8%) | 1,004 (68.2%) |
| Arts, Media & Entertainment | 68 (35.4%) | 124 (64.6%) |
| Health Diagnosing & Treating | 68 (11.6%) | 518 (88.4%) |
| Health Technologists | 57 (12.4%) | 404 (87.6%) |
| Total (Category) | 2,394 (45.1%) | 2,918 (54.9%) |
| Total (Overall) | 8,831 (51.9%) | 8,188 (48.1%) |
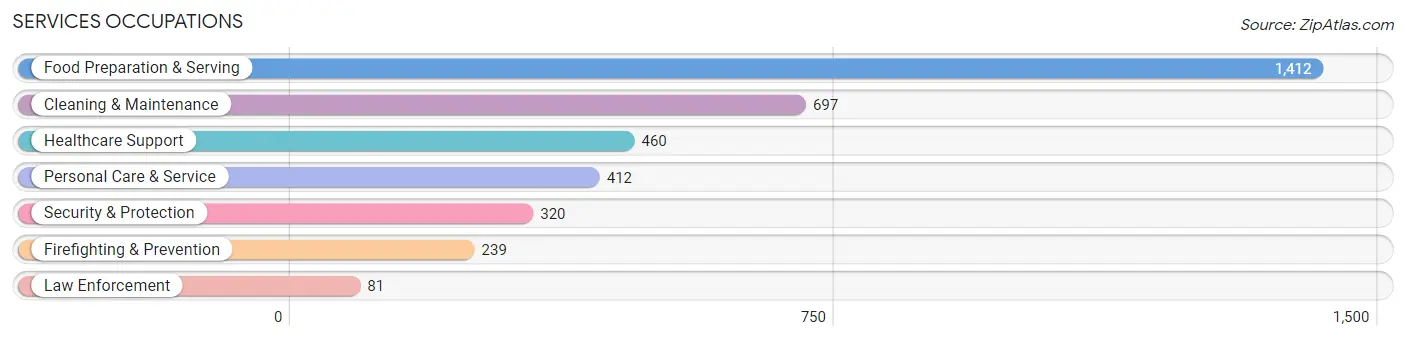
Services Occupations
The most common Services occupations in Lyon County are Food Preparation & Serving (1,412 | 8.3%), Cleaning & Maintenance (697 | 4.1%), Healthcare Support (460 | 2.7%), Personal Care & Service (412 | 2.4%), and Security & Protection (320 | 1.9%).
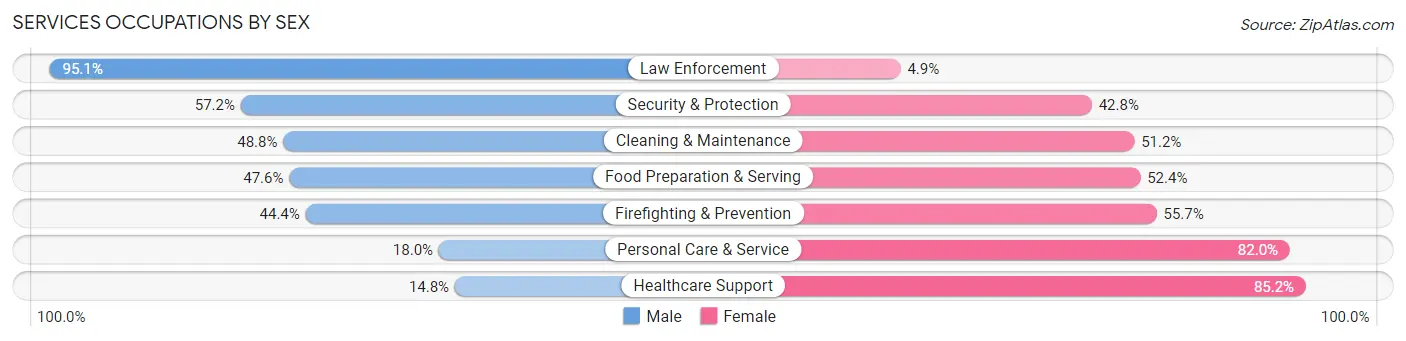
Services Occupations by Sex
Within the Services occupations in Lyon County, the most male-oriented occupations are Law Enforcement (95.1%), Security & Protection (57.2%), and Cleaning & Maintenance (48.8%), while the most female-oriented occupations are Healthcare Support (85.2%), Personal Care & Service (82.0%), and Firefighting & Prevention (55.6%).
| Occupation | Male | Female |
| Healthcare Support | 68 (14.8%) | 392 (85.2%) |
| Security & Protection | 183 (57.2%) | 137 (42.8%) |
| Firefighting & Prevention | 106 (44.4%) | 133 (55.6%) |
| Law Enforcement | 77 (95.1%) | 4 (4.9%) |
| Food Preparation & Serving | 672 (47.6%) | 740 (52.4%) |
| Cleaning & Maintenance | 340 (48.8%) | 357 (51.2%) |
| Personal Care & Service | 74 (18.0%) | 338 (82.0%) |
| Total (Category) | 1,337 (40.5%) | 1,964 (59.5%) |
| Total (Overall) | 8,831 (51.9%) | 8,188 (48.1%) |
Sales and Office Occupations
The most common Sales and Office occupations in Lyon County are Office & Administration (1,664 | 9.8%), and Sales & Related (1,355 | 8.0%).
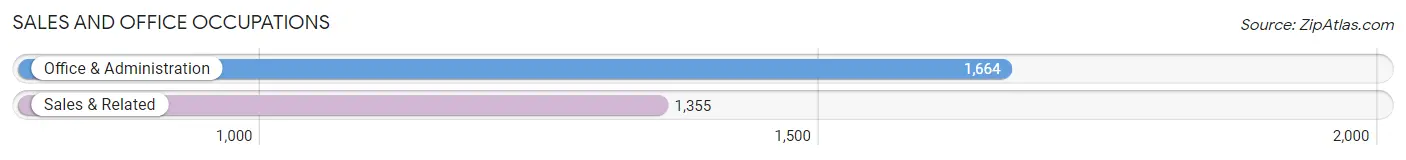
Sales and Office Occupations by Sex
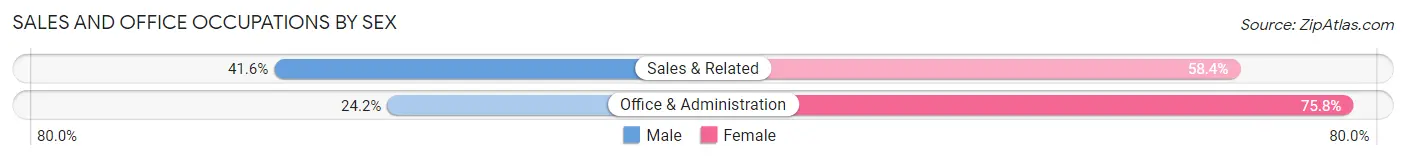
| Occupation | Male | Female |
| Sales & Related | 564 (41.6%) | 791 (58.4%) |
| Office & Administration | 403 (24.2%) | 1,261 (75.8%) |
| Total (Category) | 967 (32.0%) | 2,052 (68.0%) |
| Total (Overall) | 8,831 (51.9%) | 8,188 (48.1%) |
Natural Resources, Construction and Maintenance Occupations
The most common Natural Resources, Construction and Maintenance occupations in Lyon County are Construction & Extraction (646 | 3.8%), Installation, Maintenance & Repair (610 | 3.6%), and Farming, Fishing & Forestry (136 | 0.8%).
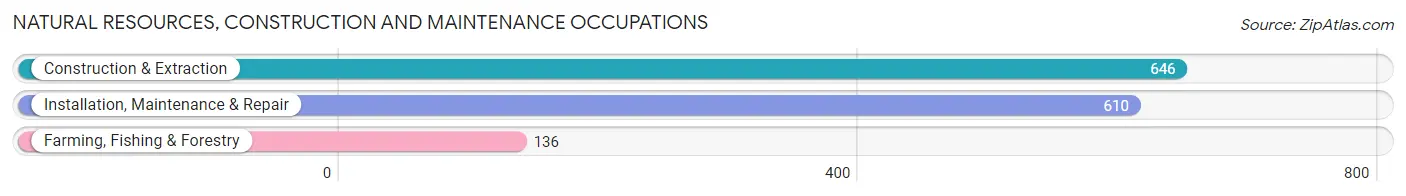
Natural Resources, Construction and Maintenance Occupations by Sex
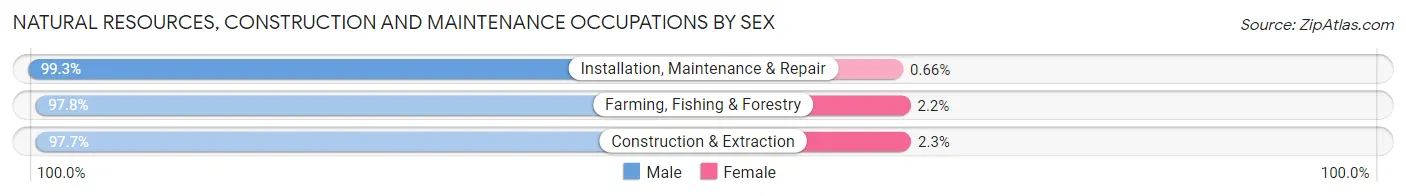
| Occupation | Male | Female |
| Farming, Fishing & Forestry | 133 (97.8%) | 3 (2.2%) |
| Construction & Extraction | 631 (97.7%) | 15 (2.3%) |
| Installation, Maintenance & Repair | 606 (99.3%) | 4 (0.7%) |
| Total (Category) | 1,370 (98.4%) | 22 (1.6%) |
| Total (Overall) | 8,831 (51.9%) | 8,188 (48.1%) |
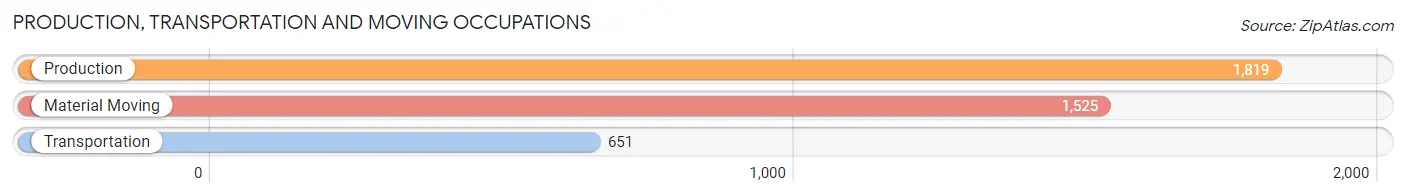
Production, Transportation and Moving Occupations
The most common Production, Transportation and Moving occupations in Lyon County are Production (1,819 | 10.7%), Material Moving (1,525 | 9.0%), and Transportation (651 | 3.8%).
Production, Transportation and Moving Occupations by Sex
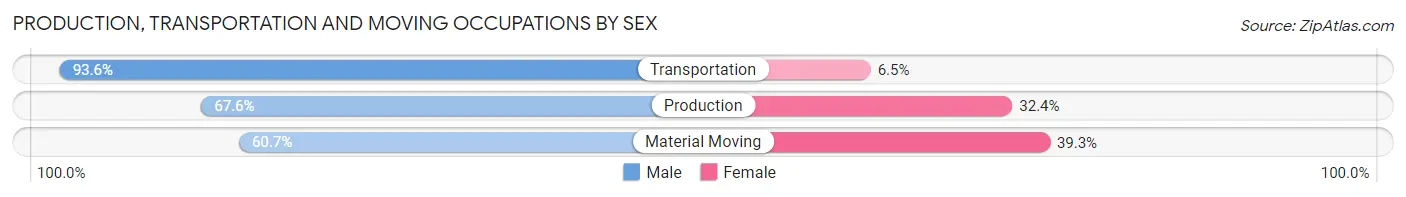
| Occupation | Male | Female |
| Production | 1,229 (67.6%) | 590 (32.4%) |
| Transportation | 609 (93.5%) | 42 (6.5%) |
| Material Moving | 925 (60.7%) | 600 (39.3%) |
| Total (Category) | 2,763 (69.2%) | 1,232 (30.8%) |
| Total (Overall) | 8,831 (51.9%) | 8,188 (48.1%) |
Employment Industries by Sex in Lyon County
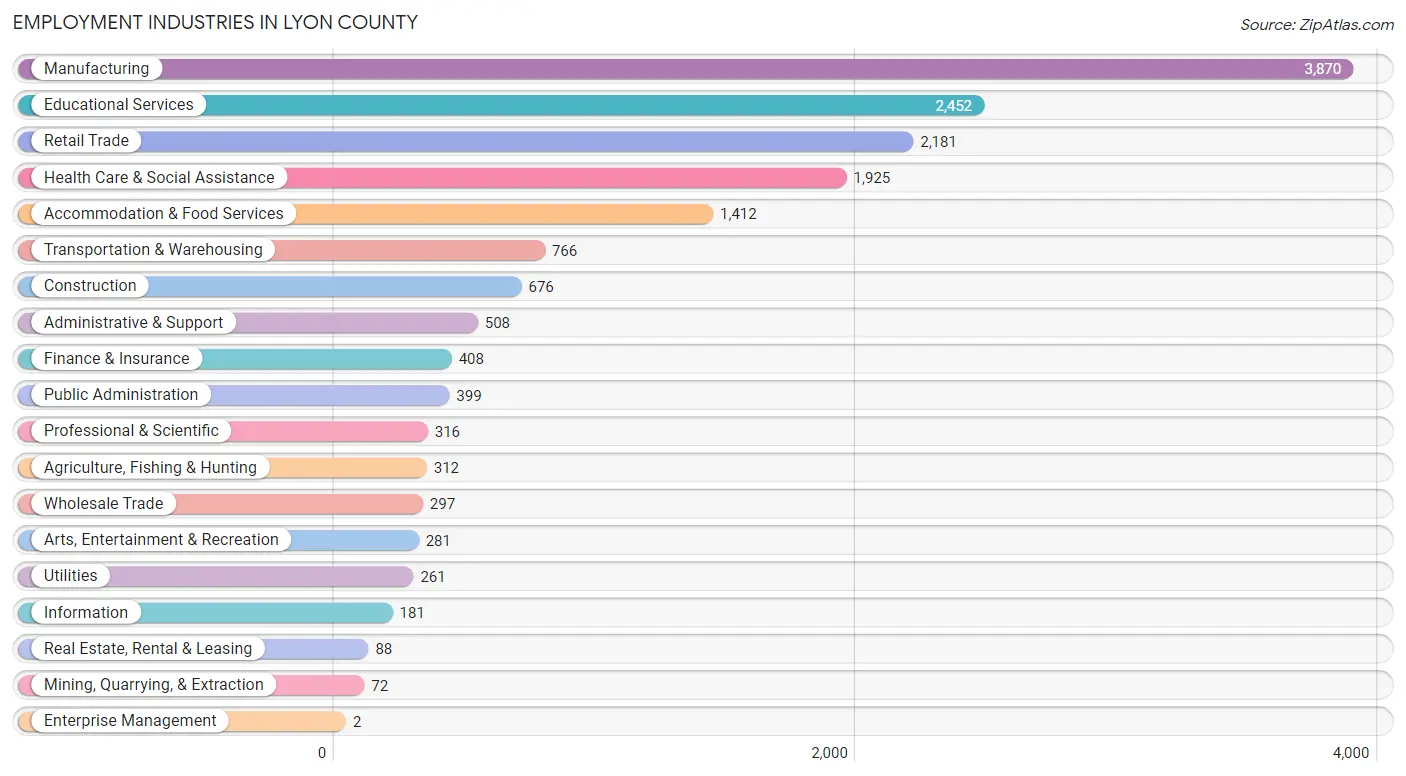
Employment Industries in Lyon County
The major employment industries in Lyon County include Manufacturing (3,870 | 22.7%), Educational Services (2,452 | 14.4%), Retail Trade (2,181 | 12.8%), Health Care & Social Assistance (1,925 | 11.3%), and Accommodation & Food Services (1,412 | 8.3%).
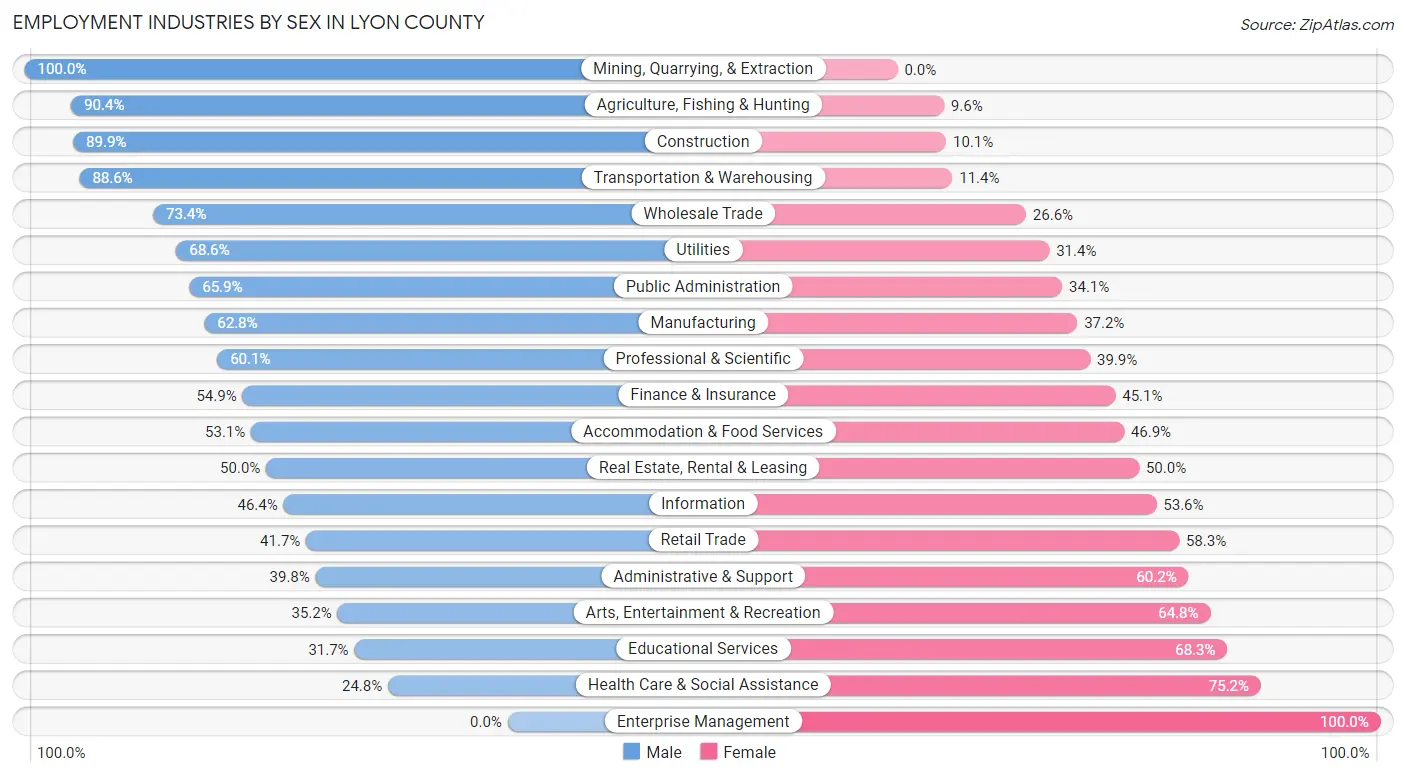
Employment Industries by Sex in Lyon County
The Lyon County industries that see more men than women are Mining, Quarrying, & Extraction (100.0%), Agriculture, Fishing & Hunting (90.4%), and Construction (89.9%), whereas the industries that tend to have a higher number of women are Enterprise Management (100.0%), Health Care & Social Assistance (75.2%), and Educational Services (68.3%).
| Industry | Male | Female |
| Agriculture, Fishing & Hunting | 282 (90.4%) | 30 (9.6%) |
| Mining, Quarrying, & Extraction | 72 (100.0%) | 0 (0.0%) |
| Construction | 608 (89.9%) | 68 (10.1%) |
| Manufacturing | 2,430 (62.8%) | 1,440 (37.2%) |
| Wholesale Trade | 218 (73.4%) | 79 (26.6%) |
| Retail Trade | 910 (41.7%) | 1,271 (58.3%) |
| Transportation & Warehousing | 679 (88.6%) | 87 (11.4%) |
| Utilities | 179 (68.6%) | 82 (31.4%) |
| Information | 84 (46.4%) | 97 (53.6%) |
| Finance & Insurance | 224 (54.9%) | 184 (45.1%) |
| Real Estate, Rental & Leasing | 44 (50.0%) | 44 (50.0%) |
| Professional & Scientific | 190 (60.1%) | 126 (39.9%) |
| Enterprise Management | 0 (0.0%) | 2 (100.0%) |
| Administrative & Support | 202 (39.8%) | 306 (60.2%) |
| Educational Services | 778 (31.7%) | 1,674 (68.3%) |
| Health Care & Social Assistance | 477 (24.8%) | 1,448 (75.2%) |
| Arts, Entertainment & Recreation | 99 (35.2%) | 182 (64.8%) |
| Accommodation & Food Services | 750 (53.1%) | 662 (46.9%) |
| Public Administration | 263 (65.9%) | 136 (34.1%) |
| Total | 8,831 (51.9%) | 8,188 (48.1%) |
Education in Lyon County
School Enrollment in Lyon County
The most common levels of schooling among the 9,734 students in Lyon County are college / undergraduate (3,504 | 36.0%), elementary school (1,856 | 19.1%), and high school (1,595 | 16.4%).
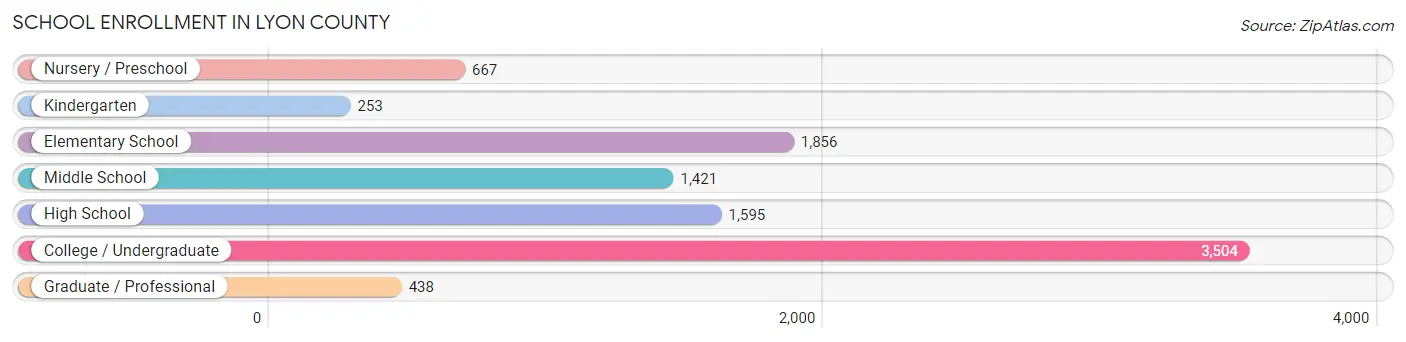
| School Level | # Students | % Students |
| Nursery / Preschool | 667 | 6.9% |
| Kindergarten | 253 | 2.6% |
| Elementary School | 1,856 | 19.1% |
| Middle School | 1,421 | 14.6% |
| High School | 1,595 | 16.4% |
| College / Undergraduate | 3,504 | 36.0% |
| Graduate / Professional | 438 | 4.5% |
| Total | 9,734 | 100.0% |
School Enrollment by Age by Funding Source in Lyon County
Out of a total of 9,734 students who are enrolled in schools in Lyon County, 467 (4.8%) attend a private institution, while the remaining 9,267 (95.2%) are enrolled in public schools. The age group of 3 to 4 year olds has the highest likelihood of being enrolled in private schools, with 143 (30.4% in the age bracket) enrolled. Conversely, the age group of 20 to 24 year olds has the lowest likelihood of being enrolled in a private school, with 2,434 (98.8% in the age bracket) attending a public institution.
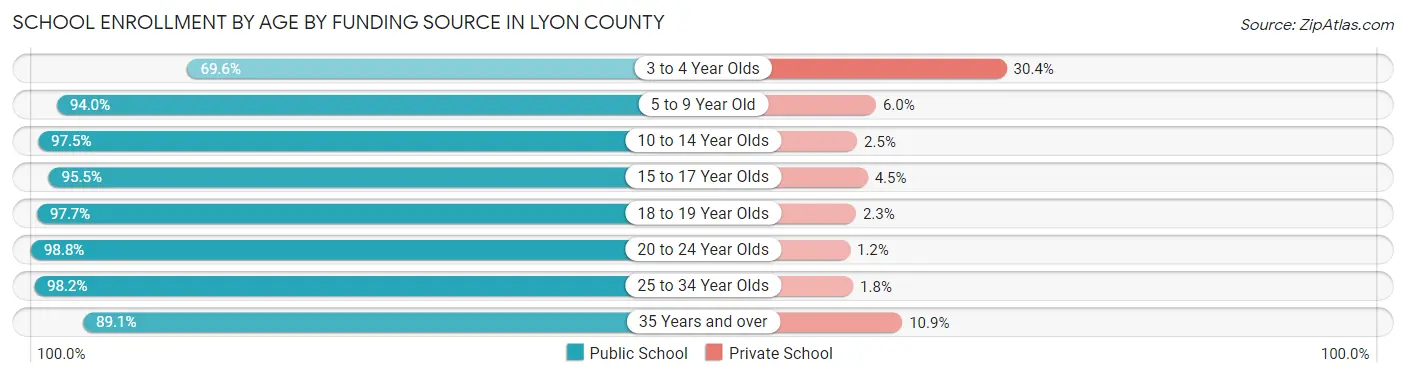
| Age Bracket | Public School | Private School |
| 3 to 4 Year Olds | 328 (69.6%) | 143 (30.4%) |
| 5 to 9 Year Old | 1,908 (94.0%) | 122 (6.0%) |
| 10 to 14 Year Olds | 1,823 (97.5%) | 47 (2.5%) |
| 15 to 17 Year Olds | 1,109 (95.5%) | 52 (4.5%) |
| 18 to 19 Year Olds | 937 (97.7%) | 22 (2.3%) |
| 20 to 24 Year Olds | 2,434 (98.8%) | 29 (1.2%) |
| 25 to 34 Year Olds | 388 (98.2%) | 7 (1.8%) |
| 35 Years and over | 343 (89.1%) | 42 (10.9%) |
| Total | 9,267 (95.2%) | 467 (4.8%) |
Educational Attainment by Field of Study in Lyon County
Education (1,218 | 22.2%), business (1,022 | 18.6%), science & technology (676 | 12.3%), bio, nature & agricultural (580 | 10.6%), and arts & humanities (426 | 7.7%) are the most common fields of study among 5,495 individuals in Lyon County who have obtained a bachelor's degree or higher.
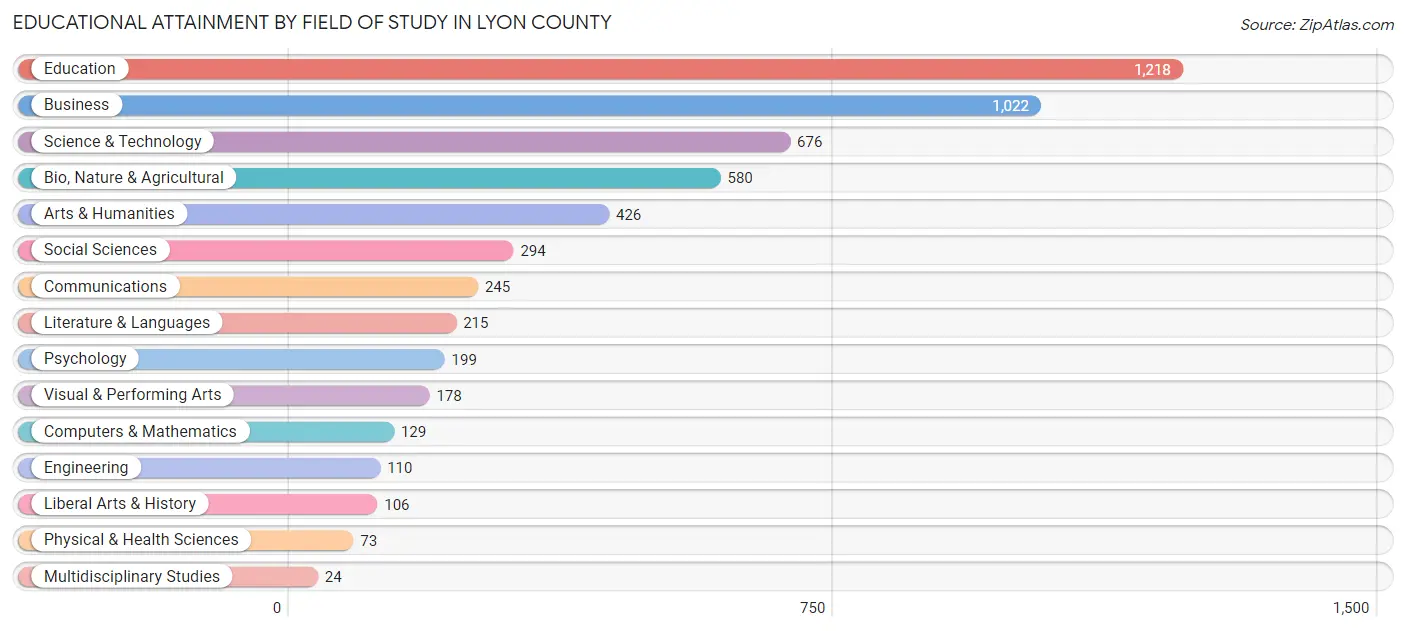
| Field of Study | # Graduates | % Graduates |
| Computers & Mathematics | 129 | 2.4% |
| Bio, Nature & Agricultural | 580 | 10.6% |
| Physical & Health Sciences | 73 | 1.3% |
| Psychology | 199 | 3.6% |
| Social Sciences | 294 | 5.3% |
| Engineering | 110 | 2.0% |
| Multidisciplinary Studies | 24 | 0.4% |
| Science & Technology | 676 | 12.3% |
| Business | 1,022 | 18.6% |
| Education | 1,218 | 22.2% |
| Literature & Languages | 215 | 3.9% |
| Liberal Arts & History | 106 | 1.9% |
| Visual & Performing Arts | 178 | 3.2% |
| Communications | 245 | 4.5% |
| Arts & Humanities | 426 | 7.7% |
| Total | 5,495 | 100.0% |
Transportation & Commute in Lyon County
Vehicle Availability by Sex in Lyon County
The most prevalent vehicle ownership categories in Lyon County are males with 2 vehicles (3,569, accounting for 42.2%) and females with 2 vehicles (3,286, making up 47.7%).
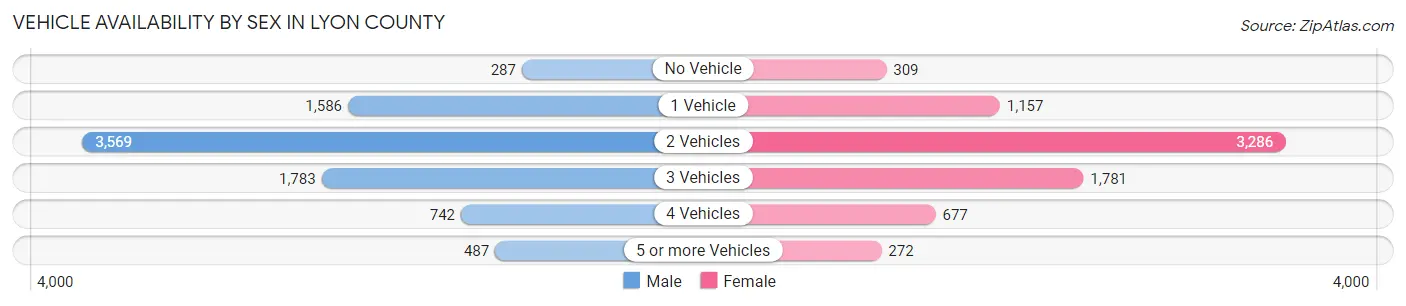
| Vehicles Available | Male | Female |
| No Vehicle | 287 (3.4%) | 309 (4.1%) |
| 1 Vehicle | 1,586 (18.8%) | 1,157 (15.5%) |
| 2 Vehicles | 3,569 (42.2%) | 3,286 (43.9%) |
| 3 Vehicles | 1,783 (21.1%) | 1,781 (23.8%) |
| 4 Vehicles | 742 (8.8%) | 677 (9.0%) |
| 5 or more Vehicles | 487 (5.8%) | 272 (3.6%) |
| Total | 8,454 (100.0%) | 7,482 (100.0%) |
Commute Time in Lyon County
The most frequently occuring commute durations in Lyon County are 5 to 9 minutes (5,211 commuters, 33.6%), 10 to 14 minutes (3,741 commuters, 24.1%), and 15 to 19 minutes (1,515 commuters, 9.8%).
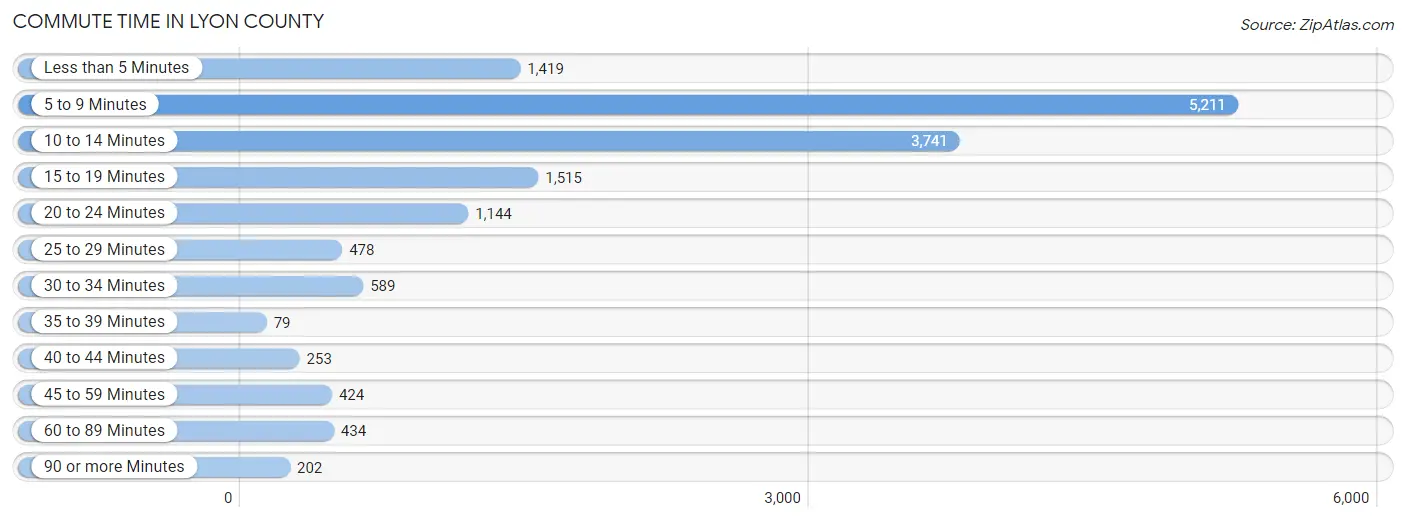
| Commute Time | # Commuters | % Commuters |
| Less than 5 Minutes | 1,419 | 9.2% |
| 5 to 9 Minutes | 5,211 | 33.6% |
| 10 to 14 Minutes | 3,741 | 24.1% |
| 15 to 19 Minutes | 1,515 | 9.8% |
| 20 to 24 Minutes | 1,144 | 7.4% |
| 25 to 29 Minutes | 478 | 3.1% |
| 30 to 34 Minutes | 589 | 3.8% |
| 35 to 39 Minutes | 79 | 0.5% |
| 40 to 44 Minutes | 253 | 1.6% |
| 45 to 59 Minutes | 424 | 2.7% |
| 60 to 89 Minutes | 434 | 2.8% |
| 90 or more Minutes | 202 | 1.3% |
Commute Time by Sex in Lyon County
The most common commute times in Lyon County are 5 to 9 minutes (2,529 commuters, 30.4%) for males and 5 to 9 minutes (2,682 commuters, 37.4%) for females.
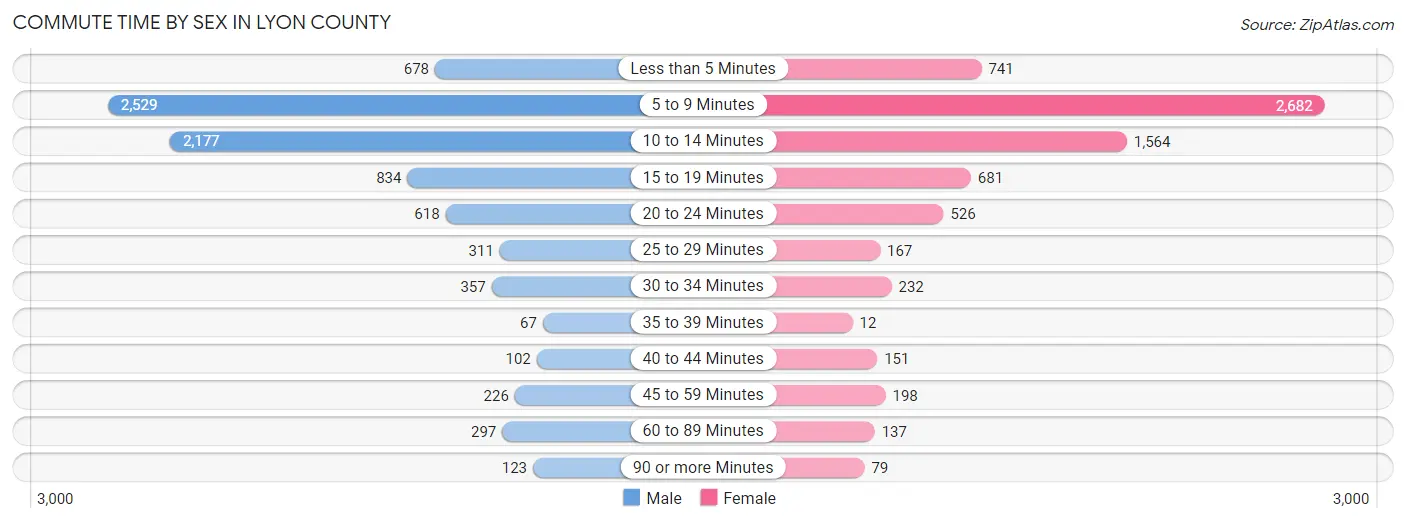
| Commute Time | Male | Female |
| Less than 5 Minutes | 678 (8.2%) | 741 (10.3%) |
| 5 to 9 Minutes | 2,529 (30.4%) | 2,682 (37.4%) |
| 10 to 14 Minutes | 2,177 (26.2%) | 1,564 (21.8%) |
| 15 to 19 Minutes | 834 (10.0%) | 681 (9.5%) |
| 20 to 24 Minutes | 618 (7.4%) | 526 (7.3%) |
| 25 to 29 Minutes | 311 (3.7%) | 167 (2.3%) |
| 30 to 34 Minutes | 357 (4.3%) | 232 (3.2%) |
| 35 to 39 Minutes | 67 (0.8%) | 12 (0.2%) |
| 40 to 44 Minutes | 102 (1.2%) | 151 (2.1%) |
| 45 to 59 Minutes | 226 (2.7%) | 198 (2.8%) |
| 60 to 89 Minutes | 297 (3.6%) | 137 (1.9%) |
| 90 or more Minutes | 123 (1.5%) | 79 (1.1%) |
Time of Departure to Work by Sex in Lyon County
The most frequent times of departure to work in Lyon County are 7:30 AM to 7:59 AM (1,392, 16.7%) for males and 7:30 AM to 7:59 AM (1,155, 16.1%) for females.
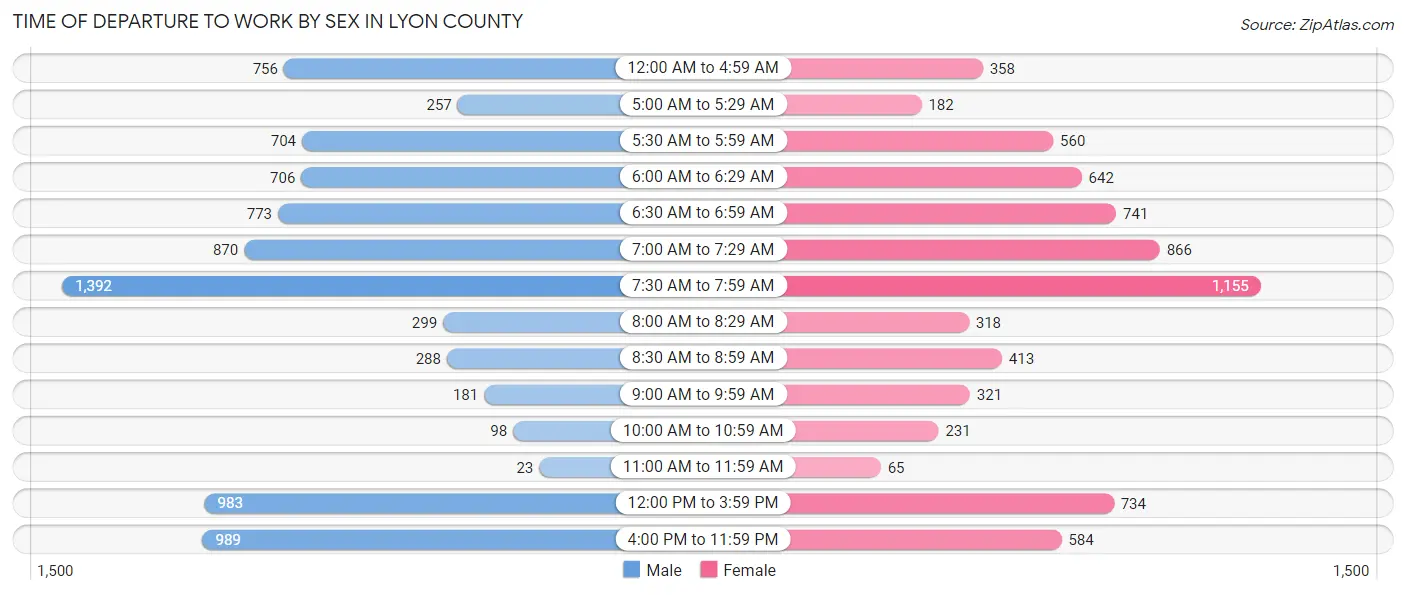
| Time of Departure | Male | Female |
| 12:00 AM to 4:59 AM | 756 (9.1%) | 358 (5.0%) |
| 5:00 AM to 5:29 AM | 257 (3.1%) | 182 (2.5%) |
| 5:30 AM to 5:59 AM | 704 (8.5%) | 560 (7.8%) |
| 6:00 AM to 6:29 AM | 706 (8.5%) | 642 (8.9%) |
| 6:30 AM to 6:59 AM | 773 (9.3%) | 741 (10.3%) |
| 7:00 AM to 7:29 AM | 870 (10.5%) | 866 (12.1%) |
| 7:30 AM to 7:59 AM | 1,392 (16.7%) | 1,155 (16.1%) |
| 8:00 AM to 8:29 AM | 299 (3.6%) | 318 (4.4%) |
| 8:30 AM to 8:59 AM | 288 (3.5%) | 413 (5.8%) |
| 9:00 AM to 9:59 AM | 181 (2.2%) | 321 (4.5%) |
| 10:00 AM to 10:59 AM | 98 (1.2%) | 231 (3.2%) |
| 11:00 AM to 11:59 AM | 23 (0.3%) | 65 (0.9%) |
| 12:00 PM to 3:59 PM | 983 (11.8%) | 734 (10.2%) |
| 4:00 PM to 11:59 PM | 989 (11.9%) | 584 (8.2%) |
| Total | 8,319 (100.0%) | 7,170 (100.0%) |
Housing Occupancy in Lyon County
Occupancy by Ownership in Lyon County
Of the total 13,223 dwellings in Lyon County, owner-occupied units account for 7,684 (58.1%), while renter-occupied units make up 5,539 (41.9%).
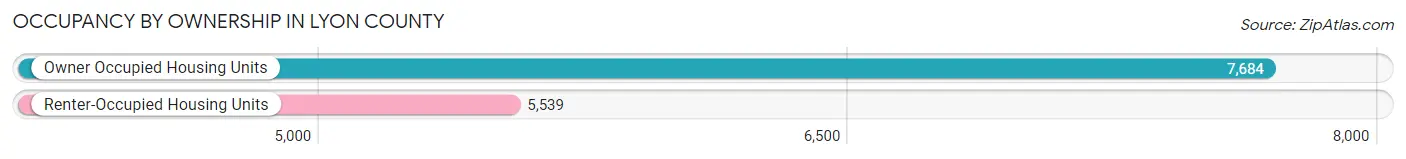
| Occupancy | # Housing Units | % Housing Units |
| Owner Occupied Housing Units | 7,684 | 58.1% |
| Renter-Occupied Housing Units | 5,539 | 41.9% |
| Total Occupied Housing Units | 13,223 | 100.0% |
Occupancy by Household Size in Lyon County
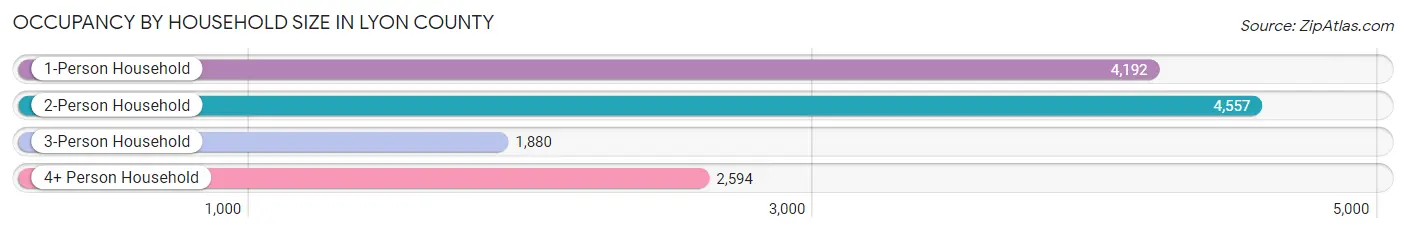
| Household Size | # Housing Units | % Housing Units |
| 1-Person Household | 4,192 | 31.7% |
| 2-Person Household | 4,557 | 34.5% |
| 3-Person Household | 1,880 | 14.2% |
| 4+ Person Household | 2,594 | 19.6% |
| Total Housing Units | 13,223 | 100.0% |
Occupancy by Ownership by Household Size in Lyon County
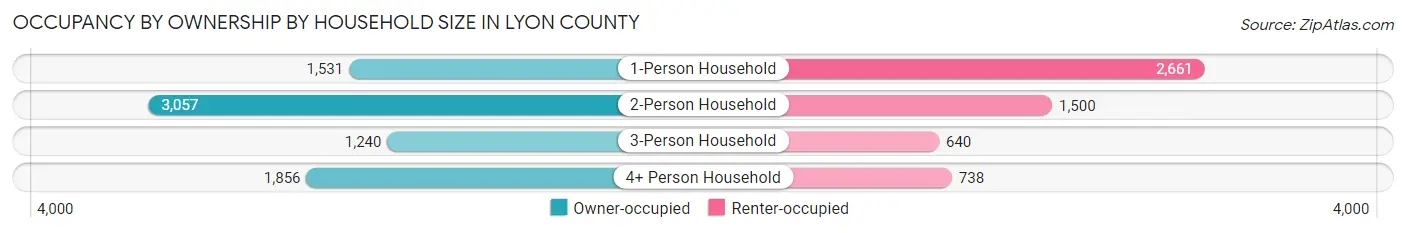
| Household Size | Owner-occupied | Renter-occupied |
| 1-Person Household | 1,531 (36.5%) | 2,661 (63.5%) |
| 2-Person Household | 3,057 (67.1%) | 1,500 (32.9%) |
| 3-Person Household | 1,240 (66.0%) | 640 (34.0%) |
| 4+ Person Household | 1,856 (71.6%) | 738 (28.4%) |
| Total Housing Units | 7,684 (58.1%) | 5,539 (41.9%) |
Occupancy by Educational Attainment in Lyon County
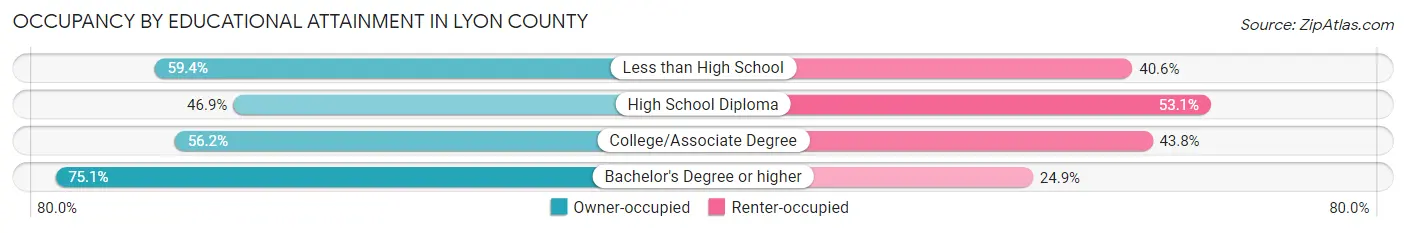
| Household Size | Owner-occupied | Renter-occupied |
| Less than High School | 722 (59.4%) | 494 (40.6%) |
| High School Diploma | 1,979 (46.9%) | 2,239 (53.1%) |
| College/Associate Degree | 2,577 (56.2%) | 2,010 (43.8%) |
| Bachelor's Degree or higher | 2,406 (75.1%) | 796 (24.9%) |
Occupancy by Age of Householder in Lyon County
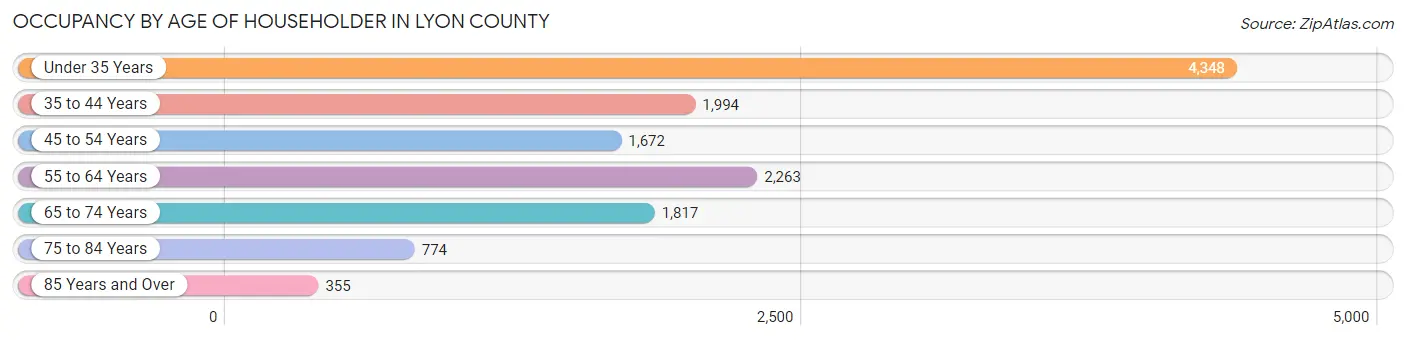
| Age Bracket | # Households | % Households |
| Under 35 Years | 4,348 | 32.9% |
| 35 to 44 Years | 1,994 | 15.1% |
| 45 to 54 Years | 1,672 | 12.6% |
| 55 to 64 Years | 2,263 | 17.1% |
| 65 to 74 Years | 1,817 | 13.7% |
| 75 to 84 Years | 774 | 5.9% |
| 85 Years and Over | 355 | 2.7% |
| Total | 13,223 | 100.0% |
Housing Finances in Lyon County
Median Income by Occupancy in Lyon County
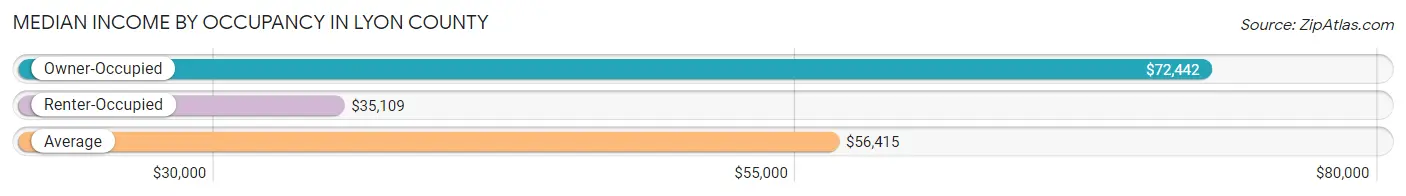
| Occupancy Type | # Households | Median Income |
| Owner-Occupied | 7,684 (58.1%) | $72,442 |
| Renter-Occupied | 5,539 (41.9%) | $35,109 |
| Average | 13,223 (100.0%) | $56,415 |
Occupancy by Householder Income Bracket in Lyon County
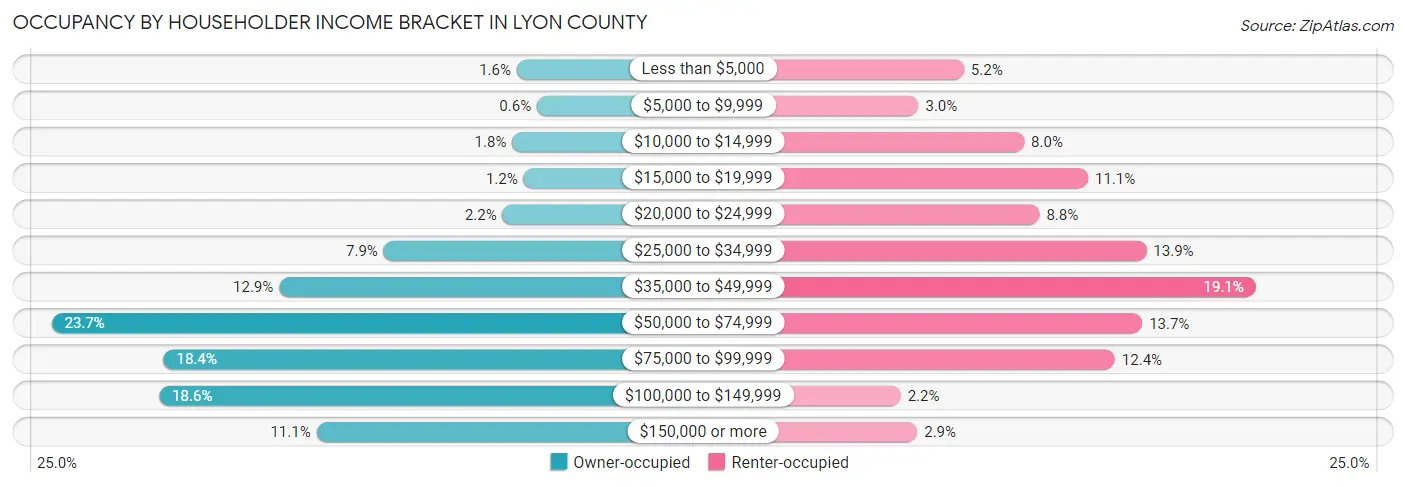
| Income Bracket | Owner-occupied | Renter-occupied |
| Less than $5,000 | 120 (1.6%) | 286 (5.2%) |
| $5,000 to $9,999 | 46 (0.6%) | 166 (3.0%) |
| $10,000 to $14,999 | 137 (1.8%) | 445 (8.0%) |
| $15,000 to $19,999 | 95 (1.2%) | 613 (11.1%) |
| $20,000 to $24,999 | 172 (2.2%) | 485 (8.8%) |
| $25,000 to $34,999 | 607 (7.9%) | 767 (13.9%) |
| $35,000 to $49,999 | 990 (12.9%) | 1,055 (19.1%) |
| $50,000 to $74,999 | 1,823 (23.7%) | 756 (13.7%) |
| $75,000 to $99,999 | 1,412 (18.4%) | 684 (12.3%) |
| $100,000 to $149,999 | 1,429 (18.6%) | 119 (2.1%) |
| $150,000 or more | 853 (11.1%) | 163 (2.9%) |
| Total | 7,684 (100.0%) | 5,539 (100.0%) |
Monthly Housing Cost Tiers in Lyon County
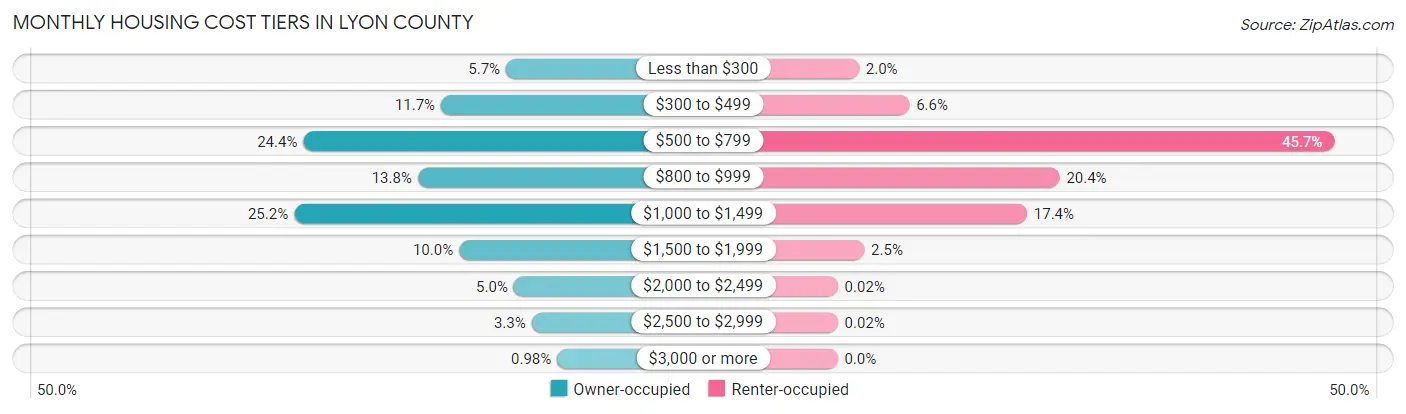
| Monthly Cost | Owner-occupied | Renter-occupied |
| Less than $300 | 437 (5.7%) | 109 (2.0%) |
| $300 to $499 | 897 (11.7%) | 366 (6.6%) |
| $500 to $799 | 1,871 (24.3%) | 2,533 (45.7%) |
| $800 to $999 | 1,061 (13.8%) | 1,132 (20.4%) |
| $1,000 to $1,499 | 1,936 (25.2%) | 966 (17.4%) |
| $1,500 to $1,999 | 769 (10.0%) | 136 (2.5%) |
| $2,000 to $2,499 | 382 (5.0%) | 1 (0.0%) |
| $2,500 to $2,999 | 256 (3.3%) | 1 (0.0%) |
| $3,000 or more | 75 (1.0%) | 0 (0.0%) |
| Total | 7,684 (100.0%) | 5,539 (100.0%) |
Physical Housing Characteristics in Lyon County
Housing Structures in Lyon County
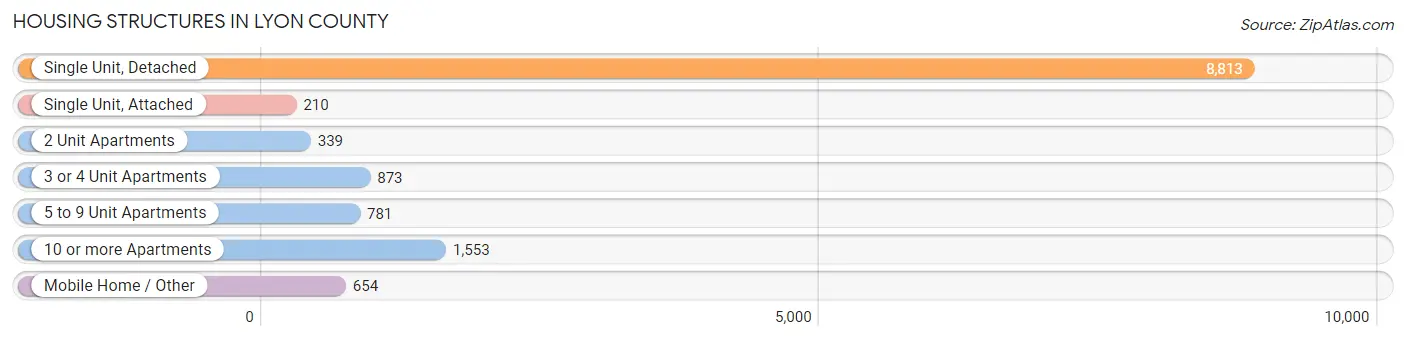
| Structure Type | # Housing Units | % Housing Units |
| Single Unit, Detached | 8,813 | 66.6% |
| Single Unit, Attached | 210 | 1.6% |
| 2 Unit Apartments | 339 | 2.6% |
| 3 or 4 Unit Apartments | 873 | 6.6% |
| 5 to 9 Unit Apartments | 781 | 5.9% |
| 10 or more Apartments | 1,553 | 11.7% |
| Mobile Home / Other | 654 | 5.0% |
| Total | 13,223 | 100.0% |
Housing Structures by Occupancy in Lyon County
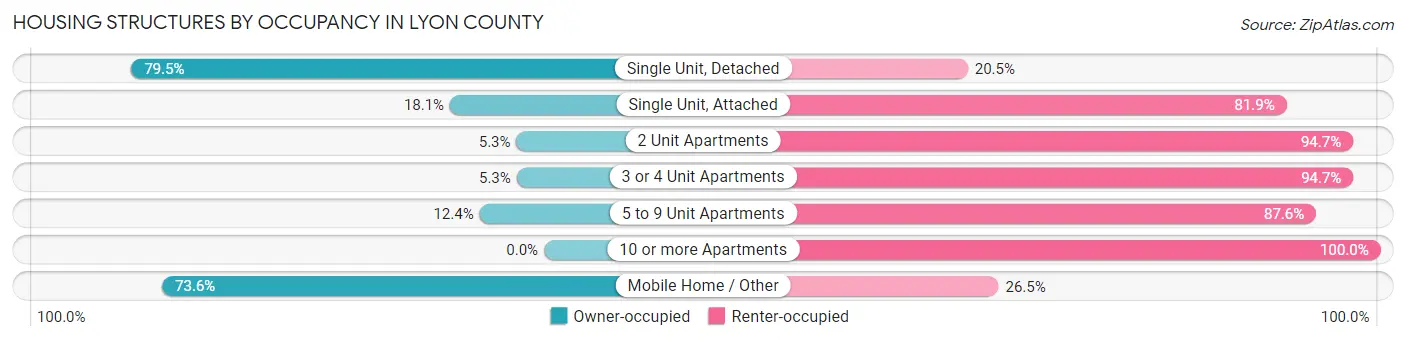
| Structure Type | Owner-occupied | Renter-occupied |
| Single Unit, Detached | 7,004 (79.5%) | 1,809 (20.5%) |
| Single Unit, Attached | 38 (18.1%) | 172 (81.9%) |
| 2 Unit Apartments | 18 (5.3%) | 321 (94.7%) |
| 3 or 4 Unit Apartments | 46 (5.3%) | 827 (94.7%) |
| 5 to 9 Unit Apartments | 97 (12.4%) | 684 (87.6%) |
| 10 or more Apartments | 0 (0.0%) | 1,553 (100.0%) |
| Mobile Home / Other | 481 (73.6%) | 173 (26.5%) |
| Total | 7,684 (58.1%) | 5,539 (41.9%) |
Housing Structures by Number of Rooms in Lyon County
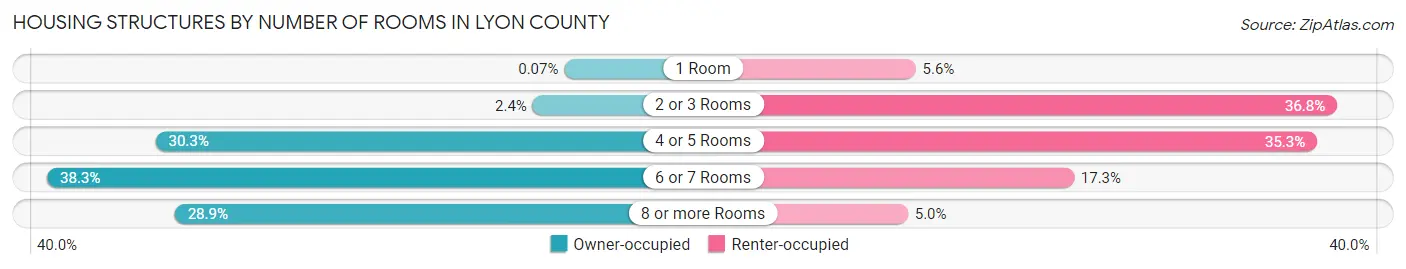
| Number of Rooms | Owner-occupied | Renter-occupied |
| 1 Room | 5 (0.1%) | 310 (5.6%) |
| 2 or 3 Rooms | 185 (2.4%) | 2,037 (36.8%) |
| 4 or 5 Rooms | 2,329 (30.3%) | 1,955 (35.3%) |
| 6 or 7 Rooms | 2,945 (38.3%) | 959 (17.3%) |
| 8 or more Rooms | 2,220 (28.9%) | 278 (5.0%) |
| Total | 7,684 (100.0%) | 5,539 (100.0%) |
Housing Structure by Heating Type in Lyon County
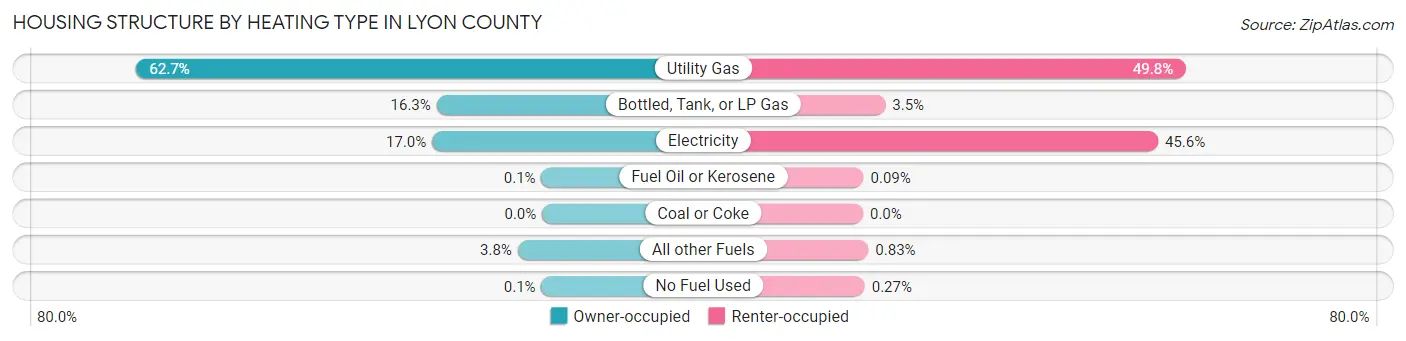
| Heating Type | Owner-occupied | Renter-occupied |
| Utility Gas | 4,819 (62.7%) | 2,756 (49.8%) |
| Bottled, Tank, or LP Gas | 1,253 (16.3%) | 191 (3.5%) |
| Electricity | 1,306 (17.0%) | 2,526 (45.6%) |
| Fuel Oil or Kerosene | 8 (0.1%) | 5 (0.1%) |
| Coal or Coke | 0 (0.0%) | 0 (0.0%) |
| All other Fuels | 290 (3.8%) | 46 (0.8%) |
| No Fuel Used | 8 (0.1%) | 15 (0.3%) |
| Total | 7,684 (100.0%) | 5,539 (100.0%) |
Household Vehicle Usage in Lyon County
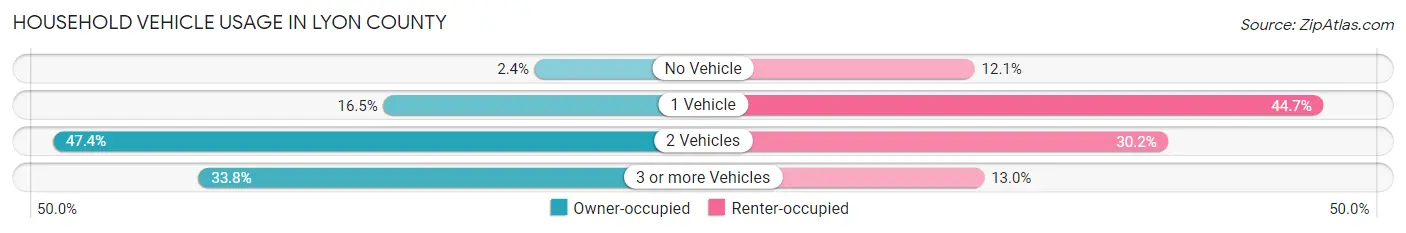
| Vehicles per Household | Owner-occupied | Renter-occupied |
| No Vehicle | 182 (2.4%) | 671 (12.1%) |
| 1 Vehicle | 1,267 (16.5%) | 2,475 (44.7%) |
| 2 Vehicles | 3,639 (47.4%) | 1,673 (30.2%) |
| 3 or more Vehicles | 2,596 (33.8%) | 720 (13.0%) |
| Total | 7,684 (100.0%) | 5,539 (100.0%) |
Real Estate & Mortgages in Lyon County
Real Estate and Mortgage Overview in Lyon County
| Characteristic | Without Mortgage | With Mortgage |
| Housing Units | 3,476 | 4,208 |
| Median Property Value | $129,800 | $142,100 |
| Median Household Income | $64,430 | $512 |
| Monthly Housing Costs | $591 | $71 |
| Real Estate Taxes | $2,058 | $111 |
Property Value by Mortgage Status in Lyon County
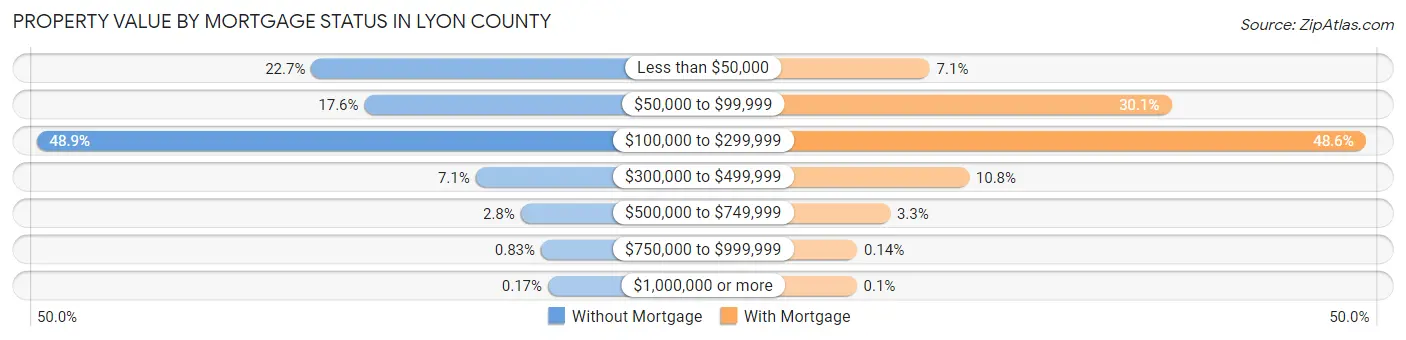
| Property Value | Without Mortgage | With Mortgage |
| Less than $50,000 | 789 (22.7%) | 297 (7.1%) |
| $50,000 to $99,999 | 613 (17.6%) | 1,265 (30.1%) |
| $100,000 to $299,999 | 1,698 (48.8%) | 2,044 (48.6%) |
| $300,000 to $499,999 | 245 (7.0%) | 454 (10.8%) |
| $500,000 to $749,999 | 96 (2.8%) | 138 (3.3%) |
| $750,000 to $999,999 | 29 (0.8%) | 6 (0.1%) |
| $1,000,000 or more | 6 (0.2%) | 4 (0.1%) |
| Total | 3,476 (100.0%) | 4,208 (100.0%) |
Household Income by Mortgage Status in Lyon County
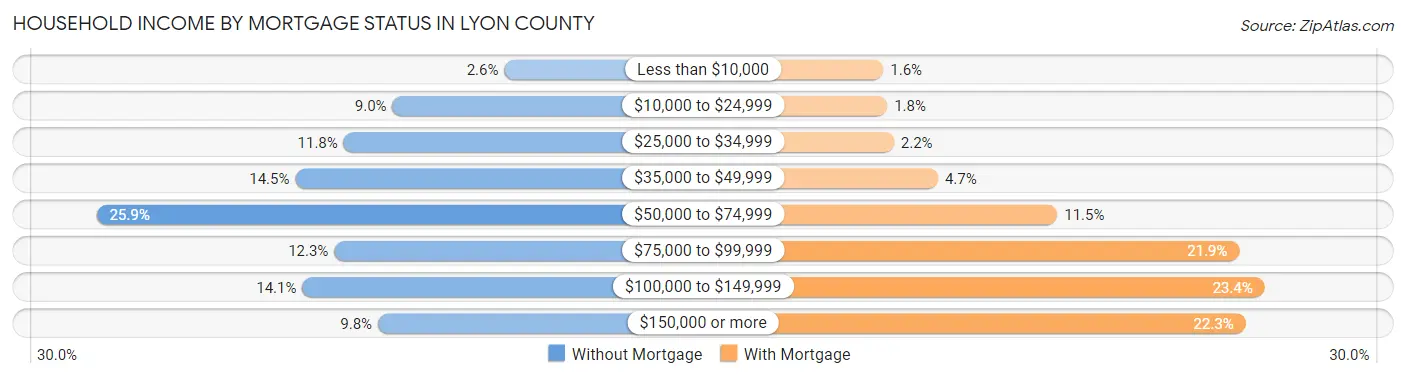
| Household Income | Without Mortgage | With Mortgage |
| Less than $10,000 | 90 (2.6%) | 67 (1.6%) |
| $10,000 to $24,999 | 312 (9.0%) | 76 (1.8%) |
| $25,000 to $34,999 | 409 (11.8%) | 92 (2.2%) |
| $35,000 to $49,999 | 505 (14.5%) | 198 (4.7%) |
| $50,000 to $74,999 | 900 (25.9%) | 485 (11.5%) |
| $75,000 to $99,999 | 428 (12.3%) | 923 (21.9%) |
| $100,000 to $149,999 | 491 (14.1%) | 984 (23.4%) |
| $150,000 or more | 341 (9.8%) | 938 (22.3%) |
| Total | 3,476 (100.0%) | 4,208 (100.0%) |
Property Value to Household Income Ratio in Lyon County
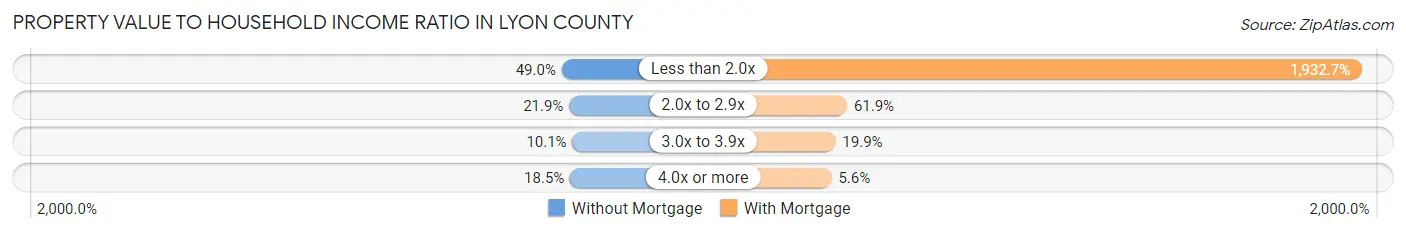
| Value-to-Income Ratio | Without Mortgage | With Mortgage |
| Less than 2.0x | 1,704 (49.0%) | 81,327 (1,932.7%) |
| 2.0x to 2.9x | 760 (21.9%) | 2,603 (61.9%) |
| 3.0x to 3.9x | 352 (10.1%) | 838 (19.9%) |
| 4.0x or more | 642 (18.5%) | 235 (5.6%) |
| Total | 3,476 (100.0%) | 4,208 (100.0%) |
Real Estate Taxes by Mortgage Status in Lyon County
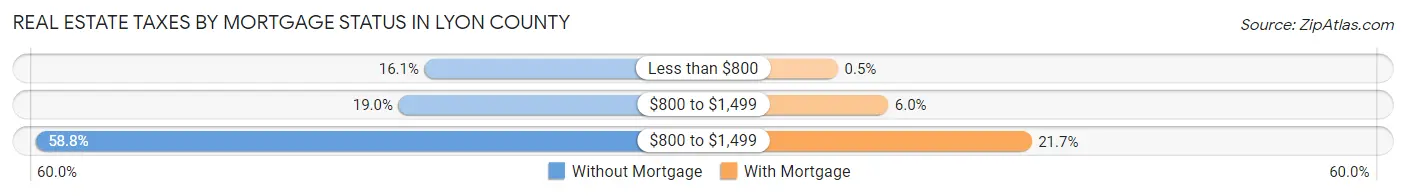
| Property Taxes | Without Mortgage | With Mortgage |
| Less than $800 | 561 (16.1%) | 21 (0.5%) |
| $800 to $1,499 | 660 (19.0%) | 253 (6.0%) |
| $800 to $1,499 | 2,045 (58.8%) | 914 (21.7%) |
| Total | 3,476 (100.0%) | 4,208 (100.0%) |
Health & Disability in Lyon County
Health Insurance Coverage by Age in Lyon County
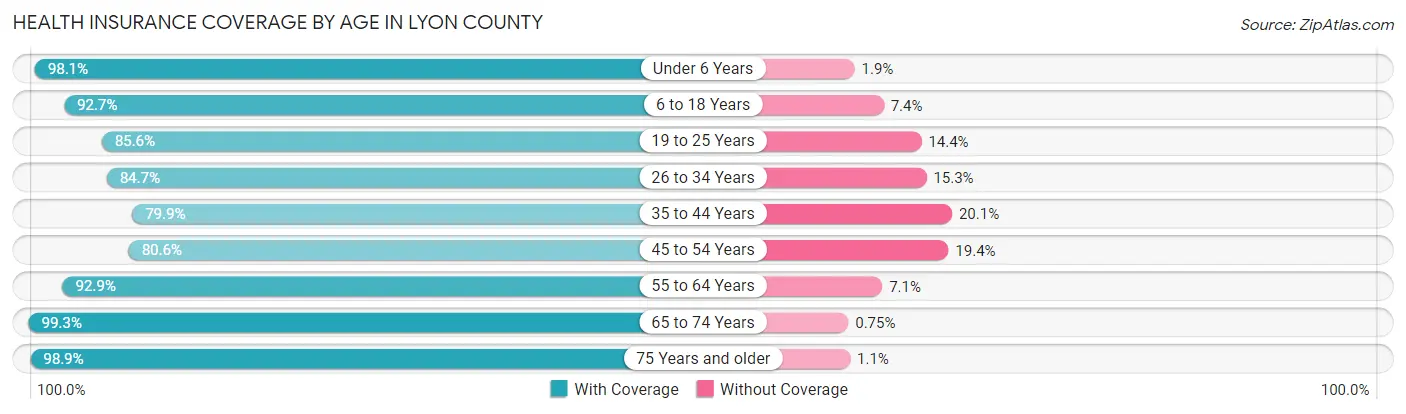
| Age Bracket | With Coverage | Without Coverage |
| Under 6 Years | 2,248 (98.1%) | 44 (1.9%) |
| 6 to 18 Years | 5,069 (92.6%) | 402 (7.3%) |
| 19 to 25 Years | 4,682 (85.6%) | 787 (14.4%) |
| 26 to 34 Years | 2,991 (84.7%) | 541 (15.3%) |
| 35 to 44 Years | 2,726 (79.9%) | 685 (20.1%) |
| 45 to 54 Years | 2,518 (80.6%) | 607 (19.4%) |
| 55 to 64 Years | 3,511 (92.9%) | 267 (7.1%) |
| 65 to 74 Years | 2,796 (99.3%) | 21 (0.7%) |
| 75 Years and older | 1,826 (98.9%) | 20 (1.1%) |
| Total | 28,367 (89.4%) | 3,374 (10.6%) |
Health Insurance Coverage by Citizenship Status in Lyon County
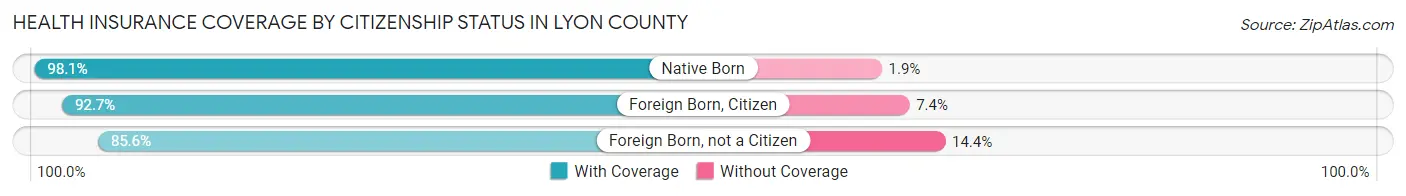
| Citizenship Status | With Coverage | Without Coverage |
| Native Born | 2,248 (98.1%) | 44 (1.9%) |
| Foreign Born, Citizen | 5,069 (92.6%) | 402 (7.3%) |
| Foreign Born, not a Citizen | 4,682 (85.6%) | 787 (14.4%) |
Health Insurance Coverage by Household Income in Lyon County
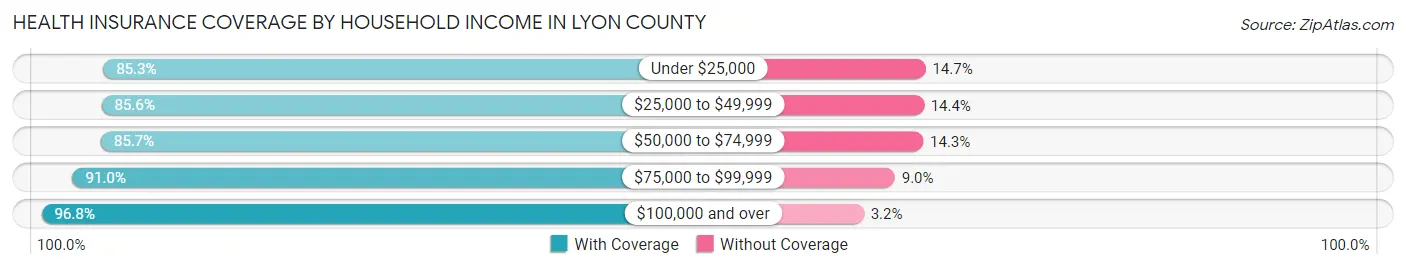
| Household Income | With Coverage | Without Coverage |
| Under $25,000 | 3,628 (85.3%) | 627 (14.7%) |
| $25,000 to $49,999 | 5,879 (85.6%) | 990 (14.4%) |
| $50,000 to $74,999 | 5,345 (85.7%) | 892 (14.3%) |
| $75,000 to $99,999 | 5,205 (91.0%) | 514 (9.0%) |
| $100,000 and over | 7,579 (96.8%) | 248 (3.2%) |
Public vs Private Health Insurance Coverage by Age in Lyon County
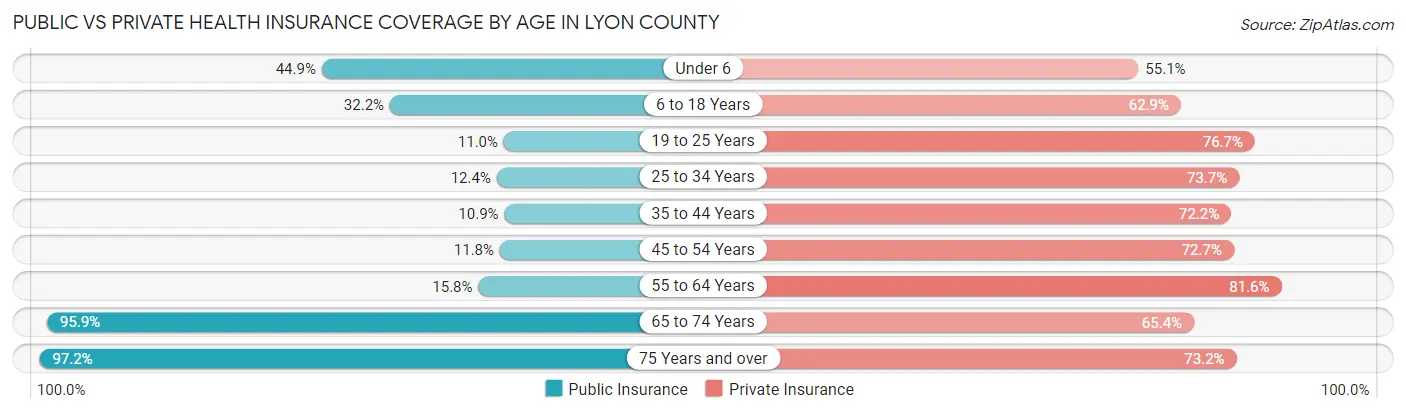
| Age Bracket | Public Insurance | Private Insurance |
| Under 6 | 1,028 (44.9%) | 1,262 (55.1%) |
| 6 to 18 Years | 1,761 (32.2%) | 3,443 (62.9%) |
| 19 to 25 Years | 604 (11.0%) | 4,192 (76.6%) |
| 25 to 34 Years | 437 (12.4%) | 2,604 (73.7%) |
| 35 to 44 Years | 373 (10.9%) | 2,464 (72.2%) |
| 45 to 54 Years | 368 (11.8%) | 2,273 (72.7%) |
| 55 to 64 Years | 596 (15.8%) | 3,082 (81.6%) |
| 65 to 74 Years | 2,700 (95.9%) | 1,841 (65.3%) |
| 75 Years and over | 1,795 (97.2%) | 1,352 (73.2%) |
| Total | 9,662 (30.4%) | 22,513 (70.9%) |
Disability Status by Sex by Age in Lyon County
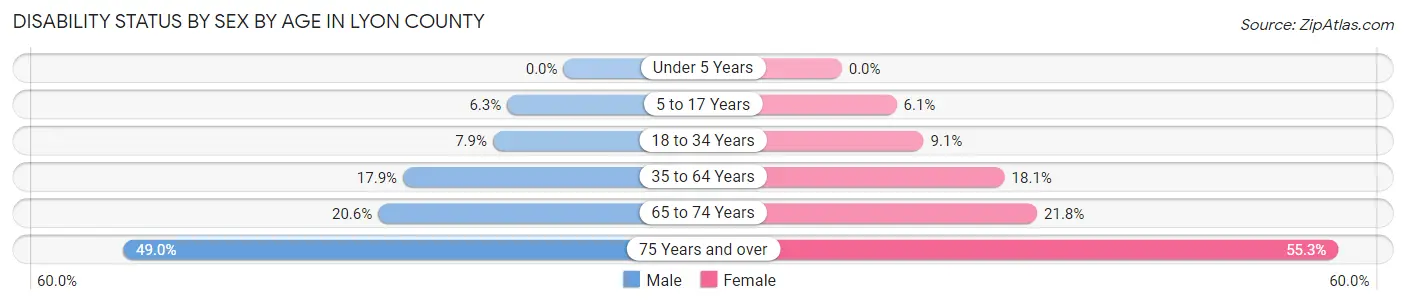
| Age Bracket | Male | Female |
| Under 5 Years | 0 (0.0%) | 0 (0.0%) |
| 5 to 17 Years | 166 (6.3%) | 158 (6.1%) |
| 18 to 34 Years | 359 (7.9%) | 463 (9.1%) |
| 35 to 64 Years | 917 (17.9%) | 940 (18.1%) |
| 65 to 74 Years | 291 (20.6%) | 306 (21.7%) |
| 75 Years and over | 380 (49.0%) | 592 (55.3%) |
Disability Class by Sex by Age in Lyon County
Disability Class: Hearing Difficulty
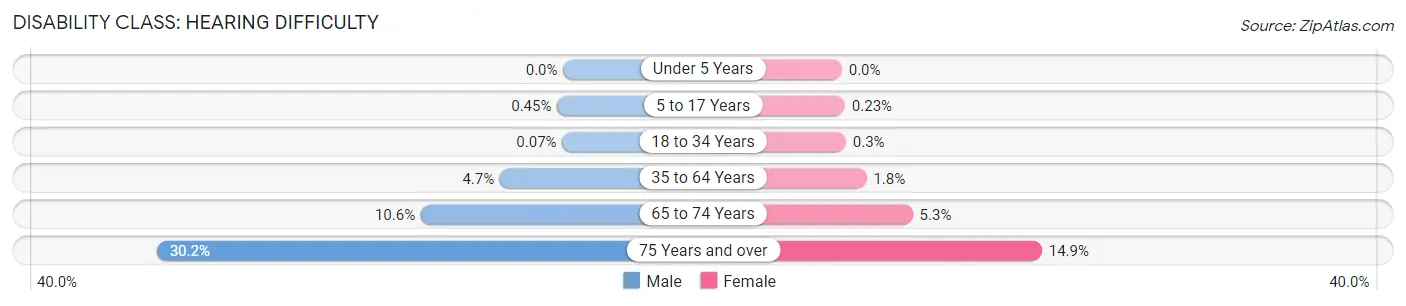
| Age Bracket | Male | Female |
| Under 5 Years | 0 (0.0%) | 0 (0.0%) |
| 5 to 17 Years | 12 (0.4%) | 6 (0.2%) |
| 18 to 34 Years | 3 (0.1%) | 15 (0.3%) |
| 35 to 64 Years | 241 (4.7%) | 95 (1.8%) |
| 65 to 74 Years | 149 (10.6%) | 74 (5.3%) |
| 75 Years and over | 234 (30.2%) | 159 (14.8%) |
Disability Class: Vision Difficulty
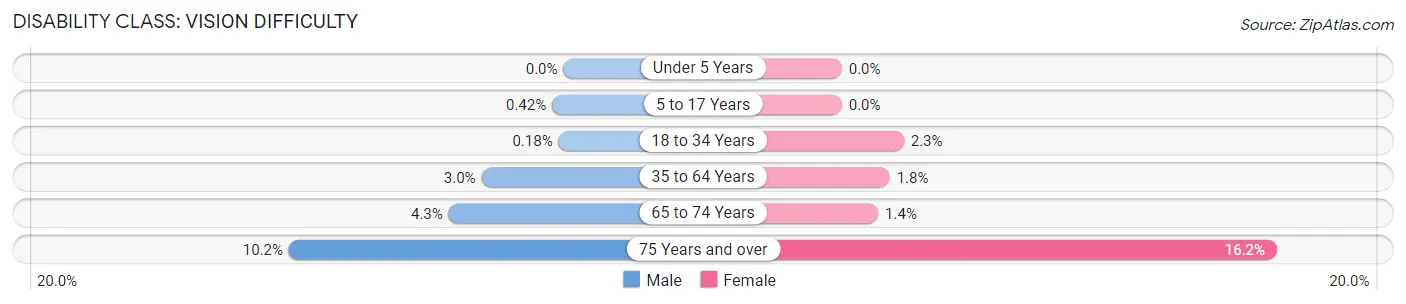
| Age Bracket | Male | Female |
| Under 5 Years | 0 (0.0%) | 0 (0.0%) |
| 5 to 17 Years | 11 (0.4%) | 0 (0.0%) |
| 18 to 34 Years | 8 (0.2%) | 117 (2.3%) |
| 35 to 64 Years | 156 (3.0%) | 92 (1.8%) |
| 65 to 74 Years | 60 (4.3%) | 19 (1.3%) |
| 75 Years and over | 79 (10.2%) | 173 (16.2%) |
Disability Class: Cognitive Difficulty
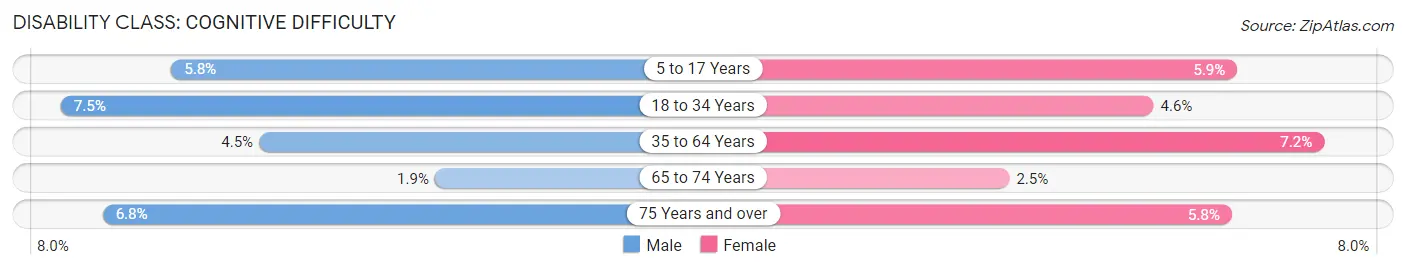
| Age Bracket | Male | Female |
| 5 to 17 Years | 154 (5.8%) | 152 (5.9%) |
| 18 to 34 Years | 341 (7.5%) | 235 (4.6%) |
| 35 to 64 Years | 232 (4.5%) | 371 (7.2%) |
| 65 to 74 Years | 27 (1.9%) | 35 (2.5%) |
| 75 Years and over | 53 (6.8%) | 62 (5.8%) |
Disability Class: Ambulatory Difficulty
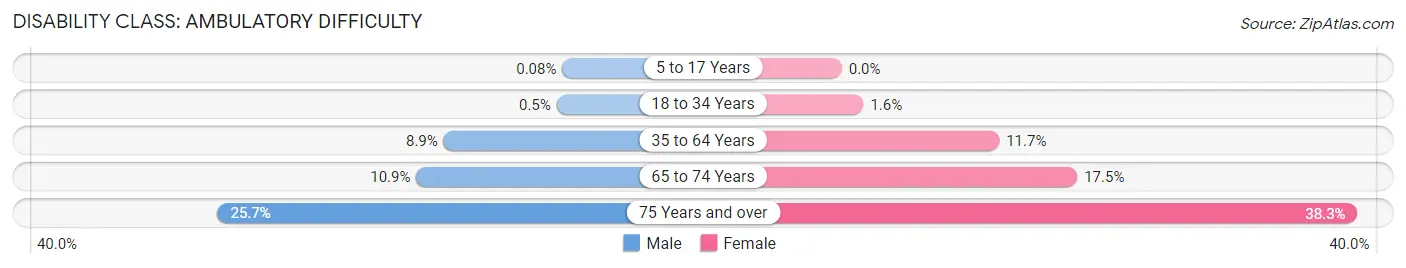
| Age Bracket | Male | Female |
| 5 to 17 Years | 2 (0.1%) | 0 (0.0%) |
| 18 to 34 Years | 23 (0.5%) | 82 (1.6%) |
| 35 to 64 Years | 456 (8.9%) | 606 (11.7%) |
| 65 to 74 Years | 154 (10.9%) | 246 (17.5%) |
| 75 Years and over | 199 (25.7%) | 410 (38.3%) |
Disability Class: Self-Care Difficulty
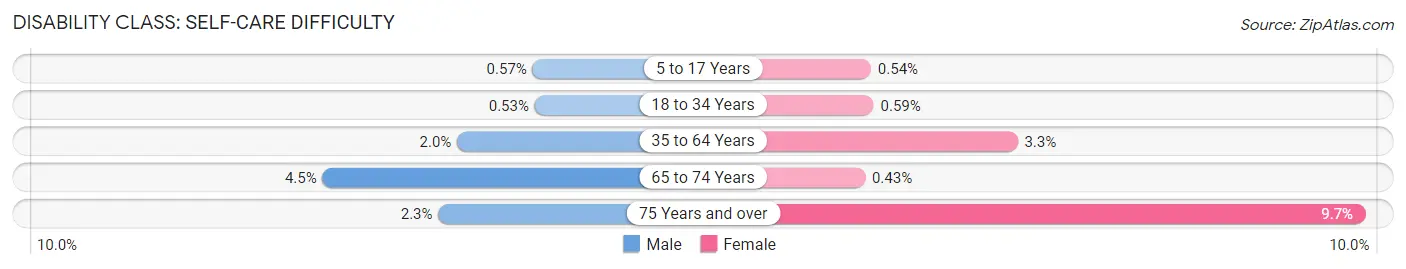
| Age Bracket | Male | Female |
| 5 to 17 Years | 15 (0.6%) | 14 (0.5%) |
| 18 to 34 Years | 24 (0.5%) | 30 (0.6%) |
| 35 to 64 Years | 101 (2.0%) | 169 (3.3%) |
| 65 to 74 Years | 63 (4.5%) | 6 (0.4%) |
| 75 Years and over | 18 (2.3%) | 104 (9.7%) |
Technology Access in Lyon County
Computing Device Access in Lyon County
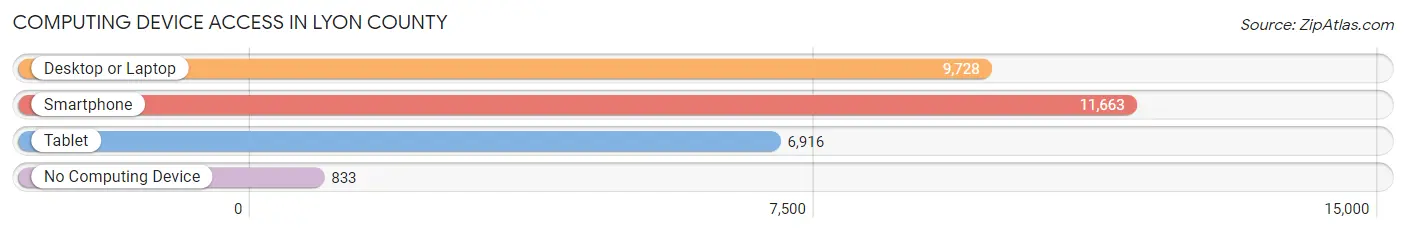
| Device Type | # Households | % Households |
| Desktop or Laptop | 9,728 | 73.6% |
| Smartphone | 11,663 | 88.2% |
| Tablet | 6,916 | 52.3% |
| No Computing Device | 833 | 6.3% |
| Total | 13,223 | 100.0% |
Internet Access in Lyon County
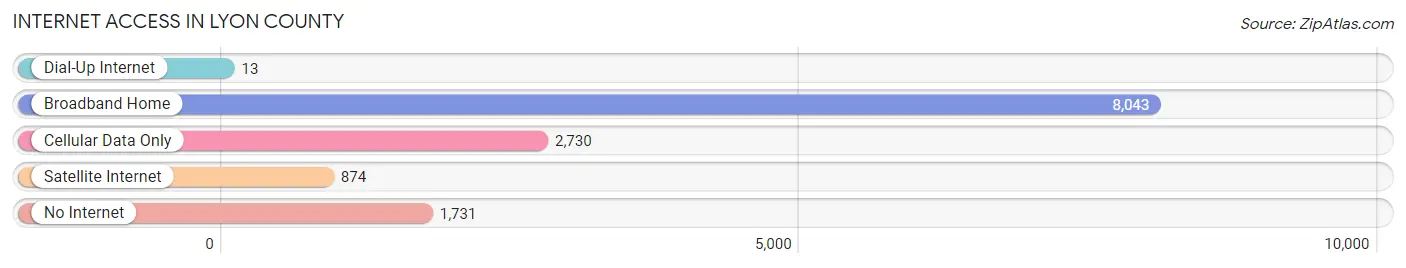
| Internet Type | # Households | % Households |
| Dial-Up Internet | 13 | 0.1% |
| Broadband Home | 8,043 | 60.8% |
| Cellular Data Only | 2,730 | 20.6% |
| Satellite Internet | 874 | 6.6% |
| No Internet | 1,731 | 13.1% |
| Total | 13,223 | 100.0% |
Lyon County Summary
Lyon County, Kansas is located in the east-central part of the state, and is bordered by Coffey County to the north, Osage County to the east, Greenwood County to the south, and Chase and Morris counties to the west. The county seat is Emporia, and the county was named after General Nathaniel Lyon, who was killed in the Civil War. The county has a total area of 576 square miles, and a population of 33,690 as of the 2010 census.
Geography
Lyon County is located in the Flint Hills region of Kansas, and is characterized by rolling hills and prairies. The county is drained by the Cottonwood River, which flows through the county from north to south. The county is also home to several small lakes, including Lake Wabaunsee, Lake Afton, and Lake Emporia.
The county is divided into two distinct regions: the eastern part of the county is part of the Osage Plains, while the western part is part of the Flint Hills. The eastern part of the county is generally flat, while the western part is characterized by rolling hills and prairies. The highest point in the county is located in the western part, at an elevation of 1,400 feet.
Economy
Lyon County is primarily an agricultural county, with the majority of the land being used for farming and ranching. The county is home to several large farms, including the Lyon County Farm Bureau, which is the largest farm in the county. The county is also home to several small businesses, including a number of retail stores, restaurants, and other services.
The county is also home to several manufacturing companies, including the Emporia-based company, Cargill, which produces animal feed and other agricultural products. The county is also home to several energy companies, including the Emporia-based company, Kansas Power and Light, which produces electricity for the region.
Demographics
As of the 2010 census, the population of Lyon County was 33,690, with a population density of 58.7 people per square mile. The racial makeup of the county was 92.3% White, 3.2% African American, 0.7% Native American, 0.7% Asian, 0.1% Pacific Islander, 1.2% from other races, and 2.0% from two or more races. Hispanic or Latino of any race were 3.7% of the population.
The median income for a household in the county was $41,945, and the median income for a family was $50,945. The per capita income for the county was $20,945. About 11.2% of families and 14.7% of the population were below the poverty line, including 19.2% of those under age 18 and 8.2% of those age 65 or over.
Conclusion
Lyon County, Kansas is a rural county located in the east-central part of the state. The county is characterized by rolling hills and prairies, and is primarily an agricultural county. The county has a population of 33,690, and is home to several small businesses and manufacturing companies. The median income for a household in the county is $41,945, and the per capita income is $20,945.
Common Questions
What is the Total Population of Lyon County?
Total Population of Lyon County is 32,182.
What is the Total Male Population of Lyon County?
Total Male Population of Lyon County is 15,699.
What is the Total Female Population of Lyon County?
Total Female Population of Lyon County is 16,483.
What is the Ratio of Males per 100 Females in Lyon County?
There are 95.24 Males per 100 Females in Lyon County.
What is the Ratio of Females per 100 Males in Lyon County?
There are 104.99 Females per 100 Males in Lyon County.
What is the Median Population Age in Lyon County?
Median Population Age in Lyon County is 32.9 Years.
What is the Average Family Size in Lyon County
Average Family Size in Lyon County is 3.0 People.
What is the Average Household Size in Lyon County
Average Household Size in Lyon County is 2.4 People.
What is Per Capita Income in Lyon County?
Per Capita income in Lyon County is $29,425.
What is the Median Family Income in Lyon County?
Median Family Income in Lyon County is $74,923.
What is the Median Household income in Lyon County?
Median Household Income in Lyon County is $56,415.
What is Income or Wage Gap in Lyon County?
Income or Wage Gap in Lyon County is 39.8%.
Women in Lyon County earn 60.2 cents for every dollar earned by a man.
What is Family Income Deficit in Lyon County?
Family Income Deficit in Lyon County is $11,341.
Families that are below poverty line in Lyon County earn $11,341 less on average than the poverty threshold level.
What is Inequality or Gini Index in Lyon County?
Inequality or Gini Index in Lyon County is 0.43.
How Large is the Labor Force in Lyon County?
There are 17,608 People in the Labor Forcein in Lyon County.
What is the Percentage of People in the Labor Force in Lyon County?
68.2% of People are in the Labor Force in Lyon County.
What is the Unemployment Rate in Lyon County?
Unemployment Rate in Lyon County is 2.7%.