Lincoln County, KS
Lincoln County Map
Lincoln County Overview
2,929
TOTAL POPULATION
1,494
MALE POPULATION
1,435
FEMALE POPULATION
104.11
MALES / 100 FEMALES
96.05
FEMALES / 100 MALES
44.6
MEDIAN AGE
3.2
AVG FAMILY SIZE
2.4
AVG HOUSEHOLD SIZE
$31,383
PER CAPITA INCOME
$69,722
AVG FAMILY INCOME
$52,540
AVG HOUSEHOLD INCOME
25.0%
WAGE / INCOME GAP [ % ]
75.0¢/ $1
WAGE / INCOME GAP [ $ ]
$8,581
FAMILY INCOME DEFICIT
0.44
INEQUALITY / GINI INDEX
1,460
LABOR FORCE [ PEOPLE ]
61.9%
PERCENT IN LABOR FORCE
1.8%
UNEMPLOYMENT RATE
Lincoln County Area Codes
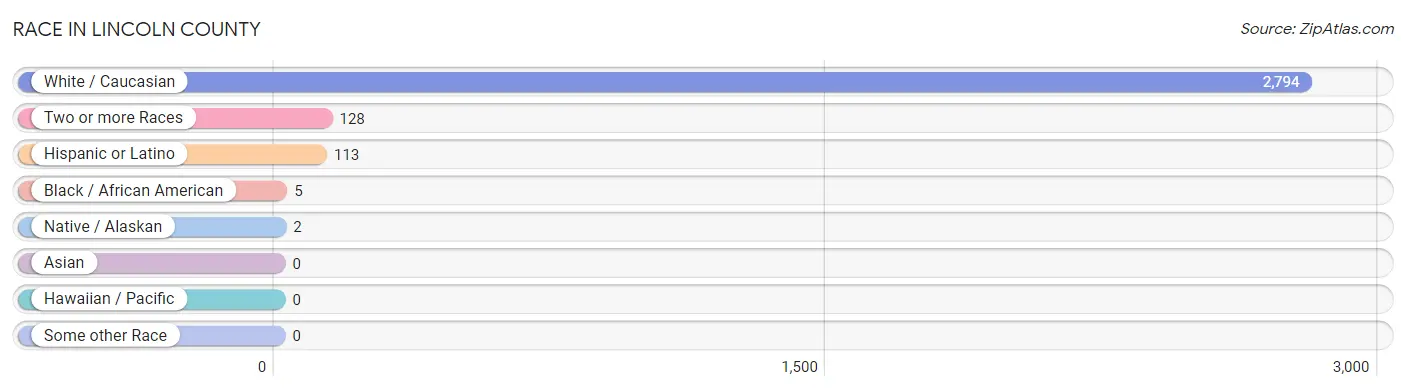
Race in Lincoln County
The most populous races in Lincoln County are White / Caucasian (2,794 | 95.4%), Two or more Races (128 | 4.4%), and Hispanic or Latino (113 | 3.9%).
| Race | # Population | % Population |
| Asian | 0 | 0.0% |
| Black / African American | 5 | 0.2% |
| Hawaiian / Pacific | 0 | 0.0% |
| Hispanic or Latino | 113 | 3.9% |
| Native / Alaskan | 2 | 0.1% |
| White / Caucasian | 2,794 | 95.4% |
| Two or more Races | 128 | 4.4% |
| Some other Race | 0 | 0.0% |
| Total | 2,929 | 100.0% |
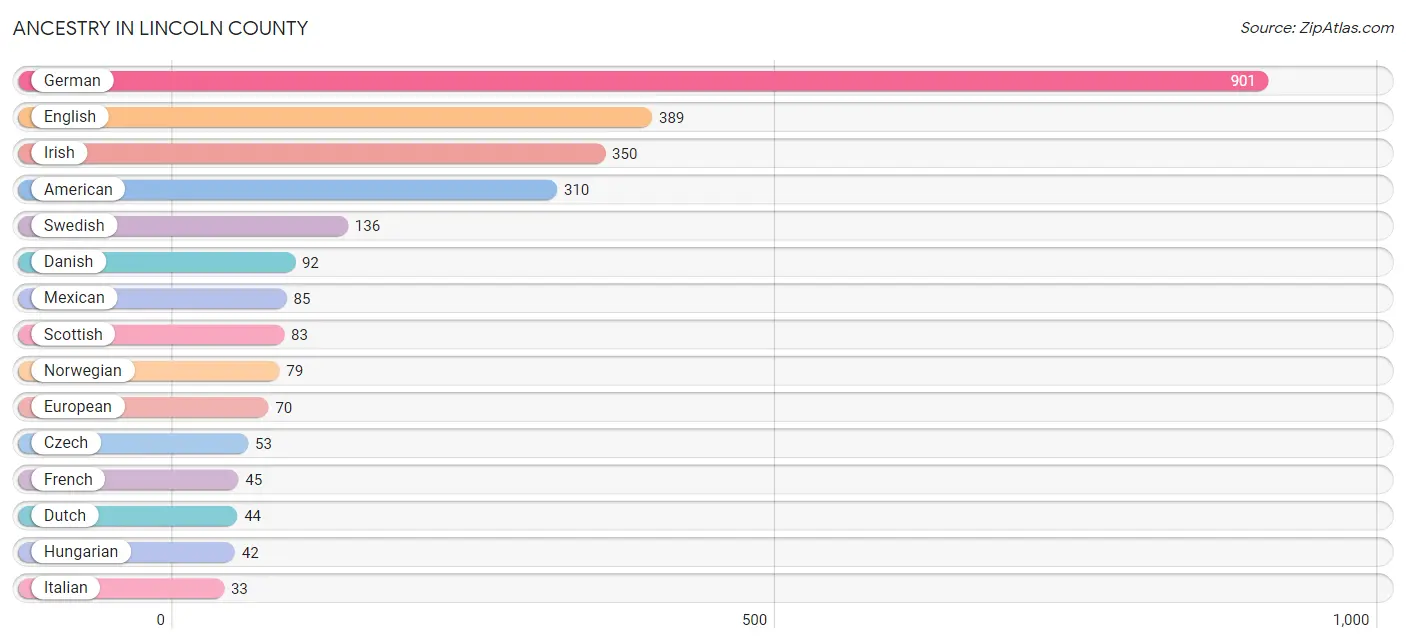
Ancestry in Lincoln County
The most populous ancestries reported in Lincoln County are German (901 | 30.8%), English (389 | 13.3%), Irish (350 | 11.9%), American (310 | 10.6%), and Swedish (136 | 4.6%), together accounting for 71.2% of all Lincoln County residents.
| Ancestry | # Population | % Population |
| American | 310 | 10.6% |
| Austrian | 16 | 0.5% |
| Belgian | 1 | 0.0% |
| British | 10 | 0.3% |
| Cajun | 9 | 0.3% |
| Central American | 4 | 0.1% |
| Cuban | 5 | 0.2% |
| Czech | 53 | 1.8% |
| Czechoslovakian | 14 | 0.5% |
| Danish | 92 | 3.1% |
| Dutch | 44 | 1.5% |
| Eastern European | 3 | 0.1% |
| English | 389 | 13.3% |
| European | 70 | 2.4% |
| French | 45 | 1.5% |
| French Canadian | 9 | 0.3% |
| German | 901 | 30.8% |
| German Russian | 2 | 0.1% |
| Greek | 3 | 0.1% |
| Guatemalan | 1 | 0.0% |
| Hungarian | 42 | 1.4% |
| Irish | 350 | 11.9% |
| Italian | 33 | 1.1% |
| Mexican | 85 | 2.9% |
| Mexican American Indian | 2 | 0.1% |
| Northern European | 8 | 0.3% |
| Norwegian | 79 | 2.7% |
| Panamanian | 3 | 0.1% |
| Pennsylvania German | 13 | 0.4% |
| Polish | 10 | 0.3% |
| Puerto Rican | 12 | 0.4% |
| Russian | 14 | 0.5% |
| Scandinavian | 4 | 0.1% |
| Scotch-Irish | 21 | 0.7% |
| Scottish | 83 | 2.8% |
| Seminole | 1 | 0.0% |
| Spaniard | 7 | 0.2% |
| Swedish | 136 | 4.6% |
| Swiss | 9 | 0.3% |
| Welsh | 18 | 0.6% | View All 40 Rows |
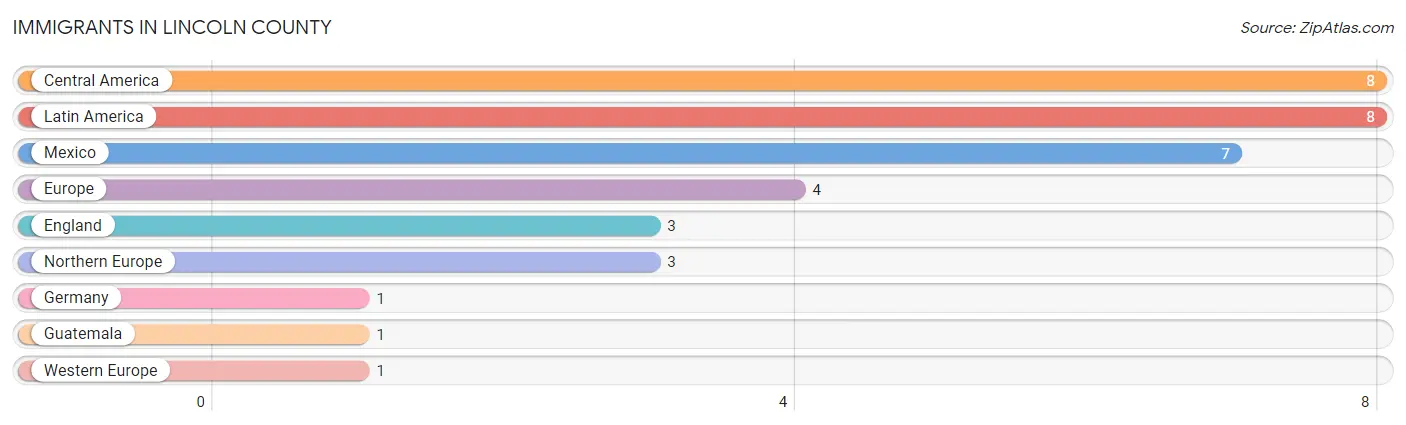
Immigrants in Lincoln County
The most numerous immigrant groups reported in Lincoln County came from Central America (8 | 0.3%), Latin America (8 | 0.3%), Mexico (7 | 0.2%), Europe (4 | 0.1%), and England (3 | 0.1%), together accounting for 1.0% of all Lincoln County residents.
| Immigration Origin | # Population | % Population |
| Central America | 8 | 0.3% |
| England | 3 | 0.1% |
| Europe | 4 | 0.1% |
| Germany | 1 | 0.0% |
| Guatemala | 1 | 0.0% |
| Latin America | 8 | 0.3% |
| Mexico | 7 | 0.2% |
| Northern Europe | 3 | 0.1% |
| Western Europe | 1 | 0.0% | View All 9 Rows |
Sex and Age in Lincoln County
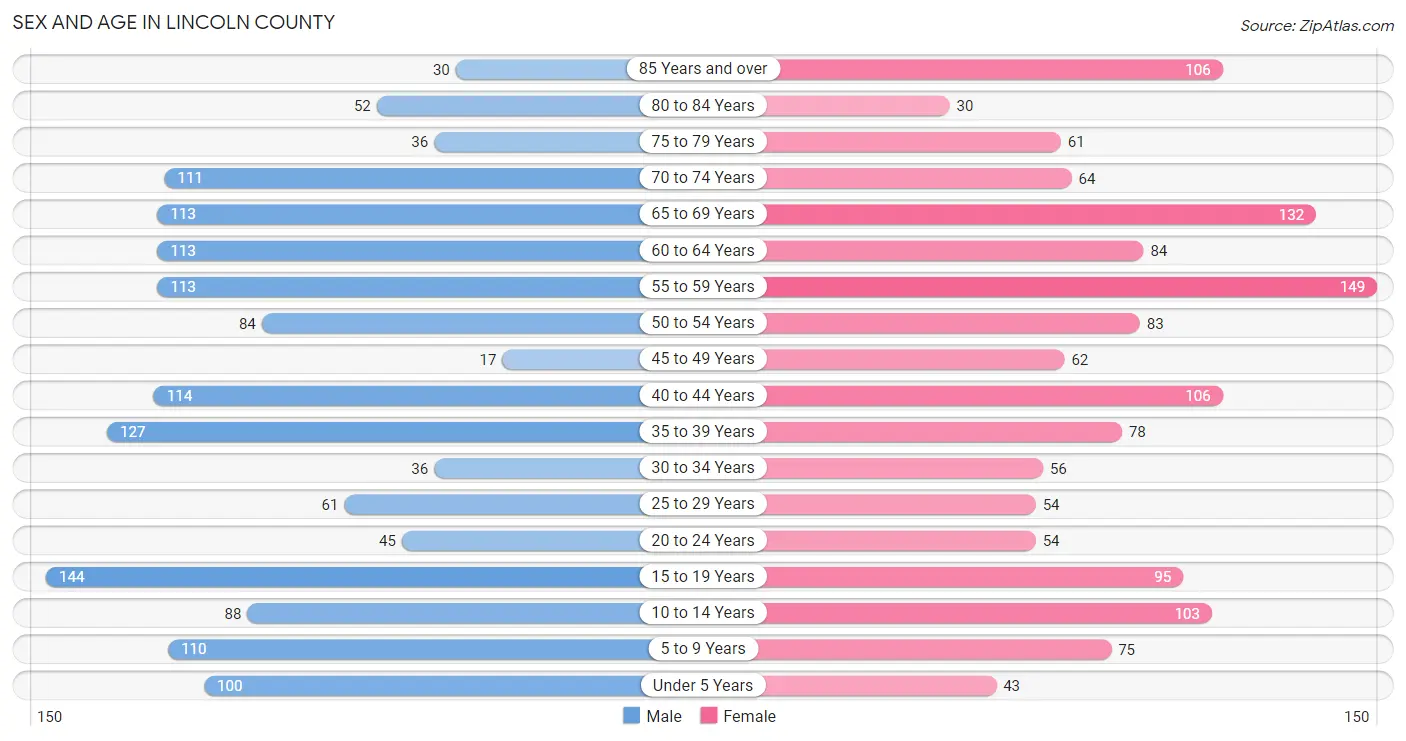
Sex and Age in Lincoln County
The most populous age groups in Lincoln County are 15 to 19 Years (144 | 9.6%) for men and 55 to 59 Years (149 | 10.4%) for women.
| Age Bracket | Male | Female |
| Under 5 Years | 100 (6.7%) | 43 (3.0%) |
| 5 to 9 Years | 110 (7.4%) | 75 (5.2%) |
| 10 to 14 Years | 88 (5.9%) | 103 (7.2%) |
| 15 to 19 Years | 144 (9.6%) | 95 (6.6%) |
| 20 to 24 Years | 45 (3.0%) | 54 (3.8%) |
| 25 to 29 Years | 61 (4.1%) | 54 (3.8%) |
| 30 to 34 Years | 36 (2.4%) | 56 (3.9%) |
| 35 to 39 Years | 127 (8.5%) | 78 (5.4%) |
| 40 to 44 Years | 114 (7.6%) | 106 (7.4%) |
| 45 to 49 Years | 17 (1.1%) | 62 (4.3%) |
| 50 to 54 Years | 84 (5.6%) | 83 (5.8%) |
| 55 to 59 Years | 113 (7.6%) | 149 (10.4%) |
| 60 to 64 Years | 113 (7.6%) | 84 (5.9%) |
| 65 to 69 Years | 113 (7.6%) | 132 (9.2%) |
| 70 to 74 Years | 111 (7.4%) | 64 (4.5%) |
| 75 to 79 Years | 36 (2.4%) | 61 (4.3%) |
| 80 to 84 Years | 52 (3.5%) | 30 (2.1%) |
| 85 Years and over | 30 (2.0%) | 106 (7.4%) |
| Total | 1,494 (100.0%) | 1,435 (100.0%) |
Families and Households in Lincoln County
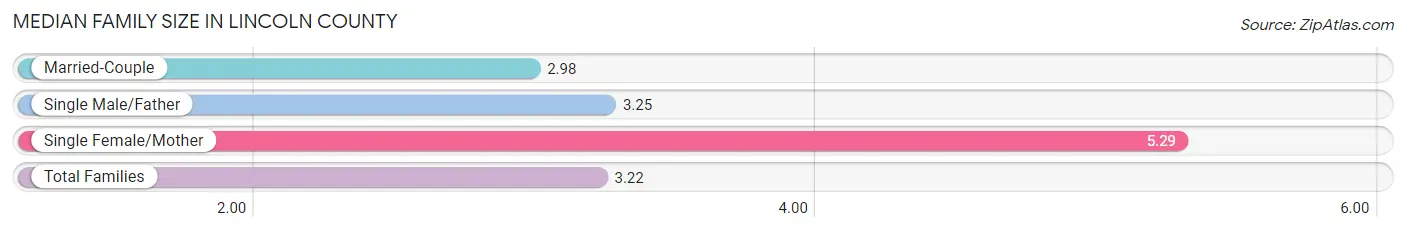
Median Family Size in Lincoln County
The median family size in Lincoln County is 3.22 persons per family, with single female/mother families (70 | 9.9%) accounting for the largest median family size of 5.29 persons per family. On the other hand, married-couple families (610 | 86.7%) represent the smallest median family size with 2.98 persons per family.
| Family Type | # Families | Family Size |
| Married-Couple | 610 (86.7%) | 2.98 |
| Single Male/Father | 24 (3.4%) | 3.25 |
| Single Female/Mother | 70 (9.9%) | 5.29 |
| Total Families | 704 (100.0%) | 3.22 |
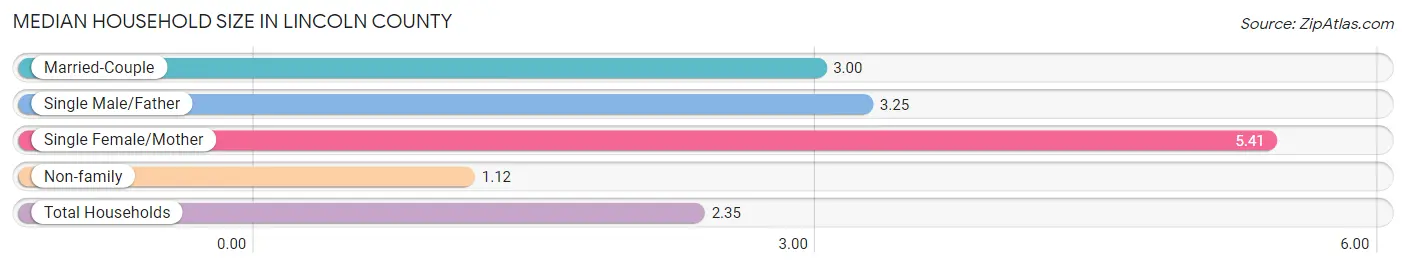
Median Household Size in Lincoln County
The median household size in Lincoln County is 2.35 persons per household, with single female/mother households (70 | 5.7%) accounting for the largest median household size of 5.41 persons per household. non-family households (519 | 42.4%) represent the smallest median household size with 1.12 persons per household.
| Household Type | # Households | Household Size |
| Married-Couple | 610 (49.9%) | 3.00 |
| Single Male/Father | 24 (2.0%) | 3.25 |
| Single Female/Mother | 70 (5.7%) | 5.41 |
| Non-family | 519 (42.4%) | 1.12 |
| Total Households | 1,223 (100.0%) | 2.35 |
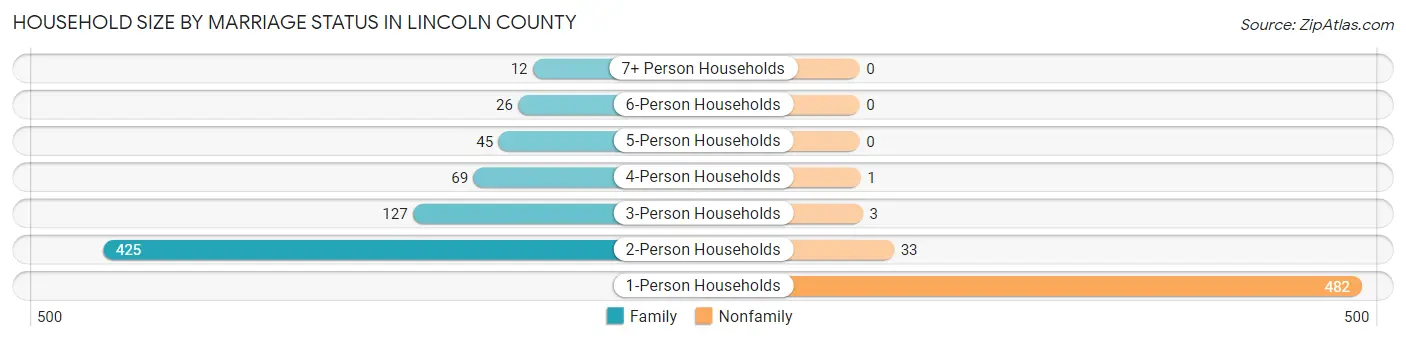
Household Size by Marriage Status in Lincoln County
Out of a total of 1,223 households in Lincoln County, 704 (57.6%) are family households, while 519 (42.4%) are nonfamily households. The most numerous type of family households are 2-person households, comprising 425, and the most common type of nonfamily households are 1-person households, comprising 482.
| Household Size | Family Households | Nonfamily Households |
| 1-Person Households | - | 482 (39.4%) |
| 2-Person Households | 425 (34.7%) | 33 (2.7%) |
| 3-Person Households | 127 (10.4%) | 3 (0.3%) |
| 4-Person Households | 69 (5.6%) | 1 (0.1%) |
| 5-Person Households | 45 (3.7%) | 0 (0.0%) |
| 6-Person Households | 26 (2.1%) | 0 (0.0%) |
| 7+ Person Households | 12 (1.0%) | 0 (0.0%) |
| Total | 704 (57.6%) | 519 (42.4%) |
Female Fertility in Lincoln County
Fertility by Age in Lincoln County
Average fertility rate in Lincoln County is 59.0 births per 1,000 women. Women in the age bracket of 15 to 19 years have the highest fertility rate with 126.0 births per 1,000 women. Women in the age bracket of 20 to 34 years acount for 50.0% of all women with births.

| Age Bracket | Women with Births | Births / 1,000 Women |
| 15 to 19 years | 12 (40.0%) | 126.0 |
| 20 to 34 years | 15 (50.0%) | 91.0 |
| 35 to 50 years | 3 (10.0%) | 12.0 |
| Total | 30 (100.0%) | 59.0 |
Fertility by Age by Marriage Status in Lincoln County
26.7% of women with births (30) in Lincoln County are married. The highest percentage of unmarried women with births falls into 15 to 19 years age bracket with 100.0% of them unmarried at the time of birth, while the lowest percentage of unmarried women with births belong to 20 to 34 years age bracket with 46.7% of them unmarried.
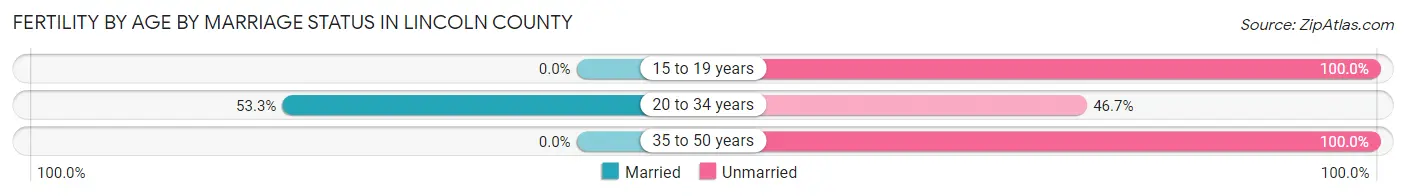
| Age Bracket | Married | Unmarried |
| 15 to 19 years | 0 (0.0%) | 12 (100.0%) |
| 20 to 34 years | 8 (53.3%) | 7 (46.7%) |
| 35 to 50 years | 0 (0.0%) | 3 (100.0%) |
| Total | 8 (26.7%) | 22 (73.3%) |
Fertility by Education in Lincoln County

| Educational Attainment | Women with Births | Births / 1,000 Women |
| Less than High School | 0 (0.0%) | 0.0 |
| High School Diploma | 15 (50.0%) | 152.0 |
| College or Associate's Degree | 10 (33.3%) | 53.0 |
| Bachelor's Degree | 0 (0.0%) | 0.0 |
| Graduate Degree | 5 (16.7%) | 76.0 |
| Total | 30 (100.0%) | 59.0 |
Fertility by Education by Marriage Status in Lincoln County
73.3% of women with births in Lincoln County are unmarried. Women with the educational attainment of graduate degree are most likely to be married with 100.0% of them married at childbirth, while women with the educational attainment of college or associate's degree are least likely to be married with 100.0% of them unmarried at childbirth.
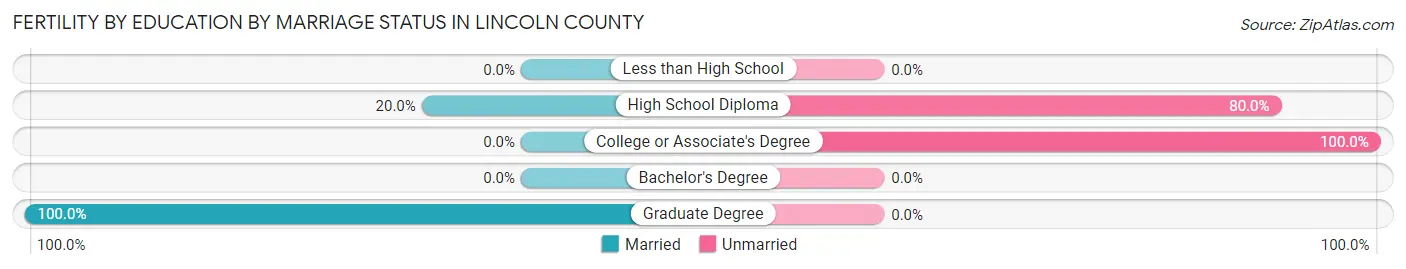
| Educational Attainment | Married | Unmarried |
| Less than High School | 0 (0.0%) | 0 (0.0%) |
| High School Diploma | 3 (20.0%) | 12 (80.0%) |
| College or Associate's Degree | 0 (0.0%) | 10 (100.0%) |
| Bachelor's Degree | 0 (0.0%) | 0 (0.0%) |
| Graduate Degree | 5 (100.0%) | 0 (0.0%) |
| Total | 8 (26.7%) | 22 (73.3%) |
Income in Lincoln County
Income Overview in Lincoln County
Per Capita Income in Lincoln County is $31,383, while median incomes of families and households are $69,722 and $52,540 respectively.
| Characteristic | Number | Measure |
| Per Capita Income | 2,929 | $31,383 |
| Median Family Income | 704 | $69,722 |
| Mean Family Income | 704 | $89,121 |
| Median Household Income | 1,223 | $52,540 |
| Mean Household Income | 1,223 | $70,397 |
| Income Deficit | 704 | $8,581 |
| Wage / Income Gap (%) | 2,929 | 24.98% |
| Wage / Income Gap ($) | 2,929 | 75.02¢ per $1 |
| Gini / Inequality Index | 2,929 | 0.44 |
Earnings by Sex in Lincoln County
Average Earnings in Lincoln County are $32,083, $37,381 for men and $28,042 for women, a difference of 25.0%.
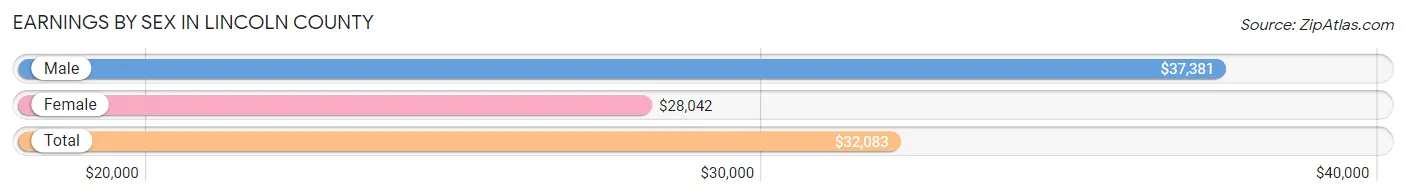
| Sex | Number | Average Earnings |
| Male | 782 (51.5%) | $37,381 |
| Female | 737 (48.5%) | $28,042 |
| Total | 1,519 (100.0%) | $32,083 |
Earnings by Sex by Income Bracket in Lincoln County
The most common earnings brackets in Lincoln County are $100,000+ for men (140 | 17.9%) and $35,000 to $39,999 for women (125 | 17.0%).
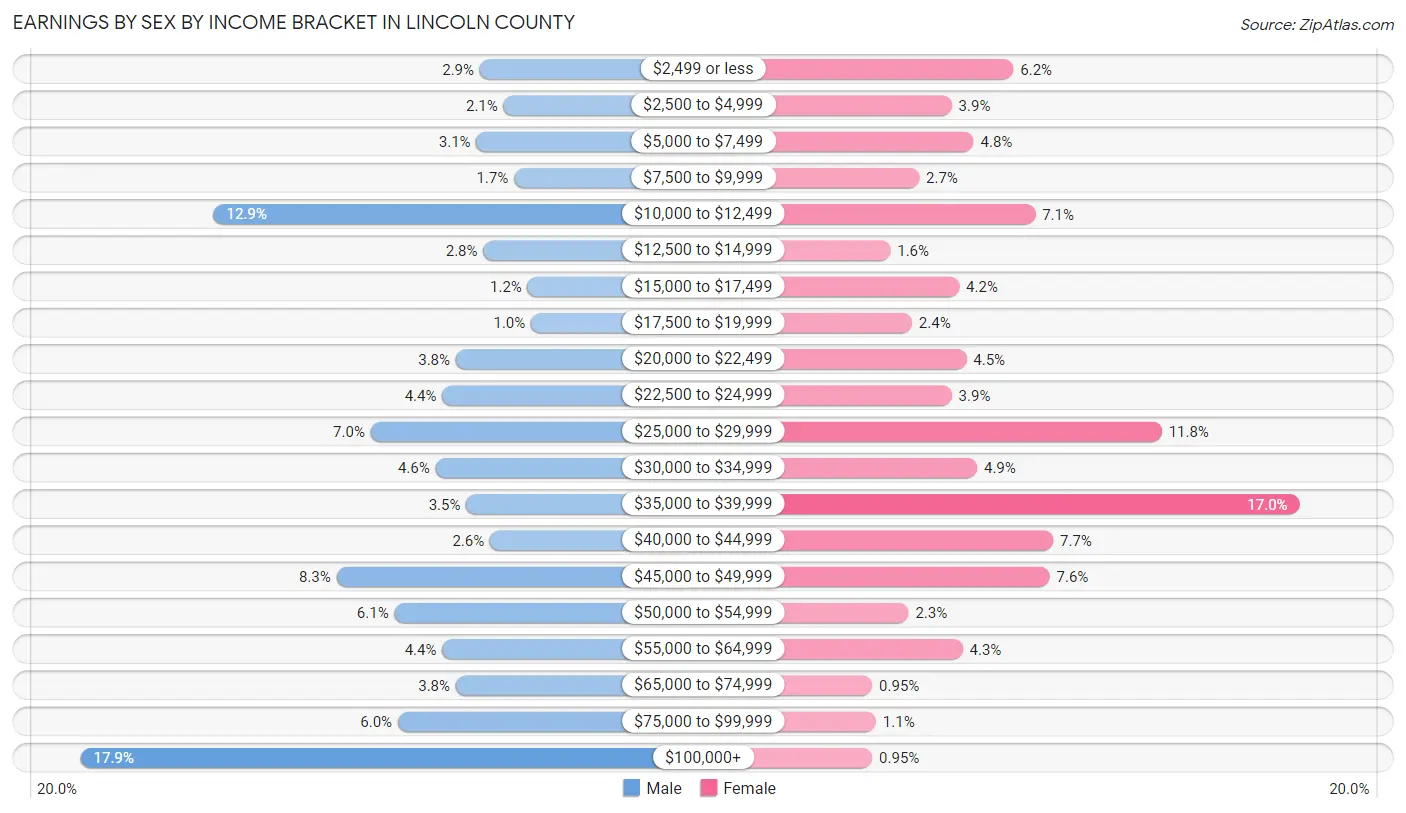
| Income | Male | Female |
| $2,499 or less | 23 (2.9%) | 46 (6.2%) |
| $2,500 to $4,999 | 16 (2.1%) | 29 (3.9%) |
| $5,000 to $7,499 | 24 (3.1%) | 35 (4.8%) |
| $7,500 to $9,999 | 13 (1.7%) | 20 (2.7%) |
| $10,000 to $12,499 | 101 (12.9%) | 52 (7.1%) |
| $12,500 to $14,999 | 22 (2.8%) | 12 (1.6%) |
| $15,000 to $17,499 | 9 (1.1%) | 31 (4.2%) |
| $17,500 to $19,999 | 8 (1.0%) | 18 (2.4%) |
| $20,000 to $22,499 | 30 (3.8%) | 33 (4.5%) |
| $22,500 to $24,999 | 34 (4.3%) | 29 (3.9%) |
| $25,000 to $29,999 | 55 (7.0%) | 87 (11.8%) |
| $30,000 to $34,999 | 36 (4.6%) | 36 (4.9%) |
| $35,000 to $39,999 | 27 (3.5%) | 125 (17.0%) |
| $40,000 to $44,999 | 20 (2.6%) | 57 (7.7%) |
| $45,000 to $49,999 | 65 (8.3%) | 56 (7.6%) |
| $50,000 to $54,999 | 48 (6.1%) | 17 (2.3%) |
| $55,000 to $64,999 | 34 (4.3%) | 32 (4.3%) |
| $65,000 to $74,999 | 30 (3.8%) | 7 (0.9%) |
| $75,000 to $99,999 | 47 (6.0%) | 8 (1.1%) |
| $100,000+ | 140 (17.9%) | 7 (0.9%) |
| Total | 782 (100.0%) | 737 (100.0%) |
Earnings by Sex by Educational Attainment in Lincoln County
Average earnings in Lincoln County are $45,819 for men and $30,667 for women, a difference of 33.1%. Men with an educational attainment of college or associate's degree enjoy the highest average annual earnings of $47,969, while those with high school diploma education earn the least with $27,917. Women with an educational attainment of bachelor's degree earn the most with the average annual earnings of $36,384, while those with college or associate's degree education have the smallest earnings of $26,750.
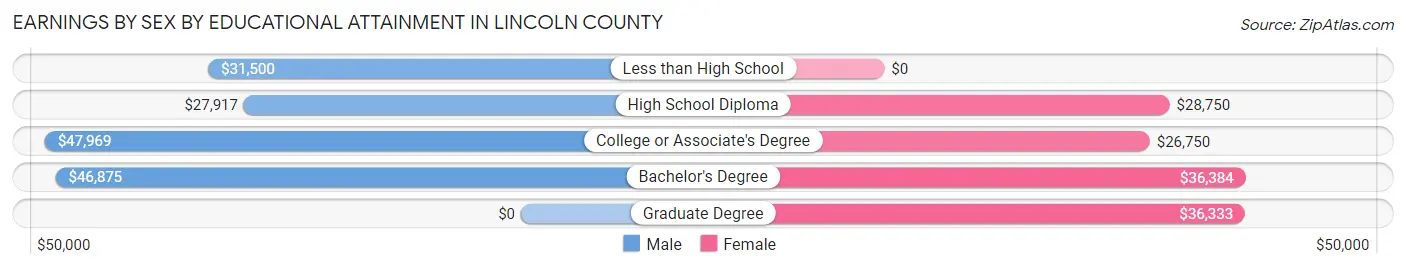
| Educational Attainment | Male Income | Female Income |
| Less than High School | $31,500 | $0 |
| High School Diploma | $27,917 | $28,750 |
| College or Associate's Degree | $47,969 | $26,750 |
| Bachelor's Degree | $46,875 | $36,384 |
| Graduate Degree | - | - |
| Total | $45,819 | $30,667 |
Family Income in Lincoln County
Family Income Brackets in Lincoln County
According to the Lincoln County family income data, there are 167 families falling into the $50,000 to $74,999 income range, which is the most common income bracket and makes up 23.7% of all families. Conversely, the $10,000 to $14,999 income bracket is the least frequent group with only 9 families (1.3%) belonging to this category.
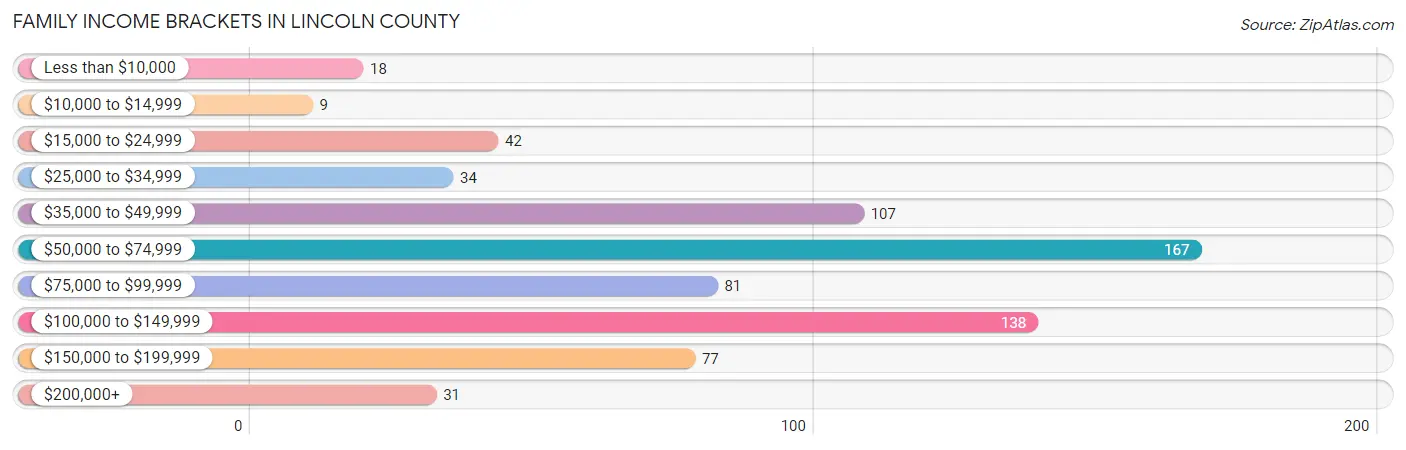
| Income Bracket | # Families | % Families |
| Less than $10,000 | 18 | 2.6% |
| $10,000 to $14,999 | 9 | 1.3% |
| $15,000 to $24,999 | 42 | 6.0% |
| $25,000 to $34,999 | 34 | 4.8% |
| $35,000 to $49,999 | 107 | 15.2% |
| $50,000 to $74,999 | 167 | 23.7% |
| $75,000 to $99,999 | 81 | 11.5% |
| $100,000 to $149,999 | 138 | 19.6% |
| $150,000 to $199,999 | 77 | 10.9% |
| $200,000+ | 31 | 4.4% |
Family Income by Famaliy Size in Lincoln County
7+ person families (10 | 1.4%) account for the highest median family income in Lincoln County with $126,000 per family, while 3-person families (127 | 18.0%) have the highest median income of $34,954 per family member.
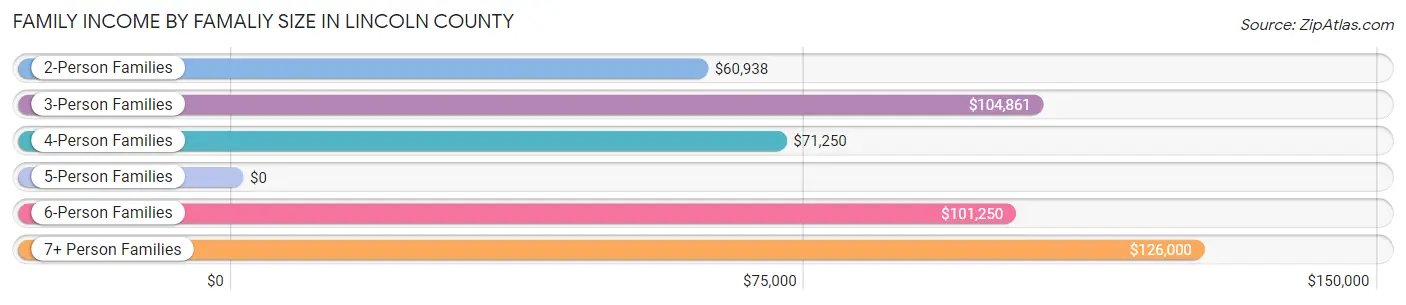
| Income Bracket | # Families | Median Income |
| 2-Person Families | 425 (60.4%) | $60,938 |
| 3-Person Families | 127 (18.0%) | $104,861 |
| 4-Person Families | 72 (10.2%) | $71,250 |
| 5-Person Families | 42 (6.0%) | $0 |
| 6-Person Families | 28 (4.0%) | $101,250 |
| 7+ Person Families | 10 (1.4%) | $126,000 |
| Total | 704 (100.0%) | $69,722 |
Family Income by Number of Earners in Lincoln County
The median family income in Lincoln County is $69,722, with families comprising 3+ earners (26) having the highest median family income of $100,833, while families with no earners (119) have the lowest median family income of $34,792, accounting for 3.7% and 16.9% of families, respectively.
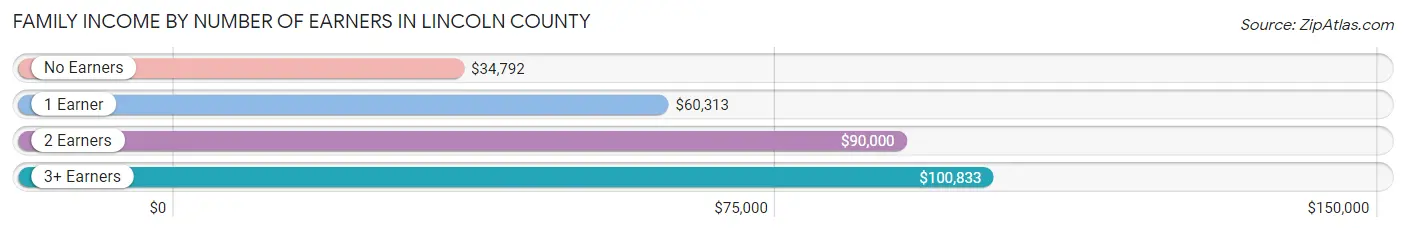
| Number of Earners | # Families | Median Income |
| No Earners | 119 (16.9%) | $34,792 |
| 1 Earner | 163 (23.2%) | $60,313 |
| 2 Earners | 396 (56.2%) | $90,000 |
| 3+ Earners | 26 (3.7%) | $100,833 |
| Total | 704 (100.0%) | $69,722 |
Household Income in Lincoln County
Household Income Brackets in Lincoln County
With 245 households falling in the category, the $50,000 to $74,999 income range is the most frequent in Lincoln County, accounting for 20.0% of all households. In contrast, only 31 households (2.5%) fall into the $200,000+ income bracket, making it the least populous group.
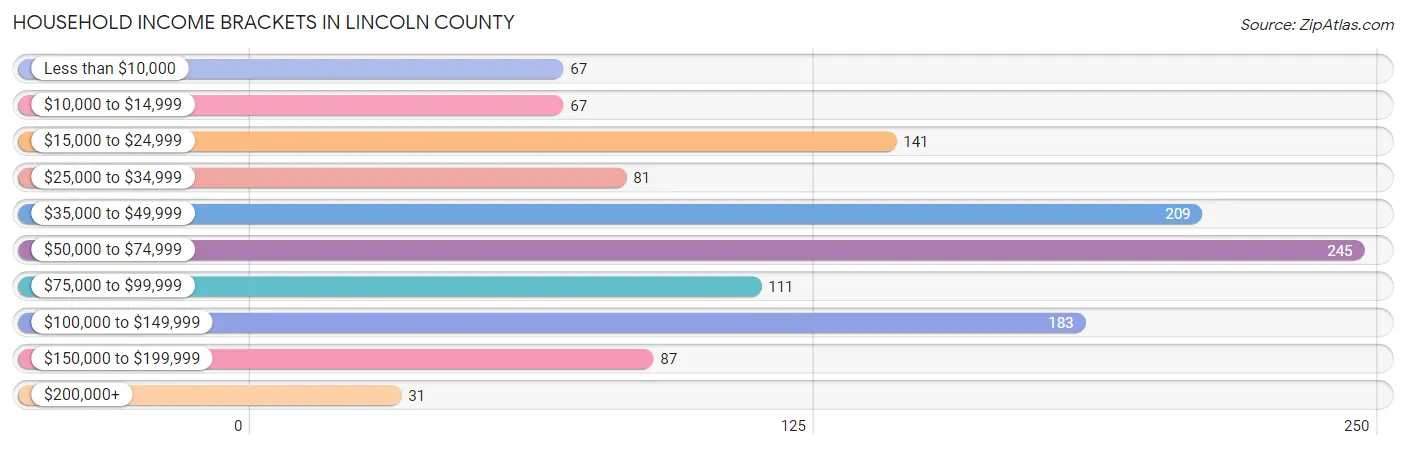
| Income Bracket | # Households | % Households |
| Less than $10,000 | 67 | 5.5% |
| $10,000 to $14,999 | 67 | 5.5% |
| $15,000 to $24,999 | 141 | 11.5% |
| $25,000 to $34,999 | 81 | 6.6% |
| $35,000 to $49,999 | 209 | 17.1% |
| $50,000 to $74,999 | 245 | 20.0% |
| $75,000 to $99,999 | 111 | 9.1% |
| $100,000 to $149,999 | 183 | 15.0% |
| $150,000 to $199,999 | 87 | 7.1% |
| $200,000+ | 31 | 2.5% |
Household Income by Householder Age in Lincoln County
The median household income in Lincoln County is $52,540, with the highest median household income of $84,931 found in the 25 to 44 years age bracket for the primary householder. A total of 325 households (26.6%) fall into this category. Meanwhile, the 15 to 24 years age bracket for the primary householder has the lowest median household income of $30,000, with 30 households (2.5%) in this group.
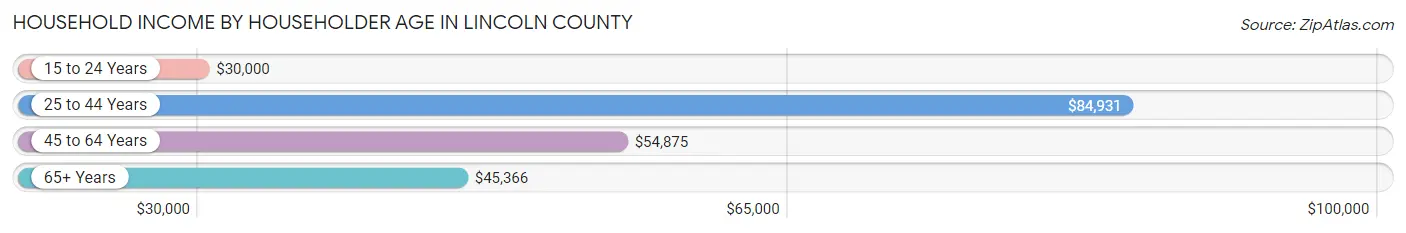
| Income Bracket | # Households | Median Income |
| 15 to 24 Years | 30 (2.5%) | $30,000 |
| 25 to 44 Years | 325 (26.6%) | $84,931 |
| 45 to 64 Years | 398 (32.5%) | $54,875 |
| 65+ Years | 470 (38.4%) | $45,366 |
| Total | 1,223 (100.0%) | $52,540 |
Poverty in Lincoln County
Income Below Poverty by Sex and Age in Lincoln County
With 13.6% poverty level for males and 12.0% for females among the residents of Lincoln County, 75 year old and over males and 65 to 74 year old females are the most vulnerable to poverty, with 30 males (26.8%) and 46 females (23.5%) in their respective age groups living below the poverty level.
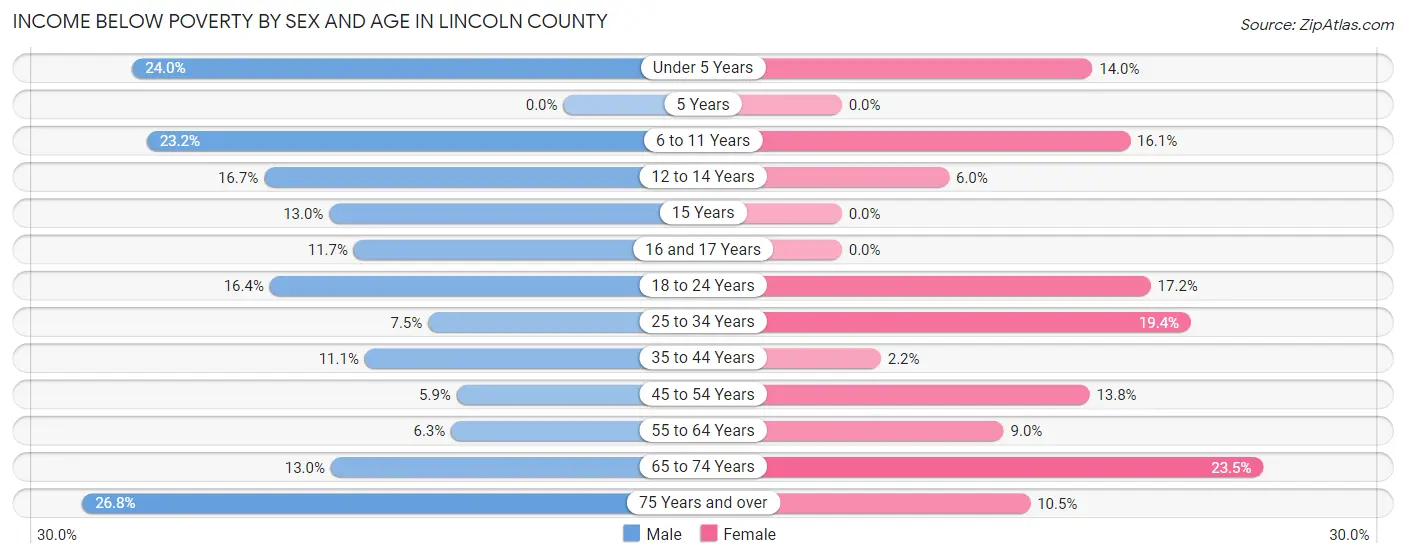
| Age Bracket | Male | Female |
| Under 5 Years | 24 (24.0%) | 6 (14.0%) |
| 5 Years | 0 (0.0%) | 0 (0.0%) |
| 6 to 11 Years | 29 (23.2%) | 13 (16.1%) |
| 12 to 14 Years | 8 (16.7%) | 4 (6.0%) |
| 15 Years | 3 (13.0%) | 0 (0.0%) |
| 16 and 17 Years | 7 (11.7%) | 0 (0.0%) |
| 18 to 24 Years | 17 (16.4%) | 16 (17.2%) |
| 25 to 34 Years | 7 (7.5%) | 21 (19.4%) |
| 35 to 44 Years | 26 (11.1%) | 4 (2.2%) |
| 45 to 54 Years | 6 (5.9%) | 20 (13.8%) |
| 55 to 64 Years | 14 (6.2%) | 21 (9.0%) |
| 65 to 74 Years | 29 (13.0%) | 46 (23.5%) |
| 75 Years and over | 30 (26.8%) | 17 (10.5%) |
| Total | 200 (13.6%) | 168 (12.0%) |
Income Above Poverty by Sex and Age in Lincoln County
According to the poverty statistics in Lincoln County, males aged 5 years and females aged 5 years are the age groups that are most secure financially, with 100.0% of males and 100.0% of females in these age groups living above the poverty line.

| Age Bracket | Male | Female |
| Under 5 Years | 76 (76.0%) | 37 (86.1%) |
| 5 Years | 25 (100.0%) | 28 (100.0%) |
| 6 to 11 Years | 96 (76.8%) | 68 (84.0%) |
| 12 to 14 Years | 40 (83.3%) | 63 (94.0%) |
| 15 Years | 20 (87.0%) | 28 (100.0%) |
| 16 and 17 Years | 53 (88.3%) | 28 (100.0%) |
| 18 to 24 Years | 87 (83.7%) | 77 (82.8%) |
| 25 to 34 Years | 86 (92.5%) | 87 (80.6%) |
| 35 to 44 Years | 209 (88.9%) | 180 (97.8%) |
| 45 to 54 Years | 95 (94.1%) | 125 (86.2%) |
| 55 to 64 Years | 210 (93.8%) | 212 (91.0%) |
| 65 to 74 Years | 195 (87.1%) | 150 (76.5%) |
| 75 Years and over | 82 (73.2%) | 145 (89.5%) |
| Total | 1,274 (86.4%) | 1,228 (88.0%) |
Income Below Poverty Among Married-Couple Families in Lincoln County
The poverty statistics for married-couple families in Lincoln County show that 7.2% or 44 of the total 610 families live below the poverty line. Families with 3 or 4 children have the highest poverty rate of 9.1%, comprising of 4 families. On the other hand, families with 5 or more children have the lowest poverty rate of 0.0%, which includes 0 families.
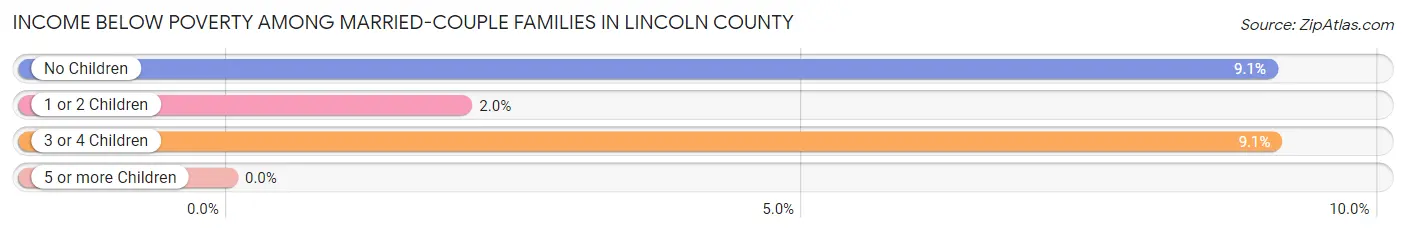
| Children | Above Poverty | Below Poverty |
| No Children | 372 (90.9%) | 37 (9.0%) |
| 1 or 2 Children | 144 (98.0%) | 3 (2.0%) |
| 3 or 4 Children | 40 (90.9%) | 4 (9.1%) |
| 5 or more Children | 10 (100.0%) | 0 (0.0%) |
| Total | 566 (92.8%) | 44 (7.2%) |
Income Below Poverty Among Single-Parent Households in Lincoln County
According to the poverty data in Lincoln County, 25.0% or 6 single-father households and 28.6% or 20 single-mother households are living below the poverty line. Among single-father households, those with 1 or 2 children have the highest poverty rate, with 5 households (41.7%) experiencing poverty. Likewise, among single-mother households, those with 3 or 4 children have the highest poverty rate, with 18 households (56.2%) falling below the poverty line.
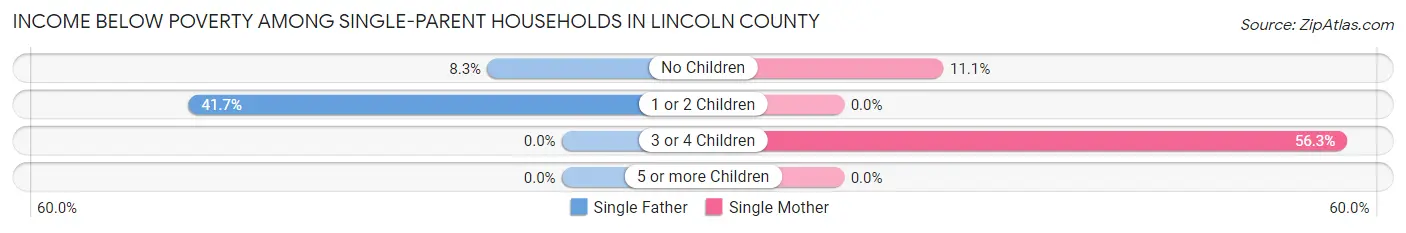
| Children | Single Father | Single Mother |
| No Children | 1 (8.3%) | 2 (11.1%) |
| 1 or 2 Children | 5 (41.7%) | 0 (0.0%) |
| 3 or 4 Children | 0 (0.0%) | 18 (56.2%) |
| 5 or more Children | 0 (0.0%) | 0 (0.0%) |
| Total | 6 (25.0%) | 20 (28.6%) |
Income Below Poverty Among Married-Couple vs Single-Parent Households in Lincoln County
The poverty data for Lincoln County shows that 44 of the married-couple family households (7.2%) and 26 of the single-parent households (27.7%) are living below the poverty level. Within the married-couple family households, those with 3 or 4 children have the highest poverty rate, with 4 households (9.1%) falling below the poverty line. Among the single-parent households, those with 3 or 4 children have the highest poverty rate, with 18 household (56.2%) living below poverty.
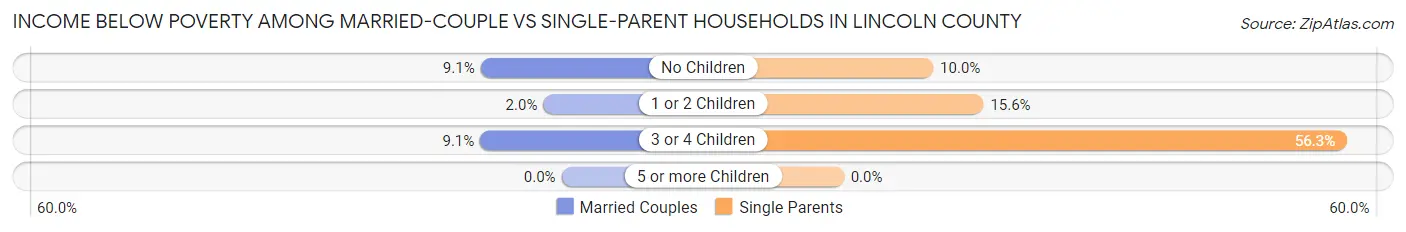
| Children | Married-Couple Families | Single-Parent Households |
| No Children | 37 (9.0%) | 3 (10.0%) |
| 1 or 2 Children | 3 (2.0%) | 5 (15.6%) |
| 3 or 4 Children | 4 (9.1%) | 18 (56.2%) |
| 5 or more Children | 0 (0.0%) | 0 (0.0%) |
| Total | 44 (7.2%) | 26 (27.7%) |
Employment Characteristics in Lincoln County
Employment by Class of Employer in Lincoln County
Among the 1,406 employed individuals in Lincoln County, private company employees (729 | 51.8%), self-employed (not incorporated) (256 | 18.2%), and local government employees (168 | 11.9%) make up the most common classes of employment.
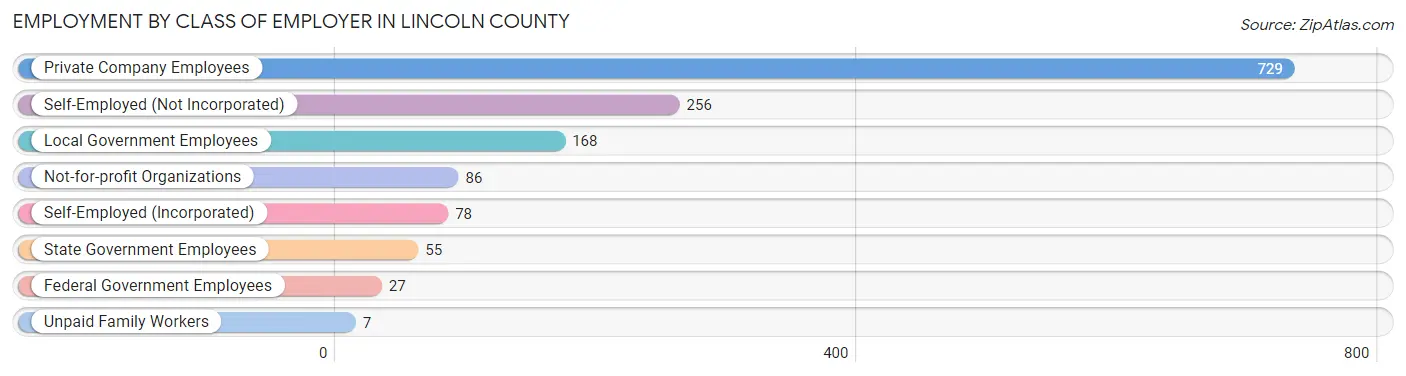
| Employer Class | # Employees | % Employees |
| Private Company Employees | 729 | 51.8% |
| Self-Employed (Incorporated) | 78 | 5.6% |
| Self-Employed (Not Incorporated) | 256 | 18.2% |
| Not-for-profit Organizations | 86 | 6.1% |
| Local Government Employees | 168 | 11.9% |
| State Government Employees | 55 | 3.9% |
| Federal Government Employees | 27 | 1.9% |
| Unpaid Family Workers | 7 | 0.5% |
| Total | 1,406 | 100.0% |
Employment Status by Age in Lincoln County
According to the labor force statistics for Lincoln County, out of the total population over 16 years of age (2,359), 61.9% or 1,460 individuals are in the labor force, with 1.8% or 26 of them unemployed. The age group with the highest labor force participation rate is 30 to 34 years, with 89.1% or 82 individuals in the labor force. Within the labor force, the 45 to 54 years age range has the highest percentage of unemployed individuals, with 10.0% or 21 of them being unemployed.
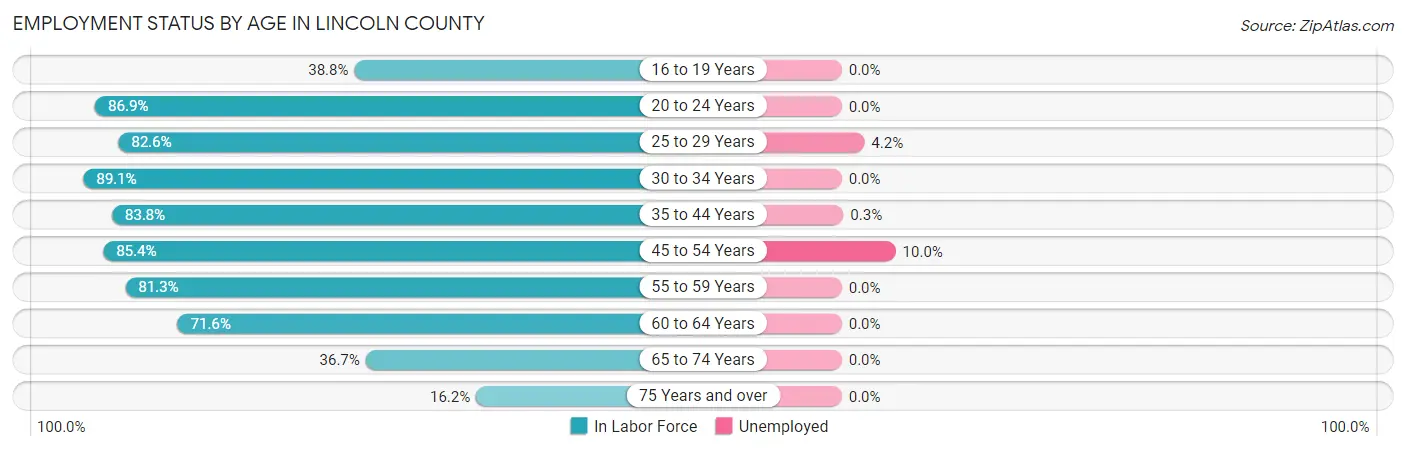
| Age Bracket | In Labor Force | Unemployed |
| 16 to 19 Years | 73 (38.8%) | 0 (0.0%) |
| 20 to 24 Years | 86 (86.9%) | 0 (0.0%) |
| 25 to 29 Years | 95 (82.6%) | 4 (4.2%) |
| 30 to 34 Years | 82 (89.1%) | 0 (0.0%) |
| 35 to 44 Years | 356 (83.8%) | 1 (0.3%) |
| 45 to 54 Years | 210 (85.4%) | 21 (10.0%) |
| 55 to 59 Years | 213 (81.3%) | 0 (0.0%) |
| 60 to 64 Years | 141 (71.6%) | 0 (0.0%) |
| 65 to 74 Years | 154 (36.7%) | 0 (0.0%) |
| 75 Years and over | 51 (16.2%) | 0 (0.0%) |
| Total | 1,460 (61.9%) | 26 (1.8%) |
Employment Status by Educational Attainment in Lincoln County
According to labor force statistics for Lincoln County, 82.0% of individuals (1,096) out of the total population between 25 and 64 years of age (1,337) are in the labor force, with 2.4% or 26 of them being unemployed. The group with the highest labor force participation rate are those with the educational attainment of college / associate degree, with 86.6% or 567 individuals in the labor force. Within the labor force, individuals with high school diploma education have the highest percentage of unemployment, with 9.4% or 21 of them being unemployed.
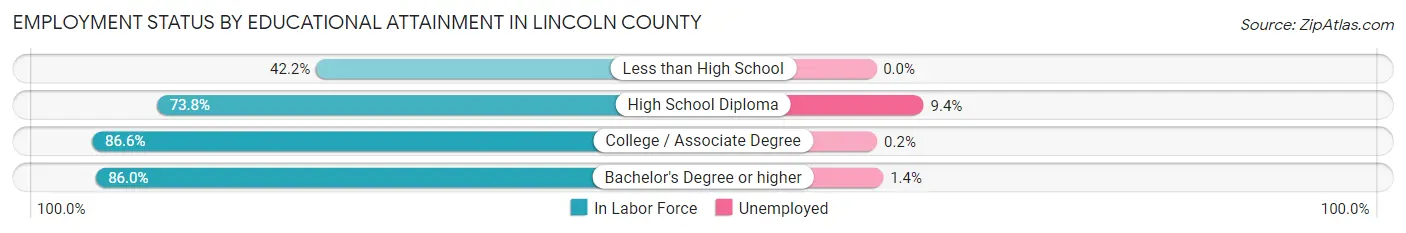
| Educational Attainment | In Labor Force | Unemployed |
| Less than High School | 19 (42.2%) | 0 (0.0%) |
| High School Diploma | 223 (73.8%) | 28 (9.4%) |
| College / Associate Degree | 567 (86.6%) | 1 (0.2%) |
| Bachelor's Degree or higher | 288 (86.0%) | 5 (1.4%) |
| Total | 1,096 (82.0%) | 32 (2.4%) |
Employment Occupations by Sex in Lincoln County
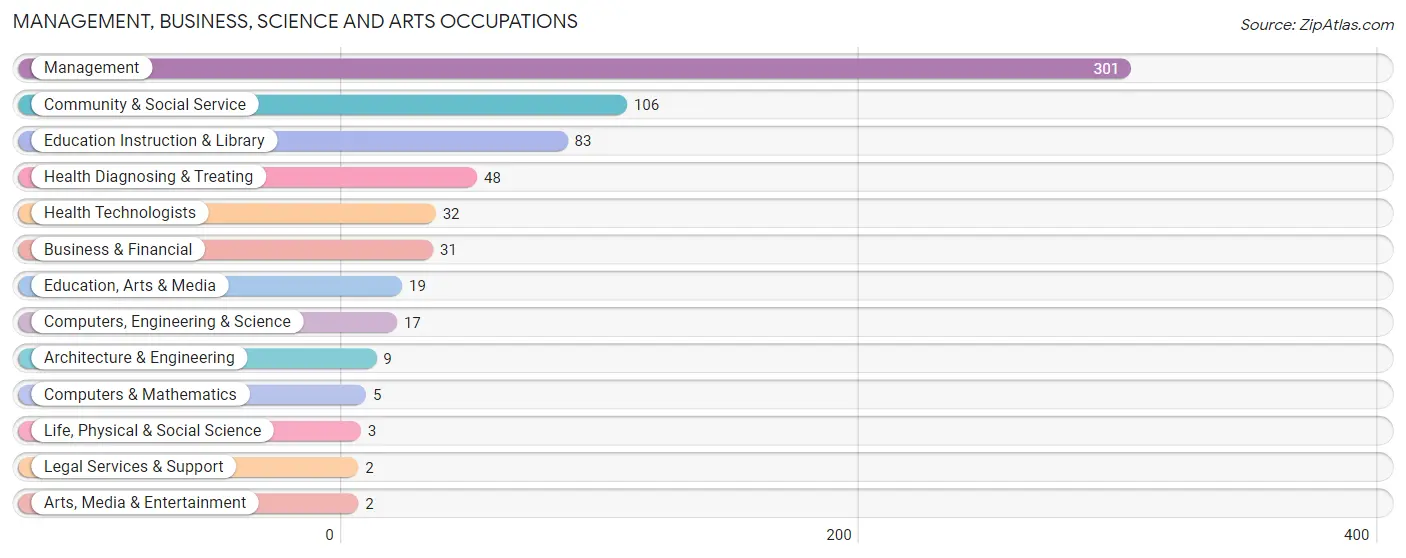
Management, Business, Science and Arts Occupations
The most common Management, Business, Science and Arts occupations in Lincoln County are Management (301 | 21.0%), Community & Social Service (106 | 7.4%), Education Instruction & Library (83 | 5.8%), Health Diagnosing & Treating (48 | 3.3%), and Health Technologists (32 | 2.2%).
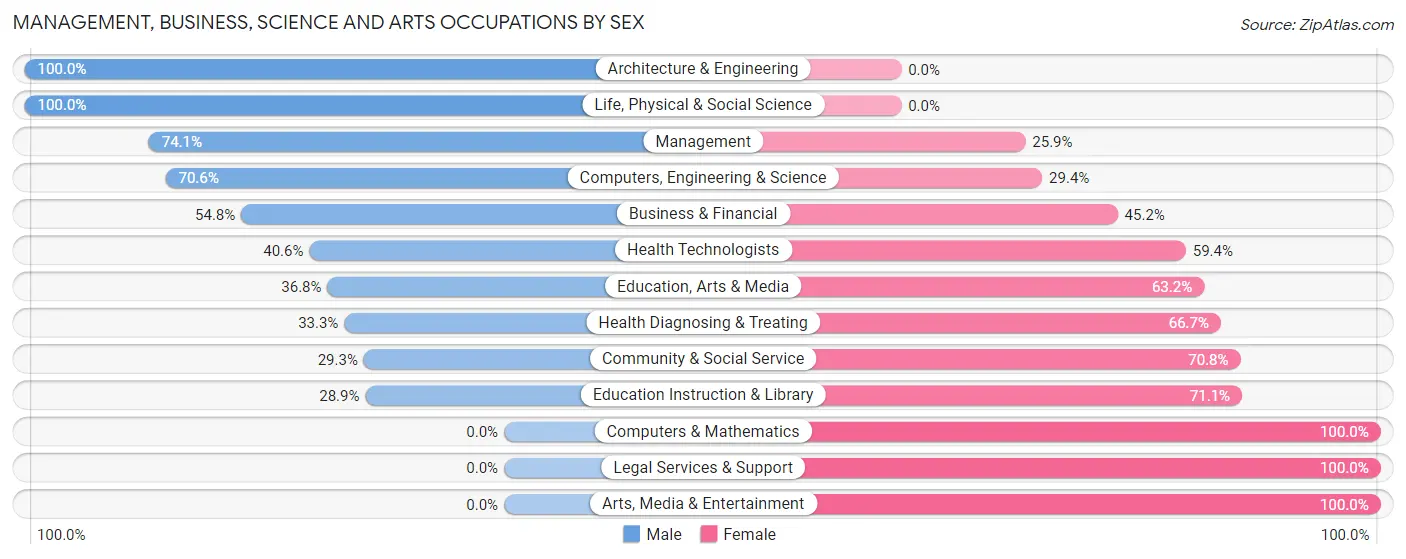
Management, Business, Science and Arts Occupations by Sex
Within the Management, Business, Science and Arts occupations in Lincoln County, the most male-oriented occupations are Architecture & Engineering (100.0%), Life, Physical & Social Science (100.0%), and Management (74.1%), while the most female-oriented occupations are Computers & Mathematics (100.0%), Legal Services & Support (100.0%), and Arts, Media & Entertainment (100.0%).
| Occupation | Male | Female |
| Management | 223 (74.1%) | 78 (25.9%) |
| Business & Financial | 17 (54.8%) | 14 (45.2%) |
| Computers, Engineering & Science | 12 (70.6%) | 5 (29.4%) |
| Computers & Mathematics | 0 (0.0%) | 5 (100.0%) |
| Architecture & Engineering | 9 (100.0%) | 0 (0.0%) |
| Life, Physical & Social Science | 3 (100.0%) | 0 (0.0%) |
| Community & Social Service | 31 (29.2%) | 75 (70.8%) |
| Education, Arts & Media | 7 (36.8%) | 12 (63.2%) |
| Legal Services & Support | 0 (0.0%) | 2 (100.0%) |
| Education Instruction & Library | 24 (28.9%) | 59 (71.1%) |
| Arts, Media & Entertainment | 0 (0.0%) | 2 (100.0%) |
| Health Diagnosing & Treating | 16 (33.3%) | 32 (66.7%) |
| Health Technologists | 13 (40.6%) | 19 (59.4%) |
| Total (Category) | 299 (59.4%) | 204 (40.6%) |
| Total (Overall) | 743 (51.8%) | 692 (48.2%) |
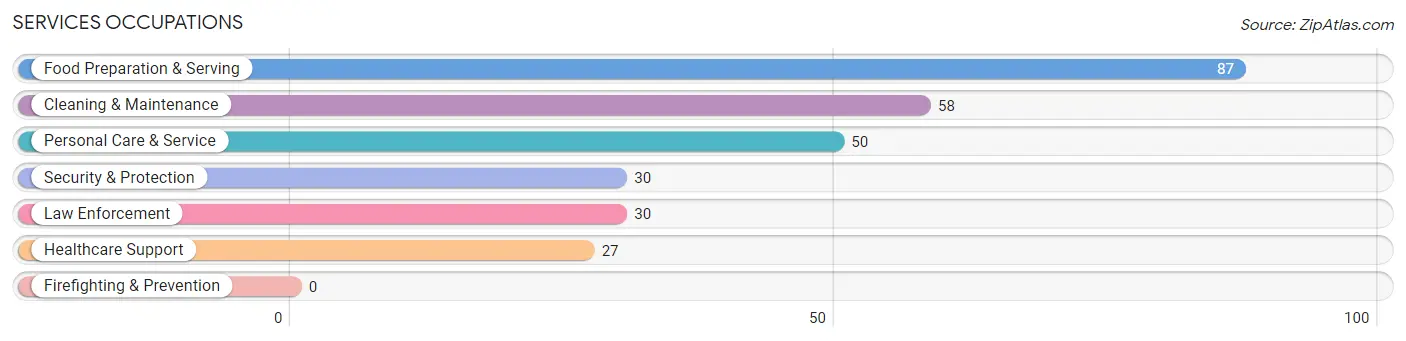
Services Occupations
The most common Services occupations in Lincoln County are Food Preparation & Serving (87 | 6.1%), Cleaning & Maintenance (58 | 4.0%), Personal Care & Service (50 | 3.5%), Security & Protection (30 | 2.1%), and Law Enforcement (30 | 2.1%).
Services Occupations by Sex
Within the Services occupations in Lincoln County, the most male-oriented occupations are Cleaning & Maintenance (63.8%), Security & Protection (63.3%), and Law Enforcement (63.3%), while the most female-oriented occupations are Healthcare Support (96.3%), Personal Care & Service (88.0%), and Food Preparation & Serving (86.2%).

| Occupation | Male | Female |
| Healthcare Support | 1 (3.7%) | 26 (96.3%) |
| Security & Protection | 19 (63.3%) | 11 (36.7%) |
| Firefighting & Prevention | 0 (0.0%) | 0 (0.0%) |
| Law Enforcement | 19 (63.3%) | 11 (36.7%) |
| Food Preparation & Serving | 12 (13.8%) | 75 (86.2%) |
| Cleaning & Maintenance | 37 (63.8%) | 21 (36.2%) |
| Personal Care & Service | 6 (12.0%) | 44 (88.0%) |
| Total (Category) | 75 (29.8%) | 177 (70.2%) |
| Total (Overall) | 743 (51.8%) | 692 (48.2%) |
Sales and Office Occupations
The most common Sales and Office occupations in Lincoln County are Office & Administration (211 | 14.7%), and Sales & Related (91 | 6.3%).
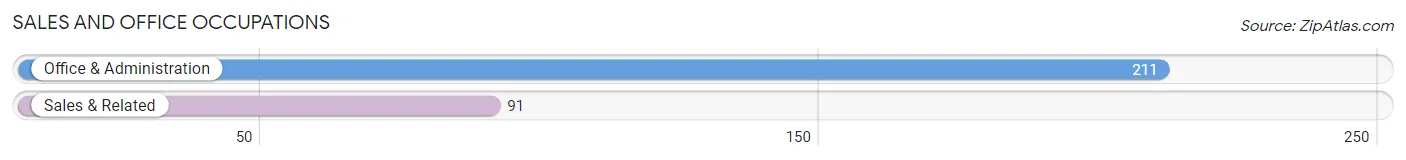
Sales and Office Occupations by Sex

| Occupation | Male | Female |
| Sales & Related | 55 (60.4%) | 36 (39.6%) |
| Office & Administration | 15 (7.1%) | 196 (92.9%) |
| Total (Category) | 70 (23.2%) | 232 (76.8%) |
| Total (Overall) | 743 (51.8%) | 692 (48.2%) |
Natural Resources, Construction and Maintenance Occupations
The most common Natural Resources, Construction and Maintenance occupations in Lincoln County are Construction & Extraction (104 | 7.2%), Farming, Fishing & Forestry (27 | 1.9%), and Installation, Maintenance & Repair (20 | 1.4%).

Natural Resources, Construction and Maintenance Occupations by Sex

| Occupation | Male | Female |
| Farming, Fishing & Forestry | 16 (59.3%) | 11 (40.7%) |
| Construction & Extraction | 102 (98.1%) | 2 (1.9%) |
| Installation, Maintenance & Repair | 20 (100.0%) | 0 (0.0%) |
| Total (Category) | 138 (91.4%) | 13 (8.6%) |
| Total (Overall) | 743 (51.8%) | 692 (48.2%) |
Production, Transportation and Moving Occupations
The most common Production, Transportation and Moving occupations in Lincoln County are Production (105 | 7.3%), Material Moving (84 | 5.9%), and Transportation (38 | 2.6%).
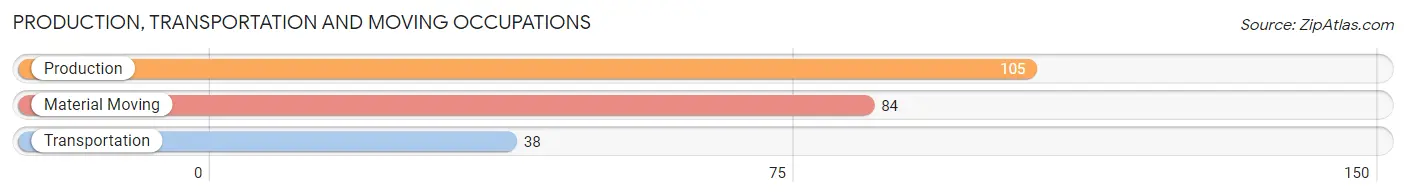
Production, Transportation and Moving Occupations by Sex

| Occupation | Male | Female |
| Production | 85 (80.9%) | 20 (19.1%) |
| Transportation | 38 (100.0%) | 0 (0.0%) |
| Material Moving | 38 (45.2%) | 46 (54.8%) |
| Total (Category) | 161 (70.9%) | 66 (29.1%) |
| Total (Overall) | 743 (51.8%) | 692 (48.2%) |
Employment Industries by Sex in Lincoln County
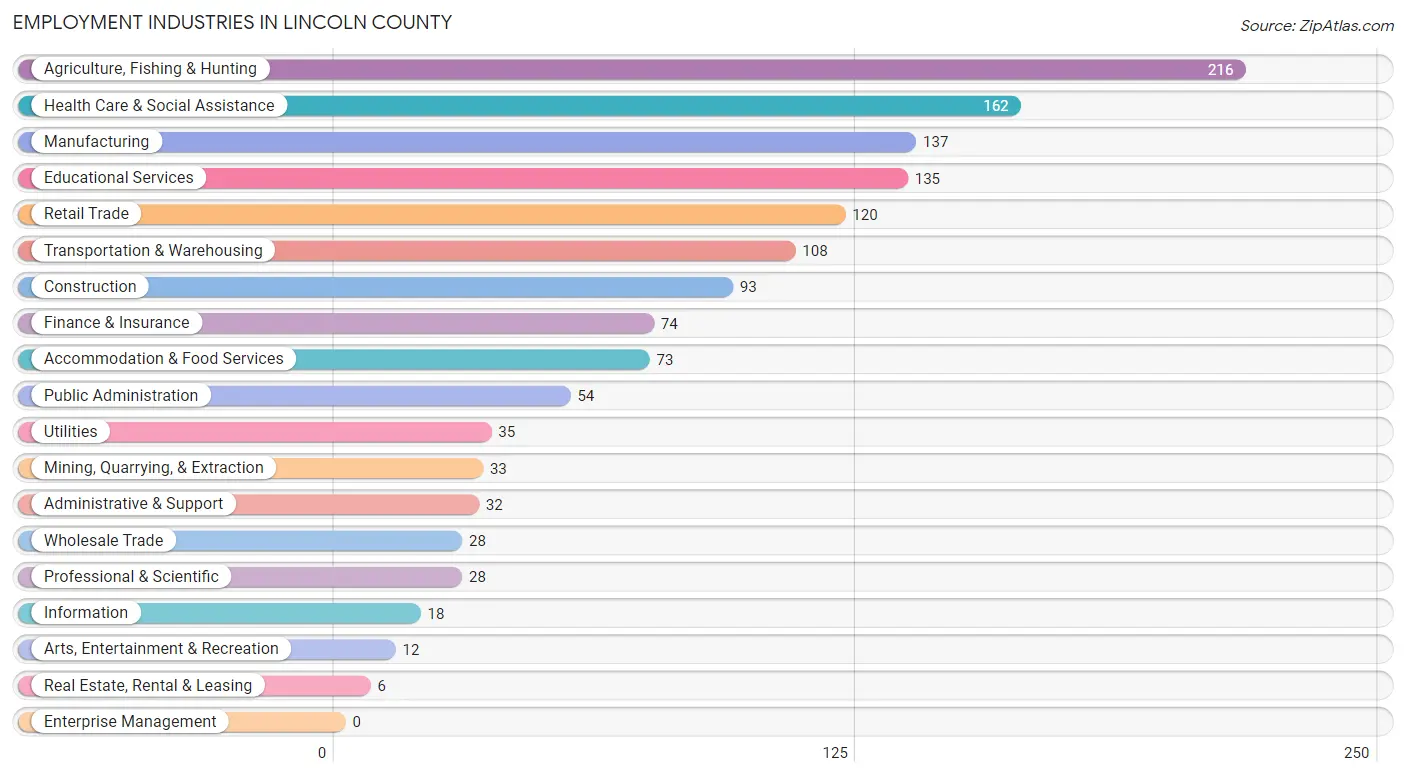
Employment Industries in Lincoln County
The major employment industries in Lincoln County include Agriculture, Fishing & Hunting (216 | 15.0%), Health Care & Social Assistance (162 | 11.3%), Manufacturing (137 | 9.6%), Educational Services (135 | 9.4%), and Retail Trade (120 | 8.4%).
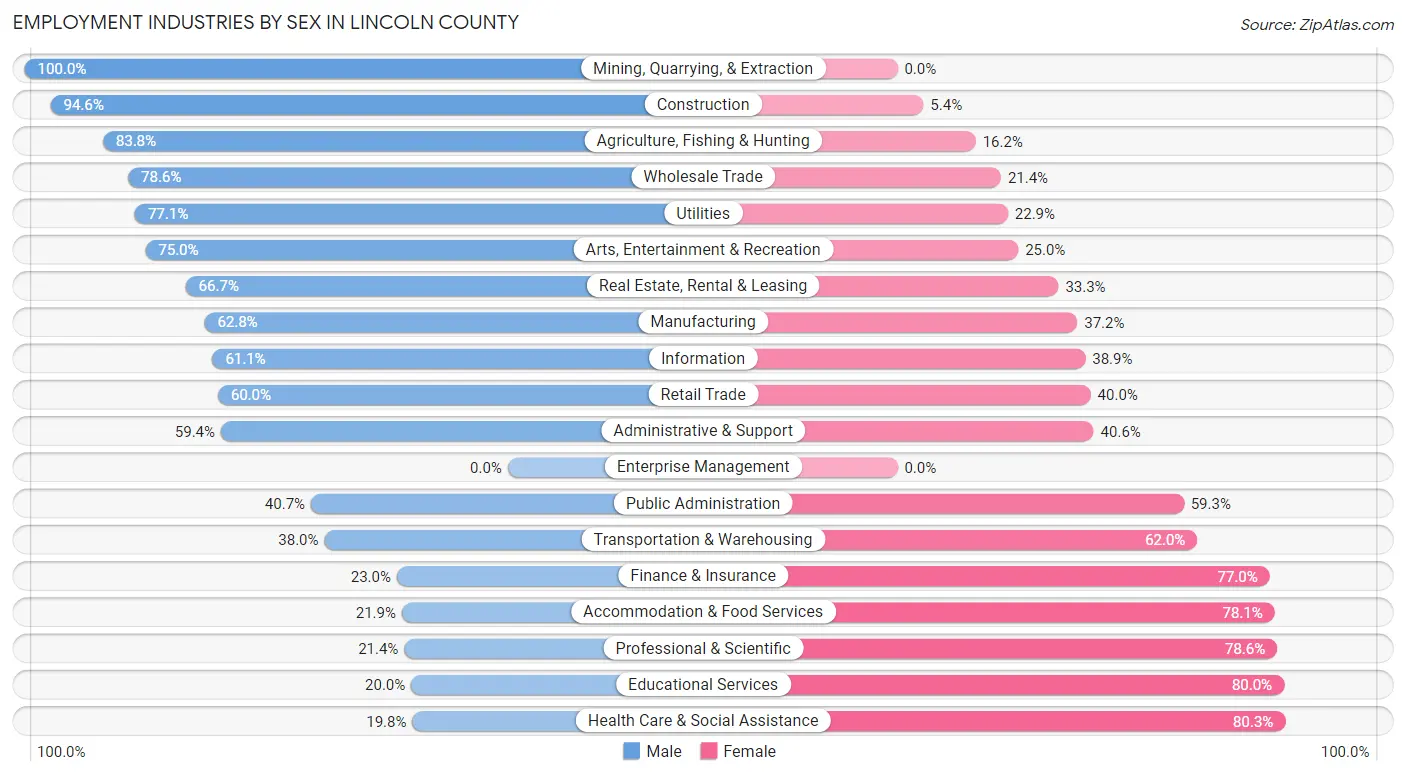
Employment Industries by Sex in Lincoln County
The Lincoln County industries that see more men than women are Mining, Quarrying, & Extraction (100.0%), Construction (94.6%), and Agriculture, Fishing & Hunting (83.8%), whereas the industries that tend to have a higher number of women are Health Care & Social Assistance (80.2%), Educational Services (80.0%), and Professional & Scientific (78.6%).
| Industry | Male | Female |
| Agriculture, Fishing & Hunting | 181 (83.8%) | 35 (16.2%) |
| Mining, Quarrying, & Extraction | 33 (100.0%) | 0 (0.0%) |
| Construction | 88 (94.6%) | 5 (5.4%) |
| Manufacturing | 86 (62.8%) | 51 (37.2%) |
| Wholesale Trade | 22 (78.6%) | 6 (21.4%) |
| Retail Trade | 72 (60.0%) | 48 (40.0%) |
| Transportation & Warehousing | 41 (38.0%) | 67 (62.0%) |
| Utilities | 27 (77.1%) | 8 (22.9%) |
| Information | 11 (61.1%) | 7 (38.9%) |
| Finance & Insurance | 17 (23.0%) | 57 (77.0%) |
| Real Estate, Rental & Leasing | 4 (66.7%) | 2 (33.3%) |
| Professional & Scientific | 6 (21.4%) | 22 (78.6%) |
| Enterprise Management | 0 (0.0%) | 0 (0.0%) |
| Administrative & Support | 19 (59.4%) | 13 (40.6%) |
| Educational Services | 27 (20.0%) | 108 (80.0%) |
| Health Care & Social Assistance | 32 (19.8%) | 130 (80.2%) |
| Arts, Entertainment & Recreation | 9 (75.0%) | 3 (25.0%) |
| Accommodation & Food Services | 16 (21.9%) | 57 (78.1%) |
| Public Administration | 22 (40.7%) | 32 (59.3%) |
| Total | 743 (51.8%) | 692 (48.2%) |
Education in Lincoln County
School Enrollment in Lincoln County
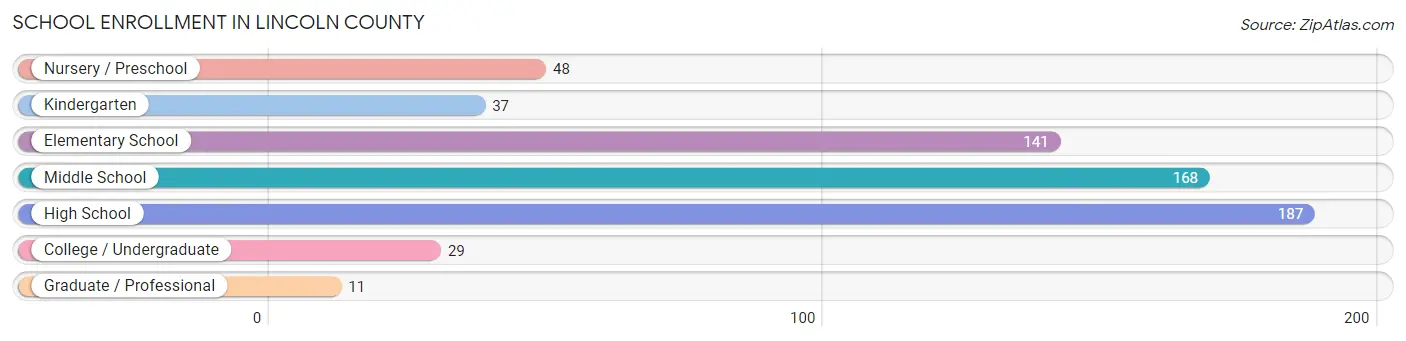
The most common levels of schooling among the 621 students in Lincoln County are high school (187 | 30.1%), middle school (168 | 27.1%), and elementary school (141 | 22.7%).
| School Level | # Students | % Students |
| Nursery / Preschool | 48 | 7.7% |
| Kindergarten | 37 | 6.0% |
| Elementary School | 141 | 22.7% |
| Middle School | 168 | 27.1% |
| High School | 187 | 30.1% |
| College / Undergraduate | 29 | 4.7% |
| Graduate / Professional | 11 | 1.8% |
| Total | 621 | 100.0% |
School Enrollment by Age by Funding Source in Lincoln County
Out of a total of 621 students who are enrolled in schools in Lincoln County, 29 (4.7%) attend a private institution, while the remaining 592 (95.3%) are enrolled in public schools. The age group of 3 to 4 year olds has the highest likelihood of being enrolled in private schools, with 6 (15.8% in the age bracket) enrolled. Conversely, the age group of 18 to 19 year olds has the lowest likelihood of being enrolled in a private school, with 55 (100.0% in the age bracket) attending a public institution.

| Age Bracket | Public School | Private School |
| 3 to 4 Year Olds | 32 (84.2%) | 6 (15.8%) |
| 5 to 9 Year Old | 168 (96.0%) | 7 (4.0%) |
| 10 to 14 Year Olds | 181 (94.8%) | 10 (5.2%) |
| 15 to 17 Year Olds | 116 (95.1%) | 6 (4.9%) |
| 18 to 19 Year Olds | 55 (100.0%) | 0 (0.0%) |
| 20 to 24 Year Olds | 28 (100.0%) | 0 (0.0%) |
| 25 to 34 Year Olds | 8 (100.0%) | 0 (0.0%) |
| 35 Years and over | 4 (100.0%) | 0 (0.0%) |
| Total | 592 (95.3%) | 29 (4.7%) |
Educational Attainment by Field of Study in Lincoln County
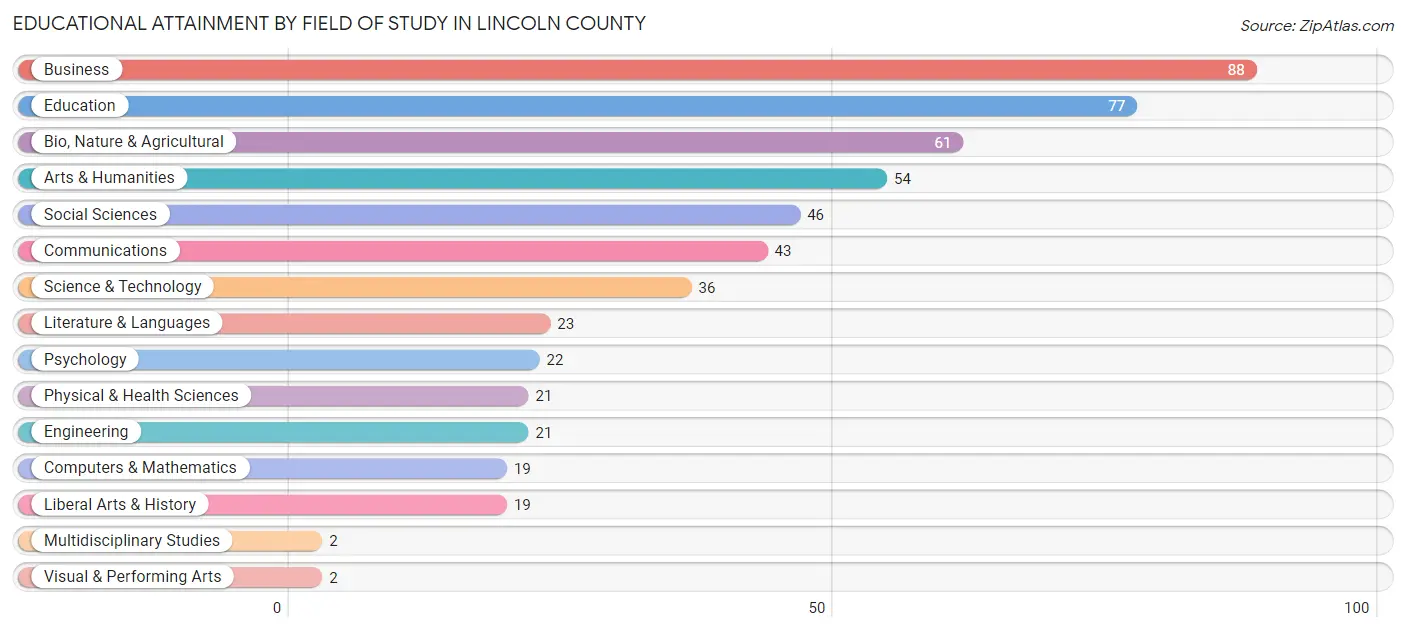
Business (88 | 16.5%), education (77 | 14.4%), bio, nature & agricultural (61 | 11.4%), arts & humanities (54 | 10.1%), and social sciences (46 | 8.6%) are the most common fields of study among 534 individuals in Lincoln County who have obtained a bachelor's degree or higher.
| Field of Study | # Graduates | % Graduates |
| Computers & Mathematics | 19 | 3.6% |
| Bio, Nature & Agricultural | 61 | 11.4% |
| Physical & Health Sciences | 21 | 3.9% |
| Psychology | 22 | 4.1% |
| Social Sciences | 46 | 8.6% |
| Engineering | 21 | 3.9% |
| Multidisciplinary Studies | 2 | 0.4% |
| Science & Technology | 36 | 6.7% |
| Business | 88 | 16.5% |
| Education | 77 | 14.4% |
| Literature & Languages | 23 | 4.3% |
| Liberal Arts & History | 19 | 3.6% |
| Visual & Performing Arts | 2 | 0.4% |
| Communications | 43 | 8.1% |
| Arts & Humanities | 54 | 10.1% |
| Total | 534 | 100.0% |
Transportation & Commute in Lincoln County
Vehicle Availability by Sex in Lincoln County
The most prevalent vehicle ownership categories in Lincoln County are males with 2 vehicles (249, accounting for 34.3%) and females with 2 vehicles (193, making up 36.7%).

| Vehicles Available | Male | Female |
| No Vehicle | 0 (0.0%) | 11 (1.6%) |
| 1 Vehicle | 54 (7.4%) | 75 (11.1%) |
| 2 Vehicles | 249 (34.3%) | 193 (28.4%) |
| 3 Vehicles | 179 (24.6%) | 148 (21.8%) |
| 4 Vehicles | 119 (16.4%) | 128 (18.9%) |
| 5 or more Vehicles | 126 (17.3%) | 124 (18.3%) |
| Total | 727 (100.0%) | 679 (100.0%) |
Commute Time in Lincoln County
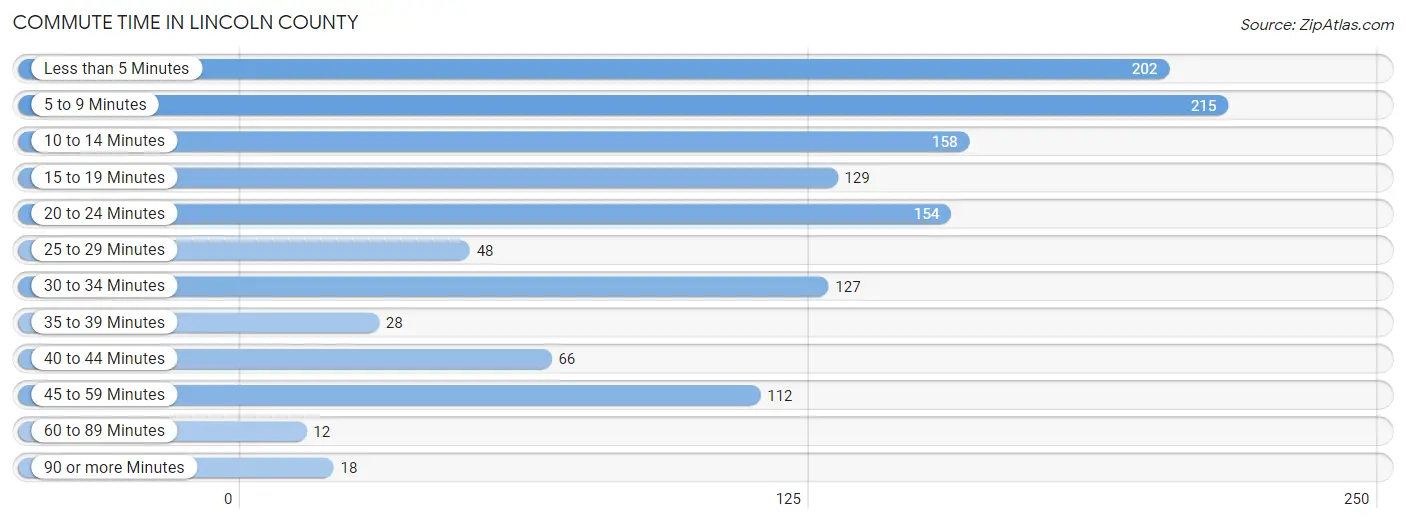
The most frequently occuring commute durations in Lincoln County are 5 to 9 minutes (215 commuters, 16.9%), less than 5 minutes (202 commuters, 15.9%), and 10 to 14 minutes (158 commuters, 12.4%).
| Commute Time | # Commuters | % Commuters |
| Less than 5 Minutes | 202 | 15.9% |
| 5 to 9 Minutes | 215 | 16.9% |
| 10 to 14 Minutes | 158 | 12.4% |
| 15 to 19 Minutes | 129 | 10.2% |
| 20 to 24 Minutes | 154 | 12.1% |
| 25 to 29 Minutes | 48 | 3.8% |
| 30 to 34 Minutes | 127 | 10.0% |
| 35 to 39 Minutes | 28 | 2.2% |
| 40 to 44 Minutes | 66 | 5.2% |
| 45 to 59 Minutes | 112 | 8.8% |
| 60 to 89 Minutes | 12 | 0.9% |
| 90 or more Minutes | 18 | 1.4% |
Commute Time by Sex in Lincoln County
The most common commute times in Lincoln County are 5 to 9 minutes (134 commuters, 21.2%) for males and 20 to 24 minutes (112 commuters, 17.6%) for females.

| Commute Time | Male | Female |
| Less than 5 Minutes | 125 (19.8%) | 77 (12.1%) |
| 5 to 9 Minutes | 134 (21.2%) | 81 (12.7%) |
| 10 to 14 Minutes | 97 (15.3%) | 61 (9.6%) |
| 15 to 19 Minutes | 38 (6.0%) | 91 (14.3%) |
| 20 to 24 Minutes | 42 (6.7%) | 112 (17.6%) |
| 25 to 29 Minutes | 12 (1.9%) | 36 (5.7%) |
| 30 to 34 Minutes | 52 (8.2%) | 75 (11.8%) |
| 35 to 39 Minutes | 19 (3.0%) | 9 (1.4%) |
| 40 to 44 Minutes | 45 (7.1%) | 21 (3.3%) |
| 45 to 59 Minutes | 51 (8.1%) | 61 (9.6%) |
| 60 to 89 Minutes | 12 (1.9%) | 0 (0.0%) |
| 90 or more Minutes | 5 (0.8%) | 13 (2.0%) |
Time of Departure to Work by Sex in Lincoln County
The most frequent times of departure to work in Lincoln County are 7:30 AM to 7:59 AM (177, 28.0%) for males and 7:30 AM to 7:59 AM (147, 23.1%) for females.

| Time of Departure | Male | Female |
| 12:00 AM to 4:59 AM | 9 (1.4%) | 59 (9.3%) |
| 5:00 AM to 5:29 AM | 48 (7.6%) | 21 (3.3%) |
| 5:30 AM to 5:59 AM | 32 (5.1%) | 33 (5.2%) |
| 6:00 AM to 6:29 AM | 43 (6.8%) | 30 (4.7%) |
| 6:30 AM to 6:59 AM | 44 (7.0%) | 35 (5.5%) |
| 7:00 AM to 7:29 AM | 135 (21.4%) | 80 (12.6%) |
| 7:30 AM to 7:59 AM | 177 (28.0%) | 147 (23.1%) |
| 8:00 AM to 8:29 AM | 34 (5.4%) | 40 (6.3%) |
| 8:30 AM to 8:59 AM | 19 (3.0%) | 56 (8.8%) |
| 9:00 AM to 9:59 AM | 18 (2.9%) | 32 (5.0%) |
| 10:00 AM to 10:59 AM | 0 (0.0%) | 33 (5.2%) |
| 11:00 AM to 11:59 AM | 7 (1.1%) | 5 (0.8%) |
| 12:00 PM to 3:59 PM | 31 (4.9%) | 27 (4.2%) |
| 4:00 PM to 11:59 PM | 35 (5.5%) | 39 (6.1%) |
| Total | 632 (100.0%) | 637 (100.0%) |
Housing Occupancy in Lincoln County
Occupancy by Ownership in Lincoln County
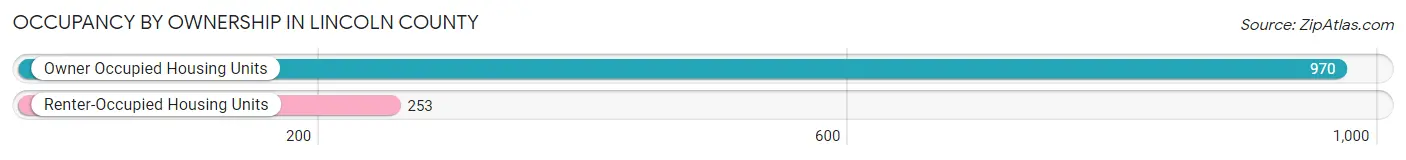
Of the total 1,223 dwellings in Lincoln County, owner-occupied units account for 970 (79.3%), while renter-occupied units make up 253 (20.7%).
| Occupancy | # Housing Units | % Housing Units |
| Owner Occupied Housing Units | 970 | 79.3% |
| Renter-Occupied Housing Units | 253 | 20.7% |
| Total Occupied Housing Units | 1,223 | 100.0% |
Occupancy by Household Size in Lincoln County
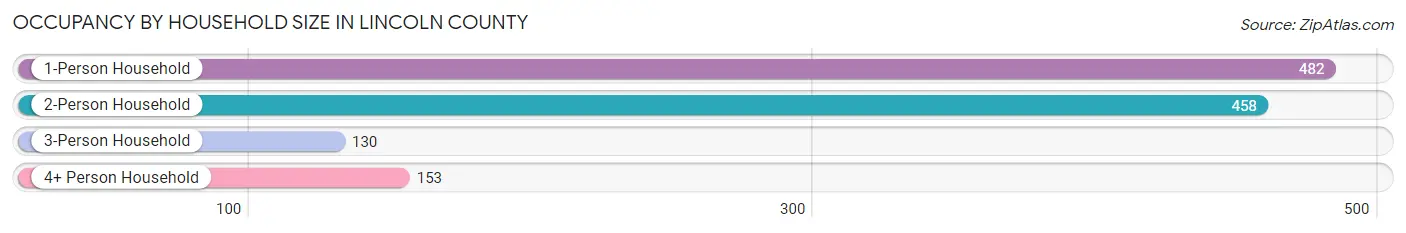
| Household Size | # Housing Units | % Housing Units |
| 1-Person Household | 482 | 39.4% |
| 2-Person Household | 458 | 37.4% |
| 3-Person Household | 130 | 10.6% |
| 4+ Person Household | 153 | 12.5% |
| Total Housing Units | 1,223 | 100.0% |
Occupancy by Ownership by Household Size in Lincoln County
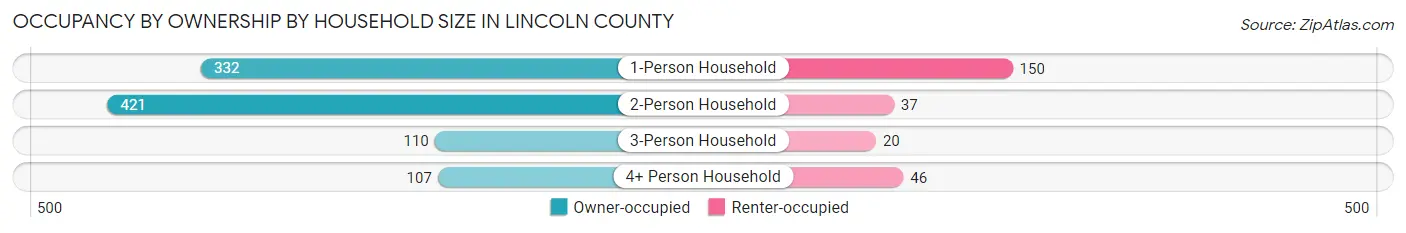
| Household Size | Owner-occupied | Renter-occupied |
| 1-Person Household | 332 (68.9%) | 150 (31.1%) |
| 2-Person Household | 421 (91.9%) | 37 (8.1%) |
| 3-Person Household | 110 (84.6%) | 20 (15.4%) |
| 4+ Person Household | 107 (69.9%) | 46 (30.1%) |
| Total Housing Units | 970 (79.3%) | 253 (20.7%) |
Occupancy by Educational Attainment in Lincoln County
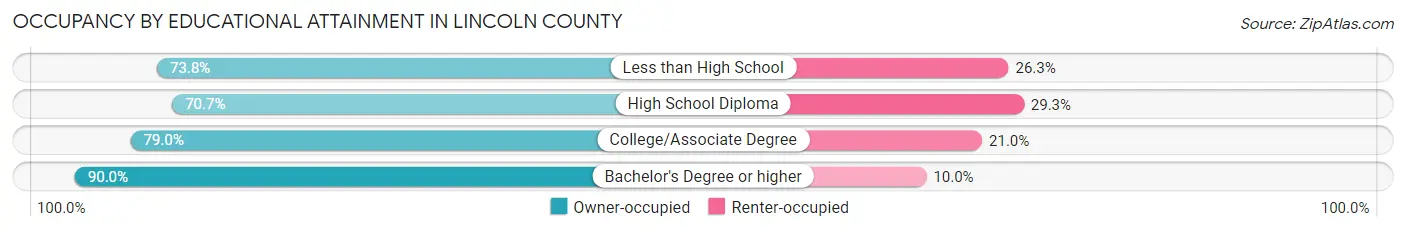
| Household Size | Owner-occupied | Renter-occupied |
| Less than High School | 59 (73.8%) | 21 (26.3%) |
| High School Diploma | 215 (70.7%) | 89 (29.3%) |
| College/Associate Degree | 425 (79.0%) | 113 (21.0%) |
| Bachelor's Degree or higher | 271 (90.0%) | 30 (10.0%) |
Occupancy by Age of Householder in Lincoln County
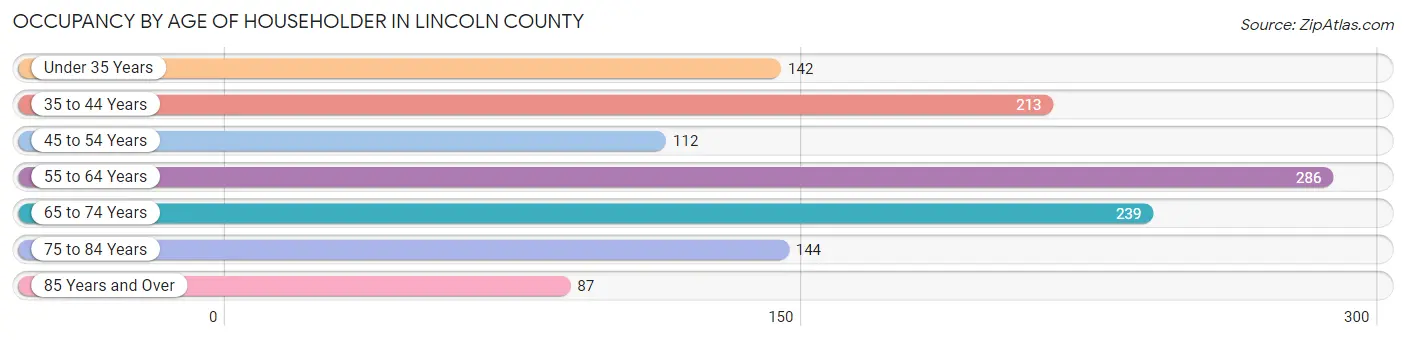
| Age Bracket | # Households | % Households |
| Under 35 Years | 142 | 11.6% |
| 35 to 44 Years | 213 | 17.4% |
| 45 to 54 Years | 112 | 9.2% |
| 55 to 64 Years | 286 | 23.4% |
| 65 to 74 Years | 239 | 19.5% |
| 75 to 84 Years | 144 | 11.8% |
| 85 Years and Over | 87 | 7.1% |
| Total | 1,223 | 100.0% |
Housing Finances in Lincoln County
Median Income by Occupancy in Lincoln County

| Occupancy Type | # Households | Median Income |
| Owner-Occupied | 970 (79.3%) | $56,786 |
| Renter-Occupied | 253 (20.7%) | $22,813 |
| Average | 1,223 (100.0%) | $52,540 |
Occupancy by Householder Income Bracket in Lincoln County
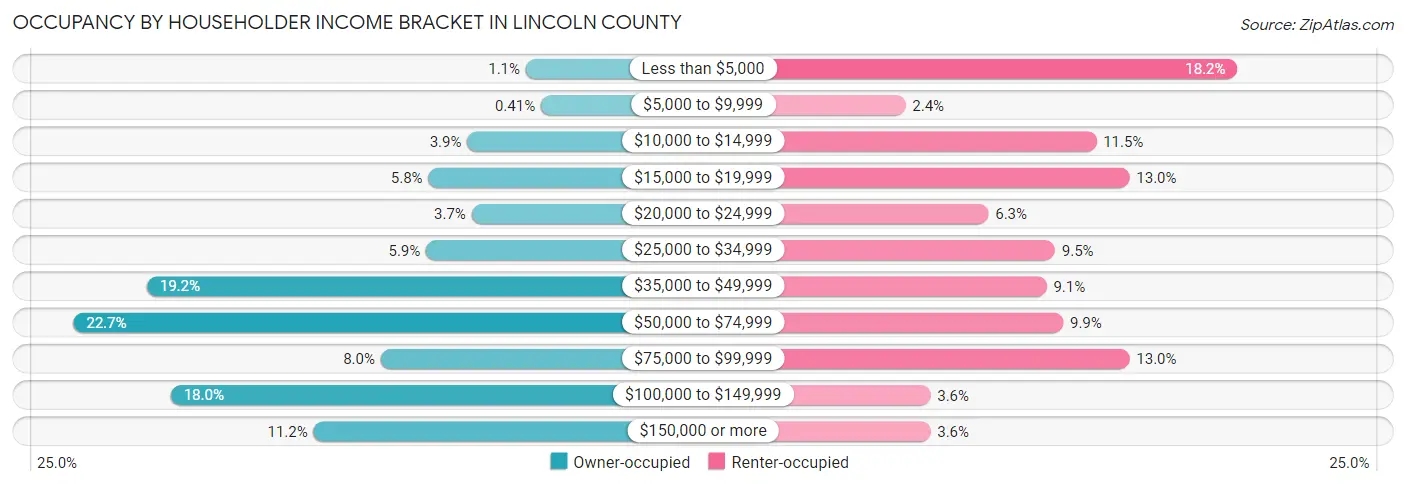
| Income Bracket | Owner-occupied | Renter-occupied |
| Less than $5,000 | 11 (1.1%) | 46 (18.2%) |
| $5,000 to $9,999 | 4 (0.4%) | 6 (2.4%) |
| $10,000 to $14,999 | 38 (3.9%) | 29 (11.5%) |
| $15,000 to $19,999 | 56 (5.8%) | 33 (13.0%) |
| $20,000 to $24,999 | 36 (3.7%) | 16 (6.3%) |
| $25,000 to $34,999 | 57 (5.9%) | 24 (9.5%) |
| $35,000 to $49,999 | 186 (19.2%) | 23 (9.1%) |
| $50,000 to $74,999 | 220 (22.7%) | 25 (9.9%) |
| $75,000 to $99,999 | 78 (8.0%) | 33 (13.0%) |
| $100,000 to $149,999 | 175 (18.0%) | 9 (3.6%) |
| $150,000 or more | 109 (11.2%) | 9 (3.6%) |
| Total | 970 (100.0%) | 253 (100.0%) |
Monthly Housing Cost Tiers in Lincoln County
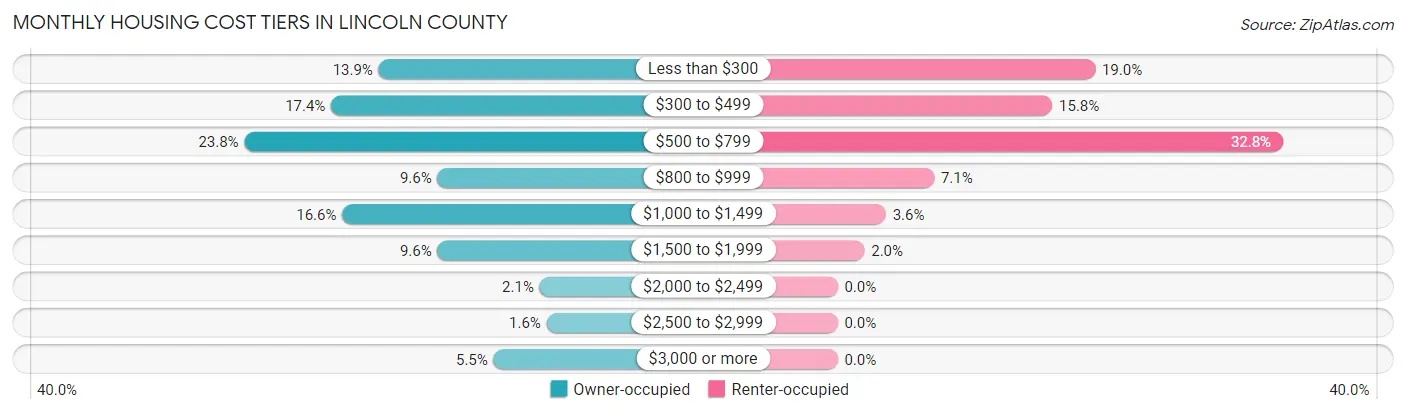
| Monthly Cost | Owner-occupied | Renter-occupied |
| Less than $300 | 135 (13.9%) | 48 (19.0%) |
| $300 to $499 | 169 (17.4%) | 40 (15.8%) |
| $500 to $799 | 231 (23.8%) | 83 (32.8%) |
| $800 to $999 | 93 (9.6%) | 18 (7.1%) |
| $1,000 to $1,499 | 161 (16.6%) | 9 (3.6%) |
| $1,500 to $1,999 | 93 (9.6%) | 5 (2.0%) |
| $2,000 to $2,499 | 20 (2.1%) | 0 (0.0%) |
| $2,500 to $2,999 | 15 (1.5%) | 0 (0.0%) |
| $3,000 or more | 53 (5.5%) | 0 (0.0%) |
| Total | 970 (100.0%) | 253 (100.0%) |
Physical Housing Characteristics in Lincoln County
Housing Structures in Lincoln County

| Structure Type | # Housing Units | % Housing Units |
| Single Unit, Detached | 1,105 | 90.3% |
| Single Unit, Attached | 0 | 0.0% |
| 2 Unit Apartments | 13 | 1.1% |
| 3 or 4 Unit Apartments | 9 | 0.7% |
| 5 to 9 Unit Apartments | 17 | 1.4% |
| 10 or more Apartments | 44 | 3.6% |
| Mobile Home / Other | 35 | 2.9% |
| Total | 1,223 | 100.0% |
Housing Structures by Occupancy in Lincoln County

| Structure Type | Owner-occupied | Renter-occupied |
| Single Unit, Detached | 945 (85.5%) | 160 (14.5%) |
| Single Unit, Attached | 0 (0.0%) | 0 (0.0%) |
| 2 Unit Apartments | 4 (30.8%) | 9 (69.2%) |
| 3 or 4 Unit Apartments | 0 (0.0%) | 9 (100.0%) |
| 5 to 9 Unit Apartments | 0 (0.0%) | 17 (100.0%) |
| 10 or more Apartments | 0 (0.0%) | 44 (100.0%) |
| Mobile Home / Other | 21 (60.0%) | 14 (40.0%) |
| Total | 970 (79.3%) | 253 (20.7%) |
Housing Structures by Number of Rooms in Lincoln County

| Number of Rooms | Owner-occupied | Renter-occupied |
| 1 Room | 0 (0.0%) | 12 (4.7%) |
| 2 or 3 Rooms | 24 (2.5%) | 58 (22.9%) |
| 4 or 5 Rooms | 185 (19.1%) | 99 (39.1%) |
| 6 or 7 Rooms | 350 (36.1%) | 59 (23.3%) |
| 8 or more Rooms | 411 (42.4%) | 25 (9.9%) |
| Total | 970 (100.0%) | 253 (100.0%) |
Housing Structure by Heating Type in Lincoln County

| Heating Type | Owner-occupied | Renter-occupied |
| Utility Gas | 473 (48.8%) | 93 (36.8%) |
| Bottled, Tank, or LP Gas | 322 (33.2%) | 65 (25.7%) |
| Electricity | 142 (14.6%) | 90 (35.6%) |
| Fuel Oil or Kerosene | 0 (0.0%) | 0 (0.0%) |
| Coal or Coke | 0 (0.0%) | 0 (0.0%) |
| All other Fuels | 33 (3.4%) | 5 (2.0%) |
| No Fuel Used | 0 (0.0%) | 0 (0.0%) |
| Total | 970 (100.0%) | 253 (100.0%) |
Household Vehicle Usage in Lincoln County

| Vehicles per Household | Owner-occupied | Renter-occupied |
| No Vehicle | 21 (2.2%) | 26 (10.3%) |
| 1 Vehicle | 122 (12.6%) | 144 (56.9%) |
| 2 Vehicles | 366 (37.7%) | 47 (18.6%) |
| 3 or more Vehicles | 461 (47.5%) | 36 (14.2%) |
| Total | 970 (100.0%) | 253 (100.0%) |
Real Estate & Mortgages in Lincoln County
Real Estate and Mortgage Overview in Lincoln County
| Characteristic | Without Mortgage | With Mortgage |
| Housing Units | 566 | 404 |
| Median Property Value | $81,600 | $122,000 |
| Median Household Income | $51,328 | $72 |
| Monthly Housing Costs | $422 | $53 |
| Real Estate Taxes | $1,282 | $2 |
Property Value by Mortgage Status in Lincoln County
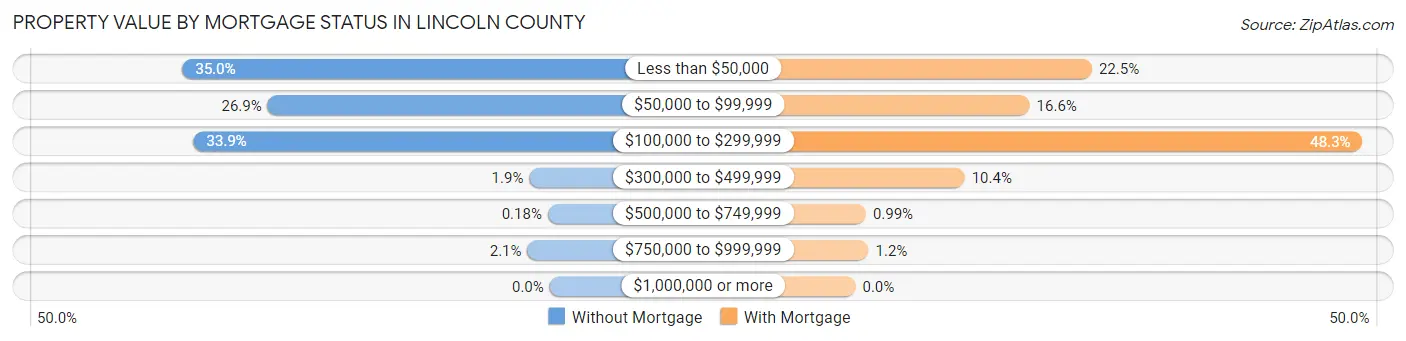
| Property Value | Without Mortgage | With Mortgage |
| Less than $50,000 | 198 (35.0%) | 91 (22.5%) |
| $50,000 to $99,999 | 152 (26.9%) | 67 (16.6%) |
| $100,000 to $299,999 | 192 (33.9%) | 195 (48.3%) |
| $300,000 to $499,999 | 11 (1.9%) | 42 (10.4%) |
| $500,000 to $749,999 | 1 (0.2%) | 4 (1.0%) |
| $750,000 to $999,999 | 12 (2.1%) | 5 (1.2%) |
| $1,000,000 or more | 0 (0.0%) | 0 (0.0%) |
| Total | 566 (100.0%) | 404 (100.0%) |
Household Income by Mortgage Status in Lincoln County
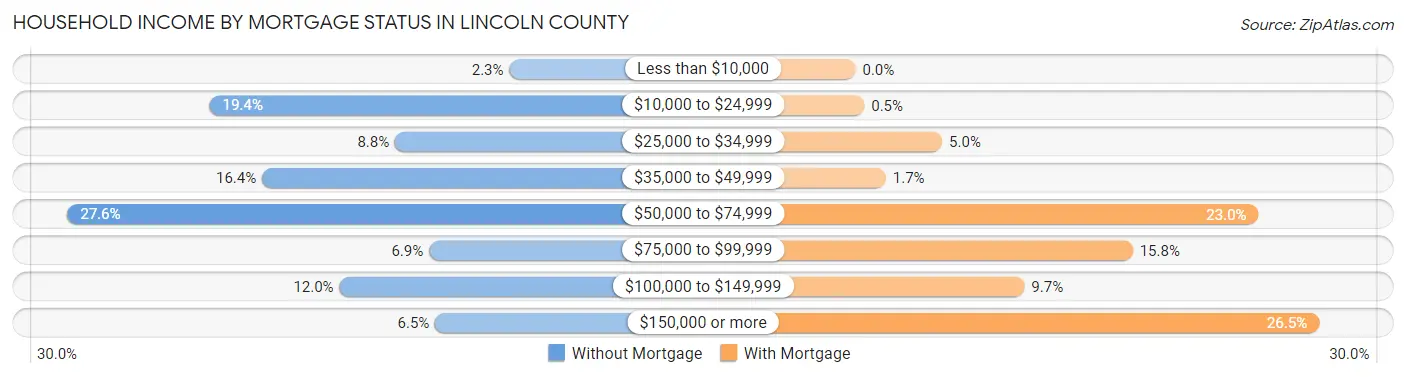
| Household Income | Without Mortgage | With Mortgage |
| Less than $10,000 | 13 (2.3%) | 0 (0.0%) |
| $10,000 to $24,999 | 110 (19.4%) | 2 (0.5%) |
| $25,000 to $34,999 | 50 (8.8%) | 20 (5.0%) |
| $35,000 to $49,999 | 93 (16.4%) | 7 (1.7%) |
| $50,000 to $74,999 | 156 (27.6%) | 93 (23.0%) |
| $75,000 to $99,999 | 39 (6.9%) | 64 (15.8%) |
| $100,000 to $149,999 | 68 (12.0%) | 39 (9.7%) |
| $150,000 or more | 37 (6.5%) | 107 (26.5%) |
| Total | 566 (100.0%) | 404 (100.0%) |
Property Value to Household Income Ratio in Lincoln County
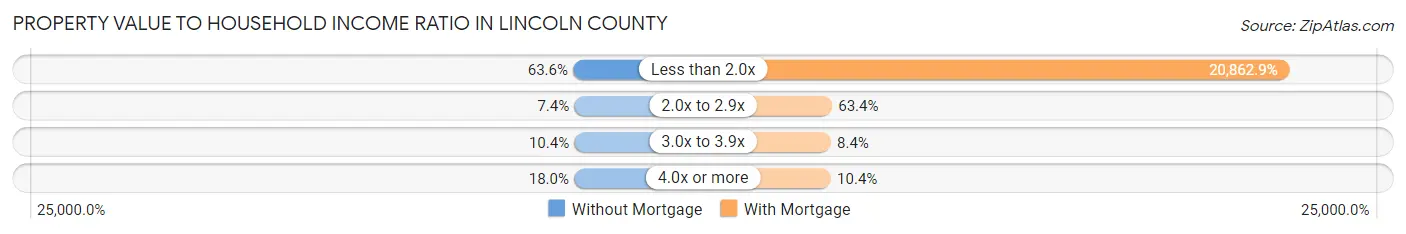
| Value-to-Income Ratio | Without Mortgage | With Mortgage |
| Less than 2.0x | 360 (63.6%) | 84,286 (20,862.9%) |
| 2.0x to 2.9x | 42 (7.4%) | 256 (63.4%) |
| 3.0x to 3.9x | 59 (10.4%) | 34 (8.4%) |
| 4.0x or more | 102 (18.0%) | 42 (10.4%) |
| Total | 566 (100.0%) | 404 (100.0%) |
Real Estate Taxes by Mortgage Status in Lincoln County
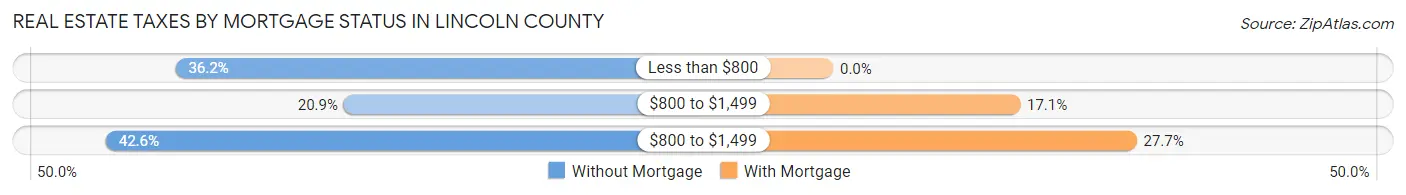
| Property Taxes | Without Mortgage | With Mortgage |
| Less than $800 | 205 (36.2%) | 0 (0.0%) |
| $800 to $1,499 | 118 (20.8%) | 69 (17.1%) |
| $800 to $1,499 | 241 (42.6%) | 112 (27.7%) |
| Total | 566 (100.0%) | 404 (100.0%) |
Health & Disability in Lincoln County
Health Insurance Coverage by Age in Lincoln County

| Age Bracket | With Coverage | Without Coverage |
| Under 6 Years | 187 (95.4%) | 9 (4.6%) |
| 6 to 18 Years | 510 (99.0%) | 5 (1.0%) |
| 19 to 25 Years | 120 (78.4%) | 33 (21.6%) |
| 26 to 34 Years | 170 (88.5%) | 22 (11.5%) |
| 35 to 44 Years | 371 (88.5%) | 48 (11.5%) |
| 45 to 54 Years | 186 (75.6%) | 60 (24.4%) |
| 55 to 64 Years | 434 (95.0%) | 23 (5.0%) |
| 65 to 74 Years | 420 (100.0%) | 0 (0.0%) |
| 75 Years and older | 274 (100.0%) | 0 (0.0%) |
| Total | 2,672 (93.0%) | 200 (7.0%) |
Health Insurance Coverage by Citizenship Status in Lincoln County
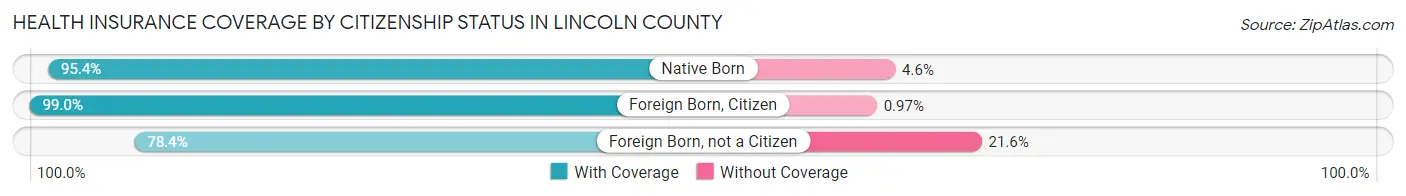
| Citizenship Status | With Coverage | Without Coverage |
| Native Born | 187 (95.4%) | 9 (4.6%) |
| Foreign Born, Citizen | 510 (99.0%) | 5 (1.0%) |
| Foreign Born, not a Citizen | 120 (78.4%) | 33 (21.6%) |
Health Insurance Coverage by Household Income in Lincoln County
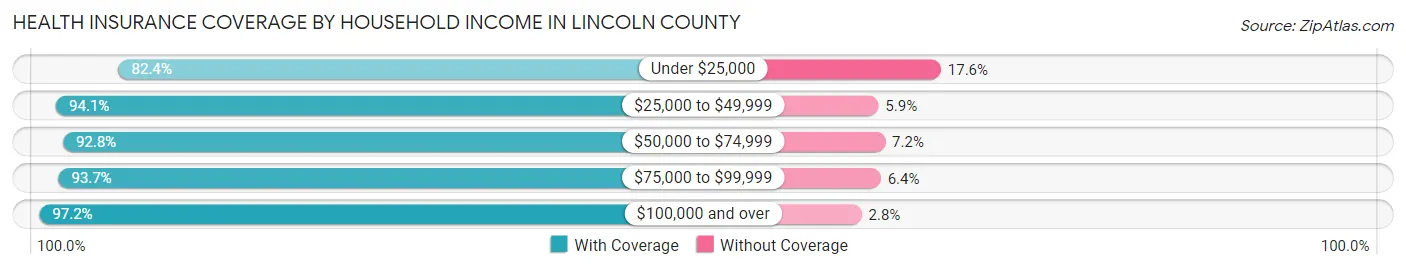
| Household Income | With Coverage | Without Coverage |
| Under $25,000 | 346 (82.4%) | 74 (17.6%) |
| $25,000 to $49,999 | 572 (94.1%) | 36 (5.9%) |
| $50,000 to $74,999 | 542 (92.8%) | 42 (7.2%) |
| $75,000 to $99,999 | 339 (93.6%) | 23 (6.4%) |
| $100,000 and over | 873 (97.2%) | 25 (2.8%) |
Public vs Private Health Insurance Coverage by Age in Lincoln County
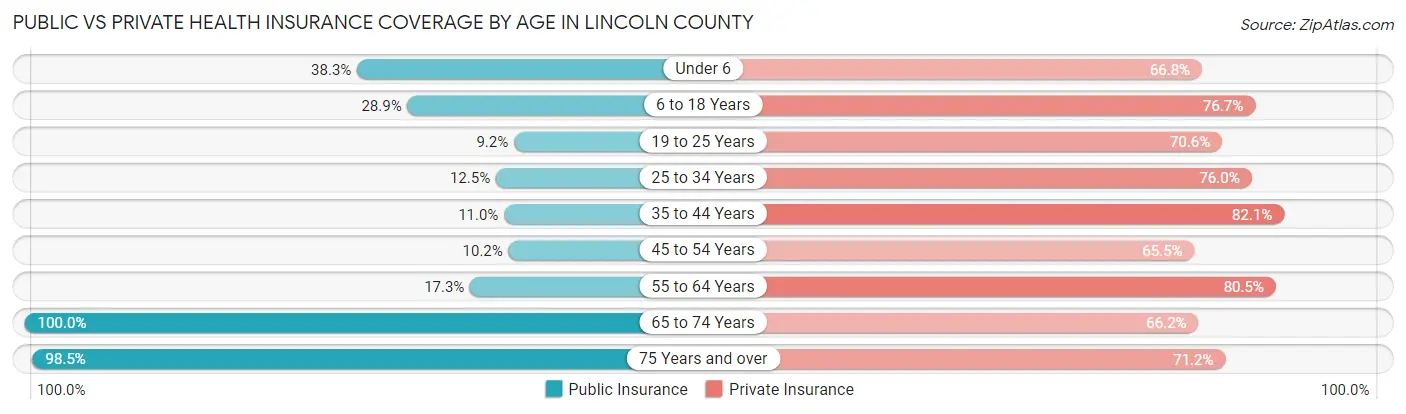
| Age Bracket | Public Insurance | Private Insurance |
| Under 6 | 75 (38.3%) | 131 (66.8%) |
| 6 to 18 Years | 149 (28.9%) | 395 (76.7%) |
| 19 to 25 Years | 14 (9.1%) | 108 (70.6%) |
| 25 to 34 Years | 24 (12.5%) | 146 (76.0%) |
| 35 to 44 Years | 46 (11.0%) | 344 (82.1%) |
| 45 to 54 Years | 25 (10.2%) | 161 (65.4%) |
| 55 to 64 Years | 79 (17.3%) | 368 (80.5%) |
| 65 to 74 Years | 420 (100.0%) | 278 (66.2%) |
| 75 Years and over | 270 (98.5%) | 195 (71.2%) |
| Total | 1,102 (38.4%) | 2,126 (74.0%) |
Disability Status by Sex by Age in Lincoln County
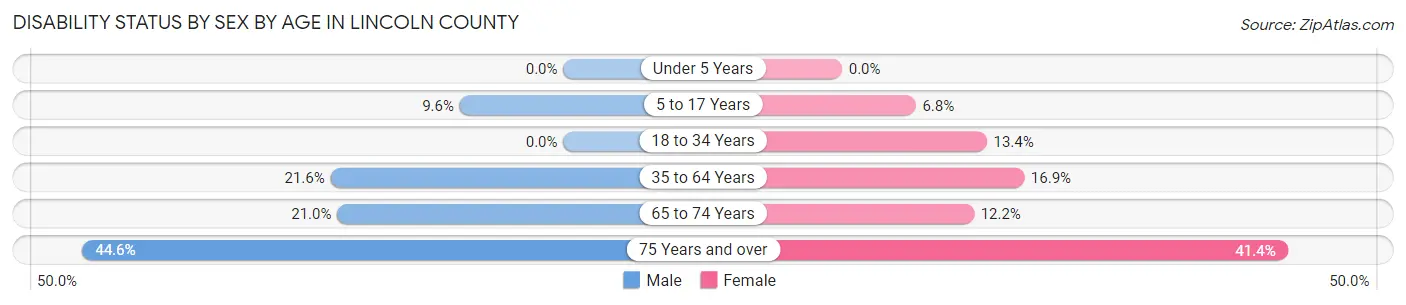
| Age Bracket | Male | Female |
| Under 5 Years | 0 (0.0%) | 0 (0.0%) |
| 5 to 17 Years | 27 (9.6%) | 16 (6.8%) |
| 18 to 34 Years | 0 (0.0%) | 27 (13.4%) |
| 35 to 64 Years | 121 (21.6%) | 95 (16.9%) |
| 65 to 74 Years | 47 (21.0%) | 24 (12.2%) |
| 75 Years and over | 50 (44.6%) | 67 (41.4%) |
Disability Class by Sex by Age in Lincoln County
Disability Class: Hearing Difficulty
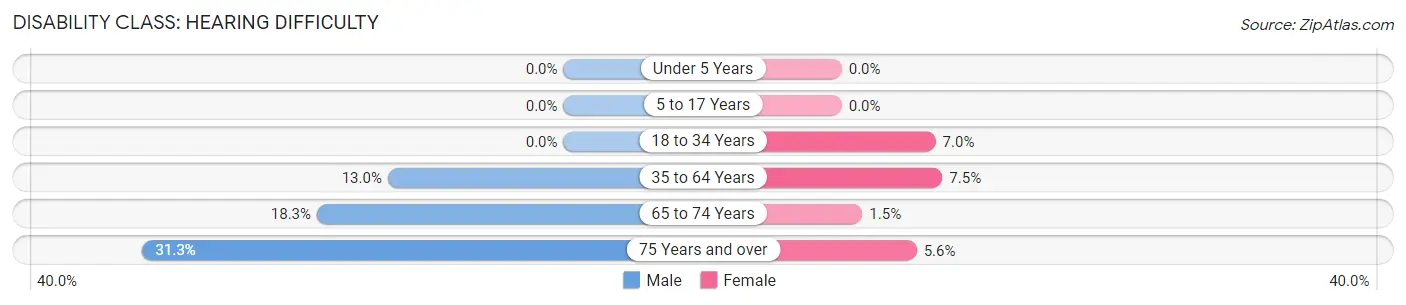
| Age Bracket | Male | Female |
| Under 5 Years | 0 (0.0%) | 0 (0.0%) |
| 5 to 17 Years | 0 (0.0%) | 0 (0.0%) |
| 18 to 34 Years | 0 (0.0%) | 14 (7.0%) |
| 35 to 64 Years | 73 (13.0%) | 42 (7.5%) |
| 65 to 74 Years | 41 (18.3%) | 3 (1.5%) |
| 75 Years and over | 35 (31.2%) | 9 (5.6%) |
Disability Class: Vision Difficulty
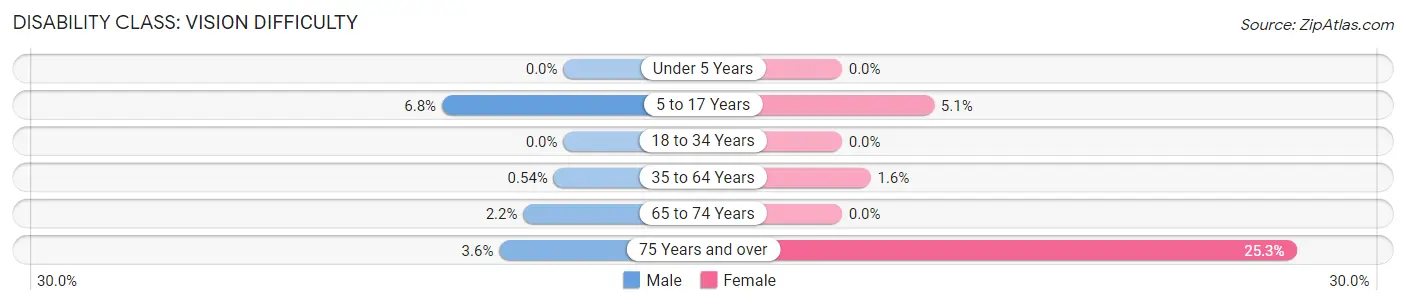
| Age Bracket | Male | Female |
| Under 5 Years | 0 (0.0%) | 0 (0.0%) |
| 5 to 17 Years | 19 (6.8%) | 12 (5.1%) |
| 18 to 34 Years | 0 (0.0%) | 0 (0.0%) |
| 35 to 64 Years | 3 (0.5%) | 9 (1.6%) |
| 65 to 74 Years | 5 (2.2%) | 0 (0.0%) |
| 75 Years and over | 4 (3.6%) | 41 (25.3%) |
Disability Class: Cognitive Difficulty
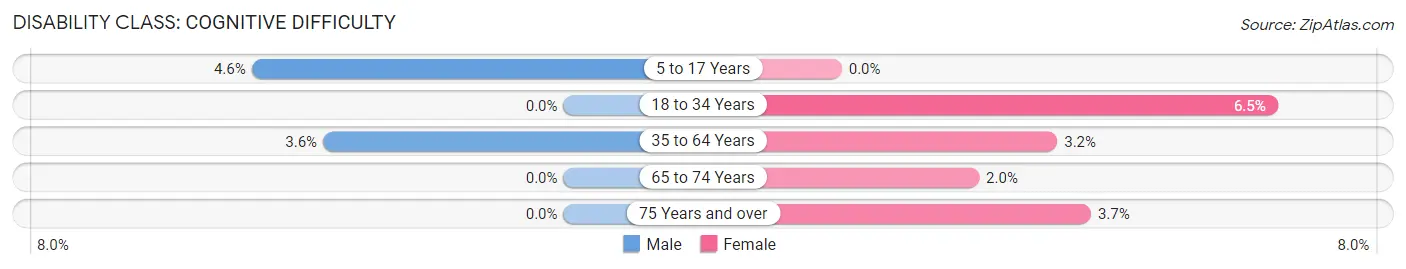
| Age Bracket | Male | Female |
| 5 to 17 Years | 13 (4.6%) | 0 (0.0%) |
| 18 to 34 Years | 0 (0.0%) | 13 (6.5%) |
| 35 to 64 Years | 20 (3.6%) | 18 (3.2%) |
| 65 to 74 Years | 0 (0.0%) | 4 (2.0%) |
| 75 Years and over | 0 (0.0%) | 6 (3.7%) |
Disability Class: Ambulatory Difficulty

| Age Bracket | Male | Female |
| 5 to 17 Years | 0 (0.0%) | 0 (0.0%) |
| 18 to 34 Years | 0 (0.0%) | 0 (0.0%) |
| 35 to 64 Years | 38 (6.8%) | 31 (5.5%) |
| 65 to 74 Years | 19 (8.5%) | 18 (9.2%) |
| 75 Years and over | 16 (14.3%) | 51 (31.5%) |
Disability Class: Self-Care Difficulty

| Age Bracket | Male | Female |
| 5 to 17 Years | 0 (0.0%) | 0 (0.0%) |
| 18 to 34 Years | 0 (0.0%) | 0 (0.0%) |
| 35 to 64 Years | 17 (3.0%) | 13 (2.3%) |
| 65 to 74 Years | 19 (8.5%) | 0 (0.0%) |
| 75 Years and over | 5 (4.5%) | 1 (0.6%) |
Technology Access in Lincoln County
Computing Device Access in Lincoln County
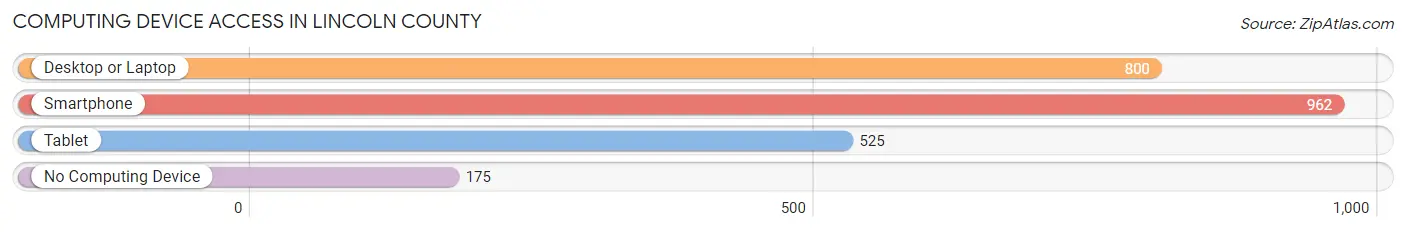
| Device Type | # Households | % Households |
| Desktop or Laptop | 800 | 65.4% |
| Smartphone | 962 | 78.7% |
| Tablet | 525 | 42.9% |
| No Computing Device | 175 | 14.3% |
| Total | 1,223 | 100.0% |
Internet Access in Lincoln County
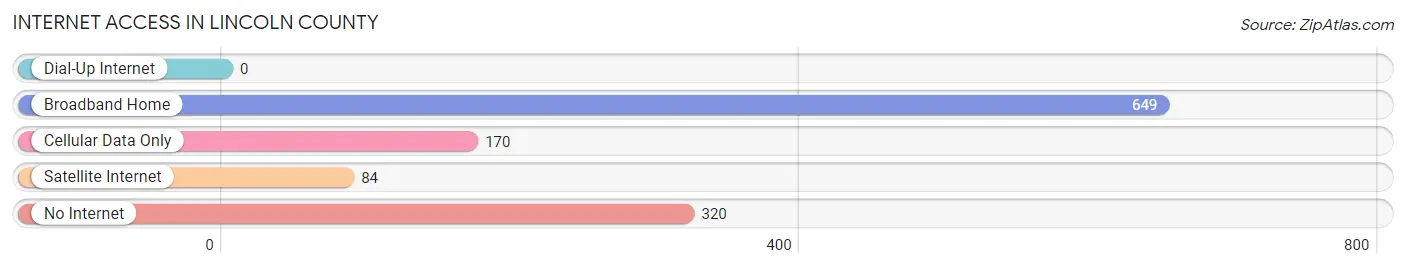
| Internet Type | # Households | % Households |
| Dial-Up Internet | 0 | 0.0% |
| Broadband Home | 649 | 53.1% |
| Cellular Data Only | 170 | 13.9% |
| Satellite Internet | 84 | 6.9% |
| No Internet | 320 | 26.2% |
| Total | 1,223 | 100.0% |
Lincoln County Summary
Lincoln County is located in the north-central part of the state of Kansas, and is bordered by Ottawa County to the north, Ellsworth County to the east, Russell County to the south, and Ness County to the west. The county seat is Lincoln, and the county has a total area of 845 square miles, of which 844 square miles is land and 1 square mile is water. As of the 2010 census, the population of Lincoln County was 3,521, making it the second least populous county in Kansas.
History
Lincoln County was established in 1867 and named after President Abraham Lincoln. The county was originally part of the larger Ellis County, which was established in 1867 as well. The county was organized in 1873, and the first county seat was located in Sylvan Grove. In 1876, the county seat was moved to Lincoln, which is the current county seat.
Geography
Lincoln County is located in the north-central part of the state of Kansas, and is bordered by Ottawa County to the north, Ellsworth County to the east, Russell County to the south, and Ness County to the west. The county has a total area of 845 square miles, of which 844 square miles is land and 1 square mile is water. The county is mostly flat, with some rolling hills in the western part of the county. The Smoky Hill River runs through the county, and there are several small lakes and ponds scattered throughout the county.
The county is home to several state parks and wildlife areas, including the Lincoln State Park, the Smoky Hill Wildlife Area, and the Lincoln State Fishing Lake. The county is also home to several small towns, including Lincoln, Sylvan Grove, and Dorrance.
Economy
Lincoln County is primarily an agricultural county, with the majority of the population employed in farming and ranching. The county is home to several large farms, and the main crops grown in the county are wheat, corn, and soybeans. The county also has a large cattle industry, and there are several large cattle ranches in the county.
In addition to agriculture, the county also has a small manufacturing sector, with several small factories located in the county. The county also has a small tourism industry, with several small bed and breakfasts located in the county.
Demographics
As of the 2010 census, the population of Lincoln County was 3,521, making it the second least populous county in Kansas. The population is spread out, with the largest city being Lincoln, which has a population of 1,845. The racial makeup of the county is 97.3% White, 0.3% African American, 0.3% Native American, 0.2% Asian, 0.1% Pacific Islander, 0.7% from other races, and 1.1% from two or more races. The median income for a household in the county is $41,944, and the median income for a family is $50,000. The per capita income for the county is $20,845.
Common Questions
What is the Total Population of Lincoln County?
Total Population of Lincoln County is 2,929.
What is the Total Male Population of Lincoln County?
Total Male Population of Lincoln County is 1,494.
What is the Total Female Population of Lincoln County?
Total Female Population of Lincoln County is 1,435.
What is the Ratio of Males per 100 Females in Lincoln County?
There are 104.11 Males per 100 Females in Lincoln County.
What is the Ratio of Females per 100 Males in Lincoln County?
There are 96.05 Females per 100 Males in Lincoln County.
What is the Median Population Age in Lincoln County?
Median Population Age in Lincoln County is 44.6 Years.
What is the Average Family Size in Lincoln County
Average Family Size in Lincoln County is 3.2 People.
What is the Average Household Size in Lincoln County
Average Household Size in Lincoln County is 2.4 People.
What is Per Capita Income in Lincoln County?
Per Capita income in Lincoln County is $31,383.
What is the Median Family Income in Lincoln County?
Median Family Income in Lincoln County is $69,722.
What is the Median Household income in Lincoln County?
Median Household Income in Lincoln County is $52,540.
What is Income or Wage Gap in Lincoln County?
Income or Wage Gap in Lincoln County is 25.0%.
Women in Lincoln County earn 75.0 cents for every dollar earned by a man.
What is Family Income Deficit in Lincoln County?
Family Income Deficit in Lincoln County is $8,581.
Families that are below poverty line in Lincoln County earn $8,581 less on average than the poverty threshold level.
What is Inequality or Gini Index in Lincoln County?
Inequality or Gini Index in Lincoln County is 0.44.
How Large is the Labor Force in Lincoln County?
There are 1,460 People in the Labor Forcein in Lincoln County.
What is the Percentage of People in the Labor Force in Lincoln County?
61.9% of People are in the Labor Force in Lincoln County.
What is the Unemployment Rate in Lincoln County?
Unemployment Rate in Lincoln County is 1.8%.