Leavenworth County, KS
Leavenworth County Map
Leavenworth County Overview
82,050
TOTAL POPULATION
43,746
MALE POPULATION
38,304
FEMALE POPULATION
114.21
MALES / 100 FEMALES
87.56
FEMALES / 100 MALES
38.0
MEDIAN AGE
3.1
AVG FAMILY SIZE
2.6
AVG HOUSEHOLD SIZE
$37,482
PER CAPITA INCOME
$104,211
AVG FAMILY INCOME
$84,307
AVG HOUSEHOLD INCOME
26.0%
WAGE / INCOME GAP [ % ]
74.0¢/ $1
WAGE / INCOME GAP [ $ ]
$11,219
FAMILY INCOME DEFICIT
0.42
INEQUALITY / GINI INDEX
38,782
LABOR FORCE [ PEOPLE ]
59.9%
PERCENT IN LABOR FORCE
4.5%
UNEMPLOYMENT RATE
Leavenworth County Area Codes
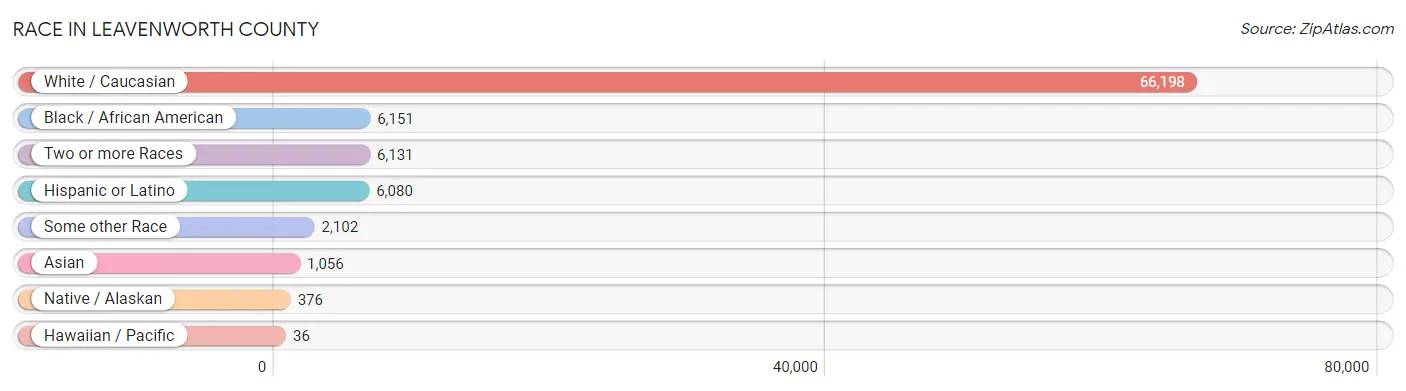
Race in Leavenworth County
The most populous races in Leavenworth County are White / Caucasian (66,198 | 80.7%), Black / African American (6,151 | 7.5%), and Two or more Races (6,131 | 7.5%).
| Race | # Population | % Population |
| Asian | 1,056 | 1.3% |
| Black / African American | 6,151 | 7.5% |
| Hawaiian / Pacific | 36 | 0.0% |
| Hispanic or Latino | 6,080 | 7.4% |
| Native / Alaskan | 376 | 0.5% |
| White / Caucasian | 66,198 | 80.7% |
| Two or more Races | 6,131 | 7.5% |
| Some other Race | 2,102 | 2.6% |
| Total | 82,050 | 100.0% |
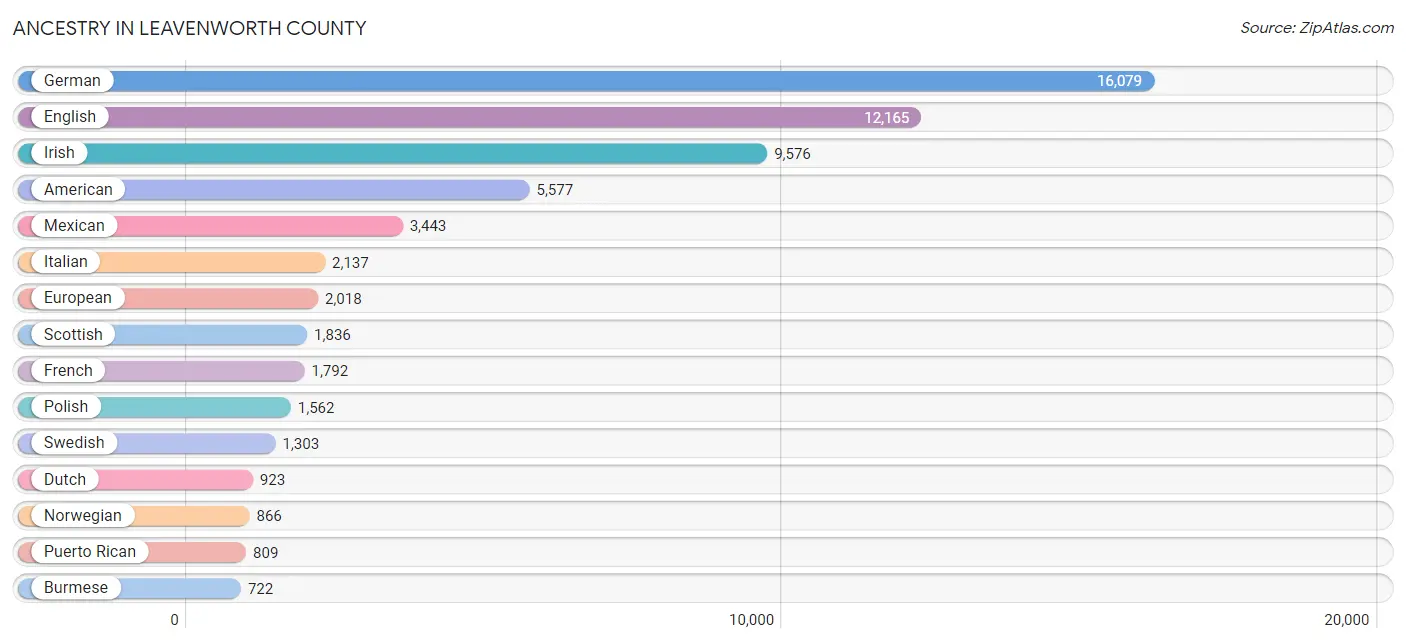
Ancestry in Leavenworth County
The most populous ancestries reported in Leavenworth County are German (16,079 | 19.6%), English (12,165 | 14.8%), Irish (9,576 | 11.7%), American (5,577 | 6.8%), and Mexican (3,443 | 4.2%), together accounting for 57.1% of all Leavenworth County residents.
| Ancestry | # Population | % Population |
| African | 167 | 0.2% |
| Albanian | 40 | 0.1% |
| American | 5,577 | 6.8% |
| Apache | 113 | 0.1% |
| Arab | 177 | 0.2% |
| Arapaho | 10 | 0.0% |
| Argentinean | 30 | 0.0% |
| Armenian | 28 | 0.0% |
| Australian | 25 | 0.0% |
| Austrian | 90 | 0.1% |
| Belgian | 57 | 0.1% |
| Bhutanese | 249 | 0.3% |
| Blackfeet | 203 | 0.3% |
| Brazilian | 109 | 0.1% |
| British | 356 | 0.4% |
| Bulgarian | 95 | 0.1% |
| Burmese | 722 | 0.9% |
| Cajun | 20 | 0.0% |
| Canadian | 55 | 0.1% |
| Celtic | 14 | 0.0% |
| Central American | 505 | 0.6% |
| Central American Indian | 65 | 0.1% |
| Cherokee | 624 | 0.8% |
| Choctaw | 29 | 0.0% |
| Colombian | 8 | 0.0% |
| Comanche | 6 | 0.0% |
| Costa Rican | 14 | 0.0% |
| Cree | 6 | 0.0% |
| Creek | 22 | 0.0% |
| Croatian | 172 | 0.2% |
| Cuban | 159 | 0.2% |
| Czech | 306 | 0.4% |
| Czechoslovakian | 30 | 0.0% |
| Danish | 296 | 0.4% |
| Delaware | 10 | 0.0% |
| Dominican | 106 | 0.1% |
| Dutch | 923 | 1.1% |
| Eastern European | 101 | 0.1% |
| Ecuadorian | 17 | 0.0% |
| English | 12,165 | 14.8% |
| Ethiopian | 5 | 0.0% |
| European | 2,018 | 2.5% |
| Filipino | 48 | 0.1% |
| Finnish | 71 | 0.1% |
| French | 1,792 | 2.2% |
| French American Indian | 30 | 0.0% |
| French Canadian | 248 | 0.3% |
| German | 16,079 | 19.6% |
| German Russian | 39 | 0.1% |
| Greek | 293 | 0.4% |
| Guamanian / Chamorro | 38 | 0.1% |
| Guatemalan | 144 | 0.2% |
| Haitian | 57 | 0.1% |
| Hopi | 4 | 0.0% |
| Hungarian | 191 | 0.2% |
| Indian (Asian) | 340 | 0.4% |
| Inupiat | 4 | 0.0% |
| Iranian | 8 | 0.0% |
| Irish | 9,576 | 11.7% |
| Iroquois | 28 | 0.0% |
| Italian | 2,137 | 2.6% |
| Jamaican | 241 | 0.3% |
| Jordanian | 40 | 0.1% |
| Kenyan | 43 | 0.1% |
| Korean | 260 | 0.3% |
| Lebanese | 27 | 0.0% |
| Lithuanian | 45 | 0.1% |
| Luxembourger | 19 | 0.0% |
| Malaysian | 103 | 0.1% |
| Mexican | 3,443 | 4.2% |
| Moroccan | 23 | 0.0% |
| Native Hawaiian | 68 | 0.1% |
| Navajo | 16 | 0.0% |
| New Zealander | 25 | 0.0% |
| Nigerian | 185 | 0.2% |
| Northern European | 242 | 0.3% |
| Norwegian | 866 | 1.1% |
| Osage | 225 | 0.3% |
| Ottawa | 6 | 0.0% |
| Pakistani | 87 | 0.1% |
| Palestinian | 87 | 0.1% |
| Panamanian | 237 | 0.3% |
| Pennsylvania German | 251 | 0.3% |
| Polish | 1,562 | 1.9% |
| Portuguese | 264 | 0.3% |
| Potawatomi | 220 | 0.3% |
| Puerto Rican | 809 | 1.0% |
| Puget Sound Salish | 5 | 0.0% |
| Romanian | 14 | 0.0% |
| Russian | 256 | 0.3% |
| Salvadoran | 110 | 0.1% |
| Samoan | 29 | 0.0% |
| Scandinavian | 224 | 0.3% |
| Scotch-Irish | 664 | 0.8% |
| Scottish | 1,836 | 2.2% |
| Seminole | 51 | 0.1% |
| Serbian | 33 | 0.0% |
| Sioux | 249 | 0.3% |
| Slavic | 99 | 0.1% |
| Slovak | 37 | 0.1% |
| South American | 55 | 0.1% |
| Spaniard | 149 | 0.2% |
| Spanish | 259 | 0.3% |
| Sri Lankan | 124 | 0.2% |
| Subsaharan African | 413 | 0.5% |
| Swedish | 1,303 | 1.6% |
| Swiss | 151 | 0.2% |
| Thai | 22 | 0.0% |
| Tohono O'Odham | 15 | 0.0% |
| Ukrainian | 77 | 0.1% |
| Welsh | 304 | 0.4% |
| Yaqui | 11 | 0.0% |
| Yup'ik | 40 | 0.1% | View All 113 Rows |
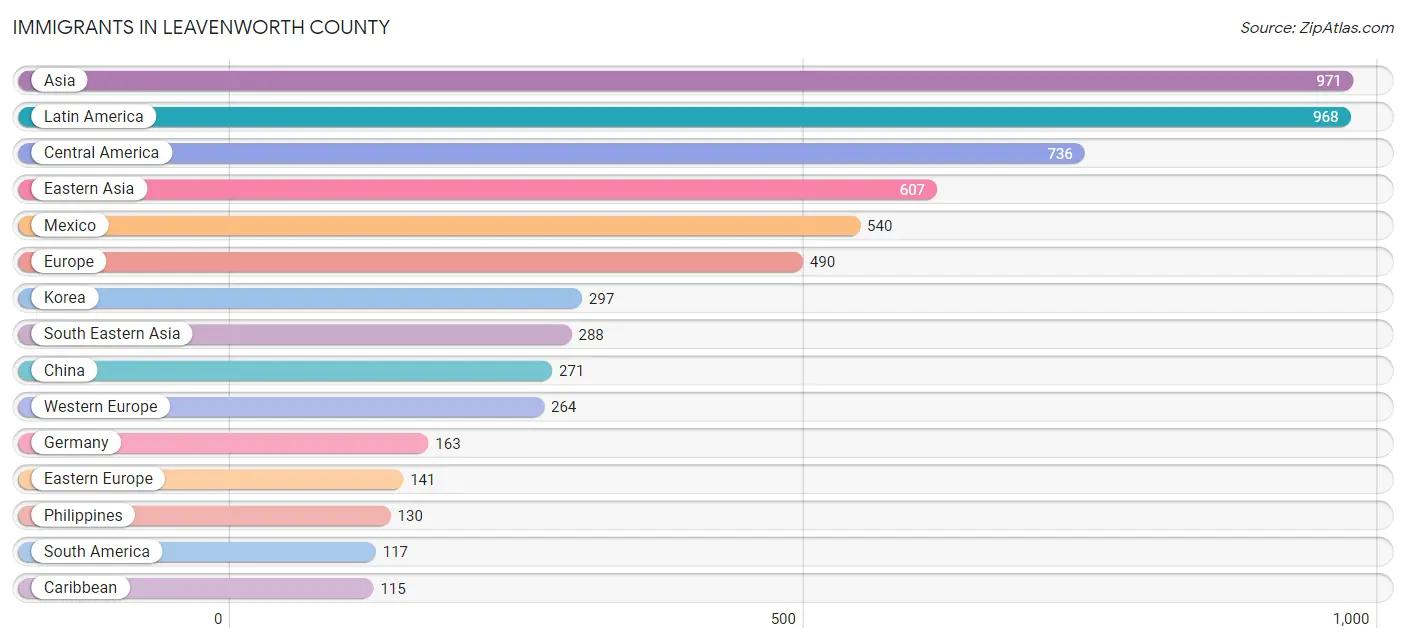
Immigrants in Leavenworth County
The most numerous immigrant groups reported in Leavenworth County came from Asia (971 | 1.2%), Latin America (968 | 1.2%), Central America (736 | 0.9%), Eastern Asia (607 | 0.7%), and Mexico (540 | 0.7%), together accounting for 4.7% of all Leavenworth County residents.
| Immigration Origin | # Population | % Population |
| Africa | 74 | 0.1% |
| Argentina | 32 | 0.0% |
| Asia | 971 | 1.2% |
| Australia | 9 | 0.0% |
| Belgium | 92 | 0.1% |
| Brazil | 58 | 0.1% |
| Bulgaria | 38 | 0.1% |
| Canada | 73 | 0.1% |
| Caribbean | 115 | 0.1% |
| Central America | 736 | 0.9% |
| China | 271 | 0.3% |
| Colombia | 10 | 0.0% |
| Cuba | 35 | 0.0% |
| Czechoslovakia | 26 | 0.0% |
| Eastern Africa | 37 | 0.1% |
| Eastern Asia | 607 | 0.7% |
| Eastern Europe | 141 | 0.2% |
| Ecuador | 17 | 0.0% |
| El Salvador | 89 | 0.1% |
| England | 26 | 0.0% |
| Ethiopia | 5 | 0.0% |
| Europe | 490 | 0.6% |
| France | 9 | 0.0% |
| Germany | 163 | 0.2% |
| Guatemala | 95 | 0.1% |
| Haiti | 57 | 0.1% |
| Honduras | 12 | 0.0% |
| Ireland | 8 | 0.0% |
| Israel | 36 | 0.0% |
| Italy | 14 | 0.0% |
| Jamaica | 23 | 0.0% |
| Japan | 39 | 0.1% |
| Jordan | 40 | 0.1% |
| Kenya | 32 | 0.0% |
| Korea | 297 | 0.4% |
| Laos | 20 | 0.0% |
| Latin America | 968 | 1.2% |
| Mexico | 540 | 0.7% |
| Middle Africa | 6 | 0.0% |
| Moldova | 25 | 0.0% |
| Nigeria | 17 | 0.0% |
| Northern Europe | 48 | 0.1% |
| Oceania | 28 | 0.0% |
| Philippines | 130 | 0.2% |
| Poland | 9 | 0.0% |
| Portugal | 5 | 0.0% |
| Russia | 36 | 0.0% |
| Serbia | 7 | 0.0% |
| South America | 117 | 0.1% |
| South Eastern Asia | 288 | 0.4% |
| Southern Europe | 37 | 0.1% |
| Spain | 18 | 0.0% |
| Taiwan | 22 | 0.0% |
| Thailand | 69 | 0.1% |
| Vietnam | 69 | 0.1% |
| Western Africa | 17 | 0.0% |
| Western Asia | 76 | 0.1% |
| Western Europe | 264 | 0.3% | View All 58 Rows |
Sex and Age in Leavenworth County
Sex and Age in Leavenworth County
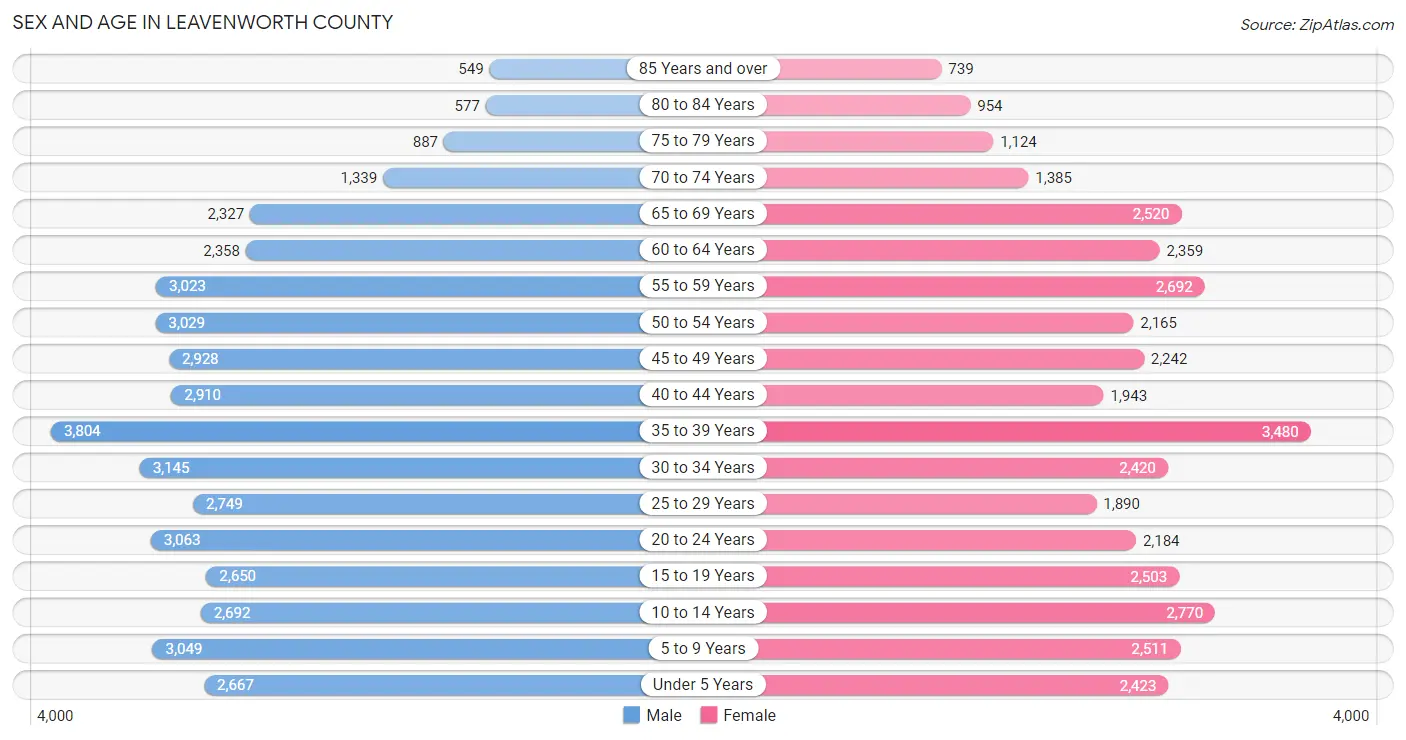
The most populous age groups in Leavenworth County are 35 to 39 Years (3,804 | 8.7%) for men and 35 to 39 Years (3,480 | 9.1%) for women.
| Age Bracket | Male | Female |
| Under 5 Years | 2,667 (6.1%) | 2,423 (6.3%) |
| 5 to 9 Years | 3,049 (7.0%) | 2,511 (6.6%) |
| 10 to 14 Years | 2,692 (6.1%) | 2,770 (7.2%) |
| 15 to 19 Years | 2,650 (6.1%) | 2,503 (6.5%) |
| 20 to 24 Years | 3,063 (7.0%) | 2,184 (5.7%) |
| 25 to 29 Years | 2,749 (6.3%) | 1,890 (4.9%) |
| 30 to 34 Years | 3,145 (7.2%) | 2,420 (6.3%) |
| 35 to 39 Years | 3,804 (8.7%) | 3,480 (9.1%) |
| 40 to 44 Years | 2,910 (6.7%) | 1,943 (5.1%) |
| 45 to 49 Years | 2,928 (6.7%) | 2,242 (5.9%) |
| 50 to 54 Years | 3,029 (6.9%) | 2,165 (5.7%) |
| 55 to 59 Years | 3,023 (6.9%) | 2,692 (7.0%) |
| 60 to 64 Years | 2,358 (5.4%) | 2,359 (6.2%) |
| 65 to 69 Years | 2,327 (5.3%) | 2,520 (6.6%) |
| 70 to 74 Years | 1,339 (3.1%) | 1,385 (3.6%) |
| 75 to 79 Years | 887 (2.0%) | 1,124 (2.9%) |
| 80 to 84 Years | 577 (1.3%) | 954 (2.5%) |
| 85 Years and over | 549 (1.3%) | 739 (1.9%) |
| Total | 43,746 (100.0%) | 38,304 (100.0%) |
Families and Households in Leavenworth County
Median Family Size in Leavenworth County
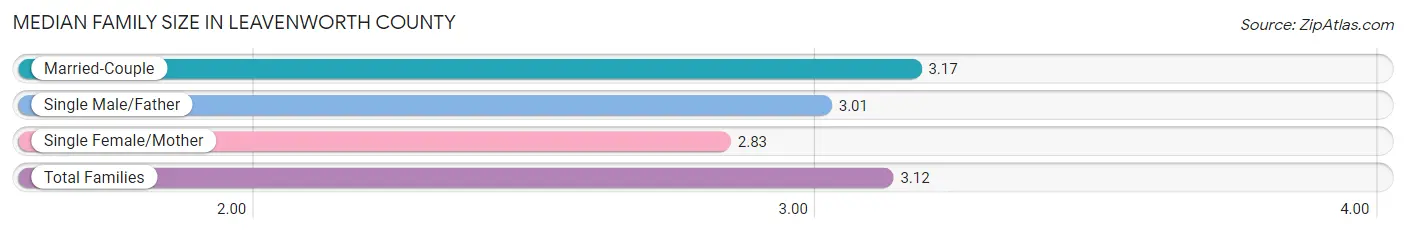
The median family size in Leavenworth County is 3.12 persons per family, with married-couple families (16,414 | 81.1%) accounting for the largest median family size of 3.17 persons per family. On the other hand, single female/mother families (2,595 | 12.8%) represent the smallest median family size with 2.83 persons per family.
| Family Type | # Families | Family Size |
| Married-Couple | 16,414 (81.1%) | 3.17 |
| Single Male/Father | 1,233 (6.1%) | 3.01 |
| Single Female/Mother | 2,595 (12.8%) | 2.83 |
| Total Families | 20,242 (100.0%) | 3.12 |
Median Household Size in Leavenworth County
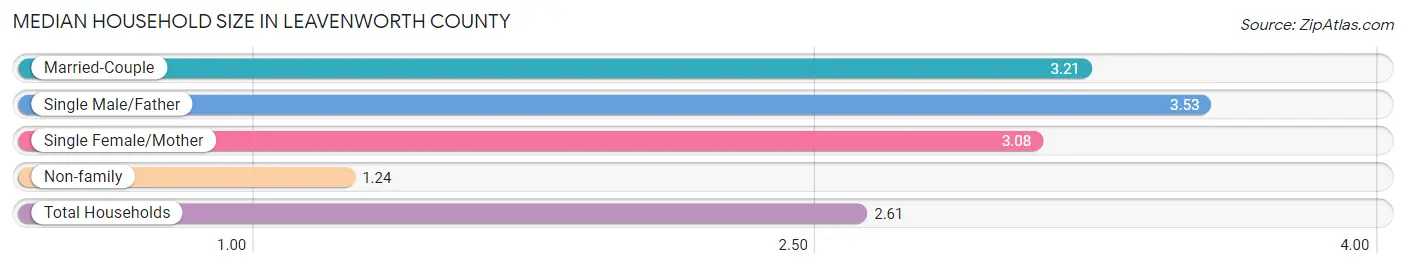
The median household size in Leavenworth County is 2.61 persons per household, with single male/father households (1,233 | 4.2%) accounting for the largest median household size of 3.53 persons per household. non-family households (8,984 | 30.7%) represent the smallest median household size with 1.24 persons per household.
| Household Type | # Households | Household Size |
| Married-Couple | 16,414 (56.2%) | 3.21 |
| Single Male/Father | 1,233 (4.2%) | 3.53 |
| Single Female/Mother | 2,595 (8.9%) | 3.08 |
| Non-family | 8,984 (30.7%) | 1.24 |
| Total Households | 29,226 (100.0%) | 2.61 |
Household Size by Marriage Status in Leavenworth County
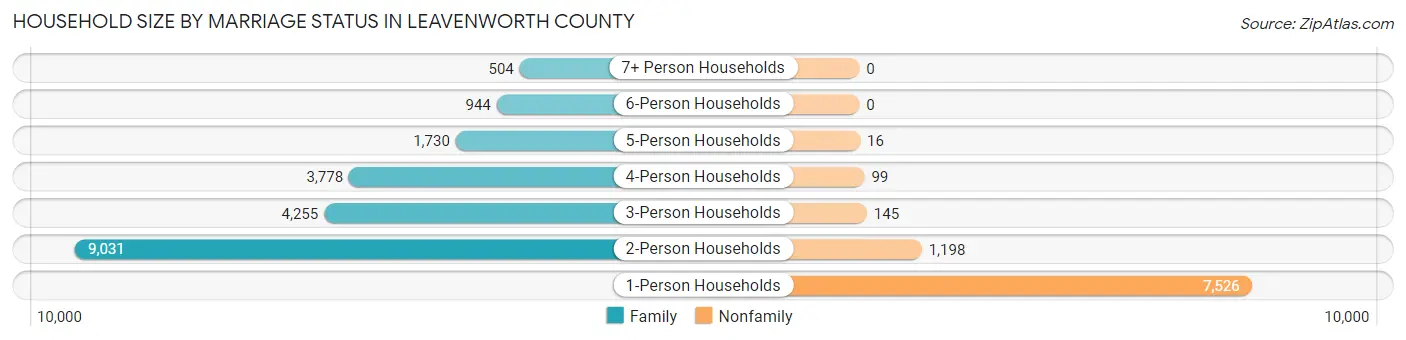
Out of a total of 29,226 households in Leavenworth County, 20,242 (69.3%) are family households, while 8,984 (30.7%) are nonfamily households. The most numerous type of family households are 2-person households, comprising 9,031, and the most common type of nonfamily households are 1-person households, comprising 7,526.
| Household Size | Family Households | Nonfamily Households |
| 1-Person Households | - | 7,526 (25.8%) |
| 2-Person Households | 9,031 (30.9%) | 1,198 (4.1%) |
| 3-Person Households | 4,255 (14.6%) | 145 (0.5%) |
| 4-Person Households | 3,778 (12.9%) | 99 (0.3%) |
| 5-Person Households | 1,730 (5.9%) | 16 (0.1%) |
| 6-Person Households | 944 (3.2%) | 0 (0.0%) |
| 7+ Person Households | 504 (1.7%) | 0 (0.0%) |
| Total | 20,242 (69.3%) | 8,984 (30.7%) |
Female Fertility in Leavenworth County
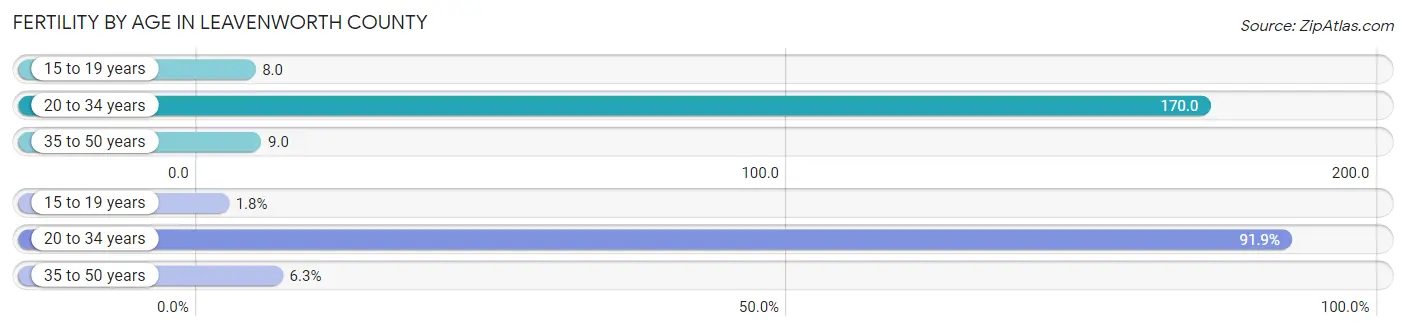
Fertility by Age in Leavenworth County
Average fertility rate in Leavenworth County is 70.0 births per 1,000 women. Women in the age bracket of 20 to 34 years have the highest fertility rate with 170.0 births per 1,000 women. Women in the age bracket of 20 to 34 years acount for 91.9% of all women with births.
| Age Bracket | Women with Births | Births / 1,000 Women |
| 15 to 19 years | 21 (1.8%) | 8.0 |
| 20 to 34 years | 1,104 (91.9%) | 170.0 |
| 35 to 50 years | 76 (6.3%) | 9.0 |
| Total | 1,201 (100.0%) | 70.0 |
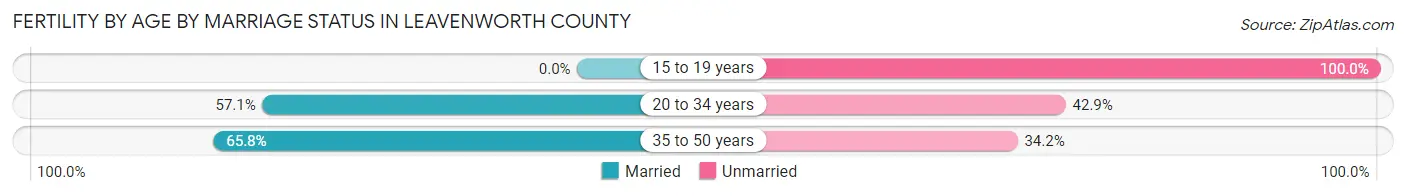
Fertility by Age by Marriage Status in Leavenworth County
56.6% of women with births (1,201) in Leavenworth County are married. The highest percentage of unmarried women with births falls into 15 to 19 years age bracket with 100.0% of them unmarried at the time of birth, while the lowest percentage of unmarried women with births belong to 35 to 50 years age bracket with 34.2% of them unmarried.
| Age Bracket | Married | Unmarried |
| 15 to 19 years | 0 (0.0%) | 21 (100.0%) |
| 20 to 34 years | 630 (57.1%) | 474 (42.9%) |
| 35 to 50 years | 50 (65.8%) | 26 (34.2%) |
| Total | 680 (56.6%) | 521 (43.4%) |
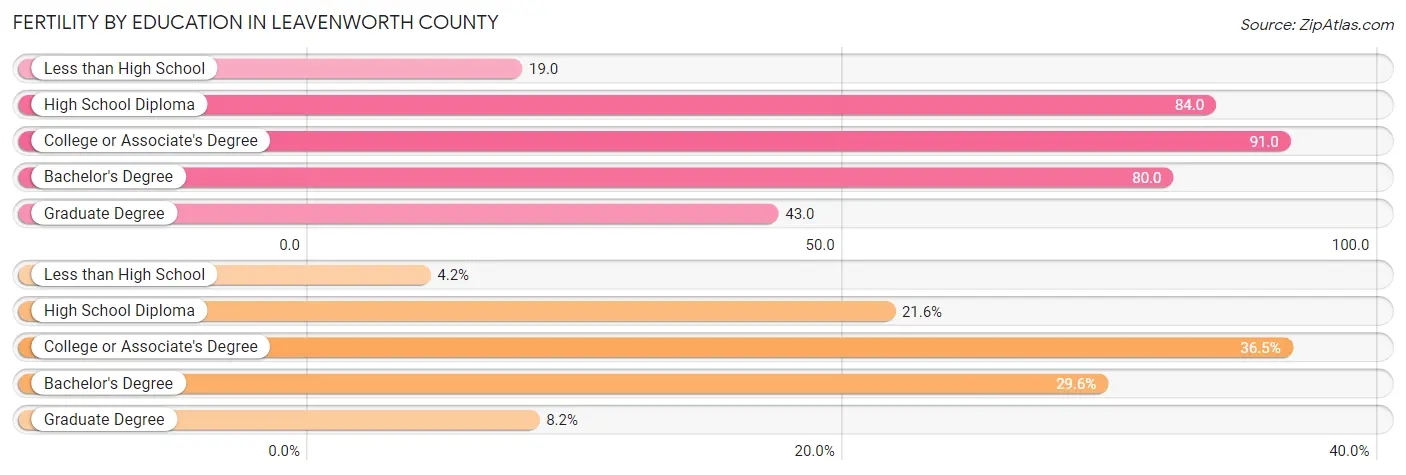
Fertility by Education in Leavenworth County
Average fertility rate in Leavenworth County is 70.0 births per 1,000 women. Women with the education attainment of college or associate's degree have the highest fertility rate of 91.0 births per 1,000 women, while women with the education attainment of less than high school have the lowest fertility at 19.0 births per 1,000 women. Women with the education attainment of college or associate's degree represent 36.5% of all women with births.
| Educational Attainment | Women with Births | Births / 1,000 Women |
| Less than High School | 50 (4.2%) | 19.0 |
| High School Diploma | 259 (21.6%) | 84.0 |
| College or Associate's Degree | 438 (36.5%) | 91.0 |
| Bachelor's Degree | 355 (29.6%) | 80.0 |
| Graduate Degree | 99 (8.2%) | 43.0 |
| Total | 1,201 (100.0%) | 70.0 |
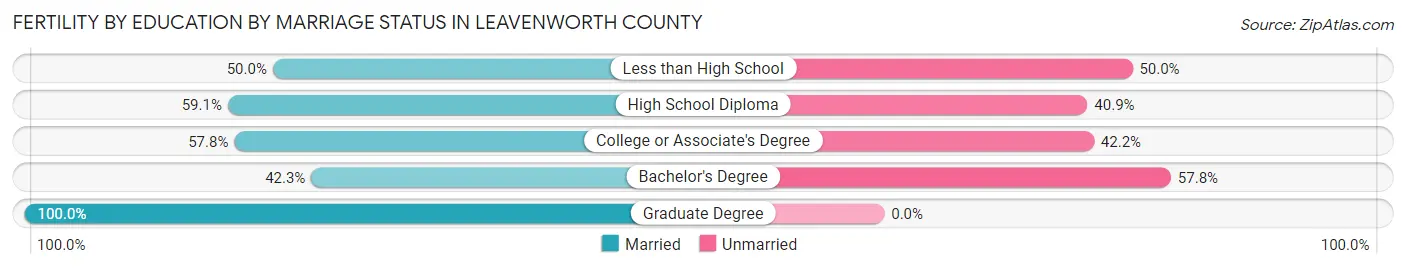
Fertility by Education by Marriage Status in Leavenworth County
43.4% of women with births in Leavenworth County are unmarried. Women with the educational attainment of graduate degree are most likely to be married with 100.0% of them married at childbirth, while women with the educational attainment of bachelor's degree are least likely to be married with 57.8% of them unmarried at childbirth.
| Educational Attainment | Married | Unmarried |
| Less than High School | 25 (50.0%) | 25 (50.0%) |
| High School Diploma | 153 (59.1%) | 106 (40.9%) |
| College or Associate's Degree | 253 (57.8%) | 185 (42.2%) |
| Bachelor's Degree | 150 (42.2%) | 205 (57.8%) |
| Graduate Degree | 99 (100.0%) | 0 (0.0%) |
| Total | 680 (56.6%) | 521 (43.4%) |
Income in Leavenworth County
Income Overview in Leavenworth County
Per Capita Income in Leavenworth County is $37,482, while median incomes of families and households are $104,211 and $84,307 respectively.
| Characteristic | Number | Measure |
| Per Capita Income | 82,050 | $37,482 |
| Median Family Income | 20,242 | $104,211 |
| Mean Family Income | 20,242 | $120,235 |
| Median Household Income | 29,226 | $84,307 |
| Mean Household Income | 29,226 | $101,341 |
| Income Deficit | 20,242 | $11,219 |
| Wage / Income Gap (%) | 82,050 | 26.04% |
| Wage / Income Gap ($) | 82,050 | 73.96¢ per $1 |
| Gini / Inequality Index | 82,050 | 0.42 |
Earnings by Sex in Leavenworth County
Average Earnings in Leavenworth County are $41,928, $49,266 for men and $36,436 for women, a difference of 26.0%.
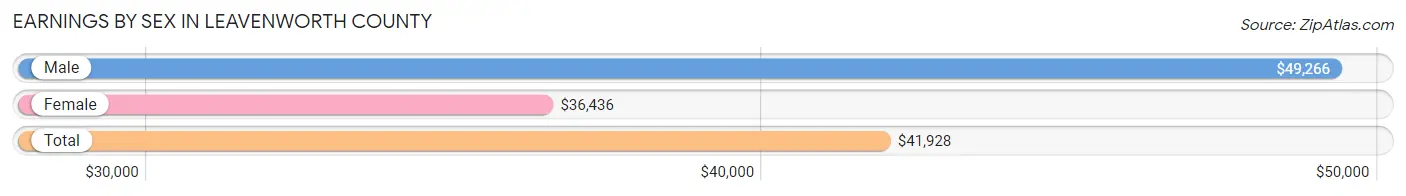
| Sex | Number | Average Earnings |
| Male | 25,036 (57.3%) | $49,266 |
| Female | 18,673 (42.7%) | $36,436 |
| Total | 43,709 (100.0%) | $41,928 |
Earnings by Sex by Income Bracket in Leavenworth County
The most common earnings brackets in Leavenworth County are $100,000+ for men (4,666 | 18.6%) and $75,000 to $99,999 for women (1,593 | 8.5%).
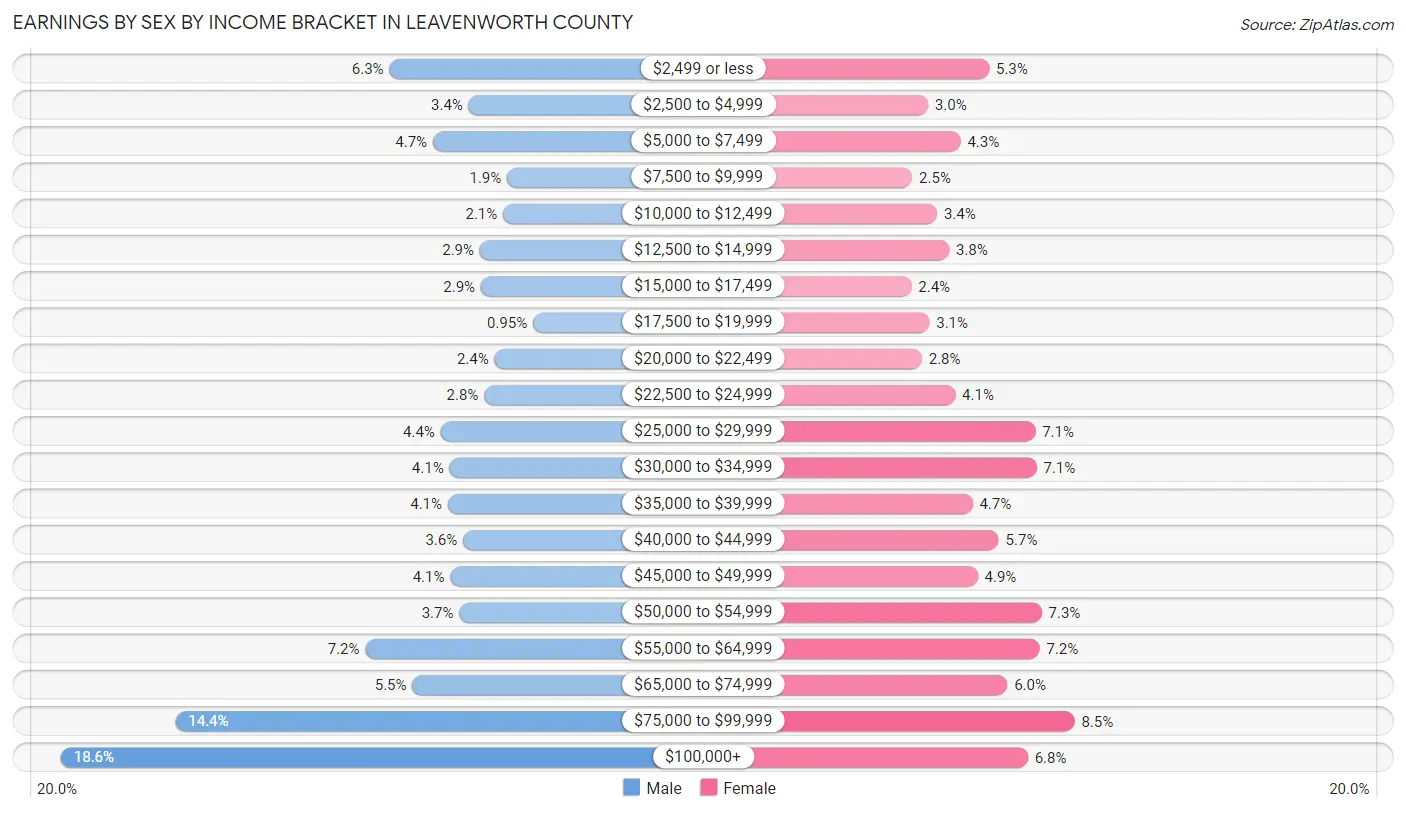
| Income | Male | Female |
| $2,499 or less | 1,584 (6.3%) | 995 (5.3%) |
| $2,500 to $4,999 | 840 (3.4%) | 568 (3.0%) |
| $5,000 to $7,499 | 1,177 (4.7%) | 795 (4.3%) |
| $7,500 to $9,999 | 481 (1.9%) | 458 (2.5%) |
| $10,000 to $12,499 | 517 (2.1%) | 631 (3.4%) |
| $12,500 to $14,999 | 737 (2.9%) | 715 (3.8%) |
| $15,000 to $17,499 | 727 (2.9%) | 451 (2.4%) |
| $17,500 to $19,999 | 238 (0.9%) | 577 (3.1%) |
| $20,000 to $22,499 | 599 (2.4%) | 524 (2.8%) |
| $22,500 to $24,999 | 697 (2.8%) | 759 (4.1%) |
| $25,000 to $29,999 | 1,103 (4.4%) | 1,319 (7.1%) |
| $30,000 to $34,999 | 1,022 (4.1%) | 1,328 (7.1%) |
| $35,000 to $39,999 | 1,036 (4.1%) | 880 (4.7%) |
| $40,000 to $44,999 | 895 (3.6%) | 1,063 (5.7%) |
| $45,000 to $49,999 | 1,015 (4.1%) | 915 (4.9%) |
| $50,000 to $54,999 | 928 (3.7%) | 1,364 (7.3%) |
| $55,000 to $64,999 | 1,811 (7.2%) | 1,349 (7.2%) |
| $65,000 to $74,999 | 1,370 (5.5%) | 1,123 (6.0%) |
| $75,000 to $99,999 | 3,593 (14.3%) | 1,593 (8.5%) |
| $100,000+ | 4,666 (18.6%) | 1,266 (6.8%) |
| Total | 25,036 (100.0%) | 18,673 (100.0%) |
Earnings by Sex by Educational Attainment in Leavenworth County
Average earnings in Leavenworth County are $57,784 for men and $41,795 for women, a difference of 27.7%. Men with an educational attainment of graduate degree enjoy the highest average annual earnings of $103,145, while those with less than high school education earn the least with $24,792. Women with an educational attainment of graduate degree earn the most with the average annual earnings of $63,154, while those with less than high school education have the smallest earnings of $22,004.
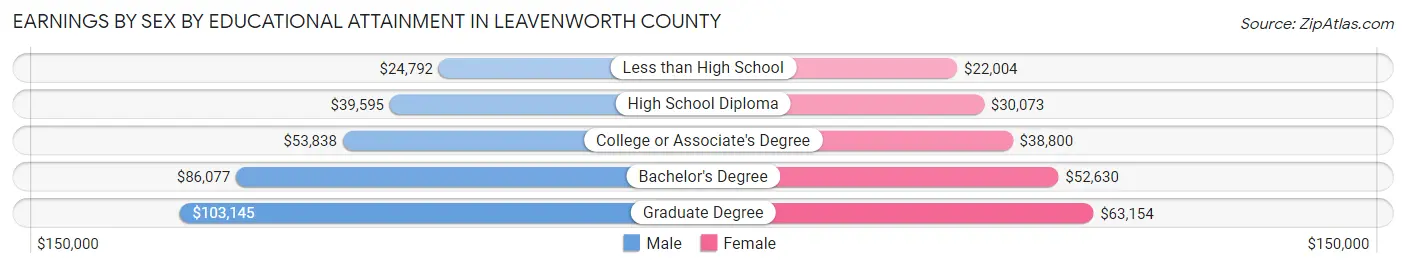
| Educational Attainment | Male Income | Female Income |
| Less than High School | $24,792 | $22,004 |
| High School Diploma | $39,595 | $30,073 |
| College or Associate's Degree | $53,838 | $38,800 |
| Bachelor's Degree | $86,077 | $52,630 |
| Graduate Degree | $103,145 | $63,154 |
| Total | $57,784 | $41,795 |
Family Income in Leavenworth County
Family Income Brackets in Leavenworth County
According to the Leavenworth County family income data, there are 5,081 families falling into the $100,000 to $149,999 income range, which is the most common income bracket and makes up 25.1% of all families. Conversely, the $10,000 to $14,999 income bracket is the least frequent group with only 101 families (0.5%) belonging to this category.
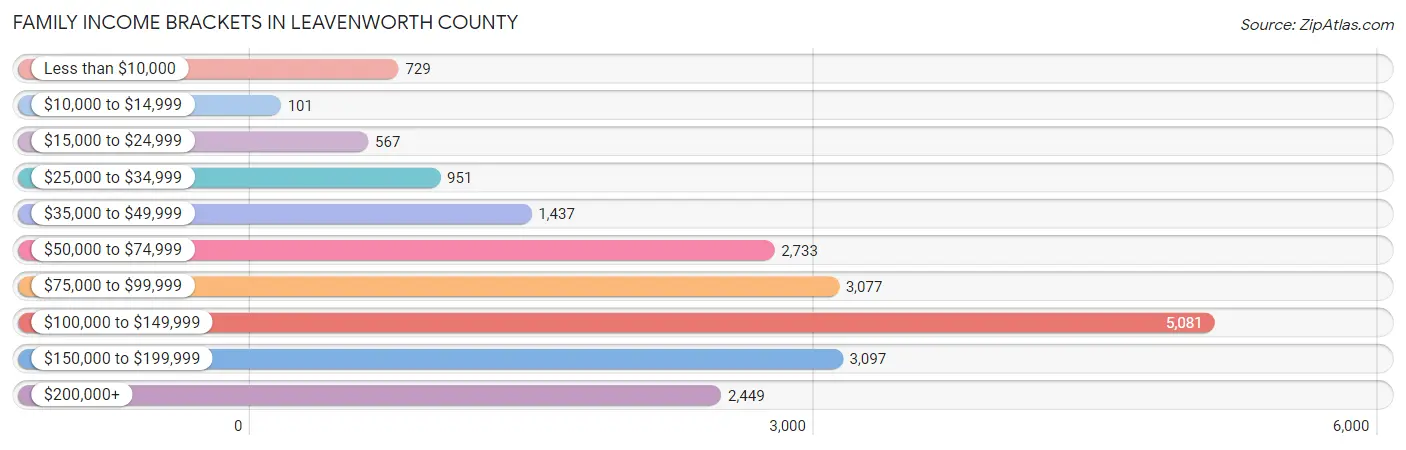
| Income Bracket | # Families | % Families |
| Less than $10,000 | 729 | 3.6% |
| $10,000 to $14,999 | 101 | 0.5% |
| $15,000 to $24,999 | 567 | 2.8% |
| $25,000 to $34,999 | 951 | 4.7% |
| $35,000 to $49,999 | 1,437 | 7.1% |
| $50,000 to $74,999 | 2,733 | 13.5% |
| $75,000 to $99,999 | 3,077 | 15.2% |
| $100,000 to $149,999 | 5,081 | 25.1% |
| $150,000 to $199,999 | 3,097 | 15.3% |
| $200,000+ | 2,449 | 12.1% |
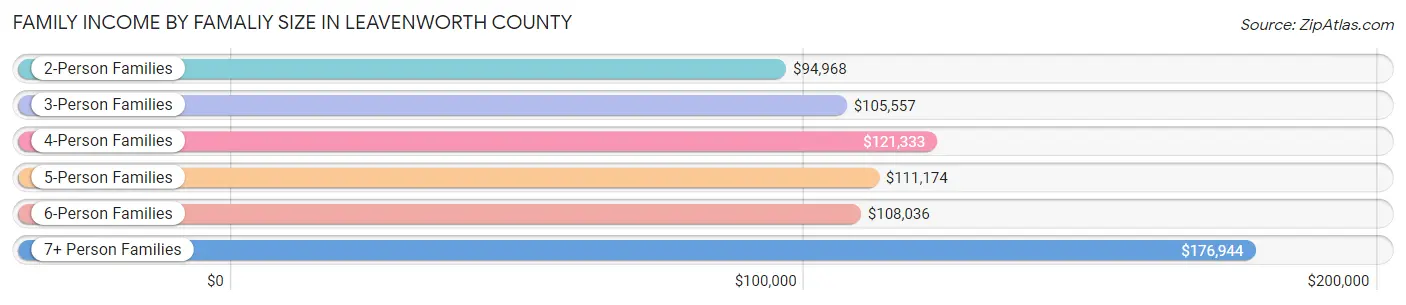
Family Income by Famaliy Size in Leavenworth County
7+ person families (446 | 2.2%) account for the highest median family income in Leavenworth County with $176,944 per family, while 2-person families (9,488 | 46.9%) have the highest median income of $47,484 per family member.
| Income Bracket | # Families | Median Income |
| 2-Person Families | 9,488 (46.9%) | $94,968 |
| 3-Person Families | 4,260 (21.0%) | $105,557 |
| 4-Person Families | 3,458 (17.1%) | $121,333 |
| 5-Person Families | 1,713 (8.5%) | $111,174 |
| 6-Person Families | 877 (4.3%) | $108,036 |
| 7+ Person Families | 446 (2.2%) | $176,944 |
| Total | 20,242 (100.0%) | $104,211 |
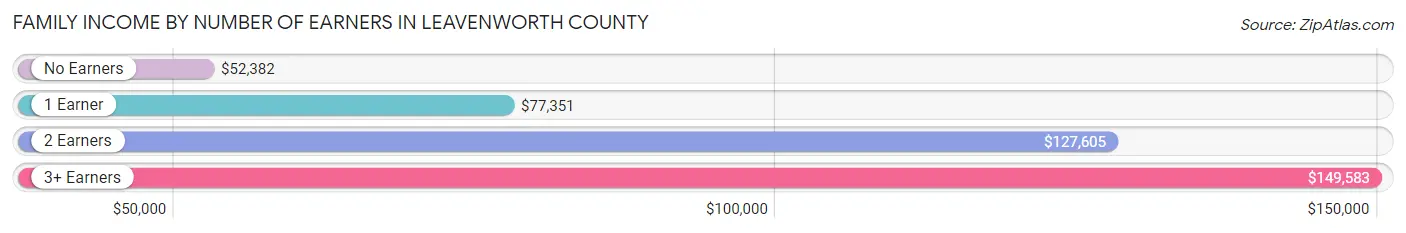
Family Income by Number of Earners in Leavenworth County
The median family income in Leavenworth County is $104,211, with families comprising 3+ earners (2,194) having the highest median family income of $149,583, while families with no earners (2,738) have the lowest median family income of $52,382, accounting for 10.8% and 13.5% of families, respectively.
| Number of Earners | # Families | Median Income |
| No Earners | 2,738 (13.5%) | $52,382 |
| 1 Earner | 6,024 (29.8%) | $77,351 |
| 2 Earners | 9,286 (45.9%) | $127,605 |
| 3+ Earners | 2,194 (10.8%) | $149,583 |
| Total | 20,242 (100.0%) | $104,211 |
Household Income in Leavenworth County
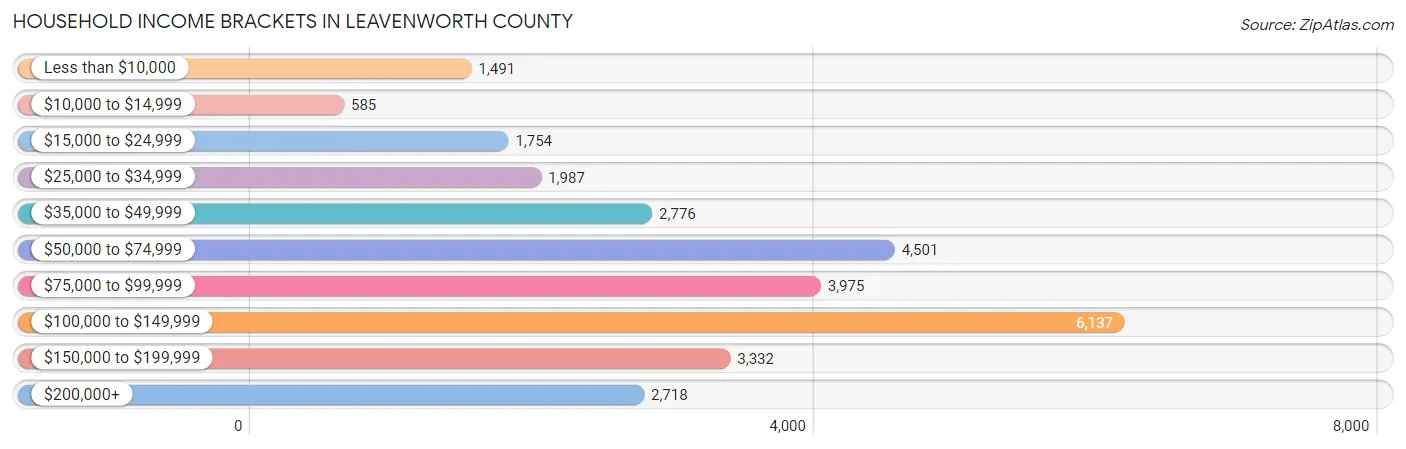
Household Income Brackets in Leavenworth County
With 6,137 households falling in the category, the $100,000 to $149,999 income range is the most frequent in Leavenworth County, accounting for 21.0% of all households. In contrast, only 585 households (2.0%) fall into the $10,000 to $14,999 income bracket, making it the least populous group.
| Income Bracket | # Households | % Households |
| Less than $10,000 | 1,491 | 5.1% |
| $10,000 to $14,999 | 585 | 2.0% |
| $15,000 to $24,999 | 1,754 | 6.0% |
| $25,000 to $34,999 | 1,987 | 6.8% |
| $35,000 to $49,999 | 2,776 | 9.5% |
| $50,000 to $74,999 | 4,501 | 15.4% |
| $75,000 to $99,999 | 3,975 | 13.6% |
| $100,000 to $149,999 | 6,137 | 21.0% |
| $150,000 to $199,999 | 3,332 | 11.4% |
| $200,000+ | 2,718 | 9.3% |
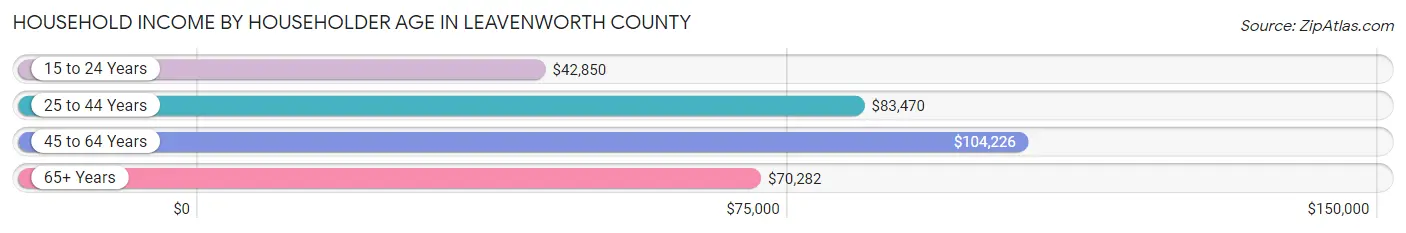
Household Income by Householder Age in Leavenworth County
The median household income in Leavenworth County is $84,307, with the highest median household income of $104,226 found in the 45 to 64 years age bracket for the primary householder. A total of 10,763 households (36.8%) fall into this category. Meanwhile, the 15 to 24 years age bracket for the primary householder has the lowest median household income of $42,850, with 1,255 households (4.3%) in this group.
| Income Bracket | # Households | Median Income |
| 15 to 24 Years | 1,255 (4.3%) | $42,850 |
| 25 to 44 Years | 10,029 (34.3%) | $83,470 |
| 45 to 64 Years | 10,763 (36.8%) | $104,226 |
| 65+ Years | 7,179 (24.6%) | $70,282 |
| Total | 29,226 (100.0%) | $84,307 |
Poverty in Leavenworth County
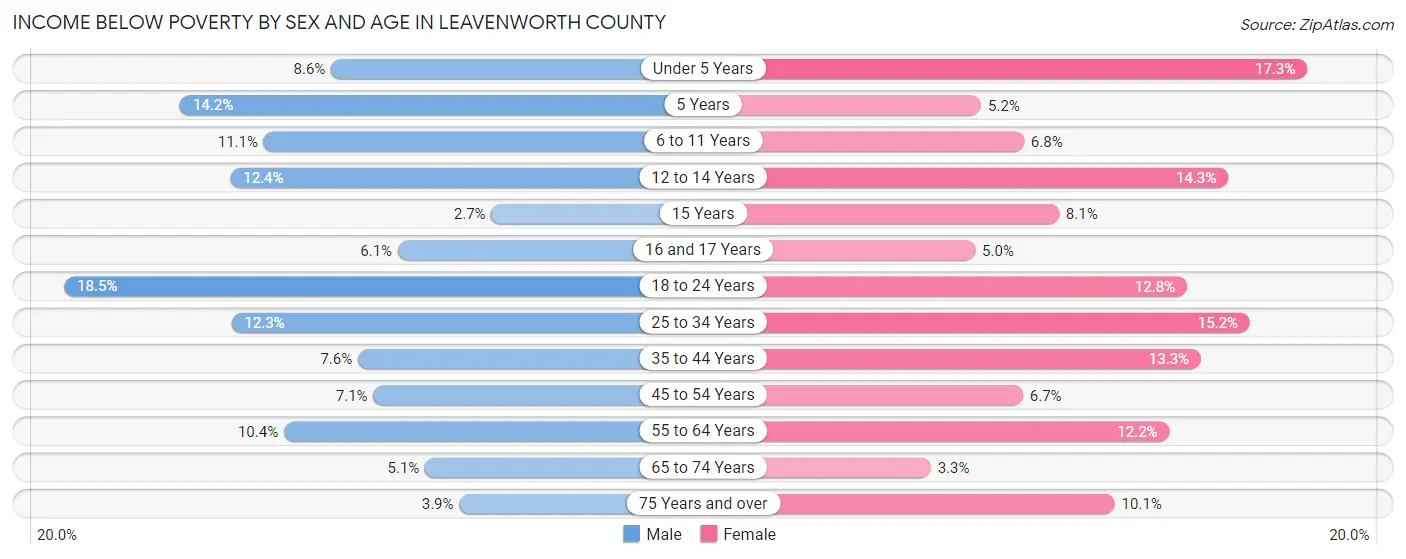
Income Below Poverty by Sex and Age in Leavenworth County
With 9.6% poverty level for males and 10.6% for females among the residents of Leavenworth County, 18 to 24 year old males and under 5 year old females are the most vulnerable to poverty, with 622 males (18.5%) and 418 females (17.3%) in their respective age groups living below the poverty level.
| Age Bracket | Male | Female |
| Under 5 Years | 223 (8.6%) | 418 (17.3%) |
| 5 Years | 74 (14.2%) | 29 (5.2%) |
| 6 to 11 Years | 408 (11.1%) | 206 (6.8%) |
| 12 to 14 Years | 171 (12.4%) | 218 (14.3%) |
| 15 Years | 13 (2.7%) | 57 (8.1%) |
| 16 and 17 Years | 69 (6.1%) | 47 (5.0%) |
| 18 to 24 Years | 622 (18.5%) | 362 (12.8%) |
| 25 to 34 Years | 573 (12.3%) | 651 (15.1%) |
| 35 to 44 Years | 403 (7.6%) | 723 (13.3%) |
| 45 to 54 Years | 361 (7.0%) | 296 (6.7%) |
| 55 to 64 Years | 517 (10.4%) | 614 (12.2%) |
| 65 to 74 Years | 180 (5.1%) | 129 (3.3%) |
| 75 Years and over | 74 (3.9%) | 273 (10.1%) |
| Total | 3,688 (9.6%) | 4,023 (10.6%) |
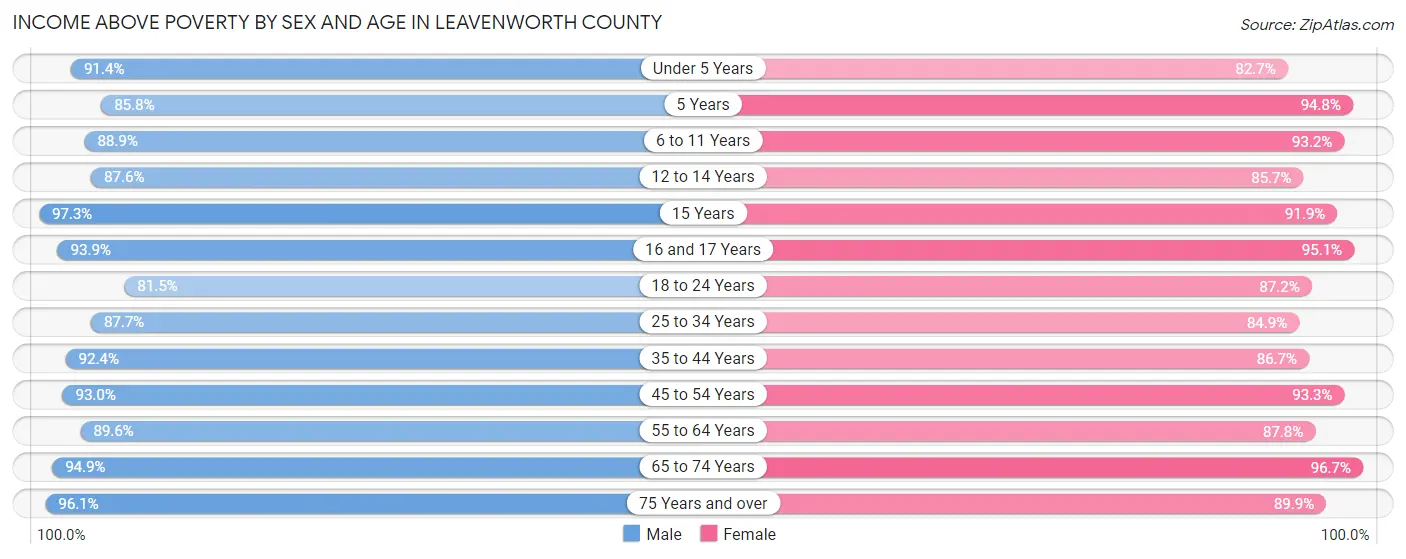
Income Above Poverty by Sex and Age in Leavenworth County
According to the poverty statistics in Leavenworth County, males aged 15 years and females aged 65 to 74 years are the age groups that are most secure financially, with 97.3% of males and 96.7% of females in these age groups living above the poverty line.
| Age Bracket | Male | Female |
| Under 5 Years | 2,363 (91.4%) | 2,002 (82.7%) |
| 5 Years | 446 (85.8%) | 532 (94.8%) |
| 6 to 11 Years | 3,261 (88.9%) | 2,843 (93.2%) |
| 12 to 14 Years | 1,212 (87.6%) | 1,302 (85.7%) |
| 15 Years | 473 (97.3%) | 650 (91.9%) |
| 16 and 17 Years | 1,054 (93.9%) | 903 (95.1%) |
| 18 to 24 Years | 2,735 (81.5%) | 2,464 (87.2%) |
| 25 to 34 Years | 4,077 (87.7%) | 3,646 (84.9%) |
| 35 to 44 Years | 4,883 (92.4%) | 4,700 (86.7%) |
| 45 to 54 Years | 4,757 (92.9%) | 4,111 (93.3%) |
| 55 to 64 Years | 4,467 (89.6%) | 4,437 (87.8%) |
| 65 to 74 Years | 3,326 (94.9%) | 3,776 (96.7%) |
| 75 Years and over | 1,843 (96.1%) | 2,423 (89.9%) |
| Total | 34,897 (90.4%) | 33,789 (89.4%) |
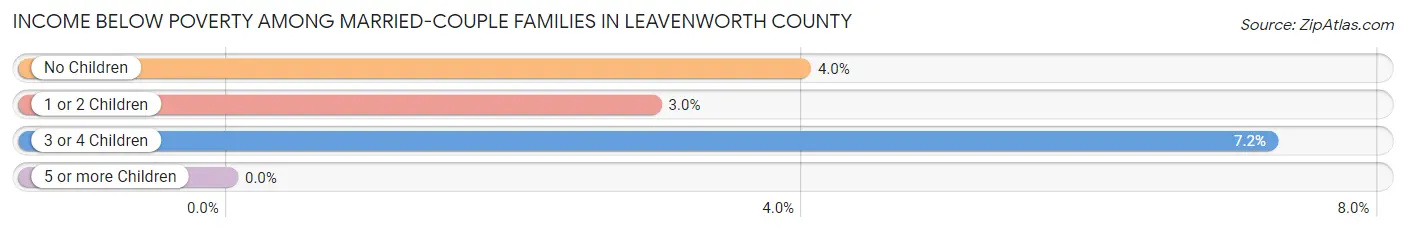
Income Below Poverty Among Married-Couple Families in Leavenworth County
The poverty statistics for married-couple families in Leavenworth County show that 4.0% or 658 of the total 16,414 families live below the poverty line. Families with 3 or 4 children have the highest poverty rate of 7.2%, comprising of 140 families. On the other hand, families with 5 or more children have the lowest poverty rate of 0.0%, which includes 0 families.
| Children | Above Poverty | Below Poverty |
| No Children | 8,709 (96.0%) | 362 (4.0%) |
| 1 or 2 Children | 5,141 (97.1%) | 156 (2.9%) |
| 3 or 4 Children | 1,793 (92.8%) | 140 (7.2%) |
| 5 or more Children | 113 (100.0%) | 0 (0.0%) |
| Total | 15,756 (96.0%) | 658 (4.0%) |
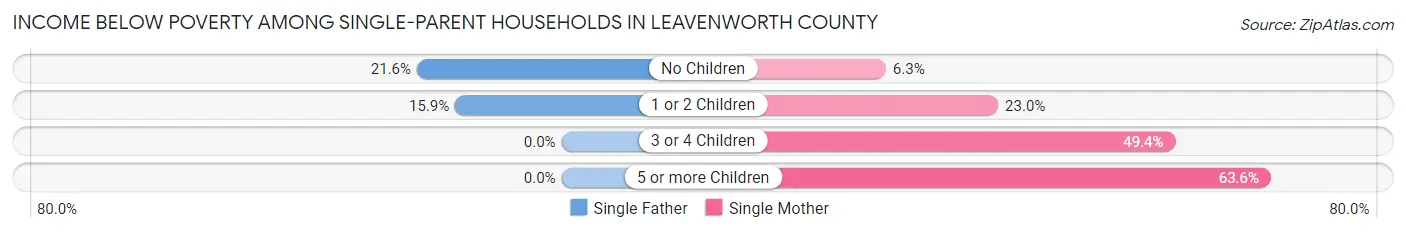
Income Below Poverty Among Single-Parent Households in Leavenworth County
According to the poverty data in Leavenworth County, 16.2% or 200 single-father households and 21.1% or 548 single-mother households are living below the poverty line. Among single-father households, those with no children have the highest poverty rate, with 122 households (21.5%) experiencing poverty. Likewise, among single-mother households, those with 5 or more children have the highest poverty rate, with 7 households (63.6%) falling below the poverty line.
| Children | Single Father | Single Mother |
| No Children | 122 (21.5%) | 46 (6.3%) |
| 1 or 2 Children | 78 (15.9%) | 367 (23.0%) |
| 3 or 4 Children | 0 (0.0%) | 128 (49.4%) |
| 5 or more Children | 0 (0.0%) | 7 (63.6%) |
| Total | 200 (16.2%) | 548 (21.1%) |
Income Below Poverty Among Married-Couple vs Single-Parent Households in Leavenworth County
The poverty data for Leavenworth County shows that 658 of the married-couple family households (4.0%) and 748 of the single-parent households (19.5%) are living below the poverty level. Within the married-couple family households, those with 3 or 4 children have the highest poverty rate, with 140 households (7.2%) falling below the poverty line. Among the single-parent households, those with 3 or 4 children have the highest poverty rate, with 128 household (37.9%) living below poverty.
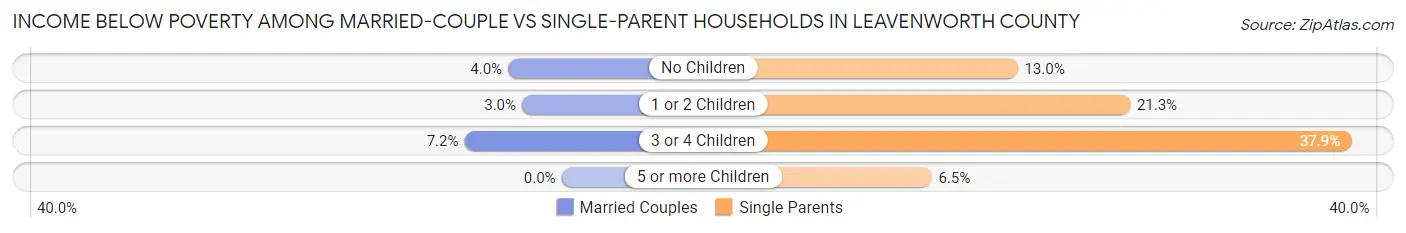
| Children | Married-Couple Families | Single-Parent Households |
| No Children | 362 (4.0%) | 168 (13.0%) |
| 1 or 2 Children | 156 (2.9%) | 445 (21.3%) |
| 3 or 4 Children | 140 (7.2%) | 128 (37.9%) |
| 5 or more Children | 0 (0.0%) | 7 (6.5%) |
| Total | 658 (4.0%) | 748 (19.5%) |
Employment Characteristics in Leavenworth County
Employment by Class of Employer in Leavenworth County
Among the 36,661 employed individuals in Leavenworth County, private company employees (21,495 | 58.6%), federal government employees (6,648 | 18.1%), and local government employees (2,323 | 6.3%) make up the most common classes of employment.
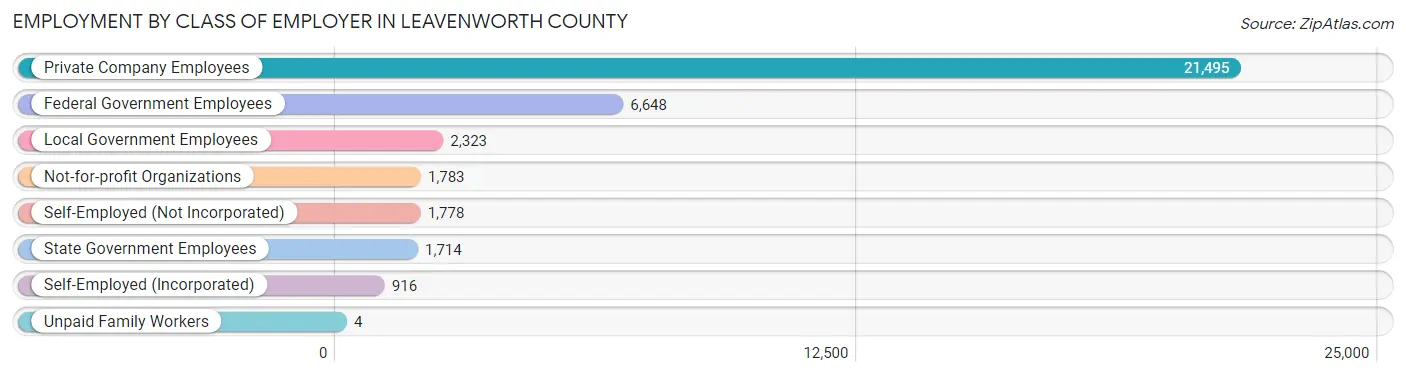
| Employer Class | # Employees | % Employees |
| Private Company Employees | 21,495 | 58.6% |
| Self-Employed (Incorporated) | 916 | 2.5% |
| Self-Employed (Not Incorporated) | 1,778 | 4.9% |
| Not-for-profit Organizations | 1,783 | 4.9% |
| Local Government Employees | 2,323 | 6.3% |
| State Government Employees | 1,714 | 4.7% |
| Federal Government Employees | 6,648 | 18.1% |
| Unpaid Family Workers | 4 | 0.0% |
| Total | 36,661 | 100.0% |
Employment Status by Age in Leavenworth County
According to the labor force statistics for Leavenworth County, out of the total population over 16 years of age (64,745), 59.9% or 38,782 individuals are in the labor force, with 4.5% or 1,745 of them unemployed. The age group with the highest labor force participation rate is 45 to 54 years, with 80.9% or 8,384 individuals in the labor force. Within the labor force, the 16 to 19 years age range has the highest percentage of unemployed individuals, with 13.2% or 247 of them being unemployed.
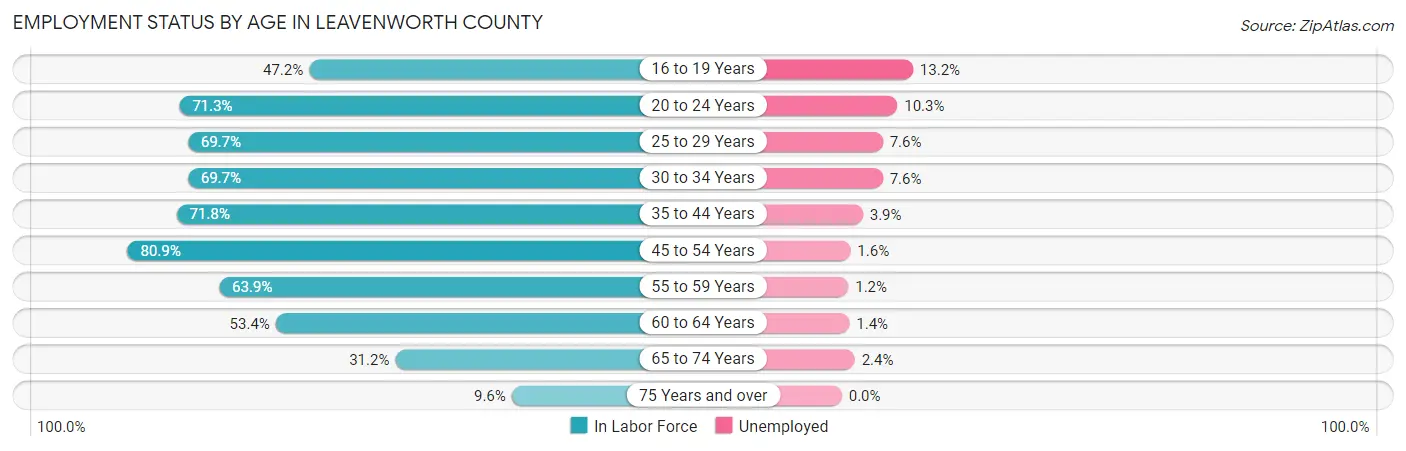
| Age Bracket | In Labor Force | Unemployed |
| 16 to 19 Years | 1,869 (47.2%) | 247 (13.2%) |
| 20 to 24 Years | 3,741 (71.3%) | 385 (10.3%) |
| 25 to 29 Years | 3,233 (69.7%) | 246 (7.6%) |
| 30 to 34 Years | 3,879 (69.7%) | 295 (7.6%) |
| 35 to 44 Years | 8,714 (71.8%) | 340 (3.9%) |
| 45 to 54 Years | 8,384 (80.9%) | 134 (1.6%) |
| 55 to 59 Years | 3,652 (63.9%) | 44 (1.2%) |
| 60 to 64 Years | 2,519 (53.4%) | 35 (1.4%) |
| 65 to 74 Years | 2,362 (31.2%) | 57 (2.4%) |
| 75 Years and over | 464 (9.6%) | 0 (0.0%) |
| Total | 38,782 (59.9%) | 1,745 (4.5%) |
Employment Status by Educational Attainment in Leavenworth County
According to labor force statistics for Leavenworth County, 70.4% of individuals (30,368) out of the total population between 25 and 64 years of age (43,137) are in the labor force, with 3.5% or 1,063 of them being unemployed. The group with the highest labor force participation rate are those with the educational attainment of bachelor's degree or higher, with 82.3% or 13,286 individuals in the labor force. Within the labor force, individuals with less than high school education have the highest percentage of unemployment, with 6.6% or 79 of them being unemployed.
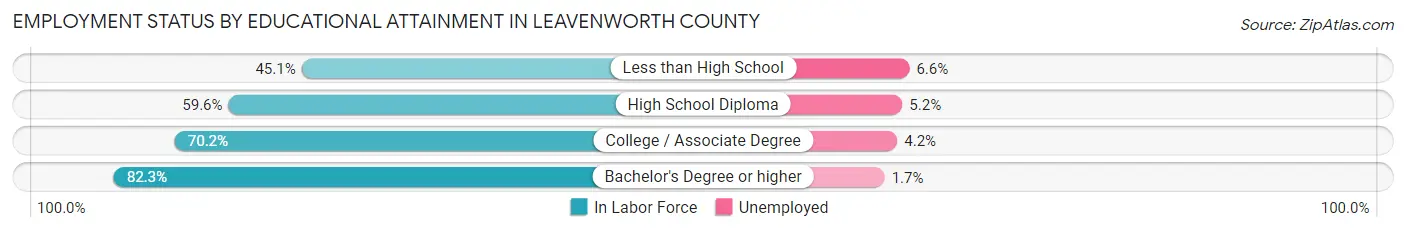
| Educational Attainment | In Labor Force | Unemployed |
| Less than High School | 1,195 (45.1%) | 175 (6.6%) |
| High School Diploma | 6,720 (59.6%) | 586 (5.2%) |
| College / Associate Degree | 9,174 (70.2%) | 549 (4.2%) |
| Bachelor's Degree or higher | 13,286 (82.3%) | 274 (1.7%) |
| Total | 30,368 (70.4%) | 1,510 (3.5%) |
Employment Occupations by Sex in Leavenworth County
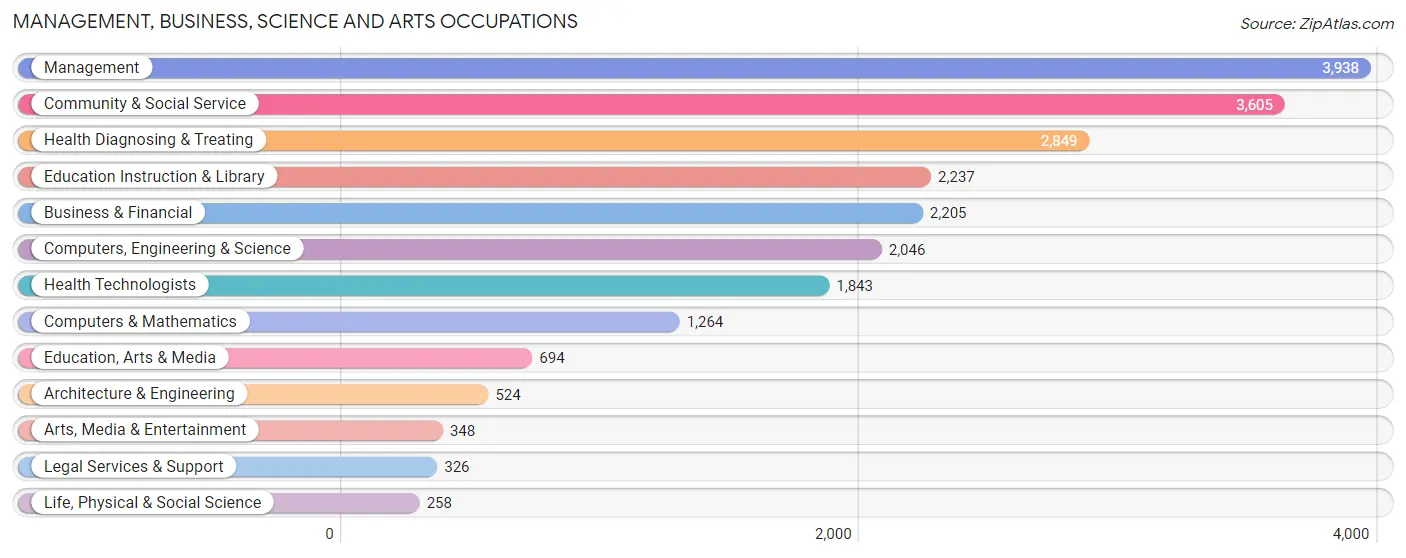
Management, Business, Science and Arts Occupations
The most common Management, Business, Science and Arts occupations in Leavenworth County are Management (3,938 | 11.4%), Community & Social Service (3,605 | 10.4%), Health Diagnosing & Treating (2,849 | 8.2%), Education Instruction & Library (2,237 | 6.5%), and Business & Financial (2,205 | 6.4%).
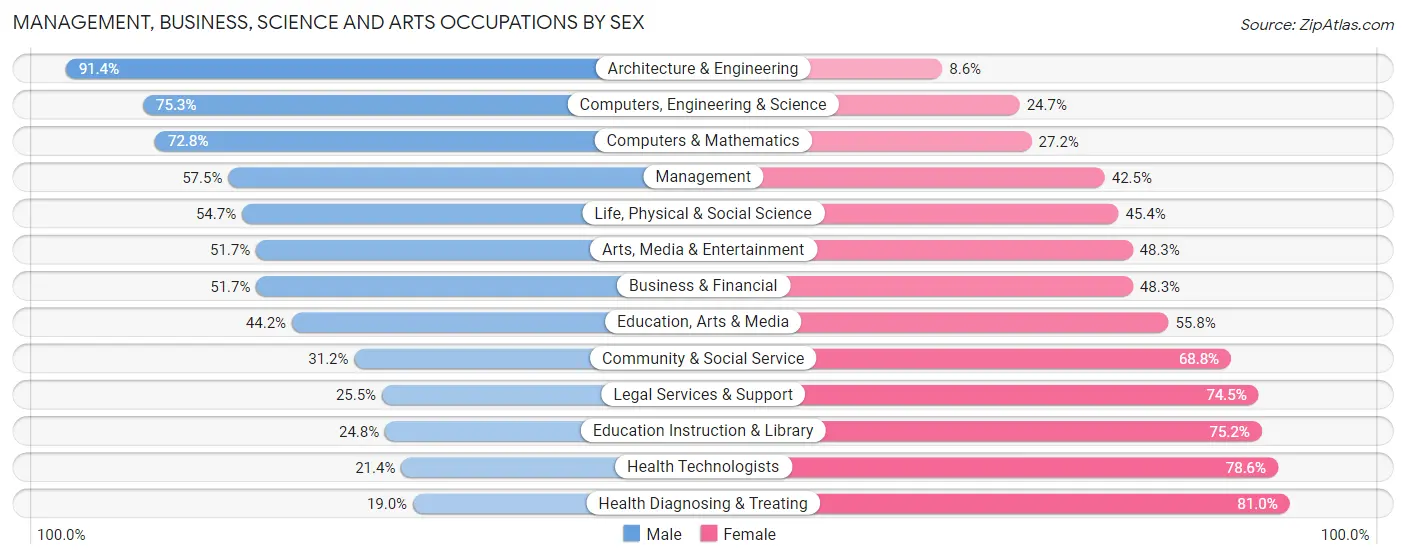
Management, Business, Science and Arts Occupations by Sex
Within the Management, Business, Science and Arts occupations in Leavenworth County, the most male-oriented occupations are Architecture & Engineering (91.4%), Computers, Engineering & Science (75.3%), and Computers & Mathematics (72.8%), while the most female-oriented occupations are Health Diagnosing & Treating (81.0%), Health Technologists (78.6%), and Education Instruction & Library (75.2%).
| Occupation | Male | Female |
| Management | 2,265 (57.5%) | 1,673 (42.5%) |
| Business & Financial | 1,139 (51.7%) | 1,066 (48.3%) |
| Computers, Engineering & Science | 1,540 (75.3%) | 506 (24.7%) |
| Computers & Mathematics | 920 (72.8%) | 344 (27.2%) |
| Architecture & Engineering | 479 (91.4%) | 45 (8.6%) |
| Life, Physical & Social Science | 141 (54.6%) | 117 (45.4%) |
| Community & Social Service | 1,125 (31.2%) | 2,480 (68.8%) |
| Education, Arts & Media | 307 (44.2%) | 387 (55.8%) |
| Legal Services & Support | 83 (25.5%) | 243 (74.5%) |
| Education Instruction & Library | 555 (24.8%) | 1,682 (75.2%) |
| Arts, Media & Entertainment | 180 (51.7%) | 168 (48.3%) |
| Health Diagnosing & Treating | 541 (19.0%) | 2,308 (81.0%) |
| Health Technologists | 395 (21.4%) | 1,448 (78.6%) |
| Total (Category) | 6,610 (45.1%) | 8,033 (54.9%) |
| Total (Overall) | 18,073 (52.2%) | 16,551 (47.8%) |
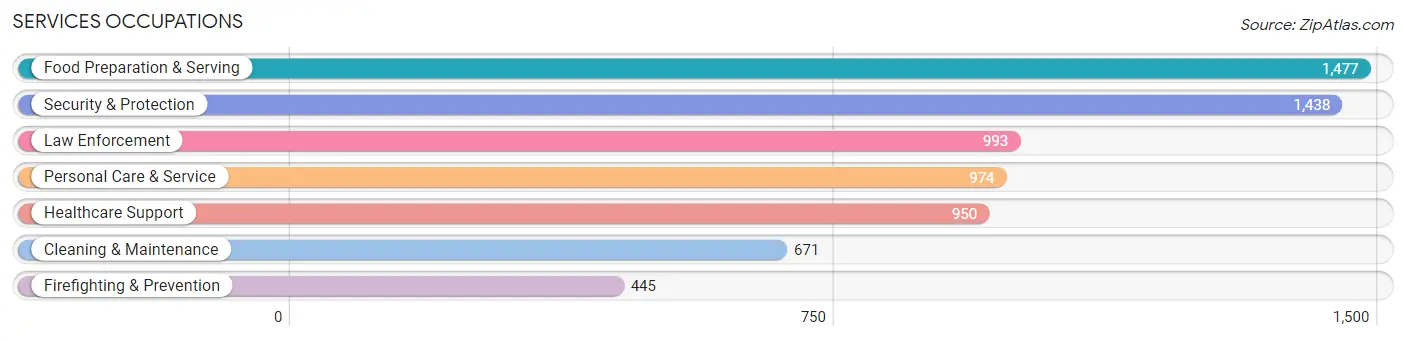
Services Occupations
The most common Services occupations in Leavenworth County are Food Preparation & Serving (1,477 | 4.3%), Security & Protection (1,438 | 4.2%), Law Enforcement (993 | 2.9%), Personal Care & Service (974 | 2.8%), and Healthcare Support (950 | 2.7%).
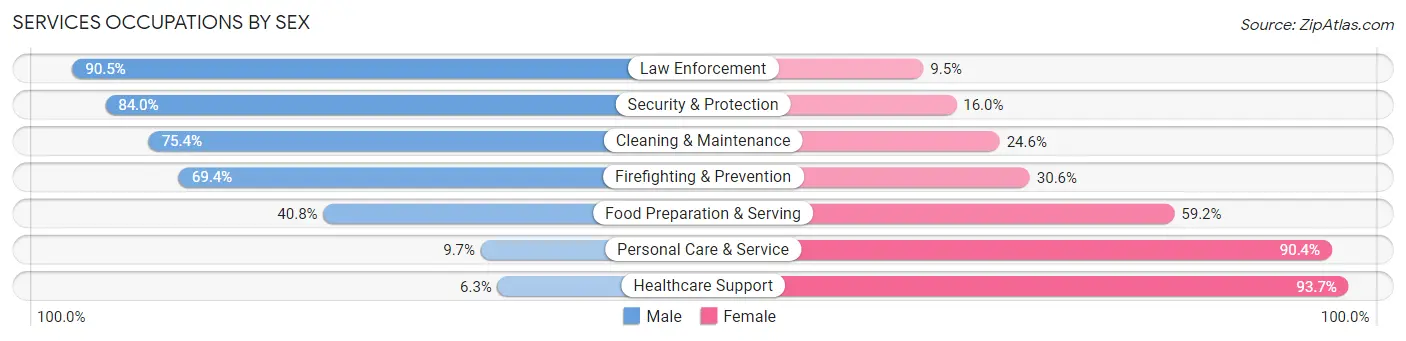
Services Occupations by Sex
Within the Services occupations in Leavenworth County, the most male-oriented occupations are Law Enforcement (90.5%), Security & Protection (84.0%), and Cleaning & Maintenance (75.4%), while the most female-oriented occupations are Healthcare Support (93.7%), Personal Care & Service (90.3%), and Food Preparation & Serving (59.2%).
| Occupation | Male | Female |
| Healthcare Support | 60 (6.3%) | 890 (93.7%) |
| Security & Protection | 1,208 (84.0%) | 230 (16.0%) |
| Firefighting & Prevention | 309 (69.4%) | 136 (30.6%) |
| Law Enforcement | 899 (90.5%) | 94 (9.5%) |
| Food Preparation & Serving | 603 (40.8%) | 874 (59.2%) |
| Cleaning & Maintenance | 506 (75.4%) | 165 (24.6%) |
| Personal Care & Service | 94 (9.7%) | 880 (90.3%) |
| Total (Category) | 2,471 (44.9%) | 3,039 (55.1%) |
| Total (Overall) | 18,073 (52.2%) | 16,551 (47.8%) |
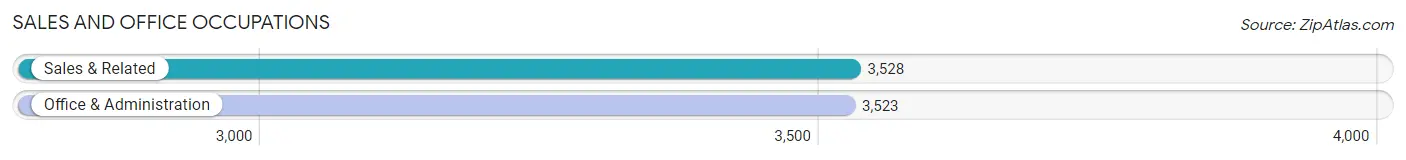
Sales and Office Occupations
The most common Sales and Office occupations in Leavenworth County are Sales & Related (3,528 | 10.2%), and Office & Administration (3,523 | 10.2%).
Sales and Office Occupations by Sex
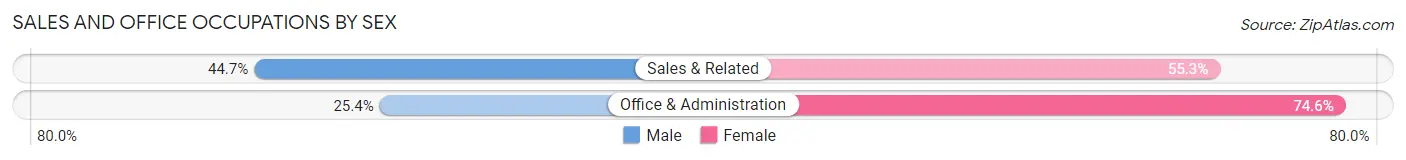
| Occupation | Male | Female |
| Sales & Related | 1,577 (44.7%) | 1,951 (55.3%) |
| Office & Administration | 895 (25.4%) | 2,628 (74.6%) |
| Total (Category) | 2,472 (35.1%) | 4,579 (64.9%) |
| Total (Overall) | 18,073 (52.2%) | 16,551 (47.8%) |
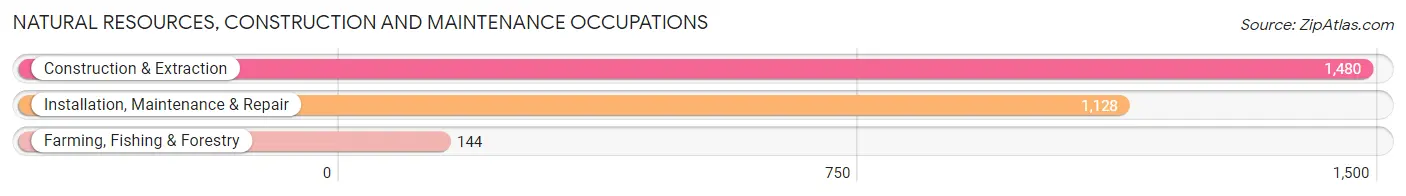
Natural Resources, Construction and Maintenance Occupations
The most common Natural Resources, Construction and Maintenance occupations in Leavenworth County are Construction & Extraction (1,480 | 4.3%), Installation, Maintenance & Repair (1,128 | 3.3%), and Farming, Fishing & Forestry (144 | 0.4%).
Natural Resources, Construction and Maintenance Occupations by Sex
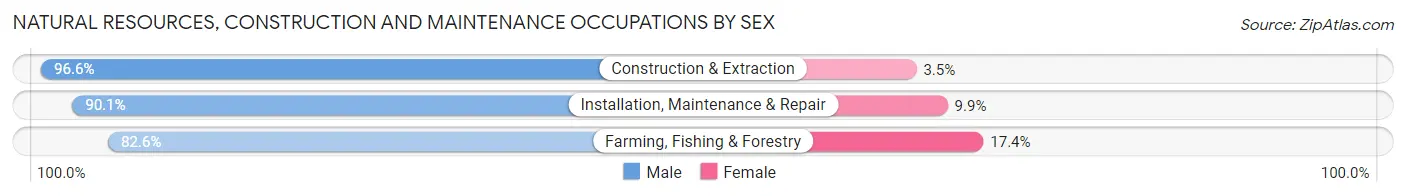
| Occupation | Male | Female |
| Farming, Fishing & Forestry | 119 (82.6%) | 25 (17.4%) |
| Construction & Extraction | 1,429 (96.6%) | 51 (3.5%) |
| Installation, Maintenance & Repair | 1,016 (90.1%) | 112 (9.9%) |
| Total (Category) | 2,564 (93.2%) | 188 (6.8%) |
| Total (Overall) | 18,073 (52.2%) | 16,551 (47.8%) |
Production, Transportation and Moving Occupations
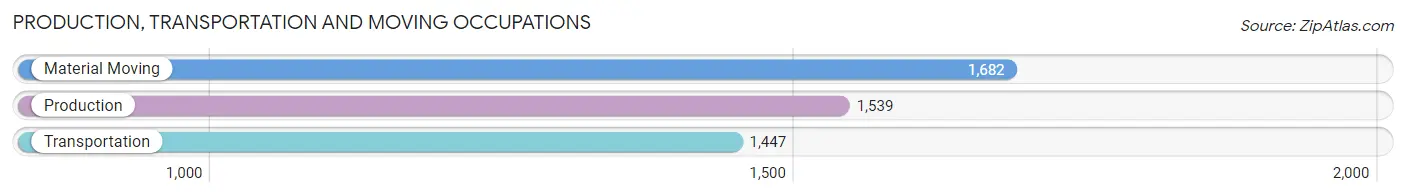
The most common Production, Transportation and Moving occupations in Leavenworth County are Material Moving (1,682 | 4.9%), Production (1,539 | 4.4%), and Transportation (1,447 | 4.2%).
Production, Transportation and Moving Occupations by Sex
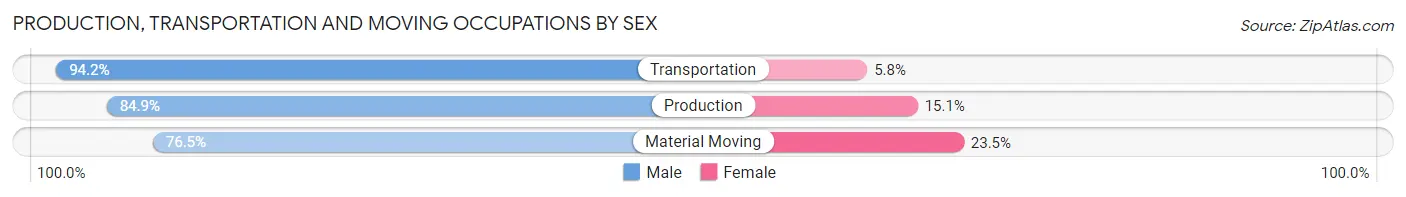
| Occupation | Male | Female |
| Production | 1,307 (84.9%) | 232 (15.1%) |
| Transportation | 1,363 (94.2%) | 84 (5.8%) |
| Material Moving | 1,286 (76.5%) | 396 (23.5%) |
| Total (Category) | 3,956 (84.8%) | 712 (15.2%) |
| Total (Overall) | 18,073 (52.2%) | 16,551 (47.8%) |
Employment Industries by Sex in Leavenworth County
Employment Industries in Leavenworth County
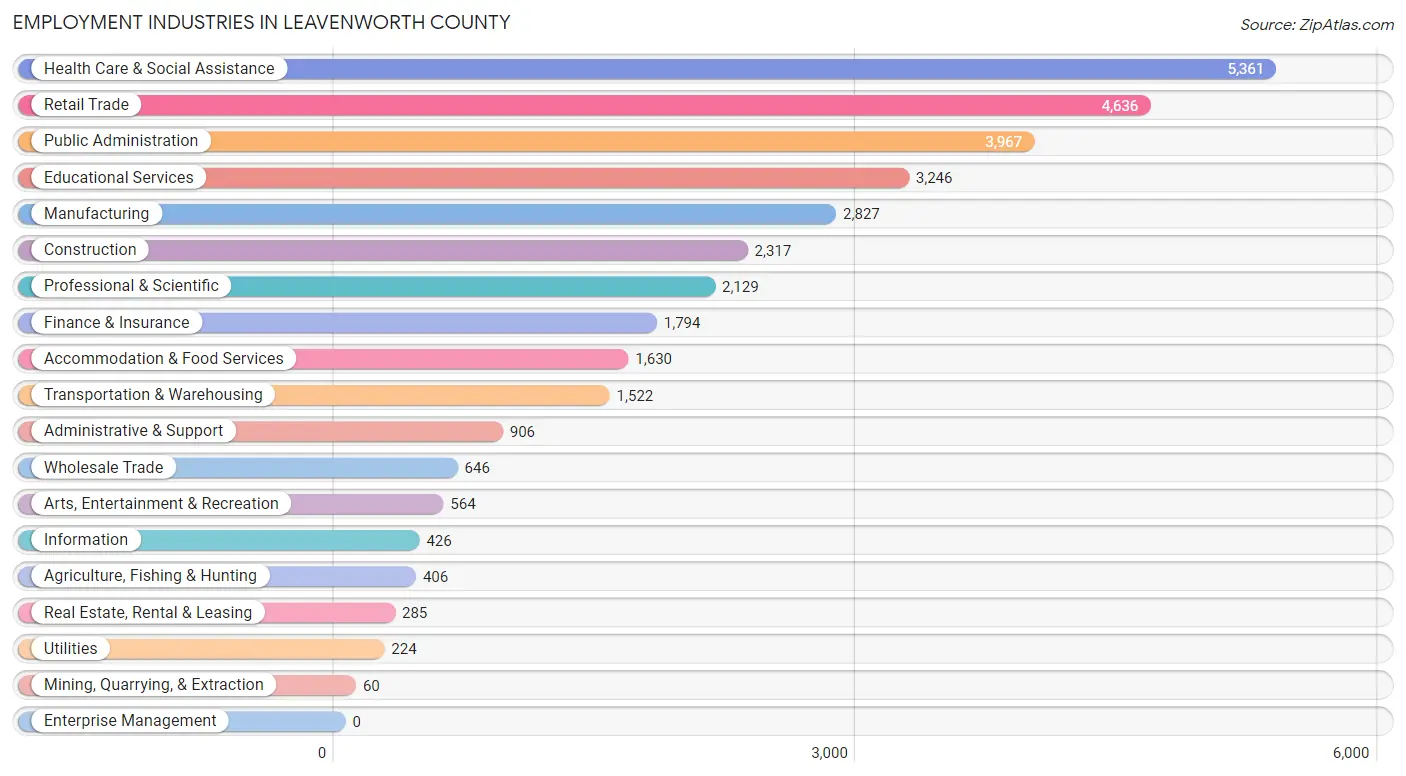
The major employment industries in Leavenworth County include Health Care & Social Assistance (5,361 | 15.5%), Retail Trade (4,636 | 13.4%), Public Administration (3,967 | 11.5%), Educational Services (3,246 | 9.4%), and Manufacturing (2,827 | 8.2%).
Employment Industries by Sex in Leavenworth County
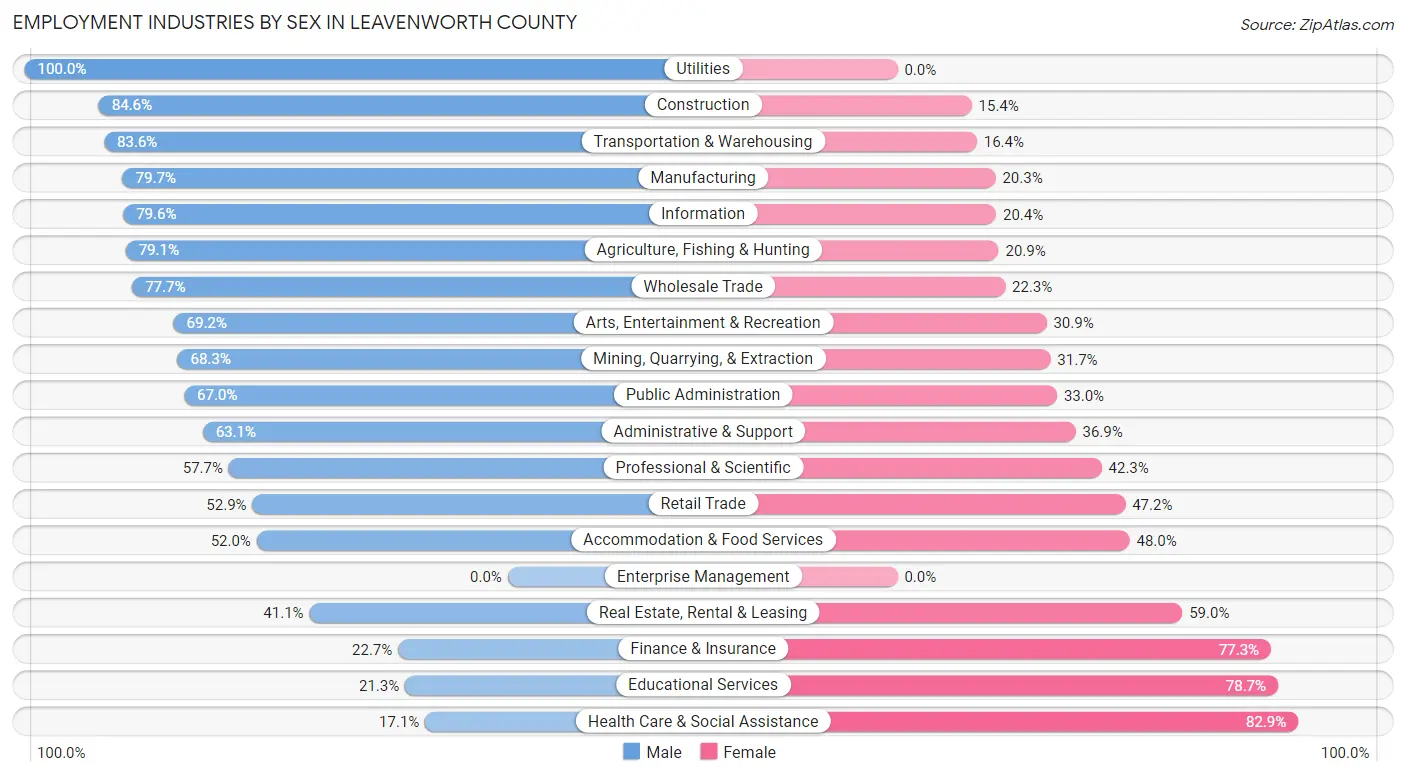
The Leavenworth County industries that see more men than women are Utilities (100.0%), Construction (84.6%), and Transportation & Warehousing (83.6%), whereas the industries that tend to have a higher number of women are Health Care & Social Assistance (82.9%), Educational Services (78.7%), and Finance & Insurance (77.3%).
| Industry | Male | Female |
| Agriculture, Fishing & Hunting | 321 (79.1%) | 85 (20.9%) |
| Mining, Quarrying, & Extraction | 41 (68.3%) | 19 (31.7%) |
| Construction | 1,961 (84.6%) | 356 (15.4%) |
| Manufacturing | 2,253 (79.7%) | 574 (20.3%) |
| Wholesale Trade | 502 (77.7%) | 144 (22.3%) |
| Retail Trade | 2,450 (52.8%) | 2,186 (47.1%) |
| Transportation & Warehousing | 1,272 (83.6%) | 250 (16.4%) |
| Utilities | 224 (100.0%) | 0 (0.0%) |
| Information | 339 (79.6%) | 87 (20.4%) |
| Finance & Insurance | 407 (22.7%) | 1,387 (77.3%) |
| Real Estate, Rental & Leasing | 117 (41.0%) | 168 (59.0%) |
| Professional & Scientific | 1,229 (57.7%) | 900 (42.3%) |
| Enterprise Management | 0 (0.0%) | 0 (0.0%) |
| Administrative & Support | 572 (63.1%) | 334 (36.9%) |
| Educational Services | 690 (21.3%) | 2,556 (78.7%) |
| Health Care & Social Assistance | 916 (17.1%) | 4,445 (82.9%) |
| Arts, Entertainment & Recreation | 390 (69.2%) | 174 (30.8%) |
| Accommodation & Food Services | 847 (52.0%) | 783 (48.0%) |
| Public Administration | 2,657 (67.0%) | 1,310 (33.0%) |
| Total | 18,073 (52.2%) | 16,551 (47.8%) |
Education in Leavenworth County
School Enrollment in Leavenworth County
The most common levels of schooling among the 20,899 students in Leavenworth County are elementary school (4,263 | 20.4%), middle school (4,211 | 20.2%), and high school (4,114 | 19.7%).
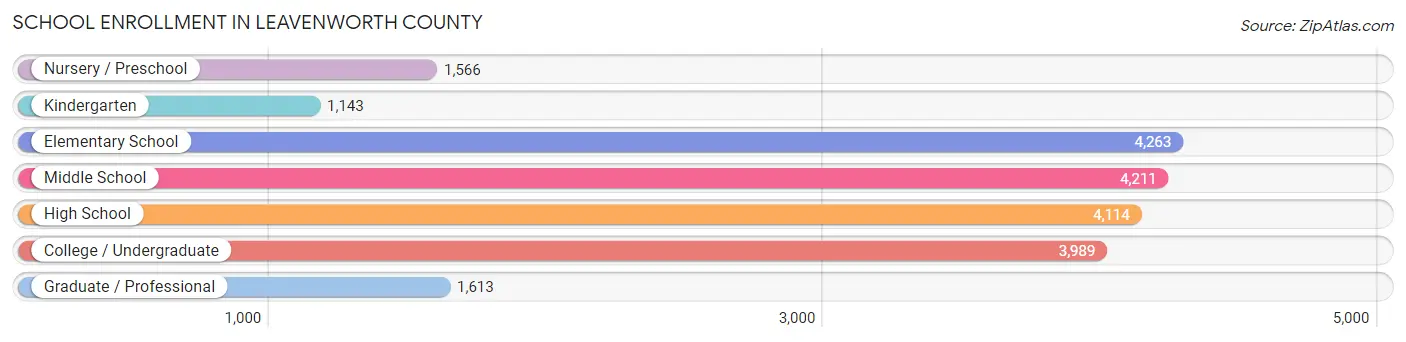
| School Level | # Students | % Students |
| Nursery / Preschool | 1,566 | 7.5% |
| Kindergarten | 1,143 | 5.5% |
| Elementary School | 4,263 | 20.4% |
| Middle School | 4,211 | 20.2% |
| High School | 4,114 | 19.7% |
| College / Undergraduate | 3,989 | 19.1% |
| Graduate / Professional | 1,613 | 7.7% |
| Total | 20,899 | 100.0% |
School Enrollment by Age by Funding Source in Leavenworth County
Out of a total of 20,899 students who are enrolled in schools in Leavenworth County, 3,887 (18.6%) attend a private institution, while the remaining 17,012 (81.4%) are enrolled in public schools. The age group of 3 to 4 year olds has the highest likelihood of being enrolled in private schools, with 459 (39.3% in the age bracket) enrolled. Conversely, the age group of 15 to 17 year olds has the lowest likelihood of being enrolled in a private school, with 2,948 (95.1% in the age bracket) attending a public institution.
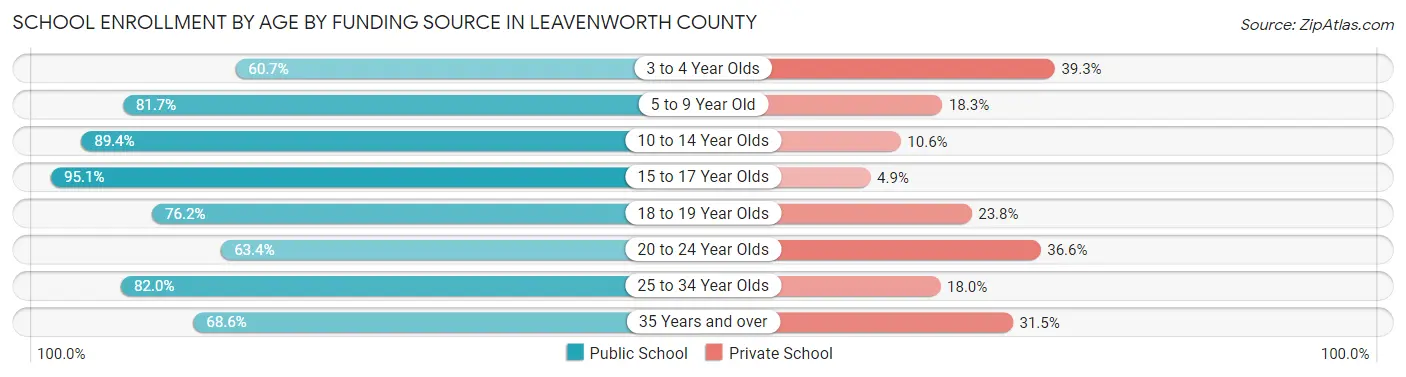
| Age Bracket | Public School | Private School |
| 3 to 4 Year Olds | 710 (60.7%) | 459 (39.3%) |
| 5 to 9 Year Old | 4,230 (81.7%) | 948 (18.3%) |
| 10 to 14 Year Olds | 4,644 (89.4%) | 549 (10.6%) |
| 15 to 17 Year Olds | 2,948 (95.1%) | 153 (4.9%) |
| 18 to 19 Year Olds | 927 (76.2%) | 289 (23.8%) |
| 20 to 24 Year Olds | 1,102 (63.4%) | 637 (36.6%) |
| 25 to 34 Year Olds | 1,197 (82.0%) | 262 (18.0%) |
| 35 Years and over | 1,264 (68.5%) | 580 (31.5%) |
| Total | 17,012 (81.4%) | 3,887 (18.6%) |
Educational Attainment by Field of Study in Leavenworth County
Business (3,930 | 18.5%), science & technology (3,236 | 15.2%), education (2,705 | 12.7%), arts & humanities (1,910 | 9.0%), and social sciences (1,794 | 8.5%) are the most common fields of study among 21,241 individuals in Leavenworth County who have obtained a bachelor's degree or higher.
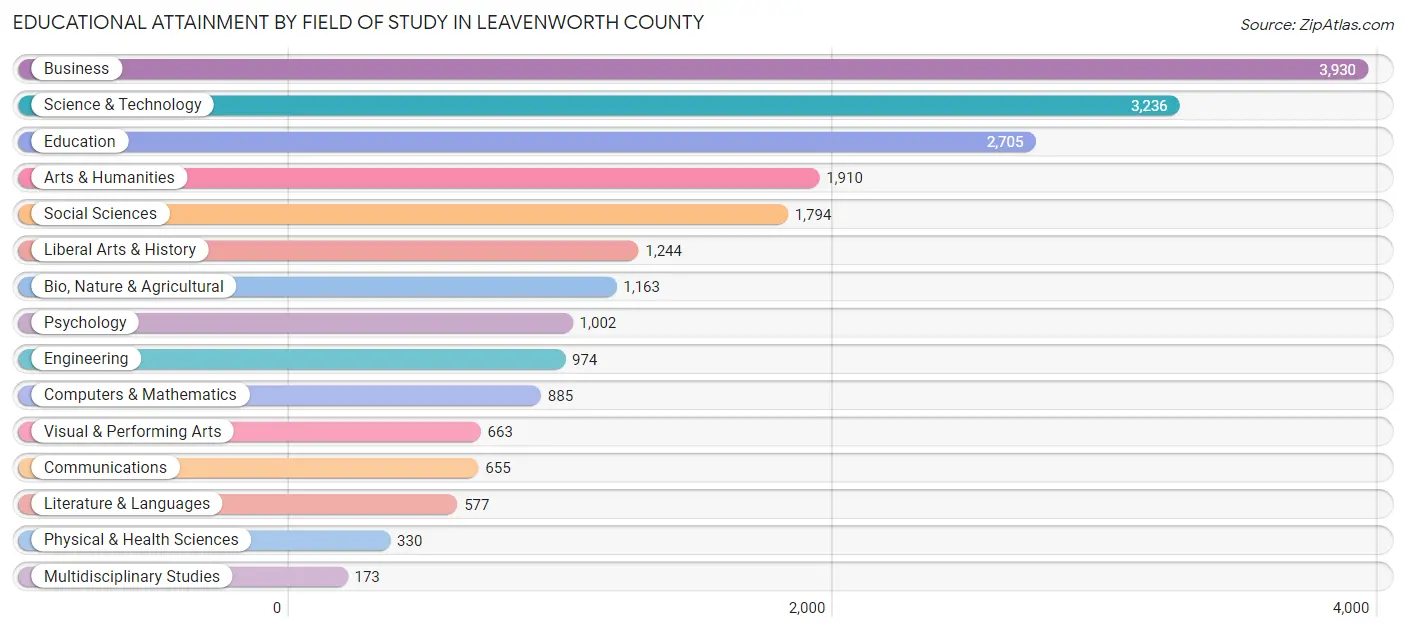
| Field of Study | # Graduates | % Graduates |
| Computers & Mathematics | 885 | 4.2% |
| Bio, Nature & Agricultural | 1,163 | 5.5% |
| Physical & Health Sciences | 330 | 1.5% |
| Psychology | 1,002 | 4.7% |
| Social Sciences | 1,794 | 8.5% |
| Engineering | 974 | 4.6% |
| Multidisciplinary Studies | 173 | 0.8% |
| Science & Technology | 3,236 | 15.2% |
| Business | 3,930 | 18.5% |
| Education | 2,705 | 12.7% |
| Literature & Languages | 577 | 2.7% |
| Liberal Arts & History | 1,244 | 5.9% |
| Visual & Performing Arts | 663 | 3.1% |
| Communications | 655 | 3.1% |
| Arts & Humanities | 1,910 | 9.0% |
| Total | 21,241 | 100.0% |
Transportation & Commute in Leavenworth County
Vehicle Availability by Sex in Leavenworth County
The most prevalent vehicle ownership categories in Leavenworth County are males with 2 vehicles (8,264, accounting for 42.0%) and females with 2 vehicles (5,795, making up 50.6%).
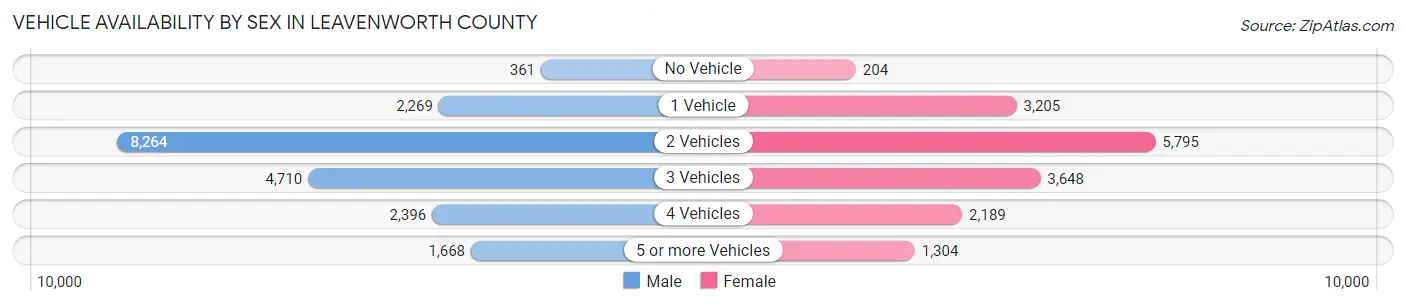
| Vehicles Available | Male | Female |
| No Vehicle | 361 (1.8%) | 204 (1.3%) |
| 1 Vehicle | 2,269 (11.5%) | 3,205 (19.6%) |
| 2 Vehicles | 8,264 (42.0%) | 5,795 (35.4%) |
| 3 Vehicles | 4,710 (23.9%) | 3,648 (22.3%) |
| 4 Vehicles | 2,396 (12.2%) | 2,189 (13.4%) |
| 5 or more Vehicles | 1,668 (8.5%) | 1,304 (8.0%) |
| Total | 19,668 (100.0%) | 16,345 (100.0%) |
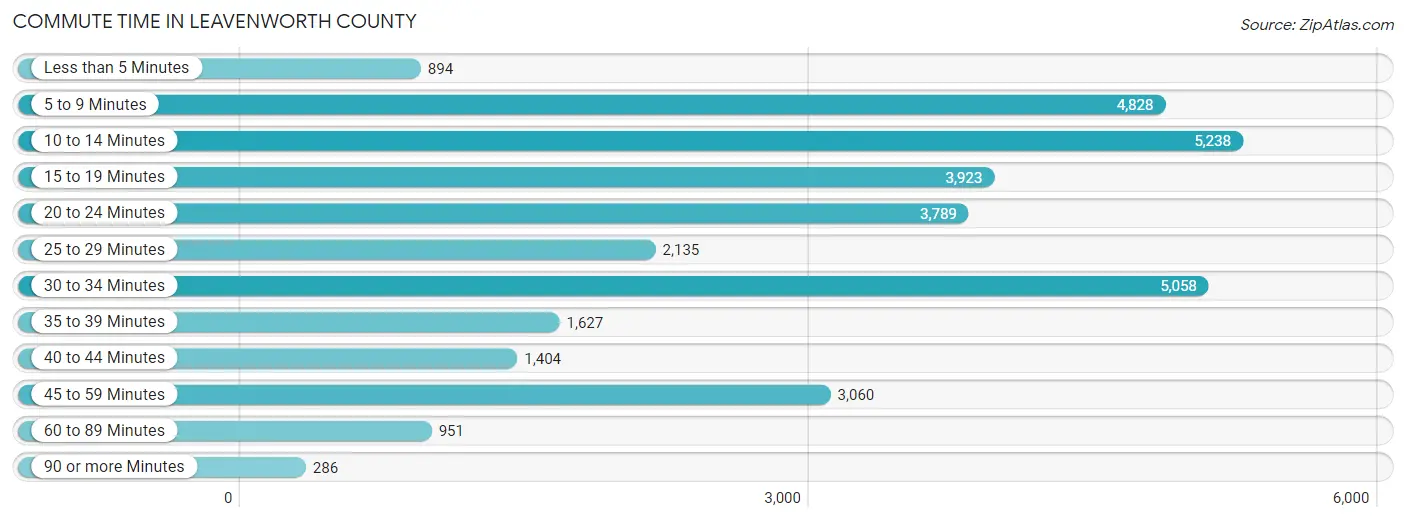
Commute Time in Leavenworth County
The most frequently occuring commute durations in Leavenworth County are 10 to 14 minutes (5,238 commuters, 15.8%), 30 to 34 minutes (5,058 commuters, 15.2%), and 5 to 9 minutes (4,828 commuters, 14.5%).
| Commute Time | # Commuters | % Commuters |
| Less than 5 Minutes | 894 | 2.7% |
| 5 to 9 Minutes | 4,828 | 14.5% |
| 10 to 14 Minutes | 5,238 | 15.8% |
| 15 to 19 Minutes | 3,923 | 11.8% |
| 20 to 24 Minutes | 3,789 | 11.4% |
| 25 to 29 Minutes | 2,135 | 6.4% |
| 30 to 34 Minutes | 5,058 | 15.2% |
| 35 to 39 Minutes | 1,627 | 4.9% |
| 40 to 44 Minutes | 1,404 | 4.2% |
| 45 to 59 Minutes | 3,060 | 9.2% |
| 60 to 89 Minutes | 951 | 2.9% |
| 90 or more Minutes | 286 | 0.9% |
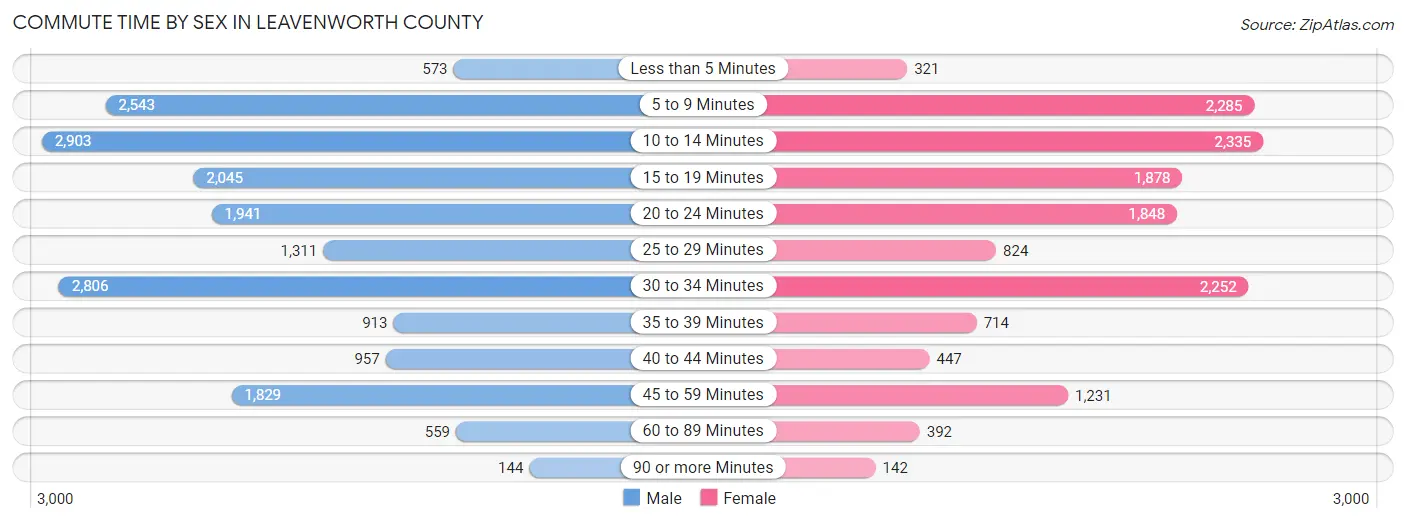
Commute Time by Sex in Leavenworth County
The most common commute times in Leavenworth County are 10 to 14 minutes (2,903 commuters, 15.7%) for males and 10 to 14 minutes (2,335 commuters, 15.9%) for females.
| Commute Time | Male | Female |
| Less than 5 Minutes | 573 (3.1%) | 321 (2.2%) |
| 5 to 9 Minutes | 2,543 (13.7%) | 2,285 (15.6%) |
| 10 to 14 Minutes | 2,903 (15.7%) | 2,335 (15.9%) |
| 15 to 19 Minutes | 2,045 (11.0%) | 1,878 (12.8%) |
| 20 to 24 Minutes | 1,941 (10.5%) | 1,848 (12.6%) |
| 25 to 29 Minutes | 1,311 (7.1%) | 824 (5.6%) |
| 30 to 34 Minutes | 2,806 (15.1%) | 2,252 (15.3%) |
| 35 to 39 Minutes | 913 (4.9%) | 714 (4.9%) |
| 40 to 44 Minutes | 957 (5.2%) | 447 (3.0%) |
| 45 to 59 Minutes | 1,829 (9.9%) | 1,231 (8.4%) |
| 60 to 89 Minutes | 559 (3.0%) | 392 (2.7%) |
| 90 or more Minutes | 144 (0.8%) | 142 (1.0%) |
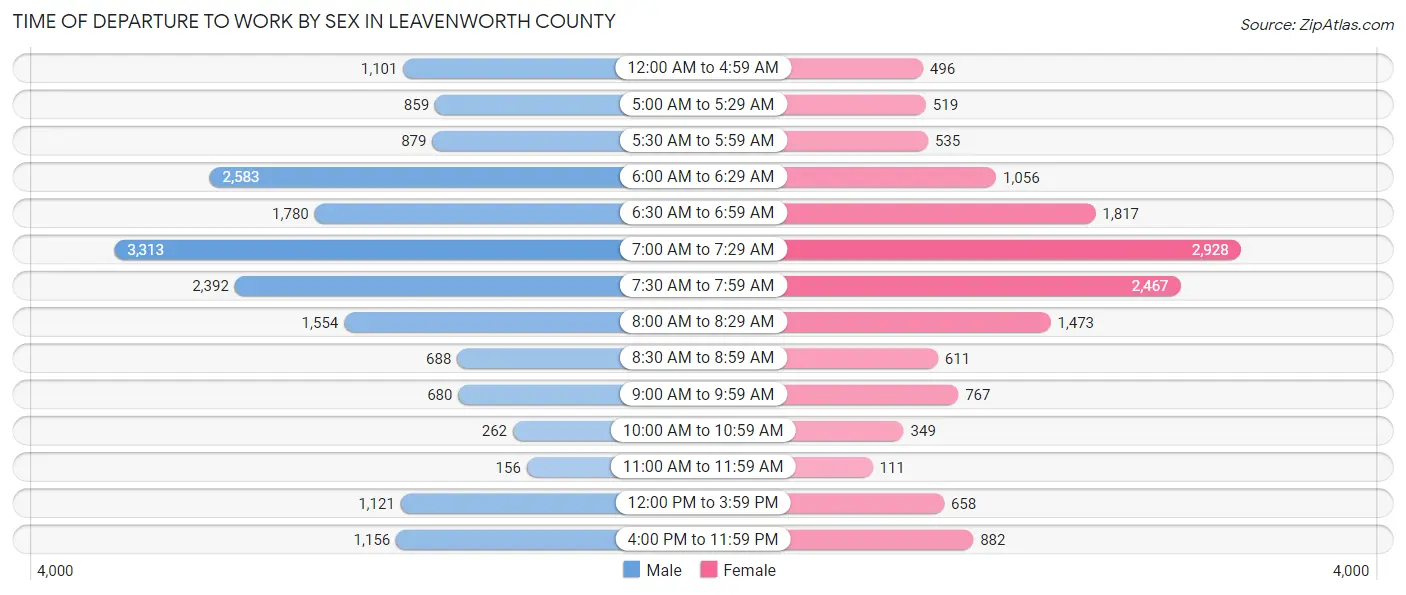
Time of Departure to Work by Sex in Leavenworth County
The most frequent times of departure to work in Leavenworth County are 7:00 AM to 7:29 AM (3,313, 17.9%) for males and 7:00 AM to 7:29 AM (2,928, 20.0%) for females.
| Time of Departure | Male | Female |
| 12:00 AM to 4:59 AM | 1,101 (5.9%) | 496 (3.4%) |
| 5:00 AM to 5:29 AM | 859 (4.6%) | 519 (3.5%) |
| 5:30 AM to 5:59 AM | 879 (4.8%) | 535 (3.6%) |
| 6:00 AM to 6:29 AM | 2,583 (13.9%) | 1,056 (7.2%) |
| 6:30 AM to 6:59 AM | 1,780 (9.6%) | 1,817 (12.4%) |
| 7:00 AM to 7:29 AM | 3,313 (17.9%) | 2,928 (20.0%) |
| 7:30 AM to 7:59 AM | 2,392 (12.9%) | 2,467 (16.8%) |
| 8:00 AM to 8:29 AM | 1,554 (8.4%) | 1,473 (10.0%) |
| 8:30 AM to 8:59 AM | 688 (3.7%) | 611 (4.2%) |
| 9:00 AM to 9:59 AM | 680 (3.7%) | 767 (5.2%) |
| 10:00 AM to 10:59 AM | 262 (1.4%) | 349 (2.4%) |
| 11:00 AM to 11:59 AM | 156 (0.8%) | 111 (0.8%) |
| 12:00 PM to 3:59 PM | 1,121 (6.0%) | 658 (4.5%) |
| 4:00 PM to 11:59 PM | 1,156 (6.2%) | 882 (6.0%) |
| Total | 18,524 (100.0%) | 14,669 (100.0%) |
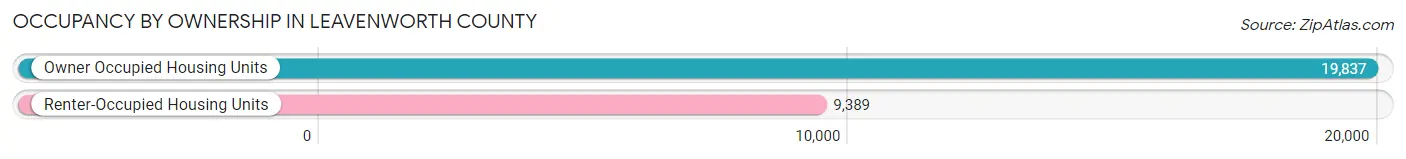
Housing Occupancy in Leavenworth County
Occupancy by Ownership in Leavenworth County
Of the total 29,226 dwellings in Leavenworth County, owner-occupied units account for 19,837 (67.9%), while renter-occupied units make up 9,389 (32.1%).
| Occupancy | # Housing Units | % Housing Units |
| Owner Occupied Housing Units | 19,837 | 67.9% |
| Renter-Occupied Housing Units | 9,389 | 32.1% |
| Total Occupied Housing Units | 29,226 | 100.0% |
Occupancy by Household Size in Leavenworth County
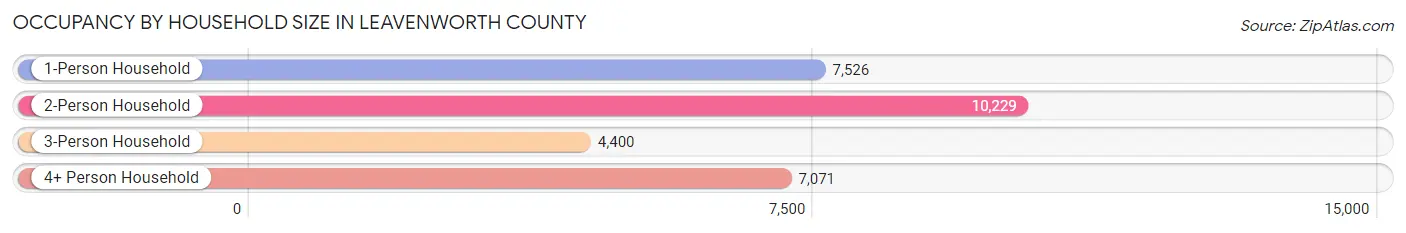
| Household Size | # Housing Units | % Housing Units |
| 1-Person Household | 7,526 | 25.8% |
| 2-Person Household | 10,229 | 35.0% |
| 3-Person Household | 4,400 | 15.1% |
| 4+ Person Household | 7,071 | 24.2% |
| Total Housing Units | 29,226 | 100.0% |
Occupancy by Ownership by Household Size in Leavenworth County
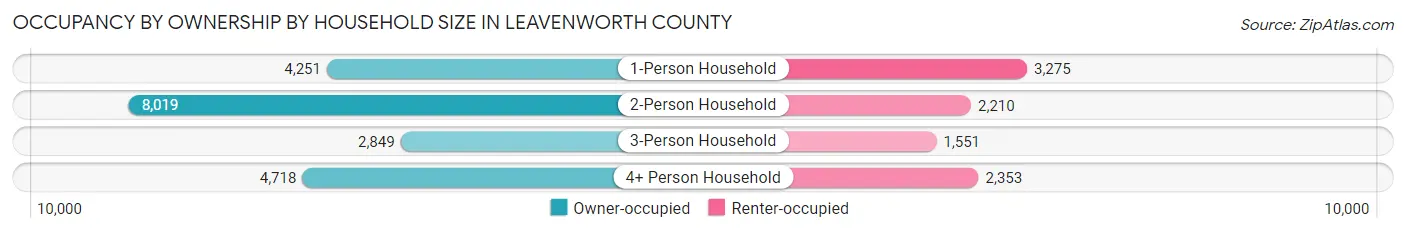
| Household Size | Owner-occupied | Renter-occupied |
| 1-Person Household | 4,251 (56.5%) | 3,275 (43.5%) |
| 2-Person Household | 8,019 (78.4%) | 2,210 (21.6%) |
| 3-Person Household | 2,849 (64.7%) | 1,551 (35.2%) |
| 4+ Person Household | 4,718 (66.7%) | 2,353 (33.3%) |
| Total Housing Units | 19,837 (67.9%) | 9,389 (32.1%) |
Occupancy by Educational Attainment in Leavenworth County
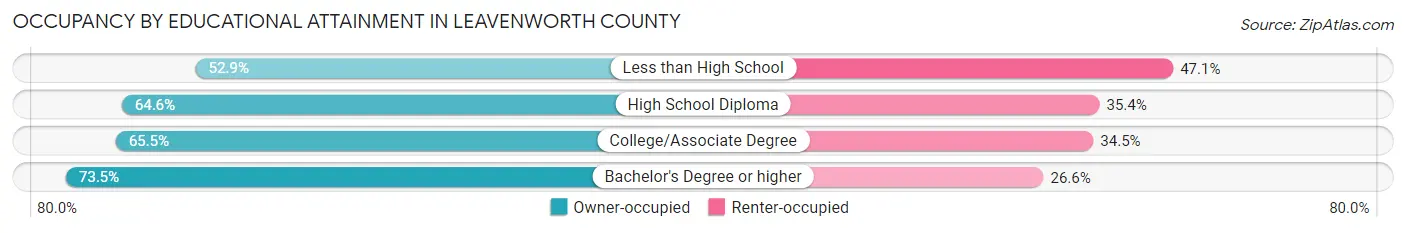
| Household Size | Owner-occupied | Renter-occupied |
| Less than High School | 752 (52.9%) | 670 (47.1%) |
| High School Diploma | 4,560 (64.6%) | 2,502 (35.4%) |
| College/Associate Degree | 5,878 (65.5%) | 3,091 (34.5%) |
| Bachelor's Degree or higher | 8,647 (73.5%) | 3,126 (26.6%) |
Occupancy by Age of Householder in Leavenworth County
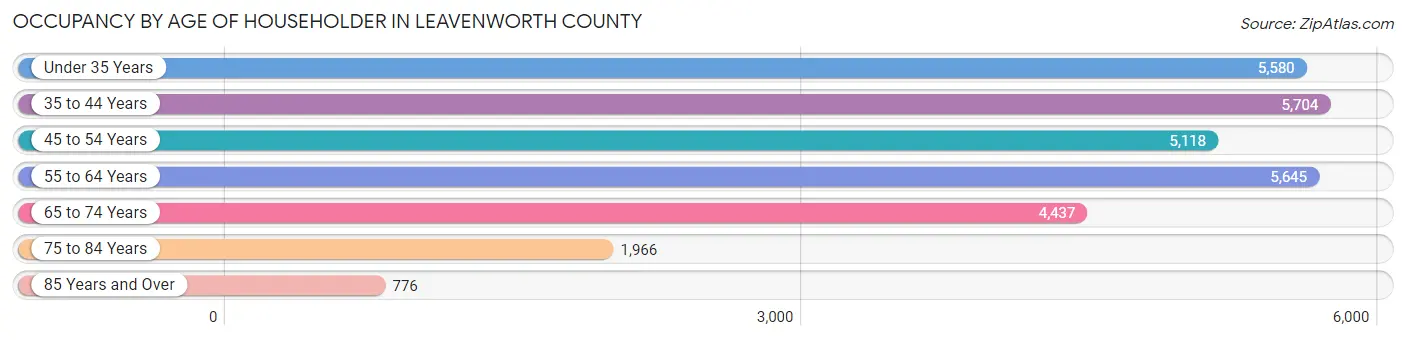
| Age Bracket | # Households | % Households |
| Under 35 Years | 5,580 | 19.1% |
| 35 to 44 Years | 5,704 | 19.5% |
| 45 to 54 Years | 5,118 | 17.5% |
| 55 to 64 Years | 5,645 | 19.3% |
| 65 to 74 Years | 4,437 | 15.2% |
| 75 to 84 Years | 1,966 | 6.7% |
| 85 Years and Over | 776 | 2.7% |
| Total | 29,226 | 100.0% |
Housing Finances in Leavenworth County
Median Income by Occupancy in Leavenworth County
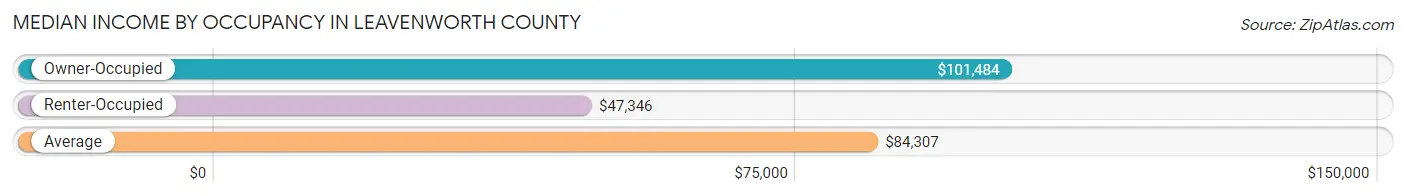
| Occupancy Type | # Households | Median Income |
| Owner-Occupied | 19,837 (67.9%) | $101,484 |
| Renter-Occupied | 9,389 (32.1%) | $47,346 |
| Average | 29,226 (100.0%) | $84,307 |
Occupancy by Householder Income Bracket in Leavenworth County
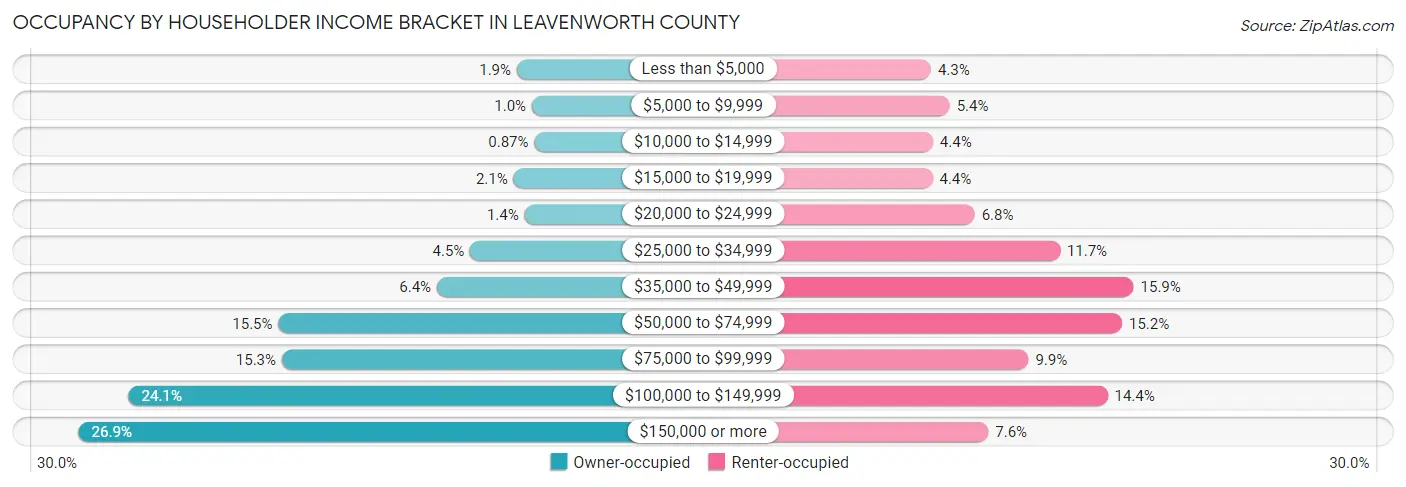
| Income Bracket | Owner-occupied | Renter-occupied |
| Less than $5,000 | 371 (1.9%) | 405 (4.3%) |
| $5,000 to $9,999 | 200 (1.0%) | 505 (5.4%) |
| $10,000 to $14,999 | 173 (0.9%) | 415 (4.4%) |
| $15,000 to $19,999 | 409 (2.1%) | 413 (4.4%) |
| $20,000 to $24,999 | 284 (1.4%) | 639 (6.8%) |
| $25,000 to $34,999 | 900 (4.5%) | 1,097 (11.7%) |
| $35,000 to $49,999 | 1,278 (6.4%) | 1,492 (15.9%) |
| $50,000 to $74,999 | 3,075 (15.5%) | 1,430 (15.2%) |
| $75,000 to $99,999 | 3,035 (15.3%) | 928 (9.9%) |
| $100,000 to $149,999 | 4,773 (24.1%) | 1,352 (14.4%) |
| $150,000 or more | 5,339 (26.9%) | 713 (7.6%) |
| Total | 19,837 (100.0%) | 9,389 (100.0%) |
Monthly Housing Cost Tiers in Leavenworth County
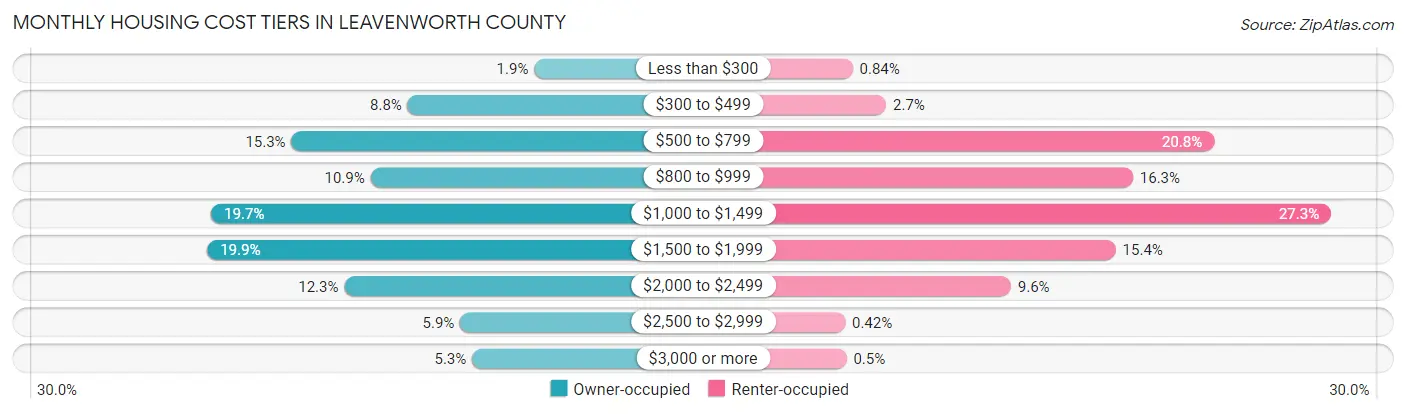
| Monthly Cost | Owner-occupied | Renter-occupied |
| Less than $300 | 367 (1.8%) | 79 (0.8%) |
| $300 to $499 | 1,753 (8.8%) | 253 (2.7%) |
| $500 to $799 | 3,027 (15.3%) | 1,953 (20.8%) |
| $800 to $999 | 2,161 (10.9%) | 1,532 (16.3%) |
| $1,000 to $1,499 | 3,907 (19.7%) | 2,559 (27.3%) |
| $1,500 to $1,999 | 3,949 (19.9%) | 1,443 (15.4%) |
| $2,000 to $2,499 | 2,448 (12.3%) | 899 (9.6%) |
| $2,500 to $2,999 | 1,178 (5.9%) | 39 (0.4%) |
| $3,000 or more | 1,047 (5.3%) | 47 (0.5%) |
| Total | 19,837 (100.0%) | 9,389 (100.0%) |
Physical Housing Characteristics in Leavenworth County
Housing Structures in Leavenworth County
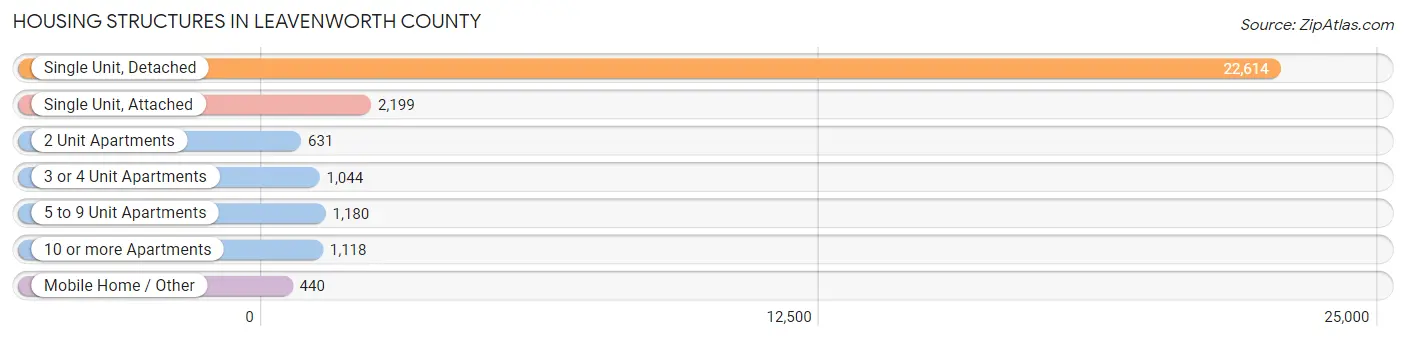
| Structure Type | # Housing Units | % Housing Units |
| Single Unit, Detached | 22,614 | 77.4% |
| Single Unit, Attached | 2,199 | 7.5% |
| 2 Unit Apartments | 631 | 2.2% |
| 3 or 4 Unit Apartments | 1,044 | 3.6% |
| 5 to 9 Unit Apartments | 1,180 | 4.0% |
| 10 or more Apartments | 1,118 | 3.8% |
| Mobile Home / Other | 440 | 1.5% |
| Total | 29,226 | 100.0% |
Housing Structures by Occupancy in Leavenworth County
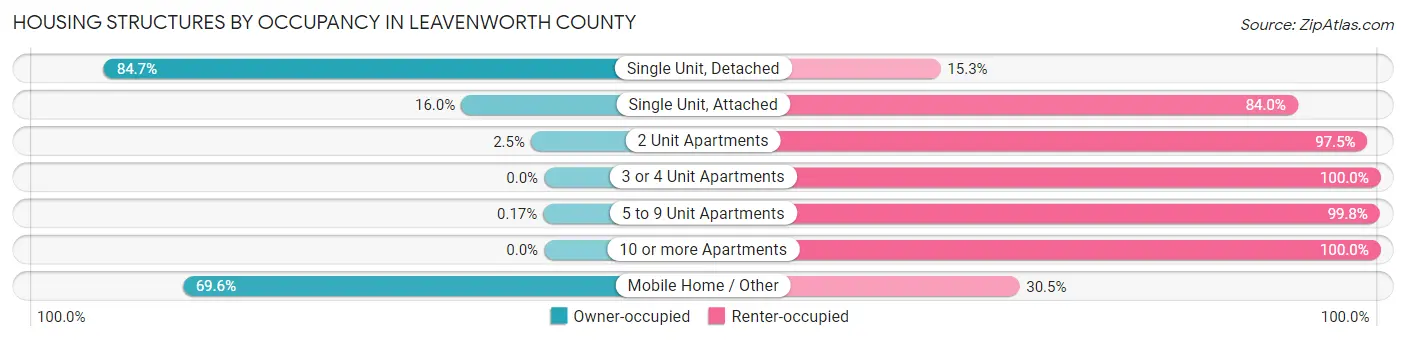
| Structure Type | Owner-occupied | Renter-occupied |
| Single Unit, Detached | 19,162 (84.7%) | 3,452 (15.3%) |
| Single Unit, Attached | 351 (16.0%) | 1,848 (84.0%) |
| 2 Unit Apartments | 16 (2.5%) | 615 (97.5%) |
| 3 or 4 Unit Apartments | 0 (0.0%) | 1,044 (100.0%) |
| 5 to 9 Unit Apartments | 2 (0.2%) | 1,178 (99.8%) |
| 10 or more Apartments | 0 (0.0%) | 1,118 (100.0%) |
| Mobile Home / Other | 306 (69.6%) | 134 (30.4%) |
| Total | 19,837 (67.9%) | 9,389 (32.1%) |
Housing Structures by Number of Rooms in Leavenworth County
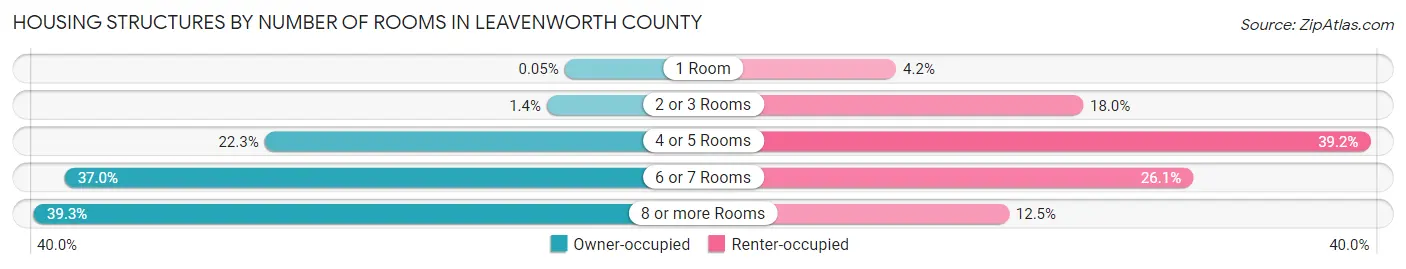
| Number of Rooms | Owner-occupied | Renter-occupied |
| 1 Room | 10 (0.1%) | 391 (4.2%) |
| 2 or 3 Rooms | 270 (1.4%) | 1,689 (18.0%) |
| 4 or 5 Rooms | 4,414 (22.3%) | 3,683 (39.2%) |
| 6 or 7 Rooms | 7,346 (37.0%) | 2,452 (26.1%) |
| 8 or more Rooms | 7,797 (39.3%) | 1,174 (12.5%) |
| Total | 19,837 (100.0%) | 9,389 (100.0%) |
Housing Structure by Heating Type in Leavenworth County
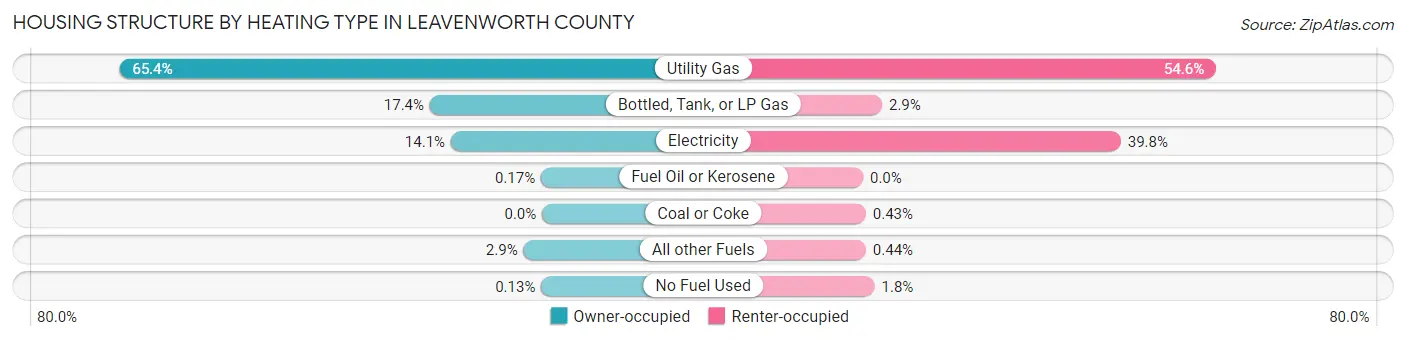
| Heating Type | Owner-occupied | Renter-occupied |
| Utility Gas | 12,966 (65.4%) | 5,123 (54.6%) |
| Bottled, Tank, or LP Gas | 3,442 (17.3%) | 276 (2.9%) |
| Electricity | 2,798 (14.1%) | 3,741 (39.8%) |
| Fuel Oil or Kerosene | 33 (0.2%) | 0 (0.0%) |
| Coal or Coke | 0 (0.0%) | 40 (0.4%) |
| All other Fuels | 572 (2.9%) | 41 (0.4%) |
| No Fuel Used | 26 (0.1%) | 168 (1.8%) |
| Total | 19,837 (100.0%) | 9,389 (100.0%) |
Household Vehicle Usage in Leavenworth County
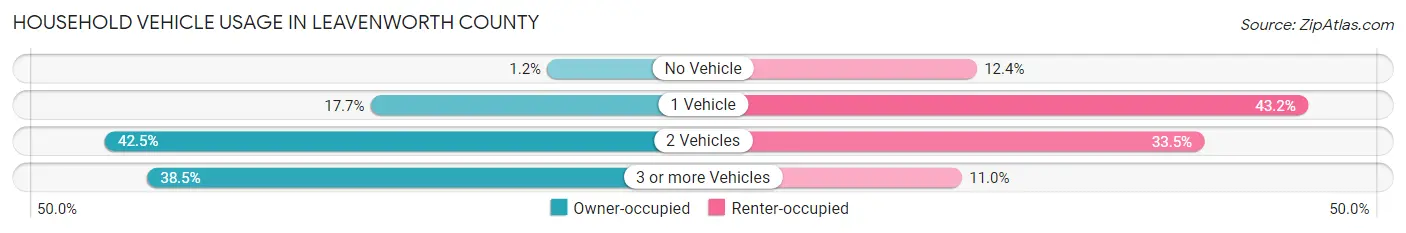
| Vehicles per Household | Owner-occupied | Renter-occupied |
| No Vehicle | 246 (1.2%) | 1,160 (12.3%) |
| 1 Vehicle | 3,517 (17.7%) | 4,054 (43.2%) |
| 2 Vehicles | 8,429 (42.5%) | 3,146 (33.5%) |
| 3 or more Vehicles | 7,645 (38.5%) | 1,029 (11.0%) |
| Total | 19,837 (100.0%) | 9,389 (100.0%) |
Real Estate & Mortgages in Leavenworth County
Real Estate and Mortgage Overview in Leavenworth County
| Characteristic | Without Mortgage | With Mortgage |
| Housing Units | 6,950 | 12,887 |
| Median Property Value | $214,900 | $253,200 |
| Median Household Income | $85,025 | $3,879 |
| Monthly Housing Costs | $642 | $1,047 |
| Real Estate Taxes | $2,725 | $208 |
Property Value by Mortgage Status in Leavenworth County
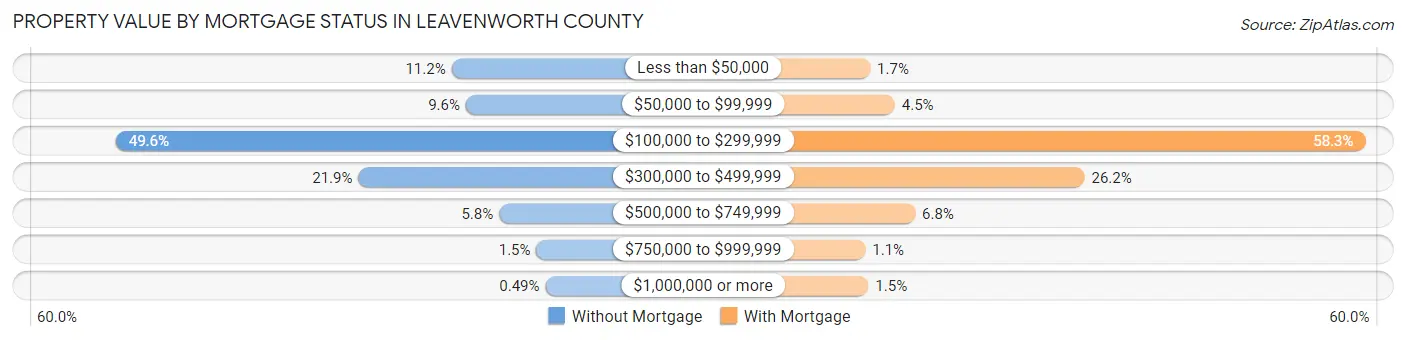
| Property Value | Without Mortgage | With Mortgage |
| Less than $50,000 | 779 (11.2%) | 215 (1.7%) |
| $50,000 to $99,999 | 666 (9.6%) | 579 (4.5%) |
| $100,000 to $299,999 | 3,445 (49.6%) | 7,508 (58.3%) |
| $300,000 to $499,999 | 1,519 (21.9%) | 3,373 (26.2%) |
| $500,000 to $749,999 | 402 (5.8%) | 878 (6.8%) |
| $750,000 to $999,999 | 105 (1.5%) | 144 (1.1%) |
| $1,000,000 or more | 34 (0.5%) | 190 (1.5%) |
| Total | 6,950 (100.0%) | 12,887 (100.0%) |
Household Income by Mortgage Status in Leavenworth County
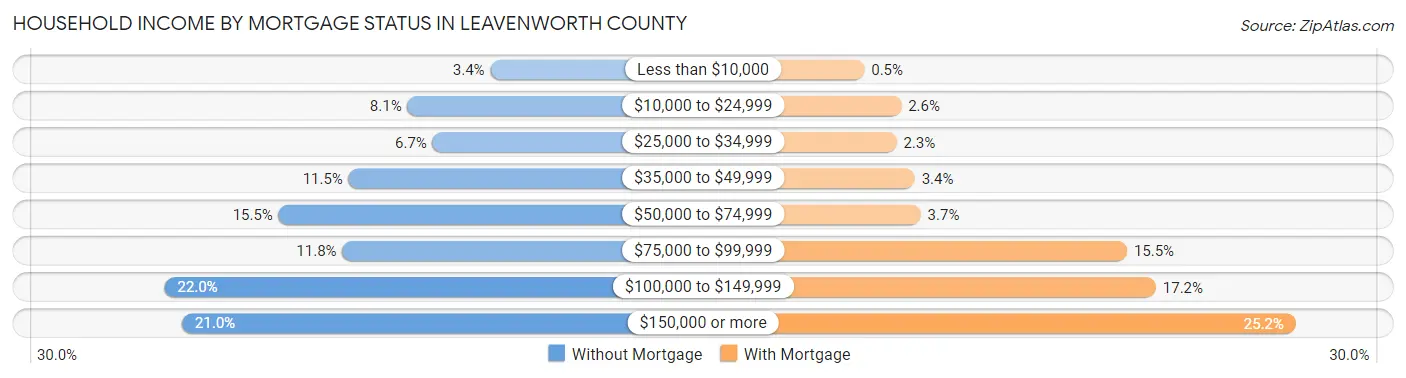
| Household Income | Without Mortgage | With Mortgage |
| Less than $10,000 | 235 (3.4%) | 64 (0.5%) |
| $10,000 to $24,999 | 564 (8.1%) | 336 (2.6%) |
| $25,000 to $34,999 | 464 (6.7%) | 302 (2.3%) |
| $35,000 to $49,999 | 798 (11.5%) | 436 (3.4%) |
| $50,000 to $74,999 | 1,076 (15.5%) | 480 (3.7%) |
| $75,000 to $99,999 | 823 (11.8%) | 1,999 (15.5%) |
| $100,000 to $149,999 | 1,530 (22.0%) | 2,212 (17.2%) |
| $150,000 or more | 1,460 (21.0%) | 3,243 (25.2%) |
| Total | 6,950 (100.0%) | 12,887 (100.0%) |
Property Value to Household Income Ratio in Leavenworth County
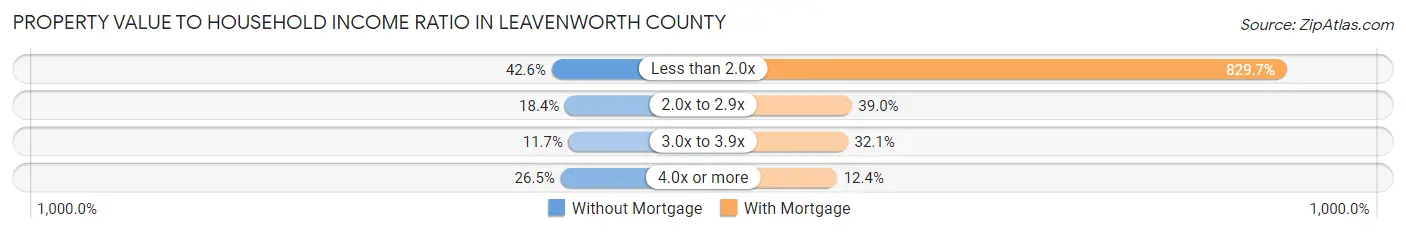
| Value-to-Income Ratio | Without Mortgage | With Mortgage |
| Less than 2.0x | 2,958 (42.6%) | 106,928 (829.7%) |
| 2.0x to 2.9x | 1,278 (18.4%) | 5,027 (39.0%) |
| 3.0x to 3.9x | 813 (11.7%) | 4,135 (32.1%) |
| 4.0x or more | 1,839 (26.5%) | 1,594 (12.4%) |
| Total | 6,950 (100.0%) | 12,887 (100.0%) |
Real Estate Taxes by Mortgage Status in Leavenworth County
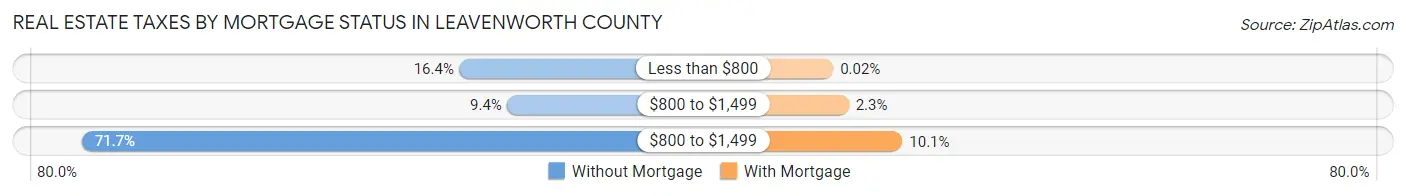
| Property Taxes | Without Mortgage | With Mortgage |
| Less than $800 | 1,141 (16.4%) | 3 (0.0%) |
| $800 to $1,499 | 654 (9.4%) | 295 (2.3%) |
| $800 to $1,499 | 4,980 (71.7%) | 1,305 (10.1%) |
| Total | 6,950 (100.0%) | 12,887 (100.0%) |
Health & Disability in Leavenworth County
Health Insurance Coverage by Age in Leavenworth County
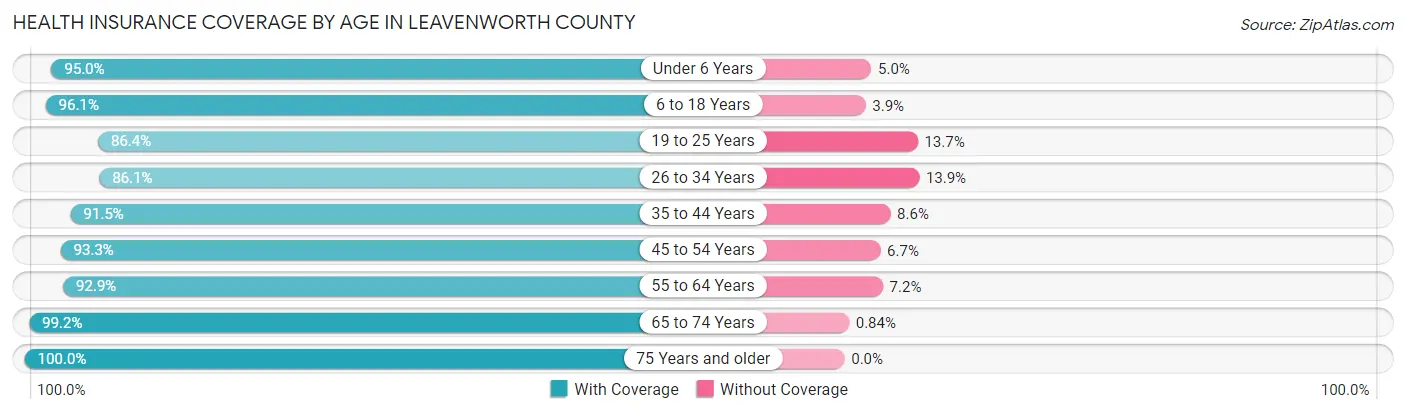
| Age Bracket | With Coverage | Without Coverage |
| Under 6 Years | 5,913 (95.0%) | 311 (5.0%) |
| 6 to 18 Years | 13,420 (96.1%) | 547 (3.9%) |
| 19 to 25 Years | 5,377 (86.4%) | 850 (13.7%) |
| 26 to 34 Years | 6,480 (86.1%) | 1,048 (13.9%) |
| 35 to 44 Years | 8,972 (91.4%) | 839 (8.6%) |
| 45 to 54 Years | 8,514 (93.3%) | 610 (6.7%) |
| 55 to 64 Years | 9,297 (92.8%) | 716 (7.1%) |
| 65 to 74 Years | 7,349 (99.2%) | 62 (0.8%) |
| 75 Years and older | 4,613 (100.0%) | 0 (0.0%) |
| Total | 69,935 (93.3%) | 4,983 (6.7%) |
Health Insurance Coverage by Citizenship Status in Leavenworth County
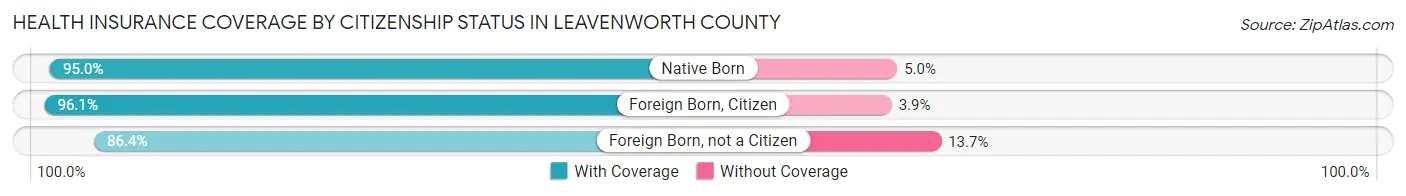
| Citizenship Status | With Coverage | Without Coverage |
| Native Born | 5,913 (95.0%) | 311 (5.0%) |
| Foreign Born, Citizen | 13,420 (96.1%) | 547 (3.9%) |
| Foreign Born, not a Citizen | 5,377 (86.4%) | 850 (13.7%) |
Health Insurance Coverage by Household Income in Leavenworth County
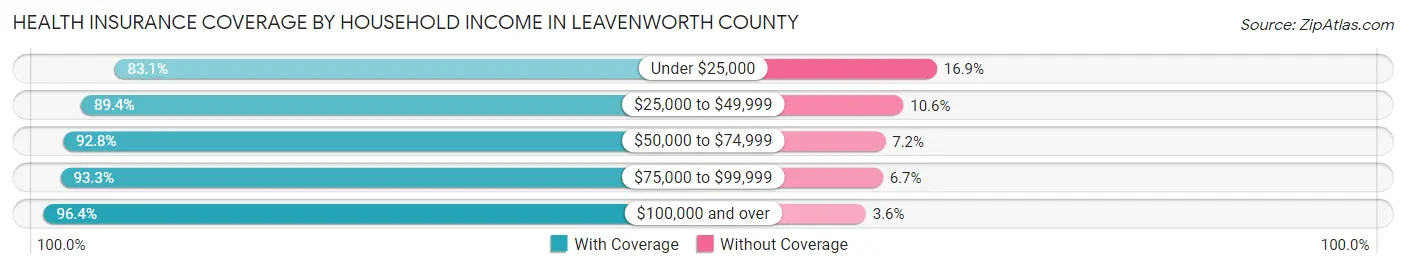
| Household Income | With Coverage | Without Coverage |
| Under $25,000 | 5,297 (83.1%) | 1,074 (16.9%) |
| $25,000 to $49,999 | 8,067 (89.4%) | 954 (10.6%) |
| $50,000 to $74,999 | 9,519 (92.8%) | 740 (7.2%) |
| $75,000 to $99,999 | 11,050 (93.3%) | 797 (6.7%) |
| $100,000 and over | 35,257 (96.4%) | 1,300 (3.6%) |
Public vs Private Health Insurance Coverage by Age in Leavenworth County
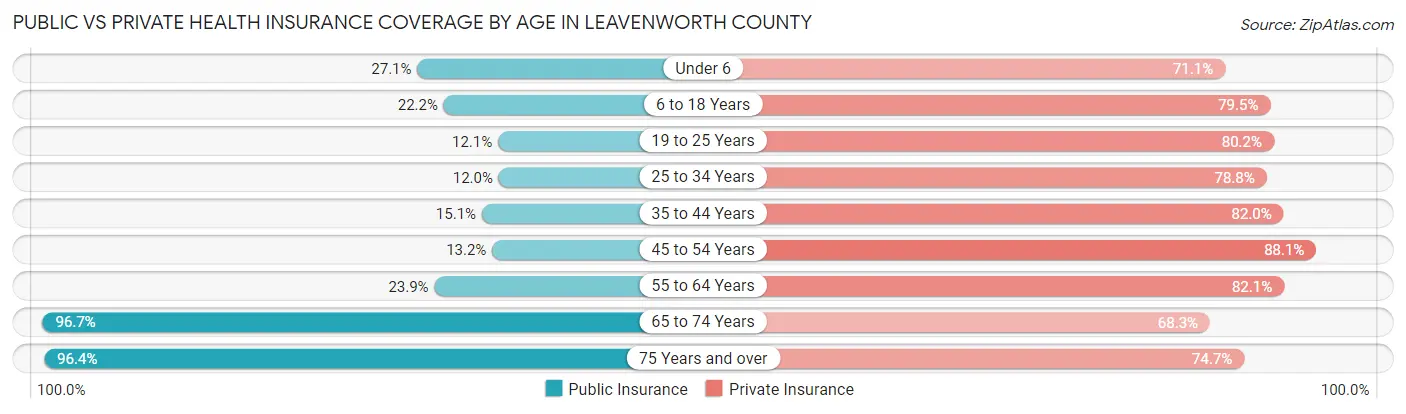
| Age Bracket | Public Insurance | Private Insurance |
| Under 6 | 1,687 (27.1%) | 4,428 (71.1%) |
| 6 to 18 Years | 3,099 (22.2%) | 11,107 (79.5%) |
| 19 to 25 Years | 755 (12.1%) | 4,993 (80.2%) |
| 25 to 34 Years | 902 (12.0%) | 5,935 (78.8%) |
| 35 to 44 Years | 1,483 (15.1%) | 8,045 (82.0%) |
| 45 to 54 Years | 1,205 (13.2%) | 8,034 (88.0%) |
| 55 to 64 Years | 2,396 (23.9%) | 8,218 (82.1%) |
| 65 to 74 Years | 7,165 (96.7%) | 5,063 (68.3%) |
| 75 Years and over | 4,446 (96.4%) | 3,445 (74.7%) |
| Total | 23,138 (30.9%) | 59,268 (79.1%) |
Disability Status by Sex by Age in Leavenworth County
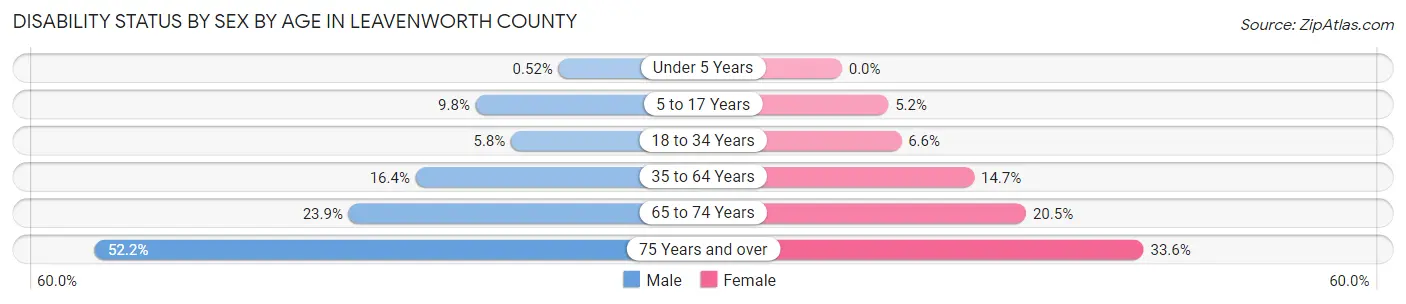
| Age Bracket | Male | Female |
| Under 5 Years | 14 (0.5%) | 0 (0.0%) |
| 5 to 17 Years | 717 (9.8%) | 359 (5.2%) |
| 18 to 34 Years | 431 (5.8%) | 474 (6.6%) |
| 35 to 64 Years | 2,329 (16.4%) | 2,178 (14.7%) |
| 65 to 74 Years | 838 (23.9%) | 801 (20.5%) |
| 75 Years and over | 1,000 (52.2%) | 906 (33.6%) |
Disability Class by Sex by Age in Leavenworth County
Disability Class: Hearing Difficulty
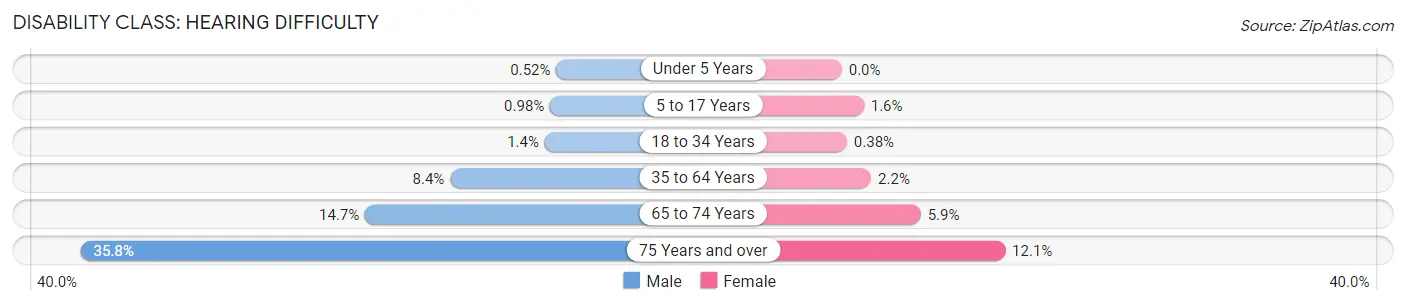
| Age Bracket | Male | Female |
| Under 5 Years | 14 (0.5%) | 0 (0.0%) |
| 5 to 17 Years | 72 (1.0%) | 113 (1.6%) |
| 18 to 34 Years | 102 (1.4%) | 27 (0.4%) |
| 35 to 64 Years | 1,190 (8.4%) | 322 (2.2%) |
| 65 to 74 Years | 516 (14.7%) | 229 (5.9%) |
| 75 Years and over | 687 (35.8%) | 327 (12.1%) |
Disability Class: Vision Difficulty
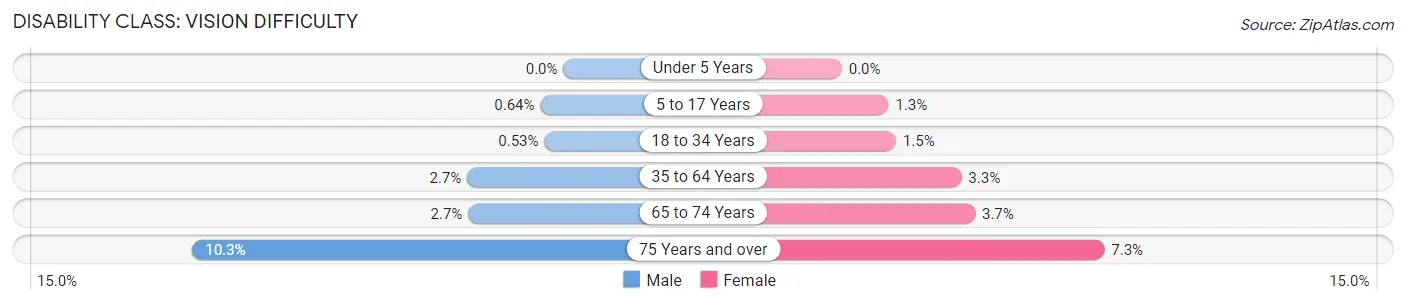
| Age Bracket | Male | Female |
| Under 5 Years | 0 (0.0%) | 0 (0.0%) |
| 5 to 17 Years | 47 (0.6%) | 90 (1.3%) |
| 18 to 34 Years | 39 (0.5%) | 108 (1.5%) |
| 35 to 64 Years | 379 (2.7%) | 492 (3.3%) |
| 65 to 74 Years | 93 (2.6%) | 145 (3.7%) |
| 75 Years and over | 198 (10.3%) | 197 (7.3%) |
Disability Class: Cognitive Difficulty
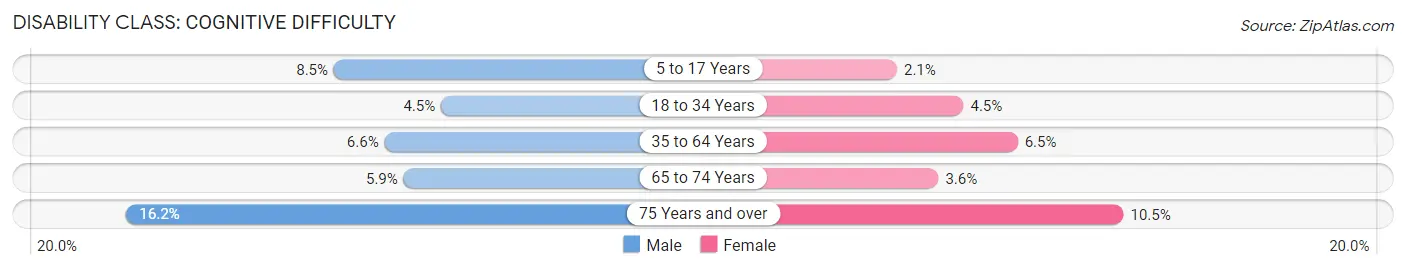
| Age Bracket | Male | Female |
| 5 to 17 Years | 626 (8.5%) | 142 (2.1%) |
| 18 to 34 Years | 336 (4.5%) | 324 (4.5%) |
| 35 to 64 Years | 940 (6.6%) | 965 (6.5%) |
| 65 to 74 Years | 208 (5.9%) | 140 (3.6%) |
| 75 Years and over | 311 (16.2%) | 282 (10.5%) |
Disability Class: Ambulatory Difficulty
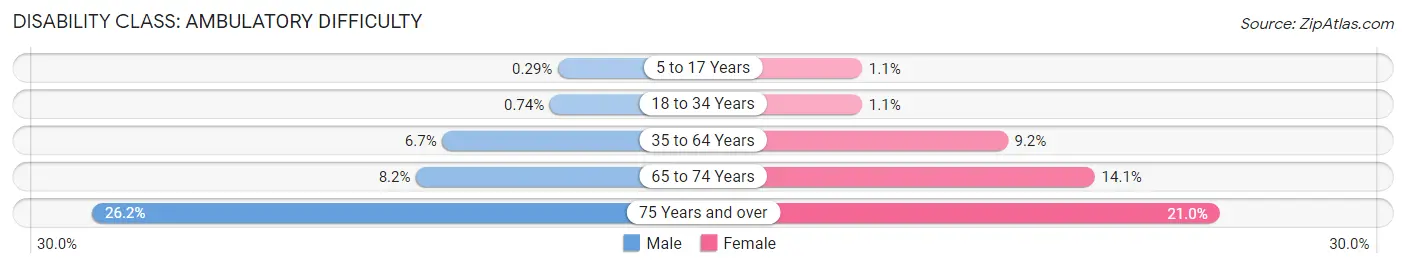
| Age Bracket | Male | Female |
| 5 to 17 Years | 21 (0.3%) | 78 (1.1%) |
| 18 to 34 Years | 55 (0.7%) | 80 (1.1%) |
| 35 to 64 Years | 953 (6.7%) | 1,364 (9.2%) |
| 65 to 74 Years | 287 (8.2%) | 550 (14.1%) |
| 75 Years and over | 503 (26.2%) | 567 (21.0%) |
Disability Class: Self-Care Difficulty
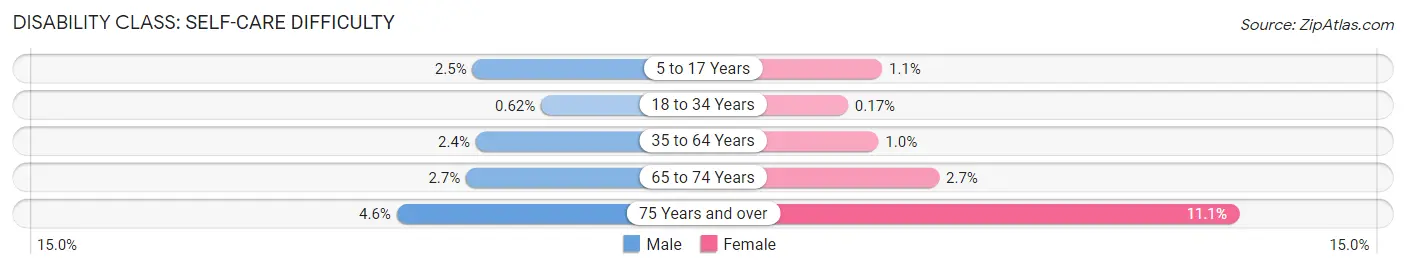
| Age Bracket | Male | Female |
| 5 to 17 Years | 186 (2.5%) | 78 (1.1%) |
| 18 to 34 Years | 46 (0.6%) | 12 (0.2%) |
| 35 to 64 Years | 345 (2.4%) | 151 (1.0%) |
| 65 to 74 Years | 95 (2.7%) | 106 (2.7%) |
| 75 Years and over | 89 (4.6%) | 298 (11.1%) |
Technology Access in Leavenworth County
Computing Device Access in Leavenworth County
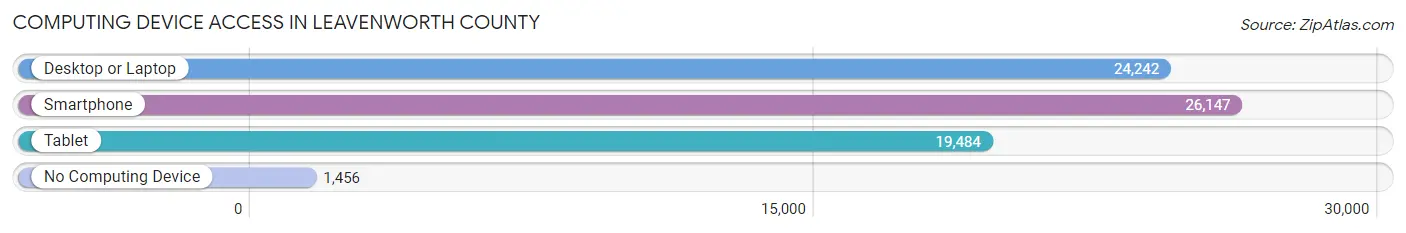
| Device Type | # Households | % Households |
| Desktop or Laptop | 24,242 | 83.0% |
| Smartphone | 26,147 | 89.5% |
| Tablet | 19,484 | 66.7% |
| No Computing Device | 1,456 | 5.0% |
| Total | 29,226 | 100.0% |
Internet Access in Leavenworth County
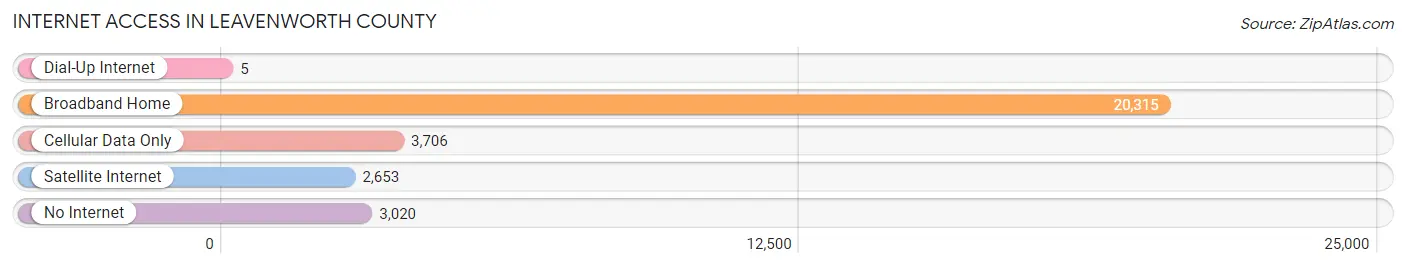
| Internet Type | # Households | % Households |
| Dial-Up Internet | 5 | 0.0% |
| Broadband Home | 20,315 | 69.5% |
| Cellular Data Only | 3,706 | 12.7% |
| Satellite Internet | 2,653 | 9.1% |
| No Internet | 3,020 | 10.3% |
| Total | 29,226 | 100.0% |
Leavenworth County Summary
Leavenworth County, Kansas is located in the northeastern corner of the state, and is bordered by Wyandotte County to the north, Johnson County to the east, Douglas County to the south, and Atchison County to the west. The county seat is Leavenworth, and the county is part of the Kansas City metropolitan area. As of the 2010 census, the population of Leavenworth County was 76,227.
History
Leavenworth County was established in 1855, and was named after Henry Leavenworth, a general in the War of 1812. The county was originally part of the Shawnee Indian Reservation, and was opened to settlement in 1854. The first settlers arrived in 1855, and the county was officially organized in 1856.
Leavenworth County was an important center of the abolitionist movement in the years leading up to the Civil War. The county was home to several prominent abolitionists, including John Brown, who was hanged in 1859 for his role in the raid on Harpers Ferry.
During the Civil War, Leavenworth County was the site of several battles, including the Battle of the Blue, which was fought in 1862. After the war, the county experienced a period of rapid growth, as the railroads and other industries began to develop in the area.
Geography
Leavenworth County covers an area of 545 square miles, and is located in the northeastern corner of Kansas. The county is bordered by Wyandotte County to the north, Johnson County to the east, Douglas County to the south, and Atchison County to the west. The county seat is Leavenworth, and the county is part of the Kansas City metropolitan area.
The terrain of Leavenworth County is mostly flat, with some rolling hills in the western part of the county. The county is drained by the Missouri River, which forms the northern border of the county. The county also contains several small lakes and ponds, as well as several creeks and streams.
Economy
Leavenworth County has a diverse economy, with a mix of manufacturing, agriculture, and services. The county is home to several large employers, including the Fort Leavenworth military base, the Lansing Correctional Facility, and the Leavenworth Federal Penitentiary.
Agriculture is an important part of the county's economy, with corn, soybeans, and wheat being the primary crops. Livestock production is also important, with cattle, hogs, and poultry being the primary animals raised.
Manufacturing is also an important part of the county's economy, with several large companies located in the area. The county is home to several automotive parts manufacturers, as well as several food processing plants.
Demographics
As of the 2010 census, the population of Leavenworth County was 76,227. The population is fairly evenly split between men and women, with 49.3% male and 50.7% female. The median age of the population is 37.7 years.
The racial makeup of the county is 87.3% White, 8.2% African American, 0.7% Native American, 0.7% Asian, 0.1% Pacific Islander, 1.2% from other races, and 2.0% from two or more races. The Hispanic or Latino population of the county is 4.2%.
The median household income in Leavenworth County is $50,945, and the median family income is $60,945. The per capita income is $25,945. The poverty rate in the county is 11.2%.
Common Questions
What is the Total Population of Leavenworth County?
Total Population of Leavenworth County is 82,050.
What is the Total Male Population of Leavenworth County?
Total Male Population of Leavenworth County is 43,746.
What is the Total Female Population of Leavenworth County?
Total Female Population of Leavenworth County is 38,304.
What is the Ratio of Males per 100 Females in Leavenworth County?
There are 114.21 Males per 100 Females in Leavenworth County.
What is the Ratio of Females per 100 Males in Leavenworth County?
There are 87.56 Females per 100 Males in Leavenworth County.
What is the Median Population Age in Leavenworth County?
Median Population Age in Leavenworth County is 38.0 Years.
What is the Average Family Size in Leavenworth County
Average Family Size in Leavenworth County is 3.1 People.
What is the Average Household Size in Leavenworth County
Average Household Size in Leavenworth County is 2.6 People.
What is Per Capita Income in Leavenworth County?
Per Capita income in Leavenworth County is $37,482.
What is the Median Family Income in Leavenworth County?
Median Family Income in Leavenworth County is $104,211.
What is the Median Household income in Leavenworth County?
Median Household Income in Leavenworth County is $84,307.
What is Income or Wage Gap in Leavenworth County?
Income or Wage Gap in Leavenworth County is 26.0%.
Women in Leavenworth County earn 74.0 cents for every dollar earned by a man.
What is Family Income Deficit in Leavenworth County?
Family Income Deficit in Leavenworth County is $11,219.
Families that are below poverty line in Leavenworth County earn $11,219 less on average than the poverty threshold level.
What is Inequality or Gini Index in Leavenworth County?
Inequality or Gini Index in Leavenworth County is 0.42.
How Large is the Labor Force in Leavenworth County?
There are 38,782 People in the Labor Forcein in Leavenworth County.
What is the Percentage of People in the Labor Force in Leavenworth County?
59.9% of People are in the Labor Force in Leavenworth County.
What is the Unemployment Rate in Leavenworth County?
Unemployment Rate in Leavenworth County is 4.5%.