Kiowa County, KS
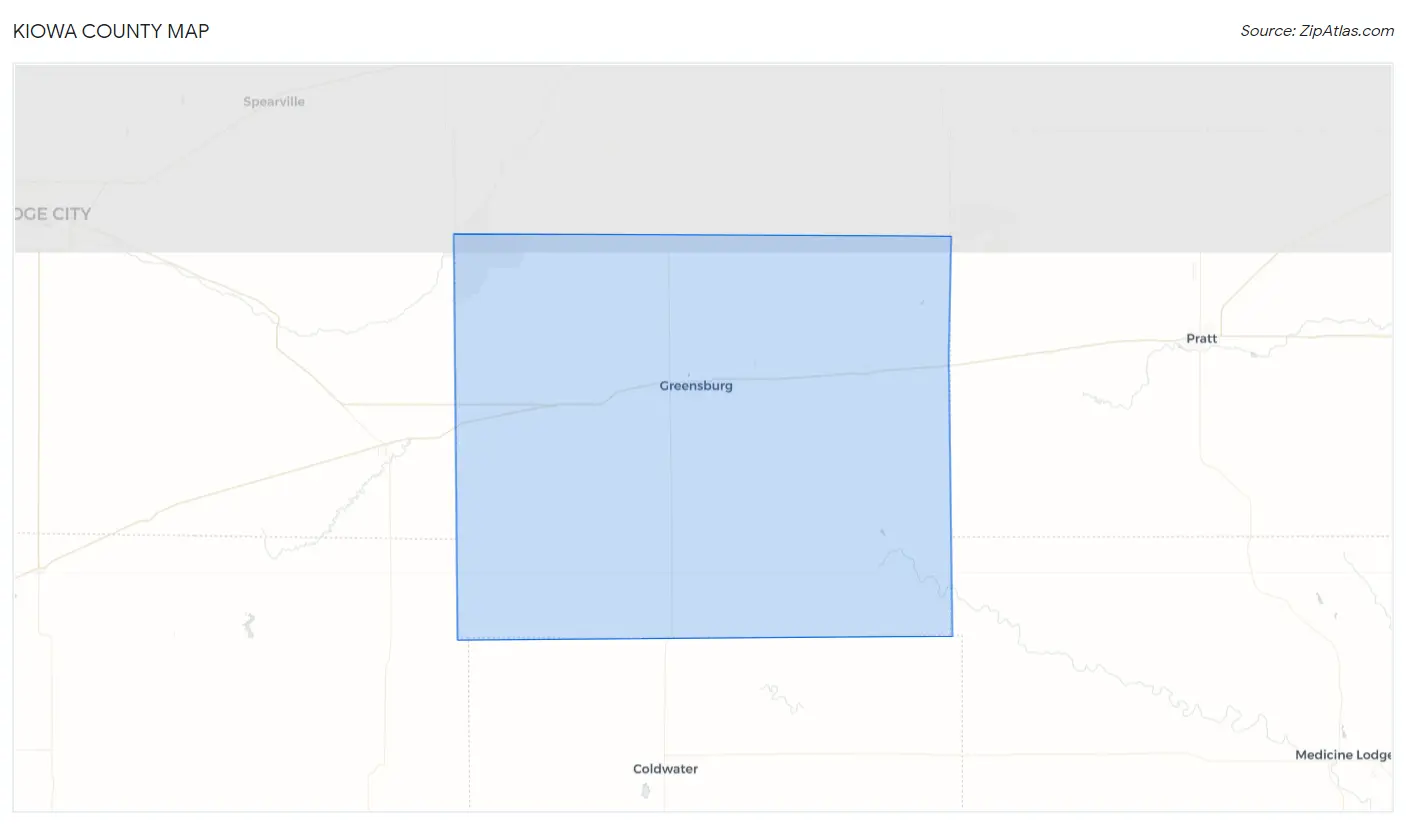
Kiowa County Map
Kiowa County Overview
2,445
TOTAL POPULATION
1,150
MALE POPULATION
1,295
FEMALE POPULATION
88.80
MALES / 100 FEMALES
112.61
FEMALES / 100 MALES
41.5
MEDIAN AGE
3.1
AVG FAMILY SIZE
2.4
AVG HOUSEHOLD SIZE
$35,199
PER CAPITA INCOME
$76,681
AVG FAMILY INCOME
$70,347
AVG HOUSEHOLD INCOME
57.8%
WAGE / INCOME GAP [ % ]
42.2¢/ $1
WAGE / INCOME GAP [ $ ]
0.43
INEQUALITY / GINI INDEX
1,294
LABOR FORCE [ PEOPLE ]
66.1%
PERCENT IN LABOR FORCE
3.6%
UNEMPLOYMENT RATE
Kiowa County Area Codes
Race in Kiowa County
The most populous races in Kiowa County are White / Caucasian (2,230 | 91.2%), Hispanic or Latino (137 | 5.6%), and Two or more Races (94 | 3.8%).
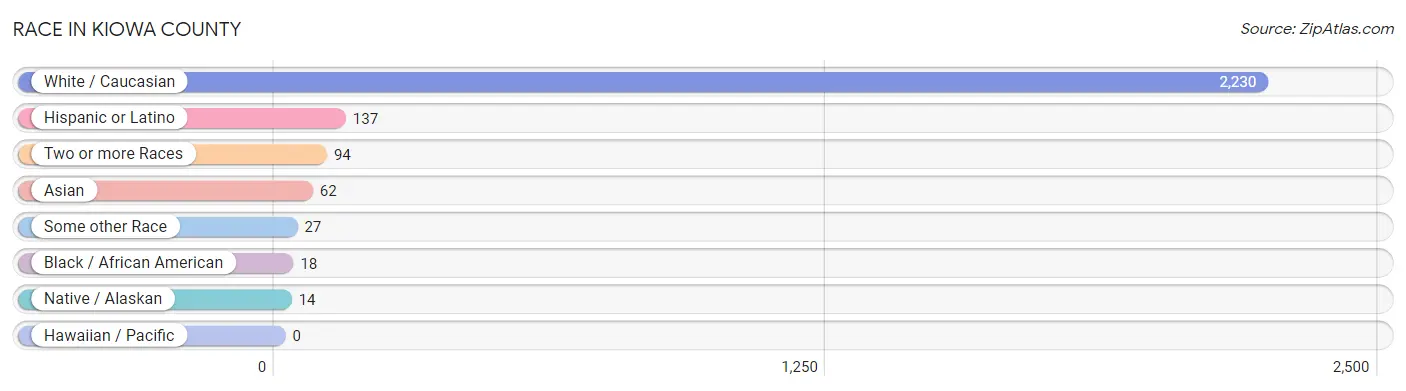
| Race | # Population | % Population |
| Asian | 62 | 2.5% |
| Black / African American | 18 | 0.7% |
| Hawaiian / Pacific | 0 | 0.0% |
| Hispanic or Latino | 137 | 5.6% |
| Native / Alaskan | 14 | 0.6% |
| White / Caucasian | 2,230 | 91.2% |
| Two or more Races | 94 | 3.8% |
| Some other Race | 27 | 1.1% |
| Total | 2,445 | 100.0% |
Ancestry in Kiowa County
The most populous ancestries reported in Kiowa County are German (695 | 28.4%), English (325 | 13.3%), American (255 | 10.4%), Irish (241 | 9.9%), and Swiss (90 | 3.7%), together accounting for 65.7% of all Kiowa County residents.
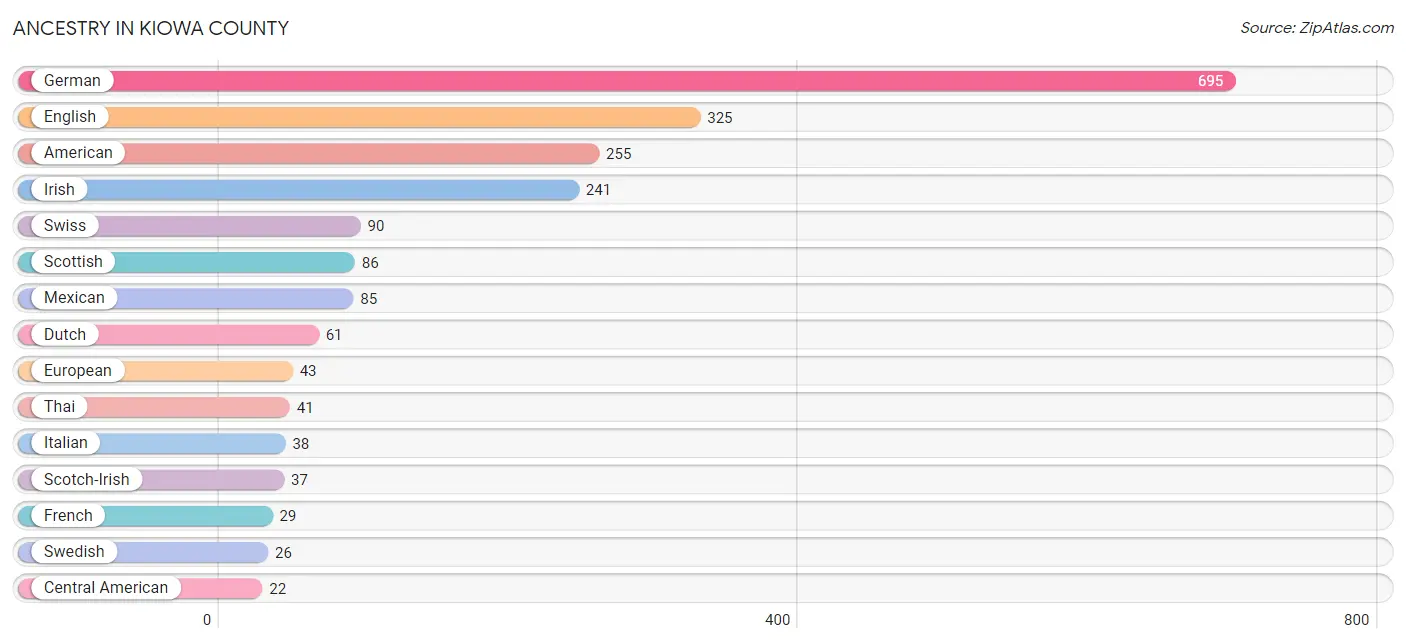
| Ancestry | # Population | % Population |
| American | 255 | 10.4% |
| Austrian | 3 | 0.1% |
| Bhutanese | 2 | 0.1% |
| Burmese | 17 | 0.7% |
| Cajun | 1 | 0.0% |
| Celtic | 1 | 0.0% |
| Central American | 22 | 0.9% |
| Cherokee | 4 | 0.2% |
| Choctaw | 1 | 0.0% |
| Croatian | 2 | 0.1% |
| Czech | 18 | 0.7% |
| Danish | 1 | 0.0% |
| Delaware | 9 | 0.4% |
| Dutch | 61 | 2.5% |
| Eastern European | 2 | 0.1% |
| English | 325 | 13.3% |
| European | 43 | 1.8% |
| French | 29 | 1.2% |
| French Canadian | 9 | 0.4% |
| German | 695 | 28.4% |
| Guatemalan | 16 | 0.6% |
| Hungarian | 2 | 0.1% |
| Indian (Asian) | 1 | 0.0% |
| Irish | 241 | 9.9% |
| Italian | 38 | 1.5% |
| Jamaican | 1 | 0.0% |
| Korean | 1 | 0.0% |
| Lithuanian | 10 | 0.4% |
| Mexican | 85 | 3.5% |
| Native Hawaiian | 1 | 0.0% |
| Norwegian | 2 | 0.1% |
| Pennsylvania German | 11 | 0.4% |
| Polish | 5 | 0.2% |
| Portuguese | 2 | 0.1% |
| Puerto Rican | 4 | 0.2% |
| Russian | 15 | 0.6% |
| Salvadoran | 6 | 0.3% |
| Scandinavian | 9 | 0.4% |
| Scotch-Irish | 37 | 1.5% |
| Scottish | 86 | 3.5% |
| Spaniard | 9 | 0.4% |
| Swedish | 26 | 1.1% |
| Swiss | 90 | 3.7% |
| Thai | 41 | 1.7% |
| Ukrainian | 2 | 0.1% |
| Welsh | 14 | 0.6% | View All 46 Rows |
Immigrants in Kiowa County
The most numerous immigrant groups reported in Kiowa County came from Asia (61 | 2.5%), India (39 | 1.6%), South Central Asia (39 | 1.6%), Latin America (36 | 1.5%), and Central America (35 | 1.4%), together accounting for 8.6% of all Kiowa County residents.
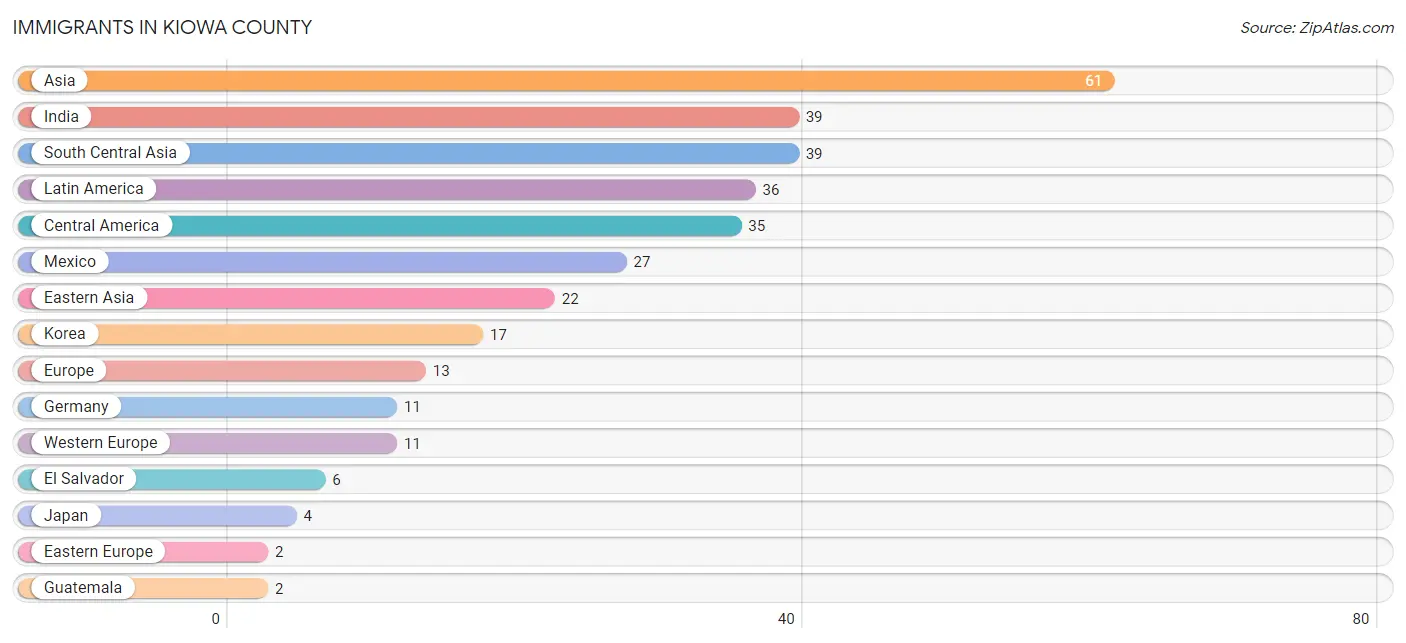
| Immigration Origin | # Population | % Population |
| Africa | 1 | 0.0% |
| Asia | 61 | 2.5% |
| Caribbean | 1 | 0.0% |
| Central America | 35 | 1.4% |
| China | 1 | 0.0% |
| Eastern Africa | 1 | 0.0% |
| Eastern Asia | 22 | 0.9% |
| Eastern Europe | 2 | 0.1% |
| El Salvador | 6 | 0.3% |
| Europe | 13 | 0.5% |
| Germany | 11 | 0.4% |
| Guatemala | 2 | 0.1% |
| Hong Kong | 1 | 0.0% |
| India | 39 | 1.6% |
| Jamaica | 1 | 0.0% |
| Japan | 4 | 0.2% |
| Kenya | 1 | 0.0% |
| Korea | 17 | 0.7% |
| Latin America | 36 | 1.5% |
| Mexico | 27 | 1.1% |
| South Central Asia | 39 | 1.6% |
| Ukraine | 2 | 0.1% |
| Western Europe | 11 | 0.4% | View All 23 Rows |
Sex and Age in Kiowa County
Sex and Age in Kiowa County
The most populous age groups in Kiowa County are 55 to 59 Years (115 | 10.0%) for men and 15 to 19 Years (132 | 10.2%) for women.

| Age Bracket | Male | Female |
| Under 5 Years | 68 (5.9%) | 72 (5.6%) |
| 5 to 9 Years | 106 (9.2%) | 76 (5.9%) |
| 10 to 14 Years | 58 (5.0%) | 78 (6.0%) |
| 15 to 19 Years | 54 (4.7%) | 132 (10.2%) |
| 20 to 24 Years | 73 (6.4%) | 62 (4.8%) |
| 25 to 29 Years | 71 (6.2%) | 127 (9.8%) |
| 30 to 34 Years | 48 (4.2%) | 59 (4.6%) |
| 35 to 39 Years | 40 (3.5%) | 47 (3.6%) |
| 40 to 44 Years | 77 (6.7%) | 70 (5.4%) |
| 45 to 49 Years | 59 (5.1%) | 59 (4.6%) |
| 50 to 54 Years | 63 (5.5%) | 57 (4.4%) |
| 55 to 59 Years | 115 (10.0%) | 89 (6.9%) |
| 60 to 64 Years | 55 (4.8%) | 76 (5.9%) |
| 65 to 69 Years | 71 (6.2%) | 86 (6.6%) |
| 70 to 74 Years | 100 (8.7%) | 59 (4.6%) |
| 75 to 79 Years | 26 (2.3%) | 28 (2.2%) |
| 80 to 84 Years | 24 (2.1%) | 46 (3.5%) |
| 85 Years and over | 42 (3.6%) | 72 (5.6%) |
| Total | 1,150 (100.0%) | 1,295 (100.0%) |
Families and Households in Kiowa County
Median Family Size in Kiowa County
The median family size in Kiowa County is 3.06 persons per family, with married-couple families (538 | 90.4%) accounting for the largest median family size of 3.09 persons per family. On the other hand, single female/mother families (36 | 6.0%) represent the smallest median family size with 2.67 persons per family.
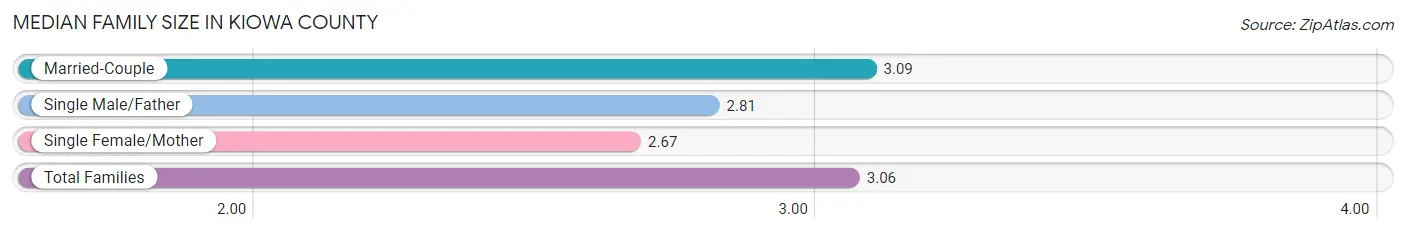
| Family Type | # Families | Family Size |
| Married-Couple | 538 (90.4%) | 3.09 |
| Single Male/Father | 21 (3.5%) | 2.81 |
| Single Female/Mother | 36 (6.0%) | 2.67 |
| Total Families | 595 (100.0%) | 3.06 |
Median Household Size in Kiowa County
The median household size in Kiowa County is 2.40 persons per household, with married-couple households (538 | 58.0%) accounting for the largest median household size of 3.1 persons per household. non-family households (332 | 35.8%) represent the smallest median household size with 1.22 persons per household.
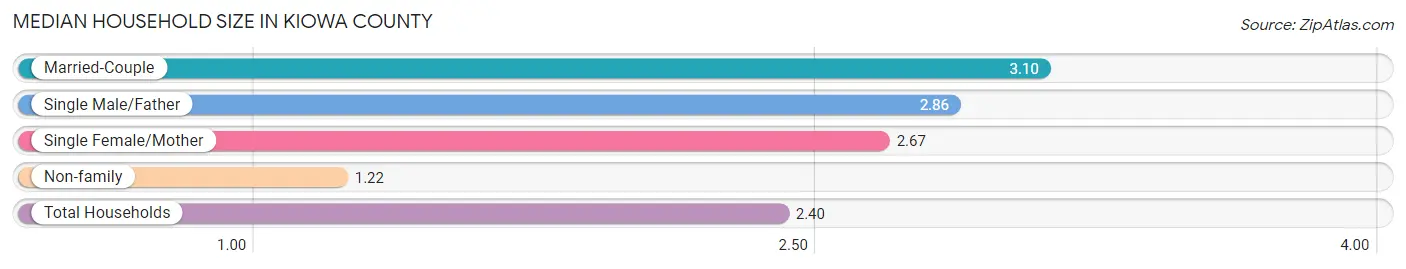
| Household Type | # Households | Household Size |
| Married-Couple | 538 (58.0%) | 3.10 |
| Single Male/Father | 21 (2.3%) | 2.86 |
| Single Female/Mother | 36 (3.9%) | 2.67 |
| Non-family | 332 (35.8%) | 1.22 |
| Total Households | 927 (100.0%) | 2.40 |
Household Size by Marriage Status in Kiowa County
Out of a total of 927 households in Kiowa County, 595 (64.2%) are family households, while 332 (35.8%) are nonfamily households. The most numerous type of family households are 2-person households, comprising 379, and the most common type of nonfamily households are 1-person households, comprising 309.
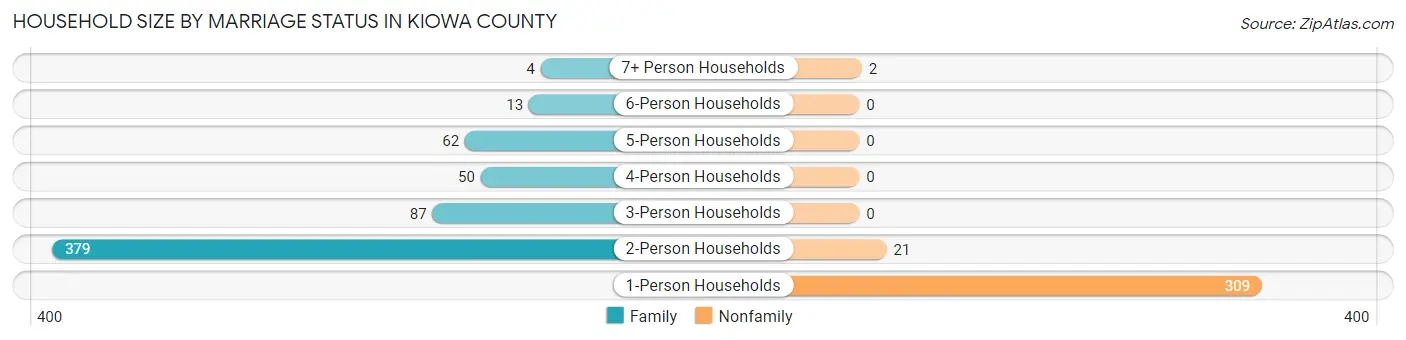
| Household Size | Family Households | Nonfamily Households |
| 1-Person Households | - | 309 (33.3%) |
| 2-Person Households | 379 (40.9%) | 21 (2.3%) |
| 3-Person Households | 87 (9.4%) | 0 (0.0%) |
| 4-Person Households | 50 (5.4%) | 0 (0.0%) |
| 5-Person Households | 62 (6.7%) | 0 (0.0%) |
| 6-Person Households | 13 (1.4%) | 0 (0.0%) |
| 7+ Person Households | 4 (0.4%) | 2 (0.2%) |
| Total | 595 (64.2%) | 332 (35.8%) |
Female Fertility in Kiowa County
Fertility by Age in Kiowa County
Average fertility rate in Kiowa County is 23.0 births per 1,000 women. Women in the age bracket of 35 to 50 years have the highest fertility rate with 33.0 births per 1,000 women. Women in the age bracket of 20 to 34 years acount for 53.8% of all women with births.

| Age Bracket | Women with Births | Births / 1,000 Women |
| 15 to 19 years | 0 (0.0%) | 0.0 |
| 20 to 34 years | 7 (53.8%) | 28.0 |
| 35 to 50 years | 6 (46.2%) | 33.0 |
| Total | 13 (100.0%) | 23.0 |
Fertility by Age by Marriage Status in Kiowa County
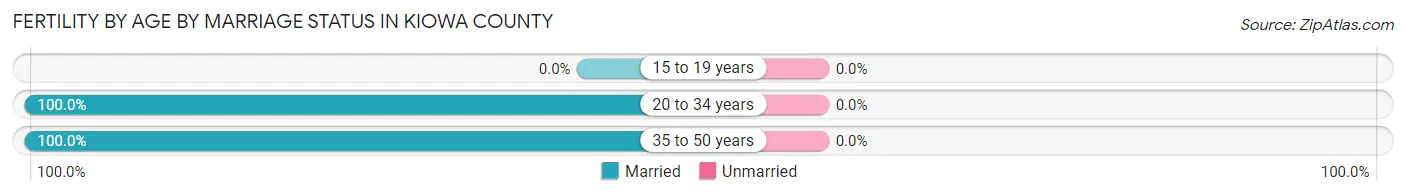
| Age Bracket | Married | Unmarried |
| 15 to 19 years | 0 (0.0%) | 0 (0.0%) |
| 20 to 34 years | 7 (100.0%) | 0 (0.0%) |
| 35 to 50 years | 6 (100.0%) | 0 (0.0%) |
| Total | 13 (100.0%) | 0 (0.0%) |
Fertility by Education in Kiowa County
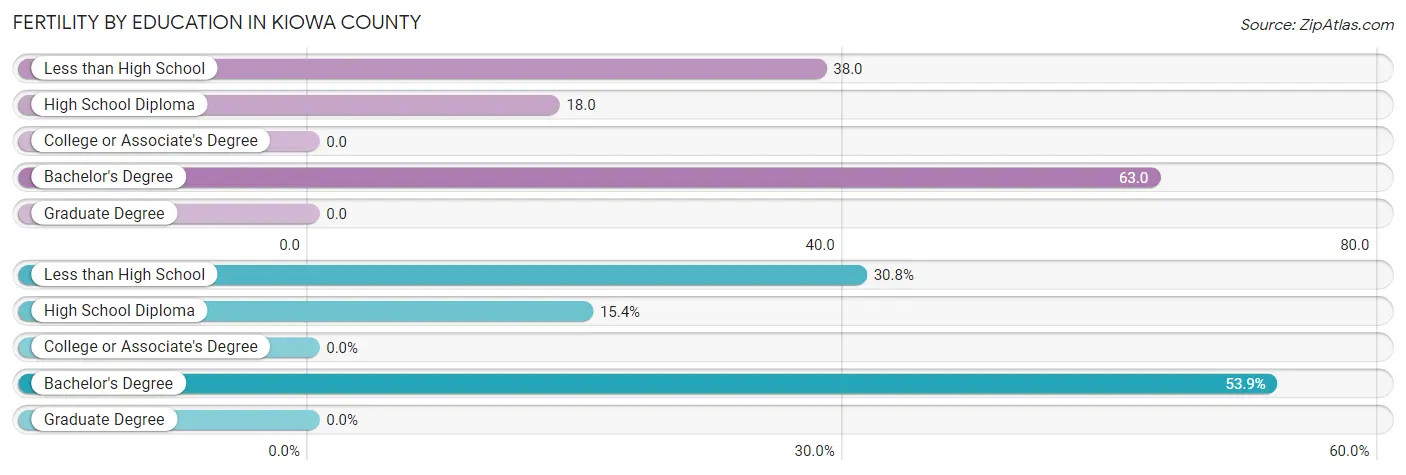
| Educational Attainment | Women with Births | Births / 1,000 Women |
| Less than High School | 4 (30.8%) | 38.0 |
| High School Diploma | 2 (15.4%) | 18.0 |
| College or Associate's Degree | 0 (0.0%) | 0.0 |
| Bachelor's Degree | 7 (53.8%) | 63.0 |
| Graduate Degree | 0 (0.0%) | 0.0 |
| Total | 13 (100.0%) | 23.0 |
Fertility by Education by Marriage Status in Kiowa County
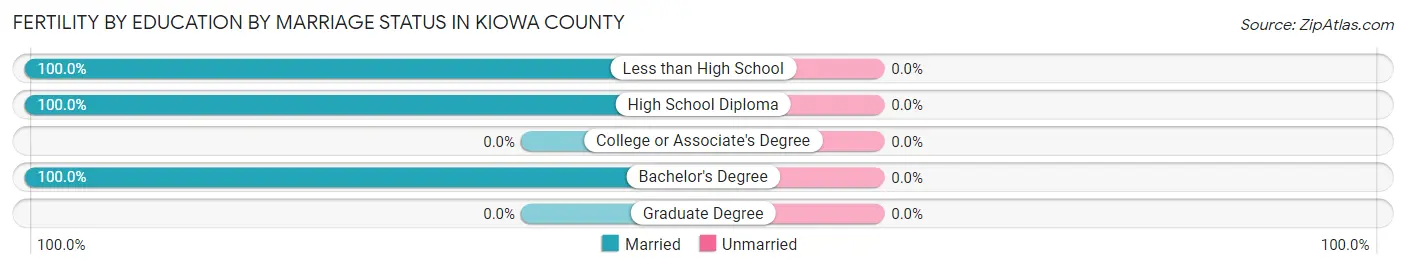
| Educational Attainment | Married | Unmarried |
| Less than High School | 4 (100.0%) | 0 (0.0%) |
| High School Diploma | 2 (100.0%) | 0 (0.0%) |
| College or Associate's Degree | 0 (0.0%) | 0 (0.0%) |
| Bachelor's Degree | 7 (100.0%) | 0 (0.0%) |
| Graduate Degree | 0 (0.0%) | 0 (0.0%) |
| Total | 13 (100.0%) | 0 (0.0%) |
Income in Kiowa County
Income Overview in Kiowa County
Per Capita Income in Kiowa County is $35,199, while median incomes of families and households are $76,681 and $70,347 respectively.
| Characteristic | Number | Measure |
| Per Capita Income | 2,445 | $35,199 |
| Median Family Income | 595 | $76,681 |
| Mean Family Income | 595 | $107,381 |
| Median Household Income | 927 | $70,347 |
| Mean Household Income | 927 | $89,071 |
| Income Deficit | 595 | $0 |
| Wage / Income Gap (%) | 2,445 | 57.82% |
| Wage / Income Gap ($) | 2,445 | 42.18¢ per $1 |
| Gini / Inequality Index | 2,445 | 0.43 |
Earnings by Sex in Kiowa County
Average Earnings in Kiowa County are $34,167, $46,809 for men and $19,743 for women, a difference of 57.8%.
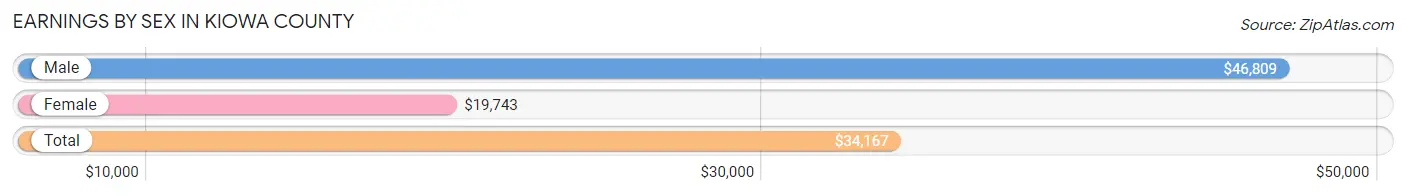
| Sex | Number | Average Earnings |
| Male | 683 (49.6%) | $46,809 |
| Female | 693 (50.4%) | $19,743 |
| Total | 1,376 (100.0%) | $34,167 |
Earnings by Sex by Income Bracket in Kiowa County
The most common earnings brackets in Kiowa County are $10,000 to $12,499 for men (84 | 12.3%) and $5,000 to $7,499 for women (86 | 12.4%).

| Income | Male | Female |
| $2,499 or less | 13 (1.9%) | 81 (11.7%) |
| $2,500 to $4,999 | 13 (1.9%) | 40 (5.8%) |
| $5,000 to $7,499 | 23 (3.4%) | 86 (12.4%) |
| $7,500 to $9,999 | 5 (0.7%) | 12 (1.7%) |
| $10,000 to $12,499 | 84 (12.3%) | 32 (4.6%) |
| $12,500 to $14,999 | 5 (0.7%) | 29 (4.2%) |
| $15,000 to $17,499 | 6 (0.9%) | 36 (5.2%) |
| $17,500 to $19,999 | 19 (2.8%) | 34 (4.9%) |
| $20,000 to $22,499 | 8 (1.2%) | 30 (4.3%) |
| $22,500 to $24,999 | 18 (2.6%) | 17 (2.5%) |
| $25,000 to $29,999 | 21 (3.1%) | 39 (5.6%) |
| $30,000 to $34,999 | 21 (3.1%) | 22 (3.2%) |
| $35,000 to $39,999 | 39 (5.7%) | 35 (5.1%) |
| $40,000 to $44,999 | 39 (5.7%) | 42 (6.1%) |
| $45,000 to $49,999 | 57 (8.4%) | 54 (7.8%) |
| $50,000 to $54,999 | 39 (5.7%) | 27 (3.9%) |
| $55,000 to $64,999 | 73 (10.7%) | 25 (3.6%) |
| $65,000 to $74,999 | 46 (6.7%) | 15 (2.2%) |
| $75,000 to $99,999 | 81 (11.9%) | 24 (3.5%) |
| $100,000+ | 73 (10.7%) | 13 (1.9%) |
| Total | 683 (100.0%) | 693 (100.0%) |
Earnings by Sex by Educational Attainment in Kiowa County
Average earnings in Kiowa County are $51,307 for men and $27,500 for women, a difference of 46.4%. Men with an educational attainment of graduate degree enjoy the highest average annual earnings of $65,000, while those with high school diploma education earn the least with $46,161. Women with an educational attainment of graduate degree earn the most with the average annual earnings of $49,135, while those with less than high school education have the smallest earnings of $13,750.
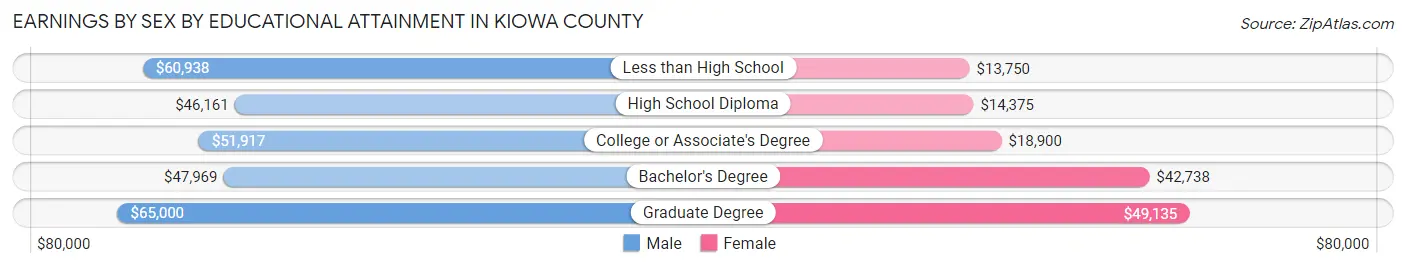
| Educational Attainment | Male Income | Female Income |
| Less than High School | $60,938 | $13,750 |
| High School Diploma | $46,161 | $14,375 |
| College or Associate's Degree | $51,917 | $18,900 |
| Bachelor's Degree | $47,969 | $42,738 |
| Graduate Degree | $65,000 | $49,135 |
| Total | $51,307 | $27,500 |
Family Income in Kiowa County
Family Income Brackets in Kiowa County
According to the Kiowa County family income data, there are 184 families falling into the $50,000 to $74,999 income range, which is the most common income bracket and makes up 30.9% of all families. Conversely, the $10,000 to $14,999 income bracket is the least frequent group with only 4 families (0.7%) belonging to this category.
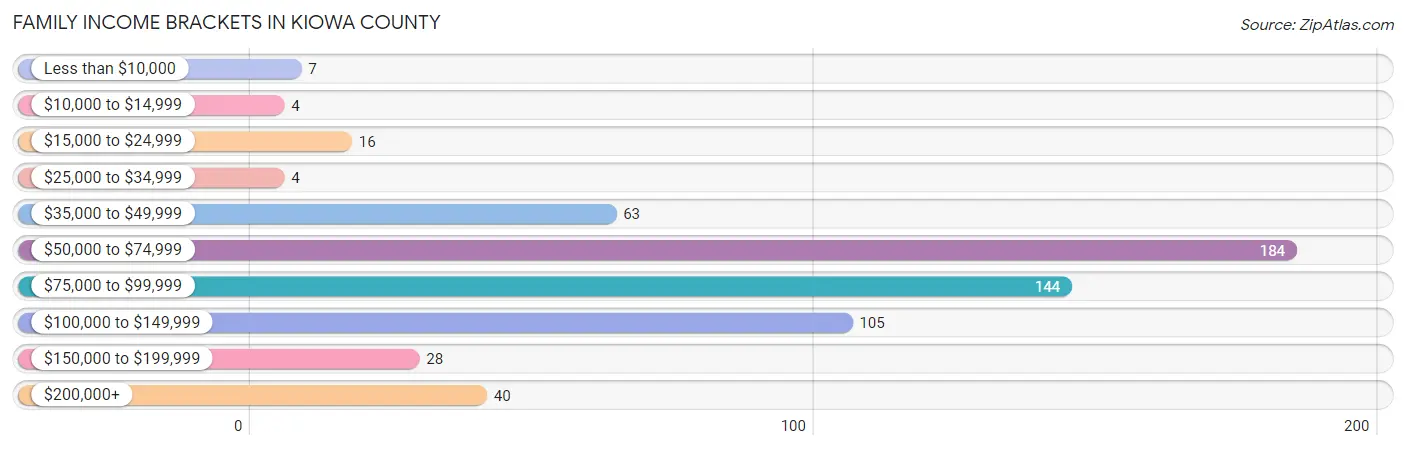
| Income Bracket | # Families | % Families |
| Less than $10,000 | 7 | 1.2% |
| $10,000 to $14,999 | 4 | 0.7% |
| $15,000 to $24,999 | 16 | 2.7% |
| $25,000 to $34,999 | 4 | 0.7% |
| $35,000 to $49,999 | 63 | 10.6% |
| $50,000 to $74,999 | 184 | 30.9% |
| $75,000 to $99,999 | 144 | 24.2% |
| $100,000 to $149,999 | 105 | 17.6% |
| $150,000 to $199,999 | 28 | 4.7% |
| $200,000+ | 40 | 6.7% |
Family Income by Famaliy Size in Kiowa County
4-person families (51 | 8.6%) account for the highest median family income in Kiowa County with $90,313 per family, while 2-person families (380 | 63.9%) have the highest median income of $35,995 per family member.
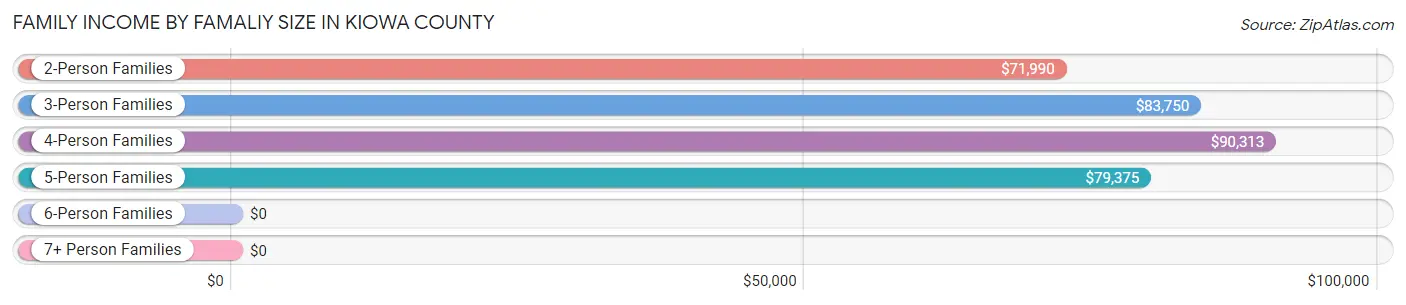
| Income Bracket | # Families | Median Income |
| 2-Person Families | 380 (63.9%) | $71,990 |
| 3-Person Families | 86 (14.4%) | $83,750 |
| 4-Person Families | 51 (8.6%) | $90,313 |
| 5-Person Families | 61 (10.2%) | $79,375 |
| 6-Person Families | 13 (2.2%) | $0 |
| 7+ Person Families | 4 (0.7%) | $0 |
| Total | 595 (100.0%) | $76,681 |
Family Income by Number of Earners in Kiowa County
The median family income in Kiowa County is $76,681, with families comprising 3+ earners (37) having the highest median family income of $131,406, while families with no earners (57) have the lowest median family income of $54,886, accounting for 6.2% and 9.6% of families, respectively.

| Number of Earners | # Families | Median Income |
| No Earners | 57 (9.6%) | $54,886 |
| 1 Earner | 133 (22.4%) | $59,479 |
| 2 Earners | 368 (61.9%) | $81,364 |
| 3+ Earners | 37 (6.2%) | $131,406 |
| Total | 595 (100.0%) | $76,681 |
Household Income in Kiowa County
Household Income Brackets in Kiowa County
With 227 households falling in the category, the $50,000 to $74,999 income range is the most frequent in Kiowa County, accounting for 24.5% of all households. In contrast, only 18 households (1.9%) fall into the less than $10,000 income bracket, making it the least populous group.
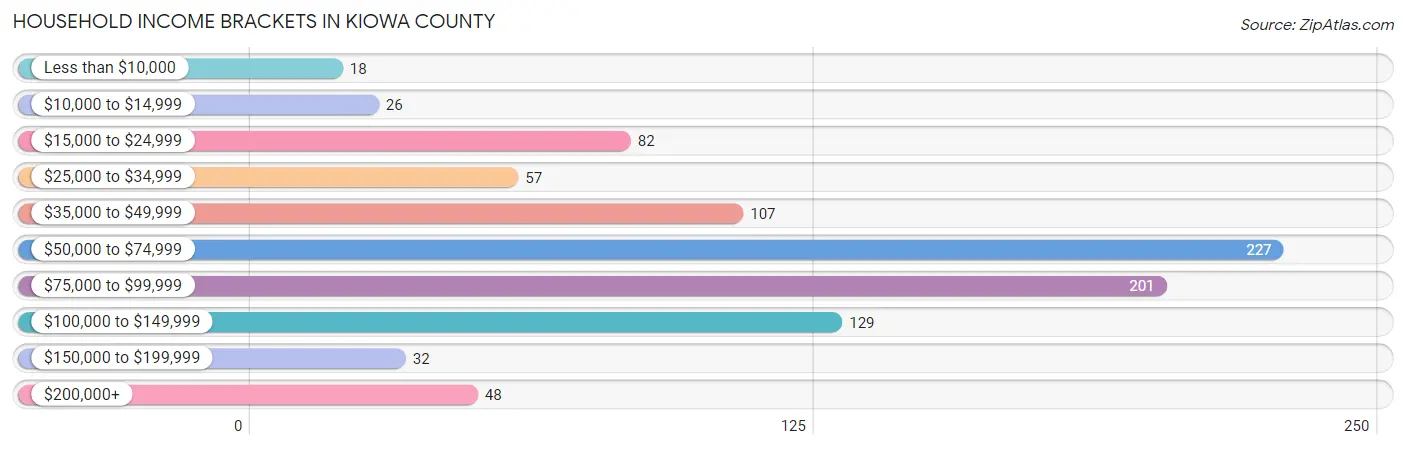
| Income Bracket | # Households | % Households |
| Less than $10,000 | 18 | 1.9% |
| $10,000 to $14,999 | 26 | 2.8% |
| $15,000 to $24,999 | 82 | 8.8% |
| $25,000 to $34,999 | 57 | 6.1% |
| $35,000 to $49,999 | 107 | 11.5% |
| $50,000 to $74,999 | 227 | 24.5% |
| $75,000 to $99,999 | 201 | 21.7% |
| $100,000 to $149,999 | 129 | 13.9% |
| $150,000 to $199,999 | 32 | 3.5% |
| $200,000+ | 48 | 5.2% |
Household Income by Householder Age in Kiowa County
The median household income in Kiowa County is $70,347, with the highest median household income of $79,844 found in the 25 to 44 years age bracket for the primary householder. A total of 263 households (28.4%) fall into this category. Meanwhile, the 15 to 24 years age bracket for the primary householder has the lowest median household income of $0, with 21 households (2.3%) in this group.
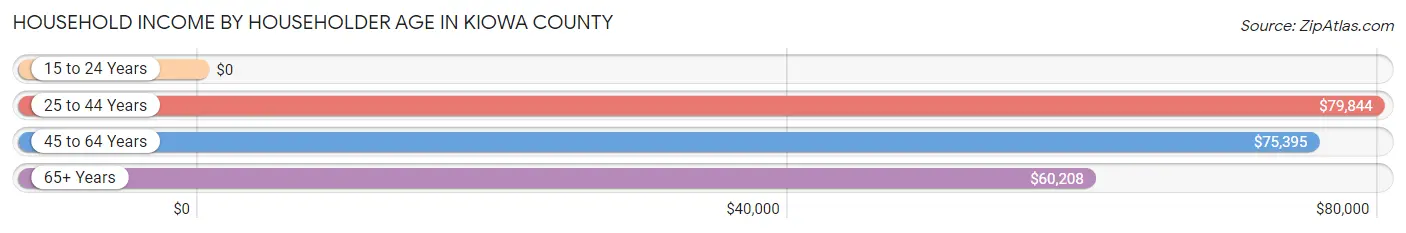
| Income Bracket | # Households | Median Income |
| 15 to 24 Years | 21 (2.3%) | $0 |
| 25 to 44 Years | 263 (28.4%) | $79,844 |
| 45 to 64 Years | 302 (32.6%) | $75,395 |
| 65+ Years | 341 (36.8%) | $60,208 |
| Total | 927 (100.0%) | $70,347 |
Poverty in Kiowa County
Income Below Poverty by Sex and Age in Kiowa County
With 2.4% poverty level for males and 7.7% for females among the residents of Kiowa County, 35 to 44 year old males and 18 to 24 year old females are the most vulnerable to poverty, with 6 males (5.3%) and 28 females (35.0%) in their respective age groups living below the poverty level.
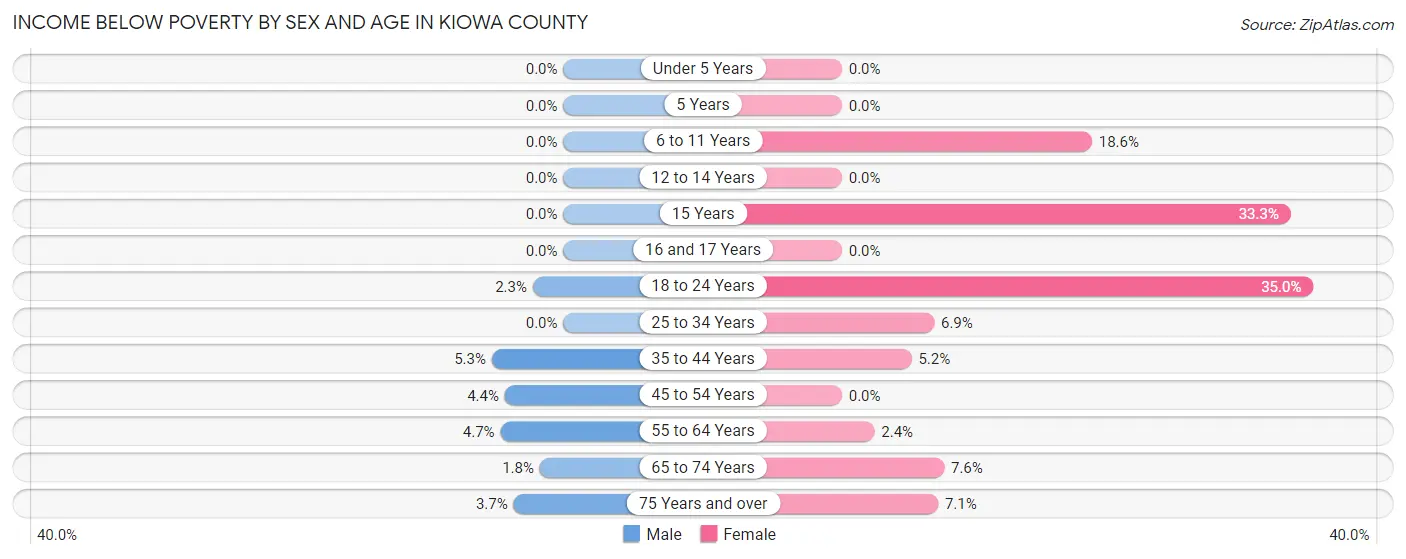
| Age Bracket | Male | Female |
| Under 5 Years | 0 (0.0%) | 0 (0.0%) |
| 5 Years | 0 (0.0%) | 0 (0.0%) |
| 6 to 11 Years | 0 (0.0%) | 18 (18.6%) |
| 12 to 14 Years | 0 (0.0%) | 0 (0.0%) |
| 15 Years | 0 (0.0%) | 5 (33.3%) |
| 16 and 17 Years | 0 (0.0%) | 0 (0.0%) |
| 18 to 24 Years | 1 (2.3%) | 28 (35.0%) |
| 25 to 34 Years | 0 (0.0%) | 10 (6.9%) |
| 35 to 44 Years | 6 (5.3%) | 6 (5.2%) |
| 45 to 54 Years | 5 (4.3%) | 0 (0.0%) |
| 55 to 64 Years | 7 (4.7%) | 4 (2.4%) |
| 65 to 74 Years | 3 (1.8%) | 11 (7.6%) |
| 75 Years and over | 3 (3.7%) | 9 (7.1%) |
| Total | 25 (2.4%) | 91 (7.7%) |
Income Above Poverty by Sex and Age in Kiowa County
According to the poverty statistics in Kiowa County, males aged under 5 years and females aged under 5 years are the age groups that are most secure financially, with 100.0% of males and 100.0% of females in these age groups living above the poverty line.

| Age Bracket | Male | Female |
| Under 5 Years | 68 (100.0%) | 72 (100.0%) |
| 5 Years | 0 (0.0%) | 14 (100.0%) |
| 6 to 11 Years | 134 (100.0%) | 79 (81.4%) |
| 12 to 14 Years | 30 (100.0%) | 42 (100.0%) |
| 15 Years | 15 (100.0%) | 10 (66.7%) |
| 16 and 17 Years | 18 (100.0%) | 51 (100.0%) |
| 18 to 24 Years | 43 (97.7%) | 52 (65.0%) |
| 25 to 34 Years | 118 (100.0%) | 136 (93.1%) |
| 35 to 44 Years | 107 (94.7%) | 110 (94.8%) |
| 45 to 54 Years | 110 (95.7%) | 112 (100.0%) |
| 55 to 64 Years | 143 (95.3%) | 161 (97.6%) |
| 65 to 74 Years | 168 (98.3%) | 134 (92.4%) |
| 75 Years and over | 78 (96.3%) | 117 (92.9%) |
| Total | 1,032 (97.6%) | 1,090 (92.3%) |
Income Below Poverty Among Married-Couple Families in Kiowa County
The poverty statistics for married-couple families in Kiowa County show that 0.7% or 4 of the total 538 families live below the poverty line. Families with 1 or 2 children have the highest poverty rate of 2.1%, comprising of 2 families. On the other hand, families with 3 or 4 children have the lowest poverty rate of 0.0%, which includes 0 families.
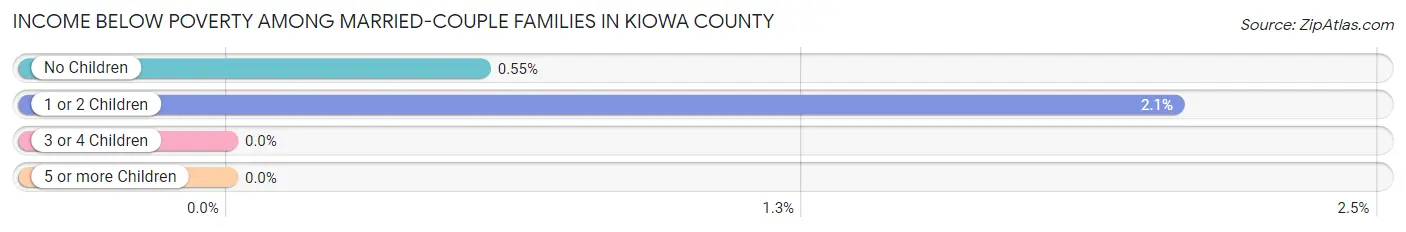
| Children | Above Poverty | Below Poverty |
| No Children | 361 (99.5%) | 2 (0.5%) |
| 1 or 2 Children | 95 (97.9%) | 2 (2.1%) |
| 3 or 4 Children | 77 (100.0%) | 0 (0.0%) |
| 5 or more Children | 1 (100.0%) | 0 (0.0%) |
| Total | 534 (99.3%) | 4 (0.7%) |
Income Below Poverty Among Single-Parent Households in Kiowa County
According to the poverty data in Kiowa County, 9.5% or 2 single-father households and 25.0% or 9 single-mother households are living below the poverty line. Among single-father households, those with 1 or 2 children have the highest poverty rate, with 2 households (25.0%) experiencing poverty. Likewise, among single-mother households, those with 1 or 2 children have the highest poverty rate, with 7 households (38.9%) falling below the poverty line.
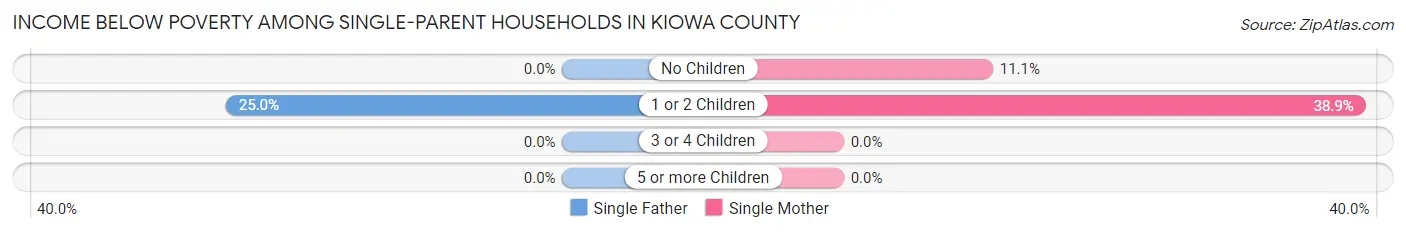
| Children | Single Father | Single Mother |
| No Children | 0 (0.0%) | 2 (11.1%) |
| 1 or 2 Children | 2 (25.0%) | 7 (38.9%) |
| 3 or 4 Children | 0 (0.0%) | 0 (0.0%) |
| 5 or more Children | 0 (0.0%) | 0 (0.0%) |
| Total | 2 (9.5%) | 9 (25.0%) |
Income Below Poverty Among Married-Couple vs Single-Parent Households in Kiowa County
The poverty data for Kiowa County shows that 4 of the married-couple family households (0.7%) and 11 of the single-parent households (19.3%) are living below the poverty level. Within the married-couple family households, those with 1 or 2 children have the highest poverty rate, with 2 households (2.1%) falling below the poverty line. Among the single-parent households, those with 1 or 2 children have the highest poverty rate, with 9 household (34.6%) living below poverty.

| Children | Married-Couple Families | Single-Parent Households |
| No Children | 2 (0.5%) | 2 (6.5%) |
| 1 or 2 Children | 2 (2.1%) | 9 (34.6%) |
| 3 or 4 Children | 0 (0.0%) | 0 (0.0%) |
| 5 or more Children | 0 (0.0%) | 0 (0.0%) |
| Total | 4 (0.7%) | 11 (19.3%) |
Employment Characteristics in Kiowa County
Employment by Class of Employer in Kiowa County
Among the 1,232 employed individuals in Kiowa County, private company employees (535 | 43.4%), local government employees (232 | 18.8%), and self-employed (not incorporated) (223 | 18.1%) make up the most common classes of employment.
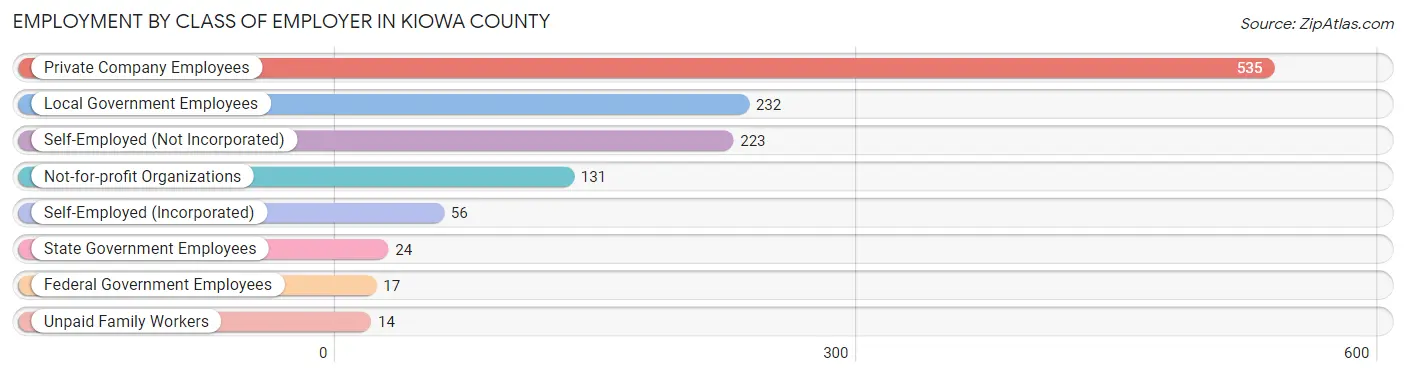
| Employer Class | # Employees | % Employees |
| Private Company Employees | 535 | 43.4% |
| Self-Employed (Incorporated) | 56 | 4.5% |
| Self-Employed (Not Incorporated) | 223 | 18.1% |
| Not-for-profit Organizations | 131 | 10.6% |
| Local Government Employees | 232 | 18.8% |
| State Government Employees | 24 | 1.9% |
| Federal Government Employees | 17 | 1.4% |
| Unpaid Family Workers | 14 | 1.1% |
| Total | 1,232 | 100.0% |
Employment Status by Age in Kiowa County
According to the labor force statistics for Kiowa County, out of the total population over 16 years of age (1,957), 66.1% or 1,294 individuals are in the labor force, with 3.6% or 47 of them unemployed. The age group with the highest labor force participation rate is 25 to 29 years, with 93.4% or 185 individuals in the labor force. Within the labor force, the 16 to 19 years age range has the highest percentage of unemployed individuals, with 15.1% or 14 of them being unemployed.
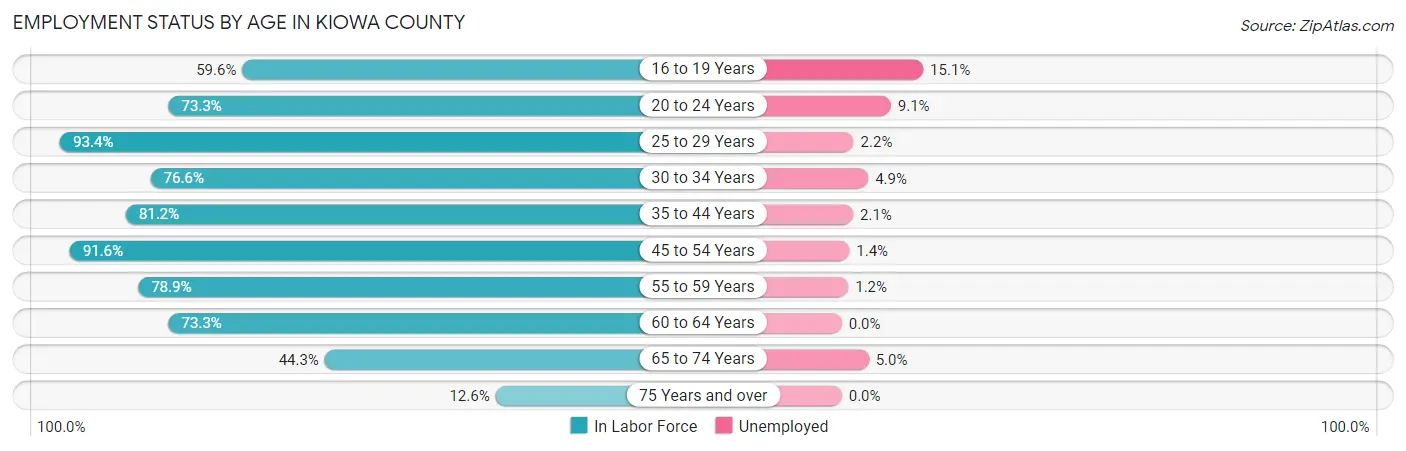
| Age Bracket | In Labor Force | Unemployed |
| 16 to 19 Years | 93 (59.6%) | 14 (15.1%) |
| 20 to 24 Years | 99 (73.3%) | 9 (9.1%) |
| 25 to 29 Years | 185 (93.4%) | 4 (2.2%) |
| 30 to 34 Years | 82 (76.6%) | 4 (4.9%) |
| 35 to 44 Years | 190 (81.2%) | 4 (2.1%) |
| 45 to 54 Years | 218 (91.6%) | 3 (1.4%) |
| 55 to 59 Years | 161 (78.9%) | 2 (1.2%) |
| 60 to 64 Years | 96 (73.3%) | 0 (0.0%) |
| 65 to 74 Years | 140 (44.3%) | 7 (5.0%) |
| 75 Years and over | 30 (12.6%) | 0 (0.0%) |
| Total | 1,294 (66.1%) | 47 (3.6%) |
Employment Status by Educational Attainment in Kiowa County
According to labor force statistics for Kiowa County, 83.8% of individuals (932) out of the total population between 25 and 64 years of age (1,112) are in the labor force, with 1.8% or 17 of them being unemployed. The group with the highest labor force participation rate are those with the educational attainment of college / associate degree, with 93.7% or 374 individuals in the labor force. Within the labor force, individuals with less than high school education have the highest percentage of unemployment, with 3.9% or 4 of them being unemployed.
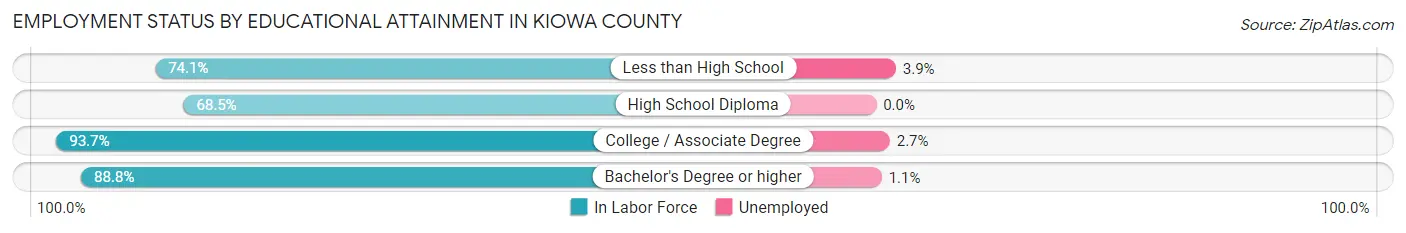
| Educational Attainment | In Labor Force | Unemployed |
| Less than High School | 103 (74.1%) | 5 (3.9%) |
| High School Diploma | 185 (68.5%) | 0 (0.0%) |
| College / Associate Degree | 374 (93.7%) | 11 (2.7%) |
| Bachelor's Degree or higher | 270 (88.8%) | 3 (1.1%) |
| Total | 932 (83.8%) | 20 (1.8%) |
Employment Occupations by Sex in Kiowa County
Management, Business, Science and Arts Occupations
The most common Management, Business, Science and Arts occupations in Kiowa County are Community & Social Service (184 | 14.8%), Education Instruction & Library (166 | 13.3%), Management (157 | 12.6%), Health Diagnosing & Treating (39 | 3.1%), and Computers, Engineering & Science (27 | 2.2%).

Management, Business, Science and Arts Occupations by Sex
Within the Management, Business, Science and Arts occupations in Kiowa County, the most male-oriented occupations are Legal Services & Support (100.0%), Management (77.1%), and Arts, Media & Entertainment (70.0%), while the most female-oriented occupations are Health Technologists (100.0%), Health Diagnosing & Treating (97.4%), and Education Instruction & Library (83.7%).
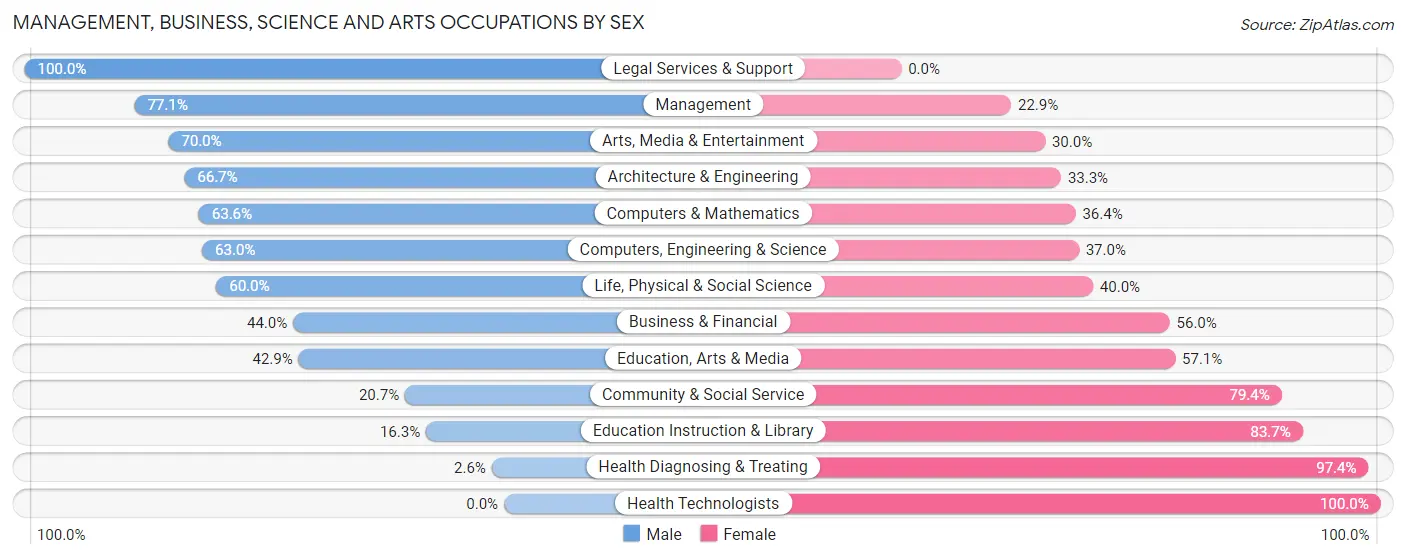
| Occupation | Male | Female |
| Management | 121 (77.1%) | 36 (22.9%) |
| Business & Financial | 11 (44.0%) | 14 (56.0%) |
| Computers, Engineering & Science | 17 (63.0%) | 10 (37.0%) |
| Computers & Mathematics | 7 (63.6%) | 4 (36.4%) |
| Architecture & Engineering | 4 (66.7%) | 2 (33.3%) |
| Life, Physical & Social Science | 6 (60.0%) | 4 (40.0%) |
| Community & Social Service | 38 (20.6%) | 146 (79.3%) |
| Education, Arts & Media | 3 (42.9%) | 4 (57.1%) |
| Legal Services & Support | 1 (100.0%) | 0 (0.0%) |
| Education Instruction & Library | 27 (16.3%) | 139 (83.7%) |
| Arts, Media & Entertainment | 7 (70.0%) | 3 (30.0%) |
| Health Diagnosing & Treating | 1 (2.6%) | 38 (97.4%) |
| Health Technologists | 0 (0.0%) | 17 (100.0%) |
| Total (Category) | 188 (43.5%) | 244 (56.5%) |
| Total (Overall) | 629 (50.4%) | 618 (49.6%) |
Services Occupations
The most common Services occupations in Kiowa County are Cleaning & Maintenance (105 | 8.4%), Food Preparation & Serving (94 | 7.5%), Personal Care & Service (34 | 2.7%), Healthcare Support (25 | 2.0%), and Security & Protection (25 | 2.0%).
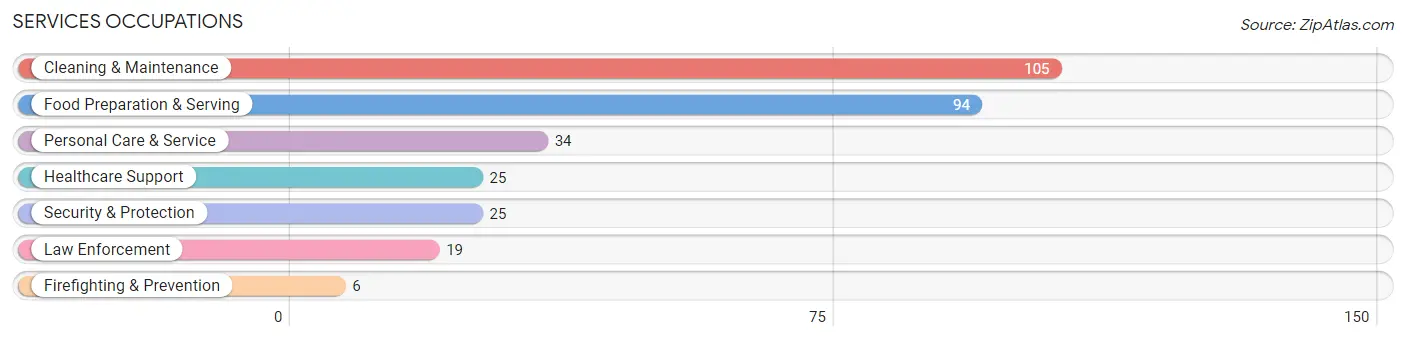
Services Occupations by Sex
Within the Services occupations in Kiowa County, the most male-oriented occupations are Law Enforcement (100.0%), Security & Protection (92.0%), and Firefighting & Prevention (66.7%), while the most female-oriented occupations are Personal Care & Service (94.1%), Healthcare Support (72.0%), and Food Preparation & Serving (67.0%).
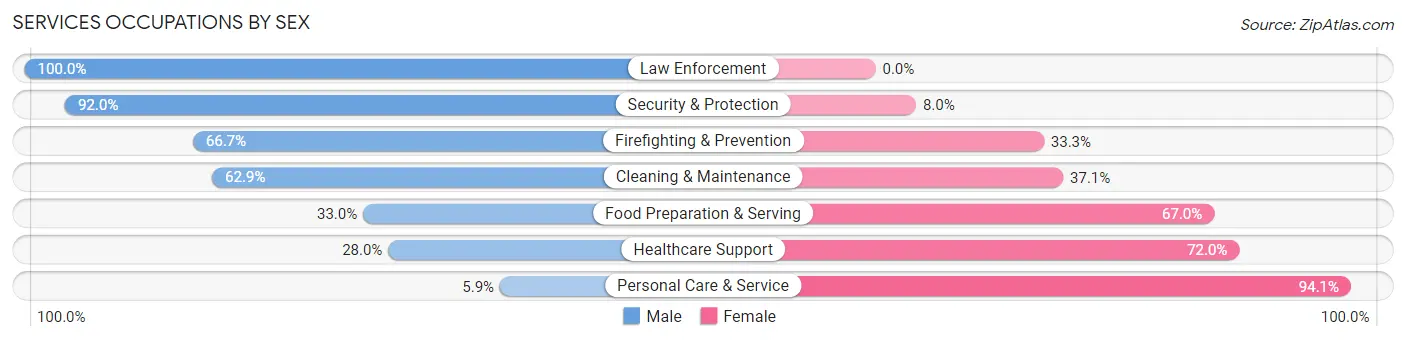
| Occupation | Male | Female |
| Healthcare Support | 7 (28.0%) | 18 (72.0%) |
| Security & Protection | 23 (92.0%) | 2 (8.0%) |
| Firefighting & Prevention | 4 (66.7%) | 2 (33.3%) |
| Law Enforcement | 19 (100.0%) | 0 (0.0%) |
| Food Preparation & Serving | 31 (33.0%) | 63 (67.0%) |
| Cleaning & Maintenance | 66 (62.9%) | 39 (37.1%) |
| Personal Care & Service | 2 (5.9%) | 32 (94.1%) |
| Total (Category) | 129 (45.6%) | 154 (54.4%) |
| Total (Overall) | 629 (50.4%) | 618 (49.6%) |
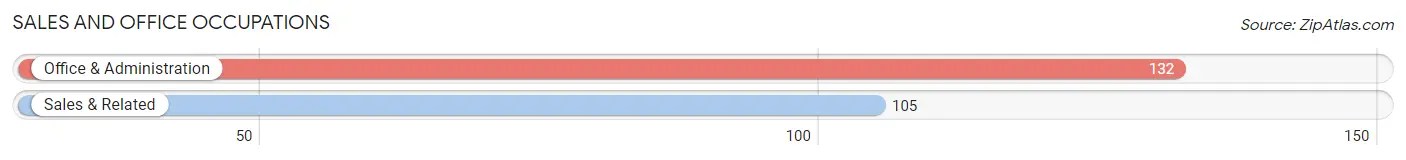
Sales and Office Occupations
The most common Sales and Office occupations in Kiowa County are Office & Administration (132 | 10.6%), and Sales & Related (105 | 8.4%).
Sales and Office Occupations by Sex
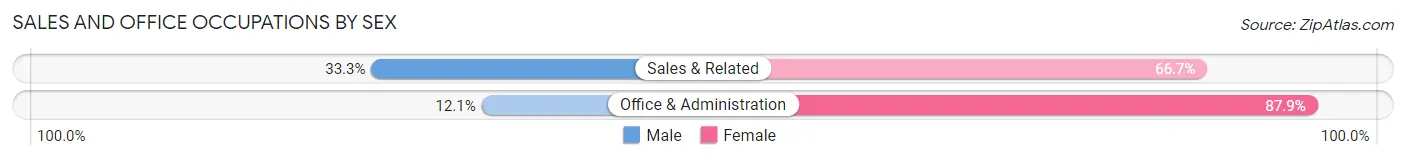
| Occupation | Male | Female |
| Sales & Related | 35 (33.3%) | 70 (66.7%) |
| Office & Administration | 16 (12.1%) | 116 (87.9%) |
| Total (Category) | 51 (21.5%) | 186 (78.5%) |
| Total (Overall) | 629 (50.4%) | 618 (49.6%) |
Natural Resources, Construction and Maintenance Occupations
The most common Natural Resources, Construction and Maintenance occupations in Kiowa County are Construction & Extraction (66 | 5.3%), Installation, Maintenance & Repair (52 | 4.2%), and Farming, Fishing & Forestry (42 | 3.4%).
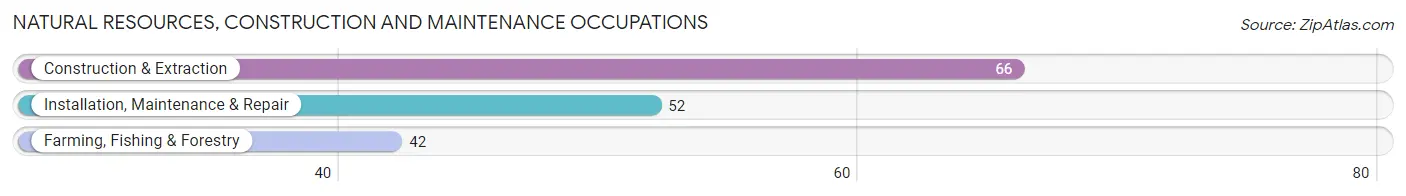
Natural Resources, Construction and Maintenance Occupations by Sex

| Occupation | Male | Female |
| Farming, Fishing & Forestry | 42 (100.0%) | 0 (0.0%) |
| Construction & Extraction | 59 (89.4%) | 7 (10.6%) |
| Installation, Maintenance & Repair | 51 (98.1%) | 1 (1.9%) |
| Total (Category) | 152 (95.0%) | 8 (5.0%) |
| Total (Overall) | 629 (50.4%) | 618 (49.6%) |
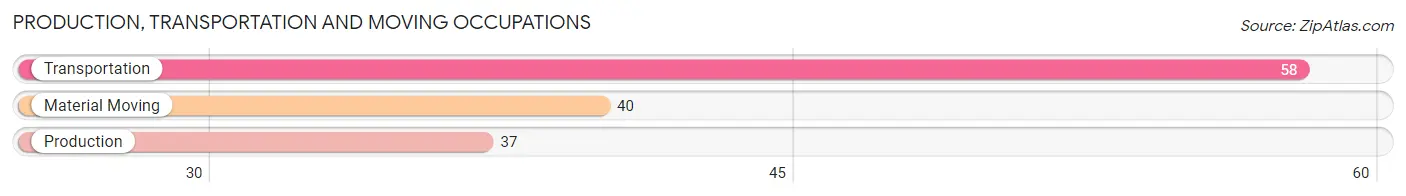
Production, Transportation and Moving Occupations
The most common Production, Transportation and Moving occupations in Kiowa County are Transportation (58 | 4.6%), Material Moving (40 | 3.2%), and Production (37 | 3.0%).
Production, Transportation and Moving Occupations by Sex
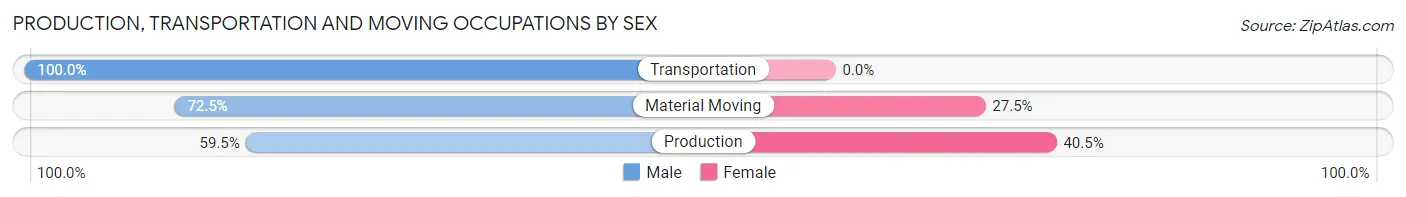
| Occupation | Male | Female |
| Production | 22 (59.5%) | 15 (40.5%) |
| Transportation | 58 (100.0%) | 0 (0.0%) |
| Material Moving | 29 (72.5%) | 11 (27.5%) |
| Total (Category) | 109 (80.7%) | 26 (19.3%) |
| Total (Overall) | 629 (50.4%) | 618 (49.6%) |
Employment Industries by Sex in Kiowa County
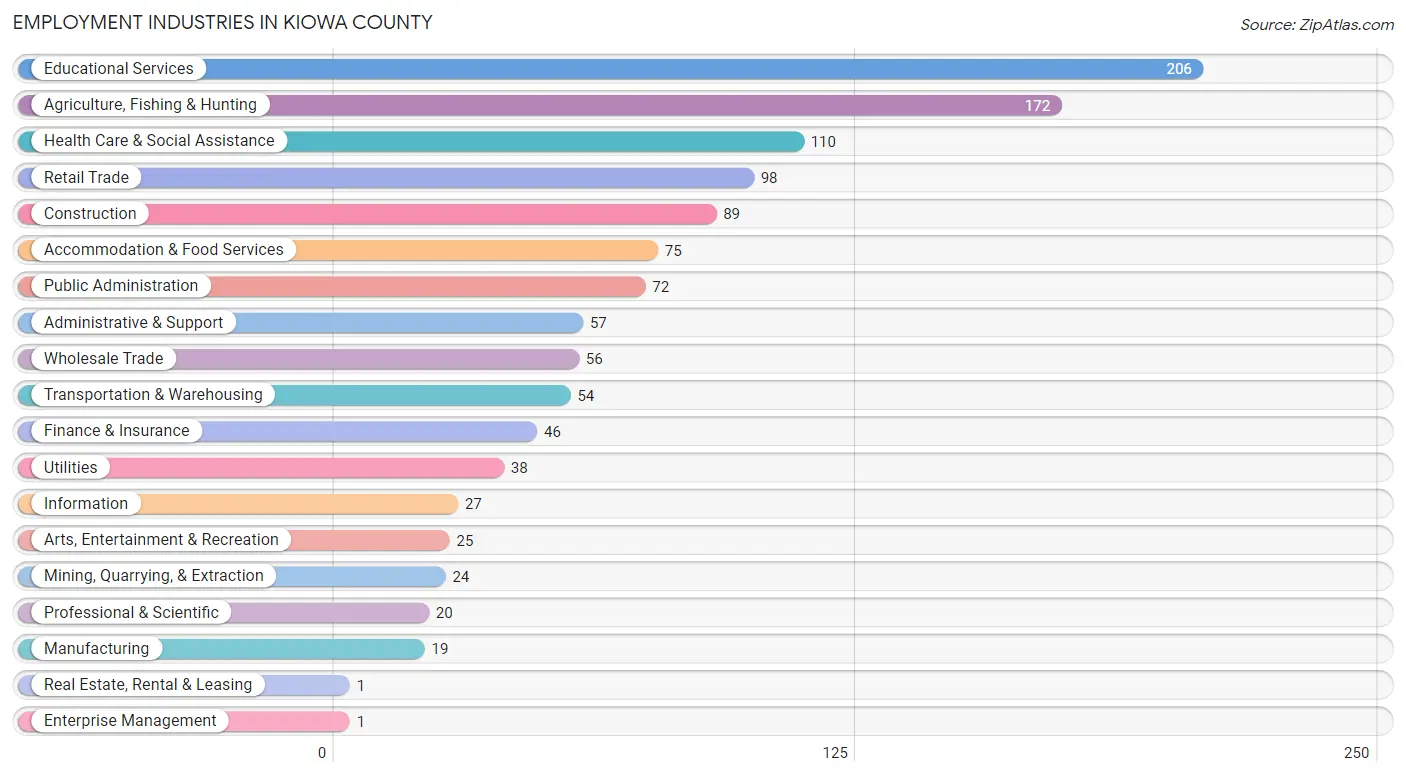
Employment Industries in Kiowa County
The major employment industries in Kiowa County include Educational Services (206 | 16.5%), Agriculture, Fishing & Hunting (172 | 13.8%), Health Care & Social Assistance (110 | 8.8%), Retail Trade (98 | 7.9%), and Construction (89 | 7.1%).
Employment Industries by Sex in Kiowa County
The Kiowa County industries that see more men than women are Real Estate, Rental & Leasing (100.0%), Utilities (92.1%), and Administrative & Support (89.5%), whereas the industries that tend to have a higher number of women are Enterprise Management (100.0%), Health Care & Social Assistance (92.7%), and Finance & Insurance (91.3%).

| Industry | Male | Female |
| Agriculture, Fishing & Hunting | 147 (85.5%) | 25 (14.5%) |
| Mining, Quarrying, & Extraction | 19 (79.2%) | 5 (20.8%) |
| Construction | 73 (82.0%) | 16 (18.0%) |
| Manufacturing | 10 (52.6%) | 9 (47.4%) |
| Wholesale Trade | 47 (83.9%) | 9 (16.1%) |
| Retail Trade | 31 (31.6%) | 67 (68.4%) |
| Transportation & Warehousing | 46 (85.2%) | 8 (14.8%) |
| Utilities | 35 (92.1%) | 3 (7.9%) |
| Information | 9 (33.3%) | 18 (66.7%) |
| Finance & Insurance | 4 (8.7%) | 42 (91.3%) |
| Real Estate, Rental & Leasing | 1 (100.0%) | 0 (0.0%) |
| Professional & Scientific | 2 (10.0%) | 18 (90.0%) |
| Enterprise Management | 0 (0.0%) | 1 (100.0%) |
| Administrative & Support | 51 (89.5%) | 6 (10.5%) |
| Educational Services | 48 (23.3%) | 158 (76.7%) |
| Health Care & Social Assistance | 8 (7.3%) | 102 (92.7%) |
| Arts, Entertainment & Recreation | 11 (44.0%) | 14 (56.0%) |
| Accommodation & Food Services | 34 (45.3%) | 41 (54.7%) |
| Public Administration | 43 (59.7%) | 29 (40.3%) |
| Total | 629 (50.4%) | 618 (49.6%) |
Education in Kiowa County
School Enrollment in Kiowa County
The most common levels of schooling among the 629 students in Kiowa County are college / undergraduate (204 | 32.4%), high school (120 | 19.1%), and elementary school (116 | 18.4%).
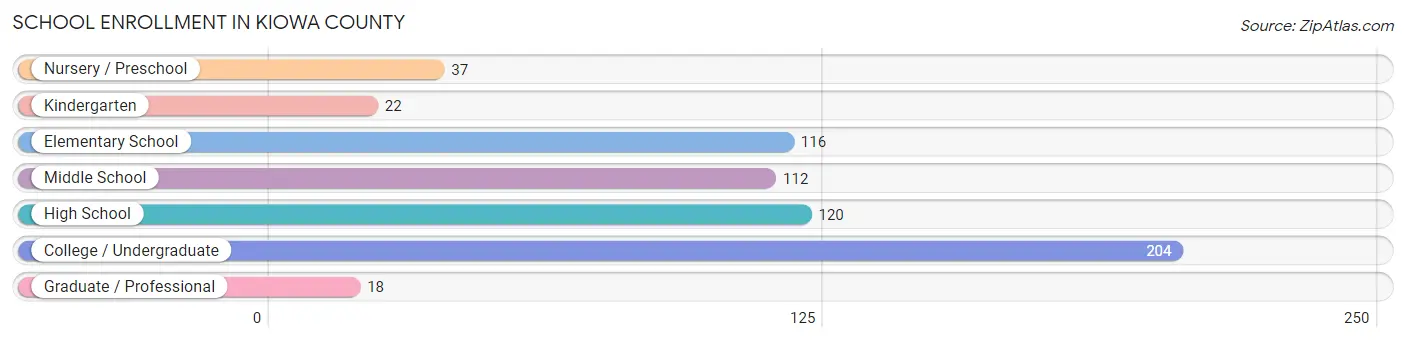
| School Level | # Students | % Students |
| Nursery / Preschool | 37 | 5.9% |
| Kindergarten | 22 | 3.5% |
| Elementary School | 116 | 18.4% |
| Middle School | 112 | 17.8% |
| High School | 120 | 19.1% |
| College / Undergraduate | 204 | 32.4% |
| Graduate / Professional | 18 | 2.9% |
| Total | 629 | 100.0% |
School Enrollment by Age by Funding Source in Kiowa County
Out of a total of 629 students who are enrolled in schools in Kiowa County, 182 (28.9%) attend a private institution, while the remaining 447 (71.1%) are enrolled in public schools. The age group of 25 to 34 year olds has the highest likelihood of being enrolled in private schools, with 40 (95.2% in the age bracket) enrolled. Conversely, the age group of 15 to 17 year olds has the lowest likelihood of being enrolled in a private school, with 92 (93.9% in the age bracket) attending a public institution.
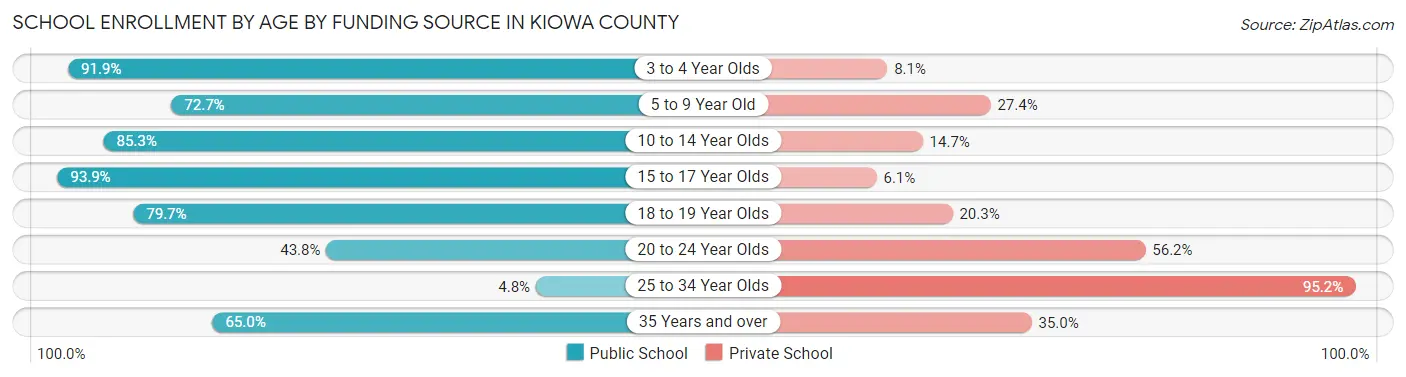
| Age Bracket | Public School | Private School |
| 3 to 4 Year Olds | 34 (91.9%) | 3 (8.1%) |
| 5 to 9 Year Old | 85 (72.7%) | 32 (27.4%) |
| 10 to 14 Year Olds | 116 (85.3%) | 20 (14.7%) |
| 15 to 17 Year Olds | 92 (93.9%) | 6 (6.1%) |
| 18 to 19 Year Olds | 59 (79.7%) | 15 (20.3%) |
| 20 to 24 Year Olds | 46 (43.8%) | 59 (56.2%) |
| 25 to 34 Year Olds | 2 (4.8%) | 40 (95.2%) |
| 35 Years and over | 13 (65.0%) | 7 (35.0%) |
| Total | 447 (71.1%) | 182 (28.9%) |
Educational Attainment by Field of Study in Kiowa County
Education (140 | 30.8%), business (63 | 13.9%), liberal arts & history (51 | 11.2%), bio, nature & agricultural (50 | 11.0%), and science & technology (31 | 6.8%) are the most common fields of study among 454 individuals in Kiowa County who have obtained a bachelor's degree or higher.
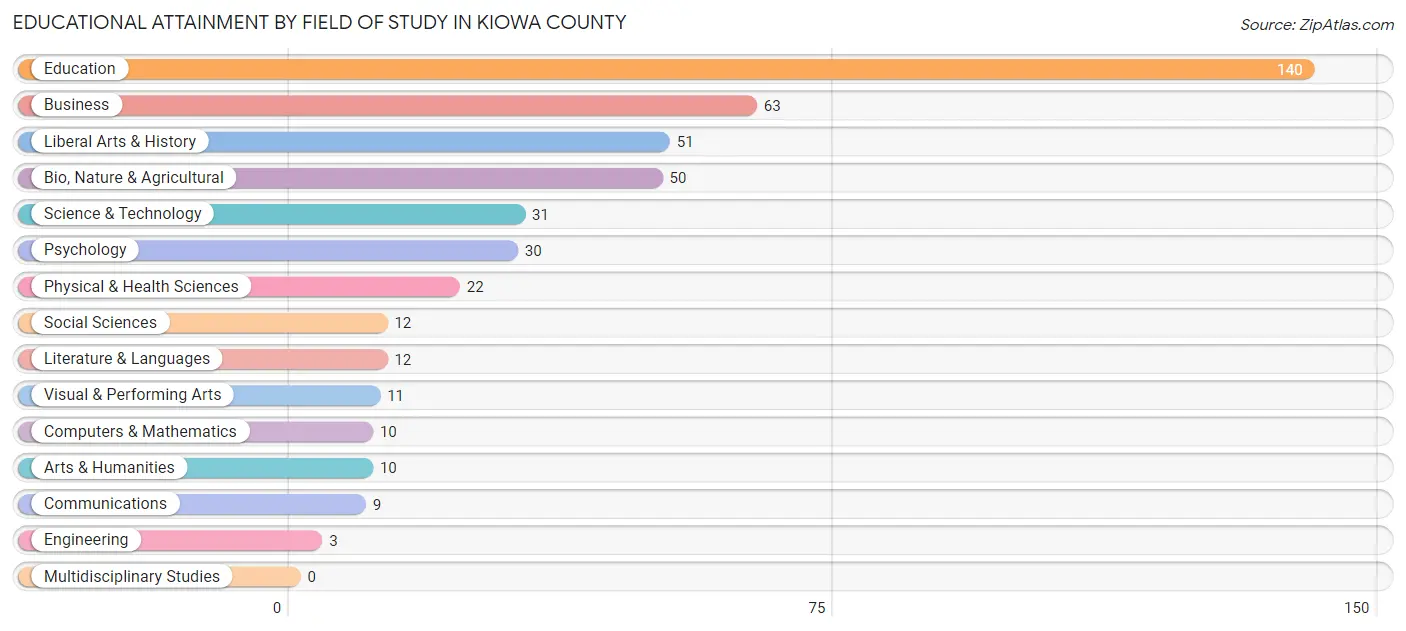
| Field of Study | # Graduates | % Graduates |
| Computers & Mathematics | 10 | 2.2% |
| Bio, Nature & Agricultural | 50 | 11.0% |
| Physical & Health Sciences | 22 | 4.9% |
| Psychology | 30 | 6.6% |
| Social Sciences | 12 | 2.6% |
| Engineering | 3 | 0.7% |
| Multidisciplinary Studies | 0 | 0.0% |
| Science & Technology | 31 | 6.8% |
| Business | 63 | 13.9% |
| Education | 140 | 30.8% |
| Literature & Languages | 12 | 2.6% |
| Liberal Arts & History | 51 | 11.2% |
| Visual & Performing Arts | 11 | 2.4% |
| Communications | 9 | 2.0% |
| Arts & Humanities | 10 | 2.2% |
| Total | 454 | 100.0% |
Transportation & Commute in Kiowa County
Vehicle Availability by Sex in Kiowa County
The most prevalent vehicle ownership categories in Kiowa County are males with 2 vehicles (206, accounting for 34.7%) and females with 2 vehicles (132, making up 36.6%).
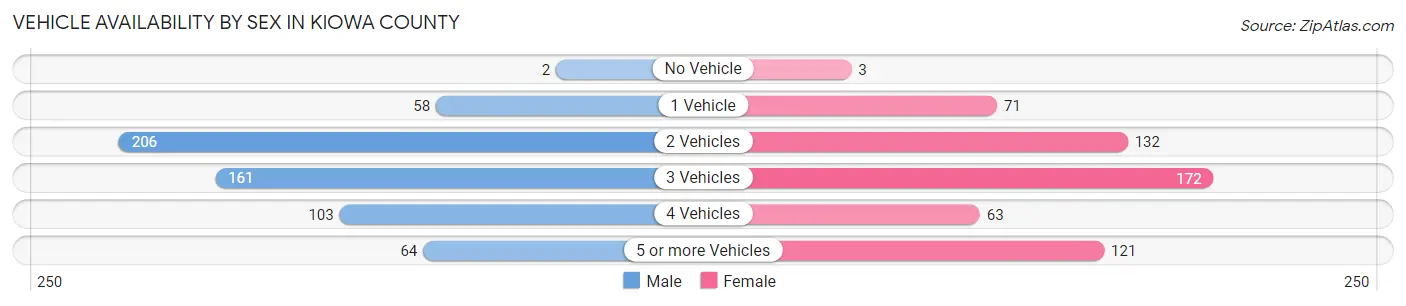
| Vehicles Available | Male | Female |
| No Vehicle | 2 (0.3%) | 3 (0.5%) |
| 1 Vehicle | 58 (9.8%) | 71 (12.6%) |
| 2 Vehicles | 206 (34.7%) | 132 (23.5%) |
| 3 Vehicles | 161 (27.1%) | 172 (30.6%) |
| 4 Vehicles | 103 (17.3%) | 63 (11.2%) |
| 5 or more Vehicles | 64 (10.8%) | 121 (21.5%) |
| Total | 594 (100.0%) | 562 (100.0%) |
Commute Time in Kiowa County
The most frequently occuring commute durations in Kiowa County are less than 5 minutes (342 commuters, 30.3%), 5 to 9 minutes (232 commuters, 20.5%), and 10 to 14 minutes (191 commuters, 16.9%).
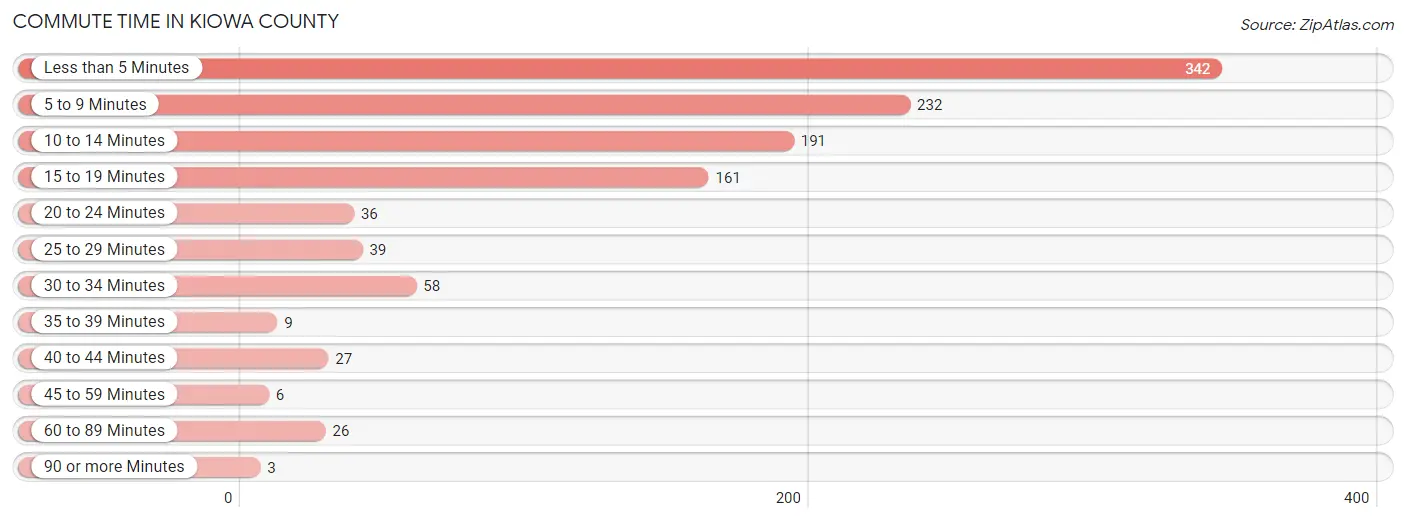
| Commute Time | # Commuters | % Commuters |
| Less than 5 Minutes | 342 | 30.3% |
| 5 to 9 Minutes | 232 | 20.5% |
| 10 to 14 Minutes | 191 | 16.9% |
| 15 to 19 Minutes | 161 | 14.2% |
| 20 to 24 Minutes | 36 | 3.2% |
| 25 to 29 Minutes | 39 | 3.5% |
| 30 to 34 Minutes | 58 | 5.1% |
| 35 to 39 Minutes | 9 | 0.8% |
| 40 to 44 Minutes | 27 | 2.4% |
| 45 to 59 Minutes | 6 | 0.5% |
| 60 to 89 Minutes | 26 | 2.3% |
| 90 or more Minutes | 3 | 0.3% |
Commute Time by Sex in Kiowa County
The most common commute times in Kiowa County are less than 5 minutes (124 commuters, 21.2%) for males and less than 5 minutes (218 commuters, 40.0%) for females.
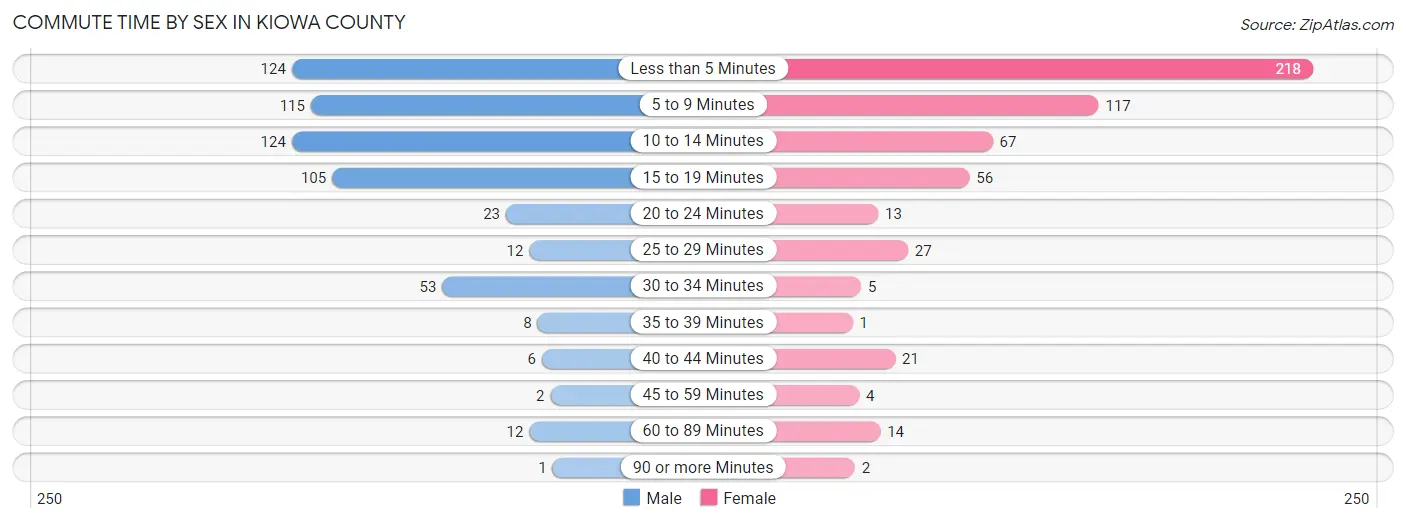
| Commute Time | Male | Female |
| Less than 5 Minutes | 124 (21.2%) | 218 (40.0%) |
| 5 to 9 Minutes | 115 (19.7%) | 117 (21.5%) |
| 10 to 14 Minutes | 124 (21.2%) | 67 (12.3%) |
| 15 to 19 Minutes | 105 (17.9%) | 56 (10.3%) |
| 20 to 24 Minutes | 23 (3.9%) | 13 (2.4%) |
| 25 to 29 Minutes | 12 (2.1%) | 27 (5.0%) |
| 30 to 34 Minutes | 53 (9.1%) | 5 (0.9%) |
| 35 to 39 Minutes | 8 (1.4%) | 1 (0.2%) |
| 40 to 44 Minutes | 6 (1.0%) | 21 (3.8%) |
| 45 to 59 Minutes | 2 (0.3%) | 4 (0.7%) |
| 60 to 89 Minutes | 12 (2.1%) | 14 (2.6%) |
| 90 or more Minutes | 1 (0.2%) | 2 (0.4%) |
Time of Departure to Work by Sex in Kiowa County
The most frequent times of departure to work in Kiowa County are 7:00 AM to 7:29 AM (113, 19.3%) for males and 7:30 AM to 7:59 AM (202, 37.1%) for females.
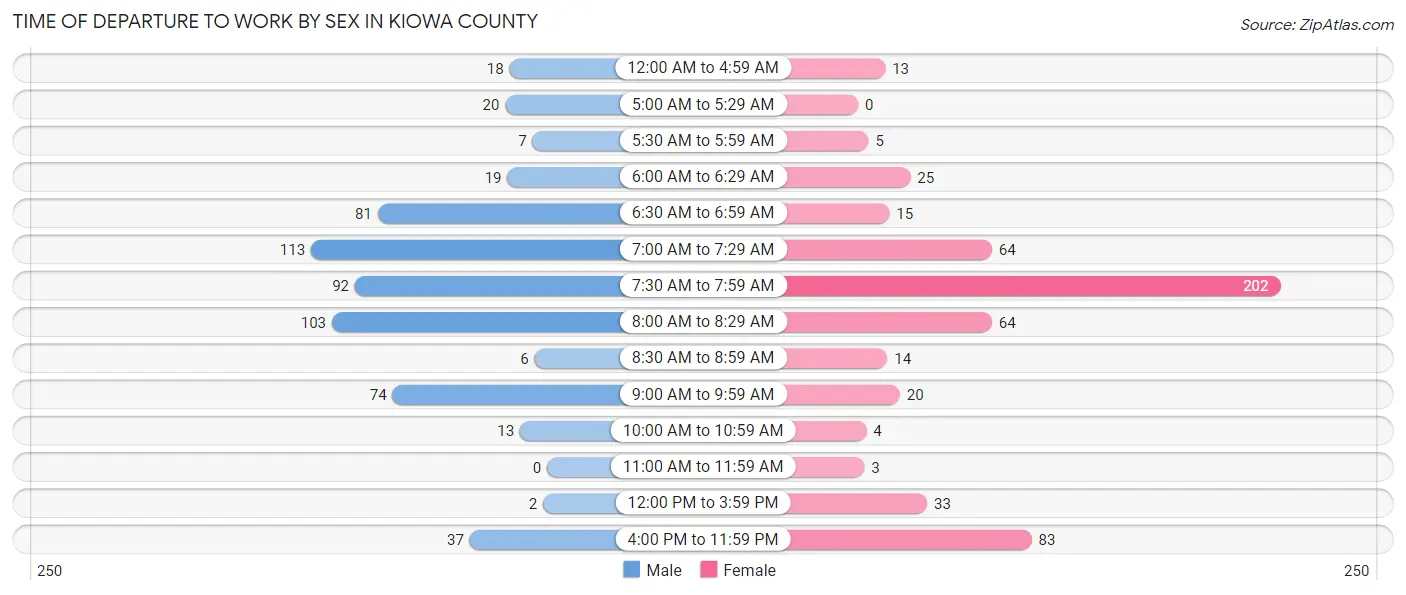
| Time of Departure | Male | Female |
| 12:00 AM to 4:59 AM | 18 (3.1%) | 13 (2.4%) |
| 5:00 AM to 5:29 AM | 20 (3.4%) | 0 (0.0%) |
| 5:30 AM to 5:59 AM | 7 (1.2%) | 5 (0.9%) |
| 6:00 AM to 6:29 AM | 19 (3.3%) | 25 (4.6%) |
| 6:30 AM to 6:59 AM | 81 (13.9%) | 15 (2.8%) |
| 7:00 AM to 7:29 AM | 113 (19.3%) | 64 (11.7%) |
| 7:30 AM to 7:59 AM | 92 (15.7%) | 202 (37.1%) |
| 8:00 AM to 8:29 AM | 103 (17.6%) | 64 (11.7%) |
| 8:30 AM to 8:59 AM | 6 (1.0%) | 14 (2.6%) |
| 9:00 AM to 9:59 AM | 74 (12.7%) | 20 (3.7%) |
| 10:00 AM to 10:59 AM | 13 (2.2%) | 4 (0.7%) |
| 11:00 AM to 11:59 AM | 0 (0.0%) | 3 (0.5%) |
| 12:00 PM to 3:59 PM | 2 (0.3%) | 33 (6.1%) |
| 4:00 PM to 11:59 PM | 37 (6.3%) | 83 (15.2%) |
| Total | 585 (100.0%) | 545 (100.0%) |
Housing Occupancy in Kiowa County
Occupancy by Ownership in Kiowa County
Of the total 927 dwellings in Kiowa County, owner-occupied units account for 699 (75.4%), while renter-occupied units make up 228 (24.6%).
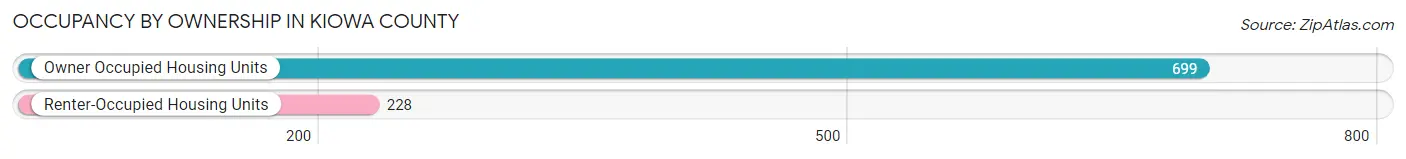
| Occupancy | # Housing Units | % Housing Units |
| Owner Occupied Housing Units | 699 | 75.4% |
| Renter-Occupied Housing Units | 228 | 24.6% |
| Total Occupied Housing Units | 927 | 100.0% |
Occupancy by Household Size in Kiowa County
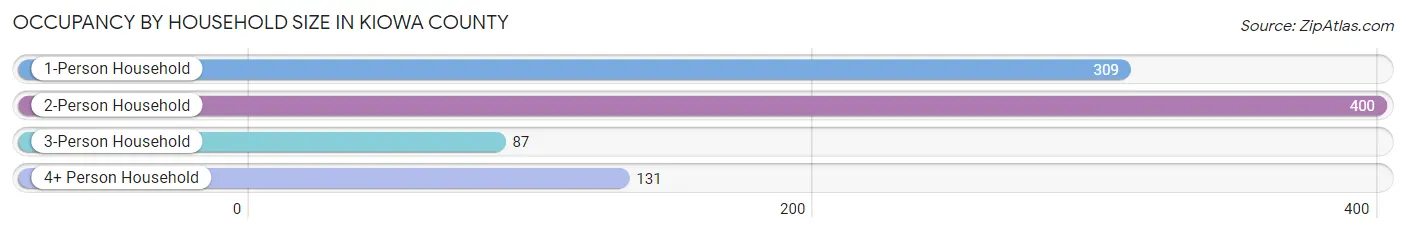
| Household Size | # Housing Units | % Housing Units |
| 1-Person Household | 309 | 33.3% |
| 2-Person Household | 400 | 43.1% |
| 3-Person Household | 87 | 9.4% |
| 4+ Person Household | 131 | 14.1% |
| Total Housing Units | 927 | 100.0% |
Occupancy by Ownership by Household Size in Kiowa County
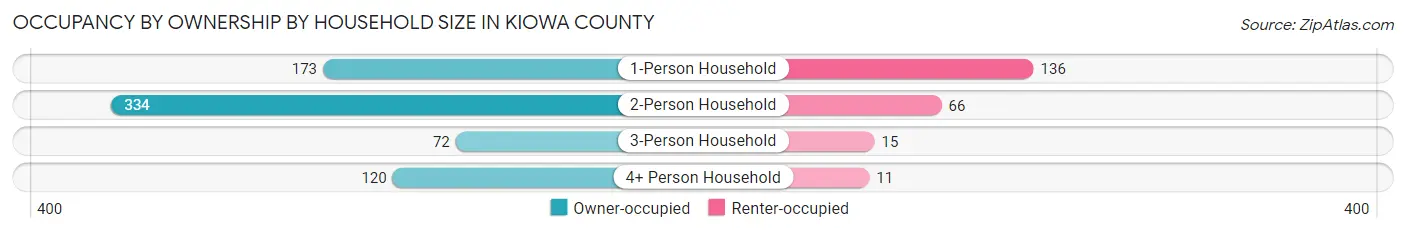
| Household Size | Owner-occupied | Renter-occupied |
| 1-Person Household | 173 (56.0%) | 136 (44.0%) |
| 2-Person Household | 334 (83.5%) | 66 (16.5%) |
| 3-Person Household | 72 (82.8%) | 15 (17.2%) |
| 4+ Person Household | 120 (91.6%) | 11 (8.4%) |
| Total Housing Units | 699 (75.4%) | 228 (24.6%) |
Occupancy by Educational Attainment in Kiowa County
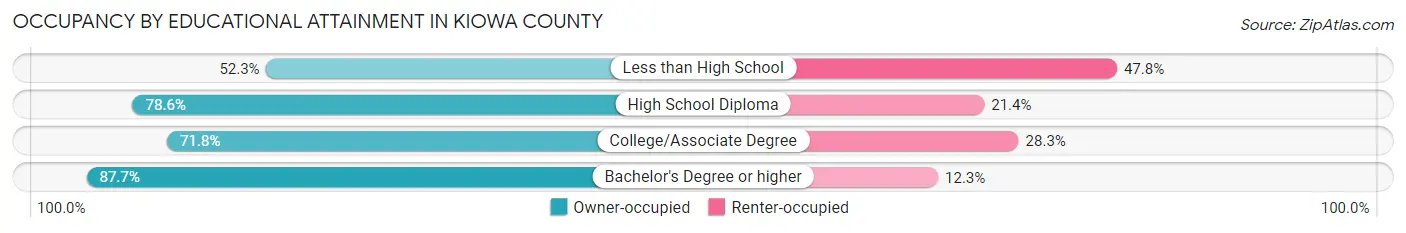
| Household Size | Owner-occupied | Renter-occupied |
| Less than High School | 58 (52.2%) | 53 (47.7%) |
| High School Diploma | 220 (78.6%) | 60 (21.4%) |
| College/Associate Degree | 221 (71.8%) | 87 (28.2%) |
| Bachelor's Degree or higher | 200 (87.7%) | 28 (12.3%) |
Occupancy by Age of Householder in Kiowa County
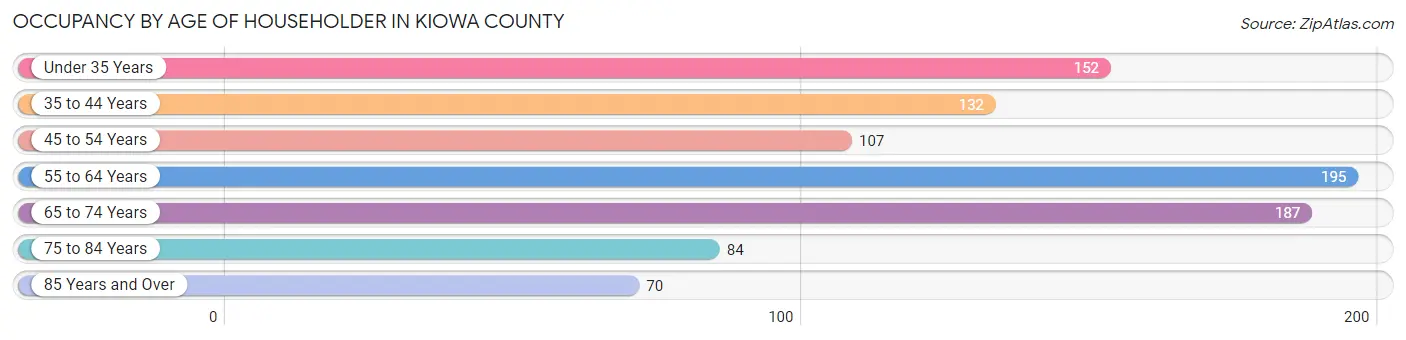
| Age Bracket | # Households | % Households |
| Under 35 Years | 152 | 16.4% |
| 35 to 44 Years | 132 | 14.2% |
| 45 to 54 Years | 107 | 11.5% |
| 55 to 64 Years | 195 | 21.0% |
| 65 to 74 Years | 187 | 20.2% |
| 75 to 84 Years | 84 | 9.1% |
| 85 Years and Over | 70 | 7.5% |
| Total | 927 | 100.0% |
Housing Finances in Kiowa County
Median Income by Occupancy in Kiowa County
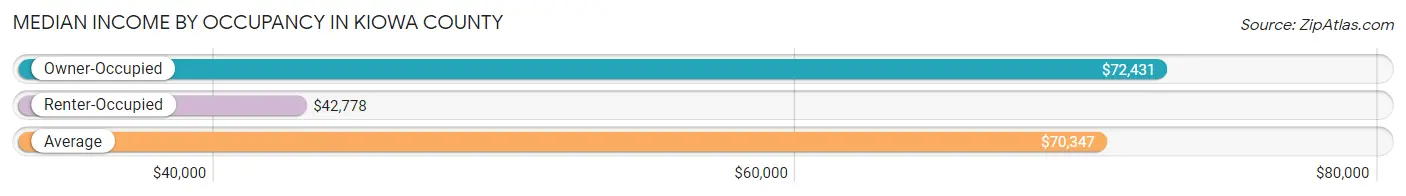
| Occupancy Type | # Households | Median Income |
| Owner-Occupied | 699 (75.4%) | $72,431 |
| Renter-Occupied | 228 (24.6%) | $42,778 |
| Average | 927 (100.0%) | $70,347 |
Occupancy by Householder Income Bracket in Kiowa County
| Income Bracket | Owner-occupied | Renter-occupied |
| Less than $5,000 | 1 (0.1%) | 4 (1.8%) |
| $5,000 to $9,999 | 9 (1.3%) | 4 (1.8%) |
| $10,000 to $14,999 | 14 (2.0%) | 12 (5.3%) |
| $15,000 to $19,999 | 12 (1.7%) | 45 (19.7%) |
| $20,000 to $24,999 | 13 (1.9%) | 12 (5.3%) |
| $25,000 to $34,999 | 32 (4.6%) | 25 (11.0%) |
| $35,000 to $49,999 | 84 (12.0%) | 23 (10.1%) |
| $50,000 to $74,999 | 191 (27.3%) | 36 (15.8%) |
| $75,000 to $99,999 | 150 (21.5%) | 51 (22.4%) |
| $100,000 to $149,999 | 114 (16.3%) | 15 (6.6%) |
| $150,000 or more | 79 (11.3%) | 1 (0.4%) |
| Total | 699 (100.0%) | 228 (100.0%) |
Monthly Housing Cost Tiers in Kiowa County
| Monthly Cost | Owner-occupied | Renter-occupied |
| Less than $300 | 104 (14.9%) | 8 (3.5%) |
| $300 to $499 | 140 (20.0%) | 22 (9.7%) |
| $500 to $799 | 176 (25.2%) | 125 (54.8%) |
| $800 to $999 | 79 (11.3%) | 26 (11.4%) |
| $1,000 to $1,499 | 101 (14.4%) | 28 (12.3%) |
| $1,500 to $1,999 | 57 (8.2%) | 1 (0.4%) |
| $2,000 to $2,499 | 20 (2.9%) | 0 (0.0%) |
| $2,500 to $2,999 | 9 (1.3%) | 0 (0.0%) |
| $3,000 or more | 13 (1.9%) | 0 (0.0%) |
| Total | 699 (100.0%) | 228 (100.0%) |
Physical Housing Characteristics in Kiowa County
Housing Structures in Kiowa County
| Structure Type | # Housing Units | % Housing Units |
| Single Unit, Detached | 823 | 88.8% |
| Single Unit, Attached | 6 | 0.6% |
| 2 Unit Apartments | 9 | 1.0% |
| 3 or 4 Unit Apartments | 39 | 4.2% |
| 5 to 9 Unit Apartments | 4 | 0.4% |
| 10 or more Apartments | 15 | 1.6% |
| Mobile Home / Other | 31 | 3.3% |
| Total | 927 | 100.0% |
Housing Structures by Occupancy in Kiowa County
| Structure Type | Owner-occupied | Renter-occupied |
| Single Unit, Detached | 668 (81.2%) | 155 (18.8%) |
| Single Unit, Attached | 0 (0.0%) | 6 (100.0%) |
| 2 Unit Apartments | 1 (11.1%) | 8 (88.9%) |
| 3 or 4 Unit Apartments | 0 (0.0%) | 39 (100.0%) |
| 5 to 9 Unit Apartments | 0 (0.0%) | 4 (100.0%) |
| 10 or more Apartments | 2 (13.3%) | 13 (86.7%) |
| Mobile Home / Other | 28 (90.3%) | 3 (9.7%) |
| Total | 699 (75.4%) | 228 (24.6%) |
Housing Structures by Number of Rooms in Kiowa County
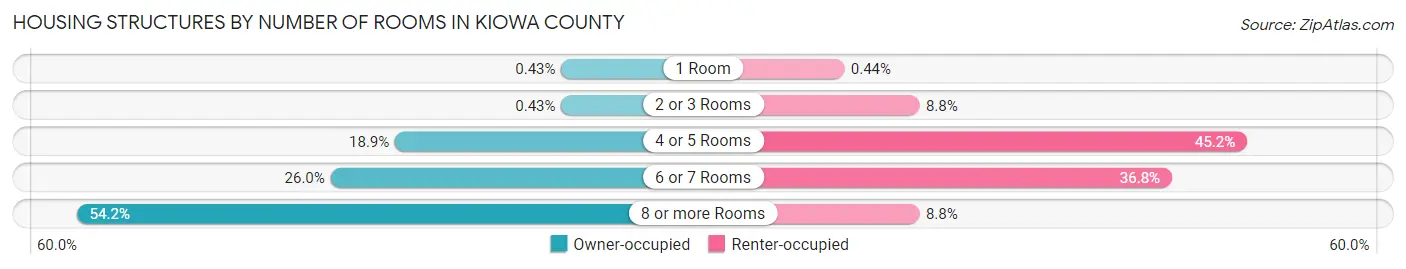
| Number of Rooms | Owner-occupied | Renter-occupied |
| 1 Room | 3 (0.4%) | 1 (0.4%) |
| 2 or 3 Rooms | 3 (0.4%) | 20 (8.8%) |
| 4 or 5 Rooms | 132 (18.9%) | 103 (45.2%) |
| 6 or 7 Rooms | 182 (26.0%) | 84 (36.8%) |
| 8 or more Rooms | 379 (54.2%) | 20 (8.8%) |
| Total | 699 (100.0%) | 228 (100.0%) |
Housing Structure by Heating Type in Kiowa County
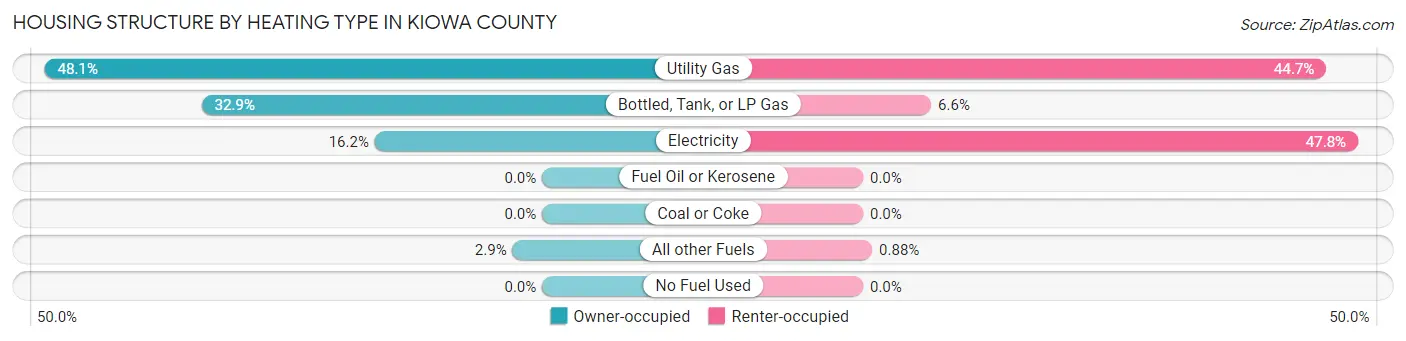
| Heating Type | Owner-occupied | Renter-occupied |
| Utility Gas | 336 (48.1%) | 102 (44.7%) |
| Bottled, Tank, or LP Gas | 230 (32.9%) | 15 (6.6%) |
| Electricity | 113 (16.2%) | 109 (47.8%) |
| Fuel Oil or Kerosene | 0 (0.0%) | 0 (0.0%) |
| Coal or Coke | 0 (0.0%) | 0 (0.0%) |
| All other Fuels | 20 (2.9%) | 2 (0.9%) |
| No Fuel Used | 0 (0.0%) | 0 (0.0%) |
| Total | 699 (100.0%) | 228 (100.0%) |
Household Vehicle Usage in Kiowa County
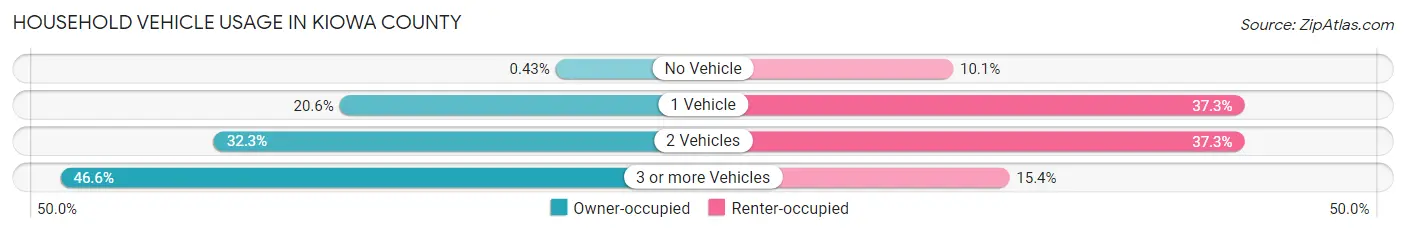
| Vehicles per Household | Owner-occupied | Renter-occupied |
| No Vehicle | 3 (0.4%) | 23 (10.1%) |
| 1 Vehicle | 144 (20.6%) | 85 (37.3%) |
| 2 Vehicles | 226 (32.3%) | 85 (37.3%) |
| 3 or more Vehicles | 326 (46.6%) | 35 (15.3%) |
| Total | 699 (100.0%) | 228 (100.0%) |
Real Estate & Mortgages in Kiowa County
Real Estate and Mortgage Overview in Kiowa County
| Characteristic | Without Mortgage | With Mortgage |
| Housing Units | 458 | 241 |
| Median Property Value | $84,500 | $173,900 |
| Median Household Income | $70,240 | $39 |
| Monthly Housing Costs | $484 | $10 |
| Real Estate Taxes | $1,407 | $0 |
Property Value by Mortgage Status in Kiowa County

| Property Value | Without Mortgage | With Mortgage |
| Less than $50,000 | 90 (19.7%) | 9 (3.7%) |
| $50,000 to $99,999 | 159 (34.7%) | 44 (18.3%) |
| $100,000 to $299,999 | 156 (34.1%) | 164 (68.0%) |
| $300,000 to $499,999 | 38 (8.3%) | 18 (7.5%) |
| $500,000 to $749,999 | 12 (2.6%) | 1 (0.4%) |
| $750,000 to $999,999 | 0 (0.0%) | 5 (2.1%) |
| $1,000,000 or more | 3 (0.7%) | 0 (0.0%) |
| Total | 458 (100.0%) | 241 (100.0%) |
Household Income by Mortgage Status in Kiowa County

| Household Income | Without Mortgage | With Mortgage |
| Less than $10,000 | 7 (1.5%) | 3 (1.2%) |
| $10,000 to $24,999 | 36 (7.9%) | 3 (1.2%) |
| $25,000 to $34,999 | 28 (6.1%) | 3 (1.2%) |
| $35,000 to $49,999 | 62 (13.5%) | 4 (1.7%) |
| $50,000 to $74,999 | 146 (31.9%) | 22 (9.1%) |
| $75,000 to $99,999 | 87 (19.0%) | 45 (18.7%) |
| $100,000 to $149,999 | 52 (11.4%) | 63 (26.1%) |
| $150,000 or more | 40 (8.7%) | 62 (25.7%) |
| Total | 458 (100.0%) | 241 (100.0%) |
Property Value to Household Income Ratio in Kiowa County
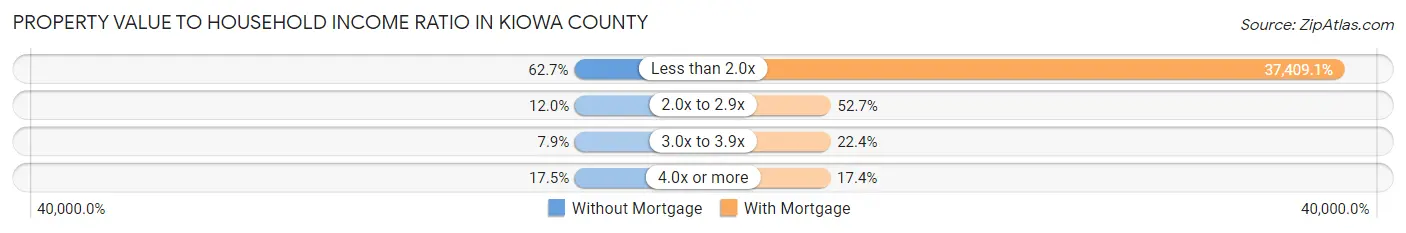
| Value-to-Income Ratio | Without Mortgage | With Mortgage |
| Less than 2.0x | 287 (62.7%) | 90,156 (37,409.1%) |
| 2.0x to 2.9x | 55 (12.0%) | 127 (52.7%) |
| 3.0x to 3.9x | 36 (7.9%) | 54 (22.4%) |
| 4.0x or more | 80 (17.5%) | 42 (17.4%) |
| Total | 458 (100.0%) | 241 (100.0%) |
Real Estate Taxes by Mortgage Status in Kiowa County
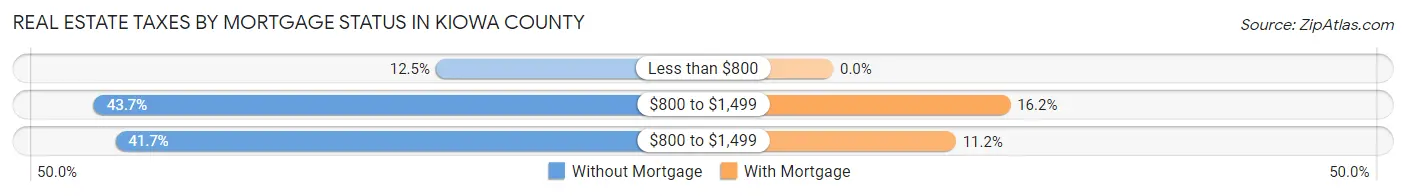
| Property Taxes | Without Mortgage | With Mortgage |
| Less than $800 | 57 (12.4%) | 0 (0.0%) |
| $800 to $1,499 | 200 (43.7%) | 39 (16.2%) |
| $800 to $1,499 | 191 (41.7%) | 27 (11.2%) |
| Total | 458 (100.0%) | 241 (100.0%) |
Health & Disability in Kiowa County
Health Insurance Coverage by Age in Kiowa County
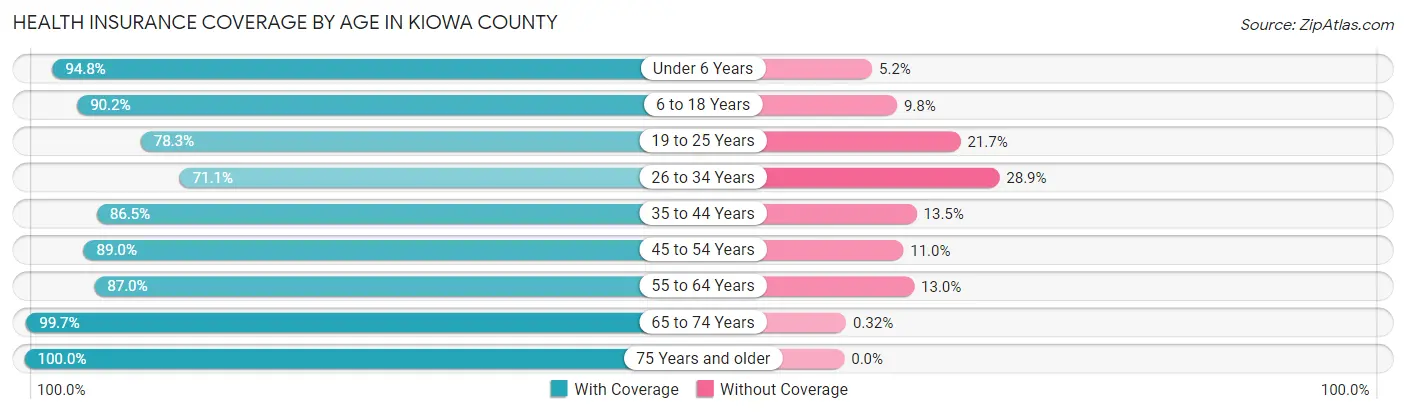
| Age Bracket | With Coverage | Without Coverage |
| Under 6 Years | 146 (94.8%) | 8 (5.2%) |
| 6 to 18 Years | 395 (90.2%) | 43 (9.8%) |
| 19 to 25 Years | 159 (78.3%) | 44 (21.7%) |
| 26 to 34 Years | 204 (71.1%) | 83 (28.9%) |
| 35 to 44 Years | 199 (86.5%) | 31 (13.5%) |
| 45 to 54 Years | 202 (89.0%) | 25 (11.0%) |
| 55 to 64 Years | 274 (87.0%) | 41 (13.0%) |
| 65 to 74 Years | 315 (99.7%) | 1 (0.3%) |
| 75 Years and older | 207 (100.0%) | 0 (0.0%) |
| Total | 2,101 (88.4%) | 276 (11.6%) |
Health Insurance Coverage by Citizenship Status in Kiowa County

| Citizenship Status | With Coverage | Without Coverage |
| Native Born | 146 (94.8%) | 8 (5.2%) |
| Foreign Born, Citizen | 395 (90.2%) | 43 (9.8%) |
| Foreign Born, not a Citizen | 159 (78.3%) | 44 (21.7%) |
Health Insurance Coverage by Household Income in Kiowa County
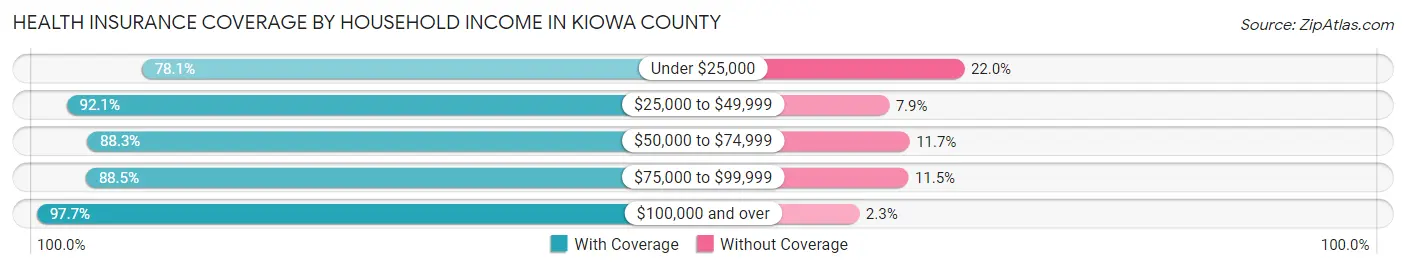
| Household Income | With Coverage | Without Coverage |
| Under $25,000 | 128 (78.0%) | 36 (22.0%) |
| $25,000 to $49,999 | 258 (92.1%) | 22 (7.9%) |
| $50,000 to $74,999 | 476 (88.3%) | 63 (11.7%) |
| $75,000 to $99,999 | 479 (88.5%) | 62 (11.5%) |
| $100,000 and over | 688 (97.7%) | 16 (2.3%) |
Public vs Private Health Insurance Coverage by Age in Kiowa County
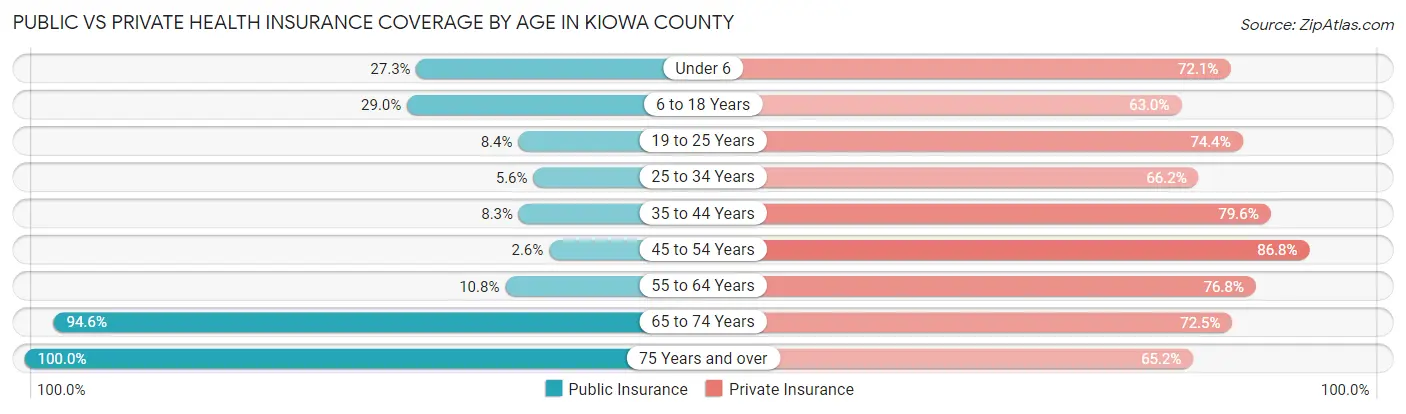
| Age Bracket | Public Insurance | Private Insurance |
| Under 6 | 42 (27.3%) | 111 (72.1%) |
| 6 to 18 Years | 127 (29.0%) | 276 (63.0%) |
| 19 to 25 Years | 17 (8.4%) | 151 (74.4%) |
| 25 to 34 Years | 16 (5.6%) | 190 (66.2%) |
| 35 to 44 Years | 19 (8.3%) | 183 (79.6%) |
| 45 to 54 Years | 6 (2.6%) | 197 (86.8%) |
| 55 to 64 Years | 34 (10.8%) | 242 (76.8%) |
| 65 to 74 Years | 299 (94.6%) | 229 (72.5%) |
| 75 Years and over | 207 (100.0%) | 135 (65.2%) |
| Total | 767 (32.3%) | 1,714 (72.1%) |
Disability Status by Sex by Age in Kiowa County
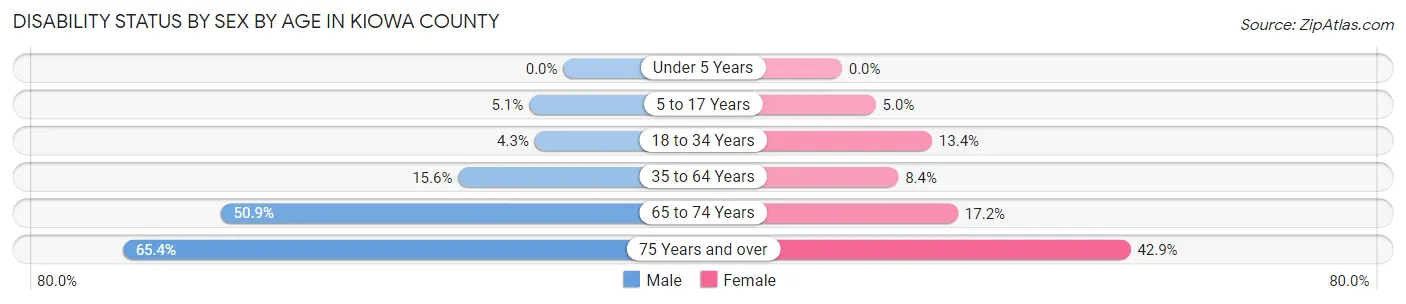
| Age Bracket | Male | Female |
| Under 5 Years | 0 (0.0%) | 0 (0.0%) |
| 5 to 17 Years | 10 (5.1%) | 11 (5.0%) |
| 18 to 34 Years | 9 (4.3%) | 42 (13.4%) |
| 35 to 64 Years | 59 (15.6%) | 33 (8.4%) |
| 65 to 74 Years | 87 (50.9%) | 25 (17.2%) |
| 75 Years and over | 53 (65.4%) | 54 (42.9%) |
Disability Class by Sex by Age in Kiowa County
Disability Class: Hearing Difficulty

| Age Bracket | Male | Female |
| Under 5 Years | 0 (0.0%) | 0 (0.0%) |
| 5 to 17 Years | 5 (2.5%) | 0 (0.0%) |
| 18 to 34 Years | 9 (4.3%) | 9 (2.9%) |
| 35 to 64 Years | 33 (8.7%) | 1 (0.3%) |
| 65 to 74 Years | 70 (40.9%) | 7 (4.8%) |
| 75 Years and over | 30 (37.0%) | 36 (28.6%) |
Disability Class: Vision Difficulty
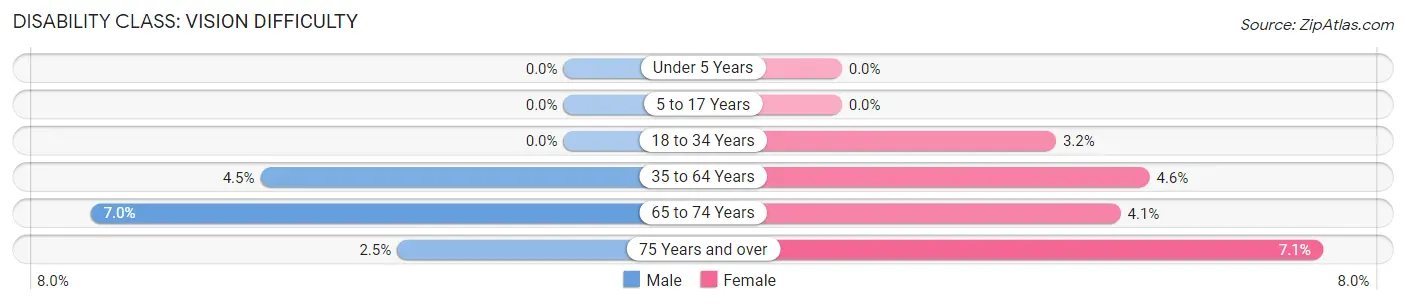
| Age Bracket | Male | Female |
| Under 5 Years | 0 (0.0%) | 0 (0.0%) |
| 5 to 17 Years | 0 (0.0%) | 0 (0.0%) |
| 18 to 34 Years | 0 (0.0%) | 10 (3.2%) |
| 35 to 64 Years | 17 (4.5%) | 18 (4.6%) |
| 65 to 74 Years | 12 (7.0%) | 6 (4.1%) |
| 75 Years and over | 2 (2.5%) | 9 (7.1%) |
Disability Class: Cognitive Difficulty
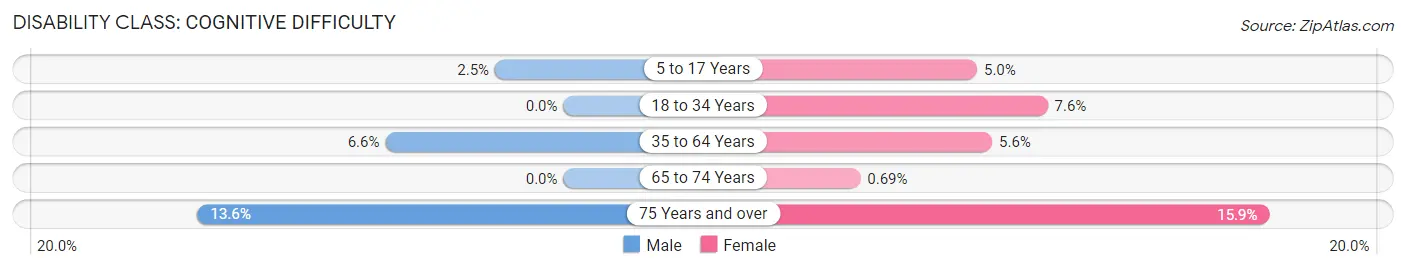
| Age Bracket | Male | Female |
| 5 to 17 Years | 5 (2.5%) | 11 (5.0%) |
| 18 to 34 Years | 0 (0.0%) | 24 (7.6%) |
| 35 to 64 Years | 25 (6.6%) | 22 (5.6%) |
| 65 to 74 Years | 0 (0.0%) | 1 (0.7%) |
| 75 Years and over | 11 (13.6%) | 20 (15.9%) |
Disability Class: Ambulatory Difficulty
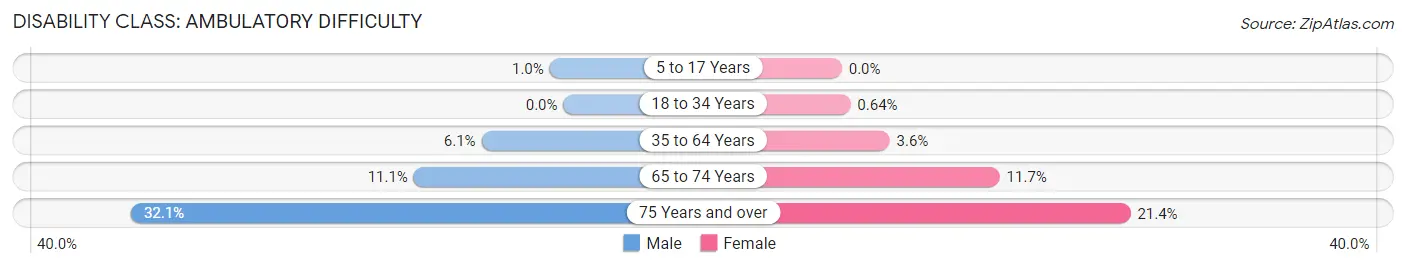
| Age Bracket | Male | Female |
| 5 to 17 Years | 2 (1.0%) | 0 (0.0%) |
| 18 to 34 Years | 0 (0.0%) | 2 (0.6%) |
| 35 to 64 Years | 23 (6.1%) | 14 (3.5%) |
| 65 to 74 Years | 19 (11.1%) | 17 (11.7%) |
| 75 Years and over | 26 (32.1%) | 27 (21.4%) |
Disability Class: Self-Care Difficulty
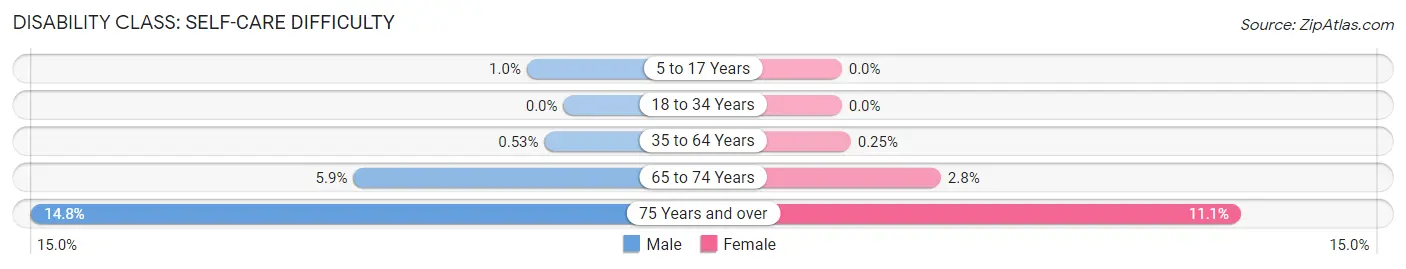
| Age Bracket | Male | Female |
| 5 to 17 Years | 2 (1.0%) | 0 (0.0%) |
| 18 to 34 Years | 0 (0.0%) | 0 (0.0%) |
| 35 to 64 Years | 2 (0.5%) | 1 (0.3%) |
| 65 to 74 Years | 10 (5.9%) | 4 (2.8%) |
| 75 Years and over | 12 (14.8%) | 14 (11.1%) |
Technology Access in Kiowa County
Computing Device Access in Kiowa County
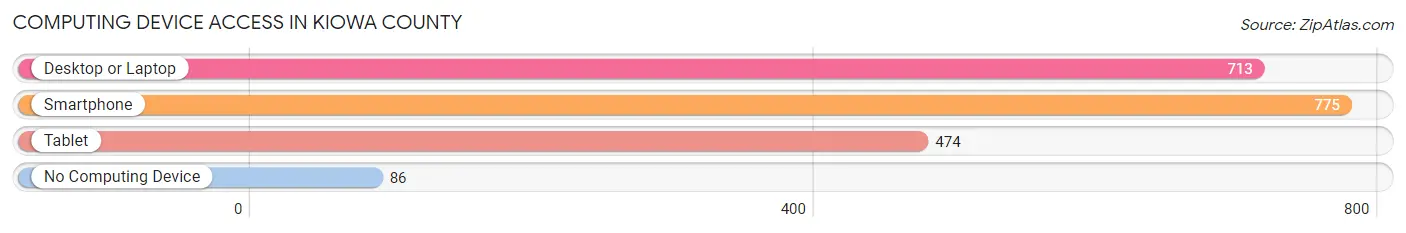
| Device Type | # Households | % Households |
| Desktop or Laptop | 713 | 76.9% |
| Smartphone | 775 | 83.6% |
| Tablet | 474 | 51.1% |
| No Computing Device | 86 | 9.3% |
| Total | 927 | 100.0% |
Internet Access in Kiowa County

| Internet Type | # Households | % Households |
| Dial-Up Internet | 3 | 0.3% |
| Broadband Home | 515 | 55.6% |
| Cellular Data Only | 92 | 9.9% |
| Satellite Internet | 142 | 15.3% |
| No Internet | 194 | 20.9% |
| Total | 927 | 100.0% |
Kiowa County Summary
Kiowa County is located in the southwestern corner of Kansas, and is bordered by Edwards County to the north, Clark County to the east, Comanche County to the south, and Barber County to the west. The county seat is Greensburg, and the county was named after the Kiowa tribe of Native Americans. As of the 2010 census, the population of Kiowa County was 3,053, making it the second least populous county in Kansas.
Geography
Kiowa County covers an area of 1,092 square miles, making it the fourth largest county in Kansas. The county is mostly flat, with some rolling hills in the eastern part of the county. The county is drained by the Arkansas River, which flows through the northern part of the county. The county is mostly covered in grassland, with some areas of cropland and woodlands.
Climate
Kiowa County has a semi-arid climate, with hot summers and cold winters. The average annual temperature is around 55°F, with average highs in the summer reaching around 90°F and average lows in the winter reaching around 20°F. The average annual precipitation is around 22 inches, with most of the precipitation falling in the spring and summer months.
Demographics
As of the 2010 census, the population of Kiowa County was 3,053, with a population density of 2.8 people per square mile. The racial makeup of the county was 95.2% White, 0.7% Black or African American, 0.7% Native American, 0.2% Asian, 0.1% Pacific Islander, 1.7% from other races, and 1.4% from two or more races. Hispanic or Latino of any race were 3.3% of the population.
The median income for a household in the county was $37,917, and the median income for a family was $45,000. The per capita income for the county was $17,945. About 11.2% of families and 14.2% of the population were below the poverty line, including 17.2% of those under age 18 and 11.2% of those age 65 or over.
Economy
Kiowa County’s economy is largely based on agriculture, with wheat, sorghum, and hay being the main crops. Cattle and sheep are also raised in the county. The county also has some oil and gas production, as well as some manufacturing. The county is home to several small businesses, including a few restaurants, a grocery store, and a few retail stores.
History
Kiowa County was established in 1886, and was named after the Kiowa tribe of Native Americans. The county was originally part of Comanche County, and was created to provide better access to the county seat of Greensburg. The county was largely settled by farmers and ranchers, and the economy was based on agriculture.
In 2007, the town of Greensburg was devastated by an EF5 tornado, which destroyed 95% of the town. The town was rebuilt, and is now a model of green building and sustainability. The town is now powered by 100% renewable energy, and is home to the world’s largest wind turbine.
Kiowa County is a rural county with a rich history and a bright future. The county is home to a variety of businesses and industries, and is a great place to live and work.
Common Questions
What is the Total Population of Kiowa County?
Total Population of Kiowa County is 2,445.
What is the Total Male Population of Kiowa County?
Total Male Population of Kiowa County is 1,150.
What is the Total Female Population of Kiowa County?
Total Female Population of Kiowa County is 1,295.
What is the Ratio of Males per 100 Females in Kiowa County?
There are 88.80 Males per 100 Females in Kiowa County.
What is the Ratio of Females per 100 Males in Kiowa County?
There are 112.61 Females per 100 Males in Kiowa County.
What is the Median Population Age in Kiowa County?
Median Population Age in Kiowa County is 41.5 Years.
What is the Average Family Size in Kiowa County
Average Family Size in Kiowa County is 3.1 People.
What is the Average Household Size in Kiowa County
Average Household Size in Kiowa County is 2.4 People.
What is Per Capita Income in Kiowa County?
Per Capita income in Kiowa County is $35,199.
What is the Median Family Income in Kiowa County?
Median Family Income in Kiowa County is $76,681.
What is the Median Household income in Kiowa County?
Median Household Income in Kiowa County is $70,347.
What is Income or Wage Gap in Kiowa County?
Income or Wage Gap in Kiowa County is 57.8%.
Women in Kiowa County earn 42.2 cents for every dollar earned by a man.
What is Inequality or Gini Index in Kiowa County?
Inequality or Gini Index in Kiowa County is 0.43.
How Large is the Labor Force in Kiowa County?
There are 1,294 People in the Labor Forcein in Kiowa County.
What is the Percentage of People in the Labor Force in Kiowa County?
66.1% of People are in the Labor Force in Kiowa County.
What is the Unemployment Rate in Kiowa County?
Unemployment Rate in Kiowa County is 3.6%.