Johnson County, KS
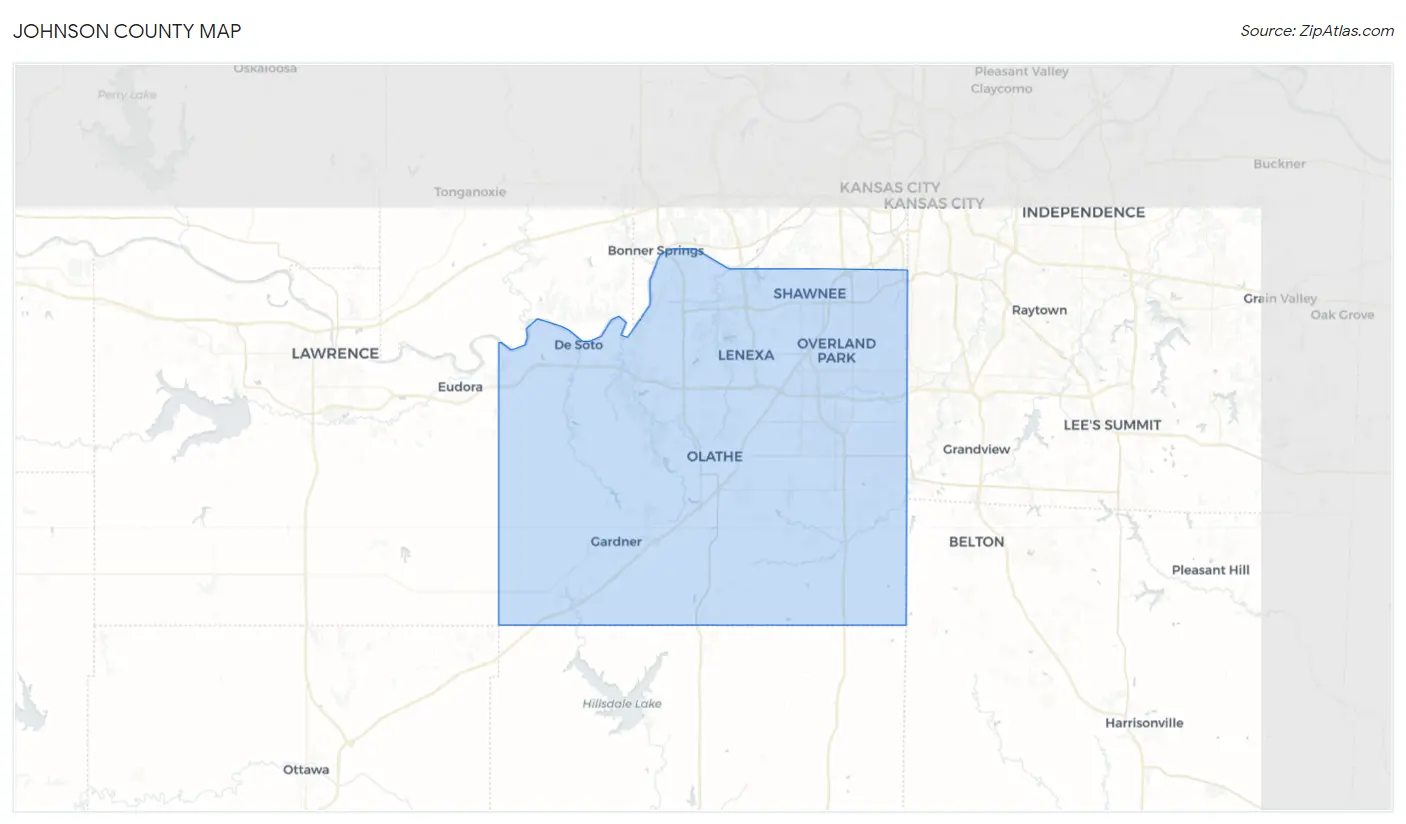
Johnson County Map
Johnson County Overview
610,742
TOTAL POPULATION
302,382
MALE POPULATION
308,360
FEMALE POPULATION
98.06
MALES / 100 FEMALES
101.98
FEMALES / 100 MALES
38.1
MEDIAN AGE
3.1
AVG FAMILY SIZE
2.5
AVG HOUSEHOLD SIZE
$56,364
PER CAPITA INCOME
$126,651
AVG FAMILY INCOME
$103,644
AVG HOUSEHOLD INCOME
31.5%
WAGE / INCOME GAP [ % ]
68.5¢/ $1
WAGE / INCOME GAP [ $ ]
$10,540
FAMILY INCOME DEFICIT
0.45
INEQUALITY / GINI INDEX
347,458
LABOR FORCE [ PEOPLE ]
71.9%
PERCENT IN LABOR FORCE
3.2%
UNEMPLOYMENT RATE
Johnson County Area Codes
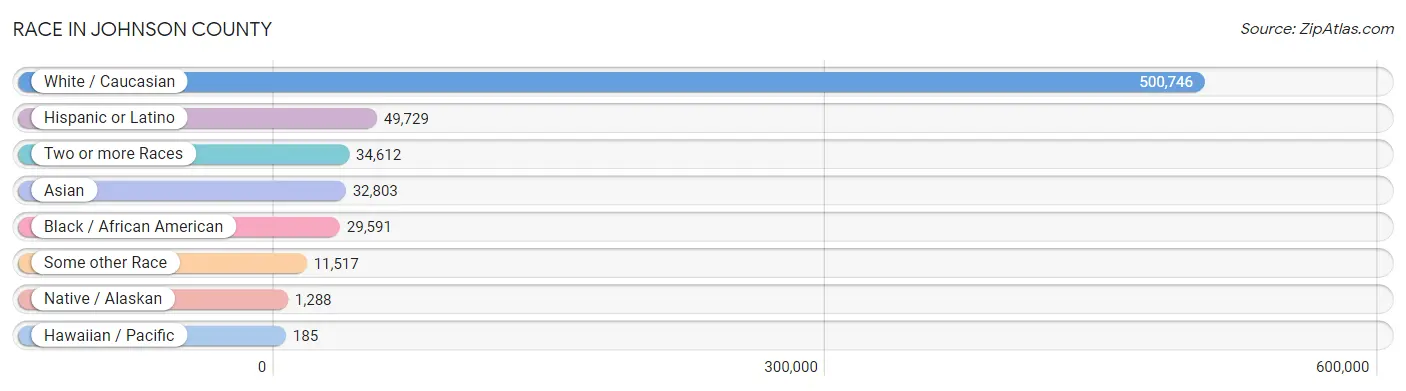
Race in Johnson County
The most populous races in Johnson County are White / Caucasian (500,746 | 82.0%), Hispanic or Latino (49,729 | 8.1%), and Two or more Races (34,612 | 5.7%).
| Race | # Population | % Population |
| Asian | 32,803 | 5.4% |
| Black / African American | 29,591 | 4.9% |
| Hawaiian / Pacific | 185 | 0.0% |
| Hispanic or Latino | 49,729 | 8.1% |
| Native / Alaskan | 1,288 | 0.2% |
| White / Caucasian | 500,746 | 82.0% |
| Two or more Races | 34,612 | 5.7% |
| Some other Race | 11,517 | 1.9% |
| Total | 610,742 | 100.0% |
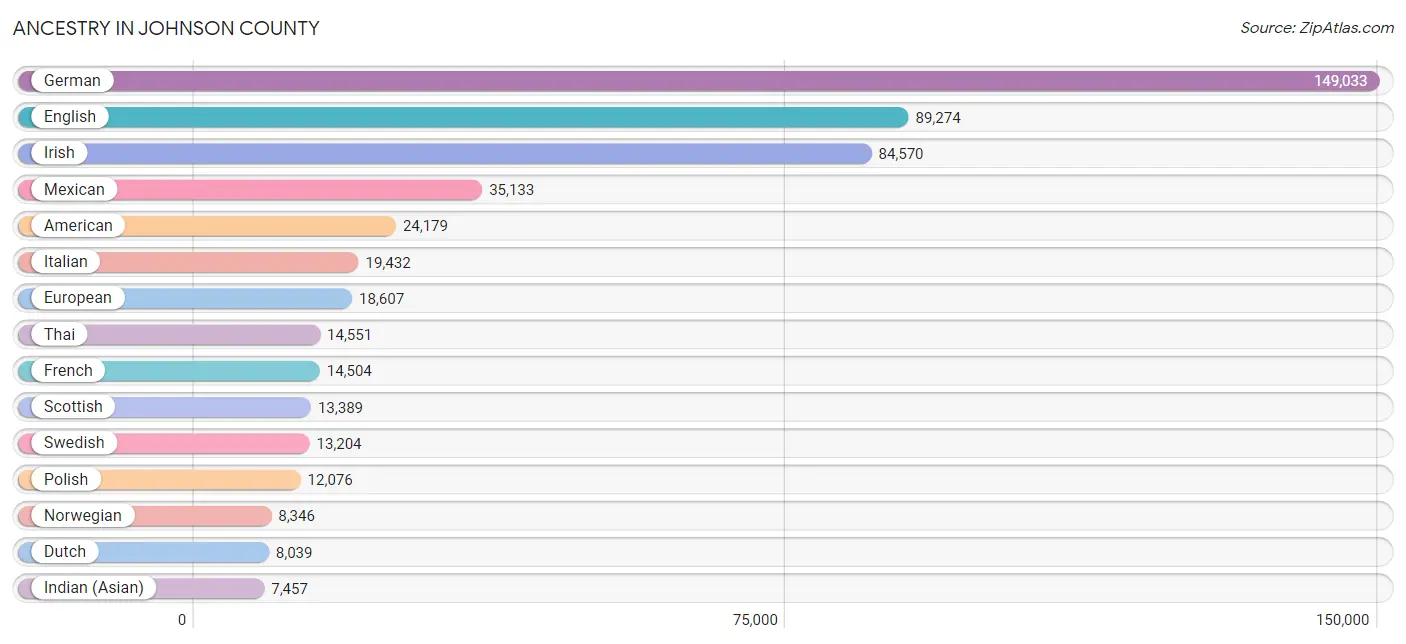
Ancestry in Johnson County
The most populous ancestries reported in Johnson County are German (149,033 | 24.4%), English (89,274 | 14.6%), Irish (84,570 | 13.9%), Mexican (35,133 | 5.8%), and American (24,179 | 4.0%), together accounting for 62.6% of all Johnson County residents.
| Ancestry | # Population | % Population |
| Afghan | 499 | 0.1% |
| African | 2,542 | 0.4% |
| Alaska Native | 30 | 0.0% |
| Albanian | 72 | 0.0% |
| Alsatian | 7 | 0.0% |
| American | 24,179 | 4.0% |
| Apache | 97 | 0.0% |
| Arab | 4,127 | 0.7% |
| Arapaho | 7 | 0.0% |
| Argentinean | 337 | 0.1% |
| Armenian | 249 | 0.0% |
| Australian | 62 | 0.0% |
| Austrian | 1,682 | 0.3% |
| Bahamian | 2 | 0.0% |
| Bangladeshi | 647 | 0.1% |
| Basque | 33 | 0.0% |
| Belgian | 2,254 | 0.4% |
| Bhutanese | 1,970 | 0.3% |
| Blackfeet | 448 | 0.1% |
| Bolivian | 109 | 0.0% |
| Brazilian | 886 | 0.2% |
| British | 5,511 | 0.9% |
| British West Indian | 17 | 0.0% |
| Bulgarian | 116 | 0.0% |
| Burmese | 2,794 | 0.5% |
| Cajun | 90 | 0.0% |
| Canadian | 690 | 0.1% |
| Celtic | 246 | 0.0% |
| Central American | 4,911 | 0.8% |
| Central American Indian | 146 | 0.0% |
| Cherokee | 1,913 | 0.3% |
| Chickasaw | 150 | 0.0% |
| Chilean | 14 | 0.0% |
| Chinese | 7 | 0.0% |
| Chippewa | 187 | 0.0% |
| Choctaw | 303 | 0.1% |
| Colombian | 860 | 0.1% |
| Colville | 7 | 0.0% |
| Comanche | 70 | 0.0% |
| Costa Rican | 33 | 0.0% |
| Cree | 37 | 0.0% |
| Creek | 158 | 0.0% |
| Croatian | 2,507 | 0.4% |
| Crow | 40 | 0.0% |
| Cuban | 894 | 0.2% |
| Czech | 4,283 | 0.7% |
| Czechoslovakian | 521 | 0.1% |
| Danish | 4,170 | 0.7% |
| Delaware | 175 | 0.0% |
| Dominican | 301 | 0.1% |
| Dutch | 8,039 | 1.3% |
| Eastern European | 2,073 | 0.3% |
| Ecuadorian | 315 | 0.1% |
| Egyptian | 161 | 0.0% |
| English | 89,274 | 14.6% |
| Estonian | 24 | 0.0% |
| Ethiopian | 1,124 | 0.2% |
| European | 18,607 | 3.0% |
| Fijian | 7 | 0.0% |
| Filipino | 579 | 0.1% |
| Finnish | 524 | 0.1% |
| French | 14,504 | 2.4% |
| French Canadian | 1,308 | 0.2% |
| German | 149,033 | 24.4% |
| German Russian | 165 | 0.0% |
| Ghanaian | 377 | 0.1% |
| Greek | 1,196 | 0.2% |
| Guamanian / Chamorro | 164 | 0.0% |
| Guatemalan | 2,140 | 0.4% |
| Guyanese | 34 | 0.0% |
| Haitian | 412 | 0.1% |
| Honduran | 1,082 | 0.2% |
| Hopi | 20 | 0.0% |
| Hungarian | 1,995 | 0.3% |
| Icelander | 45 | 0.0% |
| Indian (Asian) | 7,457 | 1.2% |
| Indonesian | 328 | 0.1% |
| Inupiat | 12 | 0.0% |
| Iranian | 1,321 | 0.2% |
| Iraqi | 383 | 0.1% |
| Irish | 84,570 | 13.9% |
| Iroquois | 215 | 0.0% |
| Israeli | 93 | 0.0% |
| Italian | 19,432 | 3.2% |
| Jamaican | 315 | 0.1% |
| Japanese | 79 | 0.0% |
| Jordanian | 566 | 0.1% |
| Kenyan | 1,629 | 0.3% |
| Kiowa | 29 | 0.0% |
| Korean | 2,383 | 0.4% |
| Laotian | 557 | 0.1% |
| Latvian | 121 | 0.0% |
| Lebanese | 1,012 | 0.2% |
| Liberian | 14 | 0.0% |
| Lithuanian | 764 | 0.1% |
| Luxembourger | 253 | 0.0% |
| Malaysian | 1,178 | 0.2% |
| Mexican | 35,133 | 5.8% |
| Mexican American Indian | 253 | 0.0% |
| Mongolian | 257 | 0.0% |
| Native Hawaiian | 301 | 0.1% |
| Navajo | 43 | 0.0% |
| New Zealander | 43 | 0.0% |
| Nicaraguan | 208 | 0.0% |
| Nigerian | 503 | 0.1% |
| Northern European | 1,418 | 0.2% |
| Norwegian | 8,346 | 1.4% |
| Okinawan | 36 | 0.0% |
| Osage | 48 | 0.0% |
| Ottawa | 3 | 0.0% |
| Pakistani | 814 | 0.1% |
| Palestinian | 450 | 0.1% |
| Panamanian | 234 | 0.0% |
| Paraguayan | 73 | 0.0% |
| Pennsylvania German | 140 | 0.0% |
| Peruvian | 899 | 0.2% |
| Polish | 12,076 | 2.0% |
| Portuguese | 492 | 0.1% |
| Potawatomi | 147 | 0.0% |
| Pueblo | 22 | 0.0% |
| Puerto Rican | 2,149 | 0.4% |
| Puget Sound Salish | 24 | 0.0% |
| Romanian | 551 | 0.1% |
| Russian | 4,644 | 0.8% |
| Salvadoran | 1,187 | 0.2% |
| Samoan | 65 | 0.0% |
| Scandinavian | 2,492 | 0.4% |
| Scotch-Irish | 6,914 | 1.1% |
| Scottish | 13,389 | 2.2% |
| Seminole | 41 | 0.0% |
| Senegalese | 40 | 0.0% |
| Serbian | 227 | 0.0% |
| Sioux | 182 | 0.0% |
| Slavic | 161 | 0.0% |
| Slovak | 617 | 0.1% |
| Slovene | 415 | 0.1% |
| Somali | 81 | 0.0% |
| South African | 155 | 0.0% |
| South American | 3,471 | 0.6% |
| South American Indian | 51 | 0.0% |
| Spaniard | 879 | 0.1% |
| Spanish | 705 | 0.1% |
| Spanish American | 15 | 0.0% |
| Sri Lankan | 3,516 | 0.6% |
| Subsaharan African | 7,216 | 1.2% |
| Sudanese | 42 | 0.0% |
| Swedish | 13,204 | 2.2% |
| Swiss | 3,230 | 0.5% |
| Syrian | 138 | 0.0% |
| Thai | 14,551 | 2.4% |
| Tohono O'Odham | 15 | 0.0% |
| Tongan | 5 | 0.0% |
| Trinidadian and Tobagonian | 34 | 0.0% |
| Turkish | 373 | 0.1% |
| Ugandan | 116 | 0.0% |
| Ukrainian | 1,623 | 0.3% |
| Uruguayan | 52 | 0.0% |
| Ute | 13 | 0.0% |
| Venezuelan | 649 | 0.1% |
| Vietnamese | 292 | 0.1% |
| Welsh | 5,958 | 1.0% |
| West Indian | 144 | 0.0% |
| Yugoslavian | 122 | 0.0% |
| Yup'ik | 5 | 0.0% | View All 164 Rows |
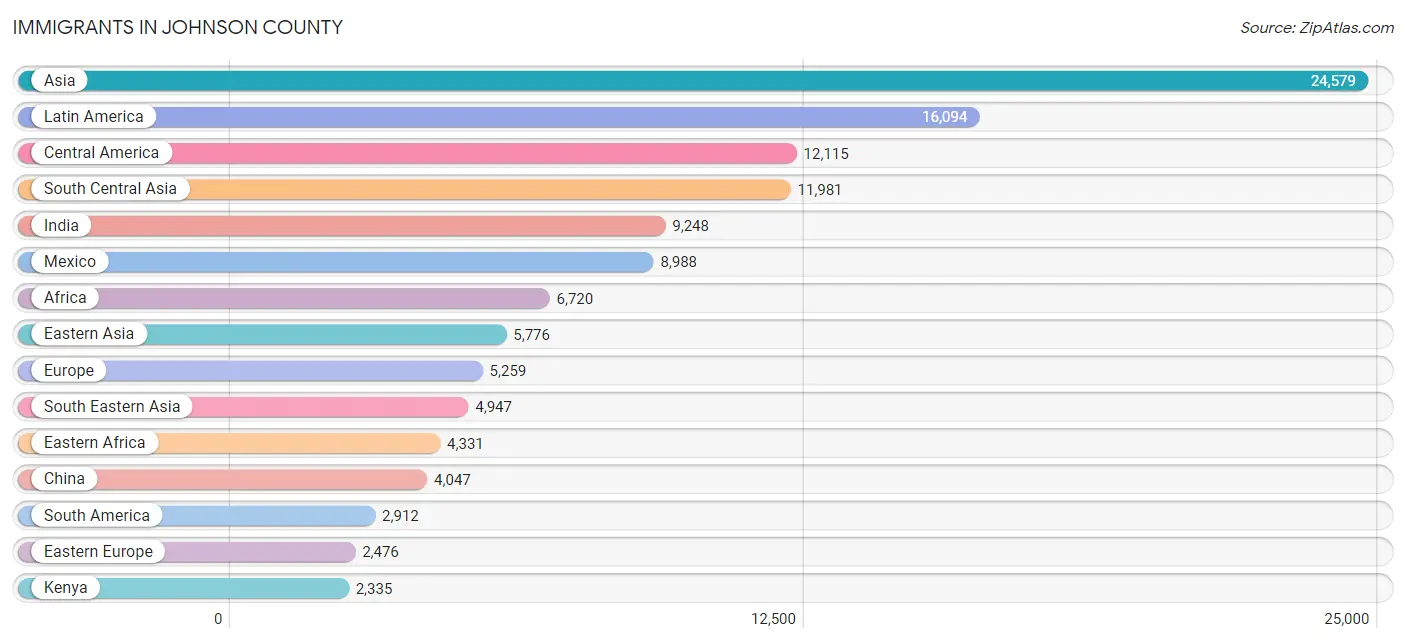
Immigrants in Johnson County
The most numerous immigrant groups reported in Johnson County came from Asia (24,579 | 4.0%), Latin America (16,094 | 2.6%), Central America (12,115 | 2.0%), South Central Asia (11,981 | 2.0%), and India (9,248 | 1.5%), together accounting for 12.1% of all Johnson County residents.
| Immigration Origin | # Population | % Population |
| Afghanistan | 287 | 0.1% |
| Africa | 6,720 | 1.1% |
| Albania | 50 | 0.0% |
| Argentina | 93 | 0.0% |
| Asia | 24,579 | 4.0% |
| Australia | 100 | 0.0% |
| Austria | 7 | 0.0% |
| Bahamas | 20 | 0.0% |
| Bangladesh | 509 | 0.1% |
| Belarus | 93 | 0.0% |
| Belgium | 13 | 0.0% |
| Bolivia | 96 | 0.0% |
| Bosnia and Herzegovina | 19 | 0.0% |
| Brazil | 912 | 0.2% |
| Bulgaria | 91 | 0.0% |
| Cambodia | 22 | 0.0% |
| Cameroon | 73 | 0.0% |
| Canada | 821 | 0.1% |
| Caribbean | 1,067 | 0.2% |
| Central America | 12,115 | 2.0% |
| China | 4,047 | 0.7% |
| Colombia | 463 | 0.1% |
| Congo | 45 | 0.0% |
| Costa Rica | 14 | 0.0% |
| Croatia | 24 | 0.0% |
| Cuba | 353 | 0.1% |
| Czechoslovakia | 82 | 0.0% |
| Denmark | 9 | 0.0% |
| Dominican Republic | 177 | 0.0% |
| Eastern Africa | 4,331 | 0.7% |
| Eastern Asia | 5,776 | 0.9% |
| Eastern Europe | 2,476 | 0.4% |
| Ecuador | 258 | 0.0% |
| Egypt | 215 | 0.0% |
| El Salvador | 611 | 0.1% |
| England | 662 | 0.1% |
| Ethiopia | 1,373 | 0.2% |
| Europe | 5,259 | 0.9% |
| Fiji | 41 | 0.0% |
| France | 211 | 0.0% |
| Germany | 854 | 0.1% |
| Ghana | 369 | 0.1% |
| Greece | 47 | 0.0% |
| Guatemala | 1,692 | 0.3% |
| Guyana | 19 | 0.0% |
| Haiti | 264 | 0.0% |
| Honduras | 583 | 0.1% |
| Hong Kong | 324 | 0.1% |
| Hungary | 86 | 0.0% |
| India | 9,248 | 1.5% |
| Indonesia | 283 | 0.1% |
| Iran | 990 | 0.2% |
| Iraq | 445 | 0.1% |
| Ireland | 126 | 0.0% |
| Israel | 99 | 0.0% |
| Italy | 107 | 0.0% |
| Jamaica | 163 | 0.0% |
| Japan | 396 | 0.1% |
| Jordan | 407 | 0.1% |
| Kazakhstan | 16 | 0.0% |
| Kenya | 2,335 | 0.4% |
| Korea | 1,333 | 0.2% |
| Kuwait | 169 | 0.0% |
| Laos | 641 | 0.1% |
| Latin America | 16,094 | 2.6% |
| Lebanon | 107 | 0.0% |
| Liberia | 7 | 0.0% |
| Malaysia | 173 | 0.0% |
| Mexico | 8,988 | 1.5% |
| Micronesia | 3 | 0.0% |
| Middle Africa | 138 | 0.0% |
| Moldova | 265 | 0.0% |
| Nepal | 117 | 0.0% |
| Netherlands | 81 | 0.0% |
| Nicaragua | 132 | 0.0% |
| Nigeria | 373 | 0.1% |
| Northern Africa | 702 | 0.1% |
| Northern Europe | 1,304 | 0.2% |
| Norway | 33 | 0.0% |
| Oceania | 242 | 0.0% |
| Pakistan | 580 | 0.1% |
| Panama | 95 | 0.0% |
| Peru | 365 | 0.1% |
| Philippines | 1,254 | 0.2% |
| Poland | 70 | 0.0% |
| Portugal | 39 | 0.0% |
| Romania | 301 | 0.1% |
| Russia | 723 | 0.1% |
| Saudi Arabia | 243 | 0.0% |
| Scotland | 64 | 0.0% |
| Senegal | 37 | 0.0% |
| Serbia | 16 | 0.0% |
| Sierra Leone | 70 | 0.0% |
| Singapore | 68 | 0.0% |
| Somalia | 17 | 0.0% |
| South Africa | 238 | 0.0% |
| South America | 2,912 | 0.5% |
| South Central Asia | 11,981 | 2.0% |
| South Eastern Asia | 4,947 | 0.8% |
| Southern Europe | 259 | 0.0% |
| Spain | 66 | 0.0% |
| Sri Lanka | 79 | 0.0% |
| Sudan | 42 | 0.0% |
| Switzerland | 37 | 0.0% |
| Syria | 89 | 0.0% |
| Taiwan | 919 | 0.2% |
| Thailand | 484 | 0.1% |
| Trinidad and Tobago | 5 | 0.0% |
| Turkey | 140 | 0.0% |
| Uganda | 116 | 0.0% |
| Ukraine | 513 | 0.1% |
| Uruguay | 29 | 0.0% |
| Uzbekistan | 81 | 0.0% |
| Venezuela | 604 | 0.1% |
| Vietnam | 1,884 | 0.3% |
| Western Africa | 981 | 0.2% |
| Western Asia | 1,864 | 0.3% |
| Western Europe | 1,220 | 0.2% |
| Yemen | 24 | 0.0% |
| Zimbabwe | 31 | 0.0% | View All 120 Rows |
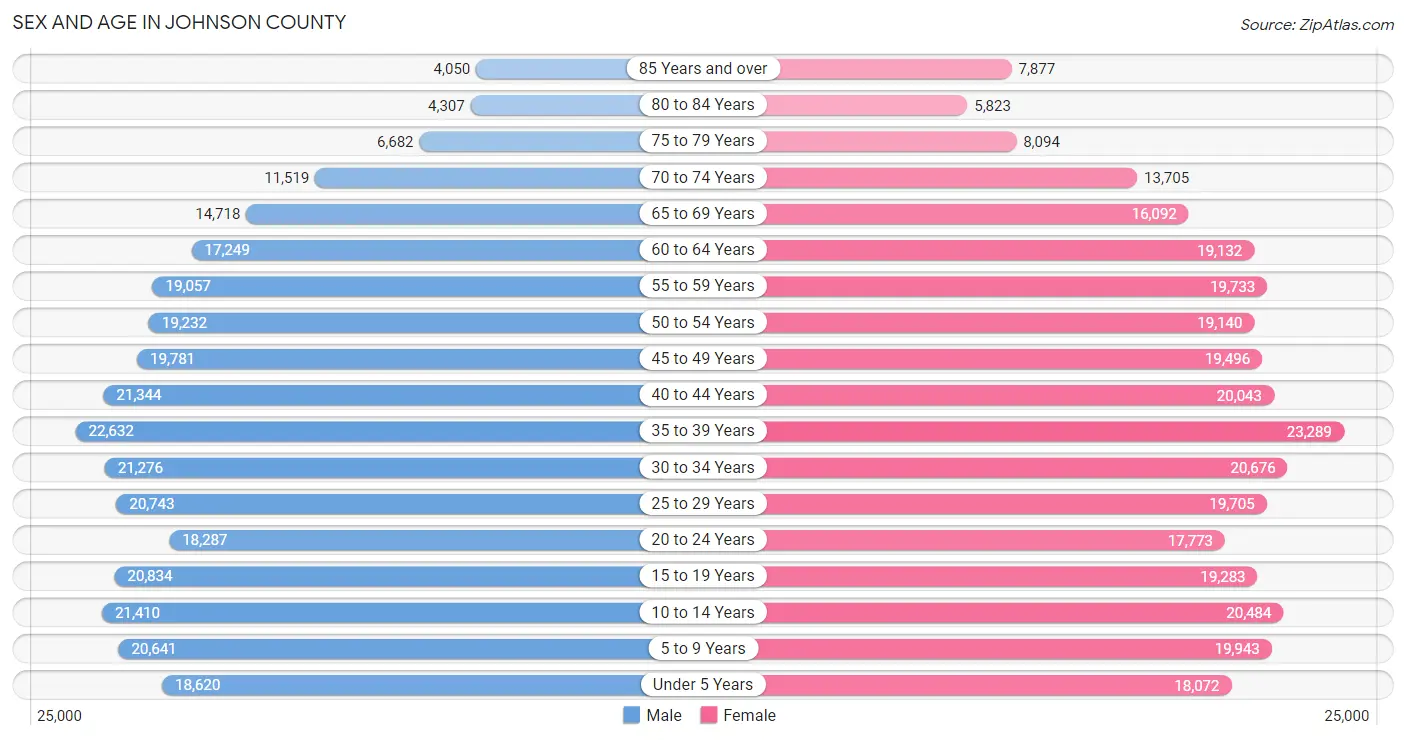
Sex and Age in Johnson County
Sex and Age in Johnson County
The most populous age groups in Johnson County are 35 to 39 Years (22,632 | 7.5%) for men and 35 to 39 Years (23,289 | 7.5%) for women.
| Age Bracket | Male | Female |
| Under 5 Years | 18,620 (6.2%) | 18,072 (5.9%) |
| 5 to 9 Years | 20,641 (6.8%) | 19,943 (6.5%) |
| 10 to 14 Years | 21,410 (7.1%) | 20,484 (6.6%) |
| 15 to 19 Years | 20,834 (6.9%) | 19,283 (6.2%) |
| 20 to 24 Years | 18,287 (6.0%) | 17,773 (5.8%) |
| 25 to 29 Years | 20,743 (6.9%) | 19,705 (6.4%) |
| 30 to 34 Years | 21,276 (7.0%) | 20,676 (6.7%) |
| 35 to 39 Years | 22,632 (7.5%) | 23,289 (7.5%) |
| 40 to 44 Years | 21,344 (7.1%) | 20,043 (6.5%) |
| 45 to 49 Years | 19,781 (6.5%) | 19,496 (6.3%) |
| 50 to 54 Years | 19,232 (6.4%) | 19,140 (6.2%) |
| 55 to 59 Years | 19,057 (6.3%) | 19,733 (6.4%) |
| 60 to 64 Years | 17,249 (5.7%) | 19,132 (6.2%) |
| 65 to 69 Years | 14,718 (4.9%) | 16,092 (5.2%) |
| 70 to 74 Years | 11,519 (3.8%) | 13,705 (4.4%) |
| 75 to 79 Years | 6,682 (2.2%) | 8,094 (2.6%) |
| 80 to 84 Years | 4,307 (1.4%) | 5,823 (1.9%) |
| 85 Years and over | 4,050 (1.3%) | 7,877 (2.5%) |
| Total | 302,382 (100.0%) | 308,360 (100.0%) |
Families and Households in Johnson County
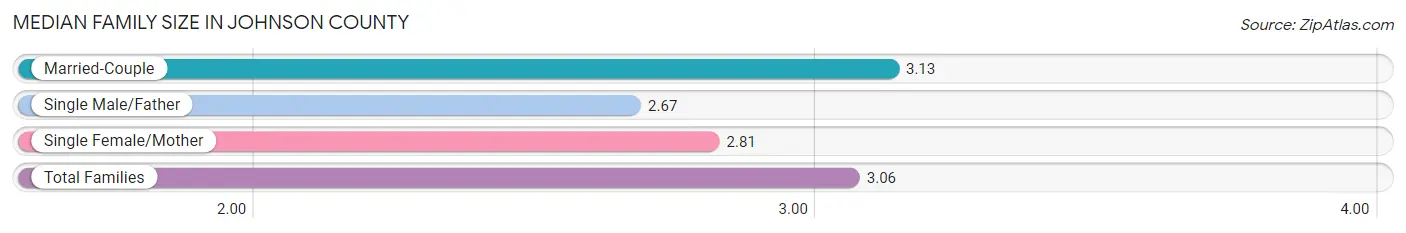
Median Family Size in Johnson County
The median family size in Johnson County is 3.06 persons per family, with married-couple families (134,107 | 82.9%) accounting for the largest median family size of 3.13 persons per family. On the other hand, single male/father families (8,765 | 5.4%) represent the smallest median family size with 2.67 persons per family.
| Family Type | # Families | Family Size |
| Married-Couple | 134,107 (82.9%) | 3.13 |
| Single Male/Father | 8,765 (5.4%) | 2.67 |
| Single Female/Mother | 18,899 (11.7%) | 2.81 |
| Total Families | 161,771 (100.0%) | 3.06 |
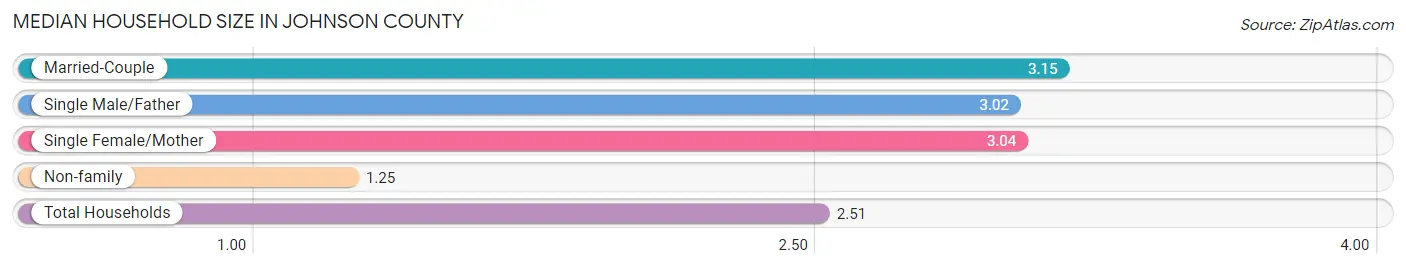
Median Household Size in Johnson County
The median household size in Johnson County is 2.51 persons per household, with married-couple households (134,107 | 55.6%) accounting for the largest median household size of 3.15 persons per household. non-family households (79,420 | 32.9%) represent the smallest median household size with 1.25 persons per household.
| Household Type | # Households | Household Size |
| Married-Couple | 134,107 (55.6%) | 3.15 |
| Single Male/Father | 8,765 (3.6%) | 3.02 |
| Single Female/Mother | 18,899 (7.8%) | 3.04 |
| Non-family | 79,420 (32.9%) | 1.25 |
| Total Households | 241,191 (100.0%) | 2.51 |
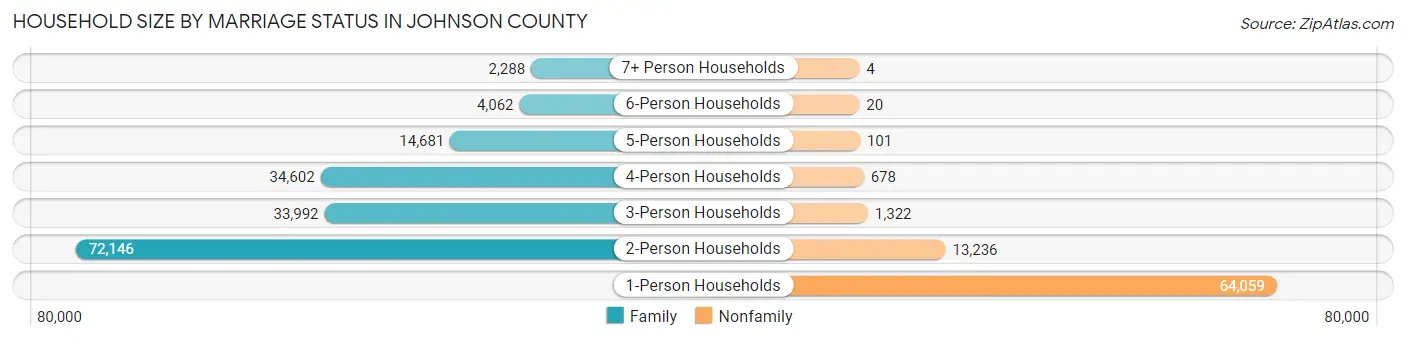
Household Size by Marriage Status in Johnson County
Out of a total of 241,191 households in Johnson County, 161,771 (67.1%) are family households, while 79,420 (32.9%) are nonfamily households. The most numerous type of family households are 2-person households, comprising 72,146, and the most common type of nonfamily households are 1-person households, comprising 64,059.
| Household Size | Family Households | Nonfamily Households |
| 1-Person Households | - | 64,059 (26.6%) |
| 2-Person Households | 72,146 (29.9%) | 13,236 (5.5%) |
| 3-Person Households | 33,992 (14.1%) | 1,322 (0.5%) |
| 4-Person Households | 34,602 (14.3%) | 678 (0.3%) |
| 5-Person Households | 14,681 (6.1%) | 101 (0.0%) |
| 6-Person Households | 4,062 (1.7%) | 20 (0.0%) |
| 7+ Person Households | 2,288 (0.9%) | 4 (0.0%) |
| Total | 161,771 (67.1%) | 79,420 (32.9%) |
Female Fertility in Johnson County
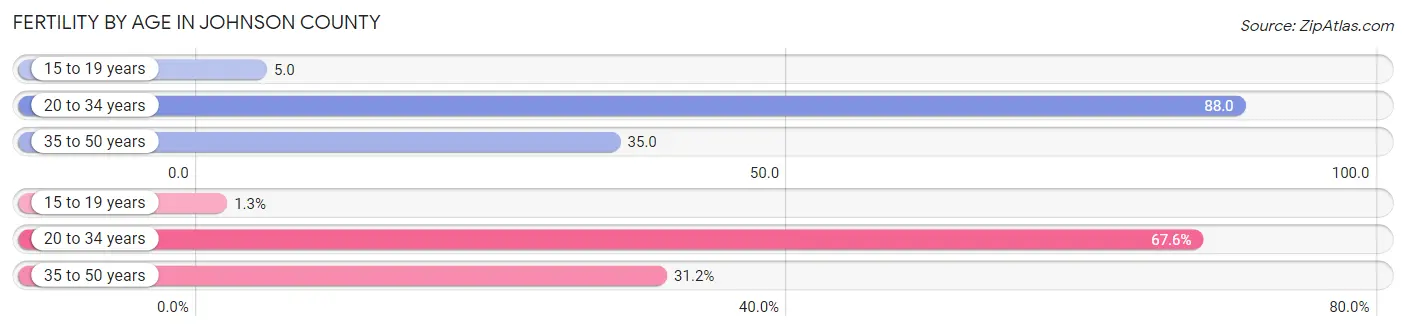
Fertility by Age in Johnson County
Average fertility rate in Johnson County is 52.0 births per 1,000 women. Women in the age bracket of 20 to 34 years have the highest fertility rate with 88.0 births per 1,000 women. Women in the age bracket of 20 to 34 years acount for 67.5% of all women with births.
| Age Bracket | Women with Births | Births / 1,000 Women |
| 15 to 19 years | 98 (1.3%) | 5.0 |
| 20 to 34 years | 5,101 (67.5%) | 88.0 |
| 35 to 50 years | 2,353 (31.2%) | 35.0 |
| Total | 7,552 (100.0%) | 52.0 |
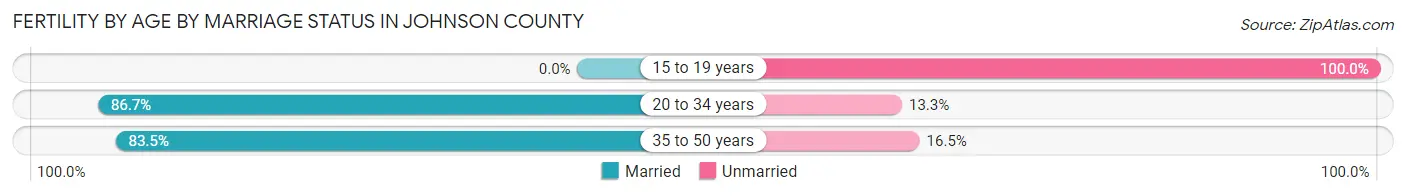
Fertility by Age by Marriage Status in Johnson County
84.6% of women with births (7,552) in Johnson County are married. The highest percentage of unmarried women with births falls into 15 to 19 years age bracket with 100.0% of them unmarried at the time of birth, while the lowest percentage of unmarried women with births belong to 20 to 34 years age bracket with 13.3% of them unmarried.
| Age Bracket | Married | Unmarried |
| 15 to 19 years | 0 (0.0%) | 98 (100.0%) |
| 20 to 34 years | 4,423 (86.7%) | 678 (13.3%) |
| 35 to 50 years | 1,965 (83.5%) | 388 (16.5%) |
| Total | 6,389 (84.6%) | 1,163 (15.4%) |
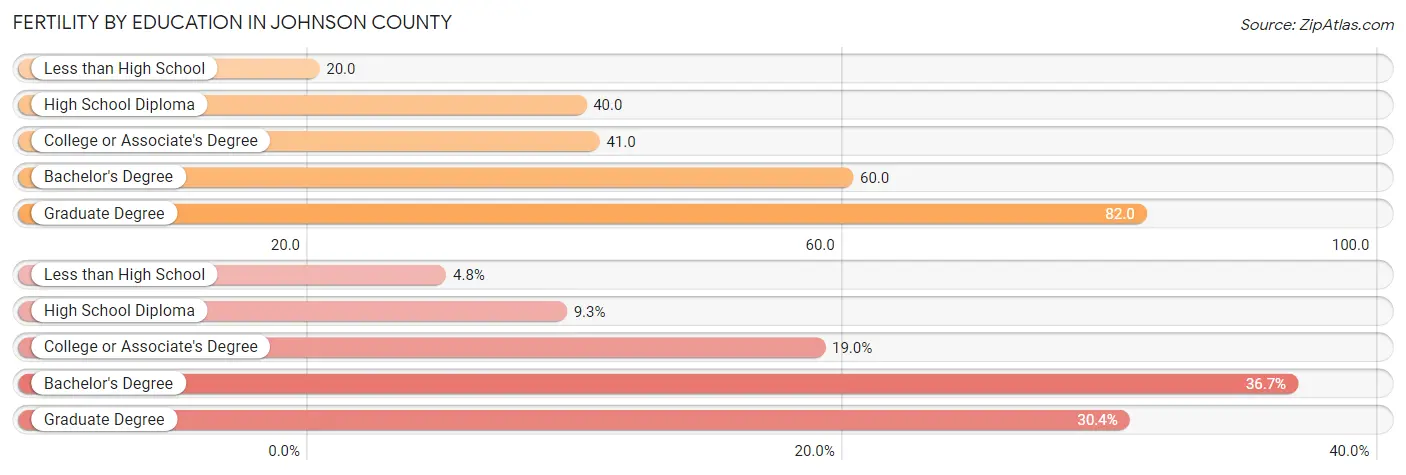
Fertility by Education in Johnson County
Average fertility rate in Johnson County is 52.0 births per 1,000 women. Women with the education attainment of graduate degree have the highest fertility rate of 82.0 births per 1,000 women, while women with the education attainment of less than high school have the lowest fertility at 20.0 births per 1,000 women. Women with the education attainment of bachelor's degree represent 36.7% of all women with births.
| Educational Attainment | Women with Births | Births / 1,000 Women |
| Less than High School | 359 (4.8%) | 20.0 |
| High School Diploma | 700 (9.3%) | 40.0 |
| College or Associate's Degree | 1,431 (19.0%) | 41.0 |
| Bachelor's Degree | 2,769 (36.7%) | 60.0 |
| Graduate Degree | 2,293 (30.4%) | 82.0 |
| Total | 7,552 (100.0%) | 52.0 |
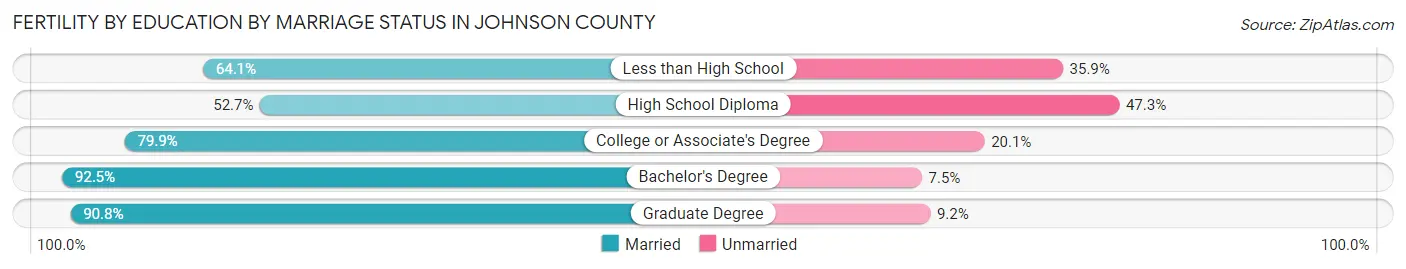
Fertility by Education by Marriage Status in Johnson County
15.4% of women with births in Johnson County are unmarried. Women with the educational attainment of bachelor's degree are most likely to be married with 92.5% of them married at childbirth, while women with the educational attainment of high school diploma are least likely to be married with 47.3% of them unmarried at childbirth.
| Educational Attainment | Married | Unmarried |
| Less than High School | 230 (64.1%) | 129 (35.9%) |
| High School Diploma | 369 (52.7%) | 331 (47.3%) |
| College or Associate's Degree | 1,143 (79.9%) | 288 (20.1%) |
| Bachelor's Degree | 2,561 (92.5%) | 208 (7.5%) |
| Graduate Degree | 2,082 (90.8%) | 211 (9.2%) |
| Total | 6,389 (84.6%) | 1,163 (15.4%) |
Income in Johnson County
Income Overview in Johnson County
Per Capita Income in Johnson County is $56,364, while median incomes of families and households are $126,651 and $103,644 respectively.
| Characteristic | Number | Measure |
| Per Capita Income | 610,742 | $56,364 |
| Median Family Income | 161,771 | $126,651 |
| Mean Family Income | 161,771 | $164,981 |
| Median Household Income | 241,191 | $103,644 |
| Mean Household Income | 241,191 | $138,482 |
| Income Deficit | 161,771 | $10,540 |
| Wage / Income Gap (%) | 610,742 | 31.50% |
| Wage / Income Gap ($) | 610,742 | 68.50¢ per $1 |
| Gini / Inequality Index | 610,742 | 0.45 |
Earnings by Sex in Johnson County
Average Earnings in Johnson County are $55,451, $65,896 for men and $45,137 for women, a difference of 31.5%.
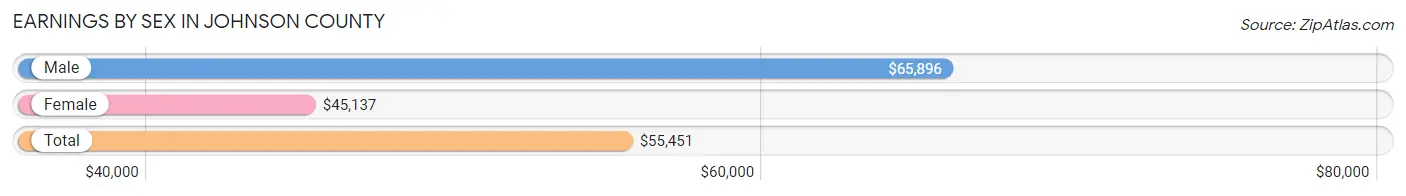
| Sex | Number | Average Earnings |
| Male | 191,798 (52.8%) | $65,896 |
| Female | 171,615 (47.2%) | $45,137 |
| Total | 363,413 (100.0%) | $55,451 |
Earnings by Sex by Income Bracket in Johnson County
The most common earnings brackets in Johnson County are $100,000+ for men (57,377 | 29.9%) and $100,000+ for women (23,362 | 13.6%).
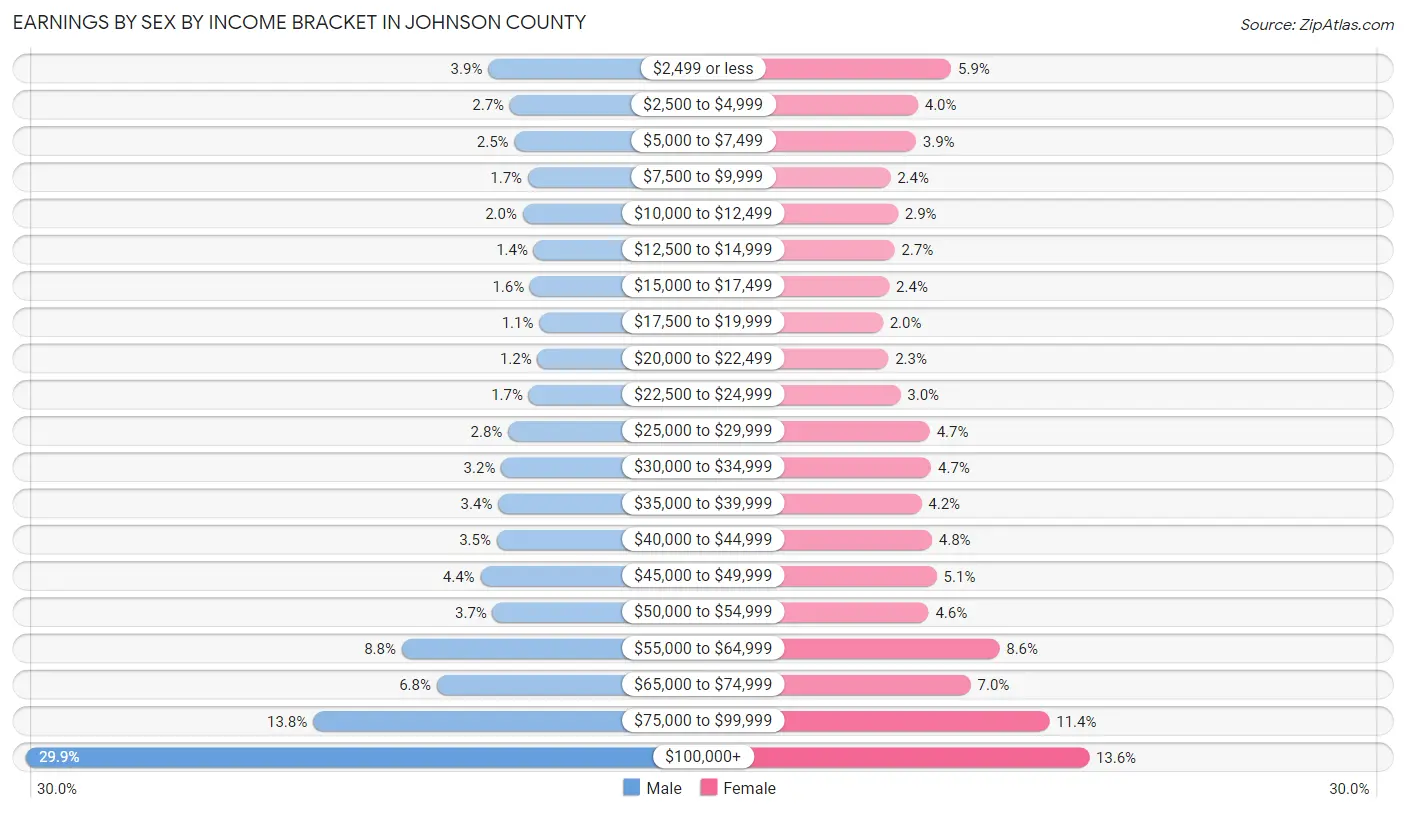
| Income | Male | Female |
| $2,499 or less | 7,563 (3.9%) | 10,053 (5.9%) |
| $2,500 to $4,999 | 5,222 (2.7%) | 6,848 (4.0%) |
| $5,000 to $7,499 | 4,730 (2.5%) | 6,658 (3.9%) |
| $7,500 to $9,999 | 3,287 (1.7%) | 4,193 (2.4%) |
| $10,000 to $12,499 | 3,845 (2.0%) | 4,924 (2.9%) |
| $12,500 to $14,999 | 2,638 (1.4%) | 4,594 (2.7%) |
| $15,000 to $17,499 | 3,043 (1.6%) | 4,084 (2.4%) |
| $17,500 to $19,999 | 2,060 (1.1%) | 3,466 (2.0%) |
| $20,000 to $22,499 | 2,241 (1.2%) | 3,999 (2.3%) |
| $22,500 to $24,999 | 3,182 (1.7%) | 5,162 (3.0%) |
| $25,000 to $29,999 | 5,412 (2.8%) | 7,997 (4.7%) |
| $30,000 to $34,999 | 6,160 (3.2%) | 8,142 (4.7%) |
| $35,000 to $39,999 | 6,491 (3.4%) | 7,195 (4.2%) |
| $40,000 to $44,999 | 6,632 (3.5%) | 8,208 (4.8%) |
| $45,000 to $49,999 | 8,406 (4.4%) | 8,669 (5.1%) |
| $50,000 to $54,999 | 7,080 (3.7%) | 7,880 (4.6%) |
| $55,000 to $64,999 | 16,872 (8.8%) | 14,713 (8.6%) |
| $65,000 to $74,999 | 13,099 (6.8%) | 11,939 (7.0%) |
| $75,000 to $99,999 | 26,458 (13.8%) | 19,529 (11.4%) |
| $100,000+ | 57,377 (29.9%) | 23,362 (13.6%) |
| Total | 191,798 (100.0%) | 171,615 (100.0%) |
Earnings by Sex by Educational Attainment in Johnson County
Average earnings in Johnson County are $75,489 for men and $51,754 for women, a difference of 31.4%. Men with an educational attainment of graduate degree enjoy the highest average annual earnings of $113,065, while those with less than high school education earn the least with $40,276. Women with an educational attainment of graduate degree earn the most with the average annual earnings of $71,136, while those with less than high school education have the smallest earnings of $25,250.
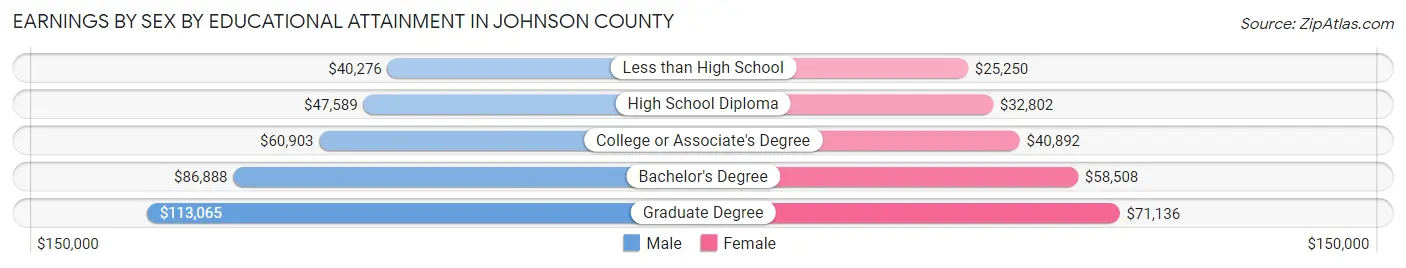
| Educational Attainment | Male Income | Female Income |
| Less than High School | $40,276 | $25,250 |
| High School Diploma | $47,589 | $32,802 |
| College or Associate's Degree | $60,903 | $40,892 |
| Bachelor's Degree | $86,888 | $58,508 |
| Graduate Degree | $113,065 | $71,136 |
| Total | $75,489 | $51,754 |
Family Income in Johnson County
Family Income Brackets in Johnson County
According to the Johnson County family income data, there are 39,634 families falling into the $200,000+ income range, which is the most common income bracket and makes up 24.5% of all families. Conversely, the $10,000 to $14,999 income bracket is the least frequent group with only 1,294 families (0.8%) belonging to this category.
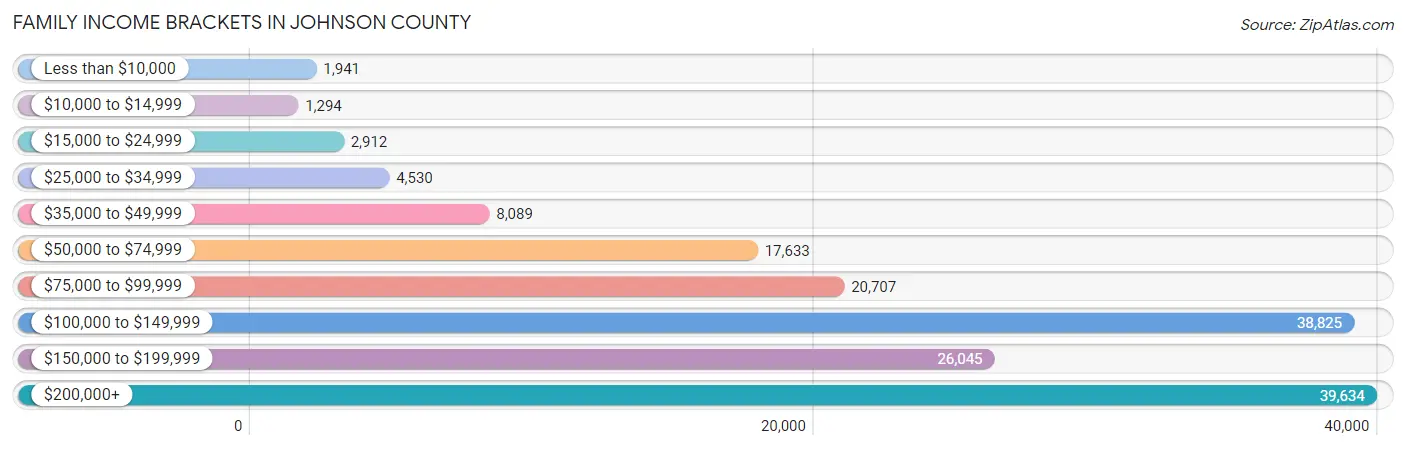
| Income Bracket | # Families | % Families |
| Less than $10,000 | 1,941 | 1.2% |
| $10,000 to $14,999 | 1,294 | 0.8% |
| $15,000 to $24,999 | 2,912 | 1.8% |
| $25,000 to $34,999 | 4,530 | 2.8% |
| $35,000 to $49,999 | 8,089 | 5.0% |
| $50,000 to $74,999 | 17,633 | 10.9% |
| $75,000 to $99,999 | 20,707 | 12.8% |
| $100,000 to $149,999 | 38,825 | 24.0% |
| $150,000 to $199,999 | 26,045 | 16.1% |
| $200,000+ | 39,634 | 24.5% |
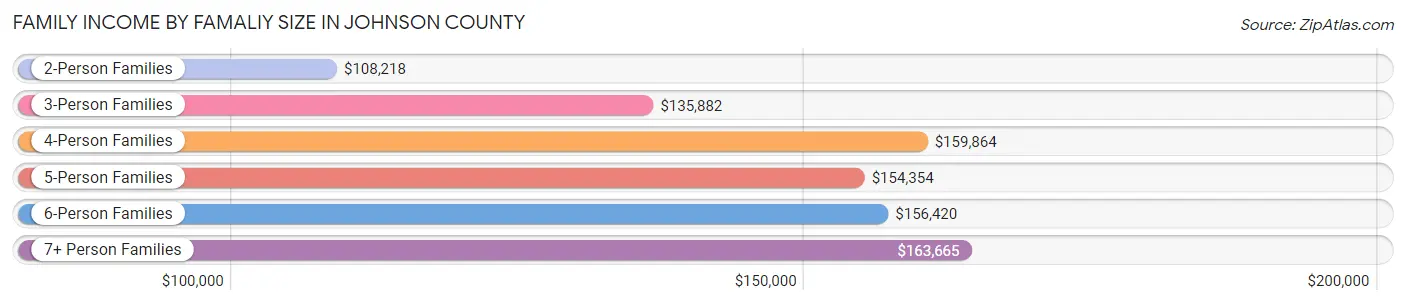
Family Income by Famaliy Size in Johnson County
7+ person families (1,817 | 1.1%) account for the highest median family income in Johnson County with $163,665 per family, while 2-person families (75,578 | 46.7%) have the highest median income of $54,109 per family member.
| Income Bracket | # Families | Median Income |
| 2-Person Families | 75,578 (46.7%) | $108,218 |
| 3-Person Families | 33,711 (20.8%) | $135,882 |
| 4-Person Families | 33,393 (20.6%) | $159,864 |
| 5-Person Families | 13,329 (8.2%) | $154,354 |
| 6-Person Families | 3,943 (2.4%) | $156,420 |
| 7+ Person Families | 1,817 (1.1%) | $163,665 |
| Total | 161,771 (100.0%) | $126,651 |
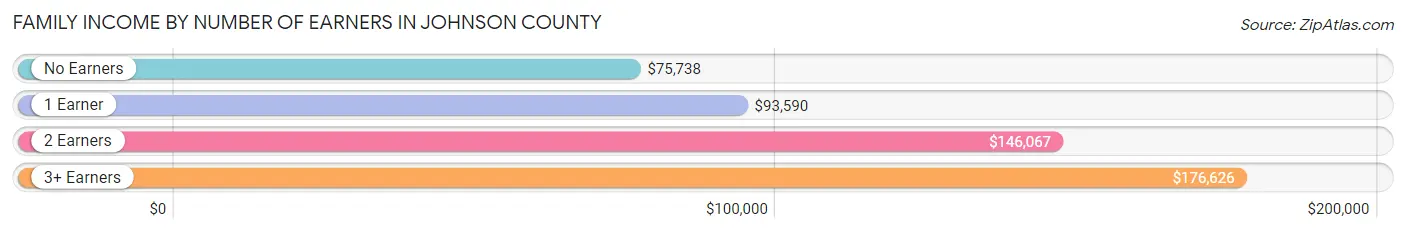
Family Income by Number of Earners in Johnson County
The median family income in Johnson County is $126,651, with families comprising 3+ earners (20,991) having the highest median family income of $176,626, while families with no earners (18,287) have the lowest median family income of $75,738, accounting for 13.0% and 11.3% of families, respectively.
| Number of Earners | # Families | Median Income |
| No Earners | 18,287 (11.3%) | $75,738 |
| 1 Earner | 42,019 (26.0%) | $93,590 |
| 2 Earners | 80,474 (49.7%) | $146,067 |
| 3+ Earners | 20,991 (13.0%) | $176,626 |
| Total | 161,771 (100.0%) | $126,651 |
Household Income in Johnson County
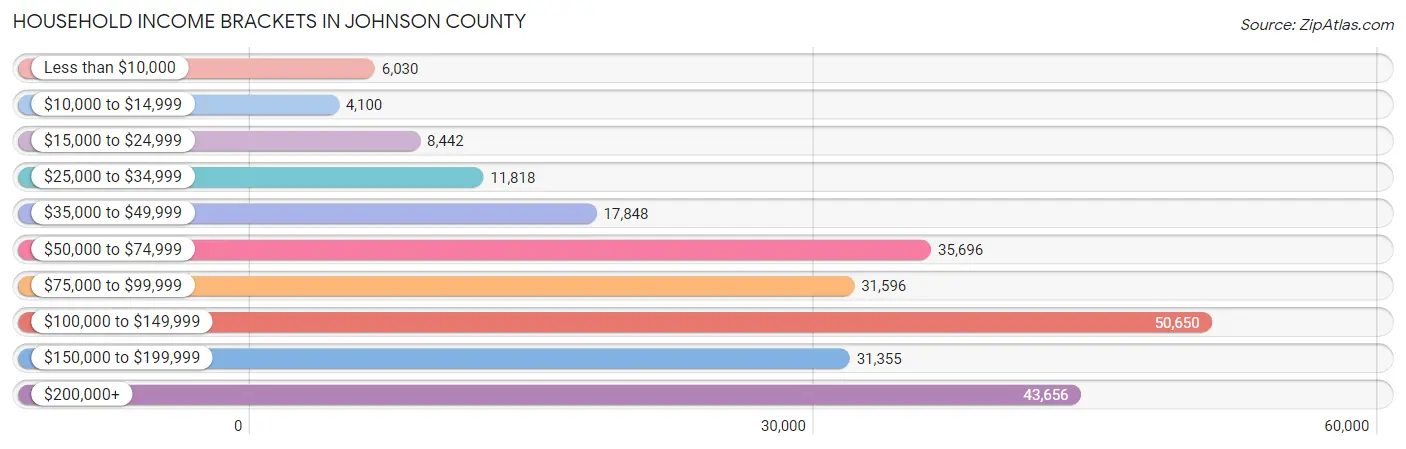
Household Income Brackets in Johnson County
With 50,650 households falling in the category, the $100,000 to $149,999 income range is the most frequent in Johnson County, accounting for 21.0% of all households. In contrast, only 4,100 households (1.7%) fall into the $10,000 to $14,999 income bracket, making it the least populous group.
| Income Bracket | # Households | % Households |
| Less than $10,000 | 6,030 | 2.5% |
| $10,000 to $14,999 | 4,100 | 1.7% |
| $15,000 to $24,999 | 8,442 | 3.5% |
| $25,000 to $34,999 | 11,818 | 4.9% |
| $35,000 to $49,999 | 17,848 | 7.4% |
| $50,000 to $74,999 | 35,696 | 14.8% |
| $75,000 to $99,999 | 31,596 | 13.1% |
| $100,000 to $149,999 | 50,650 | 21.0% |
| $150,000 to $199,999 | 31,355 | 13.0% |
| $200,000+ | 43,656 | 18.1% |
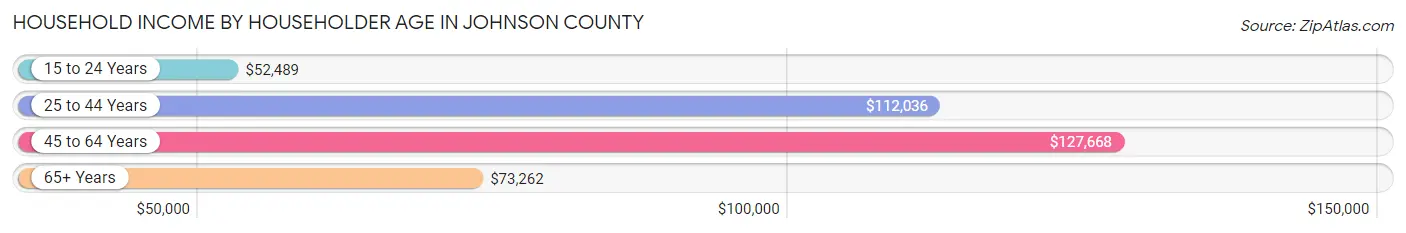
Household Income by Householder Age in Johnson County
The median household income in Johnson County is $103,644, with the highest median household income of $127,668 found in the 45 to 64 years age bracket for the primary householder. A total of 87,601 households (36.3%) fall into this category. Meanwhile, the 15 to 24 years age bracket for the primary householder has the lowest median household income of $52,489, with 9,826 households (4.1%) in this group.
| Income Bracket | # Households | Median Income |
| 15 to 24 Years | 9,826 (4.1%) | $52,489 |
| 25 to 44 Years | 86,369 (35.8%) | $112,036 |
| 45 to 64 Years | 87,601 (36.3%) | $127,668 |
| 65+ Years | 57,395 (23.8%) | $73,262 |
| Total | 241,191 (100.0%) | $103,644 |
Poverty in Johnson County
Income Below Poverty by Sex and Age in Johnson County
With 4.3% poverty level for males and 6.3% for females among the residents of Johnson County, 18 to 24 year old males and 18 to 24 year old females are the most vulnerable to poverty, with 2,115 males (8.4%) and 3,910 females (16.2%) in their respective age groups living below the poverty level.
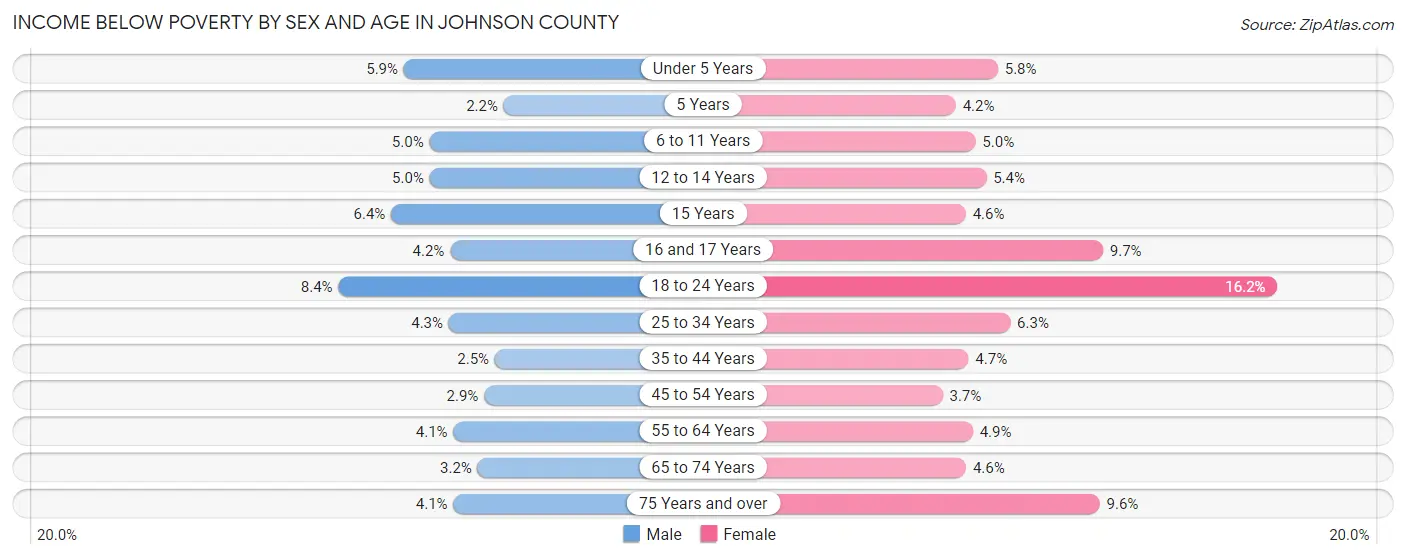
| Age Bracket | Male | Female |
| Under 5 Years | 1,086 (5.9%) | 1,043 (5.8%) |
| 5 Years | 95 (2.2%) | 147 (4.2%) |
| 6 to 11 Years | 1,187 (5.0%) | 1,183 (5.0%) |
| 12 to 14 Years | 651 (5.0%) | 660 (5.4%) |
| 15 Years | 281 (6.4%) | 180 (4.6%) |
| 16 and 17 Years | 380 (4.2%) | 837 (9.7%) |
| 18 to 24 Years | 2,115 (8.4%) | 3,910 (16.2%) |
| 25 to 34 Years | 1,777 (4.3%) | 2,522 (6.2%) |
| 35 to 44 Years | 1,114 (2.5%) | 2,032 (4.7%) |
| 45 to 54 Years | 1,142 (2.9%) | 1,445 (3.7%) |
| 55 to 64 Years | 1,470 (4.1%) | 1,884 (4.9%) |
| 65 to 74 Years | 825 (3.2%) | 1,361 (4.6%) |
| 75 Years and over | 592 (4.1%) | 1,939 (9.6%) |
| Total | 12,715 (4.3%) | 19,143 (6.3%) |
Income Above Poverty by Sex and Age in Johnson County
According to the poverty statistics in Johnson County, males aged 5 years and females aged 45 to 54 years are the age groups that are most secure financially, with 97.8% of males and 96.3% of females in these age groups living above the poverty line.
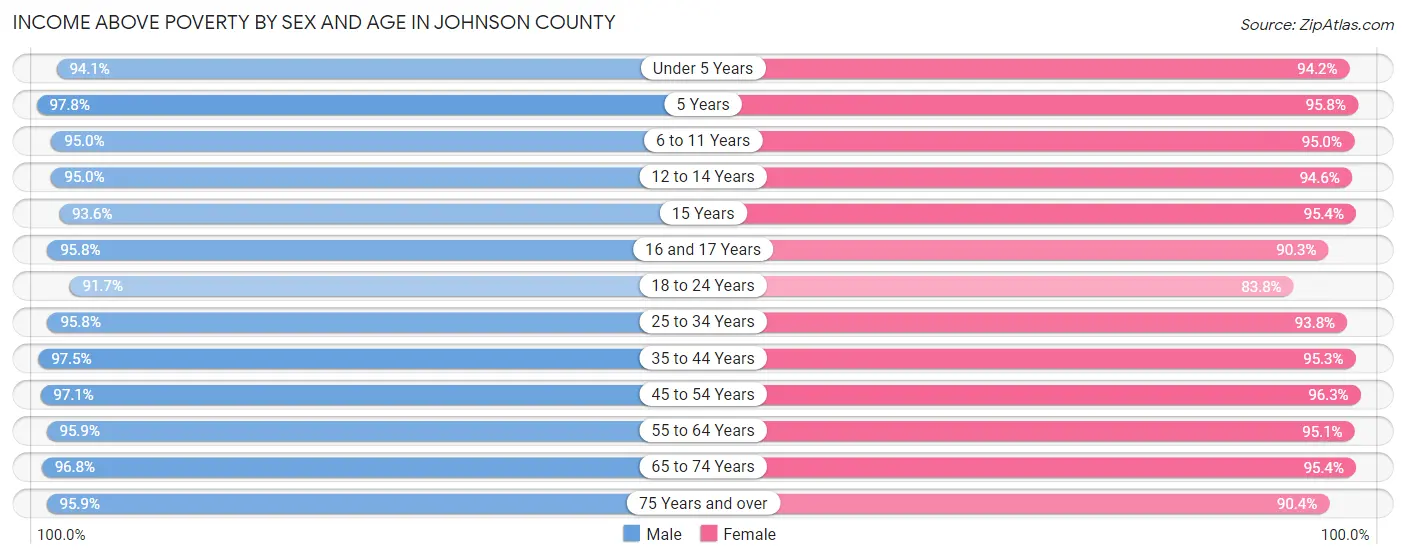
| Age Bracket | Male | Female |
| Under 5 Years | 17,262 (94.1%) | 16,974 (94.2%) |
| 5 Years | 4,212 (97.8%) | 3,327 (95.8%) |
| 6 to 11 Years | 22,688 (95.0%) | 22,685 (95.0%) |
| 12 to 14 Years | 12,467 (95.0%) | 11,653 (94.6%) |
| 15 Years | 4,117 (93.6%) | 3,730 (95.4%) |
| 16 and 17 Years | 8,675 (95.8%) | 7,802 (90.3%) |
| 18 to 24 Years | 23,215 (91.6%) | 20,264 (83.8%) |
| 25 to 34 Years | 39,994 (95.8%) | 37,859 (93.8%) |
| 35 to 44 Years | 42,662 (97.5%) | 41,236 (95.3%) |
| 45 to 54 Years | 37,706 (97.1%) | 37,143 (96.3%) |
| 55 to 64 Years | 34,598 (95.9%) | 36,893 (95.1%) |
| 65 to 74 Years | 25,084 (96.8%) | 28,171 (95.4%) |
| 75 Years and over | 13,925 (95.9%) | 18,321 (90.4%) |
| Total | 286,605 (95.8%) | 286,058 (93.7%) |
Income Below Poverty Among Married-Couple Families in Johnson County
The poverty statistics for married-couple families in Johnson County show that 1.7% or 2,251 of the total 134,107 families live below the poverty line. Families with 3 or 4 children have the highest poverty rate of 2.5%, comprising of 304 families. On the other hand, families with no children have the lowest poverty rate of 1.5%, which includes 1,121 families.
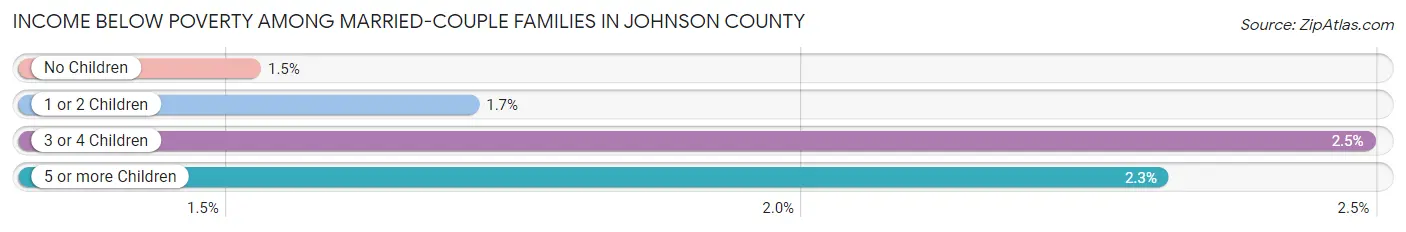
| Children | Above Poverty | Below Poverty |
| No Children | 72,748 (98.5%) | 1,121 (1.5%) |
| 1 or 2 Children | 46,379 (98.3%) | 806 (1.7%) |
| 3 or 4 Children | 11,883 (97.5%) | 304 (2.5%) |
| 5 or more Children | 846 (97.7%) | 20 (2.3%) |
| Total | 131,856 (98.3%) | 2,251 (1.7%) |
Income Below Poverty Among Single-Parent Households in Johnson County
According to the poverty data in Johnson County, 6.4% or 557 single-father households and 13.8% or 2,615 single-mother households are living below the poverty line. Among single-father households, those with 3 or 4 children have the highest poverty rate, with 152 households (19.5%) experiencing poverty. Likewise, among single-mother households, those with 5 or more children have the highest poverty rate, with 138 households (92.6%) falling below the poverty line.
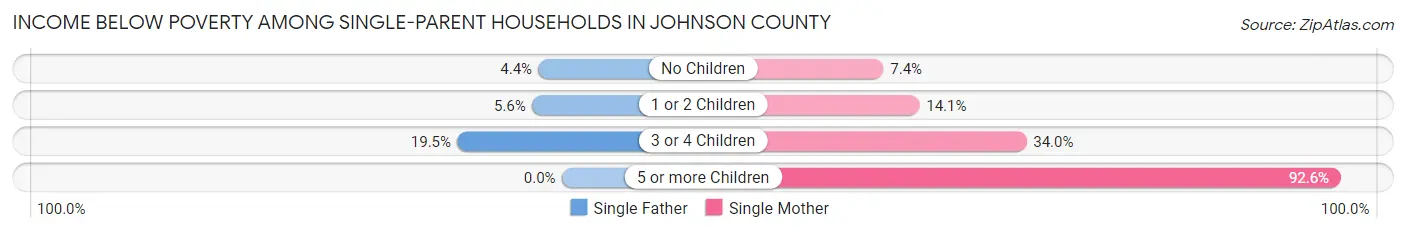
| Children | Single Father | Single Mother |
| No Children | 149 (4.4%) | 532 (7.4%) |
| 1 or 2 Children | 256 (5.6%) | 1,401 (14.1%) |
| 3 or 4 Children | 152 (19.5%) | 544 (34.0%) |
| 5 or more Children | 0 (0.0%) | 138 (92.6%) |
| Total | 557 (6.4%) | 2,615 (13.8%) |
Income Below Poverty Among Married-Couple vs Single-Parent Households in Johnson County
The poverty data for Johnson County shows that 2,251 of the married-couple family households (1.7%) and 3,172 of the single-parent households (11.5%) are living below the poverty level. Within the married-couple family households, those with 3 or 4 children have the highest poverty rate, with 304 households (2.5%) falling below the poverty line. Among the single-parent households, those with 5 or more children have the highest poverty rate, with 138 household (92.6%) living below poverty.
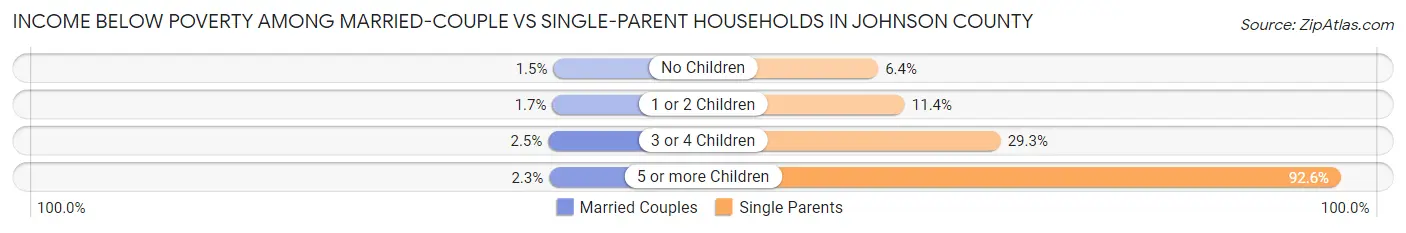
| Children | Married-Couple Families | Single-Parent Households |
| No Children | 1,121 (1.5%) | 681 (6.4%) |
| 1 or 2 Children | 806 (1.7%) | 1,657 (11.4%) |
| 3 or 4 Children | 304 (2.5%) | 696 (29.3%) |
| 5 or more Children | 20 (2.3%) | 138 (92.6%) |
| Total | 2,251 (1.7%) | 3,172 (11.5%) |
Employment Characteristics in Johnson County
Employment by Class of Employer in Johnson County
Among the 329,681 employed individuals in Johnson County, private company employees (231,207 | 70.1%), not-for-profit organizations (27,752 | 8.4%), and local government employees (21,327 | 6.5%) make up the most common classes of employment.
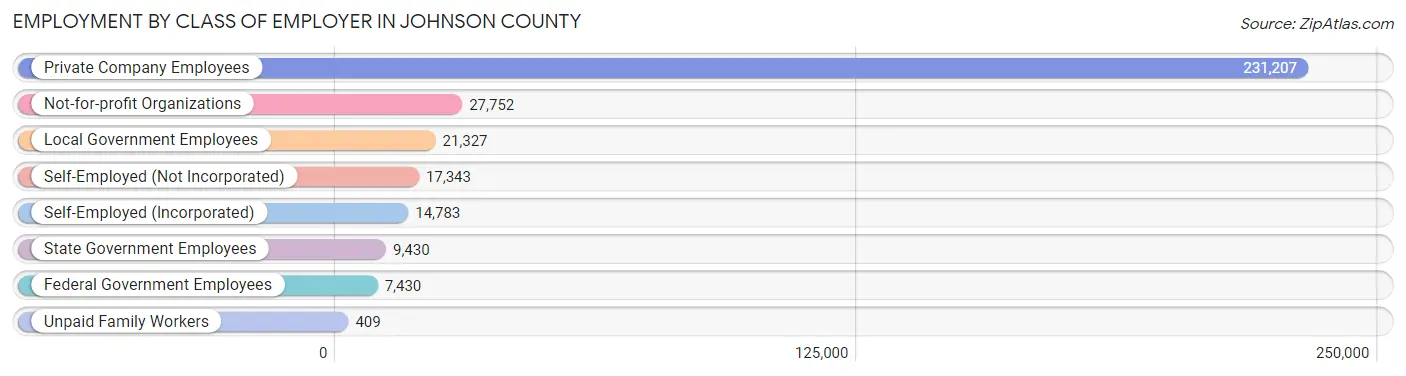
| Employer Class | # Employees | % Employees |
| Private Company Employees | 231,207 | 70.1% |
| Self-Employed (Incorporated) | 14,783 | 4.5% |
| Self-Employed (Not Incorporated) | 17,343 | 5.3% |
| Not-for-profit Organizations | 27,752 | 8.4% |
| Local Government Employees | 21,327 | 6.5% |
| State Government Employees | 9,430 | 2.9% |
| Federal Government Employees | 7,430 | 2.2% |
| Unpaid Family Workers | 409 | 0.1% |
| Total | 329,681 | 100.0% |
Employment Status by Age in Johnson County
According to the labor force statistics for Johnson County, out of the total population over 16 years of age (483,252), 71.9% or 347,458 individuals are in the labor force, with 3.2% or 11,119 of them unemployed. The age group with the highest labor force participation rate is 25 to 29 years, with 91.1% or 36,848 individuals in the labor force. Within the labor force, the 16 to 19 years age range has the highest percentage of unemployed individuals, with 12.6% or 2,200 of them being unemployed.
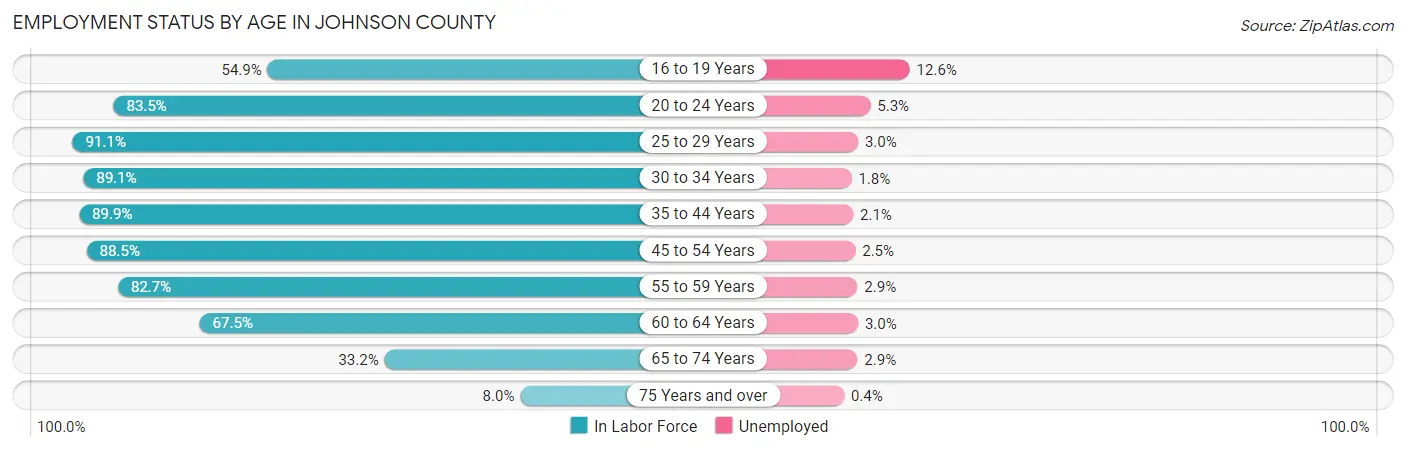
| Age Bracket | In Labor Force | Unemployed |
| 16 to 19 Years | 17,457 (54.9%) | 2,200 (12.6%) |
| 20 to 24 Years | 30,110 (83.5%) | 1,596 (5.3%) |
| 25 to 29 Years | 36,848 (91.1%) | 1,105 (3.0%) |
| 30 to 34 Years | 37,379 (89.1%) | 673 (1.8%) |
| 35 to 44 Years | 78,490 (89.9%) | 1,648 (2.1%) |
| 45 to 54 Years | 68,719 (88.5%) | 1,718 (2.5%) |
| 55 to 59 Years | 32,079 (82.7%) | 930 (2.9%) |
| 60 to 64 Years | 24,557 (67.5%) | 737 (3.0%) |
| 65 to 74 Years | 18,603 (33.2%) | 539 (2.9%) |
| 75 Years and over | 2,947 (8.0%) | 12 (0.4%) |
| Total | 347,458 (71.9%) | 11,119 (3.2%) |
Employment Status by Educational Attainment in Johnson County
According to labor force statistics for Johnson County, 86.2% of individuals (278,019) out of the total population between 25 and 64 years of age (322,528) are in the labor force, with 2.4% or 6,672 of them being unemployed. The group with the highest labor force participation rate are those with the educational attainment of bachelor's degree or higher, with 89.1% or 169,485 individuals in the labor force. Within the labor force, individuals with less than high school education have the highest percentage of unemployment, with 5.1% or 420 of them being unemployed.
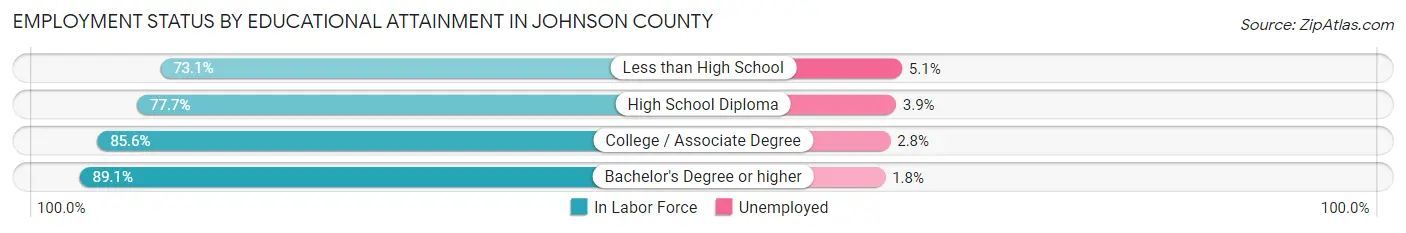
| Educational Attainment | In Labor Force | Unemployed |
| Less than High School | 8,230 (73.1%) | 574 (5.1%) |
| High School Diploma | 31,033 (77.7%) | 1,558 (3.9%) |
| College / Associate Degree | 69,430 (85.6%) | 2,271 (2.8%) |
| Bachelor's Degree or higher | 169,485 (89.1%) | 3,424 (1.8%) |
| Total | 278,019 (86.2%) | 7,741 (2.4%) |
Employment Occupations by Sex in Johnson County
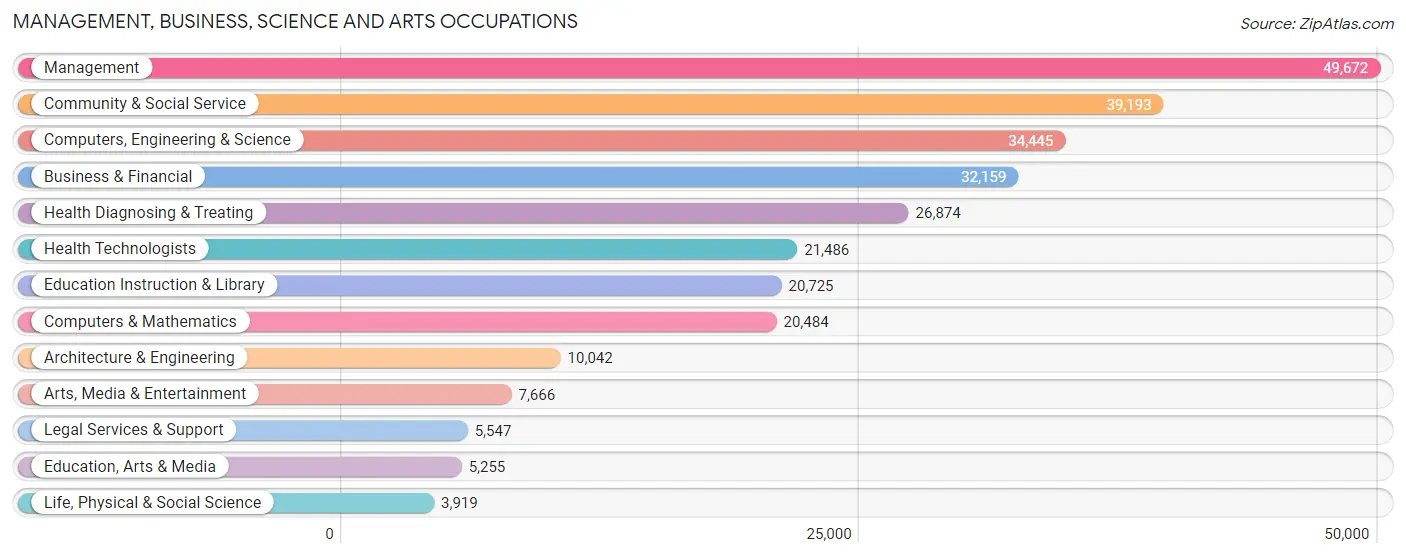
Management, Business, Science and Arts Occupations
The most common Management, Business, Science and Arts occupations in Johnson County are Management (49,672 | 14.8%), Community & Social Service (39,193 | 11.7%), Computers, Engineering & Science (34,445 | 10.3%), Business & Financial (32,159 | 9.6%), and Health Diagnosing & Treating (26,874 | 8.0%).
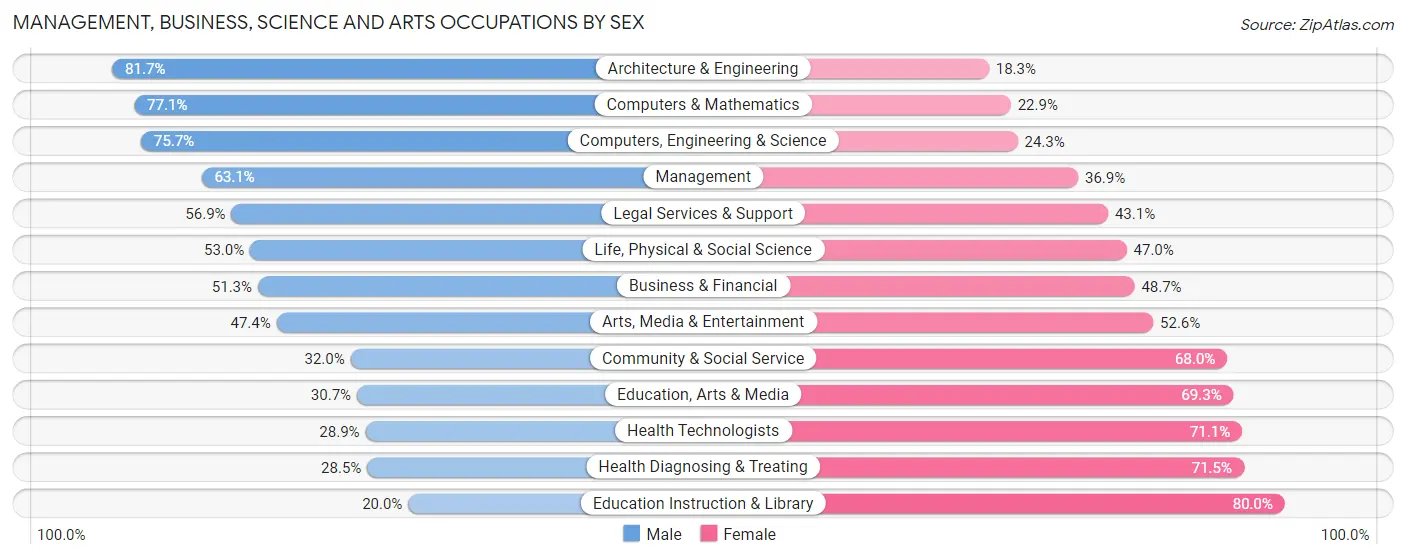
Management, Business, Science and Arts Occupations by Sex
Within the Management, Business, Science and Arts occupations in Johnson County, the most male-oriented occupations are Architecture & Engineering (81.7%), Computers & Mathematics (77.1%), and Computers, Engineering & Science (75.7%), while the most female-oriented occupations are Education Instruction & Library (80.0%), Health Diagnosing & Treating (71.5%), and Health Technologists (71.1%).
| Occupation | Male | Female |
| Management | 31,342 (63.1%) | 18,330 (36.9%) |
| Business & Financial | 16,511 (51.3%) | 15,648 (48.7%) |
| Computers, Engineering & Science | 26,085 (75.7%) | 8,360 (24.3%) |
| Computers & Mathematics | 15,802 (77.1%) | 4,682 (22.9%) |
| Architecture & Engineering | 8,207 (81.7%) | 1,835 (18.3%) |
| Life, Physical & Social Science | 2,076 (53.0%) | 1,843 (47.0%) |
| Community & Social Service | 12,543 (32.0%) | 26,650 (68.0%) |
| Education, Arts & Media | 1,612 (30.7%) | 3,643 (69.3%) |
| Legal Services & Support | 3,154 (56.9%) | 2,393 (43.1%) |
| Education Instruction & Library | 4,140 (20.0%) | 16,585 (80.0%) |
| Arts, Media & Entertainment | 3,637 (47.4%) | 4,029 (52.6%) |
| Health Diagnosing & Treating | 7,671 (28.5%) | 19,203 (71.5%) |
| Health Technologists | 6,211 (28.9%) | 15,275 (71.1%) |
| Total (Category) | 94,152 (51.6%) | 88,191 (48.4%) |
| Total (Overall) | 178,291 (53.1%) | 157,185 (46.9%) |
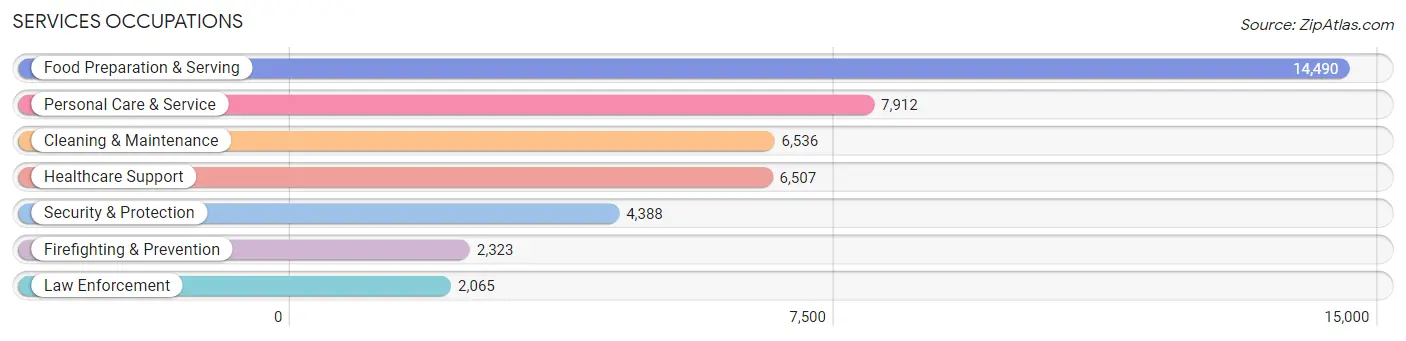
Services Occupations
The most common Services occupations in Johnson County are Food Preparation & Serving (14,490 | 4.3%), Personal Care & Service (7,912 | 2.4%), Cleaning & Maintenance (6,536 | 1.9%), Healthcare Support (6,507 | 1.9%), and Security & Protection (4,388 | 1.3%).
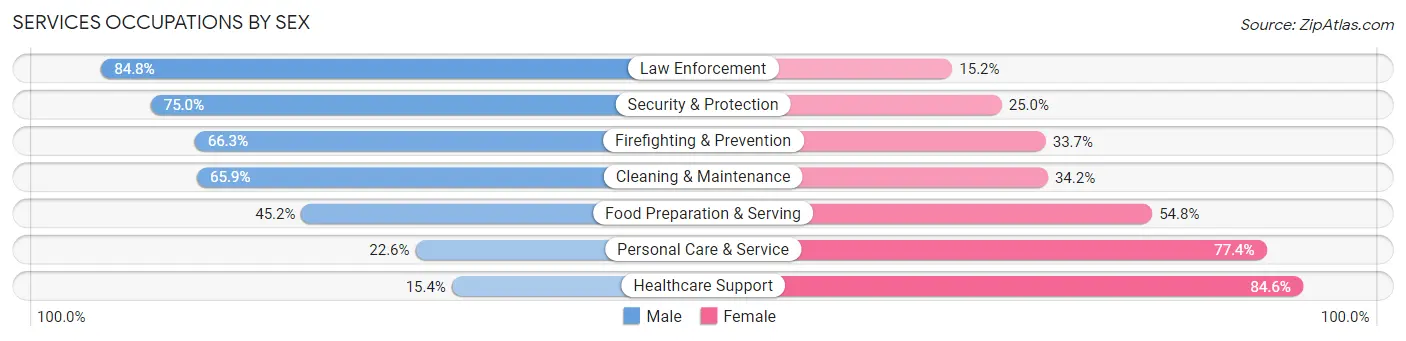
Services Occupations by Sex
Within the Services occupations in Johnson County, the most male-oriented occupations are Law Enforcement (84.8%), Security & Protection (75.0%), and Firefighting & Prevention (66.3%), while the most female-oriented occupations are Healthcare Support (84.6%), Personal Care & Service (77.4%), and Food Preparation & Serving (54.8%).
| Occupation | Male | Female |
| Healthcare Support | 1,004 (15.4%) | 5,503 (84.6%) |
| Security & Protection | 3,291 (75.0%) | 1,097 (25.0%) |
| Firefighting & Prevention | 1,540 (66.3%) | 783 (33.7%) |
| Law Enforcement | 1,751 (84.8%) | 314 (15.2%) |
| Food Preparation & Serving | 6,551 (45.2%) | 7,939 (54.8%) |
| Cleaning & Maintenance | 4,304 (65.8%) | 2,232 (34.2%) |
| Personal Care & Service | 1,790 (22.6%) | 6,122 (77.4%) |
| Total (Category) | 16,940 (42.5%) | 22,893 (57.5%) |
| Total (Overall) | 178,291 (53.1%) | 157,185 (46.9%) |
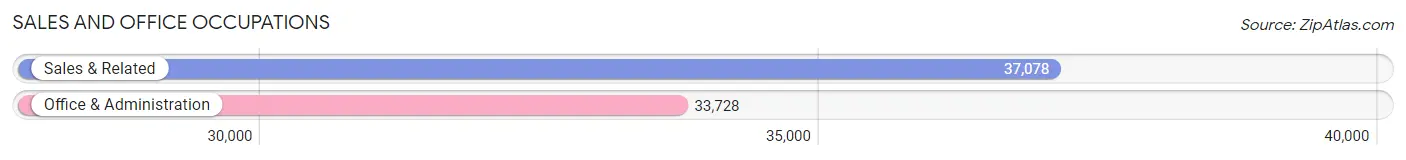
Sales and Office Occupations
The most common Sales and Office occupations in Johnson County are Sales & Related (37,078 | 11.1%), and Office & Administration (33,728 | 10.1%).
Sales and Office Occupations by Sex
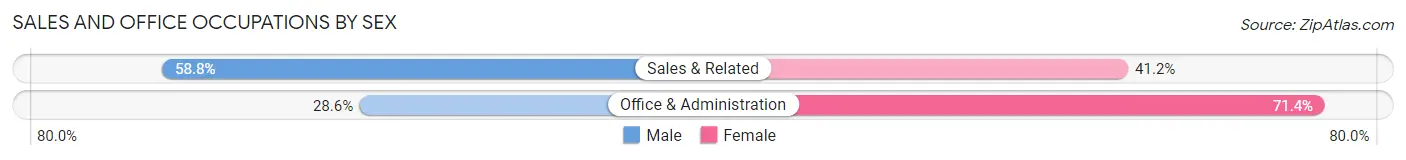
| Occupation | Male | Female |
| Sales & Related | 21,814 (58.8%) | 15,264 (41.2%) |
| Office & Administration | 9,633 (28.6%) | 24,095 (71.4%) |
| Total (Category) | 31,447 (44.4%) | 39,359 (55.6%) |
| Total (Overall) | 178,291 (53.1%) | 157,185 (46.9%) |
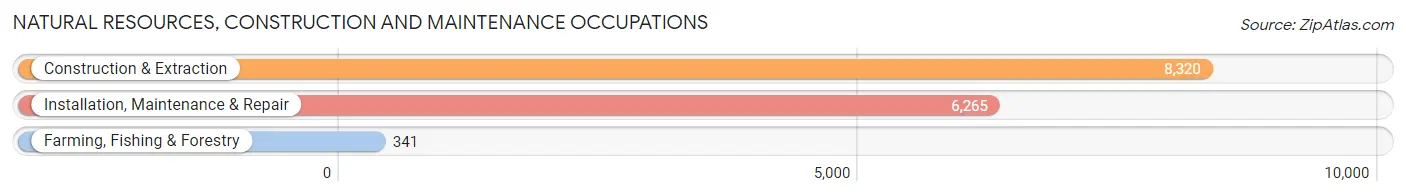
Natural Resources, Construction and Maintenance Occupations
The most common Natural Resources, Construction and Maintenance occupations in Johnson County are Construction & Extraction (8,320 | 2.5%), Installation, Maintenance & Repair (6,265 | 1.9%), and Farming, Fishing & Forestry (341 | 0.1%).
Natural Resources, Construction and Maintenance Occupations by Sex
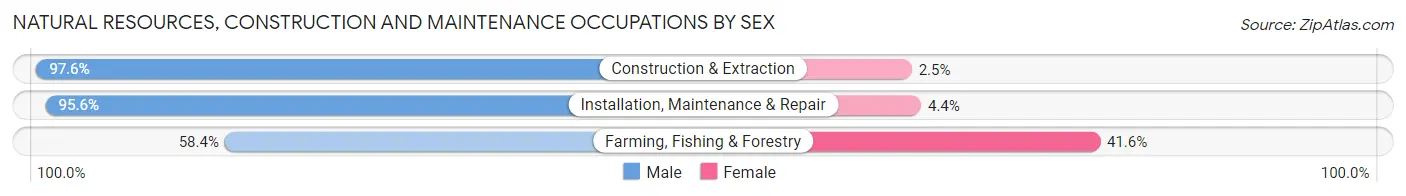
| Occupation | Male | Female |
| Farming, Fishing & Forestry | 199 (58.4%) | 142 (41.6%) |
| Construction & Extraction | 8,116 (97.6%) | 204 (2.5%) |
| Installation, Maintenance & Repair | 5,990 (95.6%) | 275 (4.4%) |
| Total (Category) | 14,305 (95.8%) | 621 (4.2%) |
| Total (Overall) | 178,291 (53.1%) | 157,185 (46.9%) |
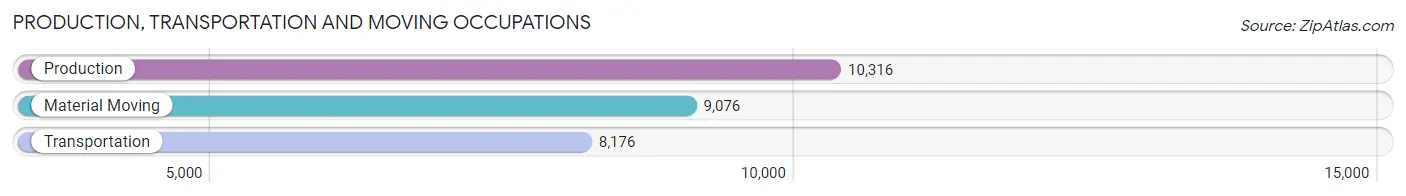
Production, Transportation and Moving Occupations
The most common Production, Transportation and Moving occupations in Johnson County are Production (10,316 | 3.1%), Material Moving (9,076 | 2.7%), and Transportation (8,176 | 2.4%).
Production, Transportation and Moving Occupations by Sex
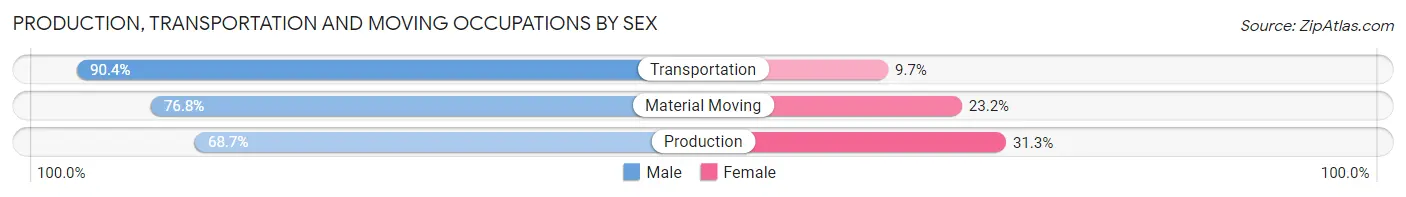
| Occupation | Male | Female |
| Production | 7,089 (68.7%) | 3,227 (31.3%) |
| Transportation | 7,387 (90.3%) | 789 (9.7%) |
| Material Moving | 6,971 (76.8%) | 2,105 (23.2%) |
| Total (Category) | 21,447 (77.8%) | 6,121 (22.2%) |
| Total (Overall) | 178,291 (53.1%) | 157,185 (46.9%) |
Employment Industries by Sex in Johnson County
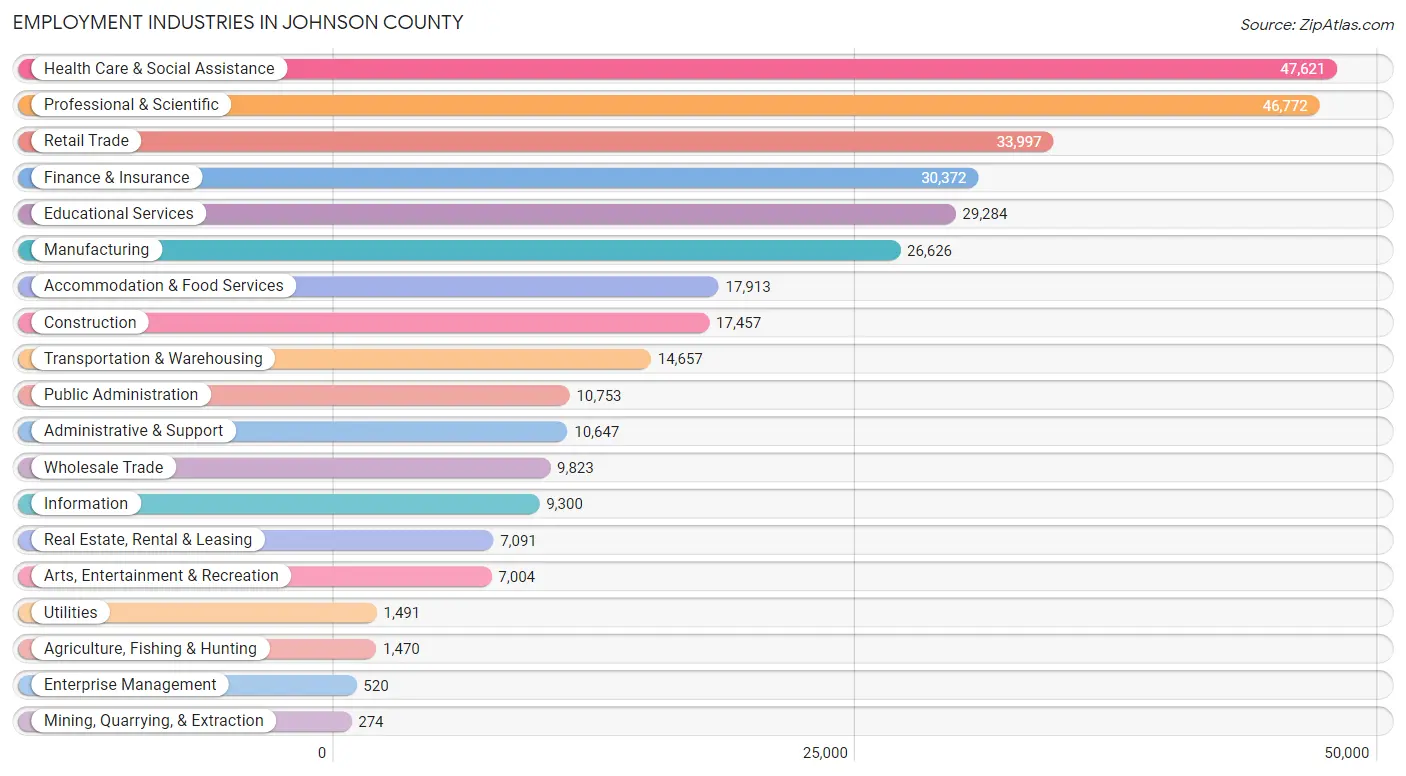
Employment Industries in Johnson County
The major employment industries in Johnson County include Health Care & Social Assistance (47,621 | 14.2%), Professional & Scientific (46,772 | 13.9%), Retail Trade (33,997 | 10.1%), Finance & Insurance (30,372 | 9.0%), and Educational Services (29,284 | 8.7%).
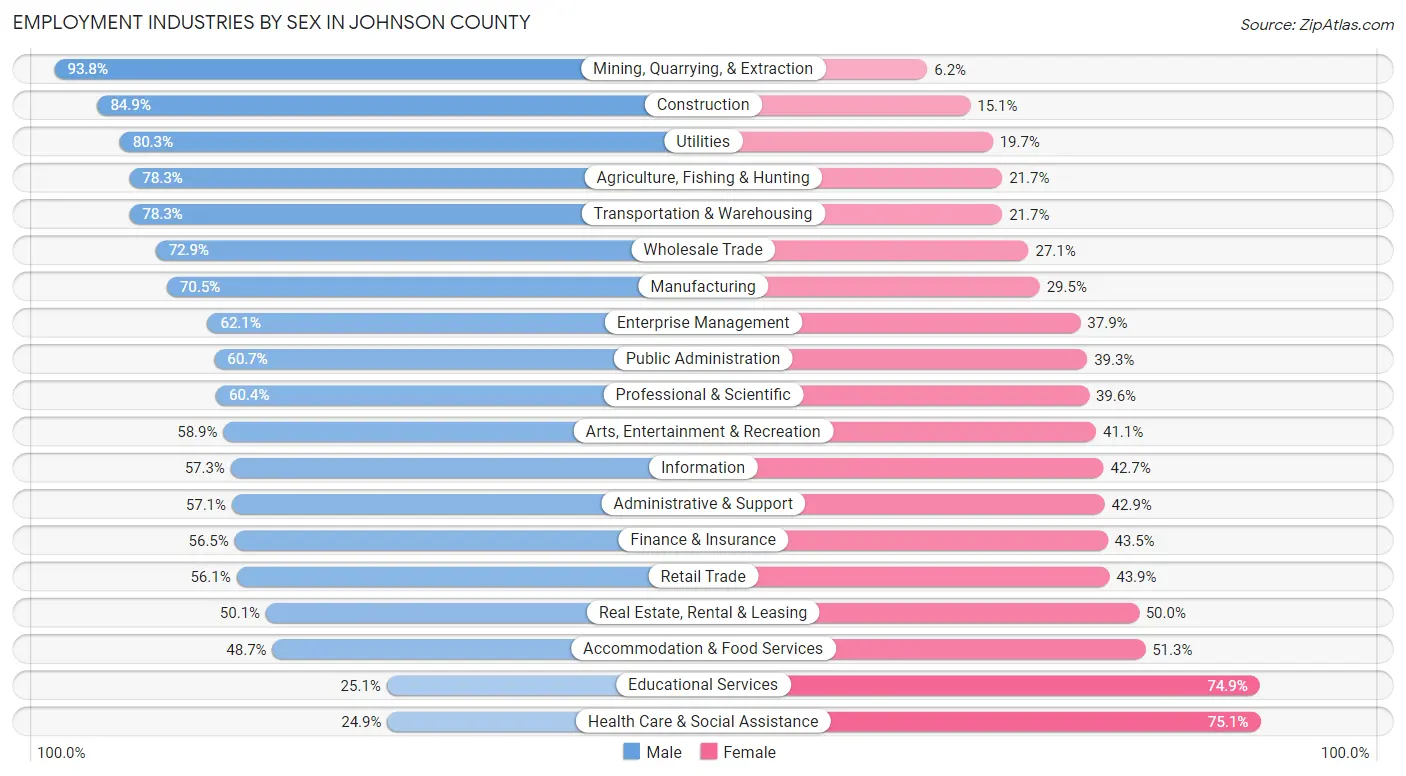
Employment Industries by Sex in Johnson County
The Johnson County industries that see more men than women are Mining, Quarrying, & Extraction (93.8%), Construction (84.9%), and Utilities (80.3%), whereas the industries that tend to have a higher number of women are Health Care & Social Assistance (75.1%), Educational Services (74.9%), and Accommodation & Food Services (51.3%).
| Industry | Male | Female |
| Agriculture, Fishing & Hunting | 1,151 (78.3%) | 319 (21.7%) |
| Mining, Quarrying, & Extraction | 257 (93.8%) | 17 (6.2%) |
| Construction | 14,822 (84.9%) | 2,635 (15.1%) |
| Manufacturing | 18,781 (70.5%) | 7,845 (29.5%) |
| Wholesale Trade | 7,157 (72.9%) | 2,666 (27.1%) |
| Retail Trade | 19,085 (56.1%) | 14,912 (43.9%) |
| Transportation & Warehousing | 11,476 (78.3%) | 3,181 (21.7%) |
| Utilities | 1,197 (80.3%) | 294 (19.7%) |
| Information | 5,333 (57.3%) | 3,967 (42.7%) |
| Finance & Insurance | 17,168 (56.5%) | 13,204 (43.5%) |
| Real Estate, Rental & Leasing | 3,549 (50.0%) | 3,542 (49.9%) |
| Professional & Scientific | 28,233 (60.4%) | 18,539 (39.6%) |
| Enterprise Management | 323 (62.1%) | 197 (37.9%) |
| Administrative & Support | 6,079 (57.1%) | 4,568 (42.9%) |
| Educational Services | 7,339 (25.1%) | 21,945 (74.9%) |
| Health Care & Social Assistance | 11,873 (24.9%) | 35,748 (75.1%) |
| Arts, Entertainment & Recreation | 4,124 (58.9%) | 2,880 (41.1%) |
| Accommodation & Food Services | 8,726 (48.7%) | 9,187 (51.3%) |
| Public Administration | 6,529 (60.7%) | 4,224 (39.3%) |
| Total | 178,291 (53.1%) | 157,185 (46.9%) |
Education in Johnson County
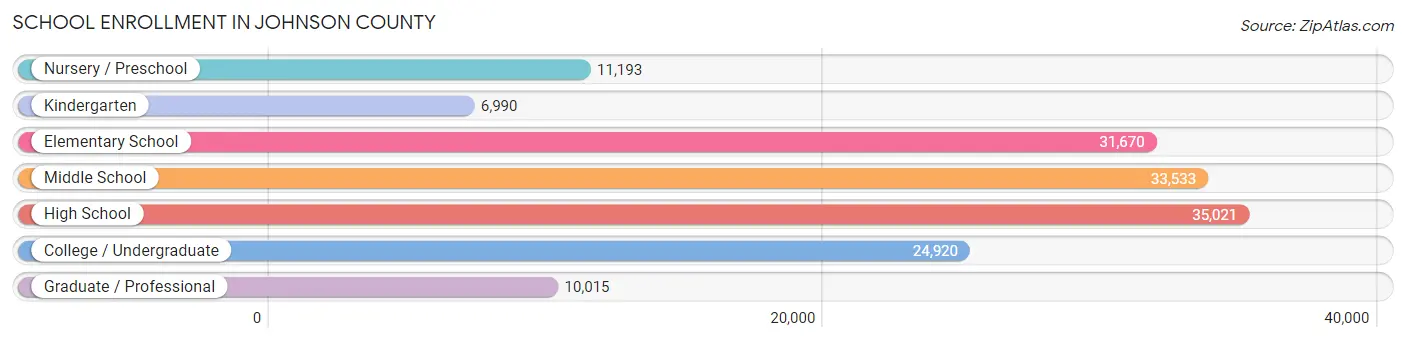
School Enrollment in Johnson County
The most common levels of schooling among the 153,342 students in Johnson County are high school (35,021 | 22.8%), middle school (33,533 | 21.9%), and elementary school (31,670 | 20.6%).
| School Level | # Students | % Students |
| Nursery / Preschool | 11,193 | 7.3% |
| Kindergarten | 6,990 | 4.6% |
| Elementary School | 31,670 | 20.6% |
| Middle School | 33,533 | 21.9% |
| High School | 35,021 | 22.8% |
| College / Undergraduate | 24,920 | 16.3% |
| Graduate / Professional | 10,015 | 6.5% |
| Total | 153,342 | 100.0% |
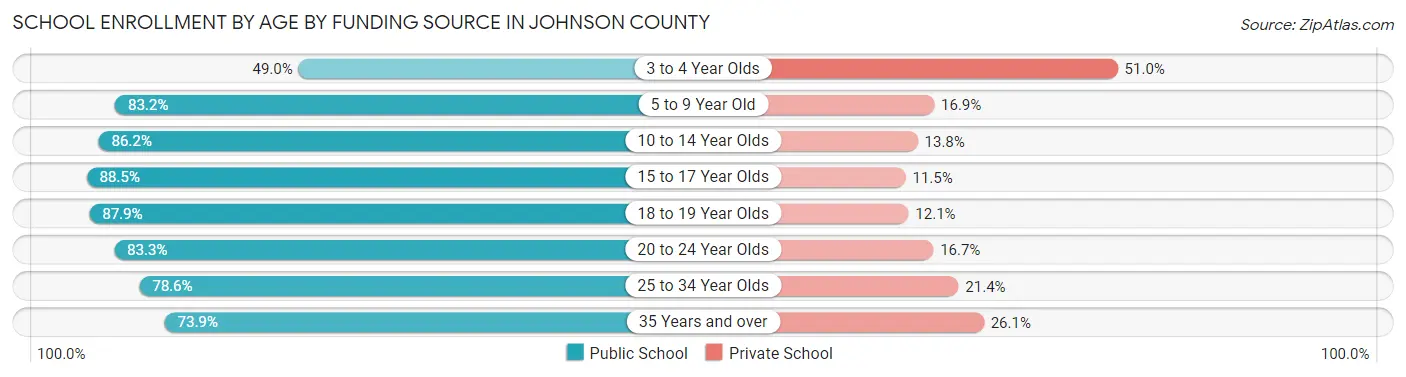
School Enrollment by Age by Funding Source in Johnson County
Out of a total of 153,342 students who are enrolled in schools in Johnson County, 26,528 (17.3%) attend a private institution, while the remaining 126,814 (82.7%) are enrolled in public schools. The age group of 3 to 4 year olds has the highest likelihood of being enrolled in private schools, with 4,004 (51.0% in the age bracket) enrolled. Conversely, the age group of 15 to 17 year olds has the lowest likelihood of being enrolled in a private school, with 22,663 (88.5% in the age bracket) attending a public institution.
| Age Bracket | Public School | Private School |
| 3 to 4 Year Olds | 3,843 (49.0%) | 4,004 (51.0%) |
| 5 to 9 Year Old | 31,485 (83.2%) | 6,382 (16.9%) |
| 10 to 14 Year Olds | 35,424 (86.2%) | 5,656 (13.8%) |
| 15 to 17 Year Olds | 22,663 (88.5%) | 2,955 (11.5%) |
| 18 to 19 Year Olds | 10,090 (87.9%) | 1,384 (12.1%) |
| 20 to 24 Year Olds | 10,688 (83.3%) | 2,139 (16.7%) |
| 25 to 34 Year Olds | 6,504 (78.6%) | 1,768 (21.4%) |
| 35 Years and over | 6,177 (73.9%) | 2,180 (26.1%) |
| Total | 126,814 (82.7%) | 26,528 (17.3%) |
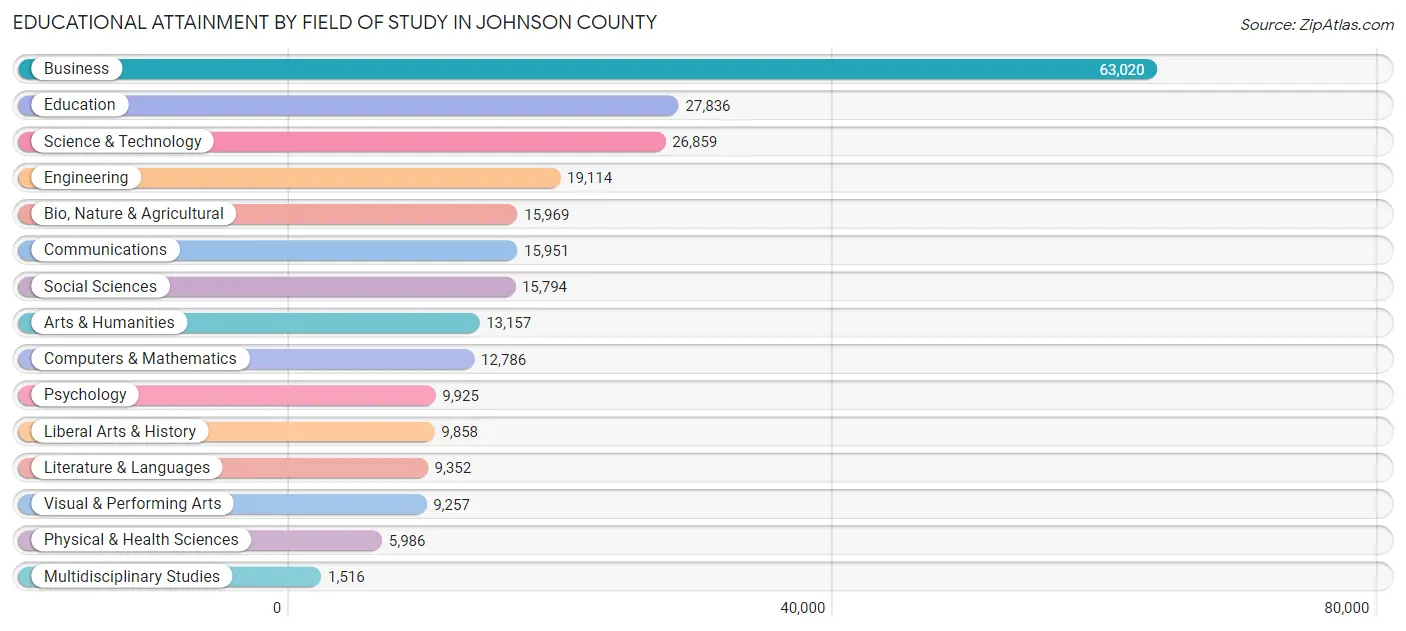
Educational Attainment by Field of Study in Johnson County
Business (63,020 | 24.6%), education (27,836 | 10.9%), science & technology (26,859 | 10.5%), engineering (19,114 | 7.5%), and bio, nature & agricultural (15,969 | 6.2%) are the most common fields of study among 256,380 individuals in Johnson County who have obtained a bachelor's degree or higher.
| Field of Study | # Graduates | % Graduates |
| Computers & Mathematics | 12,786 | 5.0% |
| Bio, Nature & Agricultural | 15,969 | 6.2% |
| Physical & Health Sciences | 5,986 | 2.3% |
| Psychology | 9,925 | 3.9% |
| Social Sciences | 15,794 | 6.2% |
| Engineering | 19,114 | 7.5% |
| Multidisciplinary Studies | 1,516 | 0.6% |
| Science & Technology | 26,859 | 10.5% |
| Business | 63,020 | 24.6% |
| Education | 27,836 | 10.9% |
| Literature & Languages | 9,352 | 3.6% |
| Liberal Arts & History | 9,858 | 3.8% |
| Visual & Performing Arts | 9,257 | 3.6% |
| Communications | 15,951 | 6.2% |
| Arts & Humanities | 13,157 | 5.1% |
| Total | 256,380 | 100.0% |
Transportation & Commute in Johnson County
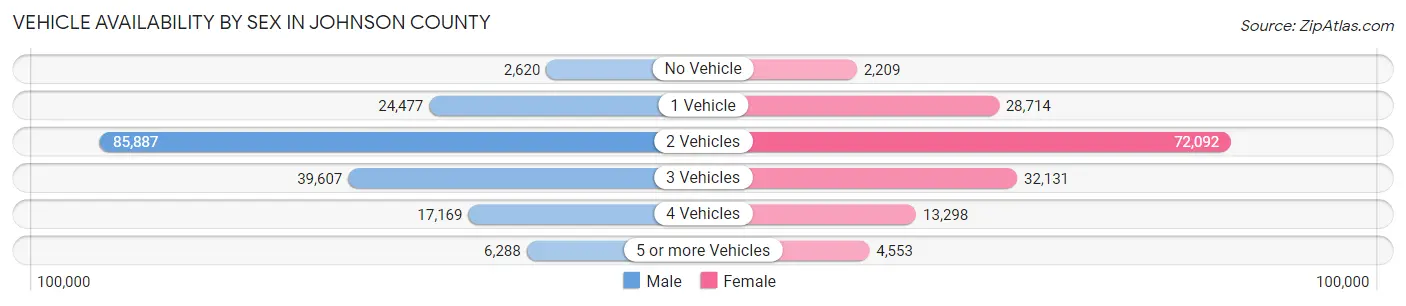
Vehicle Availability by Sex in Johnson County
The most prevalent vehicle ownership categories in Johnson County are males with 2 vehicles (85,887, accounting for 48.8%) and females with 2 vehicles (72,092, making up 56.1%).
| Vehicles Available | Male | Female |
| No Vehicle | 2,620 (1.5%) | 2,209 (1.4%) |
| 1 Vehicle | 24,477 (13.9%) | 28,714 (18.8%) |
| 2 Vehicles | 85,887 (48.8%) | 72,092 (47.1%) |
| 3 Vehicles | 39,607 (22.5%) | 32,131 (21.0%) |
| 4 Vehicles | 17,169 (9.8%) | 13,298 (8.7%) |
| 5 or more Vehicles | 6,288 (3.6%) | 4,553 (3.0%) |
| Total | 176,048 (100.0%) | 152,997 (100.0%) |
Commute Time in Johnson County
The most frequently occuring commute durations in Johnson County are 15 to 19 minutes (55,788 commuters, 20.5%), 20 to 24 minutes (54,105 commuters, 19.9%), and 10 to 14 minutes (42,358 commuters, 15.6%).
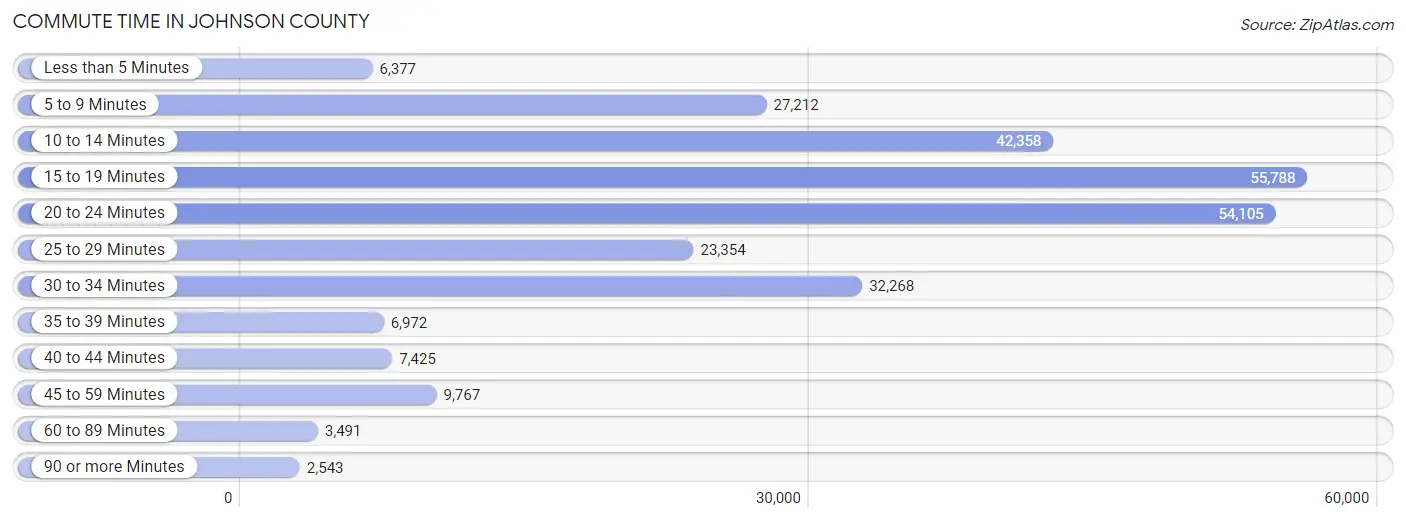
| Commute Time | # Commuters | % Commuters |
| Less than 5 Minutes | 6,377 | 2.4% |
| 5 to 9 Minutes | 27,212 | 10.0% |
| 10 to 14 Minutes | 42,358 | 15.6% |
| 15 to 19 Minutes | 55,788 | 20.5% |
| 20 to 24 Minutes | 54,105 | 19.9% |
| 25 to 29 Minutes | 23,354 | 8.6% |
| 30 to 34 Minutes | 32,268 | 11.9% |
| 35 to 39 Minutes | 6,972 | 2.6% |
| 40 to 44 Minutes | 7,425 | 2.7% |
| 45 to 59 Minutes | 9,767 | 3.6% |
| 60 to 89 Minutes | 3,491 | 1.3% |
| 90 or more Minutes | 2,543 | 0.9% |
Commute Time by Sex in Johnson County
The most common commute times in Johnson County are 20 to 24 minutes (29,281 commuters, 20.1%) for males and 15 to 19 minutes (26,759 commuters, 21.3%) for females.
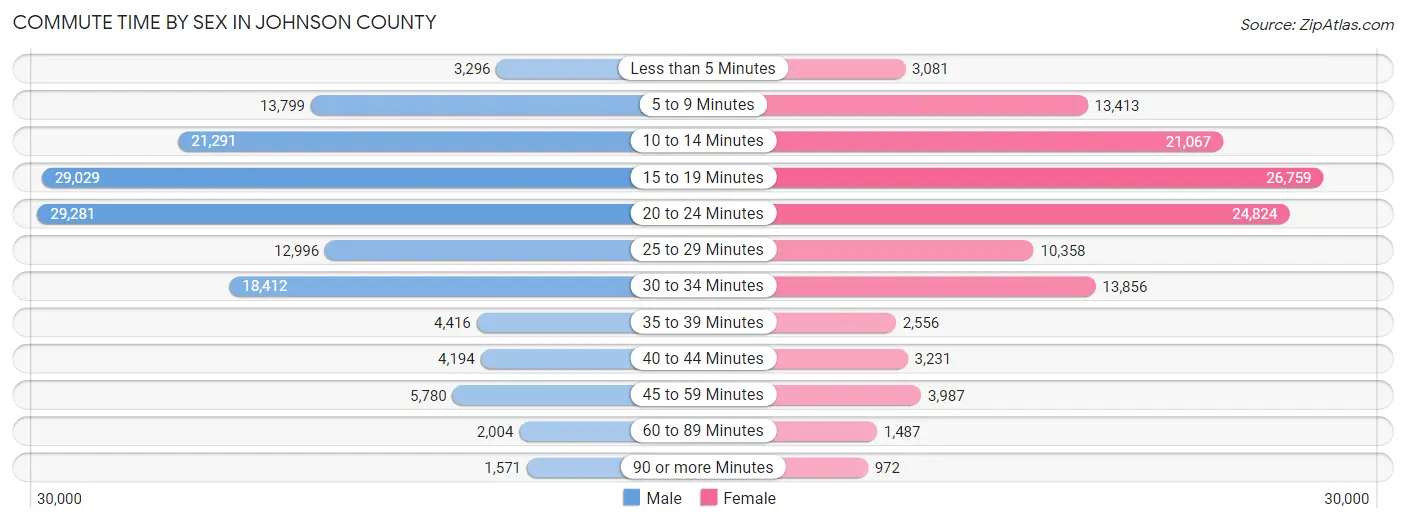
| Commute Time | Male | Female |
| Less than 5 Minutes | 3,296 (2.3%) | 3,081 (2.5%) |
| 5 to 9 Minutes | 13,799 (9.5%) | 13,413 (10.7%) |
| 10 to 14 Minutes | 21,291 (14.6%) | 21,067 (16.8%) |
| 15 to 19 Minutes | 29,029 (19.9%) | 26,759 (21.3%) |
| 20 to 24 Minutes | 29,281 (20.1%) | 24,824 (19.8%) |
| 25 to 29 Minutes | 12,996 (8.9%) | 10,358 (8.3%) |
| 30 to 34 Minutes | 18,412 (12.6%) | 13,856 (11.0%) |
| 35 to 39 Minutes | 4,416 (3.0%) | 2,556 (2.0%) |
| 40 to 44 Minutes | 4,194 (2.9%) | 3,231 (2.6%) |
| 45 to 59 Minutes | 5,780 (4.0%) | 3,987 (3.2%) |
| 60 to 89 Minutes | 2,004 (1.4%) | 1,487 (1.2%) |
| 90 or more Minutes | 1,571 (1.1%) | 972 (0.8%) |
Time of Departure to Work by Sex in Johnson County
The most frequent times of departure to work in Johnson County are 7:00 AM to 7:29 AM (23,989, 16.4%) for males and 7:30 AM to 7:59 AM (23,743, 18.9%) for females.
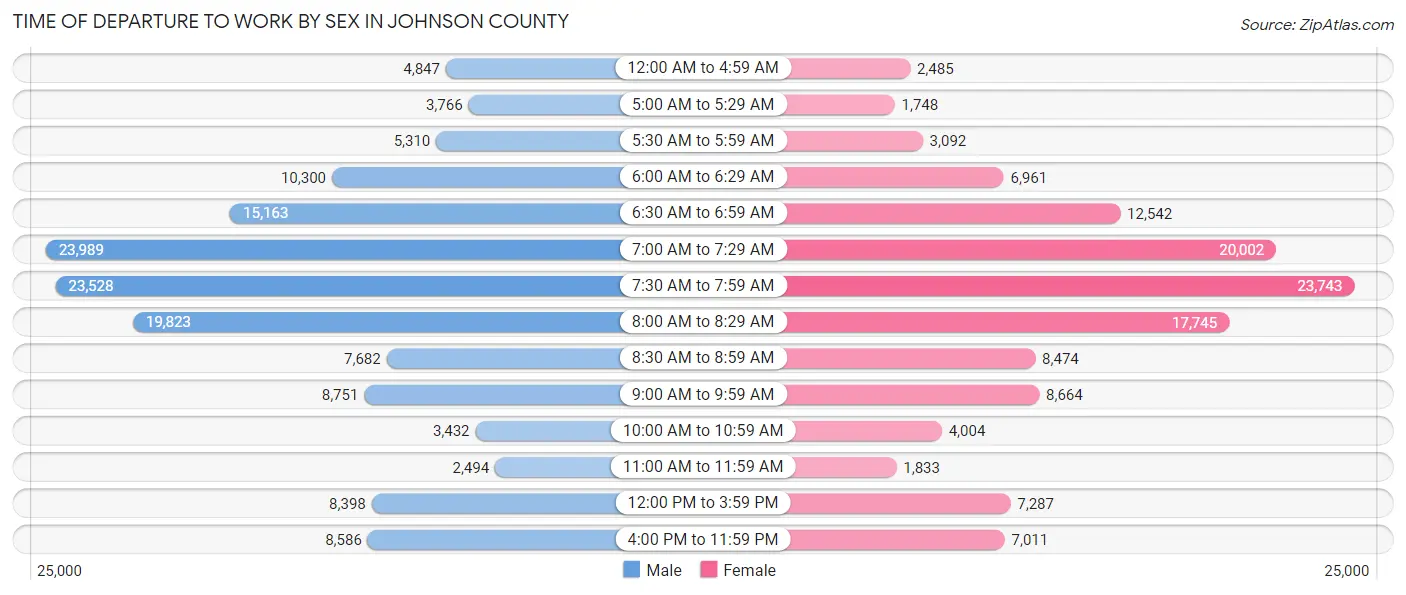
| Time of Departure | Male | Female |
| 12:00 AM to 4:59 AM | 4,847 (3.3%) | 2,485 (2.0%) |
| 5:00 AM to 5:29 AM | 3,766 (2.6%) | 1,748 (1.4%) |
| 5:30 AM to 5:59 AM | 5,310 (3.6%) | 3,092 (2.5%) |
| 6:00 AM to 6:29 AM | 10,300 (7.0%) | 6,961 (5.5%) |
| 6:30 AM to 6:59 AM | 15,163 (10.4%) | 12,542 (10.0%) |
| 7:00 AM to 7:29 AM | 23,989 (16.4%) | 20,002 (15.9%) |
| 7:30 AM to 7:59 AM | 23,528 (16.1%) | 23,743 (18.9%) |
| 8:00 AM to 8:29 AM | 19,823 (13.6%) | 17,745 (14.1%) |
| 8:30 AM to 8:59 AM | 7,682 (5.3%) | 8,474 (6.8%) |
| 9:00 AM to 9:59 AM | 8,751 (6.0%) | 8,664 (6.9%) |
| 10:00 AM to 10:59 AM | 3,432 (2.4%) | 4,004 (3.2%) |
| 11:00 AM to 11:59 AM | 2,494 (1.7%) | 1,833 (1.5%) |
| 12:00 PM to 3:59 PM | 8,398 (5.8%) | 7,287 (5.8%) |
| 4:00 PM to 11:59 PM | 8,586 (5.9%) | 7,011 (5.6%) |
| Total | 146,069 (100.0%) | 125,591 (100.0%) |
Housing Occupancy in Johnson County
Occupancy by Ownership in Johnson County
Of the total 241,191 dwellings in Johnson County, owner-occupied units account for 166,087 (68.9%), while renter-occupied units make up 75,104 (31.1%).
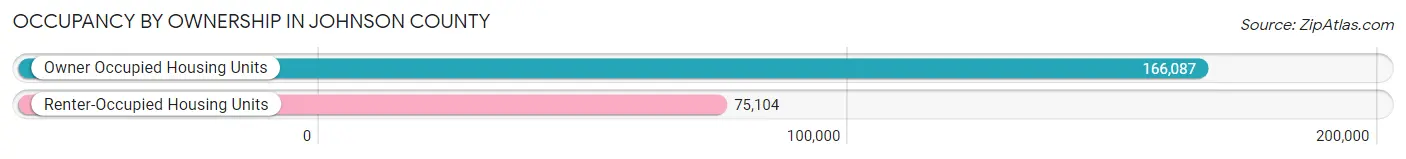
| Occupancy | # Housing Units | % Housing Units |
| Owner Occupied Housing Units | 166,087 | 68.9% |
| Renter-Occupied Housing Units | 75,104 | 31.1% |
| Total Occupied Housing Units | 241,191 | 100.0% |
Occupancy by Household Size in Johnson County
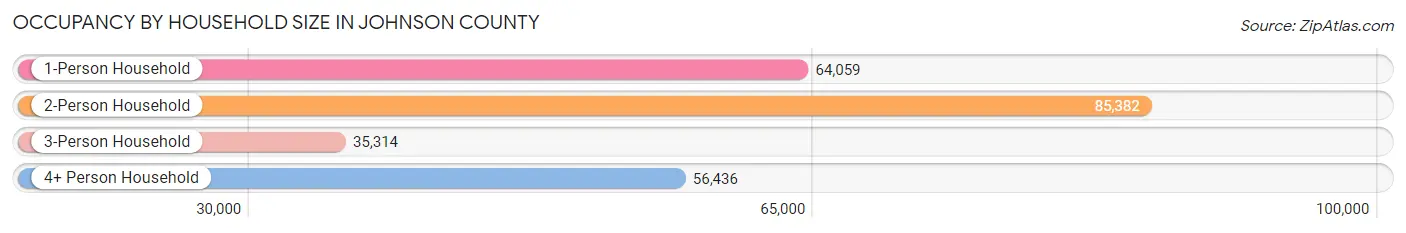
| Household Size | # Housing Units | % Housing Units |
| 1-Person Household | 64,059 | 26.6% |
| 2-Person Household | 85,382 | 35.4% |
| 3-Person Household | 35,314 | 14.6% |
| 4+ Person Household | 56,436 | 23.4% |
| Total Housing Units | 241,191 | 100.0% |
Occupancy by Ownership by Household Size in Johnson County
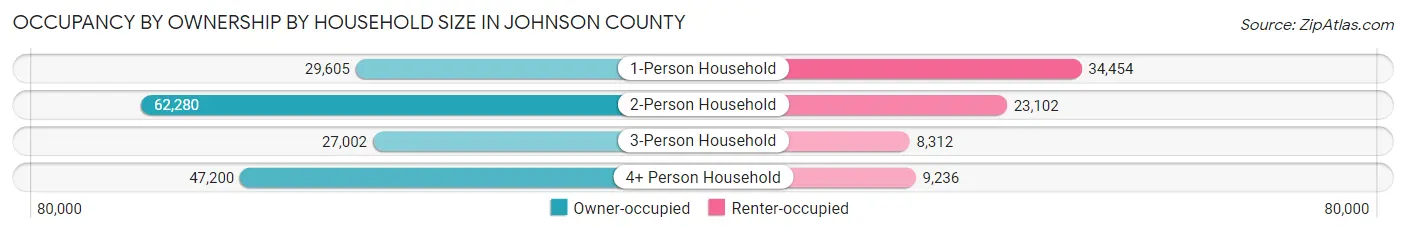
| Household Size | Owner-occupied | Renter-occupied |
| 1-Person Household | 29,605 (46.2%) | 34,454 (53.8%) |
| 2-Person Household | 62,280 (72.9%) | 23,102 (27.1%) |
| 3-Person Household | 27,002 (76.5%) | 8,312 (23.5%) |
| 4+ Person Household | 47,200 (83.6%) | 9,236 (16.4%) |
| Total Housing Units | 166,087 (68.9%) | 75,104 (31.1%) |
Occupancy by Educational Attainment in Johnson County
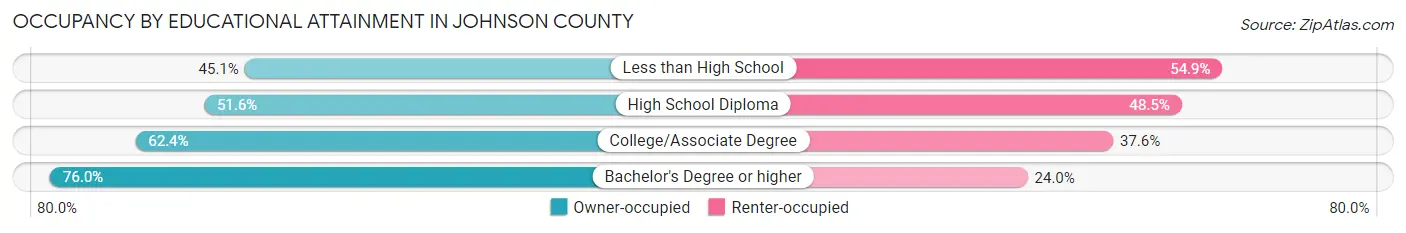
| Household Size | Owner-occupied | Renter-occupied |
| Less than High School | 2,794 (45.1%) | 3,401 (54.9%) |
| High School Diploma | 14,176 (51.5%) | 13,321 (48.4%) |
| College/Associate Degree | 39,363 (62.4%) | 23,693 (37.6%) |
| Bachelor's Degree or higher | 109,754 (76.0%) | 34,689 (24.0%) |
Occupancy by Age of Householder in Johnson County
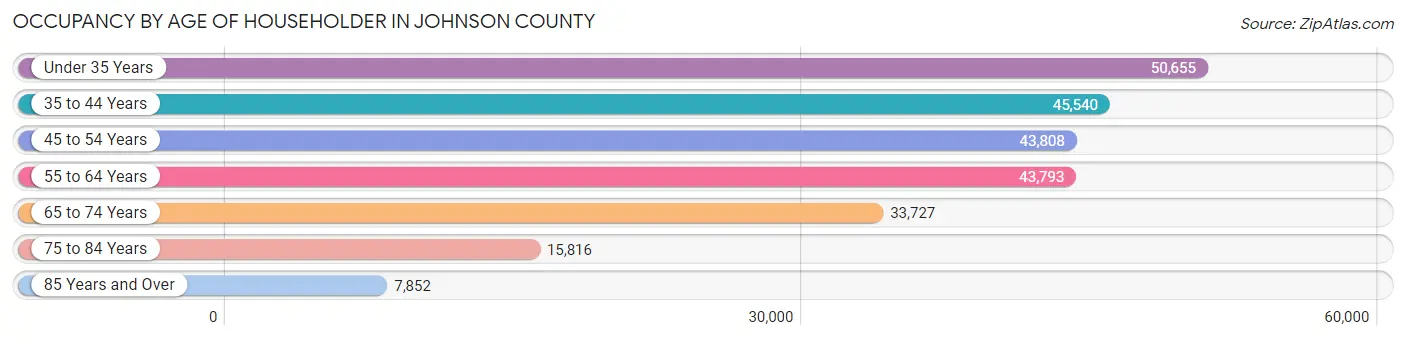
| Age Bracket | # Households | % Households |
| Under 35 Years | 50,655 | 21.0% |
| 35 to 44 Years | 45,540 | 18.9% |
| 45 to 54 Years | 43,808 | 18.2% |
| 55 to 64 Years | 43,793 | 18.2% |
| 65 to 74 Years | 33,727 | 14.0% |
| 75 to 84 Years | 15,816 | 6.6% |
| 85 Years and Over | 7,852 | 3.3% |
| Total | 241,191 | 100.0% |
Housing Finances in Johnson County
Median Income by Occupancy in Johnson County
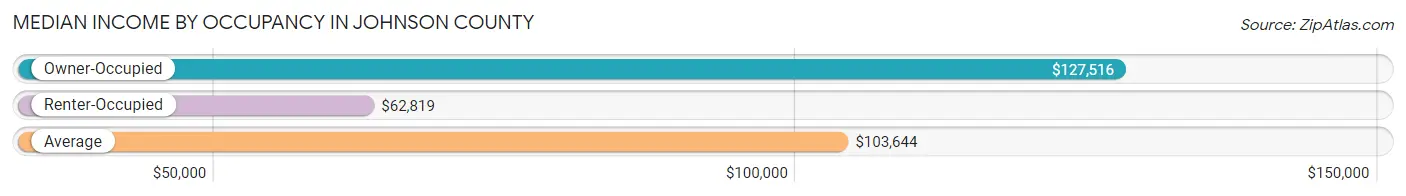
| Occupancy Type | # Households | Median Income |
| Owner-Occupied | 166,087 (68.9%) | $127,516 |
| Renter-Occupied | 75,104 (31.1%) | $62,819 |
| Average | 241,191 (100.0%) | $103,644 |
Occupancy by Householder Income Bracket in Johnson County
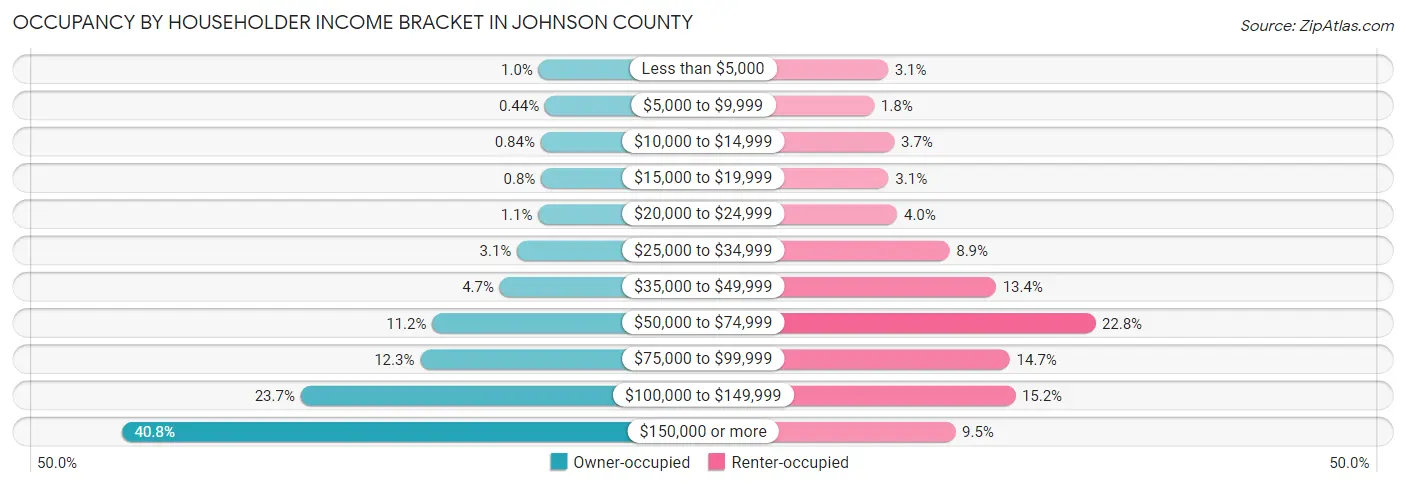
| Income Bracket | Owner-occupied | Renter-occupied |
| Less than $5,000 | 1,723 (1.0%) | 2,307 (3.1%) |
| $5,000 to $9,999 | 739 (0.4%) | 1,314 (1.8%) |
| $10,000 to $14,999 | 1,399 (0.8%) | 2,758 (3.7%) |
| $15,000 to $19,999 | 1,335 (0.8%) | 2,353 (3.1%) |
| $20,000 to $24,999 | 1,801 (1.1%) | 2,969 (4.0%) |
| $25,000 to $34,999 | 5,136 (3.1%) | 6,708 (8.9%) |
| $35,000 to $49,999 | 7,872 (4.7%) | 10,028 (13.4%) |
| $50,000 to $74,999 | 18,548 (11.2%) | 17,122 (22.8%) |
| $75,000 to $99,999 | 20,460 (12.3%) | 11,023 (14.7%) |
| $100,000 to $149,999 | 39,364 (23.7%) | 11,402 (15.2%) |
| $150,000 or more | 67,710 (40.8%) | 7,120 (9.5%) |
| Total | 166,087 (100.0%) | 75,104 (100.0%) |
Monthly Housing Cost Tiers in Johnson County
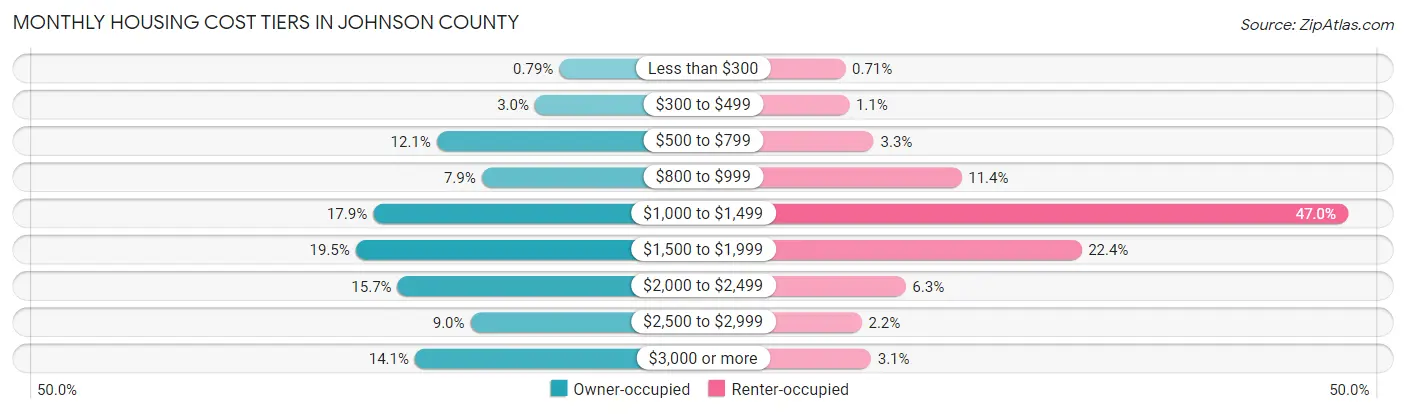
| Monthly Cost | Owner-occupied | Renter-occupied |
| Less than $300 | 1,306 (0.8%) | 531 (0.7%) |
| $300 to $499 | 5,033 (3.0%) | 796 (1.1%) |
| $500 to $799 | 20,049 (12.1%) | 2,500 (3.3%) |
| $800 to $999 | 13,174 (7.9%) | 8,564 (11.4%) |
| $1,000 to $1,499 | 29,783 (17.9%) | 35,283 (47.0%) |
| $1,500 to $1,999 | 32,435 (19.5%) | 16,857 (22.4%) |
| $2,000 to $2,499 | 26,040 (15.7%) | 4,705 (6.3%) |
| $2,500 to $2,999 | 14,876 (9.0%) | 1,665 (2.2%) |
| $3,000 or more | 23,391 (14.1%) | 2,309 (3.1%) |
| Total | 166,087 (100.0%) | 75,104 (100.0%) |
Physical Housing Characteristics in Johnson County
Housing Structures in Johnson County
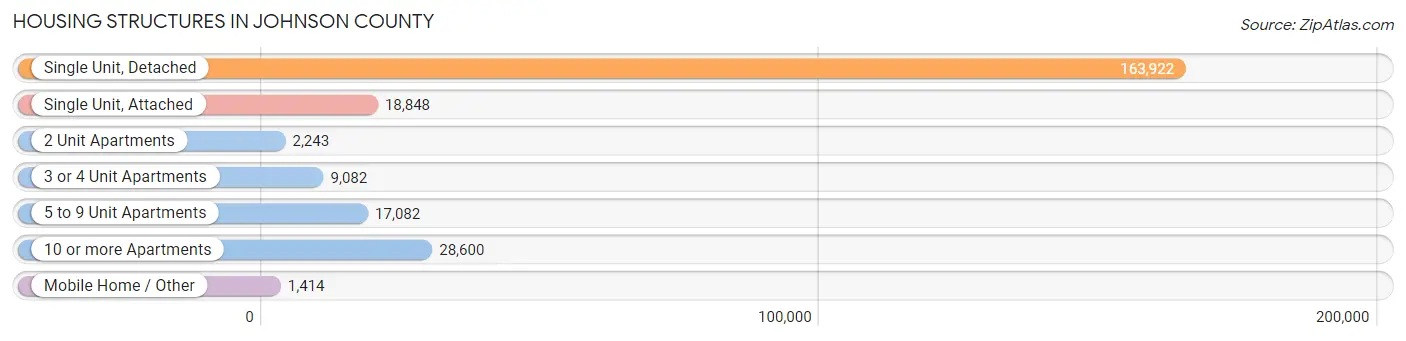
| Structure Type | # Housing Units | % Housing Units |
| Single Unit, Detached | 163,922 | 68.0% |
| Single Unit, Attached | 18,848 | 7.8% |
| 2 Unit Apartments | 2,243 | 0.9% |
| 3 or 4 Unit Apartments | 9,082 | 3.8% |
| 5 to 9 Unit Apartments | 17,082 | 7.1% |
| 10 or more Apartments | 28,600 | 11.9% |
| Mobile Home / Other | 1,414 | 0.6% |
| Total | 241,191 | 100.0% |
Housing Structures by Occupancy in Johnson County
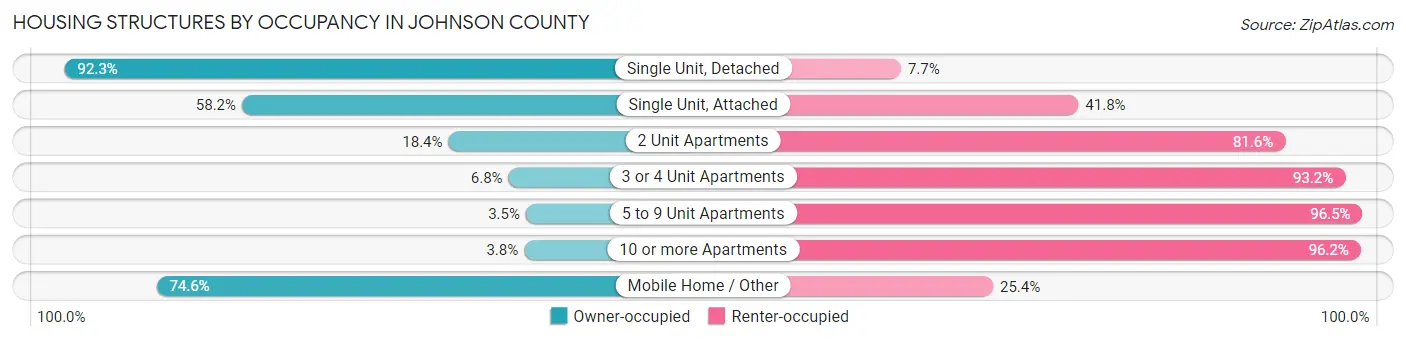
| Structure Type | Owner-occupied | Renter-occupied |
| Single Unit, Detached | 151,341 (92.3%) | 12,581 (7.7%) |
| Single Unit, Attached | 10,963 (58.2%) | 7,885 (41.8%) |
| 2 Unit Apartments | 413 (18.4%) | 1,830 (81.6%) |
| 3 or 4 Unit Apartments | 621 (6.8%) | 8,461 (93.2%) |
| 5 to 9 Unit Apartments | 598 (3.5%) | 16,484 (96.5%) |
| 10 or more Apartments | 1,096 (3.8%) | 27,504 (96.2%) |
| Mobile Home / Other | 1,055 (74.6%) | 359 (25.4%) |
| Total | 166,087 (68.9%) | 75,104 (31.1%) |
Housing Structures by Number of Rooms in Johnson County
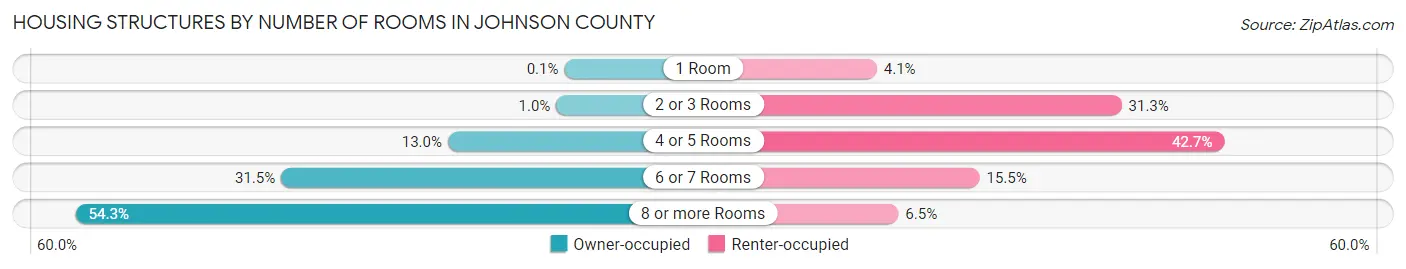
| Number of Rooms | Owner-occupied | Renter-occupied |
| 1 Room | 166 (0.1%) | 3,078 (4.1%) |
| 2 or 3 Rooms | 1,665 (1.0%) | 23,481 (31.3%) |
| 4 or 5 Rooms | 21,644 (13.0%) | 32,034 (42.6%) |
| 6 or 7 Rooms | 52,378 (31.5%) | 11,640 (15.5%) |
| 8 or more Rooms | 90,234 (54.3%) | 4,871 (6.5%) |
| Total | 166,087 (100.0%) | 75,104 (100.0%) |
Housing Structure by Heating Type in Johnson County
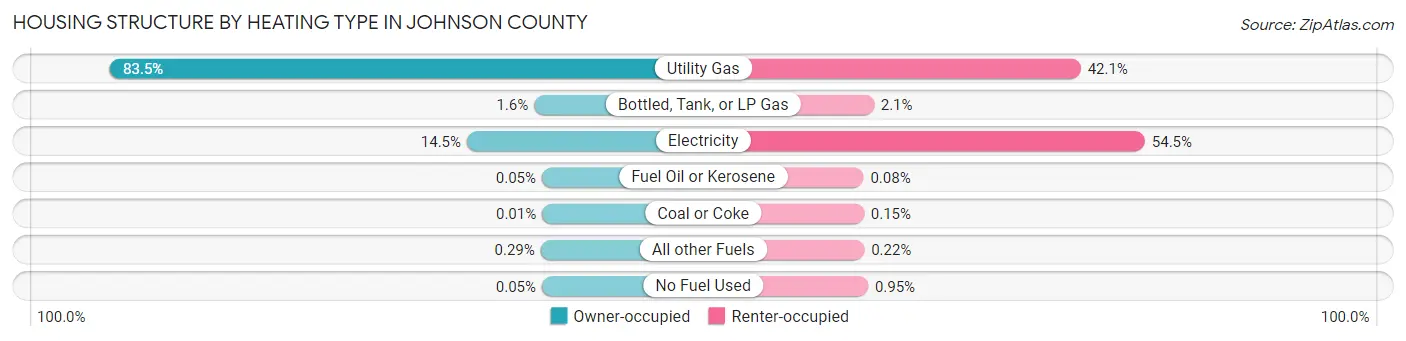
| Heating Type | Owner-occupied | Renter-occupied |
| Utility Gas | 138,682 (83.5%) | 31,592 (42.1%) |
| Bottled, Tank, or LP Gas | 2,597 (1.6%) | 1,555 (2.1%) |
| Electricity | 24,147 (14.5%) | 40,905 (54.5%) |
| Fuel Oil or Kerosene | 85 (0.1%) | 58 (0.1%) |
| Coal or Coke | 18 (0.0%) | 115 (0.2%) |
| All other Fuels | 482 (0.3%) | 163 (0.2%) |
| No Fuel Used | 76 (0.1%) | 716 (0.9%) |
| Total | 166,087 (100.0%) | 75,104 (100.0%) |
Household Vehicle Usage in Johnson County
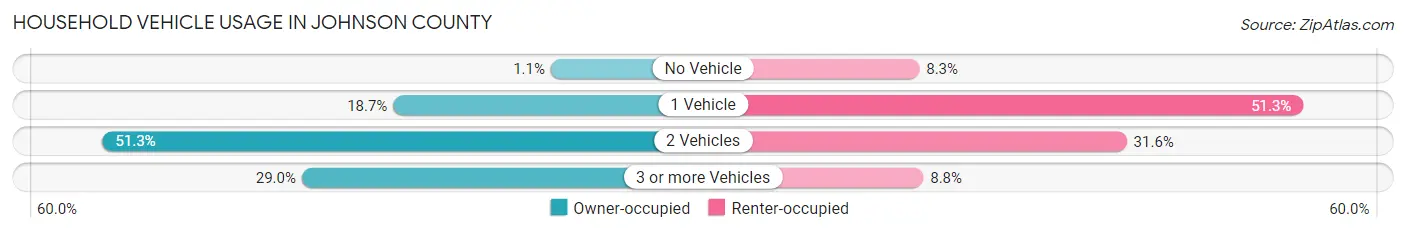
| Vehicles per Household | Owner-occupied | Renter-occupied |
| No Vehicle | 1,757 (1.1%) | 6,254 (8.3%) |
| 1 Vehicle | 31,082 (18.7%) | 38,554 (51.3%) |
| 2 Vehicles | 85,172 (51.3%) | 23,703 (31.6%) |
| 3 or more Vehicles | 48,076 (28.9%) | 6,593 (8.8%) |
| Total | 166,087 (100.0%) | 75,104 (100.0%) |
Real Estate & Mortgages in Johnson County
Real Estate and Mortgage Overview in Johnson County
| Characteristic | Without Mortgage | With Mortgage |
| Housing Units | 50,229 | 115,858 |
| Median Property Value | $334,800 | $346,600 |
| Median Household Income | $99,635 | $53,340 |
| Monthly Housing Costs | $802 | $22,957 |
| Real Estate Taxes | $3,989 | $1,517 |
Property Value by Mortgage Status in Johnson County
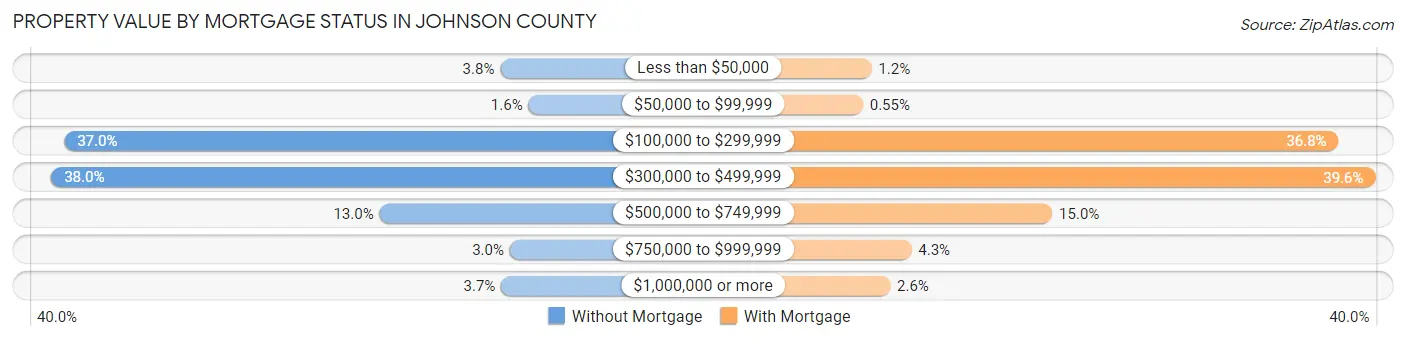
| Property Value | Without Mortgage | With Mortgage |
| Less than $50,000 | 1,887 (3.8%) | 1,407 (1.2%) |
| $50,000 to $99,999 | 808 (1.6%) | 639 (0.5%) |
| $100,000 to $299,999 | 18,575 (37.0%) | 42,621 (36.8%) |
| $300,000 to $499,999 | 19,071 (38.0%) | 45,880 (39.6%) |
| $500,000 to $749,999 | 6,511 (13.0%) | 17,350 (15.0%) |
| $750,000 to $999,999 | 1,523 (3.0%) | 4,919 (4.3%) |
| $1,000,000 or more | 1,854 (3.7%) | 3,042 (2.6%) |
| Total | 50,229 (100.0%) | 115,858 (100.0%) |
Household Income by Mortgage Status in Johnson County
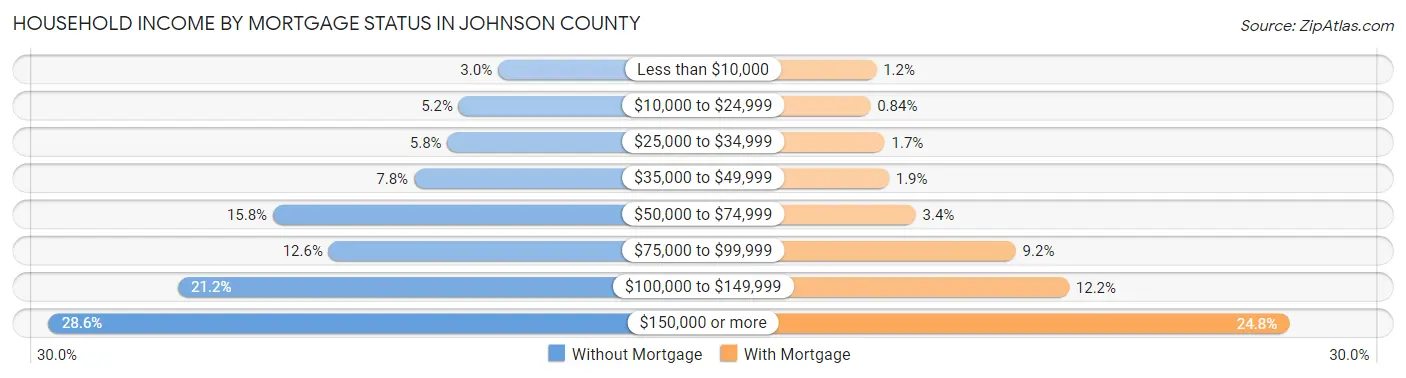
| Household Income | Without Mortgage | With Mortgage |
| Less than $10,000 | 1,484 (2.9%) | 1,365 (1.2%) |
| $10,000 to $24,999 | 2,606 (5.2%) | 978 (0.8%) |
| $25,000 to $34,999 | 2,932 (5.8%) | 1,929 (1.7%) |
| $35,000 to $49,999 | 3,893 (7.7%) | 2,204 (1.9%) |
| $50,000 to $74,999 | 7,943 (15.8%) | 3,979 (3.4%) |
| $75,000 to $99,999 | 6,338 (12.6%) | 10,605 (9.1%) |
| $100,000 to $149,999 | 10,663 (21.2%) | 14,122 (12.2%) |
| $150,000 or more | 14,370 (28.6%) | 28,701 (24.8%) |
| Total | 50,229 (100.0%) | 115,858 (100.0%) |
Property Value to Household Income Ratio in Johnson County
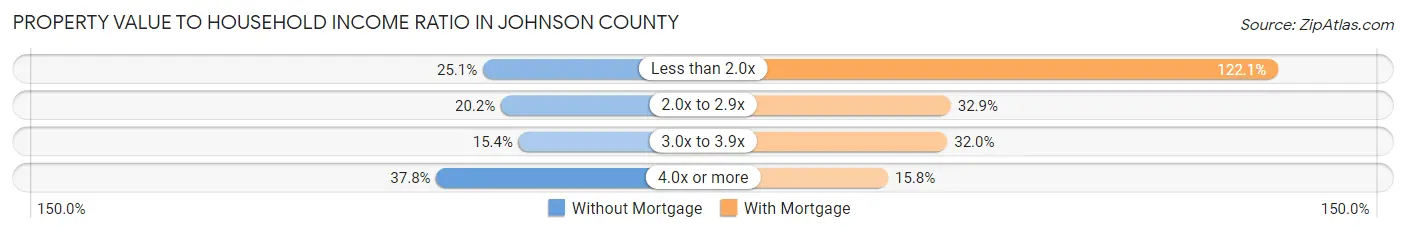
| Value-to-Income Ratio | Without Mortgage | With Mortgage |
| Less than 2.0x | 12,618 (25.1%) | 141,416 (122.1%) |
| 2.0x to 2.9x | 10,149 (20.2%) | 38,157 (32.9%) |
| 3.0x to 3.9x | 7,726 (15.4%) | 37,057 (32.0%) |
| 4.0x or more | 18,999 (37.8%) | 18,354 (15.8%) |
| Total | 50,229 (100.0%) | 115,858 (100.0%) |
Real Estate Taxes by Mortgage Status in Johnson County
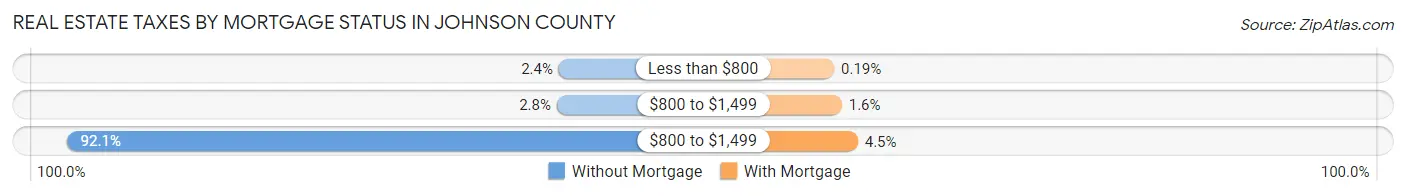
| Property Taxes | Without Mortgage | With Mortgage |
| Less than $800 | 1,220 (2.4%) | 215 (0.2%) |
| $800 to $1,499 | 1,402 (2.8%) | 1,859 (1.6%) |
| $800 to $1,499 | 46,278 (92.1%) | 5,242 (4.5%) |
| Total | 50,229 (100.0%) | 115,858 (100.0%) |
Health & Disability in Johnson County
Health Insurance Coverage by Age in Johnson County
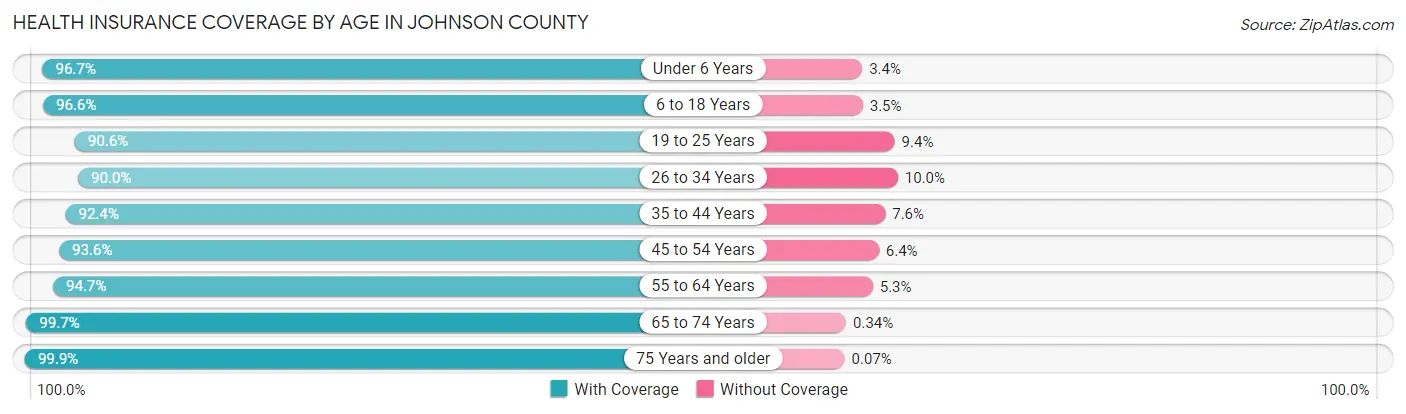
| Age Bracket | With Coverage | Without Coverage |
| Under 6 Years | 43,100 (96.7%) | 1,493 (3.4%) |
| 6 to 18 Years | 105,116 (96.6%) | 3,756 (3.5%) |
| 19 to 25 Years | 44,424 (90.6%) | 4,602 (9.4%) |
| 26 to 34 Years | 66,954 (90.0%) | 7,432 (10.0%) |
| 35 to 44 Years | 80,148 (92.4%) | 6,626 (7.6%) |
| 45 to 54 Years | 72,422 (93.6%) | 4,983 (6.4%) |
| 55 to 64 Years | 70,870 (94.7%) | 3,975 (5.3%) |
| 65 to 74 Years | 55,254 (99.7%) | 187 (0.3%) |
| 75 Years and older | 34,751 (99.9%) | 26 (0.1%) |
| Total | 573,039 (94.5%) | 33,080 (5.5%) |
Health Insurance Coverage by Citizenship Status in Johnson County
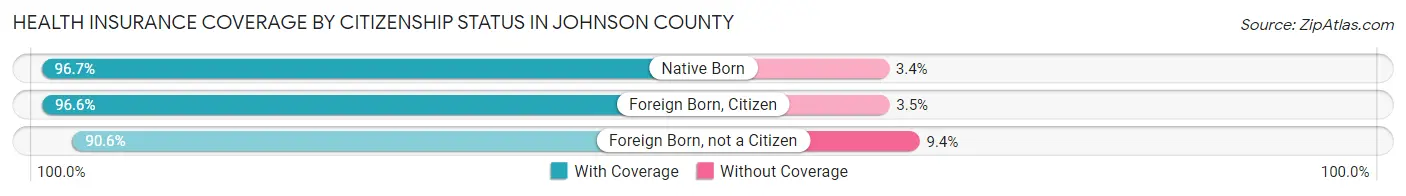
| Citizenship Status | With Coverage | Without Coverage |
| Native Born | 43,100 (96.7%) | 1,493 (3.4%) |
| Foreign Born, Citizen | 105,116 (96.6%) | 3,756 (3.5%) |
| Foreign Born, not a Citizen | 44,424 (90.6%) | 4,602 (9.4%) |
Health Insurance Coverage by Household Income in Johnson County
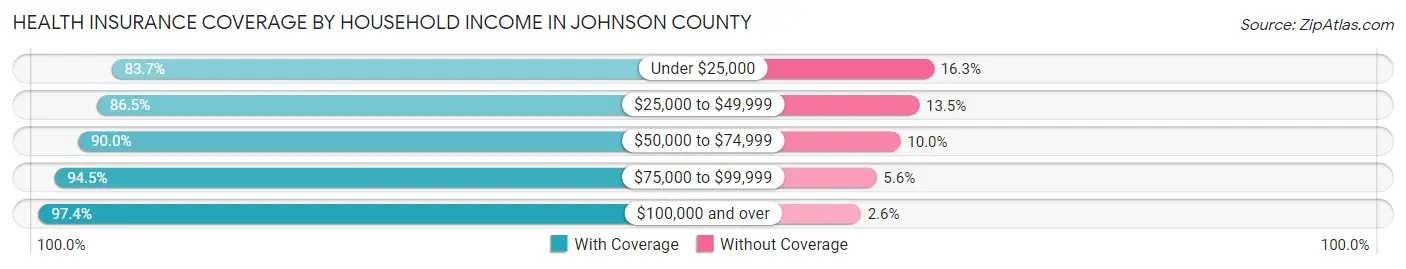
| Household Income | With Coverage | Without Coverage |
| Under $25,000 | 24,045 (83.7%) | 4,679 (16.3%) |
| $25,000 to $49,999 | 44,714 (86.5%) | 7,000 (13.5%) |
| $50,000 to $74,999 | 63,402 (90.0%) | 7,076 (10.0%) |
| $75,000 to $99,999 | 71,440 (94.5%) | 4,198 (5.6%) |
| $100,000 and over | 368,139 (97.4%) | 9,877 (2.6%) |
Public vs Private Health Insurance Coverage by Age in Johnson County
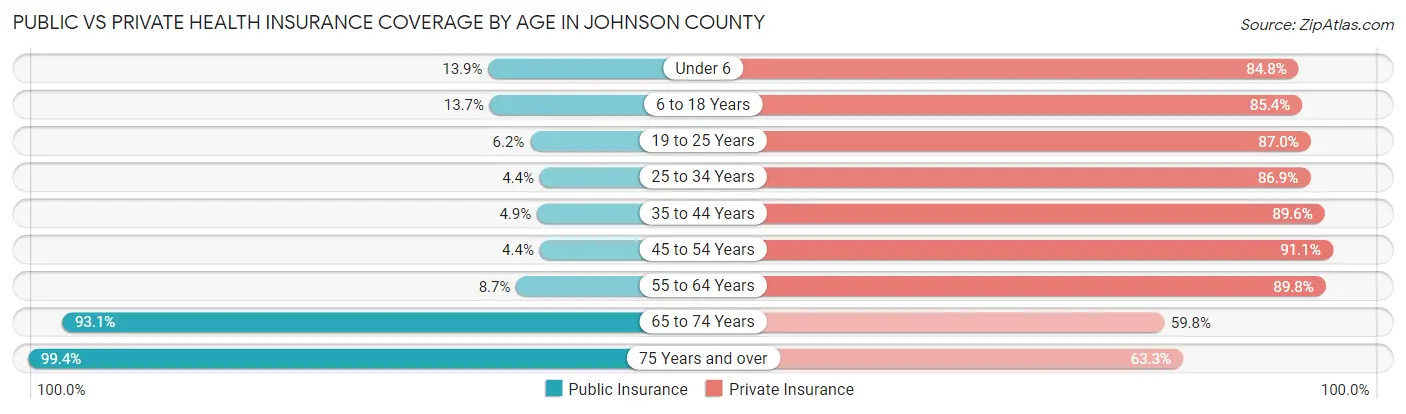
| Age Bracket | Public Insurance | Private Insurance |
| Under 6 | 6,213 (13.9%) | 37,801 (84.8%) |
| 6 to 18 Years | 14,867 (13.7%) | 93,005 (85.4%) |
| 19 to 25 Years | 3,015 (6.1%) | 42,660 (87.0%) |
| 25 to 34 Years | 3,242 (4.4%) | 64,643 (86.9%) |
| 35 to 44 Years | 4,232 (4.9%) | 77,746 (89.6%) |
| 45 to 54 Years | 3,393 (4.4%) | 70,489 (91.1%) |
| 55 to 64 Years | 6,534 (8.7%) | 67,210 (89.8%) |
| 65 to 74 Years | 51,596 (93.1%) | 33,133 (59.8%) |
| 75 Years and over | 34,561 (99.4%) | 22,019 (63.3%) |
| Total | 127,653 (21.1%) | 508,706 (83.9%) |
Disability Status by Sex by Age in Johnson County
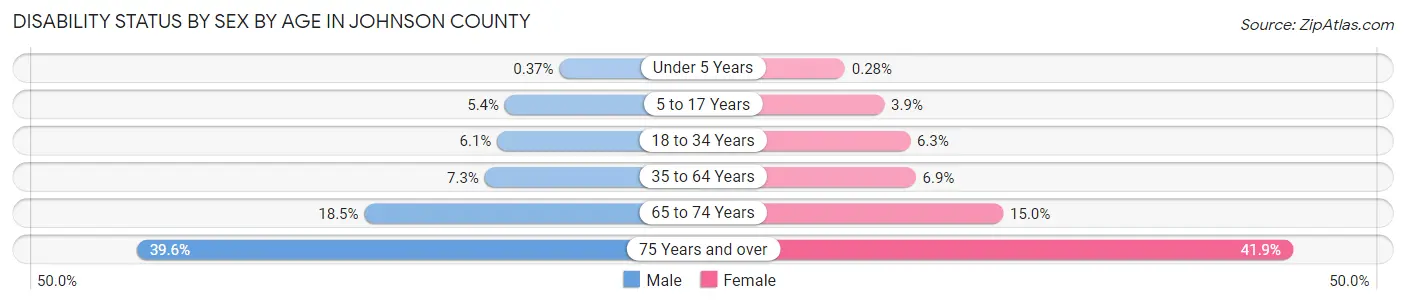
| Age Bracket | Male | Female |
| Under 5 Years | 69 (0.4%) | 50 (0.3%) |
| 5 to 17 Years | 3,011 (5.4%) | 2,081 (3.9%) |
| 18 to 34 Years | 4,108 (6.1%) | 4,105 (6.3%) |
| 35 to 64 Years | 8,647 (7.3%) | 8,259 (6.9%) |
| 65 to 74 Years | 4,785 (18.5%) | 4,422 (15.0%) |
| 75 Years and over | 5,747 (39.6%) | 8,480 (41.9%) |
Disability Class by Sex by Age in Johnson County
Disability Class: Hearing Difficulty
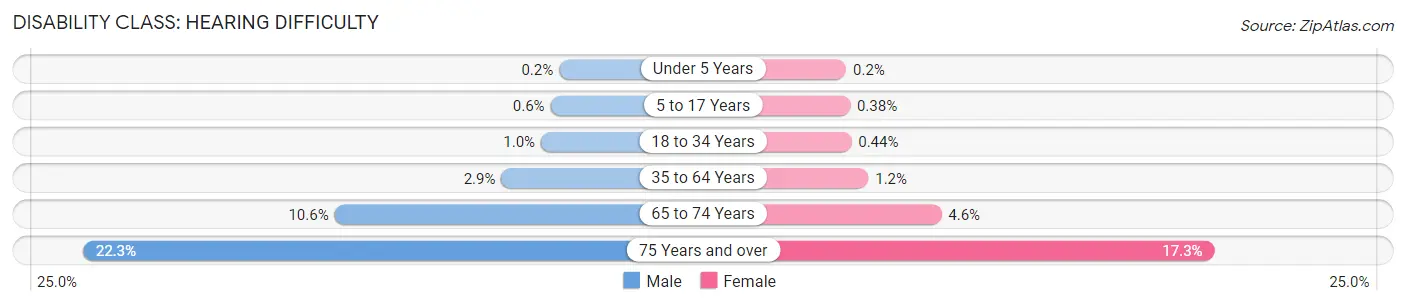
| Age Bracket | Male | Female |
| Under 5 Years | 37 (0.2%) | 37 (0.2%) |
| 5 to 17 Years | 332 (0.6%) | 203 (0.4%) |
| 18 to 34 Years | 695 (1.0%) | 288 (0.4%) |
| 35 to 64 Years | 3,415 (2.9%) | 1,481 (1.2%) |
| 65 to 74 Years | 2,752 (10.6%) | 1,364 (4.6%) |
| 75 Years and over | 3,237 (22.3%) | 3,502 (17.3%) |
Disability Class: Vision Difficulty
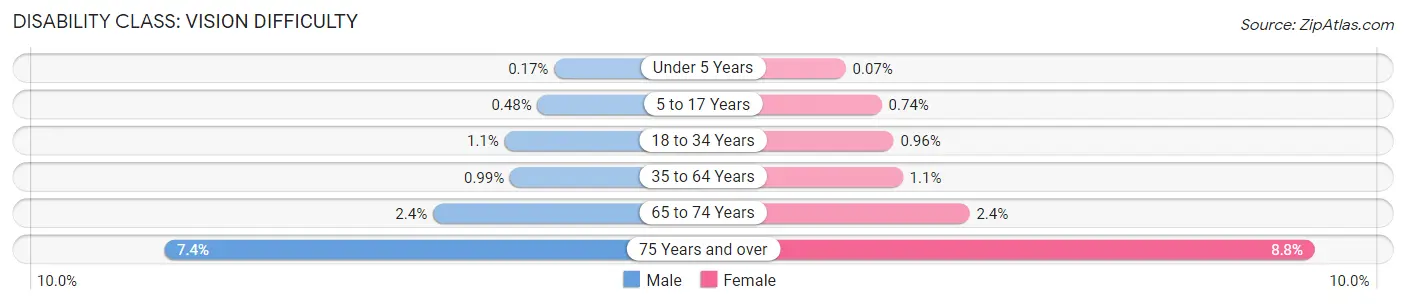
| Age Bracket | Male | Female |
| Under 5 Years | 32 (0.2%) | 13 (0.1%) |
| 5 to 17 Years | 265 (0.5%) | 394 (0.7%) |
| 18 to 34 Years | 728 (1.1%) | 623 (1.0%) |
| 35 to 64 Years | 1,167 (1.0%) | 1,358 (1.1%) |
| 65 to 74 Years | 626 (2.4%) | 701 (2.4%) |
| 75 Years and over | 1,076 (7.4%) | 1,778 (8.8%) |
Disability Class: Cognitive Difficulty
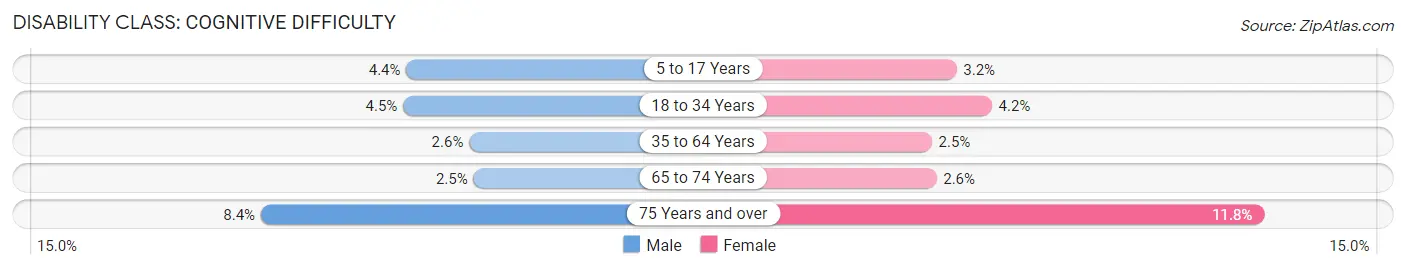
| Age Bracket | Male | Female |
| 5 to 17 Years | 2,423 (4.4%) | 1,692 (3.2%) |
| 18 to 34 Years | 2,984 (4.5%) | 2,700 (4.2%) |
| 35 to 64 Years | 3,106 (2.6%) | 3,021 (2.5%) |
| 65 to 74 Years | 648 (2.5%) | 778 (2.6%) |
| 75 Years and over | 1,222 (8.4%) | 2,383 (11.8%) |
Disability Class: Ambulatory Difficulty
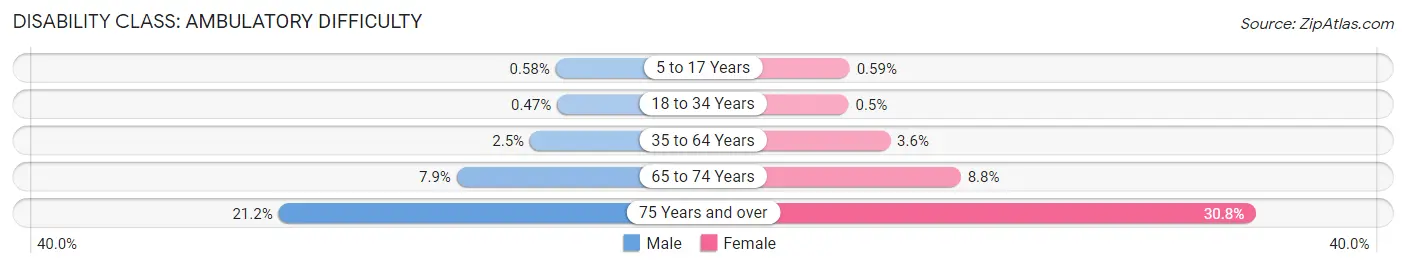
| Age Bracket | Male | Female |
| 5 to 17 Years | 321 (0.6%) | 314 (0.6%) |
| 18 to 34 Years | 313 (0.5%) | 327 (0.5%) |
| 35 to 64 Years | 2,941 (2.5%) | 4,330 (3.6%) |
| 65 to 74 Years | 2,053 (7.9%) | 2,607 (8.8%) |
| 75 Years and over | 3,071 (21.1%) | 6,229 (30.7%) |
Disability Class: Self-Care Difficulty
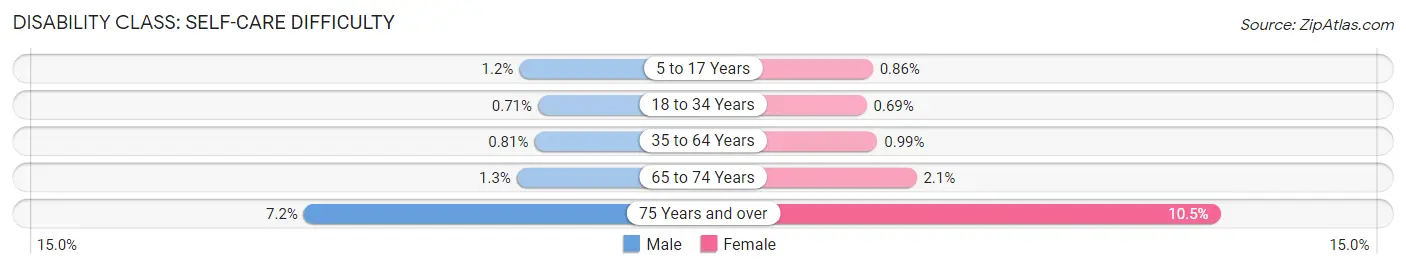
| Age Bracket | Male | Female |
| 5 to 17 Years | 685 (1.2%) | 456 (0.9%) |
| 18 to 34 Years | 475 (0.7%) | 446 (0.7%) |
| 35 to 64 Years | 958 (0.8%) | 1,198 (1.0%) |
| 65 to 74 Years | 337 (1.3%) | 613 (2.1%) |
| 75 Years and over | 1,049 (7.2%) | 2,136 (10.5%) |
Technology Access in Johnson County
Computing Device Access in Johnson County
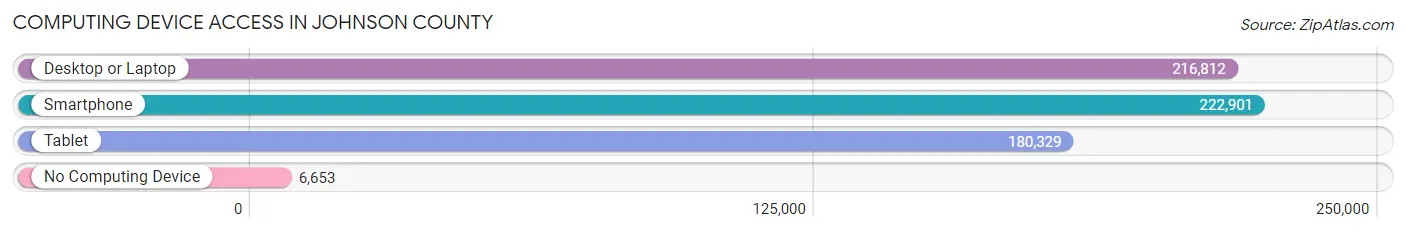
| Device Type | # Households | % Households |
| Desktop or Laptop | 216,812 | 89.9% |
| Smartphone | 222,901 | 92.4% |
| Tablet | 180,329 | 74.8% |
| No Computing Device | 6,653 | 2.8% |
| Total | 241,191 | 100.0% |
Internet Access in Johnson County
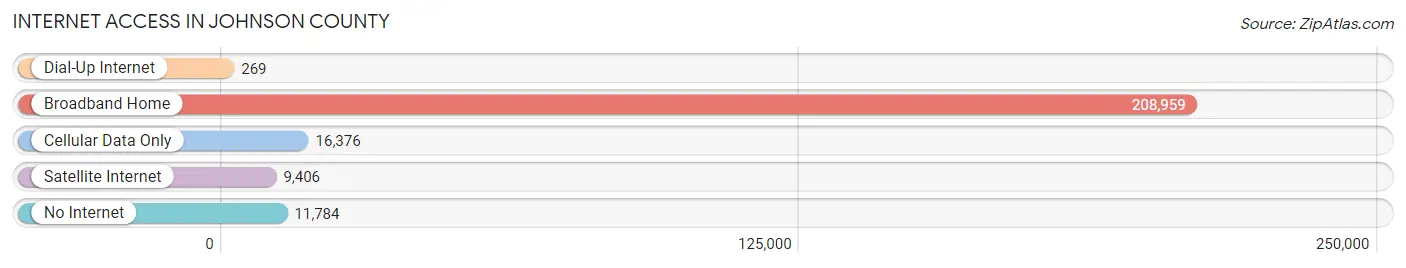
| Internet Type | # Households | % Households |
| Dial-Up Internet | 269 | 0.1% |
| Broadband Home | 208,959 | 86.6% |
| Cellular Data Only | 16,376 | 6.8% |
| Satellite Internet | 9,406 | 3.9% |
| No Internet | 11,784 | 4.9% |
| Total | 241,191 | 100.0% |
Johnson County Summary
Johnson County, Kansas is located in the northeastern part of the state and is part of the Kansas City metropolitan area. It is the most populous county in Kansas, with a population of 544,179 as of the 2010 census. The county seat is Olathe, and the largest city is Overland Park.
History
Johnson County was established in 1855 and named after the Reverend Thomas Johnson, a Methodist missionary who worked with the Shawnee Indians in the area. The county was originally part of the Shawnee Indian Reservation, which was established in 1825. The county was organized in 1859 and the first county seat was established in Olathe.
The county experienced rapid growth in the late 19th and early 20th centuries, due to the arrival of the railroad and the growth of the Kansas City metropolitan area. The population of the county increased from 8,000 in 1880 to over 200,000 by the year 2000.
Geography
Johnson County is located in the northeastern part of Kansas, and is bordered by Wyandotte County to the north, Miami County to the east, Douglas County to the south, and Leavenworth County to the west. The county covers an area of 518 square miles, and is mostly flat with some rolling hills. The county is part of the Osage Plains, and is drained by the Kansas and Missouri Rivers.
The county is home to several parks and recreational areas, including Shawnee Mission Park, Kill Creek Park, and the Johnson County Park and Recreation District.
Economy
Johnson County is part of the Kansas City metropolitan area, and is home to a diverse economy. The county is home to several major employers, including Sprint, Garmin, and the University of Kansas Medical Center. The county is also home to several large shopping malls, including Oak Park Mall and Town Center Plaza.
The county has a strong agricultural sector, with corn, soybeans, and wheat being the main crops. The county is also home to several wineries and breweries, as well as a number of small businesses.
Demographics
As of the 2010 census, Johnson County had a population of 544,179, making it the most populous county in Kansas. The population was spread out, with 25.3% under the age of 18, 8.2% from 18 to 24, 33.2% from 25 to 44, 22.2% from 45 to 64, and 11.1% who were 65 years of age or older. The median age was 35.4 years.
The racial makeup of the county was 79.2% White, 8.2% African American, 0.5% Native American, 6.7% Asian, 0.1% Pacific Islander, 2.3% from other races, and 2.9% from two or more races. Hispanic or Latino of any race were 6.7% of the population.
The median income for a household in the county was $68,945, and the median income for a family was $83,945. The per capita income for the county was $35,945. About 5.2% of families and 7.7% of the population were below the poverty line, including 9.2% of those under age 18 and 5.2% of those age 65 or over.
Common Questions
What is the Total Population of Johnson County?
Total Population of Johnson County is 610,742.
What is the Total Male Population of Johnson County?
Total Male Population of Johnson County is 302,382.
What is the Total Female Population of Johnson County?
Total Female Population of Johnson County is 308,360.
What is the Ratio of Males per 100 Females in Johnson County?
There are 98.06 Males per 100 Females in Johnson County.
What is the Ratio of Females per 100 Males in Johnson County?
There are 101.98 Females per 100 Males in Johnson County.
What is the Median Population Age in Johnson County?
Median Population Age in Johnson County is 38.1 Years.
What is the Average Family Size in Johnson County
Average Family Size in Johnson County is 3.1 People.
What is the Average Household Size in Johnson County
Average Household Size in Johnson County is 2.5 People.
What is Per Capita Income in Johnson County?
Per Capita income in Johnson County is $56,364.
What is the Median Family Income in Johnson County?
Median Family Income in Johnson County is $126,651.
What is the Median Household income in Johnson County?
Median Household Income in Johnson County is $103,644.
What is Income or Wage Gap in Johnson County?
Income or Wage Gap in Johnson County is 31.5%.
Women in Johnson County earn 68.5 cents for every dollar earned by a man.
What is Family Income Deficit in Johnson County?
Family Income Deficit in Johnson County is $10,540.
Families that are below poverty line in Johnson County earn $10,540 less on average than the poverty threshold level.
What is Inequality or Gini Index in Johnson County?
Inequality or Gini Index in Johnson County is 0.45.
How Large is the Labor Force in Johnson County?
There are 347,458 People in the Labor Forcein in Johnson County.
What is the Percentage of People in the Labor Force in Johnson County?
71.9% of People are in the Labor Force in Johnson County.
What is the Unemployment Rate in Johnson County?
Unemployment Rate in Johnson County is 3.2%.