Jewell County, KS
Jewell County Map
Jewell County Overview
2,929
TOTAL POPULATION
1,521
MALE POPULATION
1,408
FEMALE POPULATION
108.03
MALES / 100 FEMALES
92.57
FEMALES / 100 MALES
51.1
MEDIAN AGE
2.9
AVG FAMILY SIZE
2.3
AVG HOUSEHOLD SIZE
$32,759
PER CAPITA INCOME
$66,161
AVG FAMILY INCOME
$47,109
AVG HOUSEHOLD INCOME
29.7%
WAGE / INCOME GAP [ % ]
70.3¢/ $1
WAGE / INCOME GAP [ $ ]
0.50
INEQUALITY / GINI INDEX
1,329
LABOR FORCE [ PEOPLE ]
55.9%
PERCENT IN LABOR FORCE
1.5%
UNEMPLOYMENT RATE
Jewell County Area Codes
Race in Jewell County
The most populous races in Jewell County are White / Caucasian (2,732 | 93.3%), Two or more Races (131 | 4.5%), and Hispanic or Latino (50 | 1.7%).

| Race | # Population | % Population |
| Asian | 8 | 0.3% |
| Black / African American | 33 | 1.1% |
| Hawaiian / Pacific | 0 | 0.0% |
| Hispanic or Latino | 50 | 1.7% |
| Native / Alaskan | 7 | 0.2% |
| White / Caucasian | 2,732 | 93.3% |
| Two or more Races | 131 | 4.5% |
| Some other Race | 18 | 0.6% |
| Total | 2,929 | 100.0% |
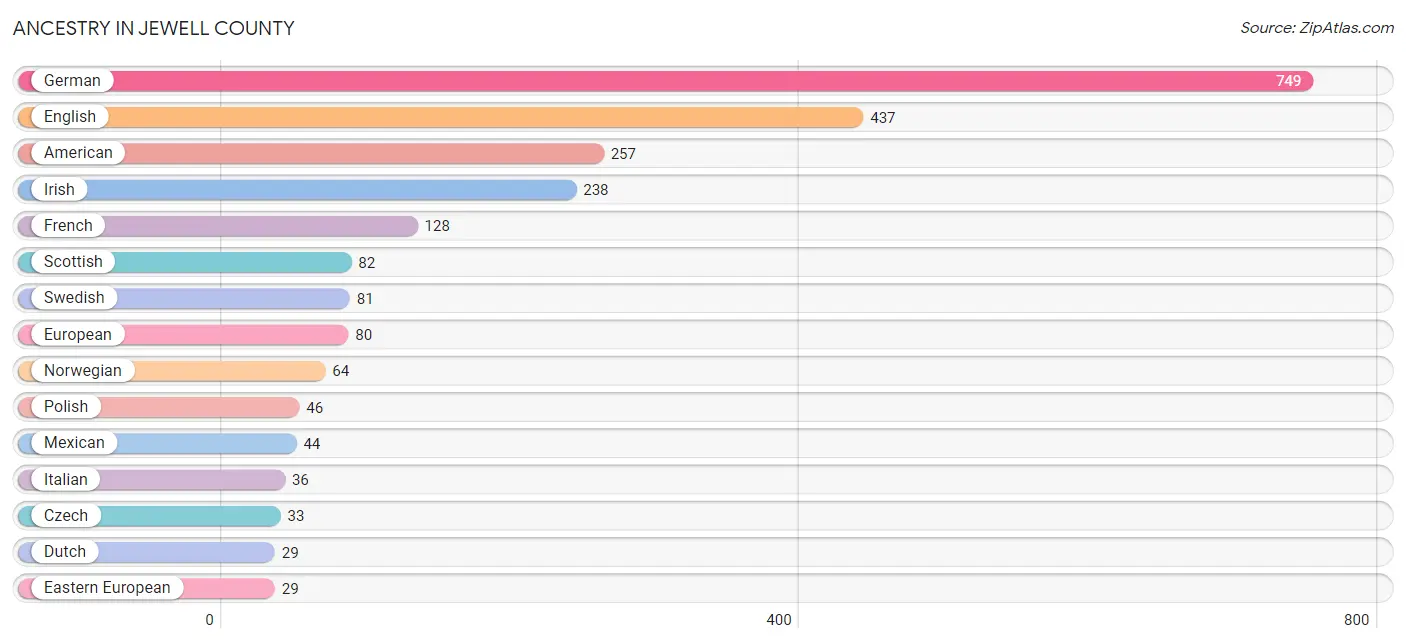
Ancestry in Jewell County
The most populous ancestries reported in Jewell County are German (749 | 25.6%), English (437 | 14.9%), American (257 | 8.8%), Irish (238 | 8.1%), and French (128 | 4.4%), together accounting for 61.8% of all Jewell County residents.
| Ancestry | # Population | % Population |
| Albanian | 14 | 0.5% |
| American | 257 | 8.8% |
| Apache | 4 | 0.1% |
| Austrian | 2 | 0.1% |
| Blackfeet | 18 | 0.6% |
| British | 8 | 0.3% |
| Burmese | 13 | 0.4% |
| Central American | 2 | 0.1% |
| Cherokee | 3 | 0.1% |
| Czech | 33 | 1.1% |
| Czechoslovakian | 3 | 0.1% |
| Danish | 7 | 0.2% |
| Dutch | 29 | 1.0% |
| Eastern European | 29 | 1.0% |
| English | 437 | 14.9% |
| European | 80 | 2.7% |
| Finnish | 1 | 0.0% |
| French | 128 | 4.4% |
| French Canadian | 3 | 0.1% |
| German | 749 | 25.6% |
| Guatemalan | 2 | 0.1% |
| Hungarian | 4 | 0.1% |
| Irish | 238 | 8.1% |
| Italian | 36 | 1.2% |
| Lithuanian | 1 | 0.0% |
| Mexican | 44 | 1.5% |
| Northern European | 9 | 0.3% |
| Norwegian | 64 | 2.2% |
| Polish | 46 | 1.6% |
| Potawatomi | 2 | 0.1% |
| Russian | 5 | 0.2% |
| Scandinavian | 16 | 0.5% |
| Scotch-Irish | 8 | 0.3% |
| Scottish | 82 | 2.8% |
| Sioux | 1 | 0.0% |
| Spanish | 4 | 0.1% |
| Swedish | 81 | 2.8% |
| Swiss | 11 | 0.4% |
| Thai | 4 | 0.1% |
| Ukrainian | 3 | 0.1% |
| Welsh | 1 | 0.0% | View All 41 Rows |
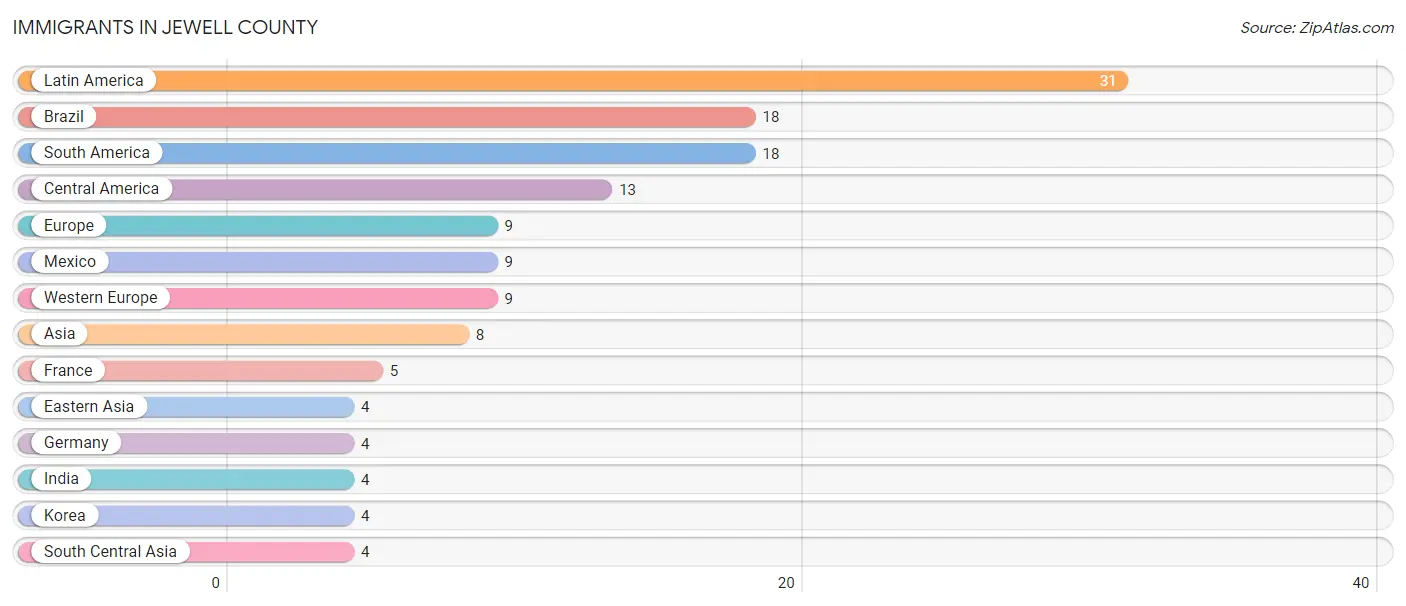
Immigrants in Jewell County
The most numerous immigrant groups reported in Jewell County came from Latin America (31 | 1.1%), Brazil (18 | 0.6%), South America (18 | 0.6%), Central America (13 | 0.4%), and Europe (9 | 0.3%), together accounting for 3.0% of all Jewell County residents.
| Immigration Origin | # Population | % Population |
| Asia | 8 | 0.3% |
| Brazil | 18 | 0.6% |
| Central America | 13 | 0.4% |
| Eastern Asia | 4 | 0.1% |
| Europe | 9 | 0.3% |
| France | 5 | 0.2% |
| Germany | 4 | 0.1% |
| India | 4 | 0.1% |
| Korea | 4 | 0.1% |
| Latin America | 31 | 1.1% |
| Mexico | 9 | 0.3% |
| South America | 18 | 0.6% |
| South Central Asia | 4 | 0.1% |
| Western Europe | 9 | 0.3% | View All 14 Rows |
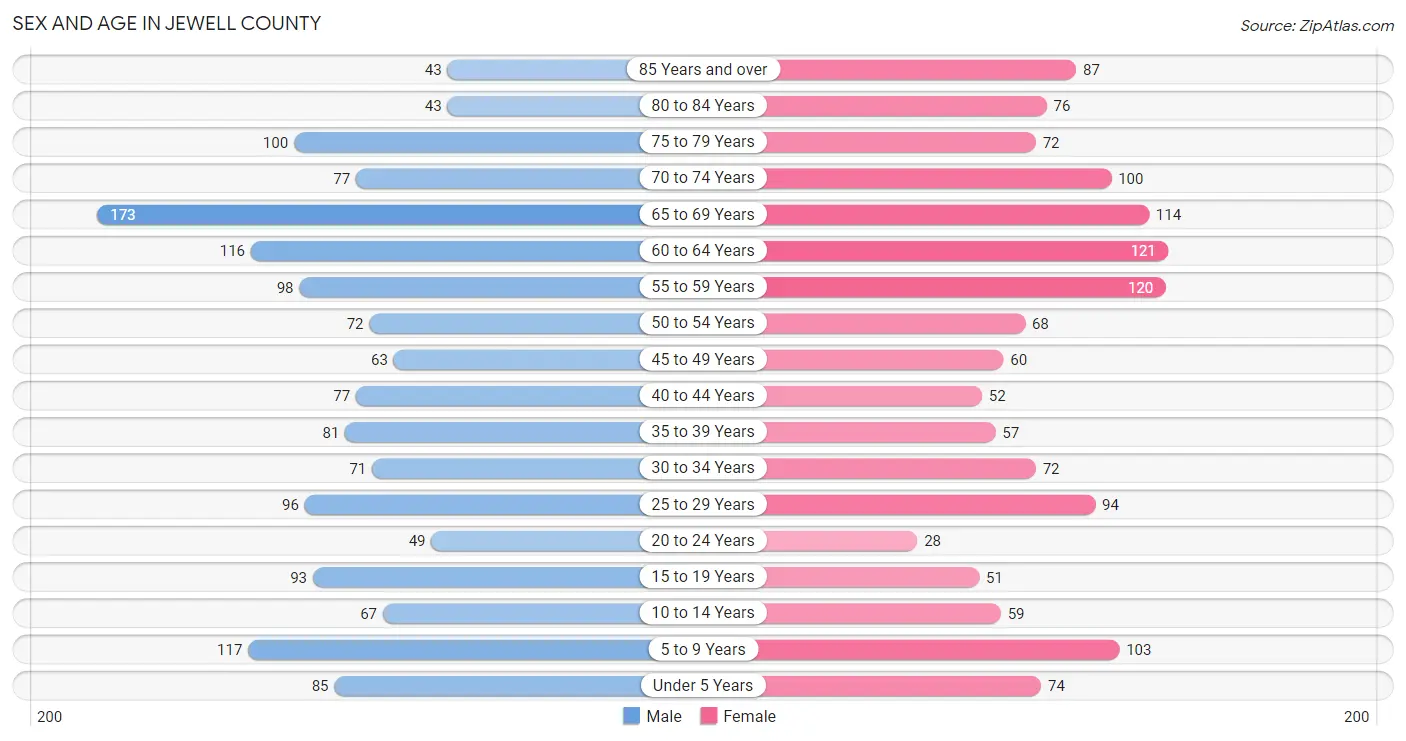
Sex and Age in Jewell County
Sex and Age in Jewell County
The most populous age groups in Jewell County are 65 to 69 Years (173 | 11.4%) for men and 60 to 64 Years (121 | 8.6%) for women.
| Age Bracket | Male | Female |
| Under 5 Years | 85 (5.6%) | 74 (5.3%) |
| 5 to 9 Years | 117 (7.7%) | 103 (7.3%) |
| 10 to 14 Years | 67 (4.4%) | 59 (4.2%) |
| 15 to 19 Years | 93 (6.1%) | 51 (3.6%) |
| 20 to 24 Years | 49 (3.2%) | 28 (2.0%) |
| 25 to 29 Years | 96 (6.3%) | 94 (6.7%) |
| 30 to 34 Years | 71 (4.7%) | 72 (5.1%) |
| 35 to 39 Years | 81 (5.3%) | 57 (4.1%) |
| 40 to 44 Years | 77 (5.1%) | 52 (3.7%) |
| 45 to 49 Years | 63 (4.1%) | 60 (4.3%) |
| 50 to 54 Years | 72 (4.7%) | 68 (4.8%) |
| 55 to 59 Years | 98 (6.4%) | 120 (8.5%) |
| 60 to 64 Years | 116 (7.6%) | 121 (8.6%) |
| 65 to 69 Years | 173 (11.4%) | 114 (8.1%) |
| 70 to 74 Years | 77 (5.1%) | 100 (7.1%) |
| 75 to 79 Years | 100 (6.6%) | 72 (5.1%) |
| 80 to 84 Years | 43 (2.8%) | 76 (5.4%) |
| 85 Years and over | 43 (2.8%) | 87 (6.2%) |
| Total | 1,521 (100.0%) | 1,408 (100.0%) |
Families and Households in Jewell County
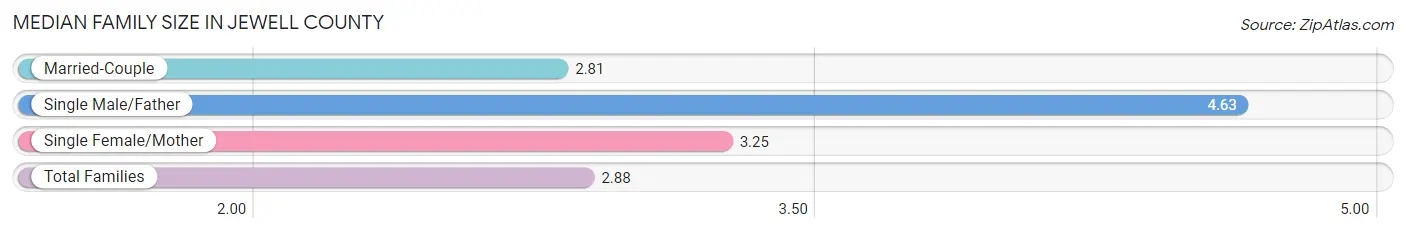
Median Family Size in Jewell County
The median family size in Jewell County is 2.88 persons per family, with single male/father families (16 | 1.9%) accounting for the largest median family size of 4.63 persons per family. On the other hand, married-couple families (727 | 88.8%) represent the smallest median family size with 2.81 persons per family.
| Family Type | # Families | Family Size |
| Married-Couple | 727 (88.8%) | 2.81 |
| Single Male/Father | 16 (1.9%) | 4.63 |
| Single Female/Mother | 76 (9.3%) | 3.25 |
| Total Families | 819 (100.0%) | 2.88 |
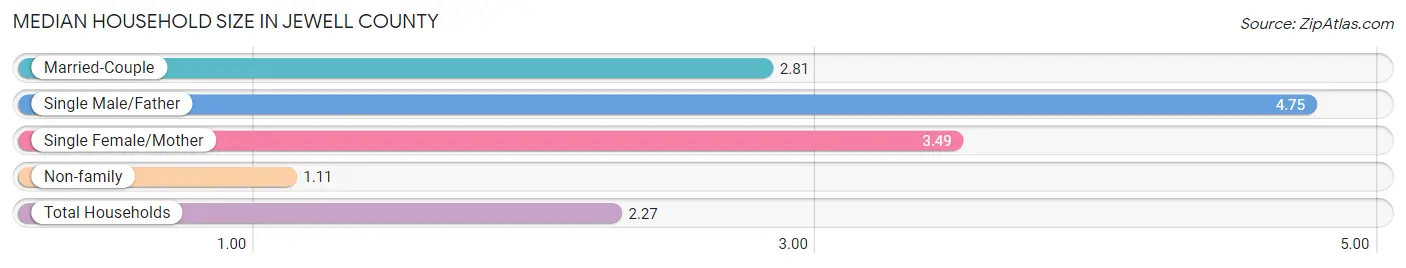
Median Household Size in Jewell County
The median household size in Jewell County is 2.27 persons per household, with single male/father households (16 | 1.3%) accounting for the largest median household size of 4.75 persons per household. non-family households (459 | 35.9%) represent the smallest median household size with 1.11 persons per household.
| Household Type | # Households | Household Size |
| Married-Couple | 727 (56.9%) | 2.81 |
| Single Male/Father | 16 (1.3%) | 4.75 |
| Single Female/Mother | 76 (5.9%) | 3.49 |
| Non-family | 459 (35.9%) | 1.11 |
| Total Households | 1,278 (100.0%) | 2.27 |
Household Size by Marriage Status in Jewell County
Out of a total of 1,278 households in Jewell County, 819 (64.1%) are family households, while 459 (35.9%) are nonfamily households. The most numerous type of family households are 2-person households, comprising 514, and the most common type of nonfamily households are 1-person households, comprising 410.

| Household Size | Family Households | Nonfamily Households |
| 1-Person Households | - | 410 (32.1%) |
| 2-Person Households | 514 (40.2%) | 49 (3.8%) |
| 3-Person Households | 92 (7.2%) | 0 (0.0%) |
| 4-Person Households | 133 (10.4%) | 0 (0.0%) |
| 5-Person Households | 49 (3.8%) | 0 (0.0%) |
| 6-Person Households | 27 (2.1%) | 0 (0.0%) |
| 7+ Person Households | 4 (0.3%) | 0 (0.0%) |
| Total | 819 (64.1%) | 459 (35.9%) |
Female Fertility in Jewell County
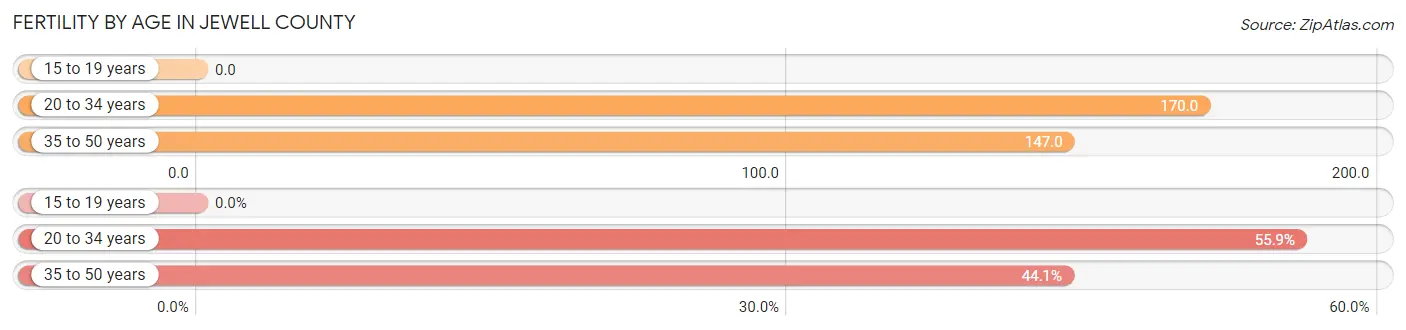
Fertility by Age in Jewell County
Average fertility rate in Jewell County is 140.0 births per 1,000 women. Women in the age bracket of 20 to 34 years have the highest fertility rate with 170.0 births per 1,000 women. Women in the age bracket of 20 to 34 years acount for 55.9% of all women with births.
| Age Bracket | Women with Births | Births / 1,000 Women |
| 15 to 19 years | 0 (0.0%) | 0.0 |
| 20 to 34 years | 33 (55.9%) | 170.0 |
| 35 to 50 years | 26 (44.1%) | 147.0 |
| Total | 59 (100.0%) | 140.0 |
Fertility by Age by Marriage Status in Jewell County
79.7% of women with births (59) in Jewell County are married. The highest percentage of unmarried women with births falls into 20 to 34 years age bracket with 36.4% of them unmarried at the time of birth, while the lowest percentage of unmarried women with births belong to 35 to 50 years age bracket with 0.0% of them unmarried.

| Age Bracket | Married | Unmarried |
| 15 to 19 years | 0 (0.0%) | 0 (0.0%) |
| 20 to 34 years | 21 (63.6%) | 12 (36.4%) |
| 35 to 50 years | 26 (100.0%) | 0 (0.0%) |
| Total | 47 (79.7%) | 12 (20.3%) |
Fertility by Education in Jewell County

| Educational Attainment | Women with Births | Births / 1,000 Women |
| Less than High School | 0 (0.0%) | 0.0 |
| High School Diploma | 2 (3.4%) | 18.0 |
| College or Associate's Degree | 20 (33.9%) | 129.0 |
| Bachelor's Degree | 17 (28.8%) | 333.0 |
| Graduate Degree | 20 (33.9%) | 476.0 |
| Total | 59 (100.0%) | 140.0 |
Fertility by Education by Marriage Status in Jewell County
20.3% of women with births in Jewell County are unmarried. Women with the educational attainment of bachelor's degree are most likely to be married with 100.0% of them married at childbirth, while women with the educational attainment of high school diploma are least likely to be married with 100.0% of them unmarried at childbirth.

| Educational Attainment | Married | Unmarried |
| Less than High School | 0 (0.0%) | 0 (0.0%) |
| High School Diploma | 0 (0.0%) | 2 (100.0%) |
| College or Associate's Degree | 10 (50.0%) | 10 (50.0%) |
| Bachelor's Degree | 17 (100.0%) | 0 (0.0%) |
| Graduate Degree | 20 (100.0%) | 0 (0.0%) |
| Total | 47 (79.7%) | 12 (20.3%) |
Income in Jewell County
Income Overview in Jewell County
Per Capita Income in Jewell County is $32,759, while median incomes of families and households are $66,161 and $47,109 respectively.
| Characteristic | Number | Measure |
| Per Capita Income | 2,929 | $32,759 |
| Median Family Income | 819 | $66,161 |
| Mean Family Income | 819 | $85,494 |
| Median Household Income | 1,278 | $47,109 |
| Mean Household Income | 1,278 | $71,540 |
| Income Deficit | 819 | $0 |
| Wage / Income Gap (%) | 2,929 | 29.74% |
| Wage / Income Gap ($) | 2,929 | 70.26¢ per $1 |
| Gini / Inequality Index | 2,929 | 0.50 |
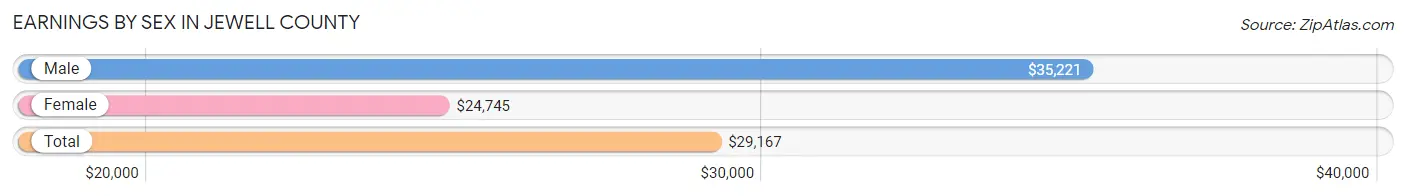
Earnings by Sex in Jewell County
Average Earnings in Jewell County are $29,167, $35,221 for men and $24,745 for women, a difference of 29.7%.
| Sex | Number | Average Earnings |
| Male | 826 (56.3%) | $35,221 |
| Female | 642 (43.7%) | $24,745 |
| Total | 1,468 (100.0%) | $29,167 |
Earnings by Sex by Income Bracket in Jewell County
The most common earnings brackets in Jewell County are $55,000 to $64,999 for men (94 | 11.4%) and $25,000 to $29,999 for women (86 | 13.4%).
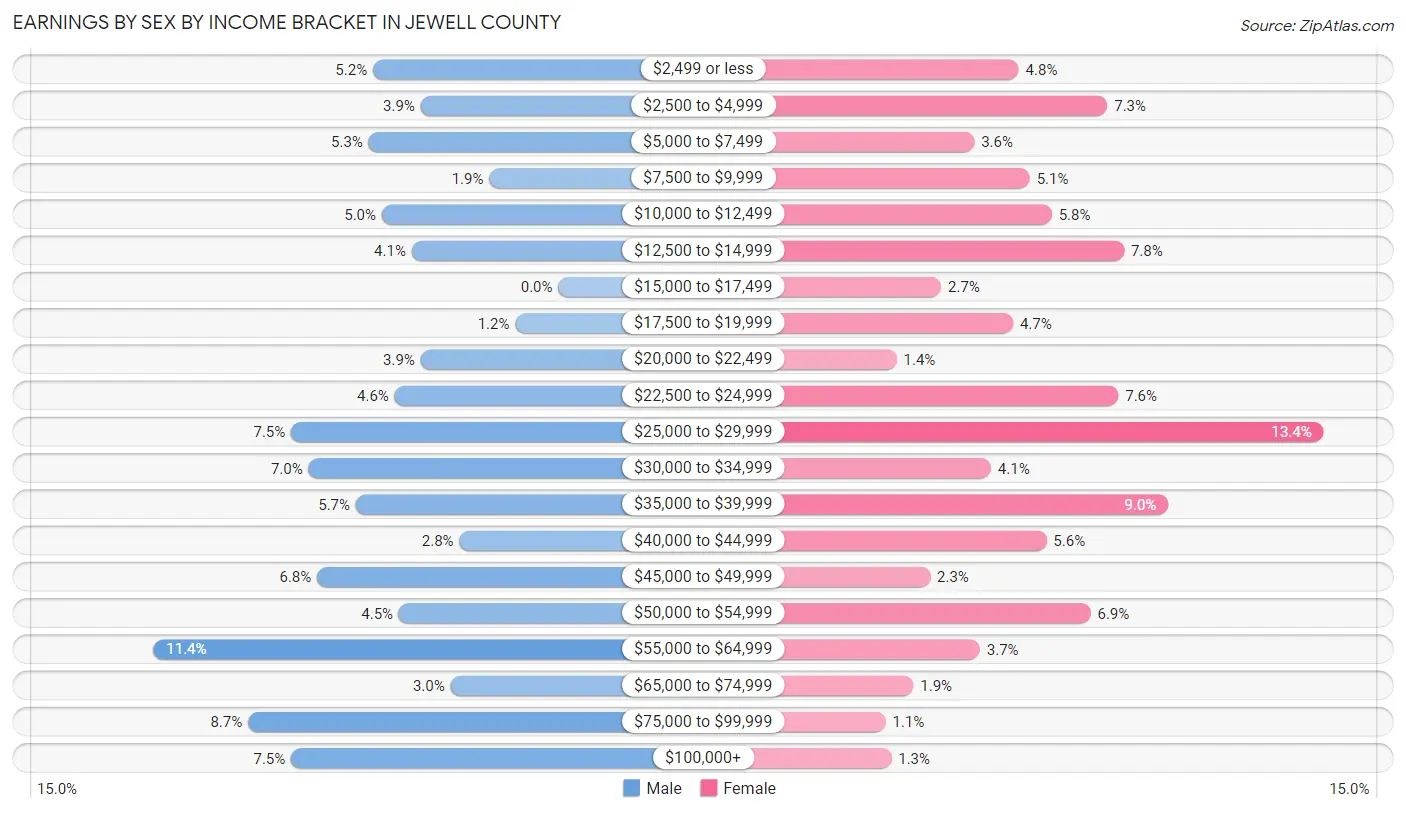
| Income | Male | Female |
| $2,499 or less | 43 (5.2%) | 31 (4.8%) |
| $2,500 to $4,999 | 32 (3.9%) | 47 (7.3%) |
| $5,000 to $7,499 | 44 (5.3%) | 23 (3.6%) |
| $7,500 to $9,999 | 16 (1.9%) | 33 (5.1%) |
| $10,000 to $12,499 | 41 (5.0%) | 37 (5.8%) |
| $12,500 to $14,999 | 34 (4.1%) | 50 (7.8%) |
| $15,000 to $17,499 | 0 (0.0%) | 17 (2.6%) |
| $17,500 to $19,999 | 10 (1.2%) | 30 (4.7%) |
| $20,000 to $22,499 | 32 (3.9%) | 9 (1.4%) |
| $22,500 to $24,999 | 38 (4.6%) | 49 (7.6%) |
| $25,000 to $29,999 | 62 (7.5%) | 86 (13.4%) |
| $30,000 to $34,999 | 58 (7.0%) | 26 (4.1%) |
| $35,000 to $39,999 | 47 (5.7%) | 58 (9.0%) |
| $40,000 to $44,999 | 23 (2.8%) | 36 (5.6%) |
| $45,000 to $49,999 | 56 (6.8%) | 15 (2.3%) |
| $50,000 to $54,999 | 37 (4.5%) | 44 (6.9%) |
| $55,000 to $64,999 | 94 (11.4%) | 24 (3.7%) |
| $65,000 to $74,999 | 25 (3.0%) | 12 (1.9%) |
| $75,000 to $99,999 | 72 (8.7%) | 7 (1.1%) |
| $100,000+ | 62 (7.5%) | 8 (1.3%) |
| Total | 826 (100.0%) | 642 (100.0%) |
Earnings by Sex by Educational Attainment in Jewell County
Average earnings in Jewell County are $37,316 for men and $26,406 for women, a difference of 29.2%. Men with an educational attainment of bachelor's degree enjoy the highest average annual earnings of $45,417, while those with less than high school education earn the least with $25,132. Women with an educational attainment of graduate degree earn the most with the average annual earnings of $45,000, while those with high school diploma education have the smallest earnings of $19,107.
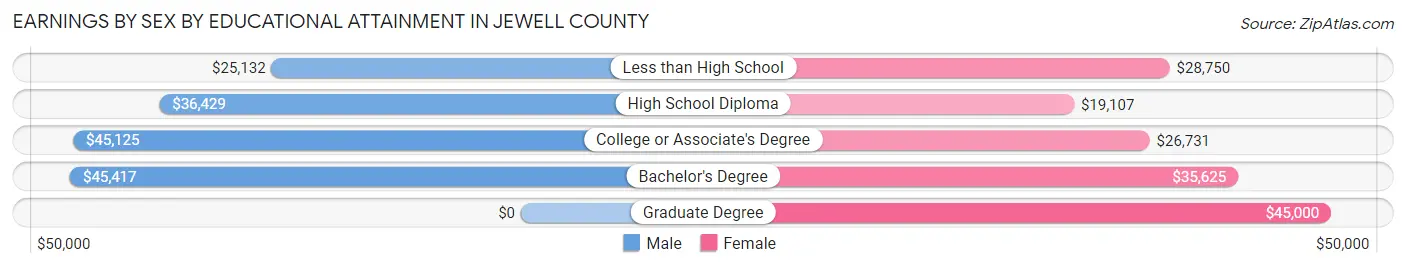
| Educational Attainment | Male Income | Female Income |
| Less than High School | $25,132 | $28,750 |
| High School Diploma | $36,429 | $19,107 |
| College or Associate's Degree | $45,125 | $26,731 |
| Bachelor's Degree | $45,417 | $35,625 |
| Graduate Degree | - | - |
| Total | $37,316 | $26,406 |
Family Income in Jewell County
Family Income Brackets in Jewell County
According to the Jewell County family income data, there are 207 families falling into the $75,000 to $99,999 income range, which is the most common income bracket and makes up 25.3% of all families. Conversely, the less than $10,000 income bracket is the least frequent group with only 17 families (2.1%) belonging to this category.

| Income Bracket | # Families | % Families |
| Less than $10,000 | 17 | 2.1% |
| $10,000 to $14,999 | 31 | 3.8% |
| $15,000 to $24,999 | 43 | 5.3% |
| $25,000 to $34,999 | 70 | 8.5% |
| $35,000 to $49,999 | 159 | 19.4% |
| $50,000 to $74,999 | 138 | 16.8% |
| $75,000 to $99,999 | 207 | 25.3% |
| $100,000 to $149,999 | 79 | 9.6% |
| $150,000 to $199,999 | 43 | 5.3% |
| $200,000+ | 32 | 3.9% |
Family Income by Famaliy Size in Jewell County
5-person families (41 | 5.0%) account for the highest median family income in Jewell County with $79,792 per family, while 2-person families (529 | 64.6%) have the highest median income of $32,902 per family member.
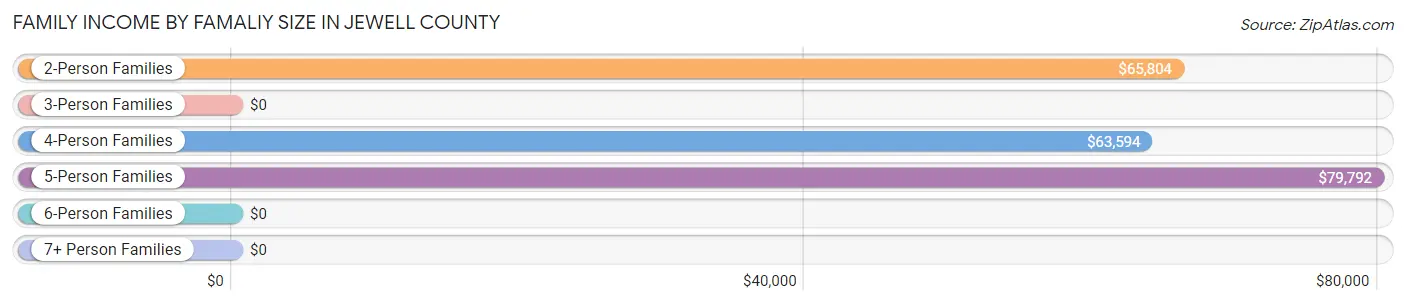
| Income Bracket | # Families | Median Income |
| 2-Person Families | 529 (64.6%) | $65,804 |
| 3-Person Families | 77 (9.4%) | $0 |
| 4-Person Families | 141 (17.2%) | $63,594 |
| 5-Person Families | 41 (5.0%) | $79,792 |
| 6-Person Families | 27 (3.3%) | $0 |
| 7+ Person Families | 4 (0.5%) | $0 |
| Total | 819 (100.0%) | $66,161 |
Family Income by Number of Earners in Jewell County
The median family income in Jewell County is $66,161, with families comprising 3+ earners (48) having the highest median family income of $110,000, while families with no earners (158) have the lowest median family income of $39,643, accounting for 5.9% and 19.3% of families, respectively.
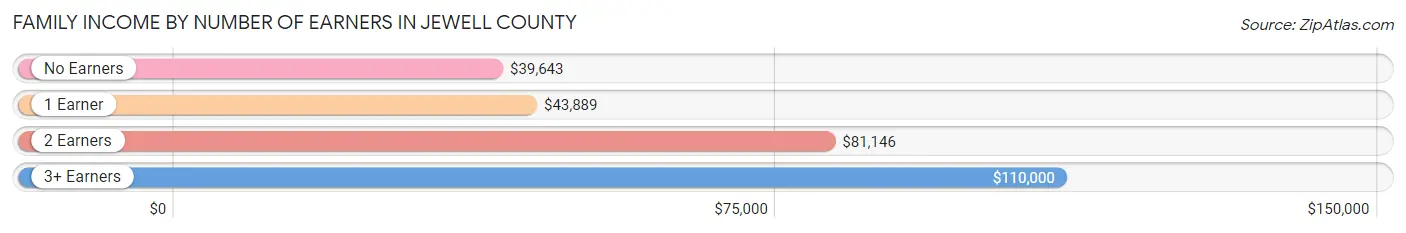
| Number of Earners | # Families | Median Income |
| No Earners | 158 (19.3%) | $39,643 |
| 1 Earner | 208 (25.4%) | $43,889 |
| 2 Earners | 405 (49.4%) | $81,146 |
| 3+ Earners | 48 (5.9%) | $110,000 |
| Total | 819 (100.0%) | $66,161 |
Household Income in Jewell County
Household Income Brackets in Jewell County
With 219 households falling in the category, the $35,000 to $49,999 income range is the most frequent in Jewell County, accounting for 17.1% of all households. In contrast, only 40 households (3.1%) fall into the $200,000+ income bracket, making it the least populous group.
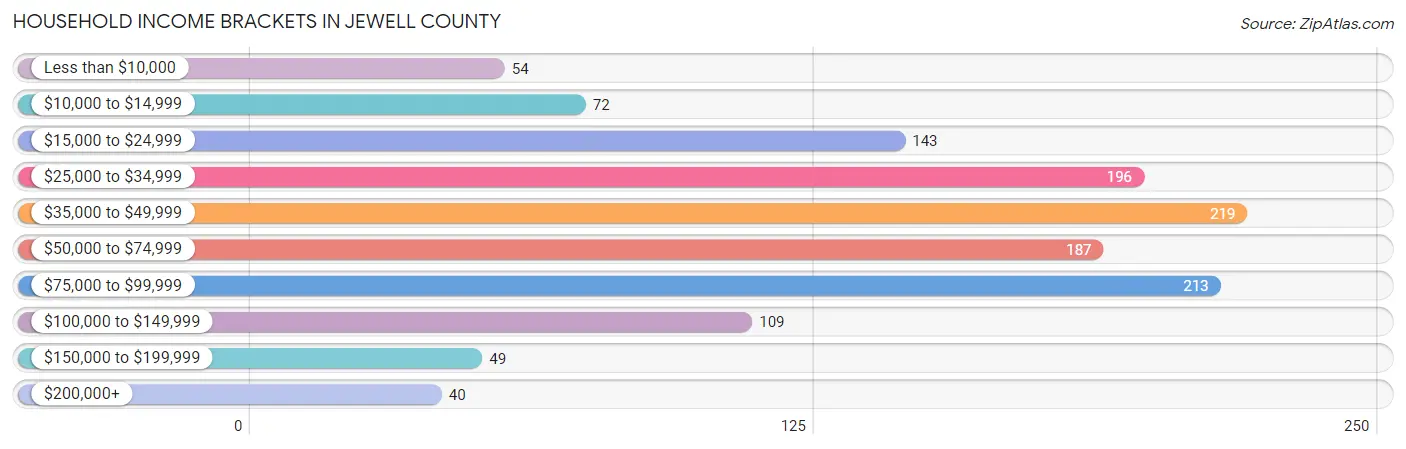
| Income Bracket | # Households | % Households |
| Less than $10,000 | 54 | 4.2% |
| $10,000 to $14,999 | 72 | 5.6% |
| $15,000 to $24,999 | 143 | 11.2% |
| $25,000 to $34,999 | 196 | 15.3% |
| $35,000 to $49,999 | 219 | 17.1% |
| $50,000 to $74,999 | 187 | 14.6% |
| $75,000 to $99,999 | 213 | 16.7% |
| $100,000 to $149,999 | 109 | 8.5% |
| $150,000 to $199,999 | 49 | 3.8% |
| $200,000+ | 40 | 3.1% |
Household Income by Householder Age in Jewell County
The median household income in Jewell County is $47,109, with the highest median household income of $67,083 found in the 45 to 64 years age bracket for the primary householder. A total of 384 households (30.0%) fall into this category. Meanwhile, the 15 to 24 years age bracket for the primary householder has the lowest median household income of $25,694, with 33 households (2.6%) in this group.
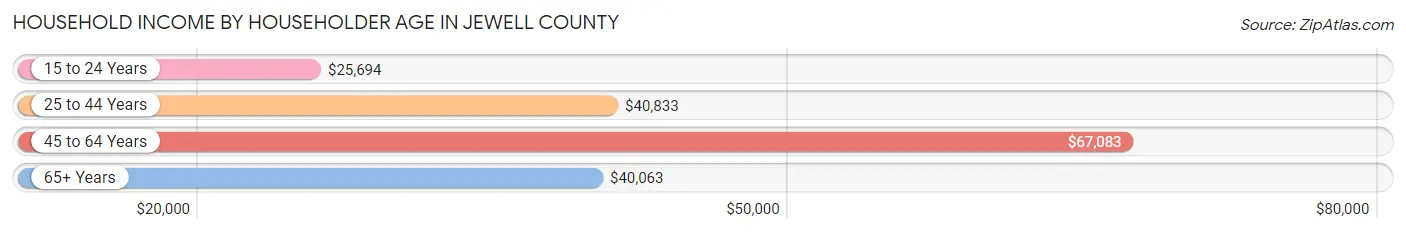
| Income Bracket | # Households | Median Income |
| 15 to 24 Years | 33 (2.6%) | $25,694 |
| 25 to 44 Years | 268 (21.0%) | $40,833 |
| 45 to 64 Years | 384 (30.0%) | $67,083 |
| 65+ Years | 593 (46.4%) | $40,063 |
| Total | 1,278 (100.0%) | $47,109 |
Poverty in Jewell County
Income Below Poverty by Sex and Age in Jewell County
With 16.3% poverty level for males and 21.3% for females among the residents of Jewell County, 18 to 24 year old males and 5 year old females are the most vulnerable to poverty, with 43 males (48.3%) and 36 females (69.2%) in their respective age groups living below the poverty level.

| Age Bracket | Male | Female |
| Under 5 Years | 22 (25.9%) | 15 (20.3%) |
| 5 Years | 0 (0.0%) | 36 (69.2%) |
| 6 to 11 Years | 45 (39.8%) | 28 (50.0%) |
| 12 to 14 Years | 24 (42.1%) | 7 (13.0%) |
| 15 Years | 0 (0.0%) | 5 (22.7%) |
| 16 and 17 Years | 0 (0.0%) | 3 (15.8%) |
| 18 to 24 Years | 43 (48.3%) | 14 (36.8%) |
| 25 to 34 Years | 0 (0.0%) | 53 (31.9%) |
| 35 to 44 Years | 44 (29.3%) | 38 (34.9%) |
| 45 to 54 Years | 19 (14.1%) | 12 (9.4%) |
| 55 to 64 Years | 34 (15.9%) | 28 (11.7%) |
| 65 to 74 Years | 8 (3.2%) | 17 (7.9%) |
| 75 Years and over | 6 (3.4%) | 42 (18.8%) |
| Total | 245 (16.3%) | 298 (21.3%) |
Income Above Poverty by Sex and Age in Jewell County
According to the poverty statistics in Jewell County, males aged 5 years and females aged 65 to 74 years are the age groups that are most secure financially, with 100.0% of males and 92.1% of females in these age groups living above the poverty line.
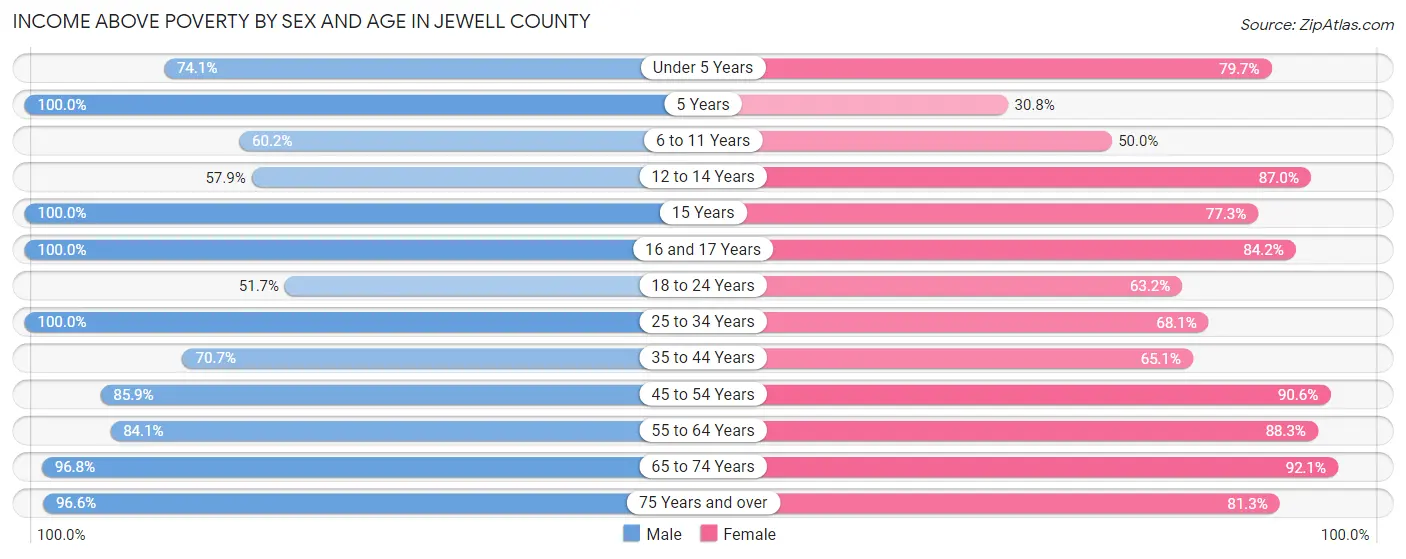
| Age Bracket | Male | Female |
| Under 5 Years | 63 (74.1%) | 59 (79.7%) |
| 5 Years | 14 (100.0%) | 16 (30.8%) |
| 6 to 11 Years | 68 (60.2%) | 28 (50.0%) |
| 12 to 14 Years | 33 (57.9%) | 47 (87.0%) |
| 15 Years | 25 (100.0%) | 17 (77.3%) |
| 16 and 17 Years | 27 (100.0%) | 16 (84.2%) |
| 18 to 24 Years | 46 (51.7%) | 24 (63.2%) |
| 25 to 34 Years | 166 (100.0%) | 113 (68.1%) |
| 35 to 44 Years | 106 (70.7%) | 71 (65.1%) |
| 45 to 54 Years | 116 (85.9%) | 116 (90.6%) |
| 55 to 64 Years | 180 (84.1%) | 212 (88.3%) |
| 65 to 74 Years | 242 (96.8%) | 197 (92.1%) |
| 75 Years and over | 170 (96.6%) | 182 (81.2%) |
| Total | 1,256 (83.7%) | 1,098 (78.6%) |
Income Below Poverty Among Married-Couple Families in Jewell County
The poverty statistics for married-couple families in Jewell County show that 9.6% or 70 of the total 727 families live below the poverty line. Families with 3 or 4 children have the highest poverty rate of 24.1%, comprising of 14 families. On the other hand, families with 5 or more children have the lowest poverty rate of 0.0%, which includes 0 families.
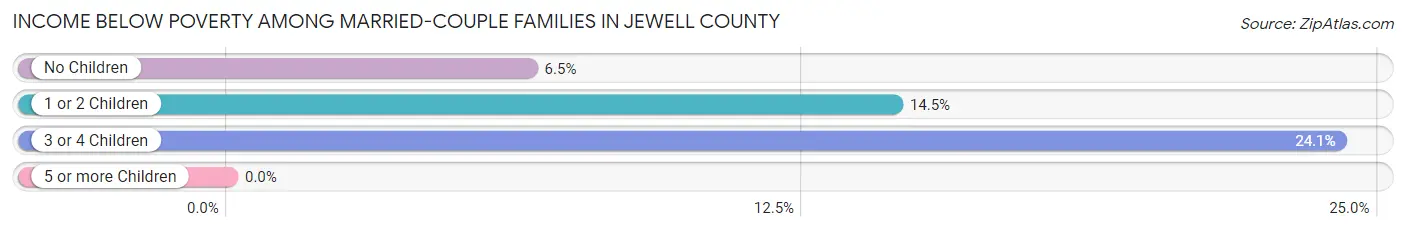
| Children | Above Poverty | Below Poverty |
| No Children | 473 (93.5%) | 33 (6.5%) |
| 1 or 2 Children | 136 (85.5%) | 23 (14.5%) |
| 3 or 4 Children | 44 (75.9%) | 14 (24.1%) |
| 5 or more Children | 4 (100.0%) | 0 (0.0%) |
| Total | 657 (90.4%) | 70 (9.6%) |
Income Below Poverty Among Single-Parent Households in Jewell County
According to the poverty data in Jewell County, 6.2% or 1 single-father households and 35.5% or 27 single-mother households are living below the poverty line. Among single-father households, those with 1 or 2 children have the highest poverty rate, with 1 households (20.0%) experiencing poverty. Likewise, among single-mother households, those with 3 or 4 children have the highest poverty rate, with 17 households (100.0%) falling below the poverty line.
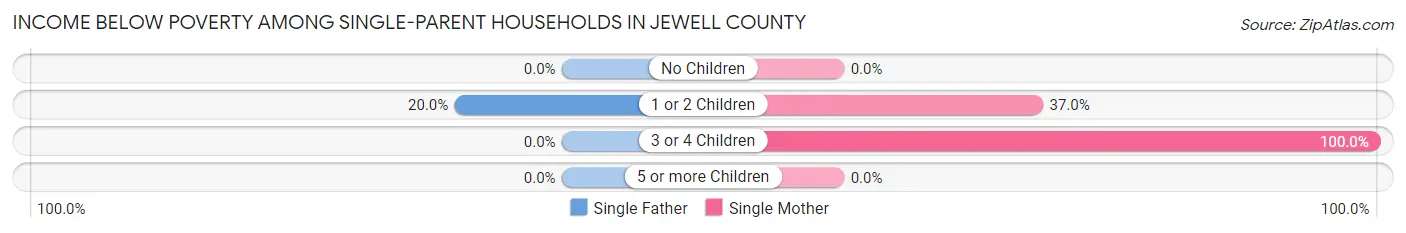
| Children | Single Father | Single Mother |
| No Children | 0 (0.0%) | 0 (0.0%) |
| 1 or 2 Children | 1 (20.0%) | 10 (37.0%) |
| 3 or 4 Children | 0 (0.0%) | 17 (100.0%) |
| 5 or more Children | 0 (0.0%) | 0 (0.0%) |
| Total | 1 (6.2%) | 27 (35.5%) |
Income Below Poverty Among Married-Couple vs Single-Parent Households in Jewell County
The poverty data for Jewell County shows that 70 of the married-couple family households (9.6%) and 28 of the single-parent households (30.4%) are living below the poverty level. Within the married-couple family households, those with 3 or 4 children have the highest poverty rate, with 14 households (24.1%) falling below the poverty line. Among the single-parent households, those with 3 or 4 children have the highest poverty rate, with 17 household (85.0%) living below poverty.
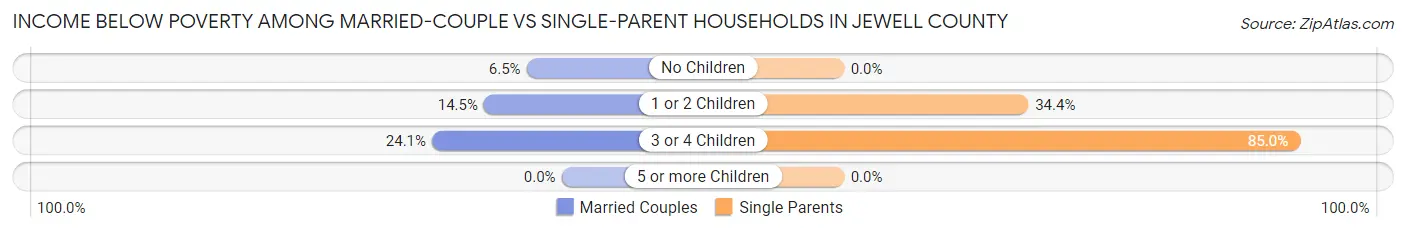
| Children | Married-Couple Families | Single-Parent Households |
| No Children | 33 (6.5%) | 0 (0.0%) |
| 1 or 2 Children | 23 (14.5%) | 11 (34.4%) |
| 3 or 4 Children | 14 (24.1%) | 17 (85.0%) |
| 5 or more Children | 0 (0.0%) | 0 (0.0%) |
| Total | 70 (9.6%) | 28 (30.4%) |
Employment Characteristics in Jewell County
Employment by Class of Employer in Jewell County
Among the 1,272 employed individuals in Jewell County, private company employees (518 | 40.7%), local government employees (239 | 18.8%), and self-employed (not incorporated) (203 | 16.0%) make up the most common classes of employment.
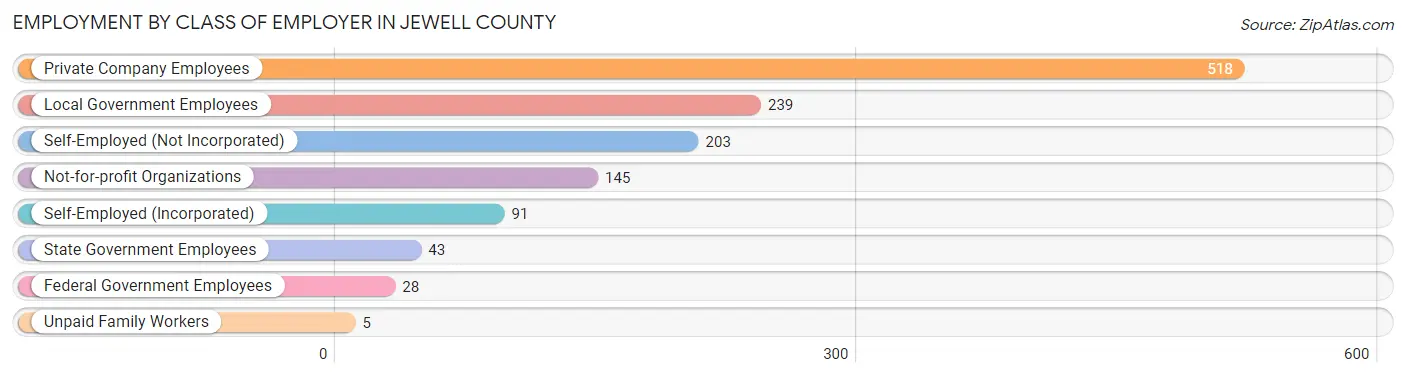
| Employer Class | # Employees | % Employees |
| Private Company Employees | 518 | 40.7% |
| Self-Employed (Incorporated) | 91 | 7.1% |
| Self-Employed (Not Incorporated) | 203 | 16.0% |
| Not-for-profit Organizations | 145 | 11.4% |
| Local Government Employees | 239 | 18.8% |
| State Government Employees | 43 | 3.4% |
| Federal Government Employees | 28 | 2.2% |
| Unpaid Family Workers | 5 | 0.4% |
| Total | 1,272 | 100.0% |
Employment Status by Age in Jewell County
According to the labor force statistics for Jewell County, out of the total population over 16 years of age (2,377), 55.9% or 1,329 individuals are in the labor force, with 1.5% or 20 of them unemployed. The age group with the highest labor force participation rate is 20 to 24 years, with 92.2% or 71 individuals in the labor force. Within the labor force, the 16 to 19 years age range has the highest percentage of unemployed individuals, with 29.5% or 13 of them being unemployed.
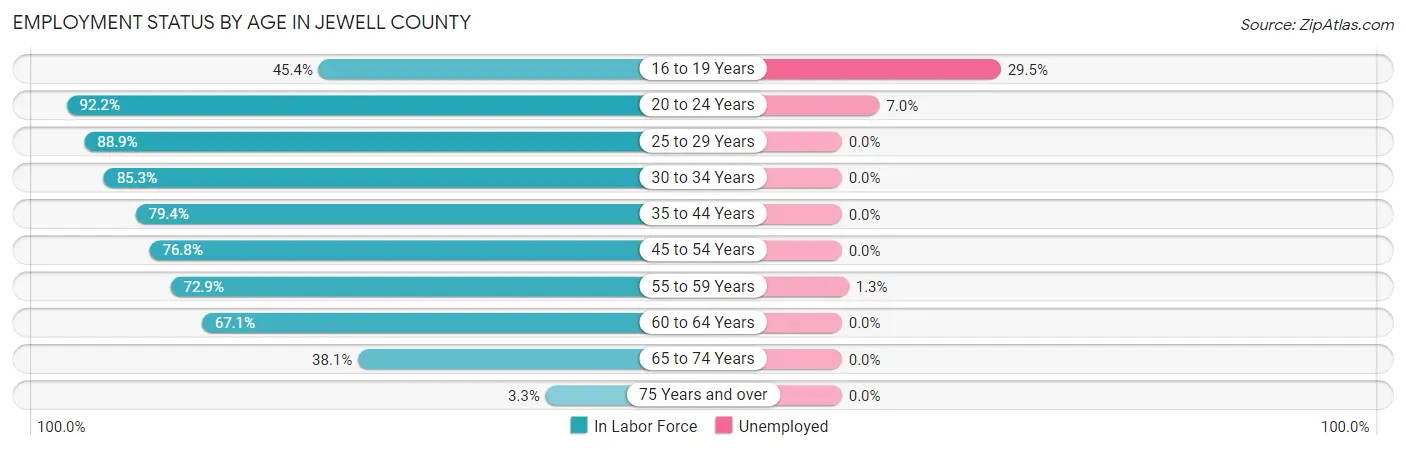
| Age Bracket | In Labor Force | Unemployed |
| 16 to 19 Years | 44 (45.4%) | 13 (29.5%) |
| 20 to 24 Years | 71 (92.2%) | 5 (7.0%) |
| 25 to 29 Years | 169 (88.9%) | 0 (0.0%) |
| 30 to 34 Years | 122 (85.3%) | 0 (0.0%) |
| 35 to 44 Years | 212 (79.4%) | 0 (0.0%) |
| 45 to 54 Years | 202 (76.8%) | 0 (0.0%) |
| 55 to 59 Years | 159 (72.9%) | 2 (1.3%) |
| 60 to 64 Years | 159 (67.1%) | 0 (0.0%) |
| 65 to 74 Years | 177 (38.1%) | 0 (0.0%) |
| 75 Years and over | 14 (3.3%) | 0 (0.0%) |
| Total | 1,329 (55.9%) | 20 (1.5%) |
Employment Status by Educational Attainment in Jewell County
According to labor force statistics for Jewell County, 77.6% of individuals (1,023) out of the total population between 25 and 64 years of age (1,318) are in the labor force, with 0.2% or 2 of them being unemployed. The group with the highest labor force participation rate are those with the educational attainment of bachelor's degree or higher, with 91.3% or 274 individuals in the labor force. Within the labor force, individuals with bachelor's degree or higher education have the highest percentage of unemployment, with 0.7% or 2 of them being unemployed.

| Educational Attainment | In Labor Force | Unemployed |
| Less than High School | 72 (66.1%) | 0 (0.0%) |
| High School Diploma | 220 (62.3%) | 0 (0.0%) |
| College / Associate Degree | 457 (82.2%) | 0 (0.0%) |
| Bachelor's Degree or higher | 274 (91.3%) | 2 (0.7%) |
| Total | 1,023 (77.6%) | 3 (0.2%) |
Employment Occupations by Sex in Jewell County
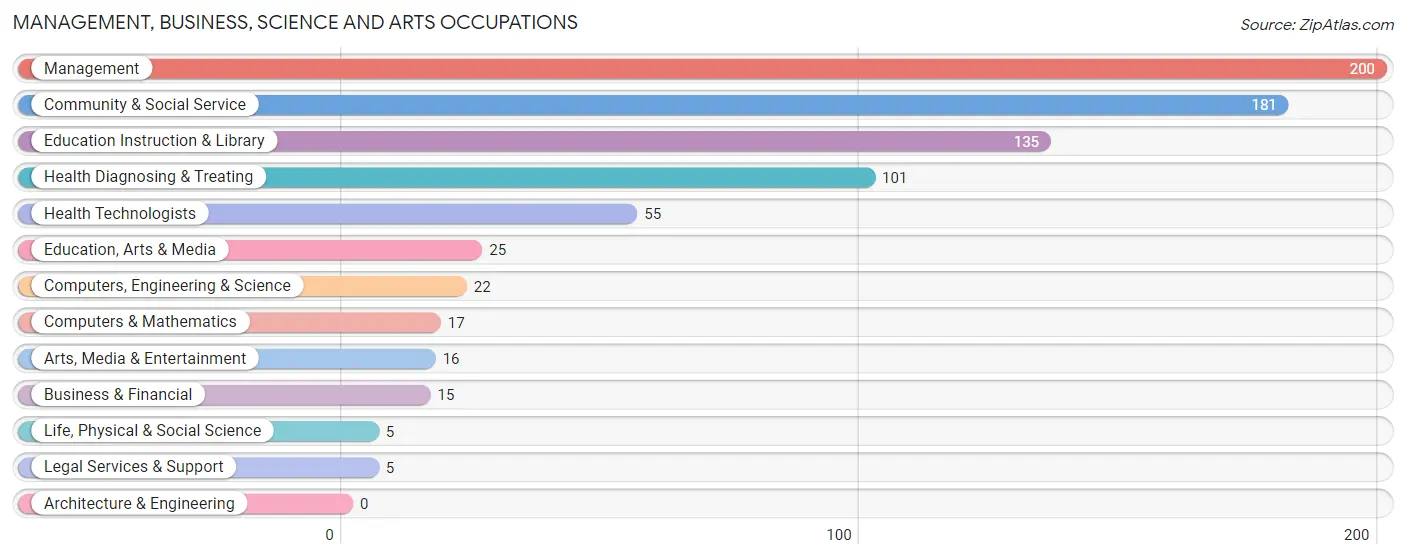
Management, Business, Science and Arts Occupations
The most common Management, Business, Science and Arts occupations in Jewell County are Management (200 | 15.3%), Community & Social Service (181 | 13.8%), Education Instruction & Library (135 | 10.3%), Health Diagnosing & Treating (101 | 7.7%), and Health Technologists (55 | 4.2%).
Management, Business, Science and Arts Occupations by Sex
Within the Management, Business, Science and Arts occupations in Jewell County, the most male-oriented occupations are Computers & Mathematics (94.1%), Arts, Media & Entertainment (93.8%), and Business & Financial (86.7%), while the most female-oriented occupations are Life, Physical & Social Science (100.0%), Legal Services & Support (100.0%), and Health Technologists (90.9%).

| Occupation | Male | Female |
| Management | 156 (78.0%) | 44 (22.0%) |
| Business & Financial | 13 (86.7%) | 2 (13.3%) |
| Computers, Engineering & Science | 16 (72.7%) | 6 (27.3%) |
| Computers & Mathematics | 16 (94.1%) | 1 (5.9%) |
| Architecture & Engineering | 0 (0.0%) | 0 (0.0%) |
| Life, Physical & Social Science | 0 (0.0%) | 5 (100.0%) |
| Community & Social Service | 76 (42.0%) | 105 (58.0%) |
| Education, Arts & Media | 18 (72.0%) | 7 (28.0%) |
| Legal Services & Support | 0 (0.0%) | 5 (100.0%) |
| Education Instruction & Library | 43 (31.9%) | 92 (68.1%) |
| Arts, Media & Entertainment | 15 (93.8%) | 1 (6.2%) |
| Health Diagnosing & Treating | 21 (20.8%) | 80 (79.2%) |
| Health Technologists | 5 (9.1%) | 50 (90.9%) |
| Total (Category) | 282 (54.3%) | 237 (45.7%) |
| Total (Overall) | 728 (55.6%) | 581 (44.4%) |
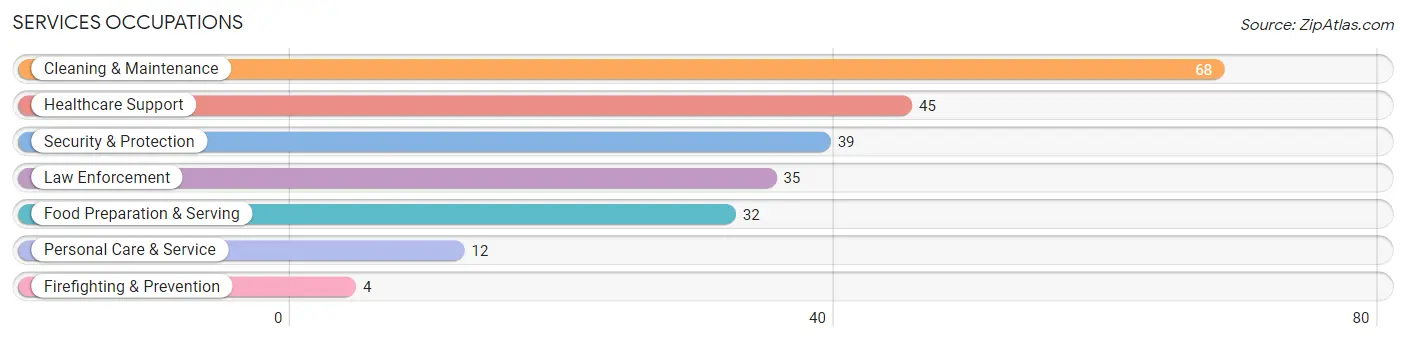
Services Occupations
The most common Services occupations in Jewell County are Cleaning & Maintenance (68 | 5.2%), Healthcare Support (45 | 3.4%), Security & Protection (39 | 3.0%), Law Enforcement (35 | 2.7%), and Food Preparation & Serving (32 | 2.4%).
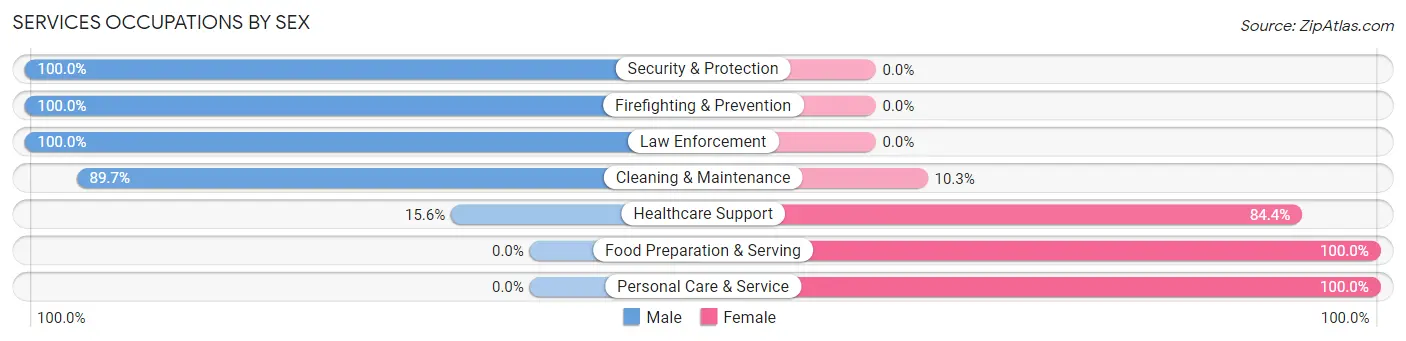
Services Occupations by Sex
Within the Services occupations in Jewell County, the most male-oriented occupations are Security & Protection (100.0%), Firefighting & Prevention (100.0%), and Law Enforcement (100.0%), while the most female-oriented occupations are Food Preparation & Serving (100.0%), Personal Care & Service (100.0%), and Healthcare Support (84.4%).
| Occupation | Male | Female |
| Healthcare Support | 7 (15.6%) | 38 (84.4%) |
| Security & Protection | 39 (100.0%) | 0 (0.0%) |
| Firefighting & Prevention | 4 (100.0%) | 0 (0.0%) |
| Law Enforcement | 35 (100.0%) | 0 (0.0%) |
| Food Preparation & Serving | 0 (0.0%) | 32 (100.0%) |
| Cleaning & Maintenance | 61 (89.7%) | 7 (10.3%) |
| Personal Care & Service | 0 (0.0%) | 12 (100.0%) |
| Total (Category) | 107 (54.6%) | 89 (45.4%) |
| Total (Overall) | 728 (55.6%) | 581 (44.4%) |
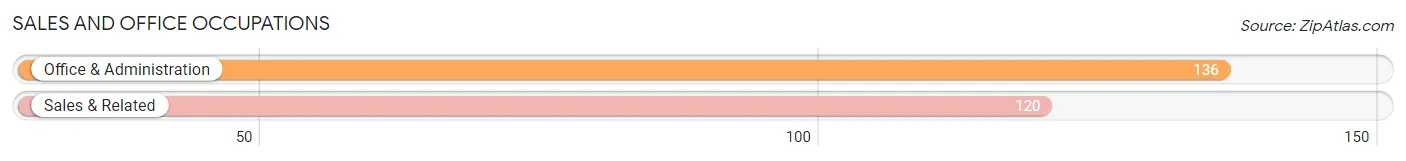
Sales and Office Occupations
The most common Sales and Office occupations in Jewell County are Office & Administration (136 | 10.4%), and Sales & Related (120 | 9.2%).
Sales and Office Occupations by Sex
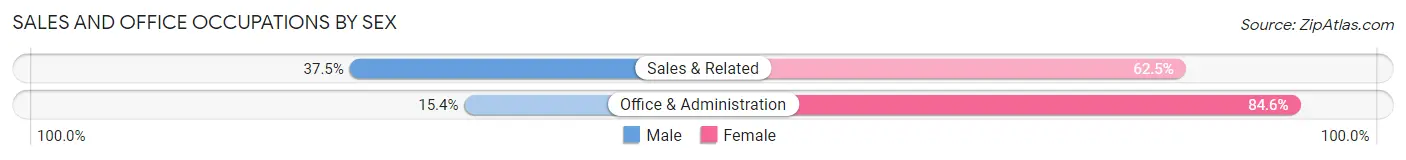
| Occupation | Male | Female |
| Sales & Related | 45 (37.5%) | 75 (62.5%) |
| Office & Administration | 21 (15.4%) | 115 (84.6%) |
| Total (Category) | 66 (25.8%) | 190 (74.2%) |
| Total (Overall) | 728 (55.6%) | 581 (44.4%) |
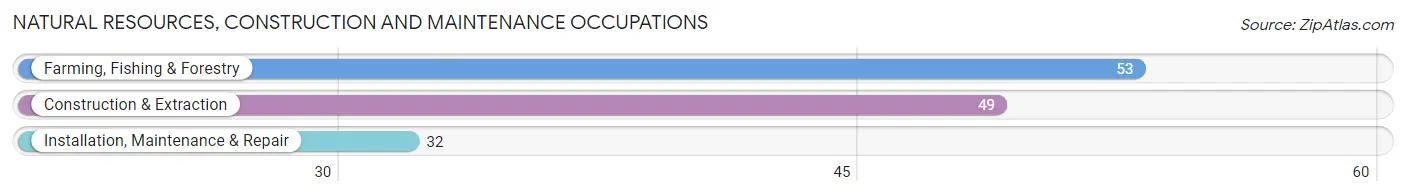
Natural Resources, Construction and Maintenance Occupations
The most common Natural Resources, Construction and Maintenance occupations in Jewell County are Farming, Fishing & Forestry (53 | 4.1%), Construction & Extraction (49 | 3.7%), and Installation, Maintenance & Repair (32 | 2.4%).
Natural Resources, Construction and Maintenance Occupations by Sex
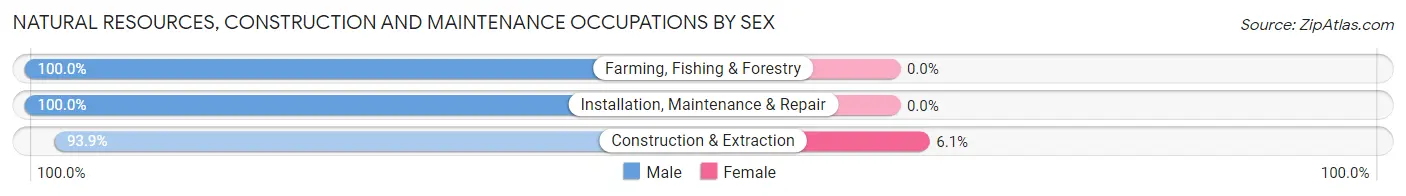
| Occupation | Male | Female |
| Farming, Fishing & Forestry | 53 (100.0%) | 0 (0.0%) |
| Construction & Extraction | 46 (93.9%) | 3 (6.1%) |
| Installation, Maintenance & Repair | 32 (100.0%) | 0 (0.0%) |
| Total (Category) | 131 (97.8%) | 3 (2.2%) |
| Total (Overall) | 728 (55.6%) | 581 (44.4%) |
Production, Transportation and Moving Occupations
The most common Production, Transportation and Moving occupations in Jewell County are Production (88 | 6.7%), Transportation (87 | 6.7%), and Material Moving (29 | 2.2%).
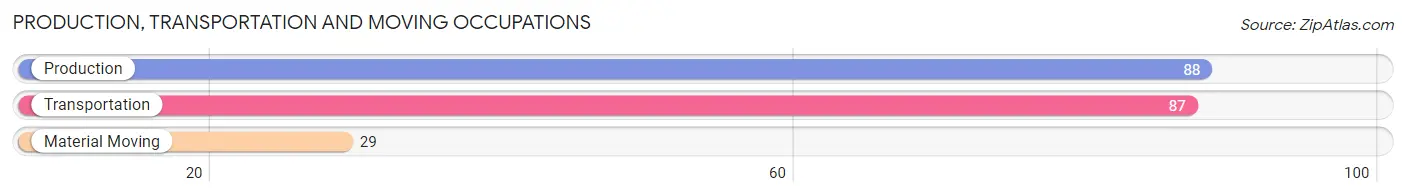
Production, Transportation and Moving Occupations by Sex
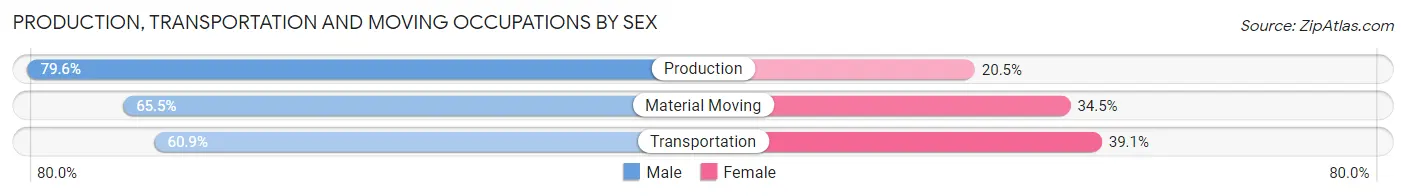
| Occupation | Male | Female |
| Production | 70 (79.5%) | 18 (20.4%) |
| Transportation | 53 (60.9%) | 34 (39.1%) |
| Material Moving | 19 (65.5%) | 10 (34.5%) |
| Total (Category) | 142 (69.6%) | 62 (30.4%) |
| Total (Overall) | 728 (55.6%) | 581 (44.4%) |
Employment Industries by Sex in Jewell County
Employment Industries in Jewell County
The major employment industries in Jewell County include Agriculture, Fishing & Hunting (213 | 16.3%), Health Care & Social Assistance (202 | 15.4%), Educational Services (182 | 13.9%), Transportation & Warehousing (108 | 8.3%), and Retail Trade (98 | 7.5%).

Employment Industries by Sex in Jewell County
The Jewell County industries that see more men than women are Mining, Quarrying, & Extraction (100.0%), Construction (100.0%), and Utilities (100.0%), whereas the industries that tend to have a higher number of women are Information (100.0%), Health Care & Social Assistance (80.2%), and Educational Services (74.2%).
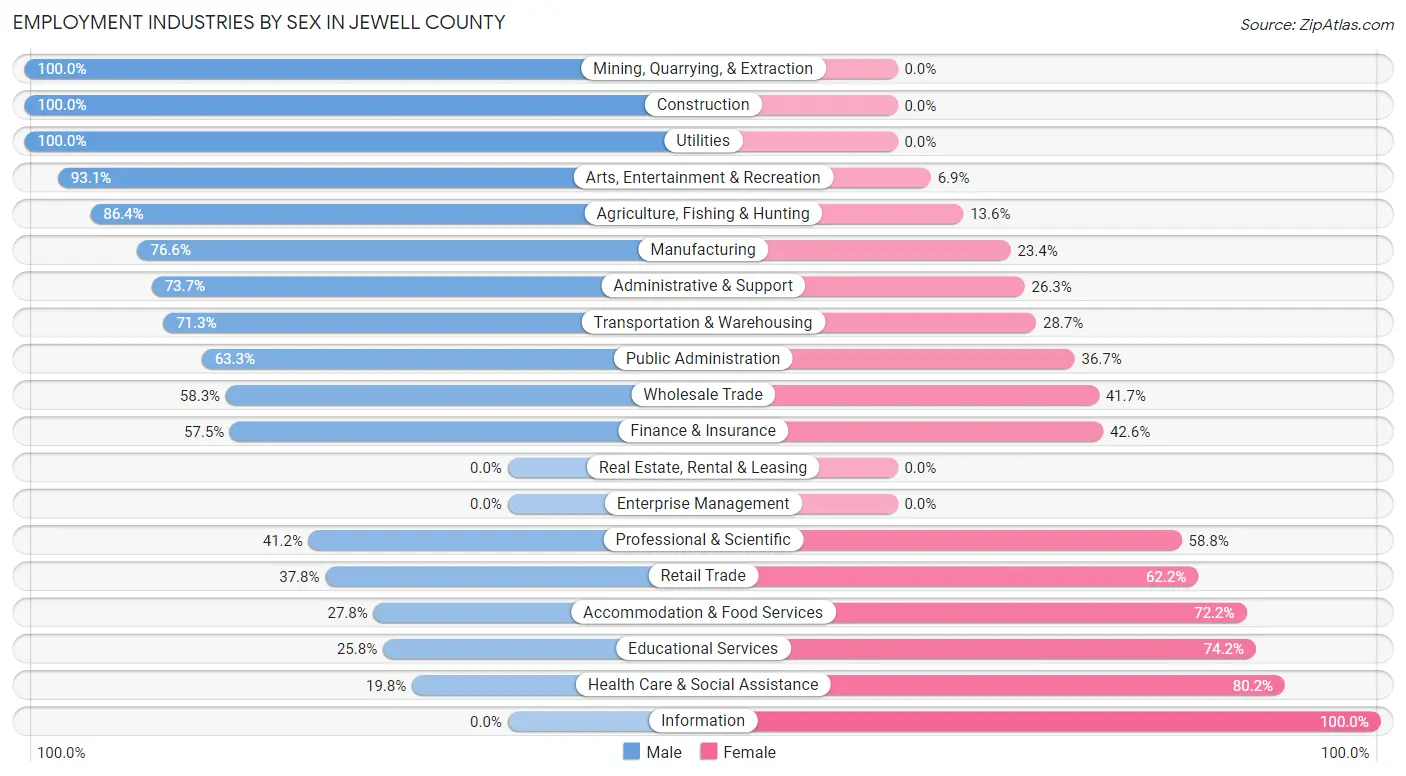
| Industry | Male | Female |
| Agriculture, Fishing & Hunting | 184 (86.4%) | 29 (13.6%) |
| Mining, Quarrying, & Extraction | 2 (100.0%) | 0 (0.0%) |
| Construction | 64 (100.0%) | 0 (0.0%) |
| Manufacturing | 72 (76.6%) | 22 (23.4%) |
| Wholesale Trade | 14 (58.3%) | 10 (41.7%) |
| Retail Trade | 37 (37.8%) | 61 (62.2%) |
| Transportation & Warehousing | 77 (71.3%) | 31 (28.7%) |
| Utilities | 10 (100.0%) | 0 (0.0%) |
| Information | 0 (0.0%) | 19 (100.0%) |
| Finance & Insurance | 27 (57.5%) | 20 (42.5%) |
| Real Estate, Rental & Leasing | 0 (0.0%) | 0 (0.0%) |
| Professional & Scientific | 14 (41.2%) | 20 (58.8%) |
| Enterprise Management | 0 (0.0%) | 0 (0.0%) |
| Administrative & Support | 14 (73.7%) | 5 (26.3%) |
| Educational Services | 47 (25.8%) | 135 (74.2%) |
| Health Care & Social Assistance | 40 (19.8%) | 162 (80.2%) |
| Arts, Entertainment & Recreation | 27 (93.1%) | 2 (6.9%) |
| Accommodation & Food Services | 10 (27.8%) | 26 (72.2%) |
| Public Administration | 38 (63.3%) | 22 (36.7%) |
| Total | 728 (55.6%) | 581 (44.4%) |
Education in Jewell County
School Enrollment in Jewell County
The most common levels of schooling among the 505 students in Jewell County are high school (142 | 28.1%), elementary school (133 | 26.3%), and middle school (107 | 21.2%).
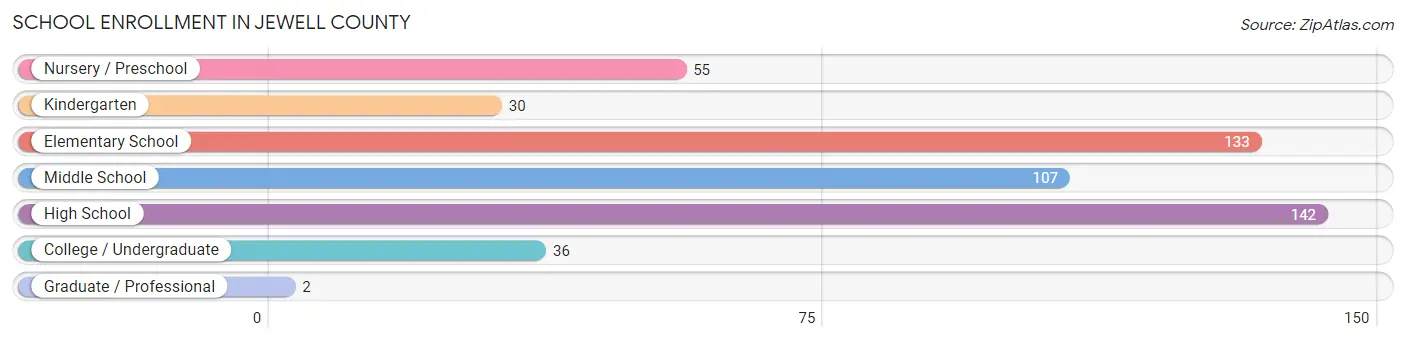
| School Level | # Students | % Students |
| Nursery / Preschool | 55 | 10.9% |
| Kindergarten | 30 | 5.9% |
| Elementary School | 133 | 26.3% |
| Middle School | 107 | 21.2% |
| High School | 142 | 28.1% |
| College / Undergraduate | 36 | 7.1% |
| Graduate / Professional | 2 | 0.4% |
| Total | 505 | 100.0% |
School Enrollment by Age by Funding Source in Jewell County
Out of a total of 505 students who are enrolled in schools in Jewell County, 41 (8.1%) attend a private institution, while the remaining 464 (91.9%) are enrolled in public schools. The age group of 25 to 34 year olds has the highest likelihood of being enrolled in private schools, with 8 (57.1% in the age bracket) enrolled. Conversely, the age group of 3 to 4 year olds has the lowest likelihood of being enrolled in a private school, with 17 (100.0% in the age bracket) attending a public institution.
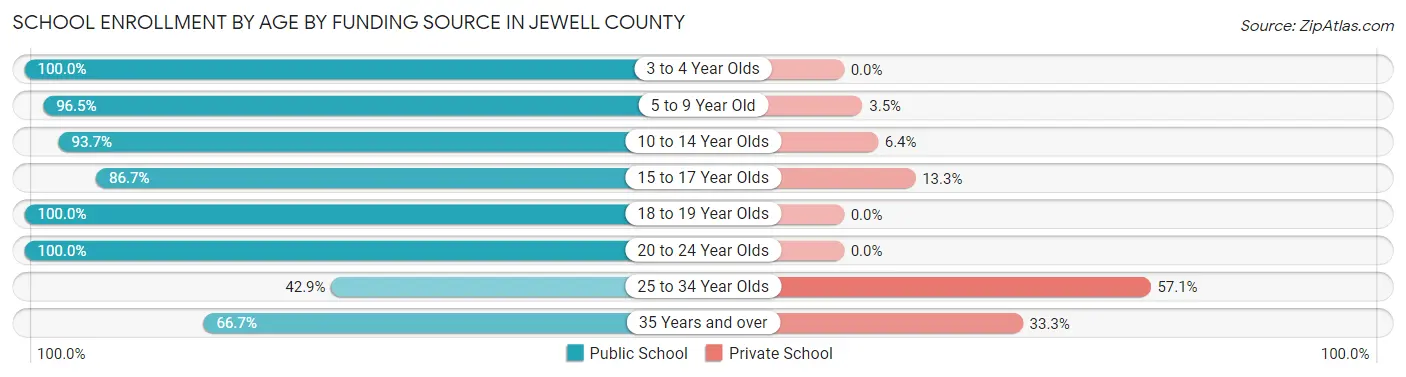
| Age Bracket | Public School | Private School |
| 3 to 4 Year Olds | 17 (100.0%) | 0 (0.0%) |
| 5 to 9 Year Old | 194 (96.5%) | 7 (3.5%) |
| 10 to 14 Year Olds | 118 (93.6%) | 8 (6.4%) |
| 15 to 17 Year Olds | 78 (86.7%) | 12 (13.3%) |
| 18 to 19 Year Olds | 36 (100.0%) | 0 (0.0%) |
| 20 to 24 Year Olds | 3 (100.0%) | 0 (0.0%) |
| 25 to 34 Year Olds | 6 (42.9%) | 8 (57.1%) |
| 35 Years and over | 12 (66.7%) | 6 (33.3%) |
| Total | 464 (91.9%) | 41 (8.1%) |
Educational Attainment by Field of Study in Jewell County
Education (102 | 24.3%), bio, nature & agricultural (62 | 14.8%), computers & mathematics (46 | 11.0%), arts & humanities (45 | 10.7%), and science & technology (41 | 9.8%) are the most common fields of study among 419 individuals in Jewell County who have obtained a bachelor's degree or higher.

| Field of Study | # Graduates | % Graduates |
| Computers & Mathematics | 46 | 11.0% |
| Bio, Nature & Agricultural | 62 | 14.8% |
| Physical & Health Sciences | 18 | 4.3% |
| Psychology | 10 | 2.4% |
| Social Sciences | 12 | 2.9% |
| Engineering | 14 | 3.3% |
| Multidisciplinary Studies | 10 | 2.4% |
| Science & Technology | 41 | 9.8% |
| Business | 27 | 6.4% |
| Education | 102 | 24.3% |
| Literature & Languages | 3 | 0.7% |
| Liberal Arts & History | 15 | 3.6% |
| Visual & Performing Arts | 12 | 2.9% |
| Communications | 2 | 0.5% |
| Arts & Humanities | 45 | 10.7% |
| Total | 419 | 100.0% |
Transportation & Commute in Jewell County
Vehicle Availability by Sex in Jewell County
The most prevalent vehicle ownership categories in Jewell County are males with 2 vehicles (247, accounting for 35.2%) and females with 2 vehicles (214, making up 43.3%).

| Vehicles Available | Male | Female |
| No Vehicle | 3 (0.4%) | 3 (0.5%) |
| 1 Vehicle | 77 (11.0%) | 49 (8.6%) |
| 2 Vehicles | 247 (35.2%) | 214 (37.5%) |
| 3 Vehicles | 191 (27.3%) | 186 (32.6%) |
| 4 Vehicles | 114 (16.3%) | 56 (9.8%) |
| 5 or more Vehicles | 69 (9.8%) | 63 (11.0%) |
| Total | 701 (100.0%) | 571 (100.0%) |
Commute Time in Jewell County
The most frequently occuring commute durations in Jewell County are less than 5 minutes (219 commuters, 18.4%), 30 to 34 minutes (216 commuters, 18.2%), and 5 to 9 minutes (210 commuters, 17.7%).
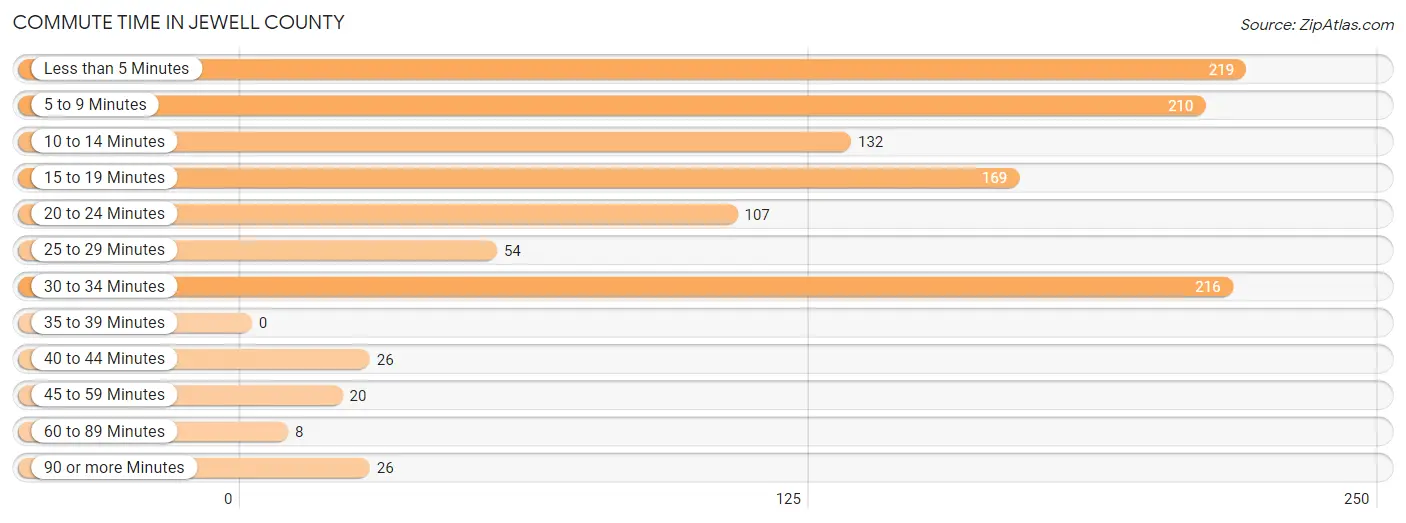
| Commute Time | # Commuters | % Commuters |
| Less than 5 Minutes | 219 | 18.4% |
| 5 to 9 Minutes | 210 | 17.7% |
| 10 to 14 Minutes | 132 | 11.1% |
| 15 to 19 Minutes | 169 | 14.2% |
| 20 to 24 Minutes | 107 | 9.0% |
| 25 to 29 Minutes | 54 | 4.5% |
| 30 to 34 Minutes | 216 | 18.2% |
| 35 to 39 Minutes | 0 | 0.0% |
| 40 to 44 Minutes | 26 | 2.2% |
| 45 to 59 Minutes | 20 | 1.7% |
| 60 to 89 Minutes | 8 | 0.7% |
| 90 or more Minutes | 26 | 2.2% |
Commute Time by Sex in Jewell County
The most common commute times in Jewell County are less than 5 minutes (121 commuters, 18.3%) for males and 30 to 34 minutes (105 commuters, 20.0%) for females.
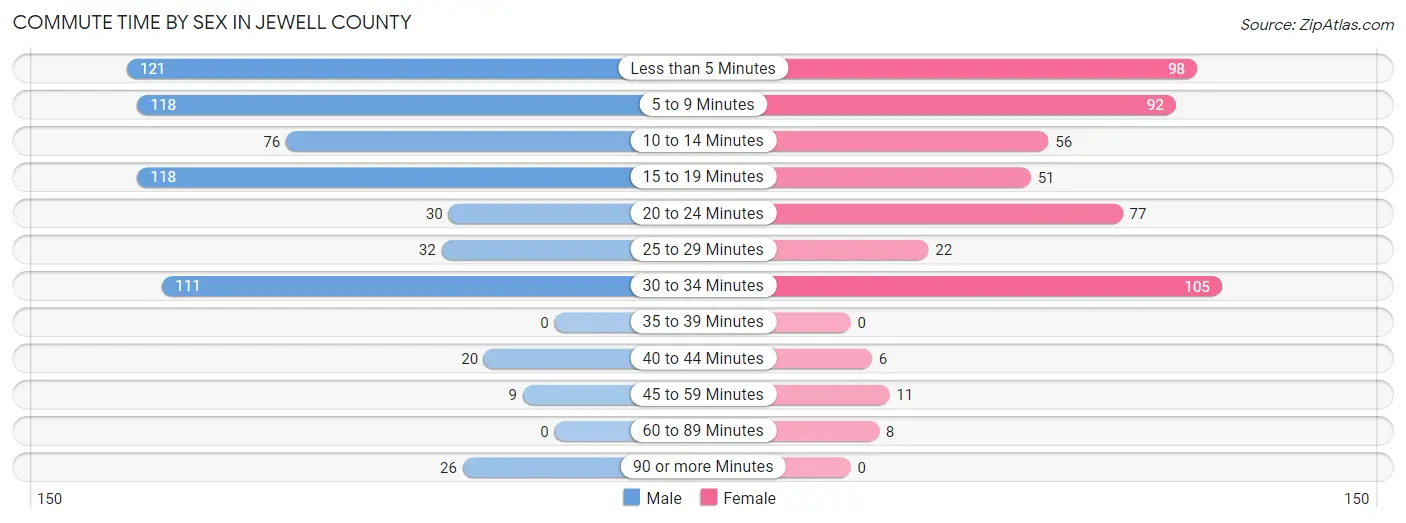
| Commute Time | Male | Female |
| Less than 5 Minutes | 121 (18.3%) | 98 (18.6%) |
| 5 to 9 Minutes | 118 (17.8%) | 92 (17.5%) |
| 10 to 14 Minutes | 76 (11.5%) | 56 (10.6%) |
| 15 to 19 Minutes | 118 (17.8%) | 51 (9.7%) |
| 20 to 24 Minutes | 30 (4.5%) | 77 (14.6%) |
| 25 to 29 Minutes | 32 (4.8%) | 22 (4.2%) |
| 30 to 34 Minutes | 111 (16.8%) | 105 (20.0%) |
| 35 to 39 Minutes | 0 (0.0%) | 0 (0.0%) |
| 40 to 44 Minutes | 20 (3.0%) | 6 (1.1%) |
| 45 to 59 Minutes | 9 (1.4%) | 11 (2.1%) |
| 60 to 89 Minutes | 0 (0.0%) | 8 (1.5%) |
| 90 or more Minutes | 26 (3.9%) | 0 (0.0%) |
Time of Departure to Work by Sex in Jewell County
The most frequent times of departure to work in Jewell County are 7:00 AM to 7:29 AM (146, 22.1%) for males and 7:30 AM to 7:59 AM (135, 25.7%) for females.
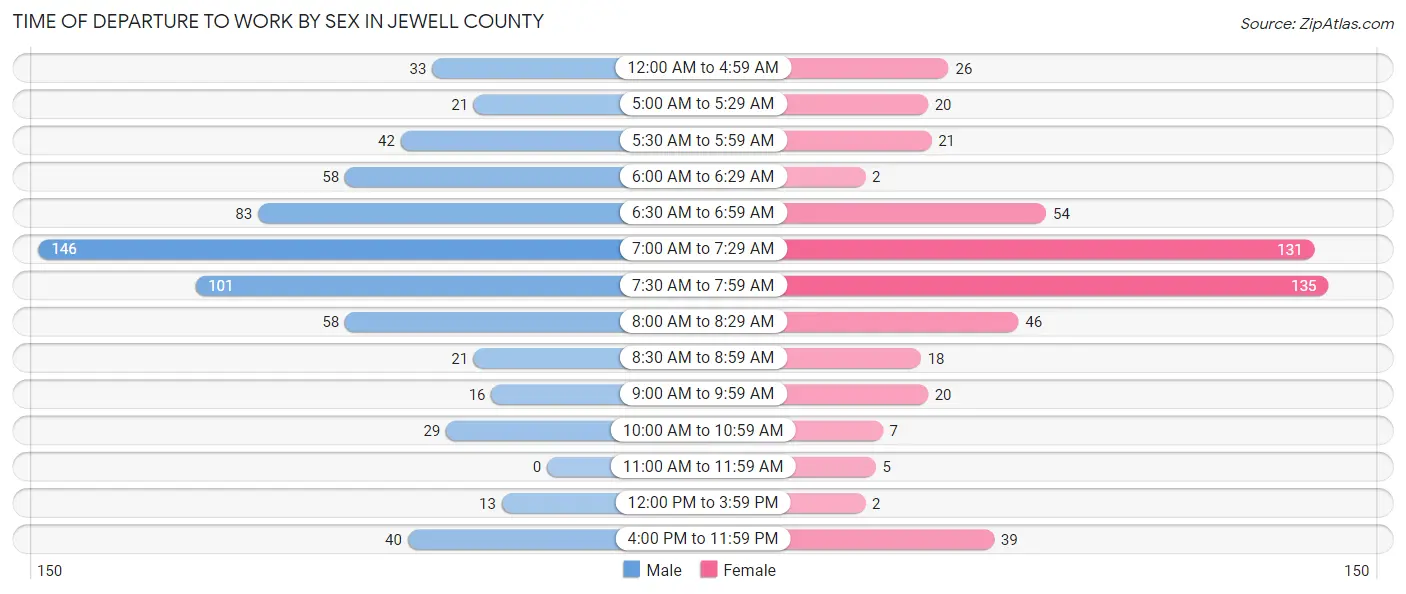
| Time of Departure | Male | Female |
| 12:00 AM to 4:59 AM | 33 (5.0%) | 26 (4.9%) |
| 5:00 AM to 5:29 AM | 21 (3.2%) | 20 (3.8%) |
| 5:30 AM to 5:59 AM | 42 (6.4%) | 21 (4.0%) |
| 6:00 AM to 6:29 AM | 58 (8.8%) | 2 (0.4%) |
| 6:30 AM to 6:59 AM | 83 (12.6%) | 54 (10.3%) |
| 7:00 AM to 7:29 AM | 146 (22.1%) | 131 (24.9%) |
| 7:30 AM to 7:59 AM | 101 (15.3%) | 135 (25.7%) |
| 8:00 AM to 8:29 AM | 58 (8.8%) | 46 (8.7%) |
| 8:30 AM to 8:59 AM | 21 (3.2%) | 18 (3.4%) |
| 9:00 AM to 9:59 AM | 16 (2.4%) | 20 (3.8%) |
| 10:00 AM to 10:59 AM | 29 (4.4%) | 7 (1.3%) |
| 11:00 AM to 11:59 AM | 0 (0.0%) | 5 (0.9%) |
| 12:00 PM to 3:59 PM | 13 (2.0%) | 2 (0.4%) |
| 4:00 PM to 11:59 PM | 40 (6.0%) | 39 (7.4%) |
| Total | 661 (100.0%) | 526 (100.0%) |
Housing Occupancy in Jewell County
Occupancy by Ownership in Jewell County
Of the total 1,278 dwellings in Jewell County, owner-occupied units account for 1,025 (80.2%), while renter-occupied units make up 253 (19.8%).

| Occupancy | # Housing Units | % Housing Units |
| Owner Occupied Housing Units | 1,025 | 80.2% |
| Renter-Occupied Housing Units | 253 | 19.8% |
| Total Occupied Housing Units | 1,278 | 100.0% |
Occupancy by Household Size in Jewell County
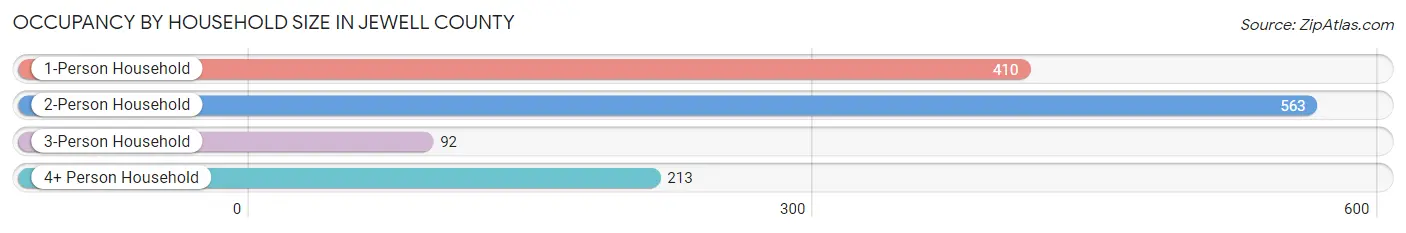
| Household Size | # Housing Units | % Housing Units |
| 1-Person Household | 410 | 32.1% |
| 2-Person Household | 563 | 44.1% |
| 3-Person Household | 92 | 7.2% |
| 4+ Person Household | 213 | 16.7% |
| Total Housing Units | 1,278 | 100.0% |
Occupancy by Ownership by Household Size in Jewell County

| Household Size | Owner-occupied | Renter-occupied |
| 1-Person Household | 293 (71.5%) | 117 (28.5%) |
| 2-Person Household | 502 (89.2%) | 61 (10.8%) |
| 3-Person Household | 75 (81.5%) | 17 (18.5%) |
| 4+ Person Household | 155 (72.8%) | 58 (27.2%) |
| Total Housing Units | 1,025 (80.2%) | 253 (19.8%) |
Occupancy by Educational Attainment in Jewell County

| Household Size | Owner-occupied | Renter-occupied |
| Less than High School | 45 (56.2%) | 35 (43.8%) |
| High School Diploma | 405 (80.8%) | 96 (19.2%) |
| College/Associate Degree | 354 (78.0%) | 100 (22.0%) |
| Bachelor's Degree or higher | 221 (90.9%) | 22 (9.0%) |
Occupancy by Age of Householder in Jewell County
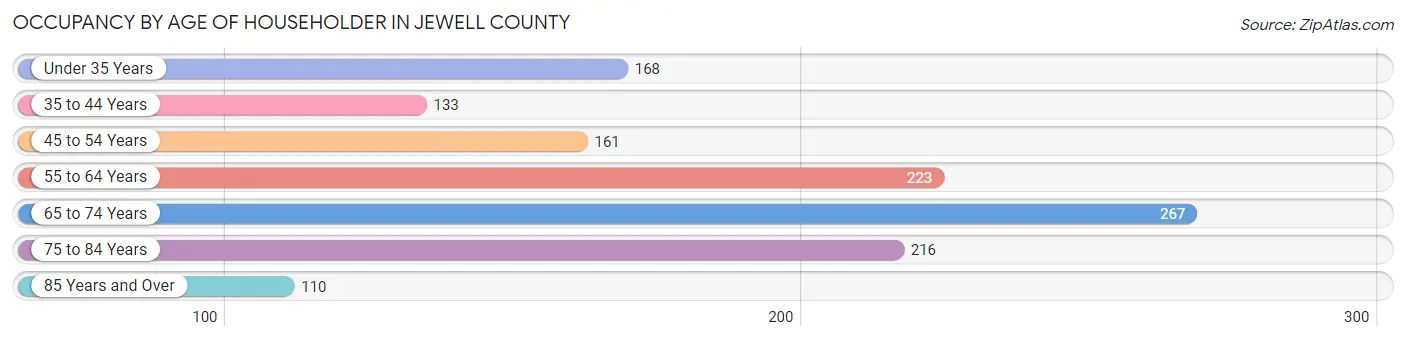
| Age Bracket | # Households | % Households |
| Under 35 Years | 168 | 13.2% |
| 35 to 44 Years | 133 | 10.4% |
| 45 to 54 Years | 161 | 12.6% |
| 55 to 64 Years | 223 | 17.4% |
| 65 to 74 Years | 267 | 20.9% |
| 75 to 84 Years | 216 | 16.9% |
| 85 Years and Over | 110 | 8.6% |
| Total | 1,278 | 100.0% |
Housing Finances in Jewell County
Median Income by Occupancy in Jewell County

| Occupancy Type | # Households | Median Income |
| Owner-Occupied | 1,025 (80.2%) | $54,896 |
| Renter-Occupied | 253 (19.8%) | $26,951 |
| Average | 1,278 (100.0%) | $47,109 |
Occupancy by Householder Income Bracket in Jewell County
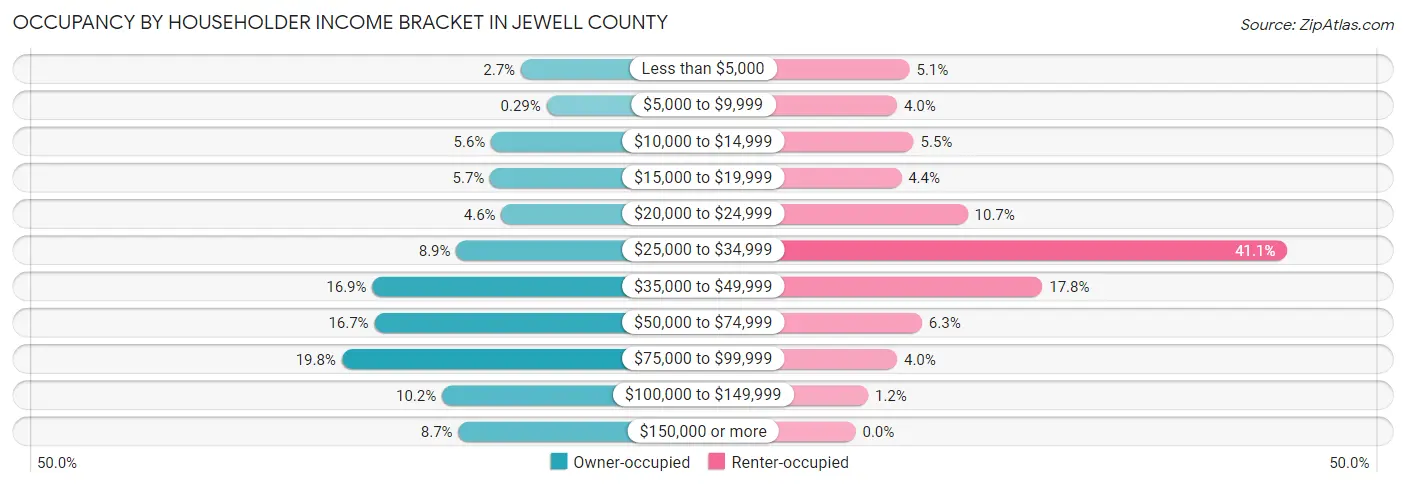
| Income Bracket | Owner-occupied | Renter-occupied |
| Less than $5,000 | 28 (2.7%) | 13 (5.1%) |
| $5,000 to $9,999 | 3 (0.3%) | 10 (4.0%) |
| $10,000 to $14,999 | 57 (5.6%) | 14 (5.5%) |
| $15,000 to $19,999 | 58 (5.7%) | 11 (4.3%) |
| $20,000 to $24,999 | 47 (4.6%) | 27 (10.7%) |
| $25,000 to $34,999 | 91 (8.9%) | 104 (41.1%) |
| $35,000 to $49,999 | 173 (16.9%) | 45 (17.8%) |
| $50,000 to $74,999 | 171 (16.7%) | 16 (6.3%) |
| $75,000 to $99,999 | 203 (19.8%) | 10 (4.0%) |
| $100,000 to $149,999 | 105 (10.2%) | 3 (1.2%) |
| $150,000 or more | 89 (8.7%) | 0 (0.0%) |
| Total | 1,025 (100.0%) | 253 (100.0%) |
Monthly Housing Cost Tiers in Jewell County

| Monthly Cost | Owner-occupied | Renter-occupied |
| Less than $300 | 207 (20.2%) | 6 (2.4%) |
| $300 to $499 | 264 (25.8%) | 49 (19.4%) |
| $500 to $799 | 329 (32.1%) | 84 (33.2%) |
| $800 to $999 | 68 (6.6%) | 24 (9.5%) |
| $1,000 to $1,499 | 83 (8.1%) | 25 (9.9%) |
| $1,500 to $1,999 | 39 (3.8%) | 0 (0.0%) |
| $2,000 to $2,499 | 21 (2.1%) | 0 (0.0%) |
| $2,500 to $2,999 | 8 (0.8%) | 0 (0.0%) |
| $3,000 or more | 6 (0.6%) | 0 (0.0%) |
| Total | 1,025 (100.0%) | 253 (100.0%) |
Physical Housing Characteristics in Jewell County
Housing Structures in Jewell County
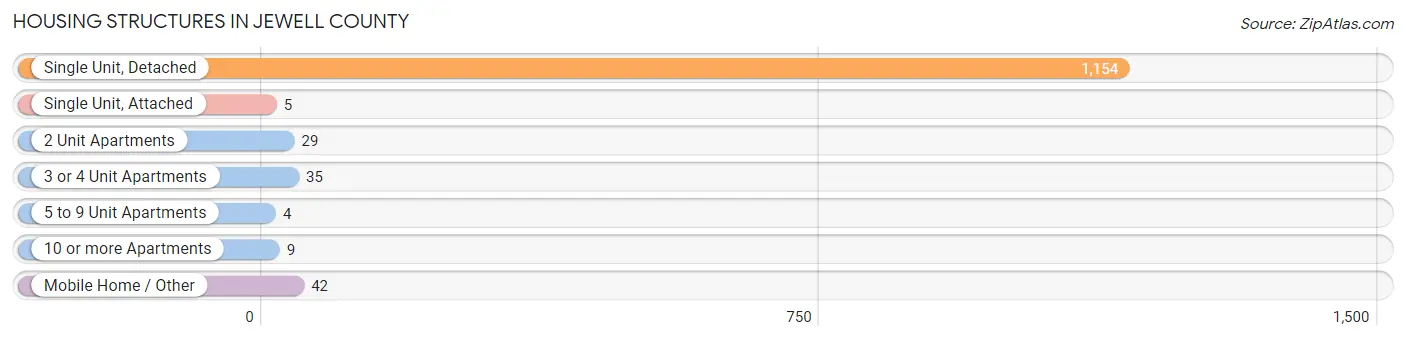
| Structure Type | # Housing Units | % Housing Units |
| Single Unit, Detached | 1,154 | 90.3% |
| Single Unit, Attached | 5 | 0.4% |
| 2 Unit Apartments | 29 | 2.3% |
| 3 or 4 Unit Apartments | 35 | 2.7% |
| 5 to 9 Unit Apartments | 4 | 0.3% |
| 10 or more Apartments | 9 | 0.7% |
| Mobile Home / Other | 42 | 3.3% |
| Total | 1,278 | 100.0% |
Housing Structures by Occupancy in Jewell County
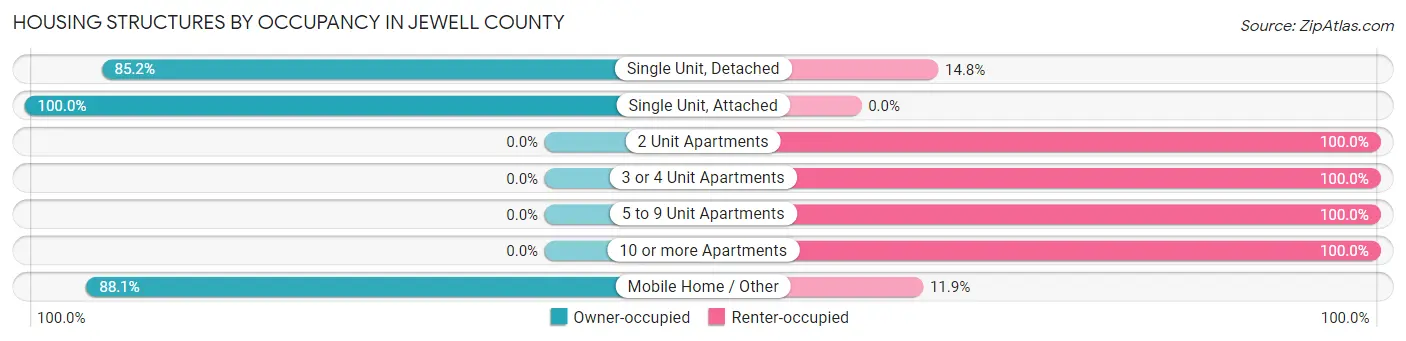
| Structure Type | Owner-occupied | Renter-occupied |
| Single Unit, Detached | 983 (85.2%) | 171 (14.8%) |
| Single Unit, Attached | 5 (100.0%) | 0 (0.0%) |
| 2 Unit Apartments | 0 (0.0%) | 29 (100.0%) |
| 3 or 4 Unit Apartments | 0 (0.0%) | 35 (100.0%) |
| 5 to 9 Unit Apartments | 0 (0.0%) | 4 (100.0%) |
| 10 or more Apartments | 0 (0.0%) | 9 (100.0%) |
| Mobile Home / Other | 37 (88.1%) | 5 (11.9%) |
| Total | 1,025 (80.2%) | 253 (19.8%) |
Housing Structures by Number of Rooms in Jewell County

| Number of Rooms | Owner-occupied | Renter-occupied |
| 1 Room | 4 (0.4%) | 3 (1.2%) |
| 2 or 3 Rooms | 8 (0.8%) | 45 (17.8%) |
| 4 or 5 Rooms | 311 (30.3%) | 99 (39.1%) |
| 6 or 7 Rooms | 390 (38.1%) | 76 (30.0%) |
| 8 or more Rooms | 312 (30.4%) | 30 (11.9%) |
| Total | 1,025 (100.0%) | 253 (100.0%) |
Housing Structure by Heating Type in Jewell County

| Heating Type | Owner-occupied | Renter-occupied |
| Utility Gas | 571 (55.7%) | 139 (54.9%) |
| Bottled, Tank, or LP Gas | 304 (29.7%) | 69 (27.3%) |
| Electricity | 53 (5.2%) | 31 (12.2%) |
| Fuel Oil or Kerosene | 0 (0.0%) | 0 (0.0%) |
| Coal or Coke | 0 (0.0%) | 0 (0.0%) |
| All other Fuels | 93 (9.1%) | 14 (5.5%) |
| No Fuel Used | 4 (0.4%) | 0 (0.0%) |
| Total | 1,025 (100.0%) | 253 (100.0%) |
Household Vehicle Usage in Jewell County
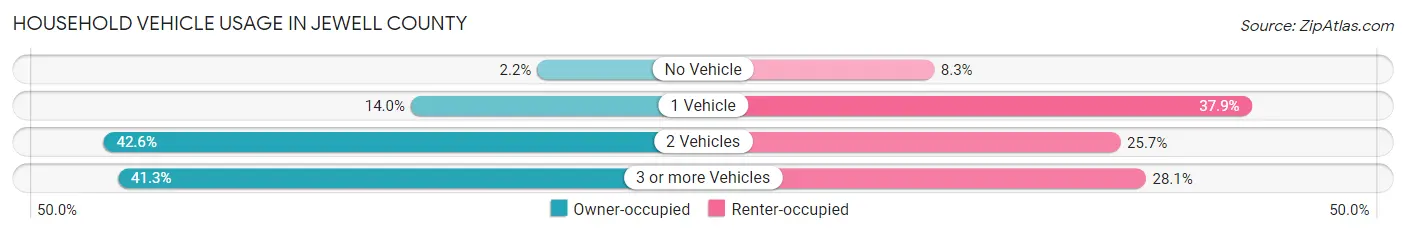
| Vehicles per Household | Owner-occupied | Renter-occupied |
| No Vehicle | 22 (2.1%) | 21 (8.3%) |
| 1 Vehicle | 143 (14.0%) | 96 (37.9%) |
| 2 Vehicles | 437 (42.6%) | 65 (25.7%) |
| 3 or more Vehicles | 423 (41.3%) | 71 (28.1%) |
| Total | 1,025 (100.0%) | 253 (100.0%) |
Real Estate & Mortgages in Jewell County
Real Estate and Mortgage Overview in Jewell County
| Characteristic | Without Mortgage | With Mortgage |
| Housing Units | 786 | 239 |
| Median Property Value | $52,600 | $80,400 |
| Median Household Income | $53,264 | $47 |
| Monthly Housing Costs | $421 | $4 |
| Real Estate Taxes | $1,101 | $0 |
Property Value by Mortgage Status in Jewell County
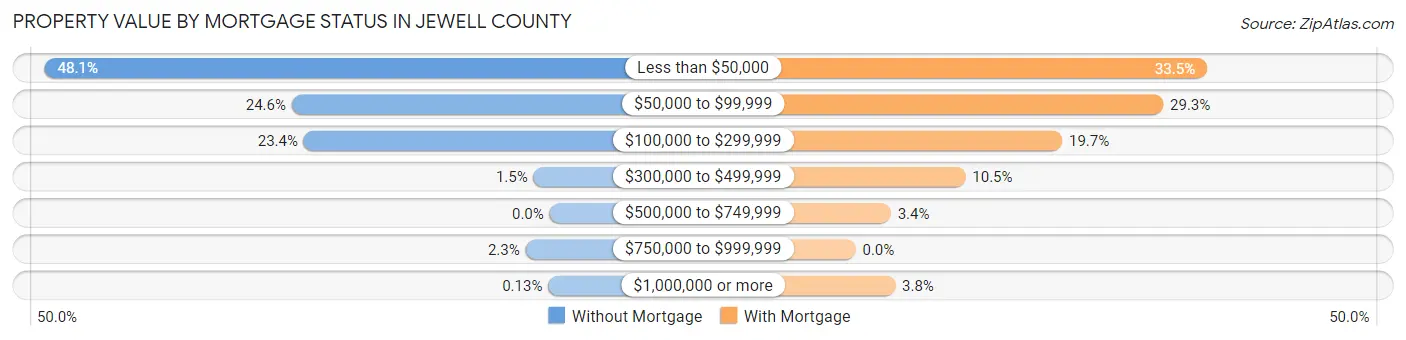
| Property Value | Without Mortgage | With Mortgage |
| Less than $50,000 | 378 (48.1%) | 80 (33.5%) |
| $50,000 to $99,999 | 193 (24.5%) | 70 (29.3%) |
| $100,000 to $299,999 | 184 (23.4%) | 47 (19.7%) |
| $300,000 to $499,999 | 12 (1.5%) | 25 (10.5%) |
| $500,000 to $749,999 | 0 (0.0%) | 8 (3.4%) |
| $750,000 to $999,999 | 18 (2.3%) | 0 (0.0%) |
| $1,000,000 or more | 1 (0.1%) | 9 (3.8%) |
| Total | 786 (100.0%) | 239 (100.0%) |
Household Income by Mortgage Status in Jewell County
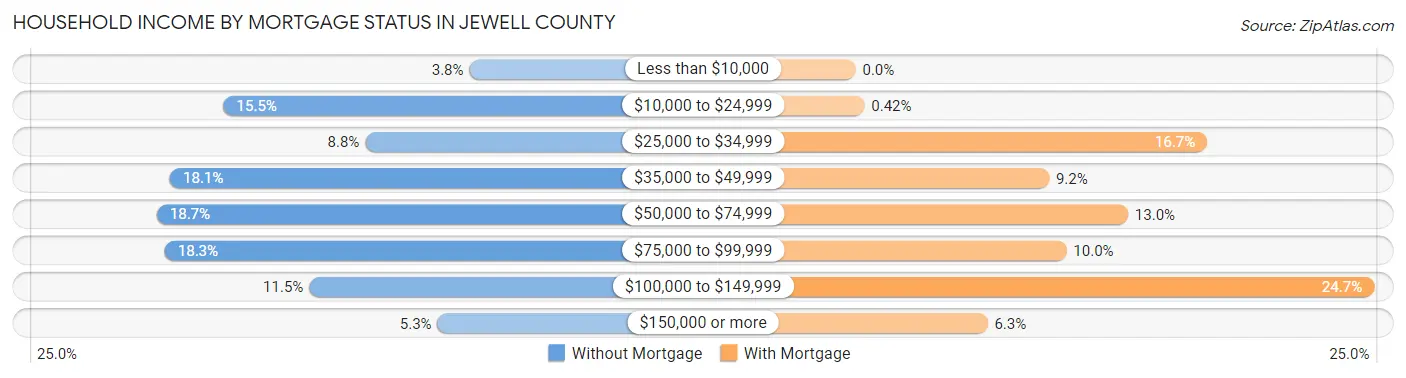
| Household Income | Without Mortgage | With Mortgage |
| Less than $10,000 | 30 (3.8%) | 0 (0.0%) |
| $10,000 to $24,999 | 122 (15.5%) | 1 (0.4%) |
| $25,000 to $34,999 | 69 (8.8%) | 40 (16.7%) |
| $35,000 to $49,999 | 142 (18.1%) | 22 (9.2%) |
| $50,000 to $74,999 | 147 (18.7%) | 31 (13.0%) |
| $75,000 to $99,999 | 144 (18.3%) | 24 (10.0%) |
| $100,000 to $149,999 | 90 (11.5%) | 59 (24.7%) |
| $150,000 or more | 42 (5.3%) | 15 (6.3%) |
| Total | 786 (100.0%) | 239 (100.0%) |
Property Value to Household Income Ratio in Jewell County
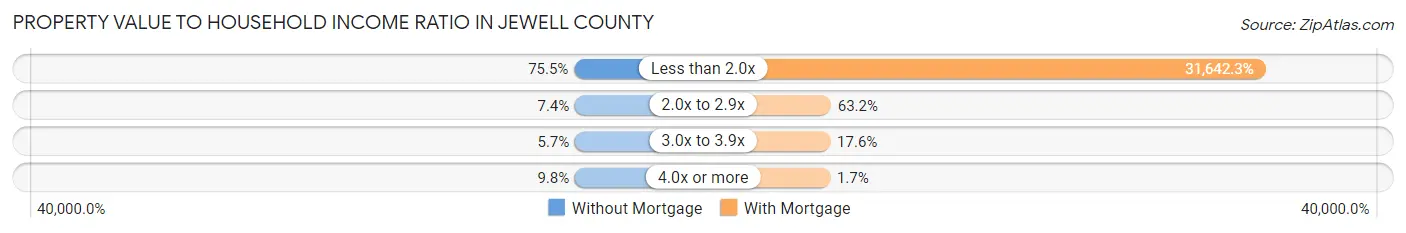
| Value-to-Income Ratio | Without Mortgage | With Mortgage |
| Less than 2.0x | 593 (75.4%) | 75,625 (31,642.3%) |
| 2.0x to 2.9x | 58 (7.4%) | 151 (63.2%) |
| 3.0x to 3.9x | 45 (5.7%) | 42 (17.6%) |
| 4.0x or more | 77 (9.8%) | 4 (1.7%) |
| Total | 786 (100.0%) | 239 (100.0%) |
Real Estate Taxes by Mortgage Status in Jewell County
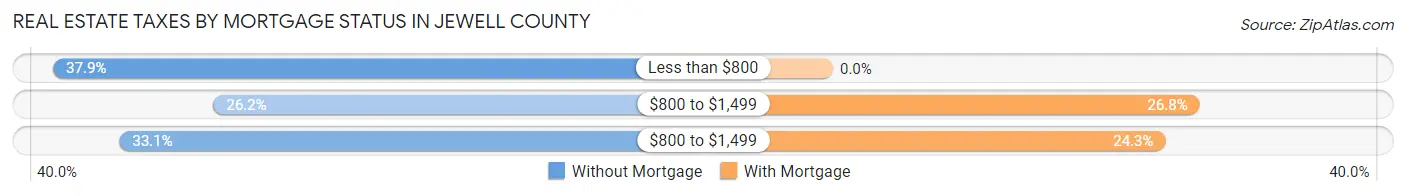
| Property Taxes | Without Mortgage | With Mortgage |
| Less than $800 | 298 (37.9%) | 0 (0.0%) |
| $800 to $1,499 | 206 (26.2%) | 64 (26.8%) |
| $800 to $1,499 | 260 (33.1%) | 58 (24.3%) |
| Total | 786 (100.0%) | 239 (100.0%) |
Health & Disability in Jewell County
Health Insurance Coverage by Age in Jewell County
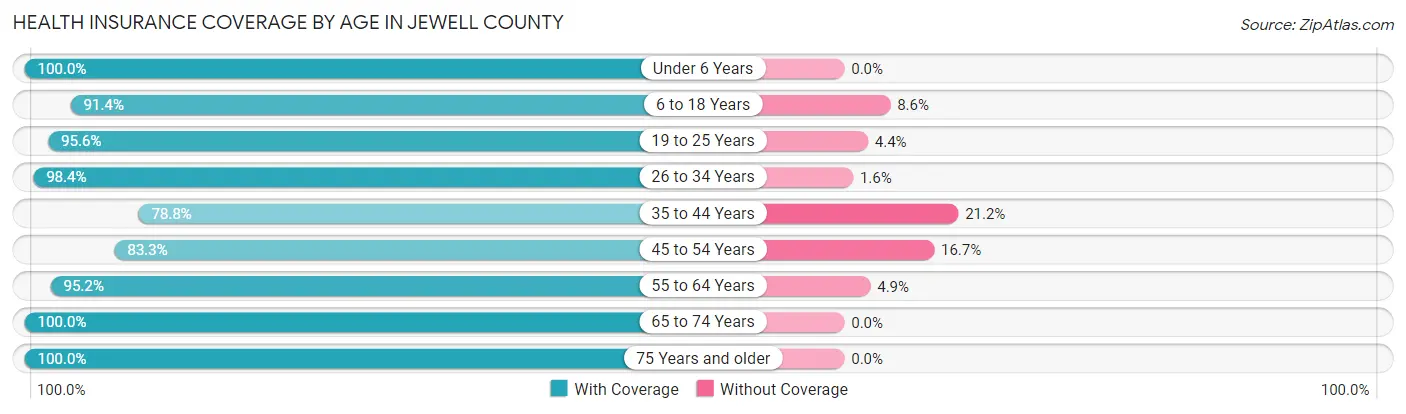
| Age Bracket | With Coverage | Without Coverage |
| Under 6 Years | 225 (100.0%) | 0 (0.0%) |
| 6 to 18 Years | 374 (91.4%) | 35 (8.6%) |
| 19 to 25 Years | 109 (95.6%) | 5 (4.4%) |
| 26 to 34 Years | 304 (98.4%) | 5 (1.6%) |
| 35 to 44 Years | 204 (78.8%) | 55 (21.2%) |
| 45 to 54 Years | 219 (83.3%) | 44 (16.7%) |
| 55 to 64 Years | 432 (95.2%) | 22 (4.9%) |
| 65 to 74 Years | 464 (100.0%) | 0 (0.0%) |
| 75 Years and older | 400 (100.0%) | 0 (0.0%) |
| Total | 2,731 (94.3%) | 166 (5.7%) |
Health Insurance Coverage by Citizenship Status in Jewell County
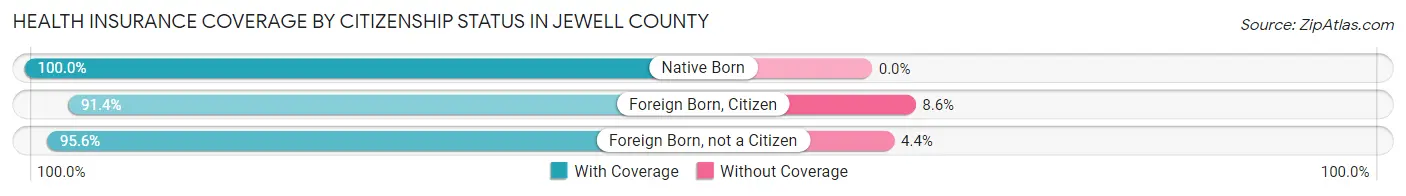
| Citizenship Status | With Coverage | Without Coverage |
| Native Born | 225 (100.0%) | 0 (0.0%) |
| Foreign Born, Citizen | 374 (91.4%) | 35 (8.6%) |
| Foreign Born, not a Citizen | 109 (95.6%) | 5 (4.4%) |
Health Insurance Coverage by Household Income in Jewell County
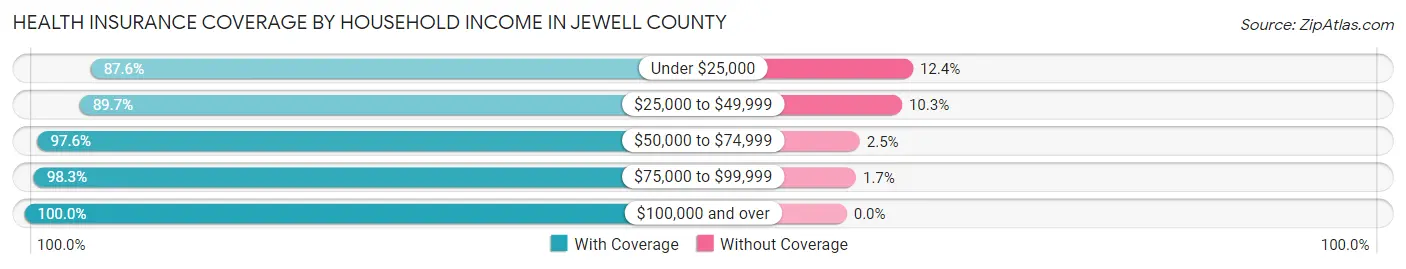
| Household Income | With Coverage | Without Coverage |
| Under $25,000 | 424 (87.6%) | 60 (12.4%) |
| $25,000 to $49,999 | 746 (89.7%) | 86 (10.3%) |
| $50,000 to $74,999 | 398 (97.6%) | 10 (2.5%) |
| $75,000 to $99,999 | 569 (98.3%) | 10 (1.7%) |
| $100,000 and over | 594 (100.0%) | 0 (0.0%) |
Public vs Private Health Insurance Coverage by Age in Jewell County
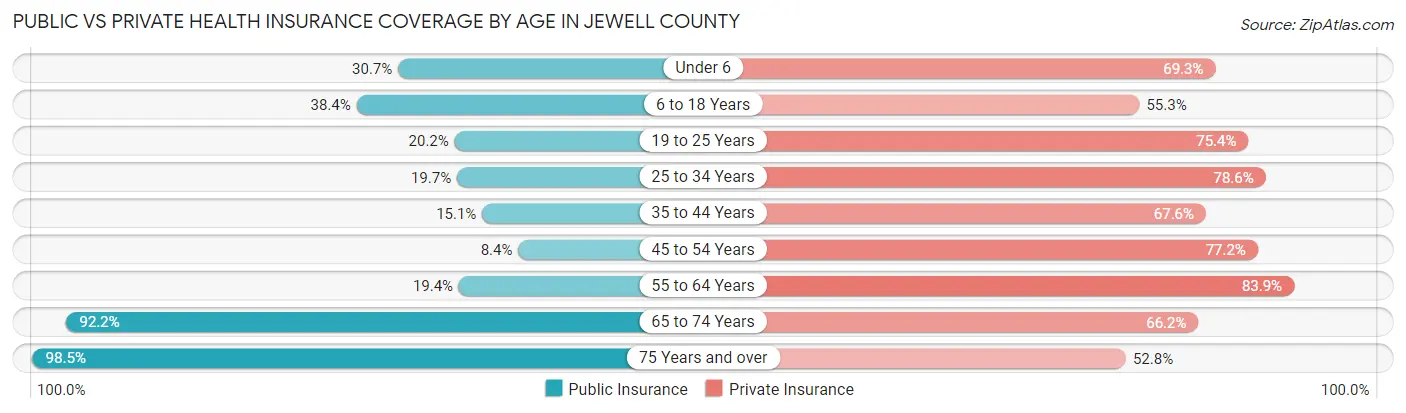
| Age Bracket | Public Insurance | Private Insurance |
| Under 6 | 69 (30.7%) | 156 (69.3%) |
| 6 to 18 Years | 157 (38.4%) | 226 (55.3%) |
| 19 to 25 Years | 23 (20.2%) | 86 (75.4%) |
| 25 to 34 Years | 61 (19.7%) | 243 (78.6%) |
| 35 to 44 Years | 39 (15.1%) | 175 (67.6%) |
| 45 to 54 Years | 22 (8.4%) | 203 (77.2%) |
| 55 to 64 Years | 88 (19.4%) | 381 (83.9%) |
| 65 to 74 Years | 428 (92.2%) | 307 (66.2%) |
| 75 Years and over | 394 (98.5%) | 211 (52.7%) |
| Total | 1,281 (44.2%) | 1,988 (68.6%) |
Disability Status by Sex by Age in Jewell County
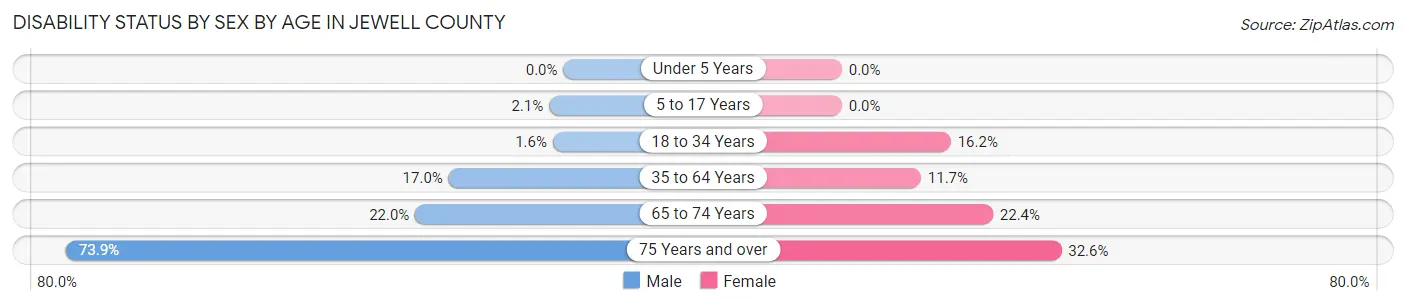
| Age Bracket | Male | Female |
| Under 5 Years | 0 (0.0%) | 0 (0.0%) |
| 5 to 17 Years | 5 (2.1%) | 0 (0.0%) |
| 18 to 34 Years | 4 (1.6%) | 33 (16.2%) |
| 35 to 64 Years | 85 (17.0%) | 56 (11.7%) |
| 65 to 74 Years | 55 (22.0%) | 48 (22.4%) |
| 75 Years and over | 130 (73.9%) | 73 (32.6%) |
Disability Class by Sex by Age in Jewell County
Disability Class: Hearing Difficulty
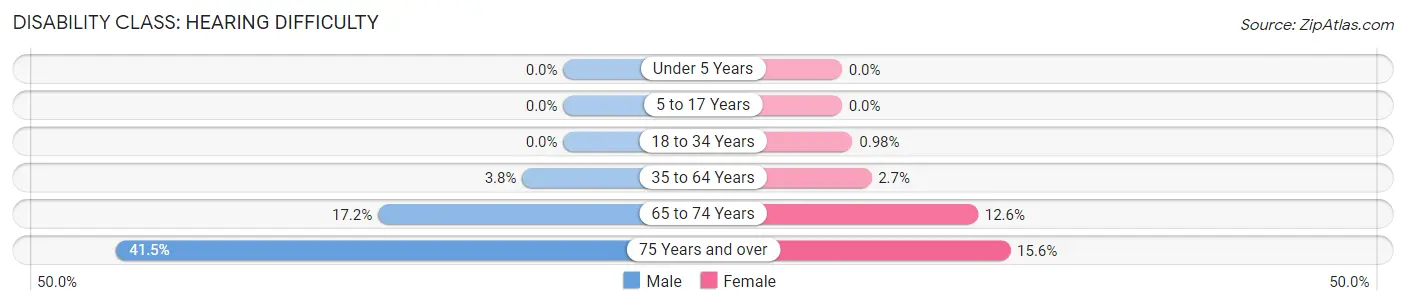
| Age Bracket | Male | Female |
| Under 5 Years | 0 (0.0%) | 0 (0.0%) |
| 5 to 17 Years | 0 (0.0%) | 0 (0.0%) |
| 18 to 34 Years | 0 (0.0%) | 2 (1.0%) |
| 35 to 64 Years | 19 (3.8%) | 13 (2.7%) |
| 65 to 74 Years | 43 (17.2%) | 27 (12.6%) |
| 75 Years and over | 73 (41.5%) | 35 (15.6%) |
Disability Class: Vision Difficulty
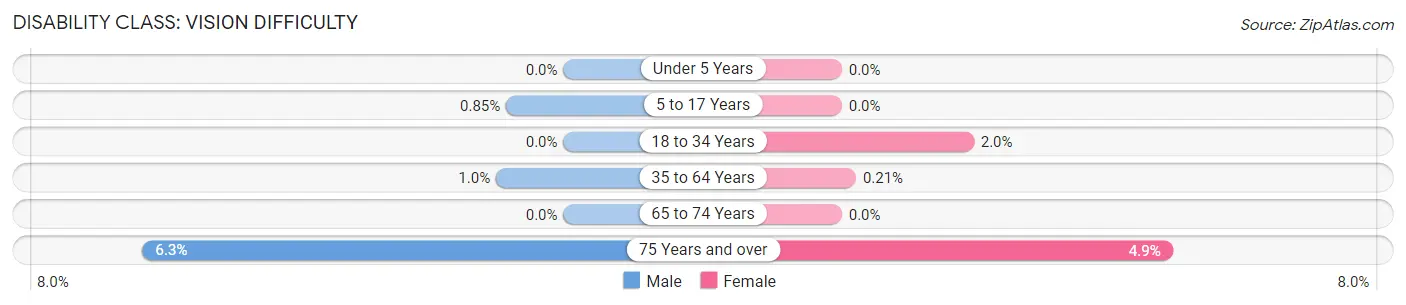
| Age Bracket | Male | Female |
| Under 5 Years | 0 (0.0%) | 0 (0.0%) |
| 5 to 17 Years | 2 (0.9%) | 0 (0.0%) |
| 18 to 34 Years | 0 (0.0%) | 4 (2.0%) |
| 35 to 64 Years | 5 (1.0%) | 1 (0.2%) |
| 65 to 74 Years | 0 (0.0%) | 0 (0.0%) |
| 75 Years and over | 11 (6.2%) | 11 (4.9%) |
Disability Class: Cognitive Difficulty
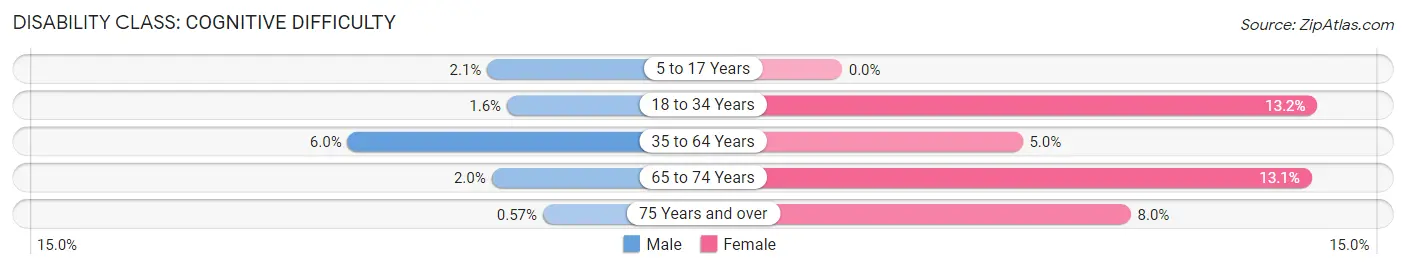
| Age Bracket | Male | Female |
| 5 to 17 Years | 5 (2.1%) | 0 (0.0%) |
| 18 to 34 Years | 4 (1.6%) | 27 (13.2%) |
| 35 to 64 Years | 30 (6.0%) | 24 (5.0%) |
| 65 to 74 Years | 5 (2.0%) | 28 (13.1%) |
| 75 Years and over | 1 (0.6%) | 18 (8.0%) |
Disability Class: Ambulatory Difficulty
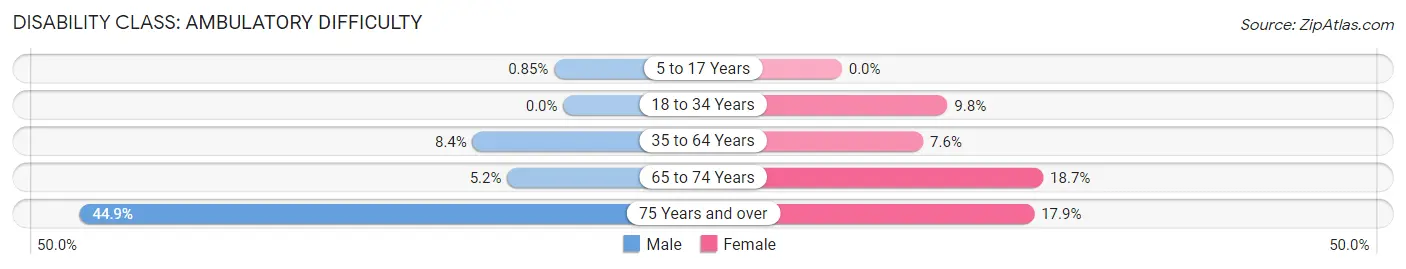
| Age Bracket | Male | Female |
| 5 to 17 Years | 2 (0.9%) | 0 (0.0%) |
| 18 to 34 Years | 0 (0.0%) | 20 (9.8%) |
| 35 to 64 Years | 42 (8.4%) | 36 (7.5%) |
| 65 to 74 Years | 13 (5.2%) | 40 (18.7%) |
| 75 Years and over | 79 (44.9%) | 40 (17.9%) |
Disability Class: Self-Care Difficulty

| Age Bracket | Male | Female |
| 5 to 17 Years | 4 (1.7%) | 0 (0.0%) |
| 18 to 34 Years | 0 (0.0%) | 18 (8.8%) |
| 35 to 64 Years | 23 (4.6%) | 18 (3.8%) |
| 65 to 74 Years | 4 (1.6%) | 7 (3.3%) |
| 75 Years and over | 8 (4.5%) | 18 (8.0%) |
Technology Access in Jewell County
Computing Device Access in Jewell County
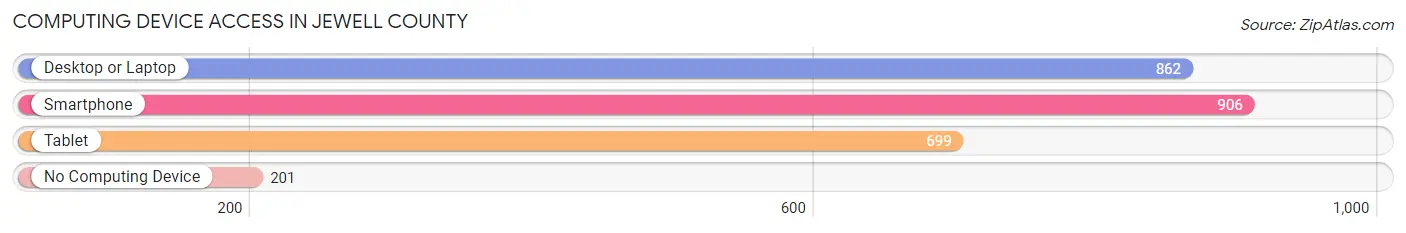
| Device Type | # Households | % Households |
| Desktop or Laptop | 862 | 67.4% |
| Smartphone | 906 | 70.9% |
| Tablet | 699 | 54.7% |
| No Computing Device | 201 | 15.7% |
| Total | 1,278 | 100.0% |
Internet Access in Jewell County
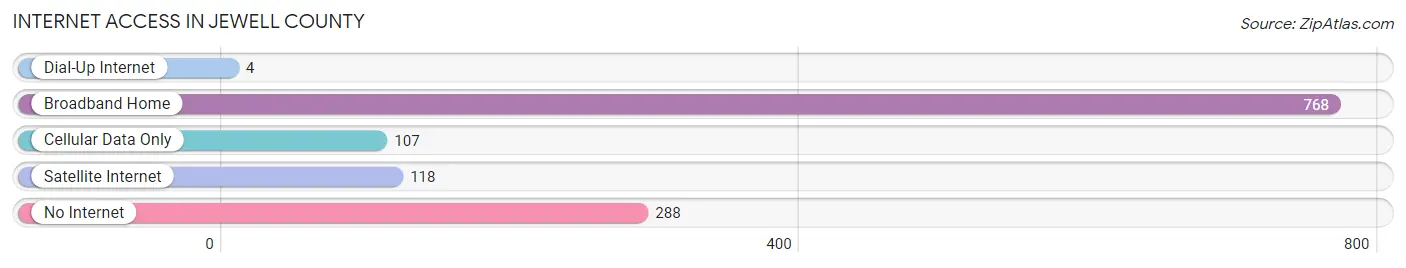
| Internet Type | # Households | % Households |
| Dial-Up Internet | 4 | 0.3% |
| Broadband Home | 768 | 60.1% |
| Cellular Data Only | 107 | 8.4% |
| Satellite Internet | 118 | 9.2% |
| No Internet | 288 | 22.5% |
| Total | 1,278 | 100.0% |
Jewell County Summary
Jewell County, Kansas is located in the north central part of the state and is bordered by Republic, Mitchell, Cloud, Smith, Osborne, and Mitchell counties. The county seat is Mankato, and the county was named after Lewis R. Jewell, a Union soldier who died in the Civil War. The county has a total area of 876 square miles, of which 875 square miles is land and 1 square mile is water.
As of the 2010 census, the population of Jewell County was 3,077, with a population density of 3.5 people per square mile. The median age was 43.7 years, and the median household income was $45,945. The racial makeup of the county was 97.3% White, 0.3% African American, 0.3% Native American, 0.2% Asian, 0.1% Pacific Islander, 0.7% from other races, and 1.1% from two or more races. Hispanic or Latino of any race were 1.7% of the population.
The economy of Jewell County is largely based on agriculture. The county is home to a variety of crops, including corn, soybeans, wheat, and sorghum. Livestock production is also important, with cattle, hogs, and sheep being raised in the area. The county also has a number of small businesses, including retail stores, restaurants, and service providers.
Jewell County is home to several historical sites, including the Jewell County Courthouse, the Jewell County Museum, and the Jewell County Historical Society. The county is also home to several parks, including the Jewell County State Park, the Jewell County Wildlife Area, and the Jewell County Fairgrounds.
Jewell County is served by several school districts, including the Jewell County USD #335, the Mankato USD #279, and the Randall USD #279. The county is also home to several higher education institutions, including the North Central Kansas Technical College and the Kansas State University Extension Office.
Jewell County is a rural county with a strong agricultural base. The county is home to a variety of historical sites, parks, and educational institutions, and offers a variety of recreational activities. The county is also home to a number of small businesses, providing employment opportunities for its residents.
Common Questions
What is the Total Population of Jewell County?
Total Population of Jewell County is 2,929.
What is the Total Male Population of Jewell County?
Total Male Population of Jewell County is 1,521.
What is the Total Female Population of Jewell County?
Total Female Population of Jewell County is 1,408.
What is the Ratio of Males per 100 Females in Jewell County?
There are 108.03 Males per 100 Females in Jewell County.
What is the Ratio of Females per 100 Males in Jewell County?
There are 92.57 Females per 100 Males in Jewell County.
What is the Median Population Age in Jewell County?
Median Population Age in Jewell County is 51.1 Years.
What is the Average Family Size in Jewell County
Average Family Size in Jewell County is 2.9 People.
What is the Average Household Size in Jewell County
Average Household Size in Jewell County is 2.3 People.
What is Per Capita Income in Jewell County?
Per Capita income in Jewell County is $32,759.
What is the Median Family Income in Jewell County?
Median Family Income in Jewell County is $66,161.
What is the Median Household income in Jewell County?
Median Household Income in Jewell County is $47,109.
What is Income or Wage Gap in Jewell County?
Income or Wage Gap in Jewell County is 29.7%.
Women in Jewell County earn 70.3 cents for every dollar earned by a man.
What is Inequality or Gini Index in Jewell County?
Inequality or Gini Index in Jewell County is 0.50.
How Large is the Labor Force in Jewell County?
There are 1,329 People in the Labor Forcein in Jewell County.
What is the Percentage of People in the Labor Force in Jewell County?
55.9% of People are in the Labor Force in Jewell County.
What is the Unemployment Rate in Jewell County?
Unemployment Rate in Jewell County is 1.5%.