Harvey County, KS
Harvey County Map
Harvey County Overview
33,959
TOTAL POPULATION
16,679
MALE POPULATION
17,280
FEMALE POPULATION
96.52
MALES / 100 FEMALES
103.60
FEMALES / 100 MALES
40.5
MEDIAN AGE
3.0
AVG FAMILY SIZE
2.5
AVG HOUSEHOLD SIZE
$33,965
PER CAPITA INCOME
$84,091
AVG FAMILY INCOME
$70,685
AVG HOUSEHOLD INCOME
37.0%
WAGE / INCOME GAP [ % ]
63.0¢/ $1
WAGE / INCOME GAP [ $ ]
$7,806
FAMILY INCOME DEFICIT
0.39
INEQUALITY / GINI INDEX
17,530
LABOR FORCE [ PEOPLE ]
65.9%
PERCENT IN LABOR FORCE
4.2%
UNEMPLOYMENT RATE
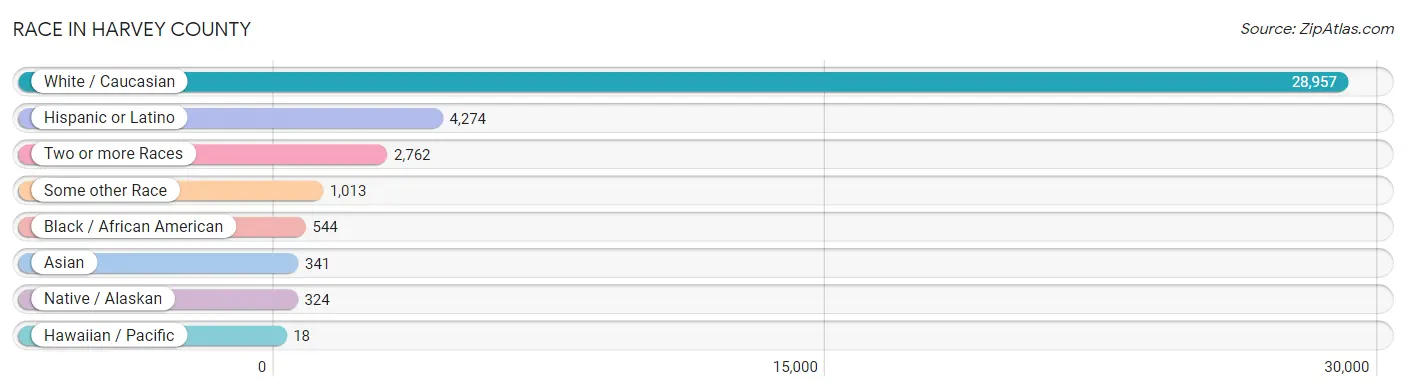
Race in Harvey County
The most populous races in Harvey County are White / Caucasian (28,957 | 85.3%), Hispanic or Latino (4,274 | 12.6%), and Two or more Races (2,762 | 8.1%).
| Race | # Population | % Population |
| Asian | 341 | 1.0% |
| Black / African American | 544 | 1.6% |
| Hawaiian / Pacific | 18 | 0.1% |
| Hispanic or Latino | 4,274 | 12.6% |
| Native / Alaskan | 324 | 0.9% |
| White / Caucasian | 28,957 | 85.3% |
| Two or more Races | 2,762 | 8.1% |
| Some other Race | 1,013 | 3.0% |
| Total | 33,959 | 100.0% |
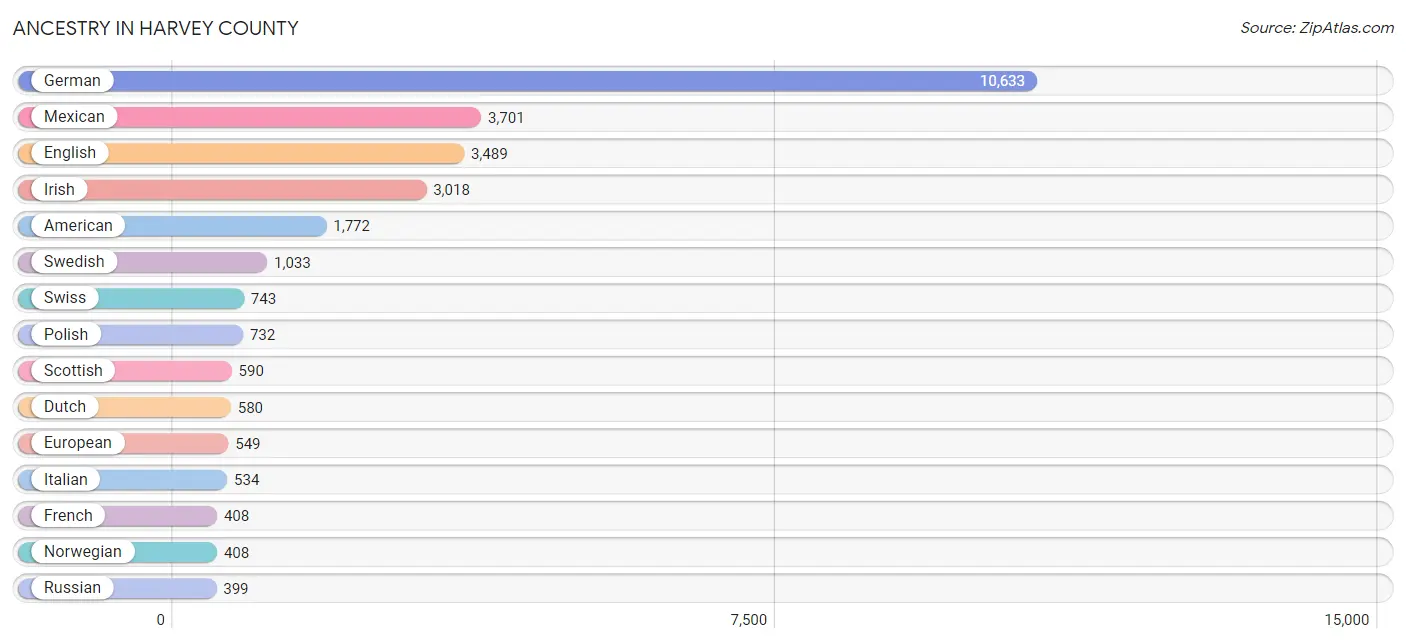
Ancestry in Harvey County
The most populous ancestries reported in Harvey County are German (10,633 | 31.3%), Mexican (3,701 | 10.9%), English (3,489 | 10.3%), Irish (3,018 | 8.9%), and American (1,772 | 5.2%), together accounting for 66.6% of all Harvey County residents.
| Ancestry | # Population | % Population |
| African | 9 | 0.0% |
| American | 1,772 | 5.2% |
| Apache | 4 | 0.0% |
| Arab | 13 | 0.0% |
| Argentinean | 61 | 0.2% |
| Austrian | 19 | 0.1% |
| Belgian | 15 | 0.0% |
| Bhutanese | 129 | 0.4% |
| Blackfeet | 6 | 0.0% |
| British | 110 | 0.3% |
| Cajun | 25 | 0.1% |
| Canadian | 59 | 0.2% |
| Central American | 177 | 0.5% |
| Central American Indian | 93 | 0.3% |
| Cherokee | 182 | 0.5% |
| Choctaw | 152 | 0.4% |
| Cuban | 56 | 0.2% |
| Cypriot | 5 | 0.0% |
| Czech | 172 | 0.5% |
| Czechoslovakian | 81 | 0.2% |
| Danish | 55 | 0.2% |
| Delaware | 10 | 0.0% |
| Dutch | 580 | 1.7% |
| Eastern European | 157 | 0.5% |
| Ecuadorian | 19 | 0.1% |
| English | 3,489 | 10.3% |
| Ethiopian | 20 | 0.1% |
| European | 549 | 1.6% |
| Finnish | 58 | 0.2% |
| French | 408 | 1.2% |
| French Canadian | 32 | 0.1% |
| German | 10,633 | 31.3% |
| German Russian | 24 | 0.1% |
| Greek | 27 | 0.1% |
| Guatemalan | 77 | 0.2% |
| Honduran | 9 | 0.0% |
| Hungarian | 13 | 0.0% |
| Indian (Asian) | 50 | 0.2% |
| Indonesian | 2 | 0.0% |
| Iranian | 11 | 0.0% |
| Irish | 3,018 | 8.9% |
| Italian | 534 | 1.6% |
| Japanese | 87 | 0.3% |
| Korean | 207 | 0.6% |
| Laotian | 9 | 0.0% |
| Latvian | 24 | 0.1% |
| Lebanese | 13 | 0.0% |
| Mexican | 3,701 | 10.9% |
| Mexican American Indian | 76 | 0.2% |
| Native Hawaiian | 18 | 0.1% |
| Navajo | 7 | 0.0% |
| Northern European | 112 | 0.3% |
| Norwegian | 408 | 1.2% |
| Pakistani | 113 | 0.3% |
| Panamanian | 19 | 0.1% |
| Pennsylvania German | 93 | 0.3% |
| Polish | 732 | 2.2% |
| Portuguese | 24 | 0.1% |
| Potawatomi | 26 | 0.1% |
| Puerto Rican | 84 | 0.3% |
| Russian | 399 | 1.2% |
| Salvadoran | 72 | 0.2% |
| Scandinavian | 64 | 0.2% |
| Scotch-Irish | 139 | 0.4% |
| Scottish | 590 | 1.7% |
| Sioux | 1 | 0.0% |
| Slavic | 3 | 0.0% |
| Slovak | 10 | 0.0% |
| Slovene | 10 | 0.0% |
| South American | 85 | 0.3% |
| Spaniard | 29 | 0.1% |
| Spanish | 66 | 0.2% |
| Sri Lankan | 119 | 0.4% |
| Subsaharan African | 34 | 0.1% |
| Swedish | 1,033 | 3.0% |
| Swiss | 743 | 2.2% |
| Thai | 3 | 0.0% |
| Ukrainian | 361 | 1.1% |
| Uruguayan | 5 | 0.0% |
| Ute | 10 | 0.0% |
| Welsh | 138 | 0.4% |
| West Indian | 3 | 0.0% | View All 82 Rows |
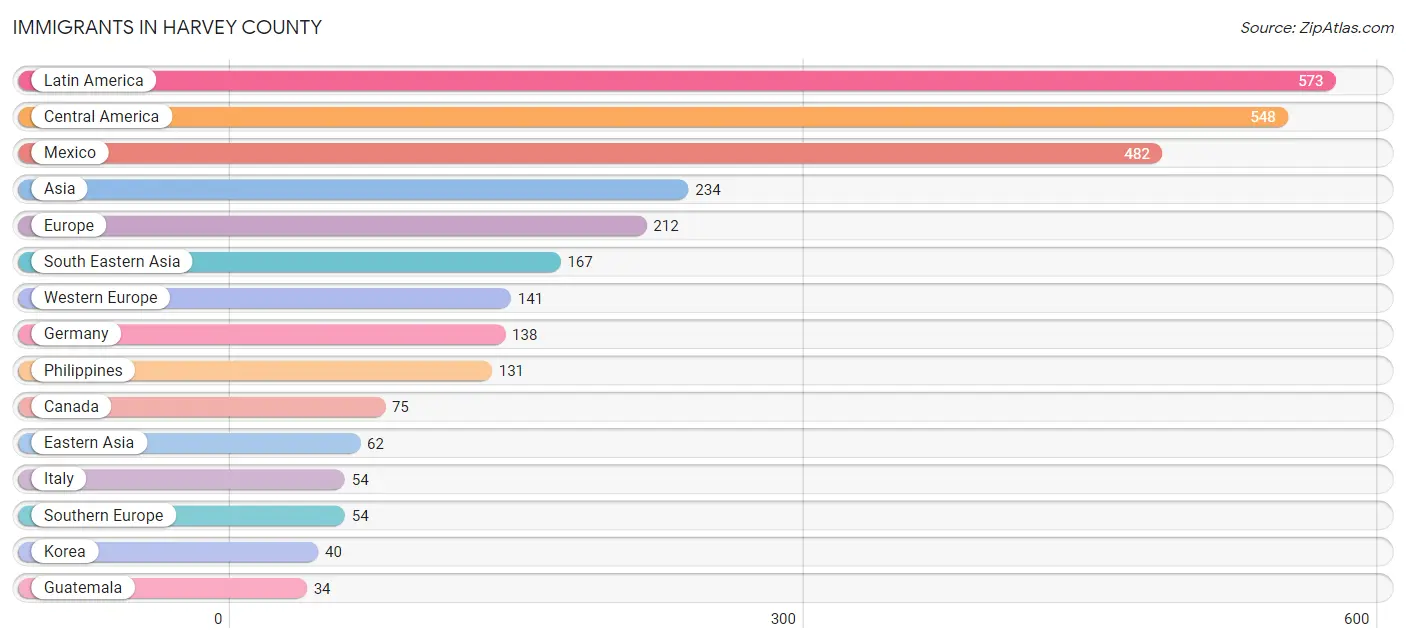
Immigrants in Harvey County
The most numerous immigrant groups reported in Harvey County came from Latin America (573 | 1.7%), Central America (548 | 1.6%), Mexico (482 | 1.4%), Asia (234 | 0.7%), and Europe (212 | 0.6%), together accounting for 6.0% of all Harvey County residents.
| Immigration Origin | # Population | % Population |
| Africa | 5 | 0.0% |
| Argentina | 1 | 0.0% |
| Asia | 234 | 0.7% |
| Cambodia | 24 | 0.1% |
| Canada | 75 | 0.2% |
| Central America | 548 | 1.6% |
| China | 13 | 0.0% |
| Czechoslovakia | 5 | 0.0% |
| Eastern Africa | 4 | 0.0% |
| Eastern Asia | 62 | 0.2% |
| Eastern Europe | 5 | 0.0% |
| Ecuador | 19 | 0.1% |
| El Salvador | 4 | 0.0% |
| England | 12 | 0.0% |
| Europe | 212 | 0.6% |
| Germany | 138 | 0.4% |
| Guatemala | 34 | 0.1% |
| Honduras | 9 | 0.0% |
| Indonesia | 12 | 0.0% |
| Italy | 54 | 0.2% |
| Japan | 9 | 0.0% |
| Korea | 40 | 0.1% |
| Latin America | 573 | 1.7% |
| Mexico | 482 | 1.4% |
| Netherlands | 3 | 0.0% |
| Northern Europe | 12 | 0.0% |
| Panama | 19 | 0.1% |
| Philippines | 131 | 0.4% |
| South America | 25 | 0.1% |
| South Eastern Asia | 167 | 0.5% |
| Southern Europe | 54 | 0.2% |
| Uruguay | 5 | 0.0% |
| Western Africa | 1 | 0.0% |
| Western Asia | 5 | 0.0% |
| Western Europe | 141 | 0.4% | View All 35 Rows |
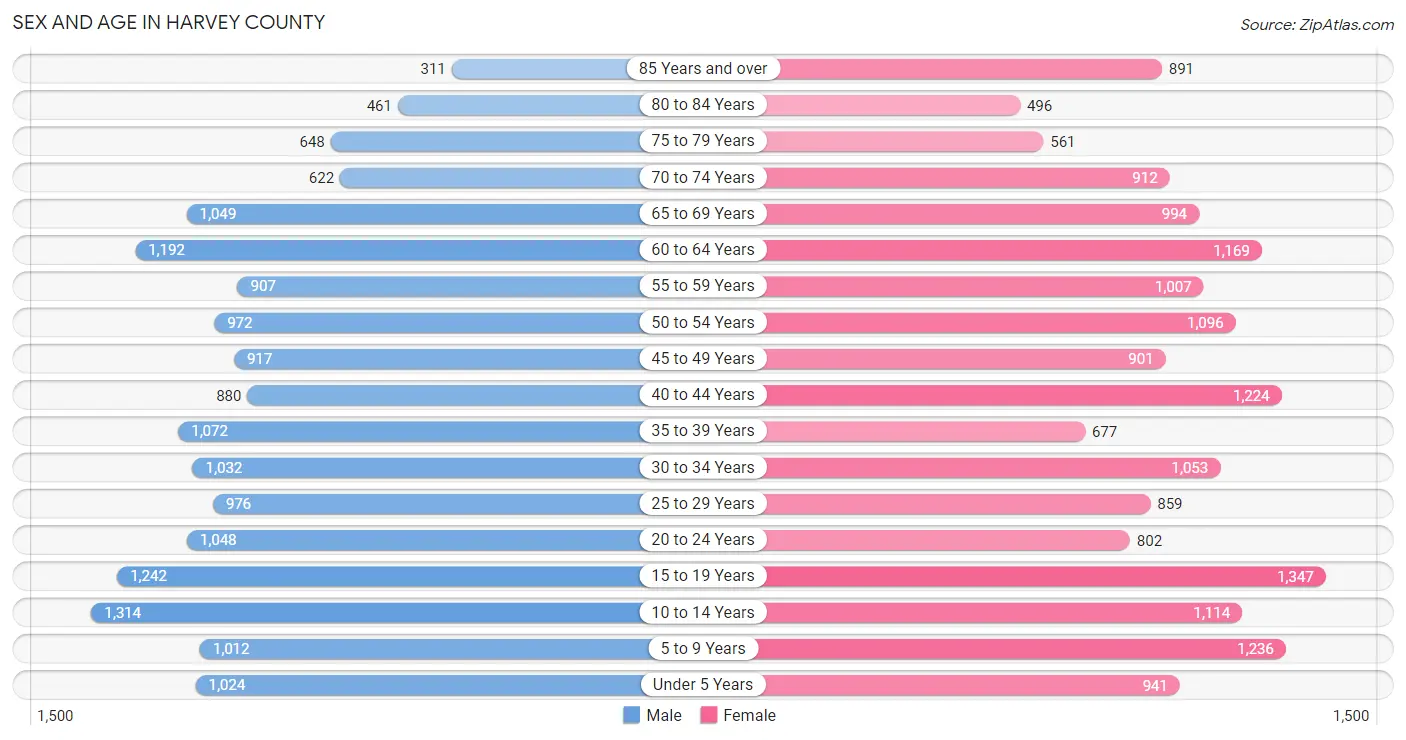
Sex and Age in Harvey County
Sex and Age in Harvey County
The most populous age groups in Harvey County are 10 to 14 Years (1,314 | 7.9%) for men and 15 to 19 Years (1,347 | 7.8%) for women.
| Age Bracket | Male | Female |
| Under 5 Years | 1,024 (6.1%) | 941 (5.4%) |
| 5 to 9 Years | 1,012 (6.1%) | 1,236 (7.1%) |
| 10 to 14 Years | 1,314 (7.9%) | 1,114 (6.5%) |
| 15 to 19 Years | 1,242 (7.4%) | 1,347 (7.8%) |
| 20 to 24 Years | 1,048 (6.3%) | 802 (4.6%) |
| 25 to 29 Years | 976 (5.9%) | 859 (5.0%) |
| 30 to 34 Years | 1,032 (6.2%) | 1,053 (6.1%) |
| 35 to 39 Years | 1,072 (6.4%) | 677 (3.9%) |
| 40 to 44 Years | 880 (5.3%) | 1,224 (7.1%) |
| 45 to 49 Years | 917 (5.5%) | 901 (5.2%) |
| 50 to 54 Years | 972 (5.8%) | 1,096 (6.3%) |
| 55 to 59 Years | 907 (5.4%) | 1,007 (5.8%) |
| 60 to 64 Years | 1,192 (7.1%) | 1,169 (6.8%) |
| 65 to 69 Years | 1,049 (6.3%) | 994 (5.8%) |
| 70 to 74 Years | 622 (3.7%) | 912 (5.3%) |
| 75 to 79 Years | 648 (3.9%) | 561 (3.3%) |
| 80 to 84 Years | 461 (2.8%) | 496 (2.9%) |
| 85 Years and over | 311 (1.9%) | 891 (5.2%) |
| Total | 16,679 (100.0%) | 17,280 (100.0%) |
Families and Households in Harvey County
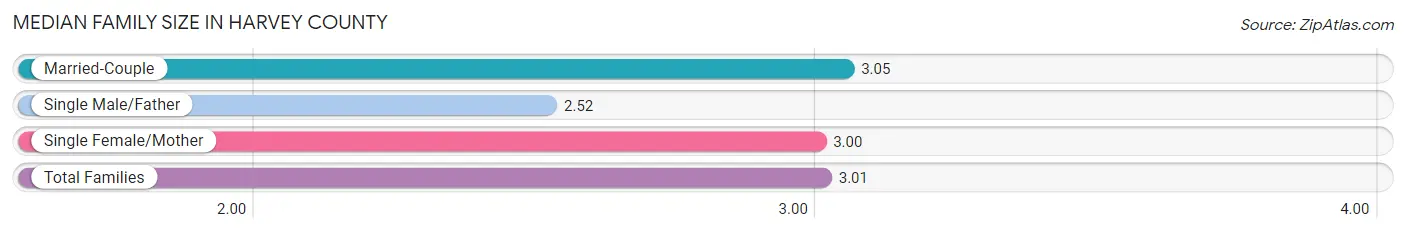
Median Family Size in Harvey County
The median family size in Harvey County is 3.01 persons per family, with married-couple families (7,041 | 78.9%) accounting for the largest median family size of 3.05 persons per family. On the other hand, single male/father families (582 | 6.5%) represent the smallest median family size with 2.52 persons per family.
| Family Type | # Families | Family Size |
| Married-Couple | 7,041 (78.9%) | 3.05 |
| Single Male/Father | 582 (6.5%) | 2.52 |
| Single Female/Mother | 1,301 (14.6%) | 3.00 |
| Total Families | 8,924 (100.0%) | 3.01 |
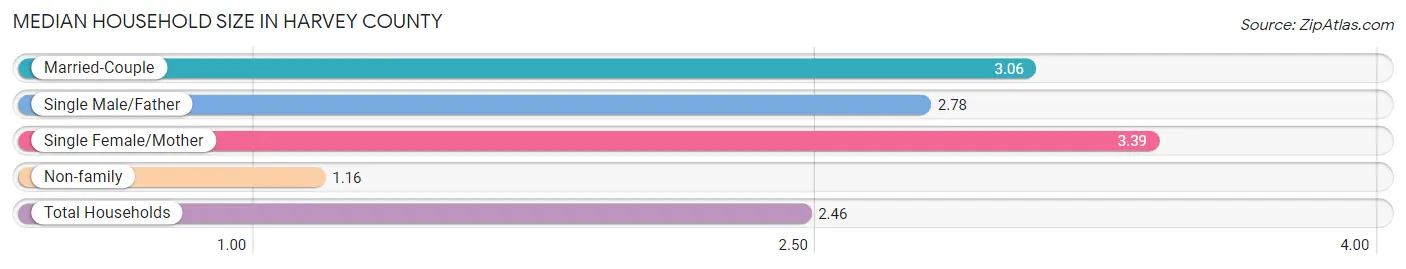
Median Household Size in Harvey County
The median household size in Harvey County is 2.46 persons per household, with single female/mother households (1,301 | 9.8%) accounting for the largest median household size of 3.39 persons per household. non-family households (4,322 | 32.6%) represent the smallest median household size with 1.16 persons per household.
| Household Type | # Households | Household Size |
| Married-Couple | 7,041 (53.2%) | 3.06 |
| Single Male/Father | 582 (4.4%) | 2.78 |
| Single Female/Mother | 1,301 (9.8%) | 3.39 |
| Non-family | 4,322 (32.6%) | 1.16 |
| Total Households | 13,246 (100.0%) | 2.46 |
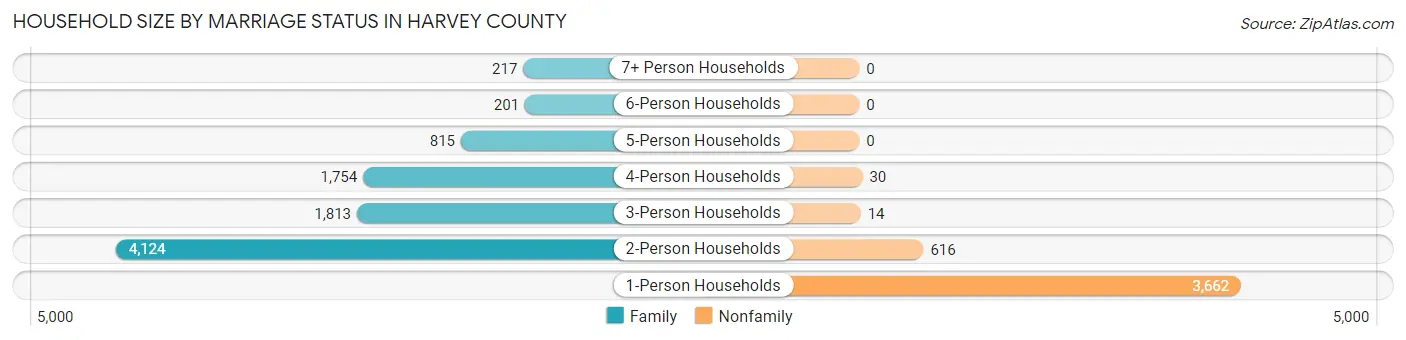
Household Size by Marriage Status in Harvey County
Out of a total of 13,246 households in Harvey County, 8,924 (67.4%) are family households, while 4,322 (32.6%) are nonfamily households. The most numerous type of family households are 2-person households, comprising 4,124, and the most common type of nonfamily households are 1-person households, comprising 3,662.
| Household Size | Family Households | Nonfamily Households |
| 1-Person Households | - | 3,662 (27.7%) |
| 2-Person Households | 4,124 (31.1%) | 616 (4.6%) |
| 3-Person Households | 1,813 (13.7%) | 14 (0.1%) |
| 4-Person Households | 1,754 (13.2%) | 30 (0.2%) |
| 5-Person Households | 815 (6.1%) | 0 (0.0%) |
| 6-Person Households | 201 (1.5%) | 0 (0.0%) |
| 7+ Person Households | 217 (1.6%) | 0 (0.0%) |
| Total | 8,924 (67.4%) | 4,322 (32.6%) |
Female Fertility in Harvey County
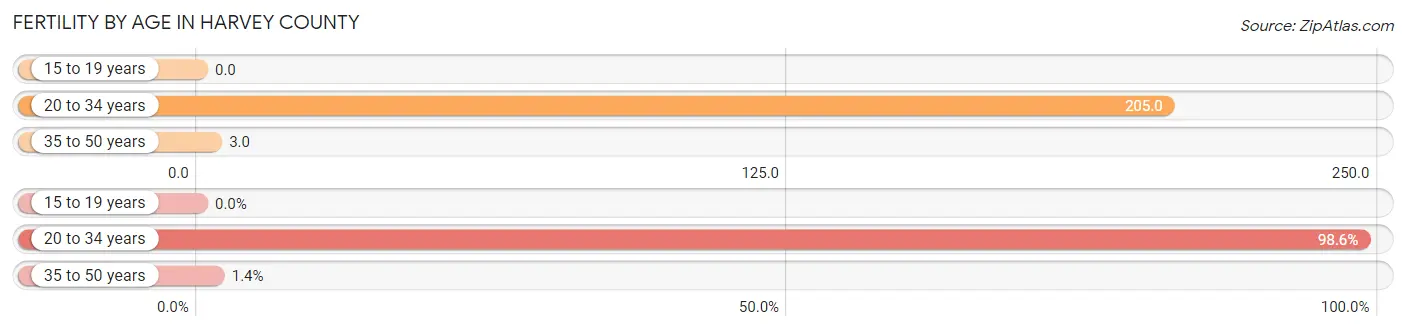
Fertility by Age in Harvey County
Average fertility rate in Harvey County is 80.0 births per 1,000 women. Women in the age bracket of 20 to 34 years have the highest fertility rate with 205.0 births per 1,000 women. Women in the age bracket of 20 to 34 years acount for 98.6% of all women with births.
| Age Bracket | Women with Births | Births / 1,000 Women |
| 15 to 19 years | 0 (0.0%) | 0.0 |
| 20 to 34 years | 556 (98.6%) | 205.0 |
| 35 to 50 years | 8 (1.4%) | 3.0 |
| Total | 564 (100.0%) | 80.0 |
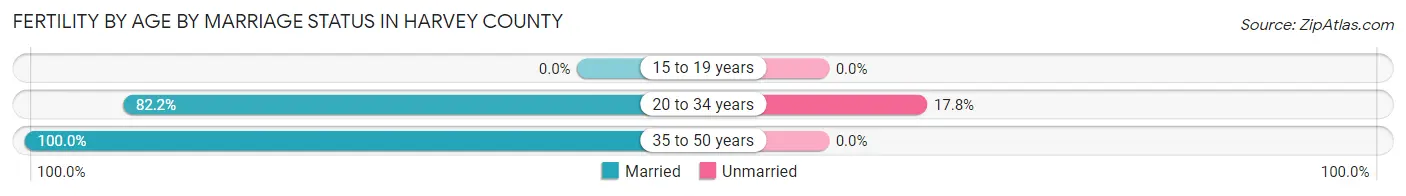
Fertility by Age by Marriage Status in Harvey County
82.4% of women with births (564) in Harvey County are married. The highest percentage of unmarried women with births falls into 20 to 34 years age bracket with 17.8% of them unmarried at the time of birth, while the lowest percentage of unmarried women with births belong to 35 to 50 years age bracket with 0.0% of them unmarried.
| Age Bracket | Married | Unmarried |
| 15 to 19 years | 0 (0.0%) | 0 (0.0%) |
| 20 to 34 years | 457 (82.2%) | 99 (17.8%) |
| 35 to 50 years | 8 (100.0%) | 0 (0.0%) |
| Total | 465 (82.5%) | 99 (17.5%) |
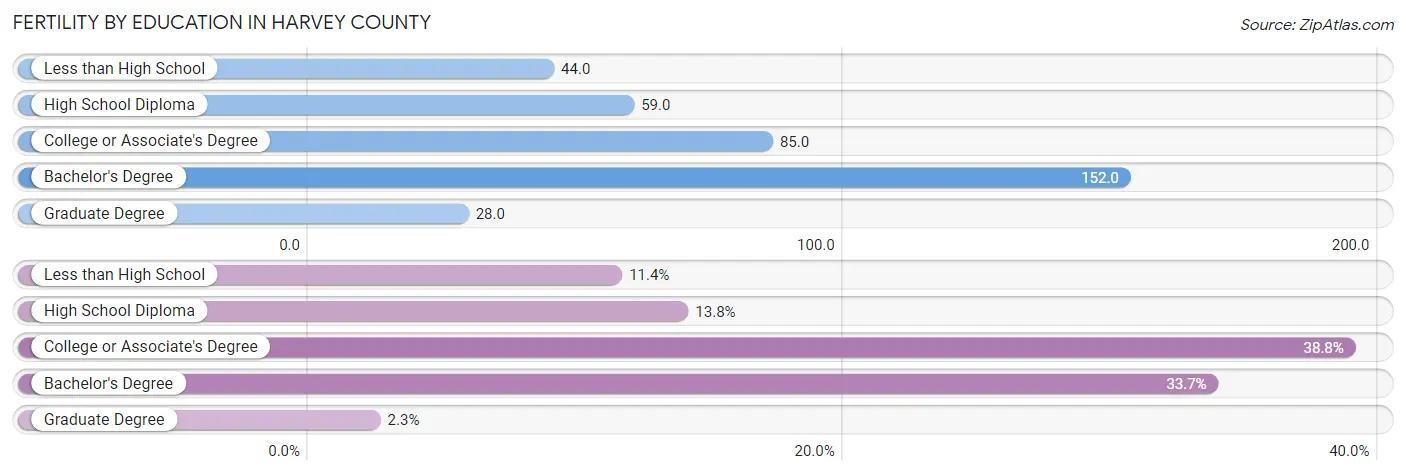
Fertility by Education in Harvey County
Average fertility rate in Harvey County is 80.0 births per 1,000 women. Women with the education attainment of bachelor's degree have the highest fertility rate of 152.0 births per 1,000 women, while women with the education attainment of graduate degree have the lowest fertility at 28.0 births per 1,000 women. Women with the education attainment of college or associate's degree represent 38.8% of all women with births.
| Educational Attainment | Women with Births | Births / 1,000 Women |
| Less than High School | 64 (11.4%) | 44.0 |
| High School Diploma | 78 (13.8%) | 59.0 |
| College or Associate's Degree | 219 (38.8%) | 85.0 |
| Bachelor's Degree | 190 (33.7%) | 152.0 |
| Graduate Degree | 13 (2.3%) | 28.0 |
| Total | 564 (100.0%) | 80.0 |
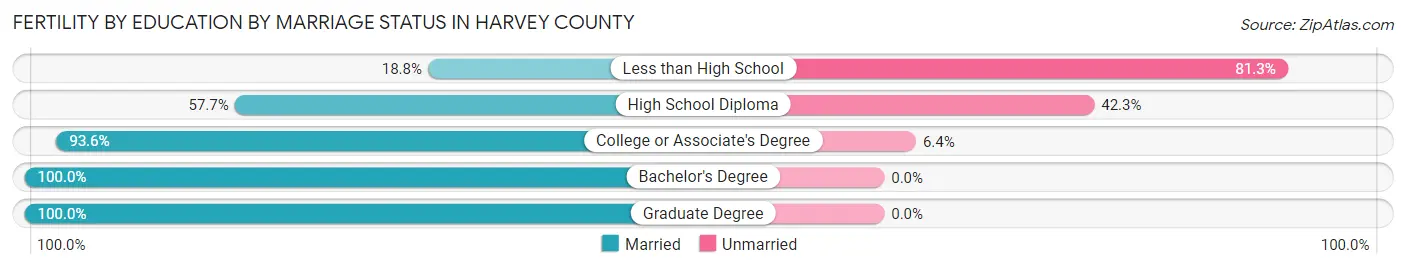
Fertility by Education by Marriage Status in Harvey County
17.5% of women with births in Harvey County are unmarried. Women with the educational attainment of bachelor's degree are most likely to be married with 100.0% of them married at childbirth, while women with the educational attainment of less than high school are least likely to be married with 81.2% of them unmarried at childbirth.
| Educational Attainment | Married | Unmarried |
| Less than High School | 12 (18.8%) | 52 (81.2%) |
| High School Diploma | 45 (57.7%) | 33 (42.3%) |
| College or Associate's Degree | 205 (93.6%) | 14 (6.4%) |
| Bachelor's Degree | 190 (100.0%) | 0 (0.0%) |
| Graduate Degree | 13 (100.0%) | 0 (0.0%) |
| Total | 465 (82.5%) | 99 (17.5%) |
Income in Harvey County
Income Overview in Harvey County
Per Capita Income in Harvey County is $33,965, while median incomes of families and households are $84,091 and $70,685 respectively.
| Characteristic | Number | Measure |
| Per Capita Income | 33,959 | $33,965 |
| Median Family Income | 8,924 | $84,091 |
| Mean Family Income | 8,924 | $100,605 |
| Median Household Income | 13,246 | $70,685 |
| Mean Household Income | 13,246 | $84,841 |
| Income Deficit | 8,924 | $7,806 |
| Wage / Income Gap (%) | 33,959 | 36.97% |
| Wage / Income Gap ($) | 33,959 | 63.03¢ per $1 |
| Gini / Inequality Index | 33,959 | 0.39 |
Earnings by Sex in Harvey County
Average Earnings in Harvey County are $37,693, $47,240 for men and $29,777 for women, a difference of 37.0%.
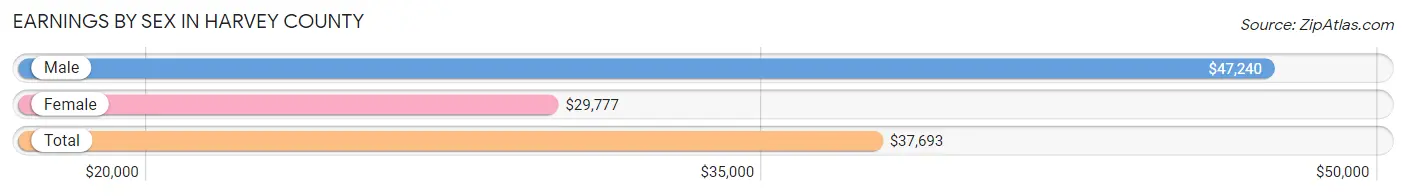
| Sex | Number | Average Earnings |
| Male | 9,640 (52.6%) | $47,240 |
| Female | 8,696 (47.4%) | $29,777 |
| Total | 18,336 (100.0%) | $37,693 |
Earnings by Sex by Income Bracket in Harvey County
The most common earnings brackets in Harvey County are $55,000 to $64,999 for men (1,305 | 13.5%) and $2,499 or less for women (892 | 10.3%).
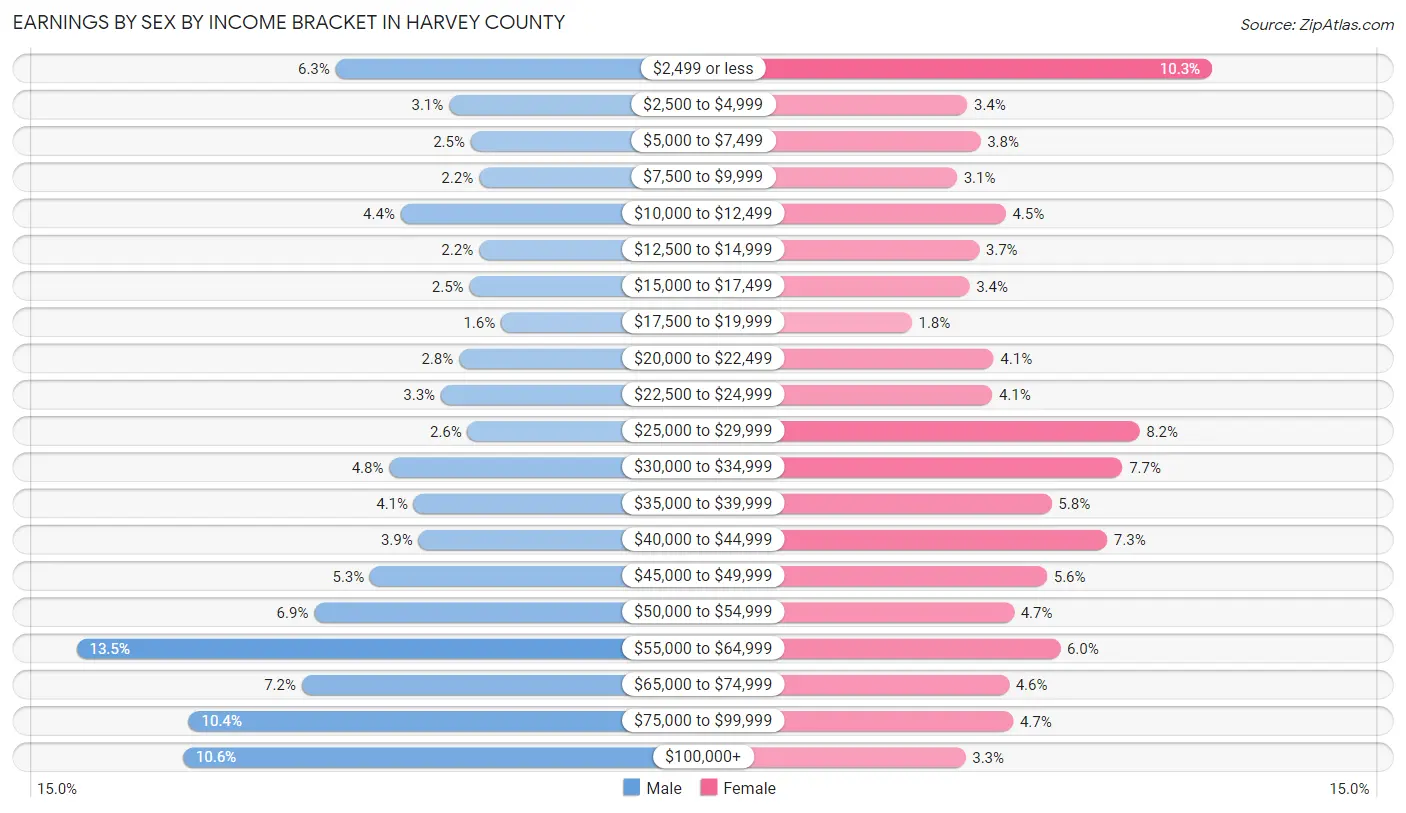
| Income | Male | Female |
| $2,499 or less | 603 (6.3%) | 892 (10.3%) |
| $2,500 to $4,999 | 296 (3.1%) | 294 (3.4%) |
| $5,000 to $7,499 | 237 (2.5%) | 326 (3.7%) |
| $7,500 to $9,999 | 215 (2.2%) | 269 (3.1%) |
| $10,000 to $12,499 | 427 (4.4%) | 388 (4.5%) |
| $12,500 to $14,999 | 215 (2.2%) | 323 (3.7%) |
| $15,000 to $17,499 | 241 (2.5%) | 299 (3.4%) |
| $17,500 to $19,999 | 155 (1.6%) | 158 (1.8%) |
| $20,000 to $22,499 | 269 (2.8%) | 358 (4.1%) |
| $22,500 to $24,999 | 318 (3.3%) | 355 (4.1%) |
| $25,000 to $29,999 | 246 (2.5%) | 715 (8.2%) |
| $30,000 to $34,999 | 458 (4.8%) | 673 (7.7%) |
| $35,000 to $39,999 | 391 (4.1%) | 500 (5.8%) |
| $40,000 to $44,999 | 379 (3.9%) | 636 (7.3%) |
| $45,000 to $49,999 | 510 (5.3%) | 489 (5.6%) |
| $50,000 to $54,999 | 661 (6.9%) | 408 (4.7%) |
| $55,000 to $64,999 | 1,305 (13.5%) | 521 (6.0%) |
| $65,000 to $74,999 | 695 (7.2%) | 396 (4.5%) |
| $75,000 to $99,999 | 1,002 (10.4%) | 406 (4.7%) |
| $100,000+ | 1,017 (10.5%) | 290 (3.3%) |
| Total | 9,640 (100.0%) | 8,696 (100.0%) |
Earnings by Sex by Educational Attainment in Harvey County
Average earnings in Harvey County are $54,062 for men and $34,289 for women, a difference of 36.6%. Men with an educational attainment of graduate degree enjoy the highest average annual earnings of $80,208, while those with less than high school education earn the least with $30,765. Women with an educational attainment of graduate degree earn the most with the average annual earnings of $59,055, while those with less than high school education have the smallest earnings of $23,598.
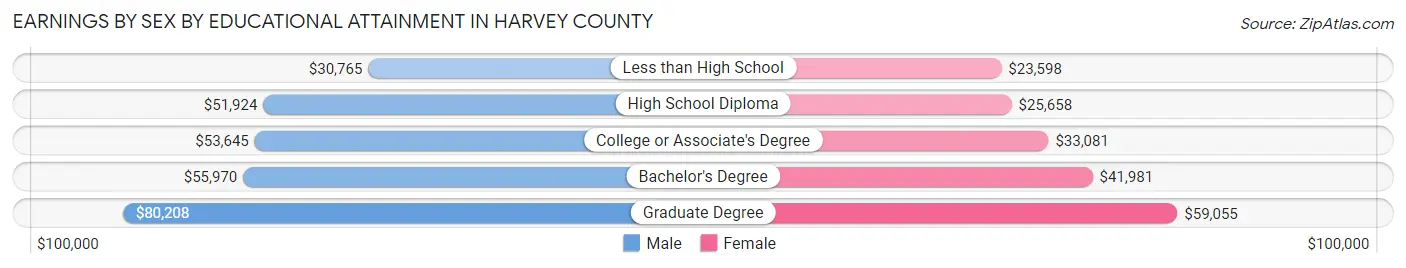
| Educational Attainment | Male Income | Female Income |
| Less than High School | $30,765 | $23,598 |
| High School Diploma | $51,924 | $25,658 |
| College or Associate's Degree | $53,645 | $33,081 |
| Bachelor's Degree | $55,970 | $41,981 |
| Graduate Degree | $80,208 | $59,055 |
| Total | $54,062 | $34,289 |
Family Income in Harvey County
Family Income Brackets in Harvey County
According to the Harvey County family income data, there are 2,195 families falling into the $100,000 to $149,999 income range, which is the most common income bracket and makes up 24.6% of all families. Conversely, the $10,000 to $14,999 income bracket is the least frequent group with only 107 families (1.2%) belonging to this category.
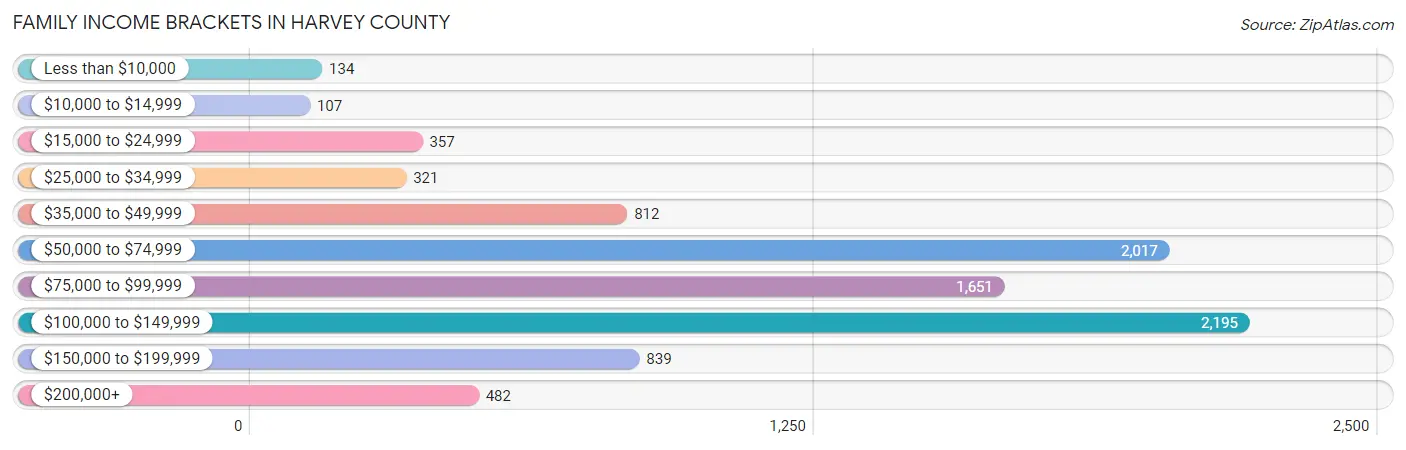
| Income Bracket | # Families | % Families |
| Less than $10,000 | 134 | 1.5% |
| $10,000 to $14,999 | 107 | 1.2% |
| $15,000 to $24,999 | 357 | 4.0% |
| $25,000 to $34,999 | 321 | 3.6% |
| $35,000 to $49,999 | 812 | 9.1% |
| $50,000 to $74,999 | 2,017 | 22.6% |
| $75,000 to $99,999 | 1,651 | 18.5% |
| $100,000 to $149,999 | 2,195 | 24.6% |
| $150,000 to $199,999 | 839 | 9.4% |
| $200,000+ | 482 | 5.4% |
Family Income by Famaliy Size in Harvey County
5-person families (712 | 8.0%) account for the highest median family income in Harvey County with $104,188 per family, while 2-person families (4,347 | 48.7%) have the highest median income of $39,341 per family member.
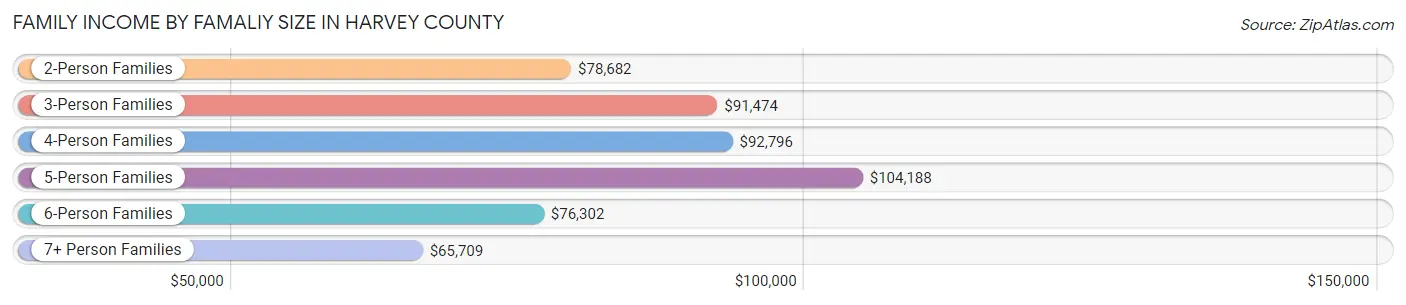
| Income Bracket | # Families | Median Income |
| 2-Person Families | 4,347 (48.7%) | $78,682 |
| 3-Person Families | 1,764 (19.8%) | $91,474 |
| 4-Person Families | 1,733 (19.4%) | $92,796 |
| 5-Person Families | 712 (8.0%) | $104,188 |
| 6-Person Families | 151 (1.7%) | $76,302 |
| 7+ Person Families | 217 (2.4%) | $65,709 |
| Total | 8,924 (100.0%) | $84,091 |
Family Income by Number of Earners in Harvey County
The median family income in Harvey County is $84,091, with families comprising 3+ earners (965) having the highest median family income of $120,436, while families with 1 earner (2,644) have the lowest median family income of $63,894, accounting for 10.8% and 29.6% of families, respectively.
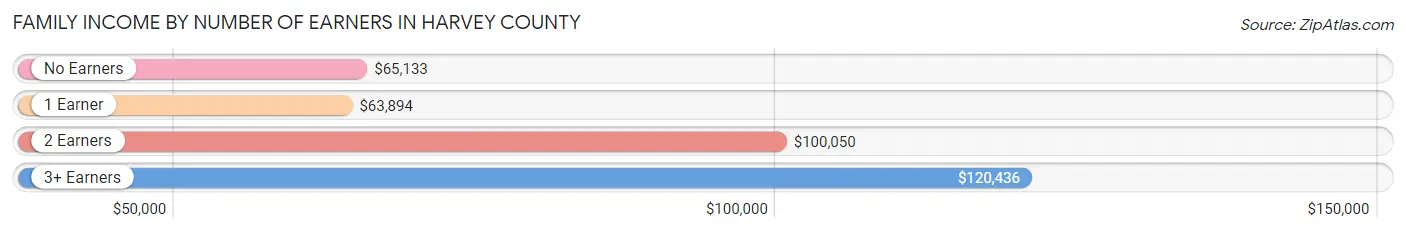
| Number of Earners | # Families | Median Income |
| No Earners | 1,125 (12.6%) | $65,133 |
| 1 Earner | 2,644 (29.6%) | $63,894 |
| 2 Earners | 4,190 (46.9%) | $100,050 |
| 3+ Earners | 965 (10.8%) | $120,436 |
| Total | 8,924 (100.0%) | $84,091 |
Household Income in Harvey County
Household Income Brackets in Harvey County
With 2,848 households falling in the category, the $50,000 to $74,999 income range is the most frequent in Harvey County, accounting for 21.5% of all households. In contrast, only 371 households (2.8%) fall into the less than $10,000 income bracket, making it the least populous group.
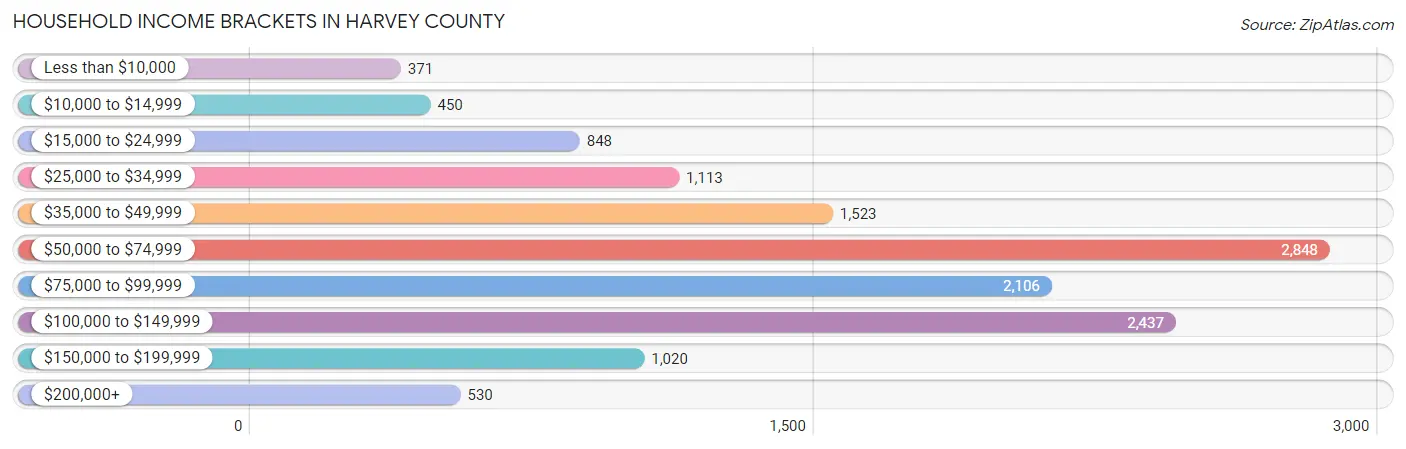
| Income Bracket | # Households | % Households |
| Less than $10,000 | 371 | 2.8% |
| $10,000 to $14,999 | 450 | 3.4% |
| $15,000 to $24,999 | 848 | 6.4% |
| $25,000 to $34,999 | 1,113 | 8.4% |
| $35,000 to $49,999 | 1,523 | 11.5% |
| $50,000 to $74,999 | 2,848 | 21.5% |
| $75,000 to $99,999 | 2,106 | 15.9% |
| $100,000 to $149,999 | 2,437 | 18.4% |
| $150,000 to $199,999 | 1,020 | 7.7% |
| $200,000+ | 530 | 4.0% |
Household Income by Householder Age in Harvey County
The median household income in Harvey County is $70,685, with the highest median household income of $81,642 found in the 45 to 64 years age bracket for the primary householder. A total of 4,425 households (33.4%) fall into this category. Meanwhile, the 65+ years age bracket for the primary householder has the lowest median household income of $51,790, with 4,317 households (32.6%) in this group.
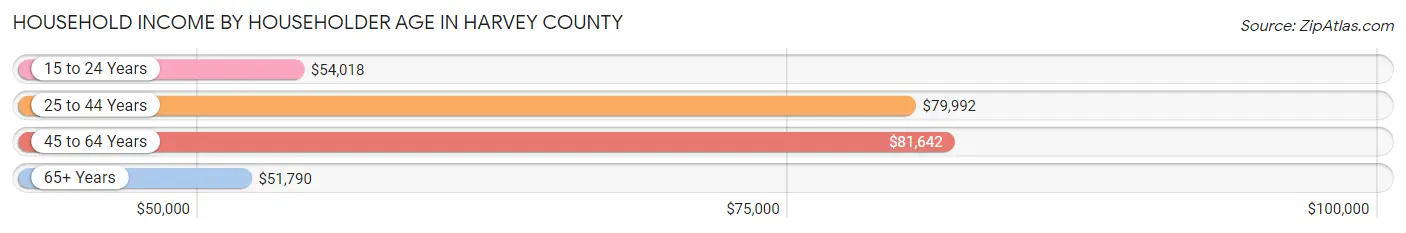
| Income Bracket | # Households | Median Income |
| 15 to 24 Years | 657 (5.0%) | $54,018 |
| 25 to 44 Years | 3,847 (29.0%) | $79,992 |
| 45 to 64 Years | 4,425 (33.4%) | $81,642 |
| 65+ Years | 4,317 (32.6%) | $51,790 |
| Total | 13,246 (100.0%) | $70,685 |
Poverty in Harvey County
Income Below Poverty by Sex and Age in Harvey County
With 7.3% poverty level for males and 12.0% for females among the residents of Harvey County, under 5 year old males and 15 year old females are the most vulnerable to poverty, with 171 males (16.8%) and 143 females (42.7%) in their respective age groups living below the poverty level.
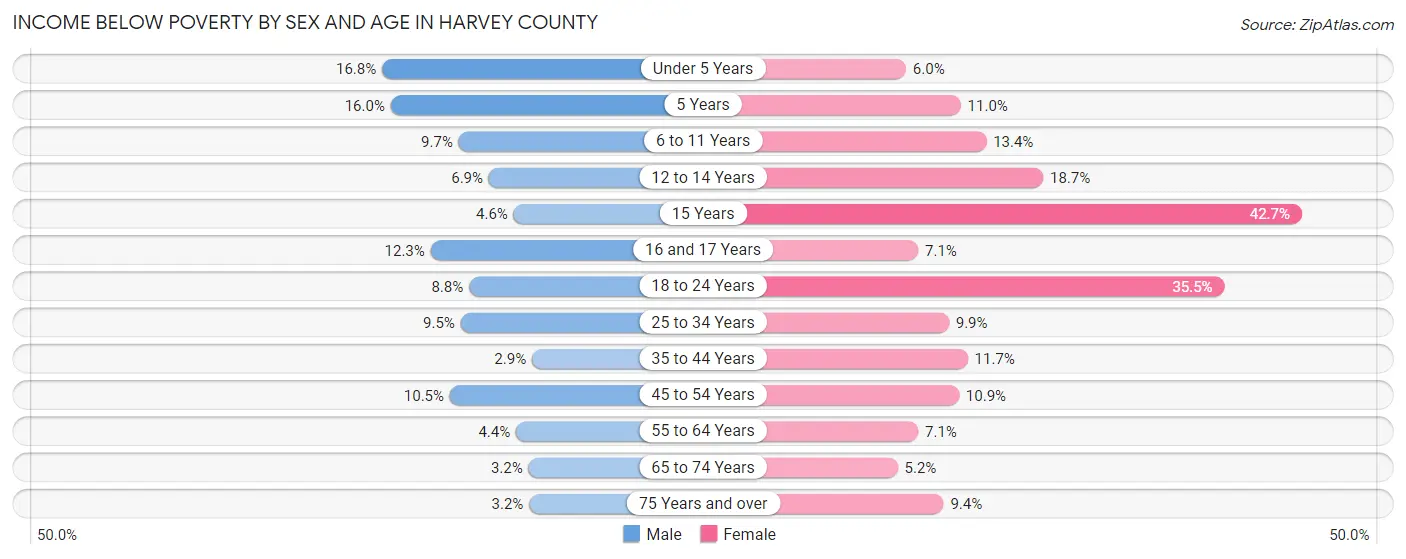
| Age Bracket | Male | Female |
| Under 5 Years | 171 (16.8%) | 56 (5.9%) |
| 5 Years | 37 (16.0%) | 32 (11.0%) |
| 6 to 11 Years | 106 (9.7%) | 169 (13.4%) |
| 12 to 14 Years | 67 (6.9%) | 144 (18.7%) |
| 15 Years | 17 (4.6%) | 143 (42.7%) |
| 16 and 17 Years | 34 (12.3%) | 33 (7.1%) |
| 18 to 24 Years | 114 (8.7%) | 380 (35.5%) |
| 25 to 34 Years | 191 (9.5%) | 188 (9.9%) |
| 35 to 44 Years | 56 (2.9%) | 222 (11.7%) |
| 45 to 54 Years | 194 (10.5%) | 217 (10.9%) |
| 55 to 64 Years | 92 (4.4%) | 153 (7.1%) |
| 65 to 74 Years | 53 (3.2%) | 97 (5.2%) |
| 75 Years and over | 40 (3.2%) | 157 (9.4%) |
| Total | 1,172 (7.3%) | 1,991 (12.0%) |
Income Above Poverty by Sex and Age in Harvey County
According to the poverty statistics in Harvey County, males aged 35 to 44 years and females aged 65 to 74 years are the age groups that are most secure financially, with 97.1% of males and 94.8% of females in these age groups living above the poverty line.
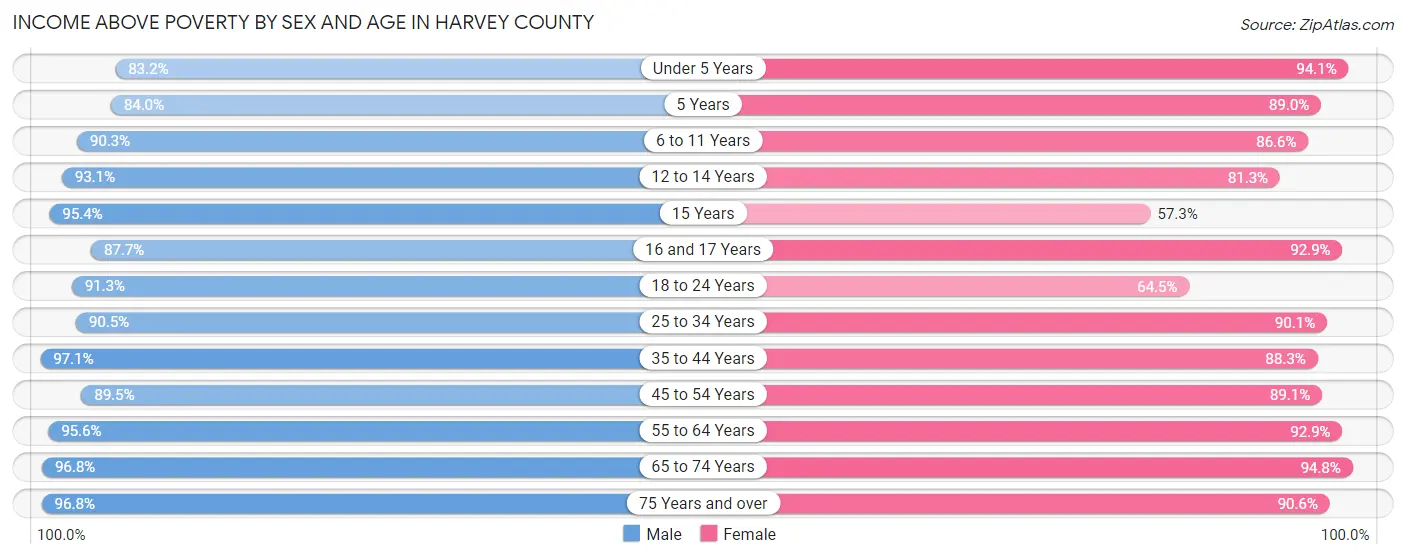
| Age Bracket | Male | Female |
| Under 5 Years | 845 (83.2%) | 885 (94.1%) |
| 5 Years | 194 (84.0%) | 258 (89.0%) |
| 6 to 11 Years | 986 (90.3%) | 1,092 (86.6%) |
| 12 to 14 Years | 903 (93.1%) | 627 (81.3%) |
| 15 Years | 352 (95.4%) | 192 (57.3%) |
| 16 and 17 Years | 242 (87.7%) | 433 (92.9%) |
| 18 to 24 Years | 1,189 (91.2%) | 690 (64.5%) |
| 25 to 34 Years | 1,813 (90.5%) | 1,705 (90.1%) |
| 35 to 44 Years | 1,866 (97.1%) | 1,679 (88.3%) |
| 45 to 54 Years | 1,648 (89.5%) | 1,780 (89.1%) |
| 55 to 64 Years | 2,003 (95.6%) | 2,008 (92.9%) |
| 65 to 74 Years | 1,587 (96.8%) | 1,777 (94.8%) |
| 75 Years and over | 1,222 (96.8%) | 1,506 (90.6%) |
| Total | 14,850 (92.7%) | 14,632 (88.0%) |
Income Below Poverty Among Married-Couple Families in Harvey County
The poverty statistics for married-couple families in Harvey County show that 2.4% or 168 of the total 7,041 families live below the poverty line. Families with 5 or more children have the highest poverty rate of 26.2%, comprising of 45 families. On the other hand, families with 3 or 4 children have the lowest poverty rate of 1.3%, which includes 8 families.
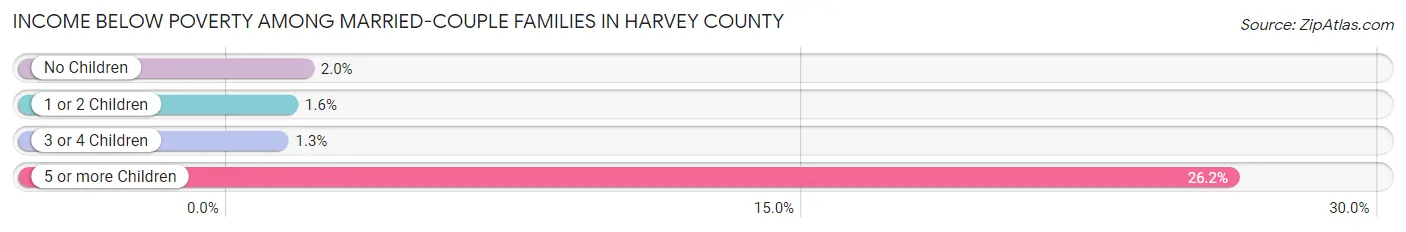
| Children | Above Poverty | Below Poverty |
| No Children | 4,009 (98.0%) | 81 (2.0%) |
| 1 or 2 Children | 2,138 (98.4%) | 34 (1.6%) |
| 3 or 4 Children | 599 (98.7%) | 8 (1.3%) |
| 5 or more Children | 127 (73.8%) | 45 (26.2%) |
| Total | 6,873 (97.6%) | 168 (2.4%) |
Income Below Poverty Among Single-Parent Households in Harvey County
According to the poverty data in Harvey County, 10.6% or 62 single-father households and 24.7% or 322 single-mother households are living below the poverty line. Among single-father households, those with 1 or 2 children have the highest poverty rate, with 48 households (18.8%) experiencing poverty. Likewise, among single-mother households, those with 1 or 2 children have the highest poverty rate, with 235 households (30.6%) falling below the poverty line.
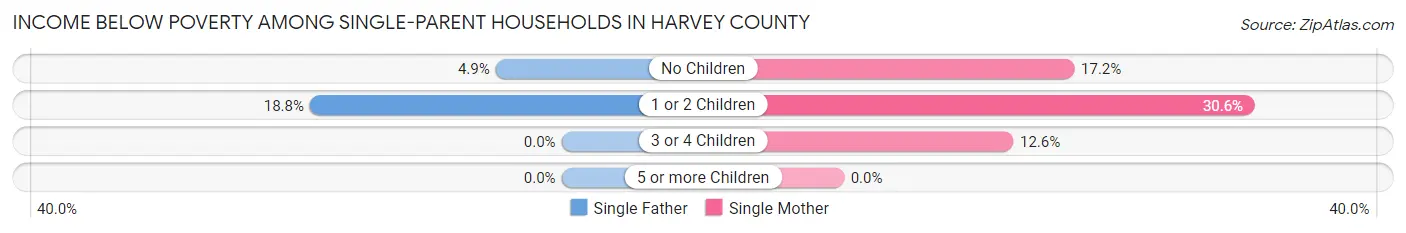
| Children | Single Father | Single Mother |
| No Children | 14 (4.9%) | 74 (17.2%) |
| 1 or 2 Children | 48 (18.8%) | 235 (30.6%) |
| 3 or 4 Children | 0 (0.0%) | 13 (12.6%) |
| 5 or more Children | 0 (0.0%) | 0 (0.0%) |
| Total | 62 (10.6%) | 322 (24.7%) |
Income Below Poverty Among Married-Couple vs Single-Parent Households in Harvey County
The poverty data for Harvey County shows that 168 of the married-couple family households (2.4%) and 384 of the single-parent households (20.4%) are living below the poverty level. Within the married-couple family households, those with 5 or more children have the highest poverty rate, with 45 households (26.2%) falling below the poverty line. Among the single-parent households, those with 1 or 2 children have the highest poverty rate, with 283 household (27.7%) living below poverty.
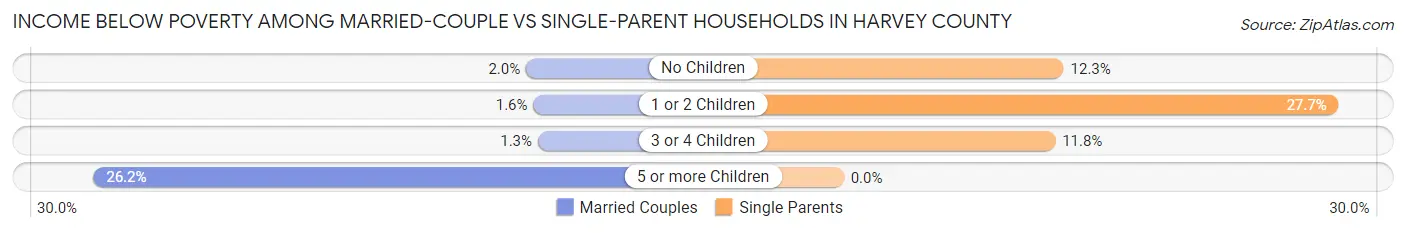
| Children | Married-Couple Families | Single-Parent Households |
| No Children | 81 (2.0%) | 88 (12.3%) |
| 1 or 2 Children | 34 (1.6%) | 283 (27.7%) |
| 3 or 4 Children | 8 (1.3%) | 13 (11.8%) |
| 5 or more Children | 45 (26.2%) | 0 (0.0%) |
| Total | 168 (2.4%) | 384 (20.4%) |
Employment Characteristics in Harvey County
Employment by Class of Employer in Harvey County
Among the 16,396 employed individuals in Harvey County, private company employees (10,266 | 62.6%), not-for-profit organizations (2,276 | 13.9%), and local government employees (1,324 | 8.1%) make up the most common classes of employment.
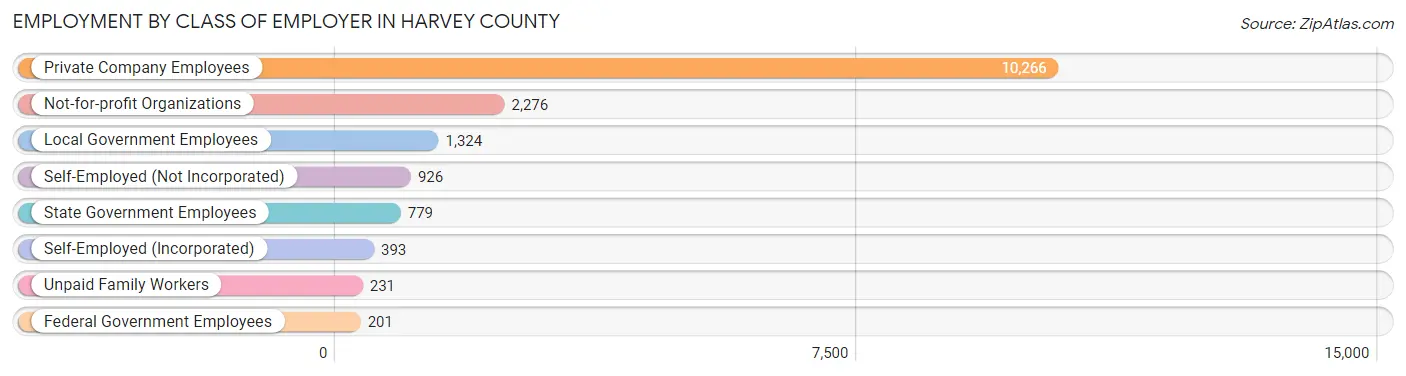
| Employer Class | # Employees | % Employees |
| Private Company Employees | 10,266 | 62.6% |
| Self-Employed (Incorporated) | 393 | 2.4% |
| Self-Employed (Not Incorporated) | 926 | 5.7% |
| Not-for-profit Organizations | 2,276 | 13.9% |
| Local Government Employees | 1,324 | 8.1% |
| State Government Employees | 779 | 4.8% |
| Federal Government Employees | 201 | 1.2% |
| Unpaid Family Workers | 231 | 1.4% |
| Total | 16,396 | 100.0% |
Employment Status by Age in Harvey County
According to the labor force statistics for Harvey County, out of the total population over 16 years of age (26,601), 65.9% or 17,530 individuals are in the labor force, with 4.2% or 736 of them unemployed. The age group with the highest labor force participation rate is 25 to 29 years, with 91.9% or 1,686 individuals in the labor force. Within the labor force, the 30 to 34 years age range has the highest percentage of unemployed individuals, with 11.0% or 207 of them being unemployed.
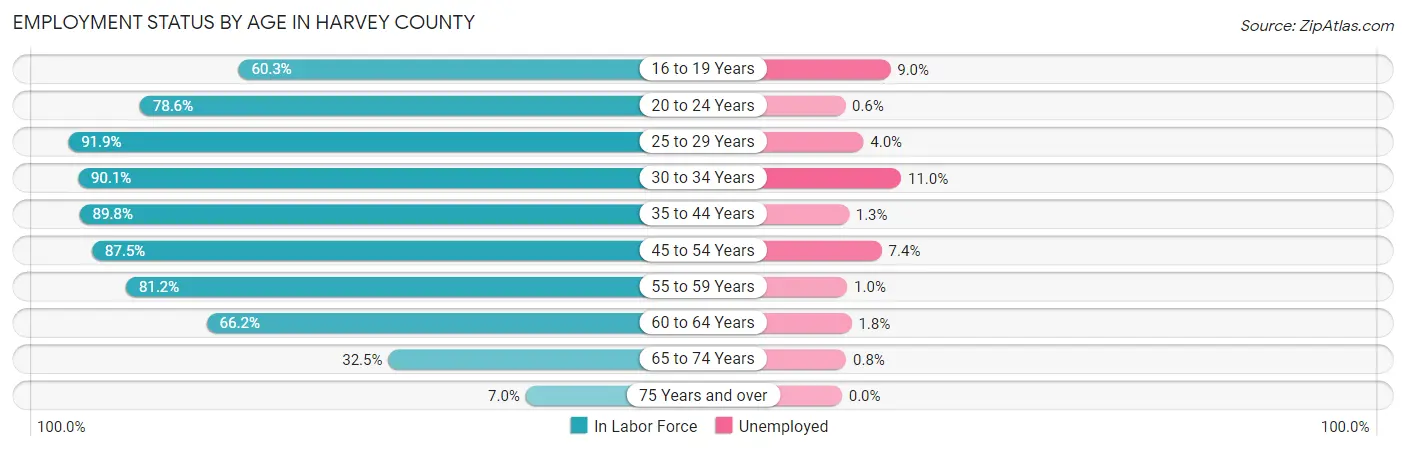
| Age Bracket | In Labor Force | Unemployed |
| 16 to 19 Years | 1,129 (60.3%) | 102 (9.0%) |
| 20 to 24 Years | 1,454 (78.6%) | 9 (0.6%) |
| 25 to 29 Years | 1,686 (91.9%) | 67 (4.0%) |
| 30 to 34 Years | 1,879 (90.1%) | 207 (11.0%) |
| 35 to 44 Years | 3,460 (89.8%) | 45 (1.3%) |
| 45 to 54 Years | 3,400 (87.5%) | 252 (7.4%) |
| 55 to 59 Years | 1,554 (81.2%) | 16 (1.0%) |
| 60 to 64 Years | 1,563 (66.2%) | 28 (1.8%) |
| 65 to 74 Years | 1,163 (32.5%) | 9 (0.8%) |
| 75 Years and over | 236 (7.0%) | 0 (0.0%) |
| Total | 17,530 (65.9%) | 736 (4.2%) |
Employment Status by Educational Attainment in Harvey County
According to labor force statistics for Harvey County, 85.0% of individuals (13,544) out of the total population between 25 and 64 years of age (15,934) are in the labor force, with 4.6% or 623 of them being unemployed. The group with the highest labor force participation rate are those with the educational attainment of college / associate degree, with 88.3% or 5,213 individuals in the labor force. Within the labor force, individuals with high school diploma education have the highest percentage of unemployment, with 11.4% or 379 of them being unemployed.
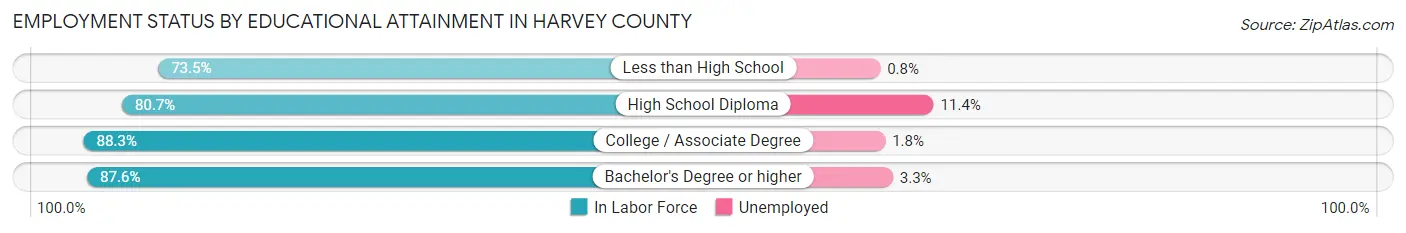
| Educational Attainment | In Labor Force | Unemployed |
| Less than High School | 896 (73.5%) | 10 (0.8%) |
| High School Diploma | 3,327 (80.7%) | 470 (11.4%) |
| College / Associate Degree | 5,213 (88.3%) | 106 (1.8%) |
| Bachelor's Degree or higher | 4,107 (87.6%) | 155 (3.3%) |
| Total | 13,544 (85.0%) | 733 (4.6%) |
Employment Occupations by Sex in Harvey County
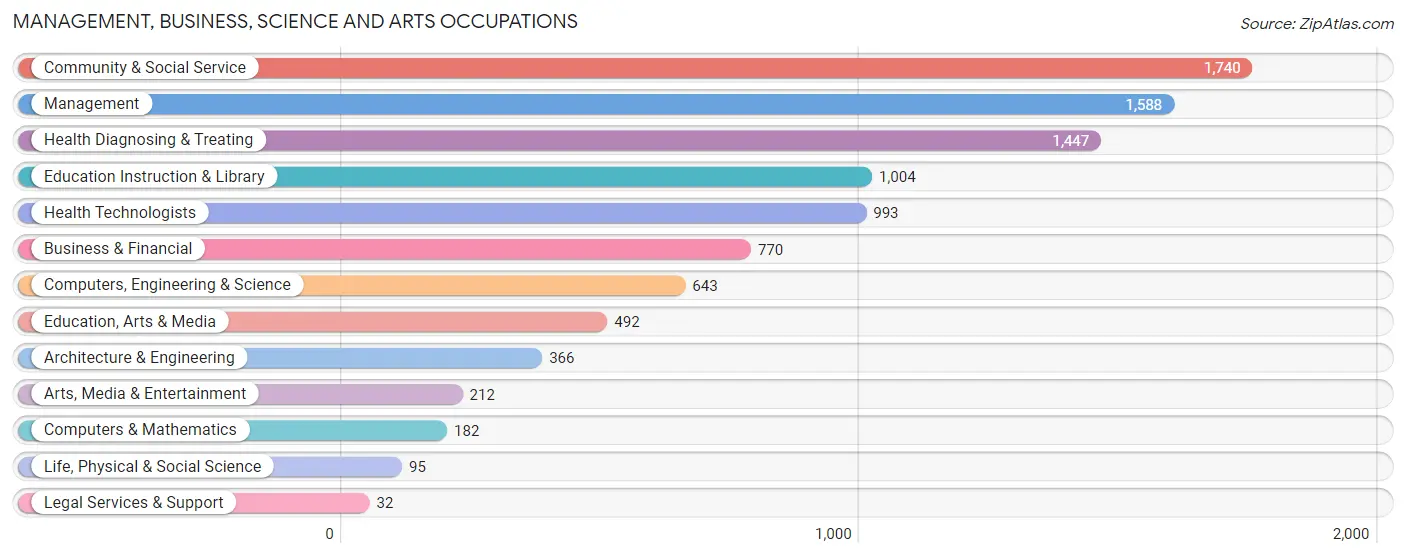
Management, Business, Science and Arts Occupations
The most common Management, Business, Science and Arts occupations in Harvey County are Community & Social Service (1,740 | 10.4%), Management (1,588 | 9.5%), Health Diagnosing & Treating (1,447 | 8.6%), Education Instruction & Library (1,004 | 6.0%), and Health Technologists (993 | 5.9%).
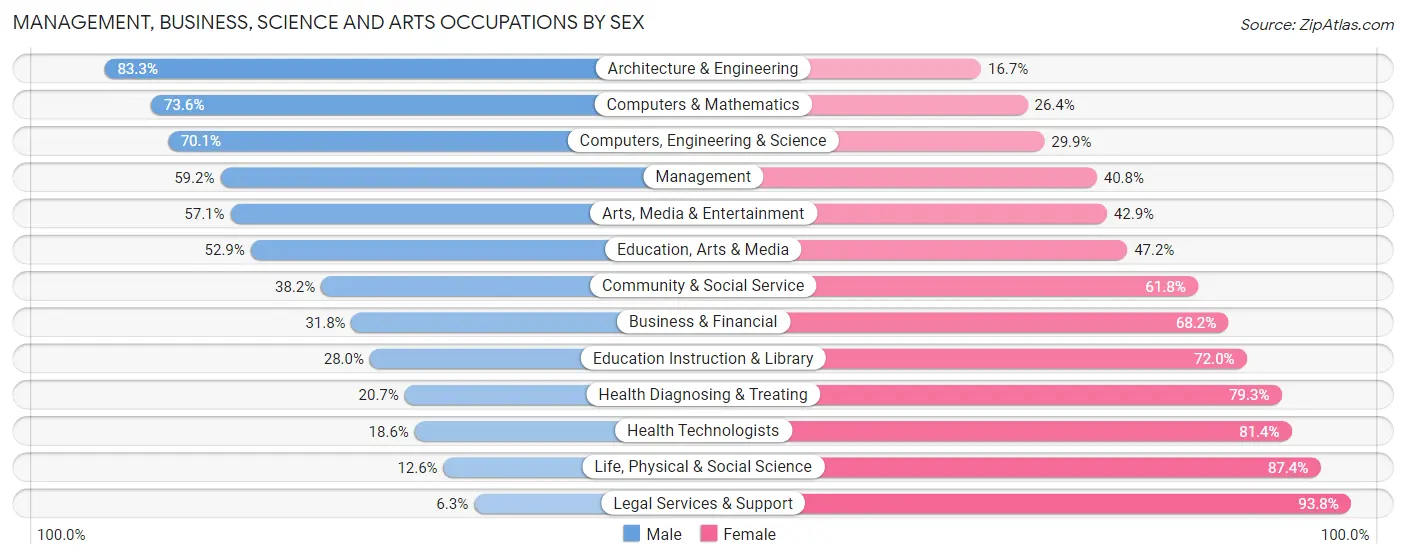
Management, Business, Science and Arts Occupations by Sex
Within the Management, Business, Science and Arts occupations in Harvey County, the most male-oriented occupations are Architecture & Engineering (83.3%), Computers & Mathematics (73.6%), and Computers, Engineering & Science (70.1%), while the most female-oriented occupations are Legal Services & Support (93.8%), Life, Physical & Social Science (87.4%), and Health Technologists (81.4%).
| Occupation | Male | Female |
| Management | 940 (59.2%) | 648 (40.8%) |
| Business & Financial | 245 (31.8%) | 525 (68.2%) |
| Computers, Engineering & Science | 451 (70.1%) | 192 (29.9%) |
| Computers & Mathematics | 134 (73.6%) | 48 (26.4%) |
| Architecture & Engineering | 305 (83.3%) | 61 (16.7%) |
| Life, Physical & Social Science | 12 (12.6%) | 83 (87.4%) |
| Community & Social Service | 664 (38.2%) | 1,076 (61.8%) |
| Education, Arts & Media | 260 (52.8%) | 232 (47.1%) |
| Legal Services & Support | 2 (6.2%) | 30 (93.8%) |
| Education Instruction & Library | 281 (28.0%) | 723 (72.0%) |
| Arts, Media & Entertainment | 121 (57.1%) | 91 (42.9%) |
| Health Diagnosing & Treating | 300 (20.7%) | 1,147 (79.3%) |
| Health Technologists | 185 (18.6%) | 808 (81.4%) |
| Total (Category) | 2,600 (42.0%) | 3,588 (58.0%) |
| Total (Overall) | 8,862 (52.8%) | 7,913 (47.2%) |
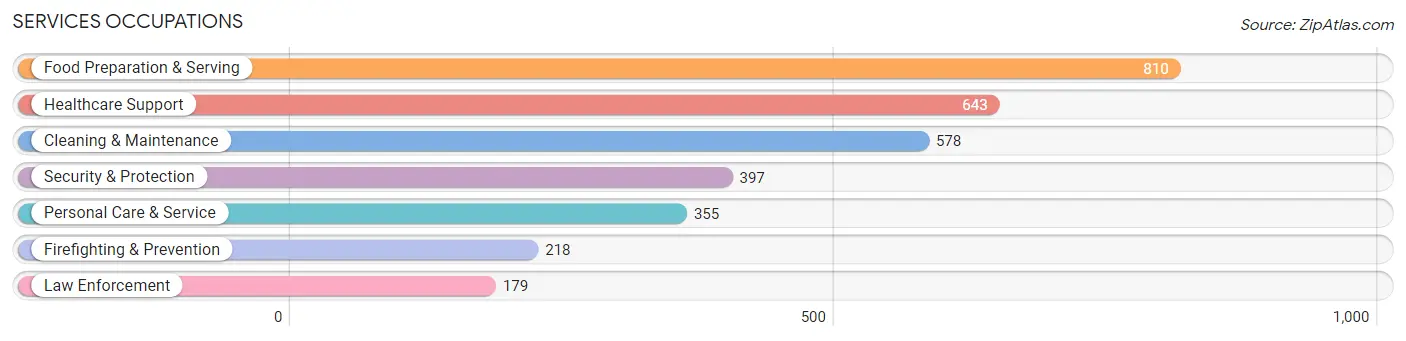
Services Occupations
The most common Services occupations in Harvey County are Food Preparation & Serving (810 | 4.8%), Healthcare Support (643 | 3.8%), Cleaning & Maintenance (578 | 3.5%), Security & Protection (397 | 2.4%), and Personal Care & Service (355 | 2.1%).
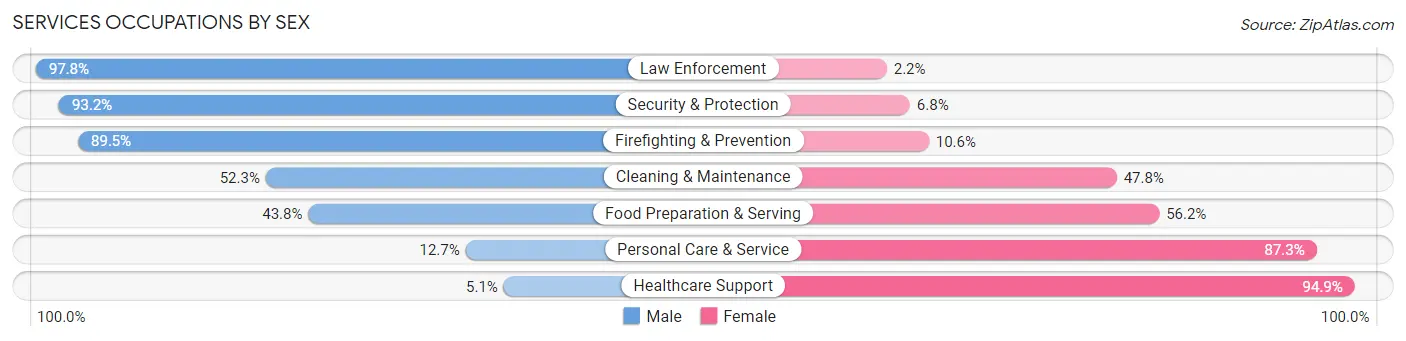
Services Occupations by Sex
Within the Services occupations in Harvey County, the most male-oriented occupations are Law Enforcement (97.8%), Security & Protection (93.2%), and Firefighting & Prevention (89.4%), while the most female-oriented occupations are Healthcare Support (94.9%), Personal Care & Service (87.3%), and Food Preparation & Serving (56.2%).
| Occupation | Male | Female |
| Healthcare Support | 33 (5.1%) | 610 (94.9%) |
| Security & Protection | 370 (93.2%) | 27 (6.8%) |
| Firefighting & Prevention | 195 (89.4%) | 23 (10.5%) |
| Law Enforcement | 175 (97.8%) | 4 (2.2%) |
| Food Preparation & Serving | 355 (43.8%) | 455 (56.2%) |
| Cleaning & Maintenance | 302 (52.2%) | 276 (47.7%) |
| Personal Care & Service | 45 (12.7%) | 310 (87.3%) |
| Total (Category) | 1,105 (39.7%) | 1,678 (60.3%) |
| Total (Overall) | 8,862 (52.8%) | 7,913 (47.2%) |
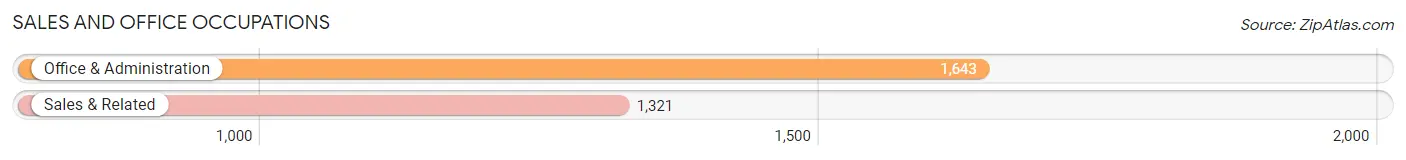
Sales and Office Occupations
The most common Sales and Office occupations in Harvey County are Office & Administration (1,643 | 9.8%), and Sales & Related (1,321 | 7.9%).
Sales and Office Occupations by Sex
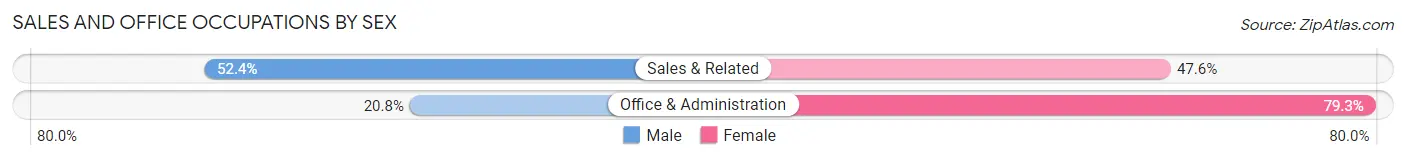
| Occupation | Male | Female |
| Sales & Related | 692 (52.4%) | 629 (47.6%) |
| Office & Administration | 341 (20.7%) | 1,302 (79.2%) |
| Total (Category) | 1,033 (34.8%) | 1,931 (65.1%) |
| Total (Overall) | 8,862 (52.8%) | 7,913 (47.2%) |
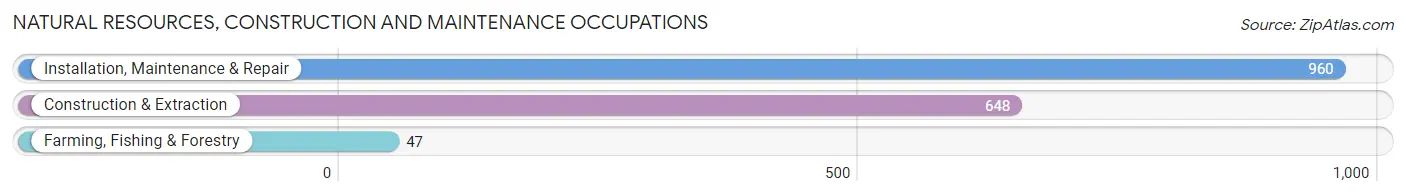
Natural Resources, Construction and Maintenance Occupations
The most common Natural Resources, Construction and Maintenance occupations in Harvey County are Installation, Maintenance & Repair (960 | 5.7%), Construction & Extraction (648 | 3.9%), and Farming, Fishing & Forestry (47 | 0.3%).
Natural Resources, Construction and Maintenance Occupations by Sex
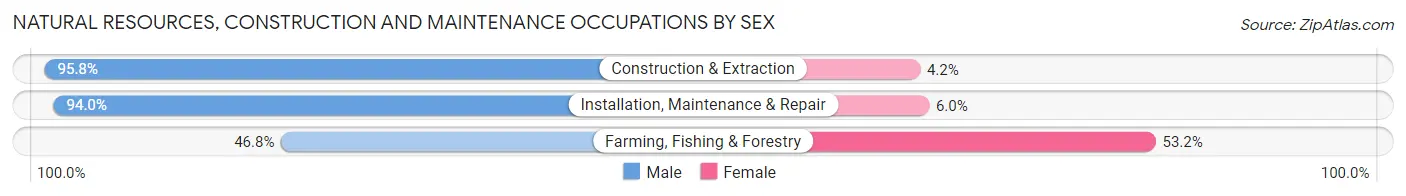
| Occupation | Male | Female |
| Farming, Fishing & Forestry | 22 (46.8%) | 25 (53.2%) |
| Construction & Extraction | 621 (95.8%) | 27 (4.2%) |
| Installation, Maintenance & Repair | 902 (94.0%) | 58 (6.0%) |
| Total (Category) | 1,545 (93.3%) | 110 (6.7%) |
| Total (Overall) | 8,862 (52.8%) | 7,913 (47.2%) |
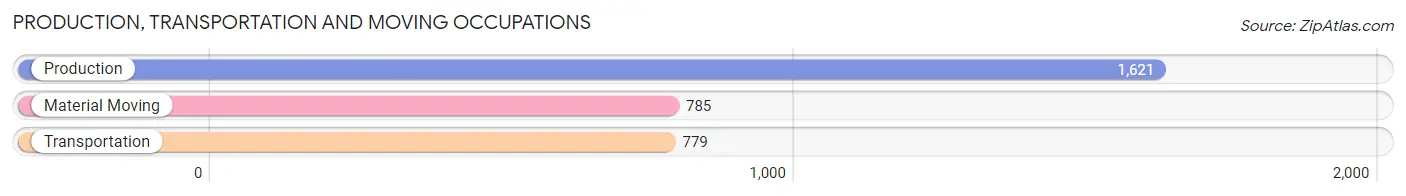
Production, Transportation and Moving Occupations
The most common Production, Transportation and Moving occupations in Harvey County are Production (1,621 | 9.7%), Material Moving (785 | 4.7%), and Transportation (779 | 4.6%).
Production, Transportation and Moving Occupations by Sex
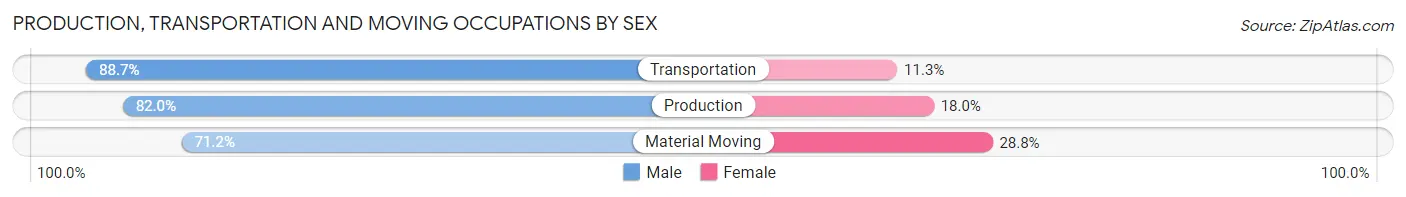
| Occupation | Male | Female |
| Production | 1,329 (82.0%) | 292 (18.0%) |
| Transportation | 691 (88.7%) | 88 (11.3%) |
| Material Moving | 559 (71.2%) | 226 (28.8%) |
| Total (Category) | 2,579 (81.0%) | 606 (19.0%) |
| Total (Overall) | 8,862 (52.8%) | 7,913 (47.2%) |
Employment Industries by Sex in Harvey County
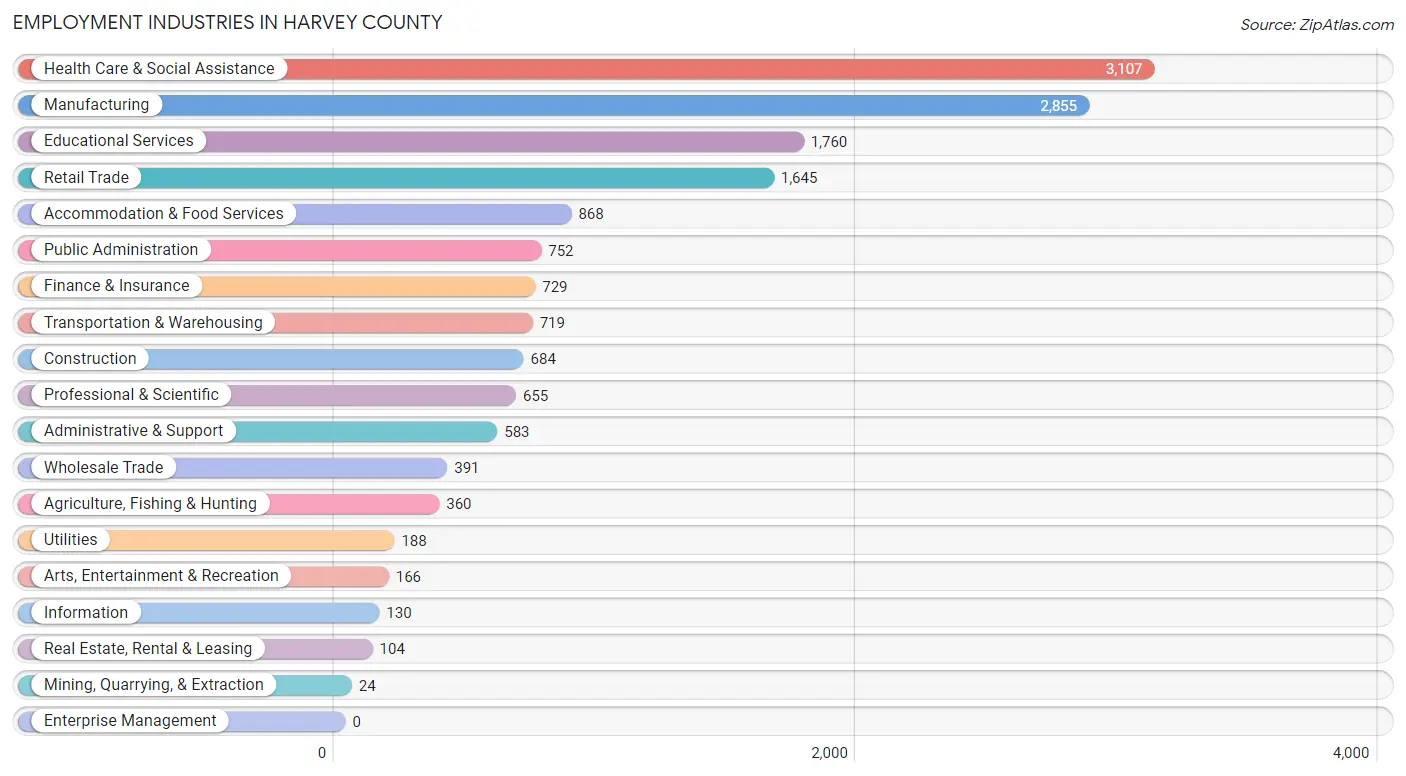
Employment Industries in Harvey County
The major employment industries in Harvey County include Health Care & Social Assistance (3,107 | 18.5%), Manufacturing (2,855 | 17.0%), Educational Services (1,760 | 10.5%), Retail Trade (1,645 | 9.8%), and Accommodation & Food Services (868 | 5.2%).
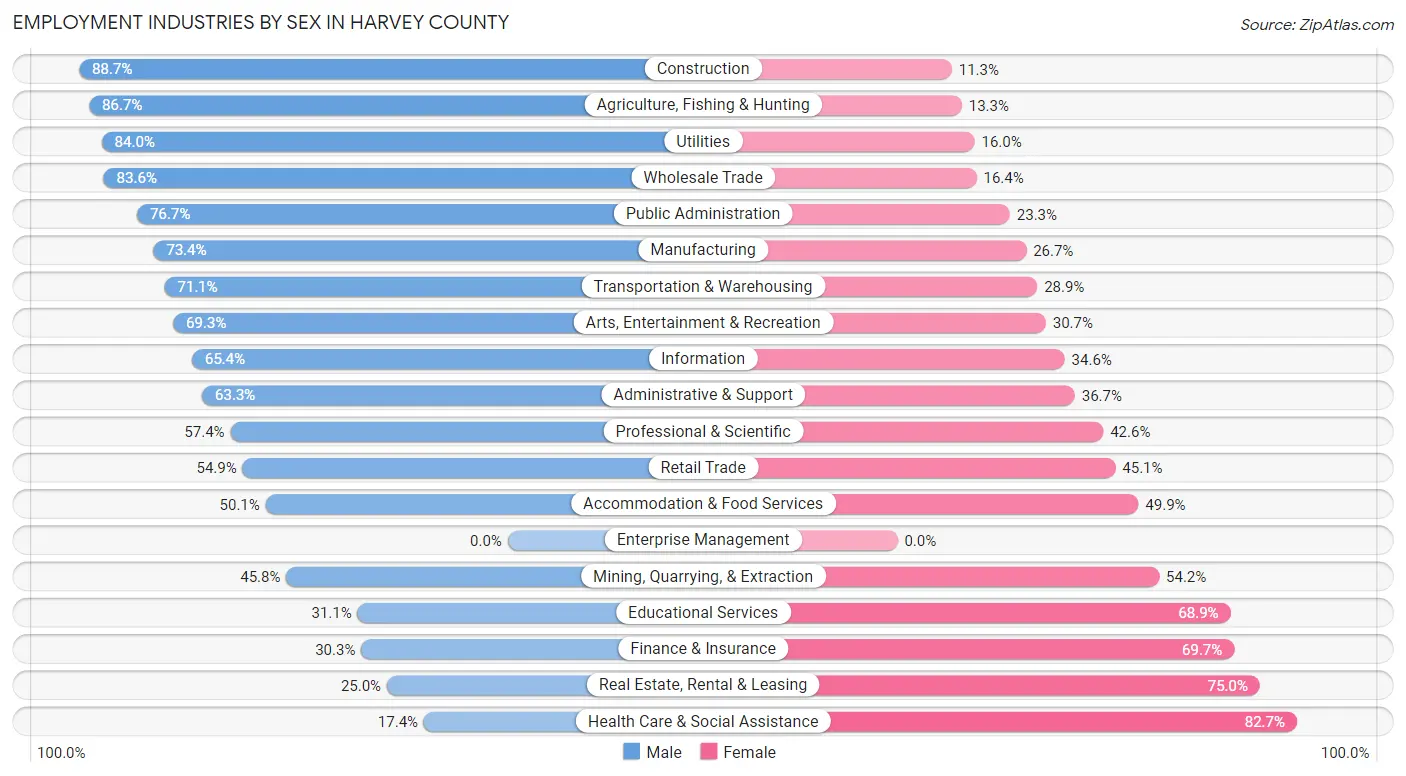
Employment Industries by Sex in Harvey County
The Harvey County industries that see more men than women are Construction (88.7%), Agriculture, Fishing & Hunting (86.7%), and Utilities (84.0%), whereas the industries that tend to have a higher number of women are Health Care & Social Assistance (82.7%), Real Estate, Rental & Leasing (75.0%), and Finance & Insurance (69.7%).
| Industry | Male | Female |
| Agriculture, Fishing & Hunting | 312 (86.7%) | 48 (13.3%) |
| Mining, Quarrying, & Extraction | 11 (45.8%) | 13 (54.2%) |
| Construction | 607 (88.7%) | 77 (11.3%) |
| Manufacturing | 2,094 (73.4%) | 761 (26.7%) |
| Wholesale Trade | 327 (83.6%) | 64 (16.4%) |
| Retail Trade | 903 (54.9%) | 742 (45.1%) |
| Transportation & Warehousing | 511 (71.1%) | 208 (28.9%) |
| Utilities | 158 (84.0%) | 30 (16.0%) |
| Information | 85 (65.4%) | 45 (34.6%) |
| Finance & Insurance | 221 (30.3%) | 508 (69.7%) |
| Real Estate, Rental & Leasing | 26 (25.0%) | 78 (75.0%) |
| Professional & Scientific | 376 (57.4%) | 279 (42.6%) |
| Enterprise Management | 0 (0.0%) | 0 (0.0%) |
| Administrative & Support | 369 (63.3%) | 214 (36.7%) |
| Educational Services | 547 (31.1%) | 1,213 (68.9%) |
| Health Care & Social Assistance | 539 (17.3%) | 2,568 (82.7%) |
| Arts, Entertainment & Recreation | 115 (69.3%) | 51 (30.7%) |
| Accommodation & Food Services | 435 (50.1%) | 433 (49.9%) |
| Public Administration | 577 (76.7%) | 175 (23.3%) |
| Total | 8,862 (52.8%) | 7,913 (47.2%) |
Education in Harvey County
School Enrollment in Harvey County
The most common levels of schooling among the 8,247 students in Harvey County are middle school (2,188 | 26.5%), high school (1,798 | 21.8%), and elementary school (1,678 | 20.3%).
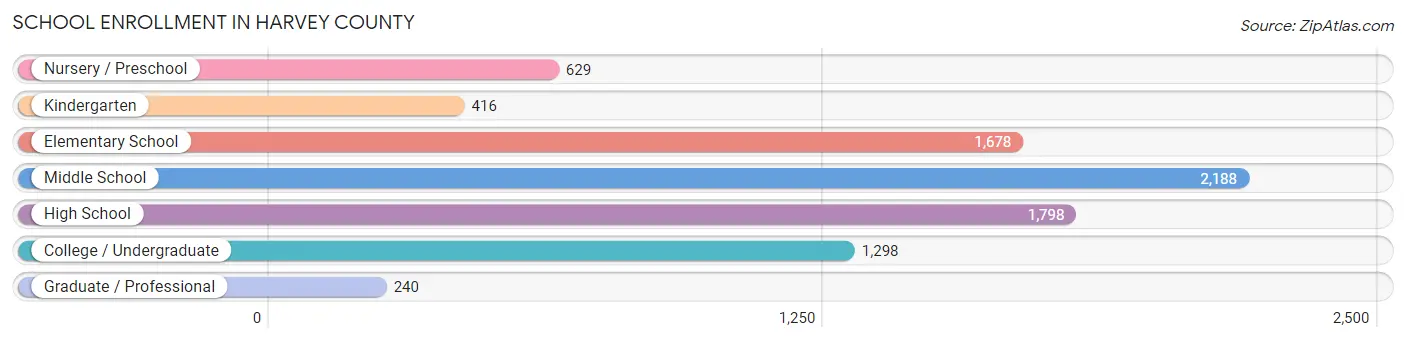
| School Level | # Students | % Students |
| Nursery / Preschool | 629 | 7.6% |
| Kindergarten | 416 | 5.0% |
| Elementary School | 1,678 | 20.3% |
| Middle School | 2,188 | 26.5% |
| High School | 1,798 | 21.8% |
| College / Undergraduate | 1,298 | 15.7% |
| Graduate / Professional | 240 | 2.9% |
| Total | 8,247 | 100.0% |
School Enrollment by Age by Funding Source in Harvey County
Out of a total of 8,247 students who are enrolled in schools in Harvey County, 2,062 (25.0%) attend a private institution, while the remaining 6,185 (75.0%) are enrolled in public schools. The age group of 20 to 24 year olds has the highest likelihood of being enrolled in private schools, with 324 (63.6% in the age bracket) enrolled. Conversely, the age group of 15 to 17 year olds has the lowest likelihood of being enrolled in a private school, with 1,235 (91.0% in the age bracket) attending a public institution.
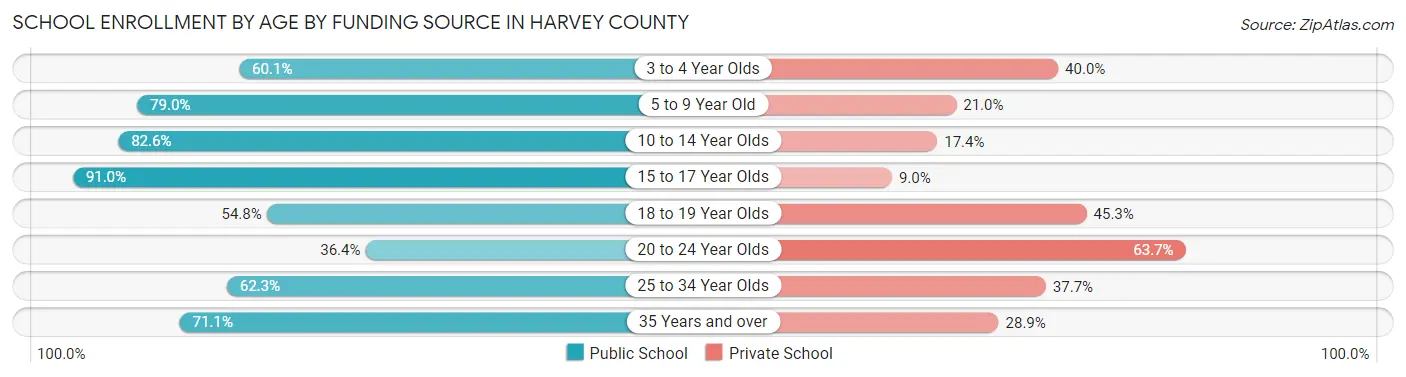
| Age Bracket | Public School | Private School |
| 3 to 4 Year Olds | 242 (60.1%) | 161 (40.0%) |
| 5 to 9 Year Old | 1,692 (79.0%) | 449 (21.0%) |
| 10 to 14 Year Olds | 1,960 (82.6%) | 414 (17.4%) |
| 15 to 17 Year Olds | 1,235 (91.0%) | 122 (9.0%) |
| 18 to 19 Year Olds | 478 (54.7%) | 395 (45.3%) |
| 20 to 24 Year Olds | 185 (36.3%) | 324 (63.6%) |
| 25 to 34 Year Olds | 182 (62.3%) | 110 (37.7%) |
| 35 Years and over | 212 (71.1%) | 86 (28.9%) |
| Total | 6,185 (75.0%) | 2,062 (25.0%) |
Educational Attainment by Field of Study in Harvey County
Education (1,505 | 19.7%), science & technology (1,206 | 15.8%), business (994 | 13.0%), arts & humanities (932 | 12.2%), and bio, nature & agricultural (639 | 8.4%) are the most common fields of study among 7,654 individuals in Harvey County who have obtained a bachelor's degree or higher.
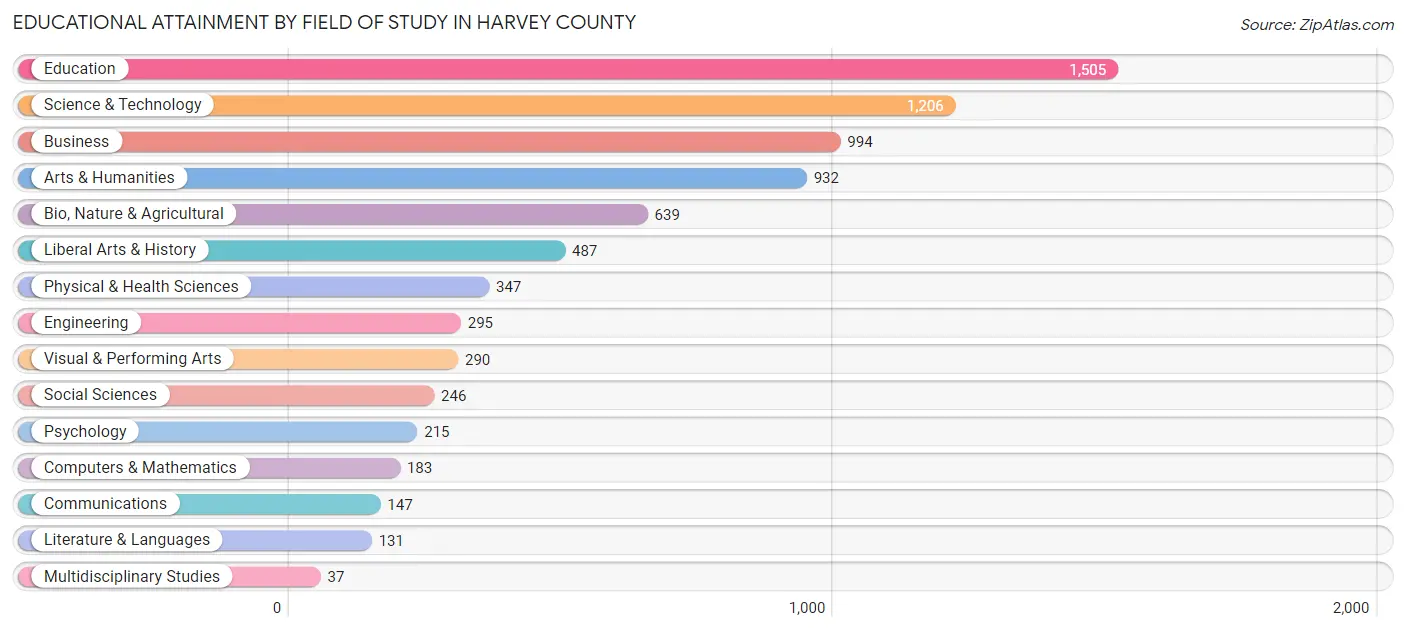
| Field of Study | # Graduates | % Graduates |
| Computers & Mathematics | 183 | 2.4% |
| Bio, Nature & Agricultural | 639 | 8.4% |
| Physical & Health Sciences | 347 | 4.5% |
| Psychology | 215 | 2.8% |
| Social Sciences | 246 | 3.2% |
| Engineering | 295 | 3.8% |
| Multidisciplinary Studies | 37 | 0.5% |
| Science & Technology | 1,206 | 15.8% |
| Business | 994 | 13.0% |
| Education | 1,505 | 19.7% |
| Literature & Languages | 131 | 1.7% |
| Liberal Arts & History | 487 | 6.4% |
| Visual & Performing Arts | 290 | 3.8% |
| Communications | 147 | 1.9% |
| Arts & Humanities | 932 | 12.2% |
| Total | 7,654 | 100.0% |
Transportation & Commute in Harvey County
Vehicle Availability by Sex in Harvey County
The most prevalent vehicle ownership categories in Harvey County are males with 2 vehicles (3,416, accounting for 39.9%) and females with 2 vehicles (2,616, making up 45.4%).
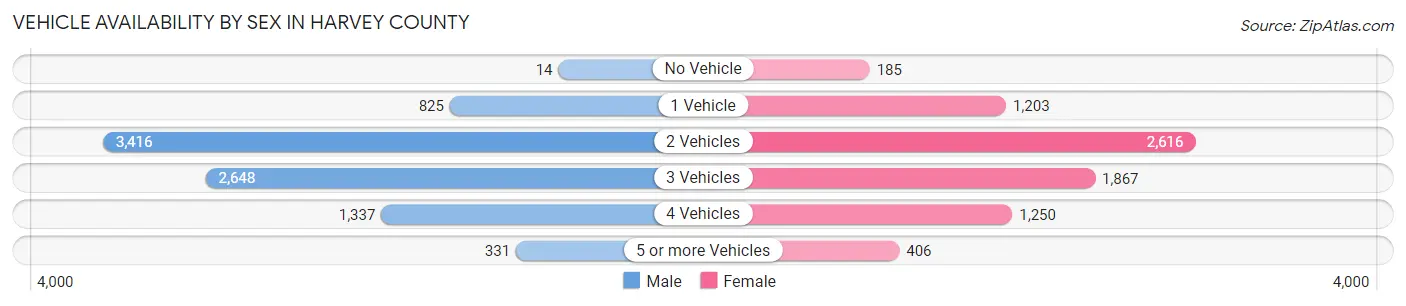
| Vehicles Available | Male | Female |
| No Vehicle | 14 (0.2%) | 185 (2.5%) |
| 1 Vehicle | 825 (9.6%) | 1,203 (16.0%) |
| 2 Vehicles | 3,416 (39.9%) | 2,616 (34.7%) |
| 3 Vehicles | 2,648 (30.9%) | 1,867 (24.8%) |
| 4 Vehicles | 1,337 (15.6%) | 1,250 (16.6%) |
| 5 or more Vehicles | 331 (3.9%) | 406 (5.4%) |
| Total | 8,571 (100.0%) | 7,527 (100.0%) |
Commute Time in Harvey County
The most frequently occuring commute durations in Harvey County are 5 to 9 minutes (2,738 commuters, 17.9%), 10 to 14 minutes (2,411 commuters, 15.8%), and 30 to 34 minutes (1,971 commuters, 12.9%).
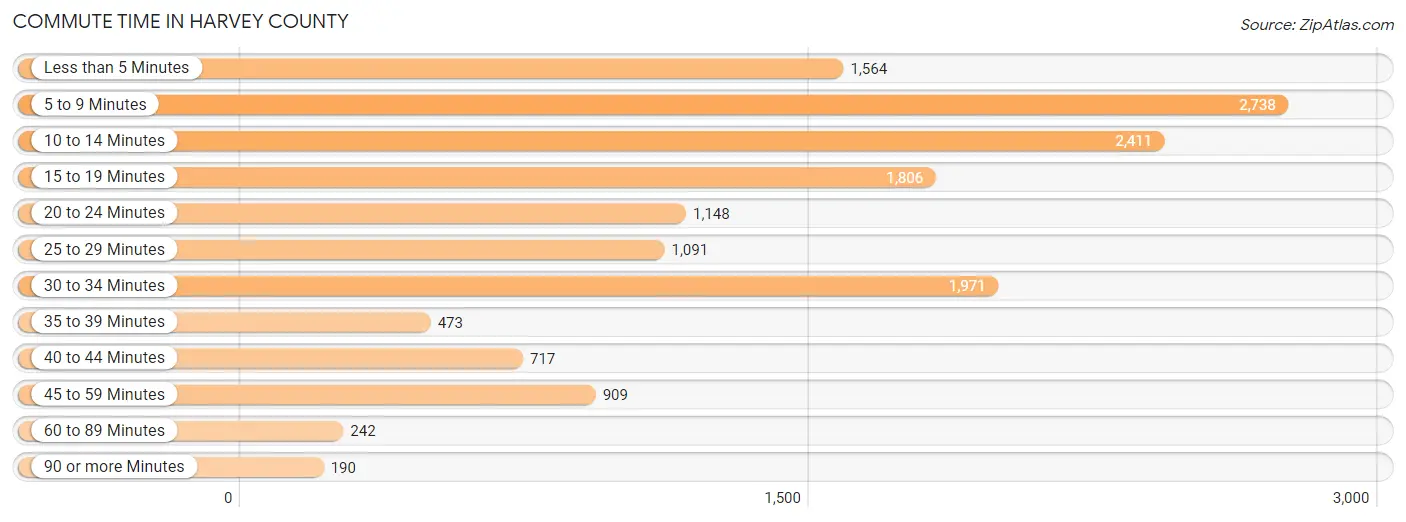
| Commute Time | # Commuters | % Commuters |
| Less than 5 Minutes | 1,564 | 10.2% |
| 5 to 9 Minutes | 2,738 | 17.9% |
| 10 to 14 Minutes | 2,411 | 15.8% |
| 15 to 19 Minutes | 1,806 | 11.8% |
| 20 to 24 Minutes | 1,148 | 7.5% |
| 25 to 29 Minutes | 1,091 | 7.1% |
| 30 to 34 Minutes | 1,971 | 12.9% |
| 35 to 39 Minutes | 473 | 3.1% |
| 40 to 44 Minutes | 717 | 4.7% |
| 45 to 59 Minutes | 909 | 6.0% |
| 60 to 89 Minutes | 242 | 1.6% |
| 90 or more Minutes | 190 | 1.3% |
Commute Time by Sex in Harvey County
The most common commute times in Harvey County are 5 to 9 minutes (1,297 commuters, 15.9%) for males and 5 to 9 minutes (1,441 commuters, 20.4%) for females.
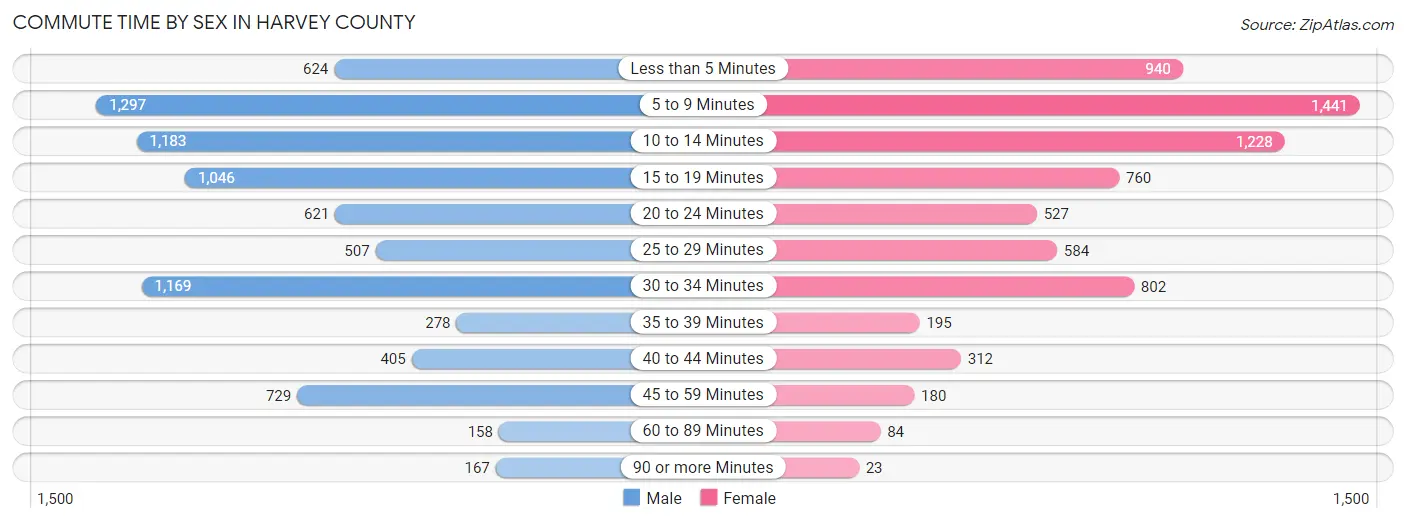
| Commute Time | Male | Female |
| Less than 5 Minutes | 624 (7.6%) | 940 (13.3%) |
| 5 to 9 Minutes | 1,297 (15.9%) | 1,441 (20.4%) |
| 10 to 14 Minutes | 1,183 (14.5%) | 1,228 (17.3%) |
| 15 to 19 Minutes | 1,046 (12.8%) | 760 (10.7%) |
| 20 to 24 Minutes | 621 (7.6%) | 527 (7.4%) |
| 25 to 29 Minutes | 507 (6.2%) | 584 (8.3%) |
| 30 to 34 Minutes | 1,169 (14.3%) | 802 (11.3%) |
| 35 to 39 Minutes | 278 (3.4%) | 195 (2.8%) |
| 40 to 44 Minutes | 405 (5.0%) | 312 (4.4%) |
| 45 to 59 Minutes | 729 (8.9%) | 180 (2.5%) |
| 60 to 89 Minutes | 158 (1.9%) | 84 (1.2%) |
| 90 or more Minutes | 167 (2.0%) | 23 (0.3%) |
Time of Departure to Work by Sex in Harvey County
The most frequent times of departure to work in Harvey County are 7:30 AM to 7:59 AM (1,239, 15.1%) for males and 7:30 AM to 7:59 AM (1,472, 20.8%) for females.
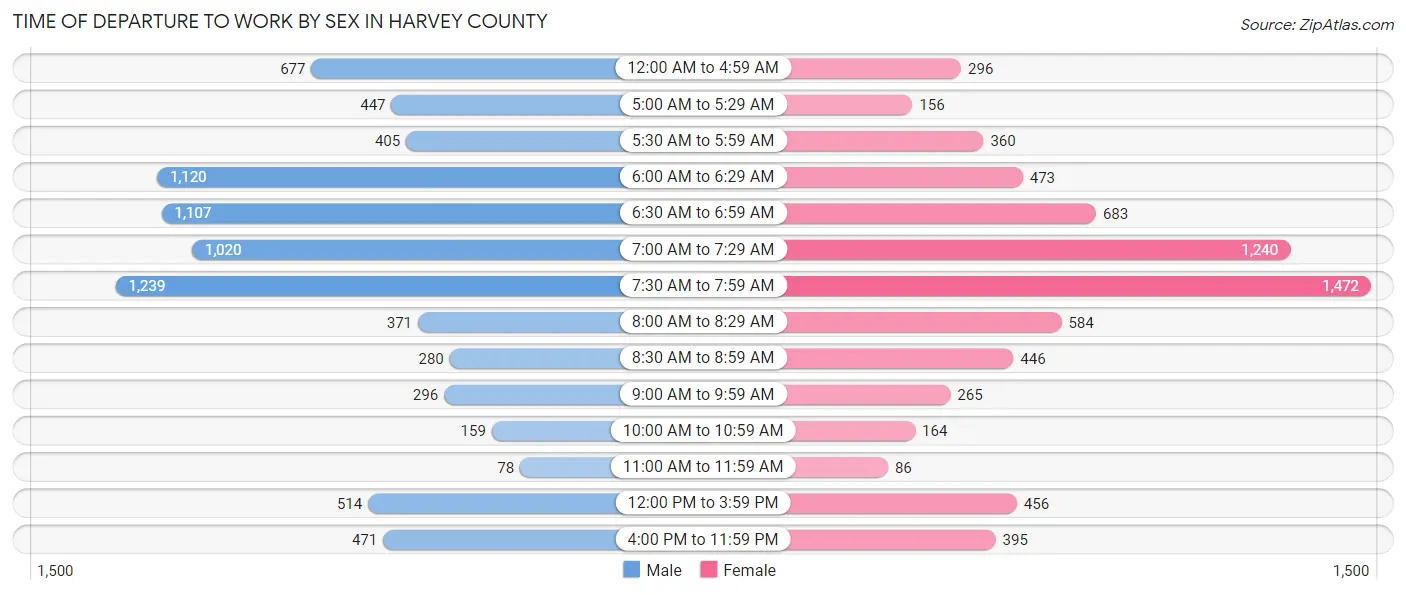
| Time of Departure | Male | Female |
| 12:00 AM to 4:59 AM | 677 (8.3%) | 296 (4.2%) |
| 5:00 AM to 5:29 AM | 447 (5.5%) | 156 (2.2%) |
| 5:30 AM to 5:59 AM | 405 (5.0%) | 360 (5.1%) |
| 6:00 AM to 6:29 AM | 1,120 (13.7%) | 473 (6.7%) |
| 6:30 AM to 6:59 AM | 1,107 (13.5%) | 683 (9.7%) |
| 7:00 AM to 7:29 AM | 1,020 (12.5%) | 1,240 (17.5%) |
| 7:30 AM to 7:59 AM | 1,239 (15.1%) | 1,472 (20.8%) |
| 8:00 AM to 8:29 AM | 371 (4.5%) | 584 (8.3%) |
| 8:30 AM to 8:59 AM | 280 (3.4%) | 446 (6.3%) |
| 9:00 AM to 9:59 AM | 296 (3.6%) | 265 (3.7%) |
| 10:00 AM to 10:59 AM | 159 (1.9%) | 164 (2.3%) |
| 11:00 AM to 11:59 AM | 78 (0.9%) | 86 (1.2%) |
| 12:00 PM to 3:59 PM | 514 (6.3%) | 456 (6.4%) |
| 4:00 PM to 11:59 PM | 471 (5.8%) | 395 (5.6%) |
| Total | 8,184 (100.0%) | 7,076 (100.0%) |
Housing Occupancy in Harvey County
Occupancy by Ownership in Harvey County
Of the total 13,246 dwellings in Harvey County, owner-occupied units account for 9,464 (71.5%), while renter-occupied units make up 3,782 (28.5%).
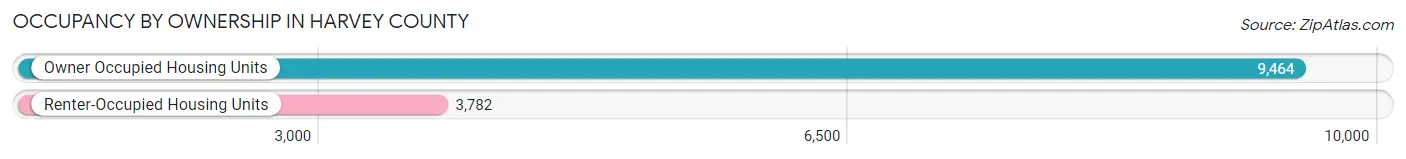
| Occupancy | # Housing Units | % Housing Units |
| Owner Occupied Housing Units | 9,464 | 71.5% |
| Renter-Occupied Housing Units | 3,782 | 28.5% |
| Total Occupied Housing Units | 13,246 | 100.0% |
Occupancy by Household Size in Harvey County
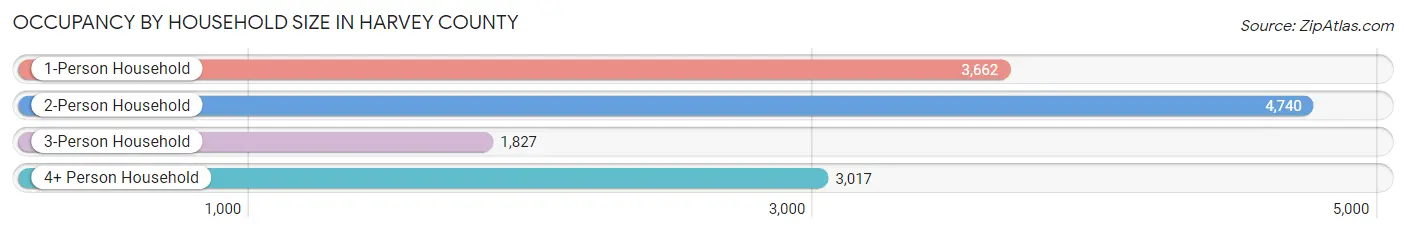
| Household Size | # Housing Units | % Housing Units |
| 1-Person Household | 3,662 | 27.7% |
| 2-Person Household | 4,740 | 35.8% |
| 3-Person Household | 1,827 | 13.8% |
| 4+ Person Household | 3,017 | 22.8% |
| Total Housing Units | 13,246 | 100.0% |
Occupancy by Ownership by Household Size in Harvey County
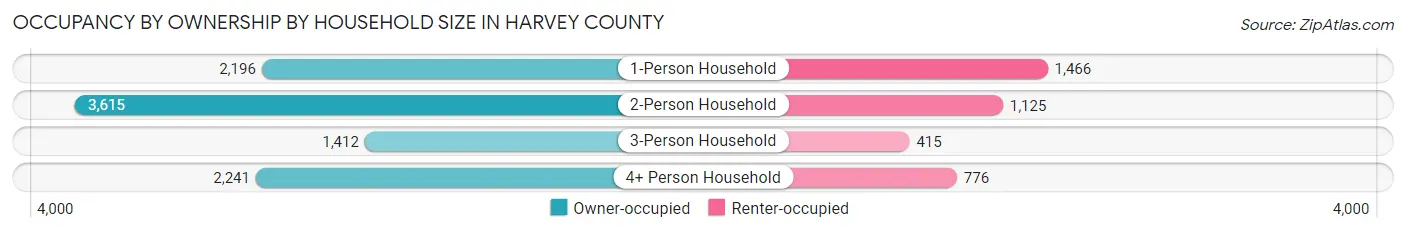
| Household Size | Owner-occupied | Renter-occupied |
| 1-Person Household | 2,196 (60.0%) | 1,466 (40.0%) |
| 2-Person Household | 3,615 (76.3%) | 1,125 (23.7%) |
| 3-Person Household | 1,412 (77.3%) | 415 (22.7%) |
| 4+ Person Household | 2,241 (74.3%) | 776 (25.7%) |
| Total Housing Units | 9,464 (71.5%) | 3,782 (28.5%) |
Occupancy by Educational Attainment in Harvey County
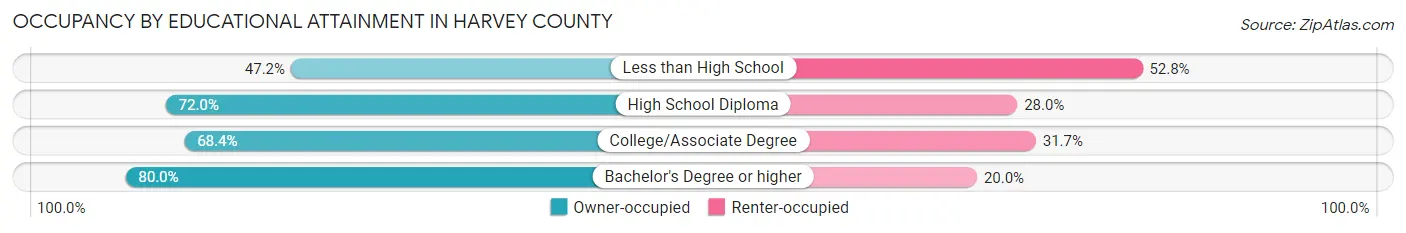
| Household Size | Owner-occupied | Renter-occupied |
| Less than High School | 482 (47.2%) | 539 (52.8%) |
| High School Diploma | 2,358 (72.0%) | 915 (28.0%) |
| College/Associate Degree | 3,159 (68.3%) | 1,463 (31.7%) |
| Bachelor's Degree or higher | 3,465 (80.0%) | 865 (20.0%) |
Occupancy by Age of Householder in Harvey County
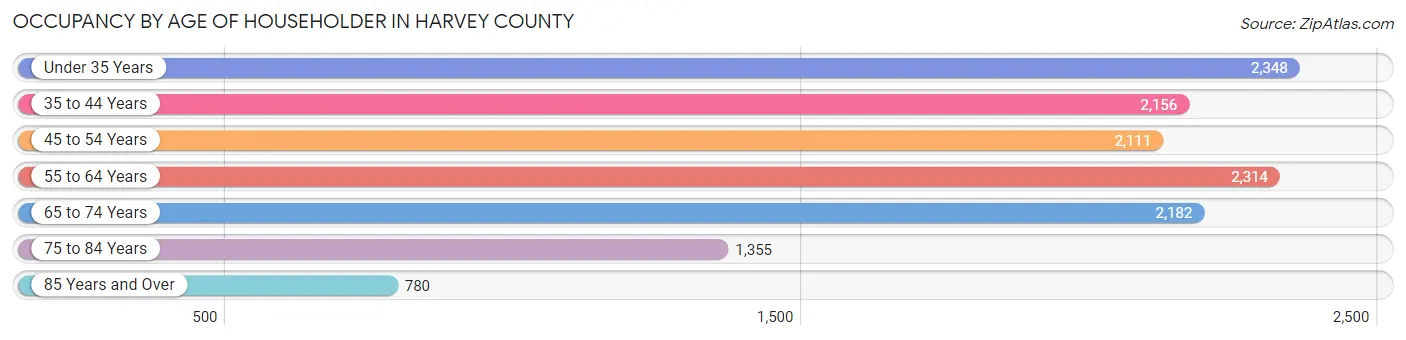
| Age Bracket | # Households | % Households |
| Under 35 Years | 2,348 | 17.7% |
| 35 to 44 Years | 2,156 | 16.3% |
| 45 to 54 Years | 2,111 | 15.9% |
| 55 to 64 Years | 2,314 | 17.5% |
| 65 to 74 Years | 2,182 | 16.5% |
| 75 to 84 Years | 1,355 | 10.2% |
| 85 Years and Over | 780 | 5.9% |
| Total | 13,246 | 100.0% |
Housing Finances in Harvey County
Median Income by Occupancy in Harvey County
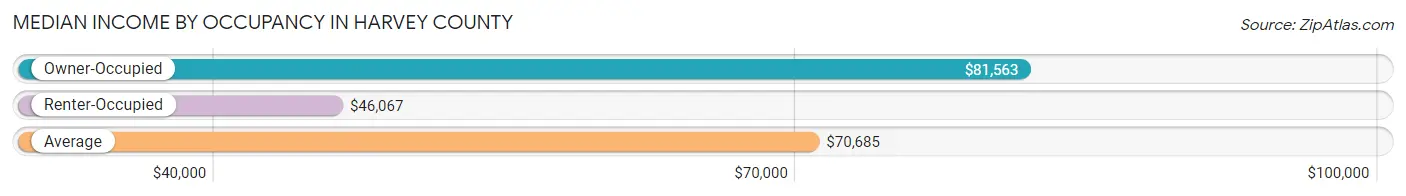
| Occupancy Type | # Households | Median Income |
| Owner-Occupied | 9,464 (71.5%) | $81,563 |
| Renter-Occupied | 3,782 (28.5%) | $46,067 |
| Average | 13,246 (100.0%) | $70,685 |
Occupancy by Householder Income Bracket in Harvey County
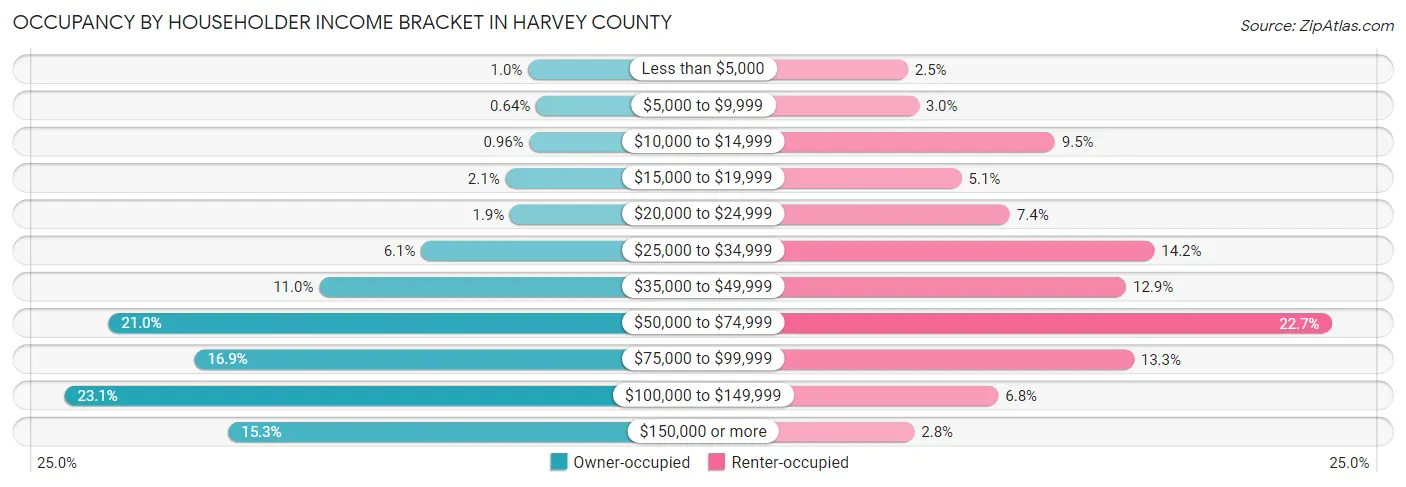
| Income Bracket | Owner-occupied | Renter-occupied |
| Less than $5,000 | 97 (1.0%) | 94 (2.5%) |
| $5,000 to $9,999 | 61 (0.6%) | 114 (3.0%) |
| $10,000 to $14,999 | 91 (1.0%) | 359 (9.5%) |
| $15,000 to $19,999 | 199 (2.1%) | 191 (5.1%) |
| $20,000 to $24,999 | 178 (1.9%) | 278 (7.3%) |
| $25,000 to $34,999 | 578 (6.1%) | 538 (14.2%) |
| $35,000 to $49,999 | 1,038 (11.0%) | 487 (12.9%) |
| $50,000 to $74,999 | 1,988 (21.0%) | 857 (22.7%) |
| $75,000 to $99,999 | 1,600 (16.9%) | 501 (13.3%) |
| $100,000 to $149,999 | 2,186 (23.1%) | 257 (6.8%) |
| $150,000 or more | 1,448 (15.3%) | 106 (2.8%) |
| Total | 9,464 (100.0%) | 3,782 (100.0%) |
Monthly Housing Cost Tiers in Harvey County
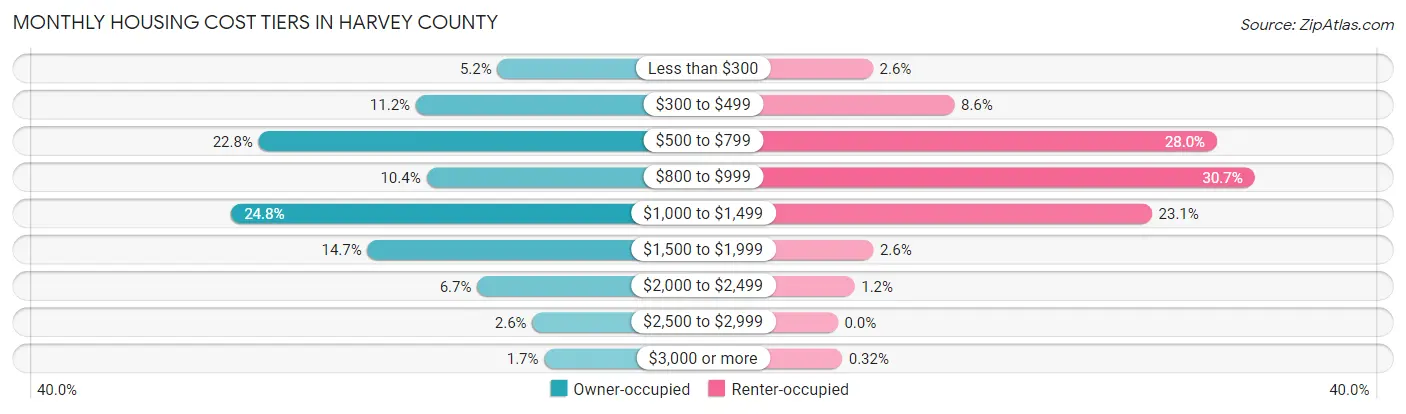
| Monthly Cost | Owner-occupied | Renter-occupied |
| Less than $300 | 489 (5.2%) | 98 (2.6%) |
| $300 to $499 | 1,058 (11.2%) | 325 (8.6%) |
| $500 to $799 | 2,154 (22.8%) | 1,057 (28.0%) |
| $800 to $999 | 984 (10.4%) | 1,162 (30.7%) |
| $1,000 to $1,499 | 2,345 (24.8%) | 875 (23.1%) |
| $1,500 to $1,999 | 1,395 (14.7%) | 99 (2.6%) |
| $2,000 to $2,499 | 630 (6.7%) | 47 (1.2%) |
| $2,500 to $2,999 | 246 (2.6%) | 0 (0.0%) |
| $3,000 or more | 163 (1.7%) | 12 (0.3%) |
| Total | 9,464 (100.0%) | 3,782 (100.0%) |
Physical Housing Characteristics in Harvey County
Housing Structures in Harvey County
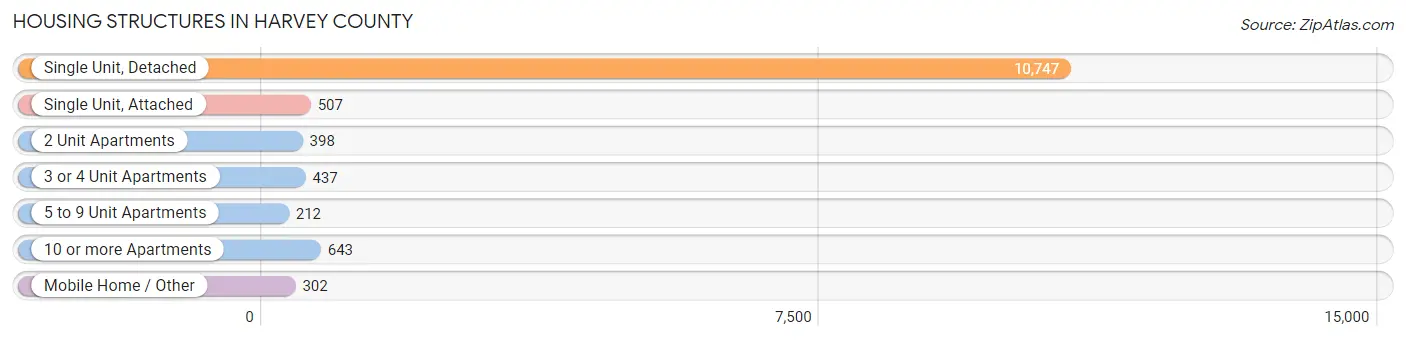
| Structure Type | # Housing Units | % Housing Units |
| Single Unit, Detached | 10,747 | 81.1% |
| Single Unit, Attached | 507 | 3.8% |
| 2 Unit Apartments | 398 | 3.0% |
| 3 or 4 Unit Apartments | 437 | 3.3% |
| 5 to 9 Unit Apartments | 212 | 1.6% |
| 10 or more Apartments | 643 | 4.9% |
| Mobile Home / Other | 302 | 2.3% |
| Total | 13,246 | 100.0% |
Housing Structures by Occupancy in Harvey County
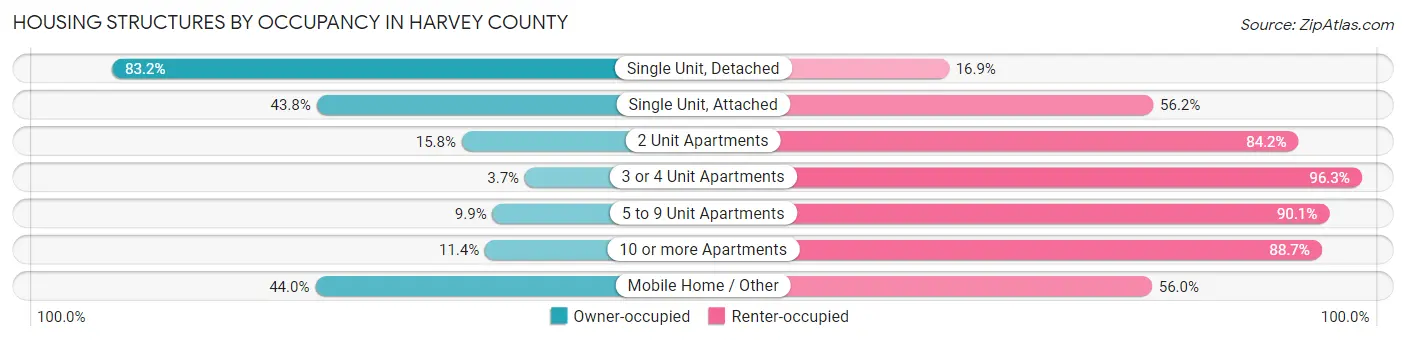
| Structure Type | Owner-occupied | Renter-occupied |
| Single Unit, Detached | 8,936 (83.2%) | 1,811 (16.9%) |
| Single Unit, Attached | 222 (43.8%) | 285 (56.2%) |
| 2 Unit Apartments | 63 (15.8%) | 335 (84.2%) |
| 3 or 4 Unit Apartments | 16 (3.7%) | 421 (96.3%) |
| 5 to 9 Unit Apartments | 21 (9.9%) | 191 (90.1%) |
| 10 or more Apartments | 73 (11.4%) | 570 (88.6%) |
| Mobile Home / Other | 133 (44.0%) | 169 (56.0%) |
| Total | 9,464 (71.5%) | 3,782 (28.5%) |
Housing Structures by Number of Rooms in Harvey County
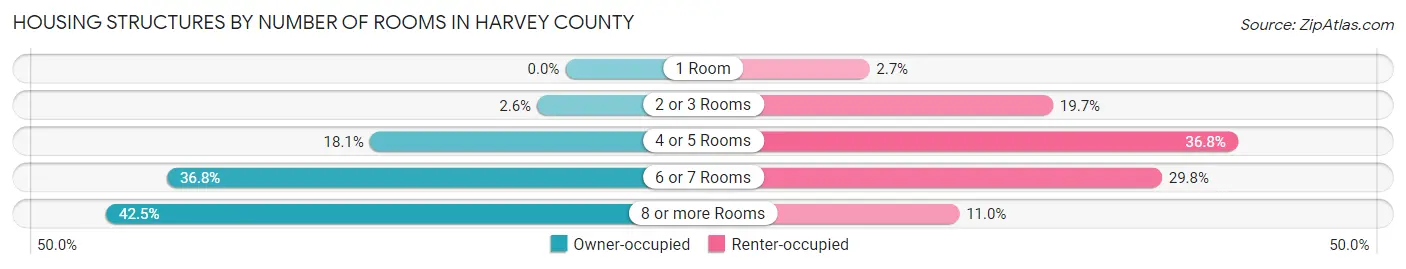
| Number of Rooms | Owner-occupied | Renter-occupied |
| 1 Room | 0 (0.0%) | 103 (2.7%) |
| 2 or 3 Rooms | 248 (2.6%) | 745 (19.7%) |
| 4 or 5 Rooms | 1,712 (18.1%) | 1,391 (36.8%) |
| 6 or 7 Rooms | 3,486 (36.8%) | 1,126 (29.8%) |
| 8 or more Rooms | 4,018 (42.5%) | 417 (11.0%) |
| Total | 9,464 (100.0%) | 3,782 (100.0%) |
Housing Structure by Heating Type in Harvey County
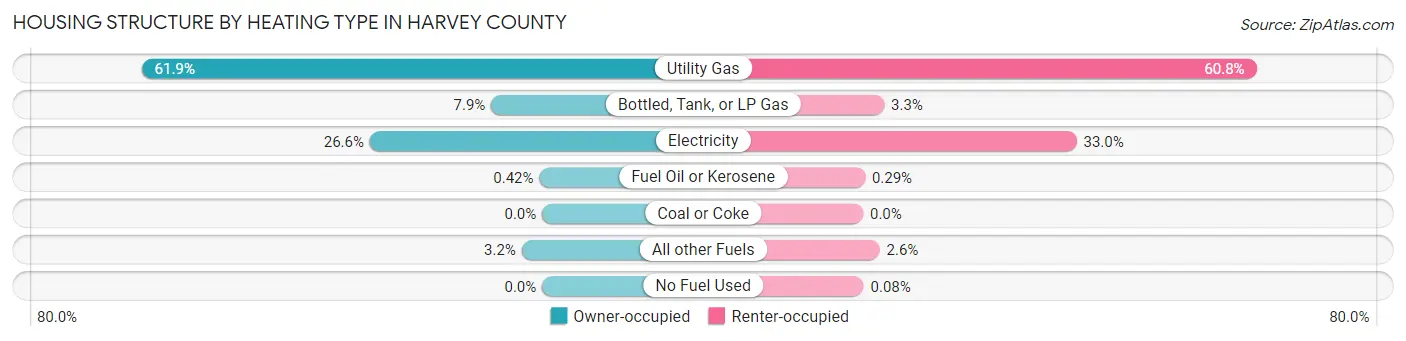
| Heating Type | Owner-occupied | Renter-occupied |
| Utility Gas | 5,859 (61.9%) | 2,300 (60.8%) |
| Bottled, Tank, or LP Gas | 745 (7.9%) | 123 (3.3%) |
| Electricity | 2,521 (26.6%) | 1,248 (33.0%) |
| Fuel Oil or Kerosene | 40 (0.4%) | 11 (0.3%) |
| Coal or Coke | 0 (0.0%) | 0 (0.0%) |
| All other Fuels | 299 (3.2%) | 97 (2.6%) |
| No Fuel Used | 0 (0.0%) | 3 (0.1%) |
| Total | 9,464 (100.0%) | 3,782 (100.0%) |
Household Vehicle Usage in Harvey County
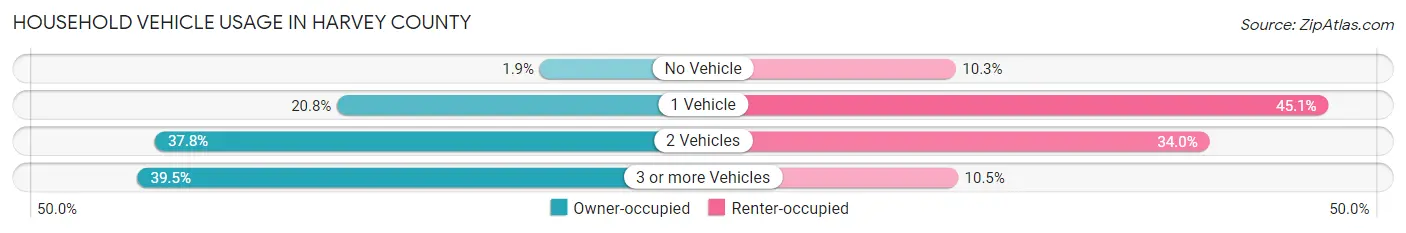
| Vehicles per Household | Owner-occupied | Renter-occupied |
| No Vehicle | 180 (1.9%) | 390 (10.3%) |
| 1 Vehicle | 1,970 (20.8%) | 1,707 (45.1%) |
| 2 Vehicles | 3,580 (37.8%) | 1,287 (34.0%) |
| 3 or more Vehicles | 3,734 (39.5%) | 398 (10.5%) |
| Total | 9,464 (100.0%) | 3,782 (100.0%) |
Real Estate & Mortgages in Harvey County
Real Estate and Mortgage Overview in Harvey County
| Characteristic | Without Mortgage | With Mortgage |
| Housing Units | 4,162 | 5,302 |
| Median Property Value | $152,900 | $166,200 |
| Median Household Income | $64,679 | $908 |
| Monthly Housing Costs | $594 | $163 |
| Real Estate Taxes | $2,266 | $120 |
Property Value by Mortgage Status in Harvey County
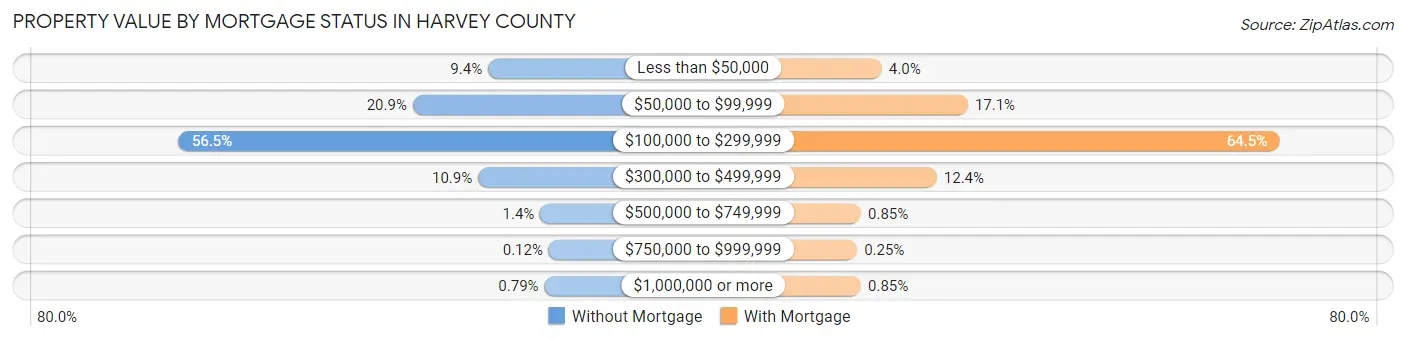
| Property Value | Without Mortgage | With Mortgage |
| Less than $50,000 | 391 (9.4%) | 213 (4.0%) |
| $50,000 to $99,999 | 868 (20.9%) | 908 (17.1%) |
| $100,000 to $299,999 | 2,351 (56.5%) | 3,421 (64.5%) |
| $300,000 to $499,999 | 454 (10.9%) | 657 (12.4%) |
| $500,000 to $749,999 | 60 (1.4%) | 45 (0.9%) |
| $750,000 to $999,999 | 5 (0.1%) | 13 (0.3%) |
| $1,000,000 or more | 33 (0.8%) | 45 (0.9%) |
| Total | 4,162 (100.0%) | 5,302 (100.0%) |
Household Income by Mortgage Status in Harvey County
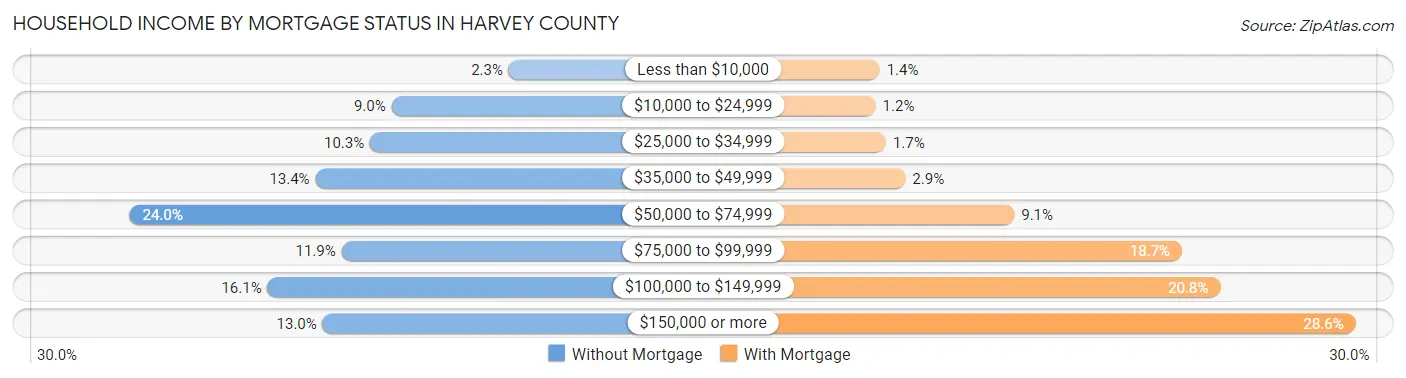
| Household Income | Without Mortgage | With Mortgage |
| Less than $10,000 | 97 (2.3%) | 73 (1.4%) |
| $10,000 to $24,999 | 376 (9.0%) | 61 (1.1%) |
| $25,000 to $34,999 | 427 (10.3%) | 92 (1.7%) |
| $35,000 to $49,999 | 557 (13.4%) | 151 (2.9%) |
| $50,000 to $74,999 | 999 (24.0%) | 481 (9.1%) |
| $75,000 to $99,999 | 495 (11.9%) | 989 (18.6%) |
| $100,000 to $149,999 | 671 (16.1%) | 1,105 (20.8%) |
| $150,000 or more | 540 (13.0%) | 1,515 (28.6%) |
| Total | 4,162 (100.0%) | 5,302 (100.0%) |
Property Value to Household Income Ratio in Harvey County
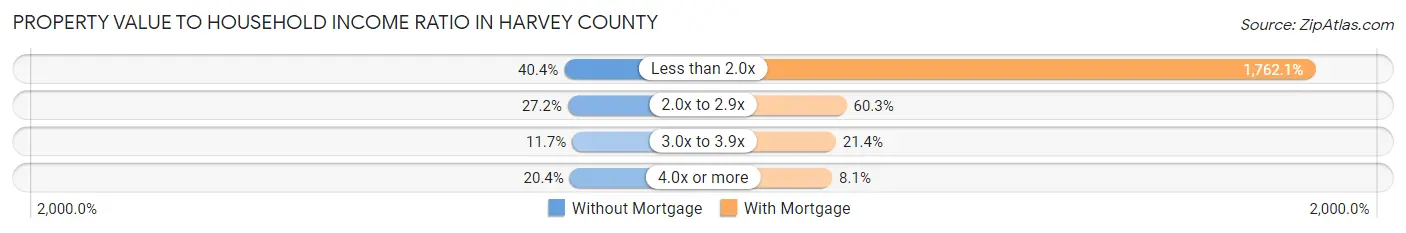
| Value-to-Income Ratio | Without Mortgage | With Mortgage |
| Less than 2.0x | 1,680 (40.4%) | 93,424 (1,762.0%) |
| 2.0x to 2.9x | 1,133 (27.2%) | 3,196 (60.3%) |
| 3.0x to 3.9x | 487 (11.7%) | 1,137 (21.4%) |
| 4.0x or more | 847 (20.3%) | 427 (8.1%) |
| Total | 4,162 (100.0%) | 5,302 (100.0%) |
Real Estate Taxes by Mortgage Status in Harvey County
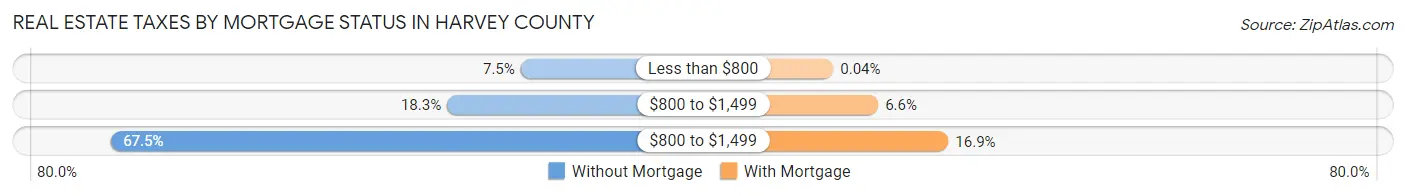
| Property Taxes | Without Mortgage | With Mortgage |
| Less than $800 | 313 (7.5%) | 2 (0.0%) |
| $800 to $1,499 | 761 (18.3%) | 350 (6.6%) |
| $800 to $1,499 | 2,809 (67.5%) | 894 (16.9%) |
| Total | 4,162 (100.0%) | 5,302 (100.0%) |
Health & Disability in Harvey County
Health Insurance Coverage by Age in Harvey County
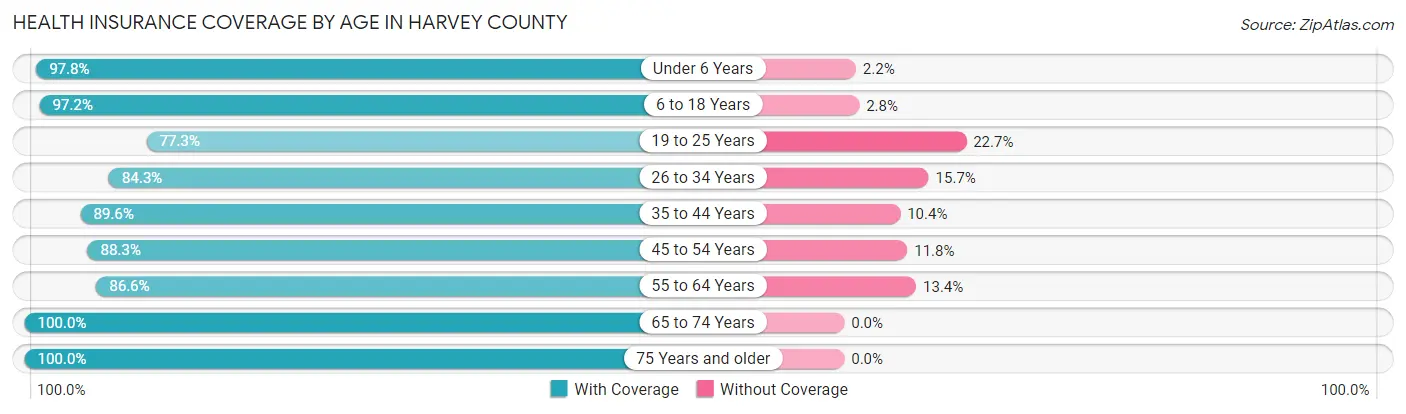
| Age Bracket | With Coverage | Without Coverage |
| Under 6 Years | 2,432 (97.8%) | 54 (2.2%) |
| 6 to 18 Years | 5,902 (97.2%) | 169 (2.8%) |
| 19 to 25 Years | 2,089 (77.3%) | 615 (22.7%) |
| 26 to 34 Years | 3,092 (84.3%) | 577 (15.7%) |
| 35 to 44 Years | 3,419 (89.6%) | 398 (10.4%) |
| 45 to 54 Years | 3,388 (88.2%) | 451 (11.7%) |
| 55 to 64 Years | 3,686 (86.6%) | 570 (13.4%) |
| 65 to 74 Years | 3,514 (100.0%) | 0 (0.0%) |
| 75 Years and older | 2,925 (100.0%) | 0 (0.0%) |
| Total | 30,447 (91.5%) | 2,834 (8.5%) |
Health Insurance Coverage by Citizenship Status in Harvey County
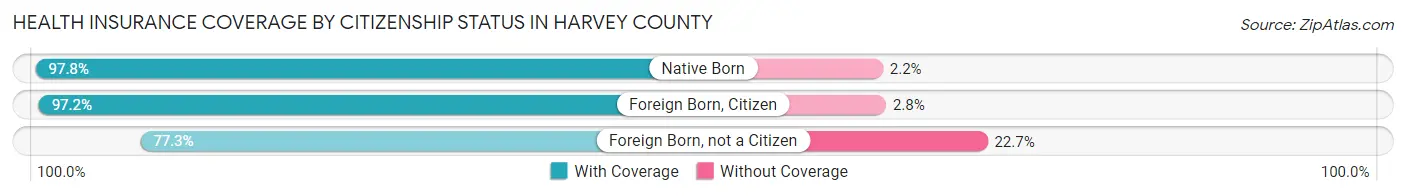
| Citizenship Status | With Coverage | Without Coverage |
| Native Born | 2,432 (97.8%) | 54 (2.2%) |
| Foreign Born, Citizen | 5,902 (97.2%) | 169 (2.8%) |
| Foreign Born, not a Citizen | 2,089 (77.3%) | 615 (22.7%) |
Health Insurance Coverage by Household Income in Harvey County
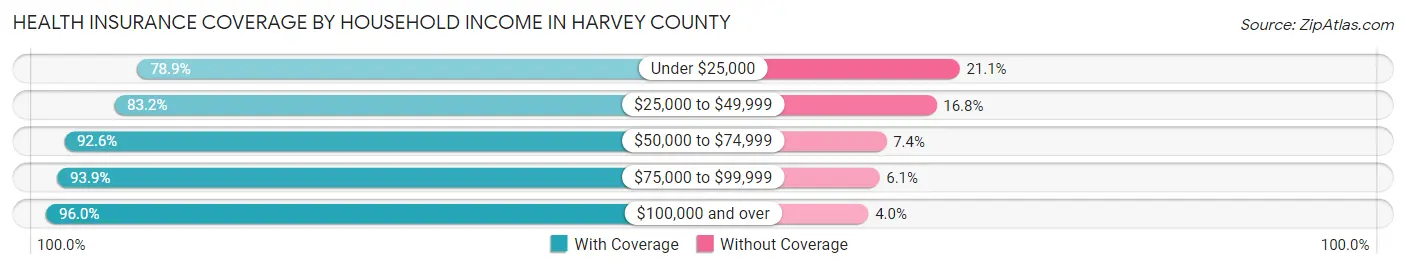
| Household Income | With Coverage | Without Coverage |
| Under $25,000 | 1,999 (78.9%) | 535 (21.1%) |
| $25,000 to $49,999 | 4,322 (83.2%) | 870 (16.8%) |
| $50,000 to $74,999 | 6,384 (92.6%) | 509 (7.4%) |
| $75,000 to $99,999 | 6,013 (93.9%) | 390 (6.1%) |
| $100,000 and over | 11,084 (96.0%) | 464 (4.0%) |
Public vs Private Health Insurance Coverage by Age in Harvey County
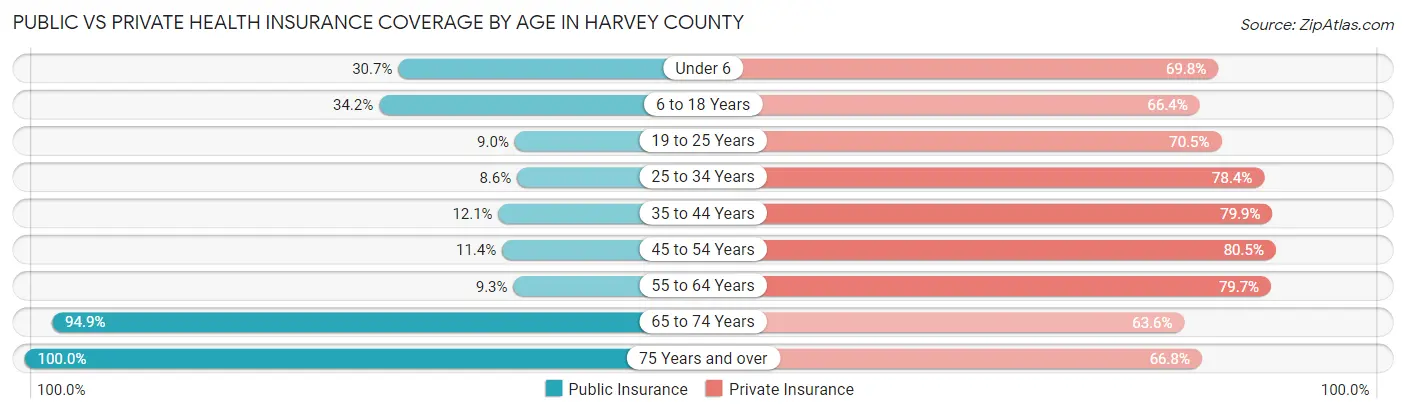
| Age Bracket | Public Insurance | Private Insurance |
| Under 6 | 762 (30.6%) | 1,736 (69.8%) |
| 6 to 18 Years | 2,077 (34.2%) | 4,032 (66.4%) |
| 19 to 25 Years | 244 (9.0%) | 1,905 (70.5%) |
| 25 to 34 Years | 315 (8.6%) | 2,876 (78.4%) |
| 35 to 44 Years | 460 (12.0%) | 3,050 (79.9%) |
| 45 to 54 Years | 437 (11.4%) | 3,092 (80.5%) |
| 55 to 64 Years | 395 (9.3%) | 3,390 (79.6%) |
| 65 to 74 Years | 3,334 (94.9%) | 2,234 (63.6%) |
| 75 Years and over | 2,925 (100.0%) | 1,954 (66.8%) |
| Total | 10,949 (32.9%) | 24,269 (72.9%) |
Disability Status by Sex by Age in Harvey County
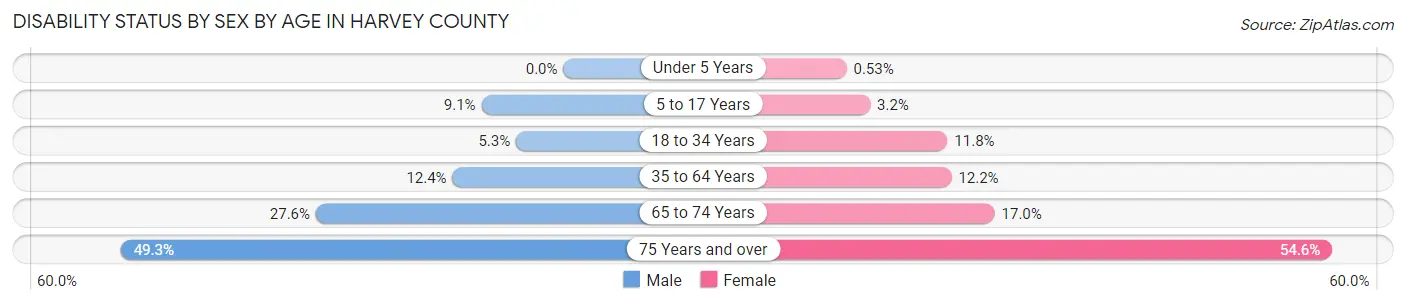
| Age Bracket | Male | Female |
| Under 5 Years | 0 (0.0%) | 5 (0.5%) |
| 5 to 17 Years | 271 (9.1%) | 99 (3.2%) |
| 18 to 34 Years | 191 (5.3%) | 380 (11.8%) |
| 35 to 64 Years | 723 (12.3%) | 740 (12.2%) |
| 65 to 74 Years | 452 (27.6%) | 319 (17.0%) |
| 75 Years and over | 622 (49.3%) | 908 (54.6%) |
Disability Class by Sex by Age in Harvey County
Disability Class: Hearing Difficulty
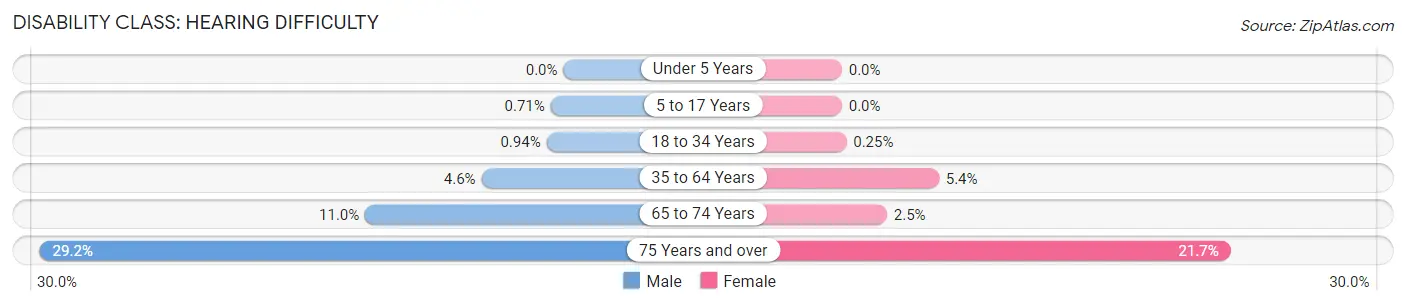
| Age Bracket | Male | Female |
| Under 5 Years | 0 (0.0%) | 0 (0.0%) |
| 5 to 17 Years | 21 (0.7%) | 0 (0.0%) |
| 18 to 34 Years | 34 (0.9%) | 8 (0.3%) |
| 35 to 64 Years | 267 (4.6%) | 327 (5.4%) |
| 65 to 74 Years | 181 (11.0%) | 47 (2.5%) |
| 75 Years and over | 368 (29.2%) | 360 (21.6%) |
Disability Class: Vision Difficulty
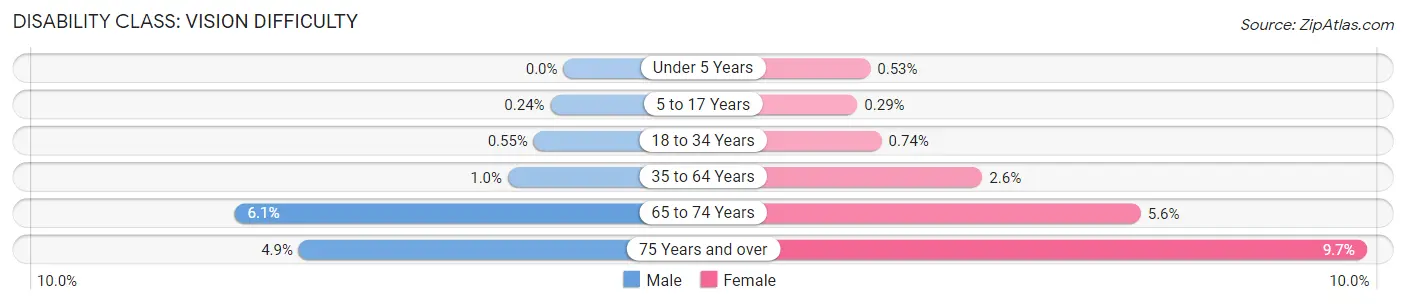
| Age Bracket | Male | Female |
| Under 5 Years | 0 (0.0%) | 5 (0.5%) |
| 5 to 17 Years | 7 (0.2%) | 9 (0.3%) |
| 18 to 34 Years | 20 (0.5%) | 24 (0.7%) |
| 35 to 64 Years | 60 (1.0%) | 158 (2.6%) |
| 65 to 74 Years | 100 (6.1%) | 104 (5.6%) |
| 75 Years and over | 62 (4.9%) | 162 (9.7%) |
Disability Class: Cognitive Difficulty
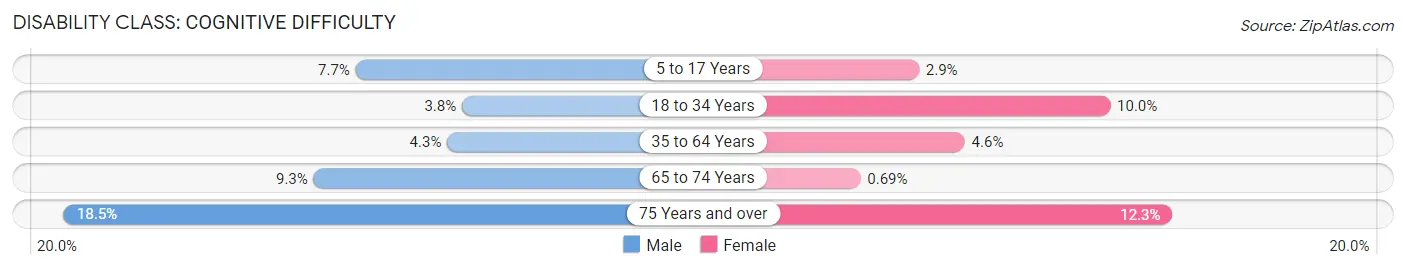
| Age Bracket | Male | Female |
| 5 to 17 Years | 229 (7.7%) | 90 (2.9%) |
| 18 to 34 Years | 136 (3.8%) | 322 (10.0%) |
| 35 to 64 Years | 252 (4.3%) | 276 (4.6%) |
| 65 to 74 Years | 152 (9.3%) | 13 (0.7%) |
| 75 Years and over | 234 (18.5%) | 204 (12.3%) |
Disability Class: Ambulatory Difficulty
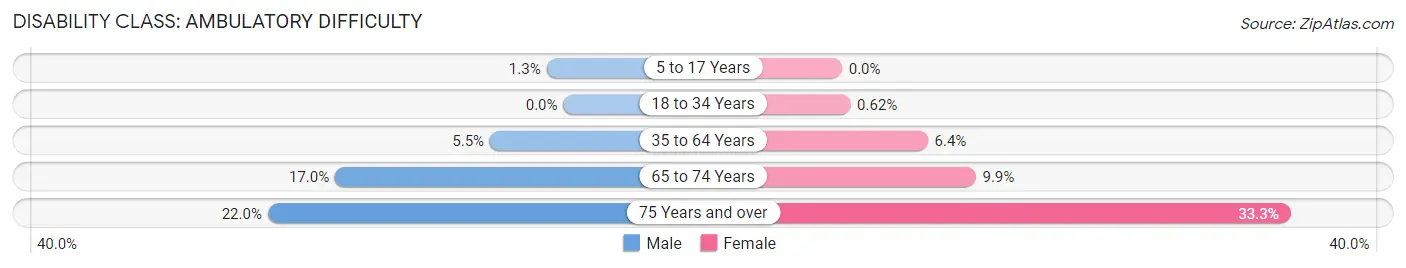
| Age Bracket | Male | Female |
| 5 to 17 Years | 37 (1.3%) | 0 (0.0%) |
| 18 to 34 Years | 0 (0.0%) | 20 (0.6%) |
| 35 to 64 Years | 319 (5.4%) | 386 (6.4%) |
| 65 to 74 Years | 278 (17.0%) | 186 (9.9%) |
| 75 Years and over | 277 (22.0%) | 554 (33.3%) |
Disability Class: Self-Care Difficulty
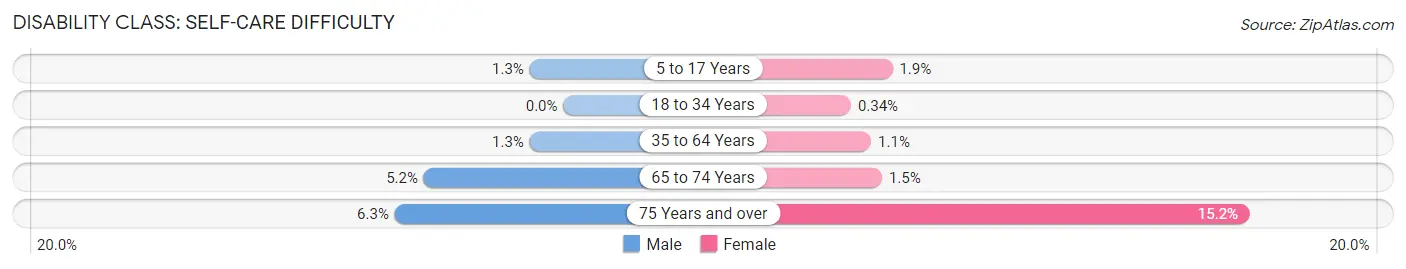
| Age Bracket | Male | Female |
| 5 to 17 Years | 37 (1.3%) | 59 (1.9%) |
| 18 to 34 Years | 0 (0.0%) | 11 (0.3%) |
| 35 to 64 Years | 73 (1.3%) | 66 (1.1%) |
| 65 to 74 Years | 85 (5.2%) | 28 (1.5%) |
| 75 Years and over | 79 (6.3%) | 252 (15.1%) |
Technology Access in Harvey County
Computing Device Access in Harvey County
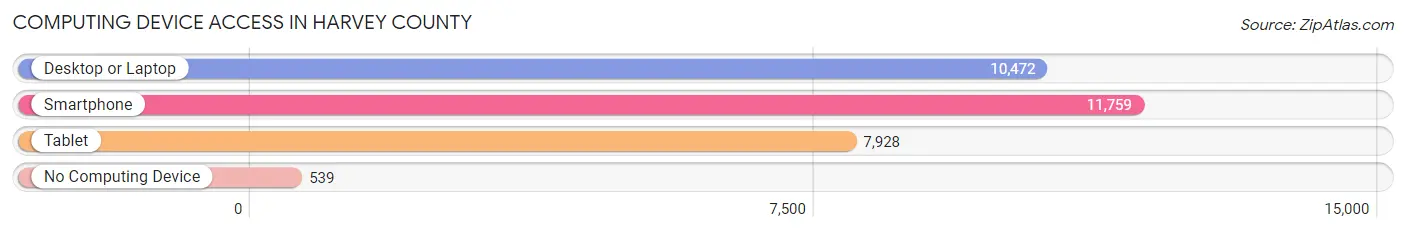
| Device Type | # Households | % Households |
| Desktop or Laptop | 10,472 | 79.1% |
| Smartphone | 11,759 | 88.8% |
| Tablet | 7,928 | 59.9% |
| No Computing Device | 539 | 4.1% |
| Total | 13,246 | 100.0% |
Internet Access in Harvey County
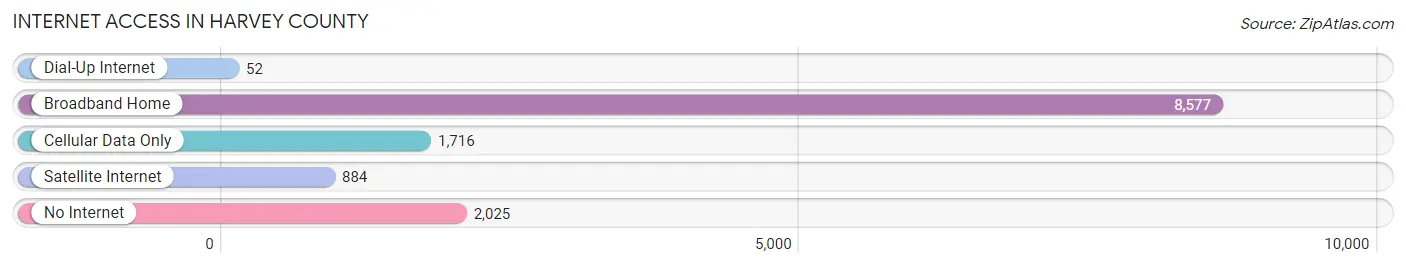
| Internet Type | # Households | % Households |
| Dial-Up Internet | 52 | 0.4% |
| Broadband Home | 8,577 | 64.7% |
| Cellular Data Only | 1,716 | 13.0% |
| Satellite Internet | 884 | 6.7% |
| No Internet | 2,025 | 15.3% |
| Total | 13,246 | 100.0% |
Harvey County Summary
Harvey County is located in the south-central region of Kansas, and is part of the Wichita metropolitan area. The county was established in 1872 and named after James M. Harvey, a former governor of Kansas. As of the 2010 census, the population of Harvey County was 34,684.
Geography
Harvey County is located in the south-central region of Kansas, and is part of the Wichita metropolitan area. The county is bordered by Sedgwick County to the north, Reno County to the east, Kingman County to the south, and McPherson County to the west. The county covers an area of 576 square miles, of which 575 square miles is land and 1 square mile is water. The county is located in the Arkansas River Valley, and is characterized by rolling hills and flat plains. The highest point in the county is located in the northwest corner, at an elevation of 1,717 feet.
The county is home to several bodies of water, including the Arkansas River, which forms the northern border of the county, and the Little Arkansas River, which flows through the county. Other bodies of water include the Harvey County Reservoir, the Harvey County State Lake, and several smaller lakes and ponds.
Economy
The economy of Harvey County is largely based on agriculture, with the county being home to several large farms and ranches. The county is also home to several manufacturing companies, including Cessna Aircraft Company, which produces aircraft components, and Koch Industries, which produces chemicals and other products.
The county is also home to several retail and service businesses, including several restaurants, hotels, and other businesses. The county is also home to several educational institutions, including Hutchinson Community College and Bethel College.
Demographics
As of the 2010 census, the population of Harvey County was 34,684, with a population density of 60.3 people per square mile. The racial makeup of the county was 91.2% White, 4.2% Hispanic or Latino, 1.7% African American, 0.7% Native American, 0.5% Asian, 0.1% Pacific Islander, and 1.7% from other races.
The median household income in the county was $50,945, and the median family income was $60,945. The per capita income in the county was $24,945. About 8.2% of the population was below the poverty line.
Conclusion
Harvey County is located in the south-central region of Kansas, and is part of the Wichita metropolitan area. The county was established in 1872 and named after James M. Harvey, a former governor of Kansas. As of the 2010 census, the population of Harvey County was 34,684. The economy of Harvey County is largely based on agriculture, with the county being home to several large farms and ranches. The county is also home to several manufacturing companies, retail and service businesses, and educational institutions. The racial makeup of the county was 91.2% White, 4.2% Hispanic or Latino, 1.7% African American, 0.7% Native American, 0.5% Asian, 0.1% Pacific Islander, and 1.7% from other races. The median household income in the county was $50,945, and the median family income was $60,945. About 8.2% of the population was below the poverty line.
Common Questions
What is the Total Population of Harvey County?
Total Population of Harvey County is 33,959.
What is the Total Male Population of Harvey County?
Total Male Population of Harvey County is 16,679.
What is the Total Female Population of Harvey County?
Total Female Population of Harvey County is 17,280.
What is the Ratio of Males per 100 Females in Harvey County?
There are 96.52 Males per 100 Females in Harvey County.
What is the Ratio of Females per 100 Males in Harvey County?
There are 103.60 Females per 100 Males in Harvey County.
What is the Median Population Age in Harvey County?
Median Population Age in Harvey County is 40.5 Years.
What is the Average Family Size in Harvey County
Average Family Size in Harvey County is 3.0 People.
What is the Average Household Size in Harvey County
Average Household Size in Harvey County is 2.5 People.
What is Per Capita Income in Harvey County?
Per Capita income in Harvey County is $33,965.
What is the Median Family Income in Harvey County?
Median Family Income in Harvey County is $84,091.
What is the Median Household income in Harvey County?
Median Household Income in Harvey County is $70,685.
What is Income or Wage Gap in Harvey County?
Income or Wage Gap in Harvey County is 37.0%.
Women in Harvey County earn 63.0 cents for every dollar earned by a man.
What is Family Income Deficit in Harvey County?
Family Income Deficit in Harvey County is $7,806.
Families that are below poverty line in Harvey County earn $7,806 less on average than the poverty threshold level.
What is Inequality or Gini Index in Harvey County?
Inequality or Gini Index in Harvey County is 0.39.
How Large is the Labor Force in Harvey County?
There are 17,530 People in the Labor Forcein in Harvey County.
What is the Percentage of People in the Labor Force in Harvey County?
65.9% of People are in the Labor Force in Harvey County.
What is the Unemployment Rate in Harvey County?
Unemployment Rate in Harvey County is 4.2%.