Gove County, KS
Gove County Map

Gove County Overview
2,758
TOTAL POPULATION
1,402
MALE POPULATION
1,356
FEMALE POPULATION
103.39
MALES / 100 FEMALES
96.72
FEMALES / 100 MALES
42.1
MEDIAN AGE
3.0
AVG FAMILY SIZE
2.3
AVG HOUSEHOLD SIZE
$33,295
PER CAPITA INCOME
$78,833
AVG FAMILY INCOME
$59,417
AVG HOUSEHOLD INCOME
43.3%
WAGE / INCOME GAP [ % ]
56.7¢/ $1
WAGE / INCOME GAP [ $ ]
0.42
INEQUALITY / GINI INDEX
1,340
LABOR FORCE [ PEOPLE ]
63.6%
PERCENT IN LABOR FORCE
3.3%
UNEMPLOYMENT RATE
Gove County Area Codes
Race in Gove County
The most populous races in Gove County are White / Caucasian (2,625 | 95.2%), Two or more Races (73 | 2.6%), and Hispanic or Latino (64 | 2.3%).

| Race | # Population | % Population |
| Asian | 30 | 1.1% |
| Black / African American | 21 | 0.8% |
| Hawaiian / Pacific | 0 | 0.0% |
| Hispanic or Latino | 64 | 2.3% |
| Native / Alaskan | 0 | 0.0% |
| White / Caucasian | 2,625 | 95.2% |
| Two or more Races | 73 | 2.6% |
| Some other Race | 9 | 0.3% |
| Total | 2,758 | 100.0% |
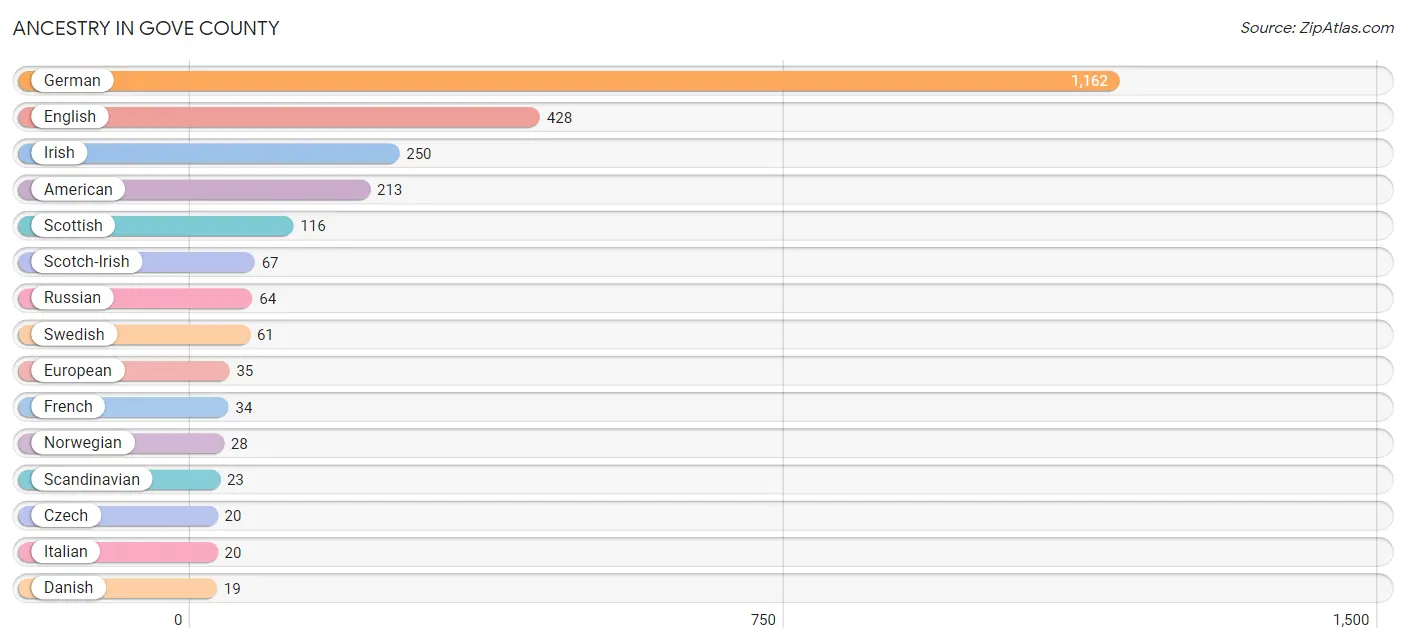
Ancestry in Gove County
The most populous ancestries reported in Gove County are German (1,162 | 42.1%), English (428 | 15.5%), Irish (250 | 9.1%), American (213 | 7.7%), and Scottish (116 | 4.2%), together accounting for 78.6% of all Gove County residents.
| Ancestry | # Population | % Population |
| American | 213 | 7.7% |
| Australian | 4 | 0.2% |
| Austrian | 13 | 0.5% |
| Belgian | 4 | 0.2% |
| Blackfeet | 2 | 0.1% |
| British | 11 | 0.4% |
| Canadian | 2 | 0.1% |
| Cherokee | 12 | 0.4% |
| Comanche | 3 | 0.1% |
| Cree | 2 | 0.1% |
| Cuban | 9 | 0.3% |
| Czech | 20 | 0.7% |
| Czechoslovakian | 2 | 0.1% |
| Danish | 19 | 0.7% |
| Dominican | 3 | 0.1% |
| Dutch | 18 | 0.6% |
| English | 428 | 15.5% |
| European | 35 | 1.3% |
| Finnish | 8 | 0.3% |
| French | 34 | 1.2% |
| French Canadian | 6 | 0.2% |
| German | 1,162 | 42.1% |
| German Russian | 12 | 0.4% |
| Hungarian | 3 | 0.1% |
| Indian (Asian) | 16 | 0.6% |
| Irish | 250 | 9.1% |
| Iroquois | 3 | 0.1% |
| Italian | 20 | 0.7% |
| Mexican | 11 | 0.4% |
| Norwegian | 28 | 1.0% |
| Polish | 19 | 0.7% |
| Puerto Rican | 18 | 0.6% |
| Russian | 64 | 2.3% |
| Scandinavian | 23 | 0.8% |
| Scotch-Irish | 67 | 2.4% |
| Scottish | 116 | 4.2% |
| South African | 2 | 0.1% |
| Spanish | 18 | 0.6% |
| Sri Lankan | 4 | 0.2% |
| Subsaharan African | 11 | 0.4% |
| Swedish | 61 | 2.2% |
| Swiss | 5 | 0.2% |
| Thai | 10 | 0.4% |
| Ukrainian | 7 | 0.3% |
| Welsh | 18 | 0.6% | View All 45 Rows |
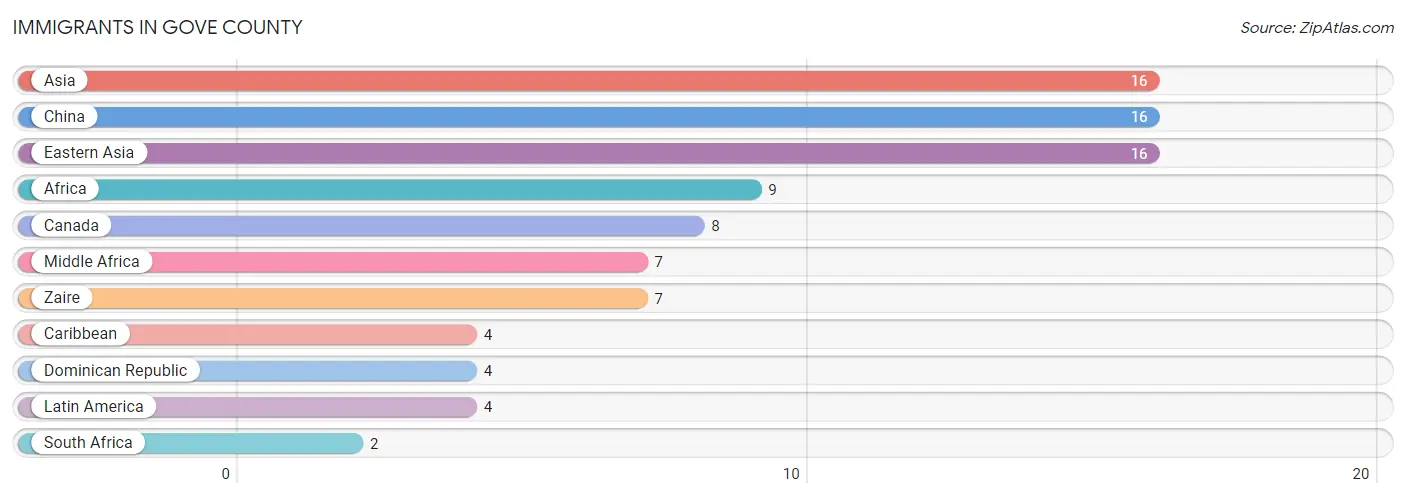
Immigrants in Gove County
The most numerous immigrant groups reported in Gove County came from Asia (16 | 0.6%), China (16 | 0.6%), Eastern Asia (16 | 0.6%), Africa (9 | 0.3%), and Canada (8 | 0.3%), together accounting for 2.4% of all Gove County residents.
| Immigration Origin | # Population | % Population |
| Africa | 9 | 0.3% |
| Asia | 16 | 0.6% |
| Canada | 8 | 0.3% |
| Caribbean | 4 | 0.2% |
| China | 16 | 0.6% |
| Dominican Republic | 4 | 0.2% |
| Eastern Asia | 16 | 0.6% |
| Latin America | 4 | 0.2% |
| Middle Africa | 7 | 0.3% |
| South Africa | 2 | 0.1% |
| Zaire | 7 | 0.3% | View All 11 Rows |
Sex and Age in Gove County
Sex and Age in Gove County
The most populous age groups in Gove County are Under 5 Years (113 | 8.1%) for men and 60 to 64 Years (111 | 8.2%) for women.

| Age Bracket | Male | Female |
| Under 5 Years | 113 (8.1%) | 89 (6.6%) |
| 5 to 9 Years | 107 (7.6%) | 106 (7.8%) |
| 10 to 14 Years | 106 (7.6%) | 91 (6.7%) |
| 15 to 19 Years | 103 (7.3%) | 58 (4.3%) |
| 20 to 24 Years | 42 (3.0%) | 60 (4.4%) |
| 25 to 29 Years | 63 (4.5%) | 67 (4.9%) |
| 30 to 34 Years | 80 (5.7%) | 92 (6.8%) |
| 35 to 39 Years | 70 (5.0%) | 72 (5.3%) |
| 40 to 44 Years | 85 (6.1%) | 66 (4.9%) |
| 45 to 49 Years | 76 (5.4%) | 47 (3.5%) |
| 50 to 54 Years | 75 (5.3%) | 48 (3.5%) |
| 55 to 59 Years | 89 (6.4%) | 72 (5.3%) |
| 60 to 64 Years | 113 (8.1%) | 111 (8.2%) |
| 65 to 69 Years | 89 (6.4%) | 82 (6.0%) |
| 70 to 74 Years | 58 (4.1%) | 92 (6.8%) |
| 75 to 79 Years | 42 (3.0%) | 82 (6.0%) |
| 80 to 84 Years | 43 (3.1%) | 69 (5.1%) |
| 85 Years and over | 48 (3.4%) | 52 (3.8%) |
| Total | 1,402 (100.0%) | 1,356 (100.0%) |
Families and Households in Gove County
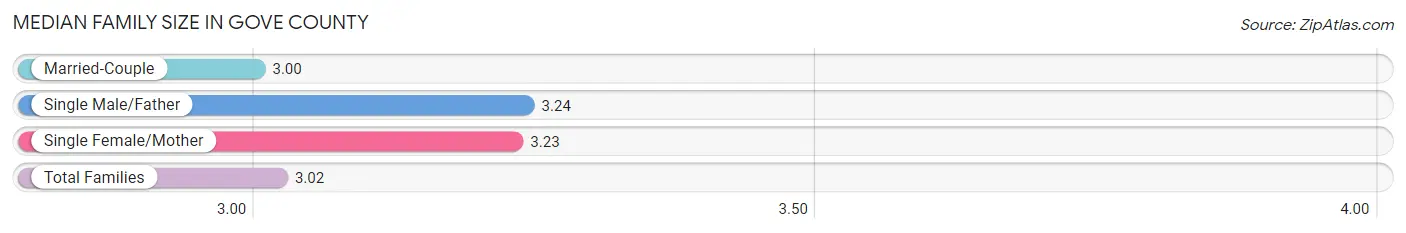
Median Family Size in Gove County
The median family size in Gove County is 3.02 persons per family, with single male/father families (21 | 2.9%) accounting for the largest median family size of 3.24 persons per family. On the other hand, married-couple families (663 | 91.1%) represent the smallest median family size with 3.00 persons per family.
| Family Type | # Families | Family Size |
| Married-Couple | 663 (91.1%) | 3.00 |
| Single Male/Father | 21 (2.9%) | 3.24 |
| Single Female/Mother | 44 (6.0%) | 3.23 |
| Total Families | 728 (100.0%) | 3.02 |
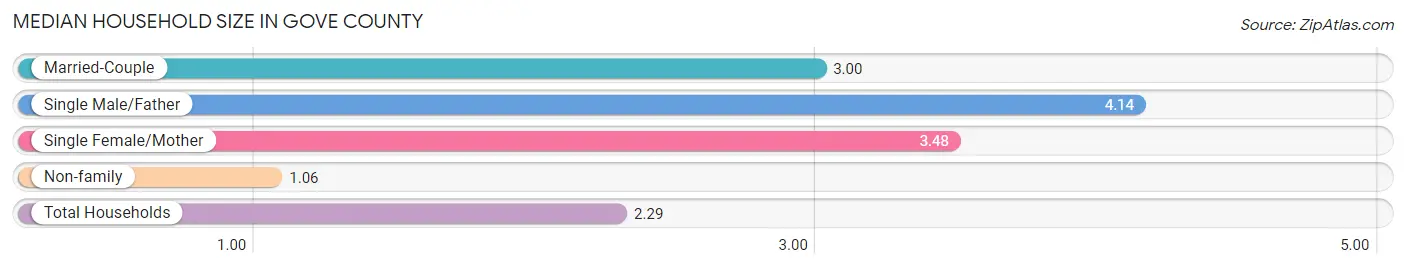
Median Household Size in Gove County
The median household size in Gove County is 2.29 persons per household, with single male/father households (21 | 1.8%) accounting for the largest median household size of 4.14 persons per household. non-family households (454 | 38.4%) represent the smallest median household size with 1.06 persons per household.
| Household Type | # Households | Household Size |
| Married-Couple | 663 (56.1%) | 3.00 |
| Single Male/Father | 21 (1.8%) | 4.14 |
| Single Female/Mother | 44 (3.7%) | 3.48 |
| Non-family | 454 (38.4%) | 1.06 |
| Total Households | 1,182 (100.0%) | 2.29 |
Household Size by Marriage Status in Gove County
Out of a total of 1,182 households in Gove County, 728 (61.6%) are family households, while 454 (38.4%) are nonfamily households. The most numerous type of family households are 2-person households, comprising 393, and the most common type of nonfamily households are 1-person households, comprising 430.
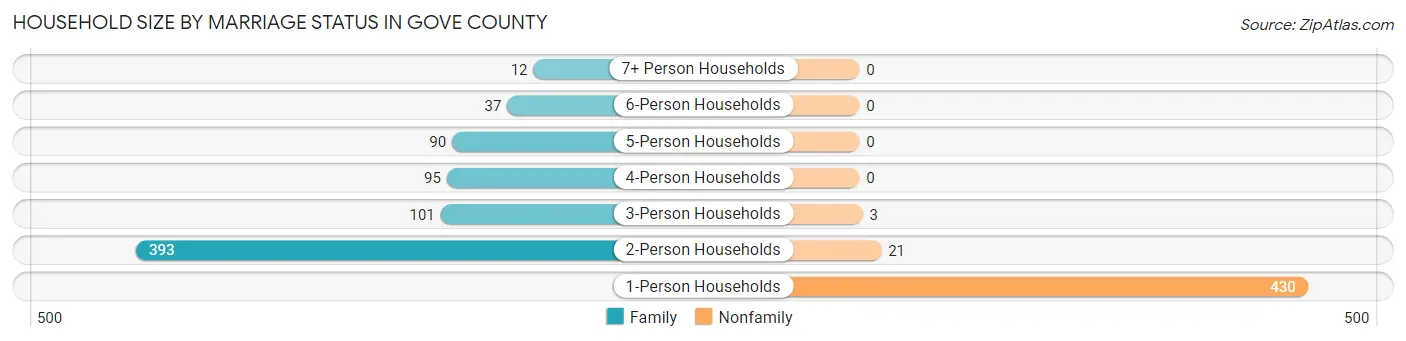
| Household Size | Family Households | Nonfamily Households |
| 1-Person Households | - | 430 (36.4%) |
| 2-Person Households | 393 (33.3%) | 21 (1.8%) |
| 3-Person Households | 101 (8.5%) | 3 (0.3%) |
| 4-Person Households | 95 (8.0%) | 0 (0.0%) |
| 5-Person Households | 90 (7.6%) | 0 (0.0%) |
| 6-Person Households | 37 (3.1%) | 0 (0.0%) |
| 7+ Person Households | 12 (1.0%) | 0 (0.0%) |
| Total | 728 (61.6%) | 454 (38.4%) |
Female Fertility in Gove County
Fertility by Age in Gove County
Average fertility rate in Gove County is 90.0 births per 1,000 women. Women in the age bracket of 20 to 34 years have the highest fertility rate with 110.0 births per 1,000 women. Women in the age bracket of 20 to 34 years acount for 55.8% of all women with births.
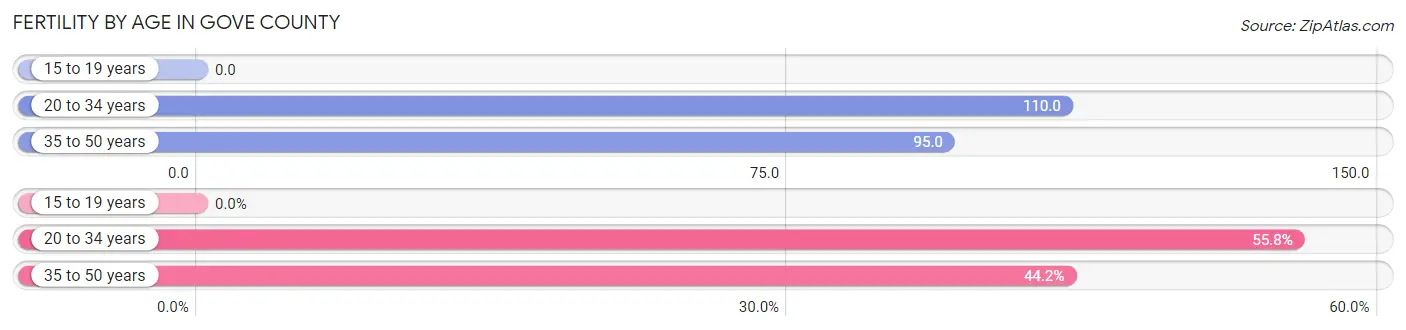
| Age Bracket | Women with Births | Births / 1,000 Women |
| 15 to 19 years | 0 (0.0%) | 0.0 |
| 20 to 34 years | 24 (55.8%) | 110.0 |
| 35 to 50 years | 19 (44.2%) | 95.0 |
| Total | 43 (100.0%) | 90.0 |
Fertility by Age by Marriage Status in Gove County
90.7% of women with births (43) in Gove County are married. The highest percentage of unmarried women with births falls into 20 to 34 years age bracket with 16.7% of them unmarried at the time of birth, while the lowest percentage of unmarried women with births belong to 35 to 50 years age bracket with 0.0% of them unmarried.
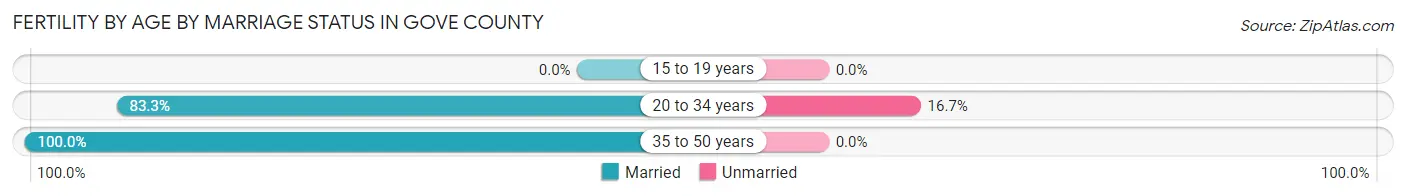
| Age Bracket | Married | Unmarried |
| 15 to 19 years | 0 (0.0%) | 0 (0.0%) |
| 20 to 34 years | 20 (83.3%) | 4 (16.7%) |
| 35 to 50 years | 19 (100.0%) | 0 (0.0%) |
| Total | 39 (90.7%) | 4 (9.3%) |
Fertility by Education in Gove County

| Educational Attainment | Women with Births | Births / 1,000 Women |
| Less than High School | 16 (37.2%) | 193.0 |
| High School Diploma | 2 (4.6%) | 17.0 |
| College or Associate's Degree | 16 (37.2%) | 125.0 |
| Bachelor's Degree | 9 (20.9%) | 75.0 |
| Graduate Degree | 0 (0.0%) | 0.0 |
| Total | 43 (100.0%) | 90.0 |
Fertility by Education by Marriage Status in Gove County
9.3% of women with births in Gove County are unmarried. Women with the educational attainment of less than high school are most likely to be married with 100.0% of them married at childbirth, while women with the educational attainment of college or associate's degree are least likely to be married with 25.0% of them unmarried at childbirth.
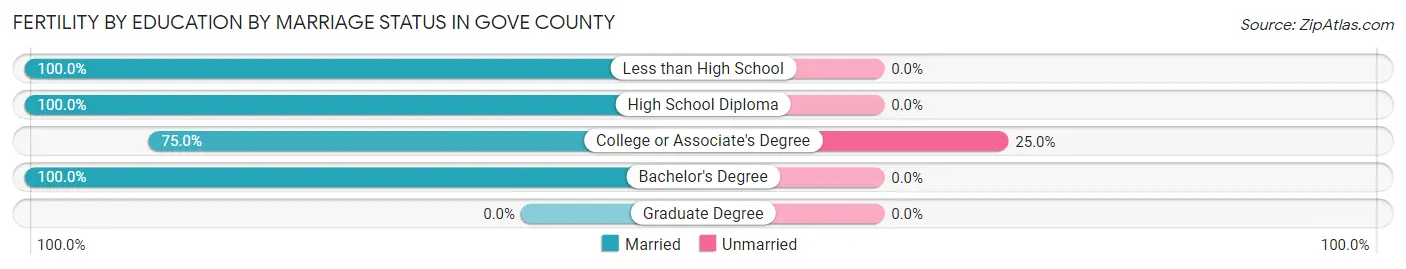
| Educational Attainment | Married | Unmarried |
| Less than High School | 16 (100.0%) | 0 (0.0%) |
| High School Diploma | 2 (100.0%) | 0 (0.0%) |
| College or Associate's Degree | 12 (75.0%) | 4 (25.0%) |
| Bachelor's Degree | 9 (100.0%) | 0 (0.0%) |
| Graduate Degree | 0 (0.0%) | 0 (0.0%) |
| Total | 39 (90.7%) | 4 (9.3%) |
Income in Gove County
Income Overview in Gove County
Per Capita Income in Gove County is $33,295, while median incomes of families and households are $78,833 and $59,417 respectively.
| Characteristic | Number | Measure |
| Per Capita Income | 2,758 | $33,295 |
| Median Family Income | 728 | $78,833 |
| Mean Family Income | 728 | $93,552 |
| Median Household Income | 1,182 | $59,417 |
| Mean Household Income | 1,182 | $76,425 |
| Income Deficit | 728 | $0 |
| Wage / Income Gap (%) | 2,758 | 43.28% |
| Wage / Income Gap ($) | 2,758 | 56.72¢ per $1 |
| Gini / Inequality Index | 2,758 | 0.42 |
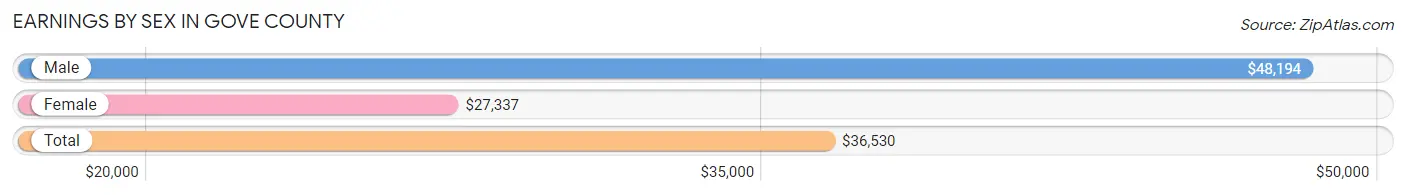
Earnings by Sex in Gove County
Average Earnings in Gove County are $36,530, $48,194 for men and $27,337 for women, a difference of 43.3%.
| Sex | Number | Average Earnings |
| Male | 838 (56.9%) | $48,194 |
| Female | 635 (43.1%) | $27,337 |
| Total | 1,473 (100.0%) | $36,530 |
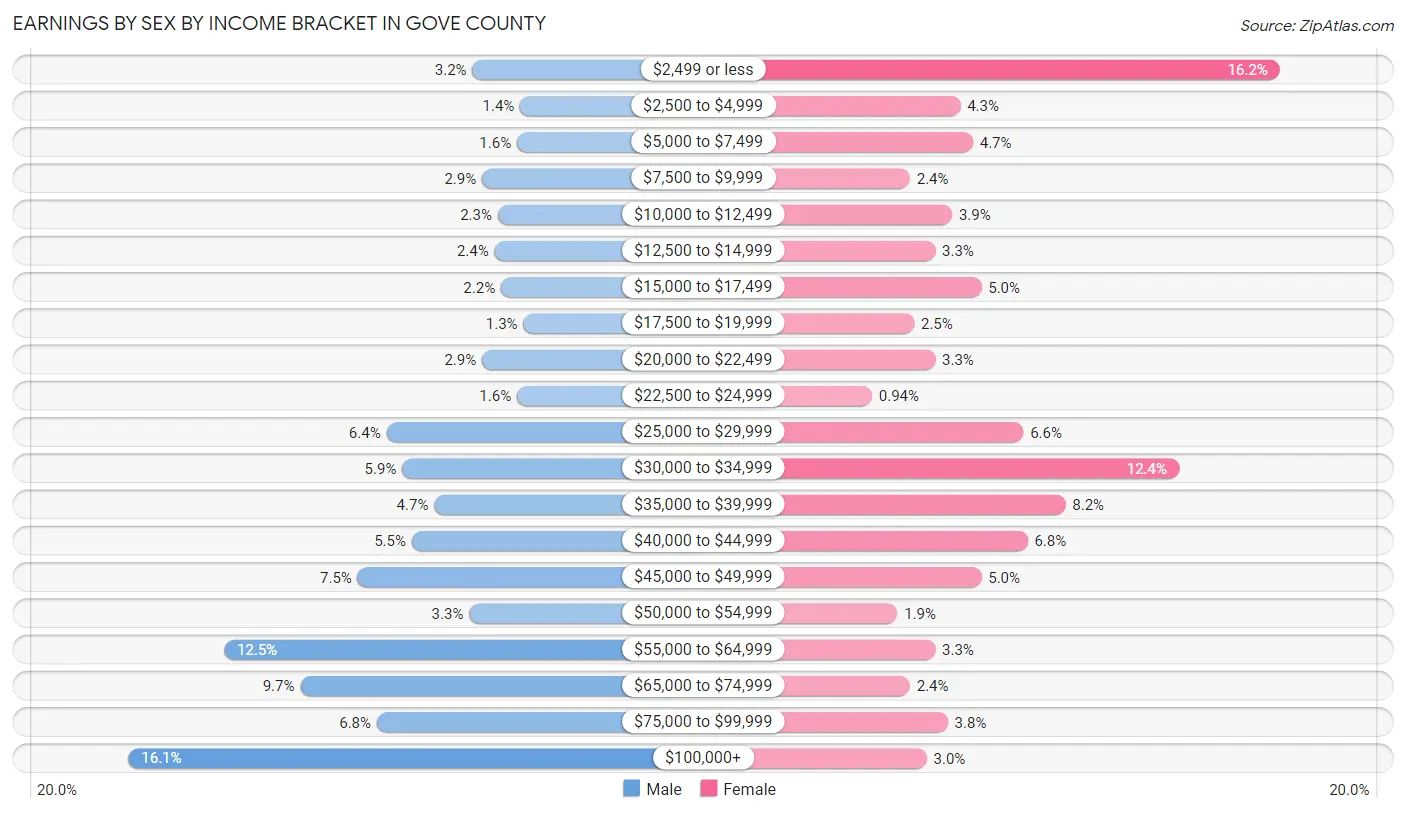
Earnings by Sex by Income Bracket in Gove County
The most common earnings brackets in Gove County are $100,000+ for men (135 | 16.1%) and $2,499 or less for women (103 | 16.2%).
| Income | Male | Female |
| $2,499 or less | 27 (3.2%) | 103 (16.2%) |
| $2,500 to $4,999 | 12 (1.4%) | 27 (4.3%) |
| $5,000 to $7,499 | 13 (1.5%) | 30 (4.7%) |
| $7,500 to $9,999 | 24 (2.9%) | 15 (2.4%) |
| $10,000 to $12,499 | 19 (2.3%) | 25 (3.9%) |
| $12,500 to $14,999 | 20 (2.4%) | 21 (3.3%) |
| $15,000 to $17,499 | 18 (2.1%) | 32 (5.0%) |
| $17,500 to $19,999 | 11 (1.3%) | 16 (2.5%) |
| $20,000 to $22,499 | 24 (2.9%) | 21 (3.3%) |
| $22,500 to $24,999 | 13 (1.5%) | 6 (0.9%) |
| $25,000 to $29,999 | 54 (6.4%) | 42 (6.6%) |
| $30,000 to $34,999 | 49 (5.9%) | 79 (12.4%) |
| $35,000 to $39,999 | 39 (4.6%) | 52 (8.2%) |
| $40,000 to $44,999 | 46 (5.5%) | 43 (6.8%) |
| $45,000 to $49,999 | 63 (7.5%) | 32 (5.0%) |
| $50,000 to $54,999 | 28 (3.3%) | 12 (1.9%) |
| $55,000 to $64,999 | 105 (12.5%) | 21 (3.3%) |
| $65,000 to $74,999 | 81 (9.7%) | 15 (2.4%) |
| $75,000 to $99,999 | 57 (6.8%) | 24 (3.8%) |
| $100,000+ | 135 (16.1%) | 19 (3.0%) |
| Total | 838 (100.0%) | 635 (100.0%) |
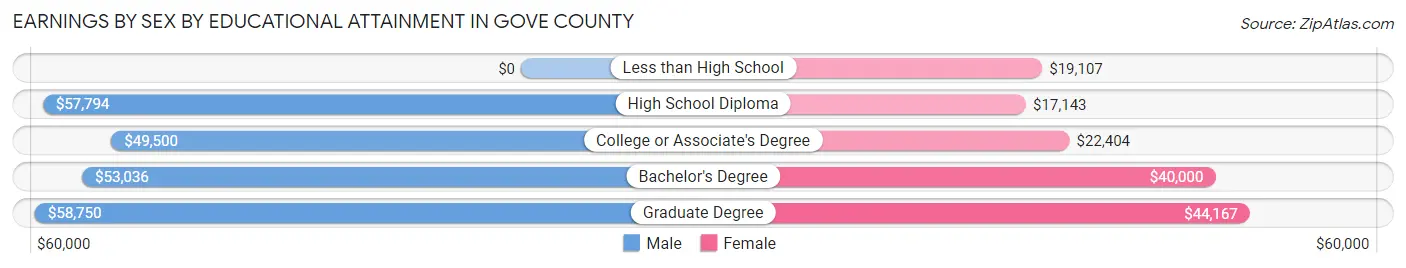
Earnings by Sex by Educational Attainment in Gove County
Average earnings in Gove County are $55,238 for men and $30,104 for women, a difference of 45.5%. Men with an educational attainment of graduate degree enjoy the highest average annual earnings of $58,750, while those with college or associate's degree education earn the least with $49,500. Women with an educational attainment of graduate degree earn the most with the average annual earnings of $44,167, while those with high school diploma education have the smallest earnings of $17,143.
| Educational Attainment | Male Income | Female Income |
| Less than High School | - | - |
| High School Diploma | $57,794 | $17,143 |
| College or Associate's Degree | $49,500 | $22,404 |
| Bachelor's Degree | $53,036 | $40,000 |
| Graduate Degree | $58,750 | $44,167 |
| Total | $55,238 | $30,104 |
Family Income in Gove County
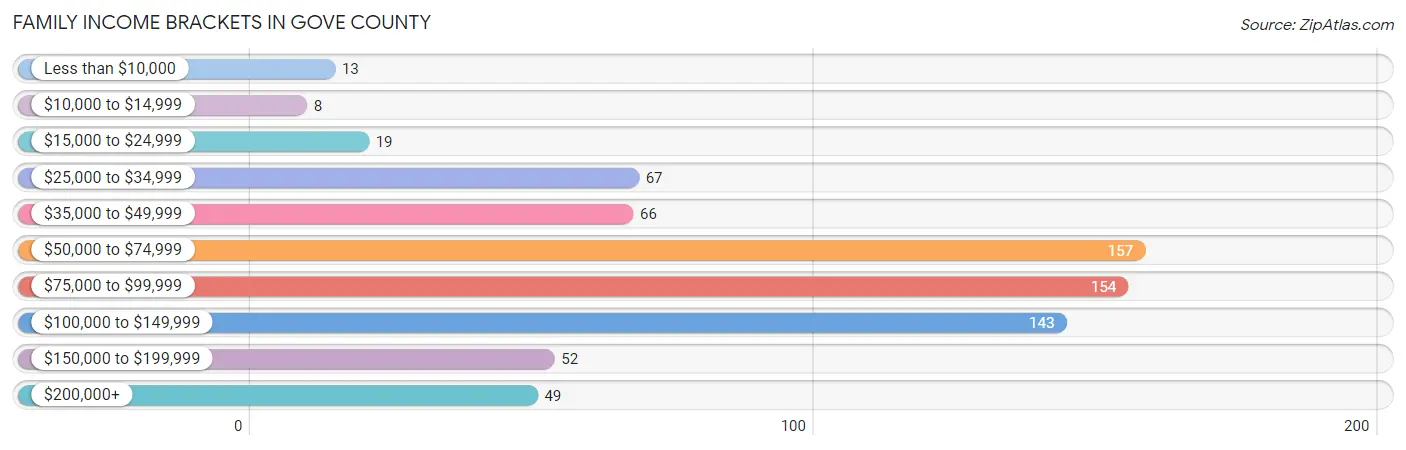
Family Income Brackets in Gove County
According to the Gove County family income data, there are 157 families falling into the $50,000 to $74,999 income range, which is the most common income bracket and makes up 21.6% of all families. Conversely, the $10,000 to $14,999 income bracket is the least frequent group with only 8 families (1.1%) belonging to this category.
| Income Bracket | # Families | % Families |
| Less than $10,000 | 13 | 1.8% |
| $10,000 to $14,999 | 8 | 1.1% |
| $15,000 to $24,999 | 19 | 2.6% |
| $25,000 to $34,999 | 67 | 9.2% |
| $35,000 to $49,999 | 66 | 9.1% |
| $50,000 to $74,999 | 157 | 21.6% |
| $75,000 to $99,999 | 154 | 21.2% |
| $100,000 to $149,999 | 143 | 19.6% |
| $150,000 to $199,999 | 52 | 7.1% |
| $200,000+ | 49 | 6.7% |
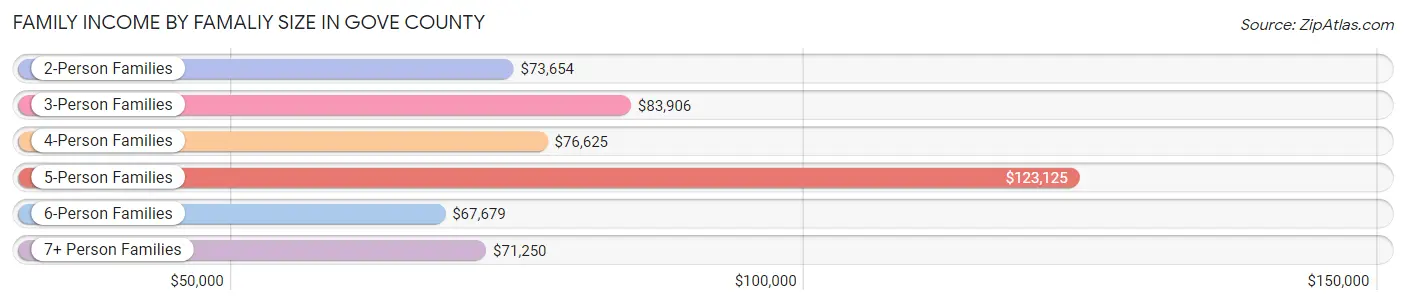
Family Income by Famaliy Size in Gove County
5-person families (84 | 11.5%) account for the highest median family income in Gove County with $123,125 per family, while 2-person families (406 | 55.8%) have the highest median income of $36,827 per family member.
| Income Bracket | # Families | Median Income |
| 2-Person Families | 406 (55.8%) | $73,654 |
| 3-Person Families | 91 (12.5%) | $83,906 |
| 4-Person Families | 100 (13.7%) | $76,625 |
| 5-Person Families | 84 (11.5%) | $123,125 |
| 6-Person Families | 37 (5.1%) | $67,679 |
| 7+ Person Families | 10 (1.4%) | $71,250 |
| Total | 728 (100.0%) | $78,833 |
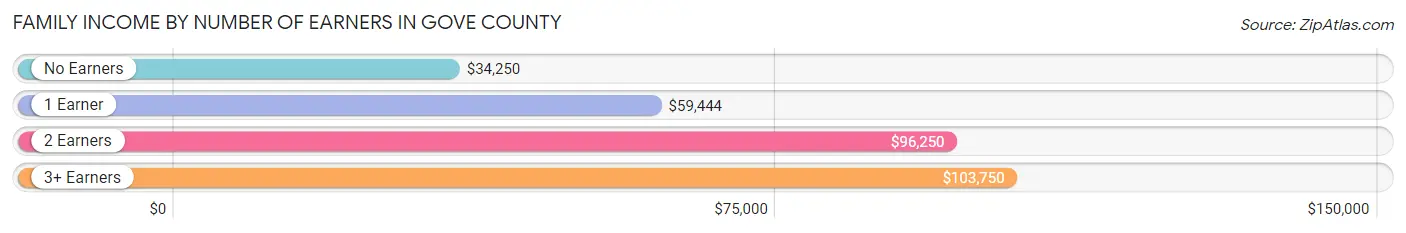
Family Income by Number of Earners in Gove County
The median family income in Gove County is $78,833, with families comprising 3+ earners (72) having the highest median family income of $103,750, while families with no earners (136) have the lowest median family income of $34,250, accounting for 9.9% and 18.7% of families, respectively.
| Number of Earners | # Families | Median Income |
| No Earners | 136 (18.7%) | $34,250 |
| 1 Earner | 158 (21.7%) | $59,444 |
| 2 Earners | 362 (49.7%) | $96,250 |
| 3+ Earners | 72 (9.9%) | $103,750 |
| Total | 728 (100.0%) | $78,833 |
Household Income in Gove County
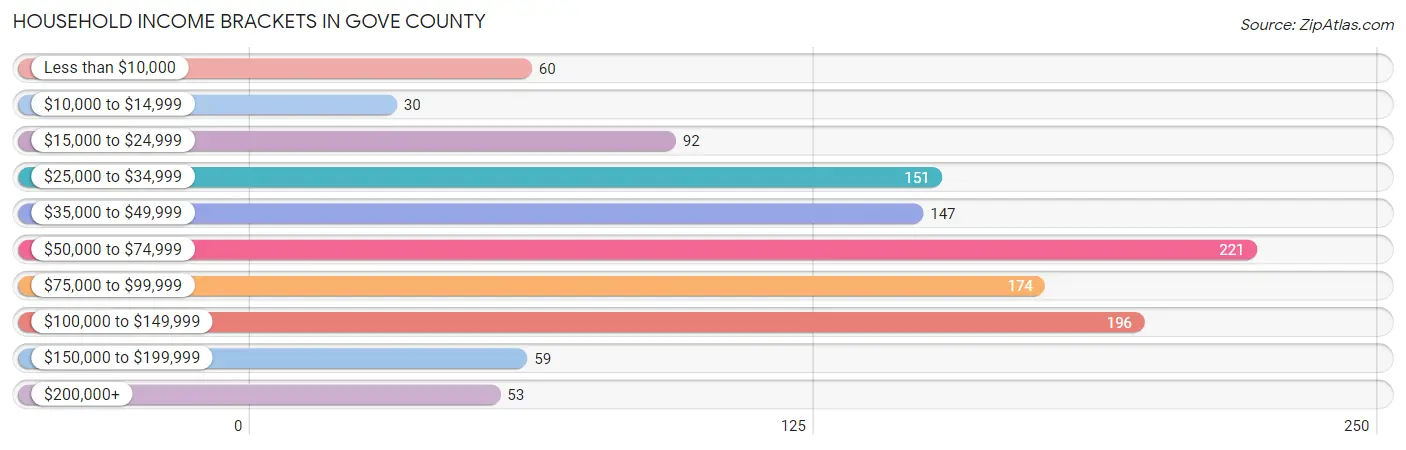
Household Income Brackets in Gove County
With 221 households falling in the category, the $50,000 to $74,999 income range is the most frequent in Gove County, accounting for 18.7% of all households. In contrast, only 30 households (2.5%) fall into the $10,000 to $14,999 income bracket, making it the least populous group.
| Income Bracket | # Households | % Households |
| Less than $10,000 | 60 | 5.1% |
| $10,000 to $14,999 | 30 | 2.5% |
| $15,000 to $24,999 | 92 | 7.8% |
| $25,000 to $34,999 | 151 | 12.8% |
| $35,000 to $49,999 | 147 | 12.4% |
| $50,000 to $74,999 | 221 | 18.7% |
| $75,000 to $99,999 | 174 | 14.7% |
| $100,000 to $149,999 | 196 | 16.6% |
| $150,000 to $199,999 | 59 | 5.0% |
| $200,000+ | 53 | 4.5% |
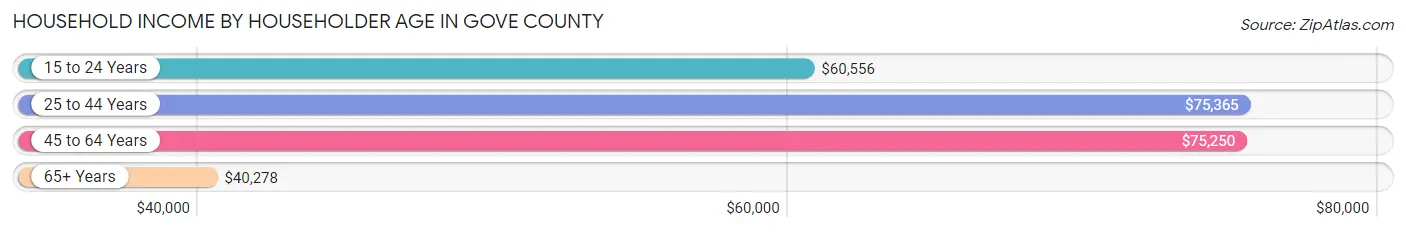
Household Income by Householder Age in Gove County
The median household income in Gove County is $59,417, with the highest median household income of $75,365 found in the 25 to 44 years age bracket for the primary householder. A total of 295 households (25.0%) fall into this category. Meanwhile, the 65+ years age bracket for the primary householder has the lowest median household income of $40,278, with 426 households (36.0%) in this group.
| Income Bracket | # Households | Median Income |
| 15 to 24 Years | 42 (3.5%) | $60,556 |
| 25 to 44 Years | 295 (25.0%) | $75,365 |
| 45 to 64 Years | 419 (35.4%) | $75,250 |
| 65+ Years | 426 (36.0%) | $40,278 |
| Total | 1,182 (100.0%) | $59,417 |
Poverty in Gove County
Income Below Poverty by Sex and Age in Gove County
With 5.8% poverty level for males and 7.0% for females among the residents of Gove County, 18 to 24 year old males and 75 year old and over females are the most vulnerable to poverty, with 15 males (19.7%) and 31 females (17.1%) in their respective age groups living below the poverty level.

| Age Bracket | Male | Female |
| Under 5 Years | 3 (2.7%) | 4 (4.5%) |
| 5 Years | 0 (0.0%) | 1 (12.5%) |
| 6 to 11 Years | 16 (11.8%) | 0 (0.0%) |
| 12 to 14 Years | 1 (1.7%) | 0 (0.0%) |
| 15 Years | 1 (3.5%) | 0 (0.0%) |
| 16 and 17 Years | 0 (0.0%) | 0 (0.0%) |
| 18 to 24 Years | 15 (19.7%) | 2 (2.6%) |
| 25 to 34 Years | 3 (2.1%) | 18 (11.3%) |
| 35 to 44 Years | 5 (3.2%) | 7 (5.1%) |
| 45 to 54 Years | 0 (0.0%) | 0 (0.0%) |
| 55 to 64 Years | 13 (6.4%) | 10 (5.5%) |
| 65 to 74 Years | 9 (6.3%) | 20 (12.1%) |
| 75 Years and over | 14 (10.9%) | 31 (17.1%) |
| Total | 80 (5.8%) | 93 (7.0%) |
Income Above Poverty by Sex and Age in Gove County
According to the poverty statistics in Gove County, males aged 5 years and females aged 6 to 11 years are the age groups that are most secure financially, with 100.0% of males and 100.0% of females in these age groups living above the poverty line.

| Age Bracket | Male | Female |
| Under 5 Years | 108 (97.3%) | 85 (95.5%) |
| 5 Years | 13 (100.0%) | 7 (87.5%) |
| 6 to 11 Years | 119 (88.1%) | 122 (100.0%) |
| 12 to 14 Years | 59 (98.3%) | 65 (100.0%) |
| 15 Years | 28 (96.6%) | 10 (100.0%) |
| 16 and 17 Years | 39 (100.0%) | 31 (100.0%) |
| 18 to 24 Years | 61 (80.3%) | 75 (97.4%) |
| 25 to 34 Years | 140 (97.9%) | 141 (88.7%) |
| 35 to 44 Years | 150 (96.8%) | 131 (94.9%) |
| 45 to 54 Years | 151 (100.0%) | 95 (100.0%) |
| 55 to 64 Years | 189 (93.6%) | 173 (94.5%) |
| 65 to 74 Years | 133 (93.7%) | 145 (87.9%) |
| 75 Years and over | 114 (89.1%) | 150 (82.9%) |
| Total | 1,304 (94.2%) | 1,230 (93.0%) |
Income Below Poverty Among Married-Couple Families in Gove County
The poverty statistics for married-couple families in Gove County show that 3.3% or 22 of the total 663 families live below the poverty line. Families with 5 or more children have the highest poverty rate of 10.0%, comprising of 1 families. On the other hand, families with 3 or 4 children have the lowest poverty rate of 1.0%, which includes 1 families.
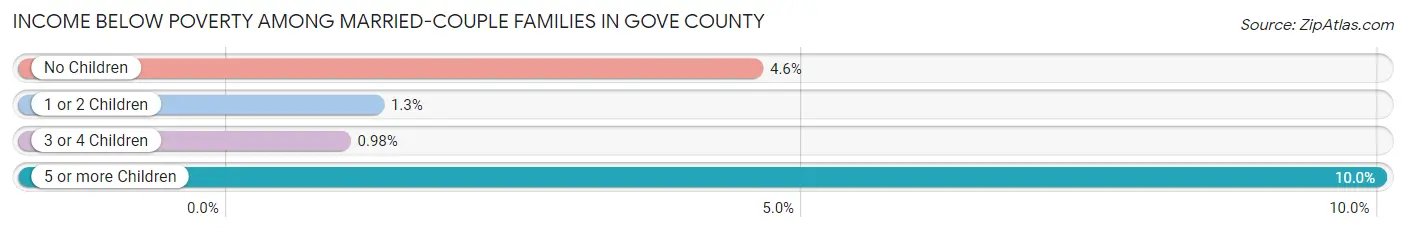
| Children | Above Poverty | Below Poverty |
| No Children | 376 (95.4%) | 18 (4.6%) |
| 1 or 2 Children | 155 (98.7%) | 2 (1.3%) |
| 3 or 4 Children | 101 (99.0%) | 1 (1.0%) |
| 5 or more Children | 9 (90.0%) | 1 (10.0%) |
| Total | 641 (96.7%) | 22 (3.3%) |
Income Below Poverty Among Single-Parent Households in Gove County
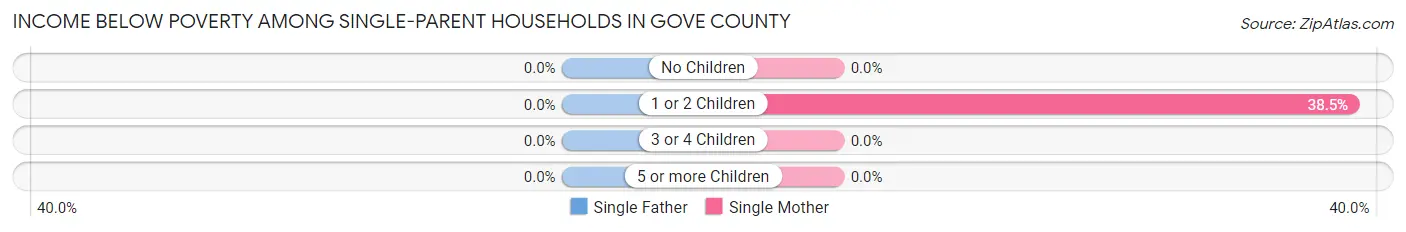
| Children | Single Father | Single Mother |
| No Children | 0 (0.0%) | 0 (0.0%) |
| 1 or 2 Children | 0 (0.0%) | 10 (38.5%) |
| 3 or 4 Children | 0 (0.0%) | 0 (0.0%) |
| 5 or more Children | 0 (0.0%) | 0 (0.0%) |
| Total | 0 (0.0%) | 10 (22.7%) |
Income Below Poverty Among Married-Couple vs Single-Parent Households in Gove County
The poverty data for Gove County shows that 22 of the married-couple family households (3.3%) and 10 of the single-parent households (15.4%) are living below the poverty level. Within the married-couple family households, those with 5 or more children have the highest poverty rate, with 1 households (10.0%) falling below the poverty line. Among the single-parent households, those with 1 or 2 children have the highest poverty rate, with 10 household (29.4%) living below poverty.
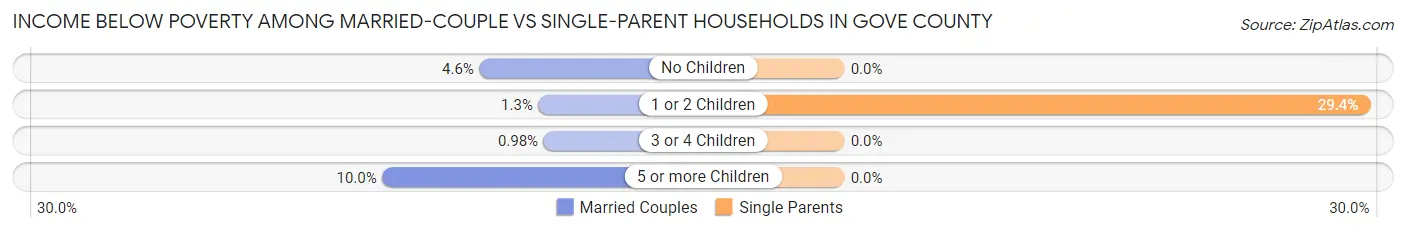
| Children | Married-Couple Families | Single-Parent Households |
| No Children | 18 (4.6%) | 0 (0.0%) |
| 1 or 2 Children | 2 (1.3%) | 10 (29.4%) |
| 3 or 4 Children | 1 (1.0%) | 0 (0.0%) |
| 5 or more Children | 1 (10.0%) | 0 (0.0%) |
| Total | 22 (3.3%) | 10 (15.4%) |
Employment Characteristics in Gove County
Employment by Class of Employer in Gove County
Among the 1,279 employed individuals in Gove County, private company employees (665 | 52.0%), self-employed (not incorporated) (192 | 15.0%), and local government employees (189 | 14.8%) make up the most common classes of employment.
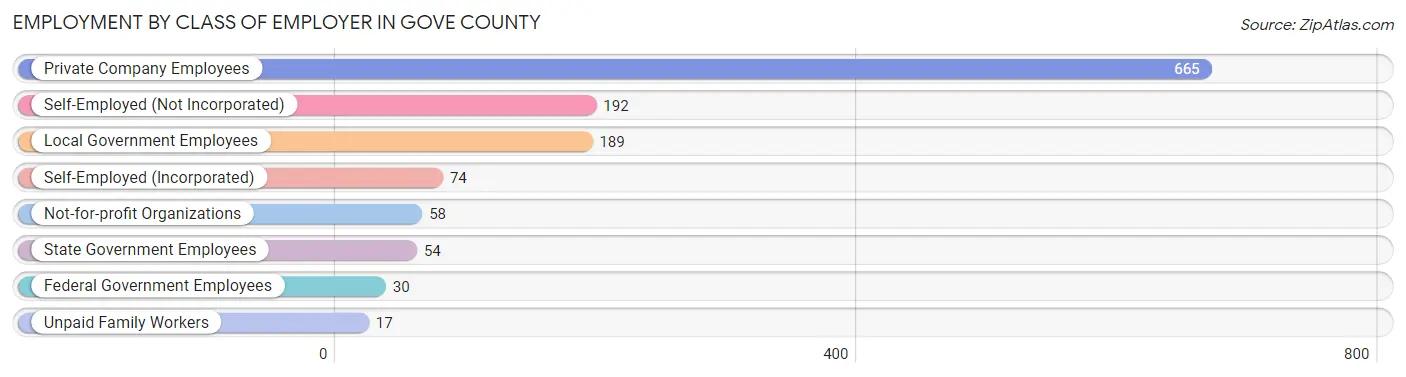
| Employer Class | # Employees | % Employees |
| Private Company Employees | 665 | 52.0% |
| Self-Employed (Incorporated) | 74 | 5.8% |
| Self-Employed (Not Incorporated) | 192 | 15.0% |
| Not-for-profit Organizations | 58 | 4.5% |
| Local Government Employees | 189 | 14.8% |
| State Government Employees | 54 | 4.2% |
| Federal Government Employees | 30 | 2.4% |
| Unpaid Family Workers | 17 | 1.3% |
| Total | 1,279 | 100.0% |
Employment Status by Age in Gove County
According to the labor force statistics for Gove County, out of the total population over 16 years of age (2,107), 63.6% or 1,340 individuals are in the labor force, with 3.3% or 44 of them unemployed. The age group with the highest labor force participation rate is 45 to 54 years, with 96.7% or 238 individuals in the labor force. Within the labor force, the 30 to 34 years age range has the highest percentage of unemployed individuals, with 8.7% or 11 of them being unemployed.
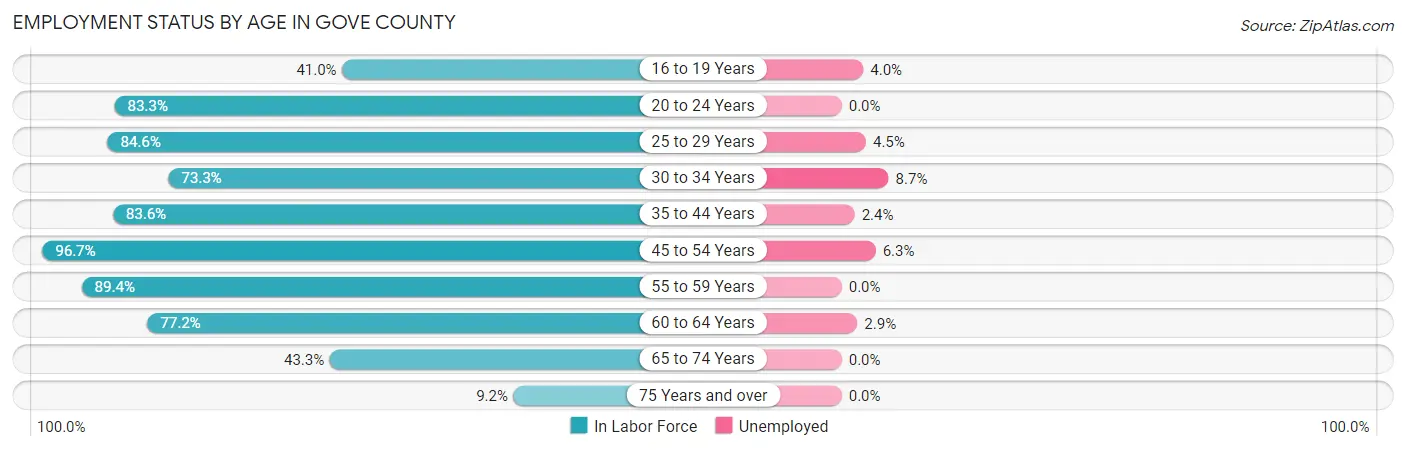
| Age Bracket | In Labor Force | Unemployed |
| 16 to 19 Years | 50 (41.0%) | 2 (4.0%) |
| 20 to 24 Years | 85 (83.3%) | 0 (0.0%) |
| 25 to 29 Years | 110 (84.6%) | 5 (4.5%) |
| 30 to 34 Years | 126 (73.3%) | 11 (8.7%) |
| 35 to 44 Years | 245 (83.6%) | 6 (2.4%) |
| 45 to 54 Years | 238 (96.7%) | 15 (6.3%) |
| 55 to 59 Years | 144 (89.4%) | 0 (0.0%) |
| 60 to 64 Years | 173 (77.2%) | 5 (2.9%) |
| 65 to 74 Years | 139 (43.3%) | 0 (0.0%) |
| 75 Years and over | 31 (9.2%) | 0 (0.0%) |
| Total | 1,340 (63.6%) | 44 (3.3%) |
Employment Status by Educational Attainment in Gove County
According to labor force statistics for Gove County, 84.5% of individuals (1,036) out of the total population between 25 and 64 years of age (1,226) are in the labor force, with 4.1% or 42 of them being unemployed. The group with the highest labor force participation rate are those with the educational attainment of bachelor's degree or higher, with 94.9% or 263 individuals in the labor force. Within the labor force, individuals with college / associate degree education have the highest percentage of unemployment, with 6.2% or 23 of them being unemployed.

| Educational Attainment | In Labor Force | Unemployed |
| Less than High School | 33 (48.5%) | 0 (0.0%) |
| High School Diploma | 371 (83.6%) | 4 (0.8%) |
| College / Associate Degree | 369 (84.4%) | 27 (6.2%) |
| Bachelor's Degree or higher | 263 (94.9%) | 17 (6.1%) |
| Total | 1,036 (84.5%) | 50 (4.1%) |
Employment Occupations by Sex in Gove County
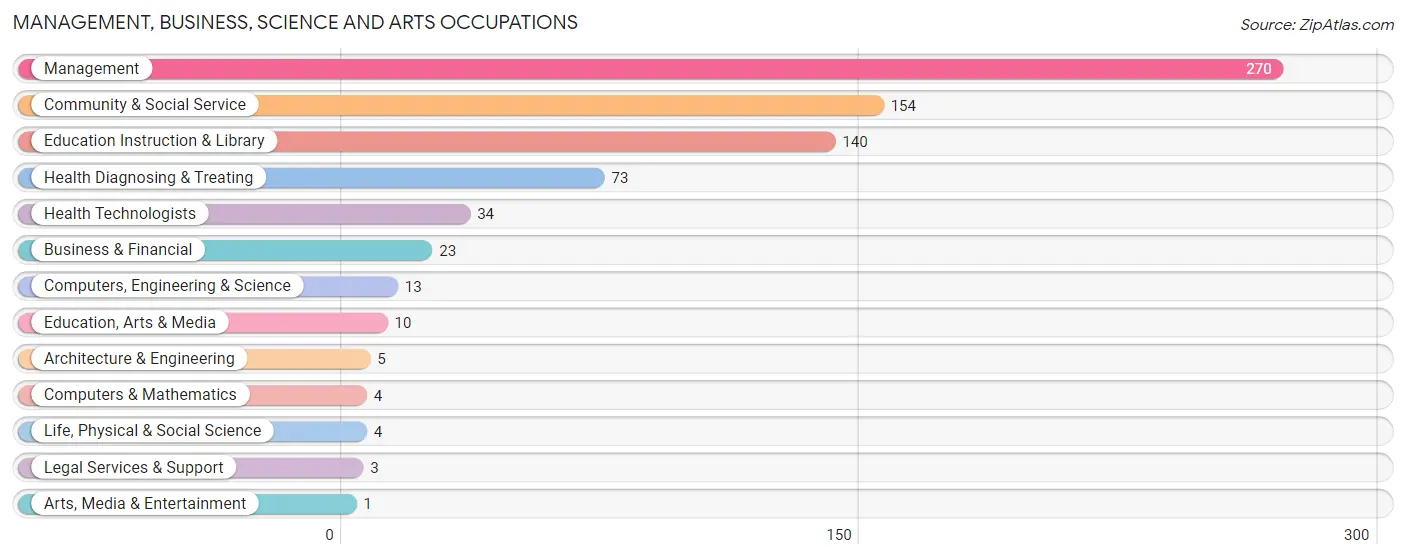
Management, Business, Science and Arts Occupations
The most common Management, Business, Science and Arts occupations in Gove County are Management (270 | 20.8%), Community & Social Service (154 | 11.9%), Education Instruction & Library (140 | 10.8%), Health Diagnosing & Treating (73 | 5.6%), and Health Technologists (34 | 2.6%).
Management, Business, Science and Arts Occupations by Sex
Within the Management, Business, Science and Arts occupations in Gove County, the most male-oriented occupations are Architecture & Engineering (100.0%), Arts, Media & Entertainment (100.0%), and Computers, Engineering & Science (84.6%), while the most female-oriented occupations are Health Technologists (91.2%), Health Diagnosing & Treating (84.9%), and Education Instruction & Library (84.3%).
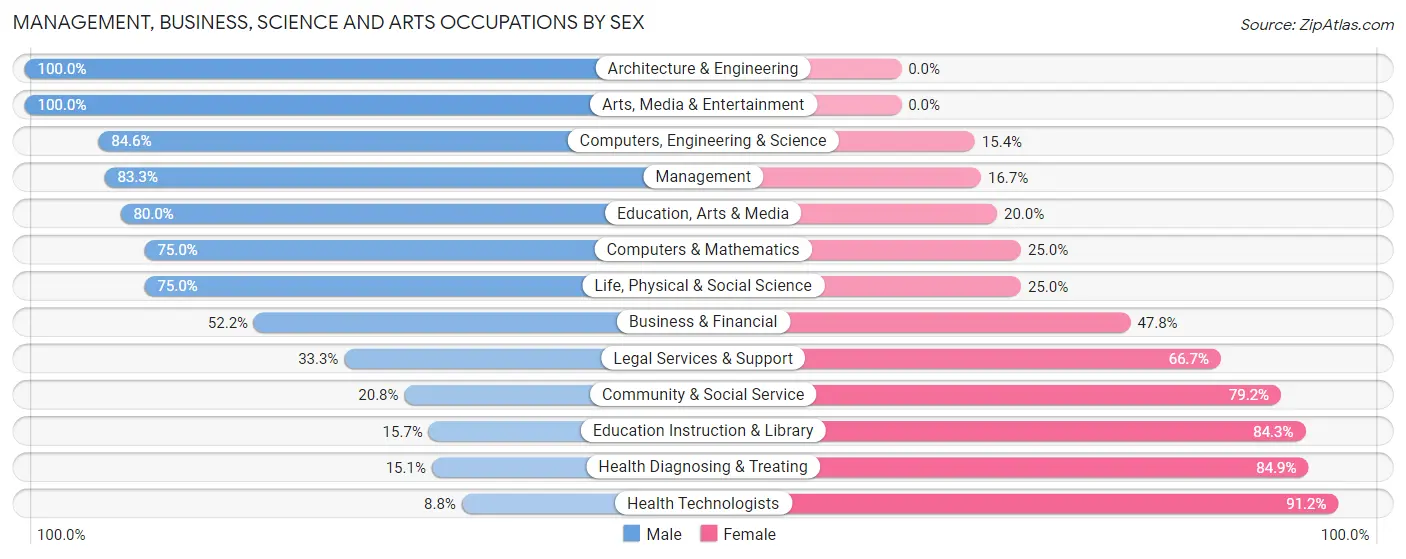
| Occupation | Male | Female |
| Management | 225 (83.3%) | 45 (16.7%) |
| Business & Financial | 12 (52.2%) | 11 (47.8%) |
| Computers, Engineering & Science | 11 (84.6%) | 2 (15.4%) |
| Computers & Mathematics | 3 (75.0%) | 1 (25.0%) |
| Architecture & Engineering | 5 (100.0%) | 0 (0.0%) |
| Life, Physical & Social Science | 3 (75.0%) | 1 (25.0%) |
| Community & Social Service | 32 (20.8%) | 122 (79.2%) |
| Education, Arts & Media | 8 (80.0%) | 2 (20.0%) |
| Legal Services & Support | 1 (33.3%) | 2 (66.7%) |
| Education Instruction & Library | 22 (15.7%) | 118 (84.3%) |
| Arts, Media & Entertainment | 1 (100.0%) | 0 (0.0%) |
| Health Diagnosing & Treating | 11 (15.1%) | 62 (84.9%) |
| Health Technologists | 3 (8.8%) | 31 (91.2%) |
| Total (Category) | 291 (54.6%) | 242 (45.4%) |
| Total (Overall) | 762 (58.8%) | 535 (41.2%) |
Services Occupations
The most common Services occupations in Gove County are Healthcare Support (66 | 5.1%), Food Preparation & Serving (57 | 4.4%), Cleaning & Maintenance (39 | 3.0%), Personal Care & Service (29 | 2.2%), and Security & Protection (11 | 0.9%).

Services Occupations by Sex
Within the Services occupations in Gove County, the most male-oriented occupations are Law Enforcement (100.0%), Security & Protection (72.7%), and Cleaning & Maintenance (43.6%), while the most female-oriented occupations are Healthcare Support (92.4%), Personal Care & Service (79.3%), and Firefighting & Prevention (75.0%).
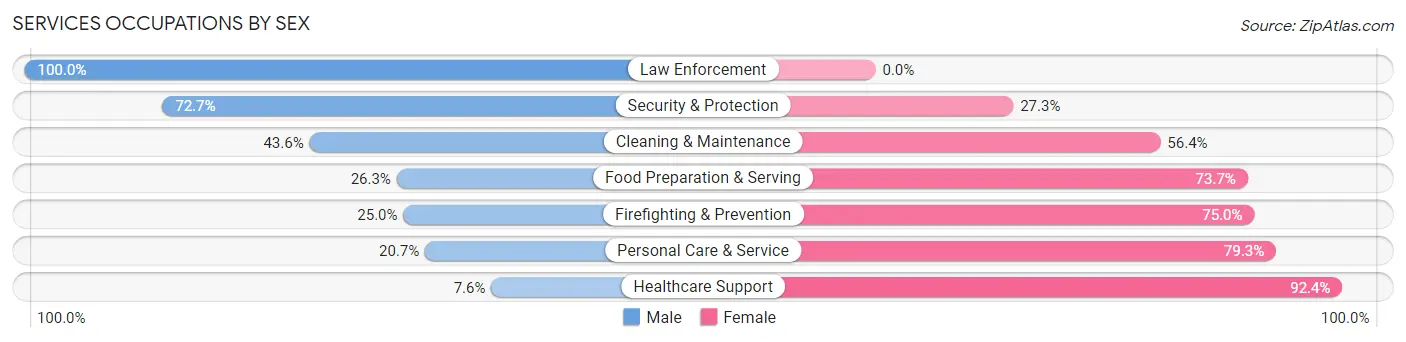
| Occupation | Male | Female |
| Healthcare Support | 5 (7.6%) | 61 (92.4%) |
| Security & Protection | 8 (72.7%) | 3 (27.3%) |
| Firefighting & Prevention | 1 (25.0%) | 3 (75.0%) |
| Law Enforcement | 7 (100.0%) | 0 (0.0%) |
| Food Preparation & Serving | 15 (26.3%) | 42 (73.7%) |
| Cleaning & Maintenance | 17 (43.6%) | 22 (56.4%) |
| Personal Care & Service | 6 (20.7%) | 23 (79.3%) |
| Total (Category) | 51 (25.3%) | 151 (74.8%) |
| Total (Overall) | 762 (58.8%) | 535 (41.2%) |
Sales and Office Occupations
The most common Sales and Office occupations in Gove County are Sales & Related (104 | 8.0%), and Office & Administration (90 | 6.9%).

Sales and Office Occupations by Sex

| Occupation | Male | Female |
| Sales & Related | 78 (75.0%) | 26 (25.0%) |
| Office & Administration | 9 (10.0%) | 81 (90.0%) |
| Total (Category) | 87 (44.9%) | 107 (55.1%) |
| Total (Overall) | 762 (58.8%) | 535 (41.2%) |
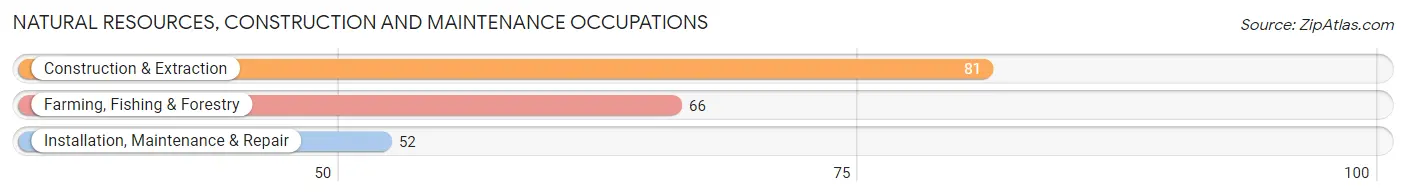
Natural Resources, Construction and Maintenance Occupations
The most common Natural Resources, Construction and Maintenance occupations in Gove County are Construction & Extraction (81 | 6.2%), Farming, Fishing & Forestry (66 | 5.1%), and Installation, Maintenance & Repair (52 | 4.0%).
Natural Resources, Construction and Maintenance Occupations by Sex
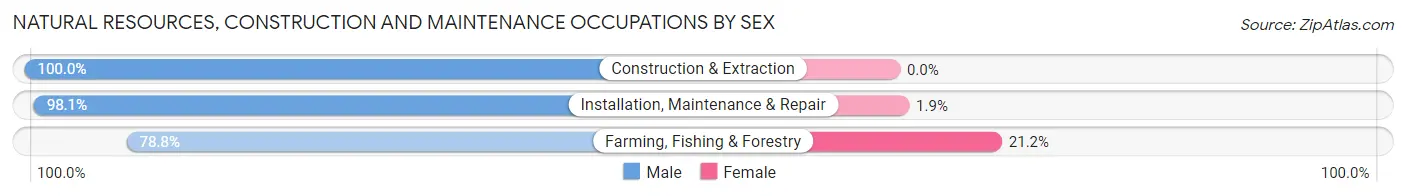
| Occupation | Male | Female |
| Farming, Fishing & Forestry | 52 (78.8%) | 14 (21.2%) |
| Construction & Extraction | 81 (100.0%) | 0 (0.0%) |
| Installation, Maintenance & Repair | 51 (98.1%) | 1 (1.9%) |
| Total (Category) | 184 (92.5%) | 15 (7.5%) |
| Total (Overall) | 762 (58.8%) | 535 (41.2%) |
Production, Transportation and Moving Occupations
The most common Production, Transportation and Moving occupations in Gove County are Transportation (69 | 5.3%), Material Moving (53 | 4.1%), and Production (47 | 3.6%).

Production, Transportation and Moving Occupations by Sex
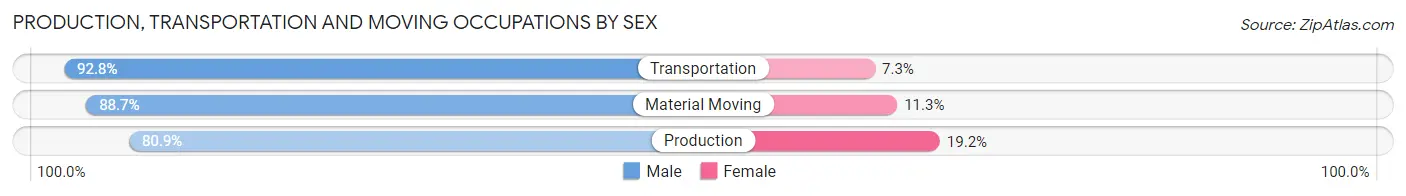
| Occupation | Male | Female |
| Production | 38 (80.8%) | 9 (19.2%) |
| Transportation | 64 (92.7%) | 5 (7.2%) |
| Material Moving | 47 (88.7%) | 6 (11.3%) |
| Total (Category) | 149 (88.2%) | 20 (11.8%) |
| Total (Overall) | 762 (58.8%) | 535 (41.2%) |
Employment Industries by Sex in Gove County
Employment Industries in Gove County
The major employment industries in Gove County include Agriculture, Fishing & Hunting (260 | 20.1%), Health Care & Social Assistance (202 | 15.6%), Educational Services (152 | 11.7%), Retail Trade (124 | 9.6%), and Construction (104 | 8.0%).

Employment Industries by Sex in Gove County
The Gove County industries that see more men than women are Utilities (100.0%), Mining, Quarrying, & Extraction (96.8%), and Construction (96.2%), whereas the industries that tend to have a higher number of women are Health Care & Social Assistance (90.1%), Information (88.9%), and Educational Services (80.3%).

| Industry | Male | Female |
| Agriculture, Fishing & Hunting | 235 (90.4%) | 25 (9.6%) |
| Mining, Quarrying, & Extraction | 30 (96.8%) | 1 (3.2%) |
| Construction | 100 (96.2%) | 4 (3.8%) |
| Manufacturing | 47 (79.7%) | 12 (20.3%) |
| Wholesale Trade | 36 (94.7%) | 2 (5.3%) |
| Retail Trade | 90 (72.6%) | 34 (27.4%) |
| Transportation & Warehousing | 42 (87.5%) | 6 (12.5%) |
| Utilities | 1 (100.0%) | 0 (0.0%) |
| Information | 2 (11.1%) | 16 (88.9%) |
| Finance & Insurance | 18 (47.4%) | 20 (52.6%) |
| Real Estate, Rental & Leasing | 1 (33.3%) | 2 (66.7%) |
| Professional & Scientific | 8 (40.0%) | 12 (60.0%) |
| Enterprise Management | 0 (0.0%) | 0 (0.0%) |
| Administrative & Support | 13 (76.5%) | 4 (23.5%) |
| Educational Services | 30 (19.7%) | 122 (80.3%) |
| Health Care & Social Assistance | 20 (9.9%) | 182 (90.1%) |
| Arts, Entertainment & Recreation | 6 (24.0%) | 19 (76.0%) |
| Accommodation & Food Services | 16 (32.7%) | 33 (67.3%) |
| Public Administration | 15 (37.5%) | 25 (62.5%) |
| Total | 762 (58.8%) | 535 (41.2%) |
Education in Gove County
School Enrollment in Gove County
The most common levels of schooling among the 618 students in Gove County are elementary school (180 | 29.1%), middle school (164 | 26.5%), and high school (151 | 24.4%).
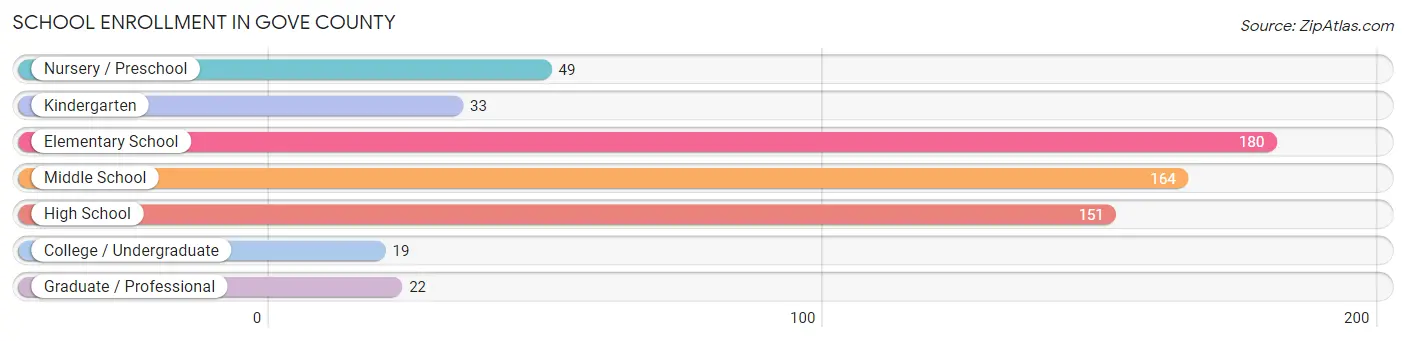
| School Level | # Students | % Students |
| Nursery / Preschool | 49 | 7.9% |
| Kindergarten | 33 | 5.3% |
| Elementary School | 180 | 29.1% |
| Middle School | 164 | 26.5% |
| High School | 151 | 24.4% |
| College / Undergraduate | 19 | 3.1% |
| Graduate / Professional | 22 | 3.6% |
| Total | 618 | 100.0% |
School Enrollment by Age by Funding Source in Gove County
Out of a total of 618 students who are enrolled in schools in Gove County, 112 (18.1%) attend a private institution, while the remaining 506 (81.9%) are enrolled in public schools. The age group of 18 to 19 year olds has the highest likelihood of being enrolled in private schools, with 18 (81.8% in the age bracket) enrolled. Conversely, the age group of 3 to 4 year olds has the lowest likelihood of being enrolled in a private school, with 43 (97.7% in the age bracket) attending a public institution.
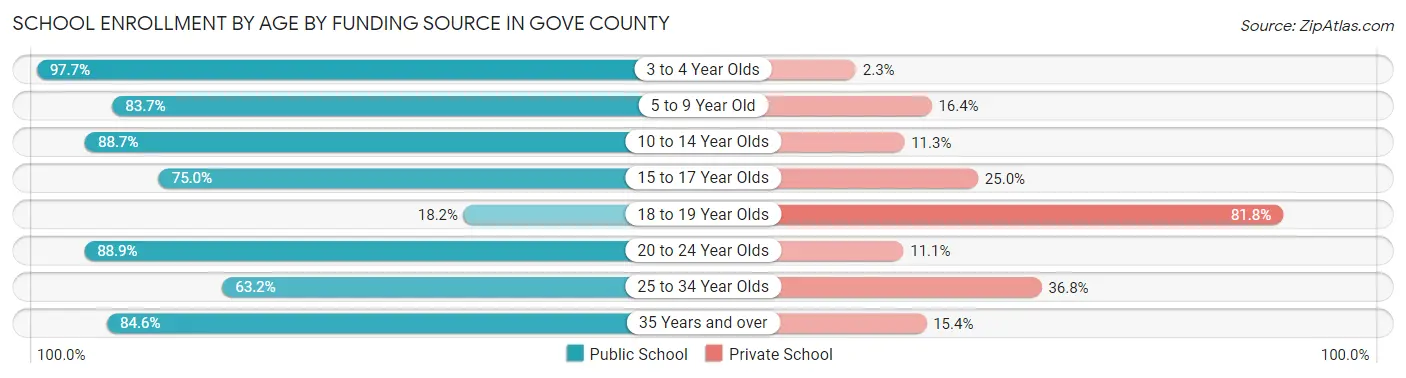
| Age Bracket | Public School | Private School |
| 3 to 4 Year Olds | 43 (97.7%) | 1 (2.3%) |
| 5 to 9 Year Old | 174 (83.7%) | 34 (16.4%) |
| 10 to 14 Year Olds | 173 (88.7%) | 22 (11.3%) |
| 15 to 17 Year Olds | 81 (75.0%) | 27 (25.0%) |
| 18 to 19 Year Olds | 4 (18.2%) | 18 (81.8%) |
| 20 to 24 Year Olds | 8 (88.9%) | 1 (11.1%) |
| 25 to 34 Year Olds | 12 (63.2%) | 7 (36.8%) |
| 35 Years and over | 11 (84.6%) | 2 (15.4%) |
| Total | 506 (81.9%) | 112 (18.1%) |
Educational Attainment by Field of Study in Gove County
Education (96 | 23.7%), business (68 | 16.8%), bio, nature & agricultural (60 | 14.8%), arts & humanities (43 | 10.6%), and science & technology (30 | 7.4%) are the most common fields of study among 405 individuals in Gove County who have obtained a bachelor's degree or higher.

| Field of Study | # Graduates | % Graduates |
| Computers & Mathematics | 13 | 3.2% |
| Bio, Nature & Agricultural | 60 | 14.8% |
| Physical & Health Sciences | 4 | 1.0% |
| Psychology | 23 | 5.7% |
| Social Sciences | 15 | 3.7% |
| Engineering | 0 | 0.0% |
| Multidisciplinary Studies | 0 | 0.0% |
| Science & Technology | 30 | 7.4% |
| Business | 68 | 16.8% |
| Education | 96 | 23.7% |
| Literature & Languages | 14 | 3.5% |
| Liberal Arts & History | 21 | 5.2% |
| Visual & Performing Arts | 12 | 3.0% |
| Communications | 6 | 1.5% |
| Arts & Humanities | 43 | 10.6% |
| Total | 405 | 100.0% |
Transportation & Commute in Gove County
Vehicle Availability by Sex in Gove County
The most prevalent vehicle ownership categories in Gove County are males with 3 vehicles (253, accounting for 33.3%) and females with 3 vehicles (146, making up 48.8%).
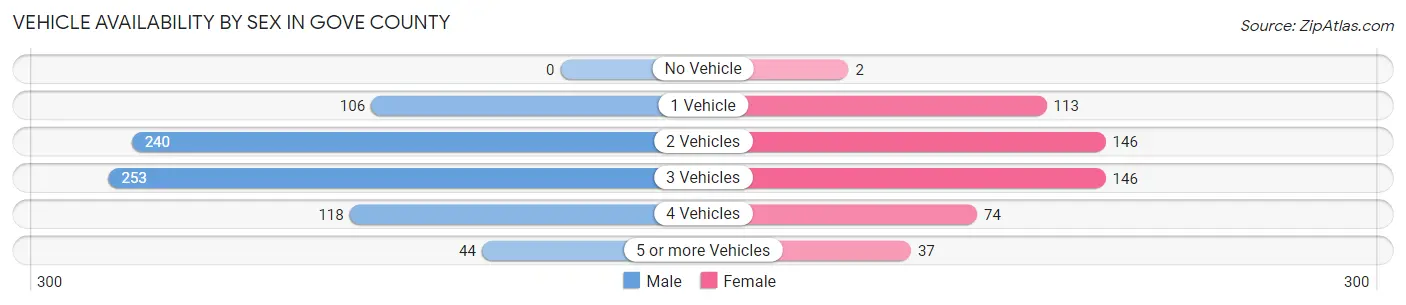
| Vehicles Available | Male | Female |
| No Vehicle | 0 (0.0%) | 2 (0.4%) |
| 1 Vehicle | 106 (13.9%) | 113 (21.8%) |
| 2 Vehicles | 240 (31.5%) | 146 (28.2%) |
| 3 Vehicles | 253 (33.3%) | 146 (28.2%) |
| 4 Vehicles | 118 (15.5%) | 74 (14.3%) |
| 5 or more Vehicles | 44 (5.8%) | 37 (7.1%) |
| Total | 761 (100.0%) | 518 (100.0%) |
Commute Time in Gove County
The most frequently occuring commute durations in Gove County are 5 to 9 minutes (290 commuters, 25.1%), less than 5 minutes (261 commuters, 22.6%), and 15 to 19 minutes (124 commuters, 10.7%).
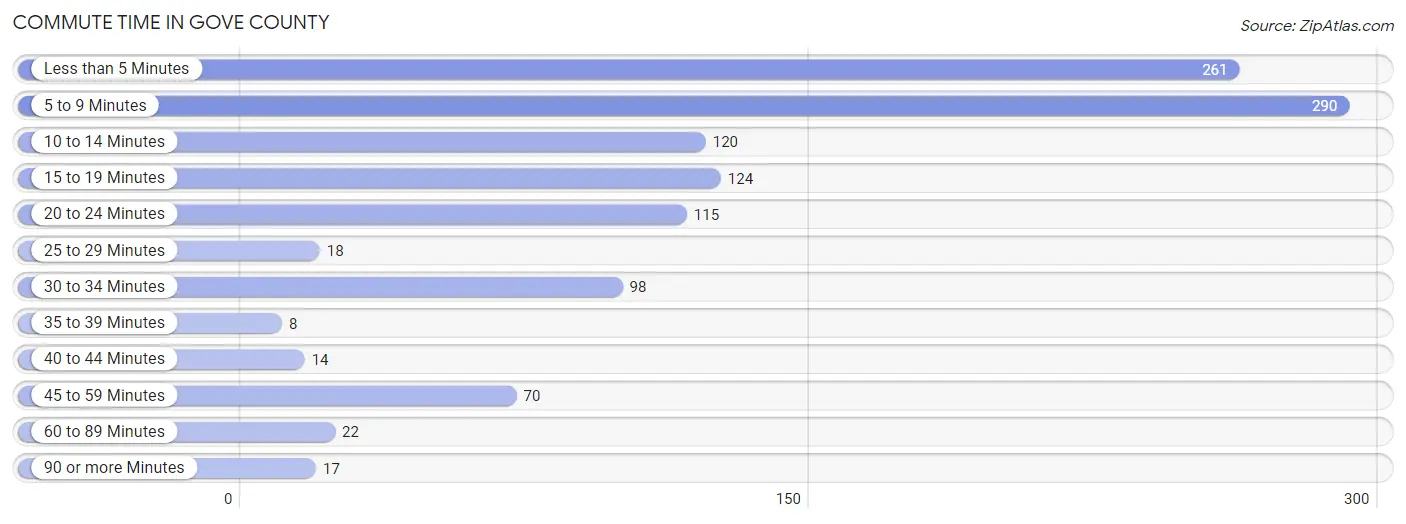
| Commute Time | # Commuters | % Commuters |
| Less than 5 Minutes | 261 | 22.6% |
| 5 to 9 Minutes | 290 | 25.1% |
| 10 to 14 Minutes | 120 | 10.4% |
| 15 to 19 Minutes | 124 | 10.7% |
| 20 to 24 Minutes | 115 | 9.9% |
| 25 to 29 Minutes | 18 | 1.6% |
| 30 to 34 Minutes | 98 | 8.5% |
| 35 to 39 Minutes | 8 | 0.7% |
| 40 to 44 Minutes | 14 | 1.2% |
| 45 to 59 Minutes | 70 | 6.0% |
| 60 to 89 Minutes | 22 | 1.9% |
| 90 or more Minutes | 17 | 1.5% |
Commute Time by Sex in Gove County
The most common commute times in Gove County are less than 5 minutes (167 commuters, 24.3%) for males and 5 to 9 minutes (123 commuters, 26.2%) for females.
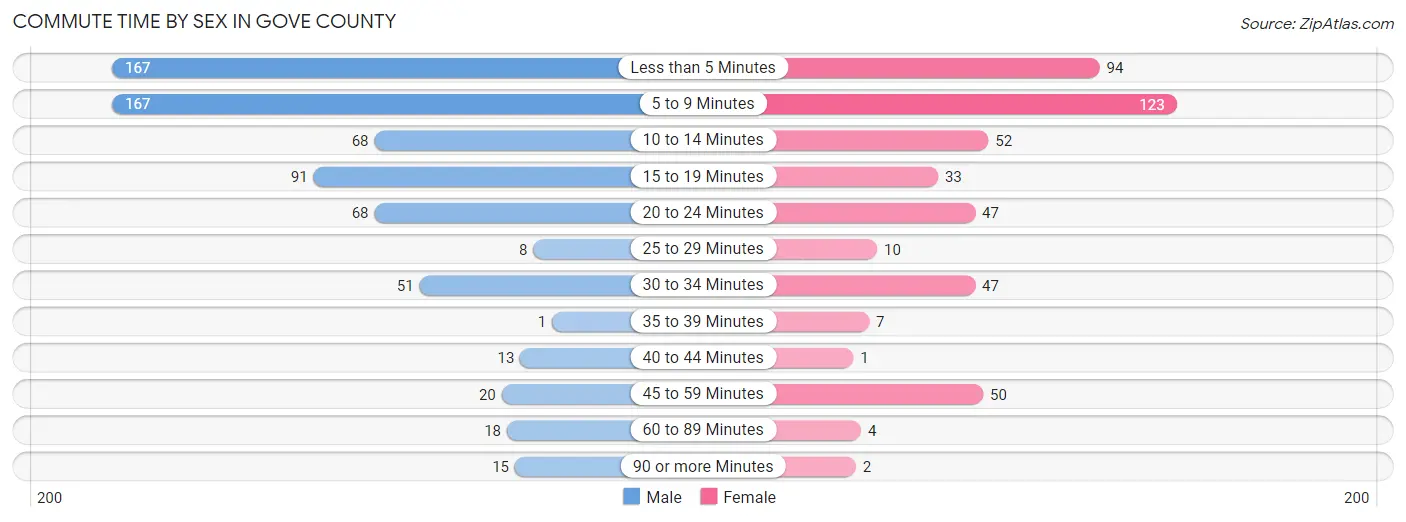
| Commute Time | Male | Female |
| Less than 5 Minutes | 167 (24.3%) | 94 (20.0%) |
| 5 to 9 Minutes | 167 (24.3%) | 123 (26.2%) |
| 10 to 14 Minutes | 68 (9.9%) | 52 (11.1%) |
| 15 to 19 Minutes | 91 (13.3%) | 33 (7.0%) |
| 20 to 24 Minutes | 68 (9.9%) | 47 (10.0%) |
| 25 to 29 Minutes | 8 (1.2%) | 10 (2.1%) |
| 30 to 34 Minutes | 51 (7.4%) | 47 (10.0%) |
| 35 to 39 Minutes | 1 (0.2%) | 7 (1.5%) |
| 40 to 44 Minutes | 13 (1.9%) | 1 (0.2%) |
| 45 to 59 Minutes | 20 (2.9%) | 50 (10.6%) |
| 60 to 89 Minutes | 18 (2.6%) | 4 (0.9%) |
| 90 or more Minutes | 15 (2.2%) | 2 (0.4%) |
Time of Departure to Work by Sex in Gove County
The most frequent times of departure to work in Gove County are 7:30 AM to 7:59 AM (196, 28.5%) for males and 7:30 AM to 7:59 AM (130, 27.7%) for females.
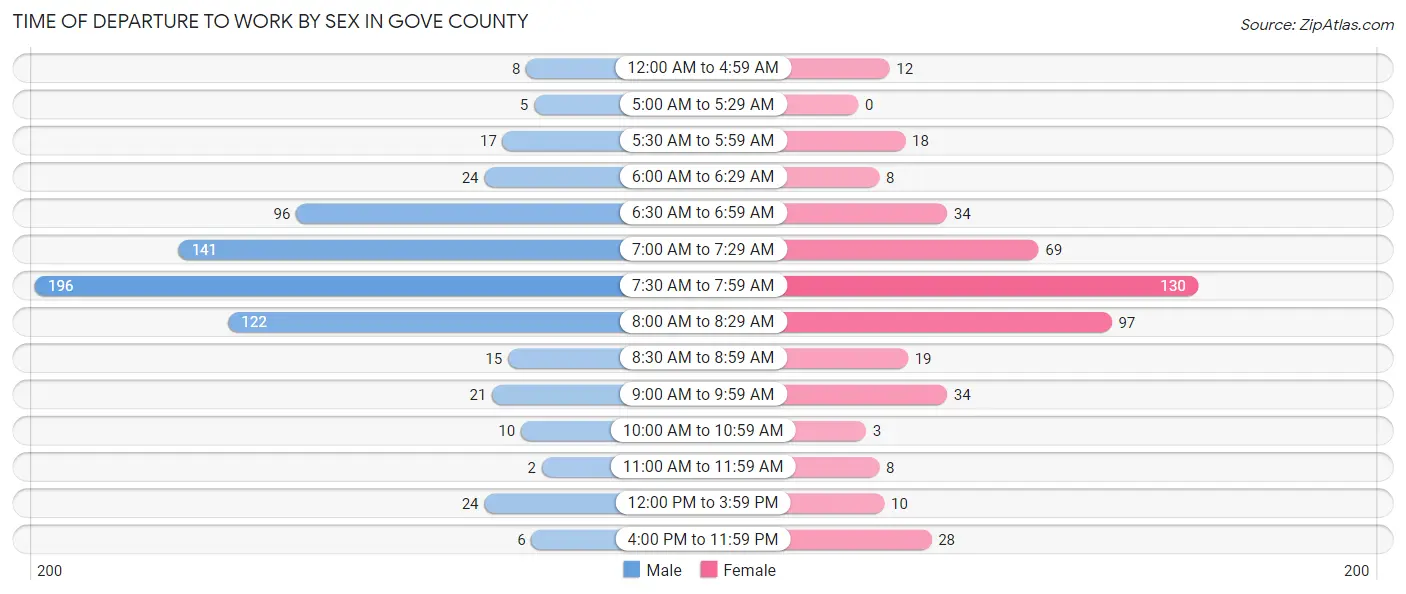
| Time of Departure | Male | Female |
| 12:00 AM to 4:59 AM | 8 (1.2%) | 12 (2.5%) |
| 5:00 AM to 5:29 AM | 5 (0.7%) | 0 (0.0%) |
| 5:30 AM to 5:59 AM | 17 (2.5%) | 18 (3.8%) |
| 6:00 AM to 6:29 AM | 24 (3.5%) | 8 (1.7%) |
| 6:30 AM to 6:59 AM | 96 (14.0%) | 34 (7.2%) |
| 7:00 AM to 7:29 AM | 141 (20.5%) | 69 (14.7%) |
| 7:30 AM to 7:59 AM | 196 (28.5%) | 130 (27.7%) |
| 8:00 AM to 8:29 AM | 122 (17.8%) | 97 (20.6%) |
| 8:30 AM to 8:59 AM | 15 (2.2%) | 19 (4.0%) |
| 9:00 AM to 9:59 AM | 21 (3.1%) | 34 (7.2%) |
| 10:00 AM to 10:59 AM | 10 (1.5%) | 3 (0.6%) |
| 11:00 AM to 11:59 AM | 2 (0.3%) | 8 (1.7%) |
| 12:00 PM to 3:59 PM | 24 (3.5%) | 10 (2.1%) |
| 4:00 PM to 11:59 PM | 6 (0.9%) | 28 (6.0%) |
| Total | 687 (100.0%) | 470 (100.0%) |
Housing Occupancy in Gove County
Occupancy by Ownership in Gove County
Of the total 1,182 dwellings in Gove County, owner-occupied units account for 924 (78.2%), while renter-occupied units make up 258 (21.8%).
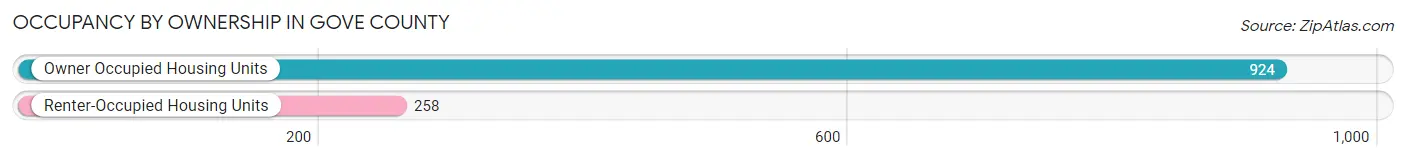
| Occupancy | # Housing Units | % Housing Units |
| Owner Occupied Housing Units | 924 | 78.2% |
| Renter-Occupied Housing Units | 258 | 21.8% |
| Total Occupied Housing Units | 1,182 | 100.0% |
Occupancy by Household Size in Gove County
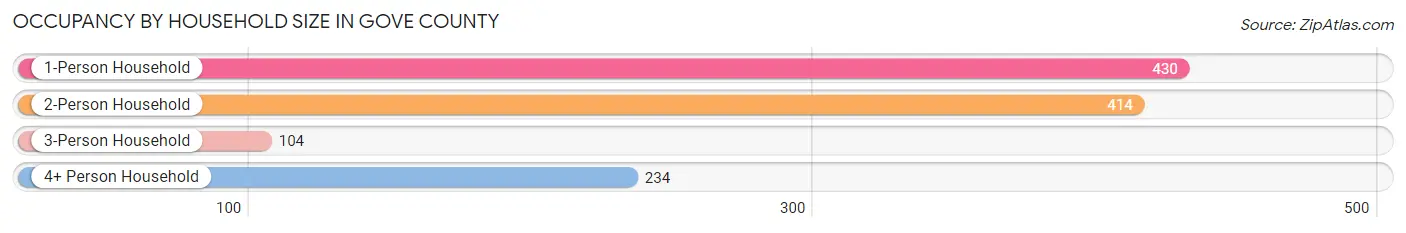
| Household Size | # Housing Units | % Housing Units |
| 1-Person Household | 430 | 36.4% |
| 2-Person Household | 414 | 35.0% |
| 3-Person Household | 104 | 8.8% |
| 4+ Person Household | 234 | 19.8% |
| Total Housing Units | 1,182 | 100.0% |
Occupancy by Ownership by Household Size in Gove County
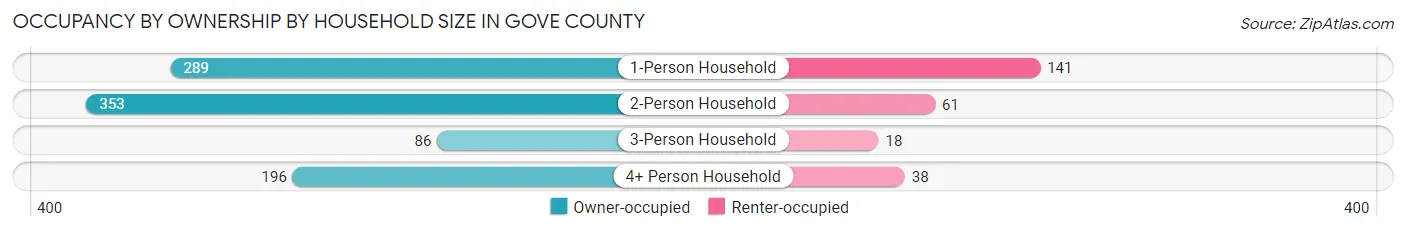
| Household Size | Owner-occupied | Renter-occupied |
| 1-Person Household | 289 (67.2%) | 141 (32.8%) |
| 2-Person Household | 353 (85.3%) | 61 (14.7%) |
| 3-Person Household | 86 (82.7%) | 18 (17.3%) |
| 4+ Person Household | 196 (83.8%) | 38 (16.2%) |
| Total Housing Units | 924 (78.2%) | 258 (21.8%) |
Occupancy by Educational Attainment in Gove County
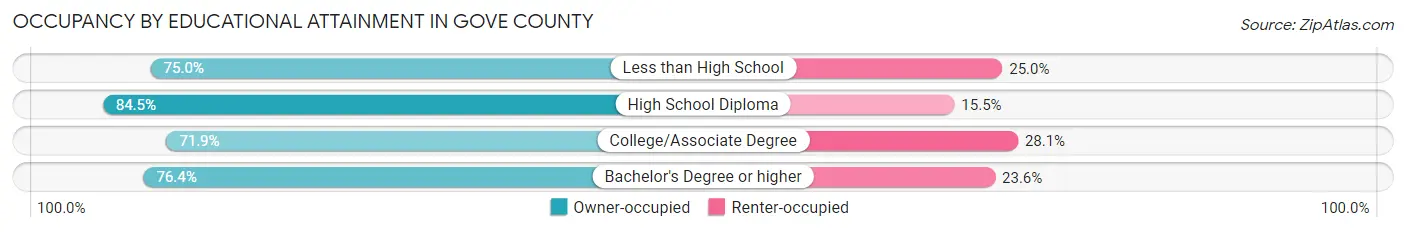
| Household Size | Owner-occupied | Renter-occupied |
| Less than High School | 33 (75.0%) | 11 (25.0%) |
| High School Diploma | 414 (84.5%) | 76 (15.5%) |
| College/Associate Degree | 289 (71.9%) | 113 (28.1%) |
| Bachelor's Degree or higher | 188 (76.4%) | 58 (23.6%) |
Occupancy by Age of Householder in Gove County
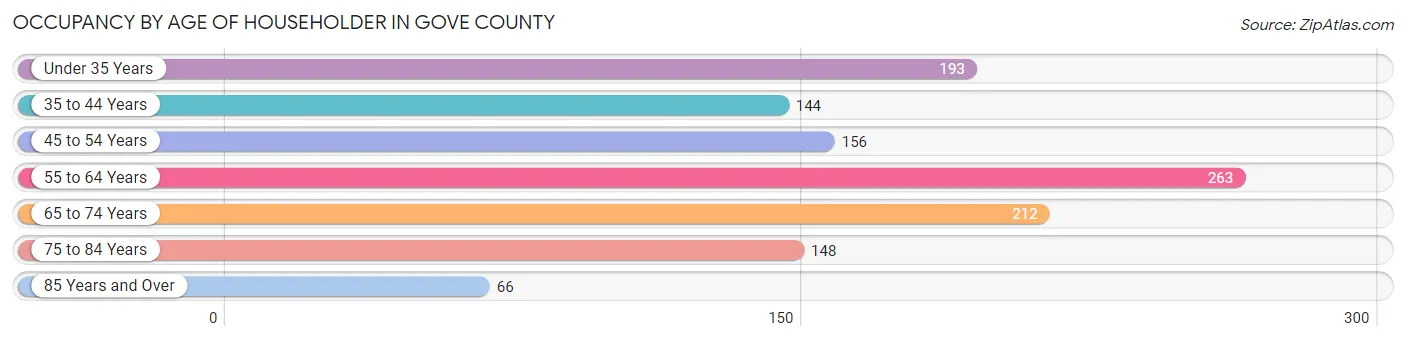
| Age Bracket | # Households | % Households |
| Under 35 Years | 193 | 16.3% |
| 35 to 44 Years | 144 | 12.2% |
| 45 to 54 Years | 156 | 13.2% |
| 55 to 64 Years | 263 | 22.3% |
| 65 to 74 Years | 212 | 17.9% |
| 75 to 84 Years | 148 | 12.5% |
| 85 Years and Over | 66 | 5.6% |
| Total | 1,182 | 100.0% |
Housing Finances in Gove County
Median Income by Occupancy in Gove County

| Occupancy Type | # Households | Median Income |
| Owner-Occupied | 924 (78.2%) | $72,614 |
| Renter-Occupied | 258 (21.8%) | $35,395 |
| Average | 1,182 (100.0%) | $59,417 |
Occupancy by Householder Income Bracket in Gove County
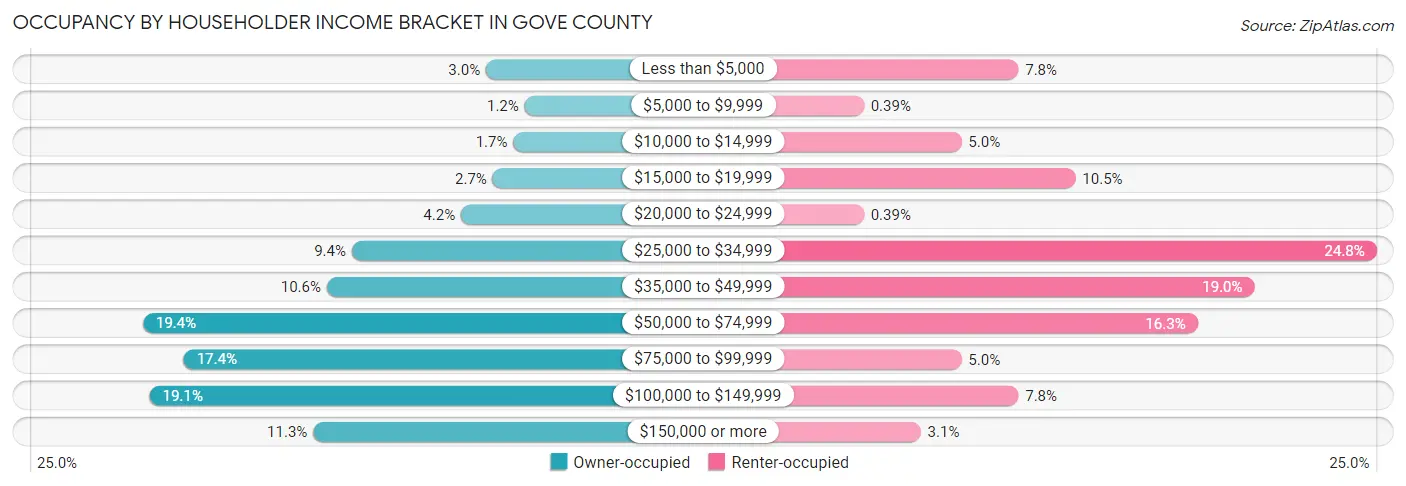
| Income Bracket | Owner-occupied | Renter-occupied |
| Less than $5,000 | 28 (3.0%) | 20 (7.7%) |
| $5,000 to $9,999 | 11 (1.2%) | 1 (0.4%) |
| $10,000 to $14,999 | 16 (1.7%) | 13 (5.0%) |
| $15,000 to $19,999 | 25 (2.7%) | 27 (10.5%) |
| $20,000 to $24,999 | 39 (4.2%) | 1 (0.4%) |
| $25,000 to $34,999 | 87 (9.4%) | 64 (24.8%) |
| $35,000 to $49,999 | 98 (10.6%) | 49 (19.0%) |
| $50,000 to $74,999 | 179 (19.4%) | 42 (16.3%) |
| $75,000 to $99,999 | 161 (17.4%) | 13 (5.0%) |
| $100,000 to $149,999 | 176 (19.1%) | 20 (7.7%) |
| $150,000 or more | 104 (11.3%) | 8 (3.1%) |
| Total | 924 (100.0%) | 258 (100.0%) |
Monthly Housing Cost Tiers in Gove County

| Monthly Cost | Owner-occupied | Renter-occupied |
| Less than $300 | 105 (11.4%) | 2 (0.8%) |
| $300 to $499 | 177 (19.2%) | 7 (2.7%) |
| $500 to $799 | 227 (24.6%) | 110 (42.6%) |
| $800 to $999 | 74 (8.0%) | 21 (8.1%) |
| $1,000 to $1,499 | 198 (21.4%) | 30 (11.6%) |
| $1,500 to $1,999 | 72 (7.8%) | 10 (3.9%) |
| $2,000 to $2,499 | 12 (1.3%) | 0 (0.0%) |
| $2,500 to $2,999 | 17 (1.8%) | 0 (0.0%) |
| $3,000 or more | 42 (4.5%) | 0 (0.0%) |
| Total | 924 (100.0%) | 258 (100.0%) |
Physical Housing Characteristics in Gove County
Housing Structures in Gove County
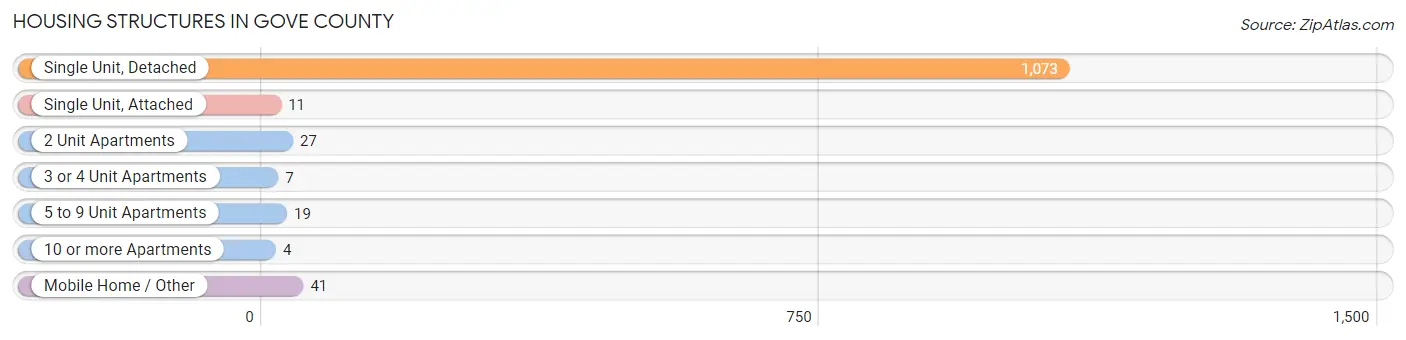
| Structure Type | # Housing Units | % Housing Units |
| Single Unit, Detached | 1,073 | 90.8% |
| Single Unit, Attached | 11 | 0.9% |
| 2 Unit Apartments | 27 | 2.3% |
| 3 or 4 Unit Apartments | 7 | 0.6% |
| 5 to 9 Unit Apartments | 19 | 1.6% |
| 10 or more Apartments | 4 | 0.3% |
| Mobile Home / Other | 41 | 3.5% |
| Total | 1,182 | 100.0% |
Housing Structures by Occupancy in Gove County

| Structure Type | Owner-occupied | Renter-occupied |
| Single Unit, Detached | 886 (82.6%) | 187 (17.4%) |
| Single Unit, Attached | 10 (90.9%) | 1 (9.1%) |
| 2 Unit Apartments | 0 (0.0%) | 27 (100.0%) |
| 3 or 4 Unit Apartments | 0 (0.0%) | 7 (100.0%) |
| 5 to 9 Unit Apartments | 0 (0.0%) | 19 (100.0%) |
| 10 or more Apartments | 0 (0.0%) | 4 (100.0%) |
| Mobile Home / Other | 28 (68.3%) | 13 (31.7%) |
| Total | 924 (78.2%) | 258 (21.8%) |
Housing Structures by Number of Rooms in Gove County
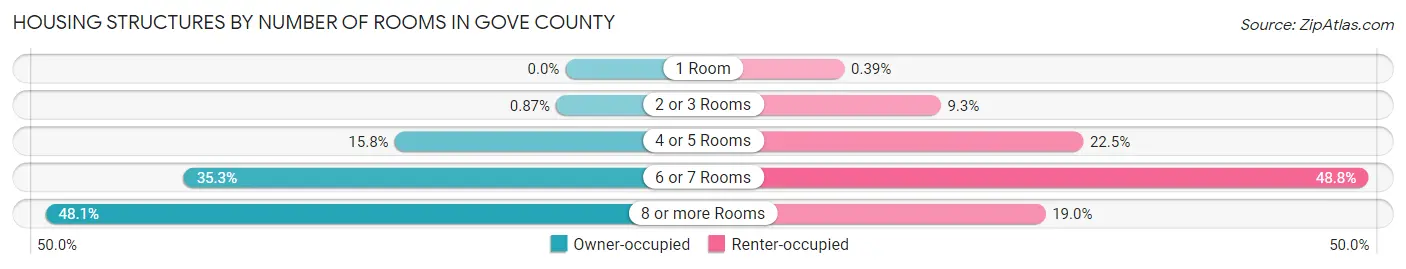
| Number of Rooms | Owner-occupied | Renter-occupied |
| 1 Room | 0 (0.0%) | 1 (0.4%) |
| 2 or 3 Rooms | 8 (0.9%) | 24 (9.3%) |
| 4 or 5 Rooms | 146 (15.8%) | 58 (22.5%) |
| 6 or 7 Rooms | 326 (35.3%) | 126 (48.8%) |
| 8 or more Rooms | 444 (48.0%) | 49 (19.0%) |
| Total | 924 (100.0%) | 258 (100.0%) |
Housing Structure by Heating Type in Gove County

| Heating Type | Owner-occupied | Renter-occupied |
| Utility Gas | 491 (53.1%) | 136 (52.7%) |
| Bottled, Tank, or LP Gas | 262 (28.3%) | 47 (18.2%) |
| Electricity | 118 (12.8%) | 58 (22.5%) |
| Fuel Oil or Kerosene | 0 (0.0%) | 16 (6.2%) |
| Coal or Coke | 0 (0.0%) | 0 (0.0%) |
| All other Fuels | 53 (5.7%) | 1 (0.4%) |
| No Fuel Used | 0 (0.0%) | 0 (0.0%) |
| Total | 924 (100.0%) | 258 (100.0%) |
Household Vehicle Usage in Gove County

| Vehicles per Household | Owner-occupied | Renter-occupied |
| No Vehicle | 7 (0.8%) | 9 (3.5%) |
| 1 Vehicle | 207 (22.4%) | 116 (45.0%) |
| 2 Vehicles | 276 (29.9%) | 85 (33.0%) |
| 3 or more Vehicles | 434 (47.0%) | 48 (18.6%) |
| Total | 924 (100.0%) | 258 (100.0%) |
Real Estate & Mortgages in Gove County
Real Estate and Mortgage Overview in Gove County
| Characteristic | Without Mortgage | With Mortgage |
| Housing Units | 512 | 412 |
| Median Property Value | $103,100 | $134,400 |
| Median Household Income | $53,194 | $63 |
| Monthly Housing Costs | $464 | $42 |
| Real Estate Taxes | $1,385 | $4 |
Property Value by Mortgage Status in Gove County

| Property Value | Without Mortgage | With Mortgage |
| Less than $50,000 | 82 (16.0%) | 52 (12.6%) |
| $50,000 to $99,999 | 162 (31.6%) | 89 (21.6%) |
| $100,000 to $299,999 | 231 (45.1%) | 205 (49.8%) |
| $300,000 to $499,999 | 14 (2.7%) | 21 (5.1%) |
| $500,000 to $749,999 | 17 (3.3%) | 9 (2.2%) |
| $750,000 to $999,999 | 5 (1.0%) | 36 (8.7%) |
| $1,000,000 or more | 1 (0.2%) | 0 (0.0%) |
| Total | 512 (100.0%) | 412 (100.0%) |
Household Income by Mortgage Status in Gove County
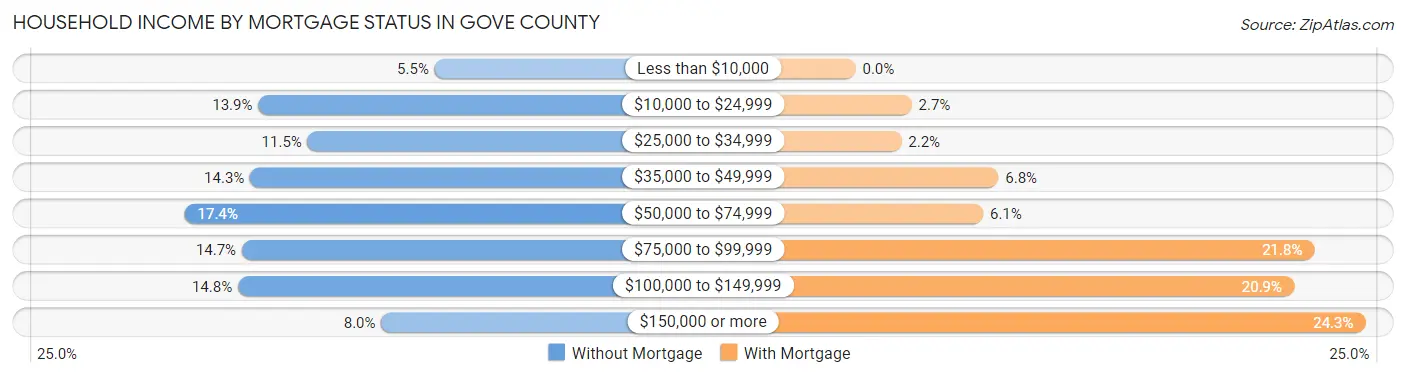
| Household Income | Without Mortgage | With Mortgage |
| Less than $10,000 | 28 (5.5%) | 0 (0.0%) |
| $10,000 to $24,999 | 71 (13.9%) | 11 (2.7%) |
| $25,000 to $34,999 | 59 (11.5%) | 9 (2.2%) |
| $35,000 to $49,999 | 73 (14.3%) | 28 (6.8%) |
| $50,000 to $74,999 | 89 (17.4%) | 25 (6.1%) |
| $75,000 to $99,999 | 75 (14.6%) | 90 (21.8%) |
| $100,000 to $149,999 | 76 (14.8%) | 86 (20.9%) |
| $150,000 or more | 41 (8.0%) | 100 (24.3%) |
| Total | 512 (100.0%) | 412 (100.0%) |
Property Value to Household Income Ratio in Gove County
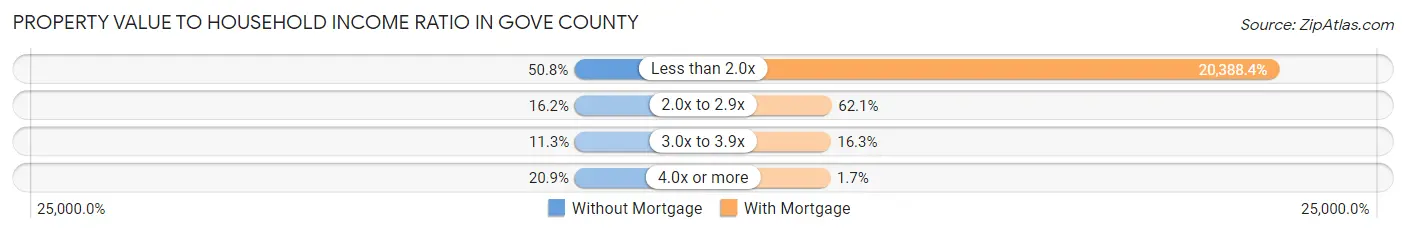
| Value-to-Income Ratio | Without Mortgage | With Mortgage |
| Less than 2.0x | 260 (50.8%) | 84,000 (20,388.3%) |
| 2.0x to 2.9x | 83 (16.2%) | 256 (62.1%) |
| 3.0x to 3.9x | 58 (11.3%) | 67 (16.3%) |
| 4.0x or more | 107 (20.9%) | 7 (1.7%) |
| Total | 512 (100.0%) | 412 (100.0%) |
Real Estate Taxes by Mortgage Status in Gove County
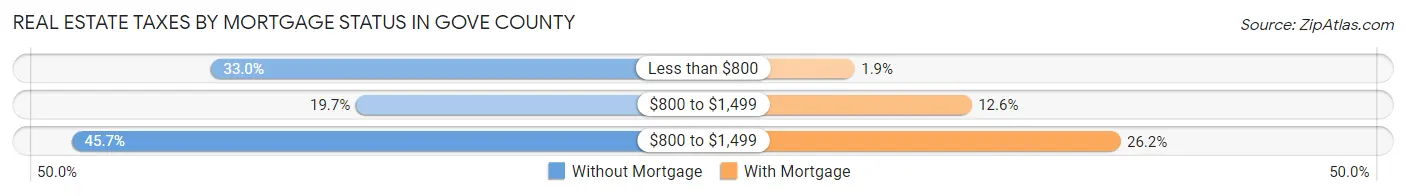
| Property Taxes | Without Mortgage | With Mortgage |
| Less than $800 | 169 (33.0%) | 8 (1.9%) |
| $800 to $1,499 | 101 (19.7%) | 52 (12.6%) |
| $800 to $1,499 | 234 (45.7%) | 108 (26.2%) |
| Total | 512 (100.0%) | 412 (100.0%) |
Health & Disability in Gove County
Health Insurance Coverage by Age in Gove County
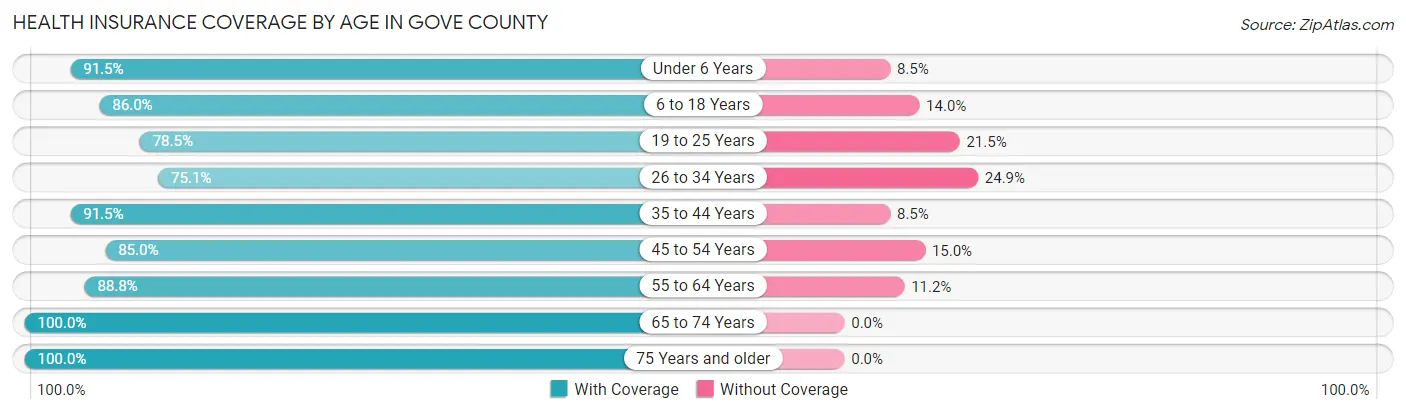
| Age Bracket | With Coverage | Without Coverage |
| Under 6 Years | 204 (91.5%) | 19 (8.5%) |
| 6 to 18 Years | 456 (86.0%) | 74 (14.0%) |
| 19 to 25 Years | 106 (78.5%) | 29 (21.5%) |
| 26 to 34 Years | 214 (75.1%) | 71 (24.9%) |
| 35 to 44 Years | 268 (91.5%) | 25 (8.5%) |
| 45 to 54 Years | 209 (85.0%) | 37 (15.0%) |
| 55 to 64 Years | 342 (88.8%) | 43 (11.2%) |
| 65 to 74 Years | 307 (100.0%) | 0 (0.0%) |
| 75 Years and older | 309 (100.0%) | 0 (0.0%) |
| Total | 2,415 (89.0%) | 298 (11.0%) |
Health Insurance Coverage by Citizenship Status in Gove County

| Citizenship Status | With Coverage | Without Coverage |
| Native Born | 204 (91.5%) | 19 (8.5%) |
| Foreign Born, Citizen | 456 (86.0%) | 74 (14.0%) |
| Foreign Born, not a Citizen | 106 (78.5%) | 29 (21.5%) |
Health Insurance Coverage by Household Income in Gove County
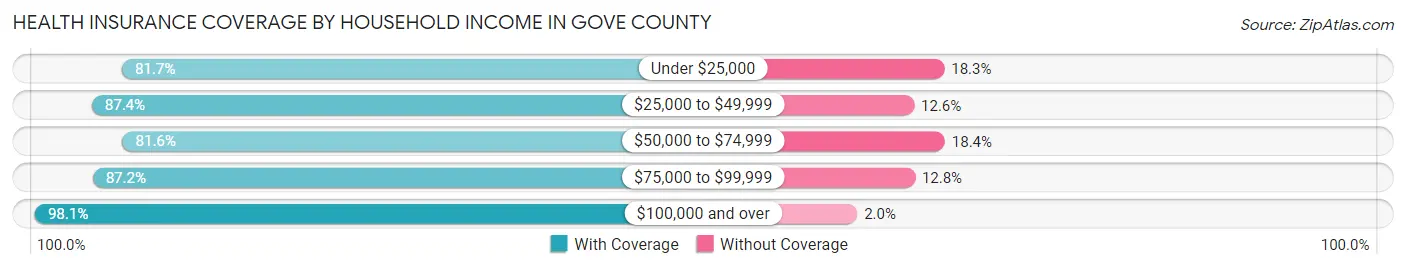
| Household Income | With Coverage | Without Coverage |
| Under $25,000 | 188 (81.7%) | 42 (18.3%) |
| $25,000 to $49,999 | 416 (87.4%) | 60 (12.6%) |
| $50,000 to $74,999 | 502 (81.6%) | 113 (18.4%) |
| $75,000 to $99,999 | 451 (87.2%) | 66 (12.8%) |
| $100,000 and over | 857 (98.1%) | 17 (1.9%) |
Public vs Private Health Insurance Coverage by Age in Gove County

| Age Bracket | Public Insurance | Private Insurance |
| Under 6 | 98 (44.0%) | 109 (48.9%) |
| 6 to 18 Years | 157 (29.6%) | 312 (58.9%) |
| 19 to 25 Years | 19 (14.1%) | 92 (68.1%) |
| 25 to 34 Years | 19 (6.7%) | 204 (71.6%) |
| 35 to 44 Years | 43 (14.7%) | 236 (80.5%) |
| 45 to 54 Years | 20 (8.1%) | 197 (80.1%) |
| 55 to 64 Years | 37 (9.6%) | 321 (83.4%) |
| 65 to 74 Years | 296 (96.4%) | 138 (45.0%) |
| 75 Years and over | 309 (100.0%) | 187 (60.5%) |
| Total | 998 (36.8%) | 1,796 (66.2%) |
Disability Status by Sex by Age in Gove County
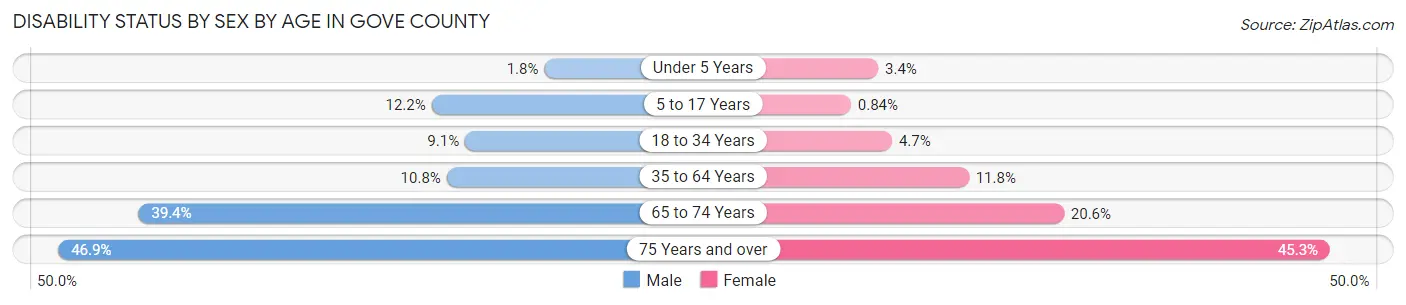
| Age Bracket | Male | Female |
| Under 5 Years | 2 (1.8%) | 3 (3.4%) |
| 5 to 17 Years | 34 (12.2%) | 2 (0.8%) |
| 18 to 34 Years | 20 (9.1%) | 11 (4.7%) |
| 35 to 64 Years | 55 (10.8%) | 49 (11.8%) |
| 65 to 74 Years | 56 (39.4%) | 34 (20.6%) |
| 75 Years and over | 60 (46.9%) | 82 (45.3%) |
Disability Class by Sex by Age in Gove County
Disability Class: Hearing Difficulty
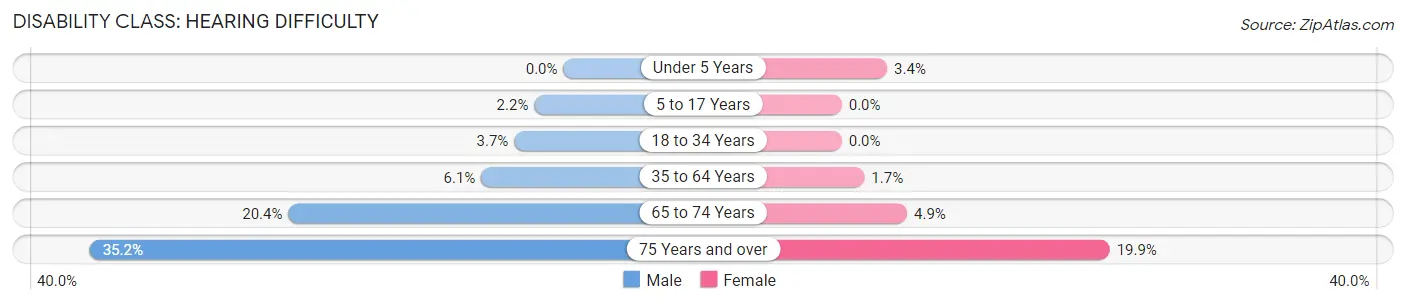
| Age Bracket | Male | Female |
| Under 5 Years | 0 (0.0%) | 3 (3.4%) |
| 5 to 17 Years | 6 (2.2%) | 0 (0.0%) |
| 18 to 34 Years | 8 (3.6%) | 0 (0.0%) |
| 35 to 64 Years | 31 (6.1%) | 7 (1.7%) |
| 65 to 74 Years | 29 (20.4%) | 8 (4.9%) |
| 75 Years and over | 45 (35.2%) | 36 (19.9%) |
Disability Class: Vision Difficulty
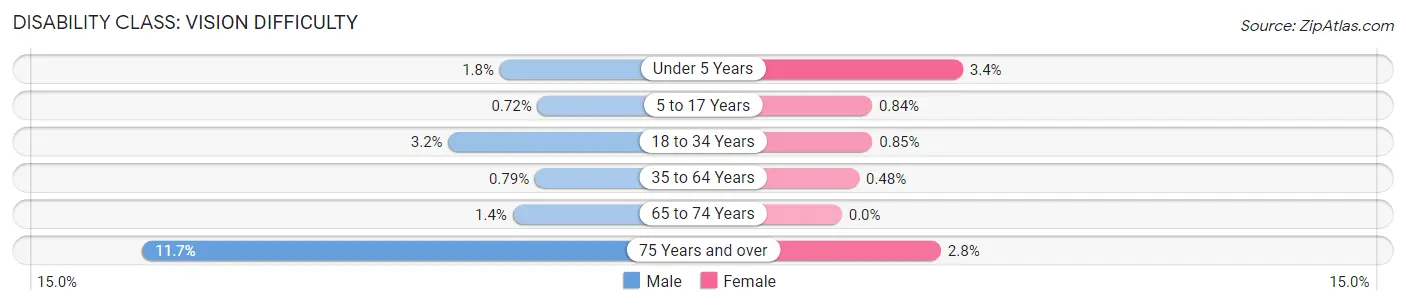
| Age Bracket | Male | Female |
| Under 5 Years | 2 (1.8%) | 3 (3.4%) |
| 5 to 17 Years | 2 (0.7%) | 2 (0.8%) |
| 18 to 34 Years | 7 (3.2%) | 2 (0.9%) |
| 35 to 64 Years | 4 (0.8%) | 2 (0.5%) |
| 65 to 74 Years | 2 (1.4%) | 0 (0.0%) |
| 75 Years and over | 15 (11.7%) | 5 (2.8%) |
Disability Class: Cognitive Difficulty
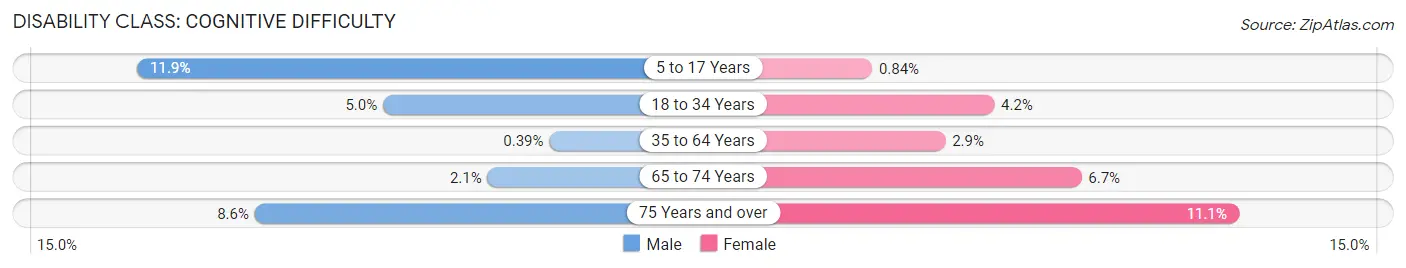
| Age Bracket | Male | Female |
| 5 to 17 Years | 33 (11.9%) | 2 (0.8%) |
| 18 to 34 Years | 11 (5.0%) | 10 (4.2%) |
| 35 to 64 Years | 2 (0.4%) | 12 (2.9%) |
| 65 to 74 Years | 3 (2.1%) | 11 (6.7%) |
| 75 Years and over | 11 (8.6%) | 20 (11.1%) |
Disability Class: Ambulatory Difficulty
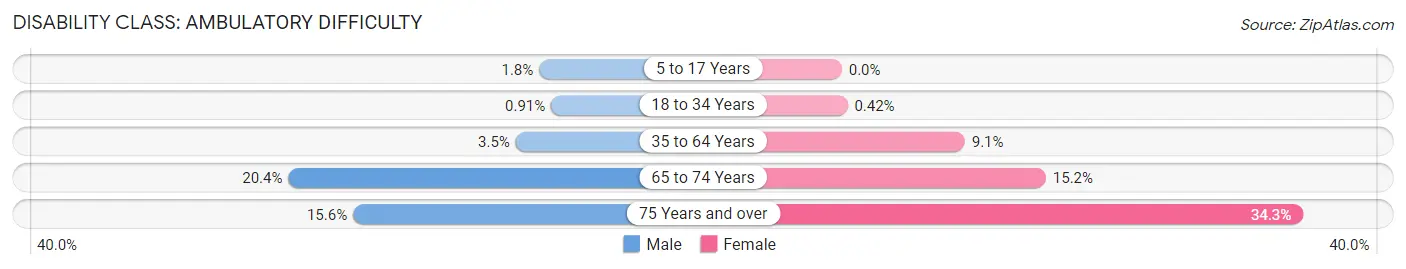
| Age Bracket | Male | Female |
| 5 to 17 Years | 5 (1.8%) | 0 (0.0%) |
| 18 to 34 Years | 2 (0.9%) | 1 (0.4%) |
| 35 to 64 Years | 18 (3.5%) | 38 (9.1%) |
| 65 to 74 Years | 29 (20.4%) | 25 (15.1%) |
| 75 Years and over | 20 (15.6%) | 62 (34.3%) |
Disability Class: Self-Care Difficulty
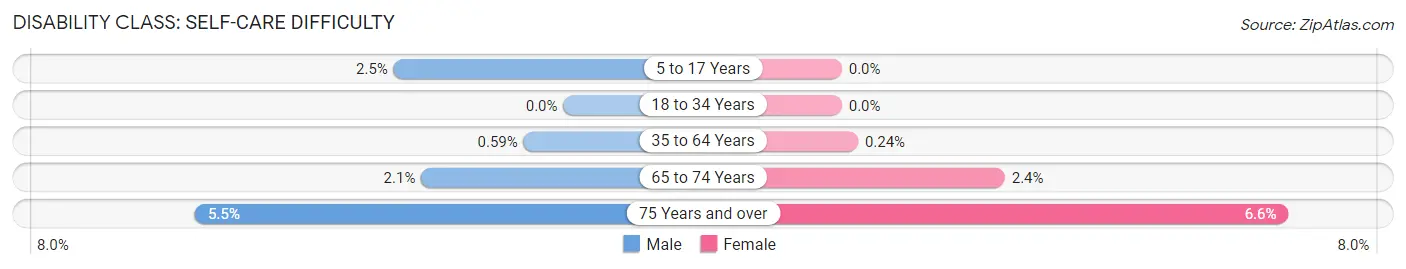
| Age Bracket | Male | Female |
| 5 to 17 Years | 7 (2.5%) | 0 (0.0%) |
| 18 to 34 Years | 0 (0.0%) | 0 (0.0%) |
| 35 to 64 Years | 3 (0.6%) | 1 (0.2%) |
| 65 to 74 Years | 3 (2.1%) | 4 (2.4%) |
| 75 Years and over | 7 (5.5%) | 12 (6.6%) |
Technology Access in Gove County
Computing Device Access in Gove County
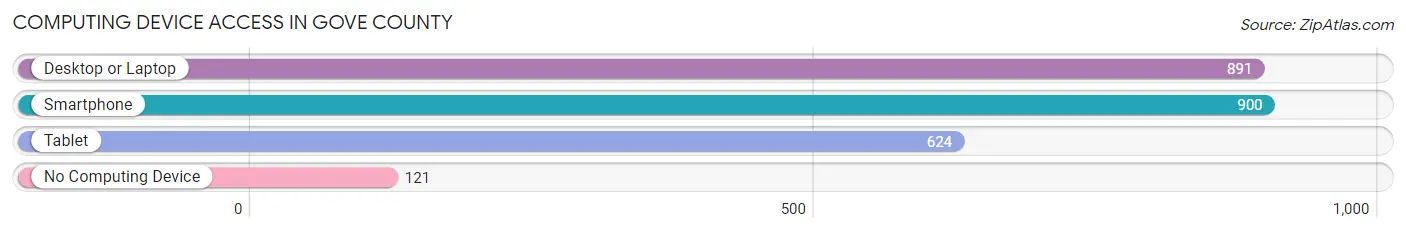
| Device Type | # Households | % Households |
| Desktop or Laptop | 891 | 75.4% |
| Smartphone | 900 | 76.1% |
| Tablet | 624 | 52.8% |
| No Computing Device | 121 | 10.2% |
| Total | 1,182 | 100.0% |
Internet Access in Gove County
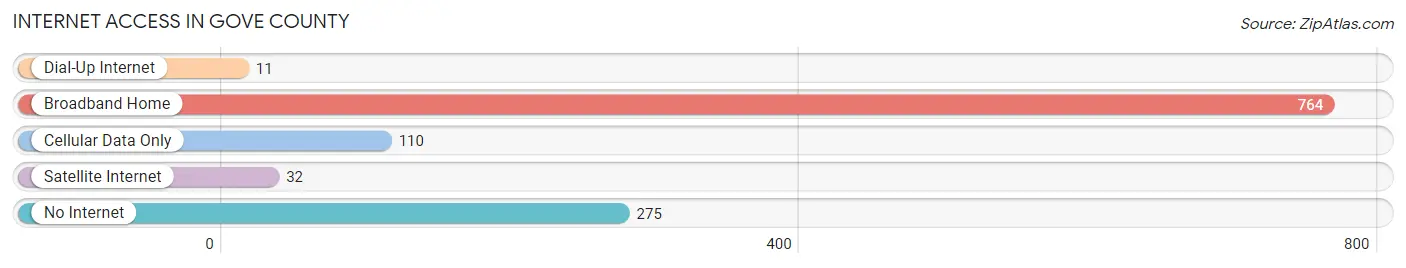
| Internet Type | # Households | % Households |
| Dial-Up Internet | 11 | 0.9% |
| Broadband Home | 764 | 64.6% |
| Cellular Data Only | 110 | 9.3% |
| Satellite Internet | 32 | 2.7% |
| No Internet | 275 | 23.3% |
| Total | 1,182 | 100.0% |
Gove County Summary
Gove County is located in the western part of the state of Kansas, and is bordered by Logan, Trego, Ness, and Scott counties. The county seat is Gove City, and the county has a total area of 876 square miles. As of the 2010 census, the population was 2,695, making it the second least populous county in the state.
Gove County was established in 1873 and named after Colonel Richard Gove, a Union Army officer who was killed in the Civil War. The county was originally part of the vast area of the Great Plains that was opened to settlement in the late 19th century. The first settlers arrived in the area in 1878, and the county was officially organized in 1879.
The geography of Gove County is characterized by rolling hills and flat plains. The county is located in the High Plains region of the Great Plains, and is part of the Smoky Hills region. The county is drained by the Smoky Hill River, which flows through the county from north to south. The county is also home to several small lakes, including Lake Gove, which is located in the northern part of the county.
The economy of Gove County is largely based on agriculture. The county is home to a variety of crops, including wheat, corn, sorghum, and soybeans. Cattle and sheep are also raised in the county. In addition, the county is home to several oil and gas fields, which provide jobs and revenue for the county.
The demographics of Gove County are largely rural and white. As of the 2010 census, the population was 97.3% white, 0.3% African American, 0.2% Native American, 0.2% Asian, 0.1% Pacific Islander, and 1.9% from two or more races. The median household income was $41,944, and the per capita income was $19,945.
Gove County is a rural county with a rich history and a strong agricultural economy. The county is home to a variety of crops and livestock, and is also home to several oil and gas fields. The county is largely white, and the median household income is slightly below the state average. Despite its small population, Gove County is an important part of the state of Kansas.
Common Questions
What is the Total Population of Gove County?
Total Population of Gove County is 2,758.
What is the Total Male Population of Gove County?
Total Male Population of Gove County is 1,402.
What is the Total Female Population of Gove County?
Total Female Population of Gove County is 1,356.
What is the Ratio of Males per 100 Females in Gove County?
There are 103.39 Males per 100 Females in Gove County.
What is the Ratio of Females per 100 Males in Gove County?
There are 96.72 Females per 100 Males in Gove County.
What is the Median Population Age in Gove County?
Median Population Age in Gove County is 42.1 Years.
What is the Average Family Size in Gove County
Average Family Size in Gove County is 3.0 People.
What is the Average Household Size in Gove County
Average Household Size in Gove County is 2.3 People.
What is Per Capita Income in Gove County?
Per Capita income in Gove County is $33,295.
What is the Median Family Income in Gove County?
Median Family Income in Gove County is $78,833.
What is the Median Household income in Gove County?
Median Household Income in Gove County is $59,417.
What is Income or Wage Gap in Gove County?
Income or Wage Gap in Gove County is 43.3%.
Women in Gove County earn 56.7 cents for every dollar earned by a man.
What is Inequality or Gini Index in Gove County?
Inequality or Gini Index in Gove County is 0.42.
How Large is the Labor Force in Gove County?
There are 1,340 People in the Labor Forcein in Gove County.
What is the Percentage of People in the Labor Force in Gove County?
63.6% of People are in the Labor Force in Gove County.
What is the Unemployment Rate in Gove County?
Unemployment Rate in Gove County is 3.3%.