Finney County, KS
Finney County Map
Finney County Overview
38,187
TOTAL POPULATION
19,697
MALE POPULATION
18,490
FEMALE POPULATION
106.53
MALES / 100 FEMALES
93.87
FEMALES / 100 MALES
31.9
MEDIAN AGE
3.4
AVG FAMILY SIZE
2.9
AVG HOUSEHOLD SIZE
$29,805
PER CAPITA INCOME
$82,562
AVG FAMILY INCOME
$68,481
AVG HOUSEHOLD INCOME
33.1%
WAGE / INCOME GAP [ % ]
66.9¢/ $1
WAGE / INCOME GAP [ $ ]
$14,693
FAMILY INCOME DEFICIT
0.40
INEQUALITY / GINI INDEX
19,784
LABOR FORCE [ PEOPLE ]
70.4%
PERCENT IN LABOR FORCE
5.4%
UNEMPLOYMENT RATE
Finney County Area Codes
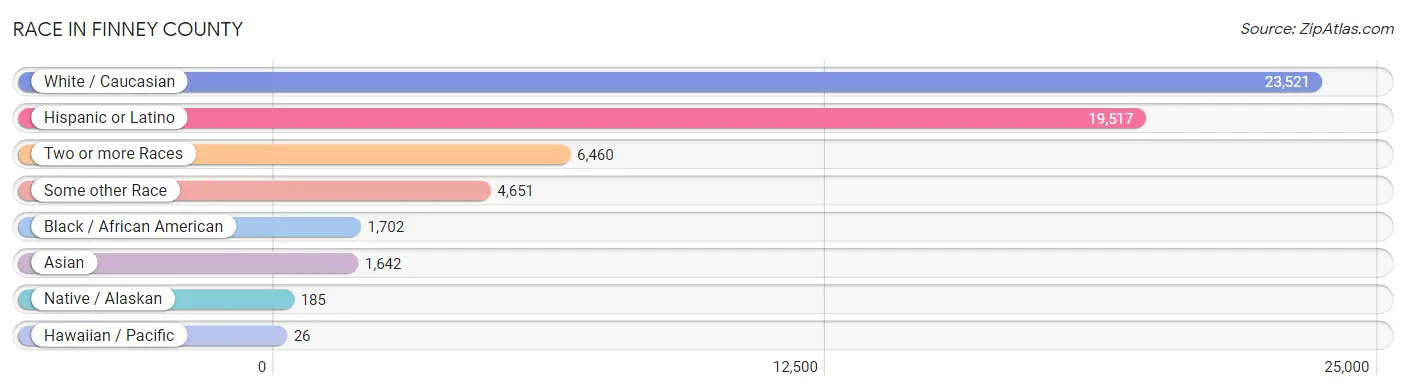
Race in Finney County
The most populous races in Finney County are White / Caucasian (23,521 | 61.6%), Hispanic or Latino (19,517 | 51.1%), and Two or more Races (6,460 | 16.9%).
| Race | # Population | % Population |
| Asian | 1,642 | 4.3% |
| Black / African American | 1,702 | 4.5% |
| Hawaiian / Pacific | 26 | 0.1% |
| Hispanic or Latino | 19,517 | 51.1% |
| Native / Alaskan | 185 | 0.5% |
| White / Caucasian | 23,521 | 61.6% |
| Two or more Races | 6,460 | 16.9% |
| Some other Race | 4,651 | 12.2% |
| Total | 38,187 | 100.0% |
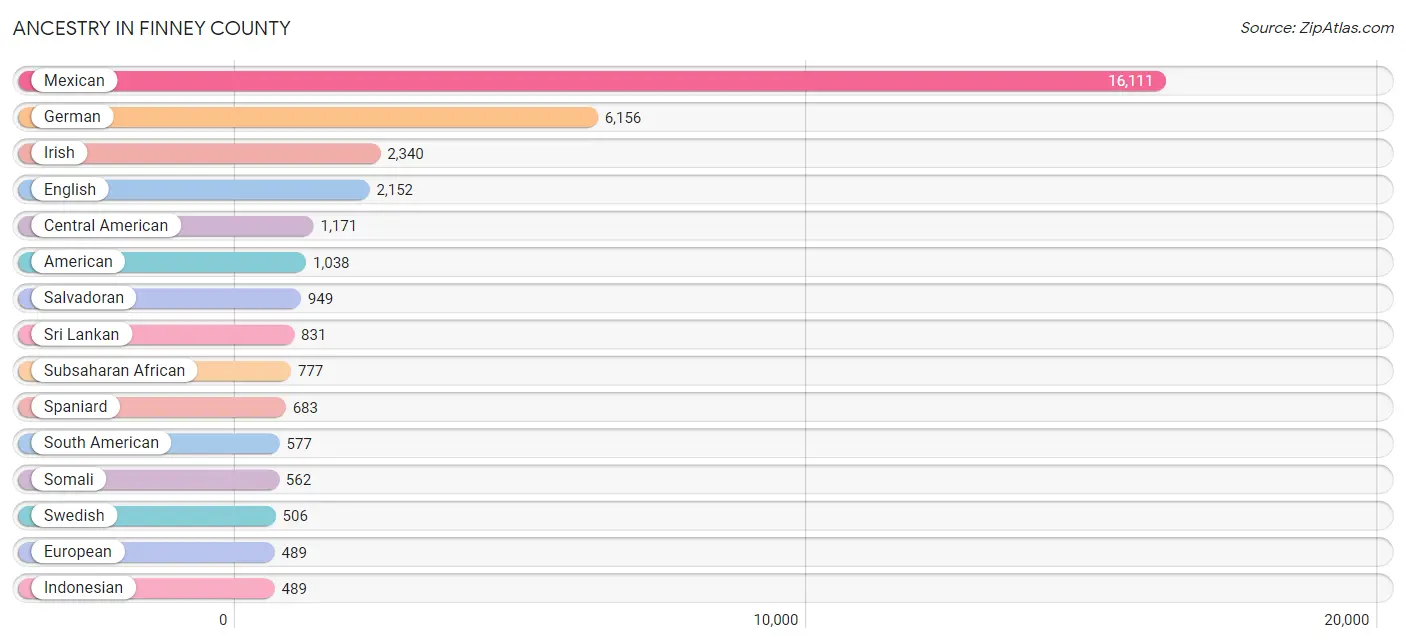
Ancestry in Finney County
The most populous ancestries reported in Finney County are Mexican (16,111 | 42.2%), German (6,156 | 16.1%), Irish (2,340 | 6.1%), English (2,152 | 5.6%), and Central American (1,171 | 3.1%), together accounting for 73.1% of all Finney County residents.
| Ancestry | # Population | % Population |
| African | 44 | 0.1% |
| American | 1,038 | 2.7% |
| Apache | 37 | 0.1% |
| Argentinean | 413 | 1.1% |
| Armenian | 18 | 0.1% |
| Australian | 6 | 0.0% |
| Austrian | 130 | 0.3% |
| Belgian | 7 | 0.0% |
| Bhutanese | 1 | 0.0% |
| Blackfeet | 8 | 0.0% |
| British | 83 | 0.2% |
| Canadian | 49 | 0.1% |
| Celtic | 2 | 0.0% |
| Central American | 1,171 | 3.1% |
| Central American Indian | 19 | 0.1% |
| Cherokee | 80 | 0.2% |
| Choctaw | 17 | 0.0% |
| Colombian | 46 | 0.1% |
| Comanche | 3 | 0.0% |
| Creek | 2 | 0.0% |
| Cuban | 71 | 0.2% |
| Czech | 236 | 0.6% |
| Czechoslovakian | 7 | 0.0% |
| Danish | 189 | 0.5% |
| Dutch | 374 | 1.0% |
| Eastern European | 42 | 0.1% |
| English | 2,152 | 5.6% |
| Ethiopian | 33 | 0.1% |
| European | 489 | 1.3% |
| French | 437 | 1.1% |
| French American Indian | 46 | 0.1% |
| French Canadian | 39 | 0.1% |
| German | 6,156 | 16.1% |
| Greek | 56 | 0.2% |
| Guamanian / Chamorro | 26 | 0.1% |
| Guatemalan | 156 | 0.4% |
| Haitian | 464 | 1.2% |
| Honduran | 23 | 0.1% |
| Hungarian | 96 | 0.3% |
| Indian (Asian) | 38 | 0.1% |
| Indonesian | 489 | 1.3% |
| Irish | 2,340 | 6.1% |
| Italian | 113 | 0.3% |
| Jamaican | 42 | 0.1% |
| Kiowa | 1 | 0.0% |
| Korean | 125 | 0.3% |
| Latvian | 52 | 0.1% |
| Lithuanian | 2 | 0.0% |
| Malaysian | 112 | 0.3% |
| Mexican | 16,111 | 42.2% |
| Mexican American Indian | 84 | 0.2% |
| Mongolian | 40 | 0.1% |
| Navajo | 21 | 0.1% |
| Norwegian | 200 | 0.5% |
| Osage | 2 | 0.0% |
| Panamanian | 43 | 0.1% |
| Pennsylvania German | 80 | 0.2% |
| Peruvian | 90 | 0.2% |
| Polish | 259 | 0.7% |
| Portuguese | 43 | 0.1% |
| Potawatomi | 84 | 0.2% |
| Puerto Rican | 185 | 0.5% |
| Russian | 175 | 0.5% |
| Salvadoran | 949 | 2.5% |
| Samoan | 23 | 0.1% |
| Scandinavian | 21 | 0.1% |
| Scotch-Irish | 59 | 0.2% |
| Scottish | 281 | 0.7% |
| Serbian | 22 | 0.1% |
| Sioux | 32 | 0.1% |
| Somali | 562 | 1.5% |
| South American | 577 | 1.5% |
| Spaniard | 683 | 1.8% |
| Spanish | 10 | 0.0% |
| Sri Lankan | 831 | 2.2% |
| Subsaharan African | 777 | 2.0% |
| Sudanese | 138 | 0.4% |
| Swedish | 506 | 1.3% |
| Swiss | 30 | 0.1% |
| Venezuelan | 28 | 0.1% |
| Welsh | 57 | 0.2% | View All 81 Rows |
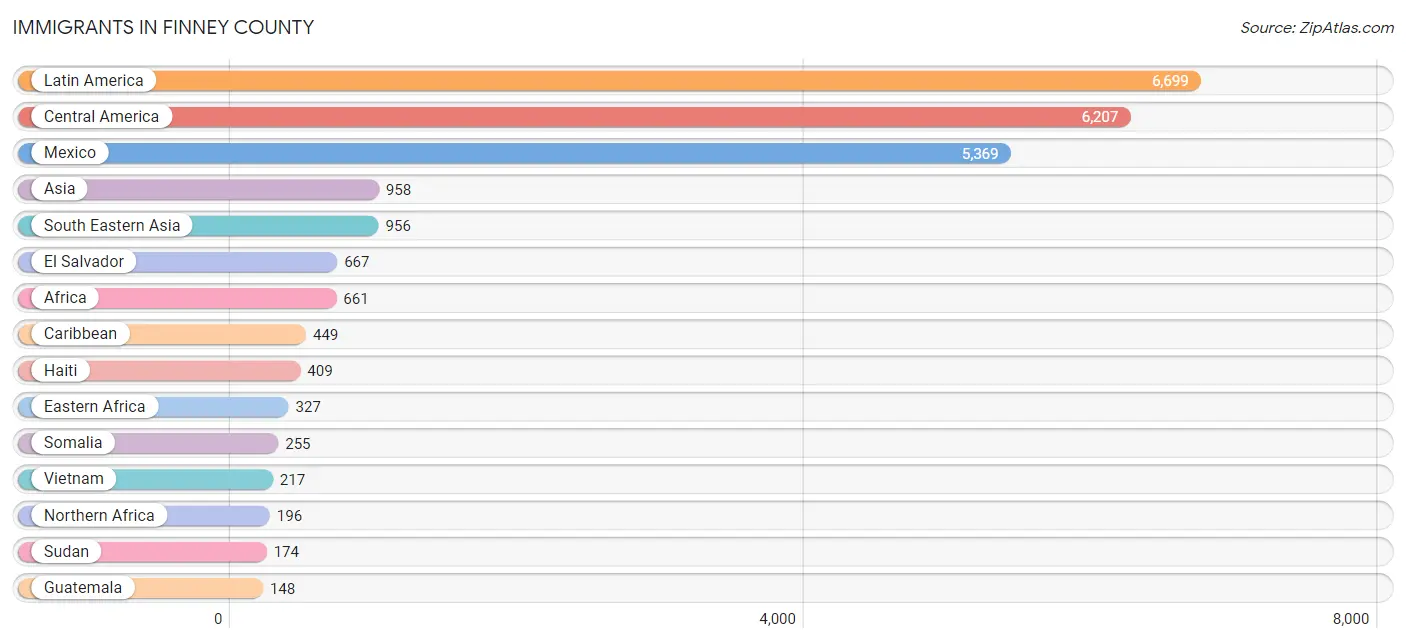
Immigrants in Finney County
The most numerous immigrant groups reported in Finney County came from Latin America (6,699 | 17.5%), Central America (6,207 | 16.3%), Mexico (5,369 | 14.1%), Asia (958 | 2.5%), and South Eastern Asia (956 | 2.5%), together accounting for 52.9% of all Finney County residents.
| Immigration Origin | # Population | % Population |
| Africa | 661 | 1.7% |
| Asia | 958 | 2.5% |
| Canada | 29 | 0.1% |
| Caribbean | 449 | 1.2% |
| Central America | 6,207 | 16.3% |
| Colombia | 14 | 0.0% |
| Cuba | 40 | 0.1% |
| Eastern Africa | 327 | 0.9% |
| Egypt | 22 | 0.1% |
| El Salvador | 667 | 1.8% |
| England | 22 | 0.1% |
| Eritrea | 9 | 0.0% |
| Ethiopia | 63 | 0.2% |
| Europe | 38 | 0.1% |
| Germany | 5 | 0.0% |
| Guatemala | 148 | 0.4% |
| Haiti | 409 | 1.1% |
| Honduras | 23 | 0.1% |
| Kazakhstan | 2 | 0.0% |
| Laos | 146 | 0.4% |
| Latin America | 6,699 | 17.5% |
| Malaysia | 40 | 0.1% |
| Mexico | 5,369 | 14.1% |
| Nigeria | 70 | 0.2% |
| Northern Africa | 196 | 0.5% |
| Northern Europe | 22 | 0.1% |
| Peru | 29 | 0.1% |
| Philippines | 100 | 0.3% |
| Portugal | 11 | 0.0% |
| Singapore | 24 | 0.1% |
| Somalia | 255 | 0.7% |
| South Africa | 33 | 0.1% |
| South America | 43 | 0.1% |
| South Central Asia | 2 | 0.0% |
| South Eastern Asia | 956 | 2.5% |
| Southern Europe | 11 | 0.0% |
| Sudan | 174 | 0.5% |
| Vietnam | 217 | 0.6% |
| Western Africa | 70 | 0.2% |
| Western Europe | 5 | 0.0% | View All 40 Rows |
Sex and Age in Finney County
Sex and Age in Finney County
The most populous age groups in Finney County are 5 to 9 Years (1,729 | 8.8%) for men and 5 to 9 Years (1,722 | 9.3%) for women.
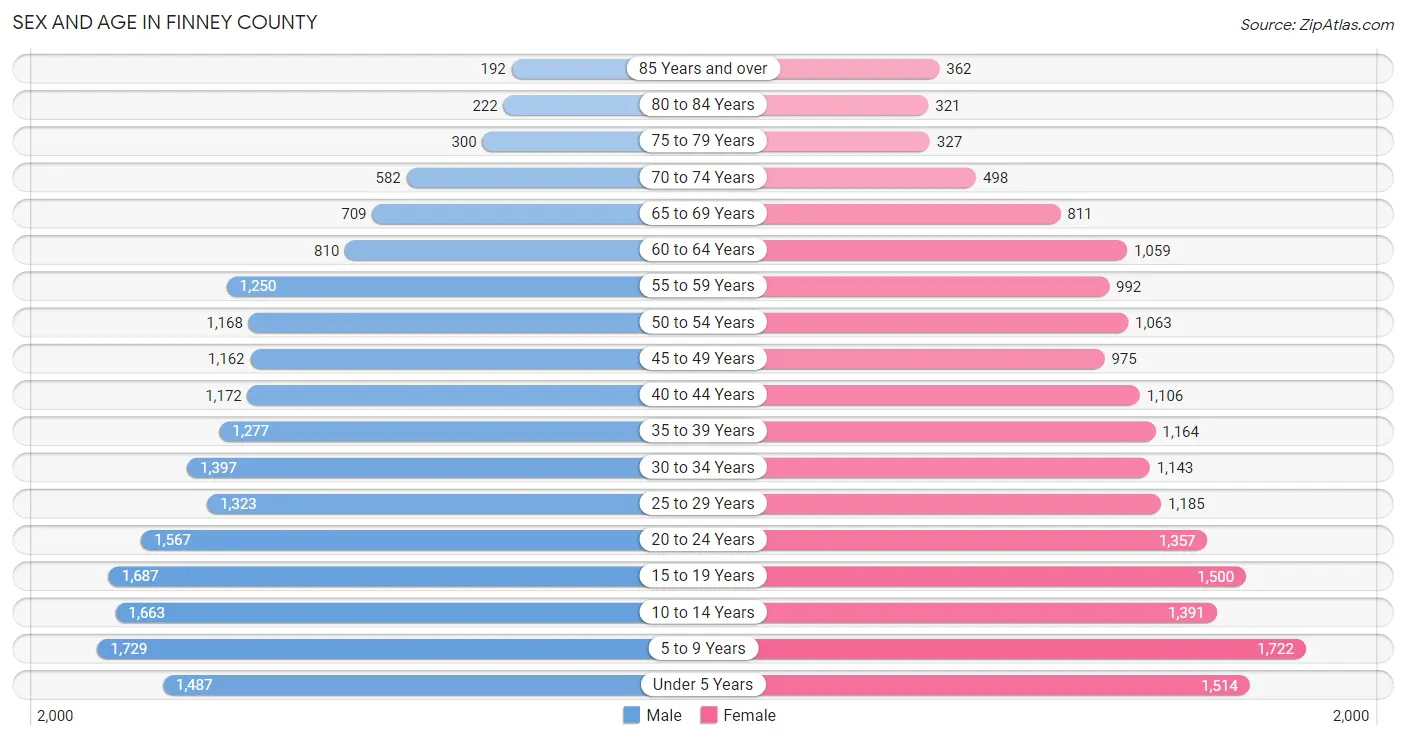
| Age Bracket | Male | Female |
| Under 5 Years | 1,487 (7.5%) | 1,514 (8.2%) |
| 5 to 9 Years | 1,729 (8.8%) | 1,722 (9.3%) |
| 10 to 14 Years | 1,663 (8.4%) | 1,391 (7.5%) |
| 15 to 19 Years | 1,687 (8.6%) | 1,500 (8.1%) |
| 20 to 24 Years | 1,567 (8.0%) | 1,357 (7.3%) |
| 25 to 29 Years | 1,323 (6.7%) | 1,185 (6.4%) |
| 30 to 34 Years | 1,397 (7.1%) | 1,143 (6.2%) |
| 35 to 39 Years | 1,277 (6.5%) | 1,164 (6.3%) |
| 40 to 44 Years | 1,172 (5.9%) | 1,106 (6.0%) |
| 45 to 49 Years | 1,162 (5.9%) | 975 (5.3%) |
| 50 to 54 Years | 1,168 (5.9%) | 1,063 (5.8%) |
| 55 to 59 Years | 1,250 (6.4%) | 992 (5.4%) |
| 60 to 64 Years | 810 (4.1%) | 1,059 (5.7%) |
| 65 to 69 Years | 709 (3.6%) | 811 (4.4%) |
| 70 to 74 Years | 582 (2.9%) | 498 (2.7%) |
| 75 to 79 Years | 300 (1.5%) | 327 (1.8%) |
| 80 to 84 Years | 222 (1.1%) | 321 (1.7%) |
| 85 Years and over | 192 (1.0%) | 362 (2.0%) |
| Total | 19,697 (100.0%) | 18,490 (100.0%) |
Families and Households in Finney County
Median Family Size in Finney County
The median family size in Finney County is 3.43 persons per family, with single female/mother families (1,625 | 17.8%) accounting for the largest median family size of 4.17 persons per family. On the other hand, single male/father families (1,028 | 11.3%) represent the smallest median family size with 2.83 persons per family.
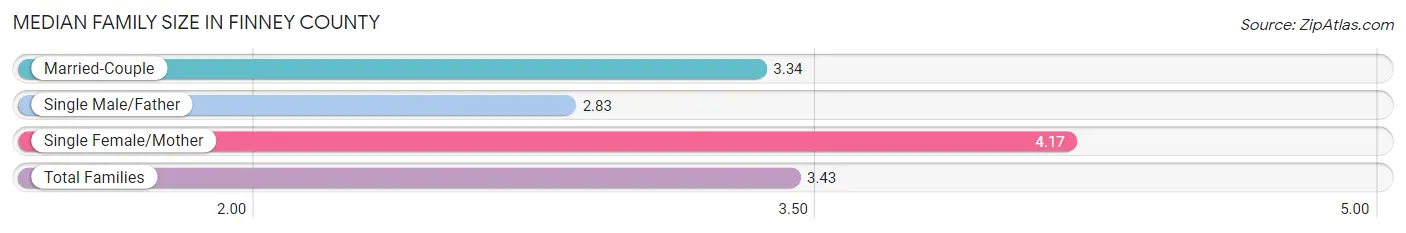
| Family Type | # Families | Family Size |
| Married-Couple | 6,458 (70.9%) | 3.34 |
| Single Male/Father | 1,028 (11.3%) | 2.83 |
| Single Female/Mother | 1,625 (17.8%) | 4.17 |
| Total Families | 9,111 (100.0%) | 3.43 |
Median Household Size in Finney County
The median household size in Finney County is 2.88 persons per household, with single female/mother households (1,625 | 12.5%) accounting for the largest median household size of 4.5 persons per household. non-family households (3,910 | 30.0%) represent the smallest median household size with 1.27 persons per household.
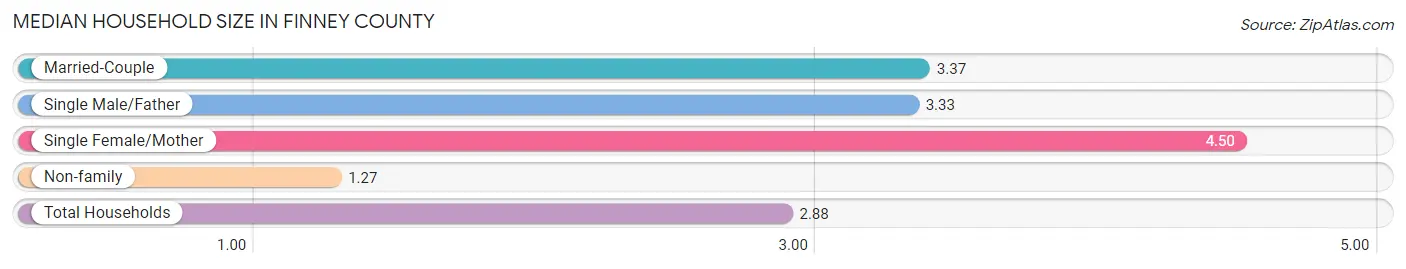
| Household Type | # Households | Household Size |
| Married-Couple | 6,458 (49.6%) | 3.37 |
| Single Male/Father | 1,028 (7.9%) | 3.33 |
| Single Female/Mother | 1,625 (12.5%) | 4.50 |
| Non-family | 3,910 (30.0%) | 1.27 |
| Total Households | 13,021 (100.0%) | 2.88 |
Household Size by Marriage Status in Finney County
Out of a total of 13,021 households in Finney County, 9,111 (70.0%) are family households, while 3,910 (30.0%) are nonfamily households. The most numerous type of family households are 2-person households, comprising 3,494, and the most common type of nonfamily households are 1-person households, comprising 3,227.
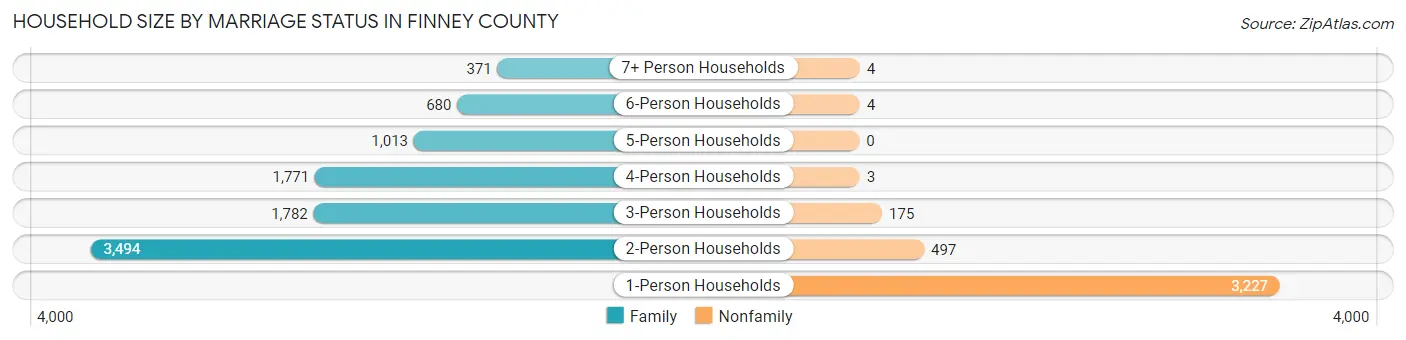
| Household Size | Family Households | Nonfamily Households |
| 1-Person Households | - | 3,227 (24.8%) |
| 2-Person Households | 3,494 (26.8%) | 497 (3.8%) |
| 3-Person Households | 1,782 (13.7%) | 175 (1.3%) |
| 4-Person Households | 1,771 (13.6%) | 3 (0.0%) |
| 5-Person Households | 1,013 (7.8%) | 0 (0.0%) |
| 6-Person Households | 680 (5.2%) | 4 (0.0%) |
| 7+ Person Households | 371 (2.9%) | 4 (0.0%) |
| Total | 9,111 (70.0%) | 3,910 (30.0%) |
Female Fertility in Finney County
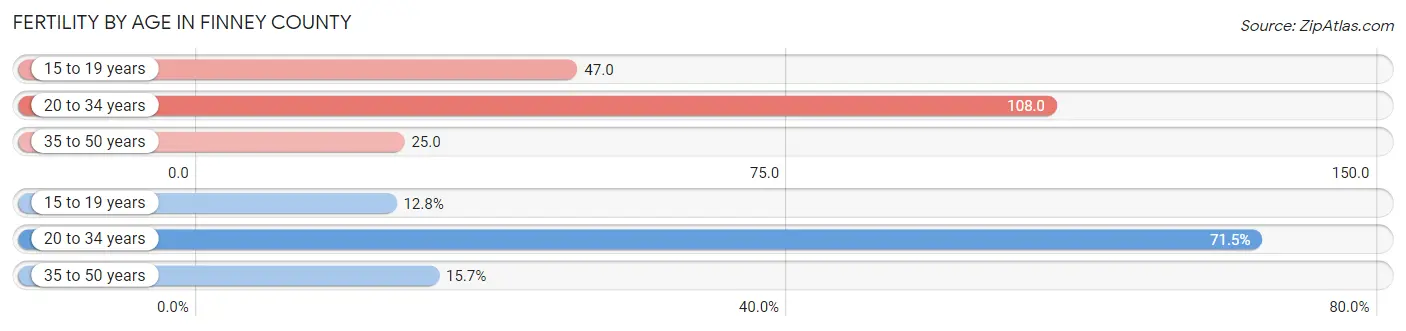
Fertility by Age in Finney County
Average fertility rate in Finney County is 64.0 births per 1,000 women. Women in the age bracket of 20 to 34 years have the highest fertility rate with 108.0 births per 1,000 women. Women in the age bracket of 20 to 34 years acount for 71.5% of all women with births.
| Age Bracket | Women with Births | Births / 1,000 Women |
| 15 to 19 years | 71 (12.8%) | 47.0 |
| 20 to 34 years | 397 (71.5%) | 108.0 |
| 35 to 50 years | 87 (15.7%) | 25.0 |
| Total | 555 (100.0%) | 64.0 |
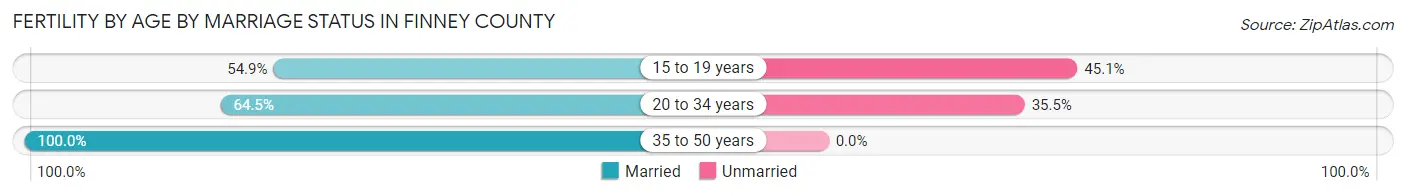
Fertility by Age by Marriage Status in Finney County
68.8% of women with births (555) in Finney County are married. The highest percentage of unmarried women with births falls into 15 to 19 years age bracket with 45.1% of them unmarried at the time of birth, while the lowest percentage of unmarried women with births belong to 35 to 50 years age bracket with 0.0% of them unmarried.
| Age Bracket | Married | Unmarried |
| 15 to 19 years | 39 (54.9%) | 32 (45.1%) |
| 20 to 34 years | 256 (64.5%) | 141 (35.5%) |
| 35 to 50 years | 87 (100.0%) | 0 (0.0%) |
| Total | 382 (68.8%) | 173 (31.2%) |
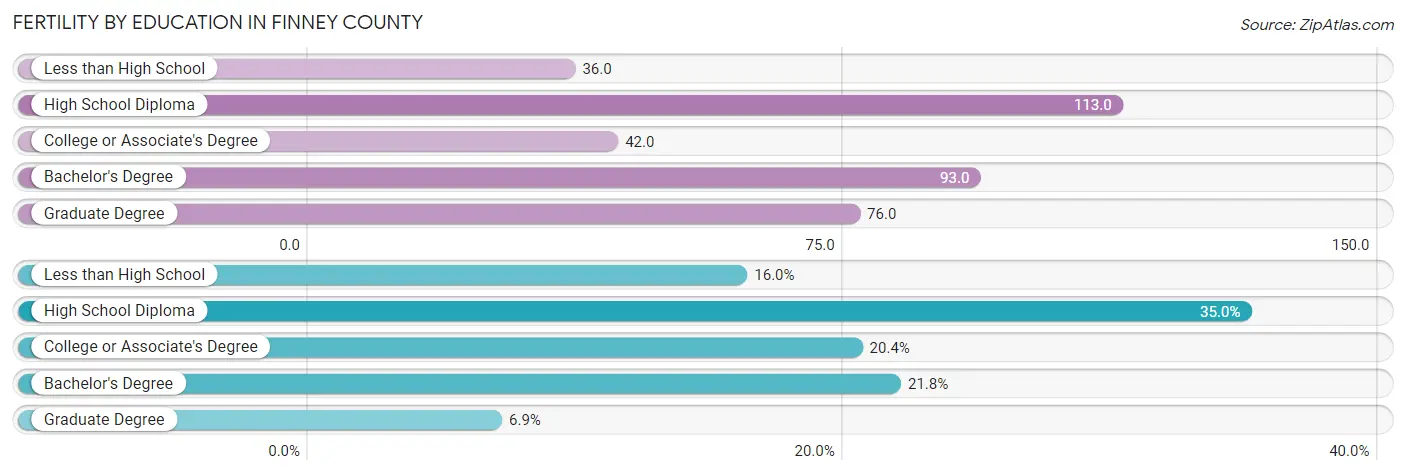
Fertility by Education in Finney County
Average fertility rate in Finney County is 64.0 births per 1,000 women. Women with the education attainment of high school diploma have the highest fertility rate of 113.0 births per 1,000 women, while women with the education attainment of less than high school have the lowest fertility at 36.0 births per 1,000 women. Women with the education attainment of high school diploma represent 34.9% of all women with births.
| Educational Attainment | Women with Births | Births / 1,000 Women |
| Less than High School | 89 (16.0%) | 36.0 |
| High School Diploma | 194 (34.9%) | 113.0 |
| College or Associate's Degree | 113 (20.4%) | 42.0 |
| Bachelor's Degree | 121 (21.8%) | 93.0 |
| Graduate Degree | 38 (6.9%) | 76.0 |
| Total | 555 (100.0%) | 64.0 |
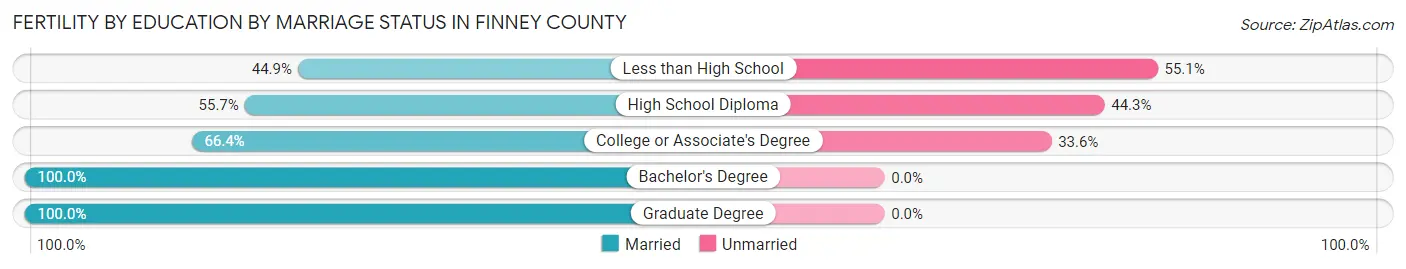
Fertility by Education by Marriage Status in Finney County
31.2% of women with births in Finney County are unmarried. Women with the educational attainment of bachelor's degree are most likely to be married with 100.0% of them married at childbirth, while women with the educational attainment of less than high school are least likely to be married with 55.1% of them unmarried at childbirth.
| Educational Attainment | Married | Unmarried |
| Less than High School | 40 (44.9%) | 49 (55.1%) |
| High School Diploma | 108 (55.7%) | 86 (44.3%) |
| College or Associate's Degree | 75 (66.4%) | 38 (33.6%) |
| Bachelor's Degree | 121 (100.0%) | 0 (0.0%) |
| Graduate Degree | 38 (100.0%) | 0 (0.0%) |
| Total | 382 (68.8%) | 173 (31.2%) |
Income in Finney County
Income Overview in Finney County
Per Capita Income in Finney County is $29,805, while median incomes of families and households are $82,562 and $68,481 respectively.
| Characteristic | Number | Measure |
| Per Capita Income | 38,187 | $29,805 |
| Median Family Income | 9,111 | $82,562 |
| Mean Family Income | 9,111 | $97,330 |
| Median Household Income | 13,021 | $68,481 |
| Mean Household Income | 13,021 | $85,317 |
| Income Deficit | 9,111 | $14,693 |
| Wage / Income Gap (%) | 38,187 | 33.09% |
| Wage / Income Gap ($) | 38,187 | 66.91¢ per $1 |
| Gini / Inequality Index | 38,187 | 0.40 |
Earnings by Sex in Finney County
Average Earnings in Finney County are $38,370, $44,925 for men and $30,060 for women, a difference of 33.1%.
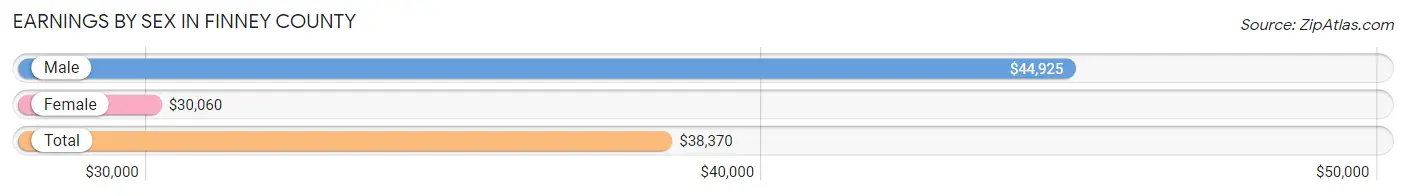
| Sex | Number | Average Earnings |
| Male | 11,830 (56.0%) | $44,925 |
| Female | 9,305 (44.0%) | $30,060 |
| Total | 21,135 (100.0%) | $38,370 |
Earnings by Sex by Income Bracket in Finney County
The most common earnings brackets in Finney County are $100,000+ for men (1,240 | 10.5%) and $35,000 to $39,999 for women (911 | 9.8%).
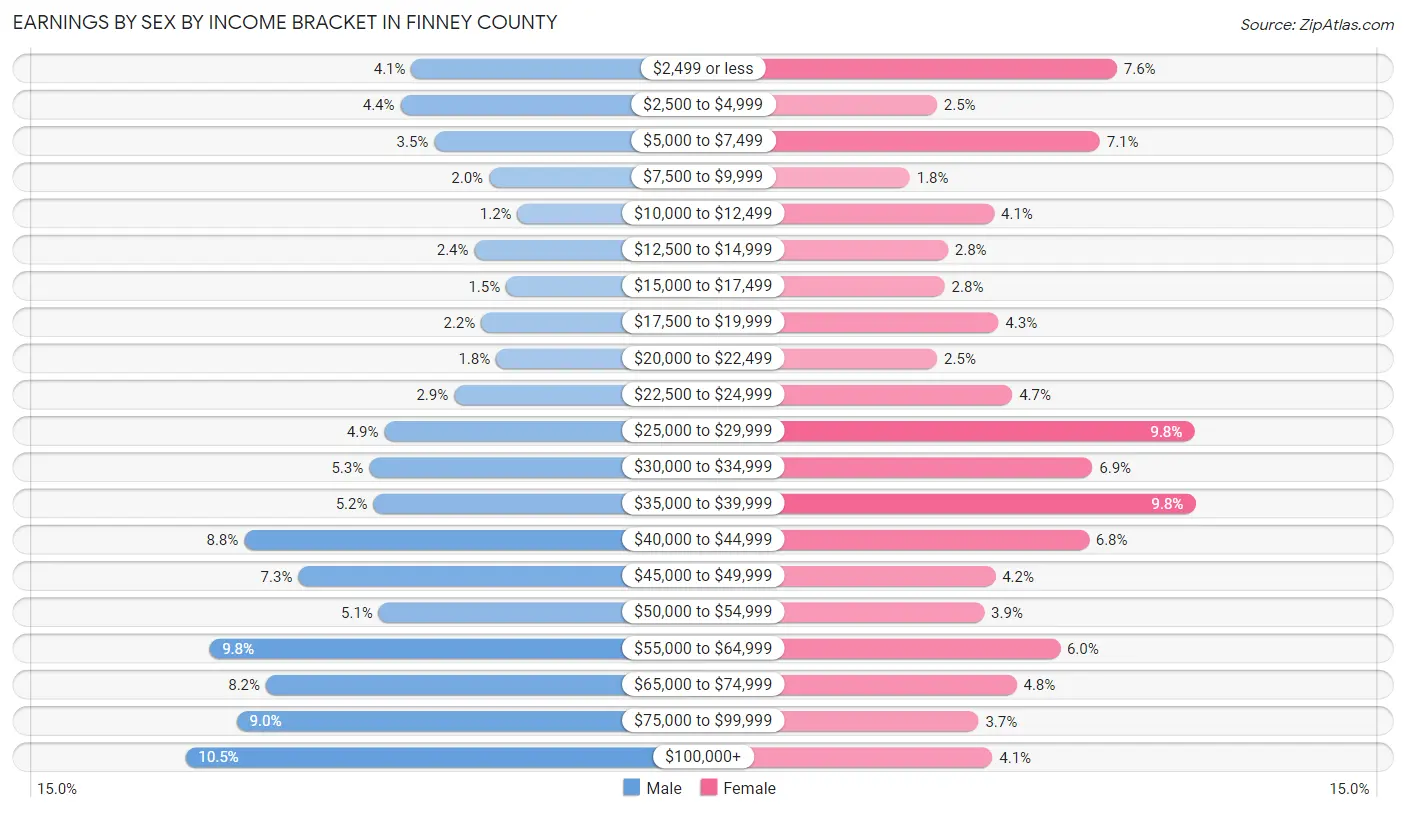
| Income | Male | Female |
| $2,499 or less | 489 (4.1%) | 706 (7.6%) |
| $2,500 to $4,999 | 525 (4.4%) | 235 (2.5%) |
| $5,000 to $7,499 | 413 (3.5%) | 662 (7.1%) |
| $7,500 to $9,999 | 231 (1.9%) | 165 (1.8%) |
| $10,000 to $12,499 | 136 (1.1%) | 385 (4.1%) |
| $12,500 to $14,999 | 279 (2.4%) | 264 (2.8%) |
| $15,000 to $17,499 | 174 (1.5%) | 256 (2.8%) |
| $17,500 to $19,999 | 257 (2.2%) | 396 (4.3%) |
| $20,000 to $22,499 | 207 (1.8%) | 236 (2.5%) |
| $22,500 to $24,999 | 347 (2.9%) | 433 (4.6%) |
| $25,000 to $29,999 | 579 (4.9%) | 908 (9.8%) |
| $30,000 to $34,999 | 629 (5.3%) | 642 (6.9%) |
| $35,000 to $39,999 | 615 (5.2%) | 911 (9.8%) |
| $40,000 to $44,999 | 1,044 (8.8%) | 633 (6.8%) |
| $45,000 to $49,999 | 865 (7.3%) | 388 (4.2%) |
| $50,000 to $54,999 | 597 (5.1%) | 359 (3.9%) |
| $55,000 to $64,999 | 1,160 (9.8%) | 557 (6.0%) |
| $65,000 to $74,999 | 973 (8.2%) | 444 (4.8%) |
| $75,000 to $99,999 | 1,070 (9.0%) | 344 (3.7%) |
| $100,000+ | 1,240 (10.5%) | 381 (4.1%) |
| Total | 11,830 (100.0%) | 9,305 (100.0%) |
Earnings by Sex by Educational Attainment in Finney County
Average earnings in Finney County are $51,362 for men and $35,039 for women, a difference of 31.8%. Men with an educational attainment of graduate degree enjoy the highest average annual earnings of $72,727, while those with high school diploma education earn the least with $44,989. Women with an educational attainment of graduate degree earn the most with the average annual earnings of $64,028, while those with high school diploma education have the smallest earnings of $27,477.
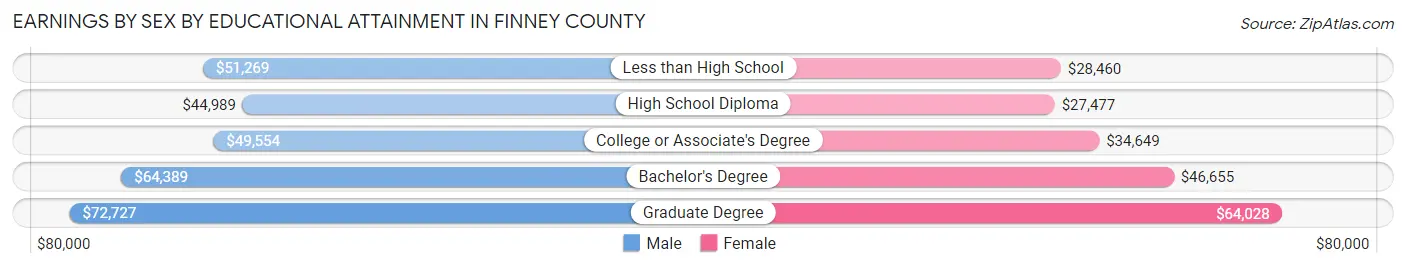
| Educational Attainment | Male Income | Female Income |
| Less than High School | $51,269 | $28,460 |
| High School Diploma | $44,989 | $27,477 |
| College or Associate's Degree | $49,554 | $34,649 |
| Bachelor's Degree | $64,389 | $46,655 |
| Graduate Degree | $72,727 | $64,028 |
| Total | $51,362 | $35,039 |
Family Income in Finney County
Family Income Brackets in Finney County
According to the Finney County family income data, there are 2,405 families falling into the $100,000 to $149,999 income range, which is the most common income bracket and makes up 26.4% of all families. Conversely, the $10,000 to $14,999 income bracket is the least frequent group with only 128 families (1.4%) belonging to this category.
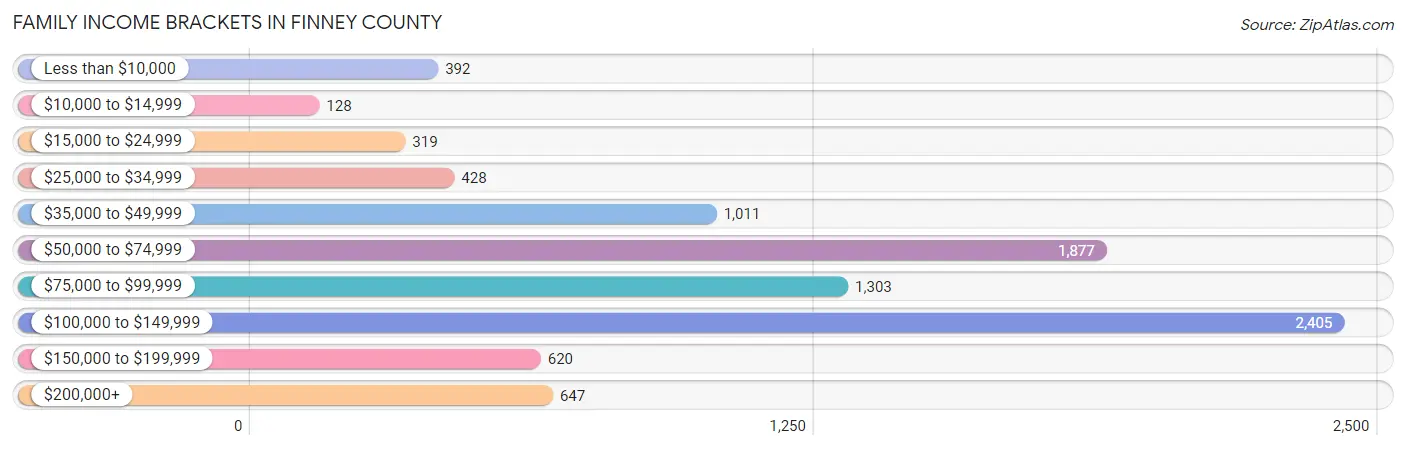
| Income Bracket | # Families | % Families |
| Less than $10,000 | 392 | 4.3% |
| $10,000 to $14,999 | 128 | 1.4% |
| $15,000 to $24,999 | 319 | 3.5% |
| $25,000 to $34,999 | 428 | 4.7% |
| $35,000 to $49,999 | 1,011 | 11.1% |
| $50,000 to $74,999 | 1,877 | 20.6% |
| $75,000 to $99,999 | 1,303 | 14.3% |
| $100,000 to $149,999 | 2,405 | 26.4% |
| $150,000 to $199,999 | 620 | 6.8% |
| $200,000+ | 647 | 7.1% |
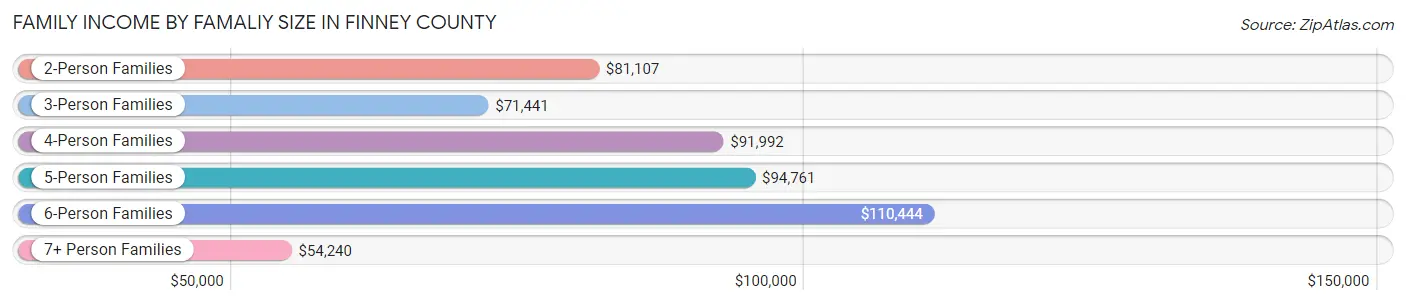
Family Income by Famaliy Size in Finney County
6-person families (647 | 7.1%) account for the highest median family income in Finney County with $110,444 per family, while 2-person families (3,870 | 42.5%) have the highest median income of $40,554 per family member.
| Income Bracket | # Families | Median Income |
| 2-Person Families | 3,870 (42.5%) | $81,107 |
| 3-Person Families | 1,734 (19.0%) | $71,441 |
| 4-Person Families | 1,548 (17.0%) | $91,992 |
| 5-Person Families | 951 (10.4%) | $94,761 |
| 6-Person Families | 647 (7.1%) | $110,444 |
| 7+ Person Families | 361 (4.0%) | $54,240 |
| Total | 9,111 (100.0%) | $82,562 |
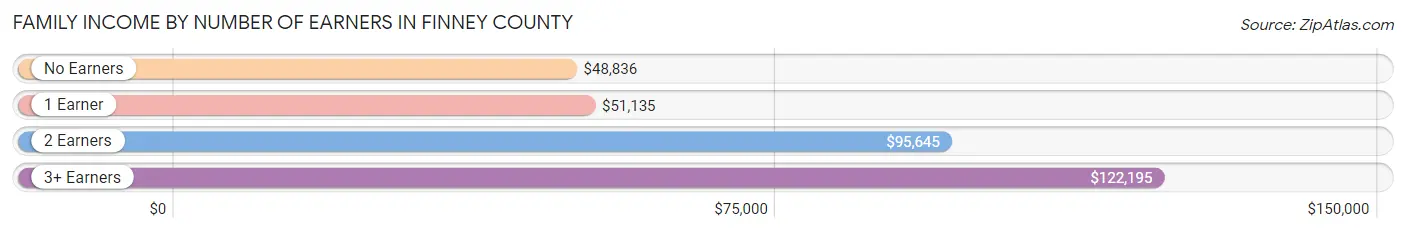
Family Income by Number of Earners in Finney County
The median family income in Finney County is $82,562, with families comprising 3+ earners (1,664) having the highest median family income of $122,195, while families with no earners (768) have the lowest median family income of $48,836, accounting for 18.3% and 8.4% of families, respectively.
| Number of Earners | # Families | Median Income |
| No Earners | 768 (8.4%) | $48,836 |
| 1 Earner | 2,707 (29.7%) | $51,135 |
| 2 Earners | 3,972 (43.6%) | $95,645 |
| 3+ Earners | 1,664 (18.3%) | $122,195 |
| Total | 9,111 (100.0%) | $82,562 |
Household Income in Finney County
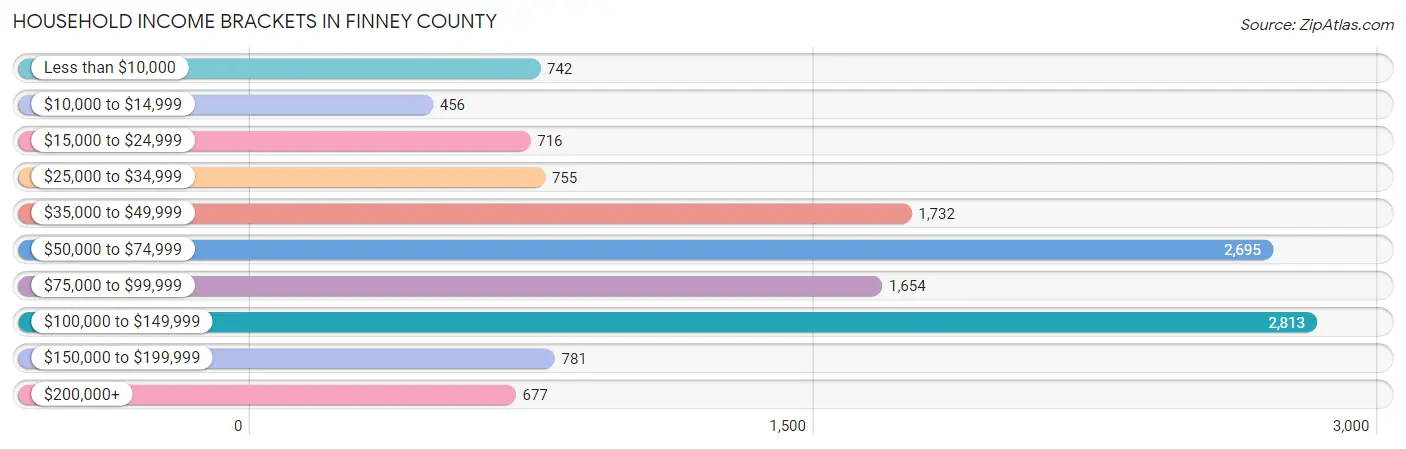
Household Income Brackets in Finney County
With 2,813 households falling in the category, the $100,000 to $149,999 income range is the most frequent in Finney County, accounting for 21.6% of all households. In contrast, only 456 households (3.5%) fall into the $10,000 to $14,999 income bracket, making it the least populous group.
| Income Bracket | # Households | % Households |
| Less than $10,000 | 742 | 5.7% |
| $10,000 to $14,999 | 456 | 3.5% |
| $15,000 to $24,999 | 716 | 5.5% |
| $25,000 to $34,999 | 755 | 5.8% |
| $35,000 to $49,999 | 1,732 | 13.3% |
| $50,000 to $74,999 | 2,695 | 20.7% |
| $75,000 to $99,999 | 1,654 | 12.7% |
| $100,000 to $149,999 | 2,813 | 21.6% |
| $150,000 to $199,999 | 781 | 6.0% |
| $200,000+ | 677 | 5.2% |
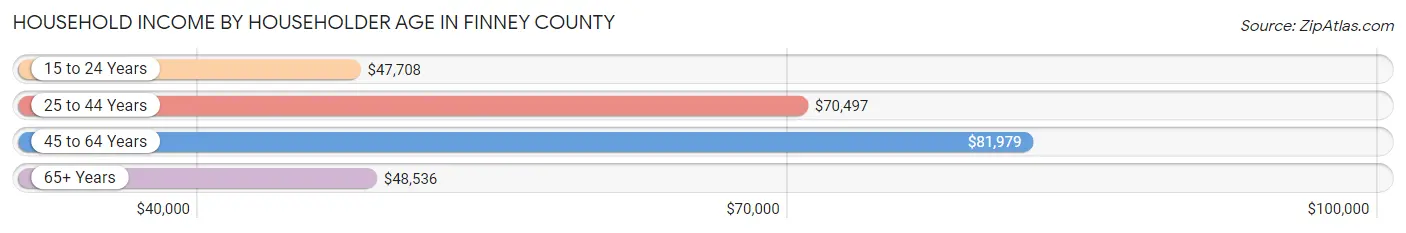
Household Income by Householder Age in Finney County
The median household income in Finney County is $68,481, with the highest median household income of $81,979 found in the 45 to 64 years age bracket for the primary householder. A total of 4,903 households (37.7%) fall into this category. Meanwhile, the 15 to 24 years age bracket for the primary householder has the lowest median household income of $47,708, with 722 households (5.5%) in this group.
| Income Bracket | # Households | Median Income |
| 15 to 24 Years | 722 (5.5%) | $47,708 |
| 25 to 44 Years | 4,609 (35.4%) | $70,497 |
| 45 to 64 Years | 4,903 (37.7%) | $81,979 |
| 65+ Years | 2,787 (21.4%) | $48,536 |
| Total | 13,021 (100.0%) | $68,481 |
Poverty in Finney County
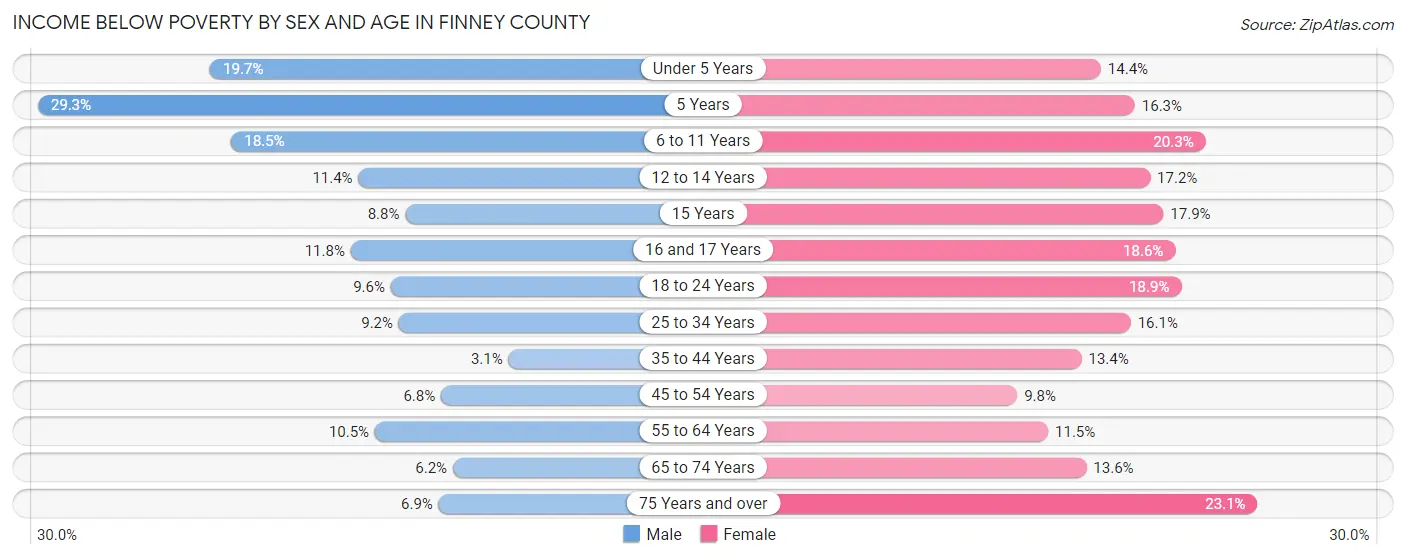
Income Below Poverty by Sex and Age in Finney County
With 10.3% poverty level for males and 15.5% for females among the residents of Finney County, 5 year old males and 75 year old and over females are the most vulnerable to poverty, with 91 males (29.3%) and 221 females (23.1%) in their respective age groups living below the poverty level.
| Age Bracket | Male | Female |
| Under 5 Years | 286 (19.7%) | 207 (14.4%) |
| 5 Years | 91 (29.3%) | 47 (16.3%) |
| 6 to 11 Years | 350 (18.5%) | 401 (20.3%) |
| 12 to 14 Years | 132 (11.4%) | 131 (17.2%) |
| 15 Years | 19 (8.8%) | 65 (17.9%) |
| 16 and 17 Years | 90 (11.8%) | 103 (18.6%) |
| 18 to 24 Years | 190 (9.6%) | 352 (18.9%) |
| 25 to 34 Years | 244 (9.2%) | 374 (16.1%) |
| 35 to 44 Years | 73 (3.0%) | 303 (13.4%) |
| 45 to 54 Years | 158 (6.8%) | 199 (9.8%) |
| 55 to 64 Years | 216 (10.5%) | 235 (11.5%) |
| 65 to 74 Years | 79 (6.1%) | 177 (13.6%) |
| 75 Years and over | 48 (6.9%) | 221 (23.1%) |
| Total | 1,976 (10.3%) | 2,815 (15.5%) |
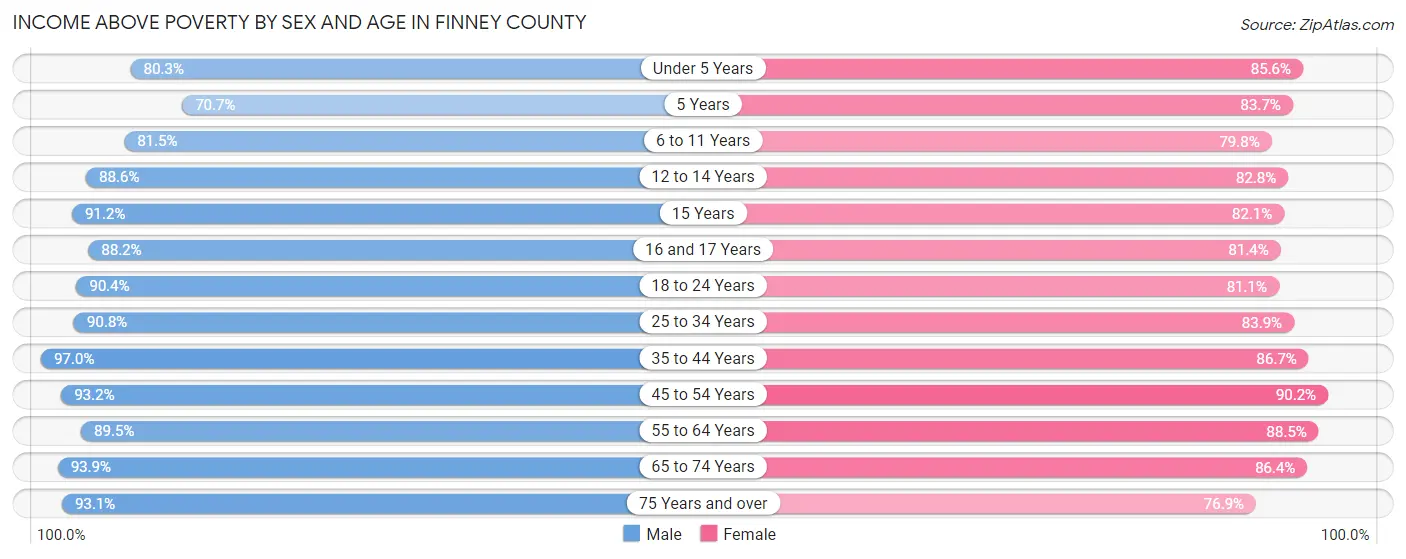
Income Above Poverty by Sex and Age in Finney County
According to the poverty statistics in Finney County, males aged 35 to 44 years and females aged 45 to 54 years are the age groups that are most secure financially, with 97.0% of males and 90.2% of females in these age groups living above the poverty line.
| Age Bracket | Male | Female |
| Under 5 Years | 1,168 (80.3%) | 1,228 (85.6%) |
| 5 Years | 220 (70.7%) | 241 (83.7%) |
| 6 to 11 Years | 1,543 (81.5%) | 1,579 (79.7%) |
| 12 to 14 Years | 1,025 (88.6%) | 632 (82.8%) |
| 15 Years | 197 (91.2%) | 298 (82.1%) |
| 16 and 17 Years | 670 (88.2%) | 452 (81.4%) |
| 18 to 24 Years | 1,787 (90.4%) | 1,510 (81.1%) |
| 25 to 34 Years | 2,419 (90.8%) | 1,950 (83.9%) |
| 35 to 44 Years | 2,320 (97.0%) | 1,967 (86.7%) |
| 45 to 54 Years | 2,163 (93.2%) | 1,838 (90.2%) |
| 55 to 64 Years | 1,843 (89.5%) | 1,810 (88.5%) |
| 65 to 74 Years | 1,205 (93.9%) | 1,123 (86.4%) |
| 75 Years and over | 644 (93.1%) | 734 (76.9%) |
| Total | 17,204 (89.7%) | 15,362 (84.5%) |
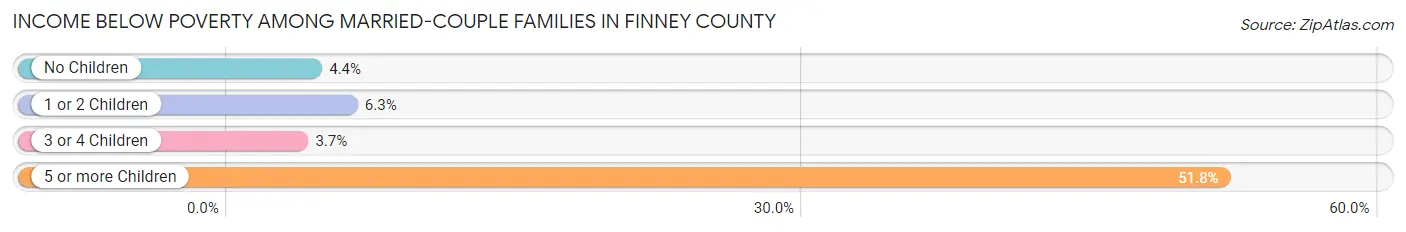
Income Below Poverty Among Married-Couple Families in Finney County
The poverty statistics for married-couple families in Finney County show that 6.1% or 392 of the total 6,458 families live below the poverty line. Families with 5 or more children have the highest poverty rate of 51.8%, comprising of 85 families. On the other hand, families with 3 or 4 children have the lowest poverty rate of 3.7%, which includes 31 families.
| Children | Above Poverty | Below Poverty |
| No Children | 3,348 (95.6%) | 154 (4.4%) |
| 1 or 2 Children | 1,827 (93.7%) | 122 (6.3%) |
| 3 or 4 Children | 812 (96.3%) | 31 (3.7%) |
| 5 or more Children | 79 (48.2%) | 85 (51.8%) |
| Total | 6,066 (93.9%) | 392 (6.1%) |
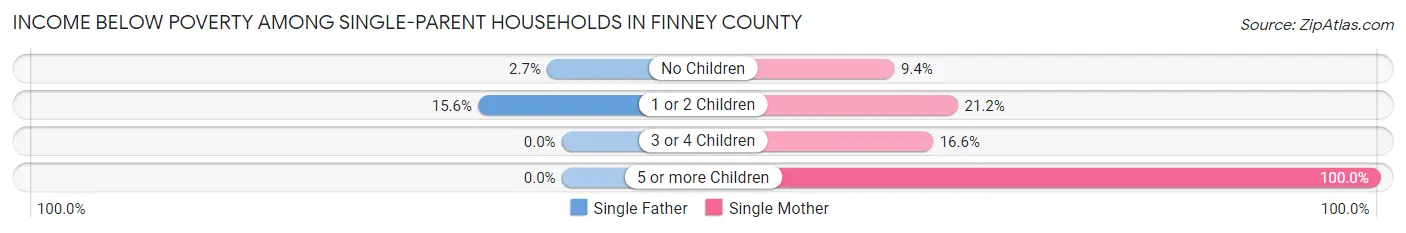
Income Below Poverty Among Single-Parent Households in Finney County
According to the poverty data in Finney County, 7.2% or 74 single-father households and 23.0% or 374 single-mother households are living below the poverty line. Among single-father households, those with 1 or 2 children have the highest poverty rate, with 60 households (15.6%) experiencing poverty. Likewise, among single-mother households, those with 5 or more children have the highest poverty rate, with 141 households (100.0%) falling below the poverty line.
| Children | Single Father | Single Mother |
| No Children | 14 (2.7%) | 49 (9.4%) |
| 1 or 2 Children | 60 (15.6%) | 112 (21.2%) |
| 3 or 4 Children | 0 (0.0%) | 72 (16.6%) |
| 5 or more Children | 0 (0.0%) | 141 (100.0%) |
| Total | 74 (7.2%) | 374 (23.0%) |
Income Below Poverty Among Married-Couple vs Single-Parent Households in Finney County
The poverty data for Finney County shows that 392 of the married-couple family households (6.1%) and 448 of the single-parent households (16.9%) are living below the poverty level. Within the married-couple family households, those with 5 or more children have the highest poverty rate, with 85 households (51.8%) falling below the poverty line. Among the single-parent households, those with 5 or more children have the highest poverty rate, with 141 household (91.0%) living below poverty.
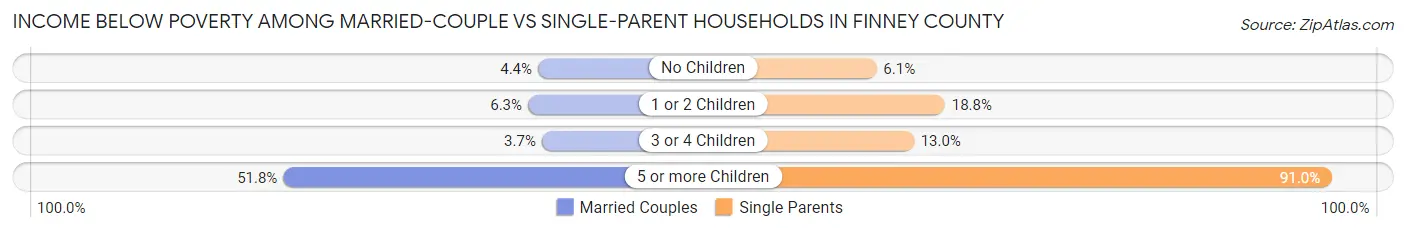
| Children | Married-Couple Families | Single-Parent Households |
| No Children | 154 (4.4%) | 63 (6.1%) |
| 1 or 2 Children | 122 (6.3%) | 172 (18.8%) |
| 3 or 4 Children | 31 (3.7%) | 72 (13.0%) |
| 5 or more Children | 85 (51.8%) | 141 (91.0%) |
| Total | 392 (6.1%) | 448 (16.9%) |
Employment Characteristics in Finney County
Employment by Class of Employer in Finney County
Among the 18,361 employed individuals in Finney County, private company employees (12,899 | 70.3%), local government employees (1,774 | 9.7%), and not-for-profit organizations (1,222 | 6.7%) make up the most common classes of employment.
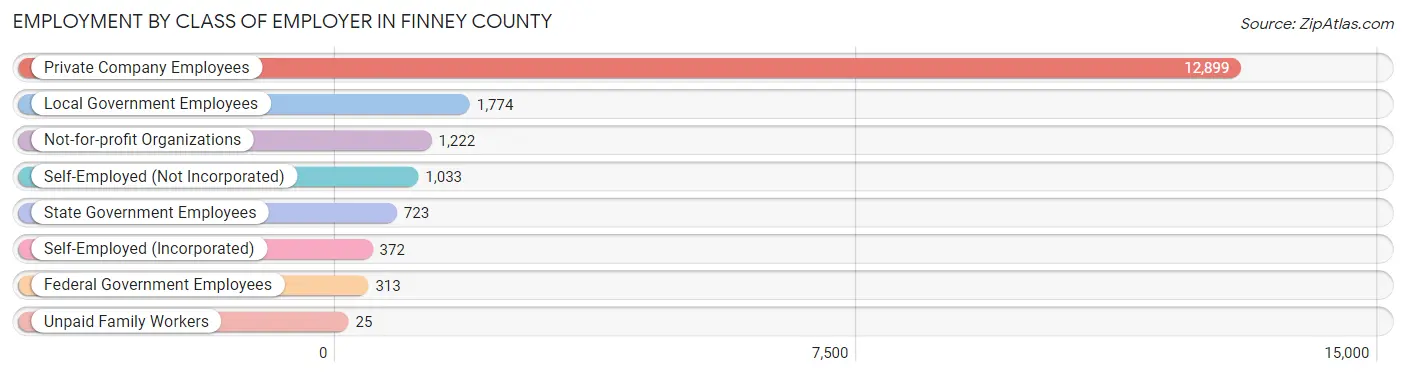
| Employer Class | # Employees | % Employees |
| Private Company Employees | 12,899 | 70.3% |
| Self-Employed (Incorporated) | 372 | 2.0% |
| Self-Employed (Not Incorporated) | 1,033 | 5.6% |
| Not-for-profit Organizations | 1,222 | 6.7% |
| Local Government Employees | 1,774 | 9.7% |
| State Government Employees | 723 | 3.9% |
| Federal Government Employees | 313 | 1.7% |
| Unpaid Family Workers | 25 | 0.1% |
| Total | 18,361 | 100.0% |
Employment Status by Age in Finney County
According to the labor force statistics for Finney County, out of the total population over 16 years of age (28,102), 70.4% or 19,784 individuals are in the labor force, with 5.4% or 1,068 of them unemployed. The age group with the highest labor force participation rate is 45 to 54 years, with 86.7% or 3,787 individuals in the labor force. Within the labor force, the 16 to 19 years age range has the highest percentage of unemployed individuals, with 10.7% or 153 of them being unemployed.
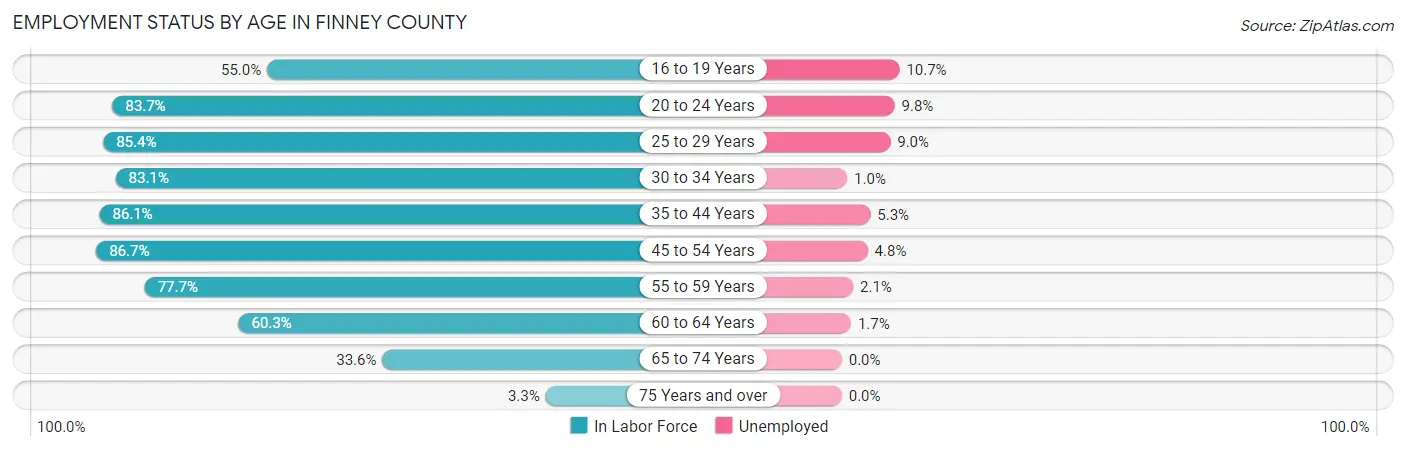
| Age Bracket | In Labor Force | Unemployed |
| 16 to 19 Years | 1,434 (55.0%) | 153 (10.7%) |
| 20 to 24 Years | 2,447 (83.7%) | 240 (9.8%) |
| 25 to 29 Years | 2,142 (85.4%) | 193 (9.0%) |
| 30 to 34 Years | 2,111 (83.1%) | 21 (1.0%) |
| 35 to 44 Years | 4,063 (86.1%) | 215 (5.3%) |
| 45 to 54 Years | 3,787 (86.7%) | 182 (4.8%) |
| 55 to 59 Years | 1,742 (77.7%) | 37 (2.1%) |
| 60 to 64 Years | 1,127 (60.3%) | 19 (1.7%) |
| 65 to 74 Years | 874 (33.6%) | 0 (0.0%) |
| 75 Years and over | 57 (3.3%) | 0 (0.0%) |
| Total | 19,784 (70.4%) | 1,068 (5.4%) |
Employment Status by Educational Attainment in Finney County
According to labor force statistics for Finney County, 82.1% of individuals (14,980) out of the total population between 25 and 64 years of age (18,246) are in the labor force, with 4.5% or 674 of them being unemployed. The group with the highest labor force participation rate are those with the educational attainment of bachelor's degree or higher, with 91.0% or 2,997 individuals in the labor force. Within the labor force, individuals with less than high school education have the highest percentage of unemployment, with 7.7% or 320 of them being unemployed.
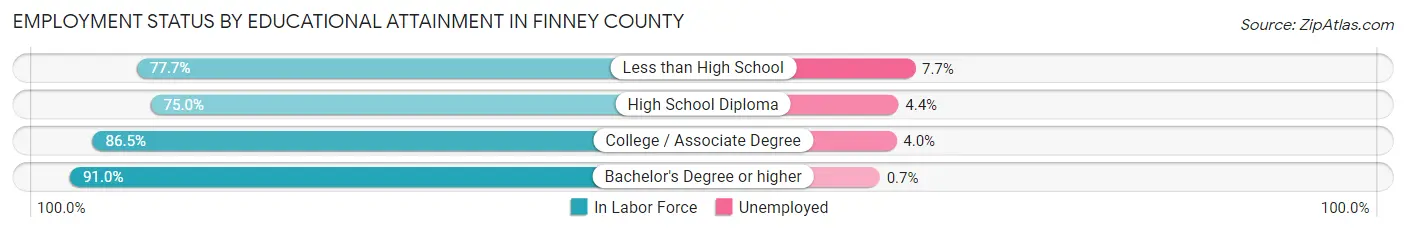
| Educational Attainment | In Labor Force | Unemployed |
| Less than High School | 4,157 (77.7%) | 412 (7.7%) |
| High School Diploma | 3,165 (75.0%) | 186 (4.4%) |
| College / Associate Degree | 4,656 (86.5%) | 215 (4.0%) |
| Bachelor's Degree or higher | 2,997 (91.0%) | 23 (0.7%) |
| Total | 14,980 (82.1%) | 821 (4.5%) |
Employment Occupations by Sex in Finney County
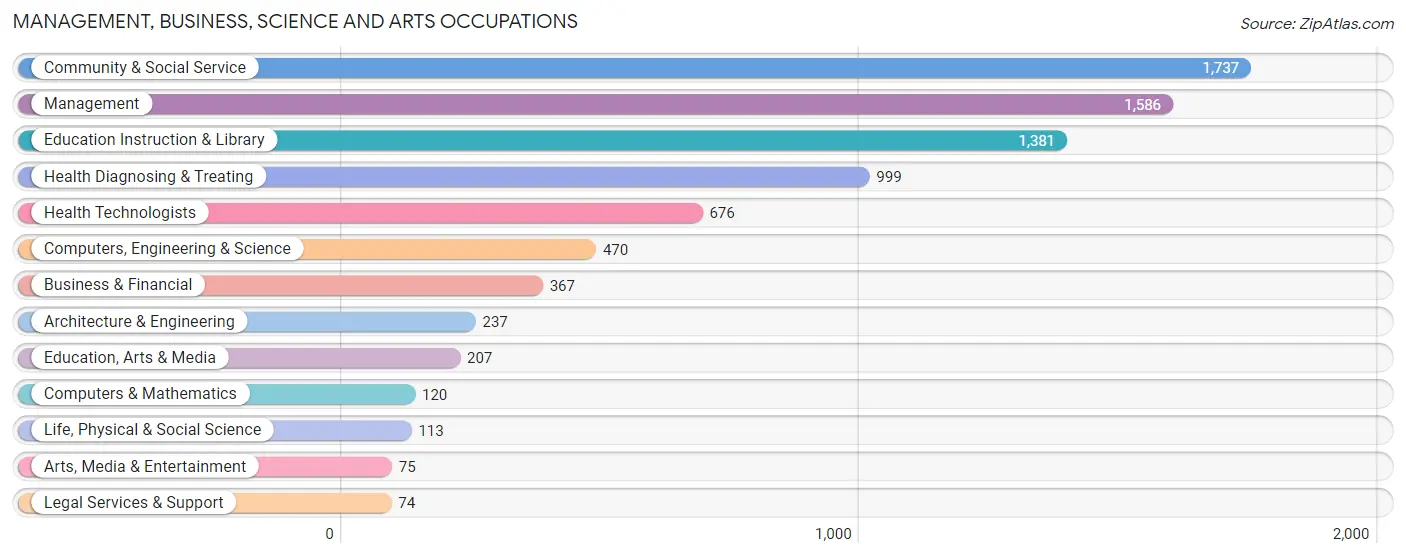
Management, Business, Science and Arts Occupations
The most common Management, Business, Science and Arts occupations in Finney County are Community & Social Service (1,737 | 9.3%), Management (1,586 | 8.5%), Education Instruction & Library (1,381 | 7.4%), Health Diagnosing & Treating (999 | 5.3%), and Health Technologists (676 | 3.6%).
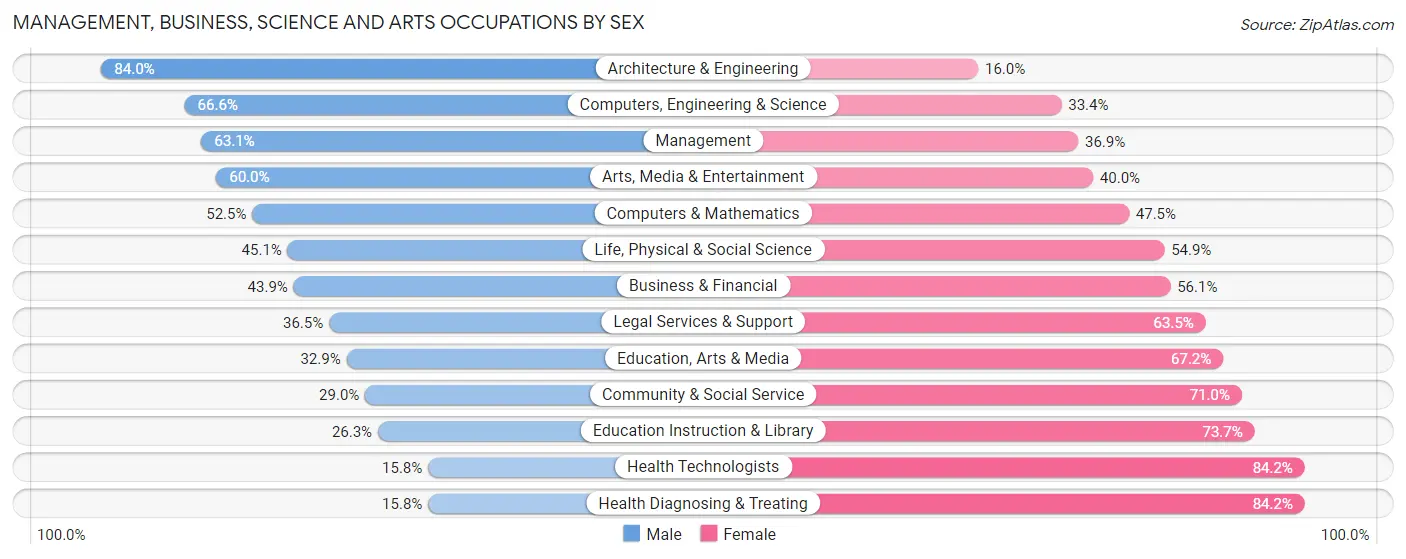
Management, Business, Science and Arts Occupations by Sex
Within the Management, Business, Science and Arts occupations in Finney County, the most male-oriented occupations are Architecture & Engineering (84.0%), Computers, Engineering & Science (66.6%), and Management (63.1%), while the most female-oriented occupations are Health Diagnosing & Treating (84.2%), Health Technologists (84.2%), and Education Instruction & Library (73.7%).
| Occupation | Male | Female |
| Management | 1,001 (63.1%) | 585 (36.9%) |
| Business & Financial | 161 (43.9%) | 206 (56.1%) |
| Computers, Engineering & Science | 313 (66.6%) | 157 (33.4%) |
| Computers & Mathematics | 63 (52.5%) | 57 (47.5%) |
| Architecture & Engineering | 199 (84.0%) | 38 (16.0%) |
| Life, Physical & Social Science | 51 (45.1%) | 62 (54.9%) |
| Community & Social Service | 503 (29.0%) | 1,234 (71.0%) |
| Education, Arts & Media | 68 (32.9%) | 139 (67.1%) |
| Legal Services & Support | 27 (36.5%) | 47 (63.5%) |
| Education Instruction & Library | 363 (26.3%) | 1,018 (73.7%) |
| Arts, Media & Entertainment | 45 (60.0%) | 30 (40.0%) |
| Health Diagnosing & Treating | 158 (15.8%) | 841 (84.2%) |
| Health Technologists | 107 (15.8%) | 569 (84.2%) |
| Total (Category) | 2,136 (41.4%) | 3,023 (58.6%) |
| Total (Overall) | 10,465 (56.0%) | 8,227 (44.0%) |
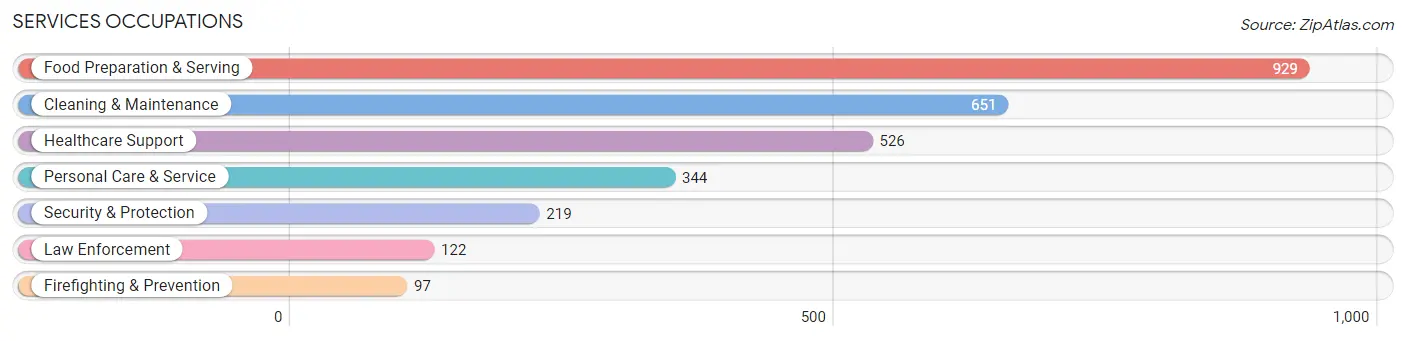
Services Occupations
The most common Services occupations in Finney County are Food Preparation & Serving (929 | 5.0%), Cleaning & Maintenance (651 | 3.5%), Healthcare Support (526 | 2.8%), Personal Care & Service (344 | 1.8%), and Security & Protection (219 | 1.2%).
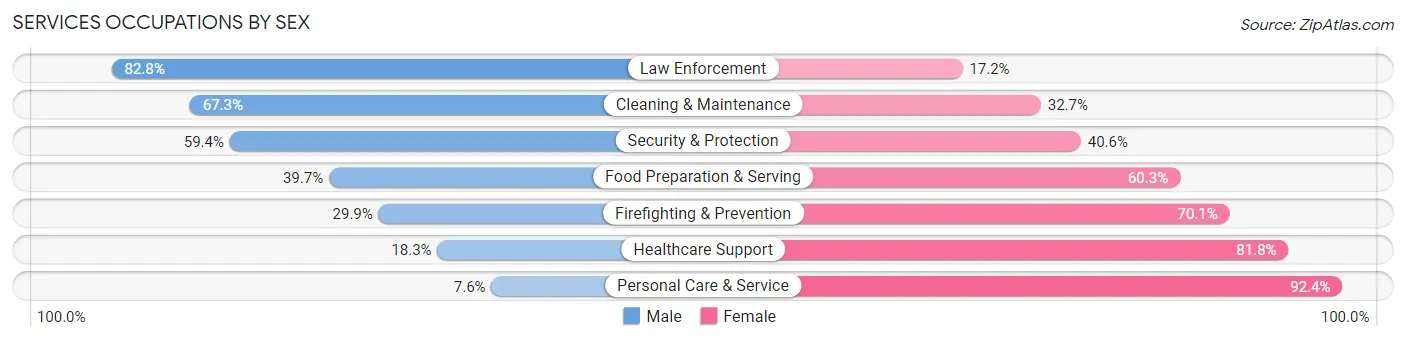
Services Occupations by Sex
Within the Services occupations in Finney County, the most male-oriented occupations are Law Enforcement (82.8%), Cleaning & Maintenance (67.3%), and Security & Protection (59.4%), while the most female-oriented occupations are Personal Care & Service (92.4%), Healthcare Support (81.8%), and Firefighting & Prevention (70.1%).
| Occupation | Male | Female |
| Healthcare Support | 96 (18.2%) | 430 (81.8%) |
| Security & Protection | 130 (59.4%) | 89 (40.6%) |
| Firefighting & Prevention | 29 (29.9%) | 68 (70.1%) |
| Law Enforcement | 101 (82.8%) | 21 (17.2%) |
| Food Preparation & Serving | 369 (39.7%) | 560 (60.3%) |
| Cleaning & Maintenance | 438 (67.3%) | 213 (32.7%) |
| Personal Care & Service | 26 (7.6%) | 318 (92.4%) |
| Total (Category) | 1,059 (39.7%) | 1,610 (60.3%) |
| Total (Overall) | 10,465 (56.0%) | 8,227 (44.0%) |
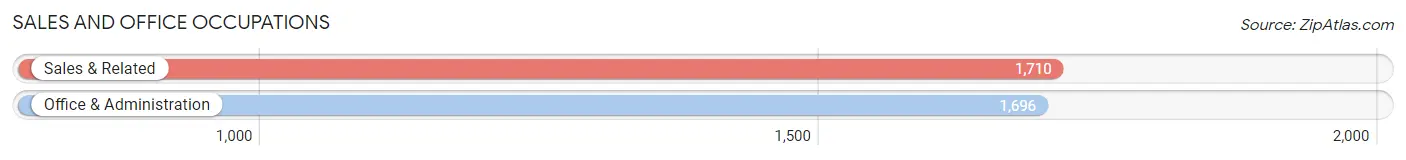
Sales and Office Occupations
The most common Sales and Office occupations in Finney County are Sales & Related (1,710 | 9.1%), and Office & Administration (1,696 | 9.1%).
Sales and Office Occupations by Sex
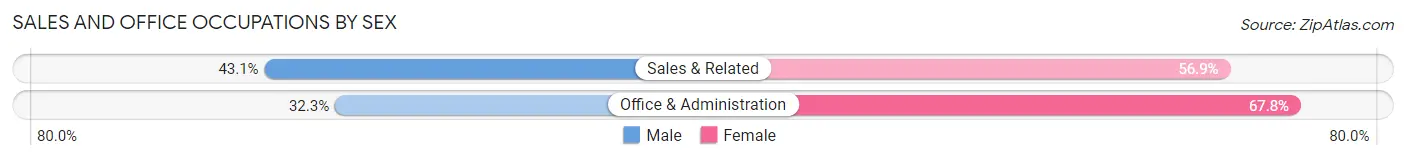
| Occupation | Male | Female |
| Sales & Related | 737 (43.1%) | 973 (56.9%) |
| Office & Administration | 547 (32.3%) | 1,149 (67.7%) |
| Total (Category) | 1,284 (37.7%) | 2,122 (62.3%) |
| Total (Overall) | 10,465 (56.0%) | 8,227 (44.0%) |
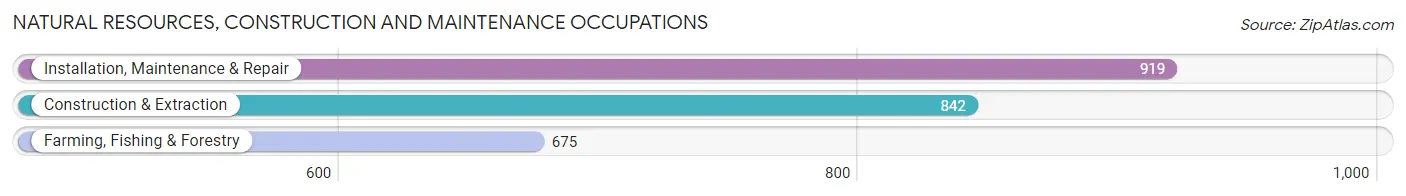
Natural Resources, Construction and Maintenance Occupations
The most common Natural Resources, Construction and Maintenance occupations in Finney County are Installation, Maintenance & Repair (919 | 4.9%), Construction & Extraction (842 | 4.5%), and Farming, Fishing & Forestry (675 | 3.6%).
Natural Resources, Construction and Maintenance Occupations by Sex
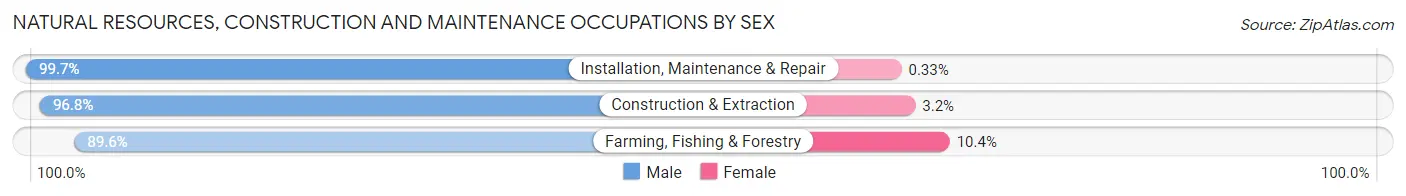
| Occupation | Male | Female |
| Farming, Fishing & Forestry | 605 (89.6%) | 70 (10.4%) |
| Construction & Extraction | 815 (96.8%) | 27 (3.2%) |
| Installation, Maintenance & Repair | 916 (99.7%) | 3 (0.3%) |
| Total (Category) | 2,336 (95.9%) | 100 (4.1%) |
| Total (Overall) | 10,465 (56.0%) | 8,227 (44.0%) |
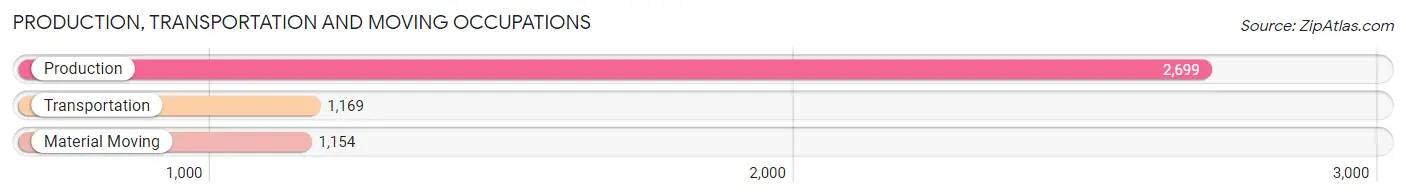
Production, Transportation and Moving Occupations
The most common Production, Transportation and Moving occupations in Finney County are Production (2,699 | 14.4%), Transportation (1,169 | 6.2%), and Material Moving (1,154 | 6.2%).
Production, Transportation and Moving Occupations by Sex
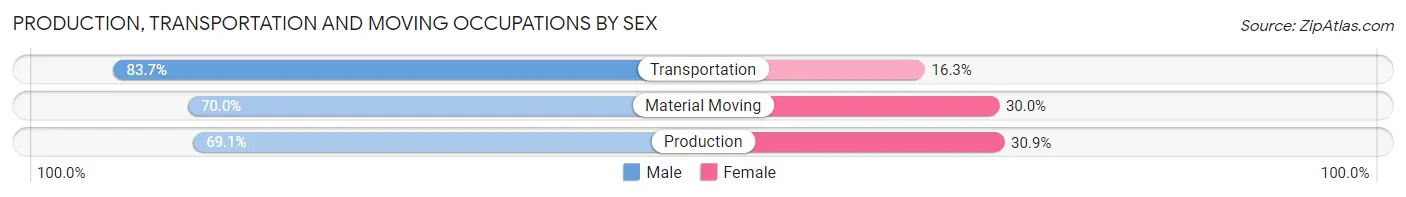
| Occupation | Male | Female |
| Production | 1,864 (69.1%) | 835 (30.9%) |
| Transportation | 978 (83.7%) | 191 (16.3%) |
| Material Moving | 808 (70.0%) | 346 (30.0%) |
| Total (Category) | 3,650 (72.7%) | 1,372 (27.3%) |
| Total (Overall) | 10,465 (56.0%) | 8,227 (44.0%) |
Employment Industries by Sex in Finney County
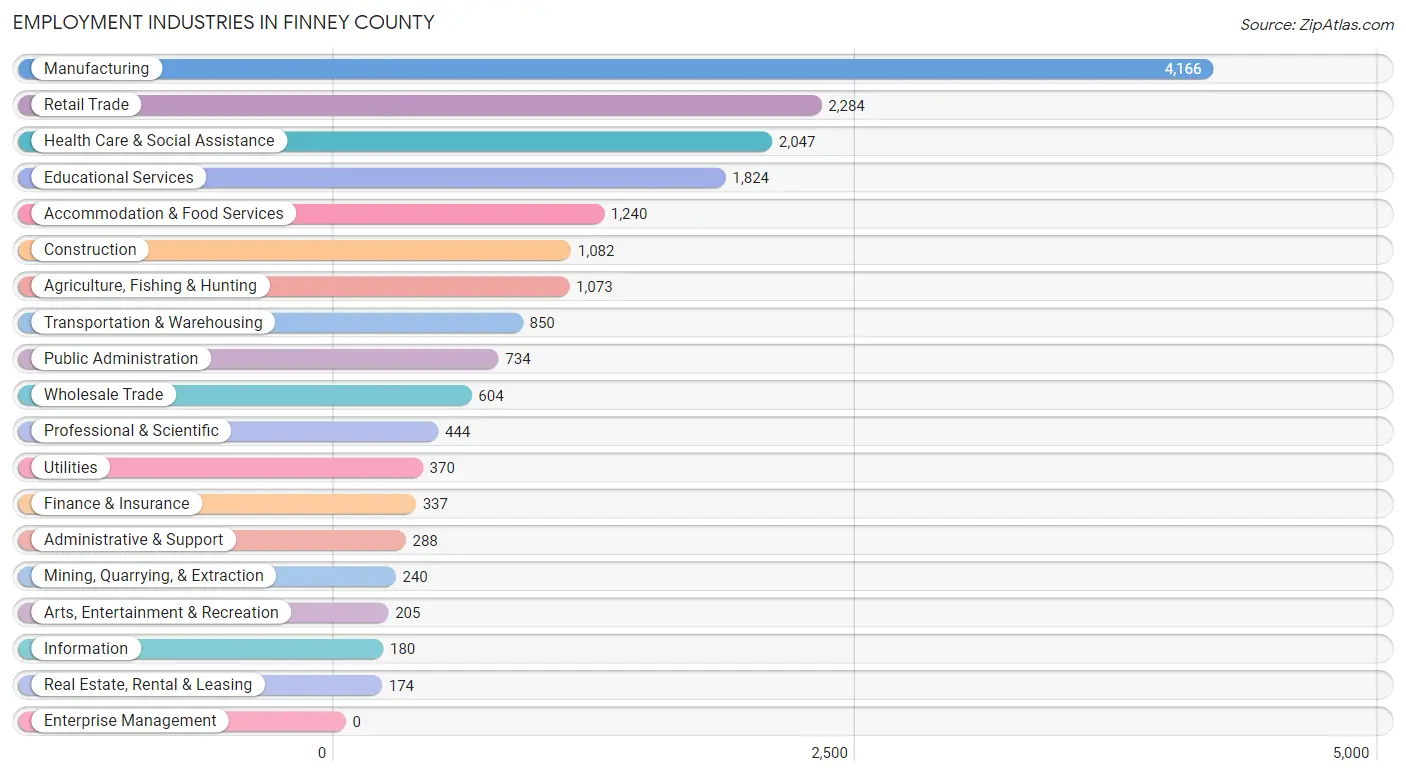
Employment Industries in Finney County
The major employment industries in Finney County include Manufacturing (4,166 | 22.3%), Retail Trade (2,284 | 12.2%), Health Care & Social Assistance (2,047 | 11.0%), Educational Services (1,824 | 9.8%), and Accommodation & Food Services (1,240 | 6.6%).
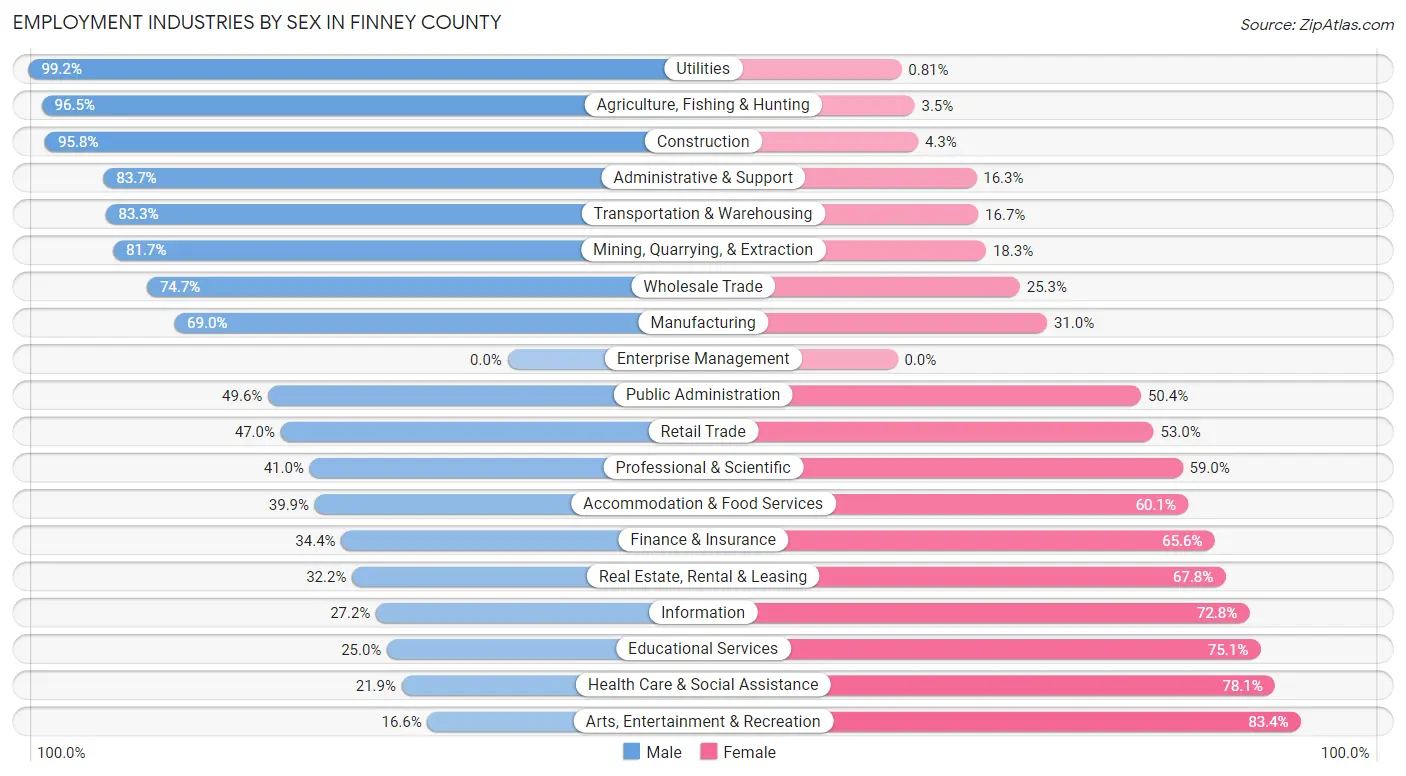
Employment Industries by Sex in Finney County
The Finney County industries that see more men than women are Utilities (99.2%), Agriculture, Fishing & Hunting (96.5%), and Construction (95.8%), whereas the industries that tend to have a higher number of women are Arts, Entertainment & Recreation (83.4%), Health Care & Social Assistance (78.1%), and Educational Services (75.0%).
| Industry | Male | Female |
| Agriculture, Fishing & Hunting | 1,035 (96.5%) | 38 (3.5%) |
| Mining, Quarrying, & Extraction | 196 (81.7%) | 44 (18.3%) |
| Construction | 1,036 (95.8%) | 46 (4.3%) |
| Manufacturing | 2,876 (69.0%) | 1,290 (31.0%) |
| Wholesale Trade | 451 (74.7%) | 153 (25.3%) |
| Retail Trade | 1,073 (47.0%) | 1,211 (53.0%) |
| Transportation & Warehousing | 708 (83.3%) | 142 (16.7%) |
| Utilities | 367 (99.2%) | 3 (0.8%) |
| Information | 49 (27.2%) | 131 (72.8%) |
| Finance & Insurance | 116 (34.4%) | 221 (65.6%) |
| Real Estate, Rental & Leasing | 56 (32.2%) | 118 (67.8%) |
| Professional & Scientific | 182 (41.0%) | 262 (59.0%) |
| Enterprise Management | 0 (0.0%) | 0 (0.0%) |
| Administrative & Support | 241 (83.7%) | 47 (16.3%) |
| Educational Services | 455 (24.9%) | 1,369 (75.0%) |
| Health Care & Social Assistance | 449 (21.9%) | 1,598 (78.1%) |
| Arts, Entertainment & Recreation | 34 (16.6%) | 171 (83.4%) |
| Accommodation & Food Services | 495 (39.9%) | 745 (60.1%) |
| Public Administration | 364 (49.6%) | 370 (50.4%) |
| Total | 10,465 (56.0%) | 8,227 (44.0%) |
Education in Finney County
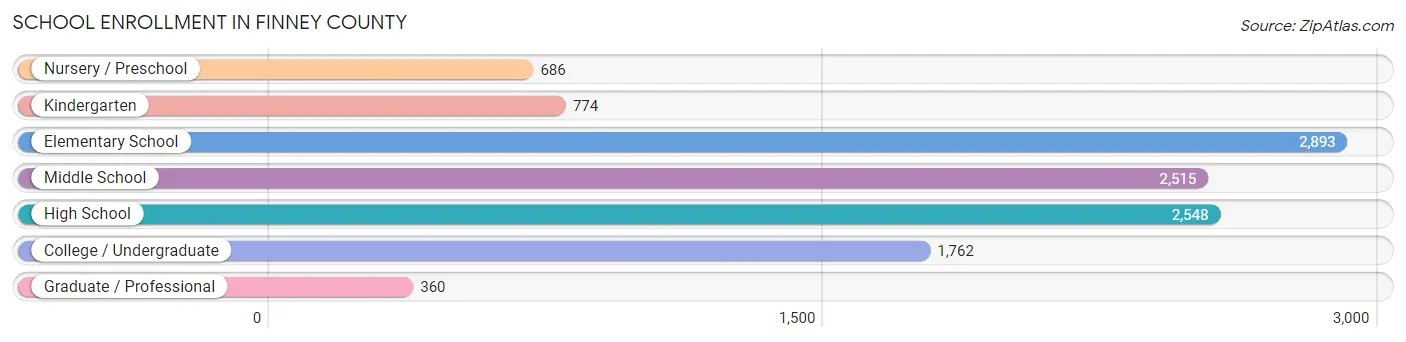
School Enrollment in Finney County
The most common levels of schooling among the 11,538 students in Finney County are elementary school (2,893 | 25.1%), high school (2,548 | 22.1%), and middle school (2,515 | 21.8%).
| School Level | # Students | % Students |
| Nursery / Preschool | 686 | 5.9% |
| Kindergarten | 774 | 6.7% |
| Elementary School | 2,893 | 25.1% |
| Middle School | 2,515 | 21.8% |
| High School | 2,548 | 22.1% |
| College / Undergraduate | 1,762 | 15.3% |
| Graduate / Professional | 360 | 3.1% |
| Total | 11,538 | 100.0% |
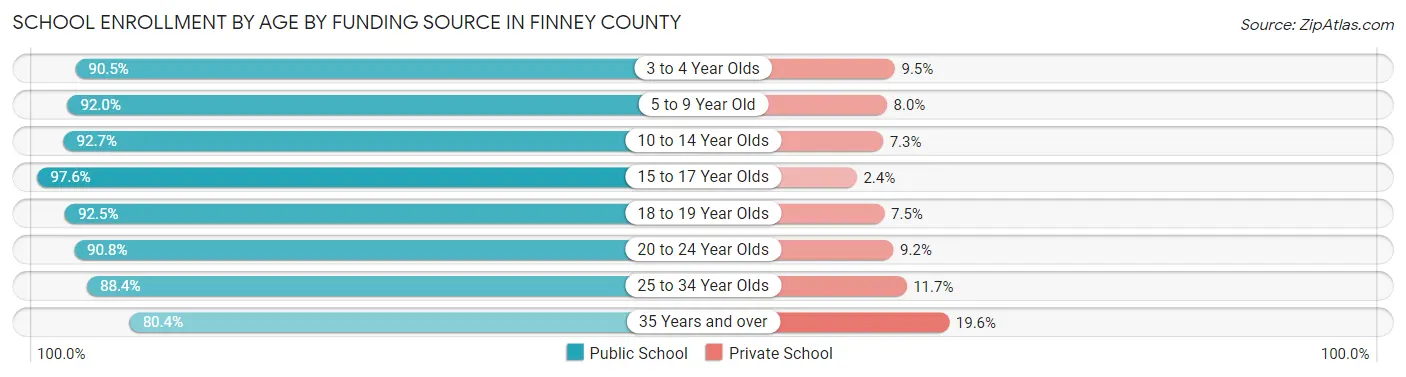
School Enrollment by Age by Funding Source in Finney County
Out of a total of 11,538 students who are enrolled in schools in Finney County, 912 (7.9%) attend a private institution, while the remaining 10,626 (92.1%) are enrolled in public schools. The age group of 35 years and over has the highest likelihood of being enrolled in private schools, with 142 (19.6% in the age bracket) enrolled. Conversely, the age group of 15 to 17 year olds has the lowest likelihood of being enrolled in a private school, with 1,796 (97.6% in the age bracket) attending a public institution.
| Age Bracket | Public School | Private School |
| 3 to 4 Year Olds | 497 (90.5%) | 52 (9.5%) |
| 5 to 9 Year Old | 3,168 (92.0%) | 275 (8.0%) |
| 10 to 14 Year Olds | 2,806 (92.7%) | 220 (7.3%) |
| 15 to 17 Year Olds | 1,796 (97.6%) | 44 (2.4%) |
| 18 to 19 Year Olds | 810 (92.5%) | 66 (7.5%) |
| 20 to 24 Year Olds | 512 (90.8%) | 52 (9.2%) |
| 25 to 34 Year Olds | 455 (88.3%) | 60 (11.7%) |
| 35 Years and over | 583 (80.4%) | 142 (19.6%) |
| Total | 10,626 (92.1%) | 912 (7.9%) |
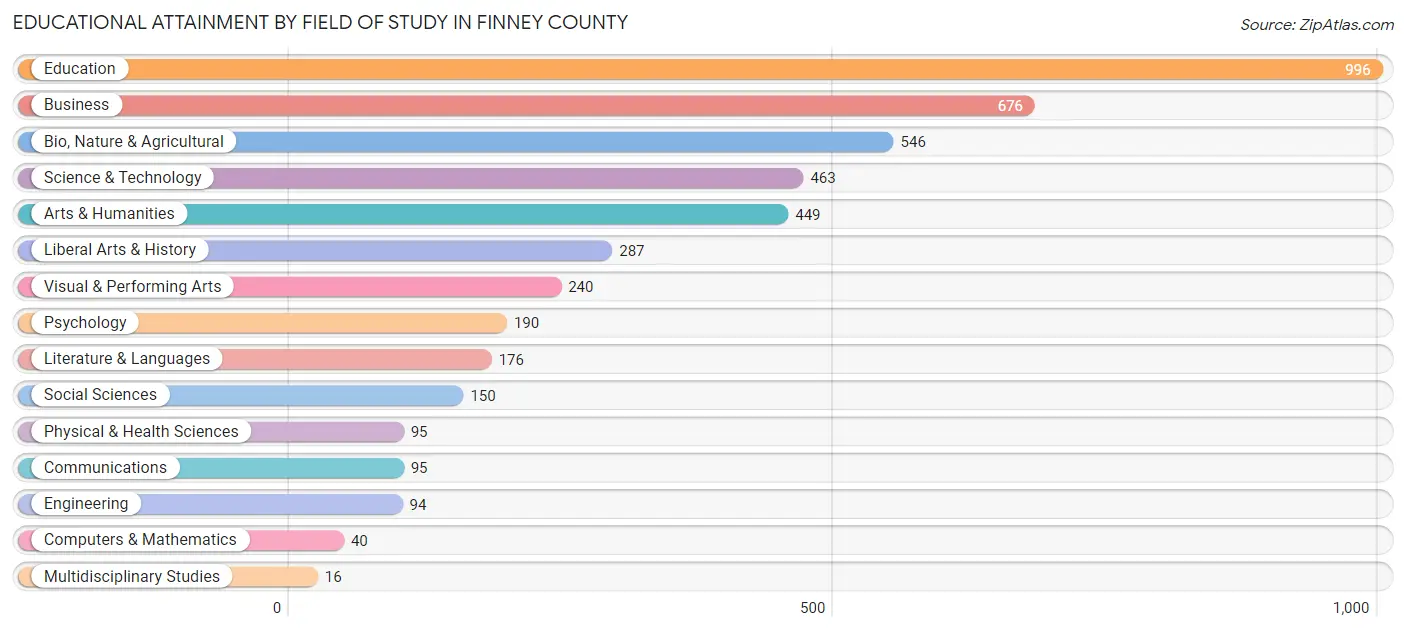
Educational Attainment by Field of Study in Finney County
Education (996 | 22.1%), business (676 | 15.0%), bio, nature & agricultural (546 | 12.1%), science & technology (463 | 10.3%), and arts & humanities (449 | 10.0%) are the most common fields of study among 4,513 individuals in Finney County who have obtained a bachelor's degree or higher.
| Field of Study | # Graduates | % Graduates |
| Computers & Mathematics | 40 | 0.9% |
| Bio, Nature & Agricultural | 546 | 12.1% |
| Physical & Health Sciences | 95 | 2.1% |
| Psychology | 190 | 4.2% |
| Social Sciences | 150 | 3.3% |
| Engineering | 94 | 2.1% |
| Multidisciplinary Studies | 16 | 0.4% |
| Science & Technology | 463 | 10.3% |
| Business | 676 | 15.0% |
| Education | 996 | 22.1% |
| Literature & Languages | 176 | 3.9% |
| Liberal Arts & History | 287 | 6.4% |
| Visual & Performing Arts | 240 | 5.3% |
| Communications | 95 | 2.1% |
| Arts & Humanities | 449 | 10.0% |
| Total | 4,513 | 100.0% |
Transportation & Commute in Finney County
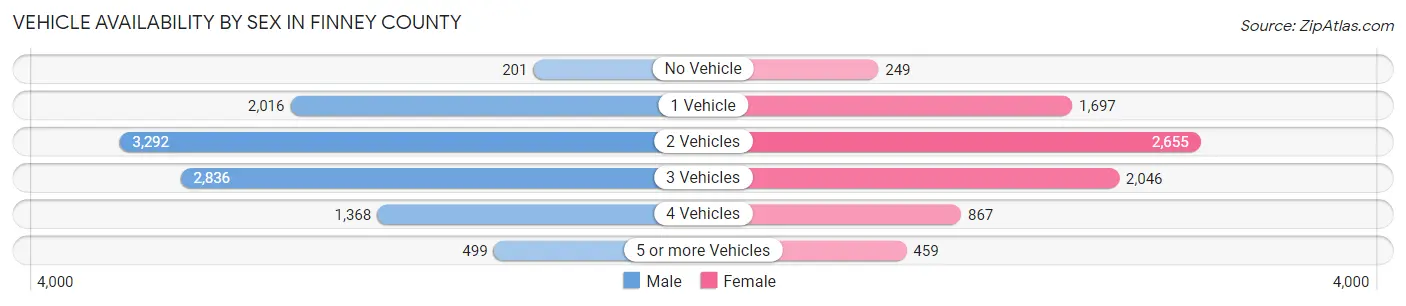
Vehicle Availability by Sex in Finney County
The most prevalent vehicle ownership categories in Finney County are males with 2 vehicles (3,292, accounting for 32.2%) and females with 2 vehicles (2,655, making up 41.3%).
| Vehicles Available | Male | Female |
| No Vehicle | 201 (2.0%) | 249 (3.1%) |
| 1 Vehicle | 2,016 (19.7%) | 1,697 (21.3%) |
| 2 Vehicles | 3,292 (32.2%) | 2,655 (33.3%) |
| 3 Vehicles | 2,836 (27.8%) | 2,046 (25.7%) |
| 4 Vehicles | 1,368 (13.4%) | 867 (10.9%) |
| 5 or more Vehicles | 499 (4.9%) | 459 (5.8%) |
| Total | 10,212 (100.0%) | 7,973 (100.0%) |
Commute Time in Finney County
The most frequently occuring commute durations in Finney County are 10 to 14 minutes (4,659 commuters, 26.2%), 5 to 9 minutes (4,450 commuters, 25.0%), and 15 to 19 minutes (4,099 commuters, 23.1%).
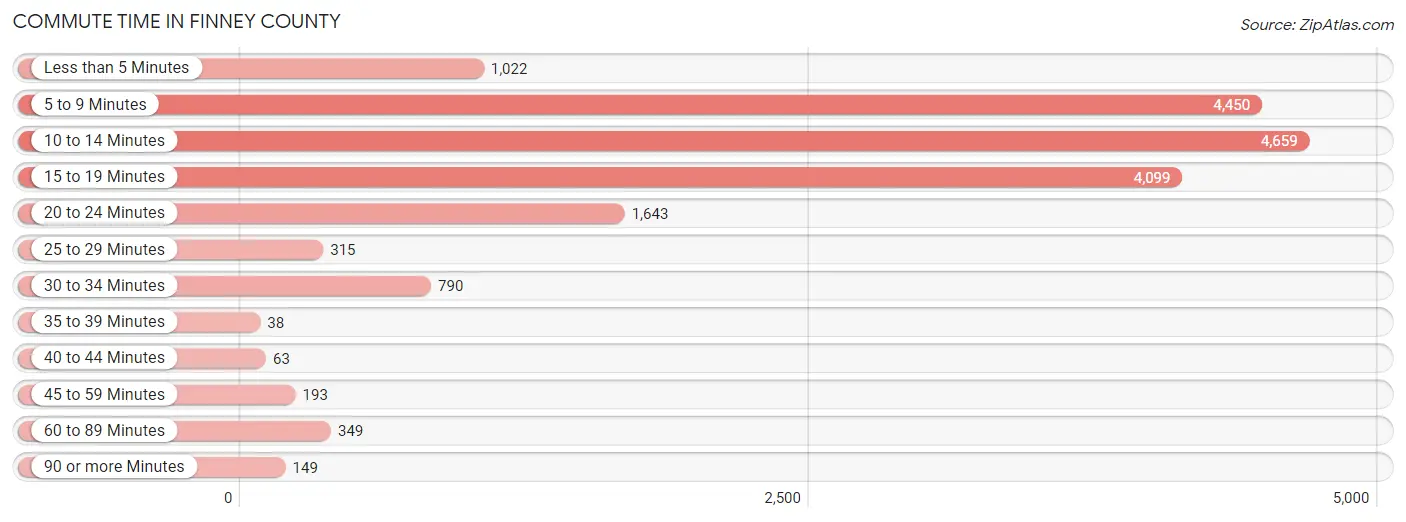
| Commute Time | # Commuters | % Commuters |
| Less than 5 Minutes | 1,022 | 5.8% |
| 5 to 9 Minutes | 4,450 | 25.0% |
| 10 to 14 Minutes | 4,659 | 26.2% |
| 15 to 19 Minutes | 4,099 | 23.1% |
| 20 to 24 Minutes | 1,643 | 9.2% |
| 25 to 29 Minutes | 315 | 1.8% |
| 30 to 34 Minutes | 790 | 4.4% |
| 35 to 39 Minutes | 38 | 0.2% |
| 40 to 44 Minutes | 63 | 0.4% |
| 45 to 59 Minutes | 193 | 1.1% |
| 60 to 89 Minutes | 349 | 2.0% |
| 90 or more Minutes | 149 | 0.8% |
Commute Time by Sex in Finney County
The most common commute times in Finney County are 15 to 19 minutes (2,536 commuters, 25.2%) for males and 10 to 14 minutes (2,296 commuters, 29.9%) for females.
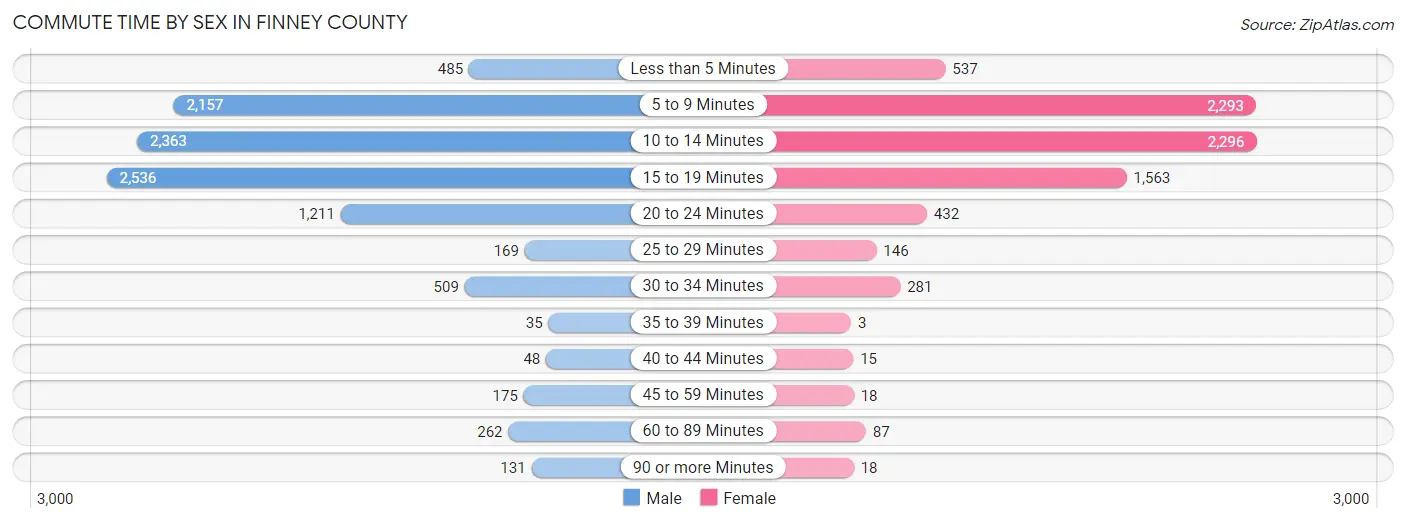
| Commute Time | Male | Female |
| Less than 5 Minutes | 485 (4.8%) | 537 (7.0%) |
| 5 to 9 Minutes | 2,157 (21.4%) | 2,293 (29.8%) |
| 10 to 14 Minutes | 2,363 (23.4%) | 2,296 (29.9%) |
| 15 to 19 Minutes | 2,536 (25.2%) | 1,563 (20.3%) |
| 20 to 24 Minutes | 1,211 (12.0%) | 432 (5.6%) |
| 25 to 29 Minutes | 169 (1.7%) | 146 (1.9%) |
| 30 to 34 Minutes | 509 (5.1%) | 281 (3.6%) |
| 35 to 39 Minutes | 35 (0.4%) | 3 (0.0%) |
| 40 to 44 Minutes | 48 (0.5%) | 15 (0.2%) |
| 45 to 59 Minutes | 175 (1.7%) | 18 (0.2%) |
| 60 to 89 Minutes | 262 (2.6%) | 87 (1.1%) |
| 90 or more Minutes | 131 (1.3%) | 18 (0.2%) |
Time of Departure to Work by Sex in Finney County
The most frequent times of departure to work in Finney County are 7:30 AM to 7:59 AM (1,476, 14.6%) for males and 7:30 AM to 7:59 AM (1,699, 22.1%) for females.
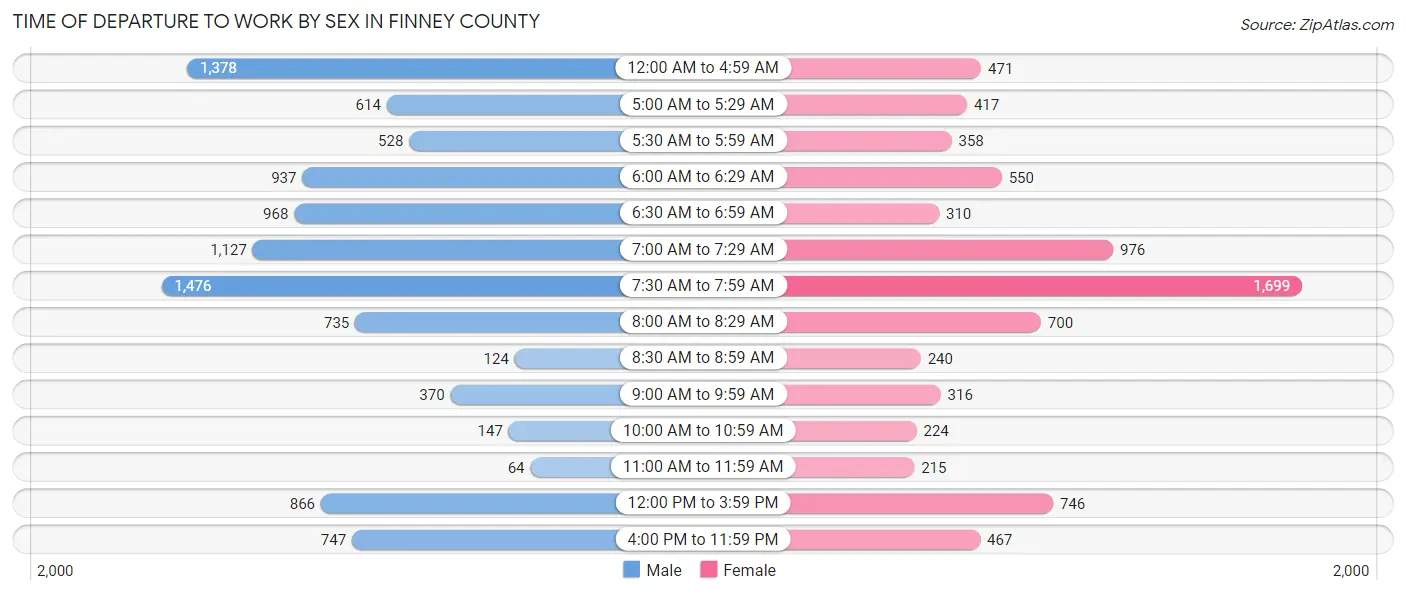
| Time of Departure | Male | Female |
| 12:00 AM to 4:59 AM | 1,378 (13.7%) | 471 (6.1%) |
| 5:00 AM to 5:29 AM | 614 (6.1%) | 417 (5.4%) |
| 5:30 AM to 5:59 AM | 528 (5.2%) | 358 (4.7%) |
| 6:00 AM to 6:29 AM | 937 (9.3%) | 550 (7.1%) |
| 6:30 AM to 6:59 AM | 968 (9.6%) | 310 (4.0%) |
| 7:00 AM to 7:29 AM | 1,127 (11.2%) | 976 (12.7%) |
| 7:30 AM to 7:59 AM | 1,476 (14.6%) | 1,699 (22.1%) |
| 8:00 AM to 8:29 AM | 735 (7.3%) | 700 (9.1%) |
| 8:30 AM to 8:59 AM | 124 (1.2%) | 240 (3.1%) |
| 9:00 AM to 9:59 AM | 370 (3.7%) | 316 (4.1%) |
| 10:00 AM to 10:59 AM | 147 (1.5%) | 224 (2.9%) |
| 11:00 AM to 11:59 AM | 64 (0.6%) | 215 (2.8%) |
| 12:00 PM to 3:59 PM | 866 (8.6%) | 746 (9.7%) |
| 4:00 PM to 11:59 PM | 747 (7.4%) | 467 (6.1%) |
| Total | 10,081 (100.0%) | 7,689 (100.0%) |
Housing Occupancy in Finney County
Occupancy by Ownership in Finney County
Of the total 13,021 dwellings in Finney County, owner-occupied units account for 8,474 (65.1%), while renter-occupied units make up 4,547 (34.9%).
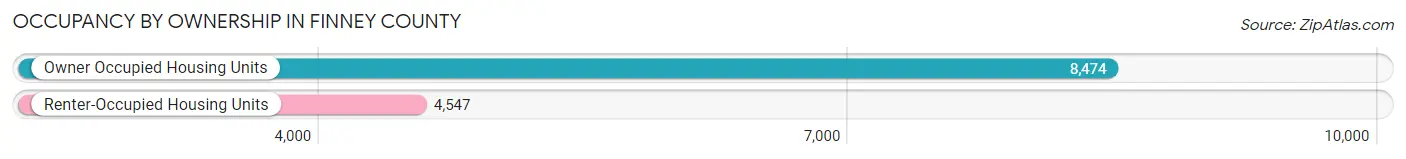
| Occupancy | # Housing Units | % Housing Units |
| Owner Occupied Housing Units | 8,474 | 65.1% |
| Renter-Occupied Housing Units | 4,547 | 34.9% |
| Total Occupied Housing Units | 13,021 | 100.0% |
Occupancy by Household Size in Finney County
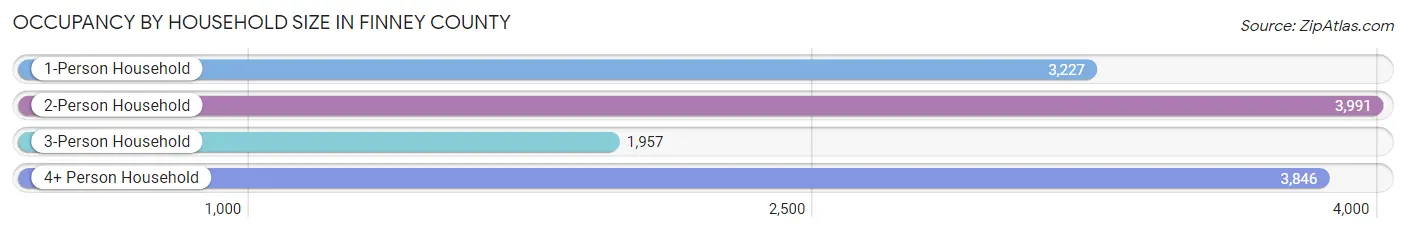
| Household Size | # Housing Units | % Housing Units |
| 1-Person Household | 3,227 | 24.8% |
| 2-Person Household | 3,991 | 30.6% |
| 3-Person Household | 1,957 | 15.0% |
| 4+ Person Household | 3,846 | 29.5% |
| Total Housing Units | 13,021 | 100.0% |
Occupancy by Ownership by Household Size in Finney County
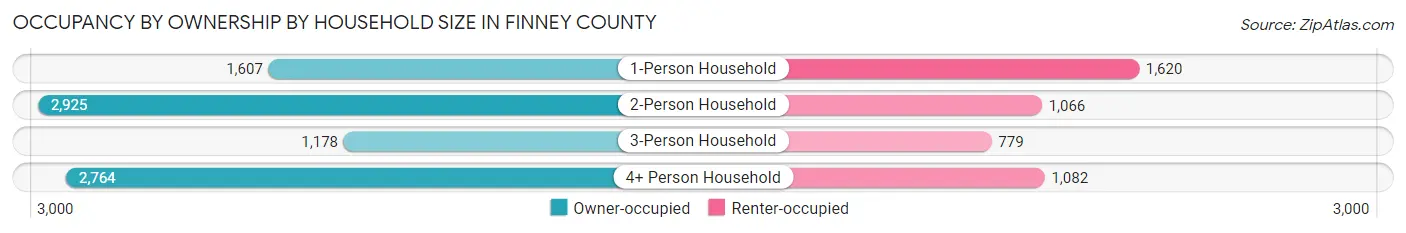
| Household Size | Owner-occupied | Renter-occupied |
| 1-Person Household | 1,607 (49.8%) | 1,620 (50.2%) |
| 2-Person Household | 2,925 (73.3%) | 1,066 (26.7%) |
| 3-Person Household | 1,178 (60.2%) | 779 (39.8%) |
| 4+ Person Household | 2,764 (71.9%) | 1,082 (28.1%) |
| Total Housing Units | 8,474 (65.1%) | 4,547 (34.9%) |
Occupancy by Educational Attainment in Finney County
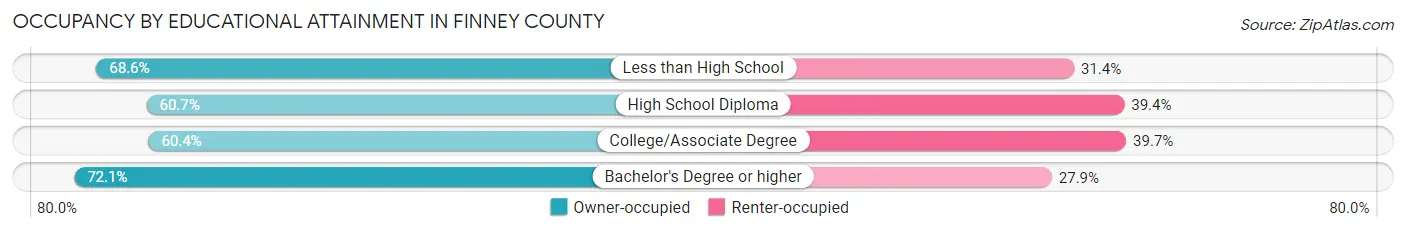
| Household Size | Owner-occupied | Renter-occupied |
| Less than High School | 2,459 (68.6%) | 1,125 (31.4%) |
| High School Diploma | 1,743 (60.7%) | 1,131 (39.4%) |
| College/Associate Degree | 2,365 (60.4%) | 1,554 (39.7%) |
| Bachelor's Degree or higher | 1,907 (72.1%) | 737 (27.9%) |
Occupancy by Age of Householder in Finney County
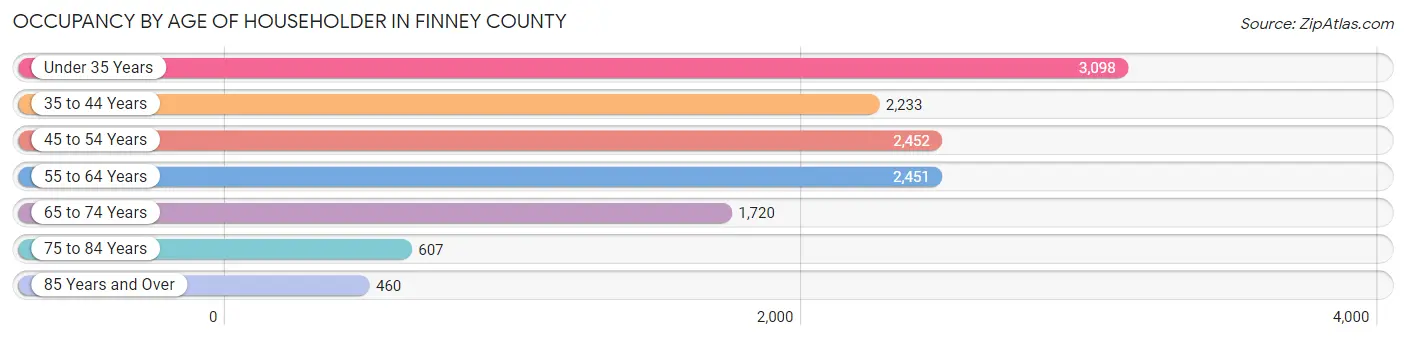
| Age Bracket | # Households | % Households |
| Under 35 Years | 3,098 | 23.8% |
| 35 to 44 Years | 2,233 | 17.2% |
| 45 to 54 Years | 2,452 | 18.8% |
| 55 to 64 Years | 2,451 | 18.8% |
| 65 to 74 Years | 1,720 | 13.2% |
| 75 to 84 Years | 607 | 4.7% |
| 85 Years and Over | 460 | 3.5% |
| Total | 13,021 | 100.0% |
Housing Finances in Finney County
Median Income by Occupancy in Finney County
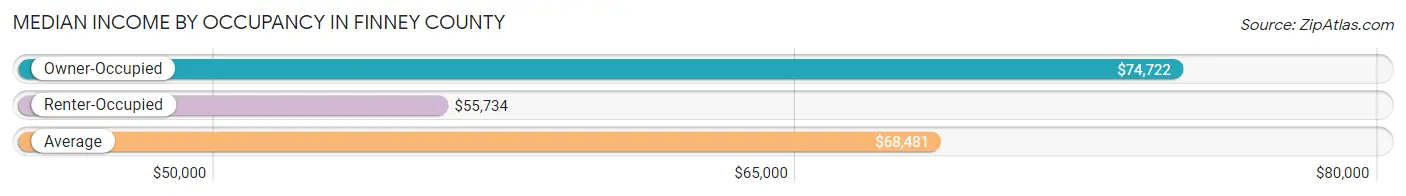
| Occupancy Type | # Households | Median Income |
| Owner-Occupied | 8,474 (65.1%) | $74,722 |
| Renter-Occupied | 4,547 (34.9%) | $55,734 |
| Average | 13,021 (100.0%) | $68,481 |
Occupancy by Householder Income Bracket in Finney County
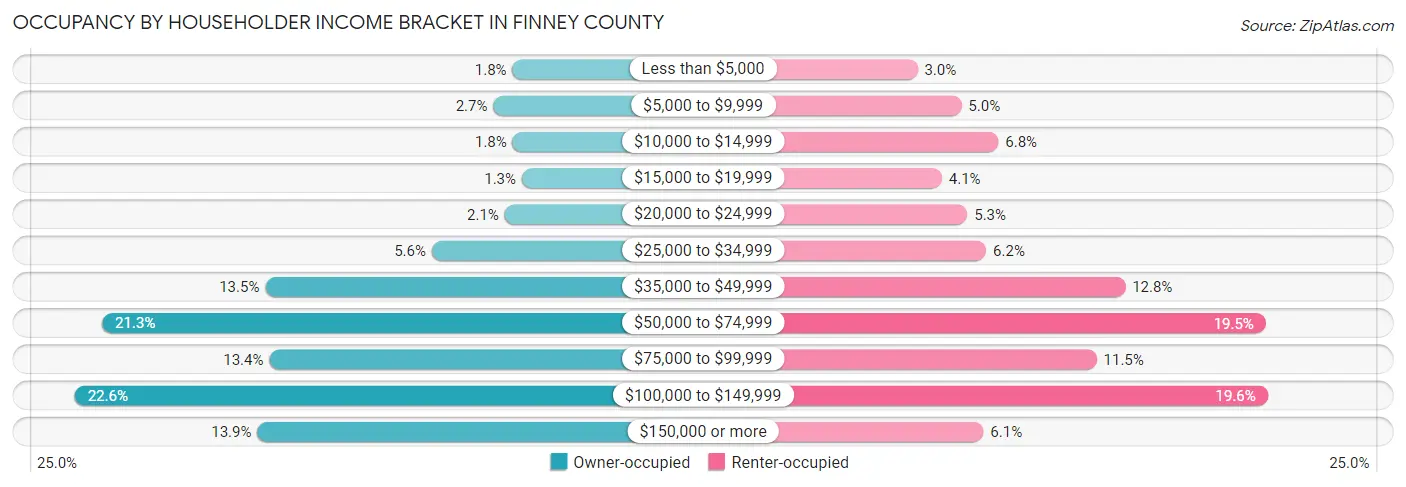
| Income Bracket | Owner-occupied | Renter-occupied |
| Less than $5,000 | 150 (1.8%) | 134 (2.9%) |
| $5,000 to $9,999 | 227 (2.7%) | 229 (5.0%) |
| $10,000 to $14,999 | 149 (1.8%) | 309 (6.8%) |
| $15,000 to $19,999 | 112 (1.3%) | 187 (4.1%) |
| $20,000 to $24,999 | 181 (2.1%) | 242 (5.3%) |
| $25,000 to $34,999 | 475 (5.6%) | 283 (6.2%) |
| $35,000 to $49,999 | 1,147 (13.5%) | 584 (12.8%) |
| $50,000 to $74,999 | 1,806 (21.3%) | 888 (19.5%) |
| $75,000 to $99,999 | 1,131 (13.4%) | 522 (11.5%) |
| $100,000 to $149,999 | 1,916 (22.6%) | 892 (19.6%) |
| $150,000 or more | 1,180 (13.9%) | 277 (6.1%) |
| Total | 8,474 (100.0%) | 4,547 (100.0%) |
Monthly Housing Cost Tiers in Finney County
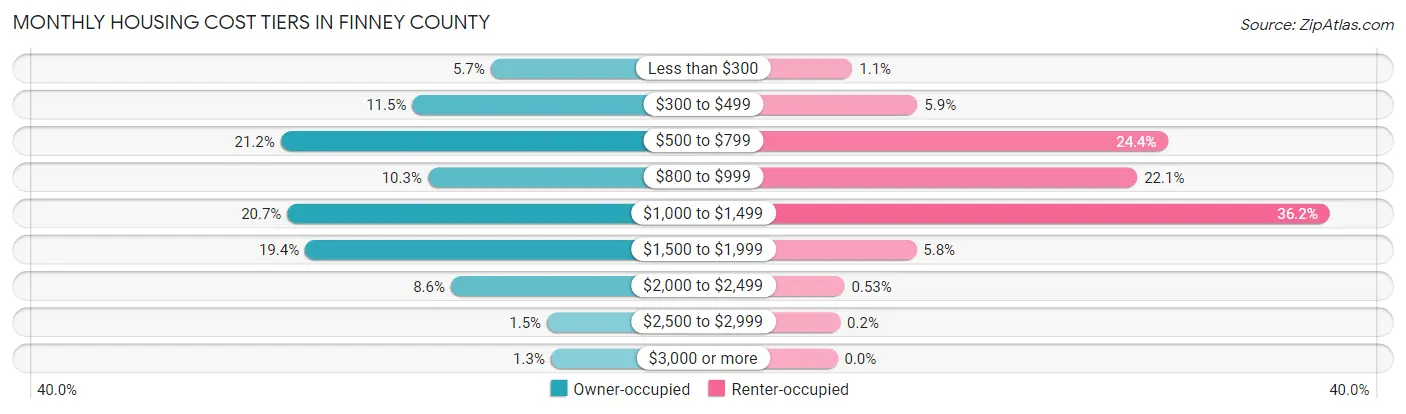
| Monthly Cost | Owner-occupied | Renter-occupied |
| Less than $300 | 481 (5.7%) | 50 (1.1%) |
| $300 to $499 | 970 (11.5%) | 268 (5.9%) |
| $500 to $799 | 1,792 (21.1%) | 1,108 (24.4%) |
| $800 to $999 | 874 (10.3%) | 1,004 (22.1%) |
| $1,000 to $1,499 | 1,751 (20.7%) | 1,648 (36.2%) |
| $1,500 to $1,999 | 1,640 (19.4%) | 264 (5.8%) |
| $2,000 to $2,499 | 730 (8.6%) | 24 (0.5%) |
| $2,500 to $2,999 | 130 (1.5%) | 9 (0.2%) |
| $3,000 or more | 106 (1.3%) | 0 (0.0%) |
| Total | 8,474 (100.0%) | 4,547 (100.0%) |
Physical Housing Characteristics in Finney County
Housing Structures in Finney County
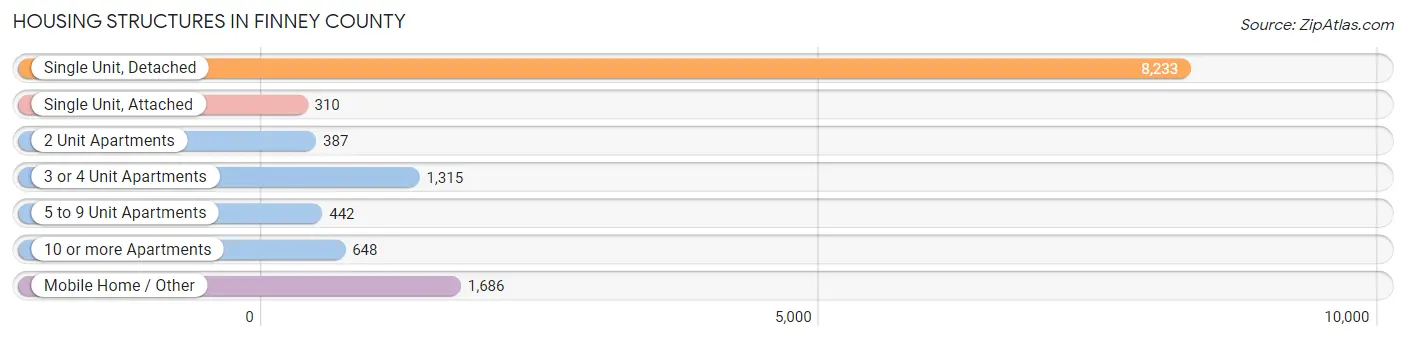
| Structure Type | # Housing Units | % Housing Units |
| Single Unit, Detached | 8,233 | 63.2% |
| Single Unit, Attached | 310 | 2.4% |
| 2 Unit Apartments | 387 | 3.0% |
| 3 or 4 Unit Apartments | 1,315 | 10.1% |
| 5 to 9 Unit Apartments | 442 | 3.4% |
| 10 or more Apartments | 648 | 5.0% |
| Mobile Home / Other | 1,686 | 13.0% |
| Total | 13,021 | 100.0% |
Housing Structures by Occupancy in Finney County
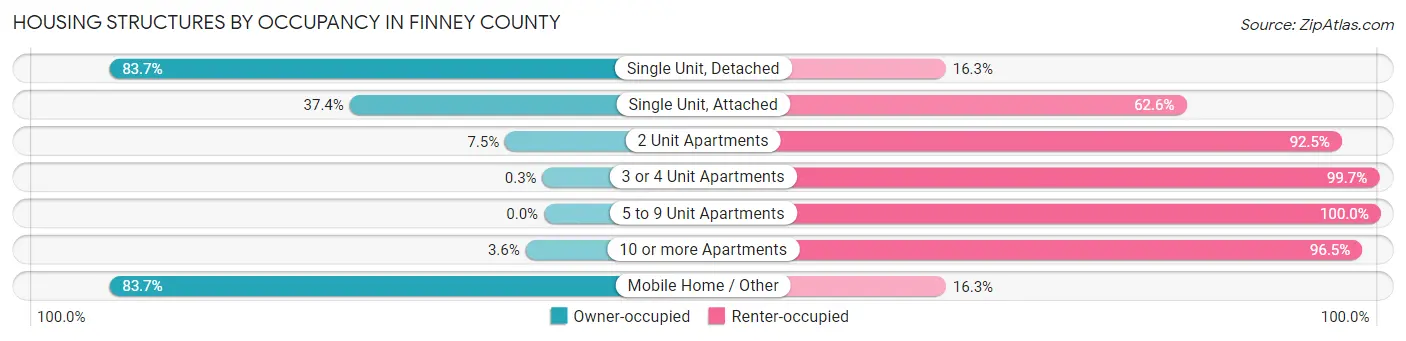
| Structure Type | Owner-occupied | Renter-occupied |
| Single Unit, Detached | 6,891 (83.7%) | 1,342 (16.3%) |
| Single Unit, Attached | 116 (37.4%) | 194 (62.6%) |
| 2 Unit Apartments | 29 (7.5%) | 358 (92.5%) |
| 3 or 4 Unit Apartments | 4 (0.3%) | 1,311 (99.7%) |
| 5 to 9 Unit Apartments | 0 (0.0%) | 442 (100.0%) |
| 10 or more Apartments | 23 (3.5%) | 625 (96.5%) |
| Mobile Home / Other | 1,411 (83.7%) | 275 (16.3%) |
| Total | 8,474 (65.1%) | 4,547 (34.9%) |
Housing Structures by Number of Rooms in Finney County
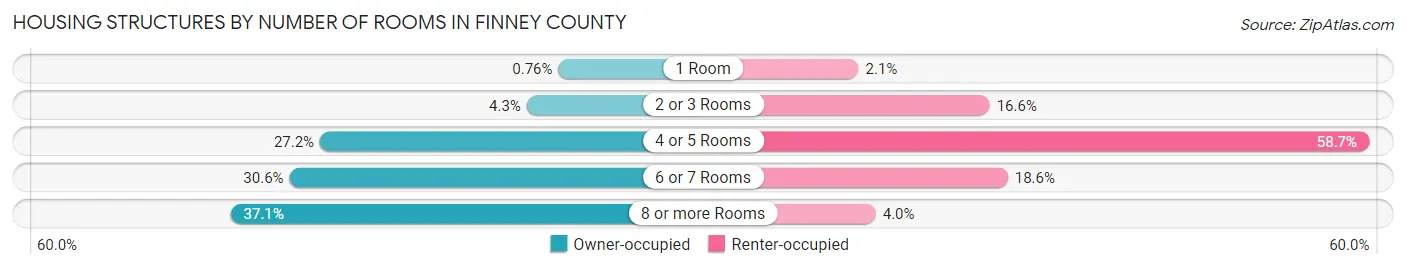
| Number of Rooms | Owner-occupied | Renter-occupied |
| 1 Room | 64 (0.8%) | 94 (2.1%) |
| 2 or 3 Rooms | 363 (4.3%) | 756 (16.6%) |
| 4 or 5 Rooms | 2,307 (27.2%) | 2,669 (58.7%) |
| 6 or 7 Rooms | 2,594 (30.6%) | 847 (18.6%) |
| 8 or more Rooms | 3,146 (37.1%) | 181 (4.0%) |
| Total | 8,474 (100.0%) | 4,547 (100.0%) |
Housing Structure by Heating Type in Finney County
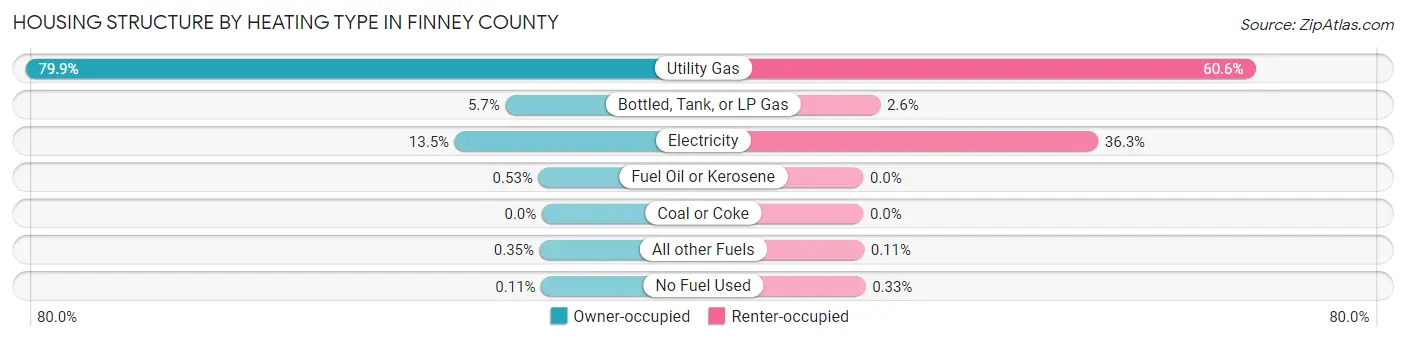
| Heating Type | Owner-occupied | Renter-occupied |
| Utility Gas | 6,769 (79.9%) | 2,757 (60.6%) |
| Bottled, Tank, or LP Gas | 479 (5.7%) | 119 (2.6%) |
| Electricity | 1,142 (13.5%) | 1,651 (36.3%) |
| Fuel Oil or Kerosene | 45 (0.5%) | 0 (0.0%) |
| Coal or Coke | 0 (0.0%) | 0 (0.0%) |
| All other Fuels | 30 (0.4%) | 5 (0.1%) |
| No Fuel Used | 9 (0.1%) | 15 (0.3%) |
| Total | 8,474 (100.0%) | 4,547 (100.0%) |
Household Vehicle Usage in Finney County
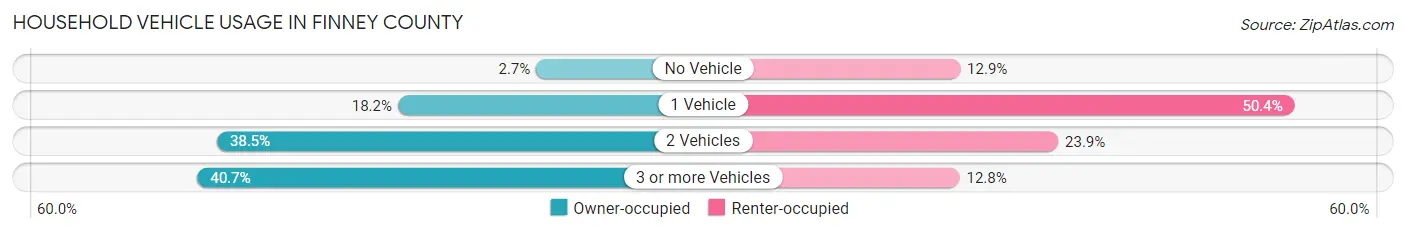
| Vehicles per Household | Owner-occupied | Renter-occupied |
| No Vehicle | 229 (2.7%) | 587 (12.9%) |
| 1 Vehicle | 1,541 (18.2%) | 2,290 (50.4%) |
| 2 Vehicles | 3,259 (38.5%) | 1,086 (23.9%) |
| 3 or more Vehicles | 3,445 (40.6%) | 584 (12.8%) |
| Total | 8,474 (100.0%) | 4,547 (100.0%) |
Real Estate & Mortgages in Finney County
Real Estate and Mortgage Overview in Finney County
| Characteristic | Without Mortgage | With Mortgage |
| Housing Units | 4,014 | 4,460 |
| Median Property Value | $151,300 | $196,900 |
| Median Household Income | $56,236 | $720 |
| Monthly Housing Costs | $591 | $106 |
| Real Estate Taxes | $2,318 | $81 |
Property Value by Mortgage Status in Finney County
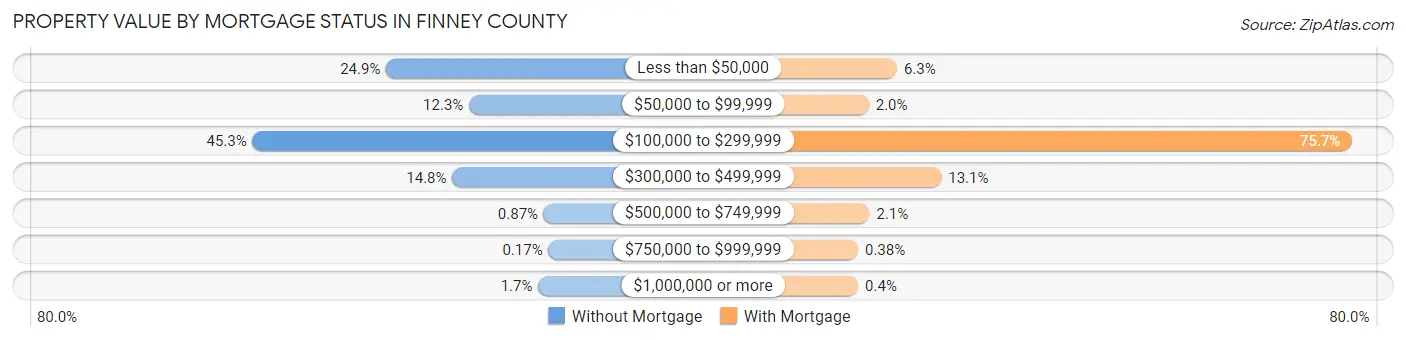
| Property Value | Without Mortgage | With Mortgage |
| Less than $50,000 | 999 (24.9%) | 282 (6.3%) |
| $50,000 to $99,999 | 492 (12.3%) | 90 (2.0%) |
| $100,000 to $299,999 | 1,817 (45.3%) | 3,375 (75.7%) |
| $300,000 to $499,999 | 595 (14.8%) | 583 (13.1%) |
| $500,000 to $749,999 | 35 (0.9%) | 95 (2.1%) |
| $750,000 to $999,999 | 7 (0.2%) | 17 (0.4%) |
| $1,000,000 or more | 69 (1.7%) | 18 (0.4%) |
| Total | 4,014 (100.0%) | 4,460 (100.0%) |
Household Income by Mortgage Status in Finney County
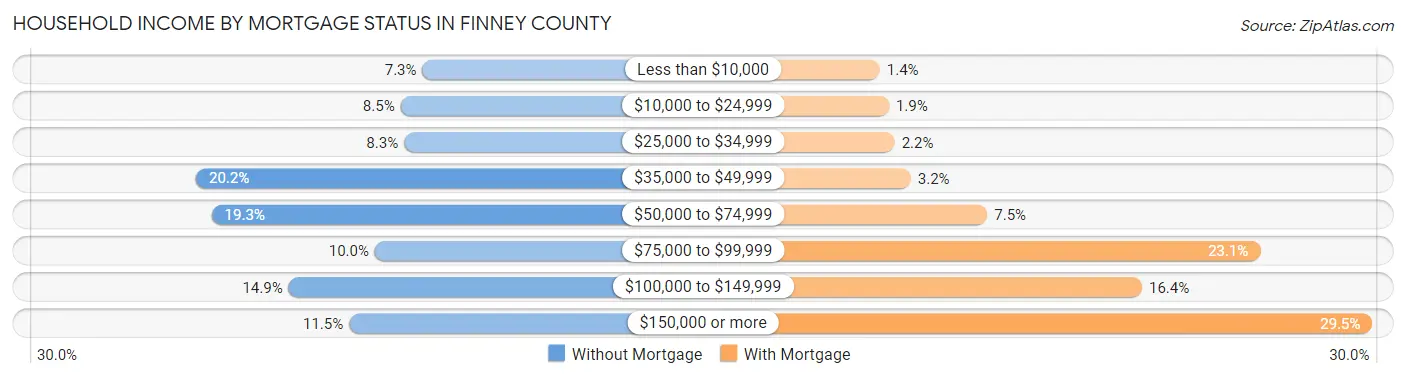
| Household Income | Without Mortgage | With Mortgage |
| Less than $10,000 | 292 (7.3%) | 62 (1.4%) |
| $10,000 to $24,999 | 342 (8.5%) | 85 (1.9%) |
| $25,000 to $34,999 | 334 (8.3%) | 100 (2.2%) |
| $35,000 to $49,999 | 811 (20.2%) | 141 (3.2%) |
| $50,000 to $74,999 | 775 (19.3%) | 336 (7.5%) |
| $75,000 to $99,999 | 401 (10.0%) | 1,031 (23.1%) |
| $100,000 to $149,999 | 599 (14.9%) | 730 (16.4%) |
| $150,000 or more | 460 (11.5%) | 1,317 (29.5%) |
| Total | 4,014 (100.0%) | 4,460 (100.0%) |
Property Value to Household Income Ratio in Finney County
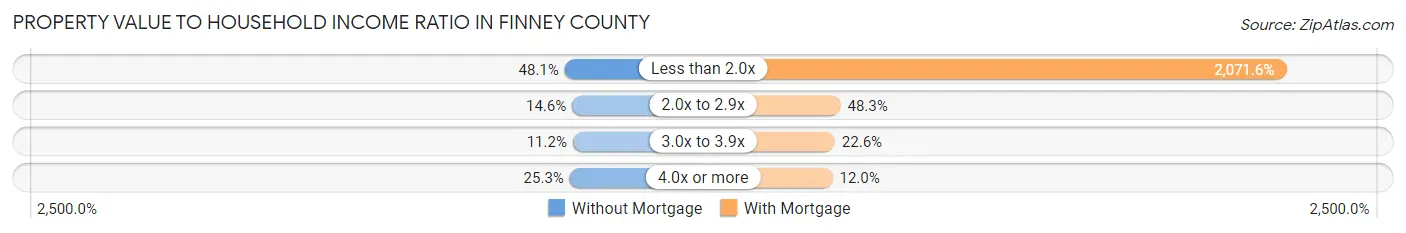
| Value-to-Income Ratio | Without Mortgage | With Mortgage |
| Less than 2.0x | 1,931 (48.1%) | 92,394 (2,071.6%) |
| 2.0x to 2.9x | 585 (14.6%) | 2,154 (48.3%) |
| 3.0x to 3.9x | 450 (11.2%) | 1,008 (22.6%) |
| 4.0x or more | 1,015 (25.3%) | 537 (12.0%) |
| Total | 4,014 (100.0%) | 4,460 (100.0%) |
Real Estate Taxes by Mortgage Status in Finney County
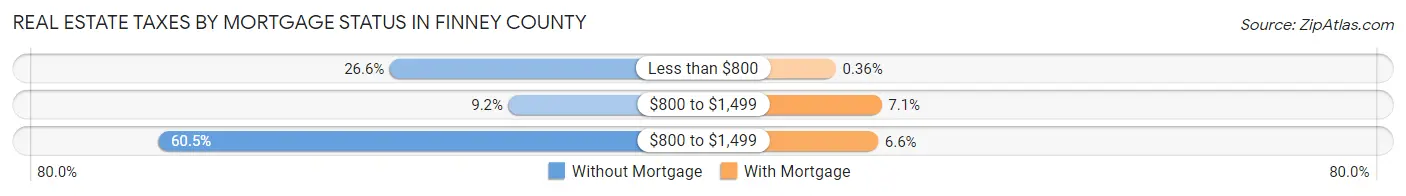
| Property Taxes | Without Mortgage | With Mortgage |
| Less than $800 | 1,067 (26.6%) | 16 (0.4%) |
| $800 to $1,499 | 371 (9.2%) | 315 (7.1%) |
| $800 to $1,499 | 2,429 (60.5%) | 292 (6.6%) |
| Total | 4,014 (100.0%) | 4,460 (100.0%) |
Health & Disability in Finney County
Health Insurance Coverage by Age in Finney County
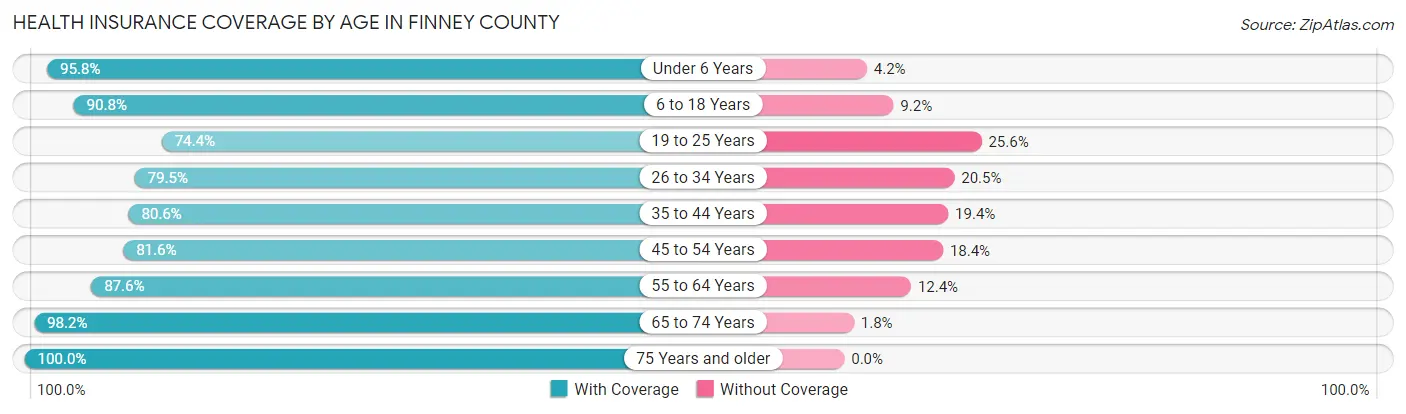
| Age Bracket | With Coverage | Without Coverage |
| Under 6 Years | 3,460 (95.8%) | 152 (4.2%) |
| 6 to 18 Years | 7,622 (90.8%) | 769 (9.2%) |
| 19 to 25 Years | 2,962 (74.4%) | 1,018 (25.6%) |
| 26 to 34 Years | 3,637 (79.5%) | 939 (20.5%) |
| 35 to 44 Years | 3,760 (80.6%) | 903 (19.4%) |
| 45 to 54 Years | 3,556 (81.6%) | 802 (18.4%) |
| 55 to 64 Years | 3,594 (87.6%) | 510 (12.4%) |
| 65 to 74 Years | 2,538 (98.2%) | 46 (1.8%) |
| 75 Years and older | 1,647 (100.0%) | 0 (0.0%) |
| Total | 32,776 (86.5%) | 5,139 (13.6%) |
Health Insurance Coverage by Citizenship Status in Finney County
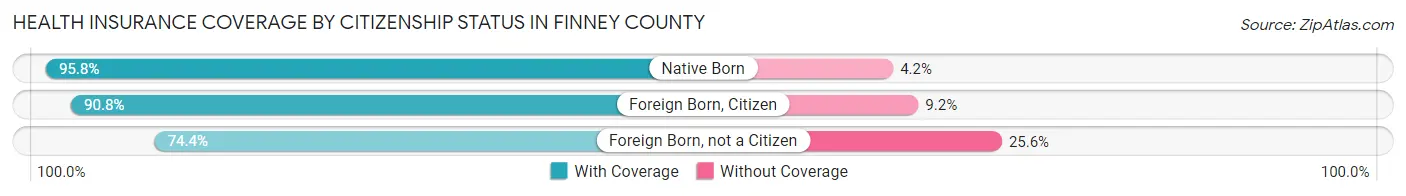
| Citizenship Status | With Coverage | Without Coverage |
| Native Born | 3,460 (95.8%) | 152 (4.2%) |
| Foreign Born, Citizen | 7,622 (90.8%) | 769 (9.2%) |
| Foreign Born, not a Citizen | 2,962 (74.4%) | 1,018 (25.6%) |
Health Insurance Coverage by Household Income in Finney County
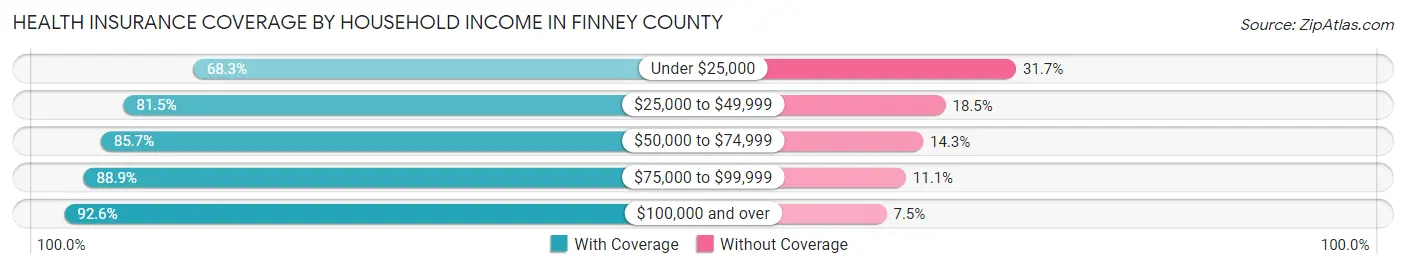
| Household Income | With Coverage | Without Coverage |
| Under $25,000 | 2,612 (68.3%) | 1,213 (31.7%) |
| $25,000 to $49,999 | 5,054 (81.5%) | 1,147 (18.5%) |
| $50,000 to $74,999 | 6,536 (85.7%) | 1,089 (14.3%) |
| $75,000 to $99,999 | 4,762 (88.9%) | 593 (11.1%) |
| $100,000 and over | 13,372 (92.5%) | 1,077 (7.4%) |
Public vs Private Health Insurance Coverage by Age in Finney County
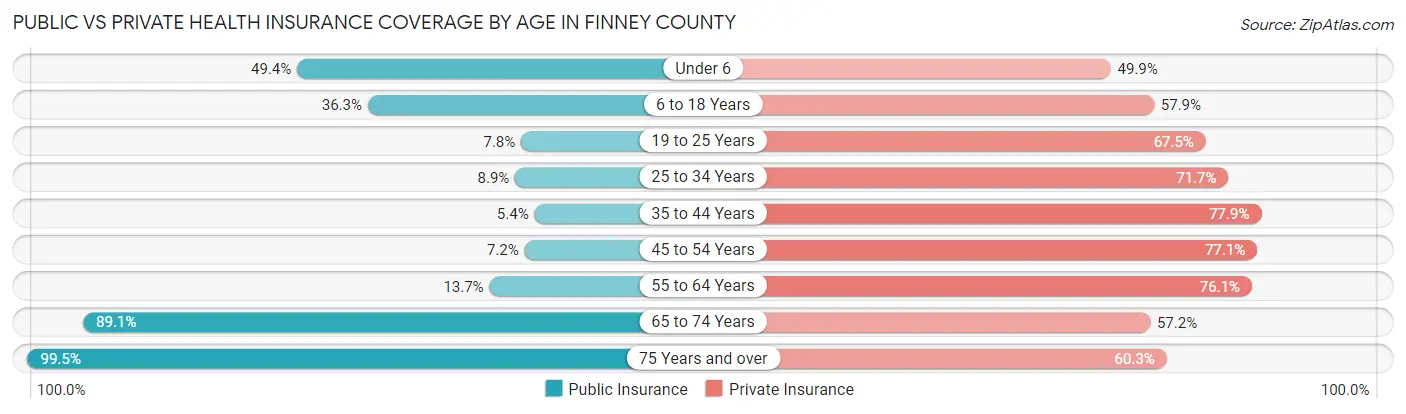
| Age Bracket | Public Insurance | Private Insurance |
| Under 6 | 1,785 (49.4%) | 1,802 (49.9%) |
| 6 to 18 Years | 3,045 (36.3%) | 4,860 (57.9%) |
| 19 to 25 Years | 312 (7.8%) | 2,688 (67.5%) |
| 25 to 34 Years | 409 (8.9%) | 3,283 (71.7%) |
| 35 to 44 Years | 250 (5.4%) | 3,630 (77.8%) |
| 45 to 54 Years | 314 (7.2%) | 3,360 (77.1%) |
| 55 to 64 Years | 563 (13.7%) | 3,124 (76.1%) |
| 65 to 74 Years | 2,303 (89.1%) | 1,478 (57.2%) |
| 75 Years and over | 1,638 (99.5%) | 993 (60.3%) |
| Total | 10,619 (28.0%) | 25,218 (66.5%) |
Disability Status by Sex by Age in Finney County
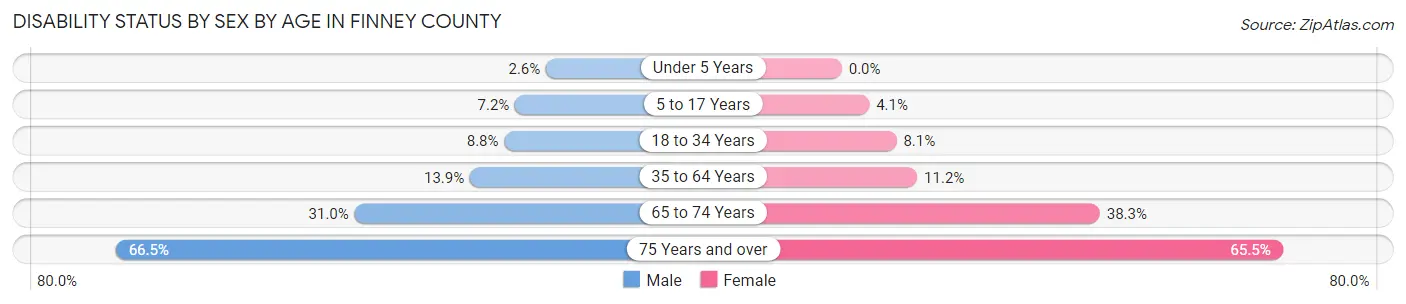
| Age Bracket | Male | Female |
| Under 5 Years | 38 (2.6%) | 0 (0.0%) |
| 5 to 17 Years | 313 (7.1%) | 164 (4.1%) |
| 18 to 34 Years | 428 (8.8%) | 346 (8.1%) |
| 35 to 64 Years | 938 (13.9%) | 711 (11.2%) |
| 65 to 74 Years | 398 (31.0%) | 498 (38.3%) |
| 75 Years and over | 460 (66.5%) | 625 (65.4%) |
Disability Class by Sex by Age in Finney County
Disability Class: Hearing Difficulty
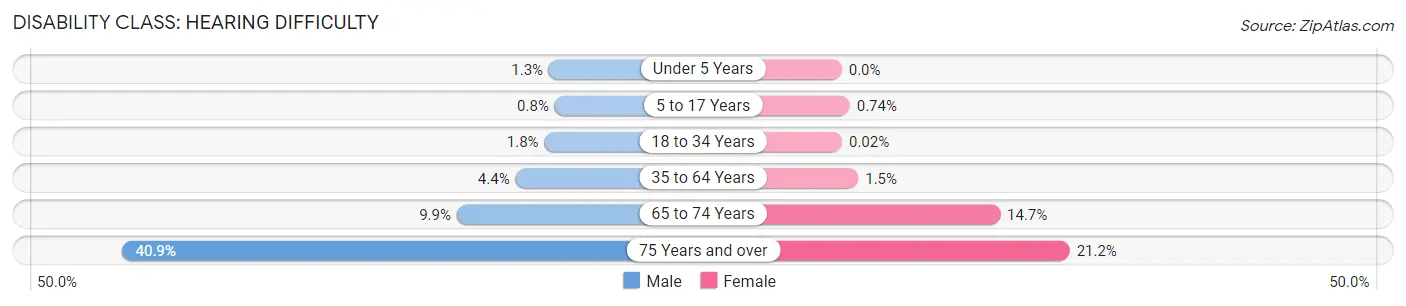
| Age Bracket | Male | Female |
| Under 5 Years | 20 (1.3%) | 0 (0.0%) |
| 5 to 17 Years | 35 (0.8%) | 30 (0.7%) |
| 18 to 34 Years | 86 (1.8%) | 1 (0.0%) |
| 35 to 64 Years | 301 (4.4%) | 97 (1.5%) |
| 65 to 74 Years | 127 (9.9%) | 191 (14.7%) |
| 75 Years and over | 283 (40.9%) | 202 (21.1%) |
Disability Class: Vision Difficulty
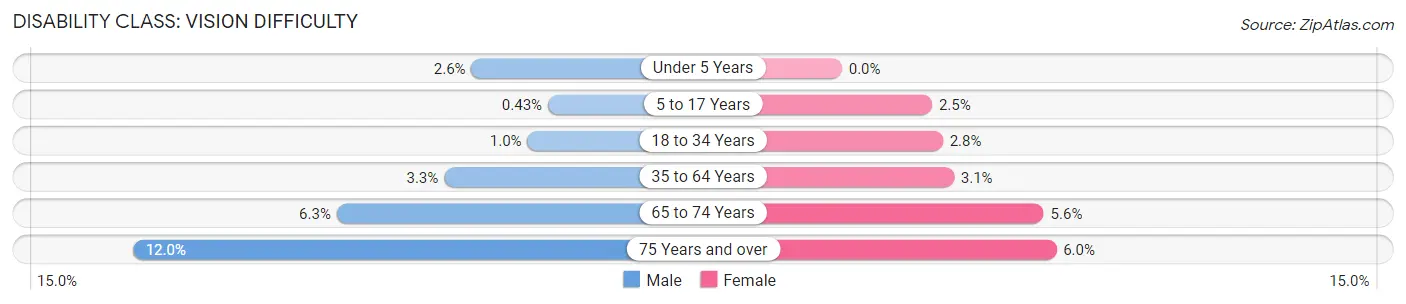
| Age Bracket | Male | Female |
| Under 5 Years | 38 (2.6%) | 0 (0.0%) |
| 5 to 17 Years | 19 (0.4%) | 101 (2.5%) |
| 18 to 34 Years | 49 (1.0%) | 120 (2.8%) |
| 35 to 64 Years | 225 (3.3%) | 198 (3.1%) |
| 65 to 74 Years | 81 (6.3%) | 73 (5.6%) |
| 75 Years and over | 83 (12.0%) | 57 (6.0%) |
Disability Class: Cognitive Difficulty
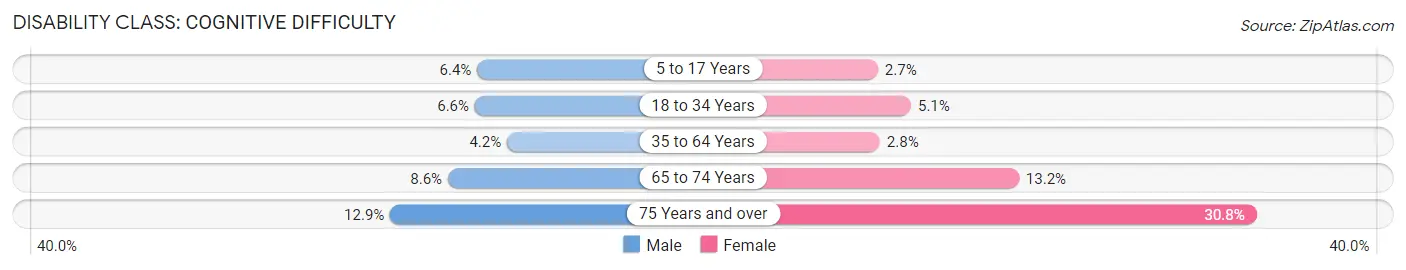
| Age Bracket | Male | Female |
| 5 to 17 Years | 280 (6.4%) | 108 (2.7%) |
| 18 to 34 Years | 321 (6.6%) | 219 (5.1%) |
| 35 to 64 Years | 283 (4.2%) | 180 (2.8%) |
| 65 to 74 Years | 110 (8.6%) | 171 (13.2%) |
| 75 Years and over | 89 (12.9%) | 294 (30.8%) |
Disability Class: Ambulatory Difficulty
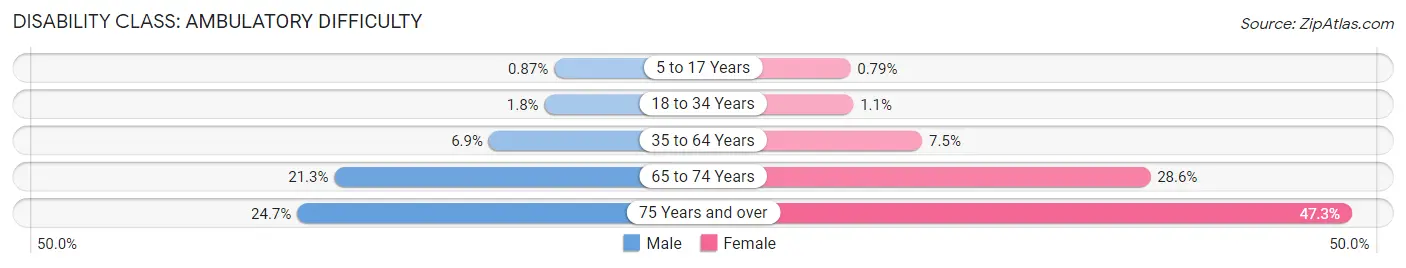
| Age Bracket | Male | Female |
| 5 to 17 Years | 38 (0.9%) | 32 (0.8%) |
| 18 to 34 Years | 86 (1.8%) | 45 (1.1%) |
| 35 to 64 Years | 469 (6.9%) | 474 (7.5%) |
| 65 to 74 Years | 273 (21.3%) | 372 (28.6%) |
| 75 Years and over | 171 (24.7%) | 452 (47.3%) |
Disability Class: Self-Care Difficulty
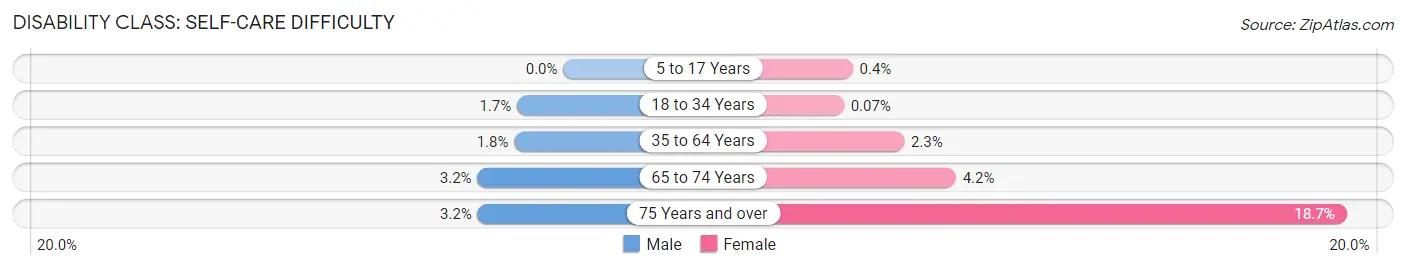
| Age Bracket | Male | Female |
| 5 to 17 Years | 0 (0.0%) | 16 (0.4%) |
| 18 to 34 Years | 84 (1.7%) | 3 (0.1%) |
| 35 to 64 Years | 123 (1.8%) | 147 (2.3%) |
| 65 to 74 Years | 41 (3.2%) | 55 (4.2%) |
| 75 Years and over | 22 (3.2%) | 179 (18.7%) |
Technology Access in Finney County
Computing Device Access in Finney County
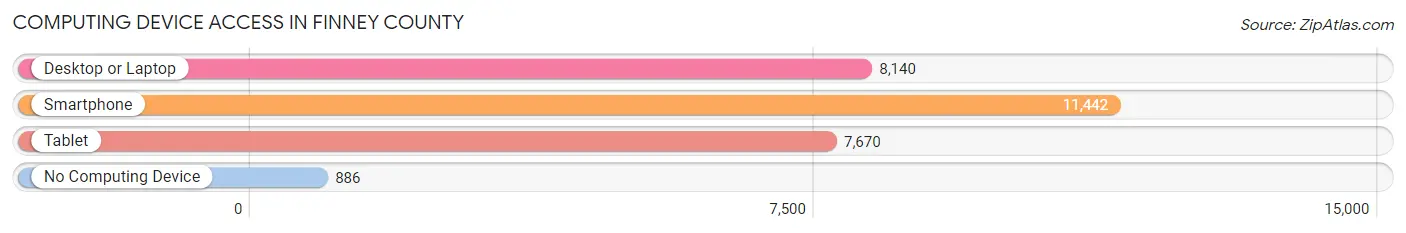
| Device Type | # Households | % Households |
| Desktop or Laptop | 8,140 | 62.5% |
| Smartphone | 11,442 | 87.9% |
| Tablet | 7,670 | 58.9% |
| No Computing Device | 886 | 6.8% |
| Total | 13,021 | 100.0% |
Internet Access in Finney County
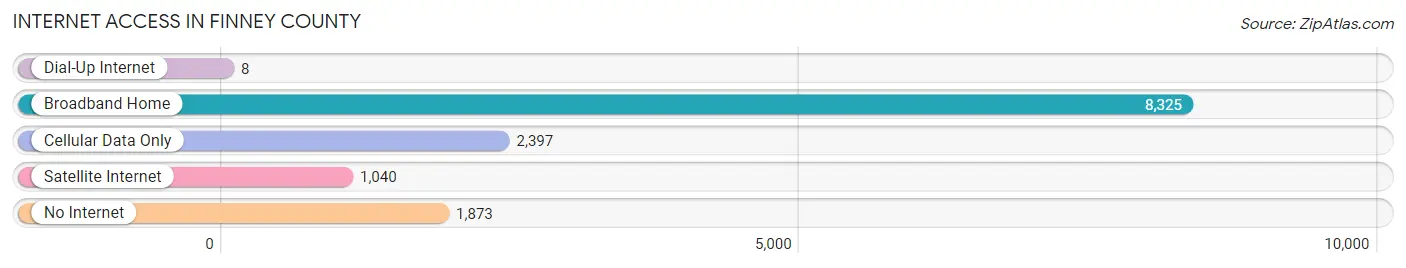
| Internet Type | # Households | % Households |
| Dial-Up Internet | 8 | 0.1% |
| Broadband Home | 8,325 | 63.9% |
| Cellular Data Only | 2,397 | 18.4% |
| Satellite Internet | 1,040 | 8.0% |
| No Internet | 1,873 | 14.4% |
| Total | 13,021 | 100.0% |
Finney County Summary
Finney County is located in the southwestern corner of the state of Kansas. It is bordered by Scott County to the north, Lane County to the east, Haskell County to the south, and Grant County to the west. The county seat is Garden City, which is also the largest city in the county. Finney County covers an area of 1,039 square miles and has a population of 36,776 as of the 2010 census.
History
Finney County was established in 1873 and named after David W. Finney, a prominent Kansas politician. The county was originally part of the large area of western Kansas that was opened to settlement in the late 19th century. The first settlers arrived in the area in 1878 and the county was officially organized in 1879.
The early settlers of Finney County were primarily farmers and ranchers, and the county quickly became an important agricultural center. The Santa Fe Railroad arrived in Garden City in 1887, which helped to spur economic growth in the area. The county also became a major center for the cattle industry, and by the early 20th century, Finney County was one of the largest cattle-producing counties in the state.
In the mid-20th century, Finney County began to diversify its economy. The county became a major center for food processing, and several large food processing plants were built in Garden City. The county also became a major center for the oil and gas industry, and several oil and gas companies have operations in the area.
Geography
Finney County is located in the southwestern corner of Kansas. It is bordered by Scott County to the north, Lane County to the east, Haskell County to the south, and Grant County to the west. The county covers an area of 1,039 square miles and has a population of 36,776 as of the 2010 census.
The landscape of Finney County is mostly flat, with some rolling hills in the eastern part of the county. The county is located in the High Plains region of the Great Plains, and the climate is semi-arid. The county receives an average of 17 inches of precipitation per year.
Economy
Finney County has a diverse economy that is based on agriculture, manufacturing, and energy production. The county is a major center for the production of wheat, corn, and other grains, and is also a major center for the cattle industry.
The county is also home to several large food processing plants, including the ConAgra Foods plant in Garden City. The county is also a major center for the oil and gas industry, and several oil and gas companies have operations in the area.
Demographics
As of the 2010 census, Finney County had a population of 36,776. The racial makeup of the county was 79.2% White, 1.3% African American, 0.7% Native American, 0.7% Asian, 0.1% Pacific Islander, 15.3% from other races, and 2.9% from two or more races. Hispanic or Latino of any race were 28.2% of the population.
The median household income in Finney County was $41,945, and the median family income was $50,945. The per capita income was $20,945. About 14.2% of the population was below the poverty line.
Common Questions
What is the Total Population of Finney County?
Total Population of Finney County is 38,187.
What is the Total Male Population of Finney County?
Total Male Population of Finney County is 19,697.
What is the Total Female Population of Finney County?
Total Female Population of Finney County is 18,490.
What is the Ratio of Males per 100 Females in Finney County?
There are 106.53 Males per 100 Females in Finney County.
What is the Ratio of Females per 100 Males in Finney County?
There are 93.87 Females per 100 Males in Finney County.
What is the Median Population Age in Finney County?
Median Population Age in Finney County is 31.9 Years.
What is the Average Family Size in Finney County
Average Family Size in Finney County is 3.4 People.
What is the Average Household Size in Finney County
Average Household Size in Finney County is 2.9 People.
What is Per Capita Income in Finney County?
Per Capita income in Finney County is $29,805.
What is the Median Family Income in Finney County?
Median Family Income in Finney County is $82,562.
What is the Median Household income in Finney County?
Median Household Income in Finney County is $68,481.
What is Income or Wage Gap in Finney County?
Income or Wage Gap in Finney County is 33.1%.
Women in Finney County earn 66.9 cents for every dollar earned by a man.
What is Family Income Deficit in Finney County?
Family Income Deficit in Finney County is $14,693.
Families that are below poverty line in Finney County earn $14,693 less on average than the poverty threshold level.
What is Inequality or Gini Index in Finney County?
Inequality or Gini Index in Finney County is 0.40.
How Large is the Labor Force in Finney County?
There are 19,784 People in the Labor Forcein in Finney County.
What is the Percentage of People in the Labor Force in Finney County?
70.4% of People are in the Labor Force in Finney County.
What is the Unemployment Rate in Finney County?
Unemployment Rate in Finney County is 5.4%.