Ellis County, KS
Ellis County Map
Ellis County Overview
28,921
TOTAL POPULATION
14,463
MALE POPULATION
14,458
FEMALE POPULATION
100.03
MALES / 100 FEMALES
99.97
FEMALES / 100 MALES
32.9
MEDIAN AGE
2.9
AVG FAMILY SIZE
2.3
AVG HOUSEHOLD SIZE
$37,217
PER CAPITA INCOME
$86,484
AVG FAMILY INCOME
$59,665
AVG HOUSEHOLD INCOME
26.2%
WAGE / INCOME GAP [ % ]
73.8¢/ $1
WAGE / INCOME GAP [ $ ]
0.50
INEQUALITY / GINI INDEX
17,300
LABOR FORCE [ PEOPLE ]
73.7%
PERCENT IN LABOR FORCE
3.3%
UNEMPLOYMENT RATE
Ellis County Area Codes
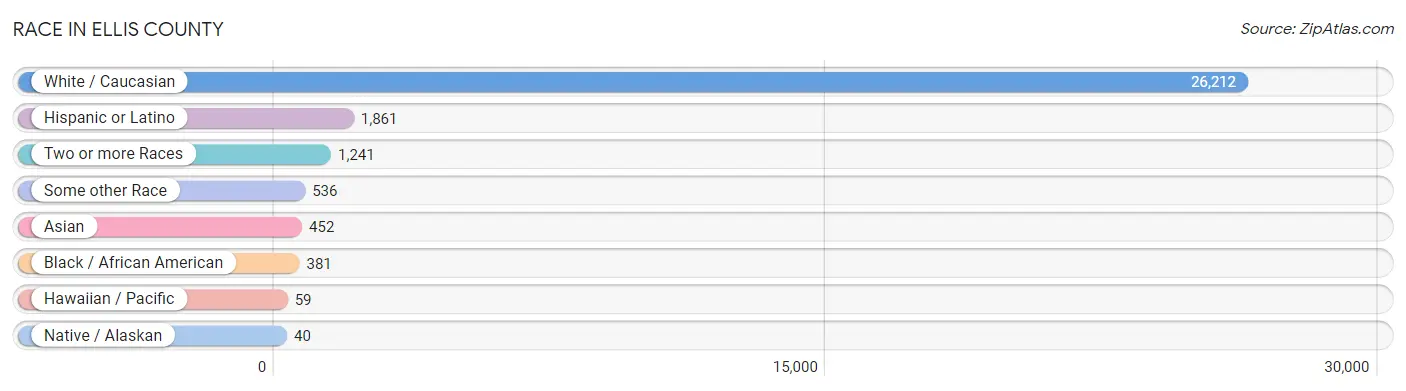
Race in Ellis County
The most populous races in Ellis County are White / Caucasian (26,212 | 90.6%), Hispanic or Latino (1,861 | 6.4%), and Two or more Races (1,241 | 4.3%).
| Race | # Population | % Population |
| Asian | 452 | 1.6% |
| Black / African American | 381 | 1.3% |
| Hawaiian / Pacific | 59 | 0.2% |
| Hispanic or Latino | 1,861 | 6.4% |
| Native / Alaskan | 40 | 0.1% |
| White / Caucasian | 26,212 | 90.6% |
| Two or more Races | 1,241 | 4.3% |
| Some other Race | 536 | 1.8% |
| Total | 28,921 | 100.0% |
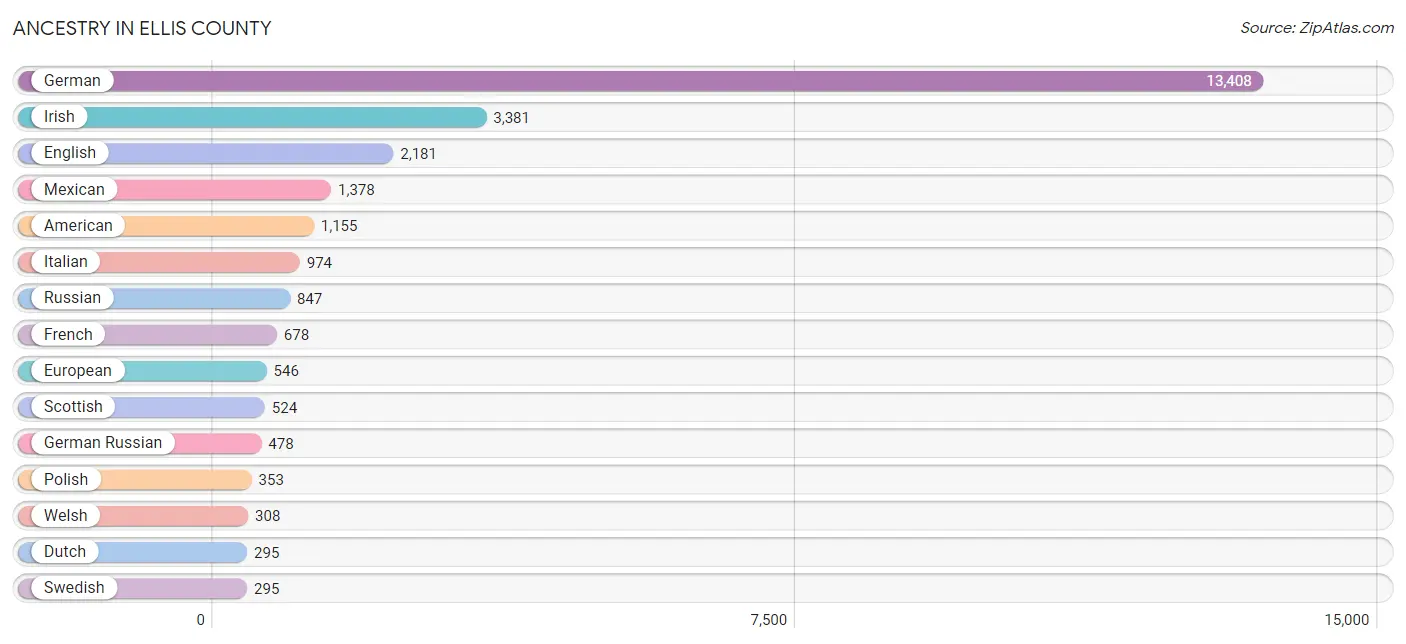
Ancestry in Ellis County
The most populous ancestries reported in Ellis County are German (13,408 | 46.4%), Irish (3,381 | 11.7%), English (2,181 | 7.5%), Mexican (1,378 | 4.8%), and American (1,155 | 4.0%), together accounting for 74.3% of all Ellis County residents.
| Ancestry | # Population | % Population |
| African | 17 | 0.1% |
| American | 1,155 | 4.0% |
| Apache | 5 | 0.0% |
| Austrian | 241 | 0.8% |
| Belgian | 57 | 0.2% |
| Bhutanese | 27 | 0.1% |
| Blackfeet | 91 | 0.3% |
| British | 18 | 0.1% |
| Burmese | 61 | 0.2% |
| Canadian | 18 | 0.1% |
| Central American | 57 | 0.2% |
| Cherokee | 186 | 0.6% |
| Chilean | 111 | 0.4% |
| Choctaw | 9 | 0.0% |
| Colombian | 44 | 0.2% |
| Comanche | 2 | 0.0% |
| Costa Rican | 23 | 0.1% |
| Creek | 5 | 0.0% |
| Cuban | 56 | 0.2% |
| Czech | 140 | 0.5% |
| Czechoslovakian | 73 | 0.3% |
| Danish | 175 | 0.6% |
| Dominican | 30 | 0.1% |
| Dutch | 295 | 1.0% |
| Eastern European | 52 | 0.2% |
| English | 2,181 | 7.5% |
| European | 546 | 1.9% |
| Finnish | 112 | 0.4% |
| French | 678 | 2.3% |
| French Canadian | 134 | 0.5% |
| German | 13,408 | 46.4% |
| German Russian | 478 | 1.7% |
| Greek | 45 | 0.2% |
| Guamanian / Chamorro | 12 | 0.0% |
| Honduran | 31 | 0.1% |
| Hungarian | 4 | 0.0% |
| Indian (Asian) | 275 | 0.9% |
| Iranian | 13 | 0.0% |
| Irish | 3,381 | 11.7% |
| Italian | 974 | 3.4% |
| Korean | 116 | 0.4% |
| Lithuanian | 78 | 0.3% |
| Malaysian | 16 | 0.1% |
| Mexican | 1,378 | 4.8% |
| Mexican American Indian | 8 | 0.0% |
| Navajo | 27 | 0.1% |
| Nigerian | 33 | 0.1% |
| Northern European | 78 | 0.3% |
| Norwegian | 180 | 0.6% |
| Pennsylvania German | 44 | 0.2% |
| Polish | 353 | 1.2% |
| Puerto Rican | 30 | 0.1% |
| Puget Sound Salish | 16 | 0.1% |
| Russian | 847 | 2.9% |
| Salvadoran | 3 | 0.0% |
| Samoan | 3 | 0.0% |
| Scandinavian | 56 | 0.2% |
| Scotch-Irish | 175 | 0.6% |
| Scottish | 524 | 1.8% |
| Senegalese | 2 | 0.0% |
| Slovak | 45 | 0.2% |
| South African | 3 | 0.0% |
| South American | 155 | 0.5% |
| Spaniard | 27 | 0.1% |
| Spanish | 72 | 0.3% |
| Sri Lankan | 47 | 0.2% |
| Subsaharan African | 70 | 0.2% |
| Sudanese | 13 | 0.0% |
| Swedish | 295 | 1.0% |
| Swiss | 50 | 0.2% |
| Thai | 124 | 0.4% |
| Tlingit-Haida | 30 | 0.1% |
| Turkish | 6 | 0.0% |
| Ukrainian | 28 | 0.1% |
| Welsh | 308 | 1.1% | View All 75 Rows |
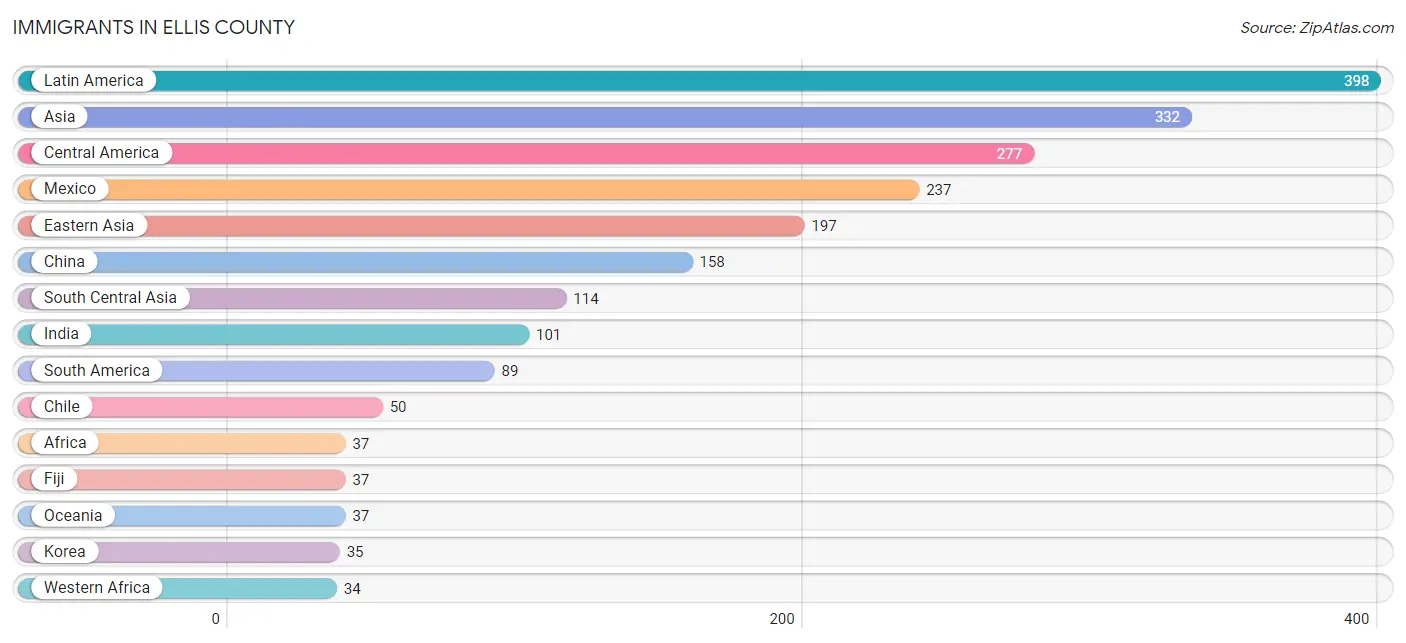
Immigrants in Ellis County
The most numerous immigrant groups reported in Ellis County came from Latin America (398 | 1.4%), Asia (332 | 1.1%), Central America (277 | 1.0%), Mexico (237 | 0.8%), and Eastern Asia (197 | 0.7%), together accounting for 5.0% of all Ellis County residents.
| Immigration Origin | # Population | % Population |
| Africa | 37 | 0.1% |
| Asia | 332 | 1.1% |
| Belize | 9 | 0.0% |
| Canada | 4 | 0.0% |
| Caribbean | 32 | 0.1% |
| Central America | 277 | 1.0% |
| Chile | 50 | 0.2% |
| China | 158 | 0.5% |
| Colombia | 16 | 0.1% |
| Dominican Republic | 30 | 0.1% |
| Eastern Asia | 197 | 0.7% |
| Europe | 33 | 0.1% |
| Fiji | 37 | 0.1% |
| Germany | 5 | 0.0% |
| Honduras | 31 | 0.1% |
| India | 101 | 0.4% |
| Iran | 13 | 0.0% |
| Italy | 2 | 0.0% |
| Japan | 4 | 0.0% |
| Korea | 35 | 0.1% |
| Latin America | 398 | 1.4% |
| Mexico | 237 | 0.8% |
| Netherlands | 6 | 0.0% |
| Northern Europe | 20 | 0.1% |
| Oceania | 37 | 0.1% |
| Philippines | 10 | 0.0% |
| Senegal | 32 | 0.1% |
| South Africa | 3 | 0.0% |
| South America | 89 | 0.3% |
| South Central Asia | 114 | 0.4% |
| South Eastern Asia | 10 | 0.0% |
| Southern Europe | 2 | 0.0% |
| Turkey | 11 | 0.0% |
| Venezuela | 23 | 0.1% |
| Western Africa | 34 | 0.1% |
| Western Asia | 11 | 0.0% |
| Western Europe | 11 | 0.0% | View All 37 Rows |
Sex and Age in Ellis County
Sex and Age in Ellis County
The most populous age groups in Ellis County are 20 to 24 Years (1,835 | 12.7%) for men and 20 to 24 Years (1,963 | 13.6%) for women.
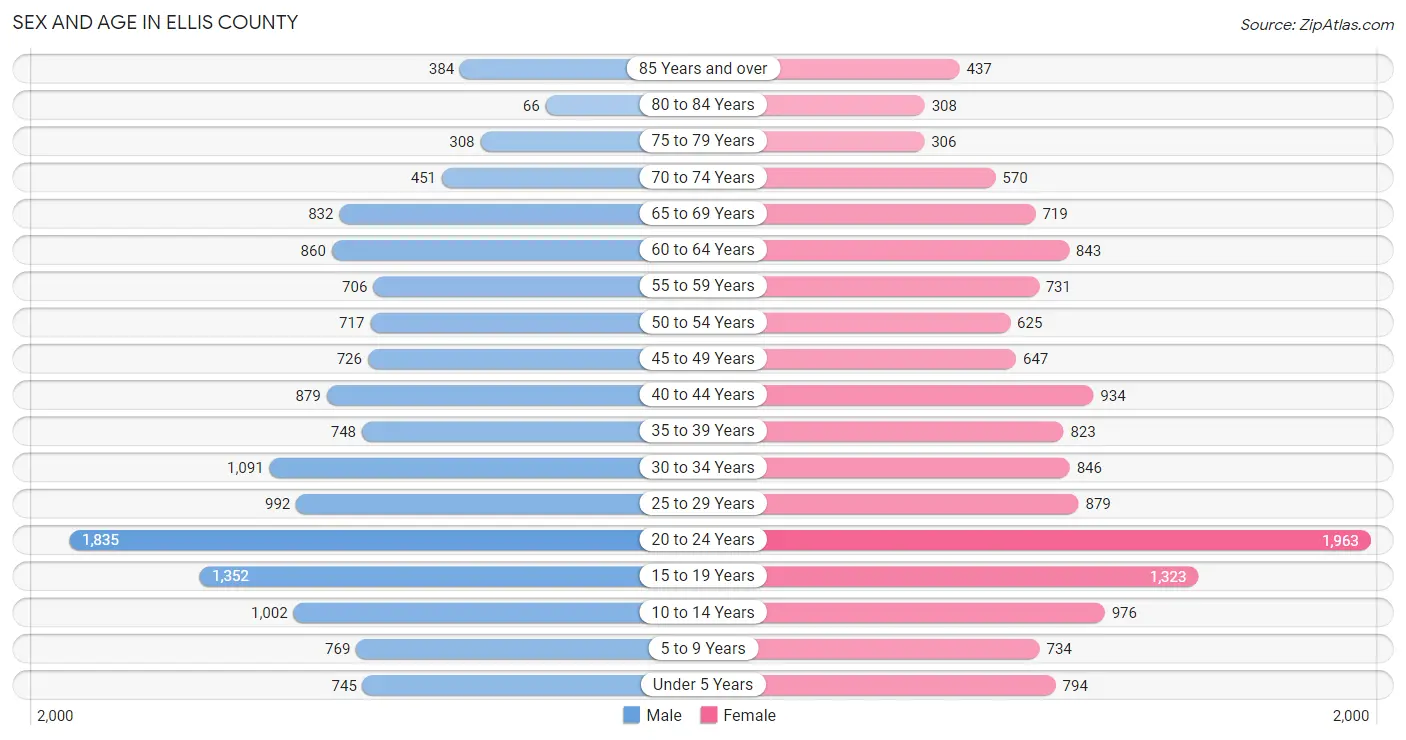
| Age Bracket | Male | Female |
| Under 5 Years | 745 (5.1%) | 794 (5.5%) |
| 5 to 9 Years | 769 (5.3%) | 734 (5.1%) |
| 10 to 14 Years | 1,002 (6.9%) | 976 (6.8%) |
| 15 to 19 Years | 1,352 (9.3%) | 1,323 (9.1%) |
| 20 to 24 Years | 1,835 (12.7%) | 1,963 (13.6%) |
| 25 to 29 Years | 992 (6.9%) | 879 (6.1%) |
| 30 to 34 Years | 1,091 (7.5%) | 846 (5.9%) |
| 35 to 39 Years | 748 (5.2%) | 823 (5.7%) |
| 40 to 44 Years | 879 (6.1%) | 934 (6.5%) |
| 45 to 49 Years | 726 (5.0%) | 647 (4.5%) |
| 50 to 54 Years | 717 (5.0%) | 625 (4.3%) |
| 55 to 59 Years | 706 (4.9%) | 731 (5.1%) |
| 60 to 64 Years | 860 (5.9%) | 843 (5.8%) |
| 65 to 69 Years | 832 (5.8%) | 719 (5.0%) |
| 70 to 74 Years | 451 (3.1%) | 570 (3.9%) |
| 75 to 79 Years | 308 (2.1%) | 306 (2.1%) |
| 80 to 84 Years | 66 (0.5%) | 308 (2.1%) |
| 85 Years and over | 384 (2.7%) | 437 (3.0%) |
| Total | 14,463 (100.0%) | 14,458 (100.0%) |
Families and Households in Ellis County
Median Family Size in Ellis County
The median family size in Ellis County is 2.93 persons per family, with married-couple families (5,546 | 81.5%) accounting for the largest median family size of 3.02 persons per family. On the other hand, single female/mother families (1,004 | 14.8%) represent the smallest median family size with 2.49 persons per family.
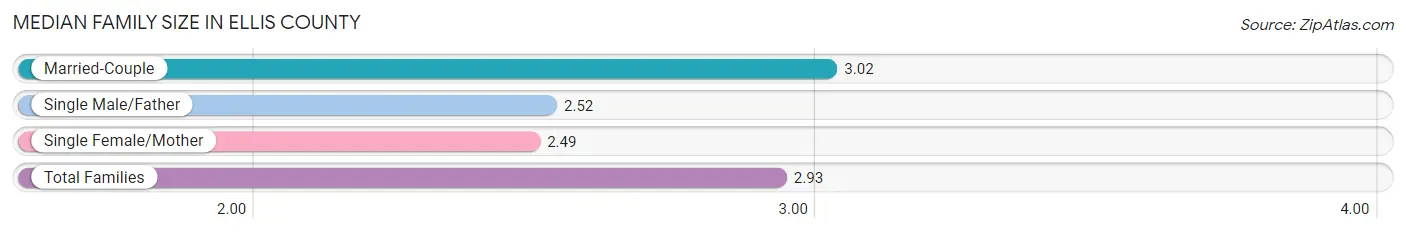
| Family Type | # Families | Family Size |
| Married-Couple | 5,546 (81.5%) | 3.02 |
| Single Male/Father | 252 (3.7%) | 2.52 |
| Single Female/Mother | 1,004 (14.8%) | 2.49 |
| Total Families | 6,802 (100.0%) | 2.93 |
Median Household Size in Ellis County
The median household size in Ellis County is 2.30 persons per household, with married-couple households (5,546 | 46.4%) accounting for the largest median household size of 3.03 persons per household. non-family households (5,156 | 43.1%) represent the smallest median household size with 1.41 persons per household.
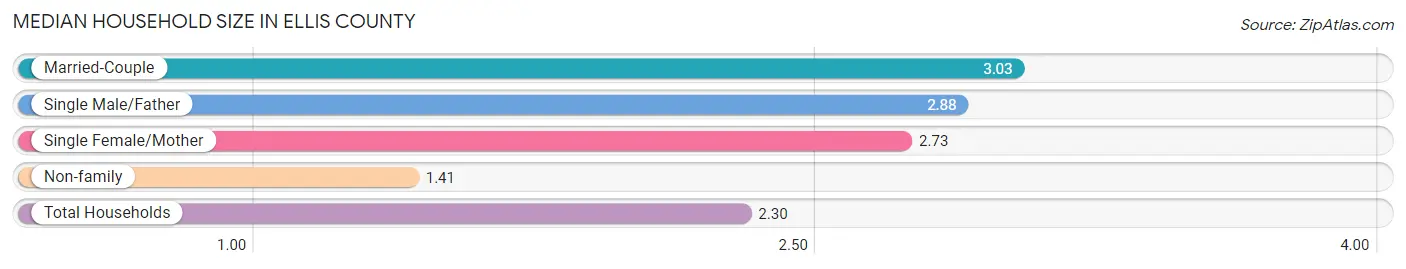
| Household Type | # Households | Household Size |
| Married-Couple | 5,546 (46.4%) | 3.03 |
| Single Male/Father | 252 (2.1%) | 2.88 |
| Single Female/Mother | 1,004 (8.4%) | 2.73 |
| Non-family | 5,156 (43.1%) | 1.41 |
| Total Households | 11,958 (100.0%) | 2.30 |
Household Size by Marriage Status in Ellis County
Out of a total of 11,958 households in Ellis County, 6,802 (56.9%) are family households, while 5,156 (43.1%) are nonfamily households. The most numerous type of family households are 2-person households, comprising 2,988, and the most common type of nonfamily households are 1-person households, comprising 3,821.
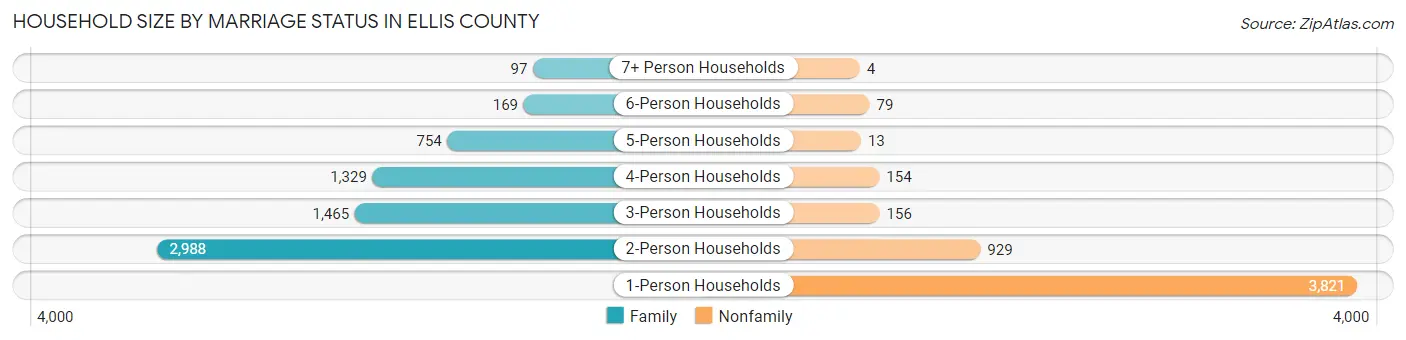
| Household Size | Family Households | Nonfamily Households |
| 1-Person Households | - | 3,821 (32.0%) |
| 2-Person Households | 2,988 (25.0%) | 929 (7.8%) |
| 3-Person Households | 1,465 (12.2%) | 156 (1.3%) |
| 4-Person Households | 1,329 (11.1%) | 154 (1.3%) |
| 5-Person Households | 754 (6.3%) | 13 (0.1%) |
| 6-Person Households | 169 (1.4%) | 79 (0.7%) |
| 7+ Person Households | 97 (0.8%) | 4 (0.0%) |
| Total | 6,802 (56.9%) | 5,156 (43.1%) |
Female Fertility in Ellis County
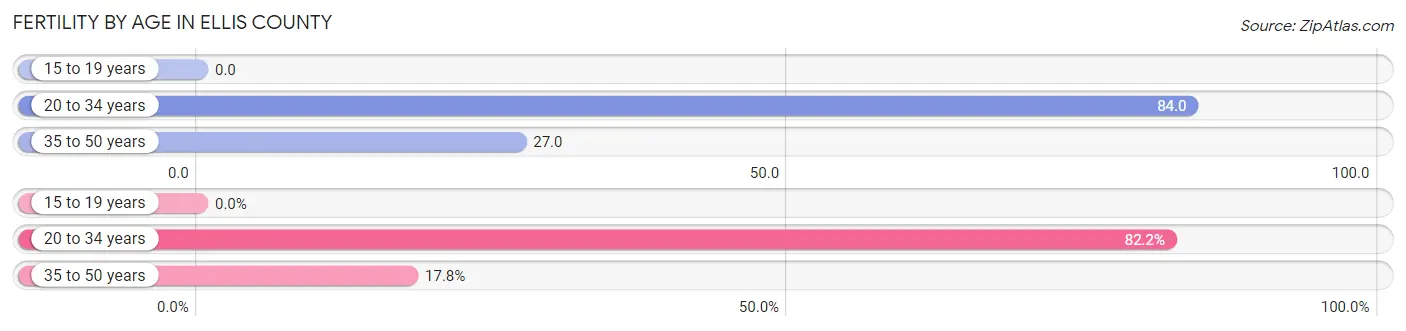
Fertility by Age in Ellis County
Average fertility rate in Ellis County is 50.0 births per 1,000 women. Women in the age bracket of 20 to 34 years have the highest fertility rate with 84.0 births per 1,000 women. Women in the age bracket of 20 to 34 years acount for 82.2% of all women with births.
| Age Bracket | Women with Births | Births / 1,000 Women |
| 15 to 19 years | 0 (0.0%) | 0.0 |
| 20 to 34 years | 309 (82.2%) | 84.0 |
| 35 to 50 years | 67 (17.8%) | 27.0 |
| Total | 376 (100.0%) | 50.0 |
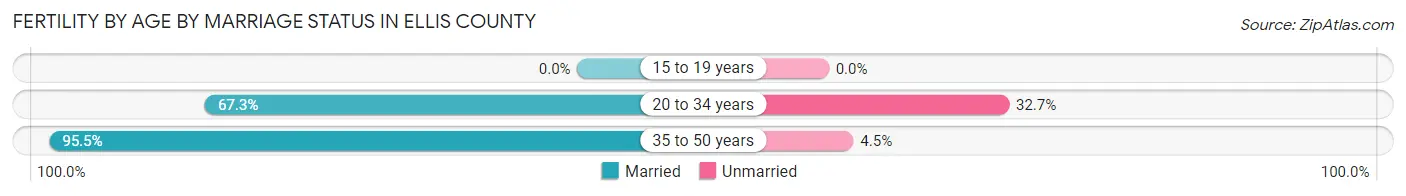
Fertility by Age by Marriage Status in Ellis County
72.3% of women with births (376) in Ellis County are married. The highest percentage of unmarried women with births falls into 20 to 34 years age bracket with 32.7% of them unmarried at the time of birth, while the lowest percentage of unmarried women with births belong to 35 to 50 years age bracket with 4.5% of them unmarried.
| Age Bracket | Married | Unmarried |
| 15 to 19 years | 0 (0.0%) | 0 (0.0%) |
| 20 to 34 years | 208 (67.3%) | 101 (32.7%) |
| 35 to 50 years | 64 (95.5%) | 3 (4.5%) |
| Total | 272 (72.3%) | 104 (27.7%) |
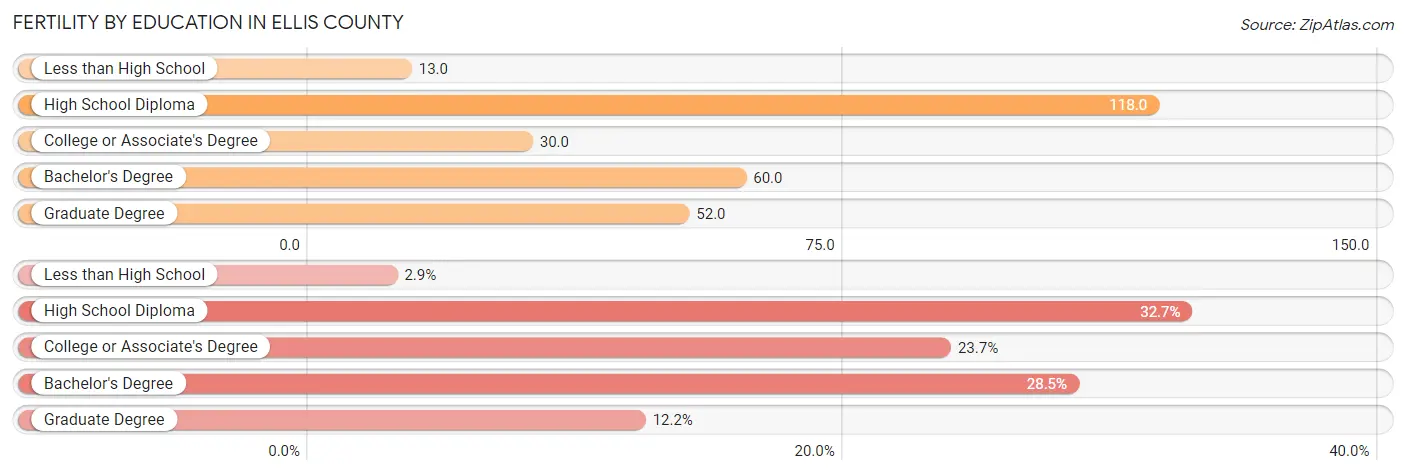
Fertility by Education in Ellis County
Average fertility rate in Ellis County is 50.0 births per 1,000 women. Women with the education attainment of high school diploma have the highest fertility rate of 118.0 births per 1,000 women, while women with the education attainment of less than high school have the lowest fertility at 13.0 births per 1,000 women. Women with the education attainment of high school diploma represent 32.7% of all women with births.
| Educational Attainment | Women with Births | Births / 1,000 Women |
| Less than High School | 11 (2.9%) | 13.0 |
| High School Diploma | 123 (32.7%) | 118.0 |
| College or Associate's Degree | 89 (23.7%) | 30.0 |
| Bachelor's Degree | 107 (28.5%) | 60.0 |
| Graduate Degree | 46 (12.2%) | 52.0 |
| Total | 376 (100.0%) | 50.0 |
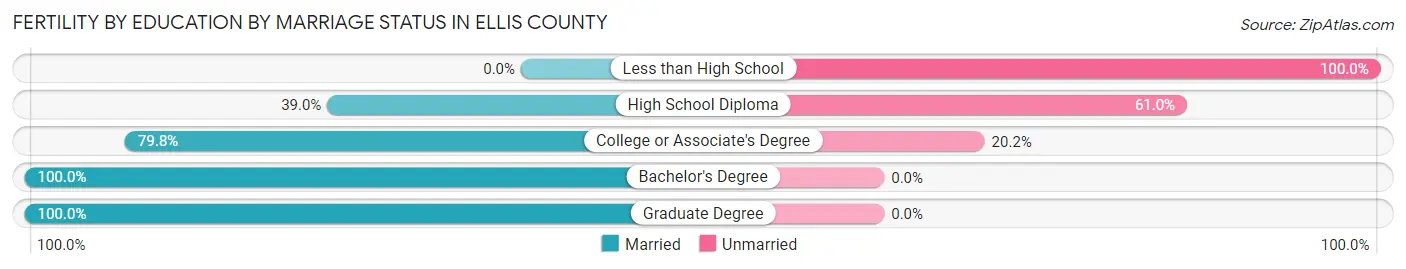
Fertility by Education by Marriage Status in Ellis County
27.7% of women with births in Ellis County are unmarried. Women with the educational attainment of bachelor's degree are most likely to be married with 100.0% of them married at childbirth, while women with the educational attainment of less than high school are least likely to be married with 100.0% of them unmarried at childbirth.
| Educational Attainment | Married | Unmarried |
| Less than High School | 0 (0.0%) | 11 (100.0%) |
| High School Diploma | 48 (39.0%) | 75 (61.0%) |
| College or Associate's Degree | 71 (79.8%) | 18 (20.2%) |
| Bachelor's Degree | 107 (100.0%) | 0 (0.0%) |
| Graduate Degree | 46 (100.0%) | 0 (0.0%) |
| Total | 272 (72.3%) | 104 (27.7%) |
Income in Ellis County
Income Overview in Ellis County
Per Capita Income in Ellis County is $37,217, while median incomes of families and households are $86,484 and $59,665 respectively.
| Characteristic | Number | Measure |
| Per Capita Income | 28,921 | $37,217 |
| Median Family Income | 6,802 | $86,484 |
| Mean Family Income | 6,802 | $102,155 |
| Median Household Income | 11,958 | $59,665 |
| Mean Household Income | 11,958 | $88,751 |
| Income Deficit | 6,802 | $0 |
| Wage / Income Gap (%) | 28,921 | 26.25% |
| Wage / Income Gap ($) | 28,921 | 73.75¢ per $1 |
| Gini / Inequality Index | 28,921 | 0.50 |
Earnings by Sex in Ellis County
Average Earnings in Ellis County are $32,521, $36,513 for men and $26,929 for women, a difference of 26.3%.
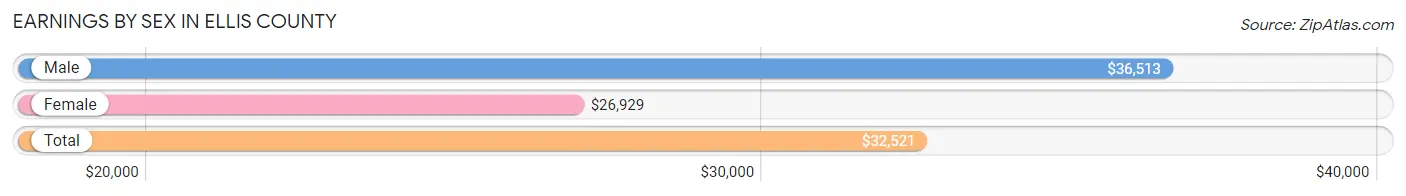
| Sex | Number | Average Earnings |
| Male | 9,788 (53.7%) | $36,513 |
| Female | 8,441 (46.3%) | $26,929 |
| Total | 18,229 (100.0%) | $32,521 |
Earnings by Sex by Income Bracket in Ellis County
The most common earnings brackets in Ellis County are $75,000 to $99,999 for men (1,198 | 12.2%) and $2,499 or less for women (790 | 9.4%).
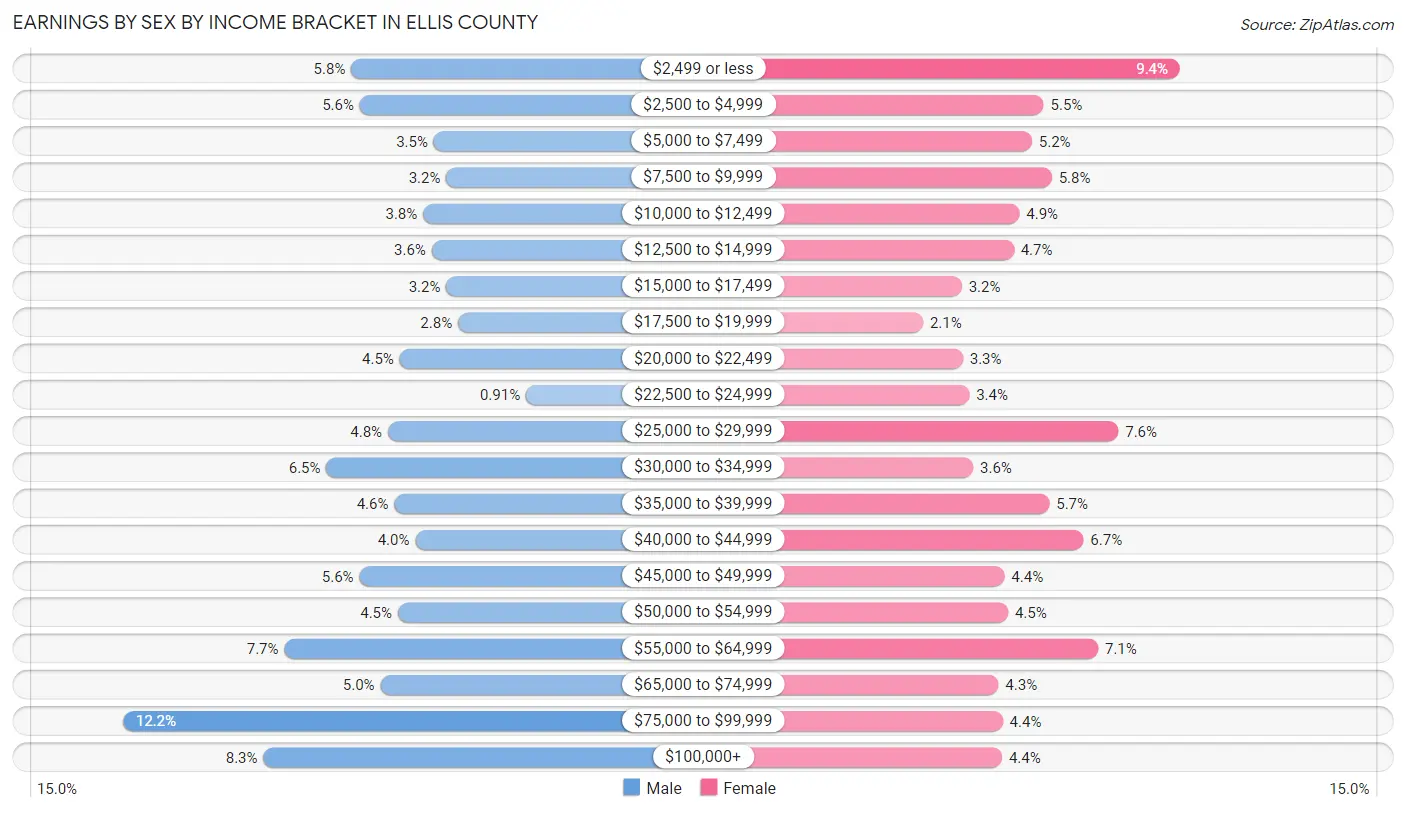
| Income | Male | Female |
| $2,499 or less | 570 (5.8%) | 790 (9.4%) |
| $2,500 to $4,999 | 546 (5.6%) | 467 (5.5%) |
| $5,000 to $7,499 | 343 (3.5%) | 439 (5.2%) |
| $7,500 to $9,999 | 308 (3.2%) | 486 (5.8%) |
| $10,000 to $12,499 | 372 (3.8%) | 409 (4.9%) |
| $12,500 to $14,999 | 348 (3.6%) | 396 (4.7%) |
| $15,000 to $17,499 | 308 (3.2%) | 273 (3.2%) |
| $17,500 to $19,999 | 276 (2.8%) | 181 (2.1%) |
| $20,000 to $22,499 | 437 (4.5%) | 275 (3.3%) |
| $22,500 to $24,999 | 89 (0.9%) | 290 (3.4%) |
| $25,000 to $29,999 | 469 (4.8%) | 644 (7.6%) |
| $30,000 to $34,999 | 638 (6.5%) | 300 (3.5%) |
| $35,000 to $39,999 | 451 (4.6%) | 480 (5.7%) |
| $40,000 to $44,999 | 393 (4.0%) | 561 (6.7%) |
| $45,000 to $49,999 | 547 (5.6%) | 374 (4.4%) |
| $50,000 to $54,999 | 441 (4.5%) | 382 (4.5%) |
| $55,000 to $64,999 | 754 (7.7%) | 596 (7.1%) |
| $65,000 to $74,999 | 489 (5.0%) | 360 (4.3%) |
| $75,000 to $99,999 | 1,198 (12.2%) | 370 (4.4%) |
| $100,000+ | 811 (8.3%) | 368 (4.4%) |
| Total | 9,788 (100.0%) | 8,441 (100.0%) |
Earnings by Sex by Educational Attainment in Ellis County
Average earnings in Ellis County are $51,222 for men and $40,786 for women, a difference of 20.4%. Men with an educational attainment of bachelor's degree enjoy the highest average annual earnings of $60,968, while those with less than high school education earn the least with $27,361. Women with an educational attainment of graduate degree earn the most with the average annual earnings of $60,383, while those with high school diploma education have the smallest earnings of $25,913.
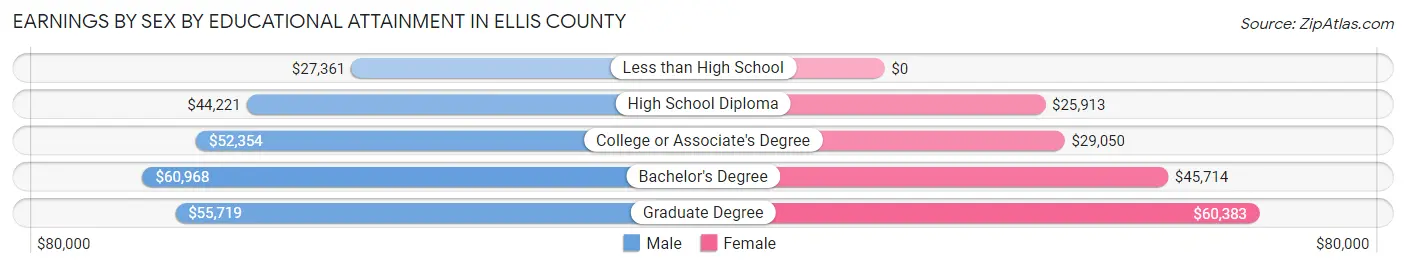
| Educational Attainment | Male Income | Female Income |
| Less than High School | $27,361 | $0 |
| High School Diploma | $44,221 | $25,913 |
| College or Associate's Degree | $52,354 | $29,050 |
| Bachelor's Degree | $60,968 | $45,714 |
| Graduate Degree | $55,719 | $60,383 |
| Total | $51,222 | $40,786 |
Family Income in Ellis County
Family Income Brackets in Ellis County
According to the Ellis County family income data, there are 1,748 families falling into the $100,000 to $149,999 income range, which is the most common income bracket and makes up 25.7% of all families. Conversely, the $10,000 to $14,999 income bracket is the least frequent group with only 20 families (0.3%) belonging to this category.
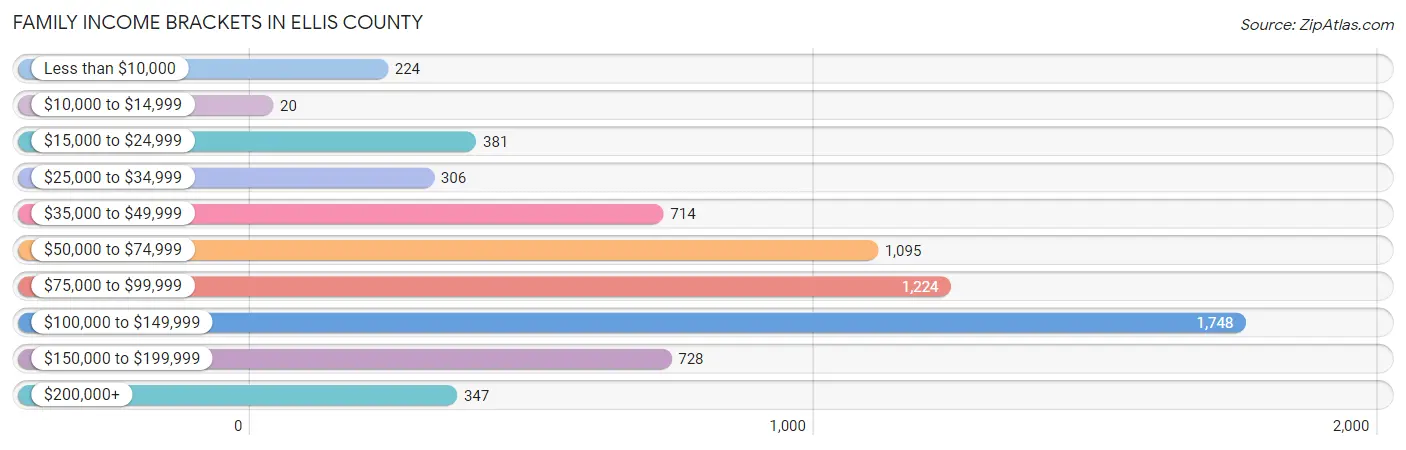
| Income Bracket | # Families | % Families |
| Less than $10,000 | 224 | 3.3% |
| $10,000 to $14,999 | 20 | 0.3% |
| $15,000 to $24,999 | 381 | 5.6% |
| $25,000 to $34,999 | 306 | 4.5% |
| $35,000 to $49,999 | 714 | 10.5% |
| $50,000 to $74,999 | 1,095 | 16.1% |
| $75,000 to $99,999 | 1,224 | 18.0% |
| $100,000 to $149,999 | 1,748 | 25.7% |
| $150,000 to $199,999 | 728 | 10.7% |
| $200,000+ | 347 | 5.1% |
Family Income by Famaliy Size in Ellis County
7+ person families (97 | 1.4%) account for the highest median family income in Ellis County with $104,028 per family, while 2-person families (3,200 | 47.0%) have the highest median income of $37,354 per family member.
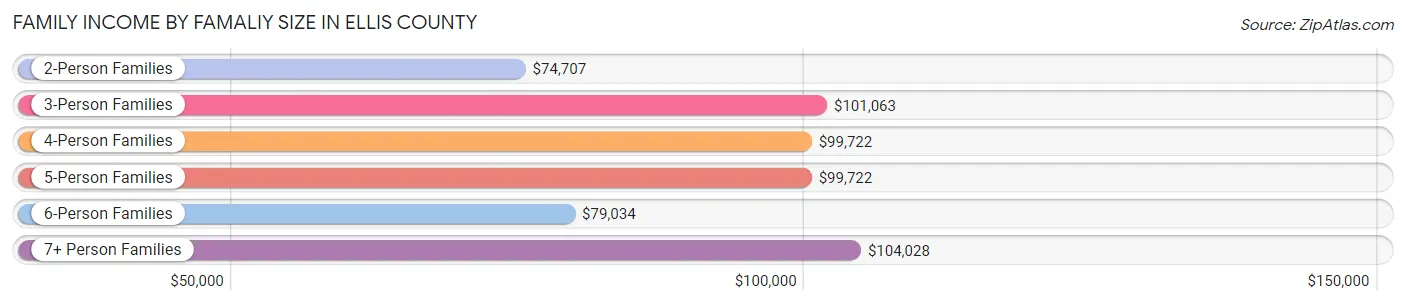
| Income Bracket | # Families | Median Income |
| 2-Person Families | 3,200 (47.0%) | $74,707 |
| 3-Person Families | 1,354 (19.9%) | $101,063 |
| 4-Person Families | 1,270 (18.7%) | $99,722 |
| 5-Person Families | 712 (10.5%) | $99,722 |
| 6-Person Families | 169 (2.5%) | $79,034 |
| 7+ Person Families | 97 (1.4%) | $104,028 |
| Total | 6,802 (100.0%) | $86,484 |
Family Income by Number of Earners in Ellis County
The median family income in Ellis County is $86,484, with families comprising 3+ earners (869) having the highest median family income of $124,519, while families with no earners (690) have the lowest median family income of $41,632, accounting for 12.8% and 10.1% of families, respectively.
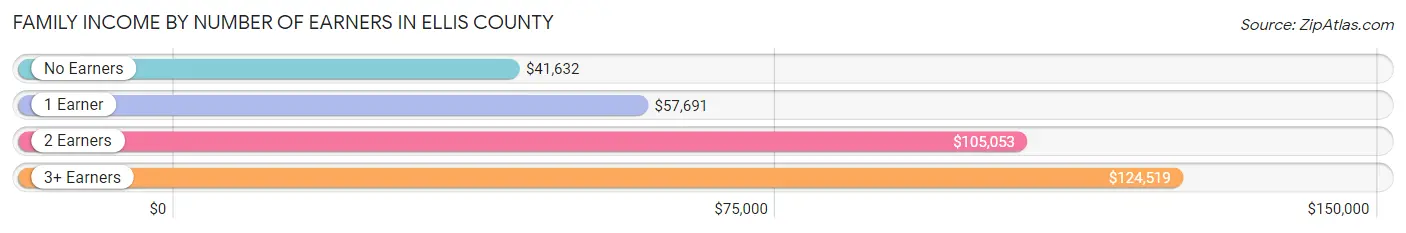
| Number of Earners | # Families | Median Income |
| No Earners | 690 (10.1%) | $41,632 |
| 1 Earner | 2,057 (30.2%) | $57,691 |
| 2 Earners | 3,186 (46.8%) | $105,053 |
| 3+ Earners | 869 (12.8%) | $124,519 |
| Total | 6,802 (100.0%) | $86,484 |
Household Income in Ellis County
Household Income Brackets in Ellis County
With 2,069 households falling in the category, the $100,000 to $149,999 income range is the most frequent in Ellis County, accounting for 17.3% of all households. In contrast, only 526 households (4.4%) fall into the $200,000+ income bracket, making it the least populous group.
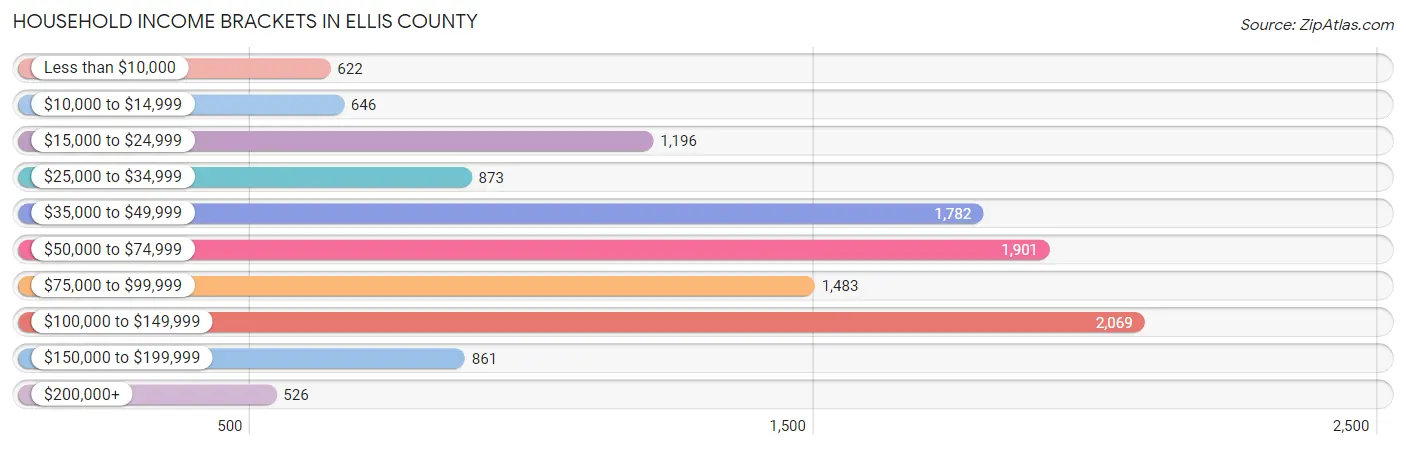
| Income Bracket | # Households | % Households |
| Less than $10,000 | 622 | 5.2% |
| $10,000 to $14,999 | 646 | 5.4% |
| $15,000 to $24,999 | 1,196 | 10.0% |
| $25,000 to $34,999 | 873 | 7.3% |
| $35,000 to $49,999 | 1,782 | 14.9% |
| $50,000 to $74,999 | 1,901 | 15.9% |
| $75,000 to $99,999 | 1,483 | 12.4% |
| $100,000 to $149,999 | 2,069 | 17.3% |
| $150,000 to $199,999 | 861 | 7.2% |
| $200,000+ | 526 | 4.4% |
Household Income by Householder Age in Ellis County
The median household income in Ellis County is $59,665, with the highest median household income of $84,275 found in the 25 to 44 years age bracket for the primary householder. A total of 3,947 households (33.0%) fall into this category. Meanwhile, the 15 to 24 years age bracket for the primary householder has the lowest median household income of $35,187, with 1,626 households (13.6%) in this group.
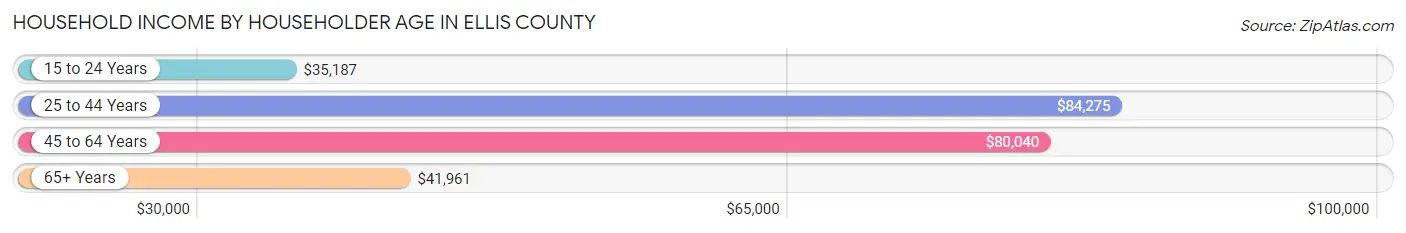
| Income Bracket | # Households | Median Income |
| 15 to 24 Years | 1,626 (13.6%) | $35,187 |
| 25 to 44 Years | 3,947 (33.0%) | $84,275 |
| 45 to 64 Years | 3,460 (28.9%) | $80,040 |
| 65+ Years | 2,925 (24.5%) | $41,961 |
| Total | 11,958 (100.0%) | $59,665 |
Poverty in Ellis County
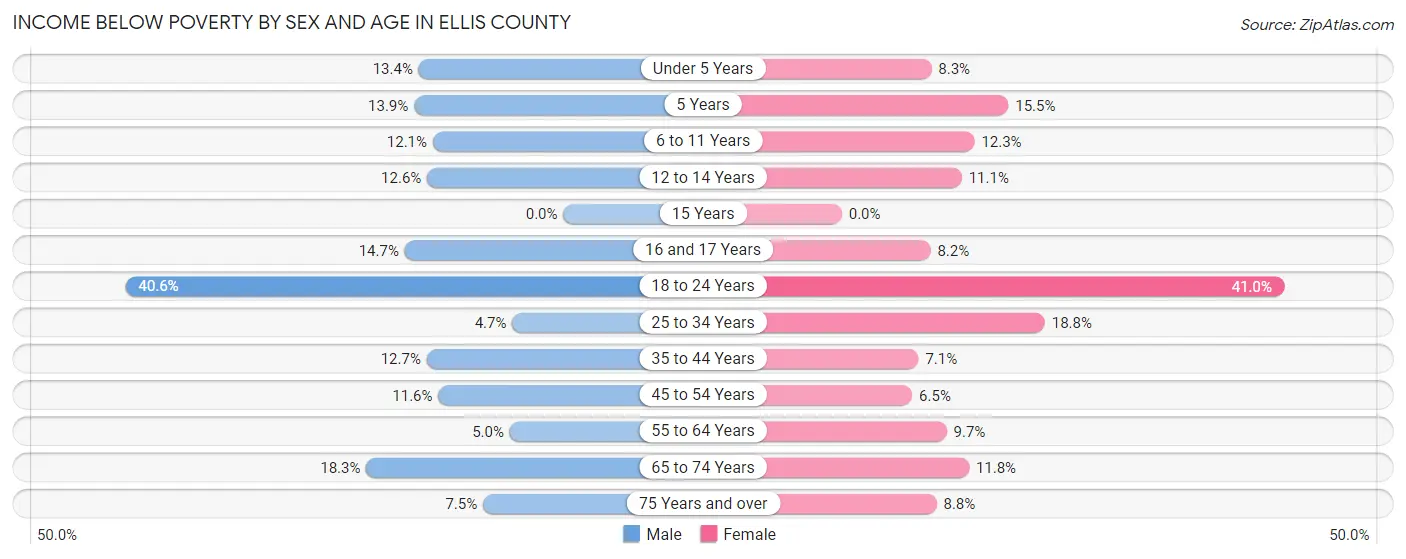
Income Below Poverty by Sex and Age in Ellis County
With 14.9% poverty level for males and 15.7% for females among the residents of Ellis County, 18 to 24 year old males and 18 to 24 year old females are the most vulnerable to poverty, with 886 males (40.6%) and 941 females (41.0%) in their respective age groups living below the poverty level.
| Age Bracket | Male | Female |
| Under 5 Years | 100 (13.4%) | 66 (8.3%) |
| 5 Years | 18 (13.9%) | 17 (15.4%) |
| 6 to 11 Years | 124 (12.1%) | 124 (12.3%) |
| 12 to 14 Years | 78 (12.6%) | 66 (11.1%) |
| 15 Years | 0 (0.0%) | 0 (0.0%) |
| 16 and 17 Years | 24 (14.7%) | 26 (8.2%) |
| 18 to 24 Years | 886 (40.6%) | 941 (41.0%) |
| 25 to 34 Years | 98 (4.7%) | 325 (18.8%) |
| 35 to 44 Years | 205 (12.7%) | 125 (7.1%) |
| 45 to 54 Years | 166 (11.6%) | 83 (6.5%) |
| 55 to 64 Years | 77 (5.0%) | 153 (9.7%) |
| 65 to 74 Years | 231 (18.3%) | 152 (11.8%) |
| 75 Years and over | 53 (7.4%) | 85 (8.8%) |
| Total | 2,060 (14.9%) | 2,163 (15.7%) |
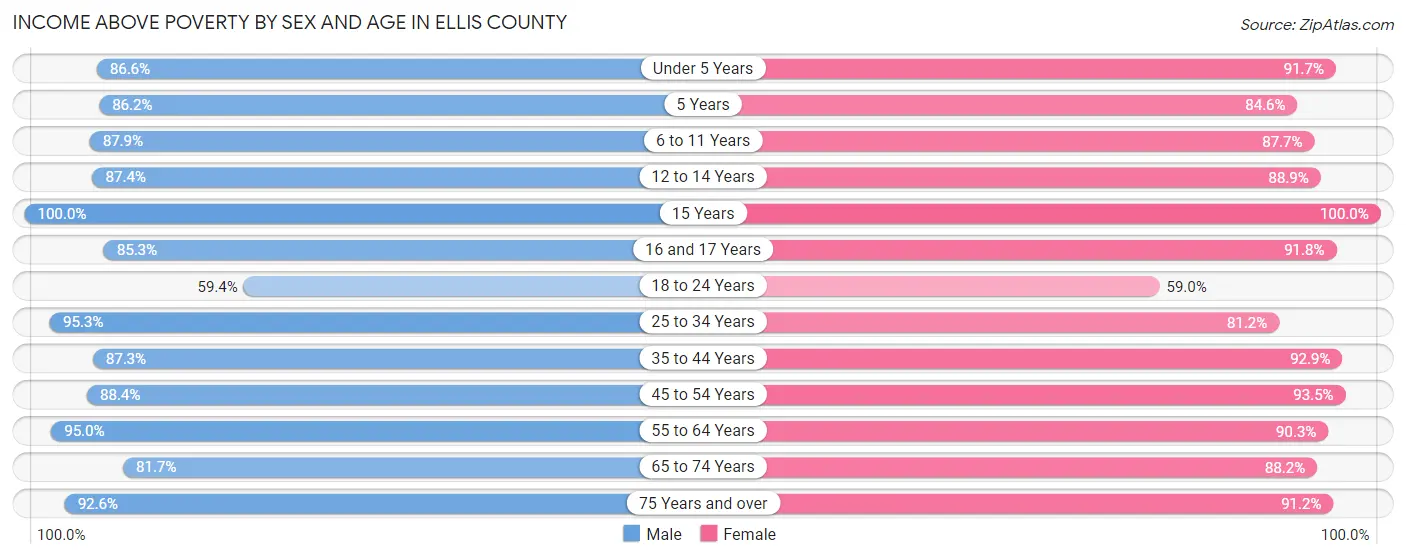
Income Above Poverty by Sex and Age in Ellis County
According to the poverty statistics in Ellis County, males aged 15 years and females aged 15 years are the age groups that are most secure financially, with 100.0% of males and 100.0% of females in these age groups living above the poverty line.
| Age Bracket | Male | Female |
| Under 5 Years | 645 (86.6%) | 728 (91.7%) |
| 5 Years | 112 (86.2%) | 93 (84.6%) |
| 6 to 11 Years | 900 (87.9%) | 883 (87.7%) |
| 12 to 14 Years | 539 (87.4%) | 527 (88.9%) |
| 15 Years | 309 (100.0%) | 119 (100.0%) |
| 16 and 17 Years | 139 (85.3%) | 290 (91.8%) |
| 18 to 24 Years | 1,294 (59.4%) | 1,353 (59.0%) |
| 25 to 34 Years | 1,969 (95.3%) | 1,400 (81.2%) |
| 35 to 44 Years | 1,412 (87.3%) | 1,631 (92.9%) |
| 45 to 54 Years | 1,265 (88.4%) | 1,189 (93.5%) |
| 55 to 64 Years | 1,471 (95.0%) | 1,420 (90.3%) |
| 65 to 74 Years | 1,032 (81.7%) | 1,136 (88.2%) |
| 75 Years and over | 658 (92.5%) | 882 (91.2%) |
| Total | 11,745 (85.1%) | 11,651 (84.3%) |
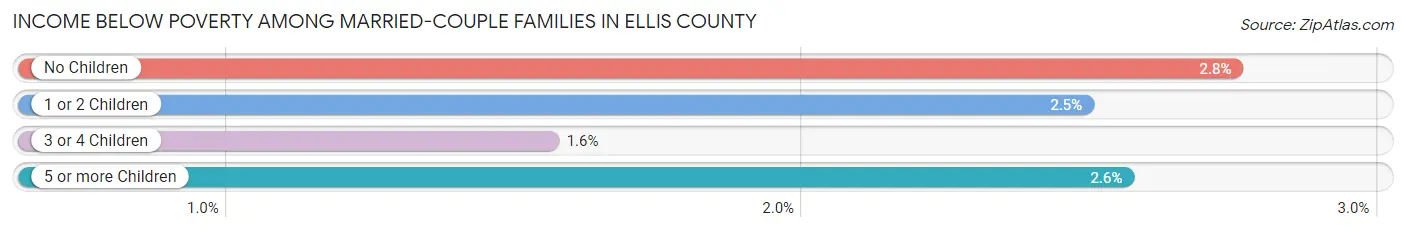
Income Below Poverty Among Married-Couple Families in Ellis County
The poverty statistics for married-couple families in Ellis County show that 2.5% or 140 of the total 5,546 families live below the poverty line. Families with no children have the highest poverty rate of 2.8%, comprising of 83 families. On the other hand, families with 3 or 4 children have the lowest poverty rate of 1.6%, which includes 10 families.
| Children | Above Poverty | Below Poverty |
| No Children | 2,939 (97.3%) | 83 (2.8%) |
| 1 or 2 Children | 1,762 (97.5%) | 45 (2.5%) |
| 3 or 4 Children | 629 (98.4%) | 10 (1.6%) |
| 5 or more Children | 76 (97.4%) | 2 (2.6%) |
| Total | 5,406 (97.5%) | 140 (2.5%) |
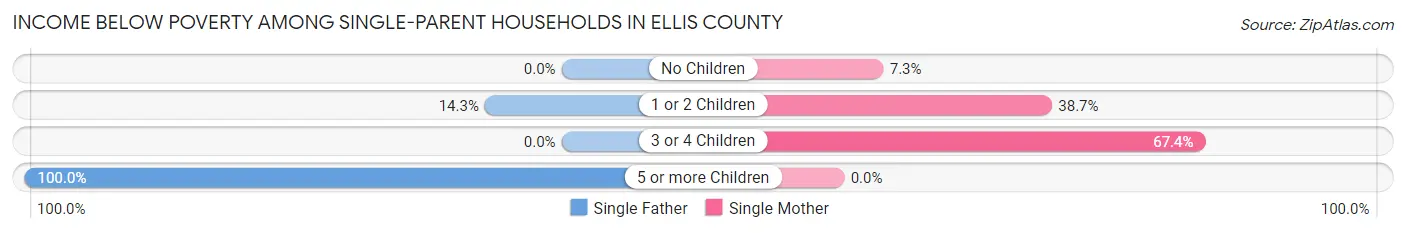
Income Below Poverty Among Single-Parent Households in Ellis County
According to the poverty data in Ellis County, 14.3% or 36 single-father households and 36.5% or 367 single-mother households are living below the poverty line. Among single-father households, those with 5 or more children have the highest poverty rate, with 19 households (100.0%) experiencing poverty. Likewise, among single-mother households, those with 3 or 4 children have the highest poverty rate, with 132 households (67.3%) falling below the poverty line.
| Children | Single Father | Single Mother |
| No Children | 0 (0.0%) | 18 (7.3%) |
| 1 or 2 Children | 17 (14.3%) | 217 (38.7%) |
| 3 or 4 Children | 0 (0.0%) | 132 (67.3%) |
| 5 or more Children | 19 (100.0%) | 0 (0.0%) |
| Total | 36 (14.3%) | 367 (36.5%) |
Income Below Poverty Among Married-Couple vs Single-Parent Households in Ellis County
The poverty data for Ellis County shows that 140 of the married-couple family households (2.5%) and 403 of the single-parent households (32.1%) are living below the poverty level. Within the married-couple family households, those with no children have the highest poverty rate, with 83 households (2.8%) falling below the poverty line. Among the single-parent households, those with 5 or more children have the highest poverty rate, with 19 household (100.0%) living below poverty.
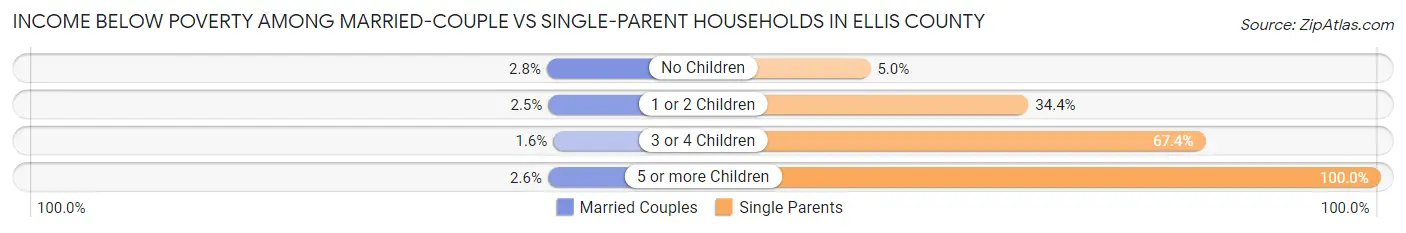
| Children | Married-Couple Families | Single-Parent Households |
| No Children | 83 (2.8%) | 18 (5.0%) |
| 1 or 2 Children | 45 (2.5%) | 234 (34.4%) |
| 3 or 4 Children | 10 (1.6%) | 132 (67.3%) |
| 5 or more Children | 2 (2.6%) | 19 (100.0%) |
| Total | 140 (2.5%) | 403 (32.1%) |
Employment Characteristics in Ellis County
Employment by Class of Employer in Ellis County
Among the 16,473 employed individuals in Ellis County, private company employees (9,485 | 57.6%), not-for-profit organizations (1,998 | 12.1%), and state government employees (1,872 | 11.4%) make up the most common classes of employment.
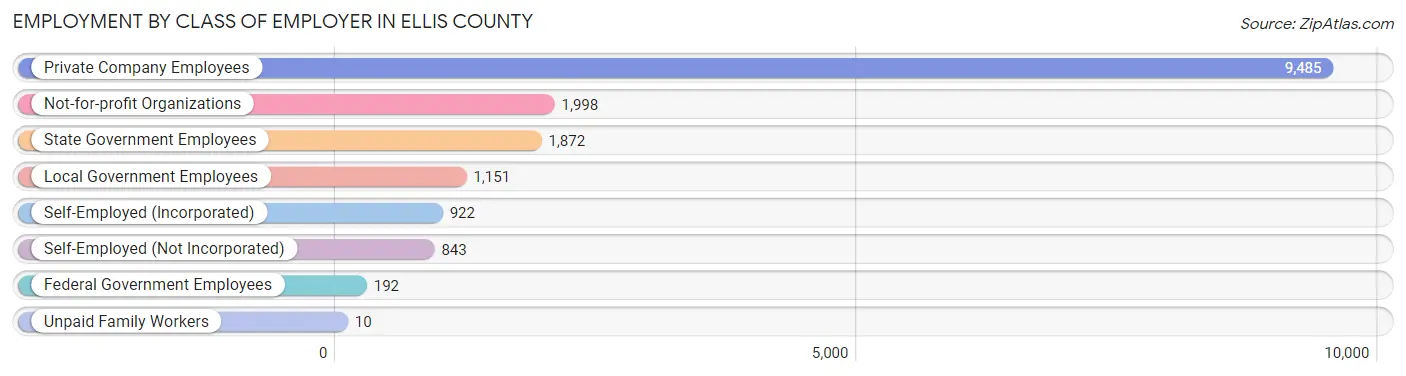
| Employer Class | # Employees | % Employees |
| Private Company Employees | 9,485 | 57.6% |
| Self-Employed (Incorporated) | 922 | 5.6% |
| Self-Employed (Not Incorporated) | 843 | 5.1% |
| Not-for-profit Organizations | 1,998 | 12.1% |
| Local Government Employees | 1,151 | 7.0% |
| State Government Employees | 1,872 | 11.4% |
| Federal Government Employees | 192 | 1.2% |
| Unpaid Family Workers | 10 | 0.1% |
| Total | 16,473 | 100.0% |
Employment Status by Age in Ellis County
According to the labor force statistics for Ellis County, out of the total population over 16 years of age (23,473), 73.7% or 17,300 individuals are in the labor force, with 3.3% or 571 of them unemployed. The age group with the highest labor force participation rate is 25 to 29 years, with 94.9% or 1,776 individuals in the labor force. Within the labor force, the 65 to 74 years age range has the highest percentage of unemployed individuals, with 14.1% or 109 of them being unemployed.
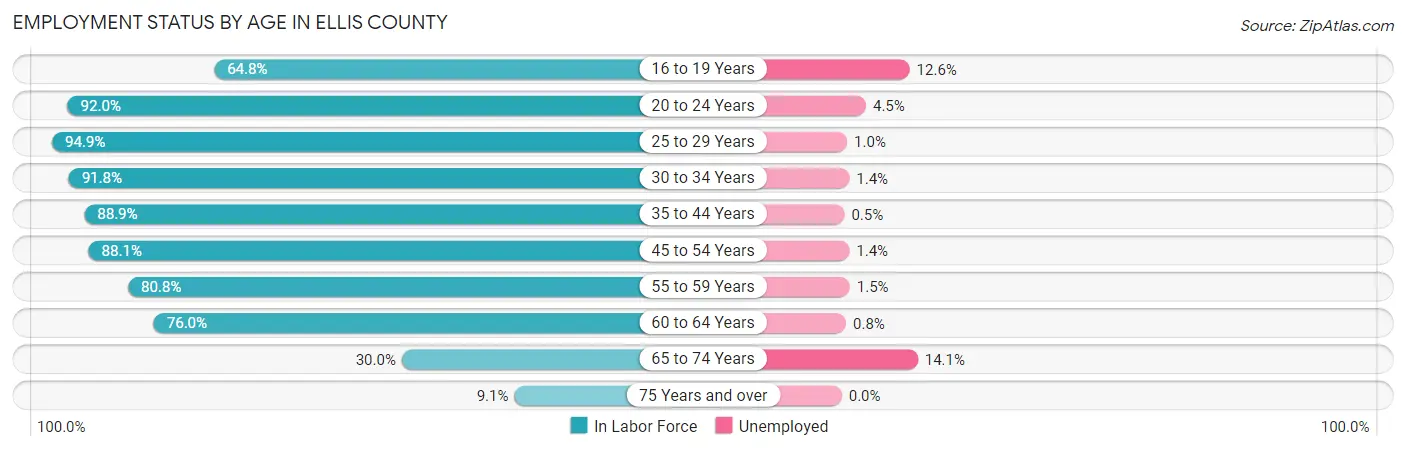
| Age Bracket | In Labor Force | Unemployed |
| 16 to 19 Years | 1,456 (64.8%) | 183 (12.6%) |
| 20 to 24 Years | 3,494 (92.0%) | 157 (4.5%) |
| 25 to 29 Years | 1,776 (94.9%) | 18 (1.0%) |
| 30 to 34 Years | 1,778 (91.8%) | 25 (1.4%) |
| 35 to 44 Years | 3,008 (88.9%) | 15 (0.5%) |
| 45 to 54 Years | 2,392 (88.1%) | 33 (1.4%) |
| 55 to 59 Years | 1,161 (80.8%) | 17 (1.5%) |
| 60 to 64 Years | 1,294 (76.0%) | 10 (0.8%) |
| 65 to 74 Years | 772 (30.0%) | 109 (14.1%) |
| 75 Years and over | 165 (9.1%) | 0 (0.0%) |
| Total | 17,300 (73.7%) | 571 (3.3%) |
Employment Status by Educational Attainment in Ellis County
According to labor force statistics for Ellis County, 87.5% of individuals (11,416) out of the total population between 25 and 64 years of age (13,047) are in the labor force, with 1.0% or 114 of them being unemployed. The group with the highest labor force participation rate are those with the educational attainment of bachelor's degree or higher, with 94.9% or 5,188 individuals in the labor force. Within the labor force, individuals with less than high school education have the highest percentage of unemployment, with 3.0% or 13 of them being unemployed.
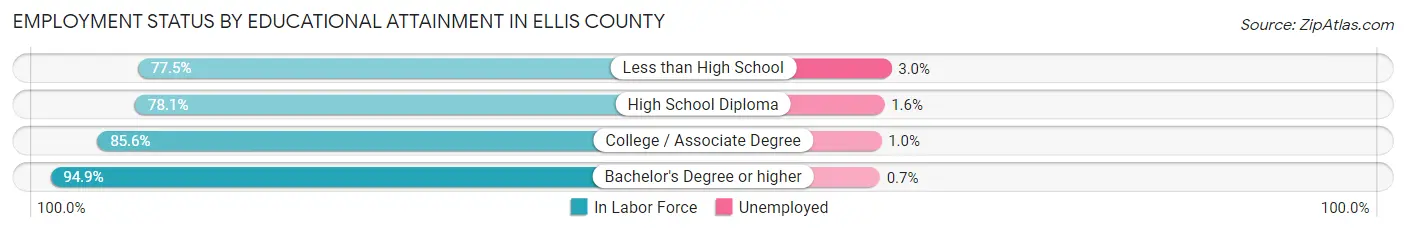
| Educational Attainment | In Labor Force | Unemployed |
| Less than High School | 427 (77.5%) | 17 (3.0%) |
| High School Diploma | 2,302 (78.1%) | 47 (1.6%) |
| College / Associate Degree | 3,494 (85.6%) | 41 (1.0%) |
| Bachelor's Degree or higher | 5,188 (94.9%) | 38 (0.7%) |
| Total | 11,416 (87.5%) | 130 (1.0%) |
Employment Occupations by Sex in Ellis County
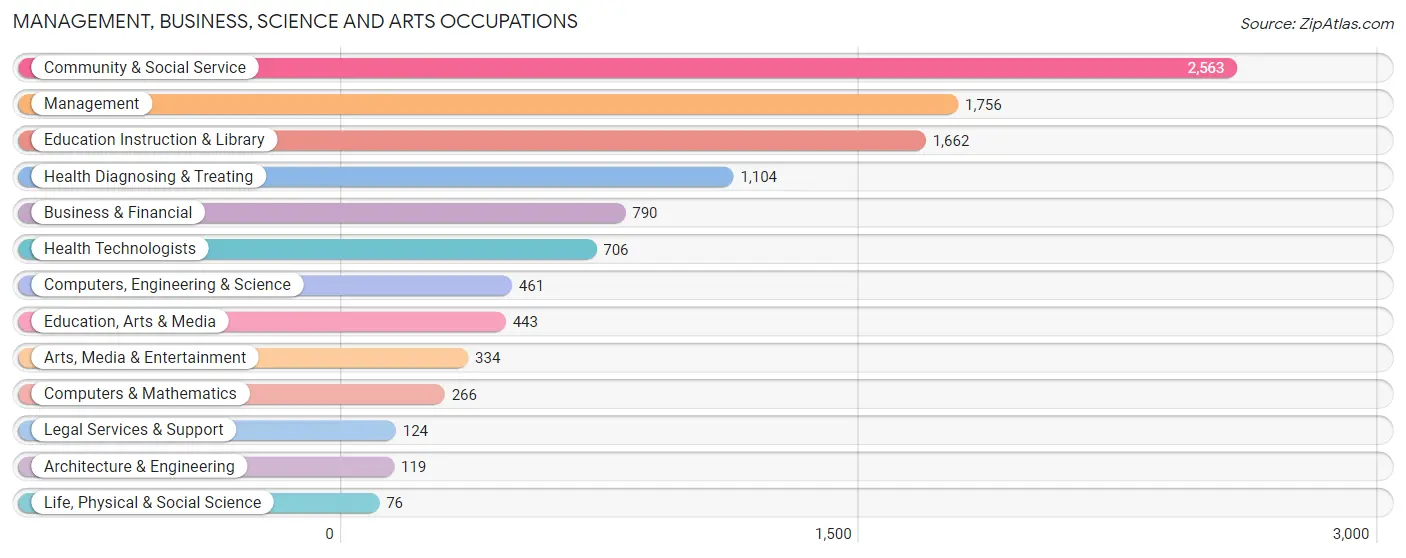
Management, Business, Science and Arts Occupations
The most common Management, Business, Science and Arts occupations in Ellis County are Community & Social Service (2,563 | 15.3%), Management (1,756 | 10.5%), Education Instruction & Library (1,662 | 9.9%), Health Diagnosing & Treating (1,104 | 6.6%), and Business & Financial (790 | 4.7%).
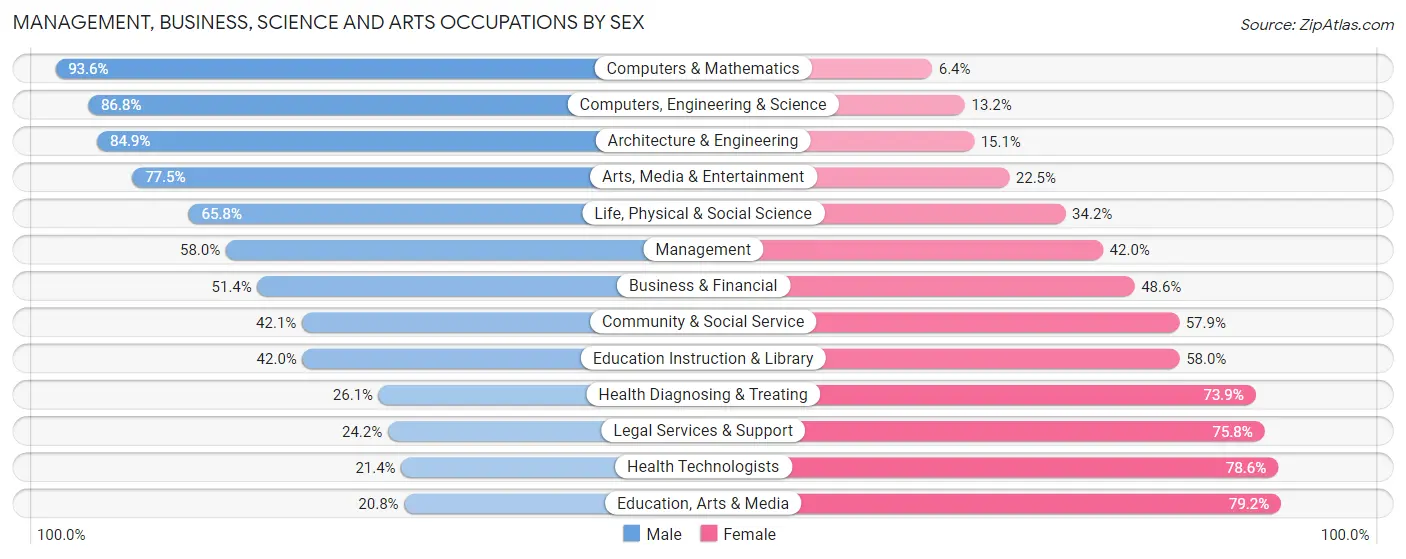
Management, Business, Science and Arts Occupations by Sex
Within the Management, Business, Science and Arts occupations in Ellis County, the most male-oriented occupations are Computers & Mathematics (93.6%), Computers, Engineering & Science (86.8%), and Architecture & Engineering (84.9%), while the most female-oriented occupations are Education, Arts & Media (79.2%), Health Technologists (78.6%), and Legal Services & Support (75.8%).
| Occupation | Male | Female |
| Management | 1,018 (58.0%) | 738 (42.0%) |
| Business & Financial | 406 (51.4%) | 384 (48.6%) |
| Computers, Engineering & Science | 400 (86.8%) | 61 (13.2%) |
| Computers & Mathematics | 249 (93.6%) | 17 (6.4%) |
| Architecture & Engineering | 101 (84.9%) | 18 (15.1%) |
| Life, Physical & Social Science | 50 (65.8%) | 26 (34.2%) |
| Community & Social Service | 1,079 (42.1%) | 1,484 (57.9%) |
| Education, Arts & Media | 92 (20.8%) | 351 (79.2%) |
| Legal Services & Support | 30 (24.2%) | 94 (75.8%) |
| Education Instruction & Library | 698 (42.0%) | 964 (58.0%) |
| Arts, Media & Entertainment | 259 (77.5%) | 75 (22.5%) |
| Health Diagnosing & Treating | 288 (26.1%) | 816 (73.9%) |
| Health Technologists | 151 (21.4%) | 555 (78.6%) |
| Total (Category) | 3,191 (47.8%) | 3,483 (52.2%) |
| Total (Overall) | 8,963 (53.6%) | 7,756 (46.4%) |
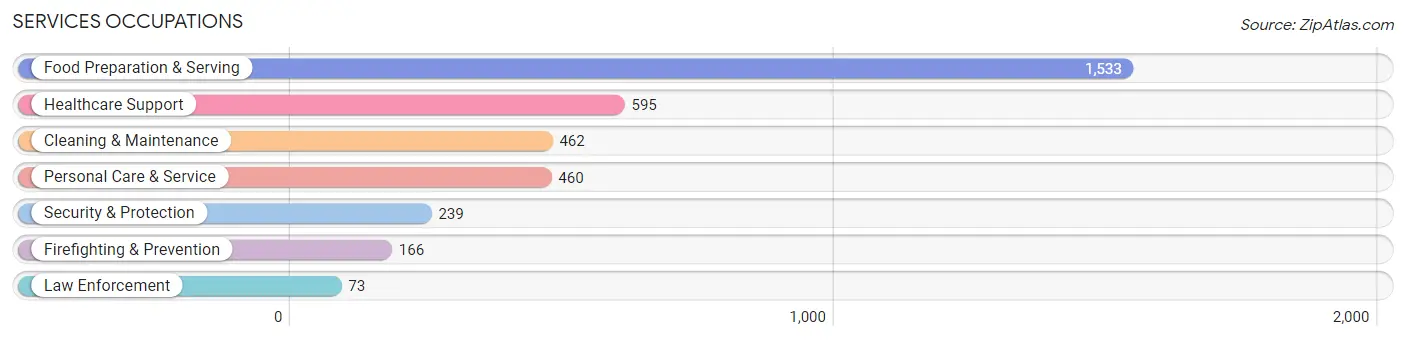
Services Occupations
The most common Services occupations in Ellis County are Food Preparation & Serving (1,533 | 9.2%), Healthcare Support (595 | 3.6%), Cleaning & Maintenance (462 | 2.8%), Personal Care & Service (460 | 2.8%), and Security & Protection (239 | 1.4%).
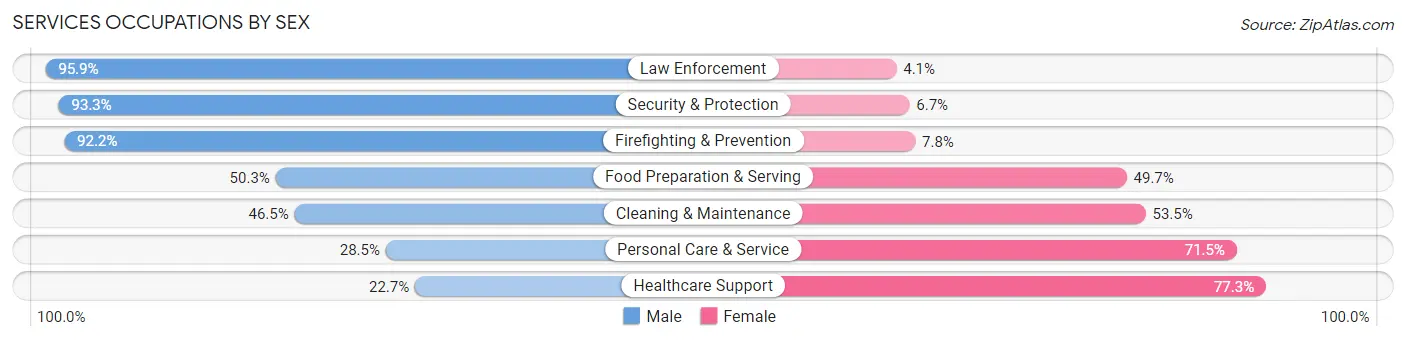
Services Occupations by Sex
Within the Services occupations in Ellis County, the most male-oriented occupations are Law Enforcement (95.9%), Security & Protection (93.3%), and Firefighting & Prevention (92.2%), while the most female-oriented occupations are Healthcare Support (77.3%), Personal Care & Service (71.5%), and Cleaning & Maintenance (53.5%).
| Occupation | Male | Female |
| Healthcare Support | 135 (22.7%) | 460 (77.3%) |
| Security & Protection | 223 (93.3%) | 16 (6.7%) |
| Firefighting & Prevention | 153 (92.2%) | 13 (7.8%) |
| Law Enforcement | 70 (95.9%) | 3 (4.1%) |
| Food Preparation & Serving | 771 (50.3%) | 762 (49.7%) |
| Cleaning & Maintenance | 215 (46.5%) | 247 (53.5%) |
| Personal Care & Service | 131 (28.5%) | 329 (71.5%) |
| Total (Category) | 1,475 (44.9%) | 1,814 (55.1%) |
| Total (Overall) | 8,963 (53.6%) | 7,756 (46.4%) |
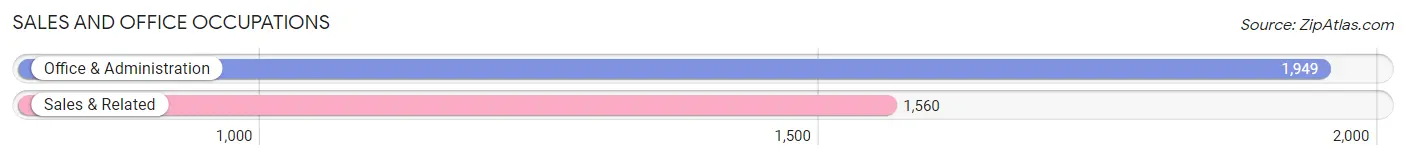
Sales and Office Occupations
The most common Sales and Office occupations in Ellis County are Office & Administration (1,949 | 11.7%), and Sales & Related (1,560 | 9.3%).
Sales and Office Occupations by Sex
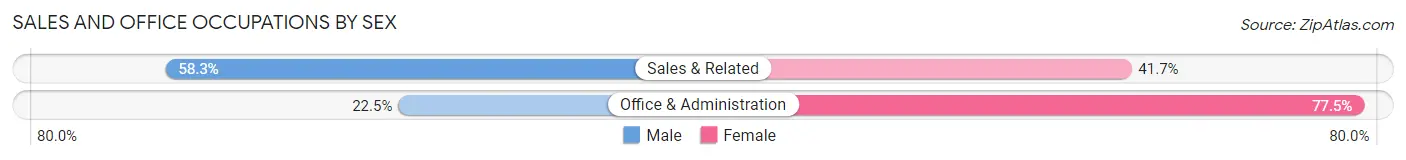
| Occupation | Male | Female |
| Sales & Related | 910 (58.3%) | 650 (41.7%) |
| Office & Administration | 439 (22.5%) | 1,510 (77.5%) |
| Total (Category) | 1,349 (38.4%) | 2,160 (61.6%) |
| Total (Overall) | 8,963 (53.6%) | 7,756 (46.4%) |
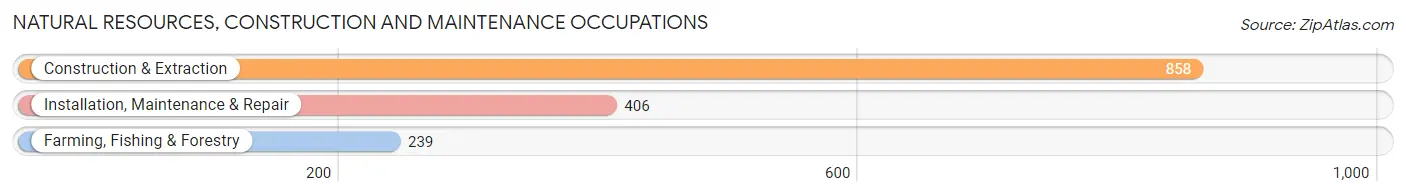
Natural Resources, Construction and Maintenance Occupations
The most common Natural Resources, Construction and Maintenance occupations in Ellis County are Construction & Extraction (858 | 5.1%), Installation, Maintenance & Repair (406 | 2.4%), and Farming, Fishing & Forestry (239 | 1.4%).
Natural Resources, Construction and Maintenance Occupations by Sex
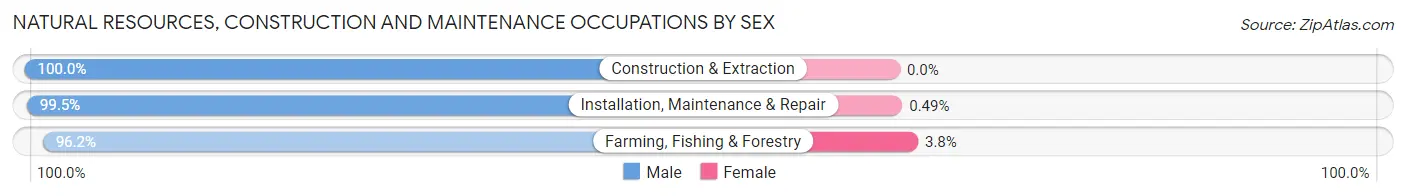
| Occupation | Male | Female |
| Farming, Fishing & Forestry | 230 (96.2%) | 9 (3.8%) |
| Construction & Extraction | 858 (100.0%) | 0 (0.0%) |
| Installation, Maintenance & Repair | 404 (99.5%) | 2 (0.5%) |
| Total (Category) | 1,492 (99.3%) | 11 (0.7%) |
| Total (Overall) | 8,963 (53.6%) | 7,756 (46.4%) |
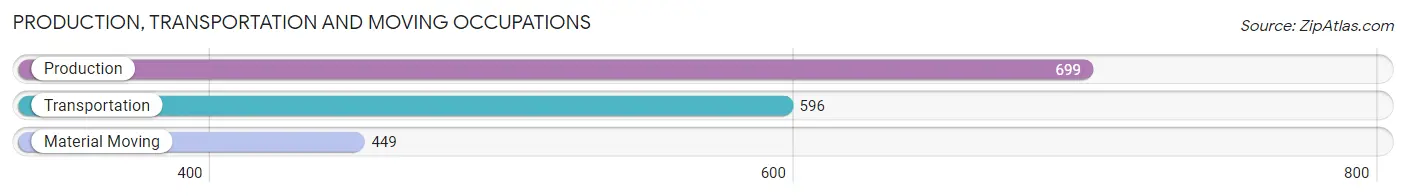
Production, Transportation and Moving Occupations
The most common Production, Transportation and Moving occupations in Ellis County are Production (699 | 4.2%), Transportation (596 | 3.6%), and Material Moving (449 | 2.7%).
Production, Transportation and Moving Occupations by Sex
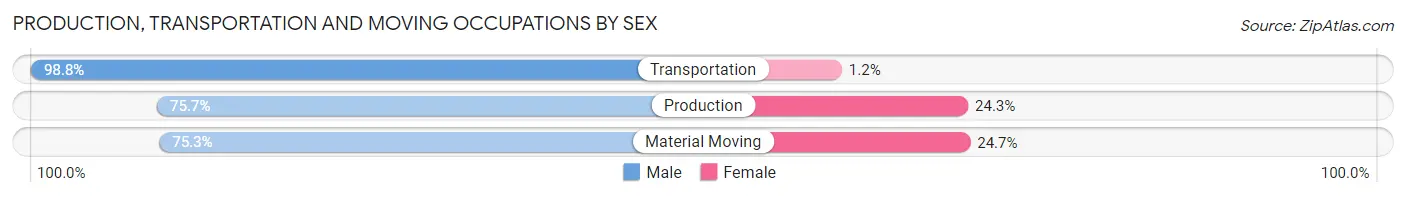
| Occupation | Male | Female |
| Production | 529 (75.7%) | 170 (24.3%) |
| Transportation | 589 (98.8%) | 7 (1.2%) |
| Material Moving | 338 (75.3%) | 111 (24.7%) |
| Total (Category) | 1,456 (83.5%) | 288 (16.5%) |
| Total (Overall) | 8,963 (53.6%) | 7,756 (46.4%) |
Employment Industries by Sex in Ellis County
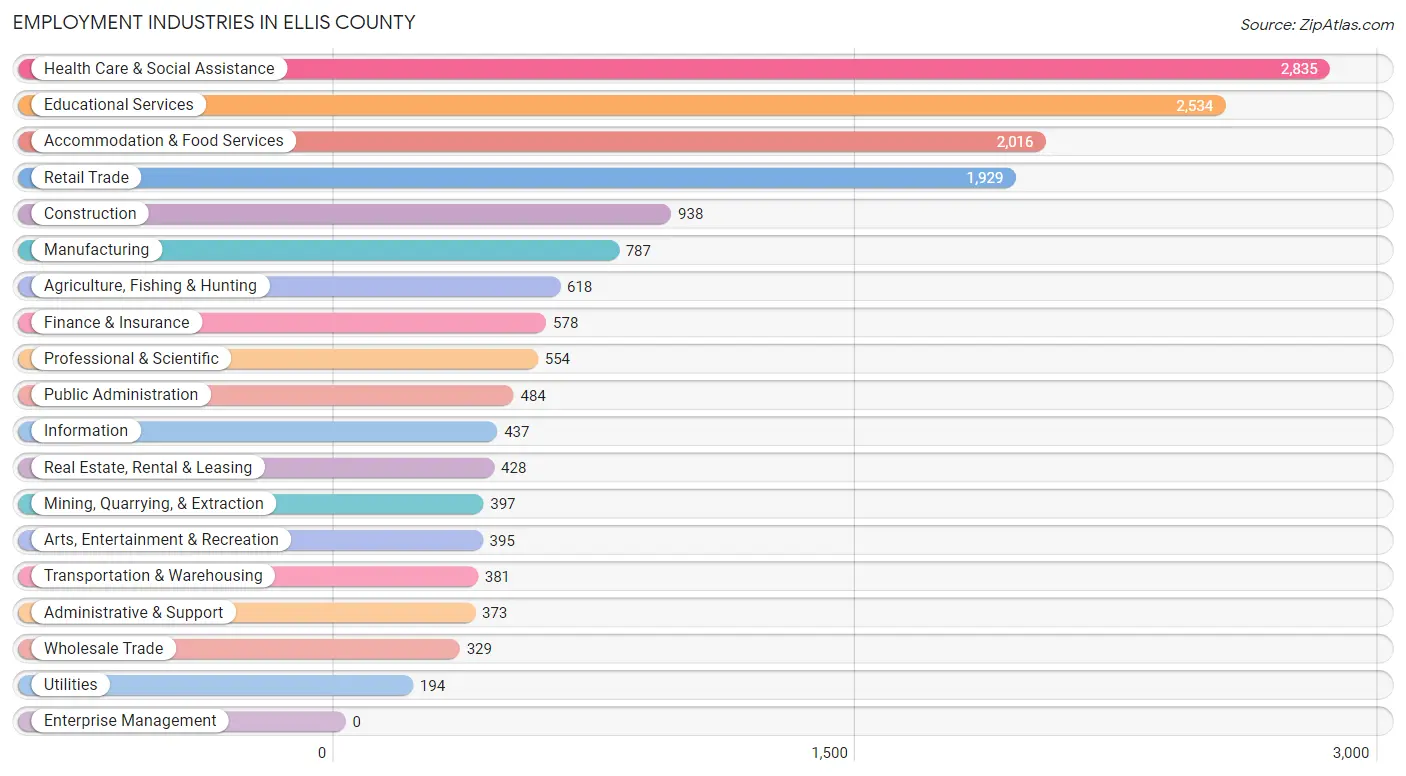
Employment Industries in Ellis County
The major employment industries in Ellis County include Health Care & Social Assistance (2,835 | 17.0%), Educational Services (2,534 | 15.2%), Accommodation & Food Services (2,016 | 12.1%), Retail Trade (1,929 | 11.5%), and Construction (938 | 5.6%).
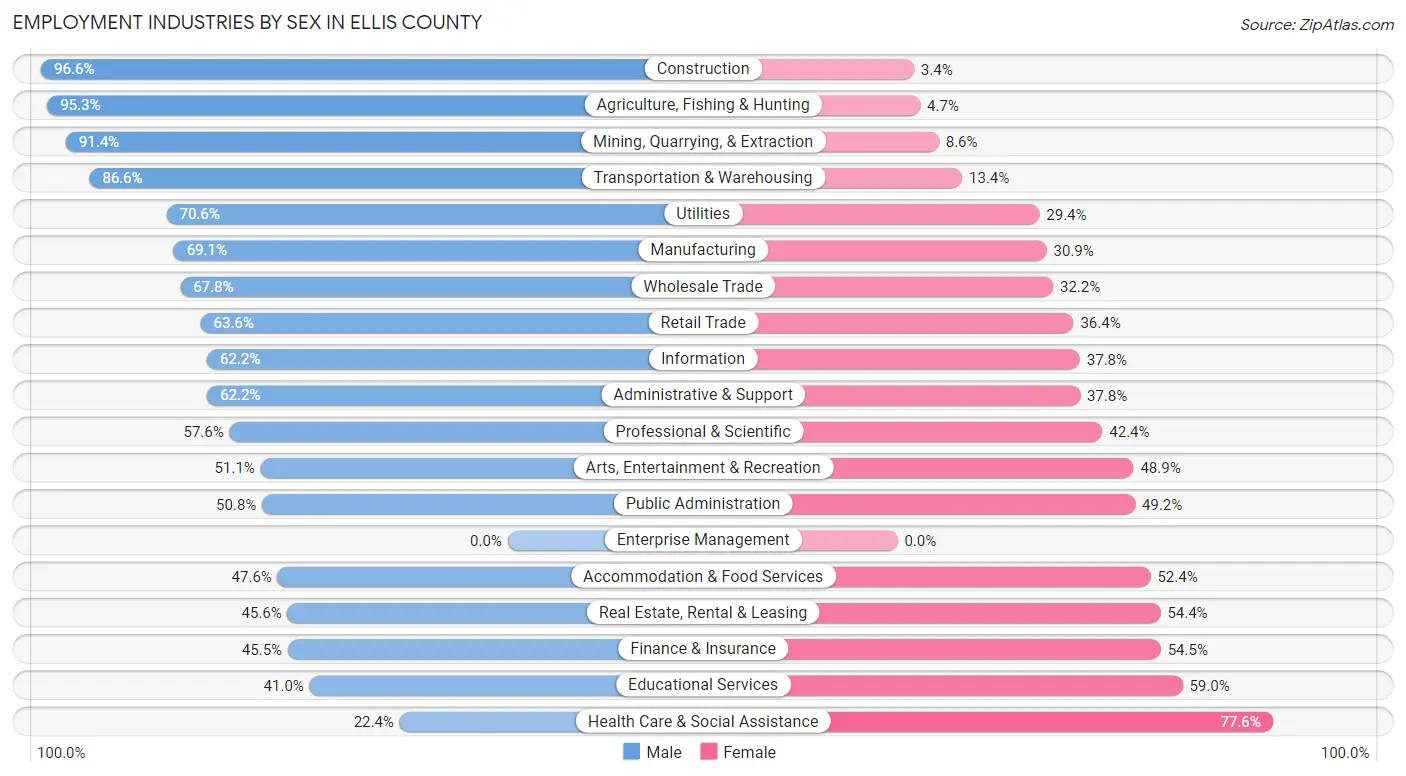
Employment Industries by Sex in Ellis County
The Ellis County industries that see more men than women are Construction (96.6%), Agriculture, Fishing & Hunting (95.3%), and Mining, Quarrying, & Extraction (91.4%), whereas the industries that tend to have a higher number of women are Health Care & Social Assistance (77.6%), Educational Services (59.0%), and Finance & Insurance (54.5%).
| Industry | Male | Female |
| Agriculture, Fishing & Hunting | 589 (95.3%) | 29 (4.7%) |
| Mining, Quarrying, & Extraction | 363 (91.4%) | 34 (8.6%) |
| Construction | 906 (96.6%) | 32 (3.4%) |
| Manufacturing | 544 (69.1%) | 243 (30.9%) |
| Wholesale Trade | 223 (67.8%) | 106 (32.2%) |
| Retail Trade | 1,226 (63.6%) | 703 (36.4%) |
| Transportation & Warehousing | 330 (86.6%) | 51 (13.4%) |
| Utilities | 137 (70.6%) | 57 (29.4%) |
| Information | 272 (62.2%) | 165 (37.8%) |
| Finance & Insurance | 263 (45.5%) | 315 (54.5%) |
| Real Estate, Rental & Leasing | 195 (45.6%) | 233 (54.4%) |
| Professional & Scientific | 319 (57.6%) | 235 (42.4%) |
| Enterprise Management | 0 (0.0%) | 0 (0.0%) |
| Administrative & Support | 232 (62.2%) | 141 (37.8%) |
| Educational Services | 1,039 (41.0%) | 1,495 (59.0%) |
| Health Care & Social Assistance | 634 (22.4%) | 2,201 (77.6%) |
| Arts, Entertainment & Recreation | 202 (51.1%) | 193 (48.9%) |
| Accommodation & Food Services | 960 (47.6%) | 1,056 (52.4%) |
| Public Administration | 246 (50.8%) | 238 (49.2%) |
| Total | 8,963 (53.6%) | 7,756 (46.4%) |
Education in Ellis County
School Enrollment in Ellis County
The most common levels of schooling among the 9,539 students in Ellis County are college / undergraduate (3,801 | 39.9%), high school (1,535 | 16.1%), and middle school (1,492 | 15.6%).
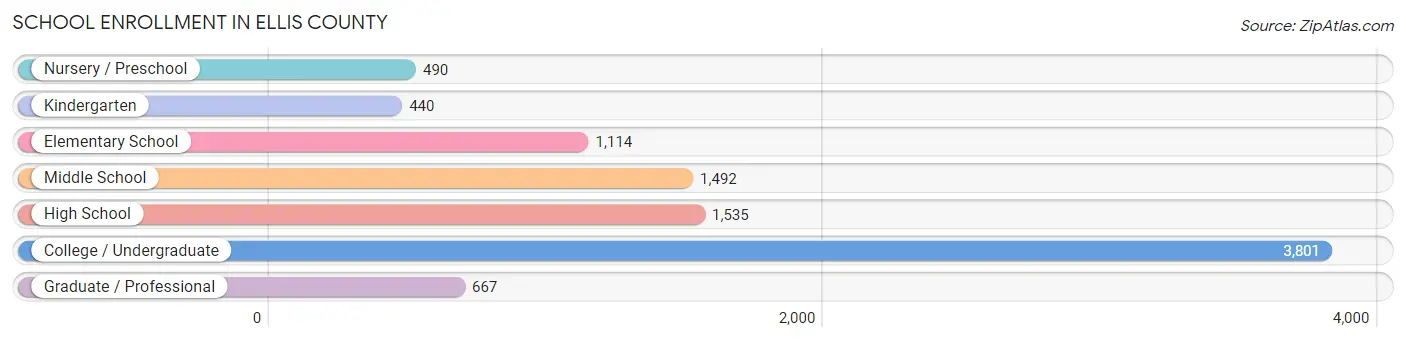
| School Level | # Students | % Students |
| Nursery / Preschool | 490 | 5.1% |
| Kindergarten | 440 | 4.6% |
| Elementary School | 1,114 | 11.7% |
| Middle School | 1,492 | 15.6% |
| High School | 1,535 | 16.1% |
| College / Undergraduate | 3,801 | 39.9% |
| Graduate / Professional | 667 | 7.0% |
| Total | 9,539 | 100.0% |
School Enrollment by Age by Funding Source in Ellis County
Out of a total of 9,539 students who are enrolled in schools in Ellis County, 1,402 (14.7%) attend a private institution, while the remaining 8,137 (85.3%) are enrolled in public schools. The age group of 3 to 4 year olds has the highest likelihood of being enrolled in private schools, with 149 (40.3% in the age bracket) enrolled. Conversely, the age group of 20 to 24 year olds has the lowest likelihood of being enrolled in a private school, with 2,463 (100.0% in the age bracket) attending a public institution.
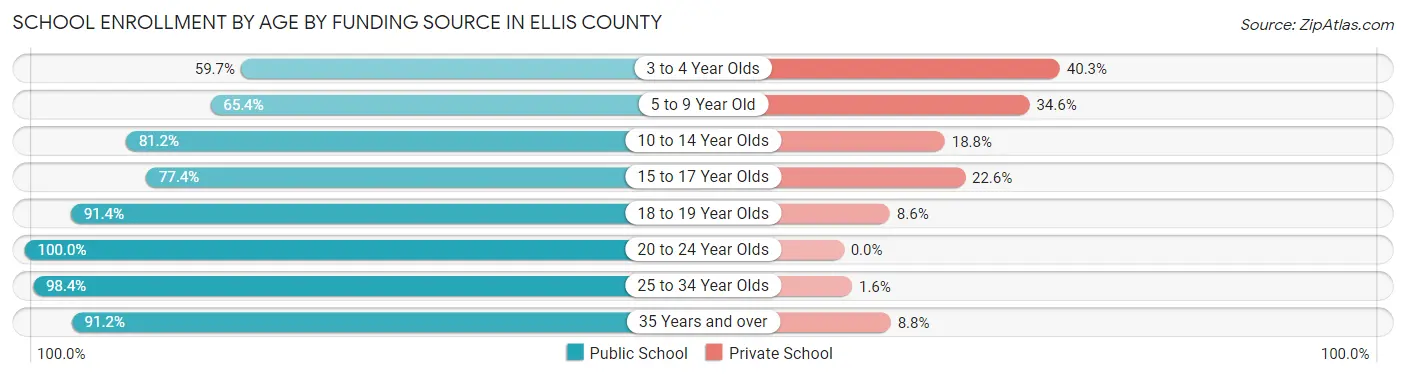
| Age Bracket | Public School | Private School |
| 3 to 4 Year Olds | 221 (59.7%) | 149 (40.3%) |
| 5 to 9 Year Old | 971 (65.4%) | 514 (34.6%) |
| 10 to 14 Year Olds | 1,577 (81.2%) | 366 (18.8%) |
| 15 to 17 Year Olds | 702 (77.4%) | 205 (22.6%) |
| 18 to 19 Year Olds | 1,401 (91.4%) | 132 (8.6%) |
| 20 to 24 Year Olds | 2,463 (100.0%) | 0 (0.0%) |
| 25 to 34 Year Olds | 443 (98.4%) | 7 (1.6%) |
| 35 Years and over | 354 (91.2%) | 34 (8.8%) |
| Total | 8,137 (85.3%) | 1,402 (14.7%) |
Educational Attainment by Field of Study in Ellis County
Business (1,420 | 19.6%), education (1,058 | 14.6%), science & technology (870 | 12.0%), bio, nature & agricultural (665 | 9.2%), and arts & humanities (562 | 7.7%) are the most common fields of study among 7,258 individuals in Ellis County who have obtained a bachelor's degree or higher.
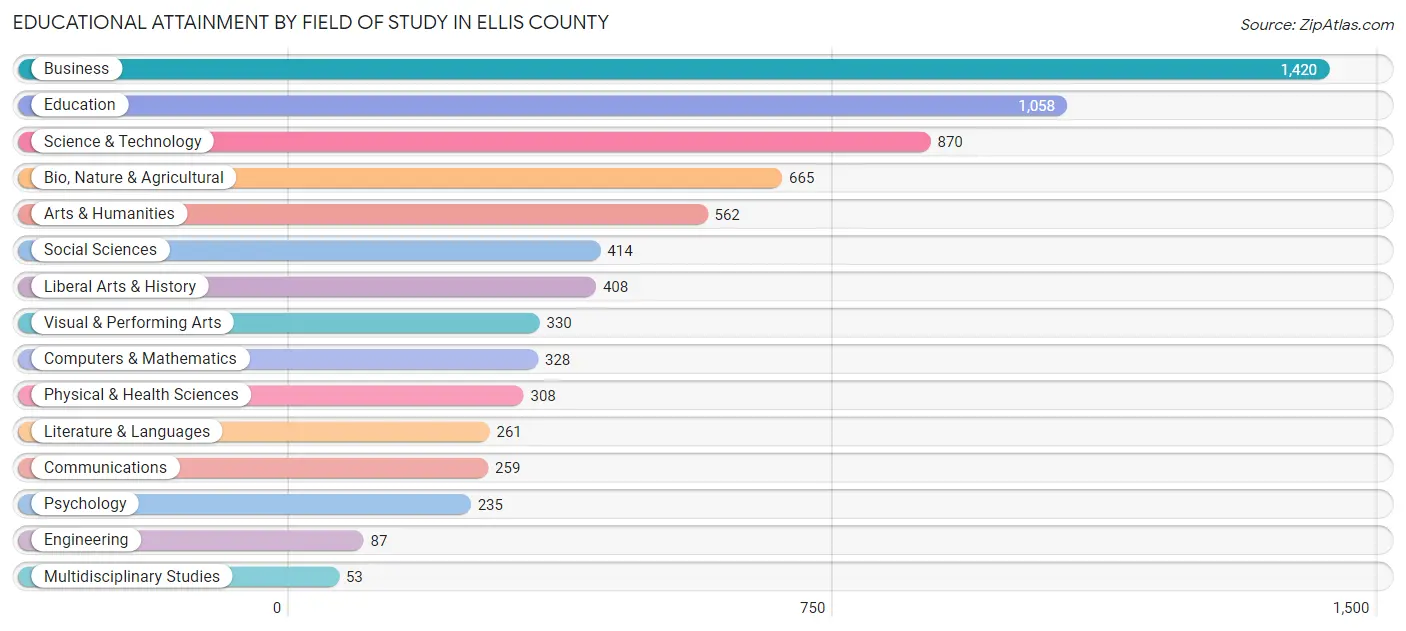
| Field of Study | # Graduates | % Graduates |
| Computers & Mathematics | 328 | 4.5% |
| Bio, Nature & Agricultural | 665 | 9.2% |
| Physical & Health Sciences | 308 | 4.2% |
| Psychology | 235 | 3.2% |
| Social Sciences | 414 | 5.7% |
| Engineering | 87 | 1.2% |
| Multidisciplinary Studies | 53 | 0.7% |
| Science & Technology | 870 | 12.0% |
| Business | 1,420 | 19.6% |
| Education | 1,058 | 14.6% |
| Literature & Languages | 261 | 3.6% |
| Liberal Arts & History | 408 | 5.6% |
| Visual & Performing Arts | 330 | 4.5% |
| Communications | 259 | 3.6% |
| Arts & Humanities | 562 | 7.7% |
| Total | 7,258 | 100.0% |
Transportation & Commute in Ellis County
Vehicle Availability by Sex in Ellis County
The most prevalent vehicle ownership categories in Ellis County are males with 2 vehicles (3,267, accounting for 38.4%) and females with 2 vehicles (2,957, making up 45.0%).
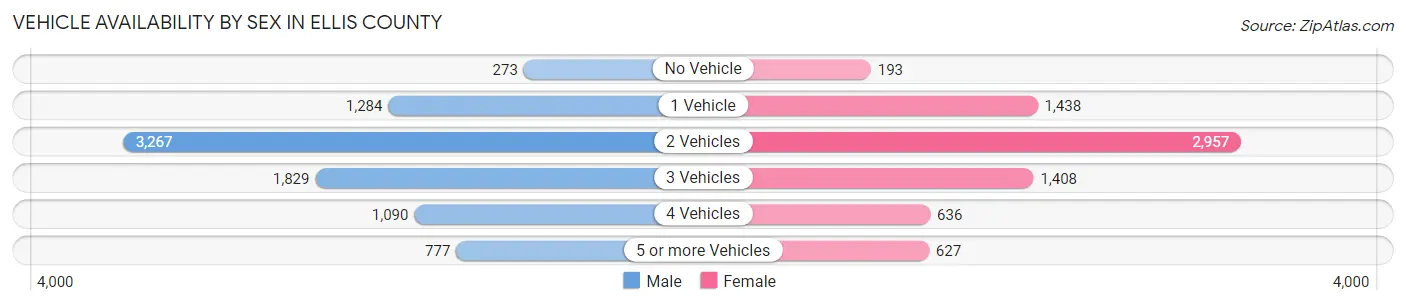
| Vehicles Available | Male | Female |
| No Vehicle | 273 (3.2%) | 193 (2.7%) |
| 1 Vehicle | 1,284 (15.1%) | 1,438 (19.8%) |
| 2 Vehicles | 3,267 (38.4%) | 2,957 (40.7%) |
| 3 Vehicles | 1,829 (21.5%) | 1,408 (19.4%) |
| 4 Vehicles | 1,090 (12.8%) | 636 (8.8%) |
| 5 or more Vehicles | 777 (9.1%) | 627 (8.6%) |
| Total | 8,520 (100.0%) | 7,259 (100.0%) |
Commute Time in Ellis County
The most frequently occuring commute durations in Ellis County are 5 to 9 minutes (5,896 commuters, 38.0%), 10 to 14 minutes (3,520 commuters, 22.7%), and 15 to 19 minutes (1,873 commuters, 12.1%).
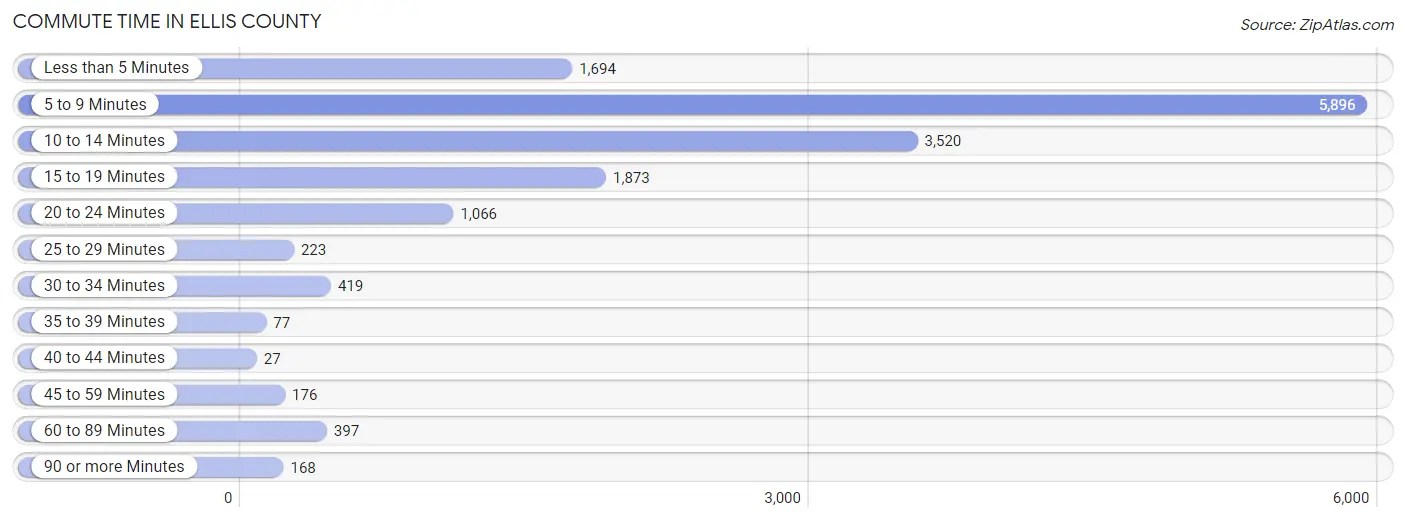
| Commute Time | # Commuters | % Commuters |
| Less than 5 Minutes | 1,694 | 10.9% |
| 5 to 9 Minutes | 5,896 | 38.0% |
| 10 to 14 Minutes | 3,520 | 22.7% |
| 15 to 19 Minutes | 1,873 | 12.1% |
| 20 to 24 Minutes | 1,066 | 6.9% |
| 25 to 29 Minutes | 223 | 1.4% |
| 30 to 34 Minutes | 419 | 2.7% |
| 35 to 39 Minutes | 77 | 0.5% |
| 40 to 44 Minutes | 27 | 0.2% |
| 45 to 59 Minutes | 176 | 1.1% |
| 60 to 89 Minutes | 397 | 2.6% |
| 90 or more Minutes | 168 | 1.1% |
Commute Time by Sex in Ellis County
The most common commute times in Ellis County are 5 to 9 minutes (3,062 commuters, 36.7%) for males and 5 to 9 minutes (2,834 commuters, 39.3%) for females.
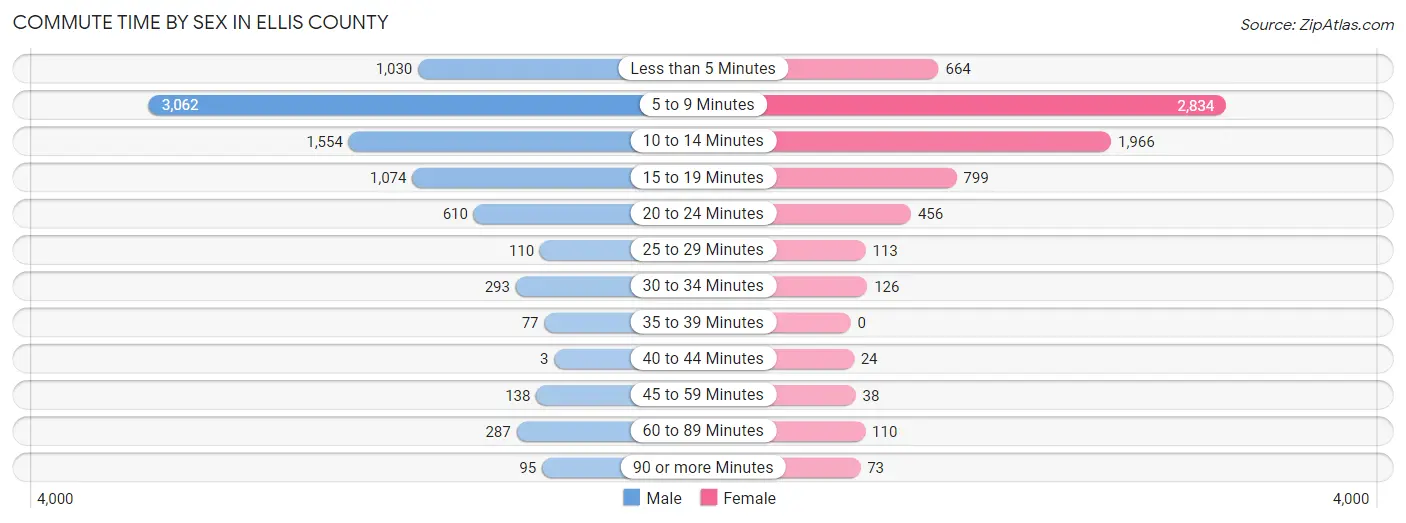
| Commute Time | Male | Female |
| Less than 5 Minutes | 1,030 (12.4%) | 664 (9.2%) |
| 5 to 9 Minutes | 3,062 (36.7%) | 2,834 (39.3%) |
| 10 to 14 Minutes | 1,554 (18.6%) | 1,966 (27.3%) |
| 15 to 19 Minutes | 1,074 (12.9%) | 799 (11.1%) |
| 20 to 24 Minutes | 610 (7.3%) | 456 (6.3%) |
| 25 to 29 Minutes | 110 (1.3%) | 113 (1.6%) |
| 30 to 34 Minutes | 293 (3.5%) | 126 (1.8%) |
| 35 to 39 Minutes | 77 (0.9%) | 0 (0.0%) |
| 40 to 44 Minutes | 3 (0.0%) | 24 (0.3%) |
| 45 to 59 Minutes | 138 (1.7%) | 38 (0.5%) |
| 60 to 89 Minutes | 287 (3.4%) | 110 (1.5%) |
| 90 or more Minutes | 95 (1.1%) | 73 (1.0%) |
Time of Departure to Work by Sex in Ellis County
The most frequent times of departure to work in Ellis County are 7:30 AM to 7:59 AM (1,826, 21.9%) for males and 7:30 AM to 7:59 AM (1,872, 26.0%) for females.
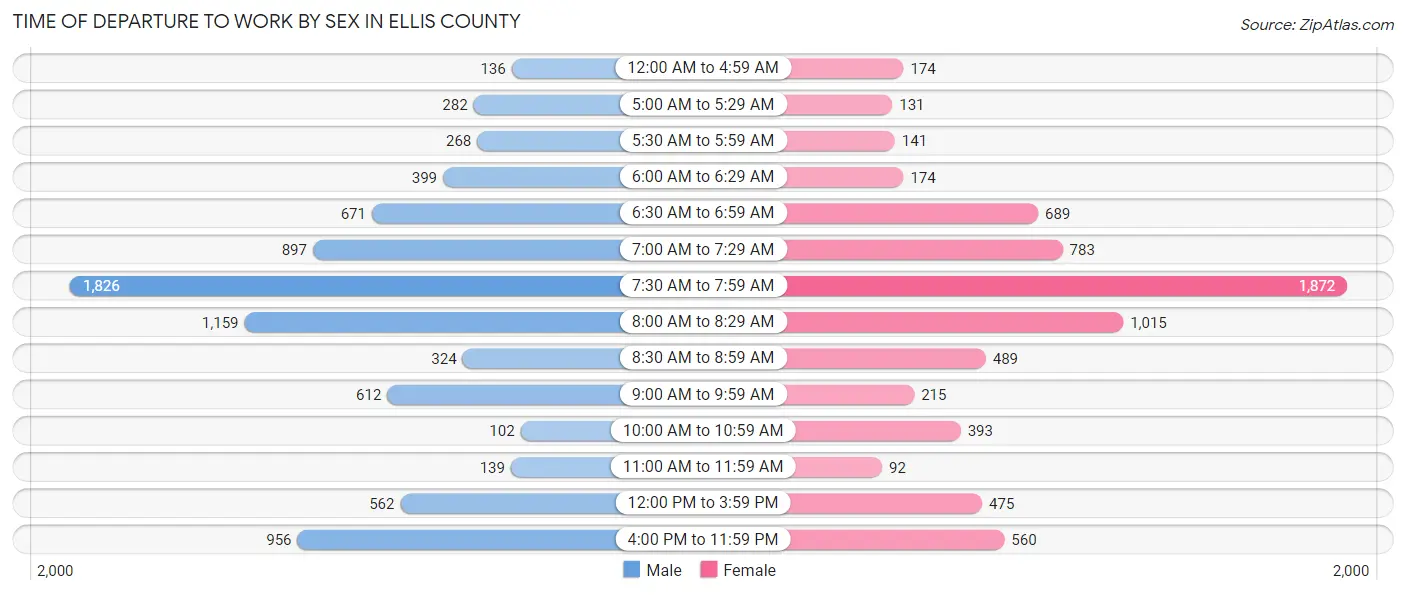
| Time of Departure | Male | Female |
| 12:00 AM to 4:59 AM | 136 (1.6%) | 174 (2.4%) |
| 5:00 AM to 5:29 AM | 282 (3.4%) | 131 (1.8%) |
| 5:30 AM to 5:59 AM | 268 (3.2%) | 141 (2.0%) |
| 6:00 AM to 6:29 AM | 399 (4.8%) | 174 (2.4%) |
| 6:30 AM to 6:59 AM | 671 (8.1%) | 689 (9.6%) |
| 7:00 AM to 7:29 AM | 897 (10.8%) | 783 (10.9%) |
| 7:30 AM to 7:59 AM | 1,826 (21.9%) | 1,872 (26.0%) |
| 8:00 AM to 8:29 AM | 1,159 (13.9%) | 1,015 (14.1%) |
| 8:30 AM to 8:59 AM | 324 (3.9%) | 489 (6.8%) |
| 9:00 AM to 9:59 AM | 612 (7.3%) | 215 (3.0%) |
| 10:00 AM to 10:59 AM | 102 (1.2%) | 393 (5.5%) |
| 11:00 AM to 11:59 AM | 139 (1.7%) | 92 (1.3%) |
| 12:00 PM to 3:59 PM | 562 (6.7%) | 475 (6.6%) |
| 4:00 PM to 11:59 PM | 956 (11.5%) | 560 (7.8%) |
| Total | 8,333 (100.0%) | 7,203 (100.0%) |
Housing Occupancy in Ellis County
Occupancy by Ownership in Ellis County
Of the total 11,958 dwellings in Ellis County, owner-occupied units account for 7,335 (61.3%), while renter-occupied units make up 4,623 (38.7%).
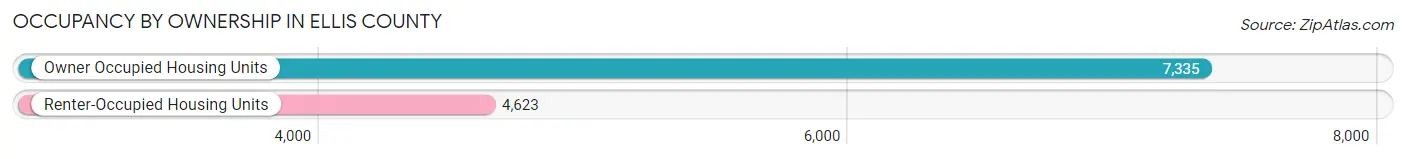
| Occupancy | # Housing Units | % Housing Units |
| Owner Occupied Housing Units | 7,335 | 61.3% |
| Renter-Occupied Housing Units | 4,623 | 38.7% |
| Total Occupied Housing Units | 11,958 | 100.0% |
Occupancy by Household Size in Ellis County
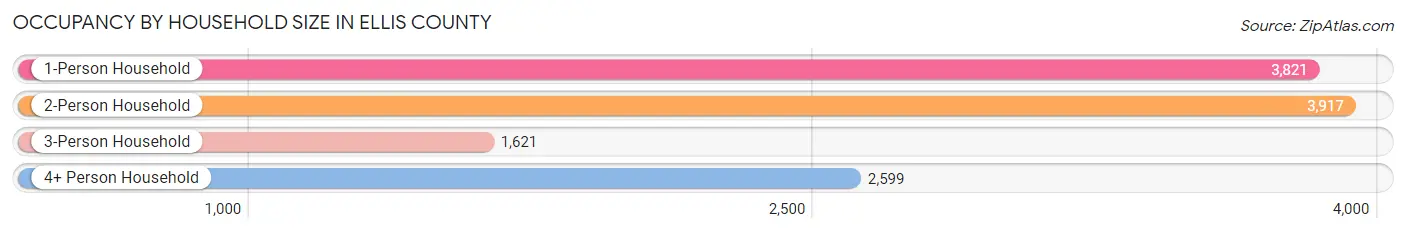
| Household Size | # Housing Units | % Housing Units |
| 1-Person Household | 3,821 | 32.0% |
| 2-Person Household | 3,917 | 32.8% |
| 3-Person Household | 1,621 | 13.6% |
| 4+ Person Household | 2,599 | 21.7% |
| Total Housing Units | 11,958 | 100.0% |
Occupancy by Ownership by Household Size in Ellis County
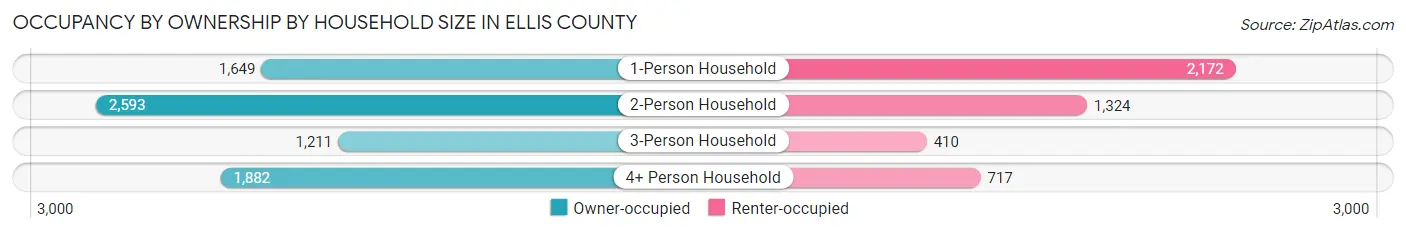
| Household Size | Owner-occupied | Renter-occupied |
| 1-Person Household | 1,649 (43.2%) | 2,172 (56.8%) |
| 2-Person Household | 2,593 (66.2%) | 1,324 (33.8%) |
| 3-Person Household | 1,211 (74.7%) | 410 (25.3%) |
| 4+ Person Household | 1,882 (72.4%) | 717 (27.6%) |
| Total Housing Units | 7,335 (61.3%) | 4,623 (38.7%) |
Occupancy by Educational Attainment in Ellis County
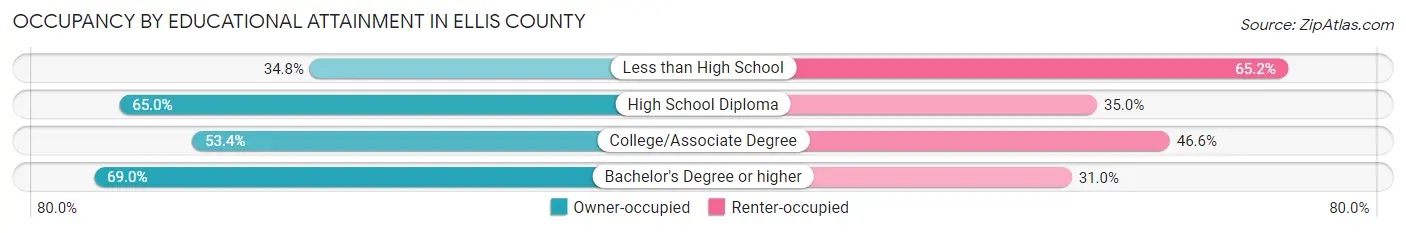
| Household Size | Owner-occupied | Renter-occupied |
| Less than High School | 185 (34.8%) | 347 (65.2%) |
| High School Diploma | 1,779 (65.0%) | 959 (35.0%) |
| College/Associate Degree | 2,135 (53.4%) | 1,861 (46.6%) |
| Bachelor's Degree or higher | 3,236 (69.0%) | 1,456 (31.0%) |
Occupancy by Age of Householder in Ellis County
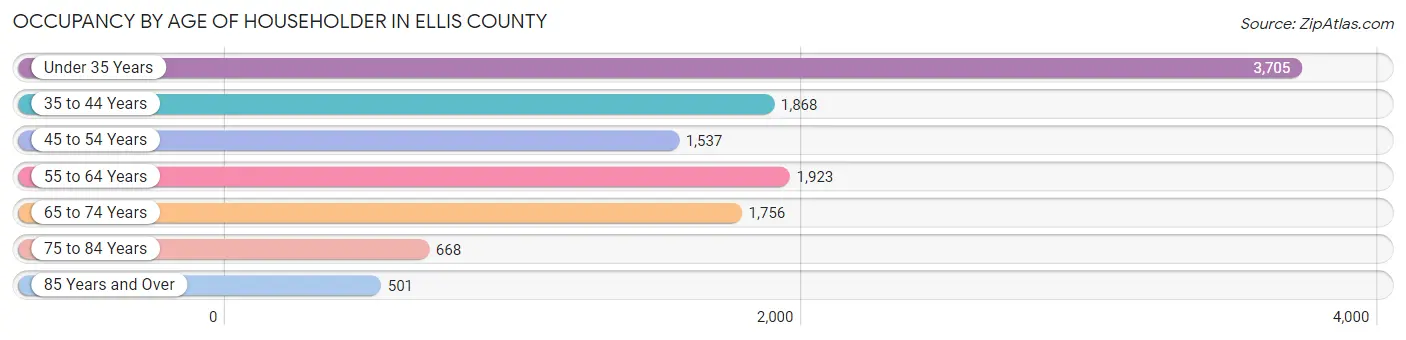
| Age Bracket | # Households | % Households |
| Under 35 Years | 3,705 | 31.0% |
| 35 to 44 Years | 1,868 | 15.6% |
| 45 to 54 Years | 1,537 | 12.9% |
| 55 to 64 Years | 1,923 | 16.1% |
| 65 to 74 Years | 1,756 | 14.7% |
| 75 to 84 Years | 668 | 5.6% |
| 85 Years and Over | 501 | 4.2% |
| Total | 11,958 | 100.0% |
Housing Finances in Ellis County
Median Income by Occupancy in Ellis County
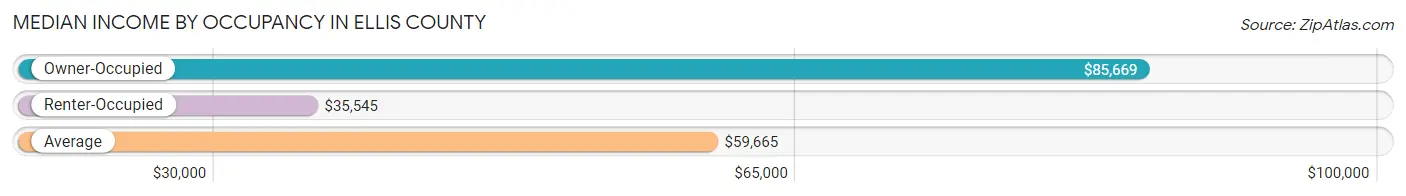
| Occupancy Type | # Households | Median Income |
| Owner-Occupied | 7,335 (61.3%) | $85,669 |
| Renter-Occupied | 4,623 (38.7%) | $35,545 |
| Average | 11,958 (100.0%) | $59,665 |
Occupancy by Householder Income Bracket in Ellis County
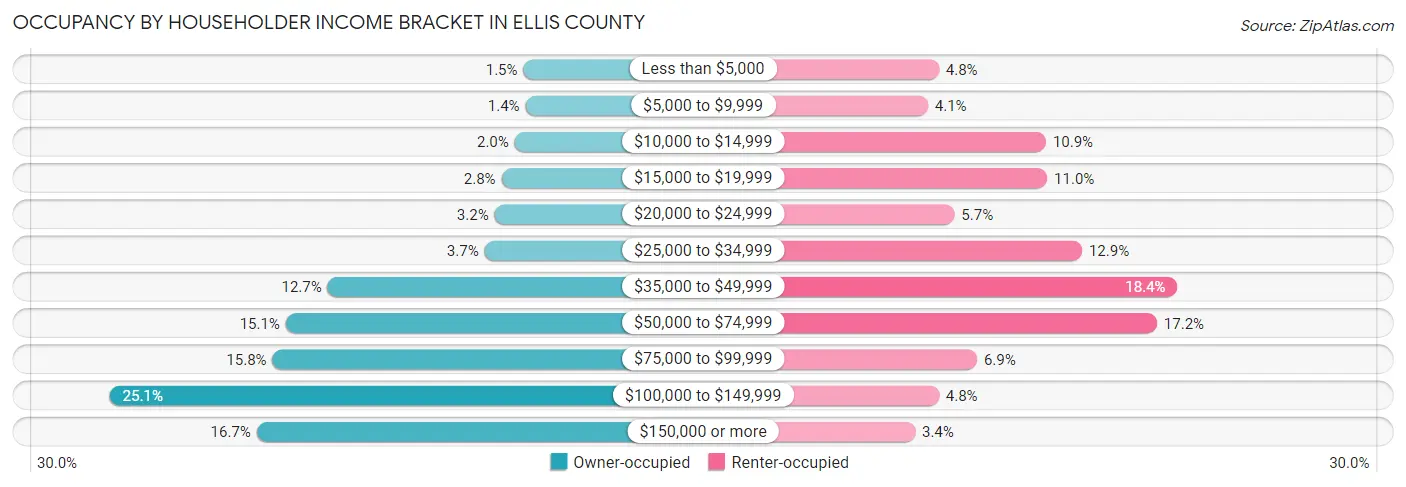
| Income Bracket | Owner-occupied | Renter-occupied |
| Less than $5,000 | 110 (1.5%) | 220 (4.8%) |
| $5,000 to $9,999 | 101 (1.4%) | 191 (4.1%) |
| $10,000 to $14,999 | 147 (2.0%) | 503 (10.9%) |
| $15,000 to $19,999 | 202 (2.8%) | 506 (11.0%) |
| $20,000 to $24,999 | 231 (3.2%) | 261 (5.7%) |
| $25,000 to $34,999 | 273 (3.7%) | 598 (12.9%) |
| $35,000 to $49,999 | 931 (12.7%) | 850 (18.4%) |
| $50,000 to $74,999 | 1,106 (15.1%) | 796 (17.2%) |
| $75,000 to $99,999 | 1,162 (15.8%) | 321 (6.9%) |
| $100,000 to $149,999 | 1,844 (25.1%) | 220 (4.8%) |
| $150,000 or more | 1,228 (16.7%) | 157 (3.4%) |
| Total | 7,335 (100.0%) | 4,623 (100.0%) |
Monthly Housing Cost Tiers in Ellis County
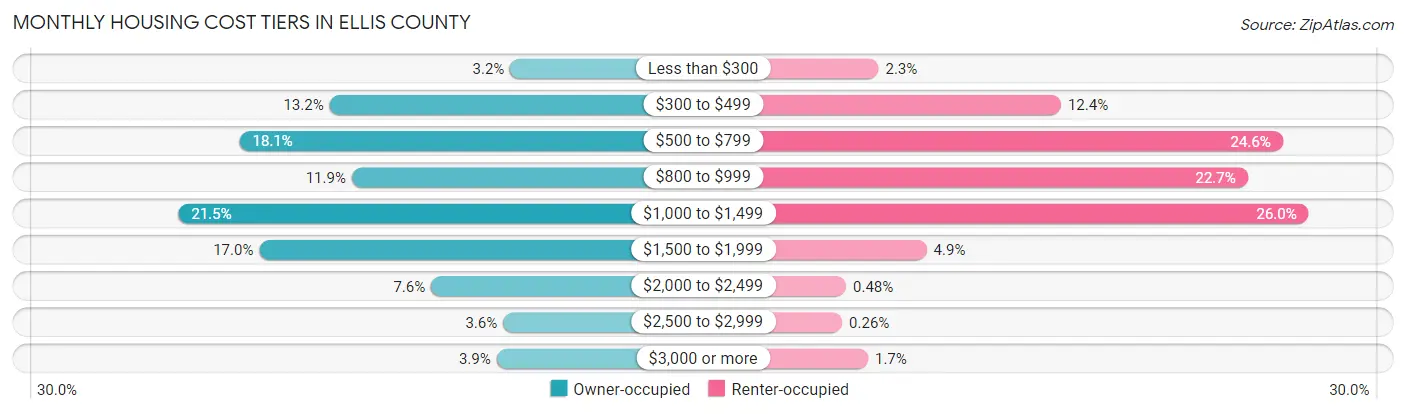
| Monthly Cost | Owner-occupied | Renter-occupied |
| Less than $300 | 233 (3.2%) | 105 (2.3%) |
| $300 to $499 | 965 (13.2%) | 571 (12.3%) |
| $500 to $799 | 1,330 (18.1%) | 1,137 (24.6%) |
| $800 to $999 | 875 (11.9%) | 1,047 (22.7%) |
| $1,000 to $1,499 | 1,578 (21.5%) | 1,203 (26.0%) |
| $1,500 to $1,999 | 1,250 (17.0%) | 228 (4.9%) |
| $2,000 to $2,499 | 554 (7.5%) | 22 (0.5%) |
| $2,500 to $2,999 | 262 (3.6%) | 12 (0.3%) |
| $3,000 or more | 288 (3.9%) | 78 (1.7%) |
| Total | 7,335 (100.0%) | 4,623 (100.0%) |
Physical Housing Characteristics in Ellis County
Housing Structures in Ellis County
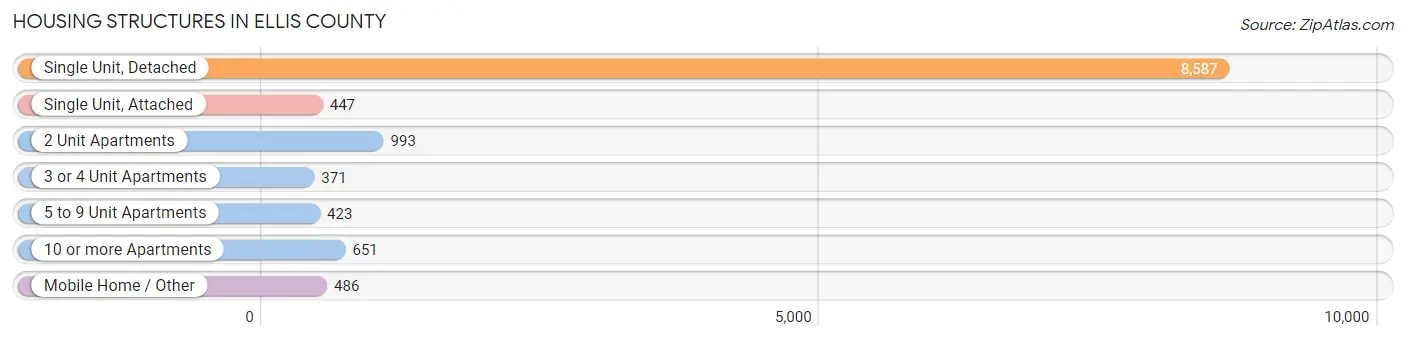
| Structure Type | # Housing Units | % Housing Units |
| Single Unit, Detached | 8,587 | 71.8% |
| Single Unit, Attached | 447 | 3.7% |
| 2 Unit Apartments | 993 | 8.3% |
| 3 or 4 Unit Apartments | 371 | 3.1% |
| 5 to 9 Unit Apartments | 423 | 3.5% |
| 10 or more Apartments | 651 | 5.4% |
| Mobile Home / Other | 486 | 4.1% |
| Total | 11,958 | 100.0% |
Housing Structures by Occupancy in Ellis County
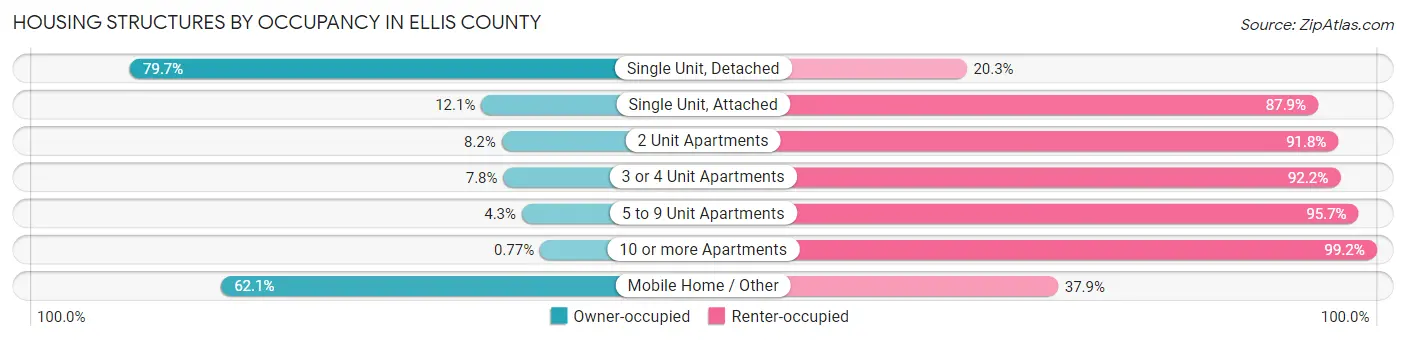
| Structure Type | Owner-occupied | Renter-occupied |
| Single Unit, Detached | 6,846 (79.7%) | 1,741 (20.3%) |
| Single Unit, Attached | 54 (12.1%) | 393 (87.9%) |
| 2 Unit Apartments | 81 (8.2%) | 912 (91.8%) |
| 3 or 4 Unit Apartments | 29 (7.8%) | 342 (92.2%) |
| 5 to 9 Unit Apartments | 18 (4.3%) | 405 (95.7%) |
| 10 or more Apartments | 5 (0.8%) | 646 (99.2%) |
| Mobile Home / Other | 302 (62.1%) | 184 (37.9%) |
| Total | 7,335 (61.3%) | 4,623 (38.7%) |
Housing Structures by Number of Rooms in Ellis County
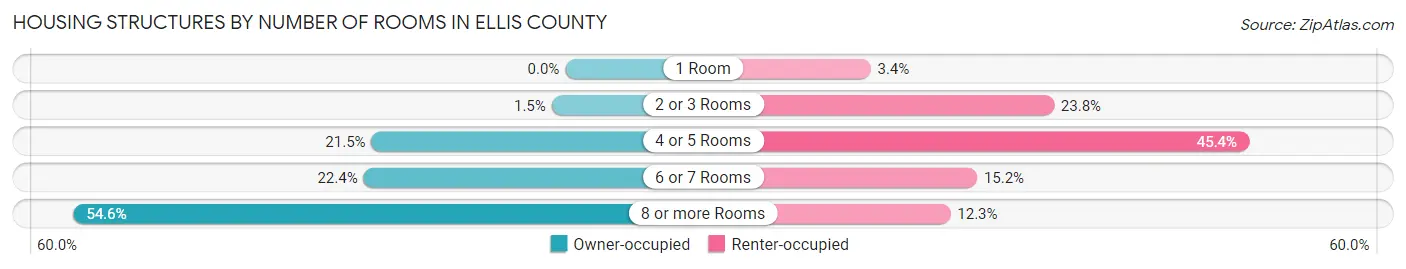
| Number of Rooms | Owner-occupied | Renter-occupied |
| 1 Room | 0 (0.0%) | 157 (3.4%) |
| 2 or 3 Rooms | 111 (1.5%) | 1,098 (23.7%) |
| 4 or 5 Rooms | 1,578 (21.5%) | 2,098 (45.4%) |
| 6 or 7 Rooms | 1,642 (22.4%) | 703 (15.2%) |
| 8 or more Rooms | 4,004 (54.6%) | 567 (12.3%) |
| Total | 7,335 (100.0%) | 4,623 (100.0%) |
Housing Structure by Heating Type in Ellis County
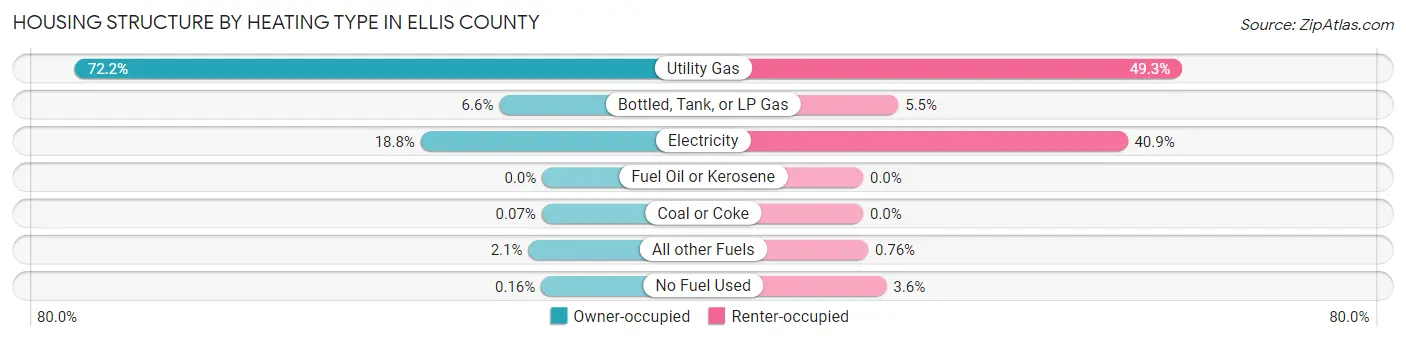
| Heating Type | Owner-occupied | Renter-occupied |
| Utility Gas | 5,299 (72.2%) | 2,279 (49.3%) |
| Bottled, Tank, or LP Gas | 486 (6.6%) | 252 (5.4%) |
| Electricity | 1,377 (18.8%) | 1,890 (40.9%) |
| Fuel Oil or Kerosene | 0 (0.0%) | 0 (0.0%) |
| Coal or Coke | 5 (0.1%) | 0 (0.0%) |
| All other Fuels | 156 (2.1%) | 35 (0.8%) |
| No Fuel Used | 12 (0.2%) | 167 (3.6%) |
| Total | 7,335 (100.0%) | 4,623 (100.0%) |
Household Vehicle Usage in Ellis County
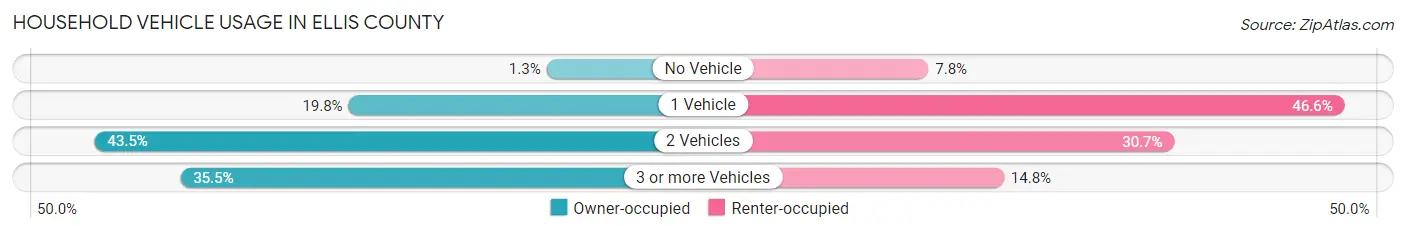
| Vehicles per Household | Owner-occupied | Renter-occupied |
| No Vehicle | 94 (1.3%) | 360 (7.8%) |
| 1 Vehicle | 1,450 (19.8%) | 2,156 (46.6%) |
| 2 Vehicles | 3,189 (43.5%) | 1,421 (30.7%) |
| 3 or more Vehicles | 2,602 (35.5%) | 686 (14.8%) |
| Total | 7,335 (100.0%) | 4,623 (100.0%) |
Real Estate & Mortgages in Ellis County
Real Estate and Mortgage Overview in Ellis County
| Characteristic | Without Mortgage | With Mortgage |
| Housing Units | 2,919 | 4,416 |
| Median Property Value | $182,300 | $209,400 |
| Median Household Income | $62,656 | $881 |
| Monthly Housing Costs | $558 | $288 |
| Real Estate Taxes | $2,294 | $101 |
Property Value by Mortgage Status in Ellis County
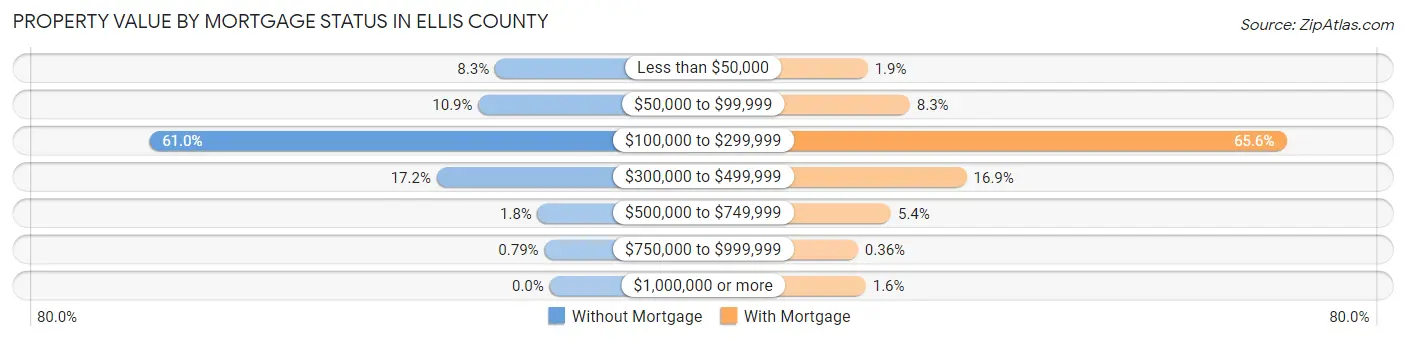
| Property Value | Without Mortgage | With Mortgage |
| Less than $50,000 | 243 (8.3%) | 82 (1.9%) |
| $50,000 to $99,999 | 317 (10.9%) | 365 (8.3%) |
| $100,000 to $299,999 | 1,781 (61.0%) | 2,898 (65.6%) |
| $300,000 to $499,999 | 502 (17.2%) | 747 (16.9%) |
| $500,000 to $749,999 | 53 (1.8%) | 239 (5.4%) |
| $750,000 to $999,999 | 23 (0.8%) | 16 (0.4%) |
| $1,000,000 or more | 0 (0.0%) | 69 (1.6%) |
| Total | 2,919 (100.0%) | 4,416 (100.0%) |
Household Income by Mortgage Status in Ellis County
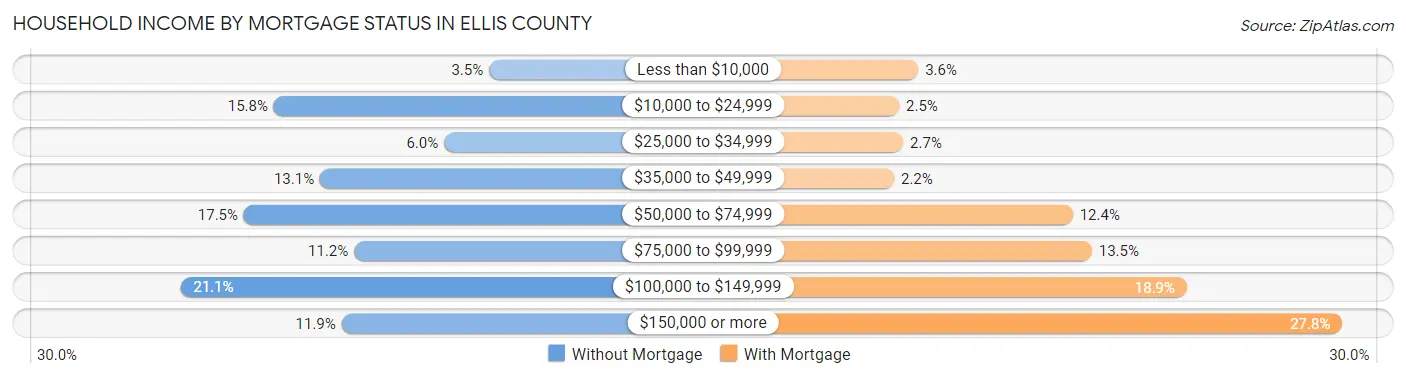
| Household Income | Without Mortgage | With Mortgage |
| Less than $10,000 | 101 (3.5%) | 158 (3.6%) |
| $10,000 to $24,999 | 460 (15.8%) | 110 (2.5%) |
| $25,000 to $34,999 | 176 (6.0%) | 120 (2.7%) |
| $35,000 to $49,999 | 383 (13.1%) | 97 (2.2%) |
| $50,000 to $74,999 | 510 (17.5%) | 548 (12.4%) |
| $75,000 to $99,999 | 326 (11.2%) | 596 (13.5%) |
| $100,000 to $149,999 | 616 (21.1%) | 836 (18.9%) |
| $150,000 or more | 347 (11.9%) | 1,228 (27.8%) |
| Total | 2,919 (100.0%) | 4,416 (100.0%) |
Property Value to Household Income Ratio in Ellis County
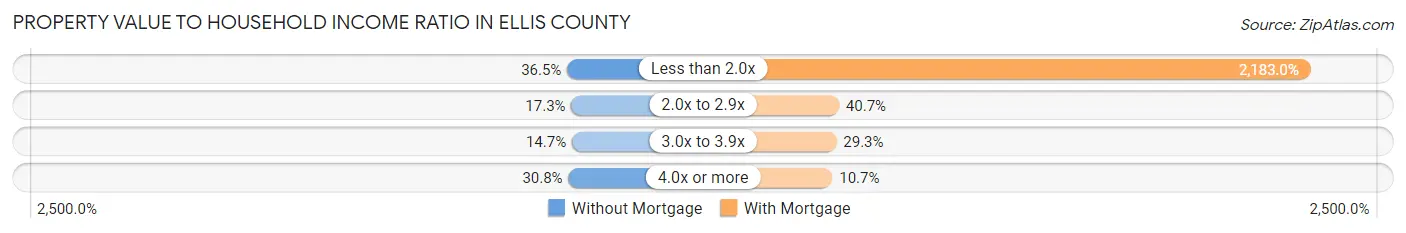
| Value-to-Income Ratio | Without Mortgage | With Mortgage |
| Less than 2.0x | 1,066 (36.5%) | 96,402 (2,183.0%) |
| 2.0x to 2.9x | 504 (17.3%) | 1,799 (40.7%) |
| 3.0x to 3.9x | 428 (14.7%) | 1,295 (29.3%) |
| 4.0x or more | 899 (30.8%) | 471 (10.7%) |
| Total | 2,919 (100.0%) | 4,416 (100.0%) |
Real Estate Taxes by Mortgage Status in Ellis County
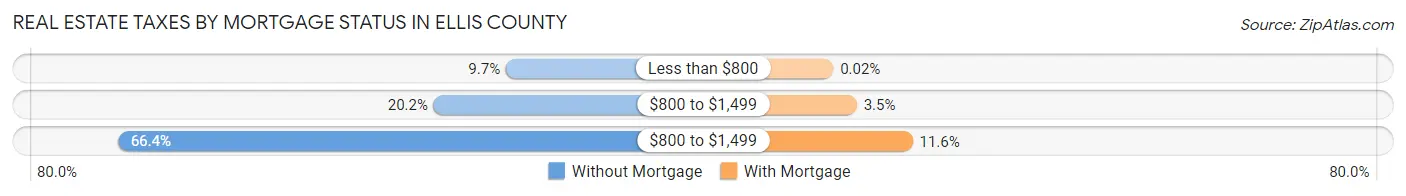
| Property Taxes | Without Mortgage | With Mortgage |
| Less than $800 | 282 (9.7%) | 1 (0.0%) |
| $800 to $1,499 | 590 (20.2%) | 153 (3.5%) |
| $800 to $1,499 | 1,938 (66.4%) | 513 (11.6%) |
| Total | 2,919 (100.0%) | 4,416 (100.0%) |
Health & Disability in Ellis County
Health Insurance Coverage by Age in Ellis County
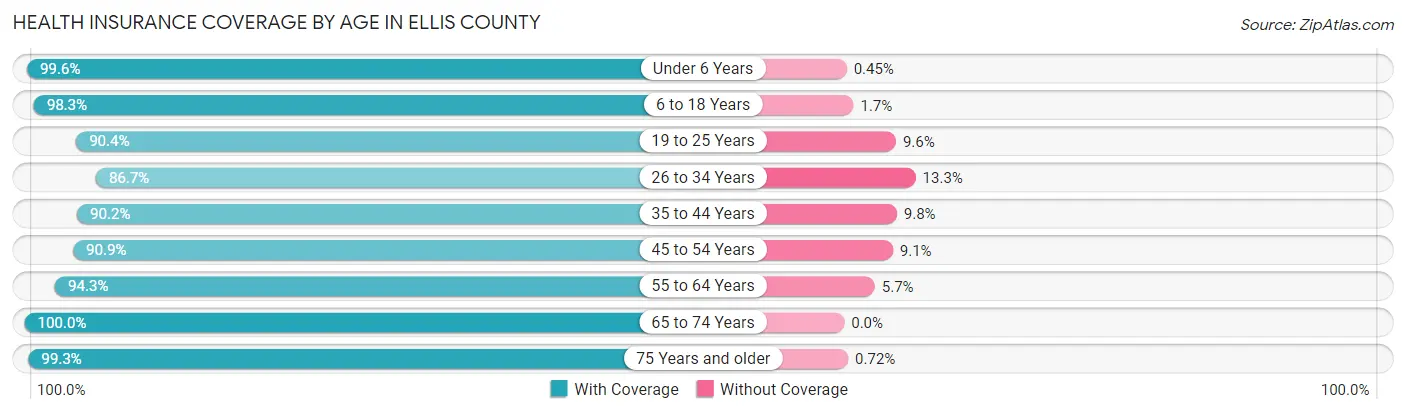
| Age Bracket | With Coverage | Without Coverage |
| Under 6 Years | 1,771 (99.6%) | 8 (0.4%) |
| 6 to 18 Years | 4,792 (98.3%) | 84 (1.7%) |
| 19 to 25 Years | 4,824 (90.4%) | 514 (9.6%) |
| 26 to 34 Years | 2,859 (86.7%) | 439 (13.3%) |
| 35 to 44 Years | 3,038 (90.2%) | 330 (9.8%) |
| 45 to 54 Years | 2,458 (90.9%) | 245 (9.1%) |
| 55 to 64 Years | 2,943 (94.3%) | 178 (5.7%) |
| 65 to 74 Years | 2,551 (100.0%) | 0 (0.0%) |
| 75 Years and older | 1,666 (99.3%) | 12 (0.7%) |
| Total | 26,902 (93.7%) | 1,810 (6.3%) |
Health Insurance Coverage by Citizenship Status in Ellis County
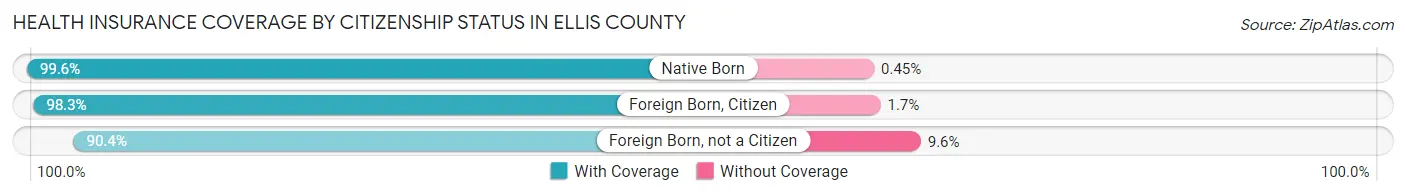
| Citizenship Status | With Coverage | Without Coverage |
| Native Born | 1,771 (99.6%) | 8 (0.4%) |
| Foreign Born, Citizen | 4,792 (98.3%) | 84 (1.7%) |
| Foreign Born, not a Citizen | 4,824 (90.4%) | 514 (9.6%) |
Health Insurance Coverage by Household Income in Ellis County
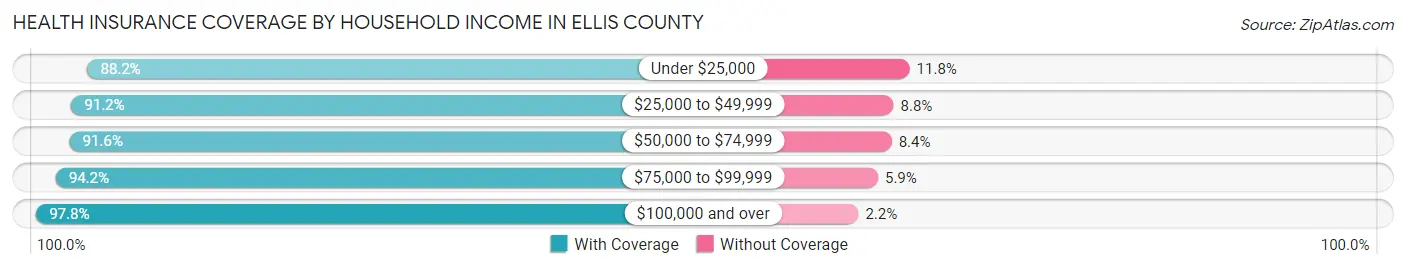
| Household Income | With Coverage | Without Coverage |
| Under $25,000 | 3,115 (88.2%) | 416 (11.8%) |
| $25,000 to $49,999 | 4,492 (91.2%) | 432 (8.8%) |
| $50,000 to $74,999 | 4,252 (91.6%) | 391 (8.4%) |
| $75,000 to $99,999 | 3,942 (94.2%) | 245 (5.9%) |
| $100,000 and over | 9,992 (97.8%) | 224 (2.2%) |
Public vs Private Health Insurance Coverage by Age in Ellis County
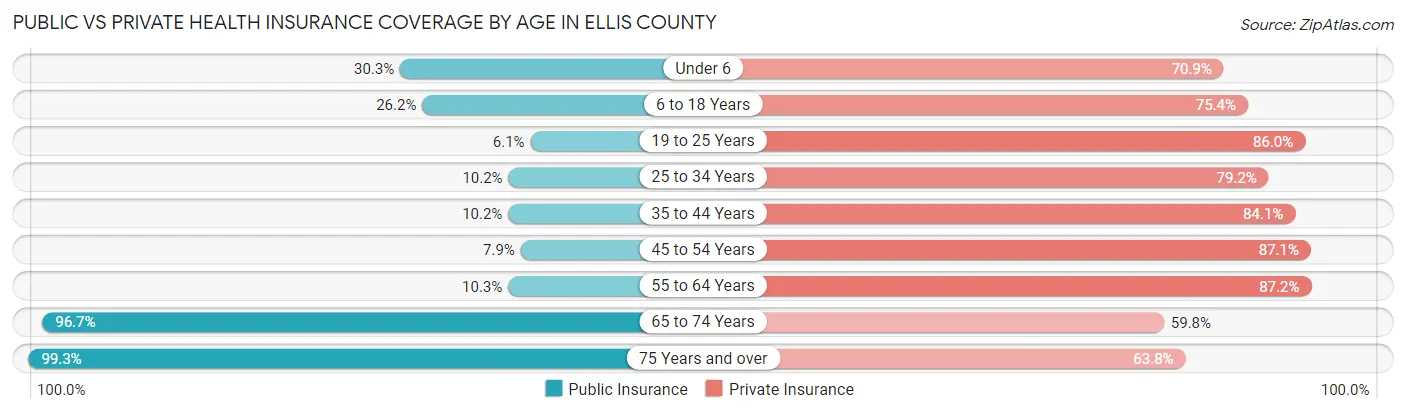
| Age Bracket | Public Insurance | Private Insurance |
| Under 6 | 539 (30.3%) | 1,261 (70.9%) |
| 6 to 18 Years | 1,277 (26.2%) | 3,674 (75.3%) |
| 19 to 25 Years | 326 (6.1%) | 4,590 (86.0%) |
| 25 to 34 Years | 336 (10.2%) | 2,613 (79.2%) |
| 35 to 44 Years | 345 (10.2%) | 2,834 (84.1%) |
| 45 to 54 Years | 214 (7.9%) | 2,353 (87.1%) |
| 55 to 64 Years | 320 (10.2%) | 2,720 (87.2%) |
| 65 to 74 Years | 2,467 (96.7%) | 1,525 (59.8%) |
| 75 Years and over | 1,666 (99.3%) | 1,070 (63.8%) |
| Total | 7,490 (26.1%) | 22,640 (78.8%) |
Disability Status by Sex by Age in Ellis County
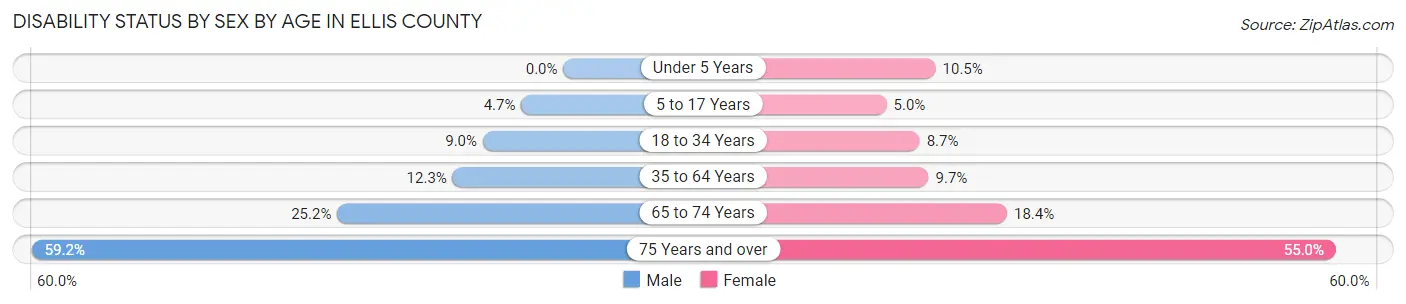
| Age Bracket | Male | Female |
| Under 5 Years | 0 (0.0%) | 83 (10.4%) |
| 5 to 17 Years | 105 (4.7%) | 107 (5.0%) |
| 18 to 34 Years | 429 (9.0%) | 397 (8.7%) |
| 35 to 64 Years | 566 (12.3%) | 445 (9.7%) |
| 65 to 74 Years | 318 (25.2%) | 237 (18.4%) |
| 75 Years and over | 421 (59.2%) | 532 (55.0%) |
Disability Class by Sex by Age in Ellis County
Disability Class: Hearing Difficulty
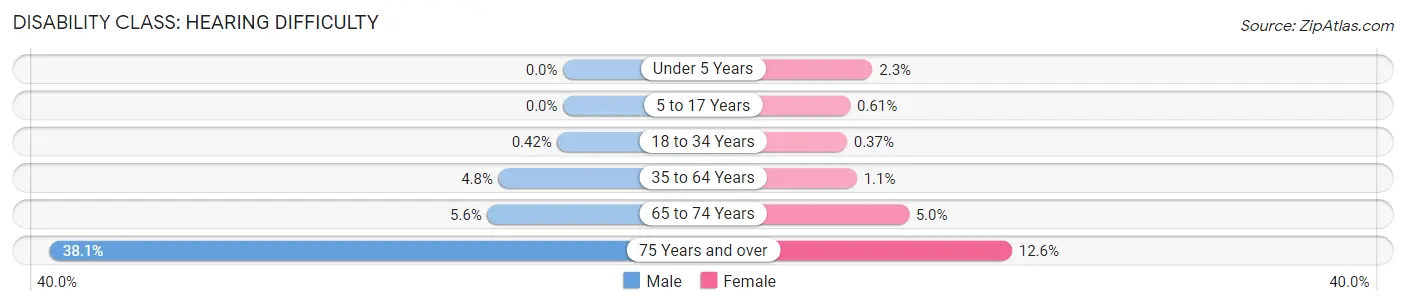
| Age Bracket | Male | Female |
| Under 5 Years | 0 (0.0%) | 18 (2.3%) |
| 5 to 17 Years | 0 (0.0%) | 13 (0.6%) |
| 18 to 34 Years | 20 (0.4%) | 17 (0.4%) |
| 35 to 64 Years | 220 (4.8%) | 51 (1.1%) |
| 65 to 74 Years | 71 (5.6%) | 64 (5.0%) |
| 75 Years and over | 271 (38.1%) | 122 (12.6%) |
Disability Class: Vision Difficulty
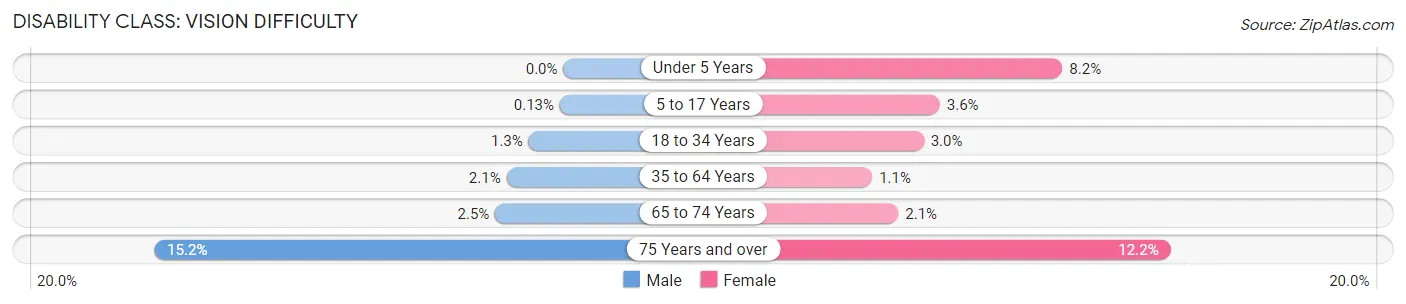
| Age Bracket | Male | Female |
| Under 5 Years | 0 (0.0%) | 65 (8.2%) |
| 5 to 17 Years | 3 (0.1%) | 78 (3.6%) |
| 18 to 34 Years | 62 (1.3%) | 139 (3.0%) |
| 35 to 64 Years | 97 (2.1%) | 52 (1.1%) |
| 65 to 74 Years | 32 (2.5%) | 27 (2.1%) |
| 75 Years and over | 108 (15.2%) | 118 (12.2%) |
Disability Class: Cognitive Difficulty
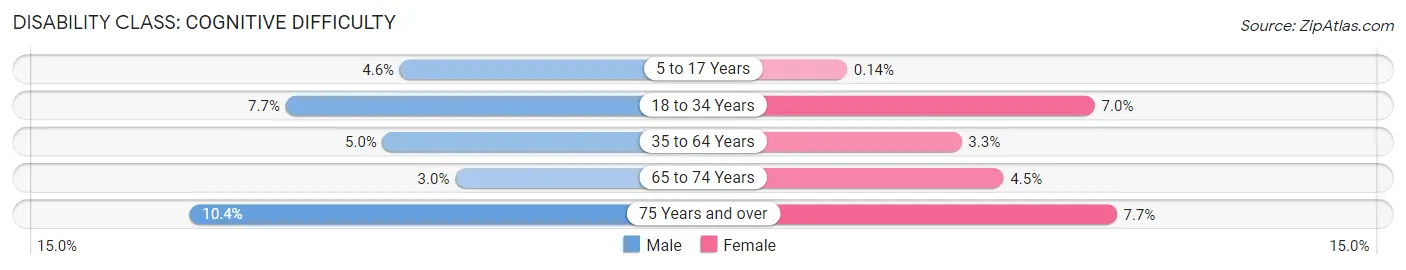
| Age Bracket | Male | Female |
| 5 to 17 Years | 102 (4.5%) | 3 (0.1%) |
| 18 to 34 Years | 370 (7.7%) | 322 (7.0%) |
| 35 to 64 Years | 231 (5.0%) | 153 (3.3%) |
| 65 to 74 Years | 38 (3.0%) | 58 (4.5%) |
| 75 Years and over | 74 (10.4%) | 74 (7.6%) |
Disability Class: Ambulatory Difficulty
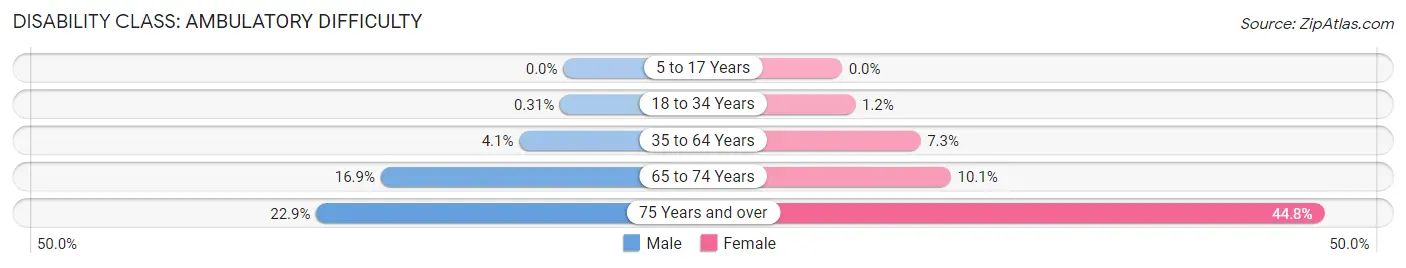
| Age Bracket | Male | Female |
| 5 to 17 Years | 0 (0.0%) | 0 (0.0%) |
| 18 to 34 Years | 15 (0.3%) | 56 (1.2%) |
| 35 to 64 Years | 188 (4.1%) | 335 (7.3%) |
| 65 to 74 Years | 214 (16.9%) | 130 (10.1%) |
| 75 Years and over | 163 (22.9%) | 433 (44.8%) |
Disability Class: Self-Care Difficulty
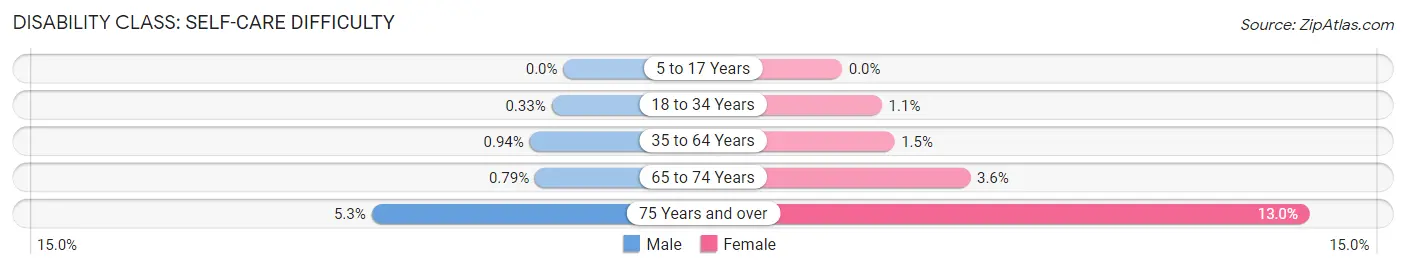
| Age Bracket | Male | Female |
| 5 to 17 Years | 0 (0.0%) | 0 (0.0%) |
| 18 to 34 Years | 16 (0.3%) | 51 (1.1%) |
| 35 to 64 Years | 43 (0.9%) | 67 (1.5%) |
| 65 to 74 Years | 10 (0.8%) | 46 (3.6%) |
| 75 Years and over | 38 (5.3%) | 126 (13.0%) |
Technology Access in Ellis County
Computing Device Access in Ellis County
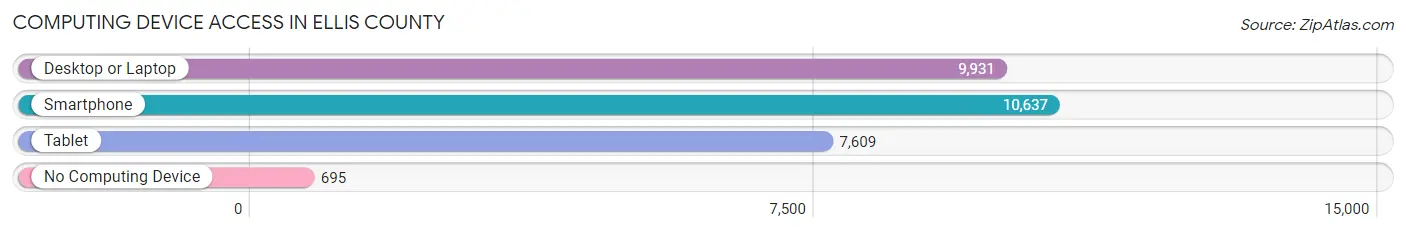
| Device Type | # Households | % Households |
| Desktop or Laptop | 9,931 | 83.1% |
| Smartphone | 10,637 | 88.9% |
| Tablet | 7,609 | 63.6% |
| No Computing Device | 695 | 5.8% |
| Total | 11,958 | 100.0% |
Internet Access in Ellis County
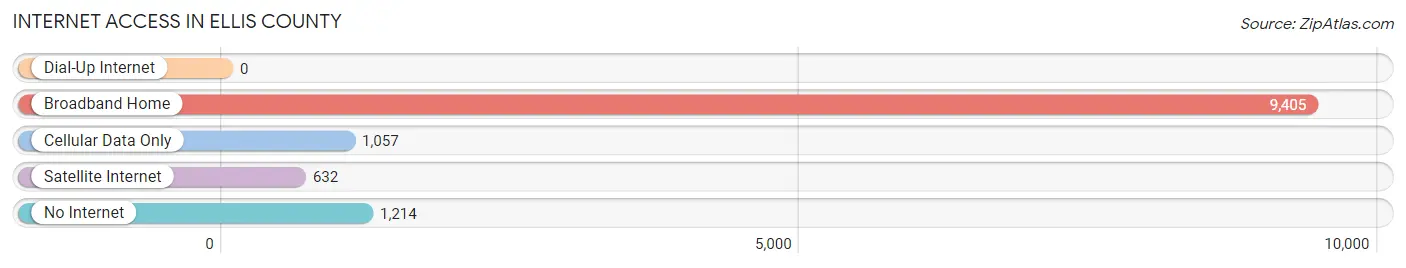
| Internet Type | # Households | % Households |
| Dial-Up Internet | 0 | 0.0% |
| Broadband Home | 9,405 | 78.6% |
| Cellular Data Only | 1,057 | 8.8% |
| Satellite Internet | 632 | 5.3% |
| No Internet | 1,214 | 10.2% |
| Total | 11,958 | 100.0% |
Ellis County Summary
Ellis County, Kansas is located in the north-central part of the state and is part of the Hays Micropolitan Statistical Area. The county was established in 1867 and named after George Ellis, a member of the Kansas Territorial Legislature. As of the 2010 census, the population of Ellis County was 28,452.
Geography
Ellis County is located in the High Plains region of Kansas and is bordered by Russell County to the north, Trego County to the east, Rush County to the south, and Ness County to the west. The county covers an area of 1,092 square miles and is the fifth-largest county in the state. The county seat is Hays, which is also the largest city in the county. Other cities in the county include Ellis, Victoria, and Catharine.
The landscape of Ellis County is mostly flat with some rolling hills. The county is drained by the Smoky Hill River, which flows through the county from east to west. The county is also home to several small lakes, including Cedar Bluff Reservoir, which is located in the western part of the county.
Climate
Ellis County has a semi-arid climate, with hot summers and cold winters. The average annual temperature is 54°F, with an average high of 79°F in July and an average low of 28°F in January. The average annual precipitation is 22 inches, with most of it falling in the spring and summer months.
Demographics
As of the 2010 census, there were 28,452 people, 10,845 households, and 7,717 families living in Ellis County. The population density was 26 people per square mile. The racial makeup of the county was 92.3% White, 2.7% Hispanic or Latino, 1.7% Native American, 0.9% Asian, 0.2% African American, 0.1% Pacific Islander, and 2.1% from two or more races.
The median income for a household in the county was $45,845, and the median income for a family was $54,845. The per capita income for the county was $21,845. About 8.3% of families and 11.2% of the population were below the poverty line, including 14.2% of those under age 18 and 8.2% of those age 65 or over.
Economy
The economy of Ellis County is largely based on agriculture, with wheat, corn, and sorghum being the main crops. The county is also home to several manufacturing companies, including a large wind turbine manufacturing plant. The county is also home to Fort Hays State University, which is a major employer in the area.
The unemployment rate in Ellis County was 3.7% in 2019, which is lower than the national average of 3.9%. The median household income in the county was $45,845 in 2019, which is higher than the national median of $61,937.
Conclusion
Ellis County, Kansas is a rural county located in the north-central part of the state. The county is home to 28,452 people and is largely based on agriculture, with wheat, corn, and sorghum being the main crops. The county is also home to several manufacturing companies and Fort Hays State University. The unemployment rate in the county is lower than the national average, and the median household income is higher than the national median.
Common Questions
What is the Total Population of Ellis County?
Total Population of Ellis County is 28,921.
What is the Total Male Population of Ellis County?
Total Male Population of Ellis County is 14,463.
What is the Total Female Population of Ellis County?
Total Female Population of Ellis County is 14,458.
What is the Ratio of Males per 100 Females in Ellis County?
There are 100.03 Males per 100 Females in Ellis County.
What is the Ratio of Females per 100 Males in Ellis County?
There are 99.97 Females per 100 Males in Ellis County.
What is the Median Population Age in Ellis County?
Median Population Age in Ellis County is 32.9 Years.
What is the Average Family Size in Ellis County
Average Family Size in Ellis County is 2.9 People.
What is the Average Household Size in Ellis County
Average Household Size in Ellis County is 2.3 People.
What is Per Capita Income in Ellis County?
Per Capita income in Ellis County is $37,217.
What is the Median Family Income in Ellis County?
Median Family Income in Ellis County is $86,484.
What is the Median Household income in Ellis County?
Median Household Income in Ellis County is $59,665.
What is Income or Wage Gap in Ellis County?
Income or Wage Gap in Ellis County is 26.2%.
Women in Ellis County earn 73.8 cents for every dollar earned by a man.
What is Inequality or Gini Index in Ellis County?
Inequality or Gini Index in Ellis County is 0.50.
How Large is the Labor Force in Ellis County?
There are 17,300 People in the Labor Forcein in Ellis County.
What is the Percentage of People in the Labor Force in Ellis County?
73.7% of People are in the Labor Force in Ellis County.
What is the Unemployment Rate in Ellis County?
Unemployment Rate in Ellis County is 3.3%.