Douglas County, KS
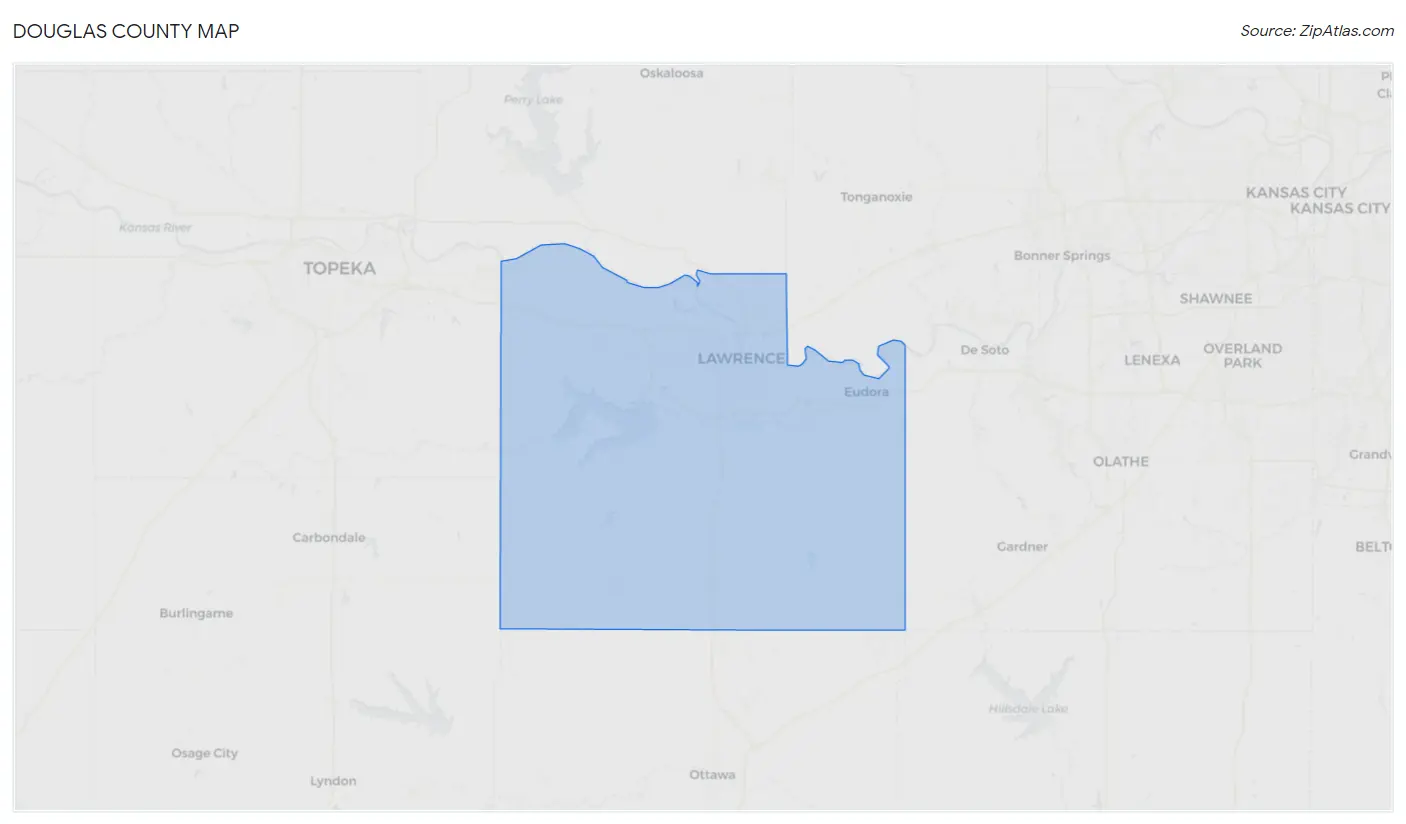
Douglas County Map
Douglas County Overview
119,094
TOTAL POPULATION
59,385
MALE POPULATION
59,709
FEMALE POPULATION
99.46
MALES / 100 FEMALES
100.55
FEMALES / 100 MALES
30.7
MEDIAN AGE
2.9
AVG FAMILY SIZE
2.2
AVG HOUSEHOLD SIZE
$37,261
PER CAPITA INCOME
$101,379
AVG FAMILY INCOME
$66,153
AVG HOUSEHOLD INCOME
25.6%
WAGE / INCOME GAP [ % ]
74.4¢/ $1
WAGE / INCOME GAP [ $ ]
$11,997
FAMILY INCOME DEFICIT
0.46
INEQUALITY / GINI INDEX
70,386
LABOR FORCE [ PEOPLE ]
70.4%
PERCENT IN LABOR FORCE
4.8%
UNEMPLOYMENT RATE
Douglas County Area Codes
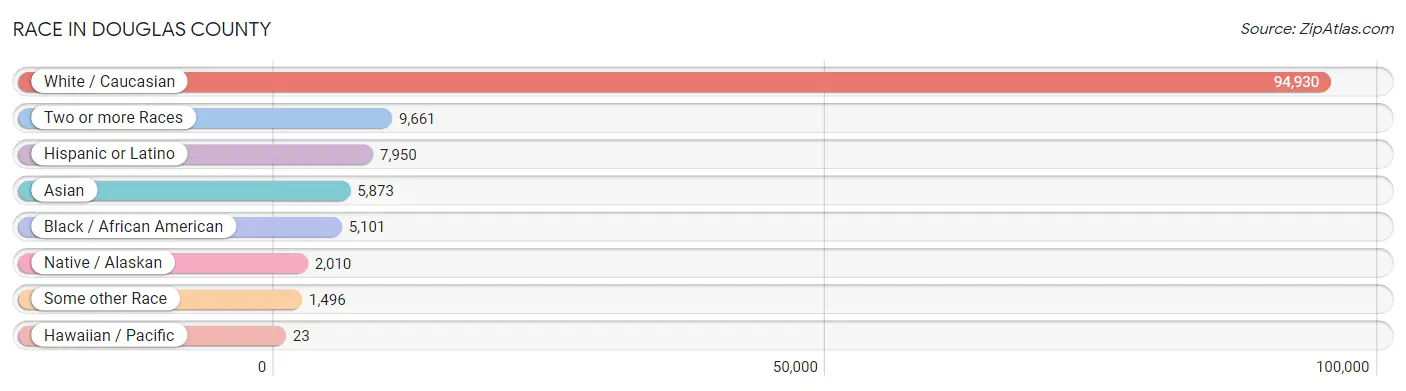
Race in Douglas County
The most populous races in Douglas County are White / Caucasian (94,930 | 79.7%), Two or more Races (9,661 | 8.1%), and Hispanic or Latino (7,950 | 6.7%).
| Race | # Population | % Population |
| Asian | 5,873 | 4.9% |
| Black / African American | 5,101 | 4.3% |
| Hawaiian / Pacific | 23 | 0.0% |
| Hispanic or Latino | 7,950 | 6.7% |
| Native / Alaskan | 2,010 | 1.7% |
| White / Caucasian | 94,930 | 79.7% |
| Two or more Races | 9,661 | 8.1% |
| Some other Race | 1,496 | 1.3% |
| Total | 119,094 | 100.0% |
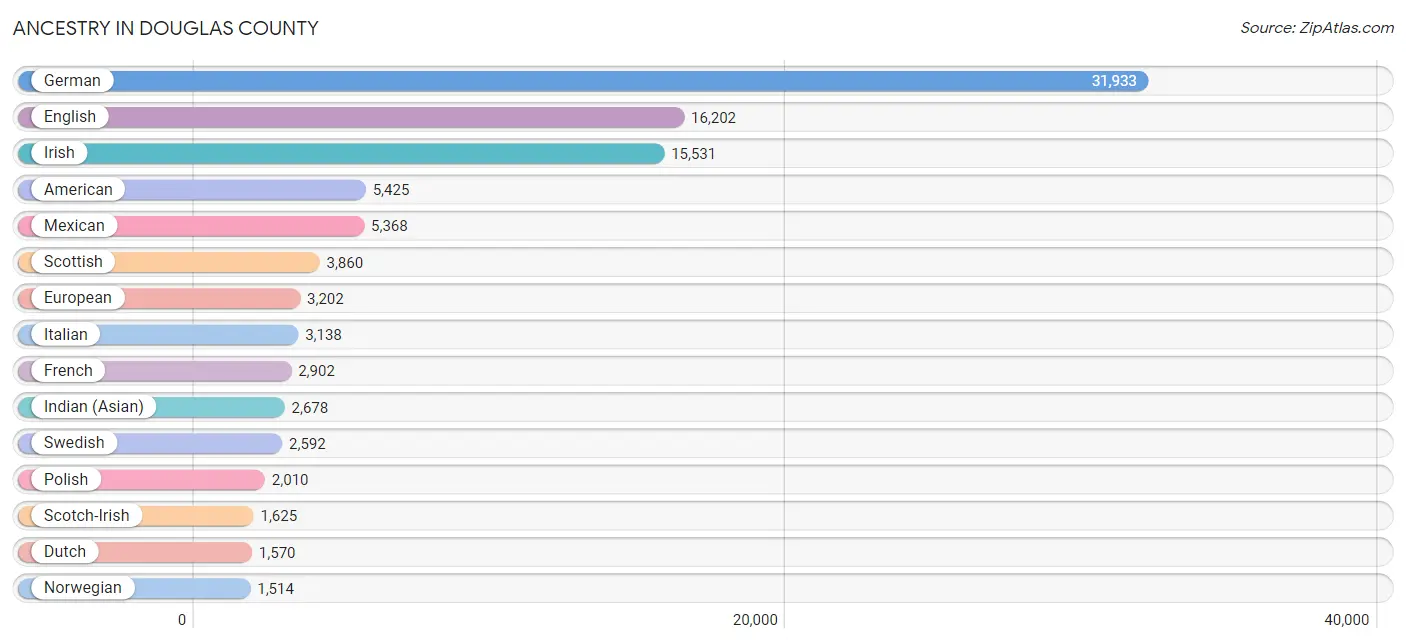
Ancestry in Douglas County
The most populous ancestries reported in Douglas County are German (31,933 | 26.8%), English (16,202 | 13.6%), Irish (15,531 | 13.0%), American (5,425 | 4.6%), and Mexican (5,368 | 4.5%), together accounting for 62.5% of all Douglas County residents.
| Ancestry | # Population | % Population |
| African | 205 | 0.2% |
| American | 5,425 | 4.6% |
| Apache | 58 | 0.1% |
| Arab | 898 | 0.7% |
| Argentinean | 53 | 0.0% |
| Australian | 18 | 0.0% |
| Austrian | 325 | 0.3% |
| Barbadian | 20 | 0.0% |
| Belgian | 430 | 0.4% |
| Bhutanese | 300 | 0.3% |
| Blackfeet | 203 | 0.2% |
| Brazilian | 112 | 0.1% |
| British | 983 | 0.8% |
| Bulgarian | 45 | 0.0% |
| Burmese | 503 | 0.4% |
| Cajun | 28 | 0.0% |
| Canadian | 137 | 0.1% |
| Cape Verdean | 7 | 0.0% |
| Carpatho Rusyn | 9 | 0.0% |
| Celtic | 32 | 0.0% |
| Central American | 303 | 0.3% |
| Central American Indian | 171 | 0.1% |
| Cherokee | 739 | 0.6% |
| Cheyenne | 84 | 0.1% |
| Chickasaw | 98 | 0.1% |
| Chippewa | 74 | 0.1% |
| Choctaw | 158 | 0.1% |
| Colombian | 135 | 0.1% |
| Comanche | 159 | 0.1% |
| Costa Rican | 50 | 0.0% |
| Creek | 197 | 0.2% |
| Croatian | 273 | 0.2% |
| Crow | 83 | 0.1% |
| Cuban | 96 | 0.1% |
| Czech | 1,230 | 1.0% |
| Czechoslovakian | 231 | 0.2% |
| Danish | 663 | 0.6% |
| Delaware | 82 | 0.1% |
| Dominican | 42 | 0.0% |
| Dutch | 1,570 | 1.3% |
| Eastern European | 196 | 0.2% |
| Ecuadorian | 29 | 0.0% |
| Egyptian | 69 | 0.1% |
| English | 16,202 | 13.6% |
| Ethiopian | 27 | 0.0% |
| European | 3,202 | 2.7% |
| Filipino | 58 | 0.1% |
| Finnish | 129 | 0.1% |
| French | 2,902 | 2.4% |
| French American Indian | 87 | 0.1% |
| French Canadian | 377 | 0.3% |
| German | 31,933 | 26.8% |
| German Russian | 12 | 0.0% |
| Greek | 340 | 0.3% |
| Guatemalan | 21 | 0.0% |
| Honduran | 112 | 0.1% |
| Hungarian | 409 | 0.3% |
| Indian (Asian) | 2,678 | 2.2% |
| Indonesian | 29 | 0.0% |
| Inupiat | 8 | 0.0% |
| Iranian | 122 | 0.1% |
| Iraqi | 391 | 0.3% |
| Irish | 15,531 | 13.0% |
| Iroquois | 56 | 0.1% |
| Israeli | 12 | 0.0% |
| Italian | 3,138 | 2.6% |
| Jamaican | 132 | 0.1% |
| Japanese | 39 | 0.0% |
| Jordanian | 80 | 0.1% |
| Kiowa | 86 | 0.1% |
| Korean | 694 | 0.6% |
| Latvian | 32 | 0.0% |
| Lebanese | 30 | 0.0% |
| Lithuanian | 72 | 0.1% |
| Luxembourger | 60 | 0.1% |
| Macedonian | 23 | 0.0% |
| Malaysian | 421 | 0.4% |
| Mexican | 5,368 | 4.5% |
| Mexican American Indian | 32 | 0.0% |
| Mongolian | 33 | 0.0% |
| Native Hawaiian | 108 | 0.1% |
| Navajo | 276 | 0.2% |
| Nicaraguan | 17 | 0.0% |
| Nigerian | 207 | 0.2% |
| Northern European | 220 | 0.2% |
| Norwegian | 1,514 | 1.3% |
| Osage | 2 | 0.0% |
| Paiute | 21 | 0.0% |
| Pakistani | 139 | 0.1% |
| Palestinian | 29 | 0.0% |
| Panamanian | 27 | 0.0% |
| Pennsylvania German | 49 | 0.0% |
| Peruvian | 114 | 0.1% |
| Polish | 2,010 | 1.7% |
| Portuguese | 65 | 0.1% |
| Potawatomi | 156 | 0.1% |
| Pueblo | 80 | 0.1% |
| Puerto Rican | 841 | 0.7% |
| Romanian | 33 | 0.0% |
| Russian | 723 | 0.6% |
| Salvadoran | 76 | 0.1% |
| Samoan | 36 | 0.0% |
| Scandinavian | 631 | 0.5% |
| Scotch-Irish | 1,625 | 1.4% |
| Scottish | 3,860 | 3.2% |
| Seminole | 38 | 0.0% |
| Senegalese | 426 | 0.4% |
| Serbian | 35 | 0.0% |
| Shoshone | 25 | 0.0% |
| Sioux | 515 | 0.4% |
| Slavic | 80 | 0.1% |
| Slovak | 34 | 0.0% |
| Slovene | 45 | 0.0% |
| South American | 504 | 0.4% |
| South American Indian | 22 | 0.0% |
| Spaniard | 301 | 0.3% |
| Spanish | 156 | 0.1% |
| Sri Lankan | 1,367 | 1.1% |
| Subsaharan African | 859 | 0.7% |
| Swedish | 2,592 | 2.2% |
| Swiss | 664 | 0.6% |
| Syrian | 159 | 0.1% |
| Thai | 725 | 0.6% |
| Tohono O'Odham | 18 | 0.0% |
| Tongan | 4 | 0.0% |
| Turkish | 54 | 0.1% |
| Ukrainian | 256 | 0.2% |
| Venezuelan | 161 | 0.1% |
| Vietnamese | 30 | 0.0% |
| Welsh | 1,179 | 1.0% |
| Yakama | 3 | 0.0% |
| Yugoslavian | 17 | 0.0% |
| Yuman | 34 | 0.0% |
| Yup'ik | 25 | 0.0% | View All 134 Rows |
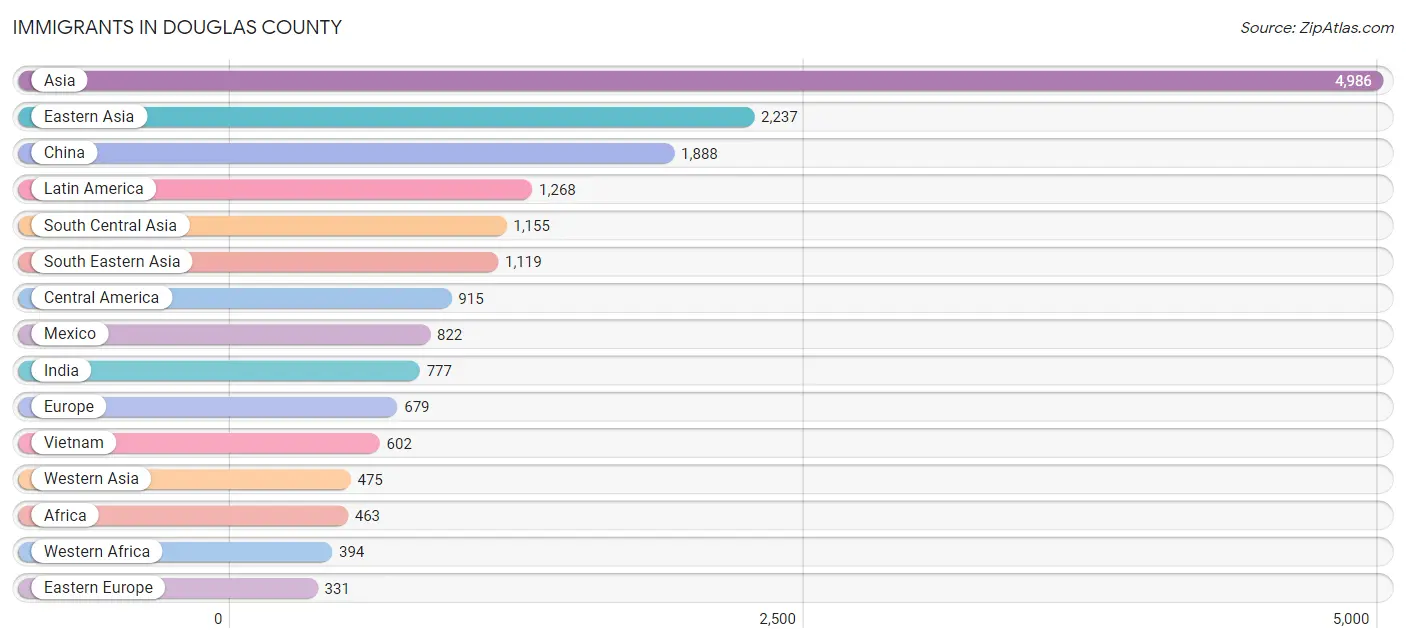
Immigrants in Douglas County
The most numerous immigrant groups reported in Douglas County came from Asia (4,986 | 4.2%), Eastern Asia (2,237 | 1.9%), China (1,888 | 1.6%), Latin America (1,268 | 1.1%), and South Central Asia (1,155 | 1.0%), together accounting for 9.7% of all Douglas County residents.
| Immigration Origin | # Population | % Population |
| Africa | 463 | 0.4% |
| Asia | 4,986 | 4.2% |
| Bolivia | 12 | 0.0% |
| Brazil | 130 | 0.1% |
| Bulgaria | 45 | 0.0% |
| Canada | 262 | 0.2% |
| Caribbean | 33 | 0.0% |
| Central America | 915 | 0.8% |
| China | 1,888 | 1.6% |
| Colombia | 47 | 0.0% |
| Cuba | 33 | 0.0% |
| Czechoslovakia | 18 | 0.0% |
| Eastern Africa | 45 | 0.0% |
| Eastern Asia | 2,237 | 1.9% |
| Eastern Europe | 331 | 0.3% |
| Ecuador | 29 | 0.0% |
| El Salvador | 26 | 0.0% |
| England | 86 | 0.1% |
| Ethiopia | 24 | 0.0% |
| Europe | 679 | 0.6% |
| France | 23 | 0.0% |
| Germany | 116 | 0.1% |
| Honduras | 50 | 0.0% |
| India | 777 | 0.6% |
| Iran | 113 | 0.1% |
| Iraq | 96 | 0.1% |
| Japan | 185 | 0.2% |
| Jordan | 80 | 0.1% |
| Kazakhstan | 19 | 0.0% |
| Kenya | 12 | 0.0% |
| Korea | 164 | 0.1% |
| Kuwait | 112 | 0.1% |
| Laos | 226 | 0.2% |
| Latin America | 1,268 | 1.1% |
| Lebanon | 18 | 0.0% |
| Malaysia | 33 | 0.0% |
| Mexico | 822 | 0.7% |
| Nepal | 134 | 0.1% |
| Nicaragua | 17 | 0.0% |
| Nigeria | 57 | 0.1% |
| Northern Europe | 202 | 0.2% |
| Pakistan | 87 | 0.1% |
| Peru | 10 | 0.0% |
| Philippines | 198 | 0.2% |
| Poland | 50 | 0.0% |
| Romania | 11 | 0.0% |
| Russia | 56 | 0.1% |
| Saudi Arabia | 21 | 0.0% |
| Scotland | 39 | 0.0% |
| Senegal | 328 | 0.3% |
| Serbia | 35 | 0.0% |
| Singapore | 33 | 0.0% |
| South Africa | 24 | 0.0% |
| South America | 320 | 0.3% |
| South Central Asia | 1,155 | 1.0% |
| South Eastern Asia | 1,119 | 0.9% |
| Southern Europe | 7 | 0.0% |
| Spain | 7 | 0.0% |
| Sri Lanka | 8 | 0.0% |
| Sweden | 6 | 0.0% |
| Syria | 38 | 0.0% |
| Taiwan | 35 | 0.0% |
| Thailand | 27 | 0.0% |
| Ukraine | 50 | 0.0% |
| Uzbekistan | 2 | 0.0% |
| Venezuela | 92 | 0.1% |
| Vietnam | 602 | 0.5% |
| Western Africa | 394 | 0.3% |
| Western Asia | 475 | 0.4% |
| Western Europe | 139 | 0.1% |
| Zimbabwe | 9 | 0.0% | View All 71 Rows |
Sex and Age in Douglas County
Sex and Age in Douglas County
The most populous age groups in Douglas County are 20 to 24 Years (10,614 | 17.9%) for men and 20 to 24 Years (10,094 | 16.9%) for women.
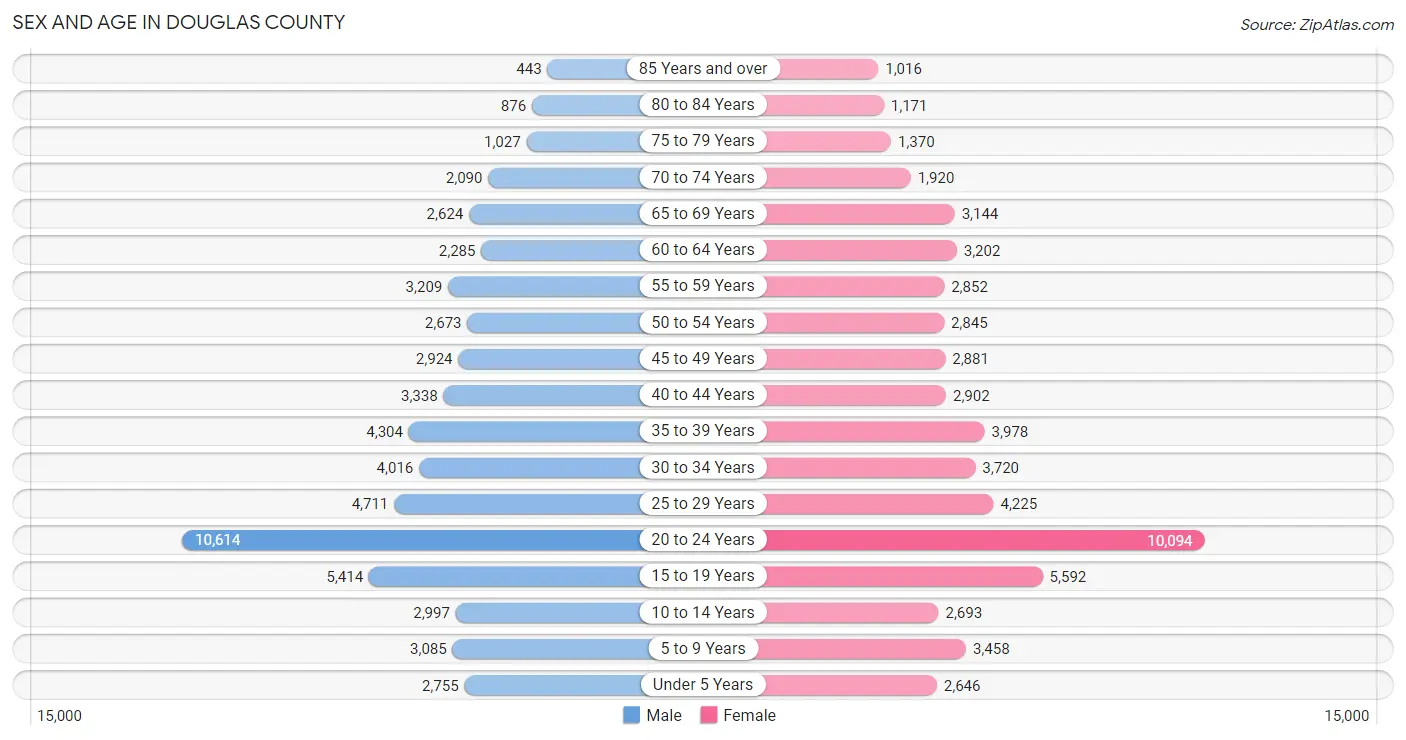
| Age Bracket | Male | Female |
| Under 5 Years | 2,755 (4.6%) | 2,646 (4.4%) |
| 5 to 9 Years | 3,085 (5.2%) | 3,458 (5.8%) |
| 10 to 14 Years | 2,997 (5.1%) | 2,693 (4.5%) |
| 15 to 19 Years | 5,414 (9.1%) | 5,592 (9.4%) |
| 20 to 24 Years | 10,614 (17.9%) | 10,094 (16.9%) |
| 25 to 29 Years | 4,711 (7.9%) | 4,225 (7.1%) |
| 30 to 34 Years | 4,016 (6.8%) | 3,720 (6.2%) |
| 35 to 39 Years | 4,304 (7.2%) | 3,978 (6.7%) |
| 40 to 44 Years | 3,338 (5.6%) | 2,902 (4.9%) |
| 45 to 49 Years | 2,924 (4.9%) | 2,881 (4.8%) |
| 50 to 54 Years | 2,673 (4.5%) | 2,845 (4.8%) |
| 55 to 59 Years | 3,209 (5.4%) | 2,852 (4.8%) |
| 60 to 64 Years | 2,285 (3.8%) | 3,202 (5.4%) |
| 65 to 69 Years | 2,624 (4.4%) | 3,144 (5.3%) |
| 70 to 74 Years | 2,090 (3.5%) | 1,920 (3.2%) |
| 75 to 79 Years | 1,027 (1.7%) | 1,370 (2.3%) |
| 80 to 84 Years | 876 (1.5%) | 1,171 (2.0%) |
| 85 Years and over | 443 (0.7%) | 1,016 (1.7%) |
| Total | 59,385 (100.0%) | 59,709 (100.0%) |
Families and Households in Douglas County
Median Family Size in Douglas County
The median family size in Douglas County is 2.86 persons per family, with married-couple families (20,631 | 80.4%) accounting for the largest median family size of 2.94 persons per family. On the other hand, single male/father families (1,600 | 6.2%) represent the smallest median family size with 2.20 persons per family.
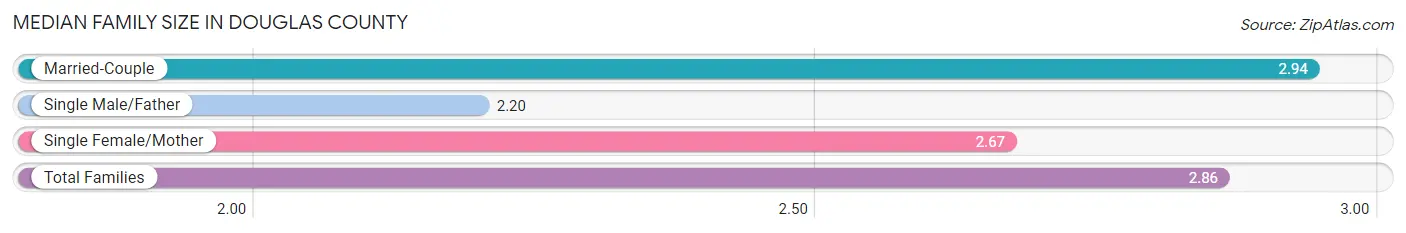
| Family Type | # Families | Family Size |
| Married-Couple | 20,631 (80.4%) | 2.94 |
| Single Male/Father | 1,600 (6.2%) | 2.20 |
| Single Female/Mother | 3,442 (13.4%) | 2.67 |
| Total Families | 25,673 (100.0%) | 2.86 |
Median Household Size in Douglas County
The median household size in Douglas County is 2.22 persons per household, with single female/mother households (3,442 | 6.9%) accounting for the largest median household size of 3.07 persons per household. non-family households (23,932 | 48.2%) represent the smallest median household size with 1.45 persons per household.
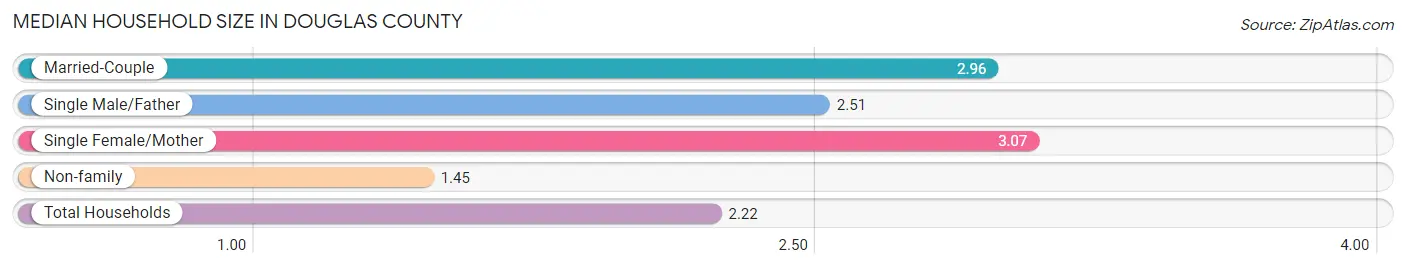
| Household Type | # Households | Household Size |
| Married-Couple | 20,631 (41.6%) | 2.96 |
| Single Male/Father | 1,600 (3.2%) | 2.51 |
| Single Female/Mother | 3,442 (6.9%) | 3.07 |
| Non-family | 23,932 (48.2%) | 1.45 |
| Total Households | 49,605 (100.0%) | 2.22 |
Household Size by Marriage Status in Douglas County
Out of a total of 49,605 households in Douglas County, 25,673 (51.7%) are family households, while 23,932 (48.2%) are nonfamily households. The most numerous type of family households are 2-person households, comprising 12,688, and the most common type of nonfamily households are 1-person households, comprising 15,494.
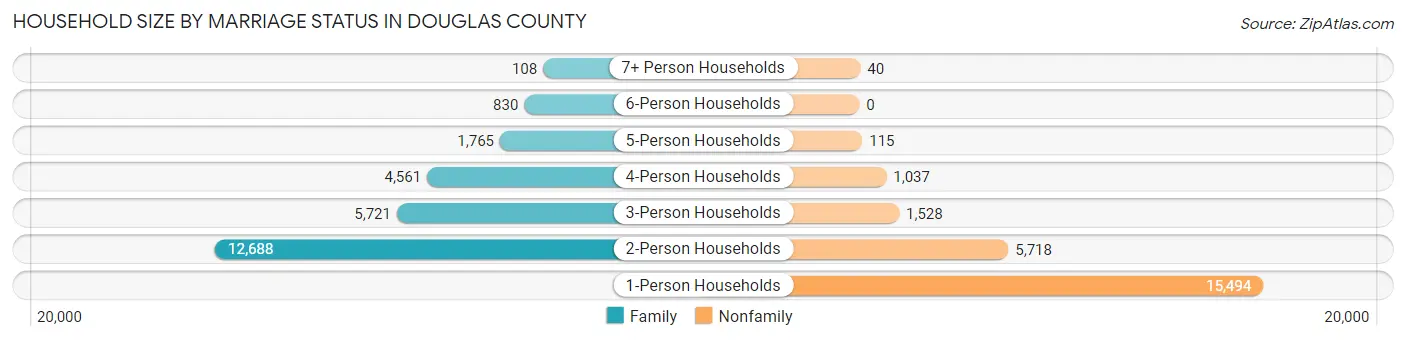
| Household Size | Family Households | Nonfamily Households |
| 1-Person Households | - | 15,494 (31.2%) |
| 2-Person Households | 12,688 (25.6%) | 5,718 (11.5%) |
| 3-Person Households | 5,721 (11.5%) | 1,528 (3.1%) |
| 4-Person Households | 4,561 (9.2%) | 1,037 (2.1%) |
| 5-Person Households | 1,765 (3.6%) | 115 (0.2%) |
| 6-Person Households | 830 (1.7%) | 0 (0.0%) |
| 7+ Person Households | 108 (0.2%) | 40 (0.1%) |
| Total | 25,673 (51.7%) | 23,932 (48.2%) |
Female Fertility in Douglas County
Fertility by Age in Douglas County
Average fertility rate in Douglas County is 36.0 births per 1,000 women. Women in the age bracket of 20 to 34 years have the highest fertility rate with 46.0 births per 1,000 women. Women in the age bracket of 20 to 34 years acount for 67.9% of all women with births.
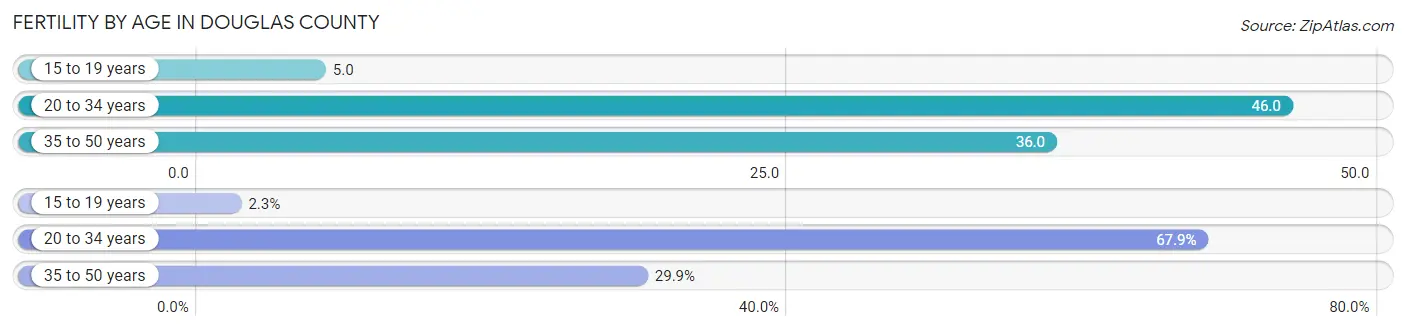
| Age Bracket | Women with Births | Births / 1,000 Women |
| 15 to 19 years | 28 (2.3%) | 5.0 |
| 20 to 34 years | 837 (67.9%) | 46.0 |
| 35 to 50 years | 368 (29.8%) | 36.0 |
| Total | 1,233 (100.0%) | 36.0 |
Fertility by Age by Marriage Status in Douglas County
83.3% of women with births (1,233) in Douglas County are married. The highest percentage of unmarried women with births falls into 15 to 19 years age bracket with 64.3% of them unmarried at the time of birth, while the lowest percentage of unmarried women with births belong to 35 to 50 years age bracket with 7.3% of them unmarried.
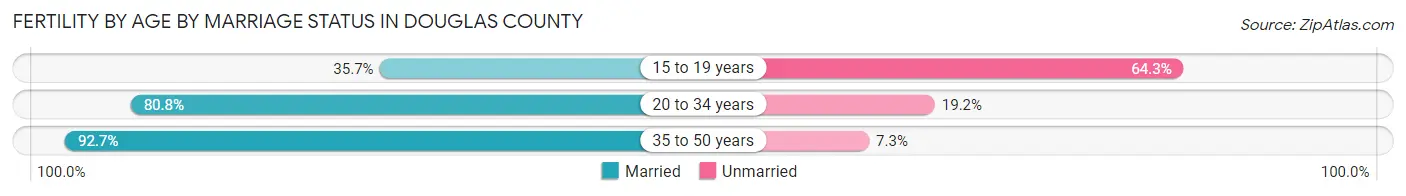
| Age Bracket | Married | Unmarried |
| 15 to 19 years | 10 (35.7%) | 18 (64.3%) |
| 20 to 34 years | 676 (80.8%) | 161 (19.2%) |
| 35 to 50 years | 341 (92.7%) | 27 (7.3%) |
| Total | 1,027 (83.3%) | 206 (16.7%) |
Fertility by Education in Douglas County
Average fertility rate in Douglas County is 36.0 births per 1,000 women. Women with the education attainment of graduate degree have the highest fertility rate of 78.0 births per 1,000 women, while women with the education attainment of less than high school have the lowest fertility at 13.0 births per 1,000 women. Women with the education attainment of bachelor's degree represent 43.4% of all women with births.
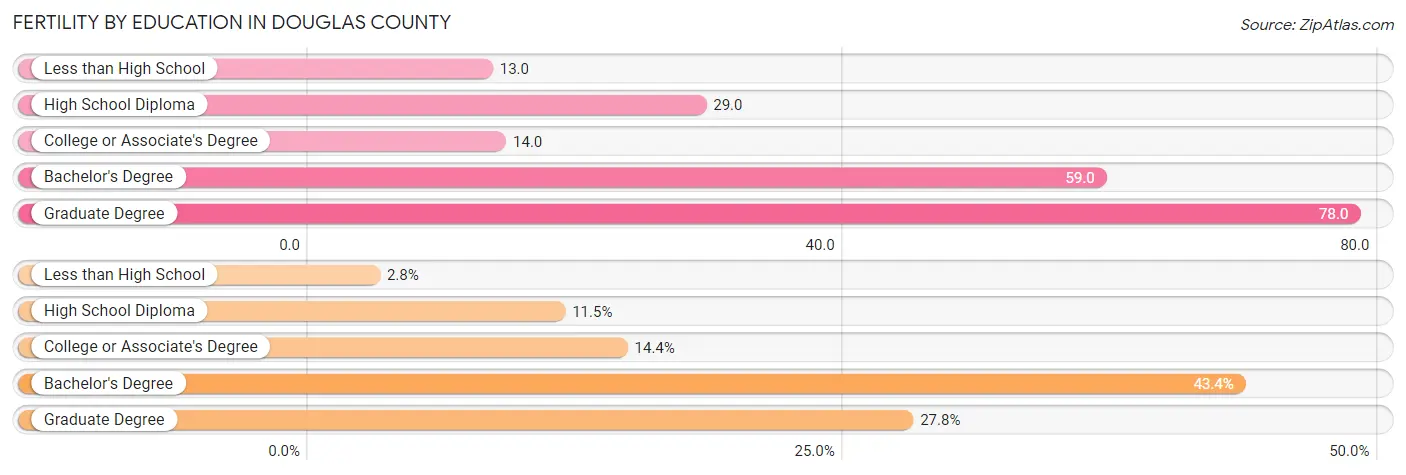
| Educational Attainment | Women with Births | Births / 1,000 Women |
| Less than High School | 35 (2.8%) | 13.0 |
| High School Diploma | 142 (11.5%) | 29.0 |
| College or Associate's Degree | 178 (14.4%) | 14.0 |
| Bachelor's Degree | 535 (43.4%) | 59.0 |
| Graduate Degree | 343 (27.8%) | 78.0 |
| Total | 1,233 (100.0%) | 36.0 |
Fertility by Education by Marriage Status in Douglas County
16.7% of women with births in Douglas County are unmarried. Women with the educational attainment of graduate degree are most likely to be married with 100.0% of them married at childbirth, while women with the educational attainment of less than high school are least likely to be married with 71.4% of them unmarried at childbirth.
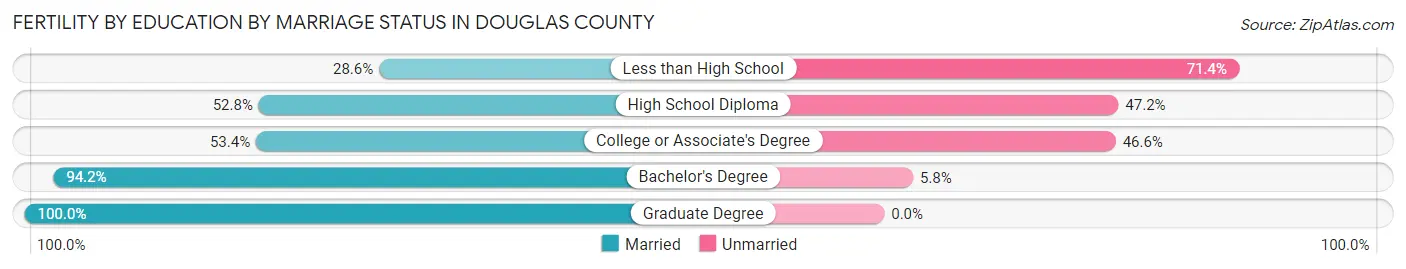
| Educational Attainment | Married | Unmarried |
| Less than High School | 10 (28.6%) | 25 (71.4%) |
| High School Diploma | 75 (52.8%) | 67 (47.2%) |
| College or Associate's Degree | 95 (53.4%) | 83 (46.6%) |
| Bachelor's Degree | 504 (94.2%) | 31 (5.8%) |
| Graduate Degree | 343 (100.0%) | 0 (0.0%) |
| Total | 1,027 (83.3%) | 206 (16.7%) |
Income in Douglas County
Income Overview in Douglas County
Per Capita Income in Douglas County is $37,261, while median incomes of families and households are $101,379 and $66,153 respectively.
| Characteristic | Number | Measure |
| Per Capita Income | 119,094 | $37,261 |
| Median Family Income | 25,673 | $101,379 |
| Mean Family Income | 25,673 | $121,293 |
| Median Household Income | 49,605 | $66,153 |
| Mean Household Income | 49,605 | $89,488 |
| Income Deficit | 25,673 | $11,997 |
| Wage / Income Gap (%) | 119,094 | 25.59% |
| Wage / Income Gap ($) | 119,094 | 74.41¢ per $1 |
| Gini / Inequality Index | 119,094 | 0.46 |
Earnings by Sex in Douglas County
Average Earnings in Douglas County are $31,737, $36,825 for men and $27,402 for women, a difference of 25.6%.
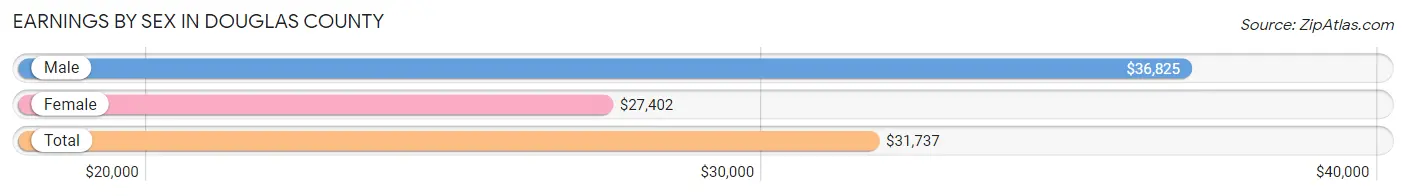
| Sex | Number | Average Earnings |
| Male | 39,845 (51.8%) | $36,825 |
| Female | 37,001 (48.1%) | $27,402 |
| Total | 76,846 (100.0%) | $31,737 |
Earnings by Sex by Income Bracket in Douglas County
The most common earnings brackets in Douglas County are $100,000+ for men (5,560 | 14.0%) and $2,499 or less for women (3,540 | 9.6%).
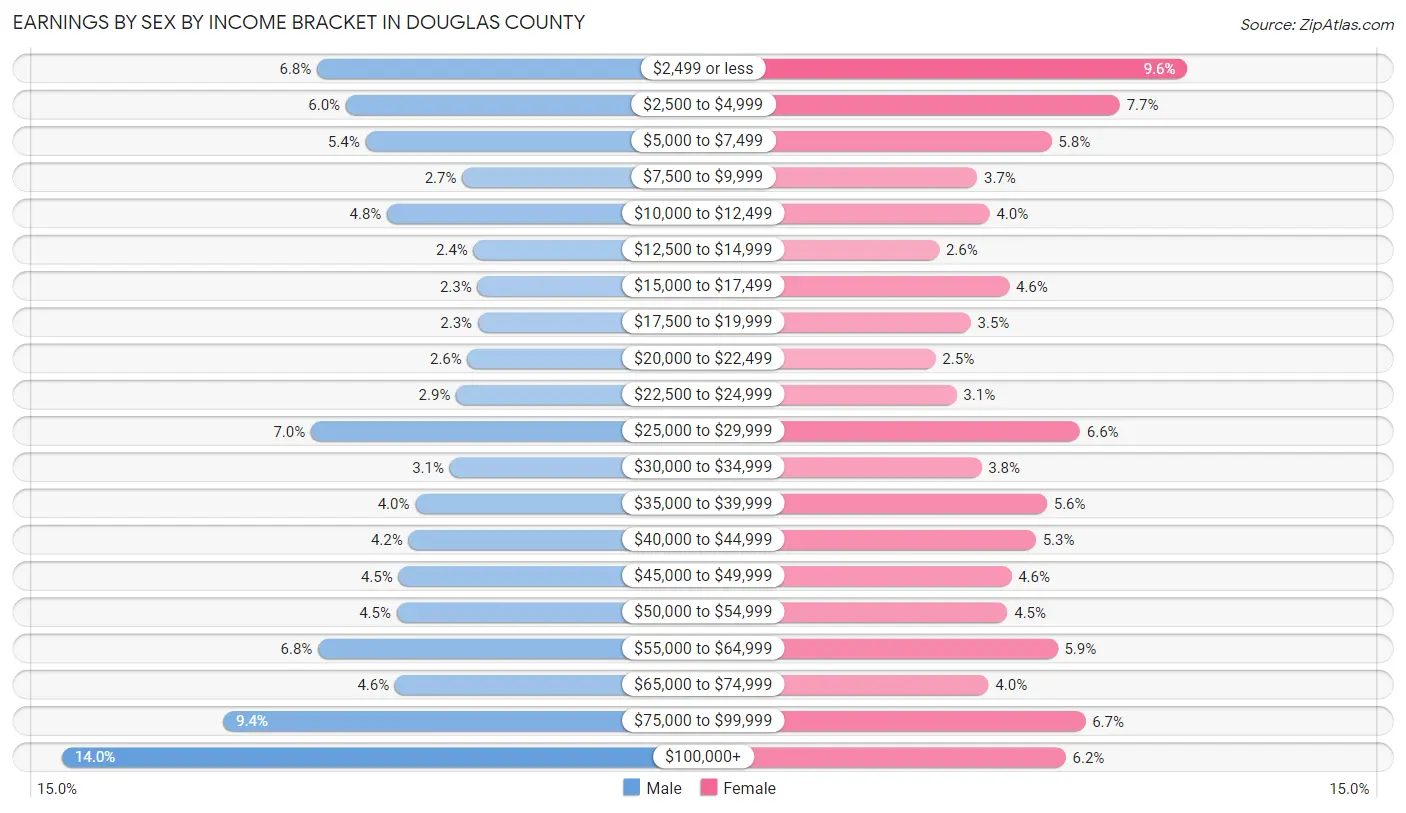
| Income | Male | Female |
| $2,499 or less | 2,703 (6.8%) | 3,540 (9.6%) |
| $2,500 to $4,999 | 2,380 (6.0%) | 2,837 (7.7%) |
| $5,000 to $7,499 | 2,161 (5.4%) | 2,127 (5.8%) |
| $7,500 to $9,999 | 1,076 (2.7%) | 1,355 (3.7%) |
| $10,000 to $12,499 | 1,917 (4.8%) | 1,485 (4.0%) |
| $12,500 to $14,999 | 950 (2.4%) | 959 (2.6%) |
| $15,000 to $17,499 | 904 (2.3%) | 1,686 (4.6%) |
| $17,500 to $19,999 | 902 (2.3%) | 1,288 (3.5%) |
| $20,000 to $22,499 | 1,018 (2.5%) | 923 (2.5%) |
| $22,500 to $24,999 | 1,145 (2.9%) | 1,138 (3.1%) |
| $25,000 to $29,999 | 2,768 (7.0%) | 2,424 (6.6%) |
| $30,000 to $34,999 | 1,215 (3.0%) | 1,400 (3.8%) |
| $35,000 to $39,999 | 1,602 (4.0%) | 2,079 (5.6%) |
| $40,000 to $44,999 | 1,676 (4.2%) | 1,965 (5.3%) |
| $45,000 to $49,999 | 1,790 (4.5%) | 1,709 (4.6%) |
| $50,000 to $54,999 | 1,809 (4.5%) | 1,670 (4.5%) |
| $55,000 to $64,999 | 2,690 (6.8%) | 2,190 (5.9%) |
| $65,000 to $74,999 | 1,827 (4.6%) | 1,474 (4.0%) |
| $75,000 to $99,999 | 3,752 (9.4%) | 2,478 (6.7%) |
| $100,000+ | 5,560 (14.0%) | 2,274 (6.1%) |
| Total | 39,845 (100.0%) | 37,001 (100.0%) |
Earnings by Sex by Educational Attainment in Douglas County
Average earnings in Douglas County are $53,617 for men and $43,041 for women, a difference of 19.7%. Men with an educational attainment of graduate degree enjoy the highest average annual earnings of $74,966, while those with less than high school education earn the least with $38,886. Women with an educational attainment of graduate degree earn the most with the average annual earnings of $60,023, while those with less than high school education have the smallest earnings of $17,028.
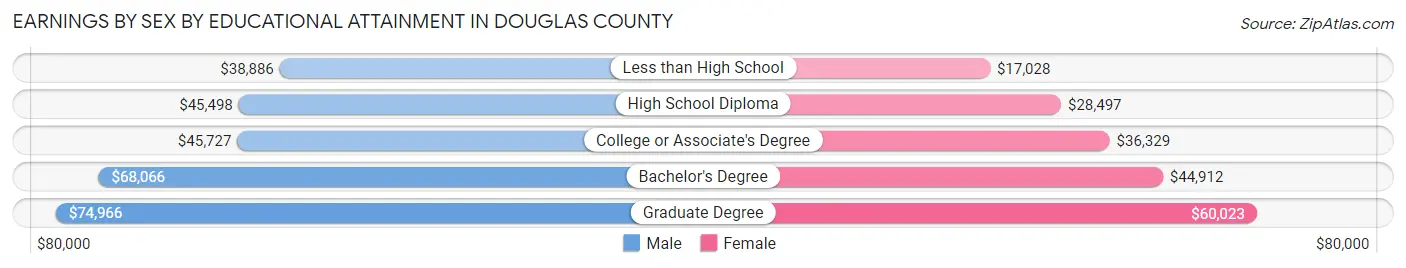
| Educational Attainment | Male Income | Female Income |
| Less than High School | $38,886 | $17,028 |
| High School Diploma | $45,498 | $28,497 |
| College or Associate's Degree | $45,727 | $36,329 |
| Bachelor's Degree | $68,066 | $44,912 |
| Graduate Degree | $74,966 | $60,023 |
| Total | $53,617 | $43,041 |
Family Income in Douglas County
Family Income Brackets in Douglas County
According to the Douglas County family income data, there are 5,725 families falling into the $100,000 to $149,999 income range, which is the most common income bracket and makes up 22.3% of all families. Conversely, the $10,000 to $14,999 income bracket is the least frequent group with only 359 families (1.4%) belonging to this category.
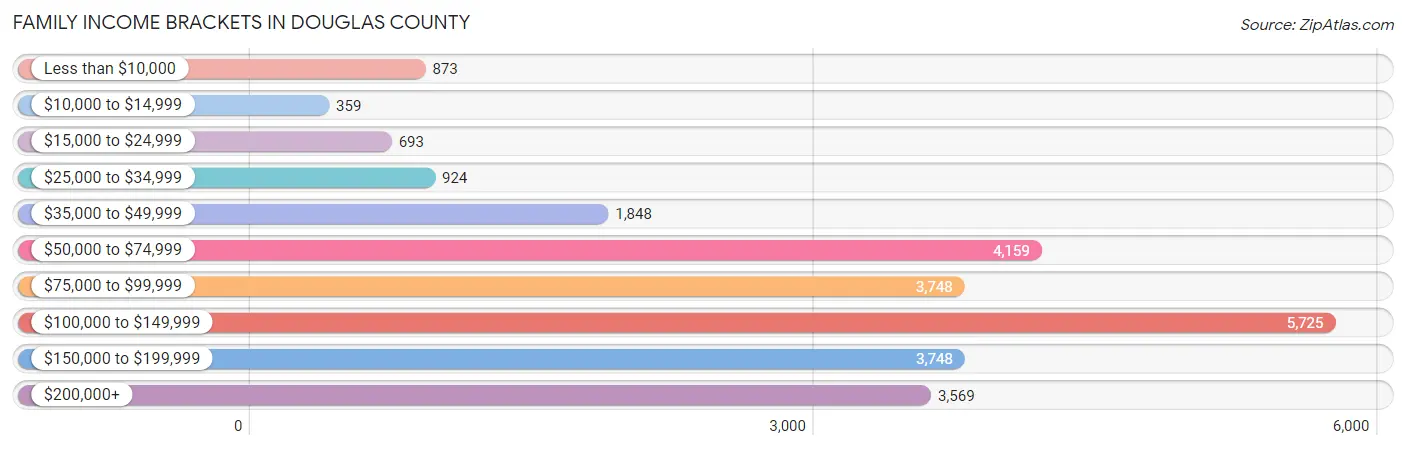
| Income Bracket | # Families | % Families |
| Less than $10,000 | 873 | 3.4% |
| $10,000 to $14,999 | 359 | 1.4% |
| $15,000 to $24,999 | 693 | 2.7% |
| $25,000 to $34,999 | 924 | 3.6% |
| $35,000 to $49,999 | 1,848 | 7.2% |
| $50,000 to $74,999 | 4,159 | 16.2% |
| $75,000 to $99,999 | 3,748 | 14.6% |
| $100,000 to $149,999 | 5,725 | 22.3% |
| $150,000 to $199,999 | 3,748 | 14.6% |
| $200,000+ | 3,569 | 13.9% |
Family Income by Famaliy Size in Douglas County
7+ person families (108 | 0.4%) account for the highest median family income in Douglas County with $205,848 per family, while 2-person families (13,989 | 54.5%) have the highest median income of $44,072 per family member.
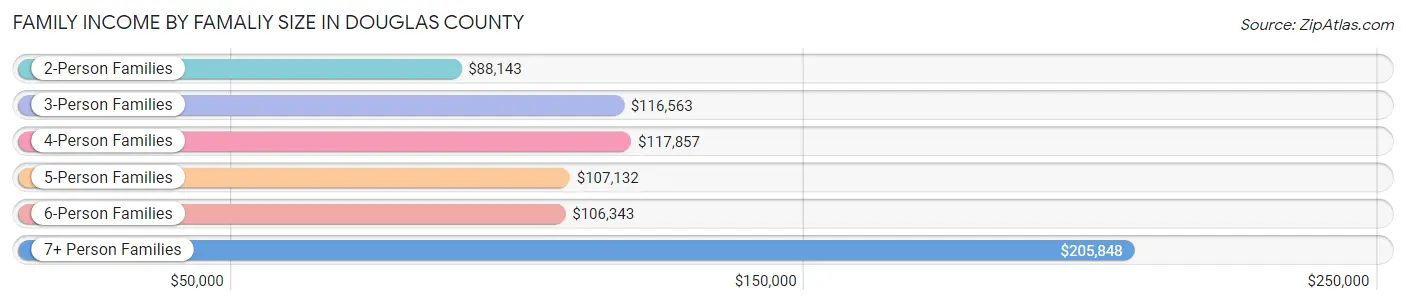
| Income Bracket | # Families | Median Income |
| 2-Person Families | 13,989 (54.5%) | $88,143 |
| 3-Person Families | 4,854 (18.9%) | $116,563 |
| 4-Person Families | 4,360 (17.0%) | $117,857 |
| 5-Person Families | 1,691 (6.6%) | $107,132 |
| 6-Person Families | 671 (2.6%) | $106,343 |
| 7+ Person Families | 108 (0.4%) | $205,848 |
| Total | 25,673 (100.0%) | $101,379 |
Family Income by Number of Earners in Douglas County
The median family income in Douglas County is $101,379, with families comprising 3+ earners (2,429) having the highest median family income of $142,188, while families with 1 earner (6,924) have the lowest median family income of $65,270, accounting for 9.5% and 27.0% of families, respectively.
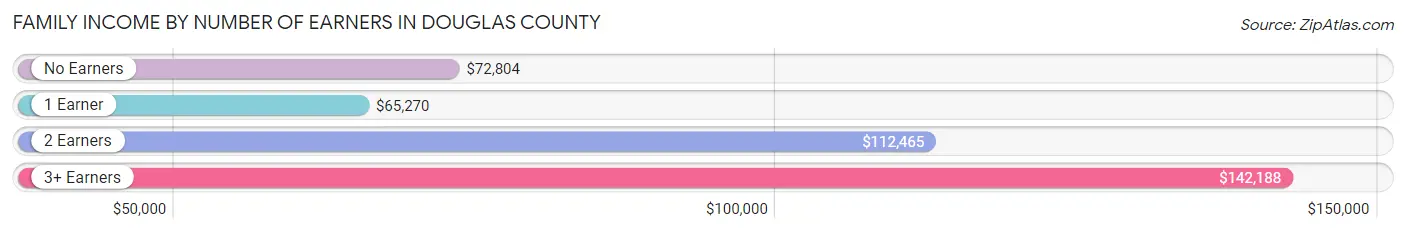
| Number of Earners | # Families | Median Income |
| No Earners | 3,642 (14.2%) | $72,804 |
| 1 Earner | 6,924 (27.0%) | $65,270 |
| 2 Earners | 12,678 (49.4%) | $112,465 |
| 3+ Earners | 2,429 (9.5%) | $142,188 |
| Total | 25,673 (100.0%) | $101,379 |
Household Income in Douglas County
Household Income Brackets in Douglas County
With 8,185 households falling in the category, the $50,000 to $74,999 income range is the most frequent in Douglas County, accounting for 16.5% of all households. In contrast, only 1,637 households (3.3%) fall into the $10,000 to $14,999 income bracket, making it the least populous group.
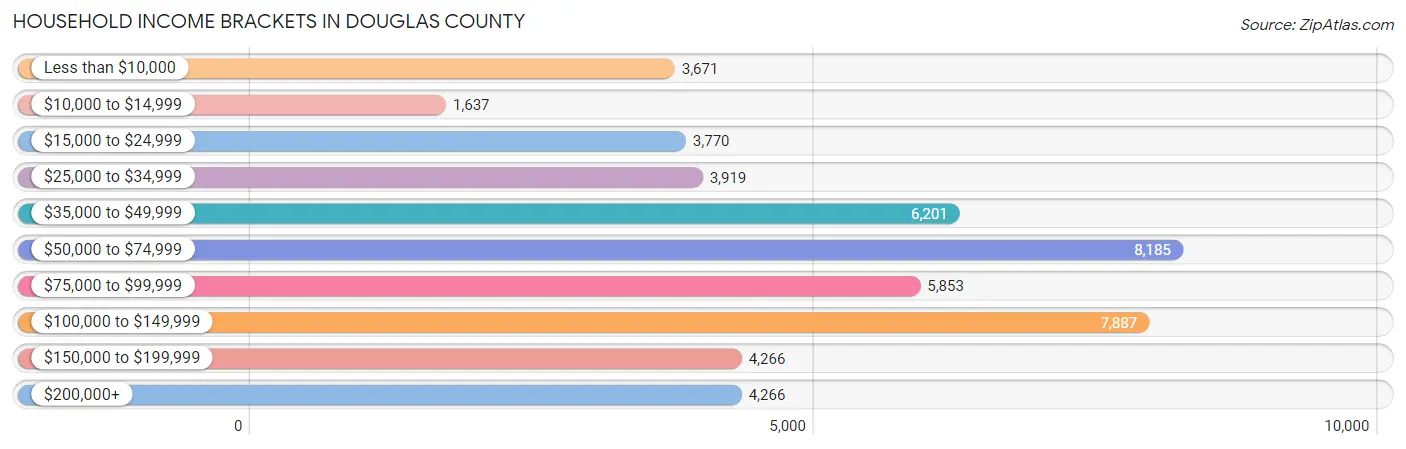
| Income Bracket | # Households | % Households |
| Less than $10,000 | 3,671 | 7.4% |
| $10,000 to $14,999 | 1,637 | 3.3% |
| $15,000 to $24,999 | 3,770 | 7.6% |
| $25,000 to $34,999 | 3,919 | 7.9% |
| $35,000 to $49,999 | 6,201 | 12.5% |
| $50,000 to $74,999 | 8,185 | 16.5% |
| $75,000 to $99,999 | 5,853 | 11.8% |
| $100,000 to $149,999 | 7,887 | 15.9% |
| $150,000 to $199,999 | 4,266 | 8.6% |
| $200,000+ | 4,266 | 8.6% |
Household Income by Householder Age in Douglas County
The median household income in Douglas County is $66,153, with the highest median household income of $91,579 found in the 45 to 64 years age bracket for the primary householder. A total of 13,013 households (26.2%) fall into this category. Meanwhile, the 15 to 24 years age bracket for the primary householder has the lowest median household income of $30,960, with 8,759 households (17.7%) in this group.
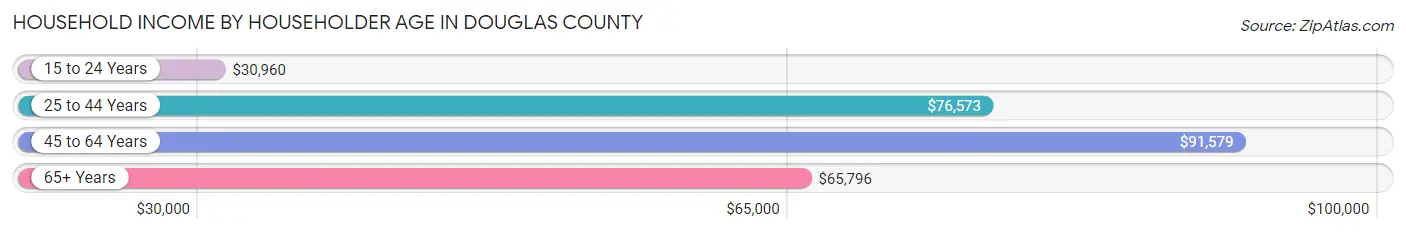
| Income Bracket | # Households | Median Income |
| 15 to 24 Years | 8,759 (17.7%) | $30,960 |
| 25 to 44 Years | 17,196 (34.7%) | $76,573 |
| 45 to 64 Years | 13,013 (26.2%) | $91,579 |
| 65+ Years | 10,637 (21.4%) | $65,796 |
| Total | 49,605 (100.0%) | $66,153 |
Poverty in Douglas County
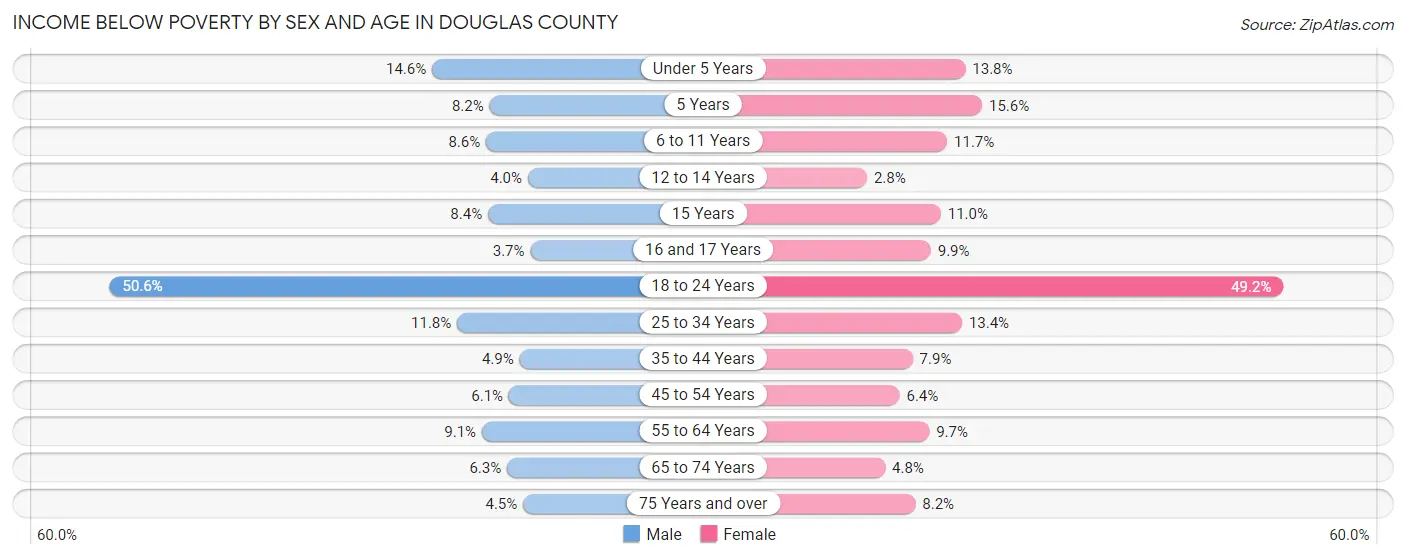
Income Below Poverty by Sex and Age in Douglas County
With 16.0% poverty level for males and 16.6% for females among the residents of Douglas County, 18 to 24 year old males and 18 to 24 year old females are the most vulnerable to poverty, with 5,292 males (50.5%) and 4,946 females (49.2%) in their respective age groups living below the poverty level.
| Age Bracket | Male | Female |
| Under 5 Years | 397 (14.6%) | 364 (13.8%) |
| 5 Years | 53 (8.2%) | 117 (15.6%) |
| 6 to 11 Years | 326 (8.6%) | 452 (11.7%) |
| 12 to 14 Years | 62 (4.0%) | 41 (2.8%) |
| 15 Years | 66 (8.4%) | 76 (11.0%) |
| 16 and 17 Years | 41 (3.7%) | 87 (9.9%) |
| 18 to 24 Years | 5,292 (50.5%) | 4,946 (49.2%) |
| 25 to 34 Years | 1,020 (11.8%) | 1,056 (13.4%) |
| 35 to 44 Years | 371 (4.9%) | 543 (7.9%) |
| 45 to 54 Years | 338 (6.1%) | 367 (6.4%) |
| 55 to 64 Years | 498 (9.1%) | 585 (9.7%) |
| 65 to 74 Years | 294 (6.3%) | 242 (4.8%) |
| 75 Years and over | 102 (4.5%) | 281 (8.2%) |
| Total | 8,860 (16.0%) | 9,157 (16.6%) |
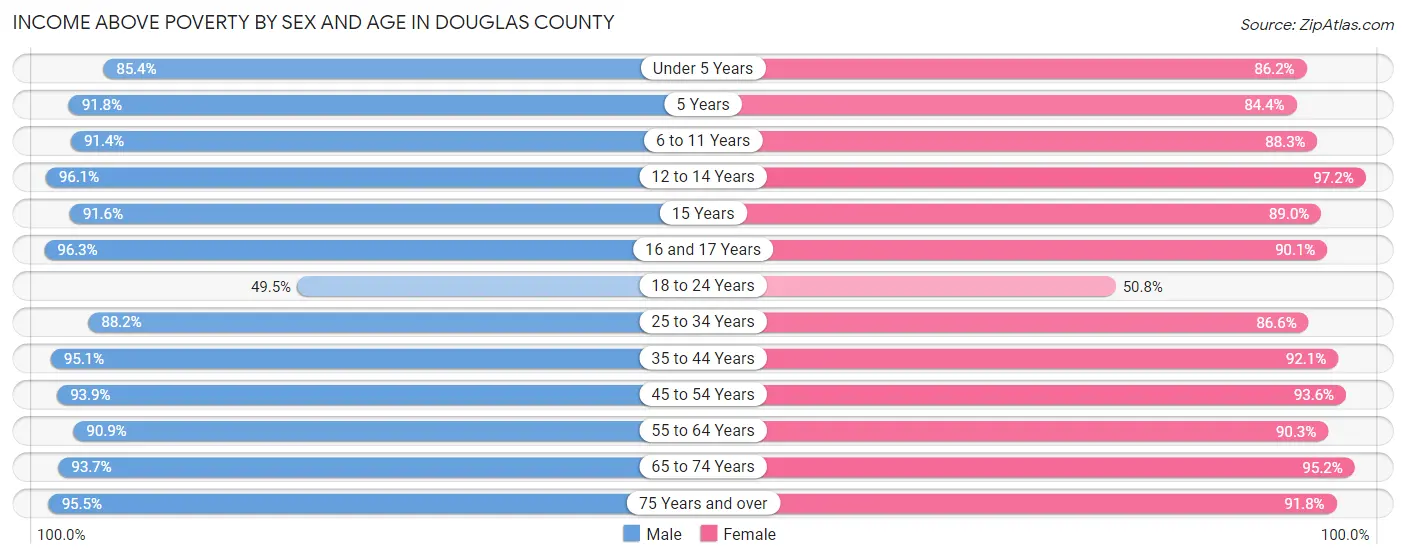
Income Above Poverty by Sex and Age in Douglas County
According to the poverty statistics in Douglas County, males aged 16 and 17 years and females aged 12 to 14 years are the age groups that are most secure financially, with 96.3% of males and 97.2% of females in these age groups living above the poverty line.
| Age Bracket | Male | Female |
| Under 5 Years | 2,319 (85.4%) | 2,282 (86.2%) |
| 5 Years | 592 (91.8%) | 632 (84.4%) |
| 6 to 11 Years | 3,460 (91.4%) | 3,401 (88.3%) |
| 12 to 14 Years | 1,506 (96.1%) | 1,421 (97.2%) |
| 15 Years | 721 (91.6%) | 613 (89.0%) |
| 16 and 17 Years | 1,076 (96.3%) | 791 (90.1%) |
| 18 to 24 Years | 5,176 (49.4%) | 5,115 (50.8%) |
| 25 to 34 Years | 7,604 (88.2%) | 6,835 (86.6%) |
| 35 to 44 Years | 7,228 (95.1%) | 6,337 (92.1%) |
| 45 to 54 Years | 5,240 (93.9%) | 5,341 (93.6%) |
| 55 to 64 Years | 4,995 (90.9%) | 5,423 (90.3%) |
| 65 to 74 Years | 4,396 (93.7%) | 4,774 (95.2%) |
| 75 Years and over | 2,174 (95.5%) | 3,149 (91.8%) |
| Total | 46,487 (84.0%) | 46,114 (83.4%) |
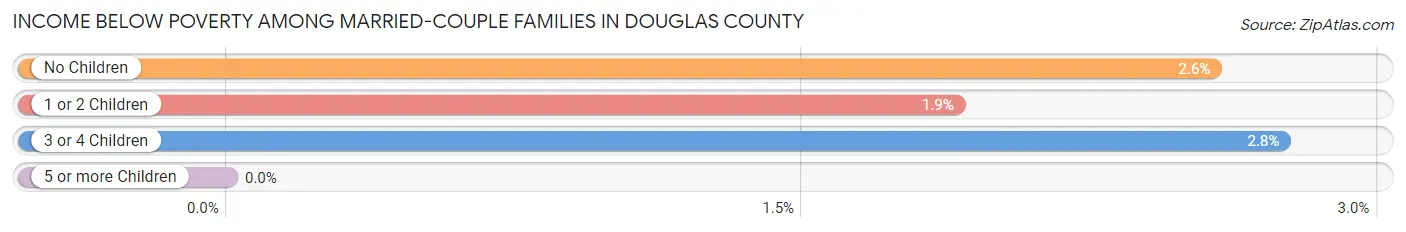
Income Below Poverty Among Married-Couple Families in Douglas County
The poverty statistics for married-couple families in Douglas County show that 2.4% or 488 of the total 20,631 families live below the poverty line. Families with 3 or 4 children have the highest poverty rate of 2.8%, comprising of 43 families. On the other hand, families with 5 or more children have the lowest poverty rate of 0.0%, which includes 0 families.
| Children | Above Poverty | Below Poverty |
| No Children | 12,150 (97.4%) | 320 (2.6%) |
| 1 or 2 Children | 6,443 (98.1%) | 125 (1.9%) |
| 3 or 4 Children | 1,521 (97.3%) | 43 (2.8%) |
| 5 or more Children | 29 (100.0%) | 0 (0.0%) |
| Total | 20,143 (97.6%) | 488 (2.4%) |
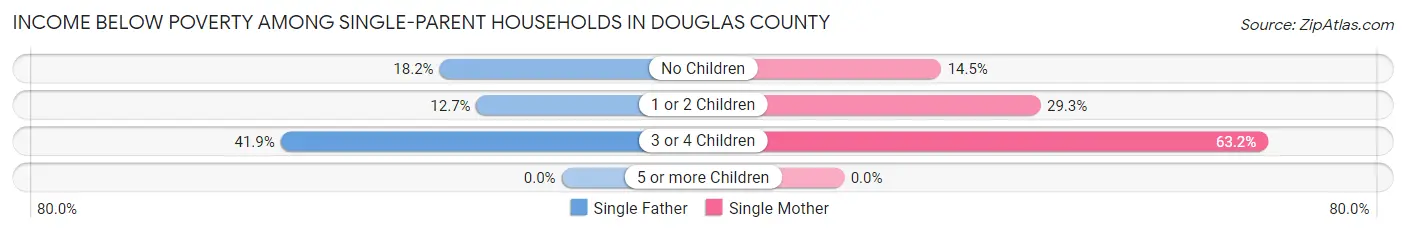
Income Below Poverty Among Single-Parent Households in Douglas County
According to the poverty data in Douglas County, 16.6% or 266 single-father households and 28.0% or 963 single-mother households are living below the poverty line. Among single-father households, those with 3 or 4 children have the highest poverty rate, with 18 households (41.9%) experiencing poverty. Likewise, among single-mother households, those with 3 or 4 children have the highest poverty rate, with 196 households (63.2%) falling below the poverty line.
| Children | Single Father | Single Mother |
| No Children | 167 (18.2%) | 146 (14.5%) |
| 1 or 2 Children | 81 (12.7%) | 621 (29.3%) |
| 3 or 4 Children | 18 (41.9%) | 196 (63.2%) |
| 5 or more Children | 0 (0.0%) | 0 (0.0%) |
| Total | 266 (16.6%) | 963 (28.0%) |
Income Below Poverty Among Married-Couple vs Single-Parent Households in Douglas County
The poverty data for Douglas County shows that 488 of the married-couple family households (2.4%) and 1,229 of the single-parent households (24.4%) are living below the poverty level. Within the married-couple family households, those with 3 or 4 children have the highest poverty rate, with 43 households (2.8%) falling below the poverty line. Among the single-parent households, those with 3 or 4 children have the highest poverty rate, with 214 household (60.6%) living below poverty.
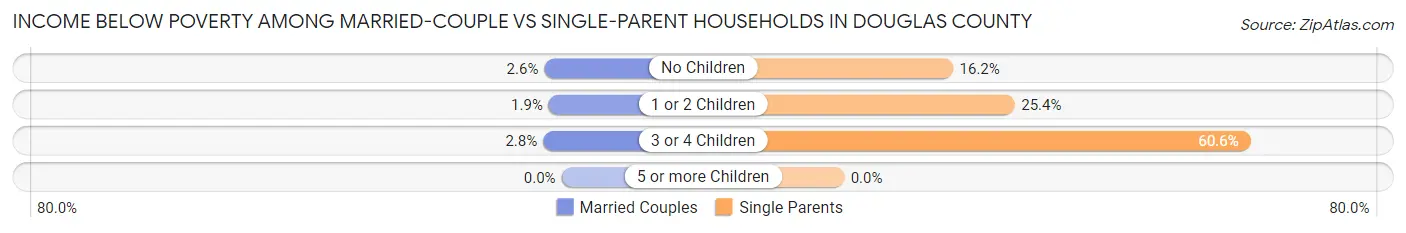
| Children | Married-Couple Families | Single-Parent Households |
| No Children | 320 (2.6%) | 313 (16.2%) |
| 1 or 2 Children | 125 (1.9%) | 702 (25.4%) |
| 3 or 4 Children | 43 (2.8%) | 214 (60.6%) |
| 5 or more Children | 0 (0.0%) | 0 (0.0%) |
| Total | 488 (2.4%) | 1,229 (24.4%) |
Employment Characteristics in Douglas County
Employment by Class of Employer in Douglas County
Among the 65,718 employed individuals in Douglas County, private company employees (40,328 | 61.4%), state government employees (8,532 | 13.0%), and not-for-profit organizations (6,654 | 10.1%) make up the most common classes of employment.
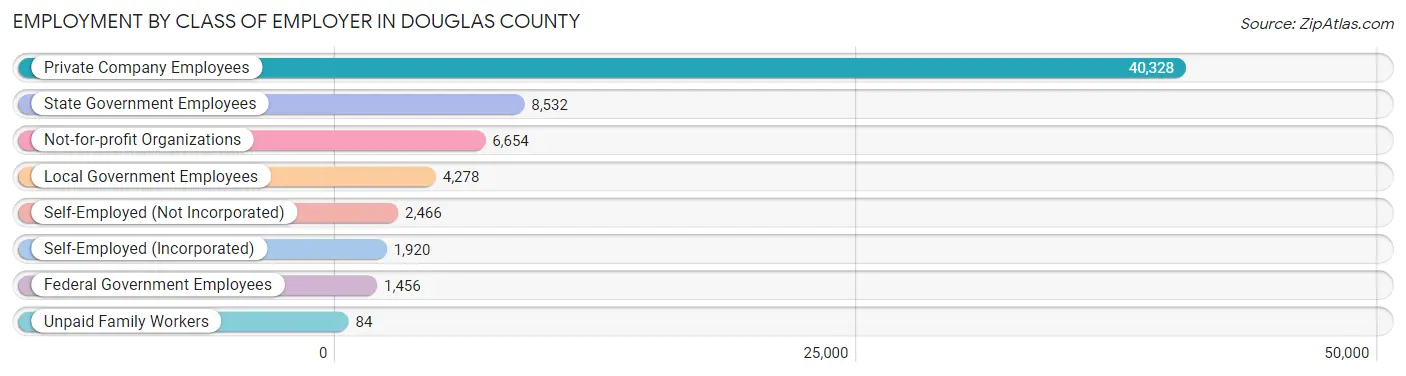
| Employer Class | # Employees | % Employees |
| Private Company Employees | 40,328 | 61.4% |
| Self-Employed (Incorporated) | 1,920 | 2.9% |
| Self-Employed (Not Incorporated) | 2,466 | 3.7% |
| Not-for-profit Organizations | 6,654 | 10.1% |
| Local Government Employees | 4,278 | 6.5% |
| State Government Employees | 8,532 | 13.0% |
| Federal Government Employees | 1,456 | 2.2% |
| Unpaid Family Workers | 84 | 0.1% |
| Total | 65,718 | 100.0% |
Employment Status by Age in Douglas County
According to the labor force statistics for Douglas County, out of the total population over 16 years of age (99,980), 70.4% or 70,386 individuals are in the labor force, with 4.8% or 3,379 of them unemployed. The age group with the highest labor force participation rate is 30 to 34 years, with 90.6% or 7,009 individuals in the labor force. Within the labor force, the 16 to 19 years age range has the highest percentage of unemployed individuals, with 12.5% or 501 of them being unemployed.
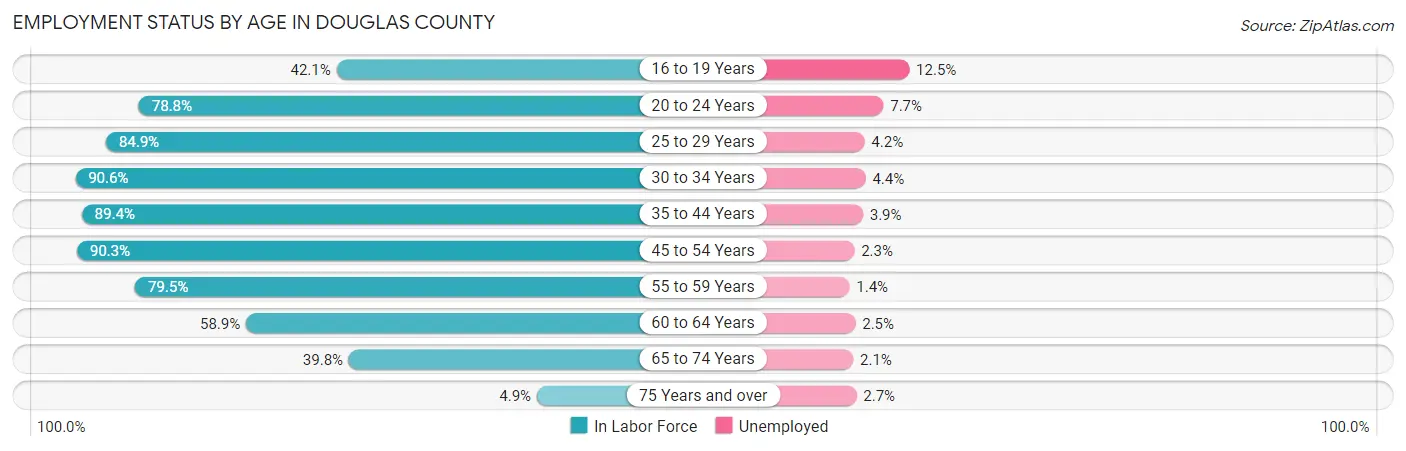
| Age Bracket | In Labor Force | Unemployed |
| 16 to 19 Years | 4,010 (42.1%) | 501 (12.5%) |
| 20 to 24 Years | 16,318 (78.8%) | 1,256 (7.7%) |
| 25 to 29 Years | 7,587 (84.9%) | 319 (4.2%) |
| 30 to 34 Years | 7,009 (90.6%) | 308 (4.4%) |
| 35 to 44 Years | 12,983 (89.4%) | 506 (3.9%) |
| 45 to 54 Years | 10,225 (90.3%) | 235 (2.3%) |
| 55 to 59 Years | 4,818 (79.5%) | 67 (1.4%) |
| 60 to 64 Years | 3,232 (58.9%) | 81 (2.5%) |
| 65 to 74 Years | 3,892 (39.8%) | 82 (2.1%) |
| 75 Years and over | 289 (4.9%) | 8 (2.7%) |
| Total | 70,386 (70.4%) | 3,379 (4.8%) |
Employment Status by Educational Attainment in Douglas County
According to labor force statistics for Douglas County, 84.8% of individuals (45,847) out of the total population between 25 and 64 years of age (54,065) are in the labor force, with 3.3% or 1,513 of them being unemployed. The group with the highest labor force participation rate are those with the educational attainment of bachelor's degree or higher, with 88.7% or 25,392 individuals in the labor force. Within the labor force, individuals with less than high school education have the highest percentage of unemployment, with 9.9% or 146 of them being unemployed.
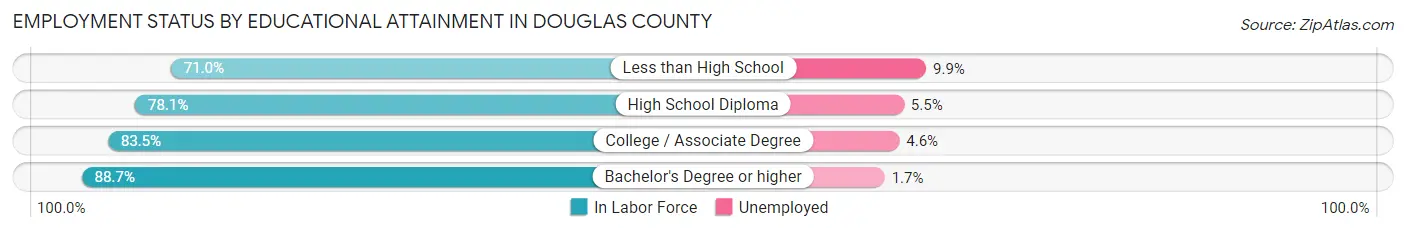
| Educational Attainment | In Labor Force | Unemployed |
| Less than High School | 1,476 (71.0%) | 206 (9.9%) |
| High School Diploma | 7,537 (78.1%) | 531 (5.5%) |
| College / Associate Degree | 11,447 (83.5%) | 631 (4.6%) |
| Bachelor's Degree or higher | 25,392 (88.7%) | 487 (1.7%) |
| Total | 45,847 (84.8%) | 1,784 (3.3%) |
Employment Occupations by Sex in Douglas County
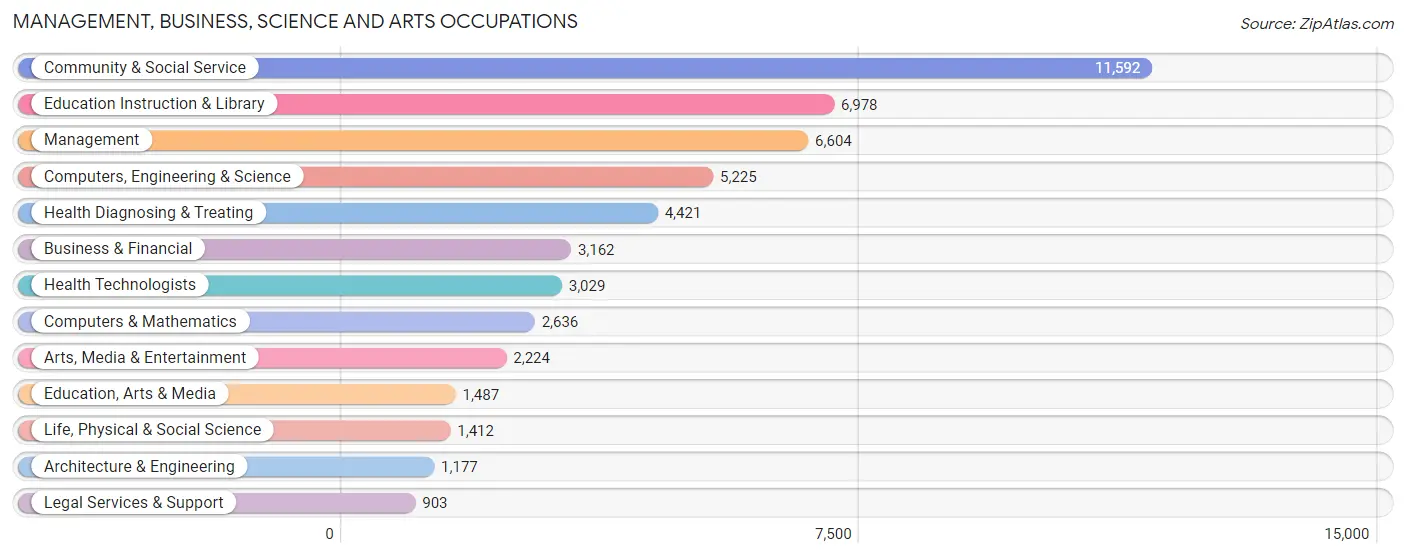
Management, Business, Science and Arts Occupations
The most common Management, Business, Science and Arts occupations in Douglas County are Community & Social Service (11,592 | 17.3%), Education Instruction & Library (6,978 | 10.4%), Management (6,604 | 9.9%), Computers, Engineering & Science (5,225 | 7.8%), and Health Diagnosing & Treating (4,421 | 6.6%).
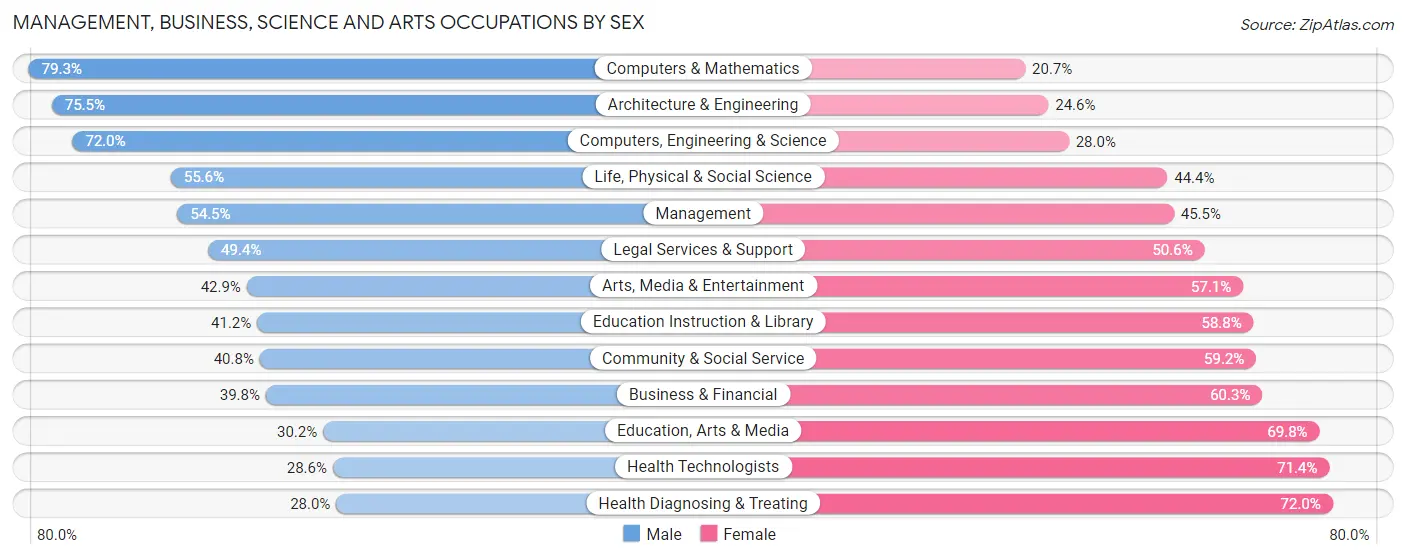
Management, Business, Science and Arts Occupations by Sex
Within the Management, Business, Science and Arts occupations in Douglas County, the most male-oriented occupations are Computers & Mathematics (79.3%), Architecture & Engineering (75.4%), and Computers, Engineering & Science (72.0%), while the most female-oriented occupations are Health Diagnosing & Treating (72.0%), Health Technologists (71.4%), and Education, Arts & Media (69.8%).
| Occupation | Male | Female |
| Management | 3,599 (54.5%) | 3,005 (45.5%) |
| Business & Financial | 1,257 (39.8%) | 1,905 (60.3%) |
| Computers, Engineering & Science | 3,764 (72.0%) | 1,461 (28.0%) |
| Computers & Mathematics | 2,091 (79.3%) | 545 (20.7%) |
| Architecture & Engineering | 888 (75.4%) | 289 (24.5%) |
| Life, Physical & Social Science | 785 (55.6%) | 627 (44.4%) |
| Community & Social Service | 4,725 (40.8%) | 6,867 (59.2%) |
| Education, Arts & Media | 449 (30.2%) | 1,038 (69.8%) |
| Legal Services & Support | 446 (49.4%) | 457 (50.6%) |
| Education Instruction & Library | 2,875 (41.2%) | 4,103 (58.8%) |
| Arts, Media & Entertainment | 955 (42.9%) | 1,269 (57.1%) |
| Health Diagnosing & Treating | 1,238 (28.0%) | 3,183 (72.0%) |
| Health Technologists | 865 (28.6%) | 2,164 (71.4%) |
| Total (Category) | 14,583 (47.0%) | 16,421 (53.0%) |
| Total (Overall) | 33,930 (50.8%) | 32,873 (49.2%) |
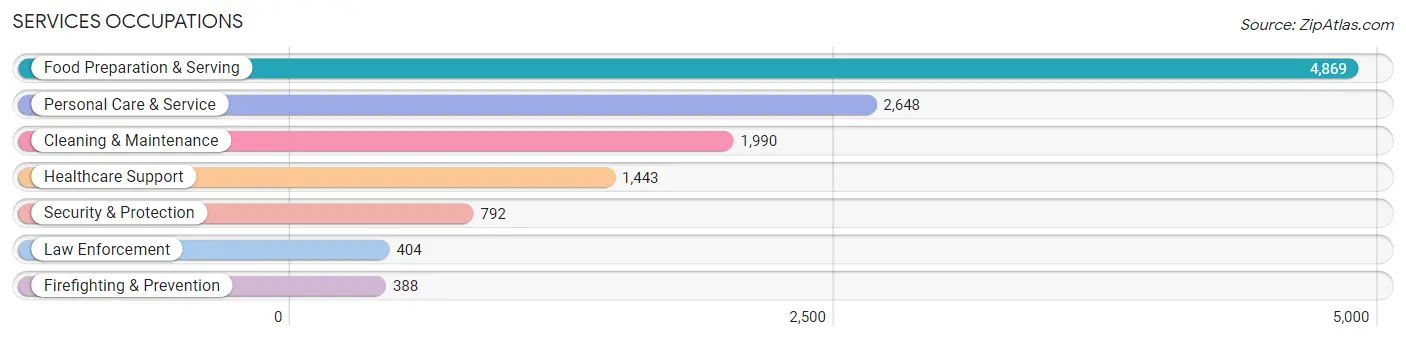
Services Occupations
The most common Services occupations in Douglas County are Food Preparation & Serving (4,869 | 7.3%), Personal Care & Service (2,648 | 4.0%), Cleaning & Maintenance (1,990 | 3.0%), Healthcare Support (1,443 | 2.2%), and Security & Protection (792 | 1.2%).
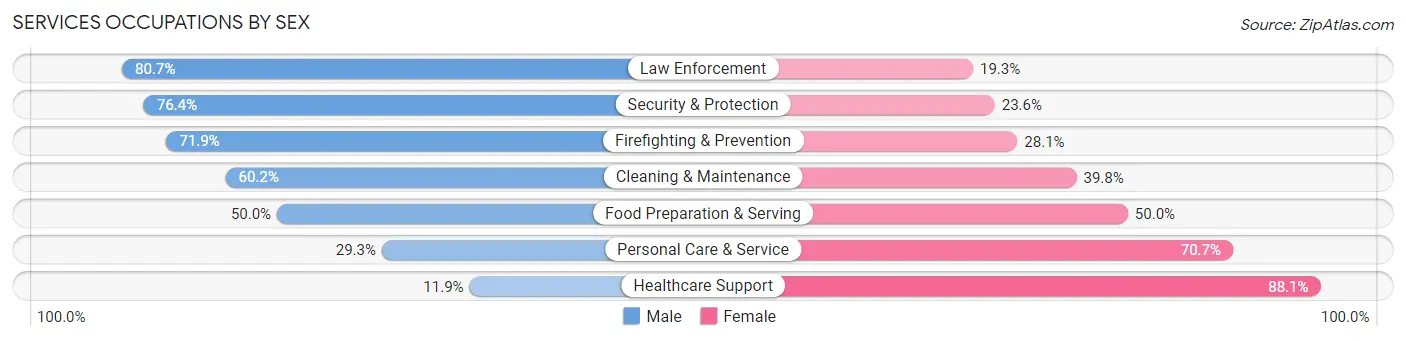
Services Occupations by Sex
Within the Services occupations in Douglas County, the most male-oriented occupations are Law Enforcement (80.7%), Security & Protection (76.4%), and Firefighting & Prevention (71.9%), while the most female-oriented occupations are Healthcare Support (88.1%), Personal Care & Service (70.7%), and Food Preparation & Serving (50.0%).
| Occupation | Male | Female |
| Healthcare Support | 172 (11.9%) | 1,271 (88.1%) |
| Security & Protection | 605 (76.4%) | 187 (23.6%) |
| Firefighting & Prevention | 279 (71.9%) | 109 (28.1%) |
| Law Enforcement | 326 (80.7%) | 78 (19.3%) |
| Food Preparation & Serving | 2,436 (50.0%) | 2,433 (50.0%) |
| Cleaning & Maintenance | 1,198 (60.2%) | 792 (39.8%) |
| Personal Care & Service | 775 (29.3%) | 1,873 (70.7%) |
| Total (Category) | 5,186 (44.2%) | 6,556 (55.8%) |
| Total (Overall) | 33,930 (50.8%) | 32,873 (49.2%) |
Sales and Office Occupations
The most common Sales and Office occupations in Douglas County are Office & Administration (7,109 | 10.6%), and Sales & Related (5,747 | 8.6%).

Sales and Office Occupations by Sex
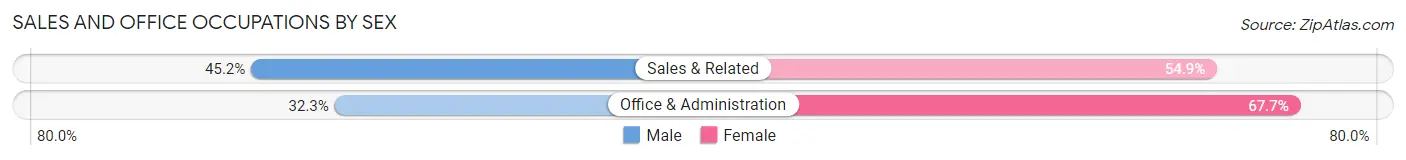
| Occupation | Male | Female |
| Sales & Related | 2,595 (45.2%) | 3,152 (54.8%) |
| Office & Administration | 2,297 (32.3%) | 4,812 (67.7%) |
| Total (Category) | 4,892 (38.1%) | 7,964 (62.0%) |
| Total (Overall) | 33,930 (50.8%) | 32,873 (49.2%) |
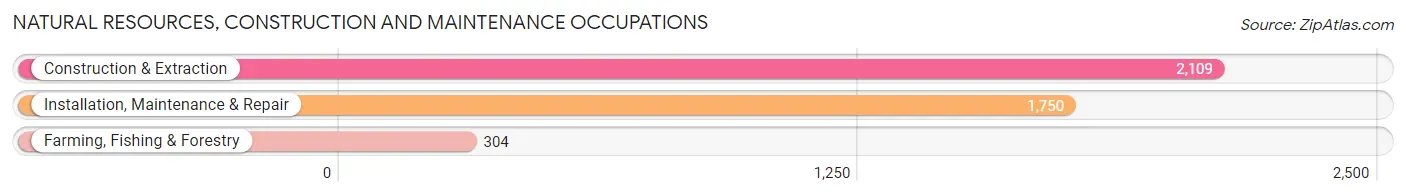
Natural Resources, Construction and Maintenance Occupations
The most common Natural Resources, Construction and Maintenance occupations in Douglas County are Construction & Extraction (2,109 | 3.2%), Installation, Maintenance & Repair (1,750 | 2.6%), and Farming, Fishing & Forestry (304 | 0.5%).
Natural Resources, Construction and Maintenance Occupations by Sex
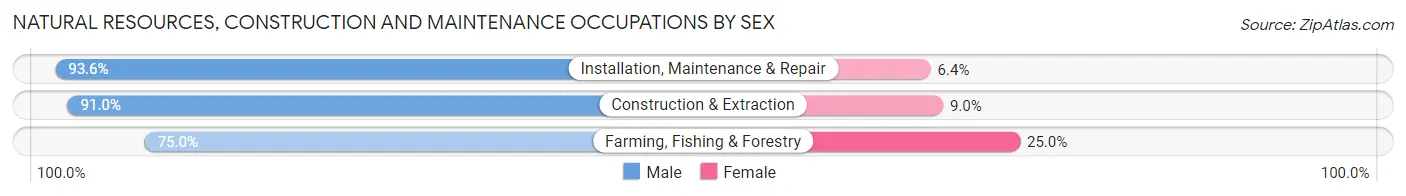
| Occupation | Male | Female |
| Farming, Fishing & Forestry | 228 (75.0%) | 76 (25.0%) |
| Construction & Extraction | 1,920 (91.0%) | 189 (9.0%) |
| Installation, Maintenance & Repair | 1,638 (93.6%) | 112 (6.4%) |
| Total (Category) | 3,786 (90.9%) | 377 (9.1%) |
| Total (Overall) | 33,930 (50.8%) | 32,873 (49.2%) |
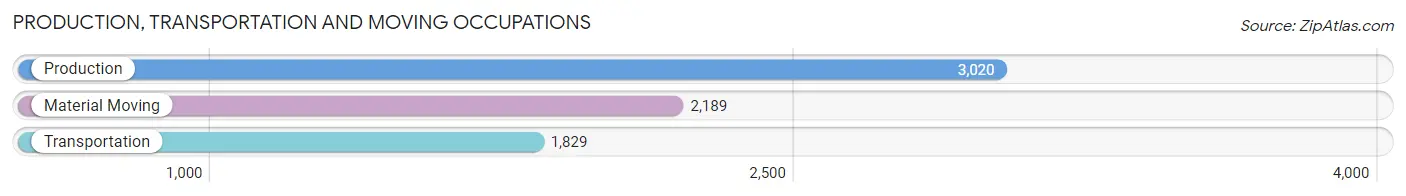
Production, Transportation and Moving Occupations
The most common Production, Transportation and Moving occupations in Douglas County are Production (3,020 | 4.5%), Material Moving (2,189 | 3.3%), and Transportation (1,829 | 2.7%).
Production, Transportation and Moving Occupations by Sex
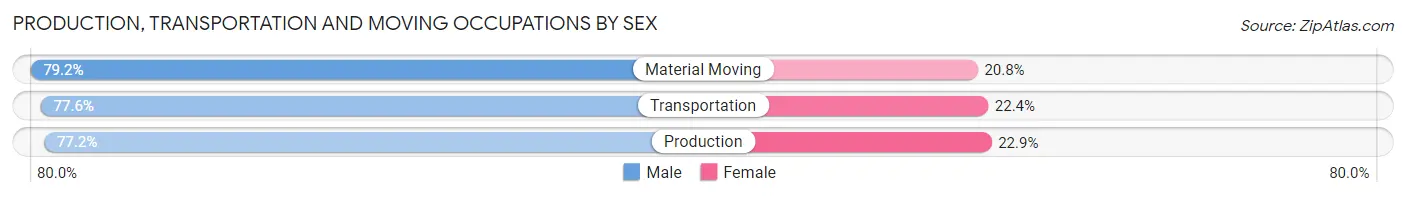
| Occupation | Male | Female |
| Production | 2,330 (77.1%) | 690 (22.9%) |
| Transportation | 1,420 (77.6%) | 409 (22.4%) |
| Material Moving | 1,733 (79.2%) | 456 (20.8%) |
| Total (Category) | 5,483 (77.9%) | 1,555 (22.1%) |
| Total (Overall) | 33,930 (50.8%) | 32,873 (49.2%) |
Employment Industries by Sex in Douglas County
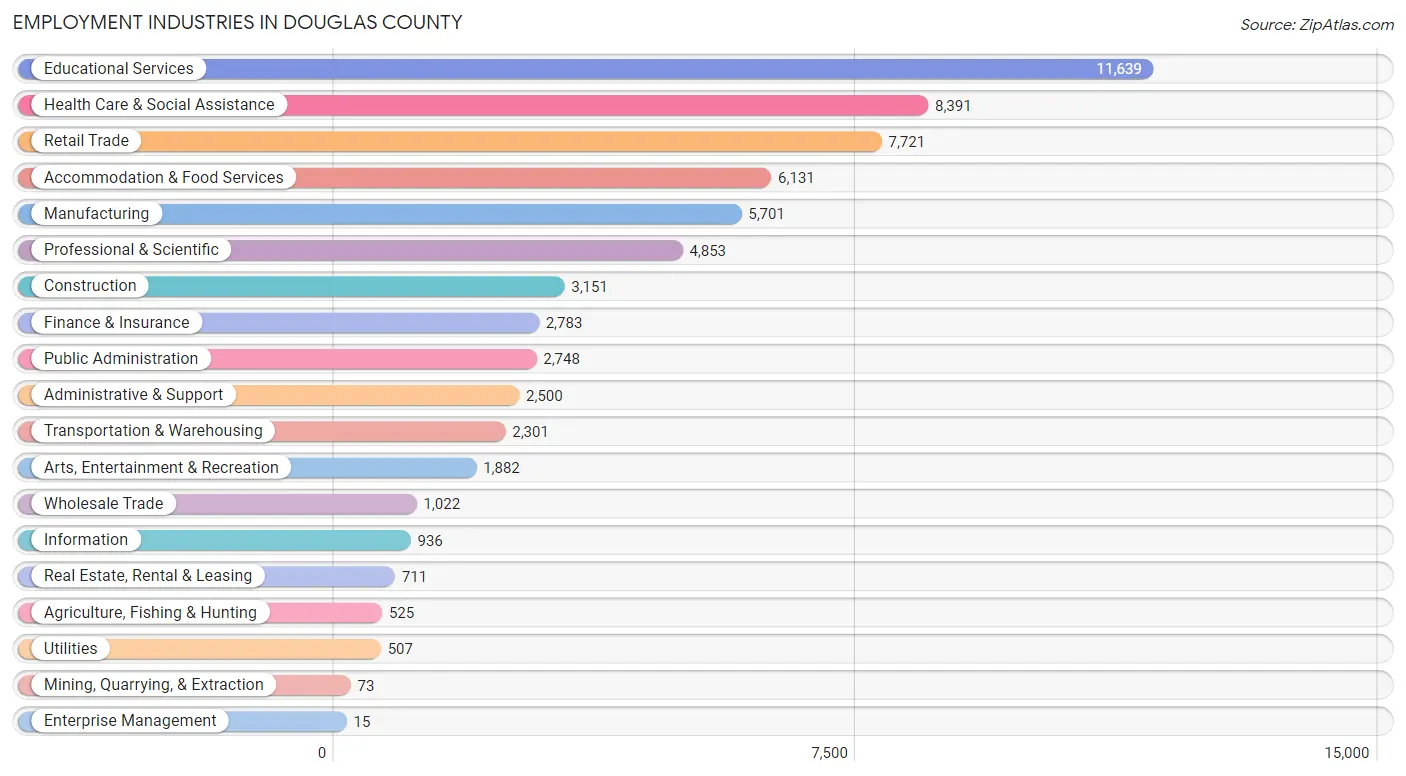
Employment Industries in Douglas County
The major employment industries in Douglas County include Educational Services (11,639 | 17.4%), Health Care & Social Assistance (8,391 | 12.6%), Retail Trade (7,721 | 11.6%), Accommodation & Food Services (6,131 | 9.2%), and Manufacturing (5,701 | 8.5%).
Employment Industries by Sex in Douglas County
The Douglas County industries that see more men than women are Construction (93.0%), Wholesale Trade (89.4%), and Agriculture, Fishing & Hunting (77.3%), whereas the industries that tend to have a higher number of women are Enterprise Management (100.0%), Health Care & Social Assistance (72.9%), and Educational Services (59.6%).
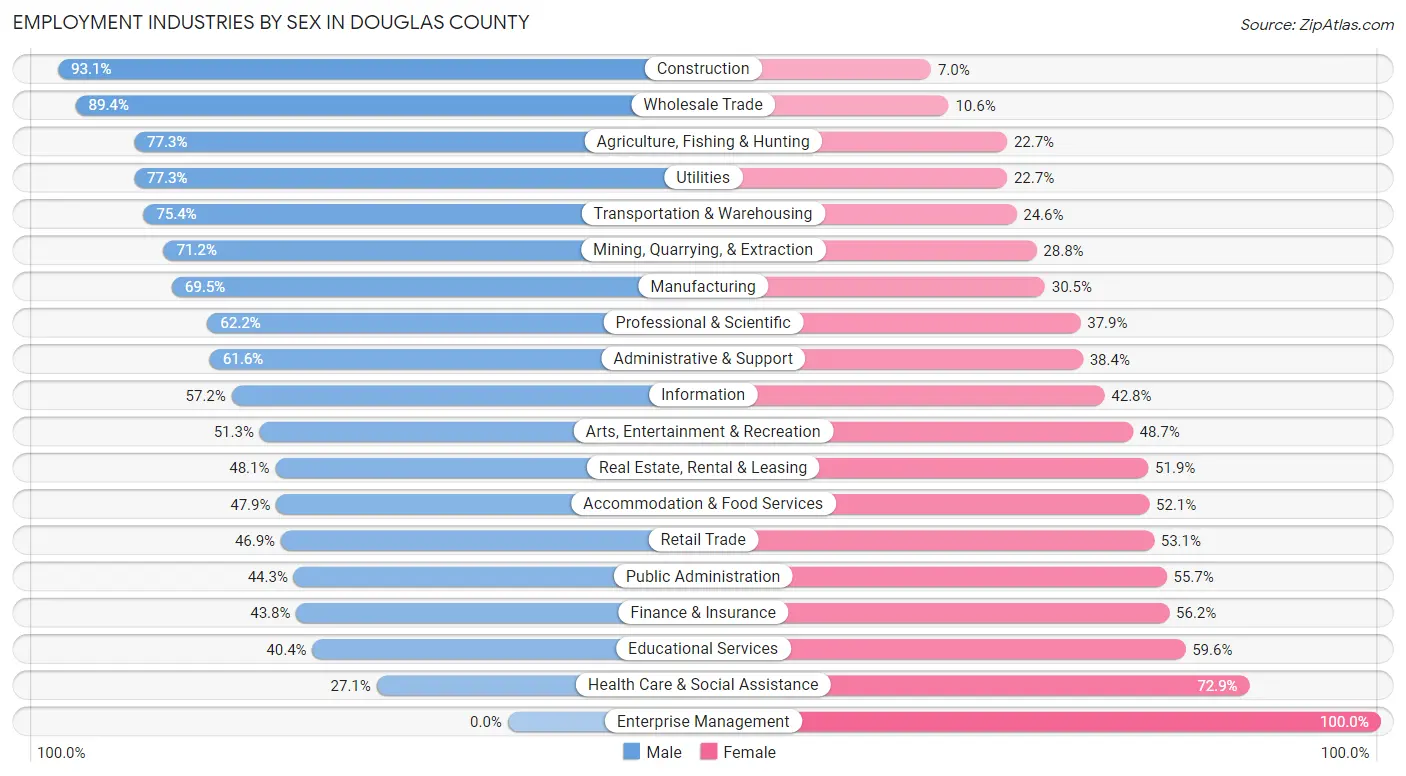
| Industry | Male | Female |
| Agriculture, Fishing & Hunting | 406 (77.3%) | 119 (22.7%) |
| Mining, Quarrying, & Extraction | 52 (71.2%) | 21 (28.8%) |
| Construction | 2,932 (93.0%) | 219 (7.0%) |
| Manufacturing | 3,962 (69.5%) | 1,739 (30.5%) |
| Wholesale Trade | 914 (89.4%) | 108 (10.6%) |
| Retail Trade | 3,624 (46.9%) | 4,097 (53.1%) |
| Transportation & Warehousing | 1,735 (75.4%) | 566 (24.6%) |
| Utilities | 392 (77.3%) | 115 (22.7%) |
| Information | 535 (57.2%) | 401 (42.8%) |
| Finance & Insurance | 1,218 (43.8%) | 1,565 (56.2%) |
| Real Estate, Rental & Leasing | 342 (48.1%) | 369 (51.9%) |
| Professional & Scientific | 3,016 (62.2%) | 1,837 (37.9%) |
| Enterprise Management | 0 (0.0%) | 15 (100.0%) |
| Administrative & Support | 1,541 (61.6%) | 959 (38.4%) |
| Educational Services | 4,706 (40.4%) | 6,933 (59.6%) |
| Health Care & Social Assistance | 2,277 (27.1%) | 6,114 (72.9%) |
| Arts, Entertainment & Recreation | 966 (51.3%) | 916 (48.7%) |
| Accommodation & Food Services | 2,937 (47.9%) | 3,194 (52.1%) |
| Public Administration | 1,217 (44.3%) | 1,531 (55.7%) |
| Total | 33,930 (50.8%) | 32,873 (49.2%) |
Education in Douglas County
School Enrollment in Douglas County
The most common levels of schooling among the 42,215 students in Douglas County are college / undergraduate (20,383 | 48.3%), graduate / professional (5,307 | 12.6%), and elementary school (4,904 | 11.6%).
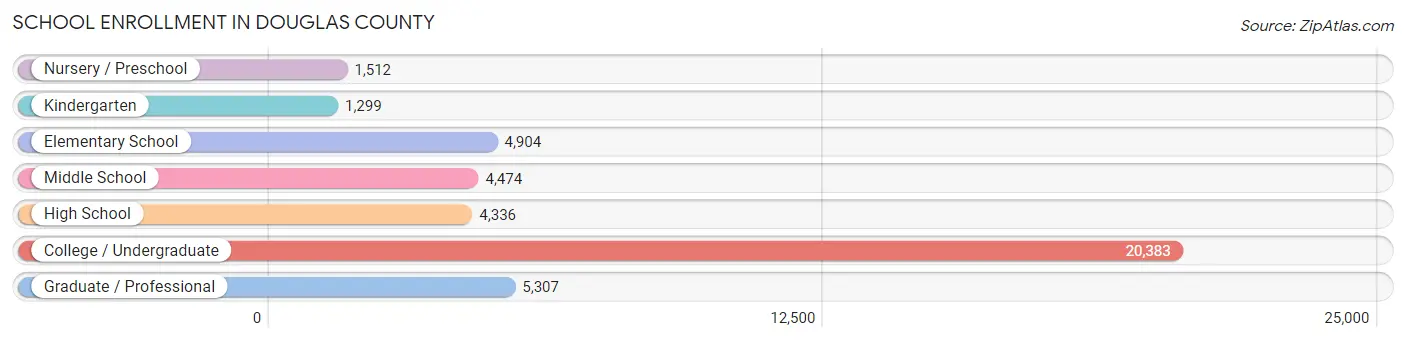
| School Level | # Students | % Students |
| Nursery / Preschool | 1,512 | 3.6% |
| Kindergarten | 1,299 | 3.1% |
| Elementary School | 4,904 | 11.6% |
| Middle School | 4,474 | 10.6% |
| High School | 4,336 | 10.3% |
| College / Undergraduate | 20,383 | 48.3% |
| Graduate / Professional | 5,307 | 12.6% |
| Total | 42,215 | 100.0% |
School Enrollment by Age by Funding Source in Douglas County
Out of a total of 42,215 students who are enrolled in schools in Douglas County, 4,348 (10.3%) attend a private institution, while the remaining 37,867 (89.7%) are enrolled in public schools. The age group of 3 to 4 year olds has the highest likelihood of being enrolled in private schools, with 427 (42.2% in the age bracket) enrolled. Conversely, the age group of 18 to 19 year olds has the lowest likelihood of being enrolled in a private school, with 6,341 (93.8% in the age bracket) attending a public institution.
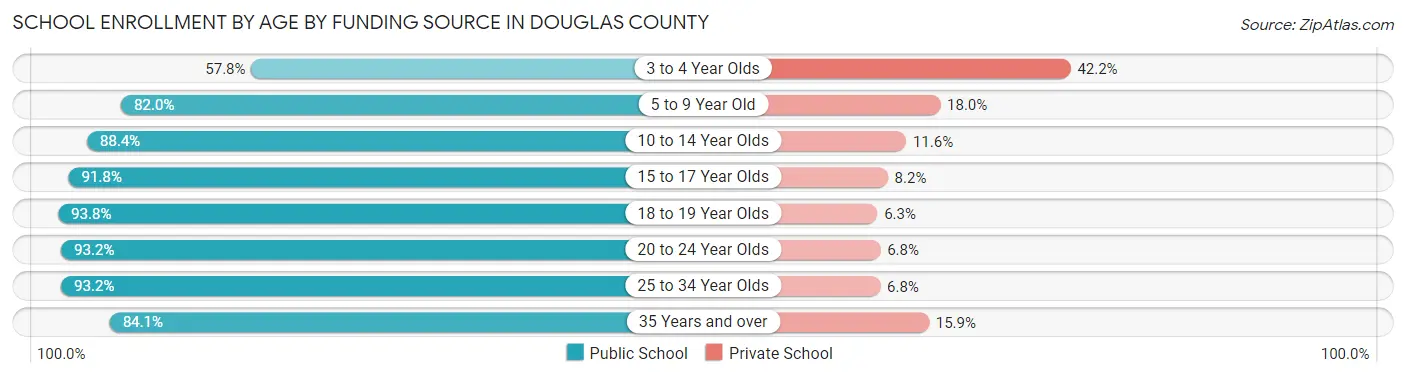
| Age Bracket | Public School | Private School |
| 3 to 4 Year Olds | 584 (57.8%) | 427 (42.2%) |
| 5 to 9 Year Old | 5,001 (82.0%) | 1,095 (18.0%) |
| 10 to 14 Year Olds | 4,882 (88.4%) | 641 (11.6%) |
| 15 to 17 Year Olds | 3,050 (91.8%) | 272 (8.2%) |
| 18 to 19 Year Olds | 6,341 (93.8%) | 423 (6.2%) |
| 20 to 24 Year Olds | 13,525 (93.2%) | 989 (6.8%) |
| 25 to 34 Year Olds | 3,142 (93.2%) | 229 (6.8%) |
| 35 Years and over | 1,358 (84.1%) | 256 (15.9%) |
| Total | 37,867 (89.7%) | 4,348 (10.3%) |
Educational Attainment by Field of Study in Douglas County
Business (5,425 | 13.6%), education (5,211 | 13.1%), science & technology (3,778 | 9.5%), literature & languages (2,954 | 7.4%), and social sciences (2,897 | 7.3%) are the most common fields of study among 39,867 individuals in Douglas County who have obtained a bachelor's degree or higher.
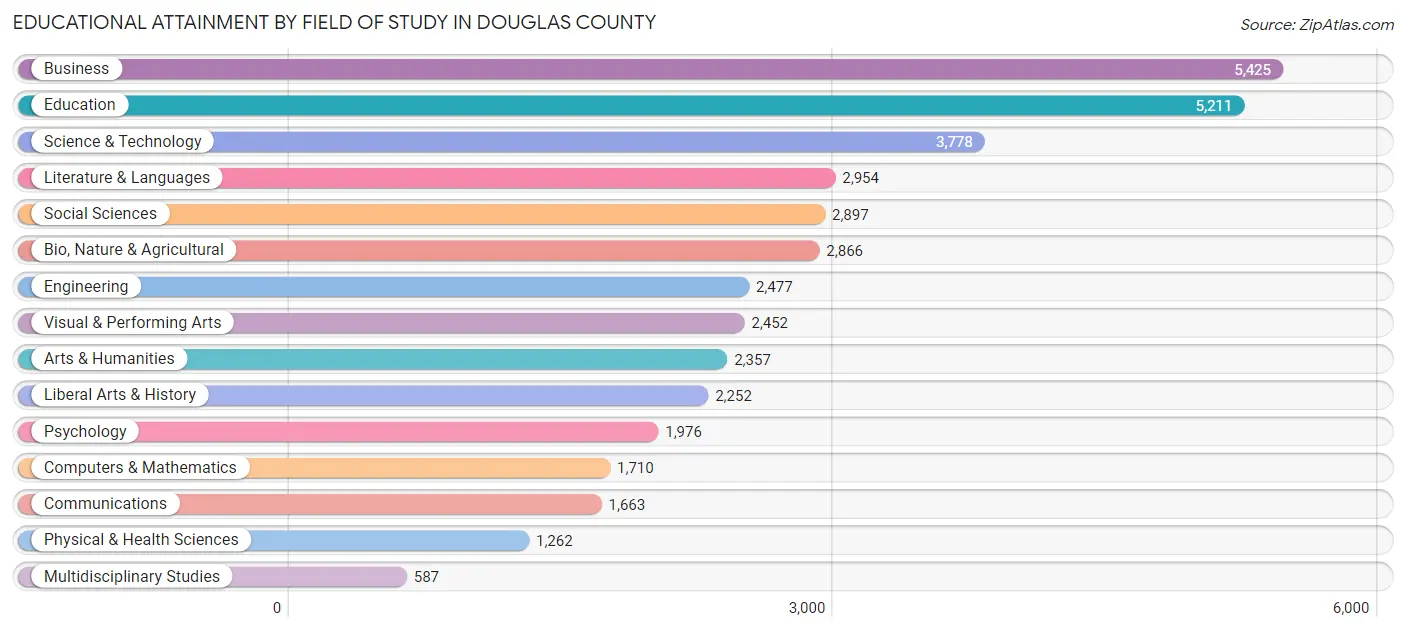
| Field of Study | # Graduates | % Graduates |
| Computers & Mathematics | 1,710 | 4.3% |
| Bio, Nature & Agricultural | 2,866 | 7.2% |
| Physical & Health Sciences | 1,262 | 3.2% |
| Psychology | 1,976 | 5.0% |
| Social Sciences | 2,897 | 7.3% |
| Engineering | 2,477 | 6.2% |
| Multidisciplinary Studies | 587 | 1.5% |
| Science & Technology | 3,778 | 9.5% |
| Business | 5,425 | 13.6% |
| Education | 5,211 | 13.1% |
| Literature & Languages | 2,954 | 7.4% |
| Liberal Arts & History | 2,252 | 5.7% |
| Visual & Performing Arts | 2,452 | 6.1% |
| Communications | 1,663 | 4.2% |
| Arts & Humanities | 2,357 | 5.9% |
| Total | 39,867 | 100.0% |
Transportation & Commute in Douglas County
Vehicle Availability by Sex in Douglas County
The most prevalent vehicle ownership categories in Douglas County are males with 2 vehicles (14,089, accounting for 43.7%) and females with 2 vehicles (12,863, making up 45.9%).
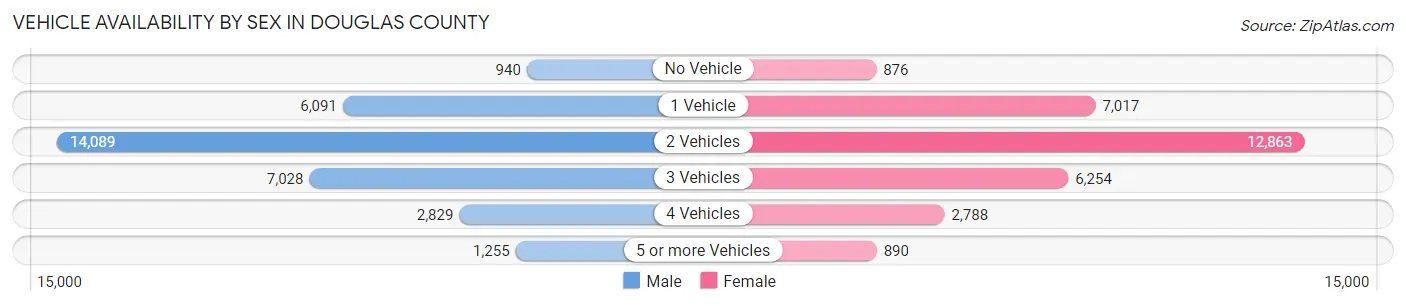
| Vehicles Available | Male | Female |
| No Vehicle | 940 (2.9%) | 876 (2.9%) |
| 1 Vehicle | 6,091 (18.9%) | 7,017 (22.9%) |
| 2 Vehicles | 14,089 (43.7%) | 12,863 (41.9%) |
| 3 Vehicles | 7,028 (21.8%) | 6,254 (20.4%) |
| 4 Vehicles | 2,829 (8.8%) | 2,788 (9.1%) |
| 5 or more Vehicles | 1,255 (3.9%) | 890 (2.9%) |
| Total | 32,232 (100.0%) | 30,688 (100.0%) |
Commute Time in Douglas County
The most frequently occuring commute durations in Douglas County are 10 to 14 minutes (12,368 commuters, 21.3%), 5 to 9 minutes (9,641 commuters, 16.6%), and 15 to 19 minutes (9,348 commuters, 16.1%).
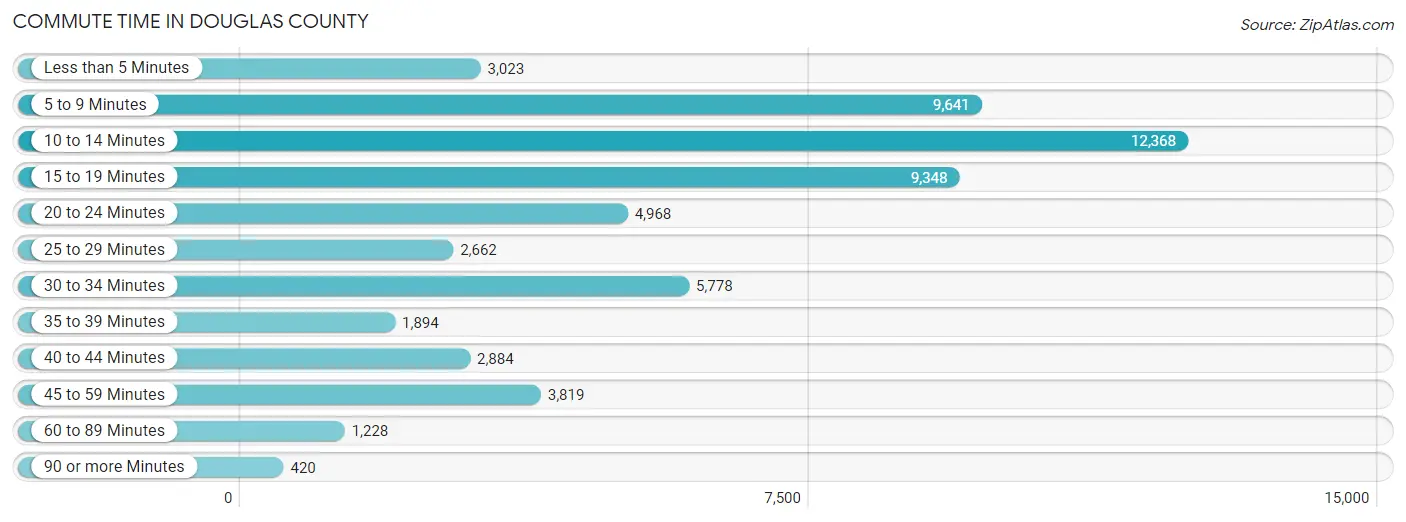
| Commute Time | # Commuters | % Commuters |
| Less than 5 Minutes | 3,023 | 5.2% |
| 5 to 9 Minutes | 9,641 | 16.6% |
| 10 to 14 Minutes | 12,368 | 21.3% |
| 15 to 19 Minutes | 9,348 | 16.1% |
| 20 to 24 Minutes | 4,968 | 8.6% |
| 25 to 29 Minutes | 2,662 | 4.6% |
| 30 to 34 Minutes | 5,778 | 10.0% |
| 35 to 39 Minutes | 1,894 | 3.3% |
| 40 to 44 Minutes | 2,884 | 5.0% |
| 45 to 59 Minutes | 3,819 | 6.6% |
| 60 to 89 Minutes | 1,228 | 2.1% |
| 90 or more Minutes | 420 | 0.7% |
Commute Time by Sex in Douglas County
The most common commute times in Douglas County are 10 to 14 minutes (6,097 commuters, 20.5%) for males and 10 to 14 minutes (6,271 commuters, 22.1%) for females.
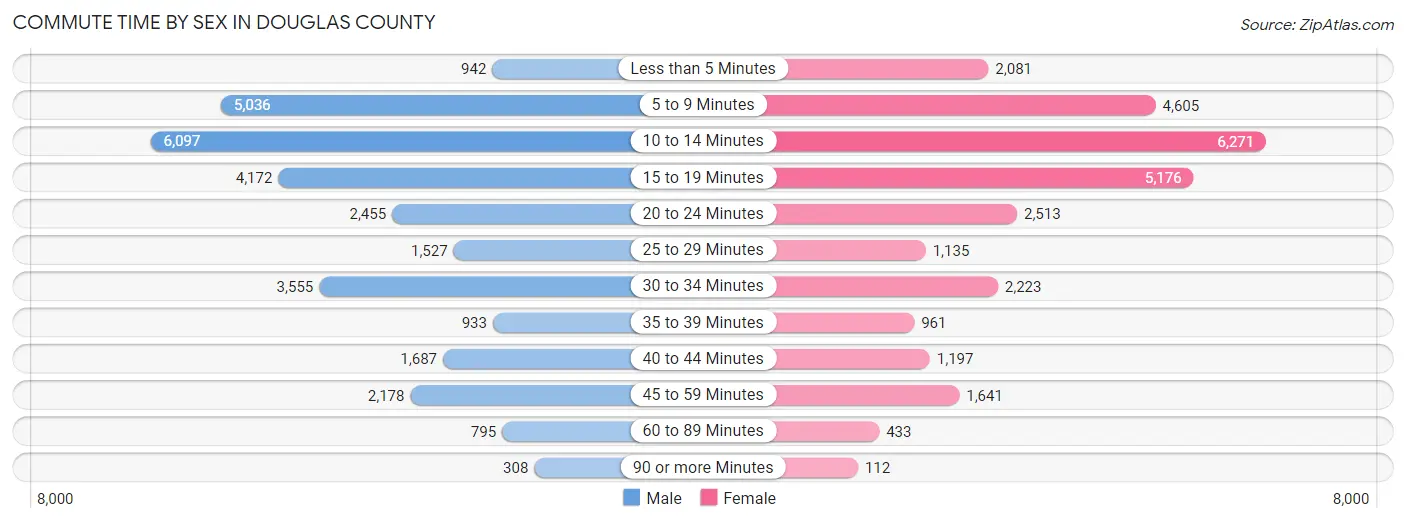
| Commute Time | Male | Female |
| Less than 5 Minutes | 942 (3.2%) | 2,081 (7.3%) |
| 5 to 9 Minutes | 5,036 (17.0%) | 4,605 (16.2%) |
| 10 to 14 Minutes | 6,097 (20.5%) | 6,271 (22.1%) |
| 15 to 19 Minutes | 4,172 (14.1%) | 5,176 (18.3%) |
| 20 to 24 Minutes | 2,455 (8.3%) | 2,513 (8.9%) |
| 25 to 29 Minutes | 1,527 (5.1%) | 1,135 (4.0%) |
| 30 to 34 Minutes | 3,555 (12.0%) | 2,223 (7.8%) |
| 35 to 39 Minutes | 933 (3.1%) | 961 (3.4%) |
| 40 to 44 Minutes | 1,687 (5.7%) | 1,197 (4.2%) |
| 45 to 59 Minutes | 2,178 (7.3%) | 1,641 (5.8%) |
| 60 to 89 Minutes | 795 (2.7%) | 433 (1.5%) |
| 90 or more Minutes | 308 (1.0%) | 112 (0.4%) |
Time of Departure to Work by Sex in Douglas County
The most frequent times of departure to work in Douglas County are 7:30 AM to 7:59 AM (4,512, 15.2%) for males and 7:30 AM to 7:59 AM (5,439, 19.2%) for females.
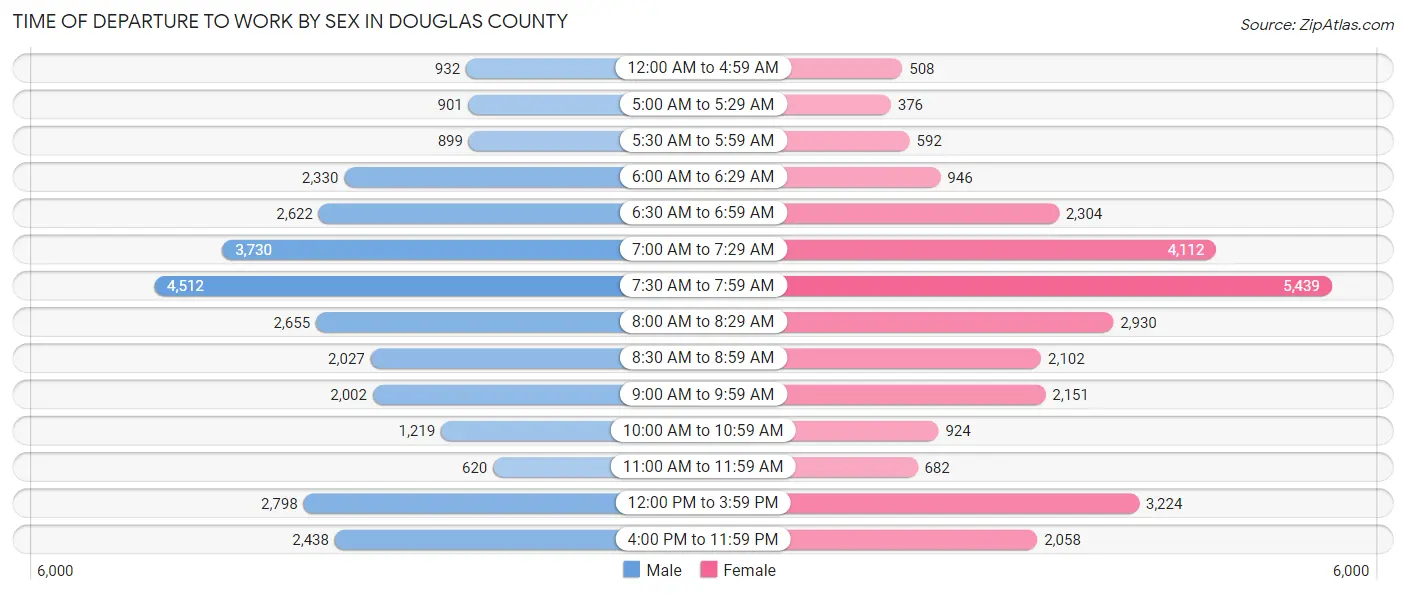
| Time of Departure | Male | Female |
| 12:00 AM to 4:59 AM | 932 (3.1%) | 508 (1.8%) |
| 5:00 AM to 5:29 AM | 901 (3.0%) | 376 (1.3%) |
| 5:30 AM to 5:59 AM | 899 (3.0%) | 592 (2.1%) |
| 6:00 AM to 6:29 AM | 2,330 (7.9%) | 946 (3.3%) |
| 6:30 AM to 6:59 AM | 2,622 (8.8%) | 2,304 (8.1%) |
| 7:00 AM to 7:29 AM | 3,730 (12.6%) | 4,112 (14.5%) |
| 7:30 AM to 7:59 AM | 4,512 (15.2%) | 5,439 (19.2%) |
| 8:00 AM to 8:29 AM | 2,655 (8.9%) | 2,930 (10.3%) |
| 8:30 AM to 8:59 AM | 2,027 (6.8%) | 2,102 (7.4%) |
| 9:00 AM to 9:59 AM | 2,002 (6.7%) | 2,151 (7.6%) |
| 10:00 AM to 10:59 AM | 1,219 (4.1%) | 924 (3.3%) |
| 11:00 AM to 11:59 AM | 620 (2.1%) | 682 (2.4%) |
| 12:00 PM to 3:59 PM | 2,798 (9.4%) | 3,224 (11.4%) |
| 4:00 PM to 11:59 PM | 2,438 (8.2%) | 2,058 (7.3%) |
| Total | 29,685 (100.0%) | 28,348 (100.0%) |
Housing Occupancy in Douglas County
Occupancy by Ownership in Douglas County
Of the total 49,605 dwellings in Douglas County, owner-occupied units account for 25,004 (50.4%), while renter-occupied units make up 24,601 (49.6%).
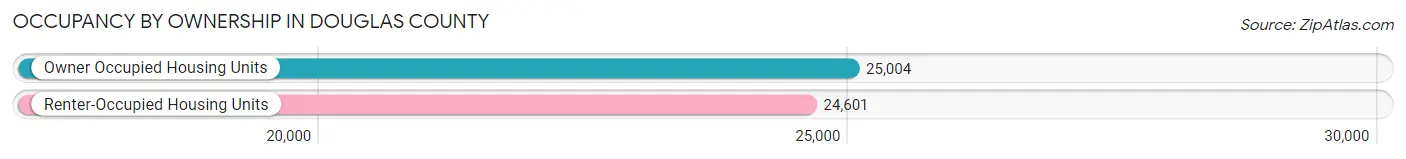
| Occupancy | # Housing Units | % Housing Units |
| Owner Occupied Housing Units | 25,004 | 50.4% |
| Renter-Occupied Housing Units | 24,601 | 49.6% |
| Total Occupied Housing Units | 49,605 | 100.0% |
Occupancy by Household Size in Douglas County
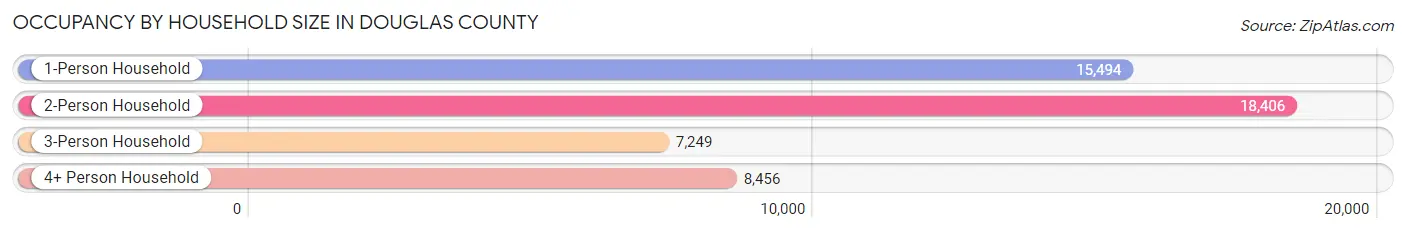
| Household Size | # Housing Units | % Housing Units |
| 1-Person Household | 15,494 | 31.2% |
| 2-Person Household | 18,406 | 37.1% |
| 3-Person Household | 7,249 | 14.6% |
| 4+ Person Household | 8,456 | 17.1% |
| Total Housing Units | 49,605 | 100.0% |
Occupancy by Ownership by Household Size in Douglas County
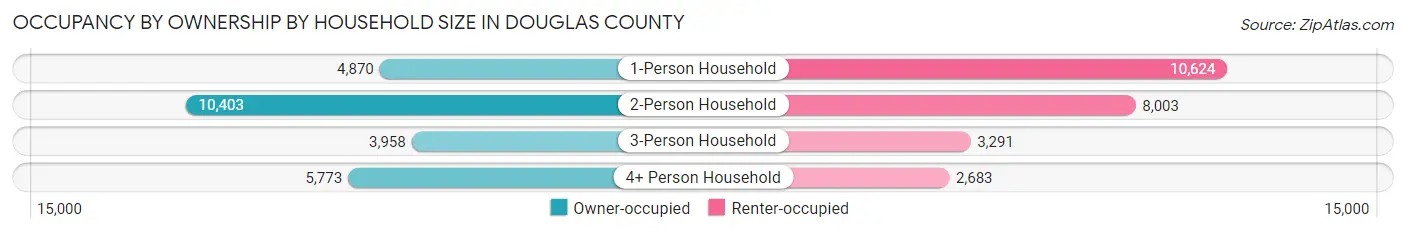
| Household Size | Owner-occupied | Renter-occupied |
| 1-Person Household | 4,870 (31.4%) | 10,624 (68.6%) |
| 2-Person Household | 10,403 (56.5%) | 8,003 (43.5%) |
| 3-Person Household | 3,958 (54.6%) | 3,291 (45.4%) |
| 4+ Person Household | 5,773 (68.3%) | 2,683 (31.7%) |
| Total Housing Units | 25,004 (50.4%) | 24,601 (49.6%) |
Occupancy by Educational Attainment in Douglas County
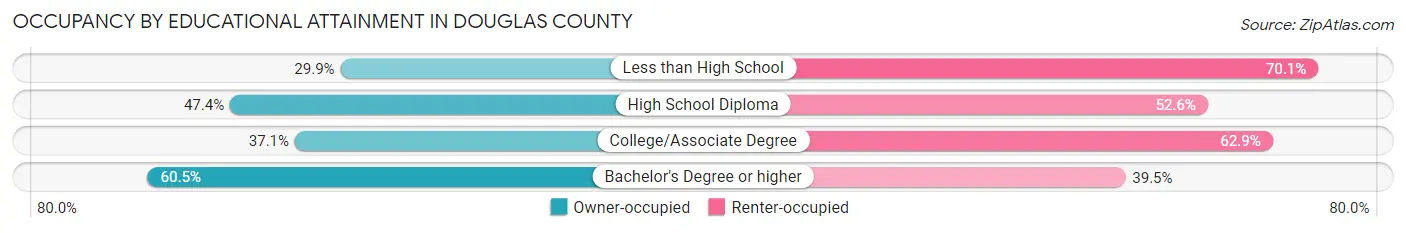
| Household Size | Owner-occupied | Renter-occupied |
| Less than High School | 361 (29.9%) | 846 (70.1%) |
| High School Diploma | 3,858 (47.4%) | 4,278 (52.6%) |
| College/Associate Degree | 5,668 (37.1%) | 9,597 (62.9%) |
| Bachelor's Degree or higher | 15,117 (60.5%) | 9,880 (39.5%) |
Occupancy by Age of Householder in Douglas County
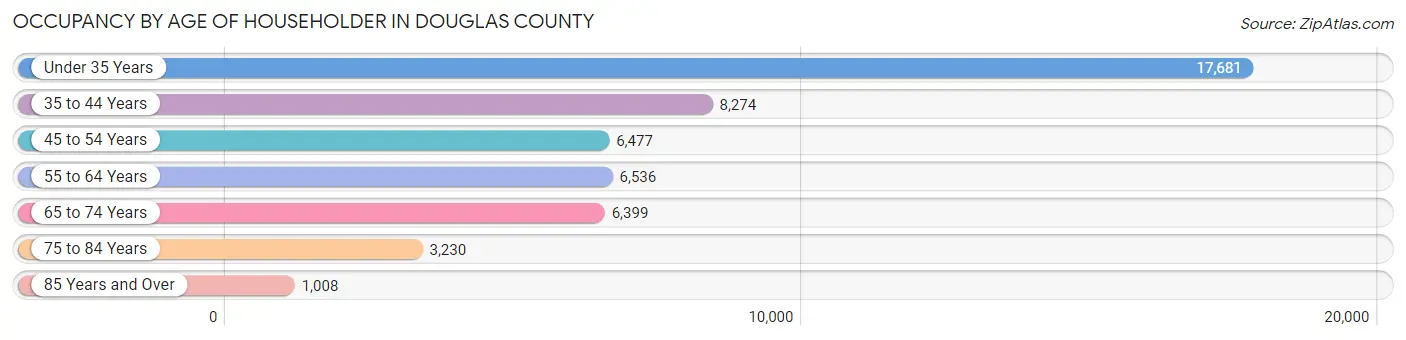
| Age Bracket | # Households | % Households |
| Under 35 Years | 17,681 | 35.6% |
| 35 to 44 Years | 8,274 | 16.7% |
| 45 to 54 Years | 6,477 | 13.1% |
| 55 to 64 Years | 6,536 | 13.2% |
| 65 to 74 Years | 6,399 | 12.9% |
| 75 to 84 Years | 3,230 | 6.5% |
| 85 Years and Over | 1,008 | 2.0% |
| Total | 49,605 | 100.0% |
Housing Finances in Douglas County
Median Income by Occupancy in Douglas County
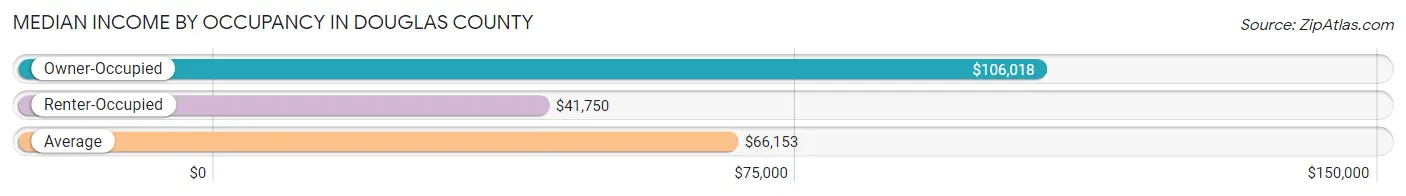
| Occupancy Type | # Households | Median Income |
| Owner-Occupied | 25,004 (50.4%) | $106,018 |
| Renter-Occupied | 24,601 (49.6%) | $41,750 |
| Average | 49,605 (100.0%) | $66,153 |
Occupancy by Householder Income Bracket in Douglas County
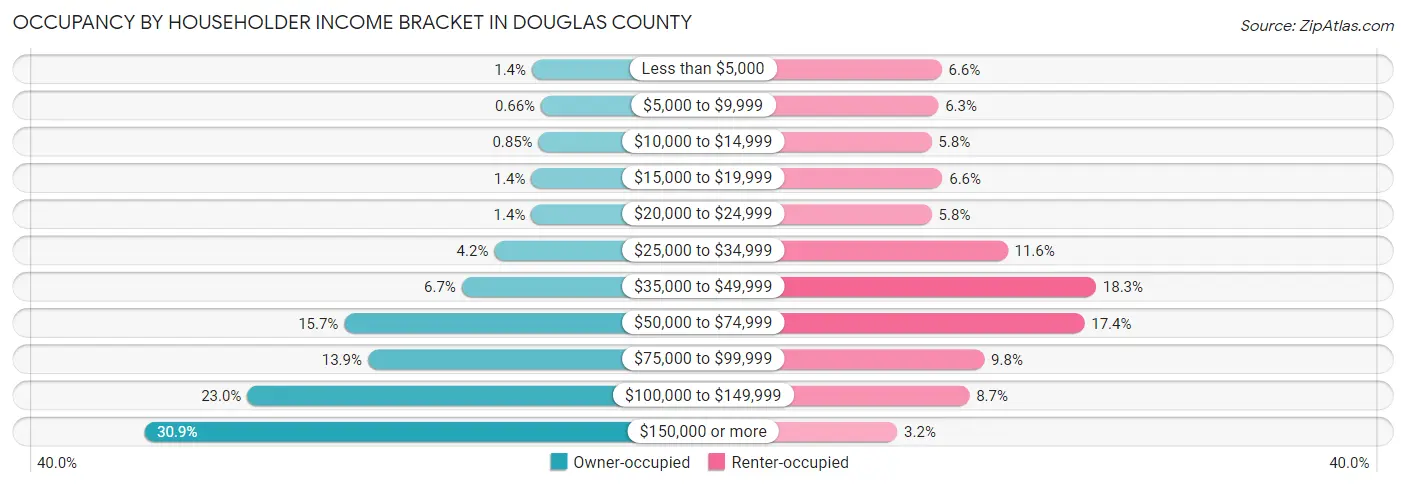
| Income Bracket | Owner-occupied | Renter-occupied |
| Less than $5,000 | 338 (1.3%) | 1,611 (6.6%) |
| $5,000 to $9,999 | 166 (0.7%) | 1,551 (6.3%) |
| $10,000 to $14,999 | 212 (0.9%) | 1,422 (5.8%) |
| $15,000 to $19,999 | 347 (1.4%) | 1,627 (6.6%) |
| $20,000 to $24,999 | 351 (1.4%) | 1,426 (5.8%) |
| $25,000 to $34,999 | 1,054 (4.2%) | 2,848 (11.6%) |
| $35,000 to $49,999 | 1,676 (6.7%) | 4,505 (18.3%) |
| $50,000 to $74,999 | 3,912 (15.7%) | 4,288 (17.4%) |
| $75,000 to $99,999 | 3,463 (13.9%) | 2,411 (9.8%) |
| $100,000 to $149,999 | 5,760 (23.0%) | 2,131 (8.7%) |
| $150,000 or more | 7,725 (30.9%) | 781 (3.2%) |
| Total | 25,004 (100.0%) | 24,601 (100.0%) |
Monthly Housing Cost Tiers in Douglas County
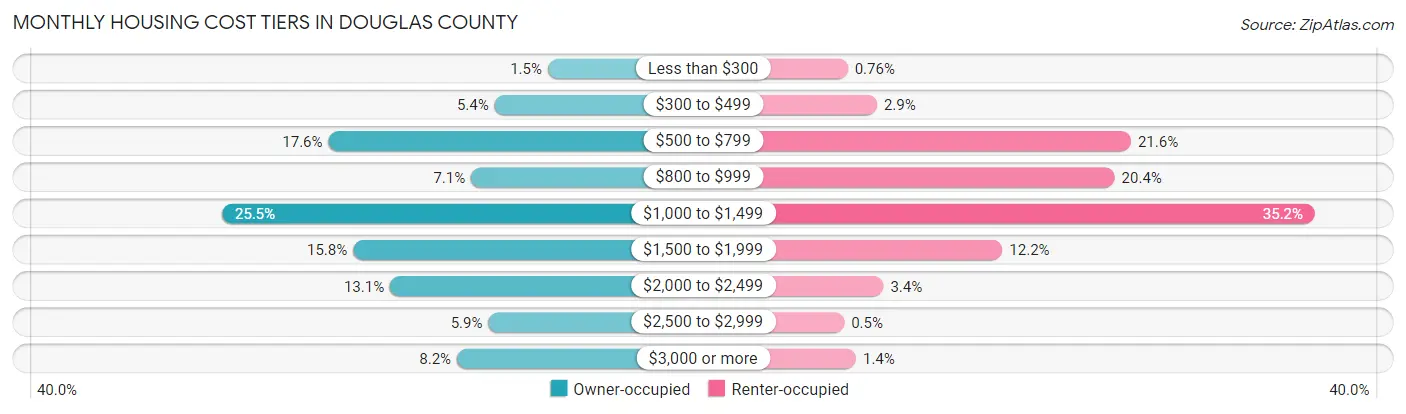
| Monthly Cost | Owner-occupied | Renter-occupied |
| Less than $300 | 367 (1.5%) | 186 (0.8%) |
| $300 to $499 | 1,348 (5.4%) | 715 (2.9%) |
| $500 to $799 | 4,409 (17.6%) | 5,319 (21.6%) |
| $800 to $999 | 1,781 (7.1%) | 5,024 (20.4%) |
| $1,000 to $1,499 | 6,369 (25.5%) | 8,650 (35.2%) |
| $1,500 to $1,999 | 3,952 (15.8%) | 2,990 (12.1%) |
| $2,000 to $2,499 | 3,274 (13.1%) | 833 (3.4%) |
| $2,500 to $2,999 | 1,463 (5.9%) | 122 (0.5%) |
| $3,000 or more | 2,041 (8.2%) | 337 (1.4%) |
| Total | 25,004 (100.0%) | 24,601 (100.0%) |
Physical Housing Characteristics in Douglas County
Housing Structures in Douglas County
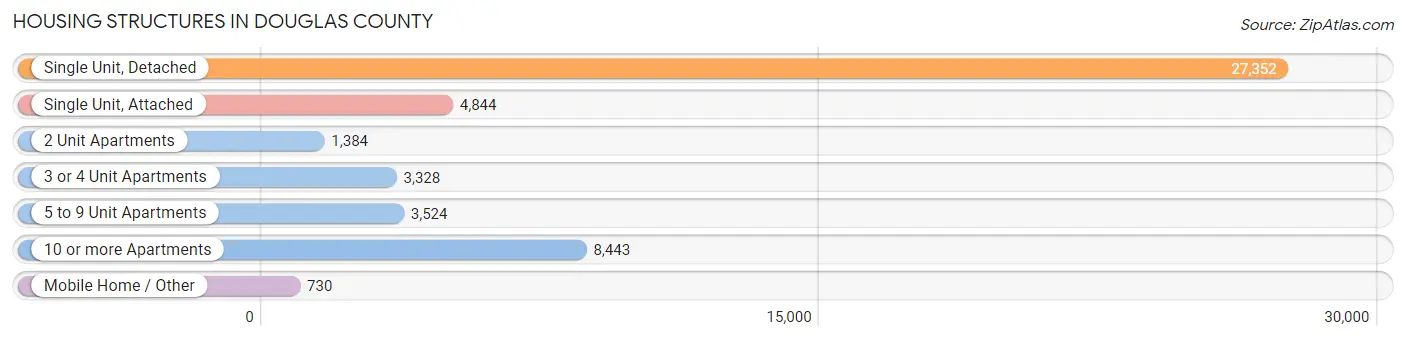
| Structure Type | # Housing Units | % Housing Units |
| Single Unit, Detached | 27,352 | 55.1% |
| Single Unit, Attached | 4,844 | 9.8% |
| 2 Unit Apartments | 1,384 | 2.8% |
| 3 or 4 Unit Apartments | 3,328 | 6.7% |
| 5 to 9 Unit Apartments | 3,524 | 7.1% |
| 10 or more Apartments | 8,443 | 17.0% |
| Mobile Home / Other | 730 | 1.5% |
| Total | 49,605 | 100.0% |
Housing Structures by Occupancy in Douglas County
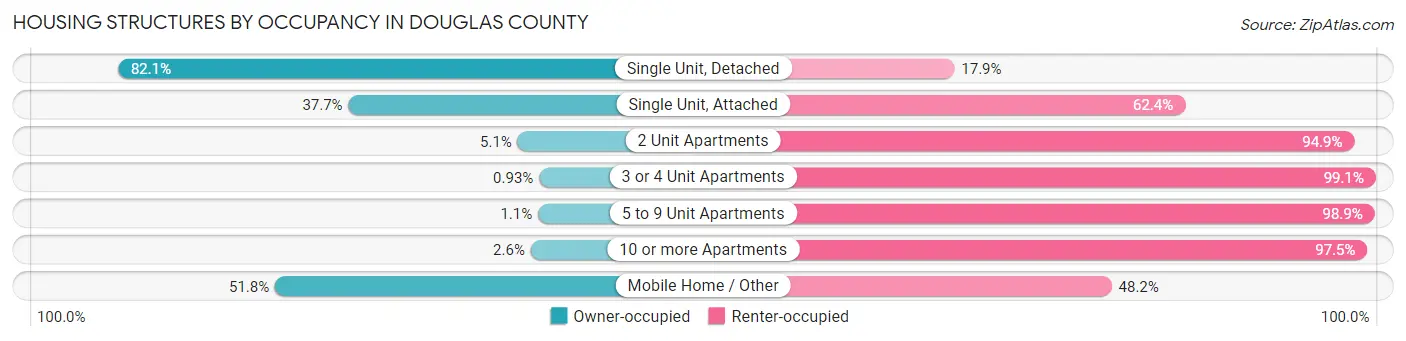
| Structure Type | Owner-occupied | Renter-occupied |
| Single Unit, Detached | 22,446 (82.1%) | 4,906 (17.9%) |
| Single Unit, Attached | 1,824 (37.7%) | 3,020 (62.4%) |
| 2 Unit Apartments | 70 (5.1%) | 1,314 (94.9%) |
| 3 or 4 Unit Apartments | 31 (0.9%) | 3,297 (99.1%) |
| 5 to 9 Unit Apartments | 40 (1.1%) | 3,484 (98.9%) |
| 10 or more Apartments | 215 (2.5%) | 8,228 (97.5%) |
| Mobile Home / Other | 378 (51.8%) | 352 (48.2%) |
| Total | 25,004 (50.4%) | 24,601 (49.6%) |
Housing Structures by Number of Rooms in Douglas County
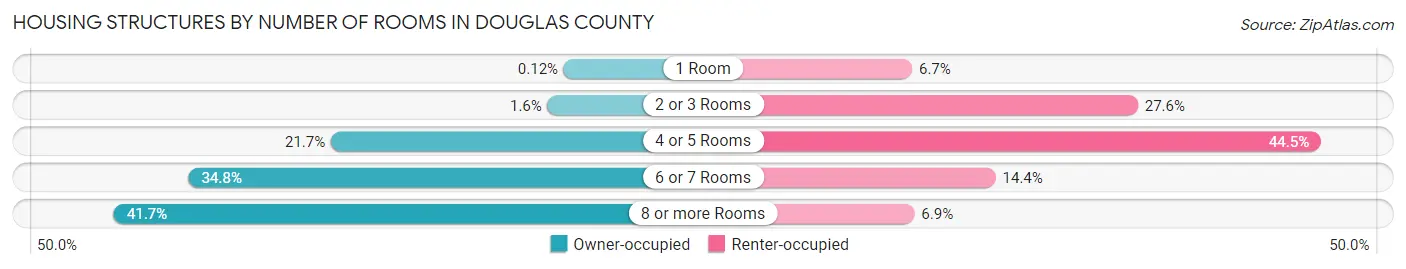
| Number of Rooms | Owner-occupied | Renter-occupied |
| 1 Room | 30 (0.1%) | 1,642 (6.7%) |
| 2 or 3 Rooms | 408 (1.6%) | 6,777 (27.6%) |
| 4 or 5 Rooms | 5,417 (21.7%) | 10,945 (44.5%) |
| 6 or 7 Rooms | 8,712 (34.8%) | 3,543 (14.4%) |
| 8 or more Rooms | 10,437 (41.7%) | 1,694 (6.9%) |
| Total | 25,004 (100.0%) | 24,601 (100.0%) |
Housing Structure by Heating Type in Douglas County
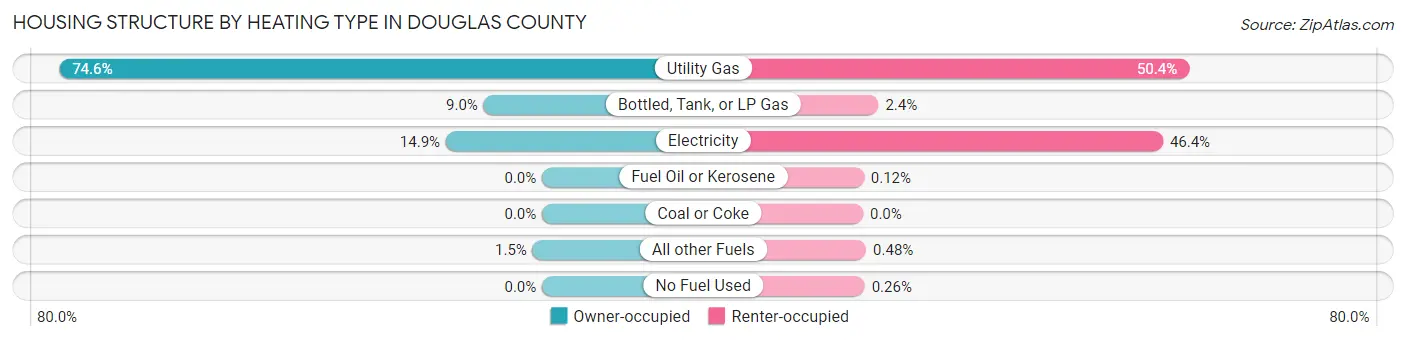
| Heating Type | Owner-occupied | Renter-occupied |
| Utility Gas | 18,663 (74.6%) | 12,397 (50.4%) |
| Bottled, Tank, or LP Gas | 2,258 (9.0%) | 588 (2.4%) |
| Electricity | 3,718 (14.9%) | 11,404 (46.4%) |
| Fuel Oil or Kerosene | 0 (0.0%) | 30 (0.1%) |
| Coal or Coke | 0 (0.0%) | 0 (0.0%) |
| All other Fuels | 365 (1.5%) | 118 (0.5%) |
| No Fuel Used | 0 (0.0%) | 64 (0.3%) |
| Total | 25,004 (100.0%) | 24,601 (100.0%) |
Household Vehicle Usage in Douglas County
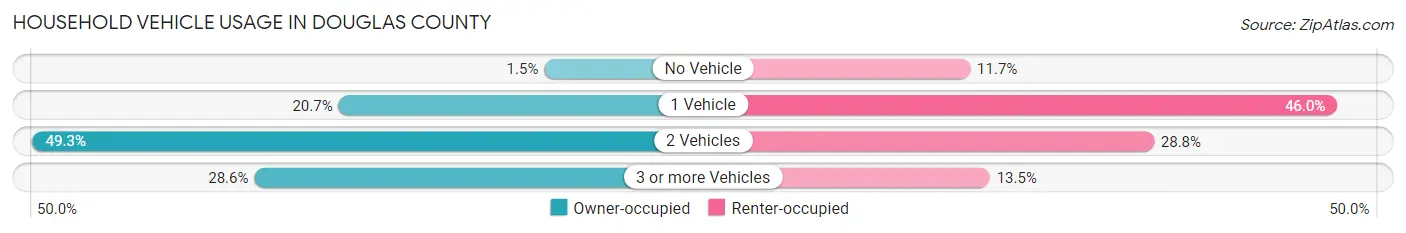
| Vehicles per Household | Owner-occupied | Renter-occupied |
| No Vehicle | 372 (1.5%) | 2,877 (11.7%) |
| 1 Vehicle | 5,175 (20.7%) | 11,305 (46.0%) |
| 2 Vehicles | 12,315 (49.2%) | 7,094 (28.8%) |
| 3 or more Vehicles | 7,142 (28.6%) | 3,325 (13.5%) |
| Total | 25,004 (100.0%) | 24,601 (100.0%) |
Real Estate & Mortgages in Douglas County
Real Estate and Mortgage Overview in Douglas County
| Characteristic | Without Mortgage | With Mortgage |
| Housing Units | 8,663 | 16,341 |
| Median Property Value | $255,400 | $262,000 |
| Median Household Income | $85,842 | $5,405 |
| Monthly Housing Costs | $701 | $2,041 |
| Real Estate Taxes | $3,214 | $323 |
Property Value by Mortgage Status in Douglas County
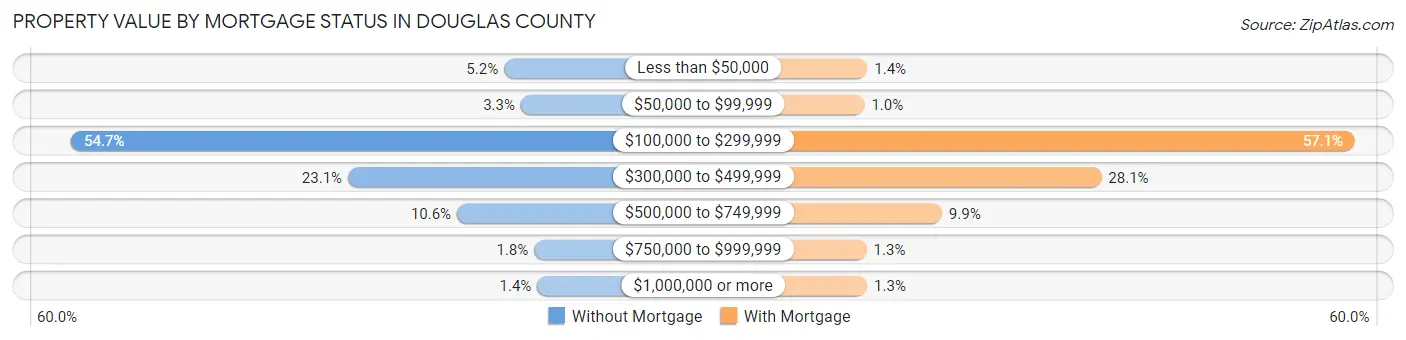
| Property Value | Without Mortgage | With Mortgage |
| Less than $50,000 | 451 (5.2%) | 220 (1.3%) |
| $50,000 to $99,999 | 285 (3.3%) | 166 (1.0%) |
| $100,000 to $299,999 | 4,737 (54.7%) | 9,325 (57.1%) |
| $300,000 to $499,999 | 1,997 (23.1%) | 4,592 (28.1%) |
| $500,000 to $749,999 | 917 (10.6%) | 1,613 (9.9%) |
| $750,000 to $999,999 | 153 (1.8%) | 207 (1.3%) |
| $1,000,000 or more | 123 (1.4%) | 218 (1.3%) |
| Total | 8,663 (100.0%) | 16,341 (100.0%) |
Household Income by Mortgage Status in Douglas County
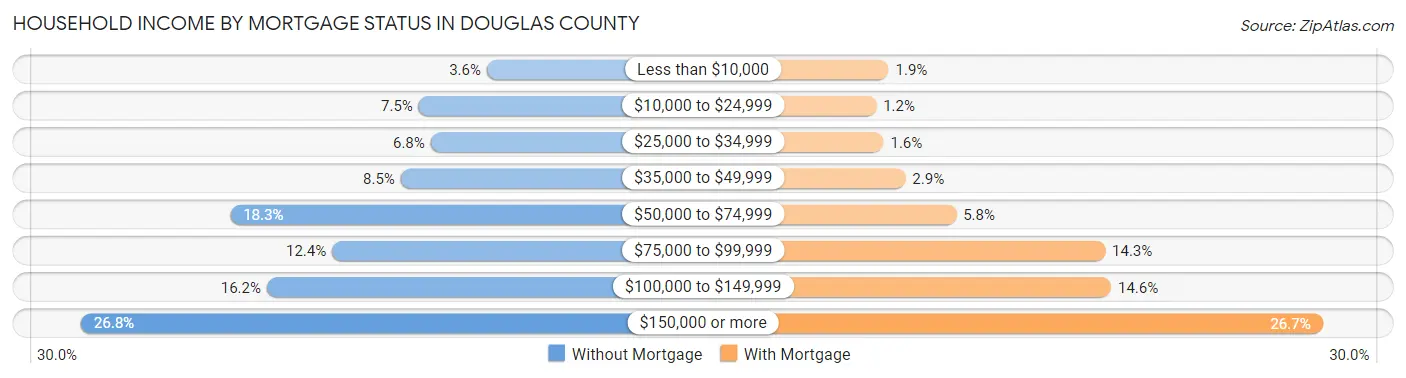
| Household Income | Without Mortgage | With Mortgage |
| Less than $10,000 | 311 (3.6%) | 309 (1.9%) |
| $10,000 to $24,999 | 648 (7.5%) | 193 (1.2%) |
| $25,000 to $34,999 | 589 (6.8%) | 262 (1.6%) |
| $35,000 to $49,999 | 737 (8.5%) | 465 (2.9%) |
| $50,000 to $74,999 | 1,581 (18.2%) | 939 (5.8%) |
| $75,000 to $99,999 | 1,077 (12.4%) | 2,331 (14.3%) |
| $100,000 to $149,999 | 1,400 (16.2%) | 2,386 (14.6%) |
| $150,000 or more | 2,320 (26.8%) | 4,360 (26.7%) |
| Total | 8,663 (100.0%) | 16,341 (100.0%) |
Property Value to Household Income Ratio in Douglas County
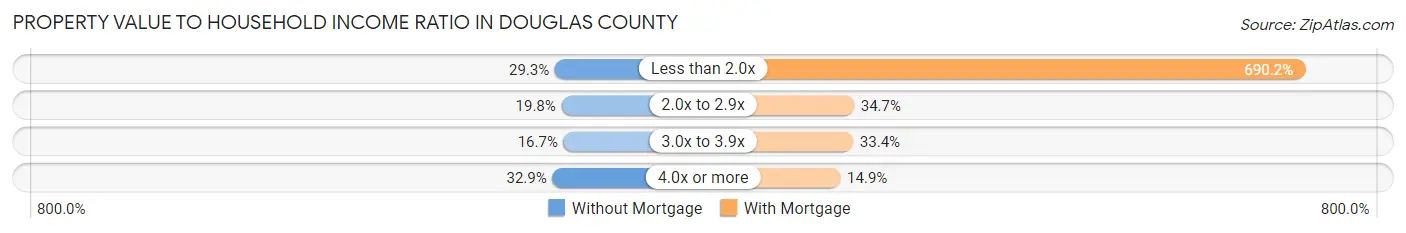
| Value-to-Income Ratio | Without Mortgage | With Mortgage |
| Less than 2.0x | 2,541 (29.3%) | 112,782 (690.2%) |
| 2.0x to 2.9x | 1,715 (19.8%) | 5,668 (34.7%) |
| 3.0x to 3.9x | 1,443 (16.7%) | 5,459 (33.4%) |
| 4.0x or more | 2,851 (32.9%) | 2,426 (14.8%) |
| Total | 8,663 (100.0%) | 16,341 (100.0%) |
Real Estate Taxes by Mortgage Status in Douglas County
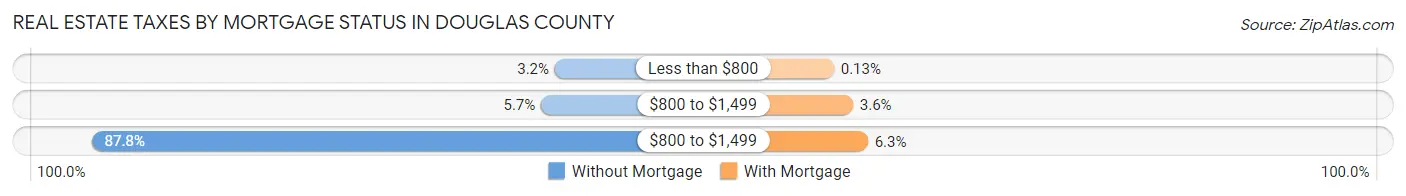
| Property Taxes | Without Mortgage | With Mortgage |
| Less than $800 | 273 (3.2%) | 21 (0.1%) |
| $800 to $1,499 | 490 (5.7%) | 591 (3.6%) |
| $800 to $1,499 | 7,603 (87.8%) | 1,035 (6.3%) |
| Total | 8,663 (100.0%) | 16,341 (100.0%) |
Health & Disability in Douglas County
Health Insurance Coverage by Age in Douglas County
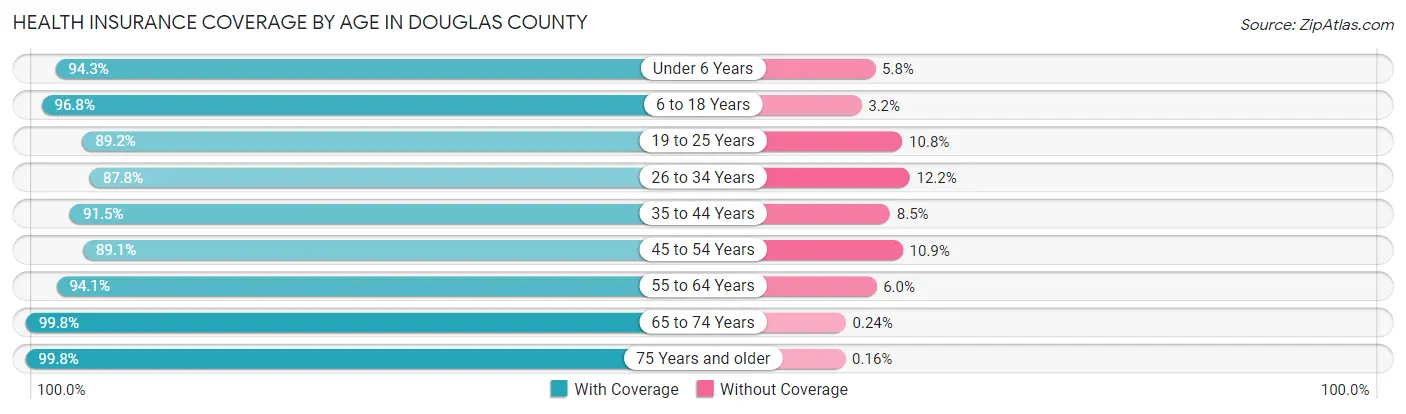
| Age Bracket | With Coverage | Without Coverage |
| Under 6 Years | 6,404 (94.3%) | 391 (5.8%) |
| 6 to 18 Years | 17,085 (96.8%) | 560 (3.2%) |
| 19 to 25 Years | 23,923 (89.2%) | 2,894 (10.8%) |
| 26 to 34 Years | 12,828 (87.8%) | 1,777 (12.2%) |
| 35 to 44 Years | 13,171 (91.5%) | 1,222 (8.5%) |
| 45 to 54 Years | 10,004 (89.1%) | 1,220 (10.9%) |
| 55 to 64 Years | 10,817 (94.1%) | 684 (5.9%) |
| 65 to 74 Years | 9,683 (99.8%) | 23 (0.2%) |
| 75 Years and older | 5,697 (99.8%) | 9 (0.2%) |
| Total | 109,612 (92.6%) | 8,780 (7.4%) |
Health Insurance Coverage by Citizenship Status in Douglas County
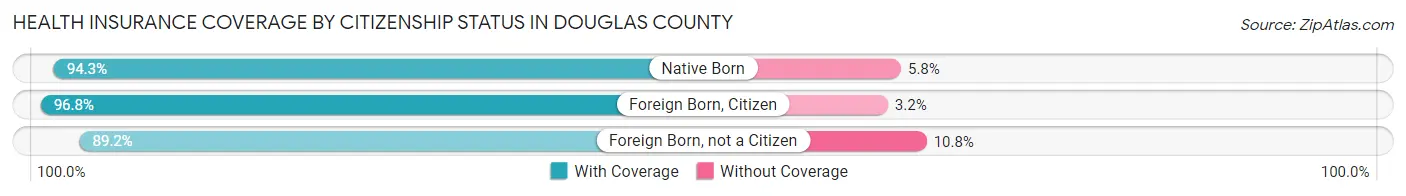
| Citizenship Status | With Coverage | Without Coverage |
| Native Born | 6,404 (94.3%) | 391 (5.8%) |
| Foreign Born, Citizen | 17,085 (96.8%) | 560 (3.2%) |
| Foreign Born, not a Citizen | 23,923 (89.2%) | 2,894 (10.8%) |
Health Insurance Coverage by Household Income in Douglas County
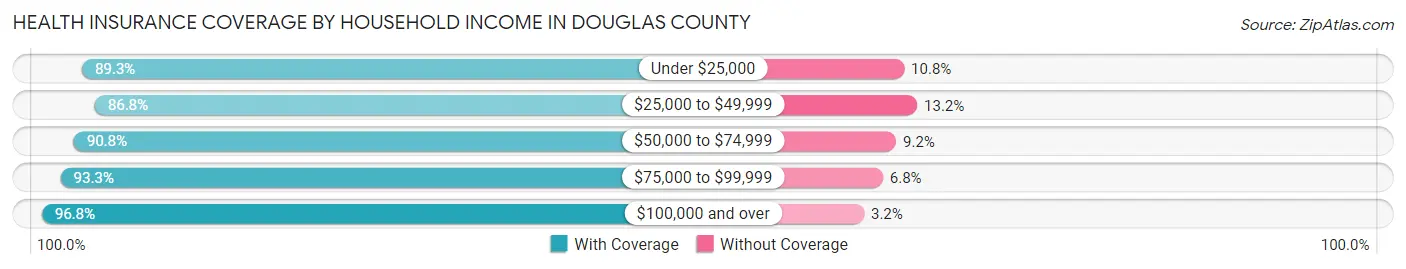
| Household Income | With Coverage | Without Coverage |
| Under $25,000 | 12,456 (89.2%) | 1,501 (10.7%) |
| $25,000 to $49,999 | 15,204 (86.8%) | 2,306 (13.2%) |
| $50,000 to $74,999 | 16,774 (90.8%) | 1,706 (9.2%) |
| $75,000 to $99,999 | 14,179 (93.2%) | 1,026 (6.8%) |
| $100,000 and over | 43,412 (96.8%) | 1,449 (3.2%) |
Public vs Private Health Insurance Coverage by Age in Douglas County
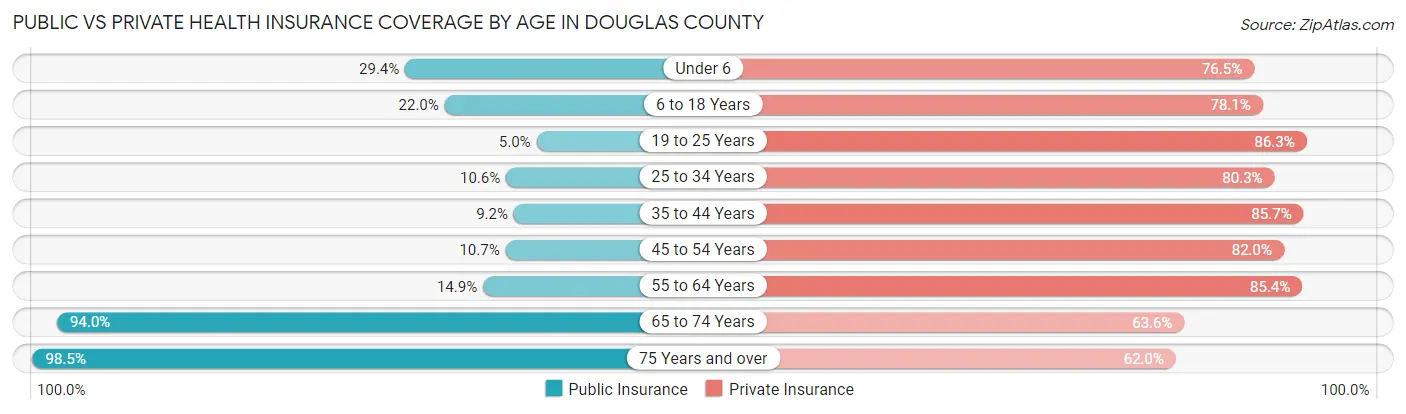
| Age Bracket | Public Insurance | Private Insurance |
| Under 6 | 1,996 (29.4%) | 5,198 (76.5%) |
| 6 to 18 Years | 3,889 (22.0%) | 13,782 (78.1%) |
| 19 to 25 Years | 1,339 (5.0%) | 23,131 (86.3%) |
| 25 to 34 Years | 1,554 (10.6%) | 11,726 (80.3%) |
| 35 to 44 Years | 1,324 (9.2%) | 12,333 (85.7%) |
| 45 to 54 Years | 1,206 (10.7%) | 9,207 (82.0%) |
| 55 to 64 Years | 1,716 (14.9%) | 9,827 (85.4%) |
| 65 to 74 Years | 9,124 (94.0%) | 6,169 (63.6%) |
| 75 Years and over | 5,622 (98.5%) | 3,537 (62.0%) |
| Total | 27,770 (23.5%) | 94,910 (80.2%) |
Disability Status by Sex by Age in Douglas County
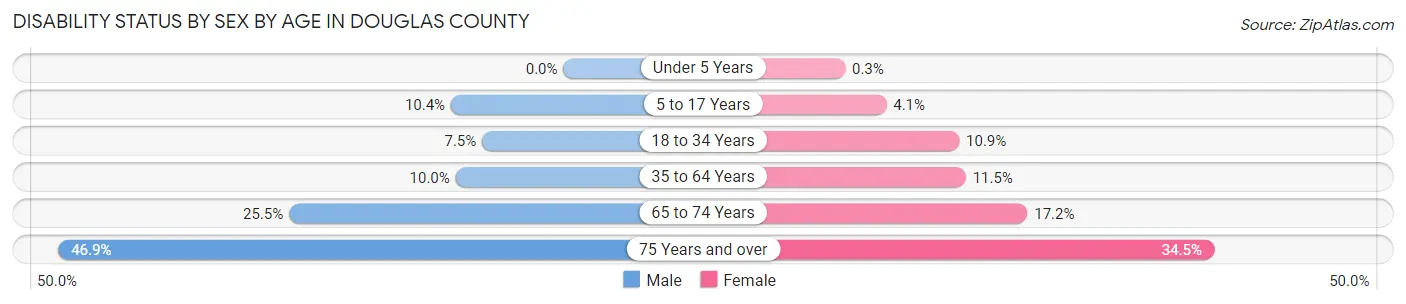
| Age Bracket | Male | Female |
| Under 5 Years | 0 (0.0%) | 8 (0.3%) |
| 5 to 17 Years | 834 (10.4%) | 319 (4.1%) |
| 18 to 34 Years | 1,711 (7.5%) | 2,400 (10.9%) |
| 35 to 64 Years | 1,854 (10.0%) | 2,137 (11.5%) |
| 65 to 74 Years | 1,194 (25.5%) | 864 (17.2%) |
| 75 Years and over | 1,067 (46.9%) | 1,184 (34.5%) |
Disability Class by Sex by Age in Douglas County
Disability Class: Hearing Difficulty
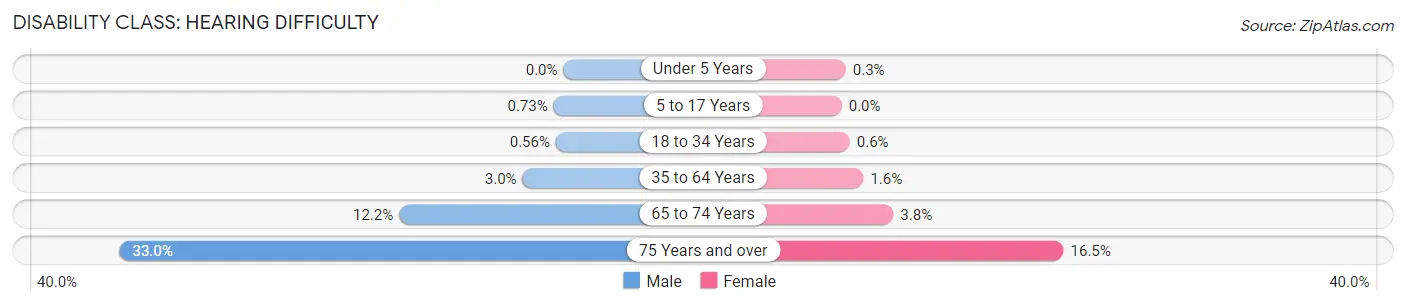
| Age Bracket | Male | Female |
| Under 5 Years | 0 (0.0%) | 8 (0.3%) |
| 5 to 17 Years | 58 (0.7%) | 0 (0.0%) |
| 18 to 34 Years | 127 (0.6%) | 133 (0.6%) |
| 35 to 64 Years | 563 (3.0%) | 300 (1.6%) |
| 65 to 74 Years | 572 (12.2%) | 192 (3.8%) |
| 75 Years and over | 750 (33.0%) | 565 (16.5%) |
Disability Class: Vision Difficulty
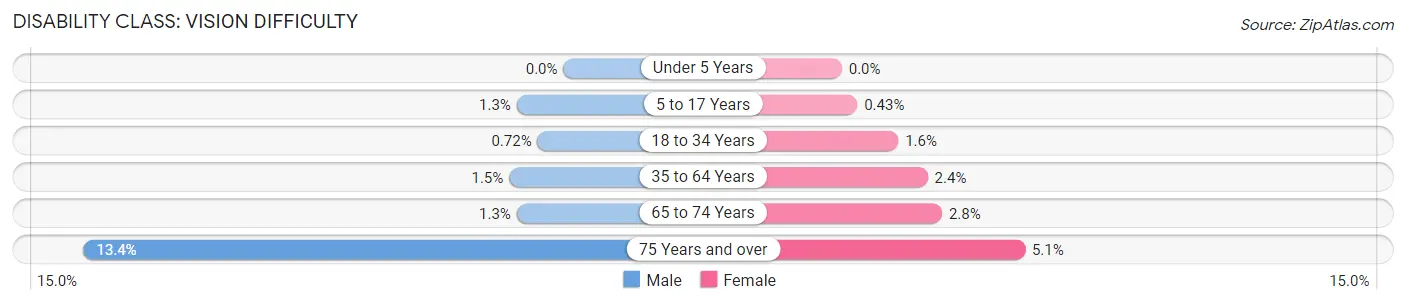
| Age Bracket | Male | Female |
| Under 5 Years | 0 (0.0%) | 0 (0.0%) |
| 5 to 17 Years | 104 (1.3%) | 33 (0.4%) |
| 18 to 34 Years | 163 (0.7%) | 346 (1.6%) |
| 35 to 64 Years | 279 (1.5%) | 445 (2.4%) |
| 65 to 74 Years | 61 (1.3%) | 140 (2.8%) |
| 75 Years and over | 304 (13.4%) | 175 (5.1%) |
Disability Class: Cognitive Difficulty
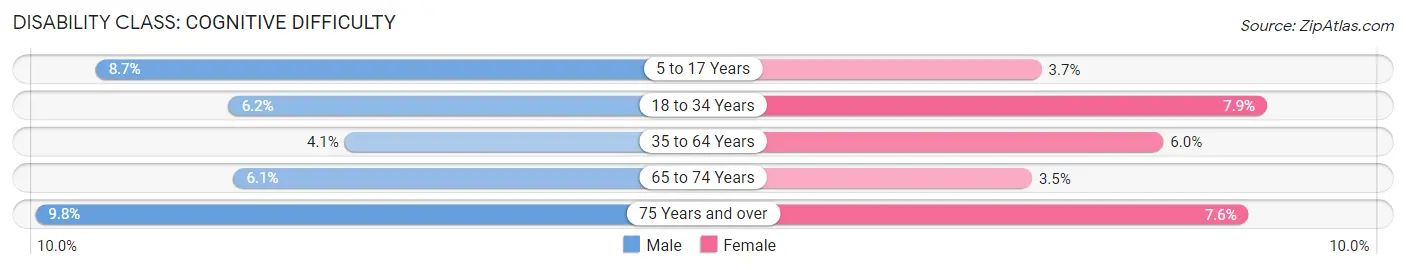
| Age Bracket | Male | Female |
| 5 to 17 Years | 694 (8.7%) | 286 (3.7%) |
| 18 to 34 Years | 1,410 (6.2%) | 1,739 (7.9%) |
| 35 to 64 Years | 753 (4.1%) | 1,109 (6.0%) |
| 65 to 74 Years | 287 (6.1%) | 177 (3.5%) |
| 75 Years and over | 223 (9.8%) | 259 (7.5%) |
Disability Class: Ambulatory Difficulty
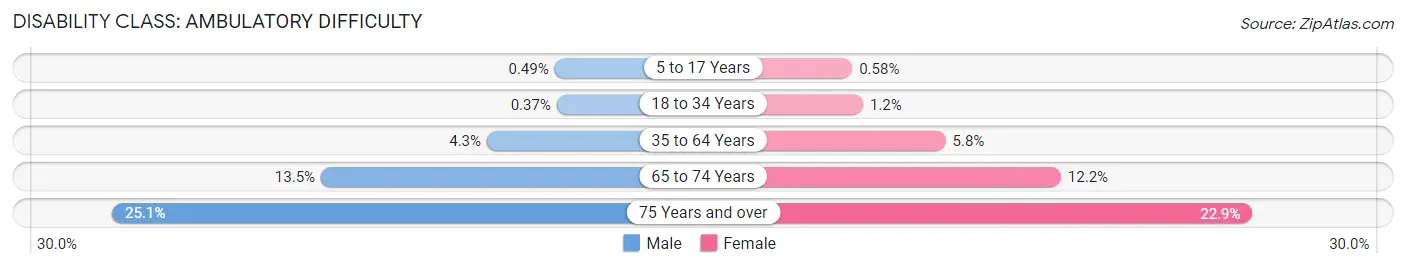
| Age Bracket | Male | Female |
| 5 to 17 Years | 39 (0.5%) | 45 (0.6%) |
| 18 to 34 Years | 83 (0.4%) | 260 (1.2%) |
| 35 to 64 Years | 789 (4.3%) | 1,075 (5.8%) |
| 65 to 74 Years | 633 (13.5%) | 612 (12.2%) |
| 75 Years and over | 572 (25.1%) | 784 (22.9%) |
Disability Class: Self-Care Difficulty
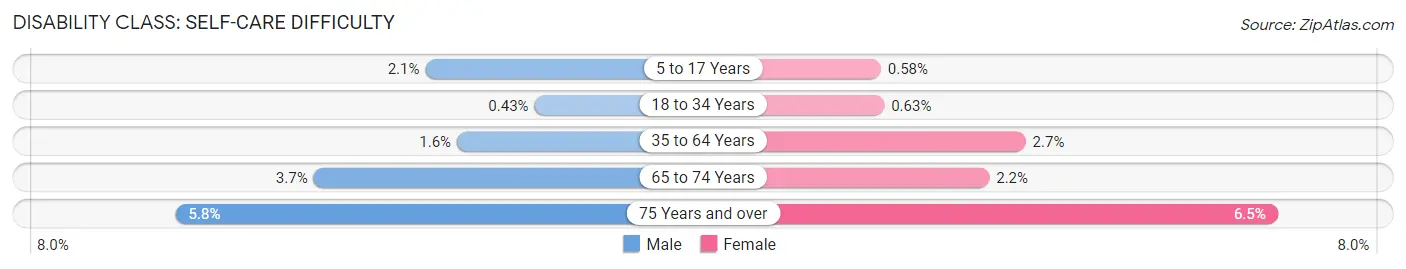
| Age Bracket | Male | Female |
| 5 to 17 Years | 164 (2.1%) | 45 (0.6%) |
| 18 to 34 Years | 97 (0.4%) | 138 (0.6%) |
| 35 to 64 Years | 293 (1.6%) | 508 (2.7%) |
| 65 to 74 Years | 174 (3.7%) | 110 (2.2%) |
| 75 Years and over | 131 (5.8%) | 222 (6.5%) |
Technology Access in Douglas County
Computing Device Access in Douglas County
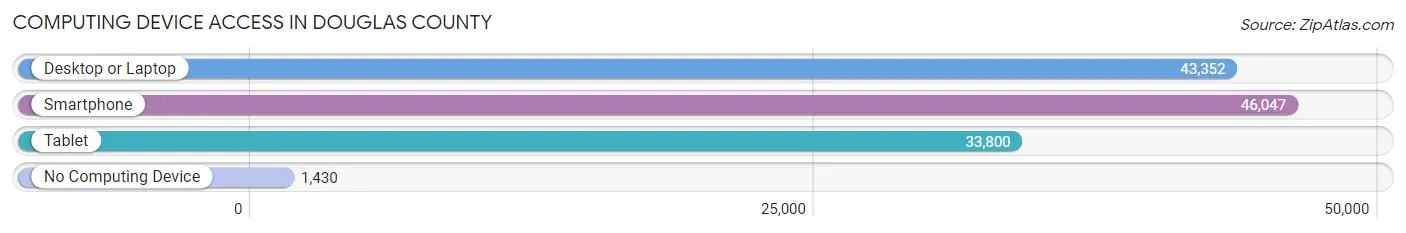
| Device Type | # Households | % Households |
| Desktop or Laptop | 43,352 | 87.4% |
| Smartphone | 46,047 | 92.8% |
| Tablet | 33,800 | 68.1% |
| No Computing Device | 1,430 | 2.9% |
| Total | 49,605 | 100.0% |
Internet Access in Douglas County
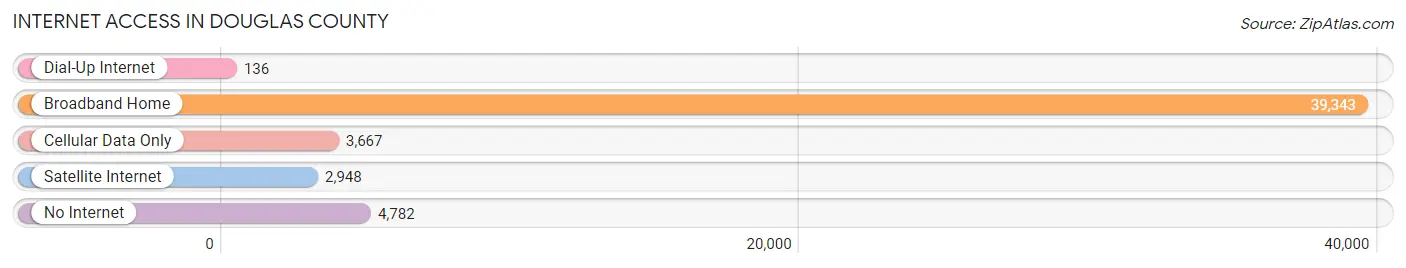
| Internet Type | # Households | % Households |
| Dial-Up Internet | 136 | 0.3% |
| Broadband Home | 39,343 | 79.3% |
| Cellular Data Only | 3,667 | 7.4% |
| Satellite Internet | 2,948 | 5.9% |
| No Internet | 4,782 | 9.6% |
| Total | 49,605 | 100.0% |
Douglas County Summary
Douglas County, Kansas is located in the northeastern part of the state and is part of the Lawrence, Kansas Metropolitan Statistical Area. The county was established in 1855 and named after Stephen A. Douglas, a U.S. Senator from Illinois. As of the 2010 census, the population of Douglas County was 110,826, making it the sixth most populous county in Kansas.
Geography
Douglas County is located in the northeastern part of Kansas and is bordered by Jefferson County to the north, Leavenworth County to the east, Johnson County to the south, and Franklin and Osage counties to the west. The county covers an area of 576 square miles and is home to the cities of Lawrence, Eudora, Baldwin City, and Lecompton. The county is also home to the Haskell Indian Nations University, the University of Kansas, and the Lawrence Public Schools.
The county is located in the Flint Hills region of Kansas and is characterized by rolling hills and prairies. The Wakarusa River runs through the county and is a popular destination for fishing, canoeing, and kayaking. The county is also home to Clinton State Park, which offers camping, fishing, and hiking opportunities.
Economy
Douglas County is home to a diverse economy that is driven by education, healthcare, and technology. The University of Kansas is the largest employer in the county, employing over 10,000 people. Other major employers include Lawrence Memorial Hospital, Lawrence Public Schools, and the Haskell Indian Nations University.
The county is also home to a number of technology companies, including Garmin International, which produces GPS navigation systems, and the software company Black & Veatch. The county is also home to a number of manufacturing companies, including the Lawrence Paper Company and the Lawrence Foundry.
Demographics
As of the 2010 census, the population of Douglas County was 110,826, making it the sixth most populous county in Kansas. The population is spread out with a median age of 33.7 years. The racial makeup of the county is 87.3% White, 5.3% African American, 1.7% Native American, 2.2% Asian, 0.2% Pacific Islander, and 2.3% from other races.
The median household income in Douglas County is $50,945 and the median family income is $63,945. The per capita income is $25,945. The poverty rate is 11.3%, which is lower than the national average.
Conclusion
Douglas County, Kansas is a diverse and vibrant county located in the northeastern part of the state. The county is home to a number of educational institutions, healthcare facilities, and technology companies. The population of the county is 110,826 and is spread out with a median age of 33.7 years. The median household income in Douglas County is $50,945 and the poverty rate is 11.3%. Douglas County is a great place to live, work, and play.
Common Questions
What is the Total Population of Douglas County?
Total Population of Douglas County is 119,094.
What is the Total Male Population of Douglas County?
Total Male Population of Douglas County is 59,385.
What is the Total Female Population of Douglas County?
Total Female Population of Douglas County is 59,709.
What is the Ratio of Males per 100 Females in Douglas County?
There are 99.46 Males per 100 Females in Douglas County.
What is the Ratio of Females per 100 Males in Douglas County?
There are 100.55 Females per 100 Males in Douglas County.
What is the Median Population Age in Douglas County?
Median Population Age in Douglas County is 30.7 Years.
What is the Average Family Size in Douglas County
Average Family Size in Douglas County is 2.9 People.
What is the Average Household Size in Douglas County
Average Household Size in Douglas County is 2.2 People.
What is Per Capita Income in Douglas County?
Per Capita income in Douglas County is $37,261.
What is the Median Family Income in Douglas County?
Median Family Income in Douglas County is $101,379.
What is the Median Household income in Douglas County?
Median Household Income in Douglas County is $66,153.
What is Income or Wage Gap in Douglas County?
Income or Wage Gap in Douglas County is 25.6%.
Women in Douglas County earn 74.4 cents for every dollar earned by a man.
What is Family Income Deficit in Douglas County?
Family Income Deficit in Douglas County is $11,997.
Families that are below poverty line in Douglas County earn $11,997 less on average than the poverty threshold level.
What is Inequality or Gini Index in Douglas County?
Inequality or Gini Index in Douglas County is 0.46.
How Large is the Labor Force in Douglas County?
There are 70,386 People in the Labor Forcein in Douglas County.
What is the Percentage of People in the Labor Force in Douglas County?
70.4% of People are in the Labor Force in Douglas County.
What is the Unemployment Rate in Douglas County?
Unemployment Rate in Douglas County is 4.8%.