Dickinson County, KS
Dickinson County Map
Dickinson County Overview
18,492
TOTAL POPULATION
9,403
MALE POPULATION
9,089
FEMALE POPULATION
103.45
MALES / 100 FEMALES
96.66
FEMALES / 100 MALES
41.8
MEDIAN AGE
2.9
AVG FAMILY SIZE
2.3
AVG HOUSEHOLD SIZE
$35,615
PER CAPITA INCOME
$78,323
AVG FAMILY INCOME
$62,971
AVG HOUSEHOLD INCOME
32.3%
WAGE / INCOME GAP [ % ]
67.7¢/ $1
WAGE / INCOME GAP [ $ ]
$9,933
FAMILY INCOME DEFICIT
0.43
INEQUALITY / GINI INDEX
9,203
LABOR FORCE [ PEOPLE ]
62.4%
PERCENT IN LABOR FORCE
3.0%
UNEMPLOYMENT RATE
Dickinson County Area Codes
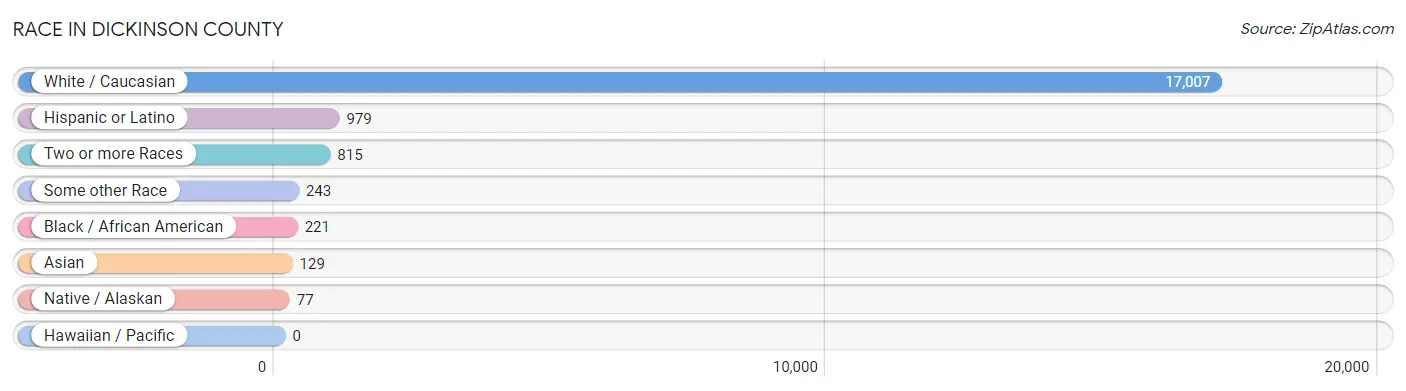
Race in Dickinson County
The most populous races in Dickinson County are White / Caucasian (17,007 | 92.0%), Hispanic or Latino (979 | 5.3%), and Two or more Races (815 | 4.4%).
| Race | # Population | % Population |
| Asian | 129 | 0.7% |
| Black / African American | 221 | 1.2% |
| Hawaiian / Pacific | 0 | 0.0% |
| Hispanic or Latino | 979 | 5.3% |
| Native / Alaskan | 77 | 0.4% |
| White / Caucasian | 17,007 | 92.0% |
| Two or more Races | 815 | 4.4% |
| Some other Race | 243 | 1.3% |
| Total | 18,492 | 100.0% |
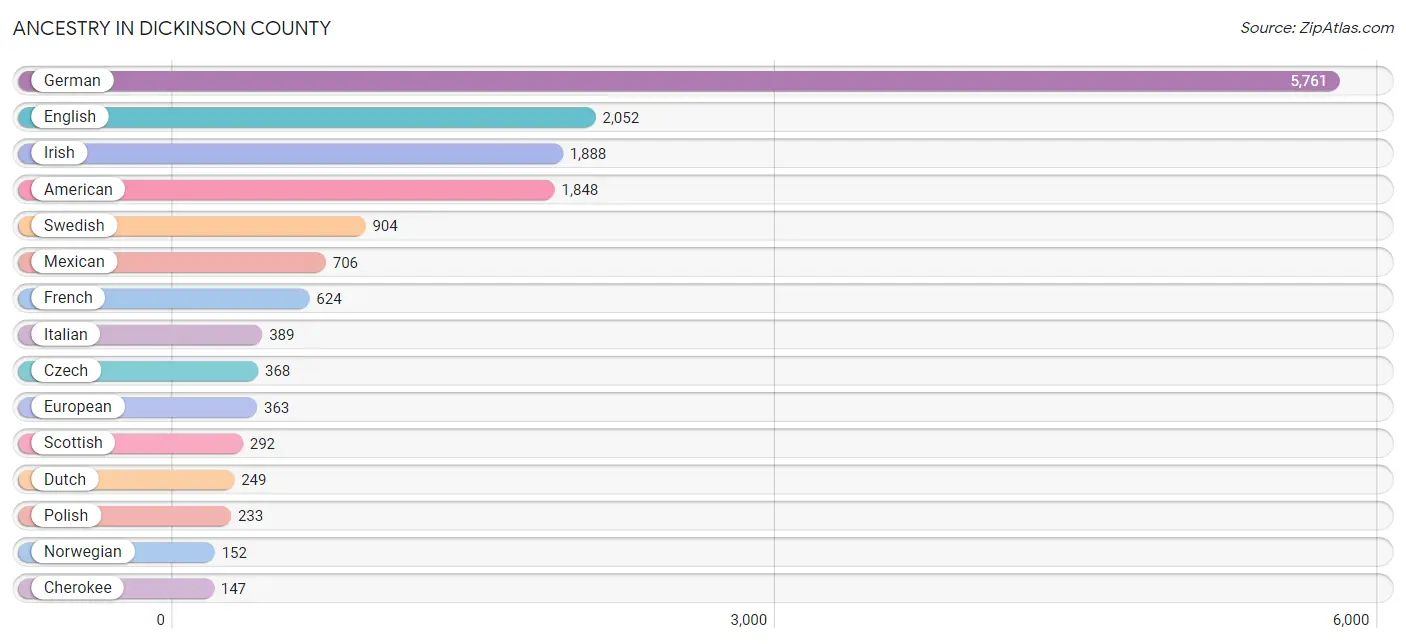
Ancestry in Dickinson County
The most populous ancestries reported in Dickinson County are German (5,761 | 31.1%), English (2,052 | 11.1%), Irish (1,888 | 10.2%), American (1,848 | 10.0%), and Swedish (904 | 4.9%), together accounting for 67.3% of all Dickinson County residents.
| Ancestry | # Population | % Population |
| Alsatian | 4 | 0.0% |
| American | 1,848 | 10.0% |
| Apache | 56 | 0.3% |
| Arab | 55 | 0.3% |
| Argentinean | 1 | 0.0% |
| Armenian | 3 | 0.0% |
| Austrian | 32 | 0.2% |
| Basque | 8 | 0.0% |
| Belgian | 38 | 0.2% |
| Blackfeet | 5 | 0.0% |
| British | 41 | 0.2% |
| Bulgarian | 11 | 0.1% |
| Burmese | 57 | 0.3% |
| Celtic | 7 | 0.0% |
| Central American | 69 | 0.4% |
| Cherokee | 147 | 0.8% |
| Choctaw | 45 | 0.2% |
| Costa Rican | 1 | 0.0% |
| Croatian | 54 | 0.3% |
| Cuban | 28 | 0.2% |
| Czech | 368 | 2.0% |
| Czechoslovakian | 16 | 0.1% |
| Danish | 11 | 0.1% |
| Delaware | 7 | 0.0% |
| Dutch | 249 | 1.3% |
| Eastern European | 17 | 0.1% |
| Egyptian | 5 | 0.0% |
| English | 2,052 | 11.1% |
| Ethiopian | 13 | 0.1% |
| European | 363 | 2.0% |
| French | 624 | 3.4% |
| French Canadian | 122 | 0.7% |
| German | 5,761 | 31.1% |
| Greek | 16 | 0.1% |
| Guamanian / Chamorro | 20 | 0.1% |
| Guatemalan | 44 | 0.2% |
| Honduran | 17 | 0.1% |
| Hungarian | 4 | 0.0% |
| Irish | 1,888 | 10.2% |
| Iroquois | 4 | 0.0% |
| Italian | 389 | 2.1% |
| Korean | 131 | 0.7% |
| Lebanese | 25 | 0.1% |
| Mexican | 706 | 3.8% |
| Mexican American Indian | 20 | 0.1% |
| Nigerian | 25 | 0.1% |
| Northern European | 7 | 0.0% |
| Norwegian | 152 | 0.8% |
| Osage | 4 | 0.0% |
| Palestinian | 25 | 0.1% |
| Panamanian | 7 | 0.0% |
| Pennsylvania German | 18 | 0.1% |
| Peruvian | 22 | 0.1% |
| Polish | 233 | 1.3% |
| Potawatomi | 1 | 0.0% |
| Puerto Rican | 50 | 0.3% |
| Romanian | 2 | 0.0% |
| Russian | 87 | 0.5% |
| Scandinavian | 35 | 0.2% |
| Scotch-Irish | 147 | 0.8% |
| Scottish | 292 | 1.6% |
| Serbian | 22 | 0.1% |
| Shoshone | 1 | 0.0% |
| Sioux | 15 | 0.1% |
| South American | 23 | 0.1% |
| South American Indian | 8 | 0.0% |
| Spaniard | 81 | 0.4% |
| Spanish | 14 | 0.1% |
| Sri Lankan | 35 | 0.2% |
| Subsaharan African | 38 | 0.2% |
| Swedish | 904 | 4.9% |
| Swiss | 90 | 0.5% |
| Ukrainian | 17 | 0.1% |
| Welsh | 60 | 0.3% | View All 74 Rows |
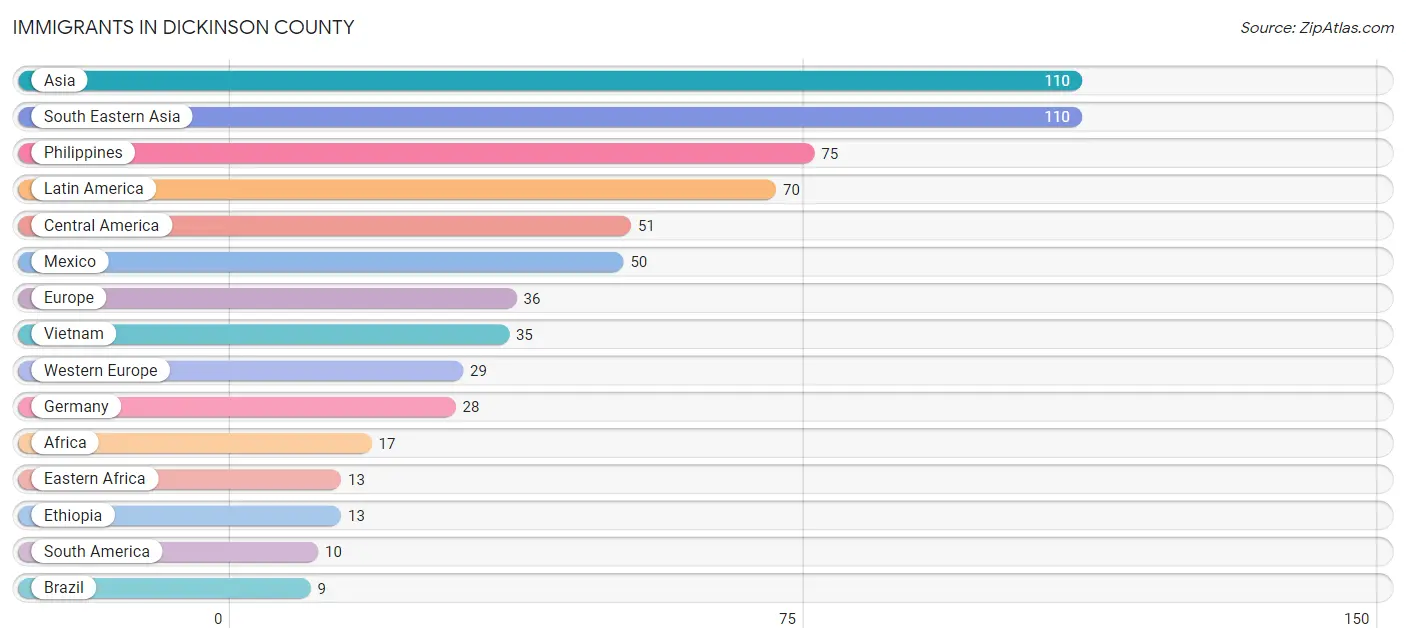
Immigrants in Dickinson County
The most numerous immigrant groups reported in Dickinson County came from Asia (110 | 0.6%), South Eastern Asia (110 | 0.6%), Philippines (75 | 0.4%), Latin America (70 | 0.4%), and Central America (51 | 0.3%), together accounting for 2.3% of all Dickinson County residents.
| Immigration Origin | # Population | % Population |
| Africa | 17 | 0.1% |
| Argentina | 1 | 0.0% |
| Asia | 110 | 0.6% |
| Brazil | 9 | 0.1% |
| Canada | 3 | 0.0% |
| Caribbean | 9 | 0.1% |
| Central America | 51 | 0.3% |
| Costa Rica | 1 | 0.0% |
| Cuba | 9 | 0.1% |
| Eastern Africa | 13 | 0.1% |
| Ethiopia | 13 | 0.1% |
| Europe | 36 | 0.2% |
| France | 1 | 0.0% |
| Germany | 28 | 0.2% |
| Latin America | 70 | 0.4% |
| Mexico | 50 | 0.3% |
| Nigeria | 4 | 0.0% |
| Philippines | 75 | 0.4% |
| South America | 10 | 0.1% |
| South Eastern Asia | 110 | 0.6% |
| Southern Europe | 7 | 0.0% |
| Spain | 7 | 0.0% |
| Vietnam | 35 | 0.2% |
| Western Africa | 4 | 0.0% |
| Western Europe | 29 | 0.2% | View All 25 Rows |
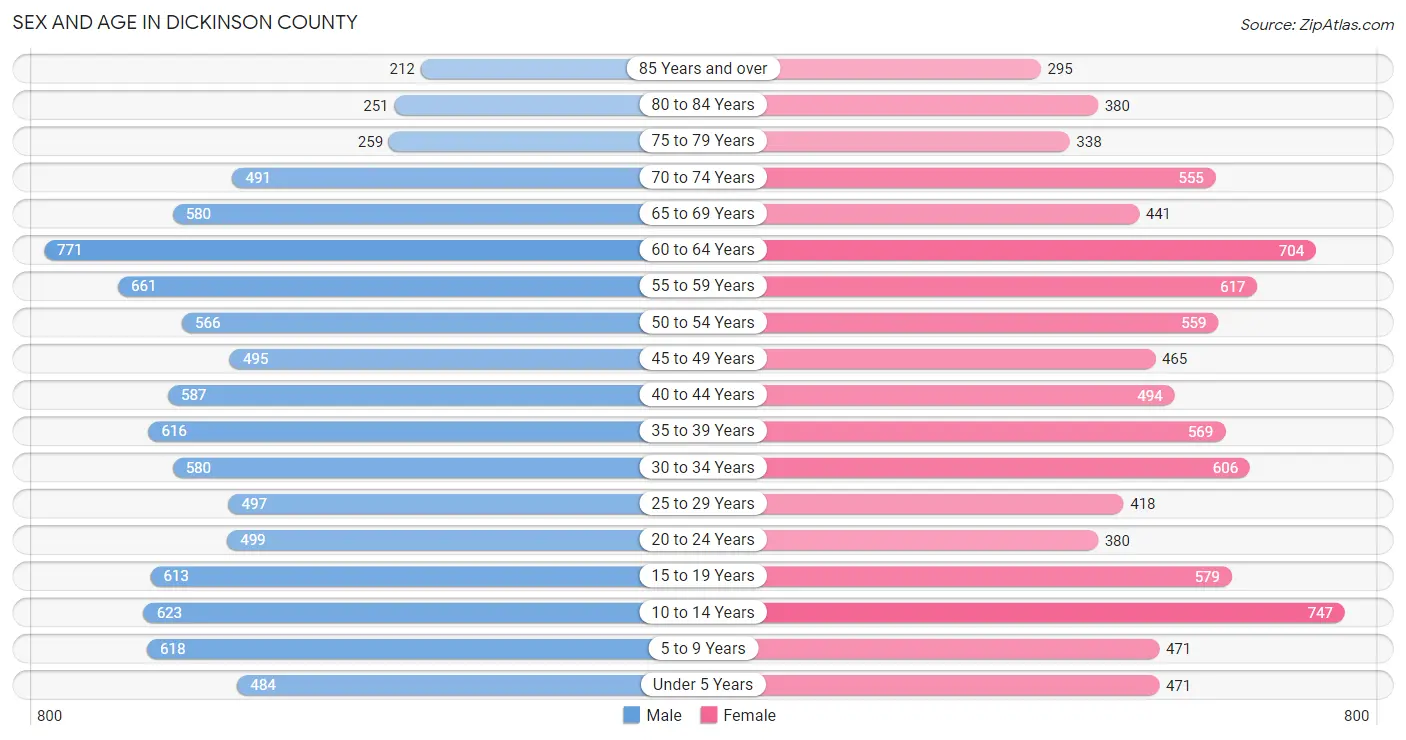
Sex and Age in Dickinson County
Sex and Age in Dickinson County
The most populous age groups in Dickinson County are 60 to 64 Years (771 | 8.2%) for men and 10 to 14 Years (747 | 8.2%) for women.
| Age Bracket | Male | Female |
| Under 5 Years | 484 (5.1%) | 471 (5.2%) |
| 5 to 9 Years | 618 (6.6%) | 471 (5.2%) |
| 10 to 14 Years | 623 (6.6%) | 747 (8.2%) |
| 15 to 19 Years | 613 (6.5%) | 579 (6.4%) |
| 20 to 24 Years | 499 (5.3%) | 380 (4.2%) |
| 25 to 29 Years | 497 (5.3%) | 418 (4.6%) |
| 30 to 34 Years | 580 (6.2%) | 606 (6.7%) |
| 35 to 39 Years | 616 (6.6%) | 569 (6.3%) |
| 40 to 44 Years | 587 (6.2%) | 494 (5.4%) |
| 45 to 49 Years | 495 (5.3%) | 465 (5.1%) |
| 50 to 54 Years | 566 (6.0%) | 559 (6.1%) |
| 55 to 59 Years | 661 (7.0%) | 617 (6.8%) |
| 60 to 64 Years | 771 (8.2%) | 704 (7.7%) |
| 65 to 69 Years | 580 (6.2%) | 441 (4.9%) |
| 70 to 74 Years | 491 (5.2%) | 555 (6.1%) |
| 75 to 79 Years | 259 (2.8%) | 338 (3.7%) |
| 80 to 84 Years | 251 (2.7%) | 380 (4.2%) |
| 85 Years and over | 212 (2.2%) | 295 (3.3%) |
| Total | 9,403 (100.0%) | 9,089 (100.0%) |
Families and Households in Dickinson County
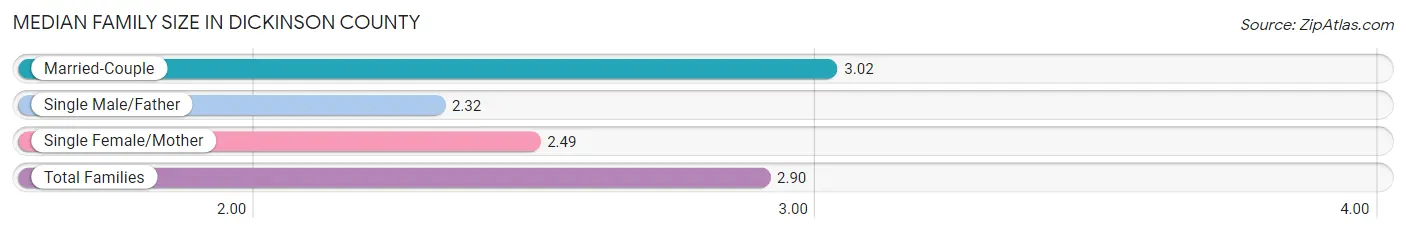
Median Family Size in Dickinson County
The median family size in Dickinson County is 2.90 persons per family, with married-couple families (4,069 | 80.2%) accounting for the largest median family size of 3.02 persons per family. On the other hand, single male/father families (262 | 5.2%) represent the smallest median family size with 2.32 persons per family.
| Family Type | # Families | Family Size |
| Married-Couple | 4,069 (80.2%) | 3.02 |
| Single Male/Father | 262 (5.2%) | 2.32 |
| Single Female/Mother | 744 (14.7%) | 2.49 |
| Total Families | 5,075 (100.0%) | 2.90 |
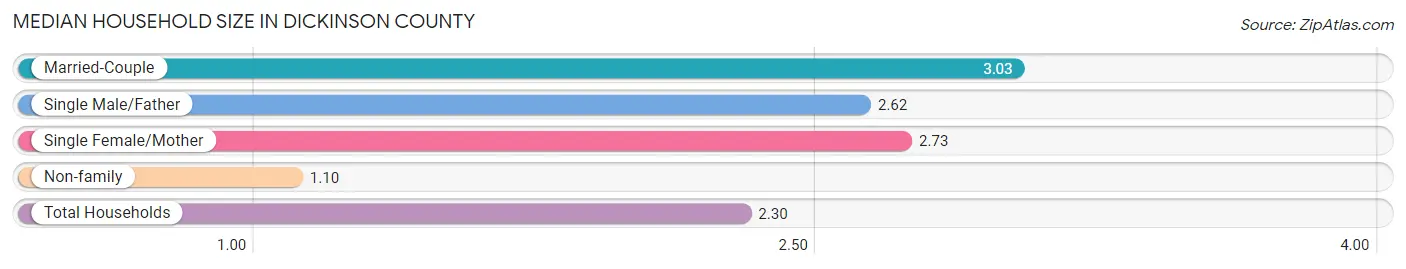
Median Household Size in Dickinson County
The median household size in Dickinson County is 2.30 persons per household, with married-couple households (4,069 | 51.5%) accounting for the largest median household size of 3.03 persons per household. non-family households (2,828 | 35.8%) represent the smallest median household size with 1.10 persons per household.
| Household Type | # Households | Household Size |
| Married-Couple | 4,069 (51.5%) | 3.03 |
| Single Male/Father | 262 (3.3%) | 2.62 |
| Single Female/Mother | 744 (9.4%) | 2.73 |
| Non-family | 2,828 (35.8%) | 1.10 |
| Total Households | 7,903 (100.0%) | 2.30 |
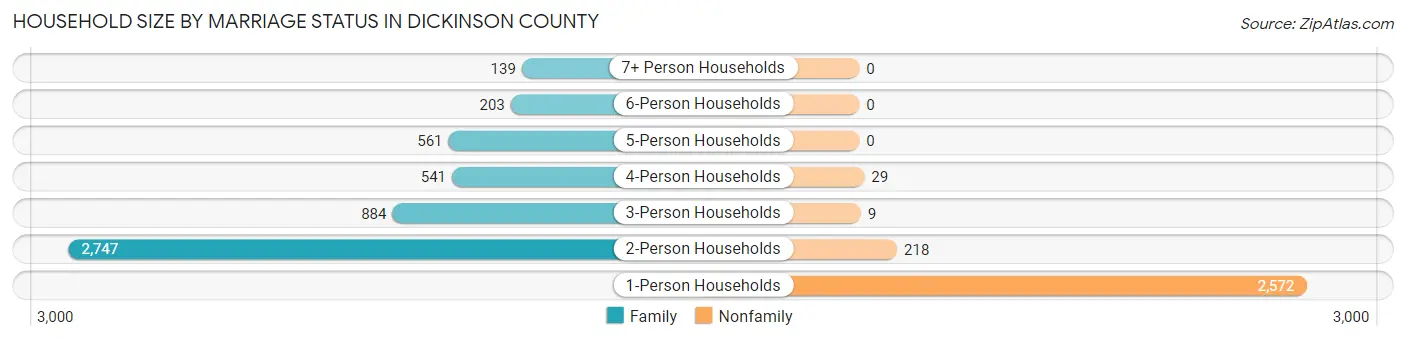
Household Size by Marriage Status in Dickinson County
Out of a total of 7,903 households in Dickinson County, 5,075 (64.2%) are family households, while 2,828 (35.8%) are nonfamily households. The most numerous type of family households are 2-person households, comprising 2,747, and the most common type of nonfamily households are 1-person households, comprising 2,572.
| Household Size | Family Households | Nonfamily Households |
| 1-Person Households | - | 2,572 (32.5%) |
| 2-Person Households | 2,747 (34.8%) | 218 (2.8%) |
| 3-Person Households | 884 (11.2%) | 9 (0.1%) |
| 4-Person Households | 541 (6.9%) | 29 (0.4%) |
| 5-Person Households | 561 (7.1%) | 0 (0.0%) |
| 6-Person Households | 203 (2.6%) | 0 (0.0%) |
| 7+ Person Households | 139 (1.8%) | 0 (0.0%) |
| Total | 5,075 (64.2%) | 2,828 (35.8%) |
Female Fertility in Dickinson County
Fertility by Age in Dickinson County
Average fertility rate in Dickinson County is 82.0 births per 1,000 women. Women in the age bracket of 20 to 34 years have the highest fertility rate with 187.0 births per 1,000 women. Women in the age bracket of 20 to 34 years acount for 87.0% of all women with births.
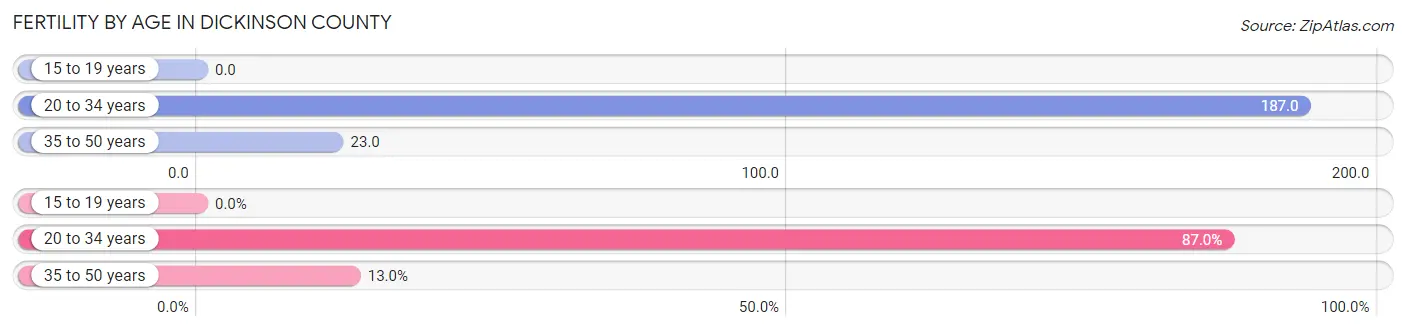
| Age Bracket | Women with Births | Births / 1,000 Women |
| 15 to 19 years | 0 (0.0%) | 0.0 |
| 20 to 34 years | 262 (87.0%) | 187.0 |
| 35 to 50 years | 39 (13.0%) | 23.0 |
| Total | 301 (100.0%) | 82.0 |
Fertility by Age by Marriage Status in Dickinson County
89.0% of women with births (301) in Dickinson County are married. The highest percentage of unmarried women with births falls into 35 to 50 years age bracket with 17.9% of them unmarried at the time of birth, while the lowest percentage of unmarried women with births belong to 20 to 34 years age bracket with 9.9% of them unmarried.
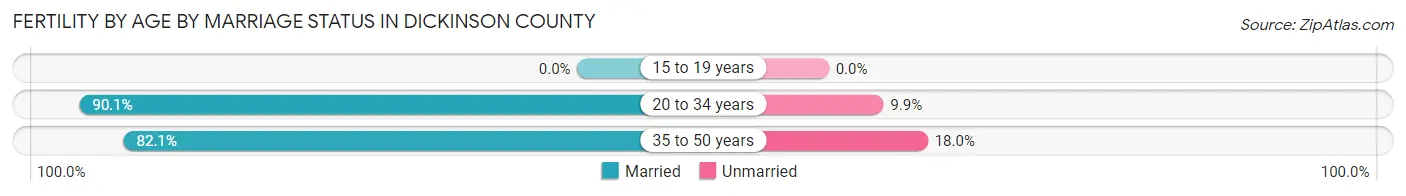
| Age Bracket | Married | Unmarried |
| 15 to 19 years | 0 (0.0%) | 0 (0.0%) |
| 20 to 34 years | 236 (90.1%) | 26 (9.9%) |
| 35 to 50 years | 32 (82.1%) | 7 (17.9%) |
| Total | 268 (89.0%) | 33 (11.0%) |
Fertility by Education in Dickinson County
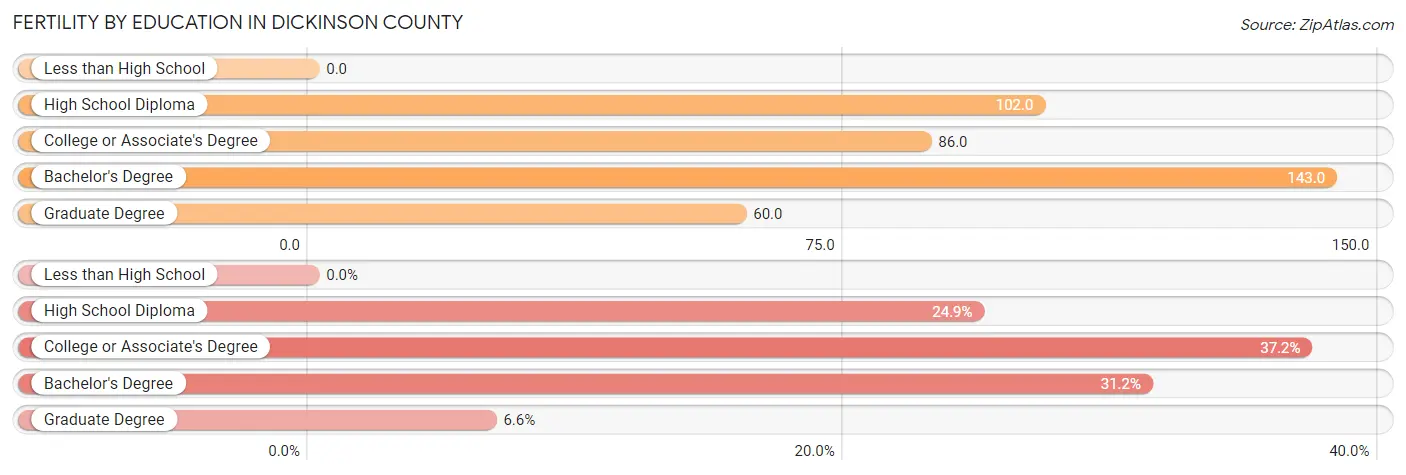
| Educational Attainment | Women with Births | Births / 1,000 Women |
| Less than High School | 0 (0.0%) | 0.0 |
| High School Diploma | 75 (24.9%) | 102.0 |
| College or Associate's Degree | 112 (37.2%) | 86.0 |
| Bachelor's Degree | 94 (31.2%) | 143.0 |
| Graduate Degree | 20 (6.6%) | 60.0 |
| Total | 301 (100.0%) | 82.0 |
Fertility by Education by Marriage Status in Dickinson County
11.0% of women with births in Dickinson County are unmarried. Women with the educational attainment of bachelor's degree are most likely to be married with 100.0% of them married at childbirth, while women with the educational attainment of high school diploma are least likely to be married with 34.7% of them unmarried at childbirth.
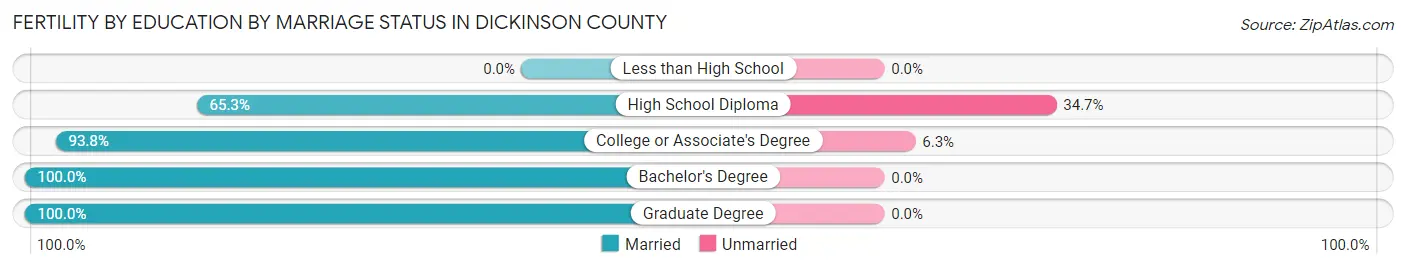
| Educational Attainment | Married | Unmarried |
| Less than High School | 0 (0.0%) | 0 (0.0%) |
| High School Diploma | 49 (65.3%) | 26 (34.7%) |
| College or Associate's Degree | 105 (93.8%) | 7 (6.2%) |
| Bachelor's Degree | 94 (100.0%) | 0 (0.0%) |
| Graduate Degree | 20 (100.0%) | 0 (0.0%) |
| Total | 268 (89.0%) | 33 (11.0%) |
Income in Dickinson County
Income Overview in Dickinson County
Per Capita Income in Dickinson County is $35,615, while median incomes of families and households are $78,323 and $62,971 respectively.
| Characteristic | Number | Measure |
| Per Capita Income | 18,492 | $35,615 |
| Median Family Income | 5,075 | $78,323 |
| Mean Family Income | 5,075 | $95,506 |
| Median Household Income | 7,903 | $62,971 |
| Mean Household Income | 7,903 | $81,081 |
| Income Deficit | 5,075 | $9,933 |
| Wage / Income Gap (%) | 18,492 | 32.27% |
| Wage / Income Gap ($) | 18,492 | 67.73¢ per $1 |
| Gini / Inequality Index | 18,492 | 0.43 |
Earnings by Sex in Dickinson County
Average Earnings in Dickinson County are $40,094, $45,219 for men and $30,629 for women, a difference of 32.3%.
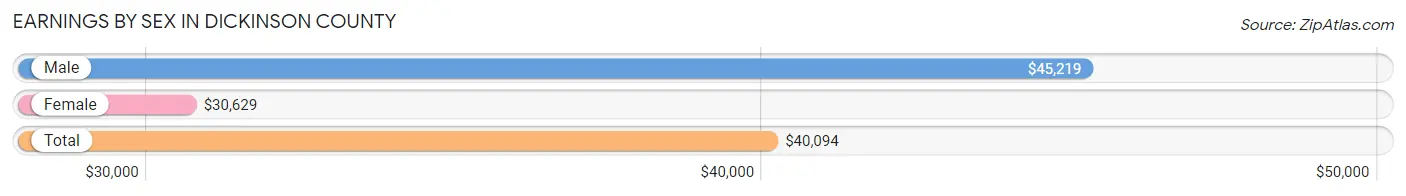
| Sex | Number | Average Earnings |
| Male | 5,229 (53.7%) | $45,219 |
| Female | 4,501 (46.3%) | $30,629 |
| Total | 9,730 (100.0%) | $40,094 |
Earnings by Sex by Income Bracket in Dickinson County
The most common earnings brackets in Dickinson County are $100,000+ for men (592 | 11.3%) and $25,000 to $29,999 for women (376 | 8.4%).
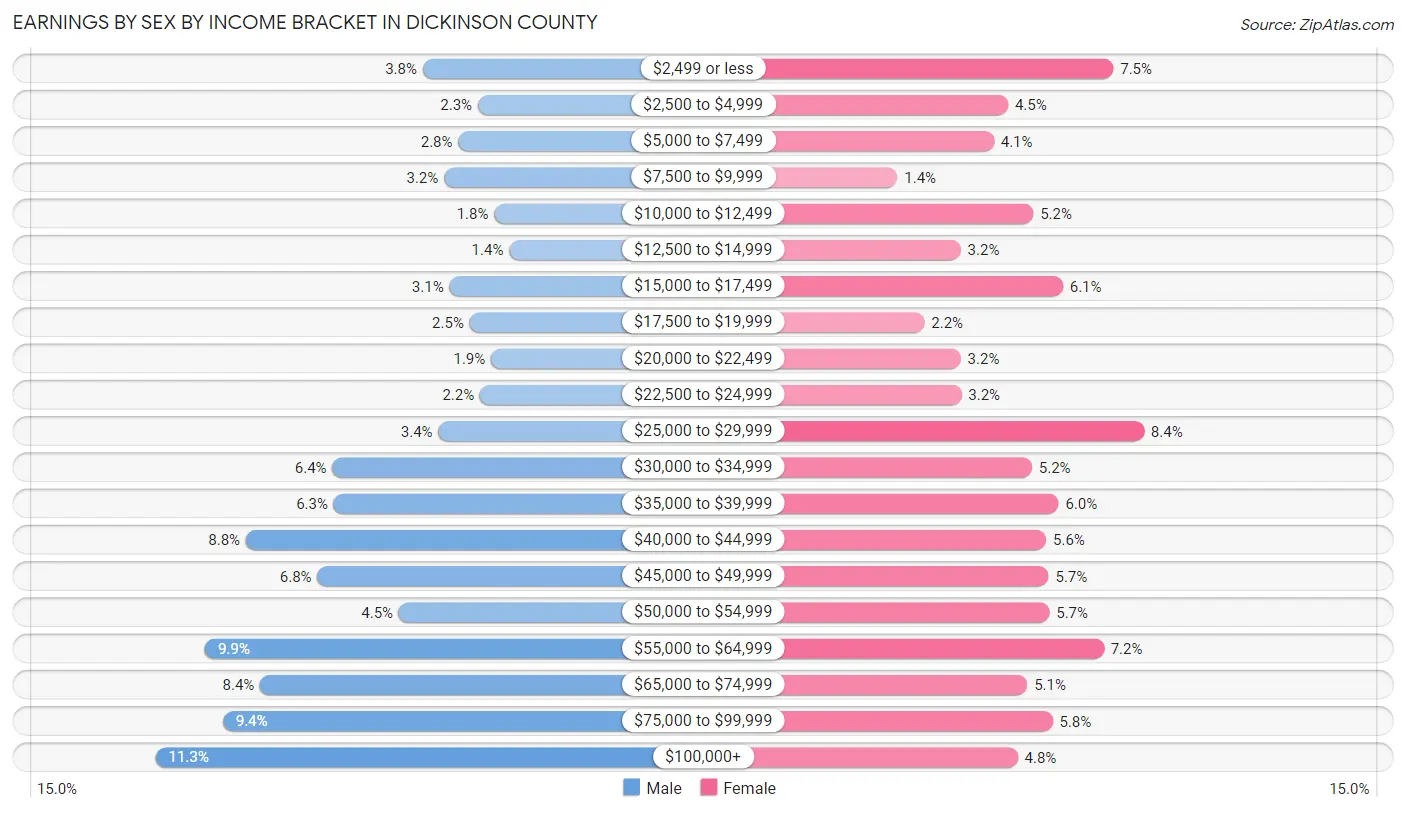
| Income | Male | Female |
| $2,499 or less | 199 (3.8%) | 337 (7.5%) |
| $2,500 to $4,999 | 118 (2.3%) | 204 (4.5%) |
| $5,000 to $7,499 | 147 (2.8%) | 186 (4.1%) |
| $7,500 to $9,999 | 168 (3.2%) | 64 (1.4%) |
| $10,000 to $12,499 | 94 (1.8%) | 236 (5.2%) |
| $12,500 to $14,999 | 72 (1.4%) | 144 (3.2%) |
| $15,000 to $17,499 | 160 (3.1%) | 273 (6.1%) |
| $17,500 to $19,999 | 130 (2.5%) | 98 (2.2%) |
| $20,000 to $22,499 | 99 (1.9%) | 144 (3.2%) |
| $22,500 to $24,999 | 115 (2.2%) | 145 (3.2%) |
| $25,000 to $29,999 | 176 (3.4%) | 376 (8.4%) |
| $30,000 to $34,999 | 332 (6.4%) | 234 (5.2%) |
| $35,000 to $39,999 | 330 (6.3%) | 268 (5.9%) |
| $40,000 to $44,999 | 459 (8.8%) | 252 (5.6%) |
| $45,000 to $49,999 | 354 (6.8%) | 255 (5.7%) |
| $50,000 to $54,999 | 234 (4.5%) | 256 (5.7%) |
| $55,000 to $64,999 | 519 (9.9%) | 325 (7.2%) |
| $65,000 to $74,999 | 438 (8.4%) | 228 (5.1%) |
| $75,000 to $99,999 | 493 (9.4%) | 260 (5.8%) |
| $100,000+ | 592 (11.3%) | 216 (4.8%) |
| Total | 5,229 (100.0%) | 4,501 (100.0%) |
Earnings by Sex by Educational Attainment in Dickinson County
Average earnings in Dickinson County are $47,119 for men and $36,103 for women, a difference of 23.4%. Men with an educational attainment of graduate degree enjoy the highest average annual earnings of $83,750, while those with high school diploma education earn the least with $42,875. Women with an educational attainment of graduate degree earn the most with the average annual earnings of $60,313, while those with less than high school education have the smallest earnings of $25,329.
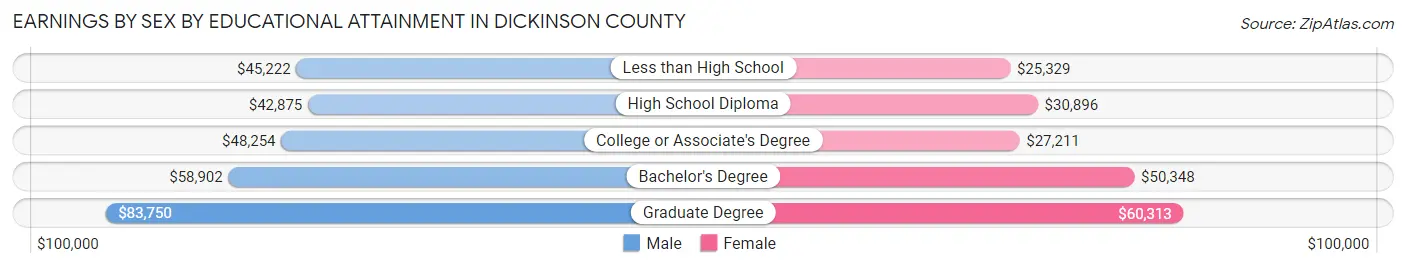
| Educational Attainment | Male Income | Female Income |
| Less than High School | $45,222 | $25,329 |
| High School Diploma | $42,875 | $30,896 |
| College or Associate's Degree | $48,254 | $27,211 |
| Bachelor's Degree | $58,902 | $50,348 |
| Graduate Degree | $83,750 | $60,313 |
| Total | $47,119 | $36,103 |
Family Income in Dickinson County
Family Income Brackets in Dickinson County
According to the Dickinson County family income data, there are 1,248 families falling into the $50,000 to $74,999 income range, which is the most common income bracket and makes up 24.6% of all families. Conversely, the $10,000 to $14,999 income bracket is the least frequent group with only 56 families (1.1%) belonging to this category.
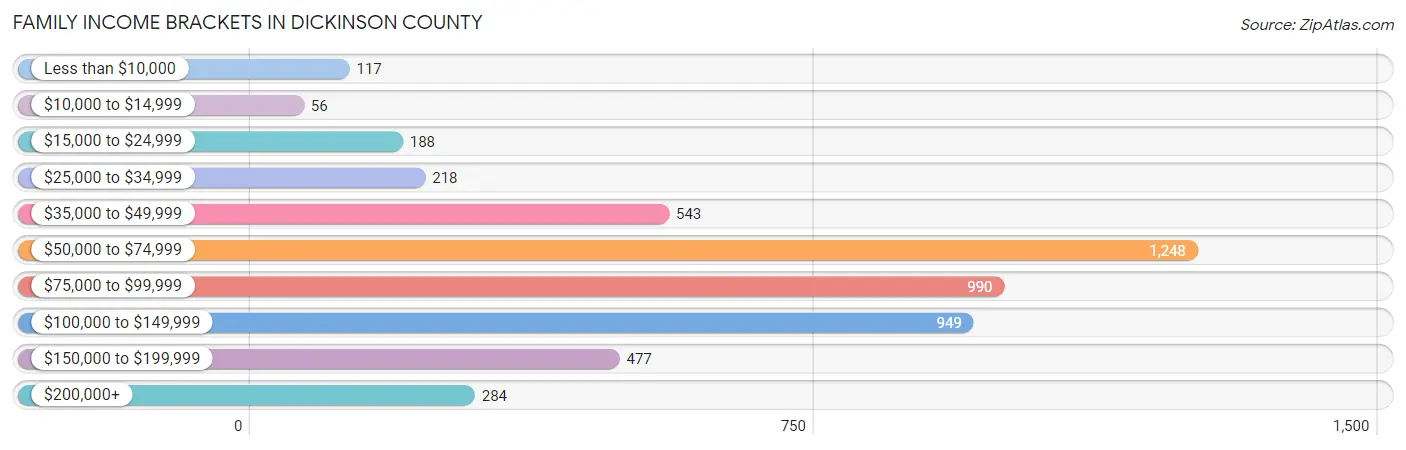
| Income Bracket | # Families | % Families |
| Less than $10,000 | 117 | 2.3% |
| $10,000 to $14,999 | 56 | 1.1% |
| $15,000 to $24,999 | 188 | 3.7% |
| $25,000 to $34,999 | 218 | 4.3% |
| $35,000 to $49,999 | 543 | 10.7% |
| $50,000 to $74,999 | 1,248 | 24.6% |
| $75,000 to $99,999 | 990 | 19.5% |
| $100,000 to $149,999 | 949 | 18.7% |
| $150,000 to $199,999 | 477 | 9.4% |
| $200,000+ | 284 | 5.6% |
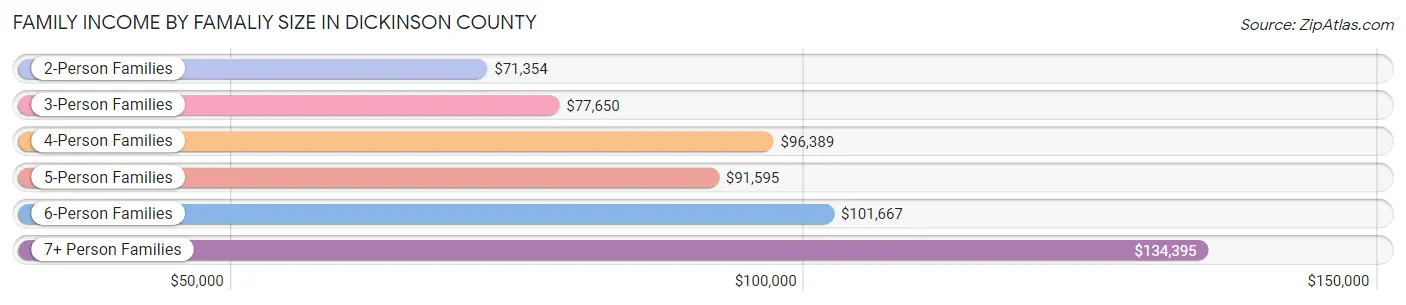
Family Income by Famaliy Size in Dickinson County
7+ person families (117 | 2.3%) account for the highest median family income in Dickinson County with $134,395 per family, while 2-person families (2,883 | 56.8%) have the highest median income of $35,677 per family member.
| Income Bracket | # Families | Median Income |
| 2-Person Families | 2,883 (56.8%) | $71,354 |
| 3-Person Families | 796 (15.7%) | $77,650 |
| 4-Person Families | 518 (10.2%) | $96,389 |
| 5-Person Families | 597 (11.8%) | $91,595 |
| 6-Person Families | 164 (3.2%) | $101,667 |
| 7+ Person Families | 117 (2.3%) | $134,395 |
| Total | 5,075 (100.0%) | $78,323 |
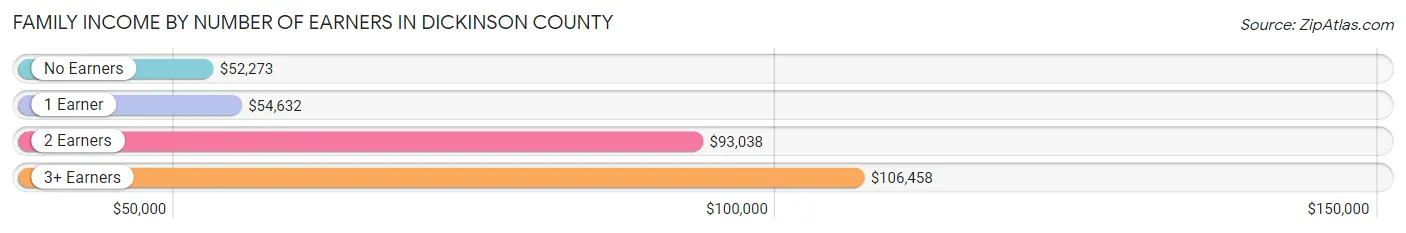
Family Income by Number of Earners in Dickinson County
The median family income in Dickinson County is $78,323, with families comprising 3+ earners (535) having the highest median family income of $106,458, while families with no earners (928) have the lowest median family income of $52,273, accounting for 10.5% and 18.3% of families, respectively.
| Number of Earners | # Families | Median Income |
| No Earners | 928 (18.3%) | $52,273 |
| 1 Earner | 1,297 (25.6%) | $54,632 |
| 2 Earners | 2,315 (45.6%) | $93,038 |
| 3+ Earners | 535 (10.5%) | $106,458 |
| Total | 5,075 (100.0%) | $78,323 |
Household Income in Dickinson County
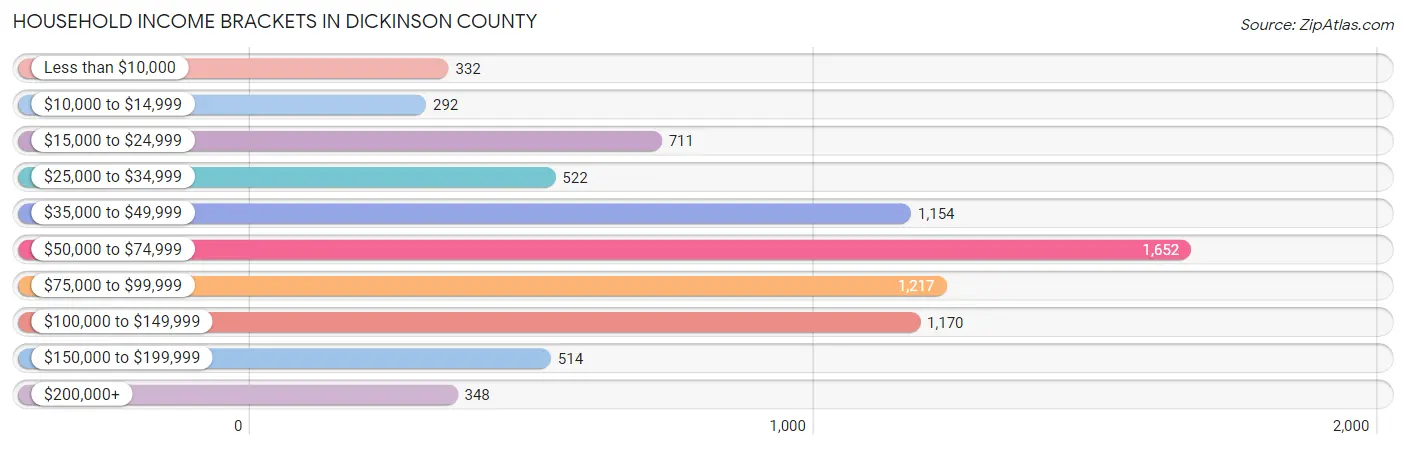
Household Income Brackets in Dickinson County
With 1,652 households falling in the category, the $50,000 to $74,999 income range is the most frequent in Dickinson County, accounting for 20.9% of all households. In contrast, only 292 households (3.7%) fall into the $10,000 to $14,999 income bracket, making it the least populous group.
| Income Bracket | # Households | % Households |
| Less than $10,000 | 332 | 4.2% |
| $10,000 to $14,999 | 292 | 3.7% |
| $15,000 to $24,999 | 711 | 9.0% |
| $25,000 to $34,999 | 522 | 6.6% |
| $35,000 to $49,999 | 1,154 | 14.6% |
| $50,000 to $74,999 | 1,652 | 20.9% |
| $75,000 to $99,999 | 1,217 | 15.4% |
| $100,000 to $149,999 | 1,170 | 14.8% |
| $150,000 to $199,999 | 514 | 6.5% |
| $200,000+ | 348 | 4.4% |
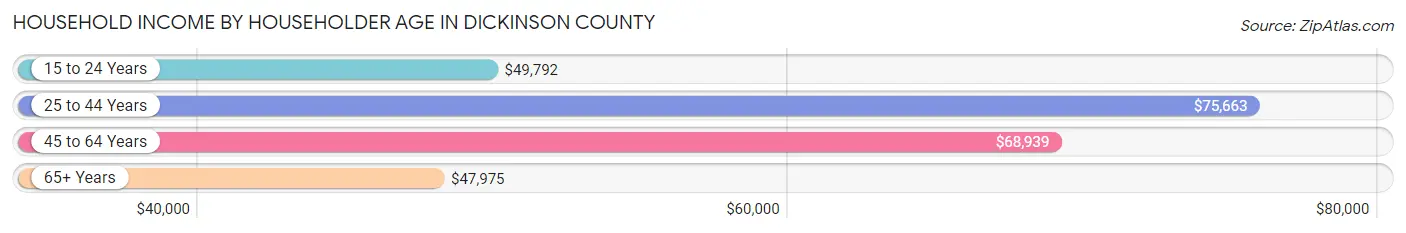
Household Income by Householder Age in Dickinson County
The median household income in Dickinson County is $62,971, with the highest median household income of $75,663 found in the 25 to 44 years age bracket for the primary householder. A total of 2,186 households (27.7%) fall into this category. Meanwhile, the 65+ years age bracket for the primary householder has the lowest median household income of $47,975, with 2,505 households (31.7%) in this group.
| Income Bracket | # Households | Median Income |
| 15 to 24 Years | 198 (2.5%) | $49,792 |
| 25 to 44 Years | 2,186 (27.7%) | $75,663 |
| 45 to 64 Years | 3,014 (38.1%) | $68,939 |
| 65+ Years | 2,505 (31.7%) | $47,975 |
| Total | 7,903 (100.0%) | $62,971 |
Poverty in Dickinson County
Income Below Poverty by Sex and Age in Dickinson County
With 7.9% poverty level for males and 9.8% for females among the residents of Dickinson County, 12 to 14 year old males and 5 year old females are the most vulnerable to poverty, with 60 males (16.6%) and 16 females (36.4%) in their respective age groups living below the poverty level.
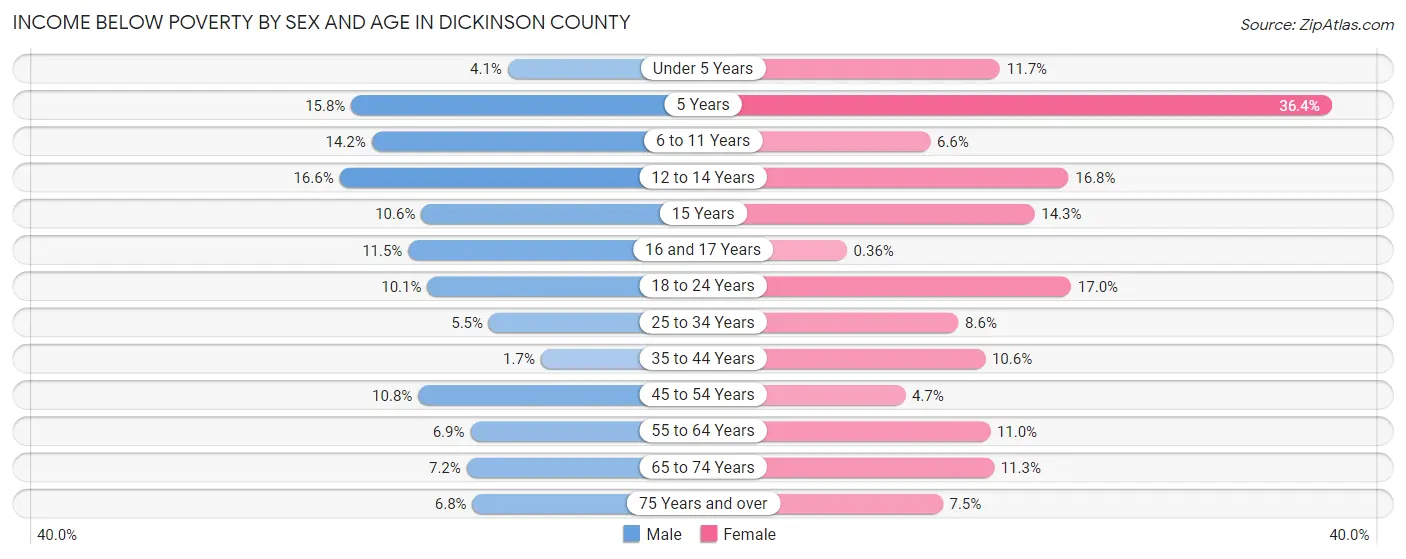
| Age Bracket | Male | Female |
| Under 5 Years | 20 (4.1%) | 54 (11.7%) |
| 5 Years | 40 (15.8%) | 16 (36.4%) |
| 6 to 11 Years | 85 (14.2%) | 46 (6.6%) |
| 12 to 14 Years | 60 (16.6%) | 75 (16.8%) |
| 15 Years | 23 (10.5%) | 16 (14.3%) |
| 16 and 17 Years | 22 (11.5%) | 1 (0.4%) |
| 18 to 24 Years | 69 (10.1%) | 92 (17.0%) |
| 25 to 34 Years | 59 (5.5%) | 88 (8.6%) |
| 35 to 44 Years | 20 (1.7%) | 113 (10.6%) |
| 45 to 54 Years | 114 (10.8%) | 48 (4.7%) |
| 55 to 64 Years | 99 (6.9%) | 145 (11.0%) |
| 65 to 74 Years | 74 (7.2%) | 110 (11.3%) |
| 75 Years and over | 43 (6.8%) | 69 (7.5%) |
| Total | 728 (7.9%) | 873 (9.8%) |
Income Above Poverty by Sex and Age in Dickinson County
According to the poverty statistics in Dickinson County, males aged 35 to 44 years and females aged 16 and 17 years are the age groups that are most secure financially, with 98.3% of males and 99.6% of females in these age groups living above the poverty line.
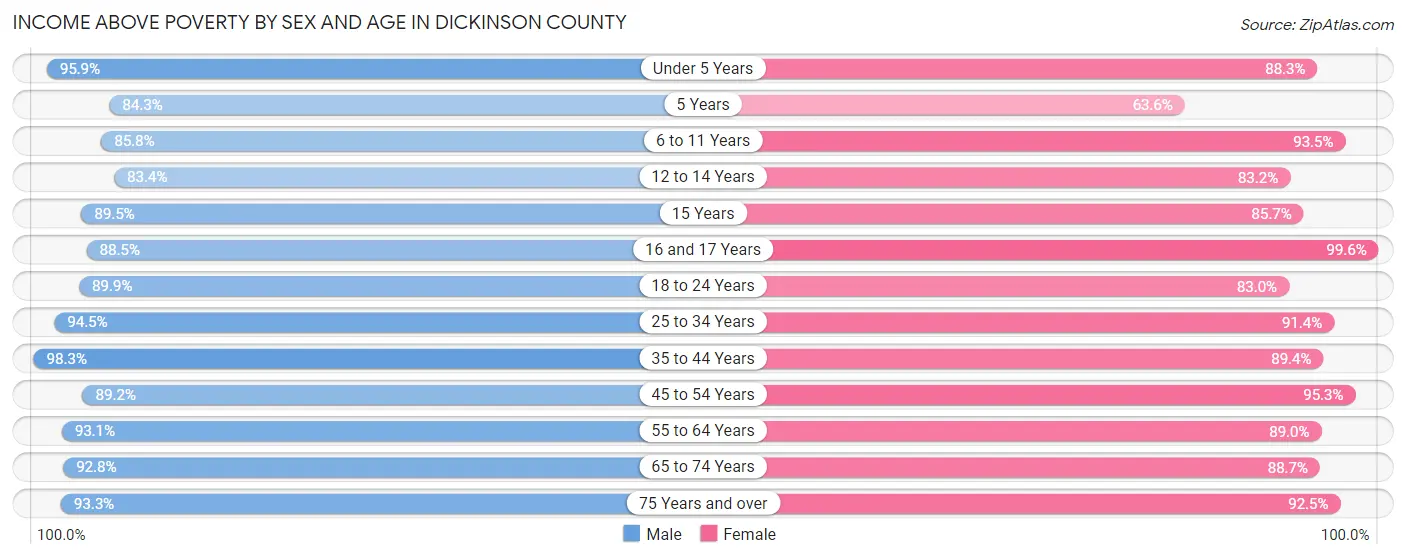
| Age Bracket | Male | Female |
| Under 5 Years | 464 (95.9%) | 406 (88.3%) |
| 5 Years | 214 (84.3%) | 28 (63.6%) |
| 6 to 11 Years | 512 (85.8%) | 656 (93.4%) |
| 12 to 14 Years | 301 (83.4%) | 371 (83.2%) |
| 15 Years | 195 (89.4%) | 96 (85.7%) |
| 16 and 17 Years | 169 (88.5%) | 278 (99.6%) |
| 18 to 24 Years | 614 (89.9%) | 449 (83.0%) |
| 25 to 34 Years | 1,008 (94.5%) | 930 (91.4%) |
| 35 to 44 Years | 1,172 (98.3%) | 950 (89.4%) |
| 45 to 54 Years | 944 (89.2%) | 976 (95.3%) |
| 55 to 64 Years | 1,333 (93.1%) | 1,173 (89.0%) |
| 65 to 74 Years | 956 (92.8%) | 865 (88.7%) |
| 75 Years and over | 594 (93.2%) | 854 (92.5%) |
| Total | 8,476 (92.1%) | 8,032 (90.2%) |
Income Below Poverty Among Married-Couple Families in Dickinson County
The poverty statistics for married-couple families in Dickinson County show that 3.1% or 125 of the total 4,069 families live below the poverty line. Families with 5 or more children have the highest poverty rate of 5.4%, comprising of 4 families. On the other hand, families with no children have the lowest poverty rate of 2.0%, which includes 51 families.
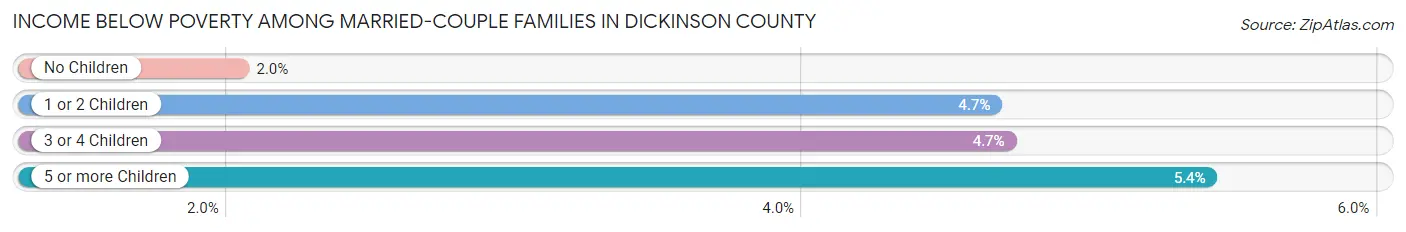
| Children | Above Poverty | Below Poverty |
| No Children | 2,446 (98.0%) | 51 (2.0%) |
| 1 or 2 Children | 1,003 (95.3%) | 49 (4.7%) |
| 3 or 4 Children | 425 (95.3%) | 21 (4.7%) |
| 5 or more Children | 70 (94.6%) | 4 (5.4%) |
| Total | 3,944 (96.9%) | 125 (3.1%) |
Income Below Poverty Among Single-Parent Households in Dickinson County
According to the poverty data in Dickinson County, 11.8% or 31 single-father households and 20.2% or 150 single-mother households are living below the poverty line. Among single-father households, those with 1 or 2 children have the highest poverty rate, with 27 households (22.0%) experiencing poverty. Likewise, among single-mother households, those with 5 or more children have the highest poverty rate, with 8 households (100.0%) falling below the poverty line.
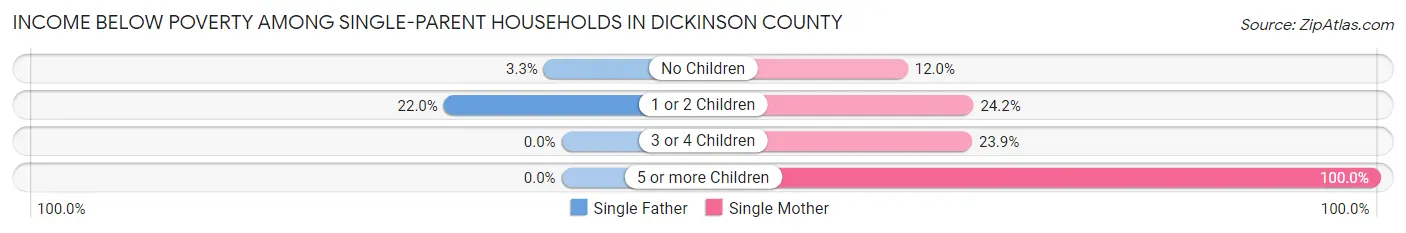
| Children | Single Father | Single Mother |
| No Children | 4 (3.3%) | 35 (11.9%) |
| 1 or 2 Children | 27 (22.0%) | 96 (24.2%) |
| 3 or 4 Children | 0 (0.0%) | 11 (23.9%) |
| 5 or more Children | 0 (0.0%) | 8 (100.0%) |
| Total | 31 (11.8%) | 150 (20.2%) |
Income Below Poverty Among Married-Couple vs Single-Parent Households in Dickinson County
The poverty data for Dickinson County shows that 125 of the married-couple family households (3.1%) and 181 of the single-parent households (18.0%) are living below the poverty level. Within the married-couple family households, those with 5 or more children have the highest poverty rate, with 4 households (5.4%) falling below the poverty line. Among the single-parent households, those with 5 or more children have the highest poverty rate, with 8 household (100.0%) living below poverty.
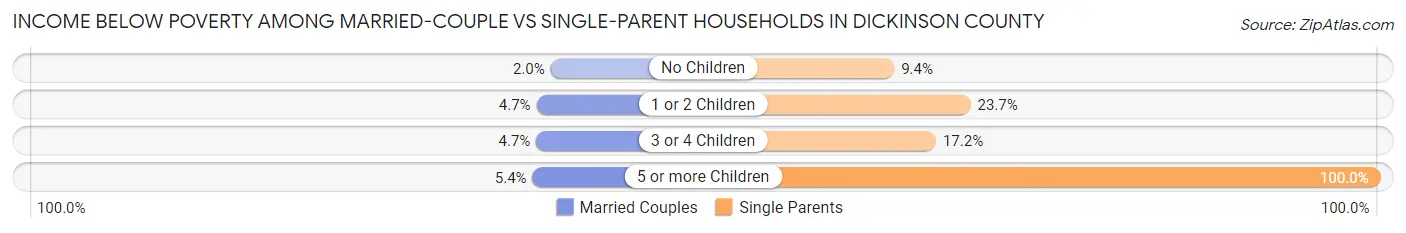
| Children | Married-Couple Families | Single-Parent Households |
| No Children | 51 (2.0%) | 39 (9.4%) |
| 1 or 2 Children | 49 (4.7%) | 123 (23.6%) |
| 3 or 4 Children | 21 (4.7%) | 11 (17.2%) |
| 5 or more Children | 4 (5.4%) | 8 (100.0%) |
| Total | 125 (3.1%) | 181 (18.0%) |
Employment Characteristics in Dickinson County
Employment by Class of Employer in Dickinson County
Among the 8,752 employed individuals in Dickinson County, private company employees (5,246 | 59.9%), local government employees (817 | 9.3%), and self-employed (not incorporated) (810 | 9.3%) make up the most common classes of employment.
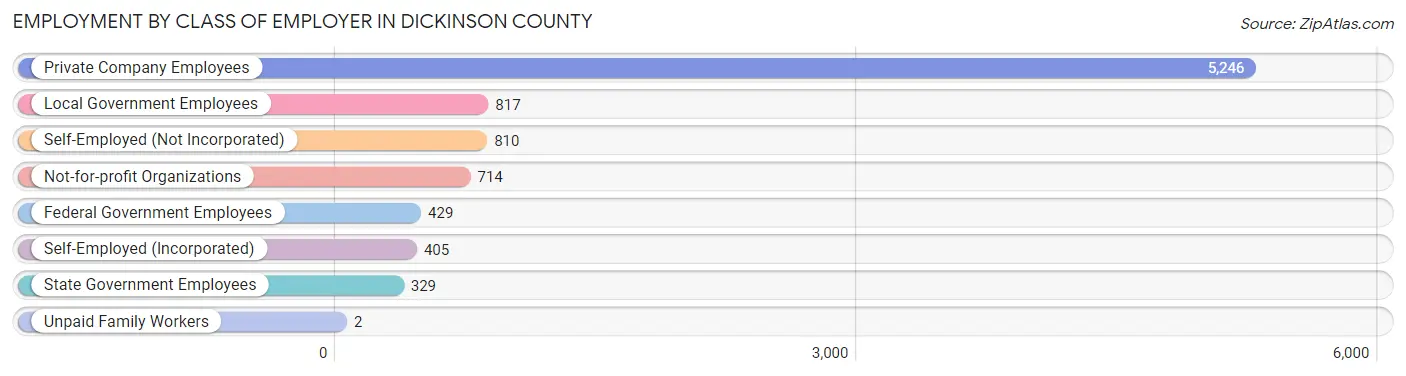
| Employer Class | # Employees | % Employees |
| Private Company Employees | 5,246 | 59.9% |
| Self-Employed (Incorporated) | 405 | 4.6% |
| Self-Employed (Not Incorporated) | 810 | 9.3% |
| Not-for-profit Organizations | 714 | 8.2% |
| Local Government Employees | 817 | 9.3% |
| State Government Employees | 329 | 3.8% |
| Federal Government Employees | 429 | 4.9% |
| Unpaid Family Workers | 2 | 0.0% |
| Total | 8,752 | 100.0% |
Employment Status by Age in Dickinson County
According to the labor force statistics for Dickinson County, out of the total population over 16 years of age (14,748), 62.4% or 9,203 individuals are in the labor force, with 3.0% or 276 of them unemployed. The age group with the highest labor force participation rate is 25 to 29 years, with 88.9% or 813 individuals in the labor force. Within the labor force, the 25 to 29 years age range has the highest percentage of unemployed individuals, with 8.3% or 67 of them being unemployed.
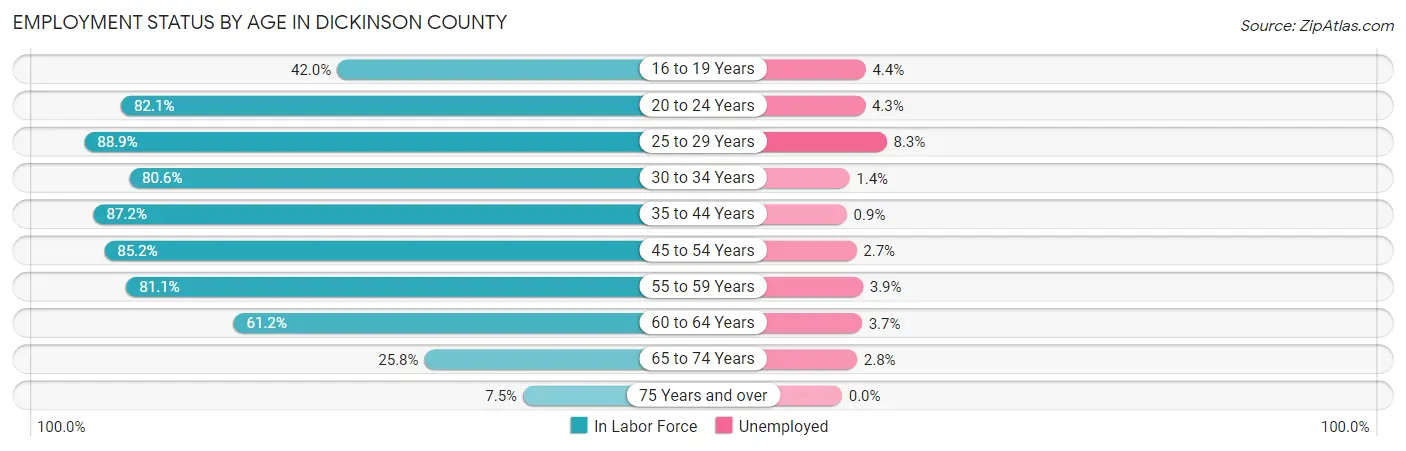
| Age Bracket | In Labor Force | Unemployed |
| 16 to 19 Years | 362 (42.0%) | 16 (4.4%) |
| 20 to 24 Years | 722 (82.1%) | 31 (4.3%) |
| 25 to 29 Years | 813 (88.9%) | 67 (8.3%) |
| 30 to 34 Years | 956 (80.6%) | 13 (1.4%) |
| 35 to 44 Years | 1,976 (87.2%) | 18 (0.9%) |
| 45 to 54 Years | 1,776 (85.2%) | 48 (2.7%) |
| 55 to 59 Years | 1,036 (81.1%) | 40 (3.9%) |
| 60 to 64 Years | 903 (61.2%) | 33 (3.7%) |
| 65 to 74 Years | 533 (25.8%) | 15 (2.8%) |
| 75 Years and over | 130 (7.5%) | 0 (0.0%) |
| Total | 9,203 (62.4%) | 276 (3.0%) |
Employment Status by Educational Attainment in Dickinson County
According to labor force statistics for Dickinson County, 81.1% of individuals (7,465) out of the total population between 25 and 64 years of age (9,205) are in the labor force, with 2.9% or 216 of them being unemployed. The group with the highest labor force participation rate are those with the educational attainment of bachelor's degree or higher, with 86.8% or 2,106 individuals in the labor force. Within the labor force, individuals with less than high school education have the highest percentage of unemployment, with 7.3% or 26 of them being unemployed.
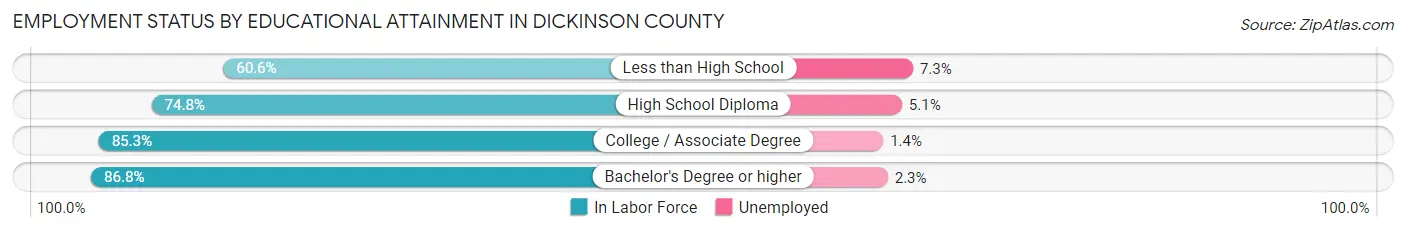
| Educational Attainment | In Labor Force | Unemployed |
| Less than High School | 356 (60.6%) | 43 (7.3%) |
| High School Diploma | 2,005 (74.8%) | 137 (5.1%) |
| College / Associate Degree | 2,995 (85.3%) | 49 (1.4%) |
| Bachelor's Degree or higher | 2,106 (86.8%) | 56 (2.3%) |
| Total | 7,465 (81.1%) | 267 (2.9%) |
Employment Occupations by Sex in Dickinson County
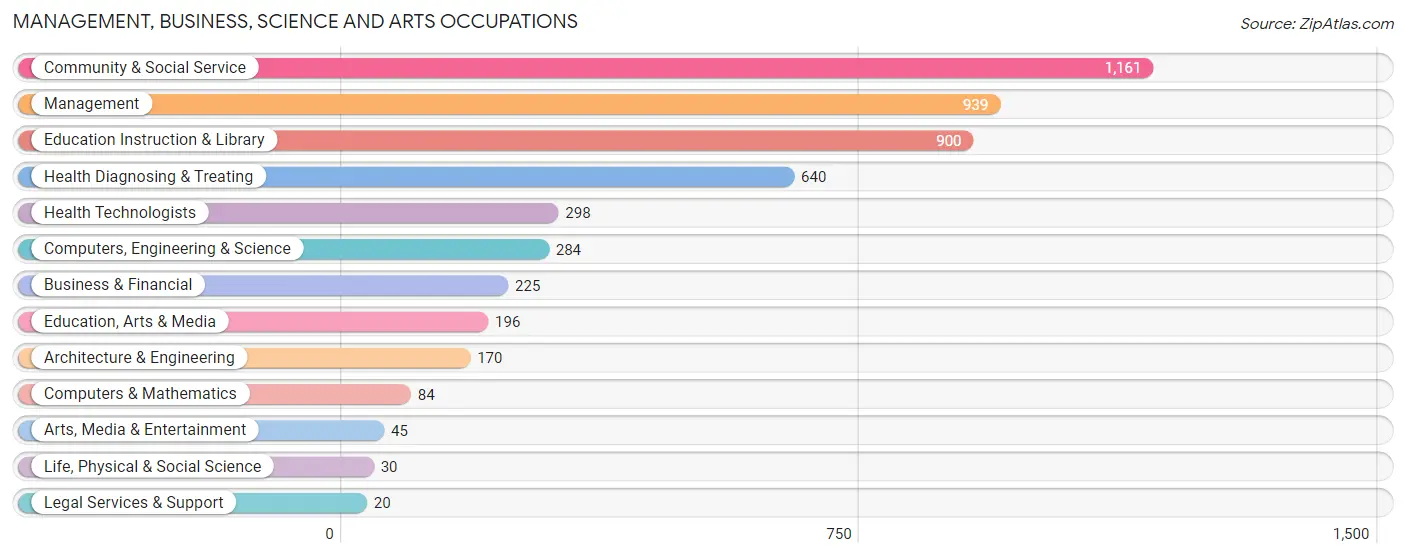
Management, Business, Science and Arts Occupations
The most common Management, Business, Science and Arts occupations in Dickinson County are Community & Social Service (1,161 | 13.1%), Management (939 | 10.6%), Education Instruction & Library (900 | 10.2%), Health Diagnosing & Treating (640 | 7.2%), and Health Technologists (298 | 3.4%).
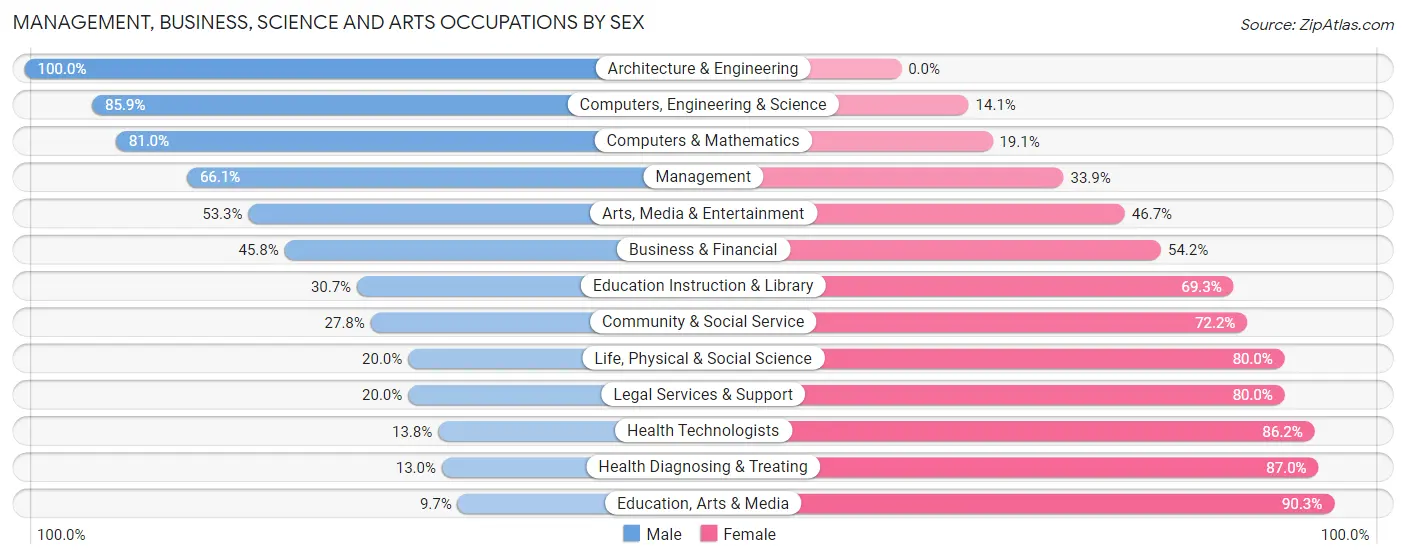
Management, Business, Science and Arts Occupations by Sex
Within the Management, Business, Science and Arts occupations in Dickinson County, the most male-oriented occupations are Architecture & Engineering (100.0%), Computers, Engineering & Science (85.9%), and Computers & Mathematics (80.9%), while the most female-oriented occupations are Education, Arts & Media (90.3%), Health Diagnosing & Treating (87.0%), and Health Technologists (86.2%).
| Occupation | Male | Female |
| Management | 621 (66.1%) | 318 (33.9%) |
| Business & Financial | 103 (45.8%) | 122 (54.2%) |
| Computers, Engineering & Science | 244 (85.9%) | 40 (14.1%) |
| Computers & Mathematics | 68 (80.9%) | 16 (19.1%) |
| Architecture & Engineering | 170 (100.0%) | 0 (0.0%) |
| Life, Physical & Social Science | 6 (20.0%) | 24 (80.0%) |
| Community & Social Service | 323 (27.8%) | 838 (72.2%) |
| Education, Arts & Media | 19 (9.7%) | 177 (90.3%) |
| Legal Services & Support | 4 (20.0%) | 16 (80.0%) |
| Education Instruction & Library | 276 (30.7%) | 624 (69.3%) |
| Arts, Media & Entertainment | 24 (53.3%) | 21 (46.7%) |
| Health Diagnosing & Treating | 83 (13.0%) | 557 (87.0%) |
| Health Technologists | 41 (13.8%) | 257 (86.2%) |
| Total (Category) | 1,374 (42.3%) | 1,875 (57.7%) |
| Total (Overall) | 4,717 (53.2%) | 4,153 (46.8%) |
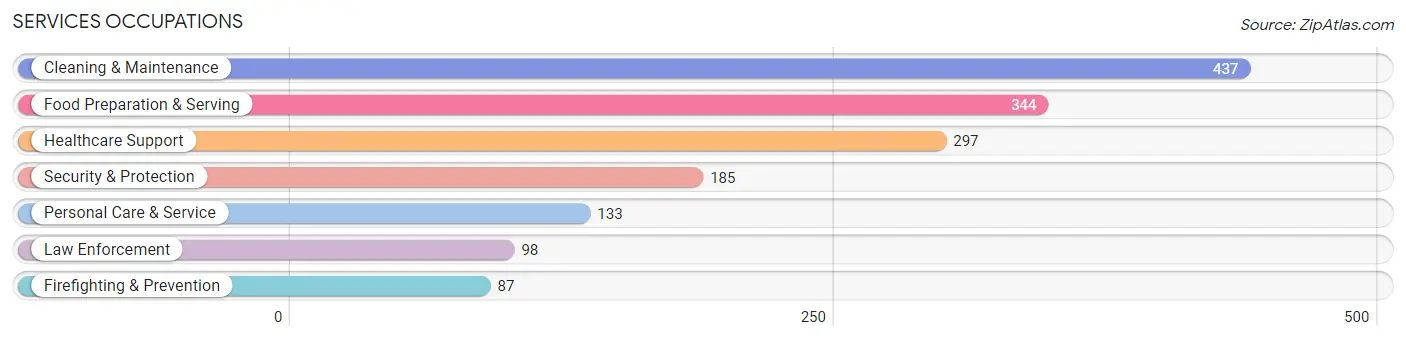
Services Occupations
The most common Services occupations in Dickinson County are Cleaning & Maintenance (437 | 4.9%), Food Preparation & Serving (344 | 3.9%), Healthcare Support (297 | 3.4%), Security & Protection (185 | 2.1%), and Personal Care & Service (133 | 1.5%).
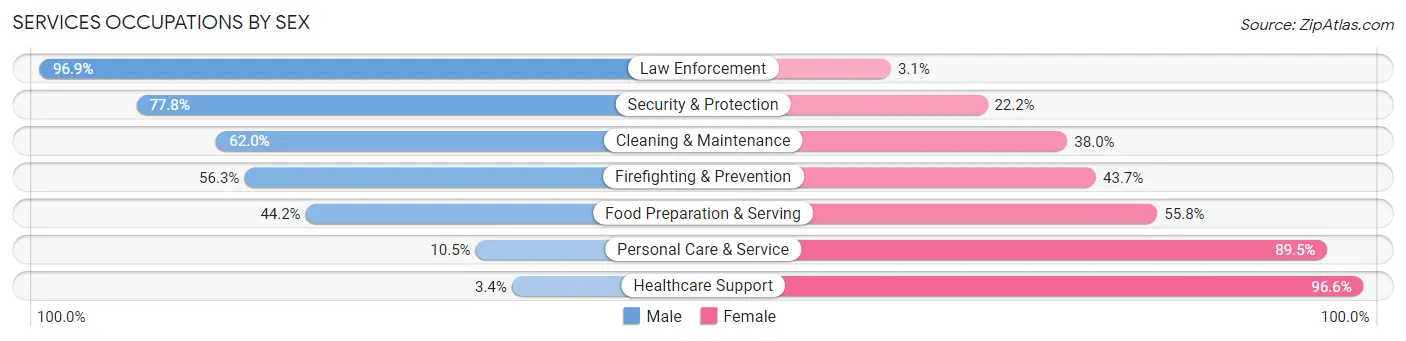
Services Occupations by Sex
Within the Services occupations in Dickinson County, the most male-oriented occupations are Law Enforcement (96.9%), Security & Protection (77.8%), and Cleaning & Maintenance (62.0%), while the most female-oriented occupations are Healthcare Support (96.6%), Personal Care & Service (89.5%), and Food Preparation & Serving (55.8%).
| Occupation | Male | Female |
| Healthcare Support | 10 (3.4%) | 287 (96.6%) |
| Security & Protection | 144 (77.8%) | 41 (22.2%) |
| Firefighting & Prevention | 49 (56.3%) | 38 (43.7%) |
| Law Enforcement | 95 (96.9%) | 3 (3.1%) |
| Food Preparation & Serving | 152 (44.2%) | 192 (55.8%) |
| Cleaning & Maintenance | 271 (62.0%) | 166 (38.0%) |
| Personal Care & Service | 14 (10.5%) | 119 (89.5%) |
| Total (Category) | 591 (42.3%) | 805 (57.7%) |
| Total (Overall) | 4,717 (53.2%) | 4,153 (46.8%) |
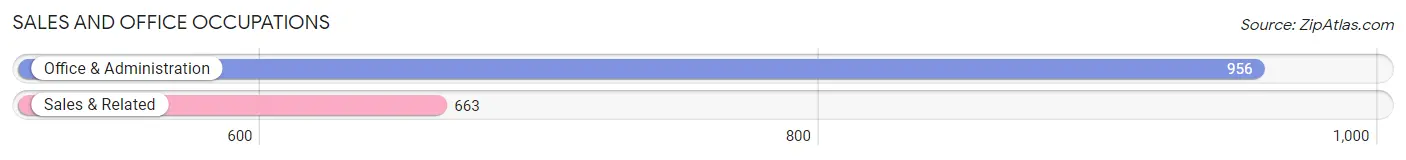
Sales and Office Occupations
The most common Sales and Office occupations in Dickinson County are Office & Administration (956 | 10.8%), and Sales & Related (663 | 7.5%).
Sales and Office Occupations by Sex
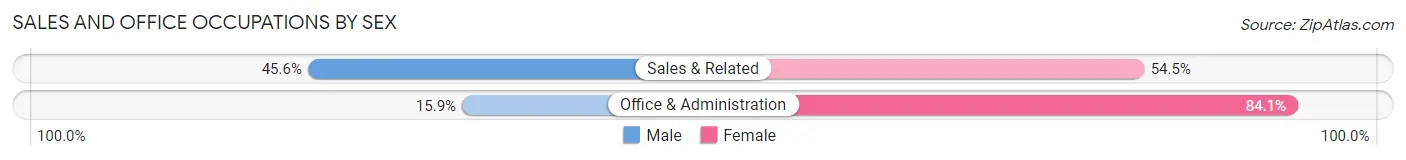
| Occupation | Male | Female |
| Sales & Related | 302 (45.6%) | 361 (54.4%) |
| Office & Administration | 152 (15.9%) | 804 (84.1%) |
| Total (Category) | 454 (28.0%) | 1,165 (72.0%) |
| Total (Overall) | 4,717 (53.2%) | 4,153 (46.8%) |
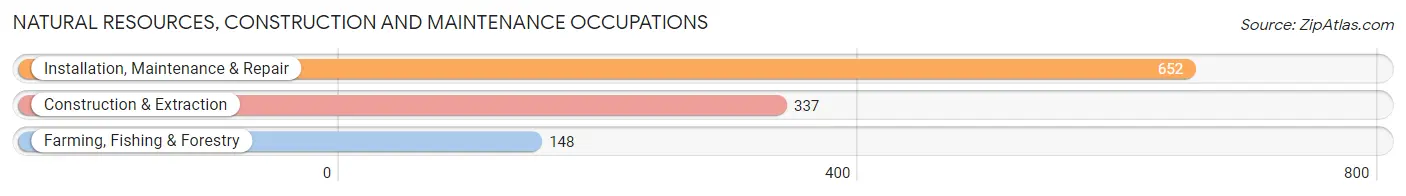
Natural Resources, Construction and Maintenance Occupations
The most common Natural Resources, Construction and Maintenance occupations in Dickinson County are Installation, Maintenance & Repair (652 | 7.3%), Construction & Extraction (337 | 3.8%), and Farming, Fishing & Forestry (148 | 1.7%).
Natural Resources, Construction and Maintenance Occupations by Sex
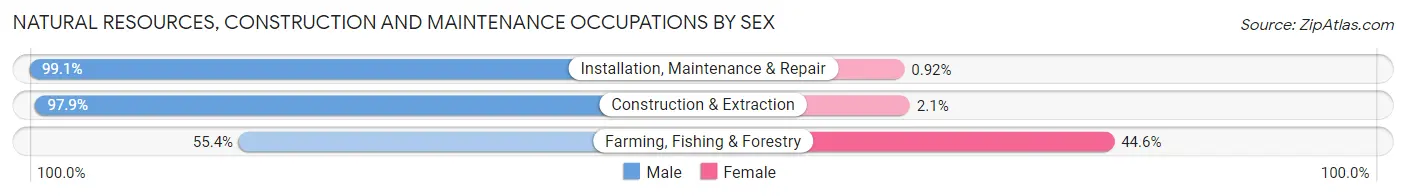
| Occupation | Male | Female |
| Farming, Fishing & Forestry | 82 (55.4%) | 66 (44.6%) |
| Construction & Extraction | 330 (97.9%) | 7 (2.1%) |
| Installation, Maintenance & Repair | 646 (99.1%) | 6 (0.9%) |
| Total (Category) | 1,058 (93.0%) | 79 (7.0%) |
| Total (Overall) | 4,717 (53.2%) | 4,153 (46.8%) |
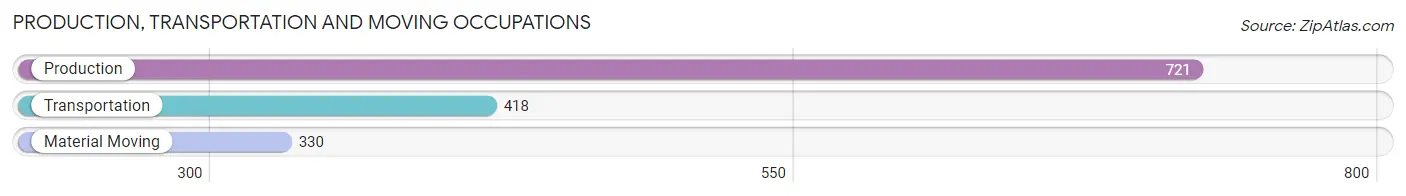
Production, Transportation and Moving Occupations
The most common Production, Transportation and Moving occupations in Dickinson County are Production (721 | 8.1%), Transportation (418 | 4.7%), and Material Moving (330 | 3.7%).
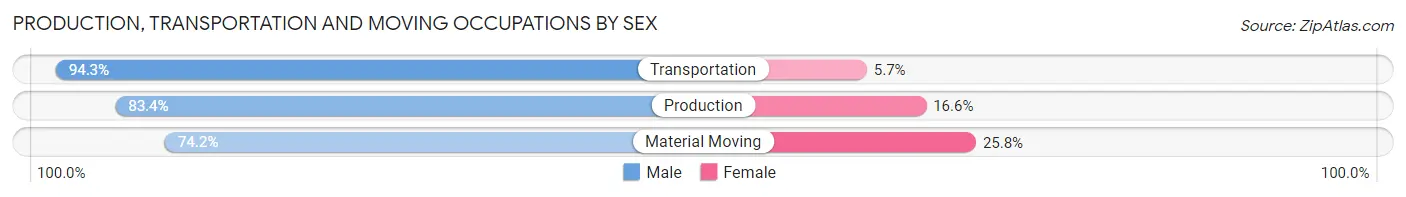
Production, Transportation and Moving Occupations by Sex
| Occupation | Male | Female |
| Production | 601 (83.4%) | 120 (16.6%) |
| Transportation | 394 (94.3%) | 24 (5.7%) |
| Material Moving | 245 (74.2%) | 85 (25.8%) |
| Total (Category) | 1,240 (84.4%) | 229 (15.6%) |
| Total (Overall) | 4,717 (53.2%) | 4,153 (46.8%) |
Employment Industries by Sex in Dickinson County
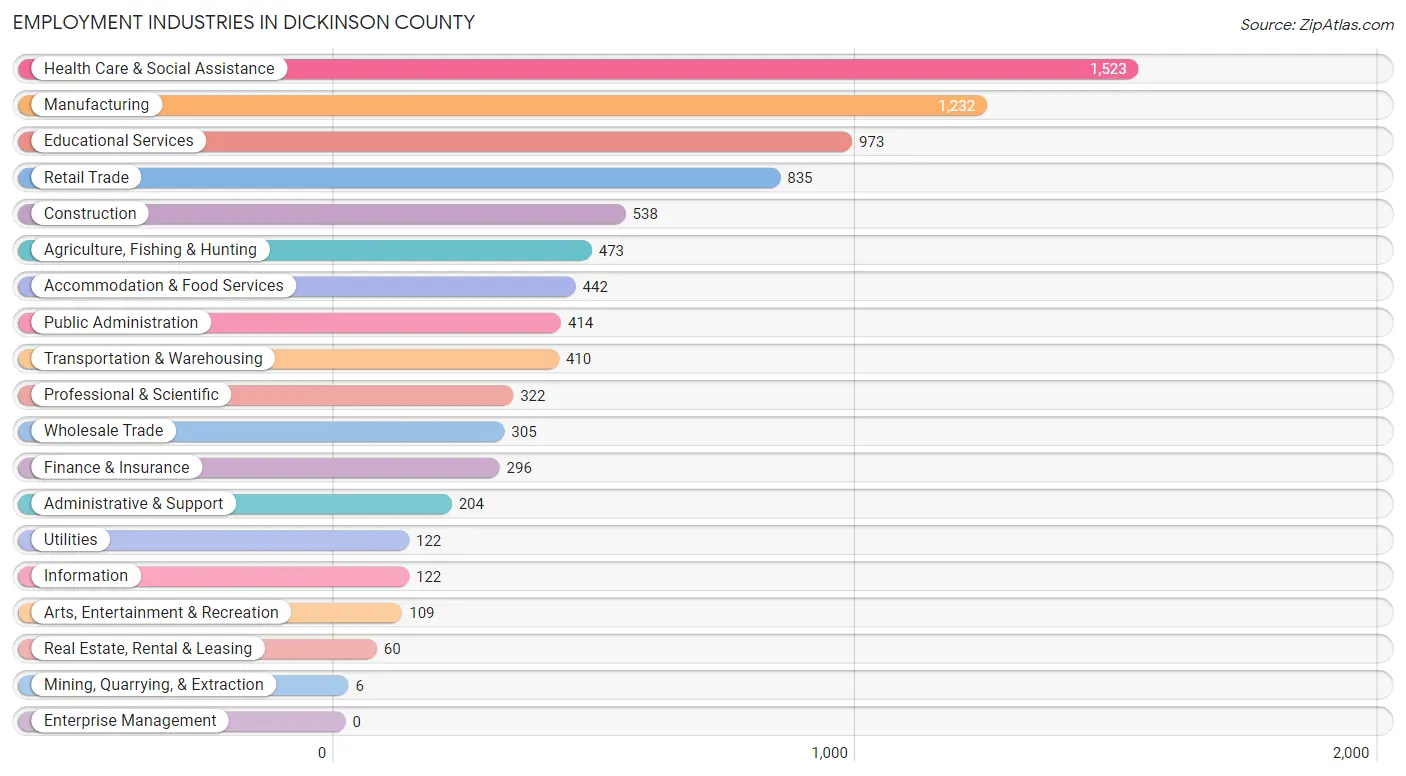
Employment Industries in Dickinson County
The major employment industries in Dickinson County include Health Care & Social Assistance (1,523 | 17.2%), Manufacturing (1,232 | 13.9%), Educational Services (973 | 11.0%), Retail Trade (835 | 9.4%), and Construction (538 | 6.1%).
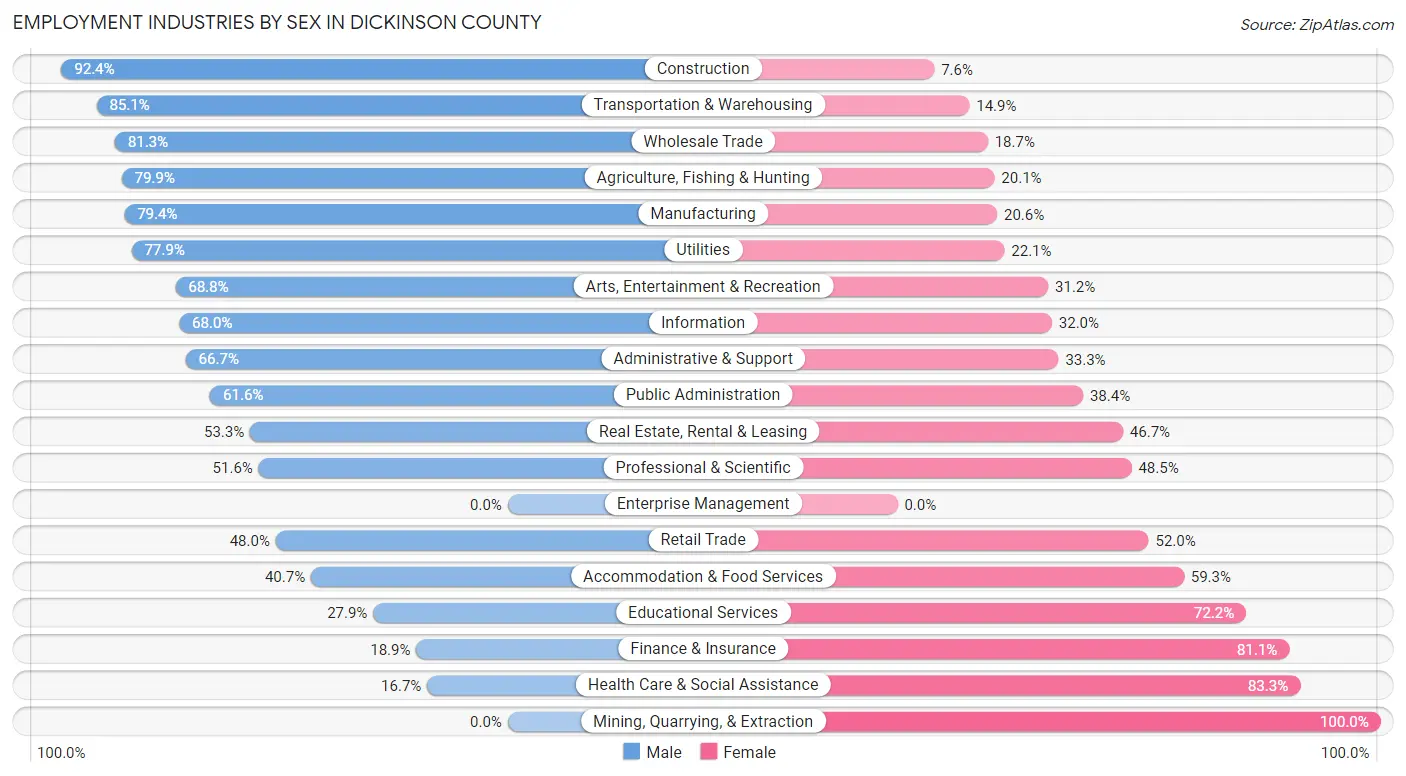
Employment Industries by Sex in Dickinson County
The Dickinson County industries that see more men than women are Construction (92.4%), Transportation & Warehousing (85.1%), and Wholesale Trade (81.3%), whereas the industries that tend to have a higher number of women are Mining, Quarrying, & Extraction (100.0%), Health Care & Social Assistance (83.3%), and Finance & Insurance (81.1%).
| Industry | Male | Female |
| Agriculture, Fishing & Hunting | 378 (79.9%) | 95 (20.1%) |
| Mining, Quarrying, & Extraction | 0 (0.0%) | 6 (100.0%) |
| Construction | 497 (92.4%) | 41 (7.6%) |
| Manufacturing | 978 (79.4%) | 254 (20.6%) |
| Wholesale Trade | 248 (81.3%) | 57 (18.7%) |
| Retail Trade | 401 (48.0%) | 434 (52.0%) |
| Transportation & Warehousing | 349 (85.1%) | 61 (14.9%) |
| Utilities | 95 (77.9%) | 27 (22.1%) |
| Information | 83 (68.0%) | 39 (32.0%) |
| Finance & Insurance | 56 (18.9%) | 240 (81.1%) |
| Real Estate, Rental & Leasing | 32 (53.3%) | 28 (46.7%) |
| Professional & Scientific | 166 (51.5%) | 156 (48.4%) |
| Enterprise Management | 0 (0.0%) | 0 (0.0%) |
| Administrative & Support | 136 (66.7%) | 68 (33.3%) |
| Educational Services | 271 (27.9%) | 702 (72.2%) |
| Health Care & Social Assistance | 254 (16.7%) | 1,269 (83.3%) |
| Arts, Entertainment & Recreation | 75 (68.8%) | 34 (31.2%) |
| Accommodation & Food Services | 180 (40.7%) | 262 (59.3%) |
| Public Administration | 255 (61.6%) | 159 (38.4%) |
| Total | 4,717 (53.2%) | 4,153 (46.8%) |
Education in Dickinson County
School Enrollment in Dickinson County
The most common levels of schooling among the 4,008 students in Dickinson County are high school (1,055 | 26.3%), middle school (1,052 | 26.3%), and elementary school (873 | 21.8%).
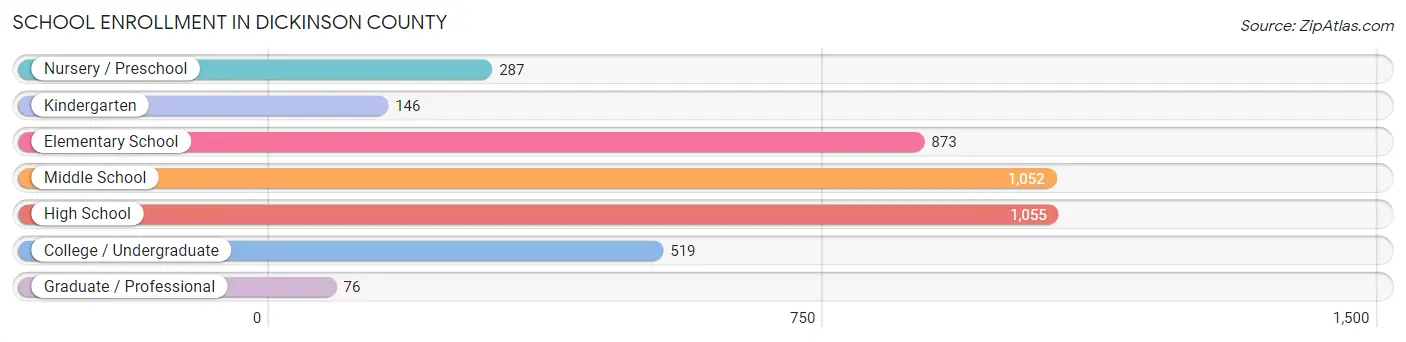
| School Level | # Students | % Students |
| Nursery / Preschool | 287 | 7.2% |
| Kindergarten | 146 | 3.6% |
| Elementary School | 873 | 21.8% |
| Middle School | 1,052 | 26.3% |
| High School | 1,055 | 26.3% |
| College / Undergraduate | 519 | 13.0% |
| Graduate / Professional | 76 | 1.9% |
| Total | 4,008 | 100.0% |
School Enrollment by Age by Funding Source in Dickinson County
Out of a total of 4,008 students who are enrolled in schools in Dickinson County, 545 (13.6%) attend a private institution, while the remaining 3,463 (86.4%) are enrolled in public schools. The age group of 35 years and over has the highest likelihood of being enrolled in private schools, with 46 (26.3% in the age bracket) enrolled. Conversely, the age group of 15 to 17 year olds has the lowest likelihood of being enrolled in a private school, with 705 (94.1% in the age bracket) attending a public institution.
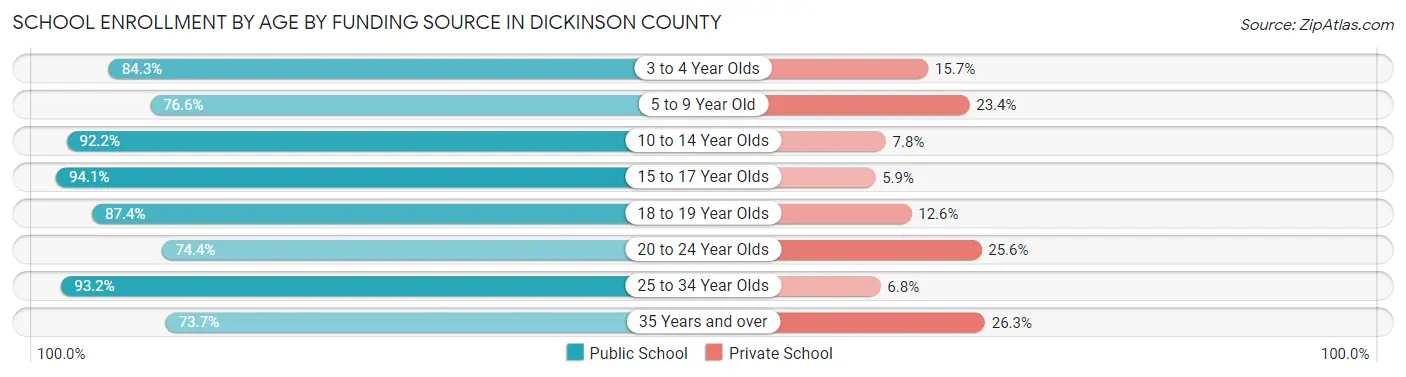
| Age Bracket | Public School | Private School |
| 3 to 4 Year Olds | 177 (84.3%) | 33 (15.7%) |
| 5 to 9 Year Old | 717 (76.6%) | 219 (23.4%) |
| 10 to 14 Year Olds | 1,214 (92.2%) | 103 (7.8%) |
| 15 to 17 Year Olds | 705 (94.1%) | 44 (5.9%) |
| 18 to 19 Year Olds | 236 (87.4%) | 34 (12.6%) |
| 20 to 24 Year Olds | 174 (74.4%) | 60 (25.6%) |
| 25 to 34 Year Olds | 109 (93.2%) | 8 (6.8%) |
| 35 Years and over | 129 (73.7%) | 46 (26.3%) |
| Total | 3,463 (86.4%) | 545 (13.6%) |
Educational Attainment by Field of Study in Dickinson County
Education (821 | 25.7%), business (438 | 13.7%), bio, nature & agricultural (389 | 12.2%), arts & humanities (341 | 10.7%), and science & technology (279 | 8.7%) are the most common fields of study among 3,192 individuals in Dickinson County who have obtained a bachelor's degree or higher.
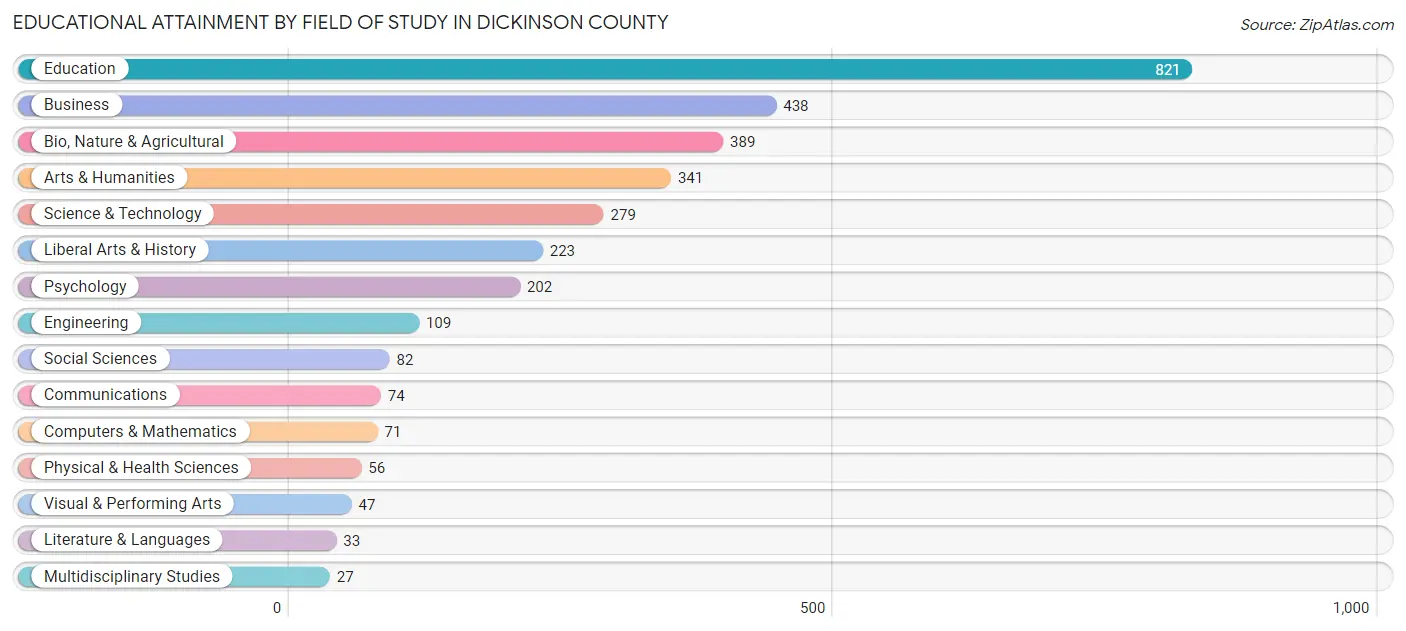
| Field of Study | # Graduates | % Graduates |
| Computers & Mathematics | 71 | 2.2% |
| Bio, Nature & Agricultural | 389 | 12.2% |
| Physical & Health Sciences | 56 | 1.8% |
| Psychology | 202 | 6.3% |
| Social Sciences | 82 | 2.6% |
| Engineering | 109 | 3.4% |
| Multidisciplinary Studies | 27 | 0.9% |
| Science & Technology | 279 | 8.7% |
| Business | 438 | 13.7% |
| Education | 821 | 25.7% |
| Literature & Languages | 33 | 1.0% |
| Liberal Arts & History | 223 | 7.0% |
| Visual & Performing Arts | 47 | 1.5% |
| Communications | 74 | 2.3% |
| Arts & Humanities | 341 | 10.7% |
| Total | 3,192 | 100.0% |
Transportation & Commute in Dickinson County
Vehicle Availability by Sex in Dickinson County
The most prevalent vehicle ownership categories in Dickinson County are males with 3 vehicles (1,429, accounting for 30.6%) and females with 3 vehicles (1,166, making up 35.1%).
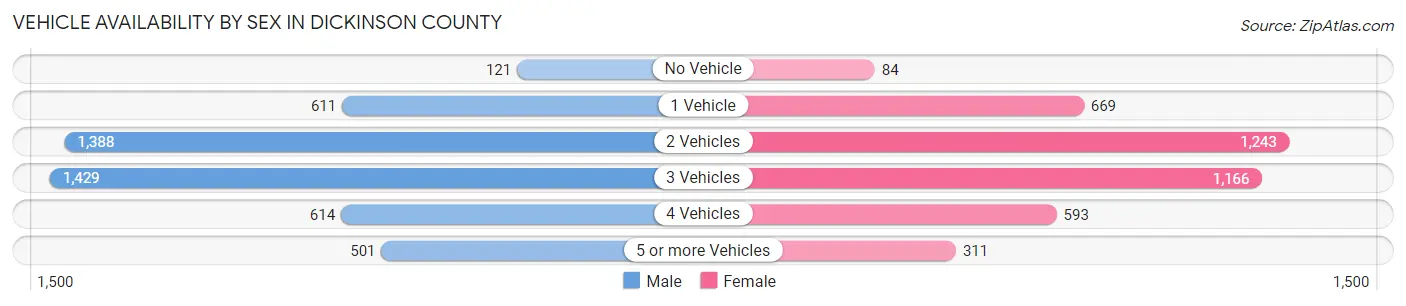
| Vehicles Available | Male | Female |
| No Vehicle | 121 (2.6%) | 84 (2.1%) |
| 1 Vehicle | 611 (13.1%) | 669 (16.5%) |
| 2 Vehicles | 1,388 (29.8%) | 1,243 (30.6%) |
| 3 Vehicles | 1,429 (30.6%) | 1,166 (28.7%) |
| 4 Vehicles | 614 (13.2%) | 593 (14.6%) |
| 5 or more Vehicles | 501 (10.7%) | 311 (7.6%) |
| Total | 4,664 (100.0%) | 4,066 (100.0%) |
Commute Time in Dickinson County
The most frequently occuring commute durations in Dickinson County are 5 to 9 minutes (1,716 commuters, 21.3%), 30 to 34 minutes (1,080 commuters, 13.4%), and 10 to 14 minutes (911 commuters, 11.3%).
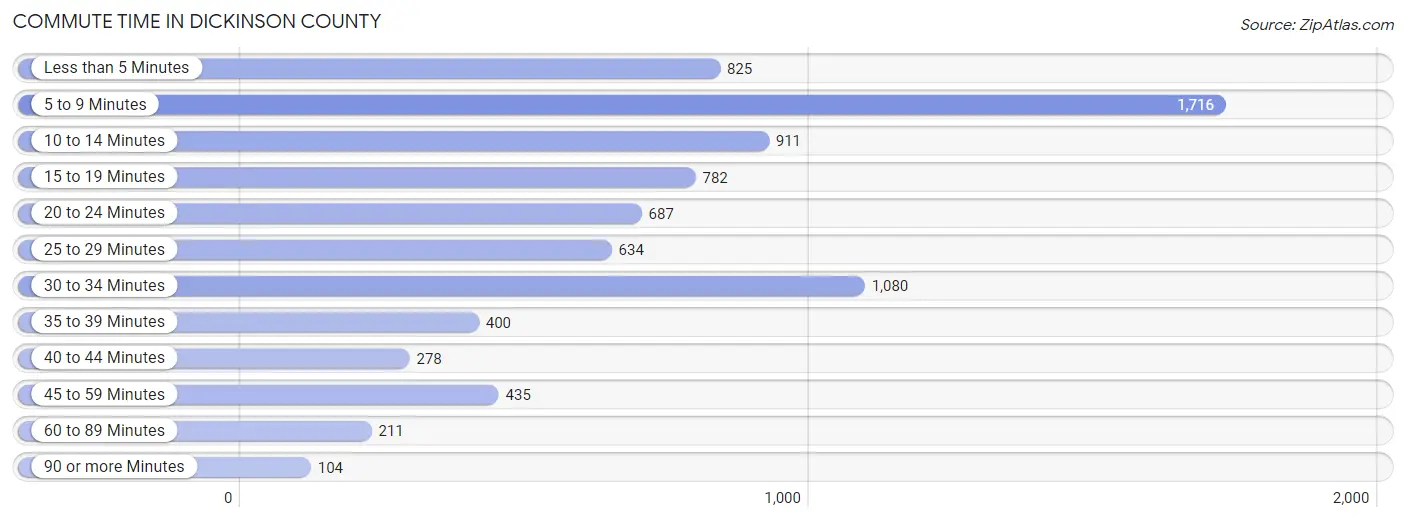
| Commute Time | # Commuters | % Commuters |
| Less than 5 Minutes | 825 | 10.2% |
| 5 to 9 Minutes | 1,716 | 21.3% |
| 10 to 14 Minutes | 911 | 11.3% |
| 15 to 19 Minutes | 782 | 9.7% |
| 20 to 24 Minutes | 687 | 8.5% |
| 25 to 29 Minutes | 634 | 7.9% |
| 30 to 34 Minutes | 1,080 | 13.4% |
| 35 to 39 Minutes | 400 | 5.0% |
| 40 to 44 Minutes | 278 | 3.5% |
| 45 to 59 Minutes | 435 | 5.4% |
| 60 to 89 Minutes | 211 | 2.6% |
| 90 or more Minutes | 104 | 1.3% |
Commute Time by Sex in Dickinson County
The most common commute times in Dickinson County are 5 to 9 minutes (837 commuters, 19.2%) for males and 5 to 9 minutes (879 commuters, 23.8%) for females.
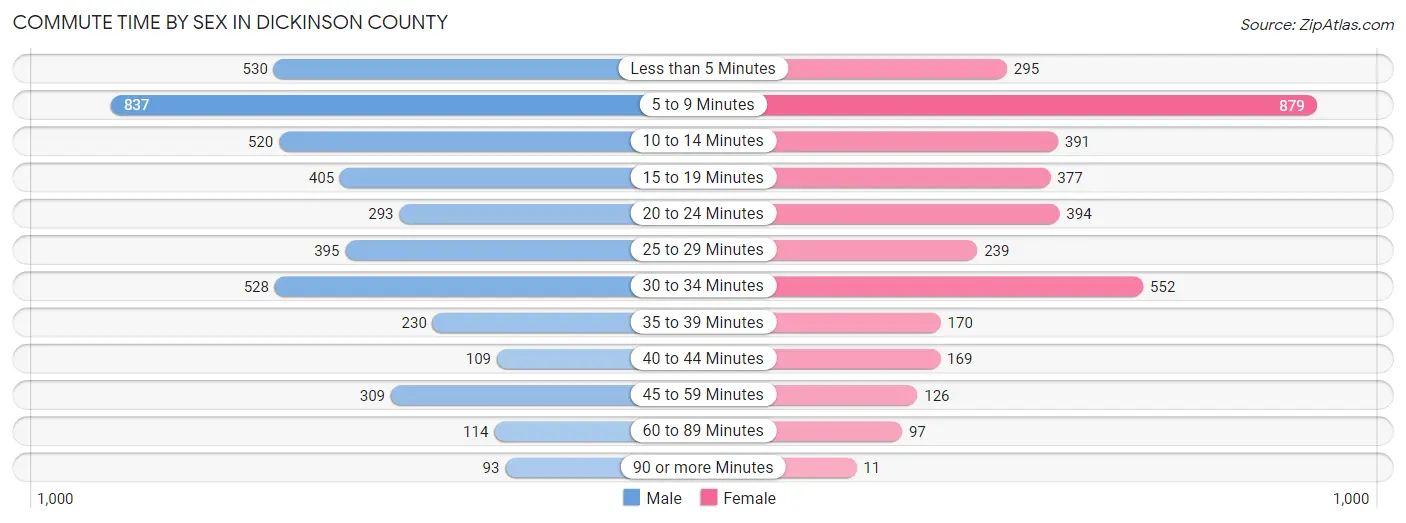
| Commute Time | Male | Female |
| Less than 5 Minutes | 530 (12.1%) | 295 (8.0%) |
| 5 to 9 Minutes | 837 (19.2%) | 879 (23.8%) |
| 10 to 14 Minutes | 520 (11.9%) | 391 (10.6%) |
| 15 to 19 Minutes | 405 (9.3%) | 377 (10.2%) |
| 20 to 24 Minutes | 293 (6.7%) | 394 (10.6%) |
| 25 to 29 Minutes | 395 (9.0%) | 239 (6.5%) |
| 30 to 34 Minutes | 528 (12.1%) | 552 (14.9%) |
| 35 to 39 Minutes | 230 (5.3%) | 170 (4.6%) |
| 40 to 44 Minutes | 109 (2.5%) | 169 (4.6%) |
| 45 to 59 Minutes | 309 (7.1%) | 126 (3.4%) |
| 60 to 89 Minutes | 114 (2.6%) | 97 (2.6%) |
| 90 or more Minutes | 93 (2.1%) | 11 (0.3%) |
Time of Departure to Work by Sex in Dickinson County
The most frequent times of departure to work in Dickinson County are 7:00 AM to 7:29 AM (832, 19.1%) for males and 7:30 AM to 7:59 AM (797, 21.5%) for females.
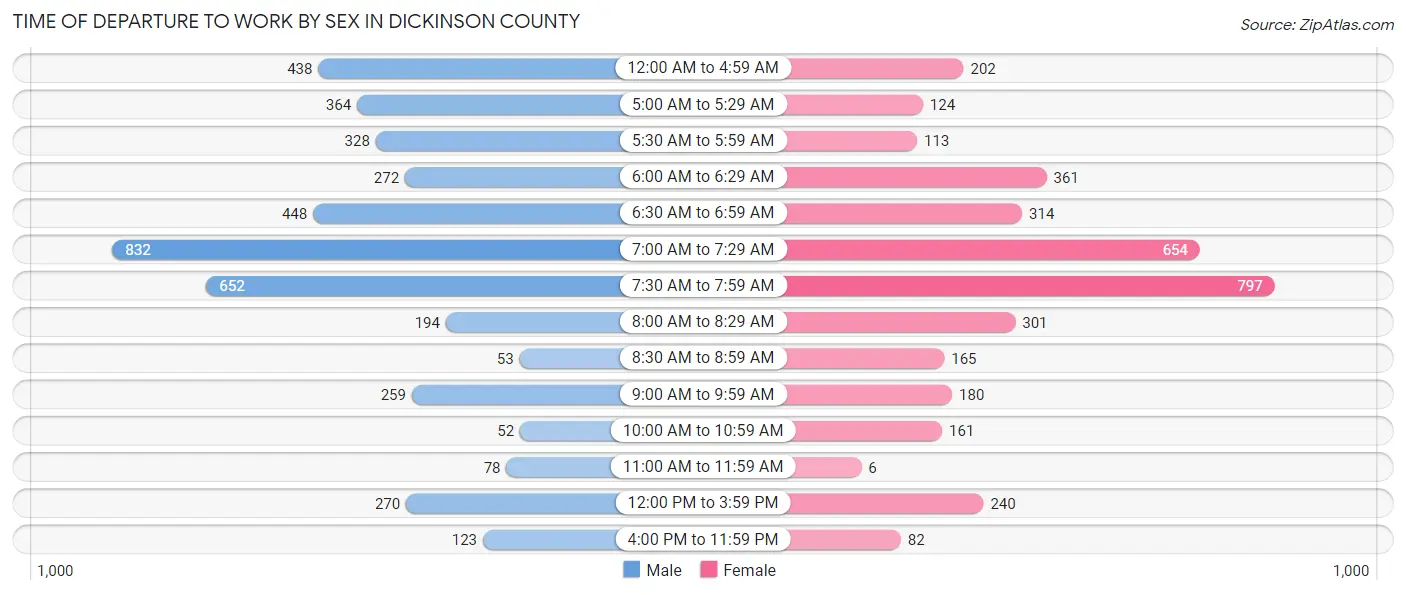
| Time of Departure | Male | Female |
| 12:00 AM to 4:59 AM | 438 (10.0%) | 202 (5.5%) |
| 5:00 AM to 5:29 AM | 364 (8.3%) | 124 (3.4%) |
| 5:30 AM to 5:59 AM | 328 (7.5%) | 113 (3.0%) |
| 6:00 AM to 6:29 AM | 272 (6.2%) | 361 (9.8%) |
| 6:30 AM to 6:59 AM | 448 (10.3%) | 314 (8.5%) |
| 7:00 AM to 7:29 AM | 832 (19.1%) | 654 (17.7%) |
| 7:30 AM to 7:59 AM | 652 (14.9%) | 797 (21.5%) |
| 8:00 AM to 8:29 AM | 194 (4.4%) | 301 (8.1%) |
| 8:30 AM to 8:59 AM | 53 (1.2%) | 165 (4.5%) |
| 9:00 AM to 9:59 AM | 259 (5.9%) | 180 (4.9%) |
| 10:00 AM to 10:59 AM | 52 (1.2%) | 161 (4.3%) |
| 11:00 AM to 11:59 AM | 78 (1.8%) | 6 (0.2%) |
| 12:00 PM to 3:59 PM | 270 (6.2%) | 240 (6.5%) |
| 4:00 PM to 11:59 PM | 123 (2.8%) | 82 (2.2%) |
| Total | 4,363 (100.0%) | 3,700 (100.0%) |
Housing Occupancy in Dickinson County
Occupancy by Ownership in Dickinson County
Of the total 7,903 dwellings in Dickinson County, owner-occupied units account for 5,941 (75.2%), while renter-occupied units make up 1,962 (24.8%).
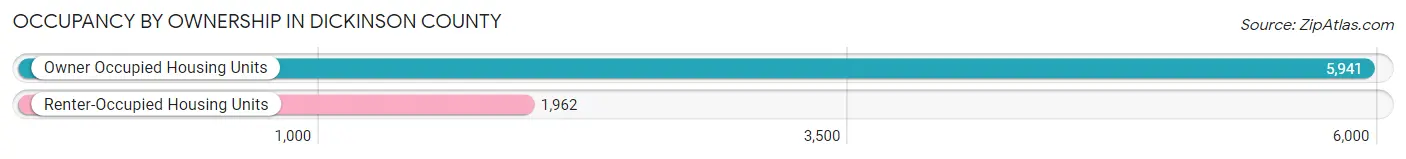
| Occupancy | # Housing Units | % Housing Units |
| Owner Occupied Housing Units | 5,941 | 75.2% |
| Renter-Occupied Housing Units | 1,962 | 24.8% |
| Total Occupied Housing Units | 7,903 | 100.0% |
Occupancy by Household Size in Dickinson County
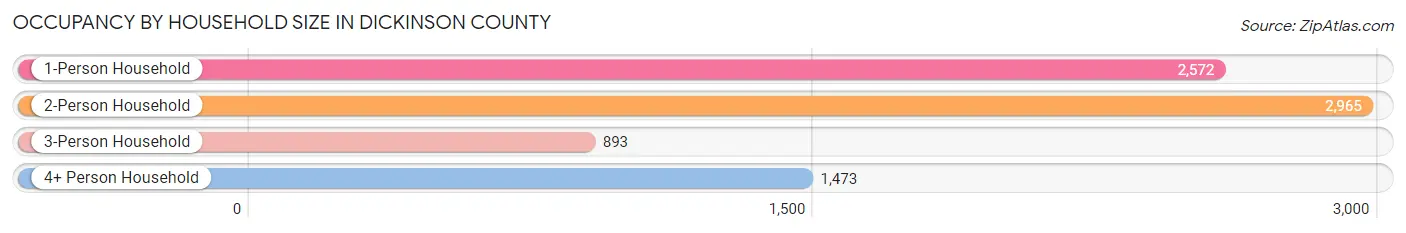
| Household Size | # Housing Units | % Housing Units |
| 1-Person Household | 2,572 | 32.5% |
| 2-Person Household | 2,965 | 37.5% |
| 3-Person Household | 893 | 11.3% |
| 4+ Person Household | 1,473 | 18.6% |
| Total Housing Units | 7,903 | 100.0% |
Occupancy by Ownership by Household Size in Dickinson County
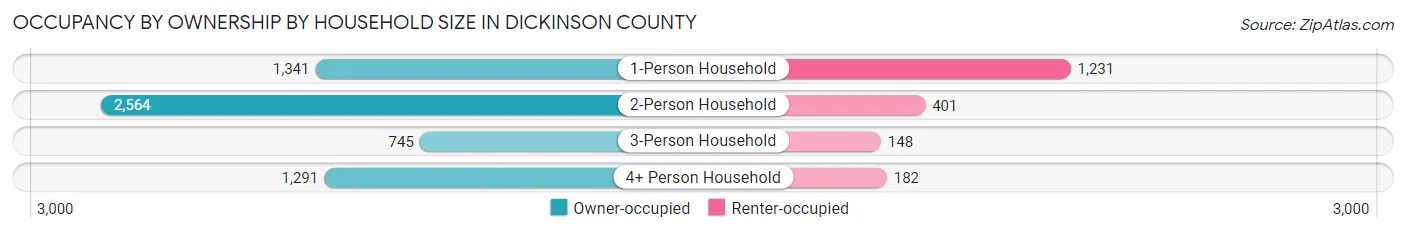
| Household Size | Owner-occupied | Renter-occupied |
| 1-Person Household | 1,341 (52.1%) | 1,231 (47.9%) |
| 2-Person Household | 2,564 (86.5%) | 401 (13.5%) |
| 3-Person Household | 745 (83.4%) | 148 (16.6%) |
| 4+ Person Household | 1,291 (87.6%) | 182 (12.4%) |
| Total Housing Units | 5,941 (75.2%) | 1,962 (24.8%) |
Occupancy by Educational Attainment in Dickinson County
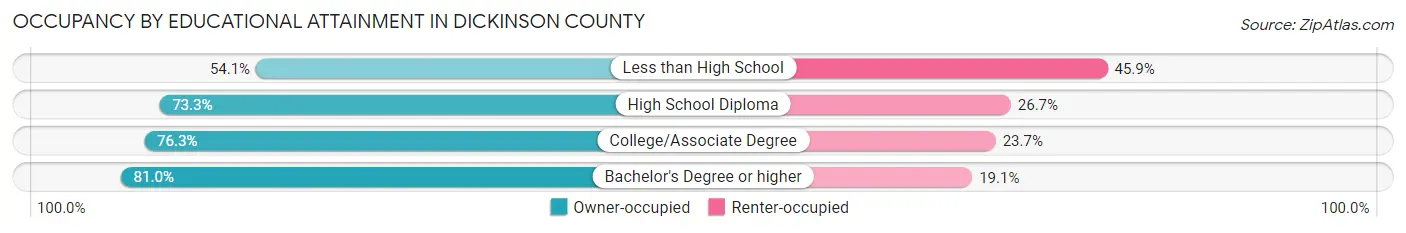
| Household Size | Owner-occupied | Renter-occupied |
| Less than High School | 262 (54.1%) | 222 (45.9%) |
| High School Diploma | 1,757 (73.3%) | 640 (26.7%) |
| College/Associate Degree | 2,346 (76.3%) | 729 (23.7%) |
| Bachelor's Degree or higher | 1,576 (80.9%) | 371 (19.1%) |
Occupancy by Age of Householder in Dickinson County
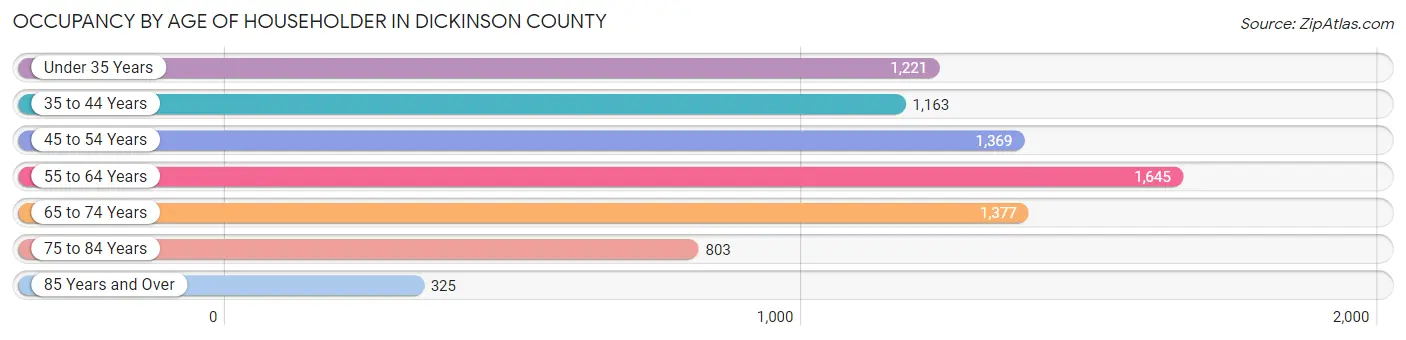
| Age Bracket | # Households | % Households |
| Under 35 Years | 1,221 | 15.4% |
| 35 to 44 Years | 1,163 | 14.7% |
| 45 to 54 Years | 1,369 | 17.3% |
| 55 to 64 Years | 1,645 | 20.8% |
| 65 to 74 Years | 1,377 | 17.4% |
| 75 to 84 Years | 803 | 10.2% |
| 85 Years and Over | 325 | 4.1% |
| Total | 7,903 | 100.0% |
Housing Finances in Dickinson County
Median Income by Occupancy in Dickinson County
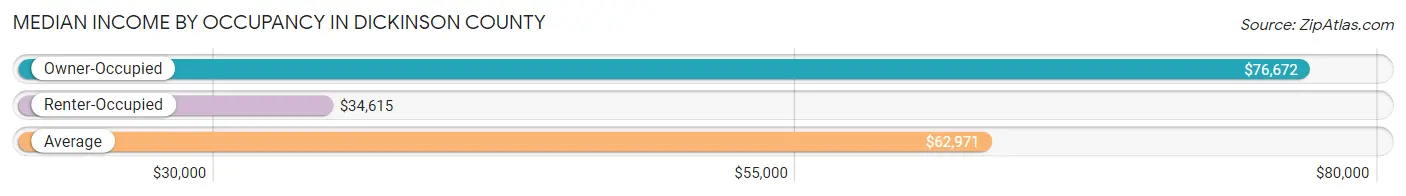
| Occupancy Type | # Households | Median Income |
| Owner-Occupied | 5,941 (75.2%) | $76,672 |
| Renter-Occupied | 1,962 (24.8%) | $34,615 |
| Average | 7,903 (100.0%) | $62,971 |
Occupancy by Householder Income Bracket in Dickinson County
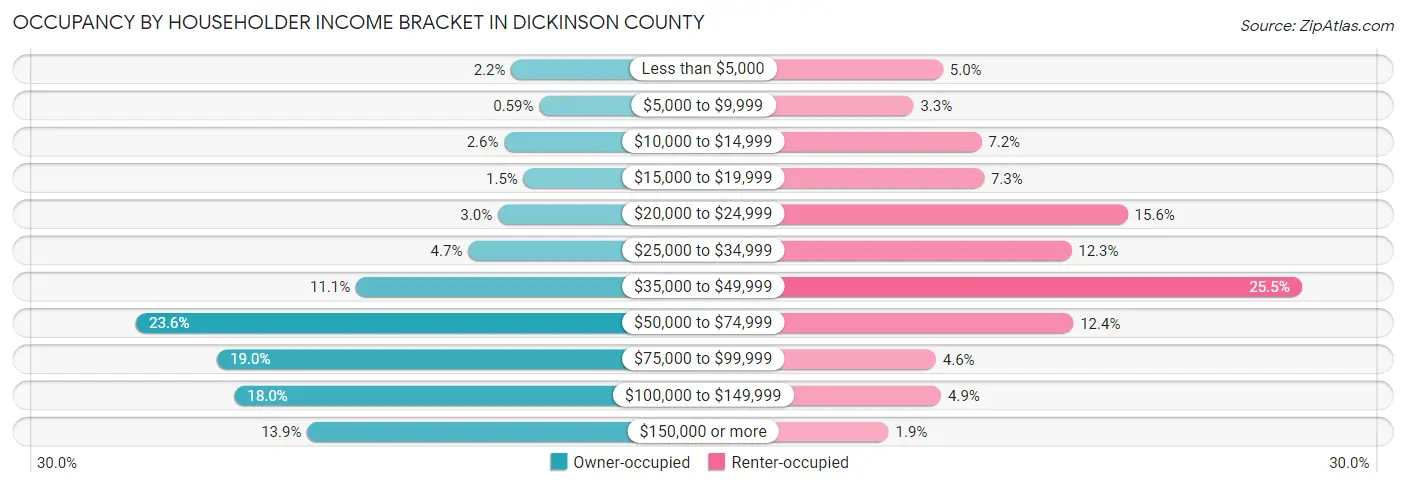
| Income Bracket | Owner-occupied | Renter-occupied |
| Less than $5,000 | 130 (2.2%) | 98 (5.0%) |
| $5,000 to $9,999 | 35 (0.6%) | 65 (3.3%) |
| $10,000 to $14,999 | 154 (2.6%) | 141 (7.2%) |
| $15,000 to $19,999 | 88 (1.5%) | 144 (7.3%) |
| $20,000 to $24,999 | 175 (2.9%) | 305 (15.5%) |
| $25,000 to $34,999 | 276 (4.6%) | 242 (12.3%) |
| $35,000 to $49,999 | 657 (11.1%) | 500 (25.5%) |
| $50,000 to $74,999 | 1,404 (23.6%) | 244 (12.4%) |
| $75,000 to $99,999 | 1,129 (19.0%) | 90 (4.6%) |
| $100,000 to $149,999 | 1,070 (18.0%) | 96 (4.9%) |
| $150,000 or more | 823 (13.9%) | 37 (1.9%) |
| Total | 5,941 (100.0%) | 1,962 (100.0%) |
Monthly Housing Cost Tiers in Dickinson County
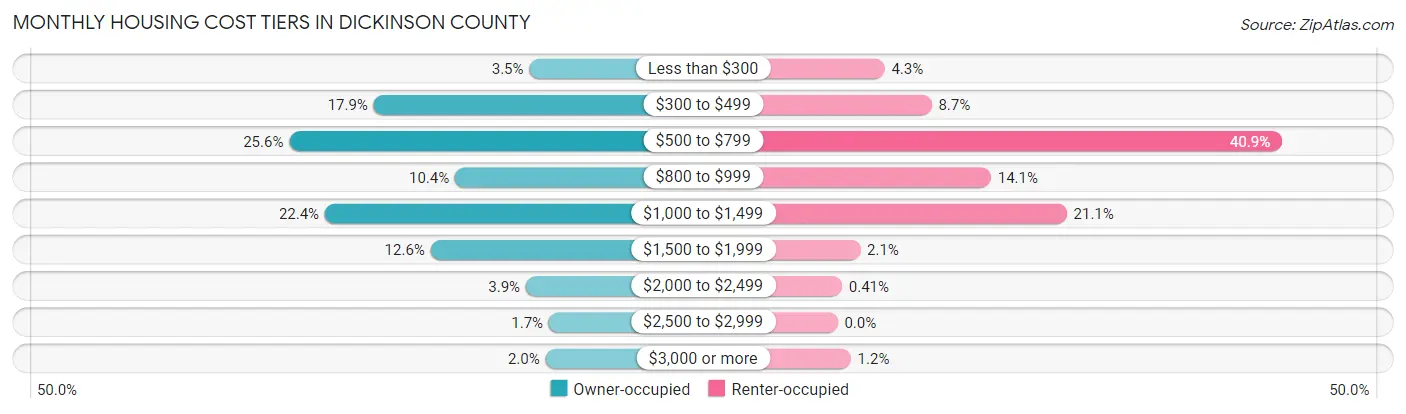
| Monthly Cost | Owner-occupied | Renter-occupied |
| Less than $300 | 210 (3.5%) | 85 (4.3%) |
| $300 to $499 | 1,061 (17.9%) | 170 (8.7%) |
| $500 to $799 | 1,523 (25.6%) | 803 (40.9%) |
| $800 to $999 | 616 (10.4%) | 277 (14.1%) |
| $1,000 to $1,499 | 1,328 (22.4%) | 414 (21.1%) |
| $1,500 to $1,999 | 750 (12.6%) | 41 (2.1%) |
| $2,000 to $2,499 | 229 (3.8%) | 8 (0.4%) |
| $2,500 to $2,999 | 103 (1.7%) | 0 (0.0%) |
| $3,000 or more | 121 (2.0%) | 24 (1.2%) |
| Total | 5,941 (100.0%) | 1,962 (100.0%) |
Physical Housing Characteristics in Dickinson County
Housing Structures in Dickinson County
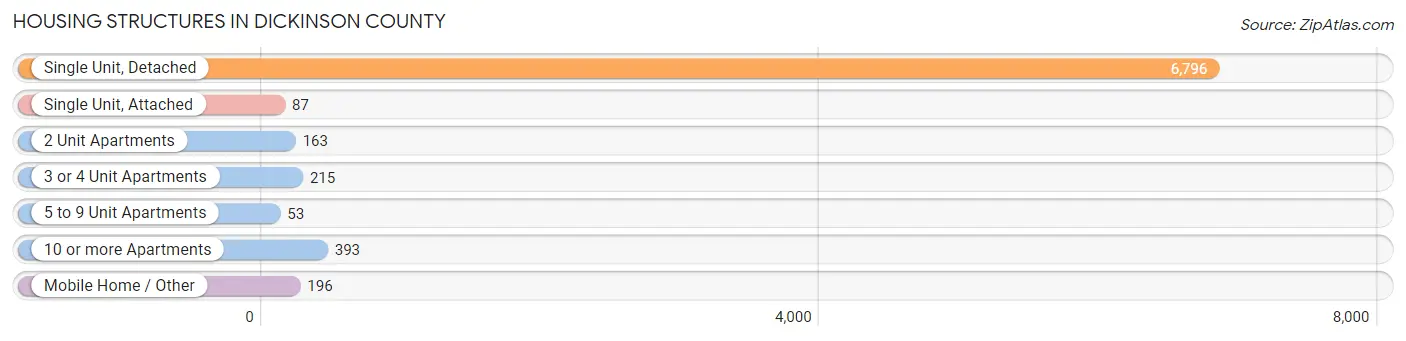
| Structure Type | # Housing Units | % Housing Units |
| Single Unit, Detached | 6,796 | 86.0% |
| Single Unit, Attached | 87 | 1.1% |
| 2 Unit Apartments | 163 | 2.1% |
| 3 or 4 Unit Apartments | 215 | 2.7% |
| 5 to 9 Unit Apartments | 53 | 0.7% |
| 10 or more Apartments | 393 | 5.0% |
| Mobile Home / Other | 196 | 2.5% |
| Total | 7,903 | 100.0% |
Housing Structures by Occupancy in Dickinson County
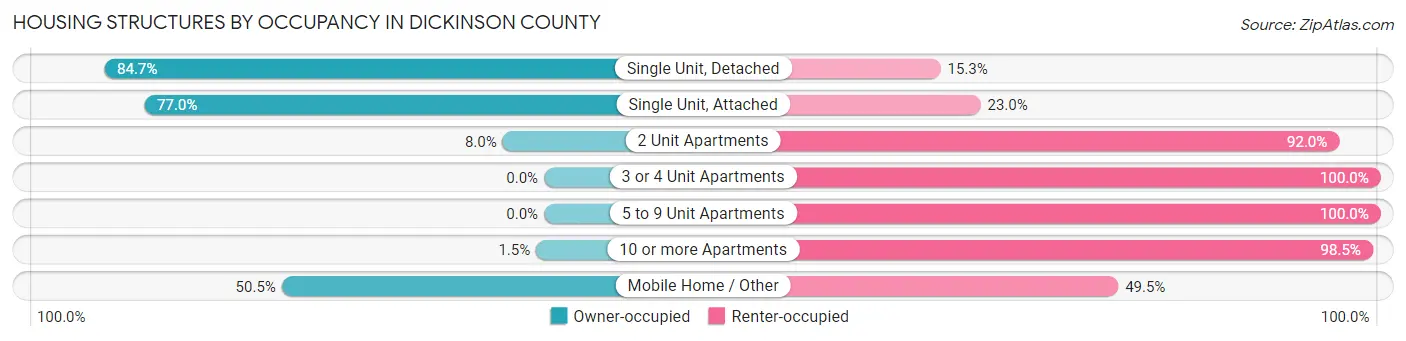
| Structure Type | Owner-occupied | Renter-occupied |
| Single Unit, Detached | 5,756 (84.7%) | 1,040 (15.3%) |
| Single Unit, Attached | 67 (77.0%) | 20 (23.0%) |
| 2 Unit Apartments | 13 (8.0%) | 150 (92.0%) |
| 3 or 4 Unit Apartments | 0 (0.0%) | 215 (100.0%) |
| 5 to 9 Unit Apartments | 0 (0.0%) | 53 (100.0%) |
| 10 or more Apartments | 6 (1.5%) | 387 (98.5%) |
| Mobile Home / Other | 99 (50.5%) | 97 (49.5%) |
| Total | 5,941 (75.2%) | 1,962 (24.8%) |
Housing Structures by Number of Rooms in Dickinson County
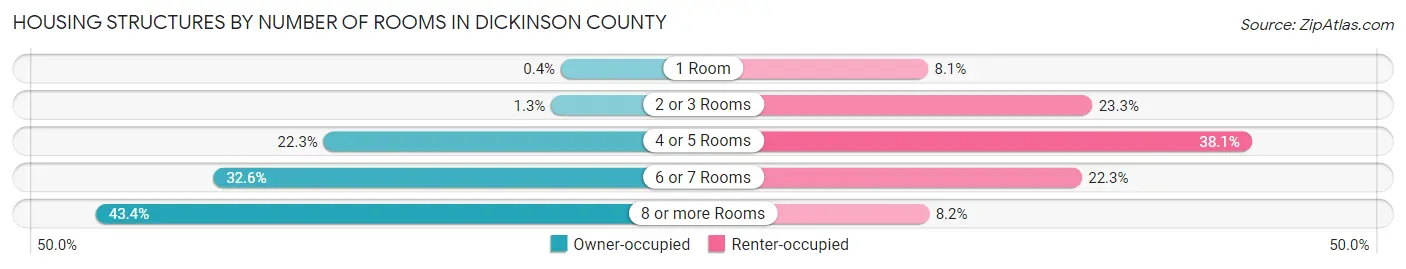
| Number of Rooms | Owner-occupied | Renter-occupied |
| 1 Room | 24 (0.4%) | 159 (8.1%) |
| 2 or 3 Rooms | 77 (1.3%) | 457 (23.3%) |
| 4 or 5 Rooms | 1,327 (22.3%) | 747 (38.1%) |
| 6 or 7 Rooms | 1,934 (32.6%) | 438 (22.3%) |
| 8 or more Rooms | 2,579 (43.4%) | 161 (8.2%) |
| Total | 5,941 (100.0%) | 1,962 (100.0%) |
Housing Structure by Heating Type in Dickinson County
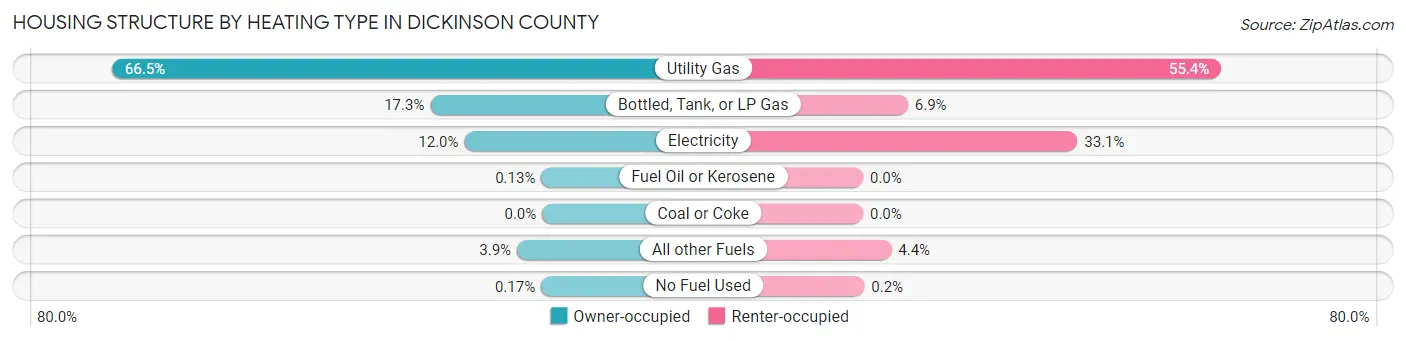
| Heating Type | Owner-occupied | Renter-occupied |
| Utility Gas | 3,951 (66.5%) | 1,086 (55.3%) |
| Bottled, Tank, or LP Gas | 1,027 (17.3%) | 136 (6.9%) |
| Electricity | 714 (12.0%) | 650 (33.1%) |
| Fuel Oil or Kerosene | 8 (0.1%) | 0 (0.0%) |
| Coal or Coke | 0 (0.0%) | 0 (0.0%) |
| All other Fuels | 231 (3.9%) | 86 (4.4%) |
| No Fuel Used | 10 (0.2%) | 4 (0.2%) |
| Total | 5,941 (100.0%) | 1,962 (100.0%) |
Household Vehicle Usage in Dickinson County
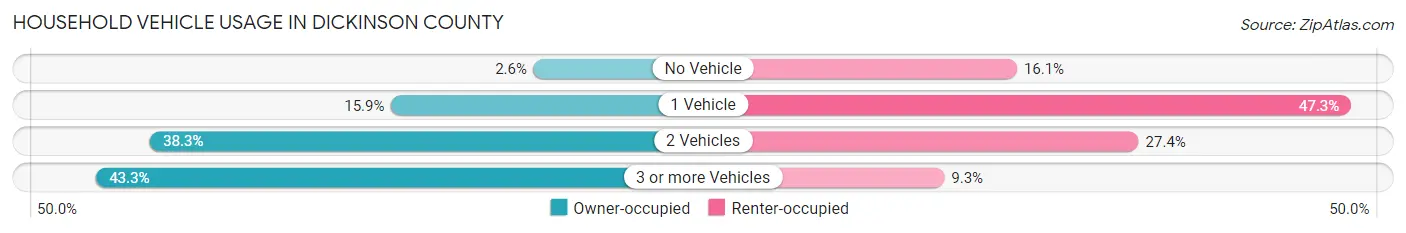
| Vehicles per Household | Owner-occupied | Renter-occupied |
| No Vehicle | 152 (2.6%) | 315 (16.1%) |
| 1 Vehicle | 942 (15.9%) | 927 (47.2%) |
| 2 Vehicles | 2,274 (38.3%) | 538 (27.4%) |
| 3 or more Vehicles | 2,573 (43.3%) | 182 (9.3%) |
| Total | 5,941 (100.0%) | 1,962 (100.0%) |
Real Estate & Mortgages in Dickinson County
Real Estate and Mortgage Overview in Dickinson County
| Characteristic | Without Mortgage | With Mortgage |
| Housing Units | 2,784 | 3,157 |
| Median Property Value | $110,200 | $158,700 |
| Median Household Income | $57,007 | $592 |
| Monthly Housing Costs | $541 | $121 |
| Real Estate Taxes | $1,878 | $52 |
Property Value by Mortgage Status in Dickinson County
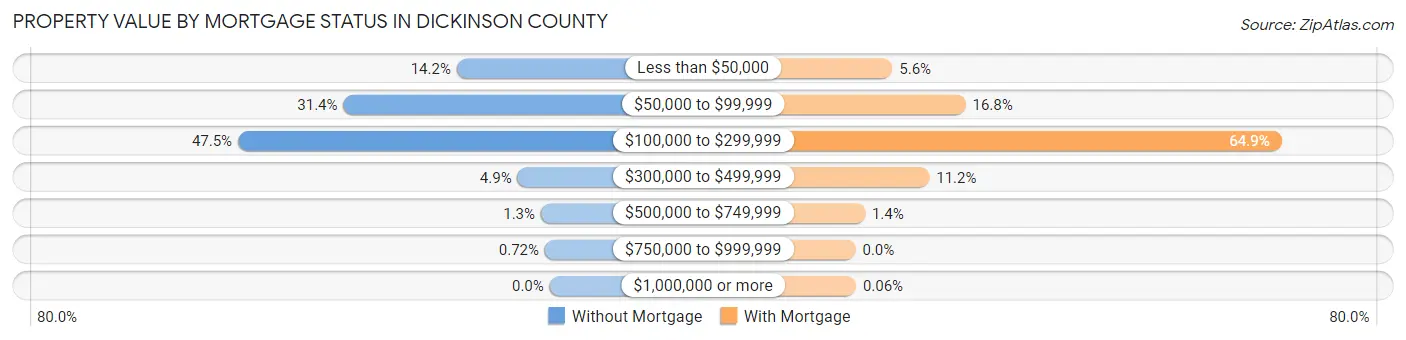
| Property Value | Without Mortgage | With Mortgage |
| Less than $50,000 | 394 (14.1%) | 177 (5.6%) |
| $50,000 to $99,999 | 875 (31.4%) | 529 (16.8%) |
| $100,000 to $299,999 | 1,322 (47.5%) | 2,049 (64.9%) |
| $300,000 to $499,999 | 136 (4.9%) | 355 (11.2%) |
| $500,000 to $749,999 | 37 (1.3%) | 45 (1.4%) |
| $750,000 to $999,999 | 20 (0.7%) | 0 (0.0%) |
| $1,000,000 or more | 0 (0.0%) | 2 (0.1%) |
| Total | 2,784 (100.0%) | 3,157 (100.0%) |
Household Income by Mortgage Status in Dickinson County
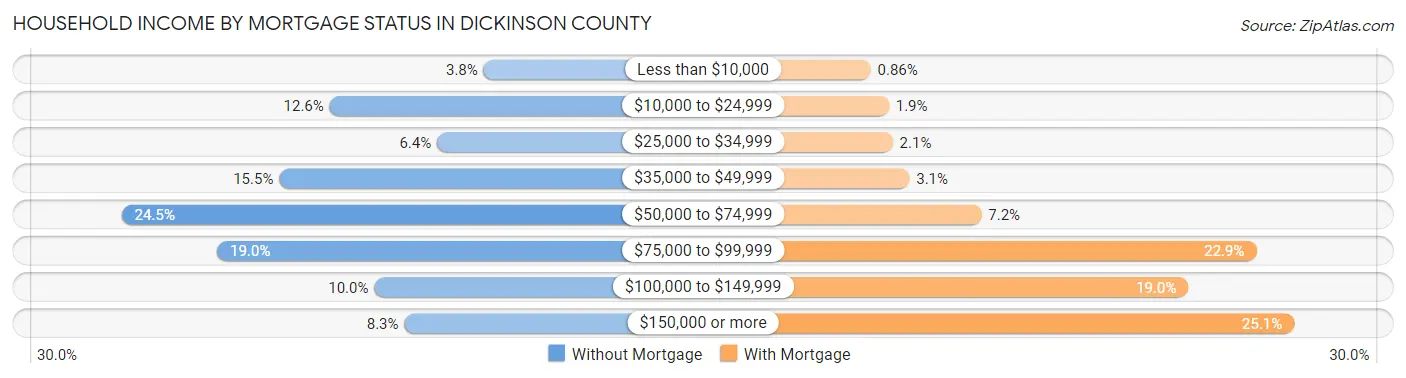
| Household Income | Without Mortgage | With Mortgage |
| Less than $10,000 | 105 (3.8%) | 27 (0.9%) |
| $10,000 to $24,999 | 350 (12.6%) | 60 (1.9%) |
| $25,000 to $34,999 | 179 (6.4%) | 67 (2.1%) |
| $35,000 to $49,999 | 430 (15.4%) | 97 (3.1%) |
| $50,000 to $74,999 | 681 (24.5%) | 227 (7.2%) |
| $75,000 to $99,999 | 529 (19.0%) | 723 (22.9%) |
| $100,000 to $149,999 | 279 (10.0%) | 600 (19.0%) |
| $150,000 or more | 231 (8.3%) | 791 (25.1%) |
| Total | 2,784 (100.0%) | 3,157 (100.0%) |
Property Value to Household Income Ratio in Dickinson County
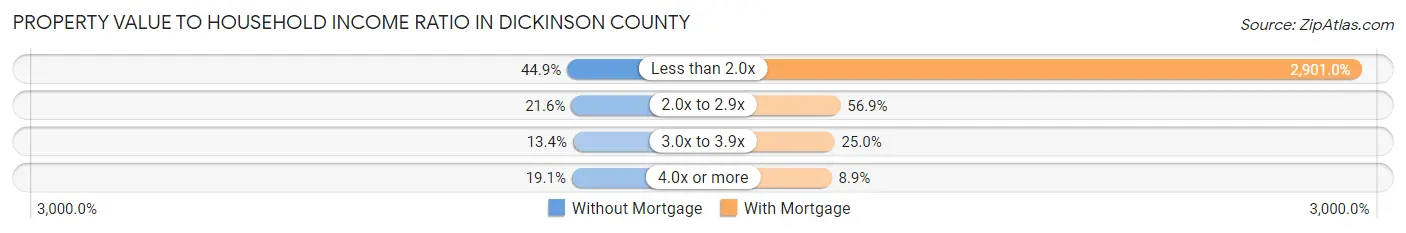
| Value-to-Income Ratio | Without Mortgage | With Mortgage |
| Less than 2.0x | 1,249 (44.9%) | 91,584 (2,901.0%) |
| 2.0x to 2.9x | 602 (21.6%) | 1,797 (56.9%) |
| 3.0x to 3.9x | 374 (13.4%) | 789 (25.0%) |
| 4.0x or more | 532 (19.1%) | 281 (8.9%) |
| Total | 2,784 (100.0%) | 3,157 (100.0%) |
Real Estate Taxes by Mortgage Status in Dickinson County
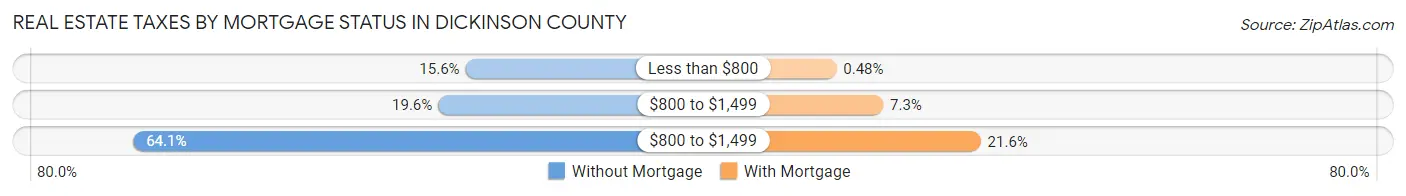
| Property Taxes | Without Mortgage | With Mortgage |
| Less than $800 | 434 (15.6%) | 15 (0.5%) |
| $800 to $1,499 | 545 (19.6%) | 231 (7.3%) |
| $800 to $1,499 | 1,785 (64.1%) | 681 (21.6%) |
| Total | 2,784 (100.0%) | 3,157 (100.0%) |
Health & Disability in Dickinson County
Health Insurance Coverage by Age in Dickinson County
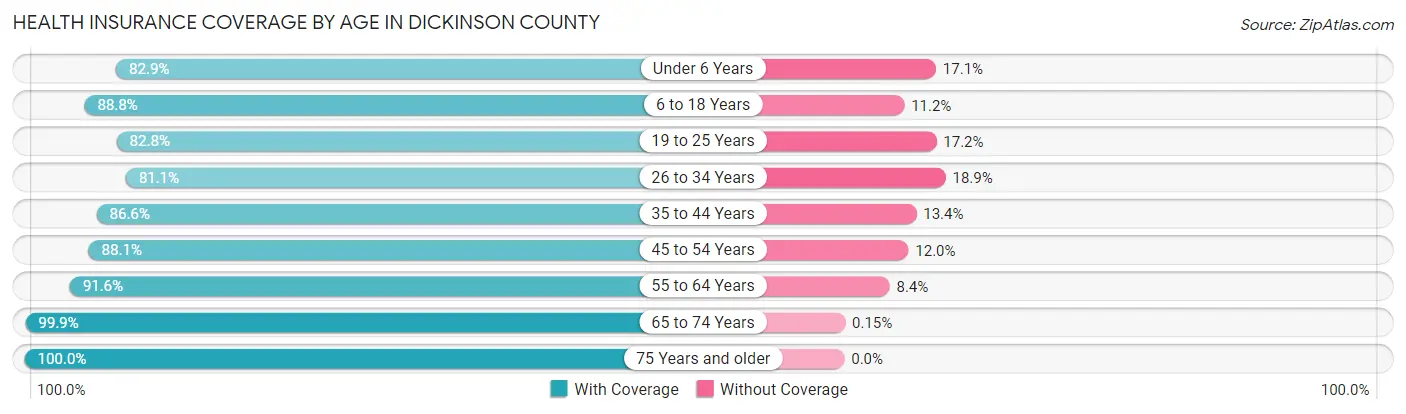
| Age Bracket | With Coverage | Without Coverage |
| Under 6 Years | 1,039 (82.9%) | 214 (17.1%) |
| 6 to 18 Years | 2,927 (88.8%) | 368 (11.2%) |
| 19 to 25 Years | 897 (82.8%) | 186 (17.2%) |
| 26 to 34 Years | 1,538 (81.1%) | 358 (18.9%) |
| 35 to 44 Years | 1,940 (86.6%) | 301 (13.4%) |
| 45 to 54 Years | 1,828 (88.0%) | 248 (11.9%) |
| 55 to 64 Years | 2,518 (91.6%) | 232 (8.4%) |
| 65 to 74 Years | 2,002 (99.9%) | 3 (0.2%) |
| 75 Years and older | 1,560 (100.0%) | 0 (0.0%) |
| Total | 16,249 (89.5%) | 1,910 (10.5%) |
Health Insurance Coverage by Citizenship Status in Dickinson County
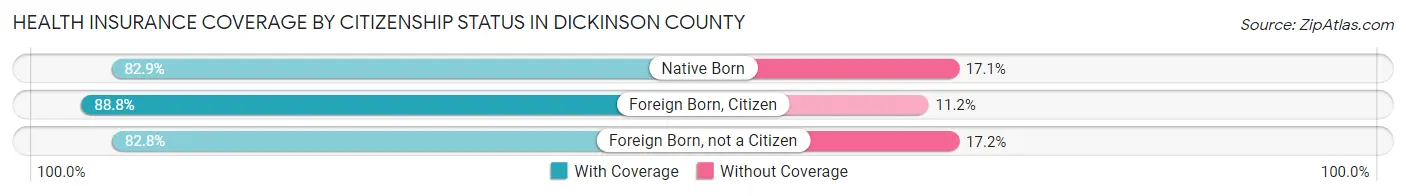
| Citizenship Status | With Coverage | Without Coverage |
| Native Born | 1,039 (82.9%) | 214 (17.1%) |
| Foreign Born, Citizen | 2,927 (88.8%) | 368 (11.2%) |
| Foreign Born, not a Citizen | 897 (82.8%) | 186 (17.2%) |
Health Insurance Coverage by Household Income in Dickinson County
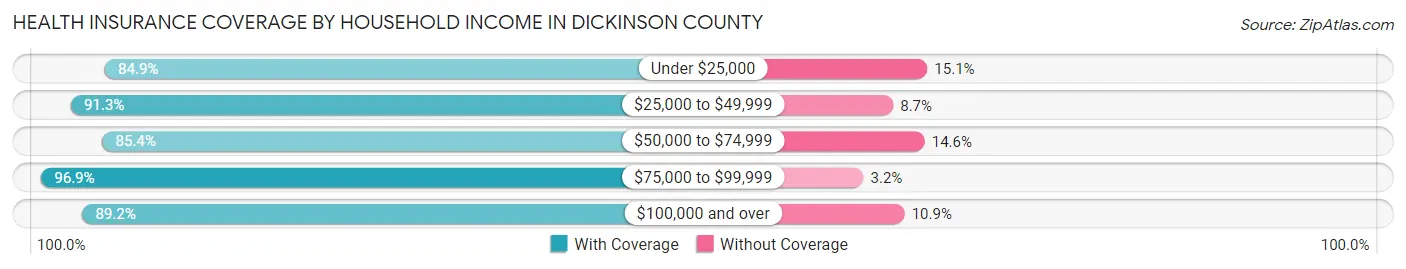
| Household Income | With Coverage | Without Coverage |
| Under $25,000 | 1,597 (84.9%) | 284 (15.1%) |
| $25,000 to $49,999 | 2,653 (91.3%) | 253 (8.7%) |
| $50,000 to $74,999 | 3,237 (85.4%) | 554 (14.6%) |
| $75,000 to $99,999 | 2,918 (96.9%) | 95 (3.2%) |
| $100,000 and over | 5,793 (89.1%) | 705 (10.8%) |
Public vs Private Health Insurance Coverage by Age in Dickinson County
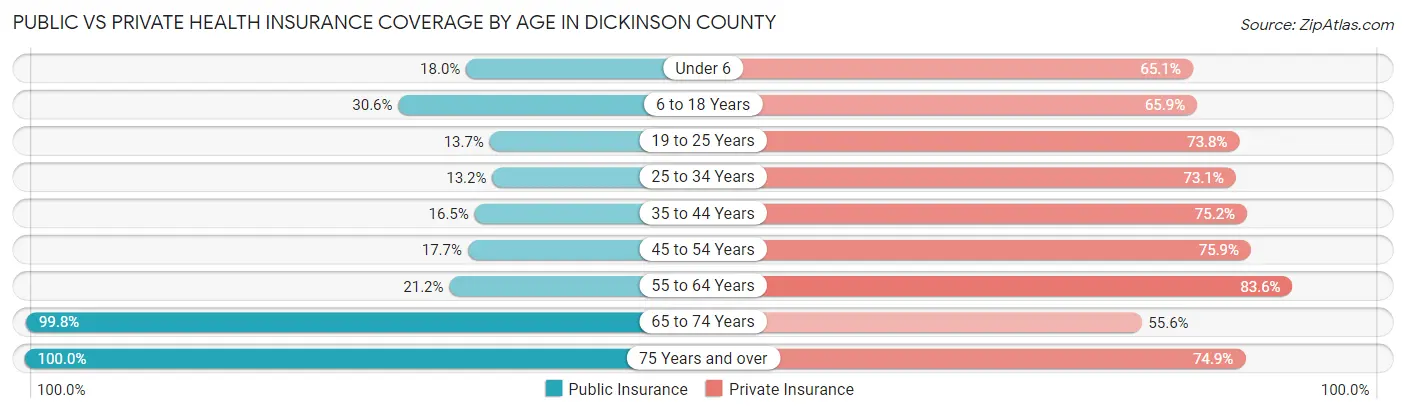
| Age Bracket | Public Insurance | Private Insurance |
| Under 6 | 226 (18.0%) | 816 (65.1%) |
| 6 to 18 Years | 1,009 (30.6%) | 2,172 (65.9%) |
| 19 to 25 Years | 148 (13.7%) | 799 (73.8%) |
| 25 to 34 Years | 250 (13.2%) | 1,386 (73.1%) |
| 35 to 44 Years | 369 (16.5%) | 1,685 (75.2%) |
| 45 to 54 Years | 368 (17.7%) | 1,576 (75.9%) |
| 55 to 64 Years | 582 (21.2%) | 2,300 (83.6%) |
| 65 to 74 Years | 2,000 (99.8%) | 1,115 (55.6%) |
| 75 Years and over | 1,560 (100.0%) | 1,168 (74.9%) |
| Total | 6,512 (35.9%) | 13,017 (71.7%) |
Disability Status by Sex by Age in Dickinson County
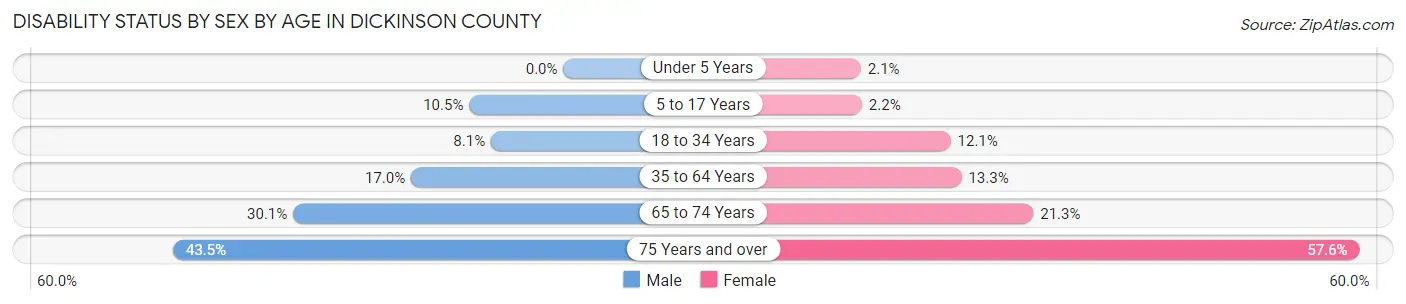
| Age Bracket | Male | Female |
| Under 5 Years | 0 (0.0%) | 10 (2.1%) |
| 5 to 17 Years | 173 (10.5%) | 36 (2.2%) |
| 18 to 34 Years | 140 (8.1%) | 191 (12.1%) |
| 35 to 64 Years | 621 (17.0%) | 454 (13.3%) |
| 65 to 74 Years | 310 (30.1%) | 208 (21.3%) |
| 75 Years and over | 277 (43.5%) | 532 (57.6%) |
Disability Class by Sex by Age in Dickinson County
Disability Class: Hearing Difficulty
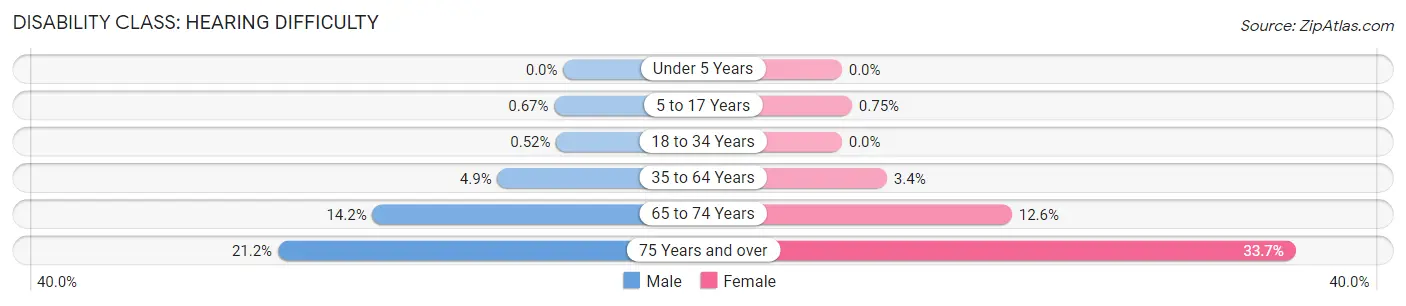
| Age Bracket | Male | Female |
| Under 5 Years | 0 (0.0%) | 0 (0.0%) |
| 5 to 17 Years | 11 (0.7%) | 12 (0.7%) |
| 18 to 34 Years | 9 (0.5%) | 0 (0.0%) |
| 35 to 64 Years | 179 (4.9%) | 114 (3.4%) |
| 65 to 74 Years | 146 (14.2%) | 123 (12.6%) |
| 75 Years and over | 135 (21.2%) | 311 (33.7%) |
Disability Class: Vision Difficulty
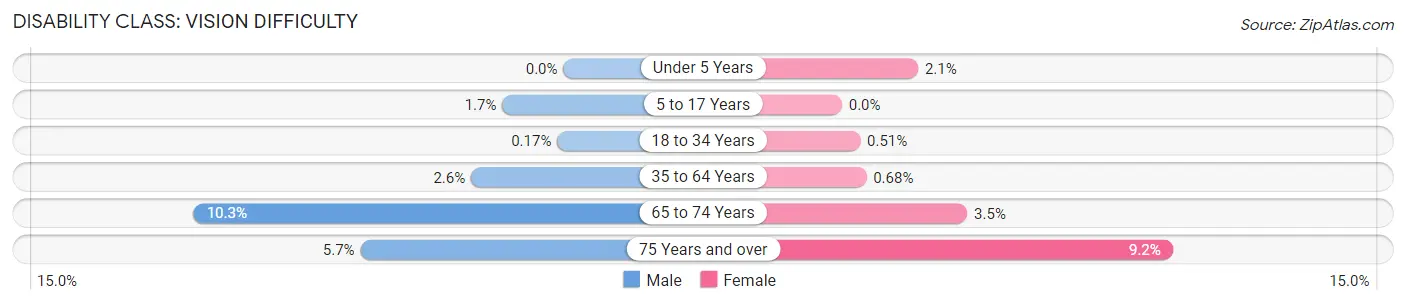
| Age Bracket | Male | Female |
| Under 5 Years | 0 (0.0%) | 10 (2.1%) |
| 5 to 17 Years | 28 (1.7%) | 0 (0.0%) |
| 18 to 34 Years | 3 (0.2%) | 8 (0.5%) |
| 35 to 64 Years | 94 (2.6%) | 23 (0.7%) |
| 65 to 74 Years | 106 (10.3%) | 34 (3.5%) |
| 75 Years and over | 36 (5.7%) | 85 (9.2%) |
Disability Class: Cognitive Difficulty
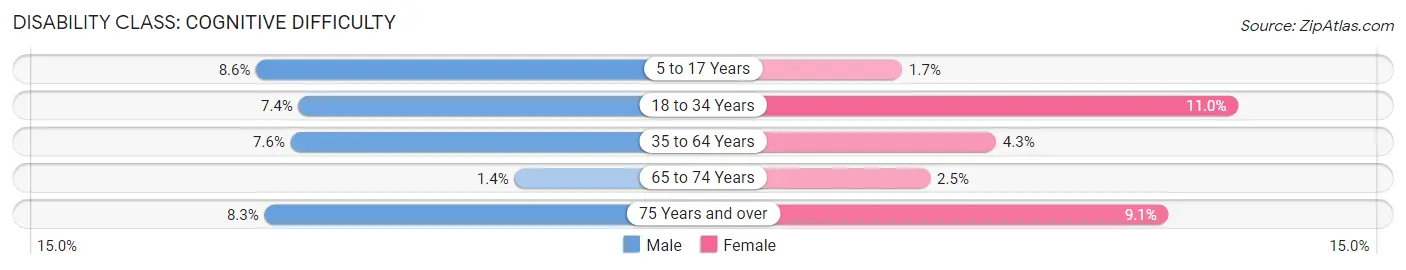
| Age Bracket | Male | Female |
| 5 to 17 Years | 141 (8.6%) | 27 (1.7%) |
| 18 to 34 Years | 128 (7.4%) | 174 (11.0%) |
| 35 to 64 Years | 278 (7.6%) | 146 (4.3%) |
| 65 to 74 Years | 14 (1.4%) | 24 (2.5%) |
| 75 Years and over | 53 (8.3%) | 84 (9.1%) |
Disability Class: Ambulatory Difficulty
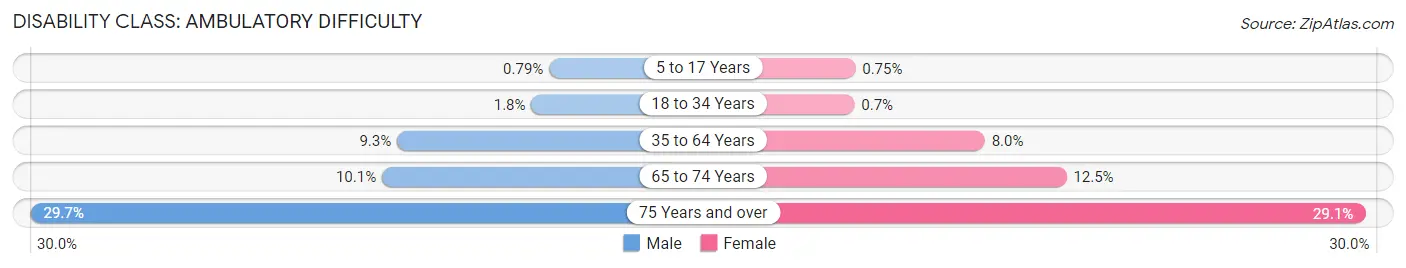
| Age Bracket | Male | Female |
| 5 to 17 Years | 13 (0.8%) | 12 (0.7%) |
| 18 to 34 Years | 31 (1.8%) | 11 (0.7%) |
| 35 to 64 Years | 339 (9.3%) | 271 (8.0%) |
| 65 to 74 Years | 104 (10.1%) | 122 (12.5%) |
| 75 Years and over | 189 (29.7%) | 269 (29.1%) |
Disability Class: Self-Care Difficulty
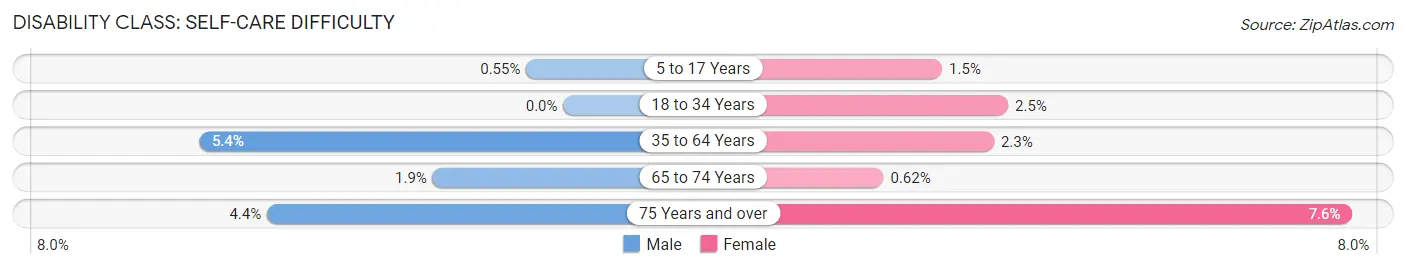
| Age Bracket | Male | Female |
| 5 to 17 Years | 9 (0.5%) | 24 (1.5%) |
| 18 to 34 Years | 0 (0.0%) | 39 (2.5%) |
| 35 to 64 Years | 198 (5.4%) | 77 (2.3%) |
| 65 to 74 Years | 20 (1.9%) | 6 (0.6%) |
| 75 Years and over | 28 (4.4%) | 70 (7.6%) |
Technology Access in Dickinson County
Computing Device Access in Dickinson County
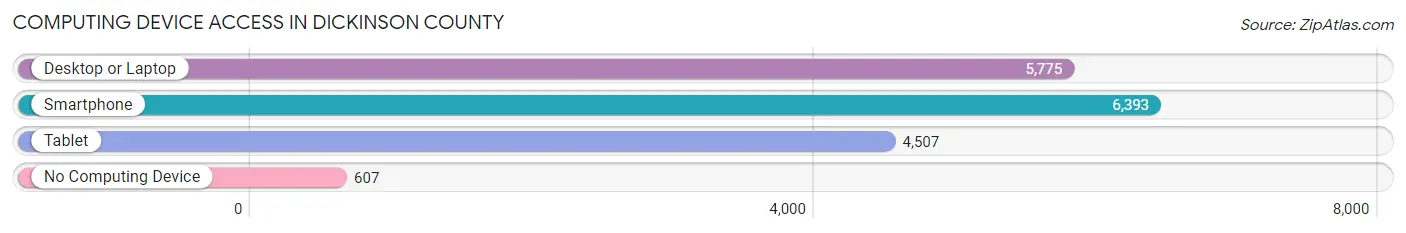
| Device Type | # Households | % Households |
| Desktop or Laptop | 5,775 | 73.1% |
| Smartphone | 6,393 | 80.9% |
| Tablet | 4,507 | 57.0% |
| No Computing Device | 607 | 7.7% |
| Total | 7,903 | 100.0% |
Internet Access in Dickinson County
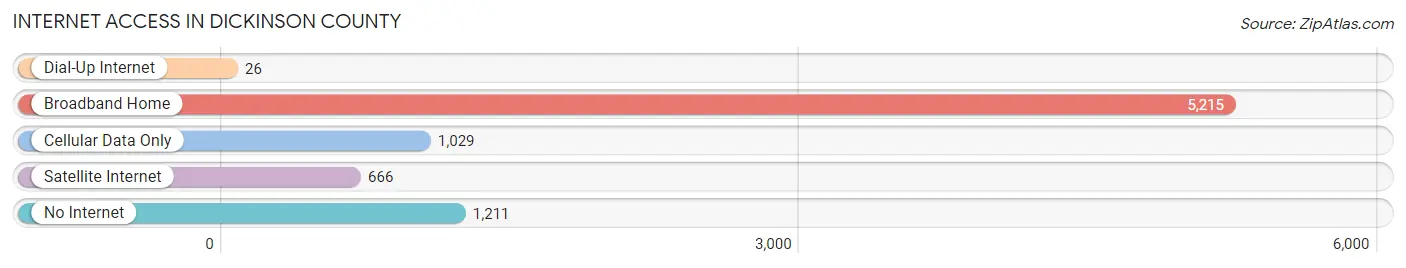
| Internet Type | # Households | % Households |
| Dial-Up Internet | 26 | 0.3% |
| Broadband Home | 5,215 | 66.0% |
| Cellular Data Only | 1,029 | 13.0% |
| Satellite Internet | 666 | 8.4% |
| No Internet | 1,211 | 15.3% |
| Total | 7,903 | 100.0% |
Dickinson County Summary
Dickinson County is located in the north-central region of Kansas, and is part of the Salina Metropolitan Statistical Area. The county was established in 1857 and named after Daniel S. Dickinson, a New York senator. As of the 2010 census, the population of Dickinson County was 19,754.
Geography
Dickinson County is located in the north-central region of Kansas, and is bordered by Clay County to the north, Ottawa County to the east, Saline County to the south, and Geary County to the west. The county has a total area of 576 square miles, of which 575 square miles is land and 1 square mile is water. The county is located in the Smoky Hills region of the Great Plains, and is characterized by rolling hills and prairies. The county is drained by the Solomon River, which flows through the county from north to south.
The county is home to several state parks and wildlife areas, including the Milford State Park, the Kanopolis State Park, and the Cheyenne Bottoms Wildlife Area.
Demographics
As of the 2010 census, there were 19,754 people, 7,845 households, and 5,541 families residing in the county. The population density was 34.4 people per square mile. The racial makeup of the county was 95.2% White, 0.7% Black or African American, 0.5% Native American, 0.3% Asian, 0.1% Pacific Islander, 1.9% from other races, and 1.3% from two or more races. 4.3% of the population were Hispanic or Latino of any race.
The median income for a household in the county was $45,845, and the median income for a family was $54,845. The per capita income for the county was $22,845. About 8.2% of families and 11.2% of the population were below the poverty line, including 14.2% of those under age 18 and 8.2% of those age 65 or over.
Economy
The economy of Dickinson County is largely based on agriculture, with the county being home to several large farms and ranches. The county is also home to several manufacturing companies, including a large wind turbine manufacturing plant. The county is also home to several oil and gas production companies, as well as several coal-fired power plants.
The county is home to several tourist attractions, including the Milford State Park, the Kanopolis State Park, and the Cheyenne Bottoms Wildlife Area. The county is also home to several museums, including the Dickinson County Historical Museum and the Abilene and Smoky Valley Railroad Museum.
The county is served by several major highways, including Interstate 70, U.S. Route 40, and U.S. Route 81. The county is also served by several airports, including the Abilene Regional Airport and the Salina Regional Airport.
Conclusion
Dickinson County is a rural county located in the north-central region of Kansas. The county is home to several state parks and wildlife areas, and is largely based on agriculture and manufacturing. The county is served by several major highways and airports, and is home to several tourist attractions and museums. The county has a population of 19,754, and a median household income of $45,845.
Common Questions
What is the Total Population of Dickinson County?
Total Population of Dickinson County is 18,492.
What is the Total Male Population of Dickinson County?
Total Male Population of Dickinson County is 9,403.
What is the Total Female Population of Dickinson County?
Total Female Population of Dickinson County is 9,089.
What is the Ratio of Males per 100 Females in Dickinson County?
There are 103.45 Males per 100 Females in Dickinson County.
What is the Ratio of Females per 100 Males in Dickinson County?
There are 96.66 Females per 100 Males in Dickinson County.
What is the Median Population Age in Dickinson County?
Median Population Age in Dickinson County is 41.8 Years.
What is the Average Family Size in Dickinson County
Average Family Size in Dickinson County is 2.9 People.
What is the Average Household Size in Dickinson County
Average Household Size in Dickinson County is 2.3 People.
What is Per Capita Income in Dickinson County?
Per Capita income in Dickinson County is $35,615.
What is the Median Family Income in Dickinson County?
Median Family Income in Dickinson County is $78,323.
What is the Median Household income in Dickinson County?
Median Household Income in Dickinson County is $62,971.
What is Income or Wage Gap in Dickinson County?
Income or Wage Gap in Dickinson County is 32.3%.
Women in Dickinson County earn 67.7 cents for every dollar earned by a man.
What is Family Income Deficit in Dickinson County?
Family Income Deficit in Dickinson County is $9,933.
Families that are below poverty line in Dickinson County earn $9,933 less on average than the poverty threshold level.
What is Inequality or Gini Index in Dickinson County?
Inequality or Gini Index in Dickinson County is 0.43.
How Large is the Labor Force in Dickinson County?
There are 9,203 People in the Labor Forcein in Dickinson County.
What is the Percentage of People in the Labor Force in Dickinson County?
62.4% of People are in the Labor Force in Dickinson County.
What is the Unemployment Rate in Dickinson County?
Unemployment Rate in Dickinson County is 3.0%.