Cowley County, KS
Cowley County Map
Cowley County Overview
34,661
TOTAL POPULATION
17,550
MALE POPULATION
17,111
FEMALE POPULATION
102.57
MALES / 100 FEMALES
97.50
FEMALES / 100 MALES
38.1
MEDIAN AGE
3.1
AVG FAMILY SIZE
2.5
AVG HOUSEHOLD SIZE
$29,977
PER CAPITA INCOME
$71,825
AVG FAMILY INCOME
$55,726
AVG HOUSEHOLD INCOME
25.2%
WAGE / INCOME GAP [ % ]
74.8¢/ $1
WAGE / INCOME GAP [ $ ]
$10,859
FAMILY INCOME DEFICIT
0.46
INEQUALITY / GINI INDEX
16,125
LABOR FORCE [ PEOPLE ]
58.7%
PERCENT IN LABOR FORCE
5.3%
UNEMPLOYMENT RATE
Cowley County Area Codes
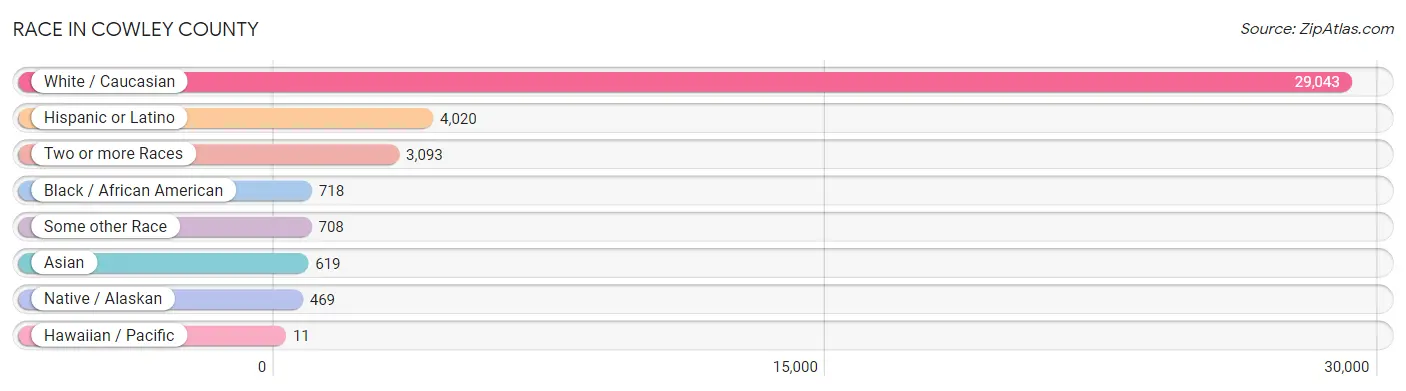
Race in Cowley County
The most populous races in Cowley County are White / Caucasian (29,043 | 83.8%), Hispanic or Latino (4,020 | 11.6%), and Two or more Races (3,093 | 8.9%).
| Race | # Population | % Population |
| Asian | 619 | 1.8% |
| Black / African American | 718 | 2.1% |
| Hawaiian / Pacific | 11 | 0.0% |
| Hispanic or Latino | 4,020 | 11.6% |
| Native / Alaskan | 469 | 1.3% |
| White / Caucasian | 29,043 | 83.8% |
| Two or more Races | 3,093 | 8.9% |
| Some other Race | 708 | 2.0% |
| Total | 34,661 | 100.0% |
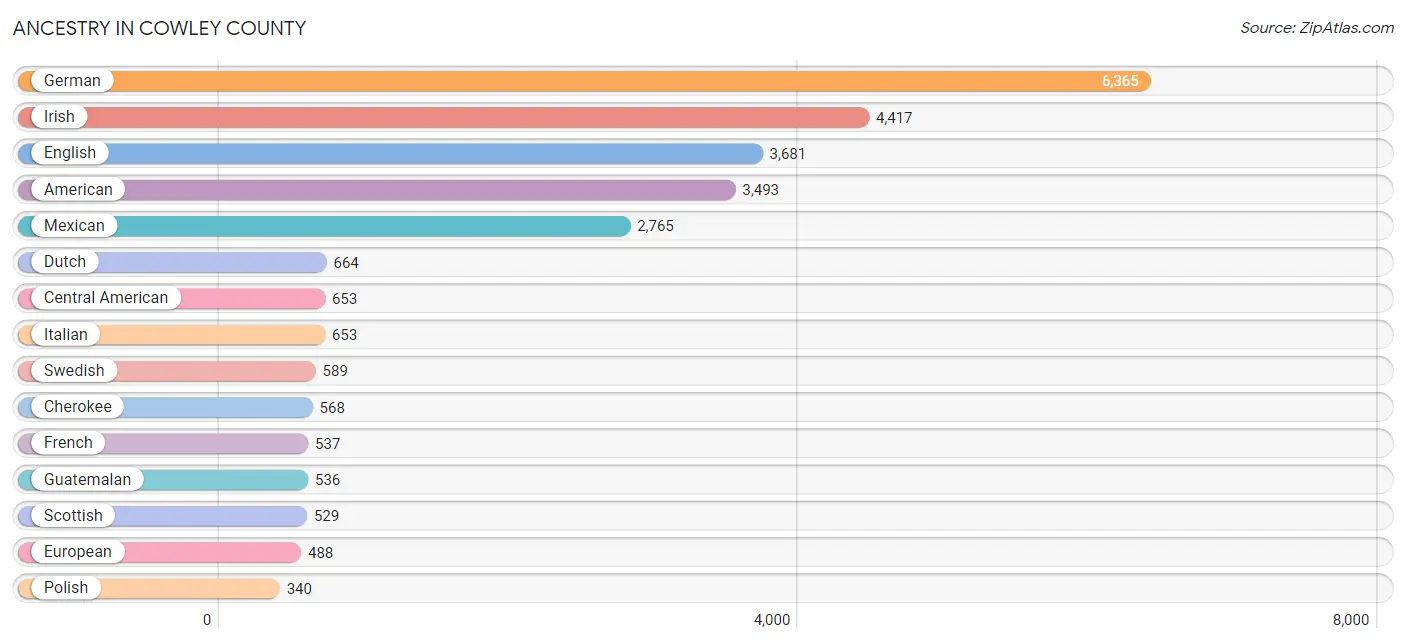
Ancestry in Cowley County
The most populous ancestries reported in Cowley County are German (6,365 | 18.4%), Irish (4,417 | 12.7%), English (3,681 | 10.6%), American (3,493 | 10.1%), and Mexican (2,765 | 8.0%), together accounting for 59.8% of all Cowley County residents.
| Ancestry | # Population | % Population |
| African | 37 | 0.1% |
| Alaska Native | 4 | 0.0% |
| Aleut | 5 | 0.0% |
| American | 3,493 | 10.1% |
| Apache | 24 | 0.1% |
| Arab | 21 | 0.1% |
| Austrian | 51 | 0.2% |
| Belgian | 6 | 0.0% |
| Bhutanese | 21 | 0.1% |
| Blackfeet | 6 | 0.0% |
| Bolivian | 49 | 0.1% |
| Brazilian | 6 | 0.0% |
| British | 223 | 0.6% |
| Burmese | 55 | 0.2% |
| Canadian | 26 | 0.1% |
| Celtic | 13 | 0.0% |
| Central American | 653 | 1.9% |
| Central American Indian | 22 | 0.1% |
| Cherokee | 568 | 1.6% |
| Chickasaw | 78 | 0.2% |
| Choctaw | 98 | 0.3% |
| Colombian | 93 | 0.3% |
| Comanche | 21 | 0.1% |
| Creek | 64 | 0.2% |
| Cuban | 7 | 0.0% |
| Czech | 310 | 0.9% |
| Czechoslovakian | 13 | 0.0% |
| Danish | 286 | 0.8% |
| Delaware | 27 | 0.1% |
| Dominican | 83 | 0.2% |
| Dutch | 664 | 1.9% |
| Eastern European | 45 | 0.1% |
| Ecuadorian | 18 | 0.1% |
| Egyptian | 3 | 0.0% |
| English | 3,681 | 10.6% |
| European | 488 | 1.4% |
| Finnish | 15 | 0.0% |
| French | 537 | 1.5% |
| French Canadian | 17 | 0.1% |
| German | 6,365 | 18.4% |
| Greek | 3 | 0.0% |
| Guatemalan | 536 | 1.5% |
| Honduran | 30 | 0.1% |
| Hungarian | 68 | 0.2% |
| Indian (Asian) | 34 | 0.1% |
| Irish | 4,417 | 12.7% |
| Iroquois | 19 | 0.1% |
| Italian | 653 | 1.9% |
| Jamaican | 83 | 0.2% |
| Kiowa | 5 | 0.0% |
| Korean | 88 | 0.3% |
| Malaysian | 307 | 0.9% |
| Mexican | 2,765 | 8.0% |
| Navajo | 1 | 0.0% |
| Nigerian | 37 | 0.1% |
| Northern European | 45 | 0.1% |
| Norwegian | 94 | 0.3% |
| Osage | 43 | 0.1% |
| Pakistani | 16 | 0.1% |
| Pennsylvania German | 20 | 0.1% |
| Polish | 340 | 1.0% |
| Portuguese | 7 | 0.0% |
| Potawatomi | 49 | 0.1% |
| Puerto Rican | 60 | 0.2% |
| Russian | 177 | 0.5% |
| Salvadoran | 87 | 0.3% |
| Samoan | 11 | 0.0% |
| Scandinavian | 105 | 0.3% |
| Scotch-Irish | 282 | 0.8% |
| Scottish | 529 | 1.5% |
| Seminole | 3 | 0.0% |
| Sioux | 5 | 0.0% |
| Slavic | 18 | 0.1% |
| Slovak | 67 | 0.2% |
| Slovene | 2 | 0.0% |
| South American | 168 | 0.5% |
| Spaniard | 49 | 0.1% |
| Spanish | 193 | 0.6% |
| Sri Lankan | 259 | 0.7% |
| Subsaharan African | 74 | 0.2% |
| Swedish | 589 | 1.7% |
| Swiss | 92 | 0.3% |
| Syrian | 6 | 0.0% |
| Thai | 12 | 0.0% |
| Ukrainian | 11 | 0.0% |
| Uruguayan | 8 | 0.0% |
| Welsh | 236 | 0.7% |
| West Indian | 12 | 0.0% | View All 88 Rows |
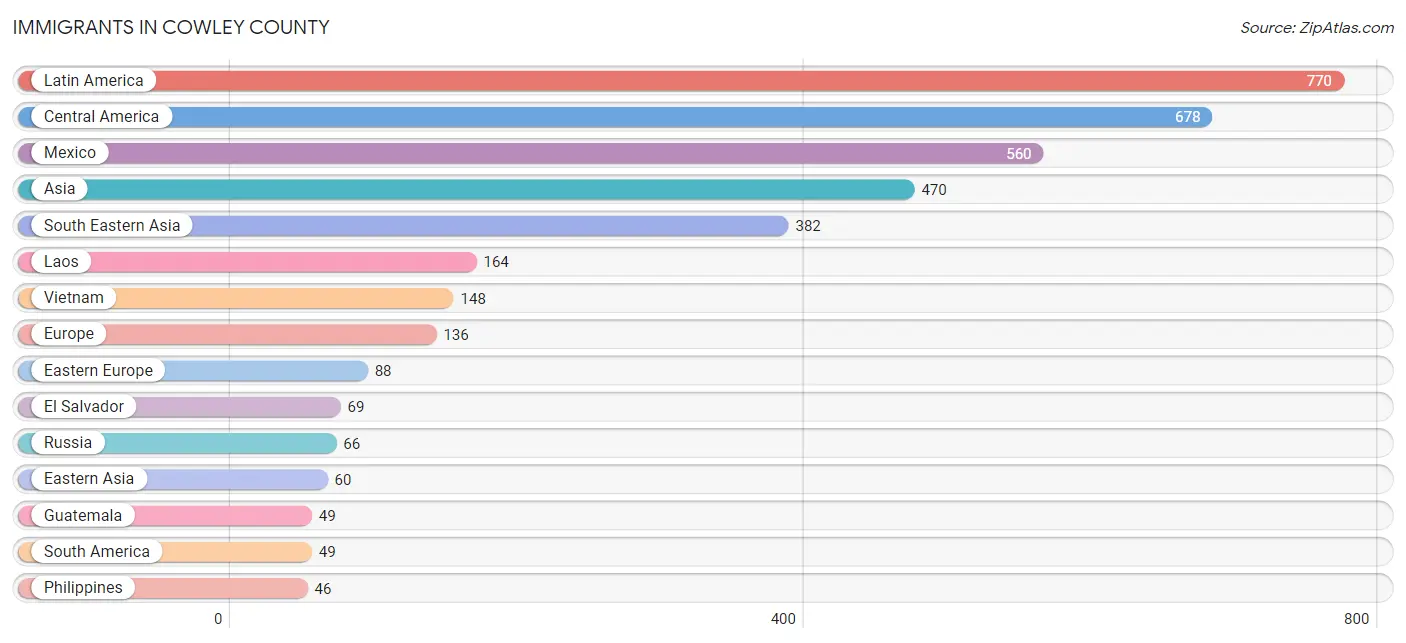
Immigrants in Cowley County
The most numerous immigrant groups reported in Cowley County came from Latin America (770 | 2.2%), Central America (678 | 2.0%), Mexico (560 | 1.6%), Asia (470 | 1.4%), and South Eastern Asia (382 | 1.1%), together accounting for 8.3% of all Cowley County residents.
| Immigration Origin | # Population | % Population |
| Asia | 470 | 1.4% |
| Australia | 4 | 0.0% |
| Bolivia | 21 | 0.1% |
| Brazil | 6 | 0.0% |
| Canada | 18 | 0.1% |
| Caribbean | 43 | 0.1% |
| Central America | 678 | 2.0% |
| China | 40 | 0.1% |
| Colombia | 14 | 0.0% |
| Eastern Asia | 60 | 0.2% |
| Eastern Europe | 88 | 0.3% |
| El Salvador | 69 | 0.2% |
| England | 2 | 0.0% |
| Europe | 136 | 0.4% |
| Germany | 16 | 0.1% |
| Guatemala | 49 | 0.1% |
| Hungary | 11 | 0.0% |
| India | 28 | 0.1% |
| Indonesia | 8 | 0.0% |
| Japan | 2 | 0.0% |
| Korea | 18 | 0.1% |
| Laos | 164 | 0.5% |
| Latin America | 770 | 2.2% |
| Mexico | 560 | 1.6% |
| Netherlands | 10 | 0.0% |
| Northern Europe | 22 | 0.1% |
| Oceania | 4 | 0.0% |
| Philippines | 46 | 0.1% |
| Russia | 66 | 0.2% |
| South America | 49 | 0.1% |
| South Central Asia | 28 | 0.1% |
| South Eastern Asia | 382 | 1.1% |
| Thailand | 16 | 0.1% |
| Trinidad and Tobago | 43 | 0.1% |
| Ukraine | 11 | 0.0% |
| Uruguay | 8 | 0.0% |
| Vietnam | 148 | 0.4% |
| Western Europe | 26 | 0.1% | View All 38 Rows |
Sex and Age in Cowley County
Sex and Age in Cowley County
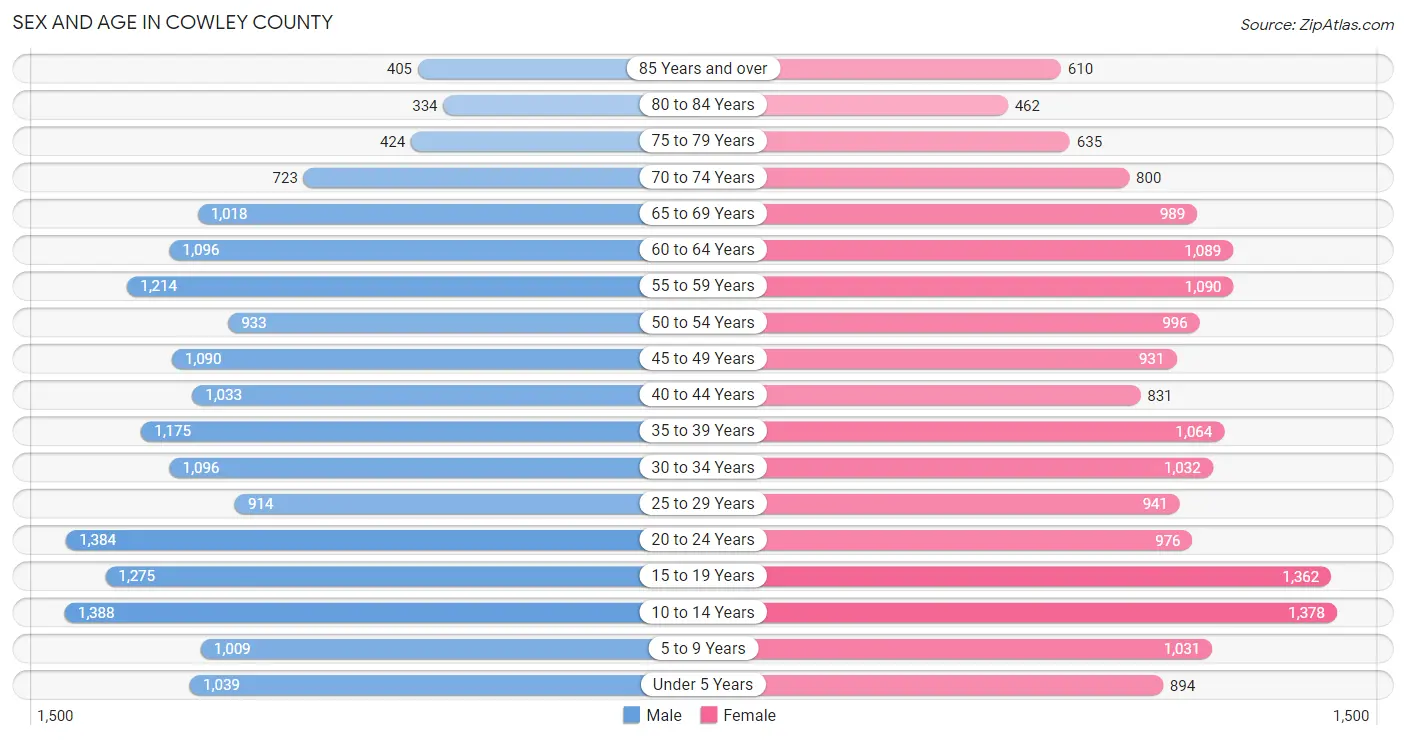
The most populous age groups in Cowley County are 10 to 14 Years (1,388 | 7.9%) for men and 10 to 14 Years (1,378 | 8.1%) for women.
| Age Bracket | Male | Female |
| Under 5 Years | 1,039 (5.9%) | 894 (5.2%) |
| 5 to 9 Years | 1,009 (5.8%) | 1,031 (6.0%) |
| 10 to 14 Years | 1,388 (7.9%) | 1,378 (8.1%) |
| 15 to 19 Years | 1,275 (7.3%) | 1,362 (8.0%) |
| 20 to 24 Years | 1,384 (7.9%) | 976 (5.7%) |
| 25 to 29 Years | 914 (5.2%) | 941 (5.5%) |
| 30 to 34 Years | 1,096 (6.2%) | 1,032 (6.0%) |
| 35 to 39 Years | 1,175 (6.7%) | 1,064 (6.2%) |
| 40 to 44 Years | 1,033 (5.9%) | 831 (4.9%) |
| 45 to 49 Years | 1,090 (6.2%) | 931 (5.4%) |
| 50 to 54 Years | 933 (5.3%) | 996 (5.8%) |
| 55 to 59 Years | 1,214 (6.9%) | 1,090 (6.4%) |
| 60 to 64 Years | 1,096 (6.2%) | 1,089 (6.4%) |
| 65 to 69 Years | 1,018 (5.8%) | 989 (5.8%) |
| 70 to 74 Years | 723 (4.1%) | 800 (4.7%) |
| 75 to 79 Years | 424 (2.4%) | 635 (3.7%) |
| 80 to 84 Years | 334 (1.9%) | 462 (2.7%) |
| 85 Years and over | 405 (2.3%) | 610 (3.6%) |
| Total | 17,550 (100.0%) | 17,111 (100.0%) |
Families and Households in Cowley County
Median Family Size in Cowley County
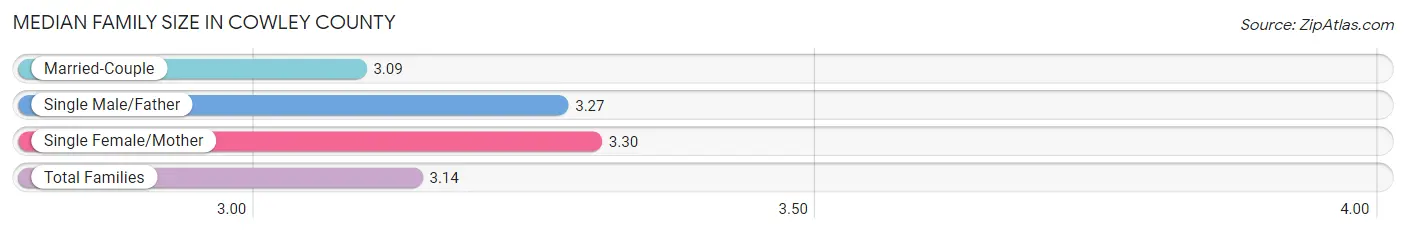
The median family size in Cowley County is 3.14 persons per family, with single female/mother families (1,546 | 18.9%) accounting for the largest median family size of 3.3 persons per family. On the other hand, married-couple families (5,994 | 73.4%) represent the smallest median family size with 3.09 persons per family.
| Family Type | # Families | Family Size |
| Married-Couple | 5,994 (73.4%) | 3.09 |
| Single Male/Father | 623 (7.6%) | 3.27 |
| Single Female/Mother | 1,546 (18.9%) | 3.30 |
| Total Families | 8,163 (100.0%) | 3.14 |
Median Household Size in Cowley County
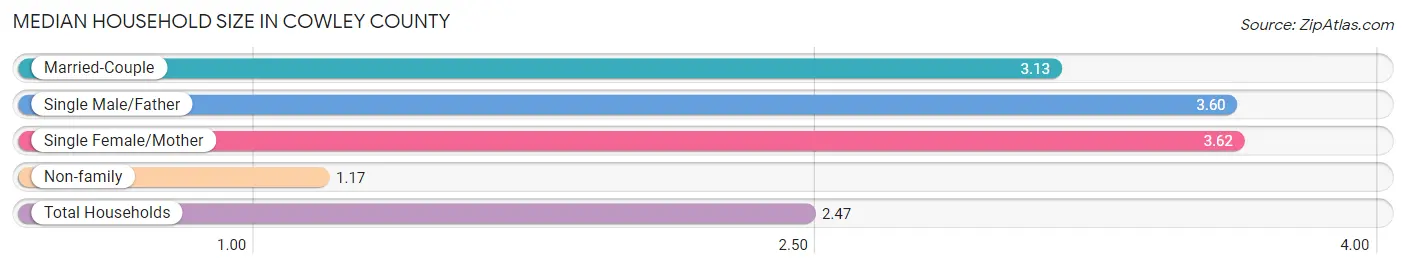
The median household size in Cowley County is 2.47 persons per household, with single female/mother households (1,546 | 11.8%) accounting for the largest median household size of 3.62 persons per household. non-family households (4,928 | 37.6%) represent the smallest median household size with 1.17 persons per household.
| Household Type | # Households | Household Size |
| Married-Couple | 5,994 (45.8%) | 3.13 |
| Single Male/Father | 623 (4.8%) | 3.60 |
| Single Female/Mother | 1,546 (11.8%) | 3.62 |
| Non-family | 4,928 (37.6%) | 1.17 |
| Total Households | 13,091 (100.0%) | 2.47 |
Household Size by Marriage Status in Cowley County
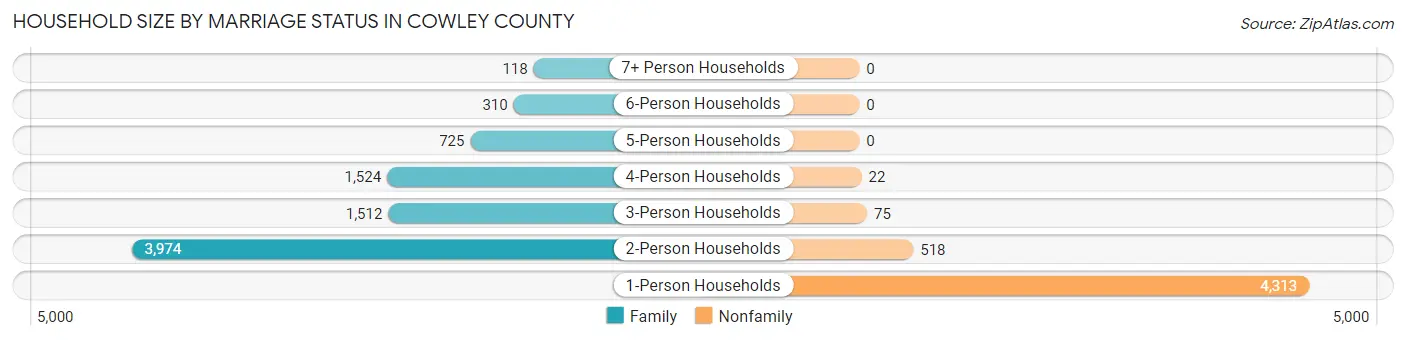
Out of a total of 13,091 households in Cowley County, 8,163 (62.4%) are family households, while 4,928 (37.6%) are nonfamily households. The most numerous type of family households are 2-person households, comprising 3,974, and the most common type of nonfamily households are 1-person households, comprising 4,313.
| Household Size | Family Households | Nonfamily Households |
| 1-Person Households | - | 4,313 (33.0%) |
| 2-Person Households | 3,974 (30.4%) | 518 (4.0%) |
| 3-Person Households | 1,512 (11.6%) | 75 (0.6%) |
| 4-Person Households | 1,524 (11.6%) | 22 (0.2%) |
| 5-Person Households | 725 (5.5%) | 0 (0.0%) |
| 6-Person Households | 310 (2.4%) | 0 (0.0%) |
| 7+ Person Households | 118 (0.9%) | 0 (0.0%) |
| Total | 8,163 (62.4%) | 4,928 (37.6%) |
Female Fertility in Cowley County
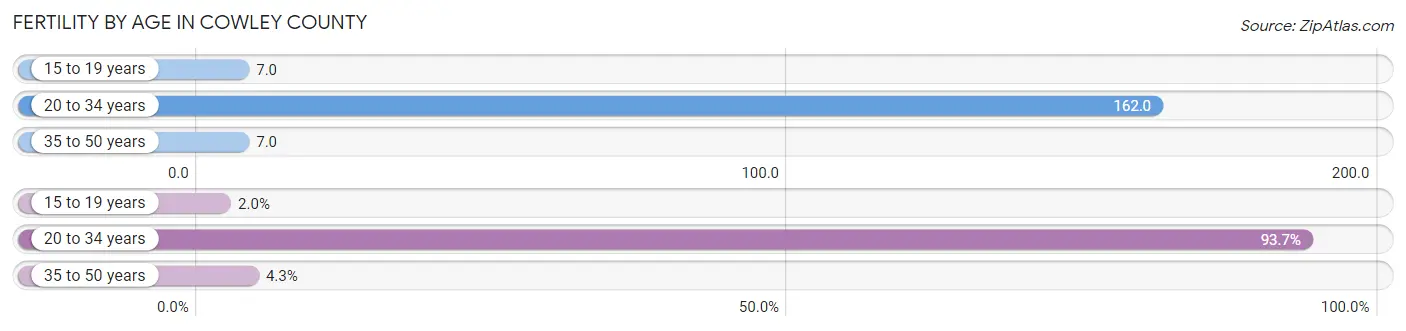
Fertility by Age in Cowley County
Average fertility rate in Cowley County is 69.0 births per 1,000 women. Women in the age bracket of 20 to 34 years have the highest fertility rate with 162.0 births per 1,000 women. Women in the age bracket of 20 to 34 years acount for 93.7% of all women with births.
| Age Bracket | Women with Births | Births / 1,000 Women |
| 15 to 19 years | 10 (2.0%) | 7.0 |
| 20 to 34 years | 477 (93.7%) | 162.0 |
| 35 to 50 years | 22 (4.3%) | 7.0 |
| Total | 509 (100.0%) | 69.0 |
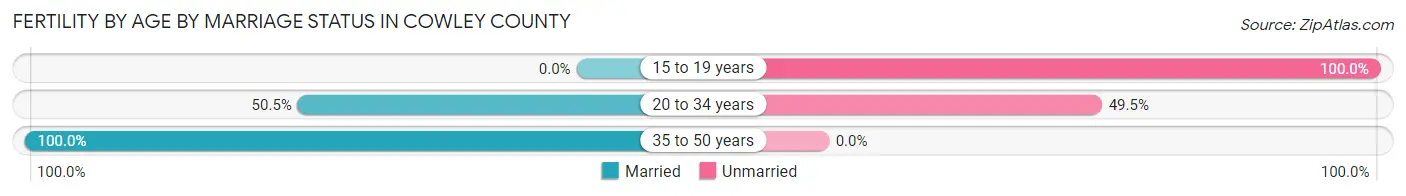
Fertility by Age by Marriage Status in Cowley County
51.7% of women with births (509) in Cowley County are married. The highest percentage of unmarried women with births falls into 15 to 19 years age bracket with 100.0% of them unmarried at the time of birth, while the lowest percentage of unmarried women with births belong to 35 to 50 years age bracket with 0.0% of them unmarried.
| Age Bracket | Married | Unmarried |
| 15 to 19 years | 0 (0.0%) | 10 (100.0%) |
| 20 to 34 years | 241 (50.5%) | 236 (49.5%) |
| 35 to 50 years | 22 (100.0%) | 0 (0.0%) |
| Total | 263 (51.7%) | 246 (48.3%) |
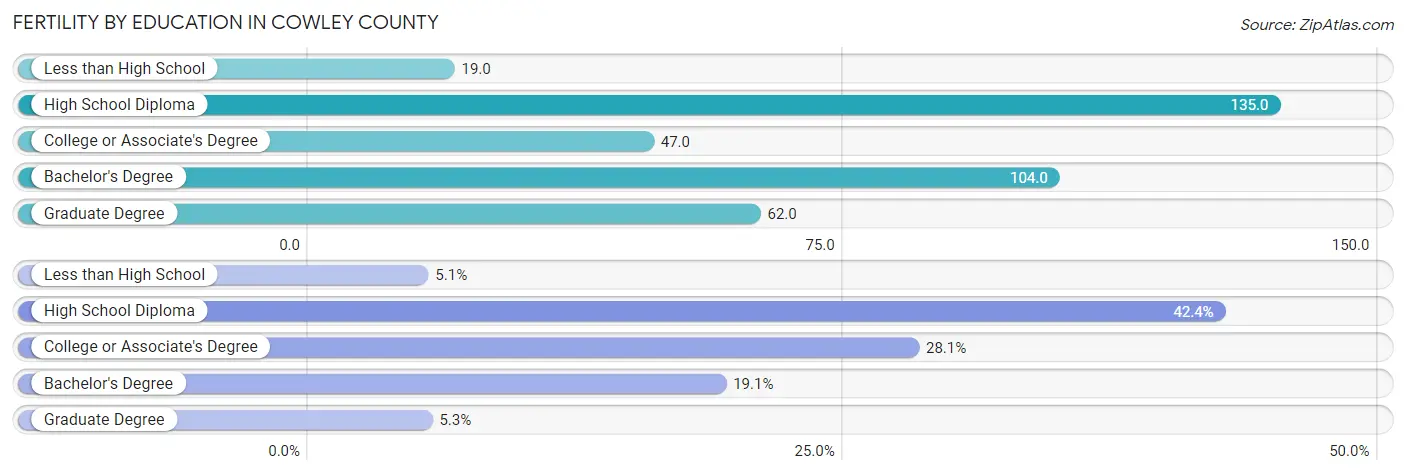
Fertility by Education in Cowley County
Average fertility rate in Cowley County is 69.0 births per 1,000 women. Women with the education attainment of high school diploma have the highest fertility rate of 135.0 births per 1,000 women, while women with the education attainment of less than high school have the lowest fertility at 19.0 births per 1,000 women. Women with the education attainment of high school diploma represent 42.4% of all women with births.
| Educational Attainment | Women with Births | Births / 1,000 Women |
| Less than High School | 26 (5.1%) | 19.0 |
| High School Diploma | 216 (42.4%) | 135.0 |
| College or Associate's Degree | 143 (28.1%) | 47.0 |
| Bachelor's Degree | 97 (19.1%) | 104.0 |
| Graduate Degree | 27 (5.3%) | 62.0 |
| Total | 509 (100.0%) | 69.0 |
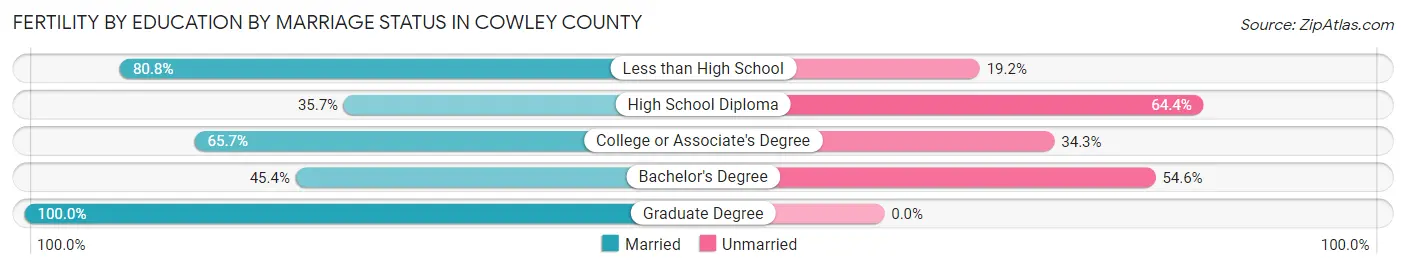
Fertility by Education by Marriage Status in Cowley County
48.3% of women with births in Cowley County are unmarried. Women with the educational attainment of graduate degree are most likely to be married with 100.0% of them married at childbirth, while women with the educational attainment of high school diploma are least likely to be married with 64.3% of them unmarried at childbirth.
| Educational Attainment | Married | Unmarried |
| Less than High School | 21 (80.8%) | 5 (19.2%) |
| High School Diploma | 77 (35.6%) | 139 (64.3%) |
| College or Associate's Degree | 94 (65.7%) | 49 (34.3%) |
| Bachelor's Degree | 44 (45.4%) | 53 (54.6%) |
| Graduate Degree | 27 (100.0%) | 0 (0.0%) |
| Total | 263 (51.7%) | 246 (48.3%) |
Income in Cowley County
Income Overview in Cowley County
Per Capita Income in Cowley County is $29,977, while median incomes of families and households are $71,825 and $55,726 respectively.
| Characteristic | Number | Measure |
| Per Capita Income | 34,661 | $29,977 |
| Median Family Income | 8,163 | $71,825 |
| Mean Family Income | 8,163 | $82,697 |
| Median Household Income | 13,091 | $55,726 |
| Mean Household Income | 13,091 | $74,917 |
| Income Deficit | 8,163 | $10,859 |
| Wage / Income Gap (%) | 34,661 | 25.16% |
| Wage / Income Gap ($) | 34,661 | 74.84¢ per $1 |
| Gini / Inequality Index | 34,661 | 0.46 |
Earnings by Sex in Cowley County
Average Earnings in Cowley County are $32,952, $37,039 for men and $27,721 for women, a difference of 25.2%.
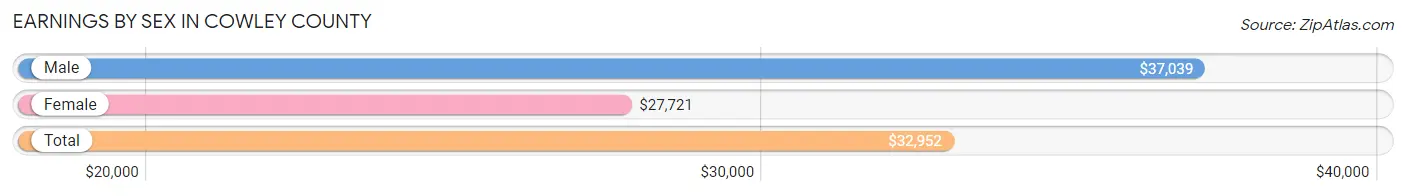
| Sex | Number | Average Earnings |
| Male | 9,590 (54.6%) | $37,039 |
| Female | 7,963 (45.4%) | $27,721 |
| Total | 17,553 (100.0%) | $32,952 |
Earnings by Sex by Income Bracket in Cowley County
The most common earnings brackets in Cowley County are $75,000 to $99,999 for men (1,094 | 11.4%) and $25,000 to $29,999 for women (670 | 8.4%).
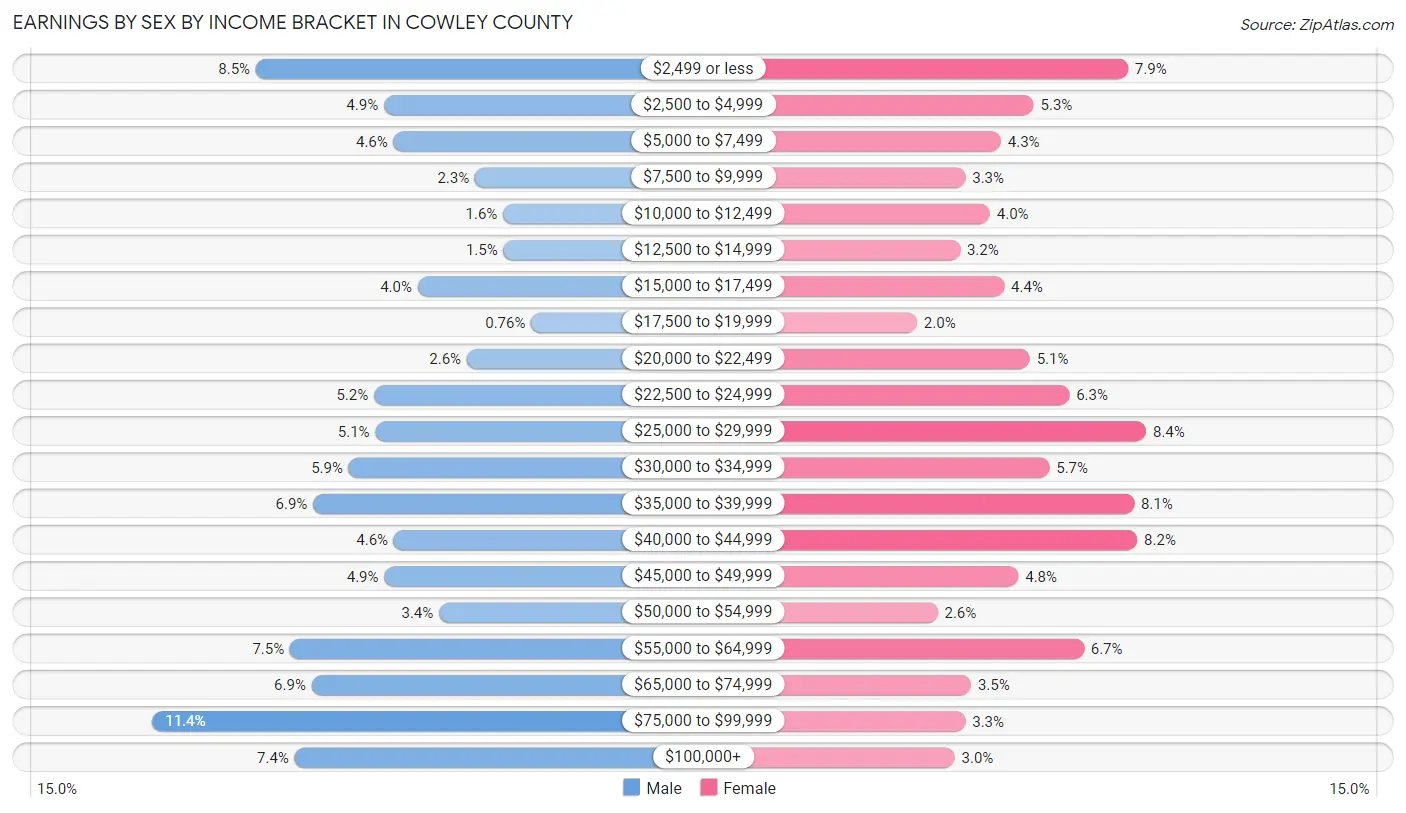
| Income | Male | Female |
| $2,499 or less | 815 (8.5%) | 629 (7.9%) |
| $2,500 to $4,999 | 470 (4.9%) | 418 (5.2%) |
| $5,000 to $7,499 | 444 (4.6%) | 345 (4.3%) |
| $7,500 to $9,999 | 224 (2.3%) | 265 (3.3%) |
| $10,000 to $12,499 | 149 (1.5%) | 320 (4.0%) |
| $12,500 to $14,999 | 148 (1.5%) | 253 (3.2%) |
| $15,000 to $17,499 | 379 (4.0%) | 352 (4.4%) |
| $17,500 to $19,999 | 73 (0.8%) | 157 (2.0%) |
| $20,000 to $22,499 | 246 (2.6%) | 409 (5.1%) |
| $22,500 to $24,999 | 497 (5.2%) | 498 (6.2%) |
| $25,000 to $29,999 | 493 (5.1%) | 670 (8.4%) |
| $30,000 to $34,999 | 565 (5.9%) | 453 (5.7%) |
| $35,000 to $39,999 | 661 (6.9%) | 643 (8.1%) |
| $40,000 to $44,999 | 443 (4.6%) | 650 (8.2%) |
| $45,000 to $49,999 | 469 (4.9%) | 384 (4.8%) |
| $50,000 to $54,999 | 321 (3.4%) | 203 (2.5%) |
| $55,000 to $64,999 | 723 (7.5%) | 530 (6.7%) |
| $65,000 to $74,999 | 665 (6.9%) | 278 (3.5%) |
| $75,000 to $99,999 | 1,094 (11.4%) | 265 (3.3%) |
| $100,000+ | 711 (7.4%) | 241 (3.0%) |
| Total | 9,590 (100.0%) | 7,963 (100.0%) |
Earnings by Sex by Educational Attainment in Cowley County
Average earnings in Cowley County are $44,690 for men and $33,498 for women, a difference of 25.0%. Men with an educational attainment of graduate degree enjoy the highest average annual earnings of $72,581, while those with less than high school education earn the least with $30,625. Women with an educational attainment of graduate degree earn the most with the average annual earnings of $56,543, while those with high school diploma education have the smallest earnings of $25,395.
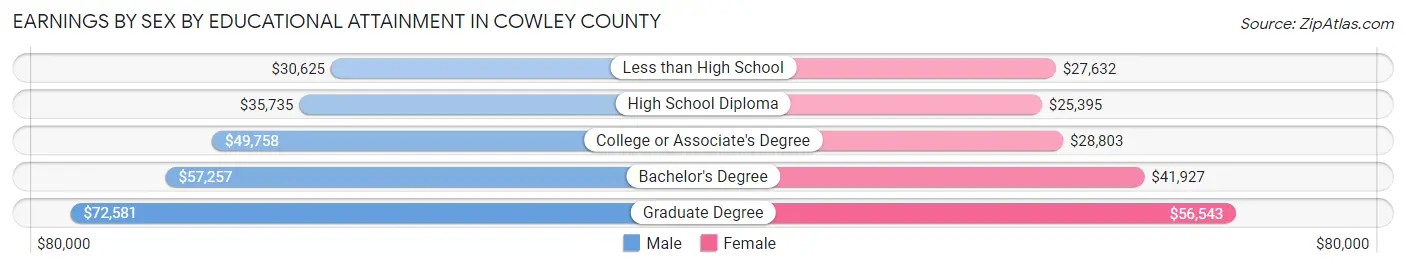
| Educational Attainment | Male Income | Female Income |
| Less than High School | $30,625 | $27,632 |
| High School Diploma | $35,735 | $25,395 |
| College or Associate's Degree | $49,758 | $28,803 |
| Bachelor's Degree | $57,257 | $41,927 |
| Graduate Degree | $72,581 | $56,543 |
| Total | $44,690 | $33,498 |
Family Income in Cowley County
Family Income Brackets in Cowley County
According to the Cowley County family income data, there are 1,804 families falling into the $100,000 to $149,999 income range, which is the most common income bracket and makes up 22.1% of all families. Conversely, the $10,000 to $14,999 income bracket is the least frequent group with only 180 families (2.2%) belonging to this category.
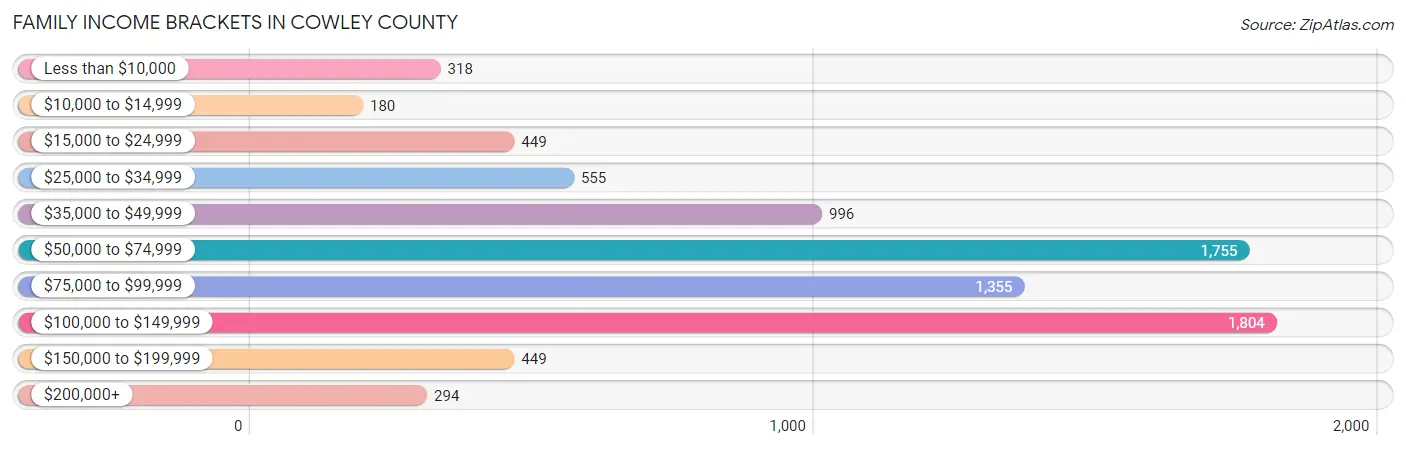
| Income Bracket | # Families | % Families |
| Less than $10,000 | 318 | 3.9% |
| $10,000 to $14,999 | 180 | 2.2% |
| $15,000 to $24,999 | 449 | 5.5% |
| $25,000 to $34,999 | 555 | 6.8% |
| $35,000 to $49,999 | 996 | 12.2% |
| $50,000 to $74,999 | 1,755 | 21.5% |
| $75,000 to $99,999 | 1,355 | 16.6% |
| $100,000 to $149,999 | 1,804 | 22.1% |
| $150,000 to $199,999 | 449 | 5.5% |
| $200,000+ | 294 | 3.6% |
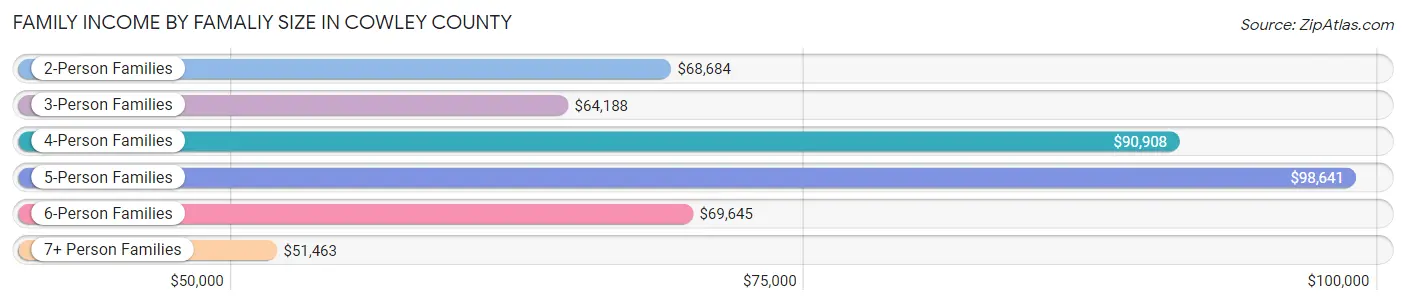
Family Income by Famaliy Size in Cowley County
5-person families (663 | 8.1%) account for the highest median family income in Cowley County with $98,641 per family, while 2-person families (4,156 | 50.9%) have the highest median income of $34,342 per family member.
| Income Bracket | # Families | Median Income |
| 2-Person Families | 4,156 (50.9%) | $68,684 |
| 3-Person Families | 1,653 (20.3%) | $64,188 |
| 4-Person Families | 1,365 (16.7%) | $90,908 |
| 5-Person Families | 663 (8.1%) | $98,641 |
| 6-Person Families | 235 (2.9%) | $69,645 |
| 7+ Person Families | 91 (1.1%) | $51,463 |
| Total | 8,163 (100.0%) | $71,825 |
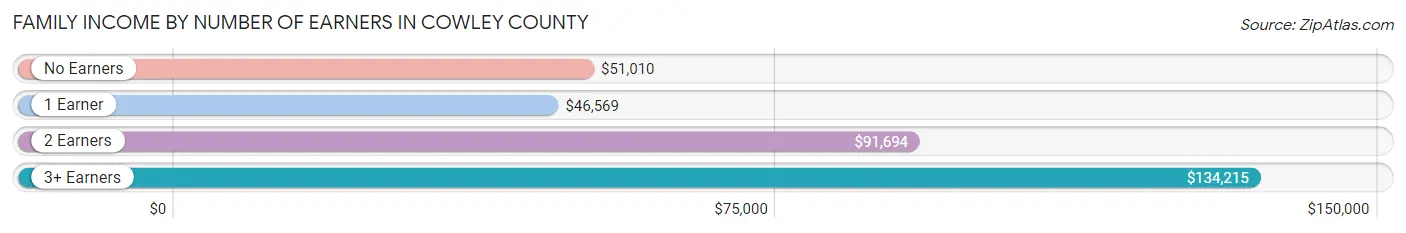
Family Income by Number of Earners in Cowley County
The median family income in Cowley County is $71,825, with families comprising 3+ earners (705) having the highest median family income of $134,215, while families with 1 earner (2,826) have the lowest median family income of $46,569, accounting for 8.6% and 34.6% of families, respectively.
| Number of Earners | # Families | Median Income |
| No Earners | 1,227 (15.0%) | $51,010 |
| 1 Earner | 2,826 (34.6%) | $46,569 |
| 2 Earners | 3,405 (41.7%) | $91,694 |
| 3+ Earners | 705 (8.6%) | $134,215 |
| Total | 8,163 (100.0%) | $71,825 |
Household Income in Cowley County
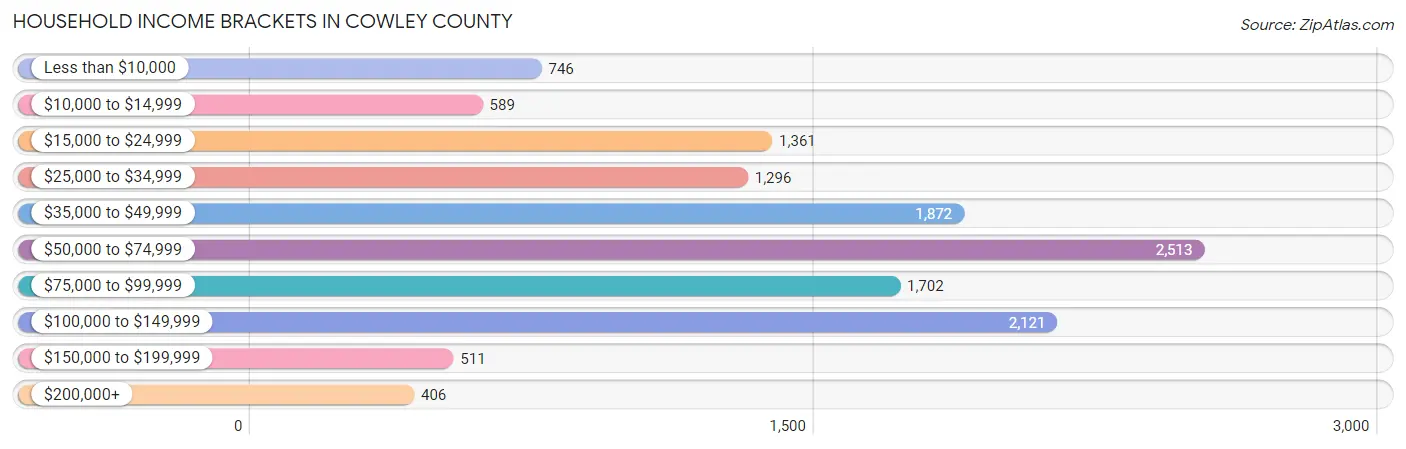
Household Income Brackets in Cowley County
With 2,513 households falling in the category, the $50,000 to $74,999 income range is the most frequent in Cowley County, accounting for 19.2% of all households. In contrast, only 406 households (3.1%) fall into the $200,000+ income bracket, making it the least populous group.
| Income Bracket | # Households | % Households |
| Less than $10,000 | 746 | 5.7% |
| $10,000 to $14,999 | 589 | 4.5% |
| $15,000 to $24,999 | 1,361 | 10.4% |
| $25,000 to $34,999 | 1,296 | 9.9% |
| $35,000 to $49,999 | 1,872 | 14.3% |
| $50,000 to $74,999 | 2,513 | 19.2% |
| $75,000 to $99,999 | 1,702 | 13.0% |
| $100,000 to $149,999 | 2,121 | 16.2% |
| $150,000 to $199,999 | 511 | 3.9% |
| $200,000+ | 406 | 3.1% |
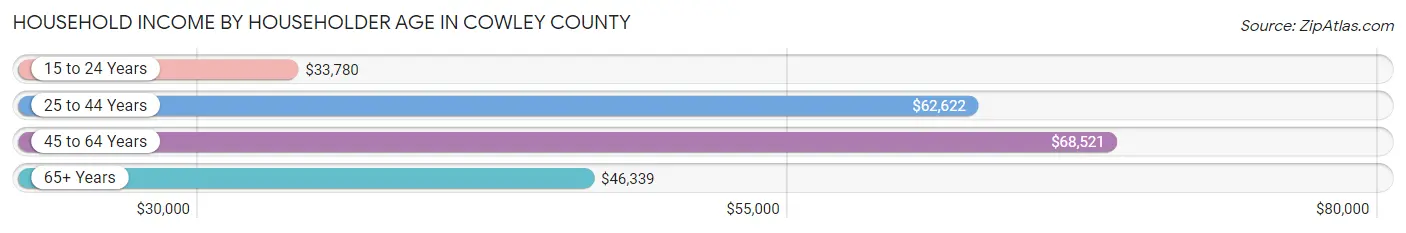
Household Income by Householder Age in Cowley County
The median household income in Cowley County is $55,726, with the highest median household income of $68,521 found in the 45 to 64 years age bracket for the primary householder. A total of 4,887 households (37.3%) fall into this category. Meanwhile, the 15 to 24 years age bracket for the primary householder has the lowest median household income of $33,780, with 631 households (4.8%) in this group.
| Income Bracket | # Households | Median Income |
| 15 to 24 Years | 631 (4.8%) | $33,780 |
| 25 to 44 Years | 3,578 (27.3%) | $62,622 |
| 45 to 64 Years | 4,887 (37.3%) | $68,521 |
| 65+ Years | 3,995 (30.5%) | $46,339 |
| Total | 13,091 (100.0%) | $55,726 |
Poverty in Cowley County
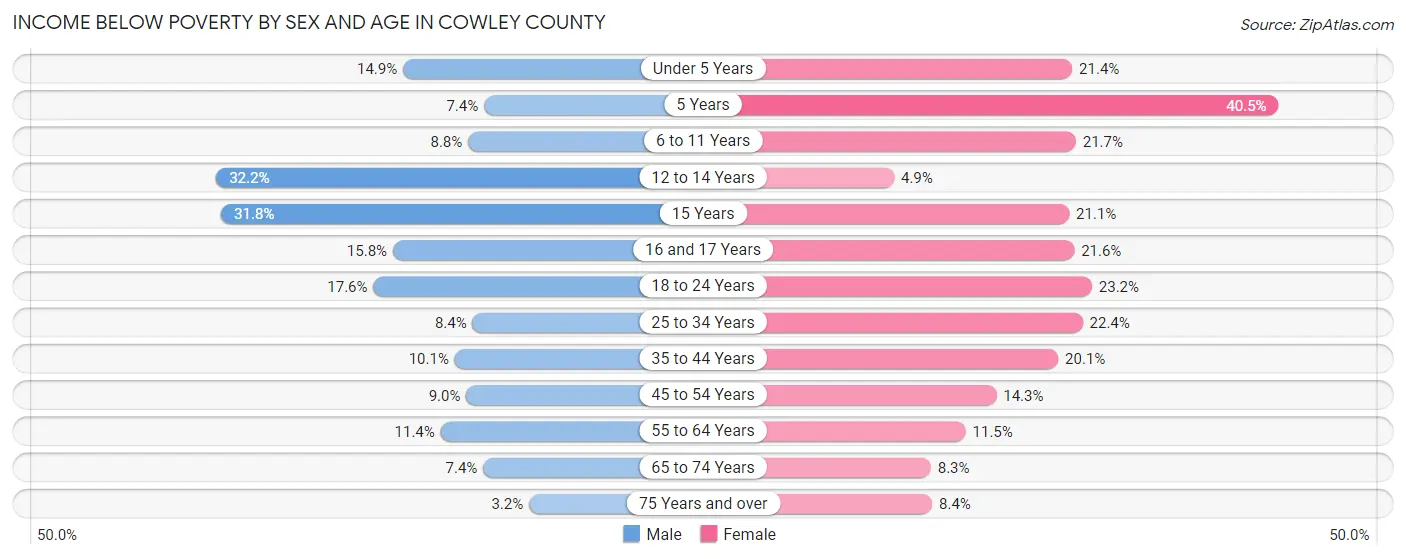
Income Below Poverty by Sex and Age in Cowley County
With 11.6% poverty level for males and 16.2% for females among the residents of Cowley County, 12 to 14 year old males and 5 year old females are the most vulnerable to poverty, with 240 males (32.2%) and 109 females (40.5%) in their respective age groups living below the poverty level.
| Age Bracket | Male | Female |
| Under 5 Years | 143 (14.9%) | 174 (21.4%) |
| 5 Years | 12 (7.4%) | 109 (40.5%) |
| 6 to 11 Years | 126 (8.8%) | 285 (21.7%) |
| 12 to 14 Years | 240 (32.2%) | 39 (4.9%) |
| 15 Years | 74 (31.8%) | 46 (21.1%) |
| 16 and 17 Years | 72 (15.8%) | 107 (21.6%) |
| 18 to 24 Years | 252 (17.6%) | 286 (23.2%) |
| 25 to 34 Years | 153 (8.4%) | 441 (22.4%) |
| 35 to 44 Years | 199 (10.1%) | 380 (20.1%) |
| 45 to 54 Years | 168 (9.0%) | 276 (14.3%) |
| 55 to 64 Years | 258 (11.4%) | 250 (11.5%) |
| 65 to 74 Years | 122 (7.4%) | 145 (8.3%) |
| 75 Years and over | 31 (3.2%) | 131 (8.4%) |
| Total | 1,850 (11.6%) | 2,669 (16.2%) |
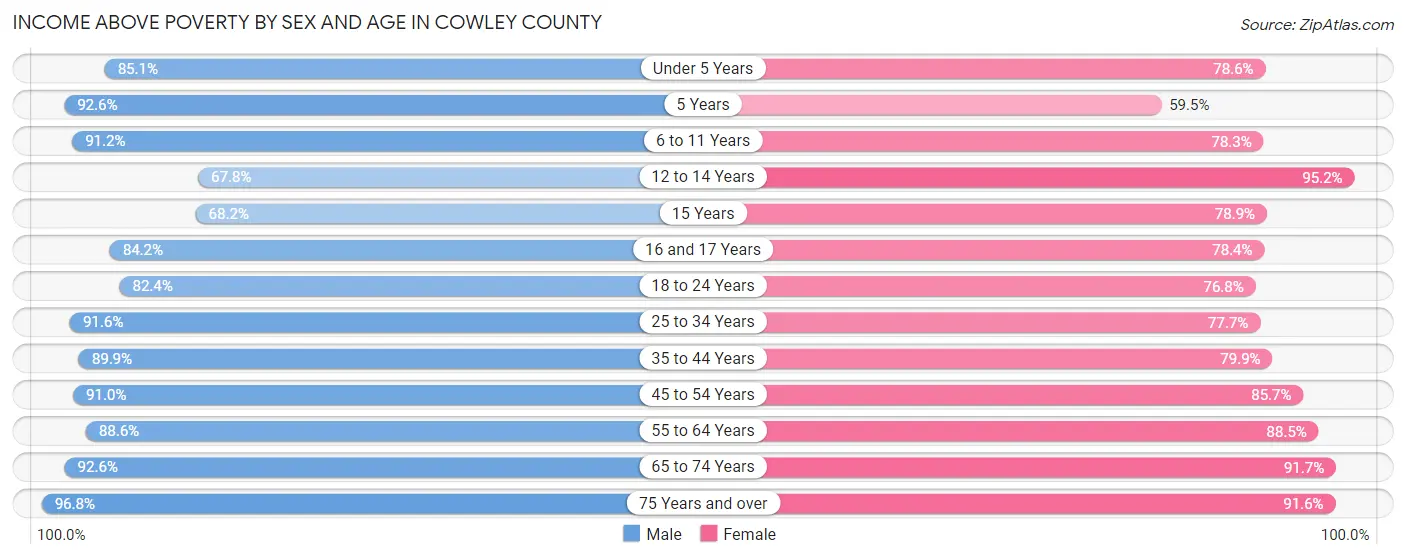
Income Above Poverty by Sex and Age in Cowley County
According to the poverty statistics in Cowley County, males aged 75 years and over and females aged 12 to 14 years are the age groups that are most secure financially, with 96.8% of males and 95.2% of females in these age groups living above the poverty line.
| Age Bracket | Male | Female |
| Under 5 Years | 818 (85.1%) | 640 (78.6%) |
| 5 Years | 151 (92.6%) | 160 (59.5%) |
| 6 to 11 Years | 1,299 (91.2%) | 1,027 (78.3%) |
| 12 to 14 Years | 505 (67.8%) | 765 (95.2%) |
| 15 Years | 159 (68.2%) | 172 (78.9%) |
| 16 and 17 Years | 383 (84.2%) | 389 (78.4%) |
| 18 to 24 Years | 1,177 (82.4%) | 946 (76.8%) |
| 25 to 34 Years | 1,662 (91.6%) | 1,532 (77.6%) |
| 35 to 44 Years | 1,776 (89.9%) | 1,512 (79.9%) |
| 45 to 54 Years | 1,697 (91.0%) | 1,649 (85.7%) |
| 55 to 64 Years | 2,007 (88.6%) | 1,926 (88.5%) |
| 65 to 74 Years | 1,517 (92.6%) | 1,610 (91.7%) |
| 75 Years and over | 944 (96.8%) | 1,433 (91.6%) |
| Total | 14,095 (88.4%) | 13,761 (83.8%) |
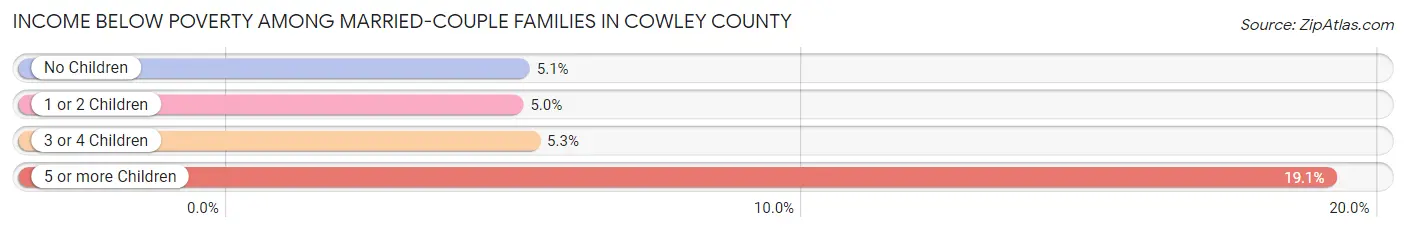
Income Below Poverty Among Married-Couple Families in Cowley County
The poverty statistics for married-couple families in Cowley County show that 5.2% or 313 of the total 5,994 families live below the poverty line. Families with 5 or more children have the highest poverty rate of 19.1%, comprising of 13 families. On the other hand, families with 1 or 2 children have the lowest poverty rate of 5.0%, which includes 88 families.
| Children | Above Poverty | Below Poverty |
| No Children | 3,493 (94.9%) | 187 (5.1%) |
| 1 or 2 Children | 1,683 (95.0%) | 88 (5.0%) |
| 3 or 4 Children | 450 (94.7%) | 25 (5.3%) |
| 5 or more Children | 55 (80.9%) | 13 (19.1%) |
| Total | 5,681 (94.8%) | 313 (5.2%) |
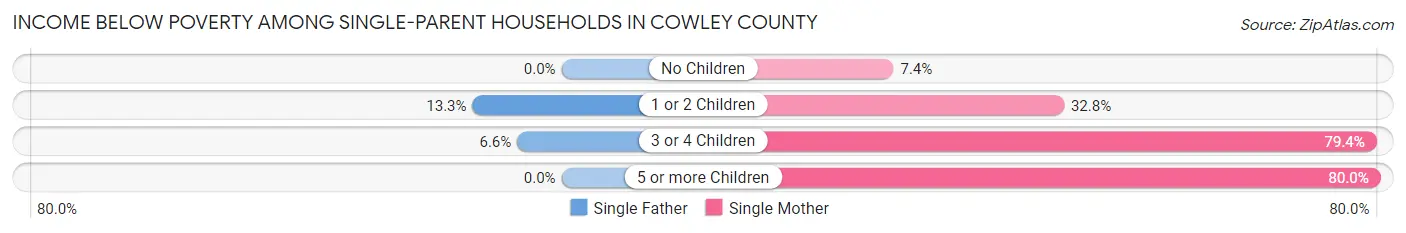
Income Below Poverty Among Single-Parent Households in Cowley County
According to the poverty data in Cowley County, 9.5% or 59 single-father households and 34.2% or 529 single-mother households are living below the poverty line. Among single-father households, those with 1 or 2 children have the highest poverty rate, with 51 households (13.3%) experiencing poverty. Likewise, among single-mother households, those with 5 or more children have the highest poverty rate, with 28 households (80.0%) falling below the poverty line.
| Children | Single Father | Single Mother |
| No Children | 0 (0.0%) | 31 (7.4%) |
| 1 or 2 Children | 51 (13.3%) | 281 (32.8%) |
| 3 or 4 Children | 8 (6.6%) | 189 (79.4%) |
| 5 or more Children | 0 (0.0%) | 28 (80.0%) |
| Total | 59 (9.5%) | 529 (34.2%) |
Income Below Poverty Among Married-Couple vs Single-Parent Households in Cowley County
The poverty data for Cowley County shows that 313 of the married-couple family households (5.2%) and 588 of the single-parent households (27.1%) are living below the poverty level. Within the married-couple family households, those with 5 or more children have the highest poverty rate, with 13 households (19.1%) falling below the poverty line. Among the single-parent households, those with 5 or more children have the highest poverty rate, with 28 household (80.0%) living below poverty.
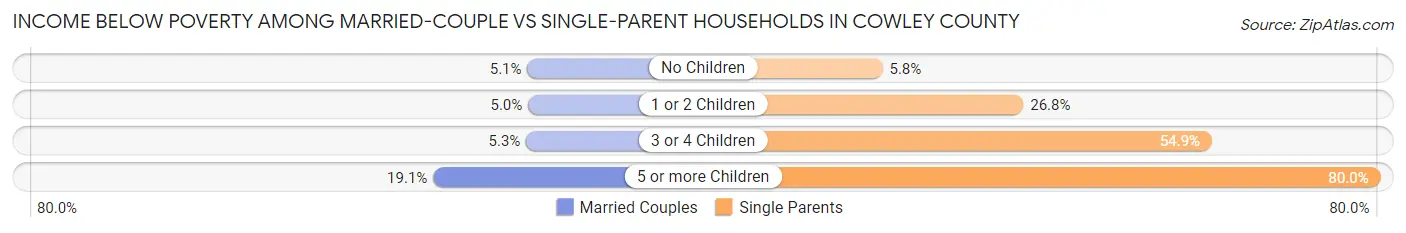
| Children | Married-Couple Families | Single-Parent Households |
| No Children | 187 (5.1%) | 31 (5.8%) |
| 1 or 2 Children | 88 (5.0%) | 332 (26.8%) |
| 3 or 4 Children | 25 (5.3%) | 197 (54.9%) |
| 5 or more Children | 13 (19.1%) | 28 (80.0%) |
| Total | 313 (5.2%) | 588 (27.1%) |
Employment Characteristics in Cowley County
Employment by Class of Employer in Cowley County
Among the 15,037 employed individuals in Cowley County, private company employees (8,847 | 58.8%), local government employees (1,939 | 12.9%), and not-for-profit organizations (1,541 | 10.2%) make up the most common classes of employment.
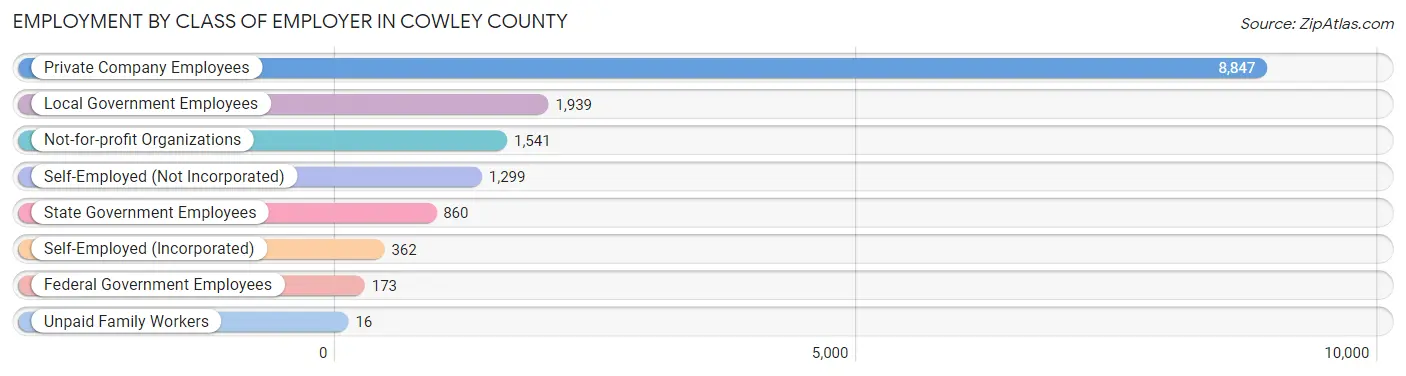
| Employer Class | # Employees | % Employees |
| Private Company Employees | 8,847 | 58.8% |
| Self-Employed (Incorporated) | 362 | 2.4% |
| Self-Employed (Not Incorporated) | 1,299 | 8.6% |
| Not-for-profit Organizations | 1,541 | 10.2% |
| Local Government Employees | 1,939 | 12.9% |
| State Government Employees | 860 | 5.7% |
| Federal Government Employees | 173 | 1.1% |
| Unpaid Family Workers | 16 | 0.1% |
| Total | 15,037 | 100.0% |
Employment Status by Age in Cowley County
According to the labor force statistics for Cowley County, out of the total population over 16 years of age (27,471), 58.7% or 16,125 individuals are in the labor force, with 5.3% or 855 of them unemployed. The age group with the highest labor force participation rate is 30 to 34 years, with 82.6% or 1,758 individuals in the labor force. Within the labor force, the 16 to 19 years age range has the highest percentage of unemployed individuals, with 12.5% or 143 of them being unemployed.
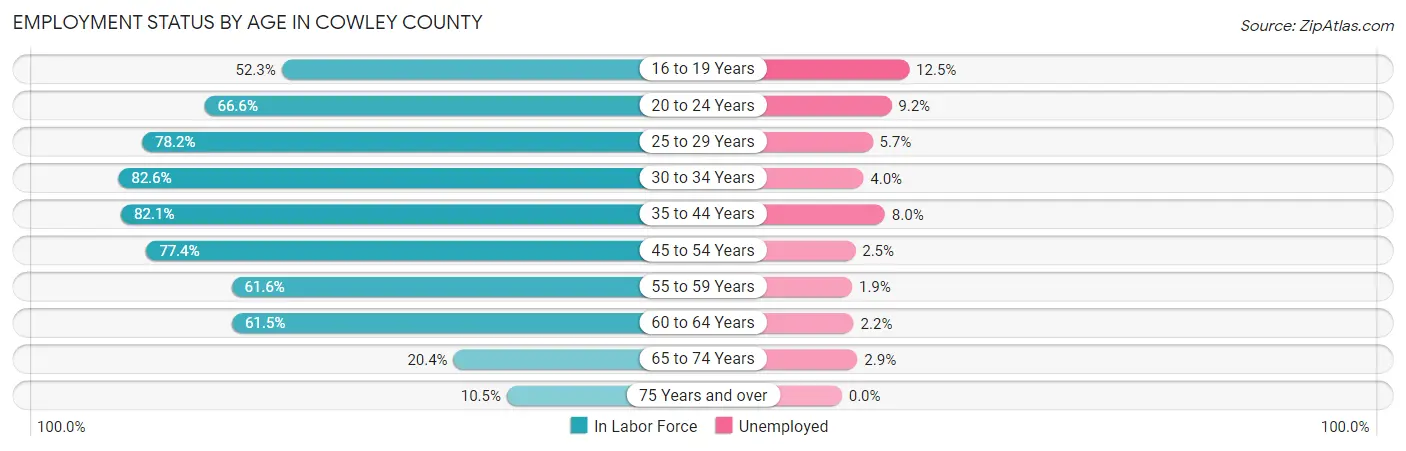
| Age Bracket | In Labor Force | Unemployed |
| 16 to 19 Years | 1,143 (52.3%) | 143 (12.5%) |
| 20 to 24 Years | 1,572 (66.6%) | 145 (9.2%) |
| 25 to 29 Years | 1,451 (78.2%) | 83 (5.7%) |
| 30 to 34 Years | 1,758 (82.6%) | 70 (4.0%) |
| 35 to 44 Years | 3,369 (82.1%) | 270 (8.0%) |
| 45 to 54 Years | 3,057 (77.4%) | 76 (2.5%) |
| 55 to 59 Years | 1,419 (61.6%) | 27 (1.9%) |
| 60 to 64 Years | 1,344 (61.5%) | 30 (2.2%) |
| 65 to 74 Years | 720 (20.4%) | 21 (2.9%) |
| 75 Years and over | 301 (10.5%) | 0 (0.0%) |
| Total | 16,125 (58.7%) | 855 (5.3%) |
Employment Status by Educational Attainment in Cowley County
According to labor force statistics for Cowley County, 75.0% of individuals (12,394) out of the total population between 25 and 64 years of age (16,525) are in the labor force, with 4.5% or 558 of them being unemployed. The group with the highest labor force participation rate are those with the educational attainment of bachelor's degree or higher, with 87.2% or 3,492 individuals in the labor force. Within the labor force, individuals with less than high school education have the highest percentage of unemployment, with 10.2% or 87 of them being unemployed.
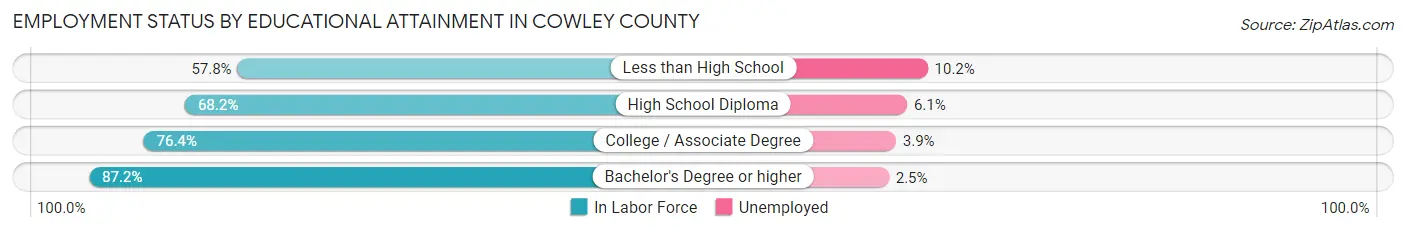
| Educational Attainment | In Labor Force | Unemployed |
| Less than High School | 853 (57.8%) | 150 (10.2%) |
| High School Diploma | 3,169 (68.2%) | 283 (6.1%) |
| College / Associate Degree | 4,889 (76.4%) | 250 (3.9%) |
| Bachelor's Degree or higher | 3,492 (87.2%) | 100 (2.5%) |
| Total | 12,394 (75.0%) | 744 (4.5%) |
Employment Occupations by Sex in Cowley County
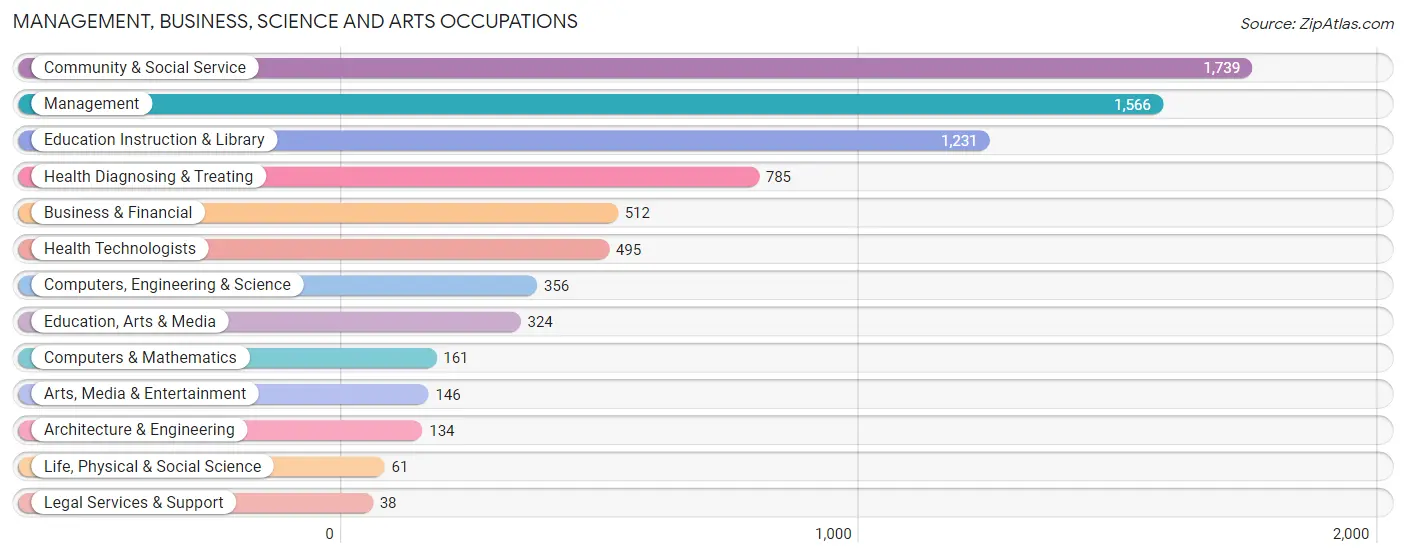
Management, Business, Science and Arts Occupations
The most common Management, Business, Science and Arts occupations in Cowley County are Community & Social Service (1,739 | 11.4%), Management (1,566 | 10.2%), Education Instruction & Library (1,231 | 8.1%), Health Diagnosing & Treating (785 | 5.1%), and Business & Financial (512 | 3.4%).
Management, Business, Science and Arts Occupations by Sex
Within the Management, Business, Science and Arts occupations in Cowley County, the most male-oriented occupations are Computers & Mathematics (83.2%), Architecture & Engineering (76.9%), and Computers, Engineering & Science (74.2%), while the most female-oriented occupations are Health Diagnosing & Treating (84.1%), Education, Arts & Media (79.9%), and Health Technologists (77.4%).
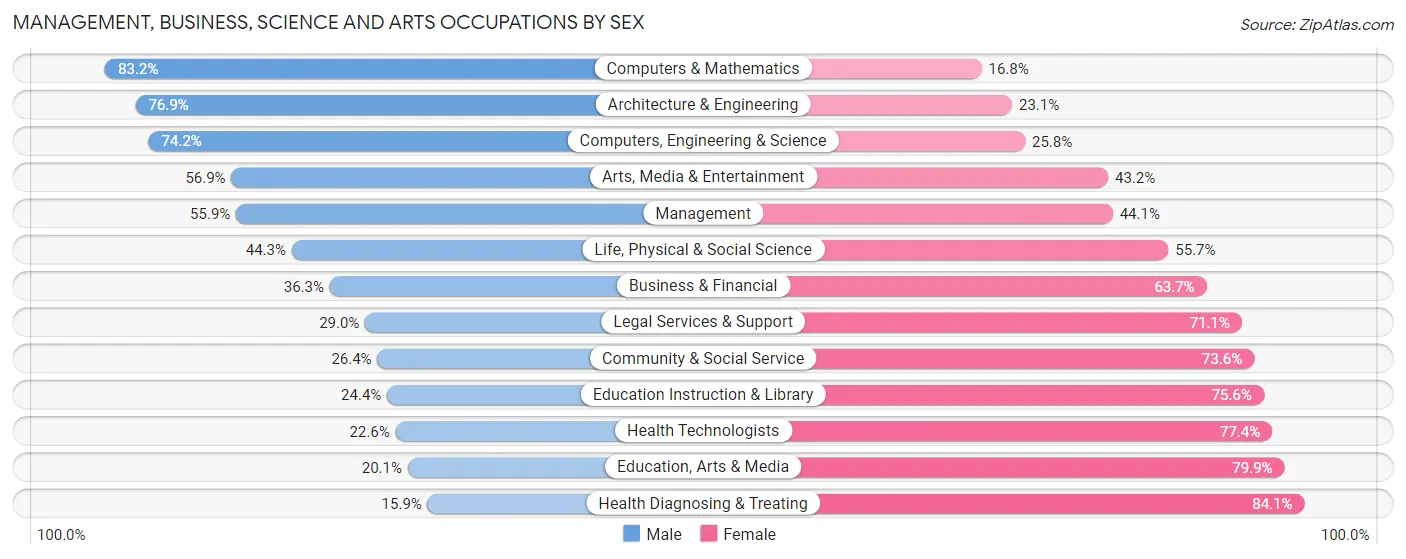
| Occupation | Male | Female |
| Management | 875 (55.9%) | 691 (44.1%) |
| Business & Financial | 186 (36.3%) | 326 (63.7%) |
| Computers, Engineering & Science | 264 (74.2%) | 92 (25.8%) |
| Computers & Mathematics | 134 (83.2%) | 27 (16.8%) |
| Architecture & Engineering | 103 (76.9%) | 31 (23.1%) |
| Life, Physical & Social Science | 27 (44.3%) | 34 (55.7%) |
| Community & Social Service | 459 (26.4%) | 1,280 (73.6%) |
| Education, Arts & Media | 65 (20.1%) | 259 (79.9%) |
| Legal Services & Support | 11 (28.9%) | 27 (71.1%) |
| Education Instruction & Library | 300 (24.4%) | 931 (75.6%) |
| Arts, Media & Entertainment | 83 (56.9%) | 63 (43.1%) |
| Health Diagnosing & Treating | 125 (15.9%) | 660 (84.1%) |
| Health Technologists | 112 (22.6%) | 383 (77.4%) |
| Total (Category) | 1,909 (38.5%) | 3,049 (61.5%) |
| Total (Overall) | 8,133 (53.2%) | 7,140 (46.8%) |
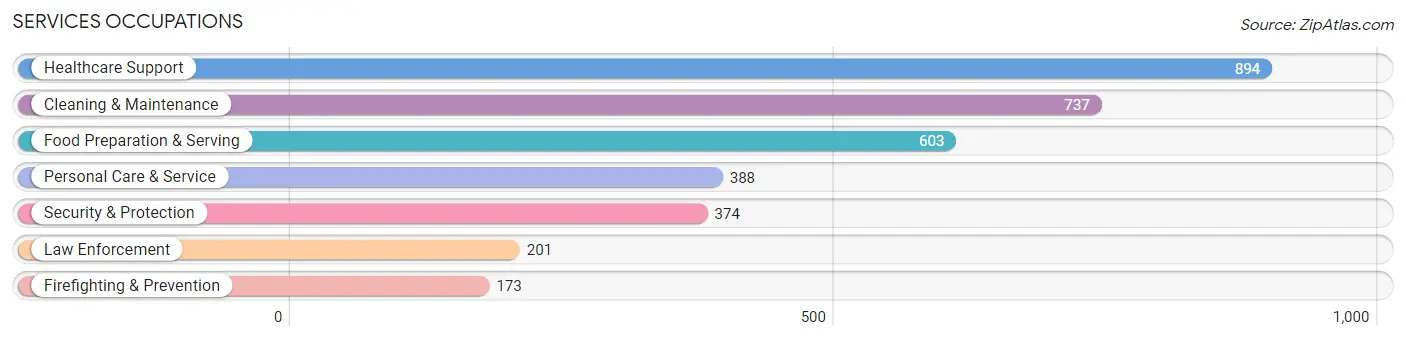
Services Occupations
The most common Services occupations in Cowley County are Healthcare Support (894 | 5.9%), Cleaning & Maintenance (737 | 4.8%), Food Preparation & Serving (603 | 4.0%), Personal Care & Service (388 | 2.5%), and Security & Protection (374 | 2.5%).
Services Occupations by Sex
Within the Services occupations in Cowley County, the most male-oriented occupations are Law Enforcement (84.6%), Security & Protection (73.8%), and Food Preparation & Serving (63.2%), while the most female-oriented occupations are Healthcare Support (80.5%), Personal Care & Service (75.3%), and Cleaning & Maintenance (54.0%).
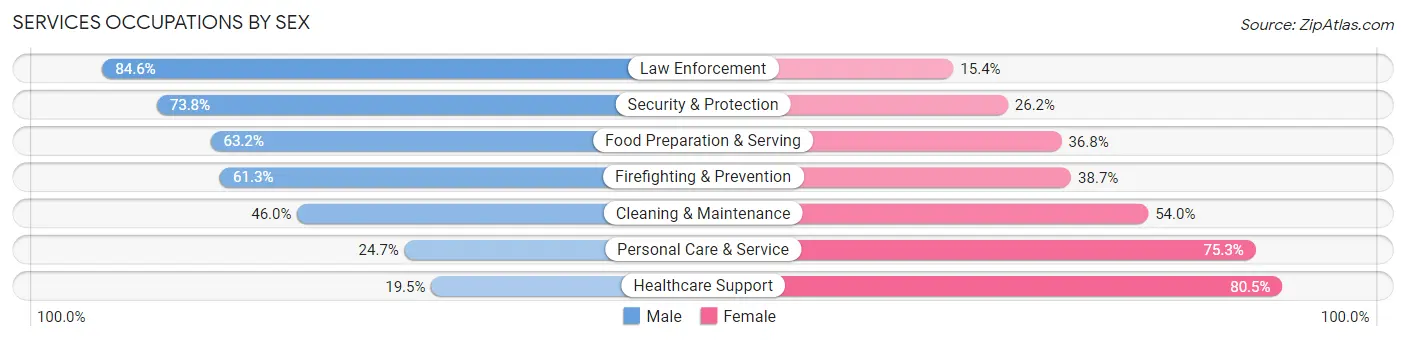
| Occupation | Male | Female |
| Healthcare Support | 174 (19.5%) | 720 (80.5%) |
| Security & Protection | 276 (73.8%) | 98 (26.2%) |
| Firefighting & Prevention | 106 (61.3%) | 67 (38.7%) |
| Law Enforcement | 170 (84.6%) | 31 (15.4%) |
| Food Preparation & Serving | 381 (63.2%) | 222 (36.8%) |
| Cleaning & Maintenance | 339 (46.0%) | 398 (54.0%) |
| Personal Care & Service | 96 (24.7%) | 292 (75.3%) |
| Total (Category) | 1,266 (42.3%) | 1,730 (57.7%) |
| Total (Overall) | 8,133 (53.2%) | 7,140 (46.8%) |
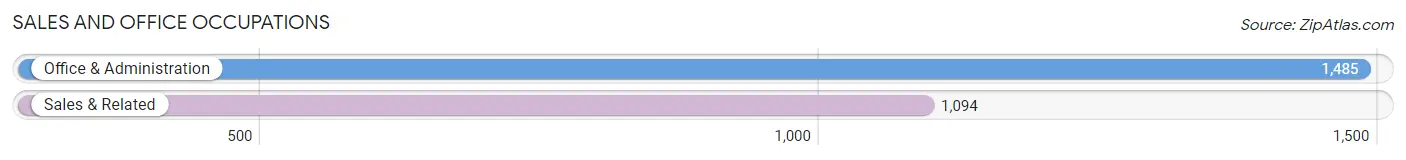
Sales and Office Occupations
The most common Sales and Office occupations in Cowley County are Office & Administration (1,485 | 9.7%), and Sales & Related (1,094 | 7.2%).
Sales and Office Occupations by Sex
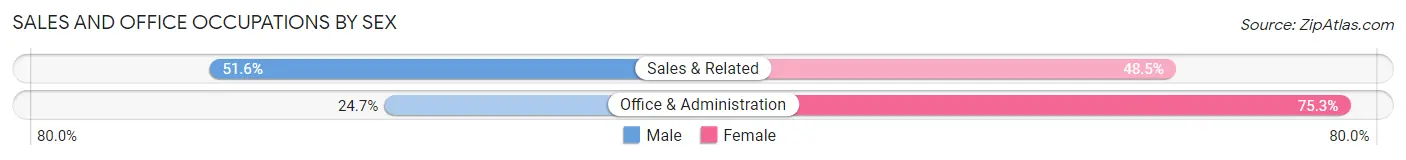
| Occupation | Male | Female |
| Sales & Related | 564 (51.5%) | 530 (48.4%) |
| Office & Administration | 367 (24.7%) | 1,118 (75.3%) |
| Total (Category) | 931 (36.1%) | 1,648 (63.9%) |
| Total (Overall) | 8,133 (53.2%) | 7,140 (46.8%) |
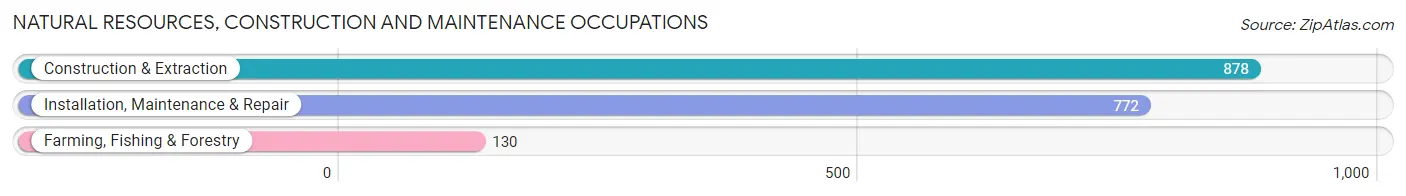
Natural Resources, Construction and Maintenance Occupations
The most common Natural Resources, Construction and Maintenance occupations in Cowley County are Construction & Extraction (878 | 5.8%), Installation, Maintenance & Repair (772 | 5.1%), and Farming, Fishing & Forestry (130 | 0.9%).
Natural Resources, Construction and Maintenance Occupations by Sex
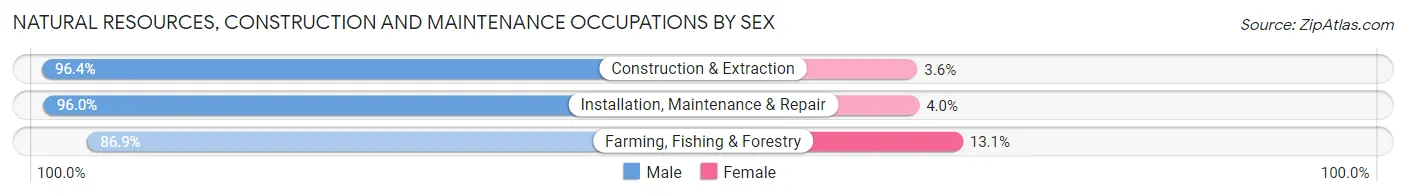
| Occupation | Male | Female |
| Farming, Fishing & Forestry | 113 (86.9%) | 17 (13.1%) |
| Construction & Extraction | 846 (96.4%) | 32 (3.6%) |
| Installation, Maintenance & Repair | 741 (96.0%) | 31 (4.0%) |
| Total (Category) | 1,700 (95.5%) | 80 (4.5%) |
| Total (Overall) | 8,133 (53.2%) | 7,140 (46.8%) |
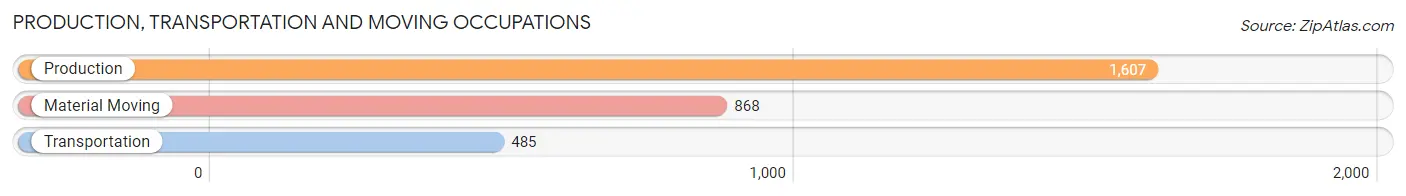
Production, Transportation and Moving Occupations
The most common Production, Transportation and Moving occupations in Cowley County are Production (1,607 | 10.5%), Material Moving (868 | 5.7%), and Transportation (485 | 3.2%).
Production, Transportation and Moving Occupations by Sex
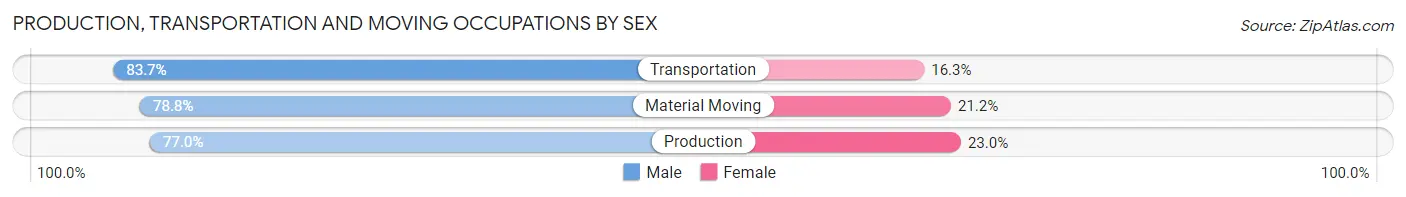
| Occupation | Male | Female |
| Production | 1,237 (77.0%) | 370 (23.0%) |
| Transportation | 406 (83.7%) | 79 (16.3%) |
| Material Moving | 684 (78.8%) | 184 (21.2%) |
| Total (Category) | 2,327 (78.6%) | 633 (21.4%) |
| Total (Overall) | 8,133 (53.2%) | 7,140 (46.8%) |
Employment Industries by Sex in Cowley County
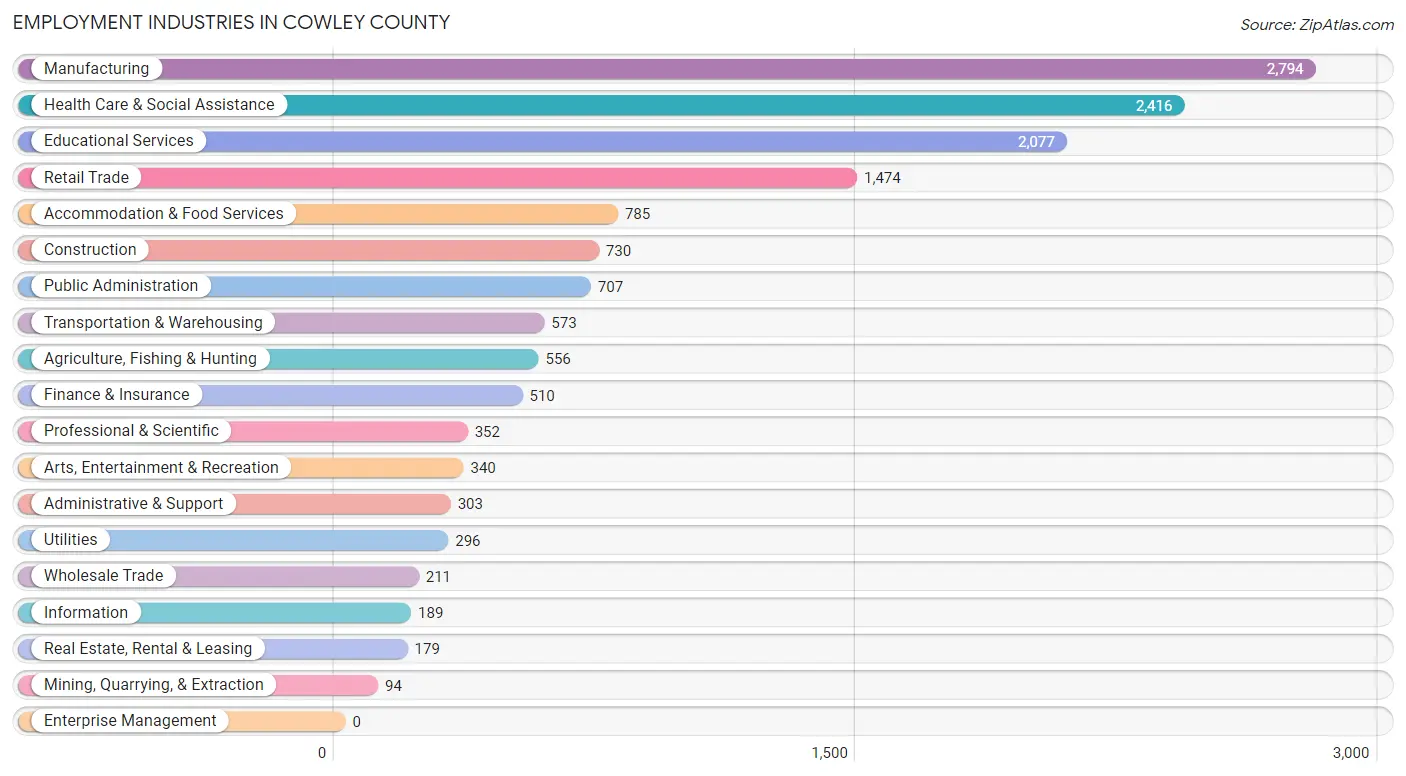
Employment Industries in Cowley County
The major employment industries in Cowley County include Manufacturing (2,794 | 18.3%), Health Care & Social Assistance (2,416 | 15.8%), Educational Services (2,077 | 13.6%), Retail Trade (1,474 | 9.7%), and Accommodation & Food Services (785 | 5.1%).
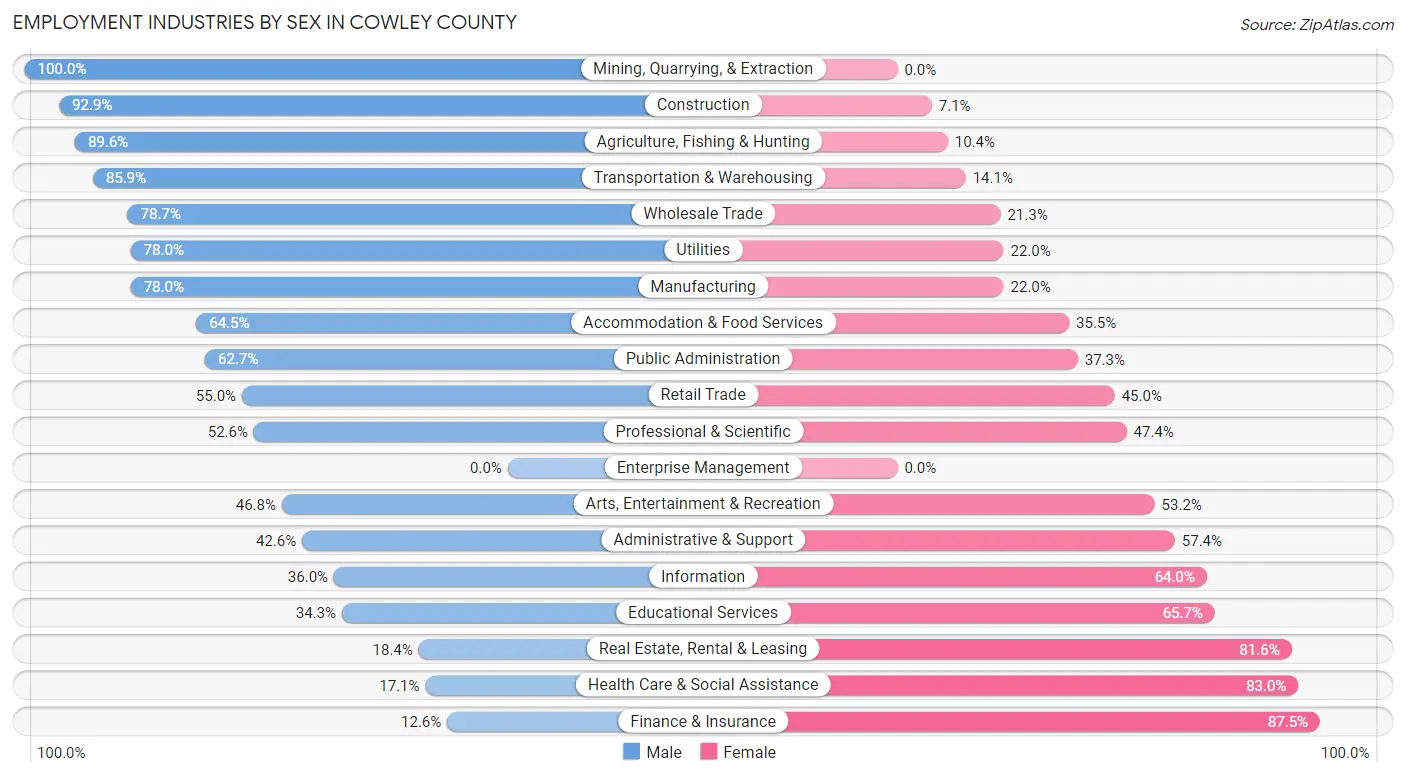
Employment Industries by Sex in Cowley County
The Cowley County industries that see more men than women are Mining, Quarrying, & Extraction (100.0%), Construction (92.9%), and Agriculture, Fishing & Hunting (89.6%), whereas the industries that tend to have a higher number of women are Finance & Insurance (87.5%), Health Care & Social Assistance (83.0%), and Real Estate, Rental & Leasing (81.6%).
| Industry | Male | Female |
| Agriculture, Fishing & Hunting | 498 (89.6%) | 58 (10.4%) |
| Mining, Quarrying, & Extraction | 94 (100.0%) | 0 (0.0%) |
| Construction | 678 (92.9%) | 52 (7.1%) |
| Manufacturing | 2,180 (78.0%) | 614 (22.0%) |
| Wholesale Trade | 166 (78.7%) | 45 (21.3%) |
| Retail Trade | 811 (55.0%) | 663 (45.0%) |
| Transportation & Warehousing | 492 (85.9%) | 81 (14.1%) |
| Utilities | 231 (78.0%) | 65 (22.0%) |
| Information | 68 (36.0%) | 121 (64.0%) |
| Finance & Insurance | 64 (12.6%) | 446 (87.5%) |
| Real Estate, Rental & Leasing | 33 (18.4%) | 146 (81.6%) |
| Professional & Scientific | 185 (52.6%) | 167 (47.4%) |
| Enterprise Management | 0 (0.0%) | 0 (0.0%) |
| Administrative & Support | 129 (42.6%) | 174 (57.4%) |
| Educational Services | 713 (34.3%) | 1,364 (65.7%) |
| Health Care & Social Assistance | 412 (17.1%) | 2,004 (83.0%) |
| Arts, Entertainment & Recreation | 159 (46.8%) | 181 (53.2%) |
| Accommodation & Food Services | 506 (64.5%) | 279 (35.5%) |
| Public Administration | 443 (62.7%) | 264 (37.3%) |
| Total | 8,133 (53.2%) | 7,140 (46.8%) |
Education in Cowley County
School Enrollment in Cowley County
The most common levels of schooling among the 8,778 students in Cowley County are middle school (1,983 | 22.6%), college / undergraduate (1,925 | 21.9%), and high school (1,890 | 21.5%).
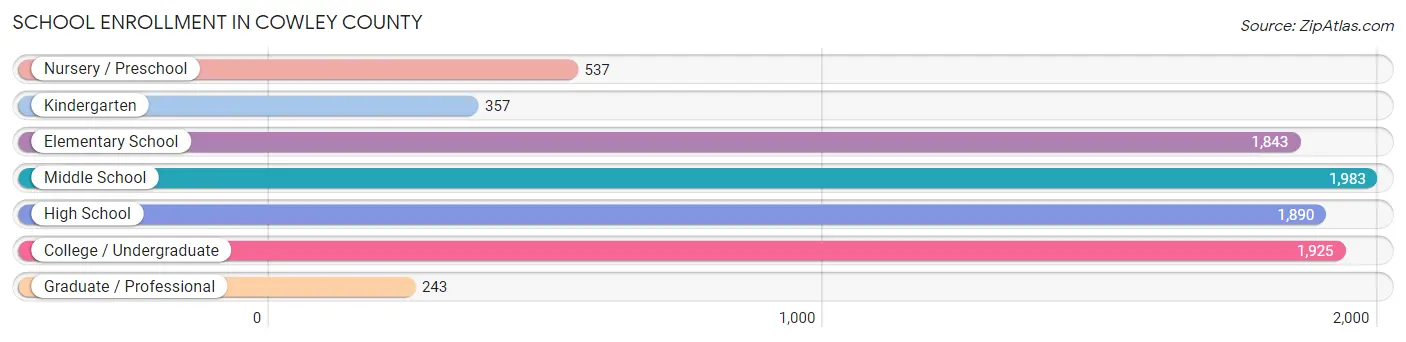
| School Level | # Students | % Students |
| Nursery / Preschool | 537 | 6.1% |
| Kindergarten | 357 | 4.1% |
| Elementary School | 1,843 | 21.0% |
| Middle School | 1,983 | 22.6% |
| High School | 1,890 | 21.5% |
| College / Undergraduate | 1,925 | 21.9% |
| Graduate / Professional | 243 | 2.8% |
| Total | 8,778 | 100.0% |
School Enrollment by Age by Funding Source in Cowley County
Out of a total of 8,778 students who are enrolled in schools in Cowley County, 1,756 (20.0%) attend a private institution, while the remaining 7,022 (80.0%) are enrolled in public schools. The age group of 20 to 24 year olds has the highest likelihood of being enrolled in private schools, with 612 (62.1% in the age bracket) enrolled. Conversely, the age group of 5 to 9 year old has the lowest likelihood of being enrolled in a private school, with 1,704 (91.5% in the age bracket) attending a public institution.
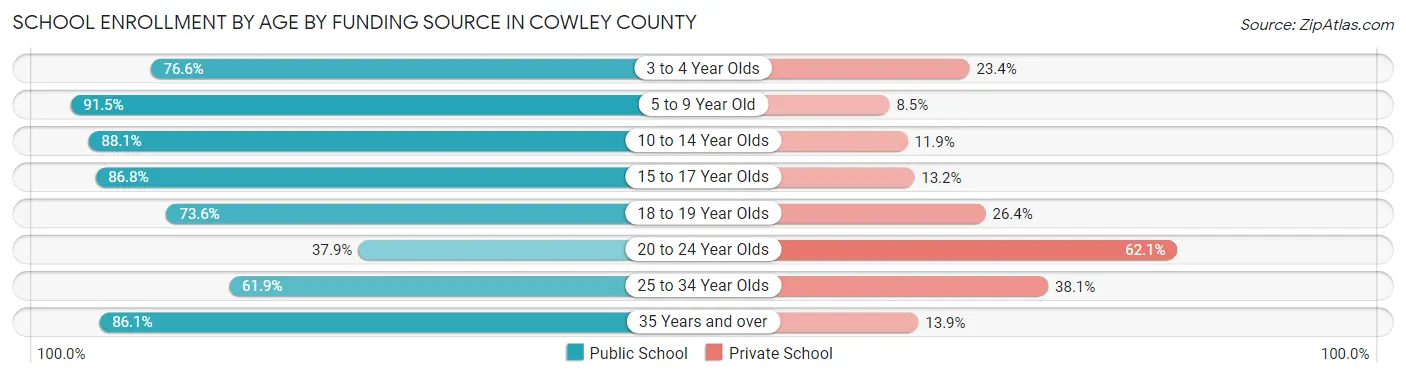
| Age Bracket | Public School | Private School |
| 3 to 4 Year Olds | 307 (76.6%) | 94 (23.4%) |
| 5 to 9 Year Old | 1,704 (91.5%) | 159 (8.5%) |
| 10 to 14 Year Olds | 2,334 (88.1%) | 315 (11.9%) |
| 15 to 17 Year Olds | 1,135 (86.8%) | 172 (13.2%) |
| 18 to 19 Year Olds | 702 (73.6%) | 252 (26.4%) |
| 20 to 24 Year Olds | 373 (37.9%) | 612 (62.1%) |
| 25 to 34 Year Olds | 174 (61.9%) | 107 (38.1%) |
| 35 Years and over | 291 (86.1%) | 47 (13.9%) |
| Total | 7,022 (80.0%) | 1,756 (20.0%) |
Educational Attainment by Field of Study in Cowley County
Education (1,403 | 23.3%), business (999 | 16.6%), science & technology (615 | 10.2%), bio, nature & agricultural (577 | 9.6%), and arts & humanities (470 | 7.8%) are the most common fields of study among 6,030 individuals in Cowley County who have obtained a bachelor's degree or higher.
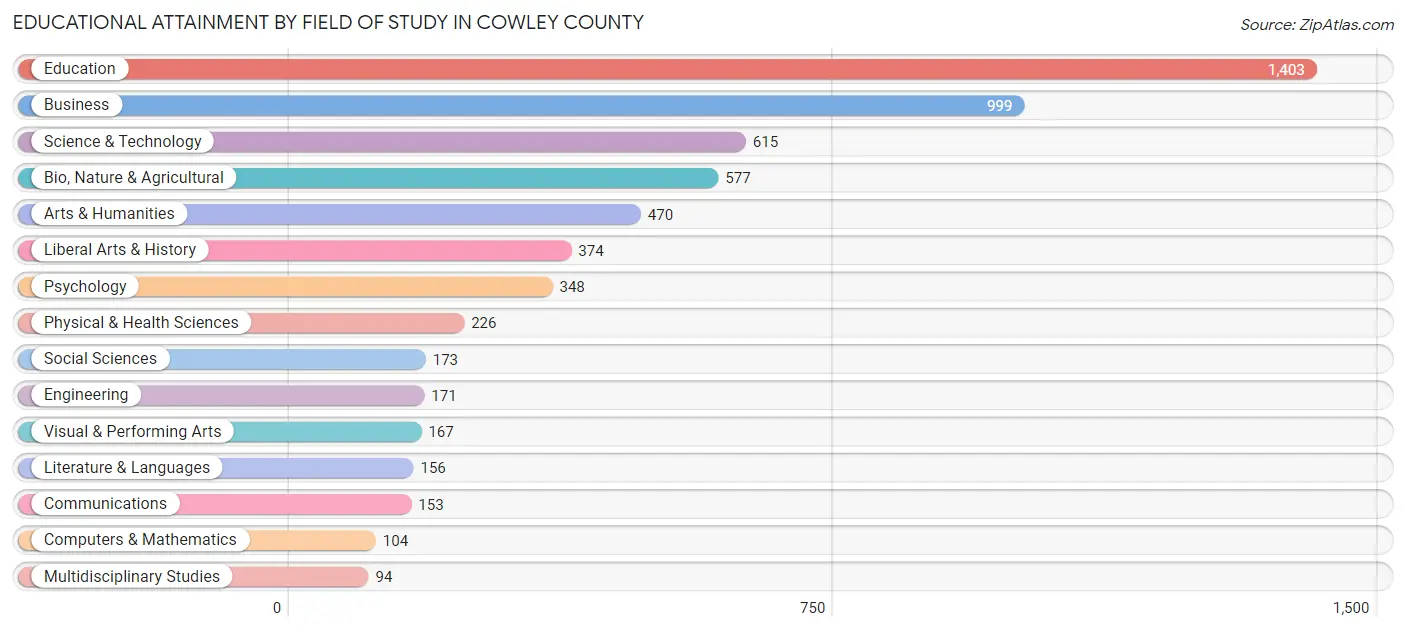
| Field of Study | # Graduates | % Graduates |
| Computers & Mathematics | 104 | 1.7% |
| Bio, Nature & Agricultural | 577 | 9.6% |
| Physical & Health Sciences | 226 | 3.7% |
| Psychology | 348 | 5.8% |
| Social Sciences | 173 | 2.9% |
| Engineering | 171 | 2.8% |
| Multidisciplinary Studies | 94 | 1.6% |
| Science & Technology | 615 | 10.2% |
| Business | 999 | 16.6% |
| Education | 1,403 | 23.3% |
| Literature & Languages | 156 | 2.6% |
| Liberal Arts & History | 374 | 6.2% |
| Visual & Performing Arts | 167 | 2.8% |
| Communications | 153 | 2.5% |
| Arts & Humanities | 470 | 7.8% |
| Total | 6,030 | 100.0% |
Transportation & Commute in Cowley County
Vehicle Availability by Sex in Cowley County
The most prevalent vehicle ownership categories in Cowley County are males with 2 vehicles (2,330, accounting for 29.4%) and females with 2 vehicles (2,077, making up 34.5%).
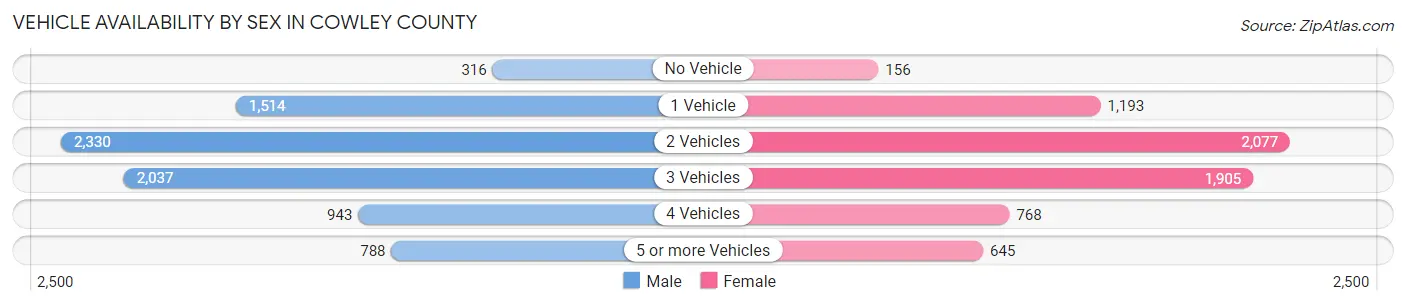
| Vehicles Available | Male | Female |
| No Vehicle | 316 (4.0%) | 156 (2.3%) |
| 1 Vehicle | 1,514 (19.1%) | 1,193 (17.7%) |
| 2 Vehicles | 2,330 (29.4%) | 2,077 (30.8%) |
| 3 Vehicles | 2,037 (25.7%) | 1,905 (28.2%) |
| 4 Vehicles | 943 (11.9%) | 768 (11.4%) |
| 5 or more Vehicles | 788 (9.9%) | 645 (9.6%) |
| Total | 7,928 (100.0%) | 6,744 (100.0%) |
Commute Time in Cowley County
The most frequently occuring commute durations in Cowley County are 5 to 9 minutes (3,192 commuters, 22.2%), 10 to 14 minutes (2,864 commuters, 19.9%), and 15 to 19 minutes (2,266 commuters, 15.7%).
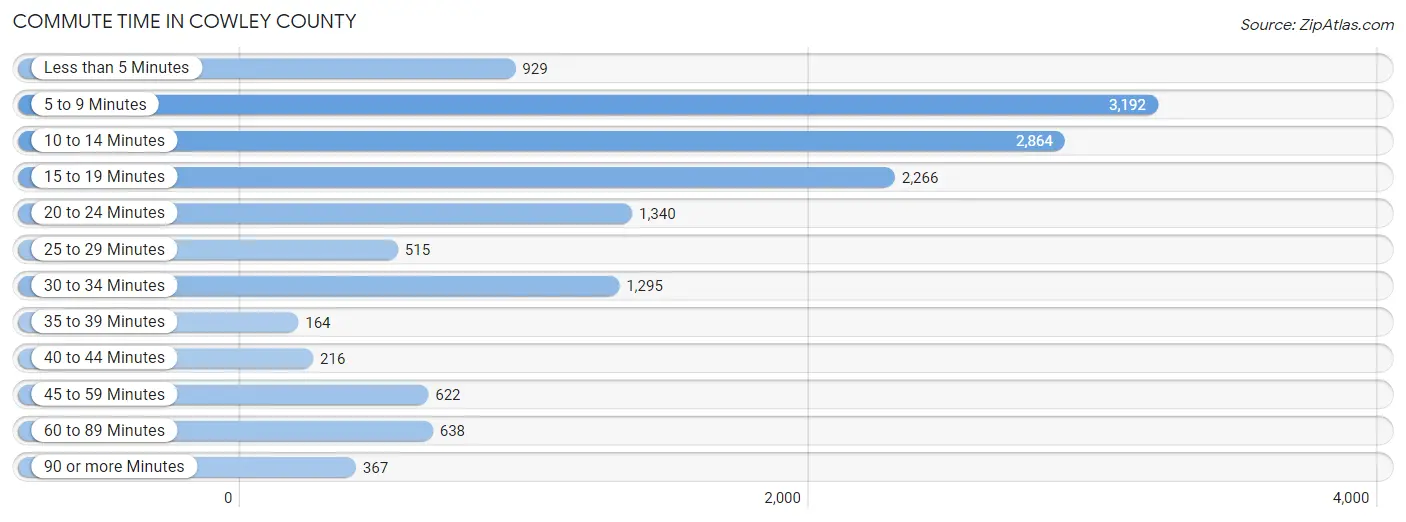
| Commute Time | # Commuters | % Commuters |
| Less than 5 Minutes | 929 | 6.5% |
| 5 to 9 Minutes | 3,192 | 22.2% |
| 10 to 14 Minutes | 2,864 | 19.9% |
| 15 to 19 Minutes | 2,266 | 15.7% |
| 20 to 24 Minutes | 1,340 | 9.3% |
| 25 to 29 Minutes | 515 | 3.6% |
| 30 to 34 Minutes | 1,295 | 9.0% |
| 35 to 39 Minutes | 164 | 1.1% |
| 40 to 44 Minutes | 216 | 1.5% |
| 45 to 59 Minutes | 622 | 4.3% |
| 60 to 89 Minutes | 638 | 4.4% |
| 90 or more Minutes | 367 | 2.5% |
Commute Time by Sex in Cowley County
The most common commute times in Cowley County are 10 to 14 minutes (1,568 commuters, 20.2%) for males and 5 to 9 minutes (1,627 commuters, 24.5%) for females.
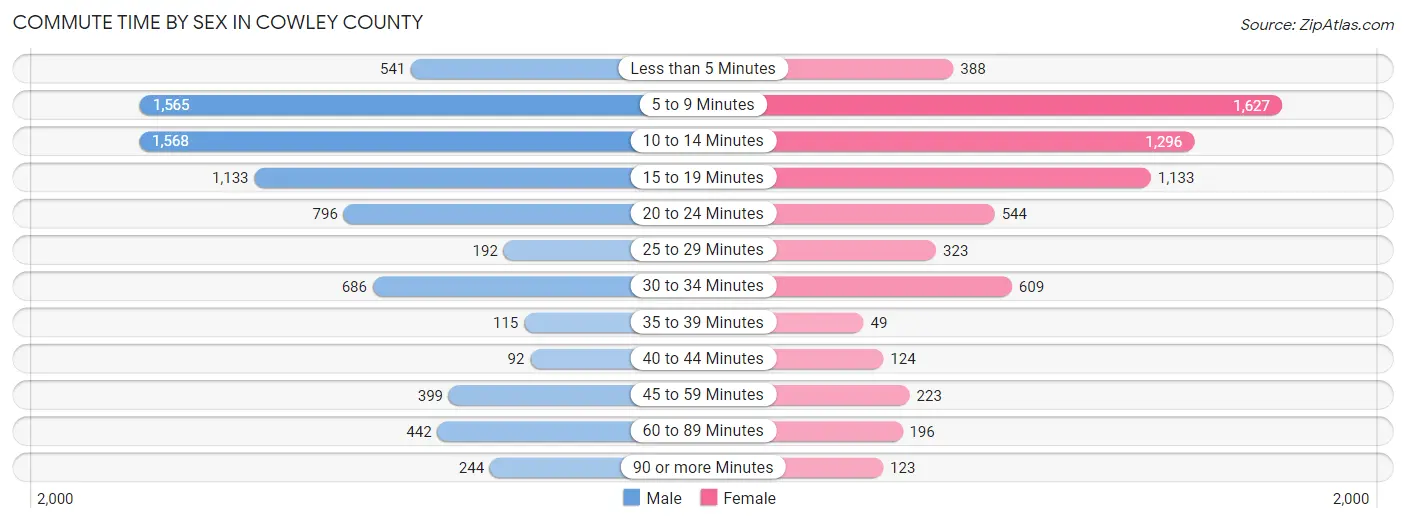
| Commute Time | Male | Female |
| Less than 5 Minutes | 541 (7.0%) | 388 (5.9%) |
| 5 to 9 Minutes | 1,565 (20.1%) | 1,627 (24.5%) |
| 10 to 14 Minutes | 1,568 (20.2%) | 1,296 (19.5%) |
| 15 to 19 Minutes | 1,133 (14.6%) | 1,133 (17.1%) |
| 20 to 24 Minutes | 796 (10.2%) | 544 (8.2%) |
| 25 to 29 Minutes | 192 (2.5%) | 323 (4.9%) |
| 30 to 34 Minutes | 686 (8.8%) | 609 (9.2%) |
| 35 to 39 Minutes | 115 (1.5%) | 49 (0.7%) |
| 40 to 44 Minutes | 92 (1.2%) | 124 (1.9%) |
| 45 to 59 Minutes | 399 (5.1%) | 223 (3.4%) |
| 60 to 89 Minutes | 442 (5.7%) | 196 (2.9%) |
| 90 or more Minutes | 244 (3.1%) | 123 (1.8%) |
Time of Departure to Work by Sex in Cowley County
The most frequent times of departure to work in Cowley County are 6:30 AM to 6:59 AM (1,080, 13.9%) for males and 7:00 AM to 7:29 AM (1,308, 19.7%) for females.
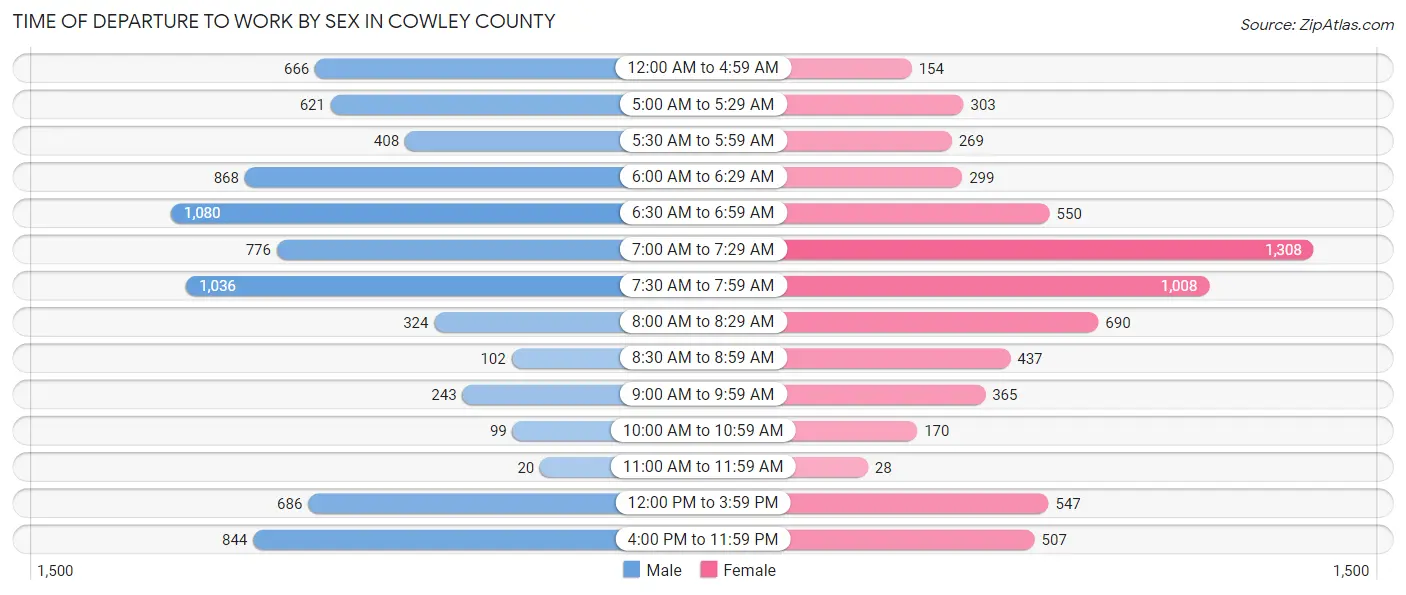
| Time of Departure | Male | Female |
| 12:00 AM to 4:59 AM | 666 (8.6%) | 154 (2.3%) |
| 5:00 AM to 5:29 AM | 621 (8.0%) | 303 (4.6%) |
| 5:30 AM to 5:59 AM | 408 (5.2%) | 269 (4.1%) |
| 6:00 AM to 6:29 AM | 868 (11.2%) | 299 (4.5%) |
| 6:30 AM to 6:59 AM | 1,080 (13.9%) | 550 (8.3%) |
| 7:00 AM to 7:29 AM | 776 (10.0%) | 1,308 (19.7%) |
| 7:30 AM to 7:59 AM | 1,036 (13.3%) | 1,008 (15.2%) |
| 8:00 AM to 8:29 AM | 324 (4.2%) | 690 (10.4%) |
| 8:30 AM to 8:59 AM | 102 (1.3%) | 437 (6.6%) |
| 9:00 AM to 9:59 AM | 243 (3.1%) | 365 (5.5%) |
| 10:00 AM to 10:59 AM | 99 (1.3%) | 170 (2.6%) |
| 11:00 AM to 11:59 AM | 20 (0.3%) | 28 (0.4%) |
| 12:00 PM to 3:59 PM | 686 (8.8%) | 547 (8.2%) |
| 4:00 PM to 11:59 PM | 844 (10.9%) | 507 (7.6%) |
| Total | 7,773 (100.0%) | 6,635 (100.0%) |
Housing Occupancy in Cowley County
Occupancy by Ownership in Cowley County
Of the total 13,091 dwellings in Cowley County, owner-occupied units account for 9,274 (70.8%), while renter-occupied units make up 3,817 (29.2%).
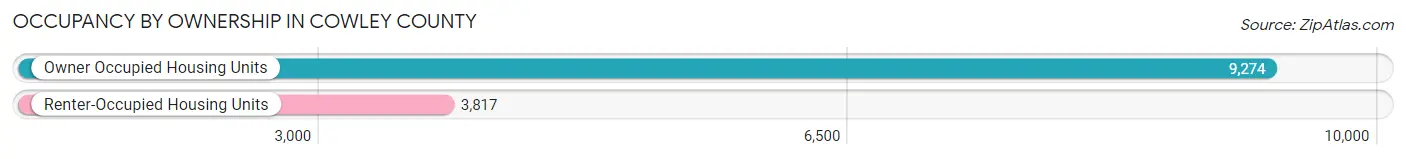
| Occupancy | # Housing Units | % Housing Units |
| Owner Occupied Housing Units | 9,274 | 70.8% |
| Renter-Occupied Housing Units | 3,817 | 29.2% |
| Total Occupied Housing Units | 13,091 | 100.0% |
Occupancy by Household Size in Cowley County
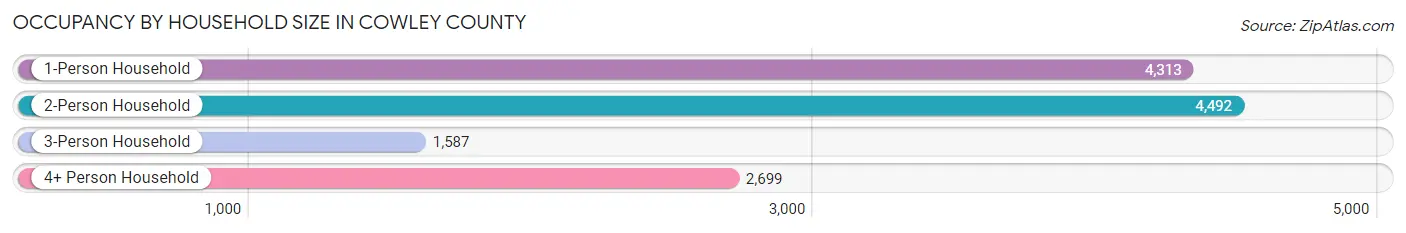
| Household Size | # Housing Units | % Housing Units |
| 1-Person Household | 4,313 | 33.0% |
| 2-Person Household | 4,492 | 34.3% |
| 3-Person Household | 1,587 | 12.1% |
| 4+ Person Household | 2,699 | 20.6% |
| Total Housing Units | 13,091 | 100.0% |
Occupancy by Ownership by Household Size in Cowley County
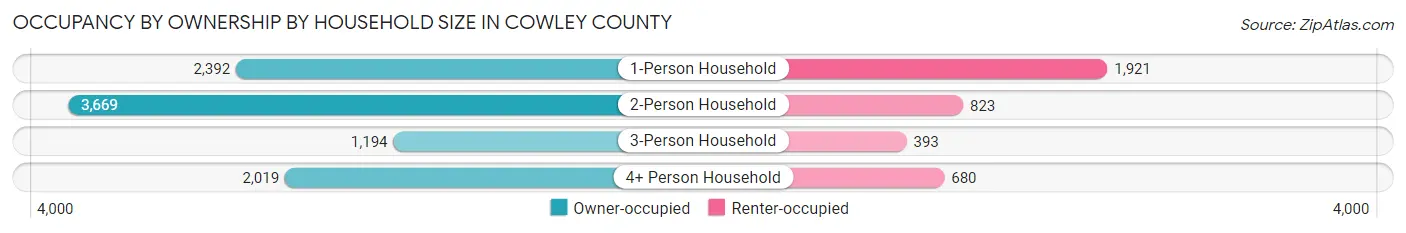
| Household Size | Owner-occupied | Renter-occupied |
| 1-Person Household | 2,392 (55.5%) | 1,921 (44.5%) |
| 2-Person Household | 3,669 (81.7%) | 823 (18.3%) |
| 3-Person Household | 1,194 (75.2%) | 393 (24.8%) |
| 4+ Person Household | 2,019 (74.8%) | 680 (25.2%) |
| Total Housing Units | 9,274 (70.8%) | 3,817 (29.2%) |
Occupancy by Educational Attainment in Cowley County
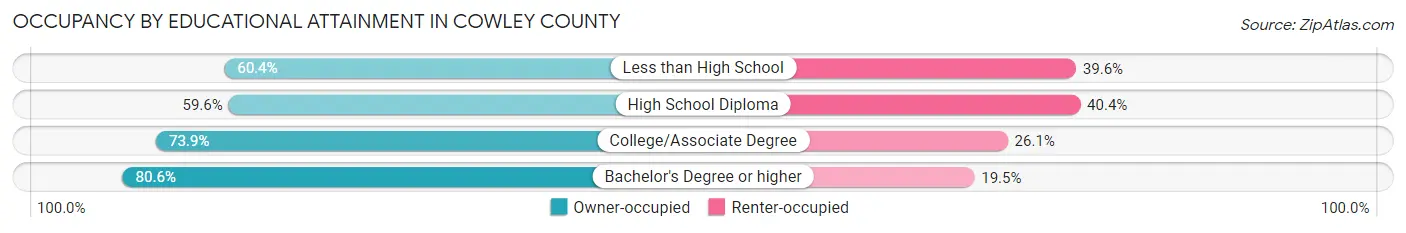
| Household Size | Owner-occupied | Renter-occupied |
| Less than High School | 549 (60.4%) | 360 (39.6%) |
| High School Diploma | 2,121 (59.6%) | 1,440 (40.4%) |
| College/Associate Degree | 3,800 (73.9%) | 1,340 (26.1%) |
| Bachelor's Degree or higher | 2,804 (80.5%) | 677 (19.5%) |
Occupancy by Age of Householder in Cowley County
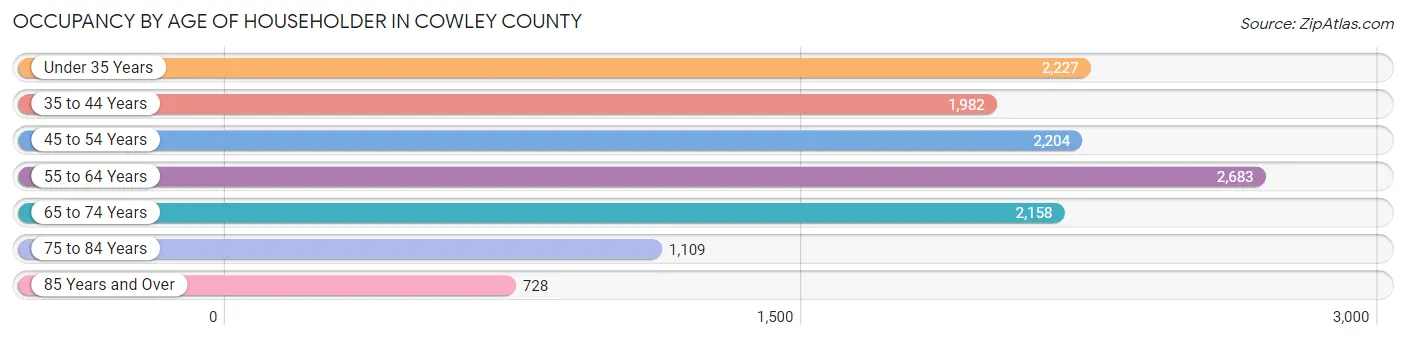
| Age Bracket | # Households | % Households |
| Under 35 Years | 2,227 | 17.0% |
| 35 to 44 Years | 1,982 | 15.1% |
| 45 to 54 Years | 2,204 | 16.8% |
| 55 to 64 Years | 2,683 | 20.5% |
| 65 to 74 Years | 2,158 | 16.5% |
| 75 to 84 Years | 1,109 | 8.5% |
| 85 Years and Over | 728 | 5.6% |
| Total | 13,091 | 100.0% |
Housing Finances in Cowley County
Median Income by Occupancy in Cowley County
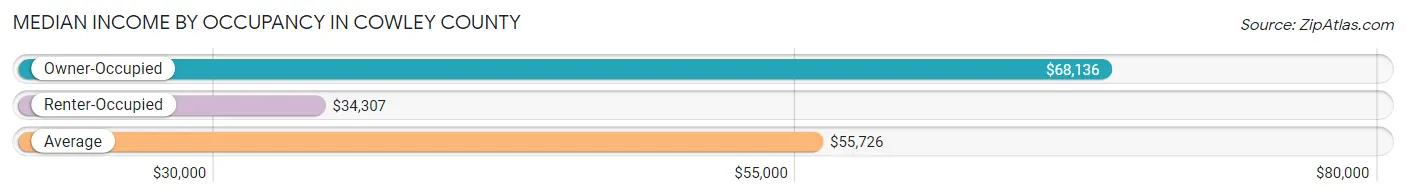
| Occupancy Type | # Households | Median Income |
| Owner-Occupied | 9,274 (70.8%) | $68,136 |
| Renter-Occupied | 3,817 (29.2%) | $34,307 |
| Average | 13,091 (100.0%) | $55,726 |
Occupancy by Householder Income Bracket in Cowley County
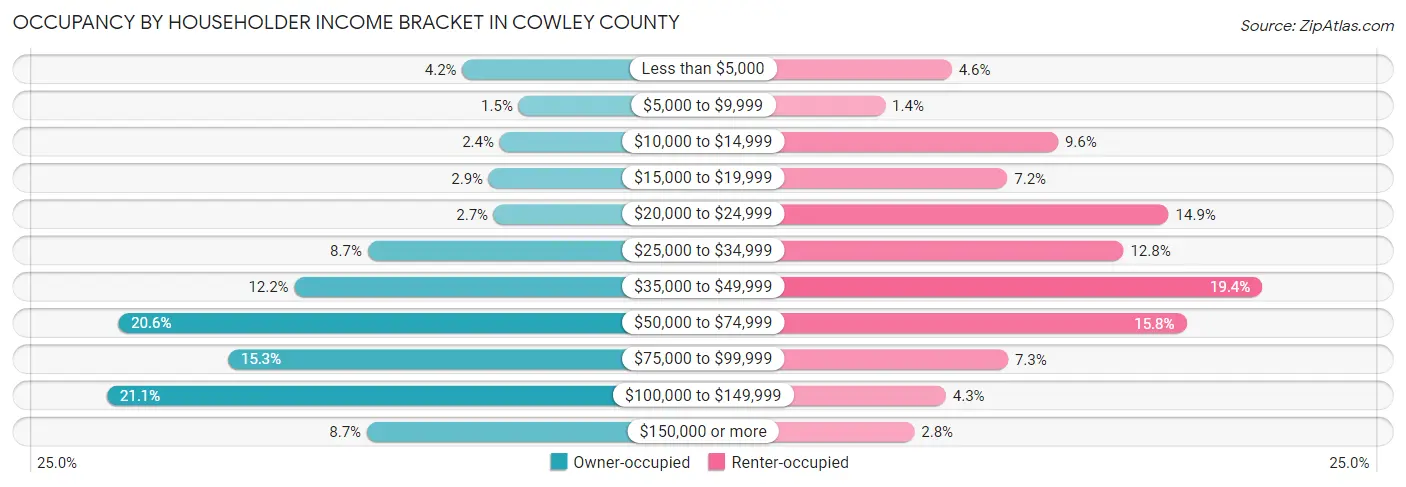
| Income Bracket | Owner-occupied | Renter-occupied |
| Less than $5,000 | 385 (4.2%) | 175 (4.6%) |
| $5,000 to $9,999 | 136 (1.5%) | 54 (1.4%) |
| $10,000 to $14,999 | 220 (2.4%) | 368 (9.6%) |
| $15,000 to $19,999 | 268 (2.9%) | 276 (7.2%) |
| $20,000 to $24,999 | 246 (2.6%) | 569 (14.9%) |
| $25,000 to $34,999 | 803 (8.7%) | 487 (12.8%) |
| $35,000 to $49,999 | 1,127 (12.1%) | 739 (19.4%) |
| $50,000 to $74,999 | 1,906 (20.5%) | 601 (15.8%) |
| $75,000 to $99,999 | 1,421 (15.3%) | 277 (7.3%) |
| $100,000 to $149,999 | 1,955 (21.1%) | 164 (4.3%) |
| $150,000 or more | 807 (8.7%) | 107 (2.8%) |
| Total | 9,274 (100.0%) | 3,817 (100.0%) |
Monthly Housing Cost Tiers in Cowley County
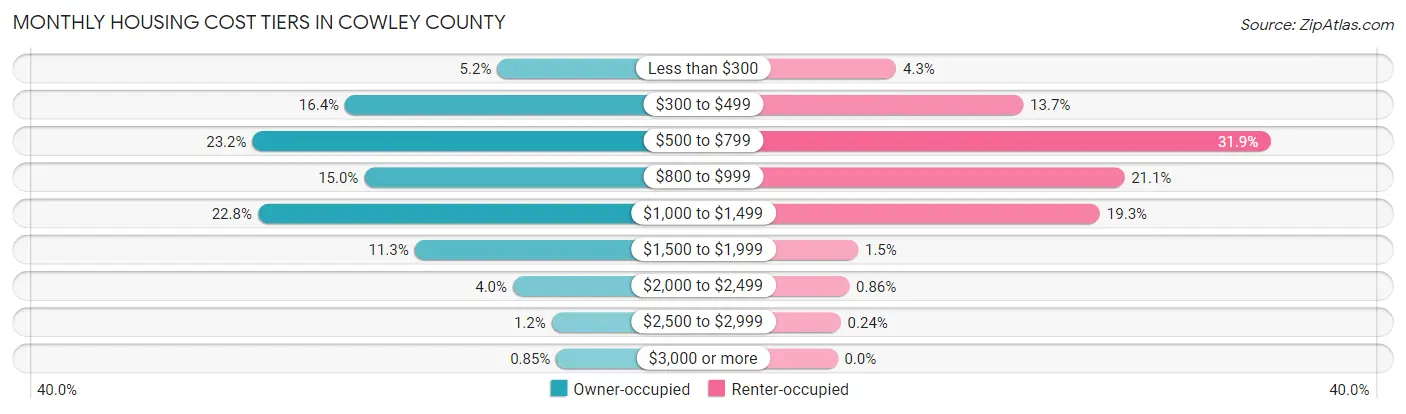
| Monthly Cost | Owner-occupied | Renter-occupied |
| Less than $300 | 481 (5.2%) | 165 (4.3%) |
| $300 to $499 | 1,522 (16.4%) | 522 (13.7%) |
| $500 to $799 | 2,154 (23.2%) | 1,216 (31.9%) |
| $800 to $999 | 1,390 (15.0%) | 806 (21.1%) |
| $1,000 to $1,499 | 2,117 (22.8%) | 738 (19.3%) |
| $1,500 to $1,999 | 1,046 (11.3%) | 58 (1.5%) |
| $2,000 to $2,499 | 375 (4.0%) | 33 (0.9%) |
| $2,500 to $2,999 | 110 (1.2%) | 9 (0.2%) |
| $3,000 or more | 79 (0.9%) | 0 (0.0%) |
| Total | 9,274 (100.0%) | 3,817 (100.0%) |
Physical Housing Characteristics in Cowley County
Housing Structures in Cowley County
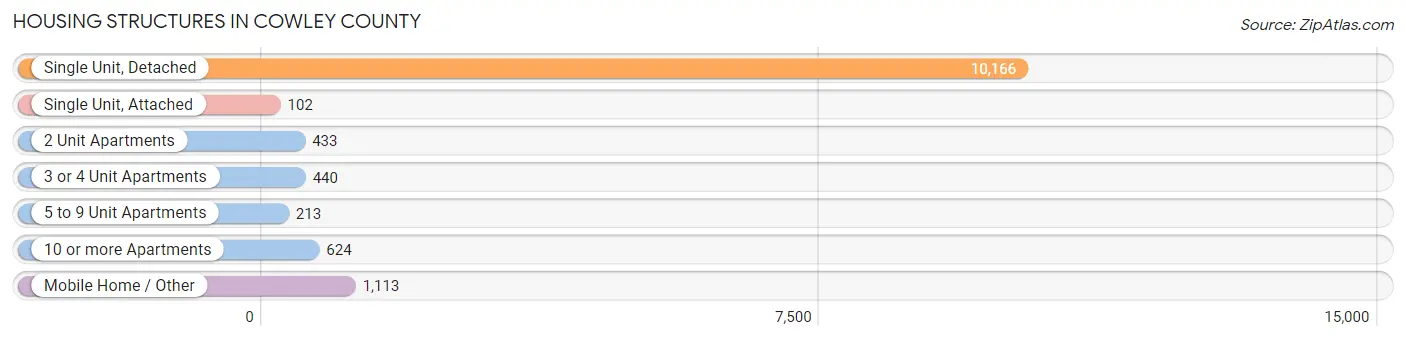
| Structure Type | # Housing Units | % Housing Units |
| Single Unit, Detached | 10,166 | 77.7% |
| Single Unit, Attached | 102 | 0.8% |
| 2 Unit Apartments | 433 | 3.3% |
| 3 or 4 Unit Apartments | 440 | 3.4% |
| 5 to 9 Unit Apartments | 213 | 1.6% |
| 10 or more Apartments | 624 | 4.8% |
| Mobile Home / Other | 1,113 | 8.5% |
| Total | 13,091 | 100.0% |
Housing Structures by Occupancy in Cowley County
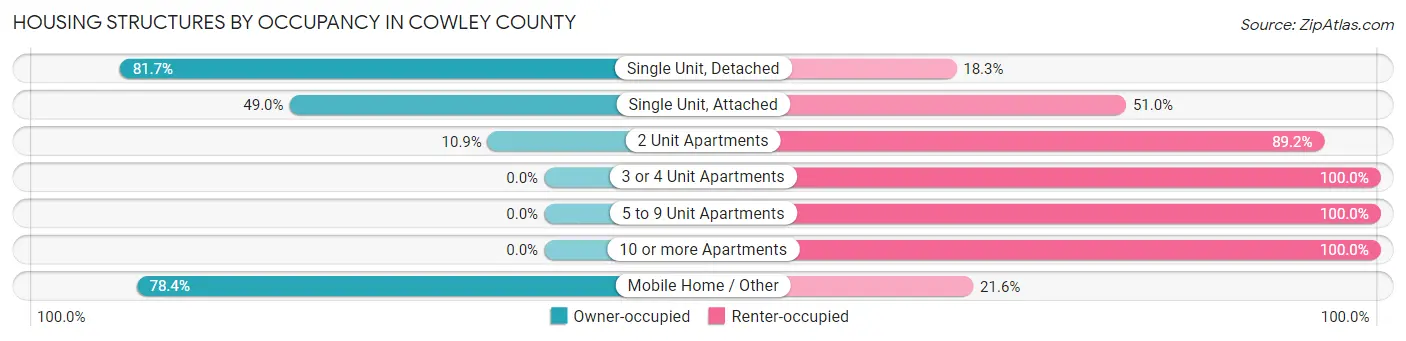
| Structure Type | Owner-occupied | Renter-occupied |
| Single Unit, Detached | 8,304 (81.7%) | 1,862 (18.3%) |
| Single Unit, Attached | 50 (49.0%) | 52 (51.0%) |
| 2 Unit Apartments | 47 (10.8%) | 386 (89.1%) |
| 3 or 4 Unit Apartments | 0 (0.0%) | 440 (100.0%) |
| 5 to 9 Unit Apartments | 0 (0.0%) | 213 (100.0%) |
| 10 or more Apartments | 0 (0.0%) | 624 (100.0%) |
| Mobile Home / Other | 873 (78.4%) | 240 (21.6%) |
| Total | 9,274 (70.8%) | 3,817 (29.2%) |
Housing Structures by Number of Rooms in Cowley County
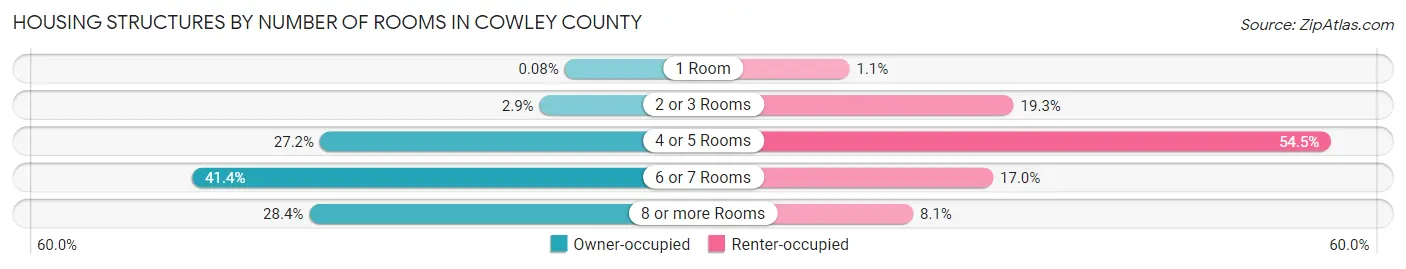
| Number of Rooms | Owner-occupied | Renter-occupied |
| 1 Room | 7 (0.1%) | 41 (1.1%) |
| 2 or 3 Rooms | 265 (2.9%) | 736 (19.3%) |
| 4 or 5 Rooms | 2,525 (27.2%) | 2,081 (54.5%) |
| 6 or 7 Rooms | 3,841 (41.4%) | 649 (17.0%) |
| 8 or more Rooms | 2,636 (28.4%) | 310 (8.1%) |
| Total | 9,274 (100.0%) | 3,817 (100.0%) |
Housing Structure by Heating Type in Cowley County
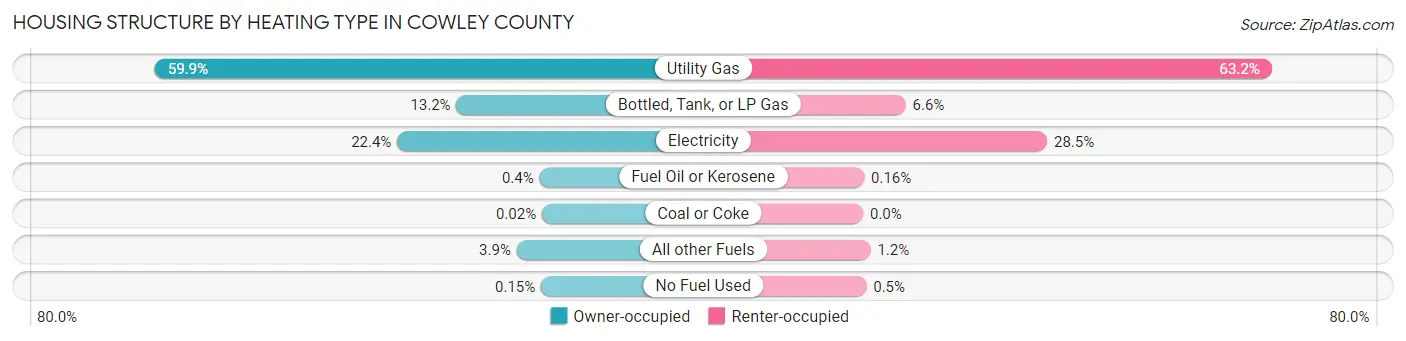
| Heating Type | Owner-occupied | Renter-occupied |
| Utility Gas | 5,552 (59.9%) | 2,411 (63.2%) |
| Bottled, Tank, or LP Gas | 1,228 (13.2%) | 251 (6.6%) |
| Electricity | 2,077 (22.4%) | 1,086 (28.4%) |
| Fuel Oil or Kerosene | 37 (0.4%) | 6 (0.2%) |
| Coal or Coke | 2 (0.0%) | 0 (0.0%) |
| All other Fuels | 364 (3.9%) | 44 (1.1%) |
| No Fuel Used | 14 (0.2%) | 19 (0.5%) |
| Total | 9,274 (100.0%) | 3,817 (100.0%) |
Household Vehicle Usage in Cowley County
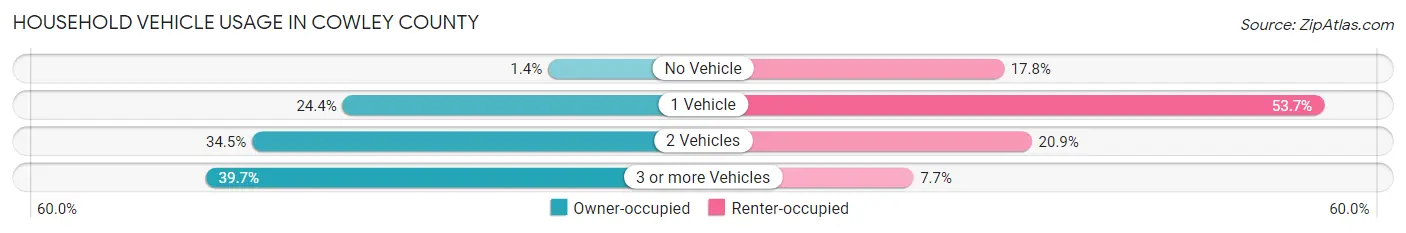
| Vehicles per Household | Owner-occupied | Renter-occupied |
| No Vehicle | 127 (1.4%) | 679 (17.8%) |
| 1 Vehicle | 2,262 (24.4%) | 2,048 (53.6%) |
| 2 Vehicles | 3,201 (34.5%) | 798 (20.9%) |
| 3 or more Vehicles | 3,684 (39.7%) | 292 (7.6%) |
| Total | 9,274 (100.0%) | 3,817 (100.0%) |
Real Estate & Mortgages in Cowley County
Real Estate and Mortgage Overview in Cowley County
| Characteristic | Without Mortgage | With Mortgage |
| Housing Units | 4,319 | 4,955 |
| Median Property Value | $92,700 | $112,100 |
| Median Household Income | $54,243 | $552 |
| Monthly Housing Costs | $527 | $72 |
| Real Estate Taxes | $1,466 | $134 |
Property Value by Mortgage Status in Cowley County
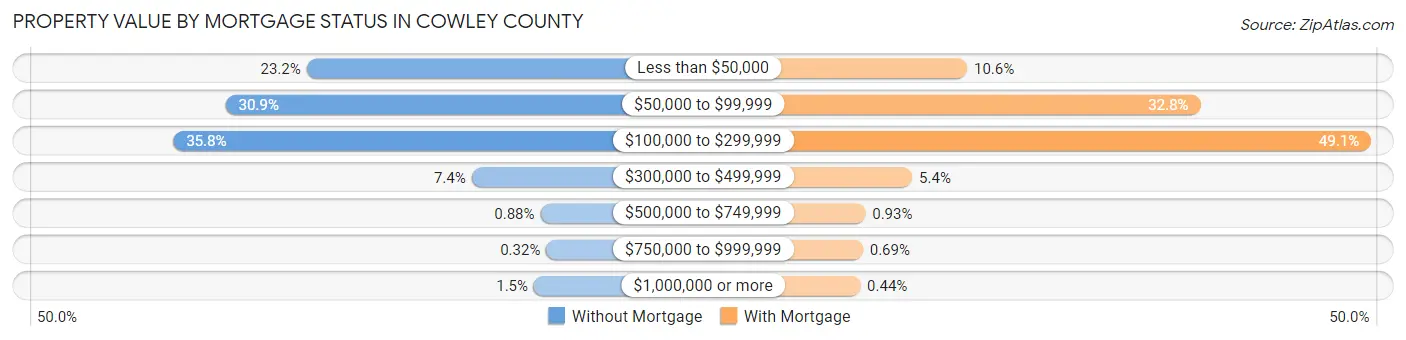
| Property Value | Without Mortgage | With Mortgage |
| Less than $50,000 | 1,000 (23.2%) | 526 (10.6%) |
| $50,000 to $99,999 | 1,333 (30.9%) | 1,627 (32.8%) |
| $100,000 to $299,999 | 1,548 (35.8%) | 2,433 (49.1%) |
| $300,000 to $499,999 | 321 (7.4%) | 267 (5.4%) |
| $500,000 to $749,999 | 38 (0.9%) | 46 (0.9%) |
| $750,000 to $999,999 | 14 (0.3%) | 34 (0.7%) |
| $1,000,000 or more | 65 (1.5%) | 22 (0.4%) |
| Total | 4,319 (100.0%) | 4,955 (100.0%) |
Household Income by Mortgage Status in Cowley County
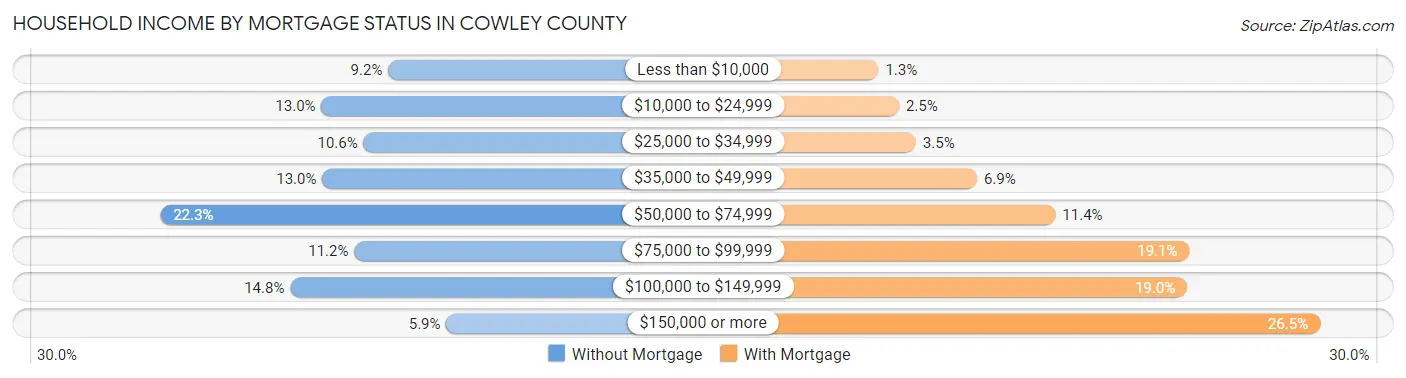
| Household Income | Without Mortgage | With Mortgage |
| Less than $10,000 | 398 (9.2%) | 65 (1.3%) |
| $10,000 to $24,999 | 563 (13.0%) | 123 (2.5%) |
| $25,000 to $34,999 | 459 (10.6%) | 171 (3.5%) |
| $35,000 to $49,999 | 561 (13.0%) | 344 (6.9%) |
| $50,000 to $74,999 | 961 (22.3%) | 566 (11.4%) |
| $75,000 to $99,999 | 482 (11.2%) | 945 (19.1%) |
| $100,000 to $149,999 | 640 (14.8%) | 939 (19.0%) |
| $150,000 or more | 255 (5.9%) | 1,315 (26.5%) |
| Total | 4,319 (100.0%) | 4,955 (100.0%) |
Property Value to Household Income Ratio in Cowley County
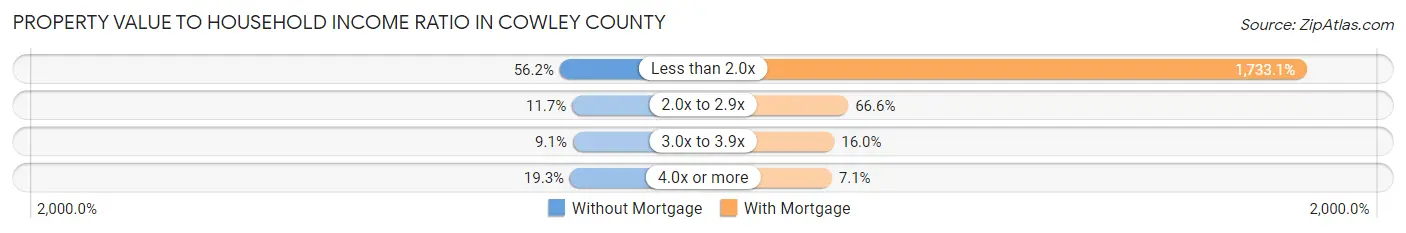
| Value-to-Income Ratio | Without Mortgage | With Mortgage |
| Less than 2.0x | 2,428 (56.2%) | 85,873 (1,733.1%) |
| 2.0x to 2.9x | 505 (11.7%) | 3,298 (66.6%) |
| 3.0x to 3.9x | 392 (9.1%) | 792 (16.0%) |
| 4.0x or more | 834 (19.3%) | 352 (7.1%) |
| Total | 4,319 (100.0%) | 4,955 (100.0%) |
Real Estate Taxes by Mortgage Status in Cowley County
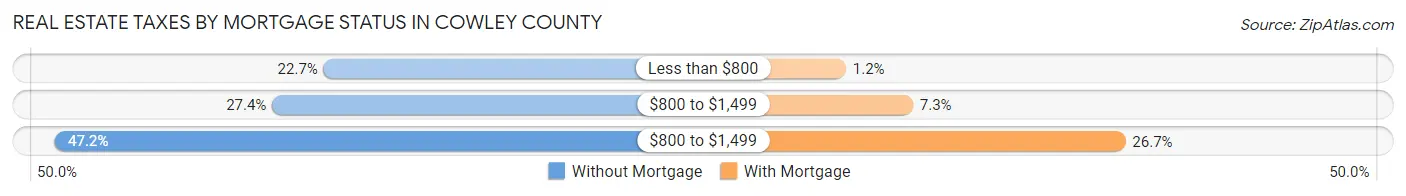
| Property Taxes | Without Mortgage | With Mortgage |
| Less than $800 | 980 (22.7%) | 58 (1.2%) |
| $800 to $1,499 | 1,183 (27.4%) | 361 (7.3%) |
| $800 to $1,499 | 2,039 (47.2%) | 1,323 (26.7%) |
| Total | 4,319 (100.0%) | 4,955 (100.0%) |
Health & Disability in Cowley County
Health Insurance Coverage by Age in Cowley County
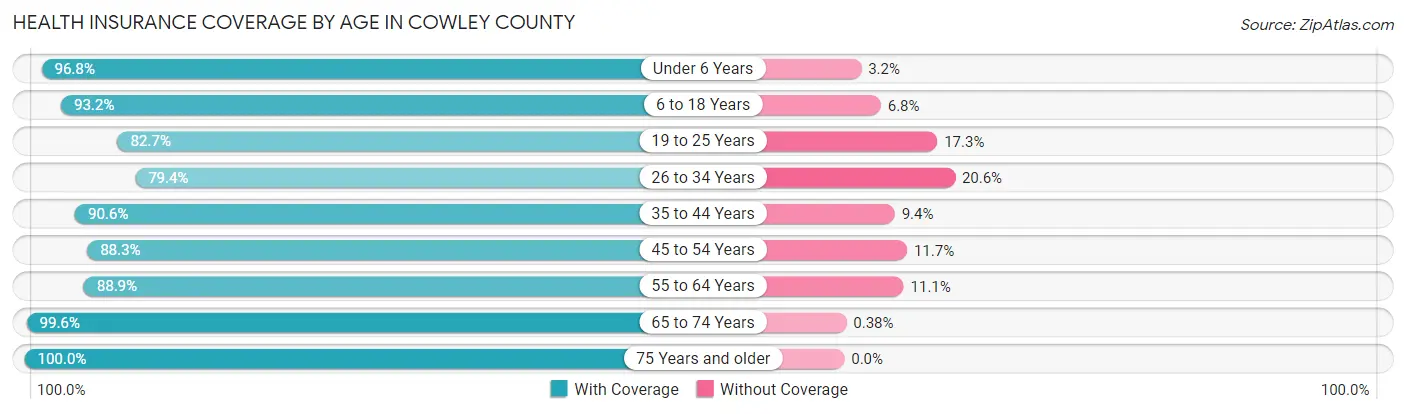
| Age Bracket | With Coverage | Without Coverage |
| Under 6 Years | 2,301 (96.8%) | 75 (3.2%) |
| 6 to 18 Years | 5,955 (93.2%) | 435 (6.8%) |
| 19 to 25 Years | 2,662 (82.7%) | 558 (17.3%) |
| 26 to 34 Years | 2,782 (79.4%) | 723 (20.6%) |
| 35 to 44 Years | 3,503 (90.6%) | 364 (9.4%) |
| 45 to 54 Years | 3,347 (88.3%) | 443 (11.7%) |
| 55 to 64 Years | 3,950 (88.9%) | 491 (11.1%) |
| 65 to 74 Years | 3,381 (99.6%) | 13 (0.4%) |
| 75 Years and older | 2,539 (100.0%) | 0 (0.0%) |
| Total | 30,420 (90.7%) | 3,102 (9.2%) |
Health Insurance Coverage by Citizenship Status in Cowley County
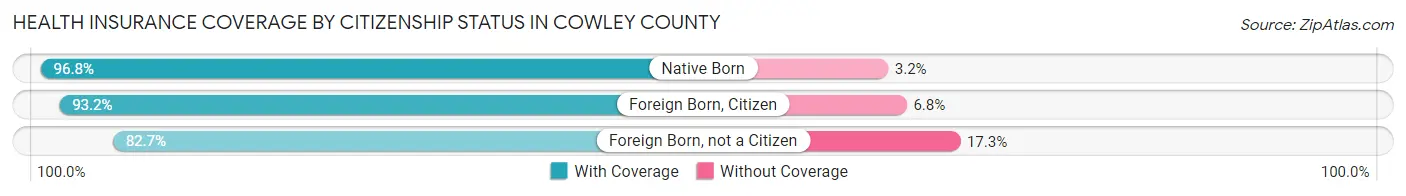
| Citizenship Status | With Coverage | Without Coverage |
| Native Born | 2,301 (96.8%) | 75 (3.2%) |
| Foreign Born, Citizen | 5,955 (93.2%) | 435 (6.8%) |
| Foreign Born, not a Citizen | 2,662 (82.7%) | 558 (17.3%) |
Health Insurance Coverage by Household Income in Cowley County
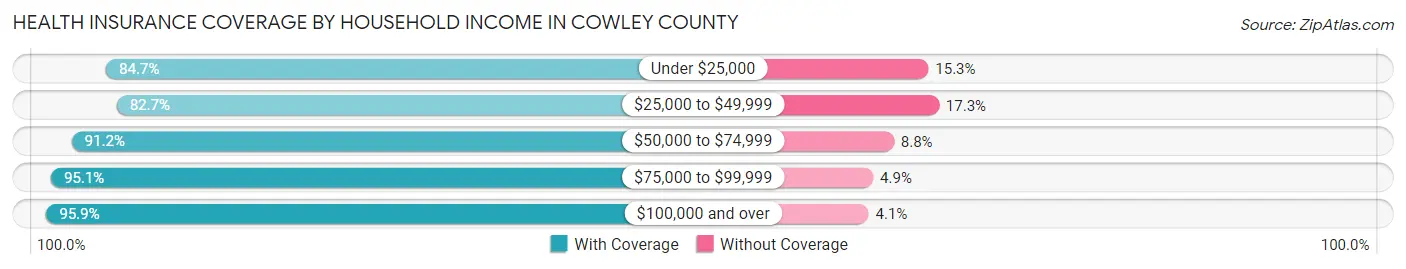
| Household Income | With Coverage | Without Coverage |
| Under $25,000 | 3,626 (84.7%) | 654 (15.3%) |
| $25,000 to $49,999 | 5,321 (82.7%) | 1,110 (17.3%) |
| $50,000 to $74,999 | 6,616 (91.2%) | 640 (8.8%) |
| $75,000 to $99,999 | 4,777 (95.1%) | 248 (4.9%) |
| $100,000 and over | 8,986 (95.9%) | 382 (4.1%) |
Public vs Private Health Insurance Coverage by Age in Cowley County
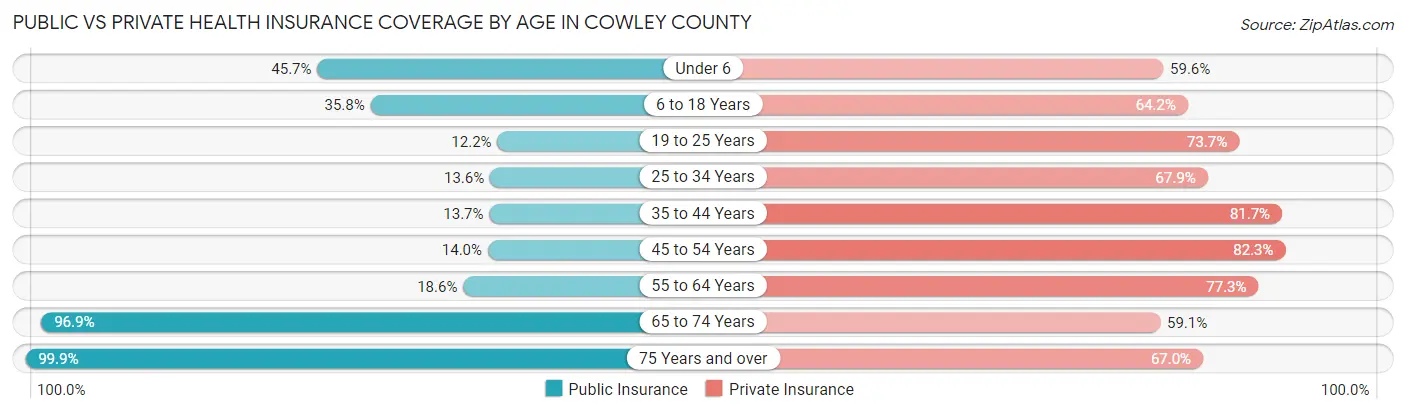
| Age Bracket | Public Insurance | Private Insurance |
| Under 6 | 1,085 (45.7%) | 1,417 (59.6%) |
| 6 to 18 Years | 2,287 (35.8%) | 4,103 (64.2%) |
| 19 to 25 Years | 394 (12.2%) | 2,374 (73.7%) |
| 25 to 34 Years | 477 (13.6%) | 2,380 (67.9%) |
| 35 to 44 Years | 531 (13.7%) | 3,159 (81.7%) |
| 45 to 54 Years | 531 (14.0%) | 3,120 (82.3%) |
| 55 to 64 Years | 825 (18.6%) | 3,434 (77.3%) |
| 65 to 74 Years | 3,289 (96.9%) | 2,005 (59.1%) |
| 75 Years and over | 2,536 (99.9%) | 1,702 (67.0%) |
| Total | 11,955 (35.7%) | 23,694 (70.7%) |
Disability Status by Sex by Age in Cowley County
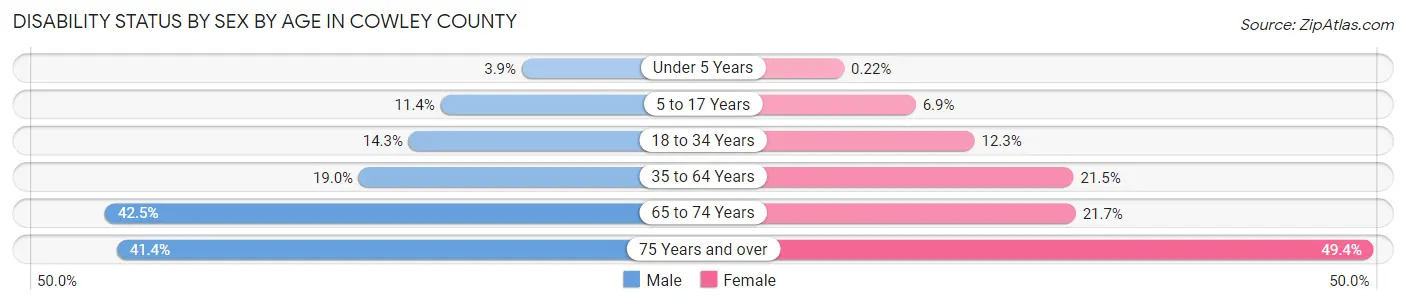
| Age Bracket | Male | Female |
| Under 5 Years | 40 (3.8%) | 2 (0.2%) |
| 5 to 17 Years | 351 (11.4%) | 214 (6.9%) |
| 18 to 34 Years | 539 (14.3%) | 443 (12.3%) |
| 35 to 64 Years | 1,158 (19.0%) | 1,289 (21.5%) |
| 65 to 74 Years | 697 (42.5%) | 381 (21.7%) |
| 75 Years and over | 404 (41.4%) | 772 (49.4%) |
Disability Class by Sex by Age in Cowley County
Disability Class: Hearing Difficulty
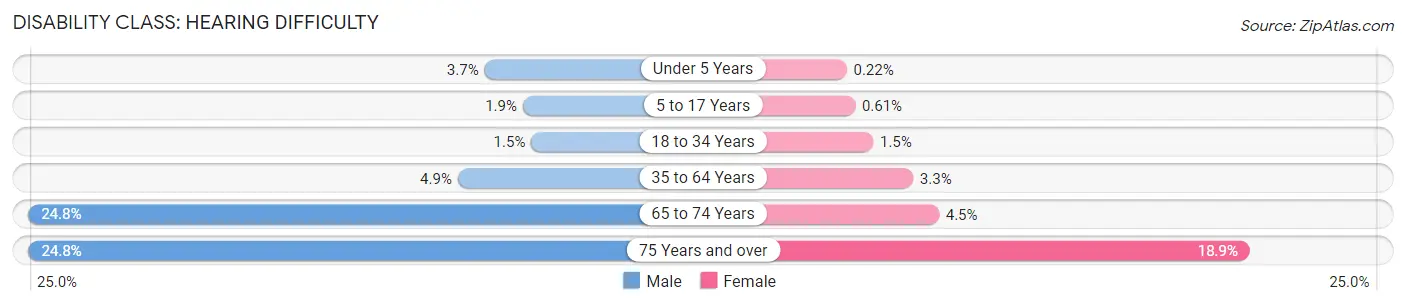
| Age Bracket | Male | Female |
| Under 5 Years | 38 (3.7%) | 2 (0.2%) |
| 5 to 17 Years | 58 (1.9%) | 19 (0.6%) |
| 18 to 34 Years | 56 (1.5%) | 52 (1.5%) |
| 35 to 64 Years | 299 (4.9%) | 198 (3.3%) |
| 65 to 74 Years | 407 (24.8%) | 79 (4.5%) |
| 75 Years and over | 242 (24.8%) | 296 (18.9%) |
Disability Class: Vision Difficulty
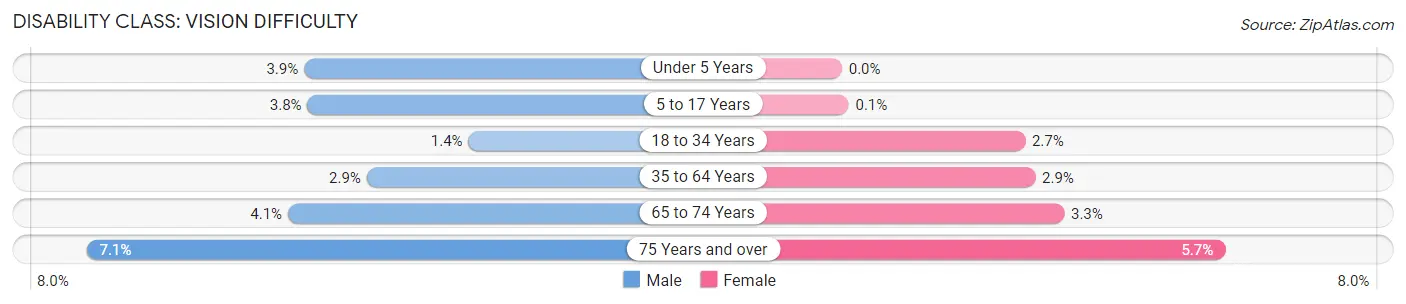
| Age Bracket | Male | Female |
| Under 5 Years | 40 (3.8%) | 0 (0.0%) |
| 5 to 17 Years | 117 (3.8%) | 3 (0.1%) |
| 18 to 34 Years | 53 (1.4%) | 98 (2.7%) |
| 35 to 64 Years | 178 (2.9%) | 172 (2.9%) |
| 65 to 74 Years | 67 (4.1%) | 58 (3.3%) |
| 75 Years and over | 69 (7.1%) | 89 (5.7%) |
Disability Class: Cognitive Difficulty
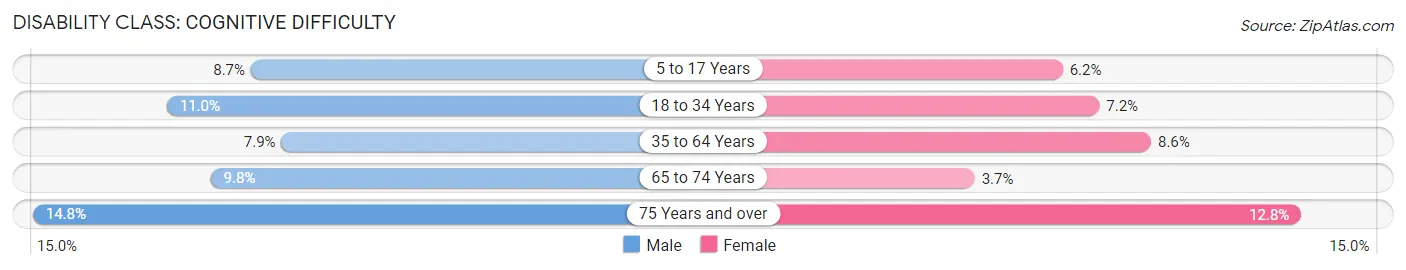
| Age Bracket | Male | Female |
| 5 to 17 Years | 268 (8.7%) | 192 (6.1%) |
| 18 to 34 Years | 415 (11.0%) | 258 (7.2%) |
| 35 to 64 Years | 479 (7.9%) | 516 (8.6%) |
| 65 to 74 Years | 161 (9.8%) | 65 (3.7%) |
| 75 Years and over | 144 (14.8%) | 200 (12.8%) |
Disability Class: Ambulatory Difficulty
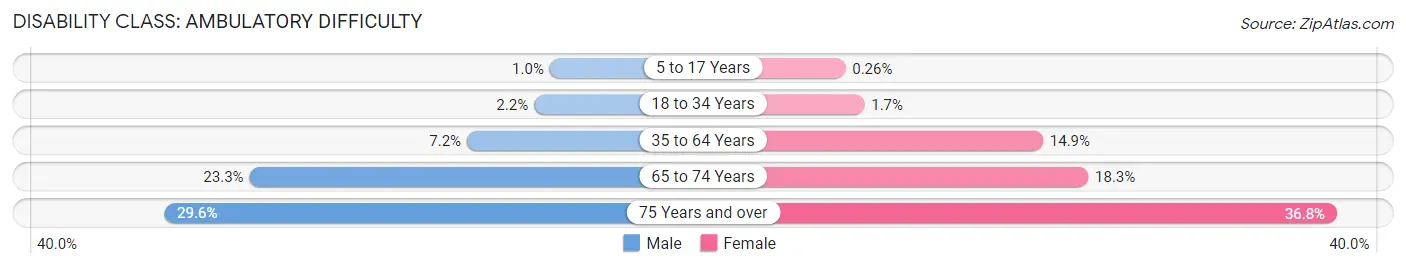
| Age Bracket | Male | Female |
| 5 to 17 Years | 31 (1.0%) | 8 (0.3%) |
| 18 to 34 Years | 82 (2.2%) | 60 (1.7%) |
| 35 to 64 Years | 437 (7.2%) | 895 (14.9%) |
| 65 to 74 Years | 382 (23.3%) | 321 (18.3%) |
| 75 Years and over | 289 (29.6%) | 575 (36.8%) |
Disability Class: Self-Care Difficulty
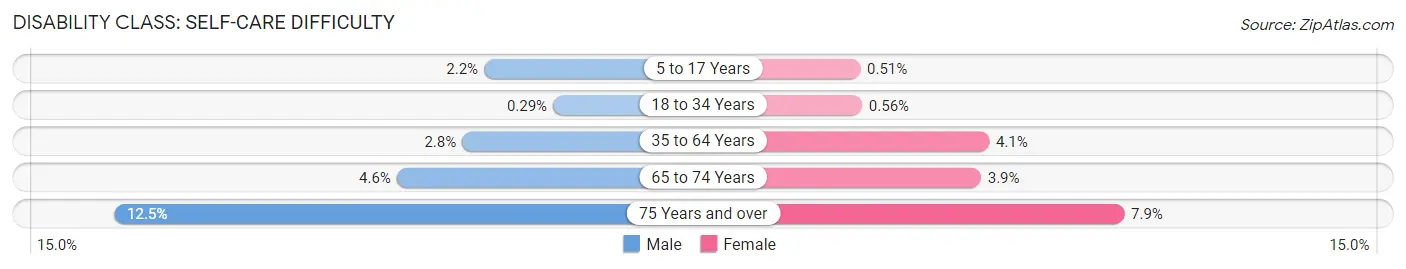
| Age Bracket | Male | Female |
| 5 to 17 Years | 68 (2.2%) | 16 (0.5%) |
| 18 to 34 Years | 11 (0.3%) | 20 (0.6%) |
| 35 to 64 Years | 172 (2.8%) | 246 (4.1%) |
| 65 to 74 Years | 76 (4.6%) | 68 (3.9%) |
| 75 Years and over | 122 (12.5%) | 123 (7.9%) |
Technology Access in Cowley County
Computing Device Access in Cowley County
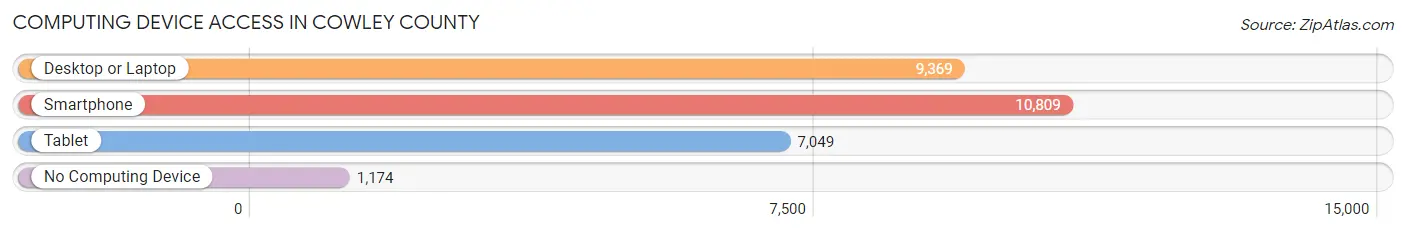
| Device Type | # Households | % Households |
| Desktop or Laptop | 9,369 | 71.6% |
| Smartphone | 10,809 | 82.6% |
| Tablet | 7,049 | 53.8% |
| No Computing Device | 1,174 | 9.0% |
| Total | 13,091 | 100.0% |
Internet Access in Cowley County
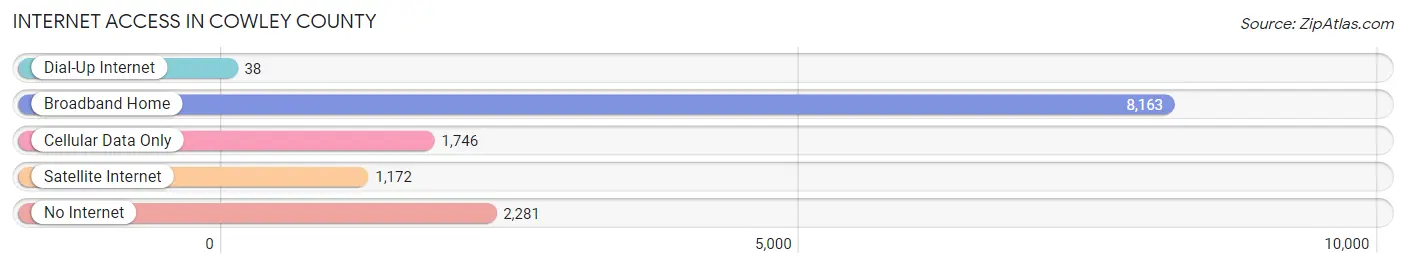
| Internet Type | # Households | % Households |
| Dial-Up Internet | 38 | 0.3% |
| Broadband Home | 8,163 | 62.4% |
| Cellular Data Only | 1,746 | 13.3% |
| Satellite Internet | 1,172 | 8.9% |
| No Internet | 2,281 | 17.4% |
| Total | 13,091 | 100.0% |
Cowley County Summary
Cowley County, Kansas is located in the south-central part of the state and is part of the Wichita metropolitan area. The county was established in 1867 and is named after Matthew Cowley, a Union Army officer who served in the Civil War. The county seat is Winfield, which is also the largest city in the county. Cowley County has a population of 36,291, according to the 2020 census, and covers an area of 845 square miles.
Geography
Cowley County is located in the south-central part of Kansas, and is bordered by Sumner County to the north, Sedgwick County to the east, Elk County to the south, and Chautauqua County to the west. The county is part of the Arkansas River Valley, and is located in the Great Plains region of the United States. The county is mostly flat, with some rolling hills in the western part of the county. The Arkansas River runs through the county, and there are several small lakes and reservoirs in the area. The climate is semi-arid, with hot summers and cold winters.
Economy
Cowley County has a diverse economy, with a mix of agriculture, manufacturing, and services. The county is home to several large employers, including Winfield Industries, a manufacturer of industrial equipment, and Cowley College, a two-year community college. Agriculture is a major part of the economy, with wheat, corn, and soybeans being the main crops. The county also has a thriving tourism industry, with several attractions, including the Kansas State Fair, the Winfield Country Club, and the Arkansas River.
Demographics
According to the 2020 census, Cowley County has a population of 36,291. The population is mostly white (90.2%), with small percentages of African American (3.2%), Hispanic (2.7%), and Asian (1.3%) residents. The median household income is $50,845, and the median home value is $128,400. The unemployment rate is 4.2%, and the poverty rate is 11.2%.
Education
Cowley County is served by the Winfield Unified School District, which includes seven elementary schools, two middle schools, and one high school. The county is also home to Cowley College, a two-year community college that offers associate degrees and certificate programs. The college also offers a variety of continuing education courses and programs.
Conclusion
Cowley County, Kansas is a diverse and vibrant county located in the south-central part of the state. The county has a strong economy, with a mix of agriculture, manufacturing, and services. The population is mostly white, with small percentages of African American, Hispanic, and Asian residents. The county is served by the Winfield Unified School District and Cowley College, and has a thriving tourism industry.
Common Questions
What is the Total Population of Cowley County?
Total Population of Cowley County is 34,661.
What is the Total Male Population of Cowley County?
Total Male Population of Cowley County is 17,550.
What is the Total Female Population of Cowley County?
Total Female Population of Cowley County is 17,111.
What is the Ratio of Males per 100 Females in Cowley County?
There are 102.57 Males per 100 Females in Cowley County.
What is the Ratio of Females per 100 Males in Cowley County?
There are 97.50 Females per 100 Males in Cowley County.
What is the Median Population Age in Cowley County?
Median Population Age in Cowley County is 38.1 Years.
What is the Average Family Size in Cowley County
Average Family Size in Cowley County is 3.1 People.
What is the Average Household Size in Cowley County
Average Household Size in Cowley County is 2.5 People.
What is Per Capita Income in Cowley County?
Per Capita income in Cowley County is $29,977.
What is the Median Family Income in Cowley County?
Median Family Income in Cowley County is $71,825.
What is the Median Household income in Cowley County?
Median Household Income in Cowley County is $55,726.
What is Income or Wage Gap in Cowley County?
Income or Wage Gap in Cowley County is 25.2%.
Women in Cowley County earn 74.8 cents for every dollar earned by a man.
What is Family Income Deficit in Cowley County?
Family Income Deficit in Cowley County is $10,859.
Families that are below poverty line in Cowley County earn $10,859 less on average than the poverty threshold level.
What is Inequality or Gini Index in Cowley County?
Inequality or Gini Index in Cowley County is 0.46.
How Large is the Labor Force in Cowley County?
There are 16,125 People in the Labor Forcein in Cowley County.
What is the Percentage of People in the Labor Force in Cowley County?
58.7% of People are in the Labor Force in Cowley County.
What is the Unemployment Rate in Cowley County?
Unemployment Rate in Cowley County is 5.3%.