Clay County, KS
Clay County Map

Clay County Overview
8,088
TOTAL POPULATION
4,113
MALE POPULATION
3,975
FEMALE POPULATION
103.47
MALES / 100 FEMALES
96.64
FEMALES / 100 MALES
43.1
MEDIAN AGE
2.8
AVG FAMILY SIZE
2.2
AVG HOUSEHOLD SIZE
$32,628
PER CAPITA INCOME
$75,615
AVG FAMILY INCOME
$57,765
AVG HOUSEHOLD INCOME
39.3%
WAGE / INCOME GAP [ % ]
60.7¢/ $1
WAGE / INCOME GAP [ $ ]
0.42
INEQUALITY / GINI INDEX
3,938
LABOR FORCE [ PEOPLE ]
61.7%
PERCENT IN LABOR FORCE
1.4%
UNEMPLOYMENT RATE
Clay County Area Codes
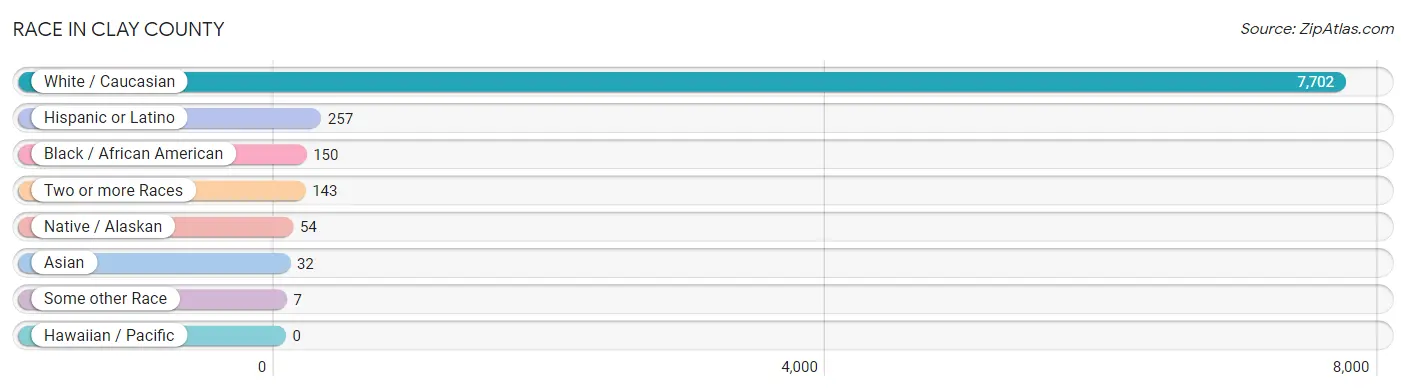
Race in Clay County
The most populous races in Clay County are White / Caucasian (7,702 | 95.2%), Hispanic or Latino (257 | 3.2%), and Black / African American (150 | 1.8%).
| Race | # Population | % Population |
| Asian | 32 | 0.4% |
| Black / African American | 150 | 1.8% |
| Hawaiian / Pacific | 0 | 0.0% |
| Hispanic or Latino | 257 | 3.2% |
| Native / Alaskan | 54 | 0.7% |
| White / Caucasian | 7,702 | 95.2% |
| Two or more Races | 143 | 1.8% |
| Some other Race | 7 | 0.1% |
| Total | 8,088 | 100.0% |
Ancestry in Clay County
The most populous ancestries reported in Clay County are German (2,298 | 28.4%), English (1,287 | 15.9%), Irish (758 | 9.4%), American (546 | 6.8%), and Swedish (418 | 5.2%), together accounting for 65.6% of all Clay County residents.

| Ancestry | # Population | % Population |
| African | 3 | 0.0% |
| American | 546 | 6.8% |
| Australian | 41 | 0.5% |
| Bangladeshi | 9 | 0.1% |
| Belgian | 8 | 0.1% |
| Bhutanese | 24 | 0.3% |
| British | 35 | 0.4% |
| Burmese | 4 | 0.1% |
| Canadian | 2 | 0.0% |
| Cherokee | 3 | 0.0% |
| Creek | 52 | 0.6% |
| Czech | 115 | 1.4% |
| Czechoslovakian | 41 | 0.5% |
| Danish | 6 | 0.1% |
| Dutch | 85 | 1.1% |
| Eastern European | 8 | 0.1% |
| English | 1,287 | 15.9% |
| European | 125 | 1.5% |
| French | 296 | 3.7% |
| French American Indian | 12 | 0.2% |
| French Canadian | 62 | 0.8% |
| German | 2,298 | 28.4% |
| Guamanian / Chamorro | 1 | 0.0% |
| Hungarian | 1 | 0.0% |
| Indian (Asian) | 22 | 0.3% |
| Irish | 758 | 9.4% |
| Italian | 71 | 0.9% |
| Korean | 1 | 0.0% |
| Mexican | 188 | 2.3% |
| Northern European | 12 | 0.2% |
| Norwegian | 86 | 1.1% |
| Pennsylvania German | 4 | 0.1% |
| Polish | 29 | 0.4% |
| Puerto Rican | 46 | 0.6% |
| Russian | 41 | 0.5% |
| Scandinavian | 28 | 0.4% |
| Scotch-Irish | 72 | 0.9% |
| Scottish | 115 | 1.4% |
| Sioux | 5 | 0.1% |
| Slovak | 1 | 0.0% |
| Sri Lankan | 1 | 0.0% |
| Subsaharan African | 3 | 0.0% |
| Swedish | 418 | 5.2% |
| Swiss | 42 | 0.5% |
| Welsh | 88 | 1.1% |
| Yugoslavian | 6 | 0.1% | View All 46 Rows |
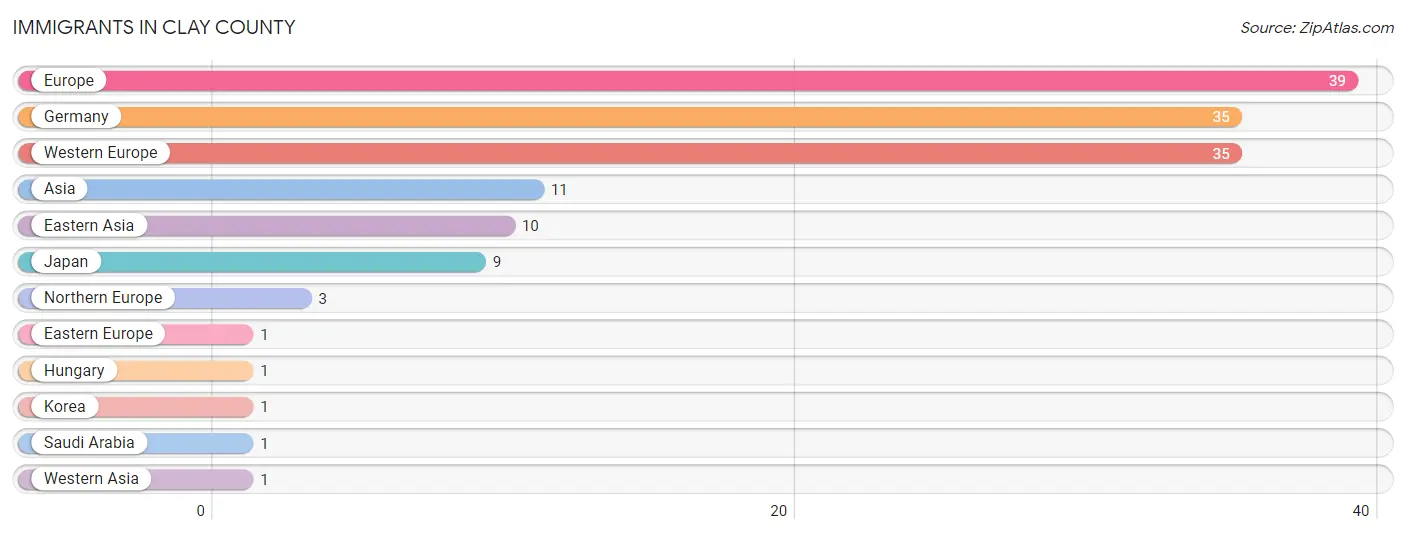
Immigrants in Clay County
The most numerous immigrant groups reported in Clay County came from Europe (39 | 0.5%), Germany (35 | 0.4%), Western Europe (35 | 0.4%), Asia (11 | 0.1%), and Eastern Asia (10 | 0.1%), together accounting for 1.6% of all Clay County residents.
| Immigration Origin | # Population | % Population |
| Asia | 11 | 0.1% |
| Eastern Asia | 10 | 0.1% |
| Eastern Europe | 1 | 0.0% |
| Europe | 39 | 0.5% |
| Germany | 35 | 0.4% |
| Hungary | 1 | 0.0% |
| Japan | 9 | 0.1% |
| Korea | 1 | 0.0% |
| Northern Europe | 3 | 0.0% |
| Saudi Arabia | 1 | 0.0% |
| Western Asia | 1 | 0.0% |
| Western Europe | 35 | 0.4% | View All 12 Rows |
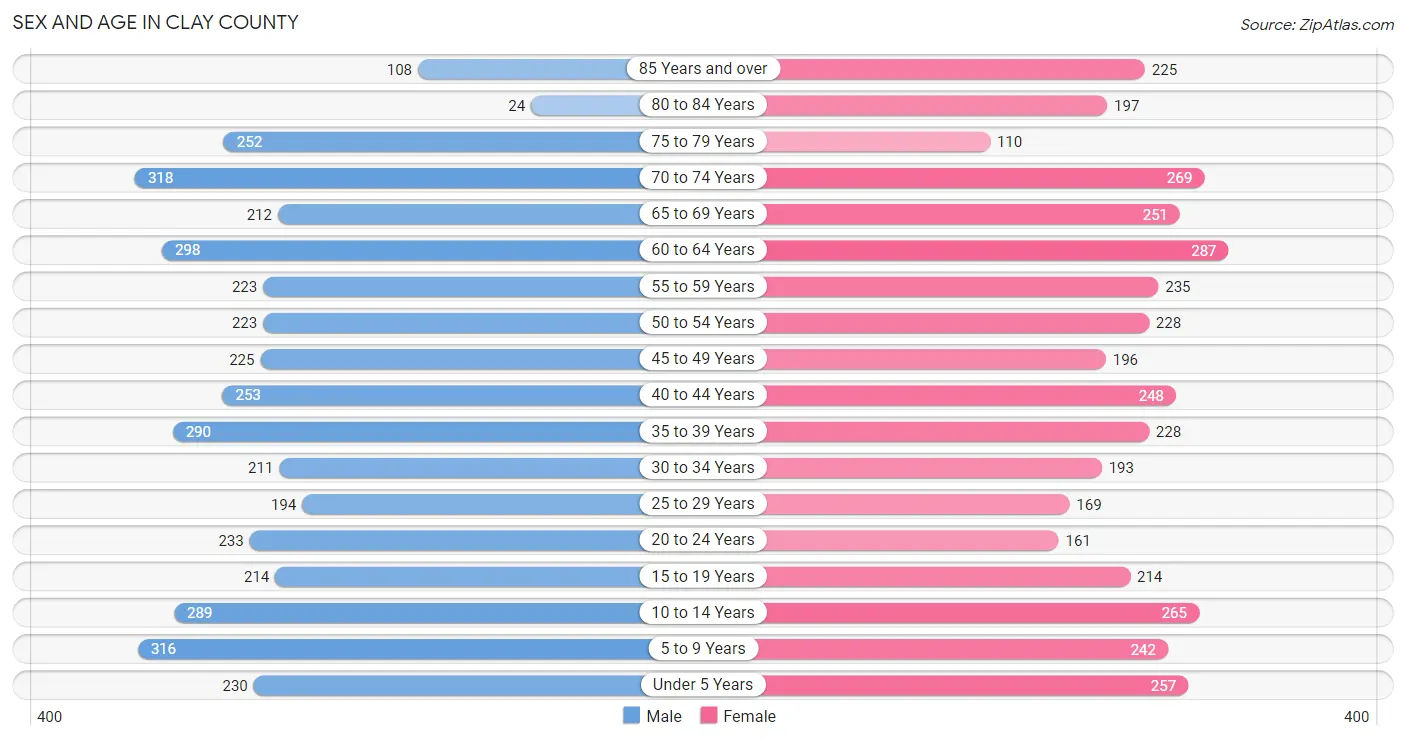
Sex and Age in Clay County
Sex and Age in Clay County
The most populous age groups in Clay County are 70 to 74 Years (318 | 7.7%) for men and 60 to 64 Years (287 | 7.2%) for women.
| Age Bracket | Male | Female |
| Under 5 Years | 230 (5.6%) | 257 (6.5%) |
| 5 to 9 Years | 316 (7.7%) | 242 (6.1%) |
| 10 to 14 Years | 289 (7.0%) | 265 (6.7%) |
| 15 to 19 Years | 214 (5.2%) | 214 (5.4%) |
| 20 to 24 Years | 233 (5.7%) | 161 (4.1%) |
| 25 to 29 Years | 194 (4.7%) | 169 (4.3%) |
| 30 to 34 Years | 211 (5.1%) | 193 (4.9%) |
| 35 to 39 Years | 290 (7.0%) | 228 (5.7%) |
| 40 to 44 Years | 253 (6.1%) | 248 (6.2%) |
| 45 to 49 Years | 225 (5.5%) | 196 (4.9%) |
| 50 to 54 Years | 223 (5.4%) | 228 (5.7%) |
| 55 to 59 Years | 223 (5.4%) | 235 (5.9%) |
| 60 to 64 Years | 298 (7.2%) | 287 (7.2%) |
| 65 to 69 Years | 212 (5.1%) | 251 (6.3%) |
| 70 to 74 Years | 318 (7.7%) | 269 (6.8%) |
| 75 to 79 Years | 252 (6.1%) | 110 (2.8%) |
| 80 to 84 Years | 24 (0.6%) | 197 (5.0%) |
| 85 Years and over | 108 (2.6%) | 225 (5.7%) |
| Total | 4,113 (100.0%) | 3,975 (100.0%) |
Families and Households in Clay County
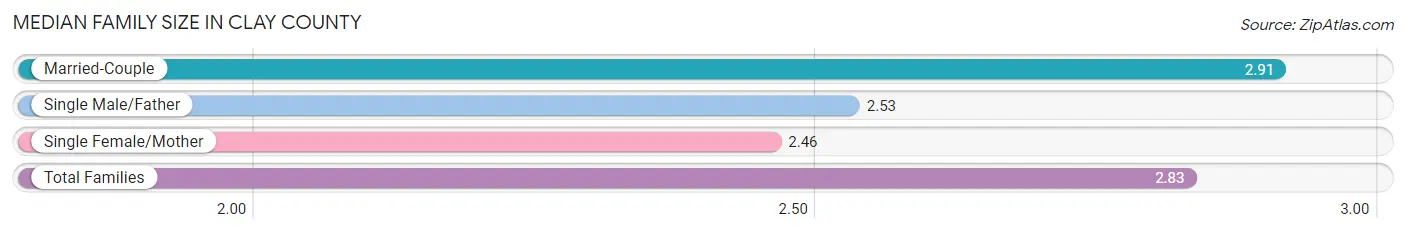
Median Family Size in Clay County
The median family size in Clay County is 2.83 persons per family, with married-couple families (1,769 | 79.7%) accounting for the largest median family size of 2.91 persons per family. On the other hand, single female/mother families (266 | 12.0%) represent the smallest median family size with 2.46 persons per family.
| Family Type | # Families | Family Size |
| Married-Couple | 1,769 (79.7%) | 2.91 |
| Single Male/Father | 184 (8.3%) | 2.53 |
| Single Female/Mother | 266 (12.0%) | 2.46 |
| Total Families | 2,219 (100.0%) | 2.83 |
Median Household Size in Clay County
The median household size in Clay County is 2.22 persons per household, with married-couple households (1,769 | 49.5%) accounting for the largest median household size of 2.92 persons per household. non-family households (1,351 | 37.8%) represent the smallest median household size with 1.11 persons per household.
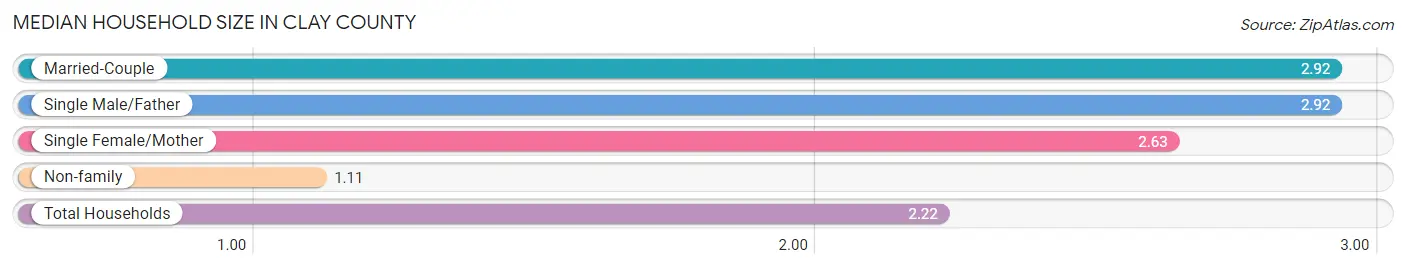
| Household Type | # Households | Household Size |
| Married-Couple | 1,769 (49.5%) | 2.92 |
| Single Male/Father | 184 (5.1%) | 2.92 |
| Single Female/Mother | 266 (7.4%) | 2.63 |
| Non-family | 1,351 (37.8%) | 1.11 |
| Total Households | 3,570 (100.0%) | 2.22 |
Household Size by Marriage Status in Clay County
Out of a total of 3,570 households in Clay County, 2,219 (62.2%) are family households, while 1,351 (37.8%) are nonfamily households. The most numerous type of family households are 2-person households, comprising 1,206, and the most common type of nonfamily households are 1-person households, comprising 1,166.
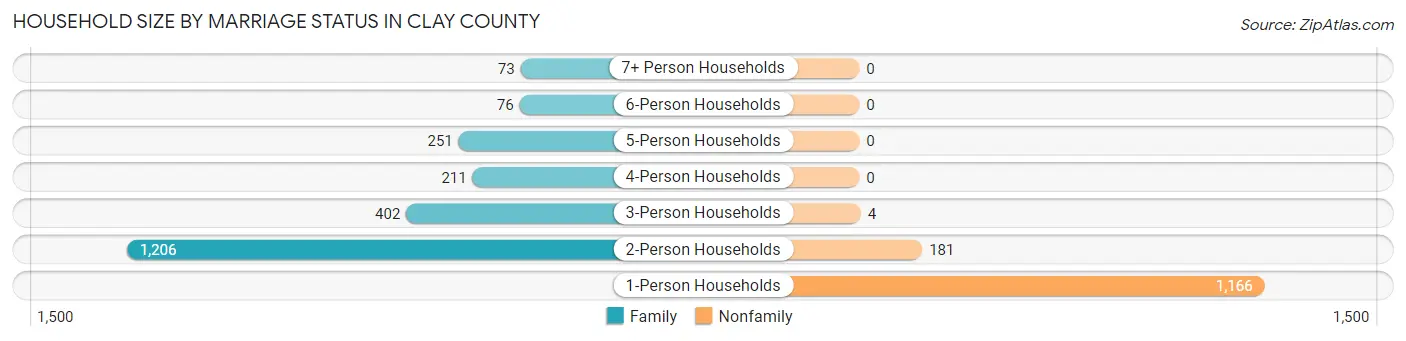
| Household Size | Family Households | Nonfamily Households |
| 1-Person Households | - | 1,166 (32.7%) |
| 2-Person Households | 1,206 (33.8%) | 181 (5.1%) |
| 3-Person Households | 402 (11.3%) | 4 (0.1%) |
| 4-Person Households | 211 (5.9%) | 0 (0.0%) |
| 5-Person Households | 251 (7.0%) | 0 (0.0%) |
| 6-Person Households | 76 (2.1%) | 0 (0.0%) |
| 7+ Person Households | 73 (2.0%) | 0 (0.0%) |
| Total | 2,219 (62.2%) | 1,351 (37.8%) |
Female Fertility in Clay County
Fertility by Age in Clay County
Average fertility rate in Clay County is 87.0 births per 1,000 women. Women in the age bracket of 20 to 34 years have the highest fertility rate with 208.0 births per 1,000 women. Women in the age bracket of 20 to 34 years acount for 83.2% of all women with births.
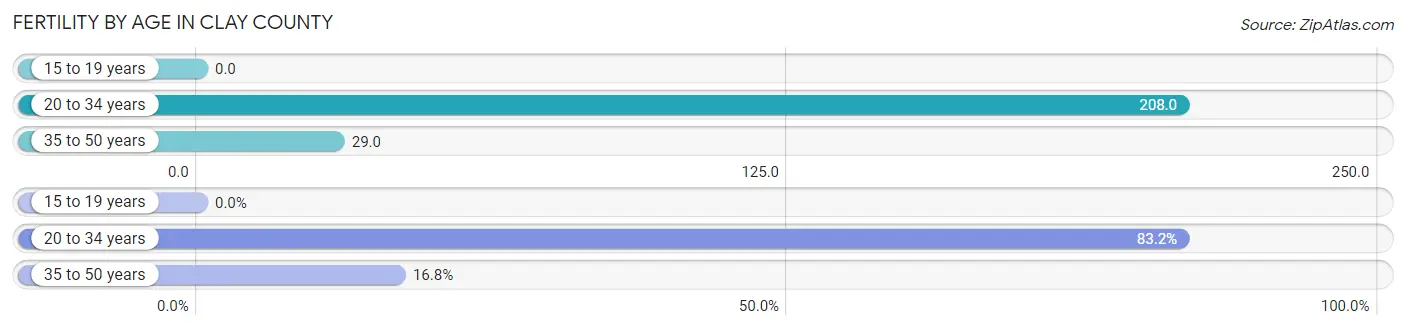
| Age Bracket | Women with Births | Births / 1,000 Women |
| 15 to 19 years | 0 (0.0%) | 0.0 |
| 20 to 34 years | 109 (83.2%) | 208.0 |
| 35 to 50 years | 22 (16.8%) | 29.0 |
| Total | 131 (100.0%) | 87.0 |
Fertility by Age by Marriage Status in Clay County
49.6% of women with births (131) in Clay County are married. The highest percentage of unmarried women with births falls into 20 to 34 years age bracket with 60.6% of them unmarried at the time of birth, while the lowest percentage of unmarried women with births belong to 35 to 50 years age bracket with 0.0% of them unmarried.
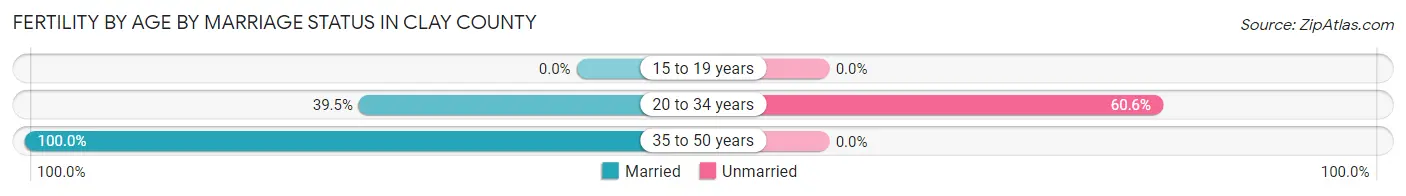
| Age Bracket | Married | Unmarried |
| 15 to 19 years | 0 (0.0%) | 0 (0.0%) |
| 20 to 34 years | 43 (39.5%) | 66 (60.6%) |
| 35 to 50 years | 22 (100.0%) | 0 (0.0%) |
| Total | 65 (49.6%) | 66 (50.4%) |
Fertility by Education in Clay County
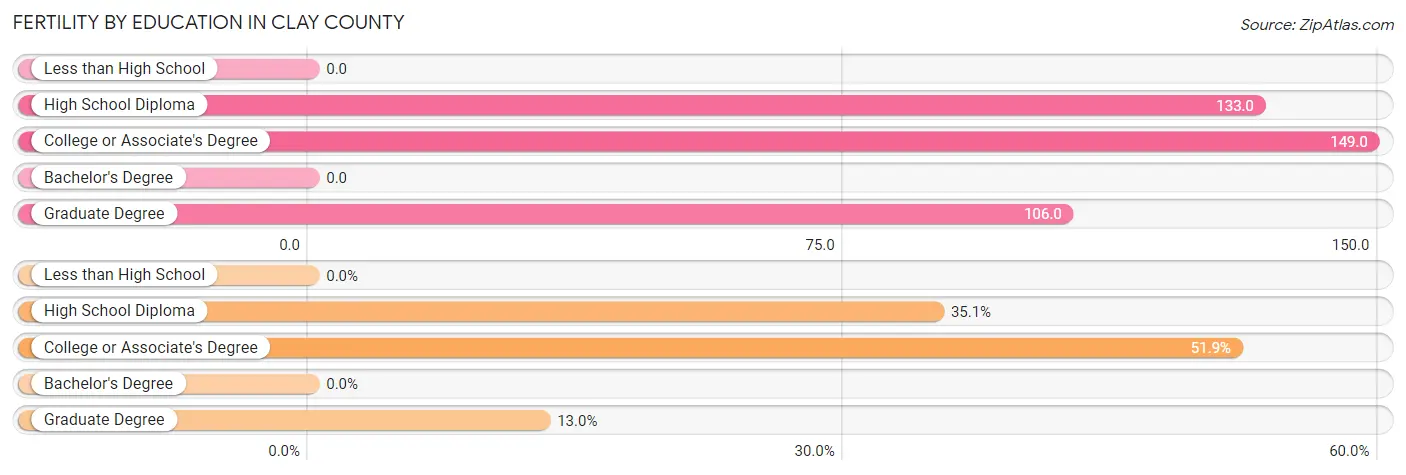
| Educational Attainment | Women with Births | Births / 1,000 Women |
| Less than High School | 0 (0.0%) | 0.0 |
| High School Diploma | 46 (35.1%) | 133.0 |
| College or Associate's Degree | 68 (51.9%) | 149.0 |
| Bachelor's Degree | 0 (0.0%) | 0.0 |
| Graduate Degree | 17 (13.0%) | 106.0 |
| Total | 131 (100.0%) | 87.0 |
Fertility by Education by Marriage Status in Clay County
50.4% of women with births in Clay County are unmarried. Women with the educational attainment of high school diploma are most likely to be married with 100.0% of them married at childbirth, while women with the educational attainment of college or associate's degree are least likely to be married with 97.1% of them unmarried at childbirth.
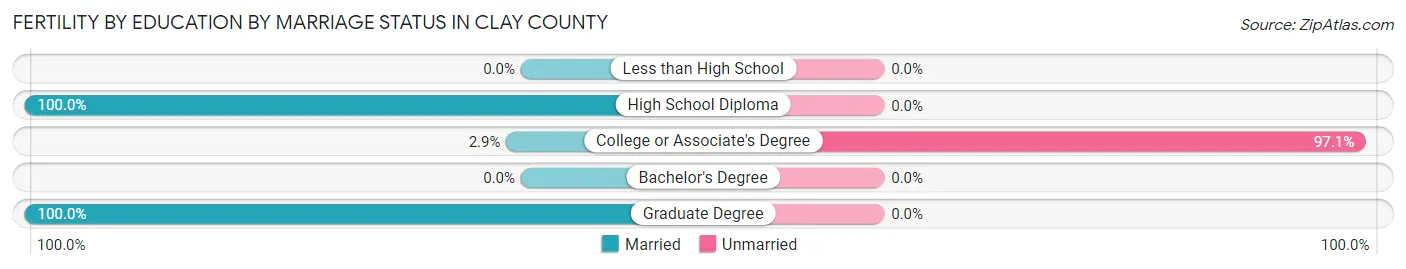
| Educational Attainment | Married | Unmarried |
| Less than High School | 0 (0.0%) | 0 (0.0%) |
| High School Diploma | 46 (100.0%) | 0 (0.0%) |
| College or Associate's Degree | 2 (2.9%) | 66 (97.1%) |
| Bachelor's Degree | 0 (0.0%) | 0 (0.0%) |
| Graduate Degree | 17 (100.0%) | 0 (0.0%) |
| Total | 65 (49.6%) | 66 (50.4%) |
Income in Clay County
Income Overview in Clay County
Per Capita Income in Clay County is $32,628, while median incomes of families and households are $75,615 and $57,765 respectively.
| Characteristic | Number | Measure |
| Per Capita Income | 8,088 | $32,628 |
| Median Family Income | 2,219 | $75,615 |
| Mean Family Income | 2,219 | $87,933 |
| Median Household Income | 3,570 | $57,765 |
| Mean Household Income | 3,570 | $71,763 |
| Income Deficit | 2,219 | $0 |
| Wage / Income Gap (%) | 8,088 | 39.33% |
| Wage / Income Gap ($) | 8,088 | 60.67¢ per $1 |
| Gini / Inequality Index | 8,088 | 0.42 |
Earnings by Sex in Clay County
Average Earnings in Clay County are $36,707, $45,110 for men and $27,368 for women, a difference of 39.3%.
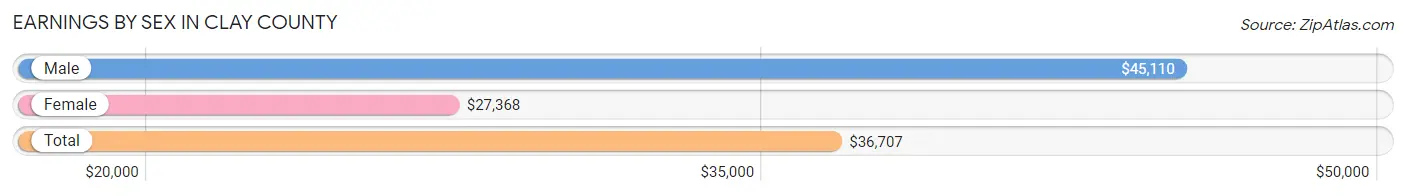
| Sex | Number | Average Earnings |
| Male | 2,259 (54.9%) | $45,110 |
| Female | 1,856 (45.1%) | $27,368 |
| Total | 4,115 (100.0%) | $36,707 |
Earnings by Sex by Income Bracket in Clay County
The most common earnings brackets in Clay County are $75,000 to $99,999 for men (331 | 14.6%) and $45,000 to $49,999 for women (167 | 9.0%).
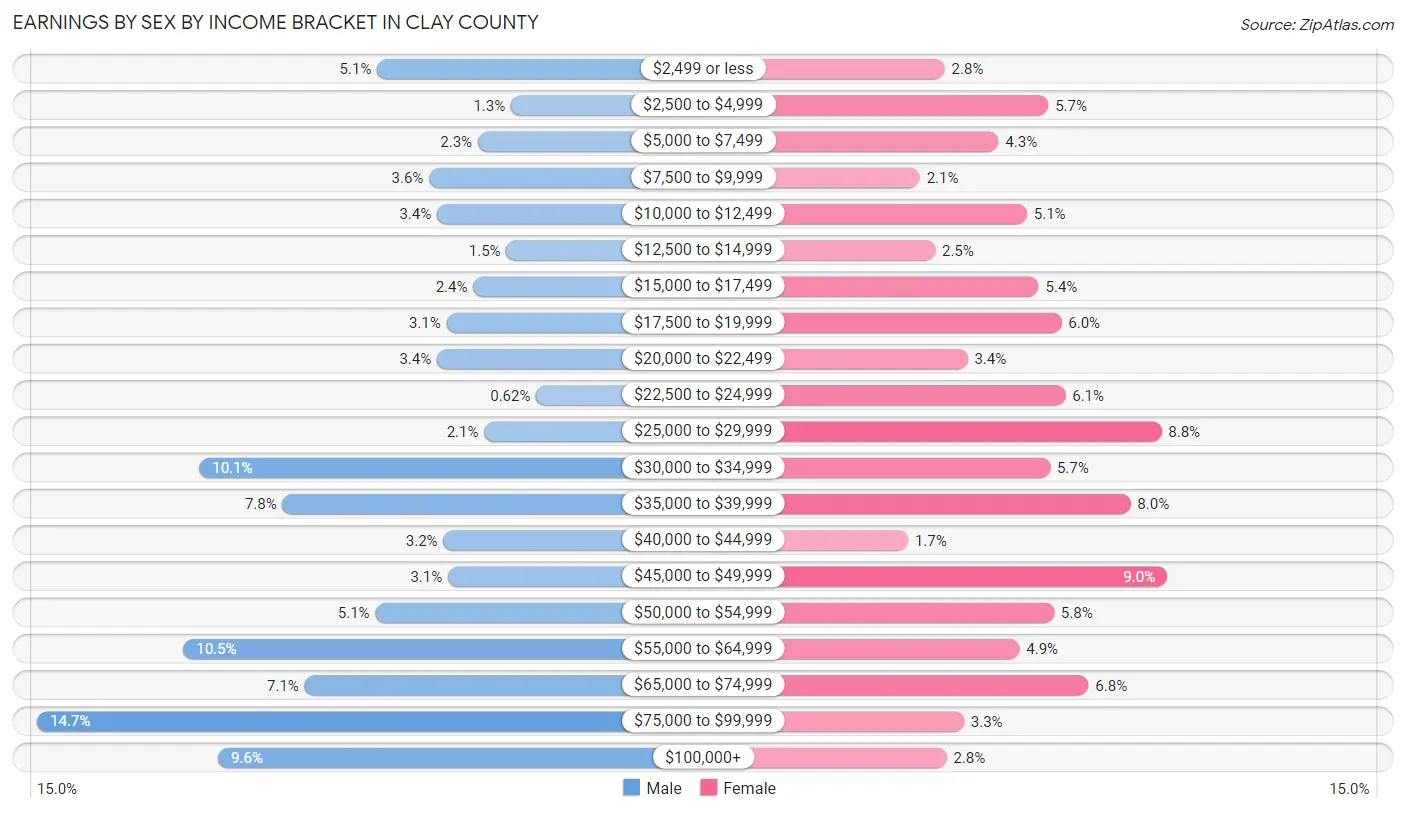
| Income | Male | Female |
| $2,499 or less | 115 (5.1%) | 51 (2.8%) |
| $2,500 to $4,999 | 30 (1.3%) | 105 (5.7%) |
| $5,000 to $7,499 | 51 (2.3%) | 79 (4.3%) |
| $7,500 to $9,999 | 82 (3.6%) | 38 (2.1%) |
| $10,000 to $12,499 | 77 (3.4%) | 94 (5.1%) |
| $12,500 to $14,999 | 33 (1.5%) | 46 (2.5%) |
| $15,000 to $17,499 | 54 (2.4%) | 100 (5.4%) |
| $17,500 to $19,999 | 71 (3.1%) | 112 (6.0%) |
| $20,000 to $22,499 | 77 (3.4%) | 63 (3.4%) |
| $22,500 to $24,999 | 14 (0.6%) | 114 (6.1%) |
| $25,000 to $29,999 | 47 (2.1%) | 164 (8.8%) |
| $30,000 to $34,999 | 228 (10.1%) | 106 (5.7%) |
| $35,000 to $39,999 | 175 (7.7%) | 148 (8.0%) |
| $40,000 to $44,999 | 73 (3.2%) | 32 (1.7%) |
| $45,000 to $49,999 | 70 (3.1%) | 167 (9.0%) |
| $50,000 to $54,999 | 116 (5.1%) | 108 (5.8%) |
| $55,000 to $64,999 | 238 (10.5%) | 90 (4.9%) |
| $65,000 to $74,999 | 161 (7.1%) | 126 (6.8%) |
| $75,000 to $99,999 | 331 (14.6%) | 61 (3.3%) |
| $100,000+ | 216 (9.6%) | 52 (2.8%) |
| Total | 2,259 (100.0%) | 1,856 (100.0%) |
Earnings by Sex by Educational Attainment in Clay County
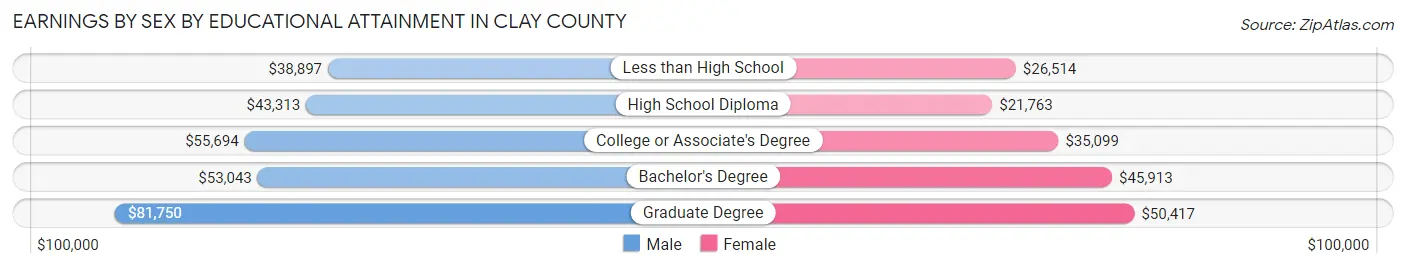
Average earnings in Clay County are $54,119 for men and $32,308 for women, a difference of 40.3%. Men with an educational attainment of graduate degree enjoy the highest average annual earnings of $81,750, while those with less than high school education earn the least with $38,897. Women with an educational attainment of graduate degree earn the most with the average annual earnings of $50,417, while those with high school diploma education have the smallest earnings of $21,763.
| Educational Attainment | Male Income | Female Income |
| Less than High School | $38,897 | $26,514 |
| High School Diploma | $43,313 | $21,763 |
| College or Associate's Degree | $55,694 | $35,099 |
| Bachelor's Degree | $53,043 | $45,913 |
| Graduate Degree | $81,750 | $50,417 |
| Total | $54,119 | $32,308 |
Family Income in Clay County
Family Income Brackets in Clay County
According to the Clay County family income data, there are 466 families falling into the $50,000 to $74,999 income range, which is the most common income bracket and makes up 21.0% of all families. Conversely, the $10,000 to $14,999 income bracket is the least frequent group with only 40 families (1.8%) belonging to this category.

| Income Bracket | # Families | % Families |
| Less than $10,000 | 73 | 3.3% |
| $10,000 to $14,999 | 40 | 1.8% |
| $15,000 to $24,999 | 115 | 5.2% |
| $25,000 to $34,999 | 71 | 3.2% |
| $35,000 to $49,999 | 326 | 14.7% |
| $50,000 to $74,999 | 466 | 21.0% |
| $75,000 to $99,999 | 411 | 18.5% |
| $100,000 to $149,999 | 428 | 19.3% |
| $150,000 to $199,999 | 180 | 8.1% |
| $200,000+ | 107 | 4.8% |
Family Income by Famaliy Size in Clay County
5-person families (238 | 10.7%) account for the highest median family income in Clay County with $115,102 per family, while 2-person families (1,235 | 55.7%) have the highest median income of $33,912 per family member.

| Income Bracket | # Families | Median Income |
| 2-Person Families | 1,235 (55.7%) | $67,823 |
| 3-Person Families | 413 (18.6%) | $77,529 |
| 4-Person Families | 184 (8.3%) | $59,663 |
| 5-Person Families | 238 (10.7%) | $115,102 |
| 6-Person Families | 76 (3.4%) | $103,833 |
| 7+ Person Families | 73 (3.3%) | $93,325 |
| Total | 2,219 (100.0%) | $75,615 |
Family Income by Number of Earners in Clay County
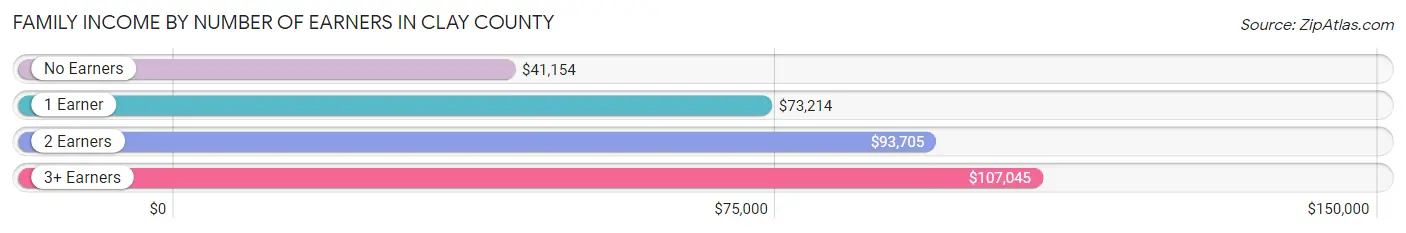
The median family income in Clay County is $75,615, with families comprising 3+ earners (144) having the highest median family income of $107,045, while families with no earners (566) have the lowest median family income of $41,154, accounting for 6.5% and 25.5% of families, respectively.
| Number of Earners | # Families | Median Income |
| No Earners | 566 (25.5%) | $41,154 |
| 1 Earner | 548 (24.7%) | $73,214 |
| 2 Earners | 961 (43.3%) | $93,705 |
| 3+ Earners | 144 (6.5%) | $107,045 |
| Total | 2,219 (100.0%) | $75,615 |
Household Income in Clay County
Household Income Brackets in Clay County
With 828 households falling in the category, the $50,000 to $74,999 income range is the most frequent in Clay County, accounting for 23.2% of all households. In contrast, only 86 households (2.4%) fall into the less than $10,000 income bracket, making it the least populous group.

| Income Bracket | # Households | % Households |
| Less than $10,000 | 86 | 2.4% |
| $10,000 to $14,999 | 221 | 6.2% |
| $15,000 to $24,999 | 489 | 13.7% |
| $25,000 to $34,999 | 225 | 6.3% |
| $35,000 to $49,999 | 461 | 12.9% |
| $50,000 to $74,999 | 828 | 23.2% |
| $75,000 to $99,999 | 428 | 12.0% |
| $100,000 to $149,999 | 514 | 14.4% |
| $150,000 to $199,999 | 189 | 5.3% |
| $200,000+ | 132 | 3.7% |
Household Income by Householder Age in Clay County
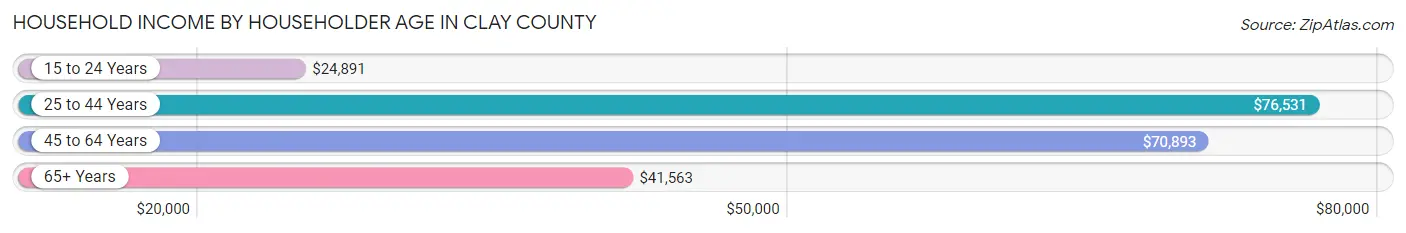
The median household income in Clay County is $57,765, with the highest median household income of $76,531 found in the 25 to 44 years age bracket for the primary householder. A total of 851 households (23.8%) fall into this category. Meanwhile, the 15 to 24 years age bracket for the primary householder has the lowest median household income of $24,891, with 294 households (8.2%) in this group.
| Income Bracket | # Households | Median Income |
| 15 to 24 Years | 294 (8.2%) | $24,891 |
| 25 to 44 Years | 851 (23.8%) | $76,531 |
| 45 to 64 Years | 1,250 (35.0%) | $70,893 |
| 65+ Years | 1,175 (32.9%) | $41,563 |
| Total | 3,570 (100.0%) | $57,765 |
Poverty in Clay County
Income Below Poverty by Sex and Age in Clay County
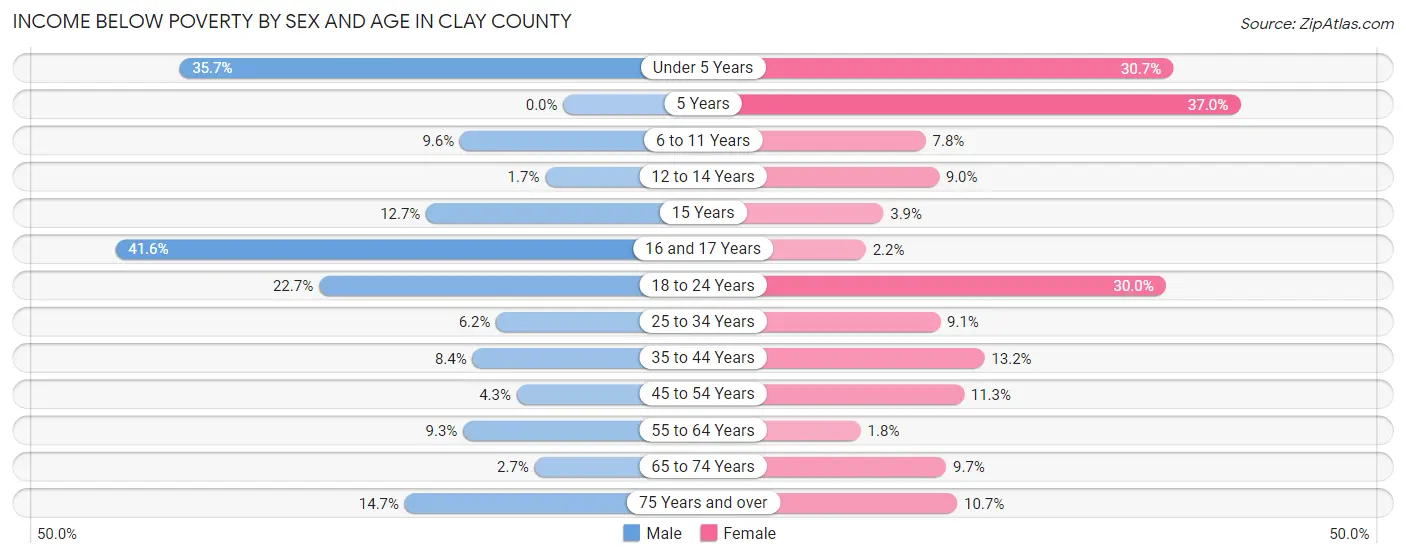
With 10.9% poverty level for males and 11.8% for females among the residents of Clay County, 16 and 17 year old males and 5 year old females are the most vulnerable to poverty, with 42 males (41.6%) and 17 females (37.0%) in their respective age groups living below the poverty level.
| Age Bracket | Male | Female |
| Under 5 Years | 82 (35.6%) | 79 (30.7%) |
| 5 Years | 0 (0.0%) | 17 (37.0%) |
| 6 to 11 Years | 42 (9.6%) | 20 (7.8%) |
| 12 to 14 Years | 2 (1.7%) | 18 (9.0%) |
| 15 Years | 7 (12.7%) | 2 (3.8%) |
| 16 and 17 Years | 42 (41.6%) | 2 (2.2%) |
| 18 to 24 Years | 61 (22.7%) | 70 (30.0%) |
| 25 to 34 Years | 24 (6.2%) | 33 (9.1%) |
| 35 to 44 Years | 45 (8.4%) | 63 (13.2%) |
| 45 to 54 Years | 19 (4.3%) | 48 (11.3%) |
| 55 to 64 Years | 48 (9.3%) | 9 (1.8%) |
| 65 to 74 Years | 14 (2.7%) | 48 (9.7%) |
| 75 Years and over | 49 (14.7%) | 55 (10.7%) |
| Total | 435 (10.9%) | 464 (11.8%) |
Income Above Poverty by Sex and Age in Clay County
According to the poverty statistics in Clay County, males aged 5 years and females aged 55 to 64 years are the age groups that are most secure financially, with 100.0% of males and 98.3% of females in these age groups living above the poverty line.
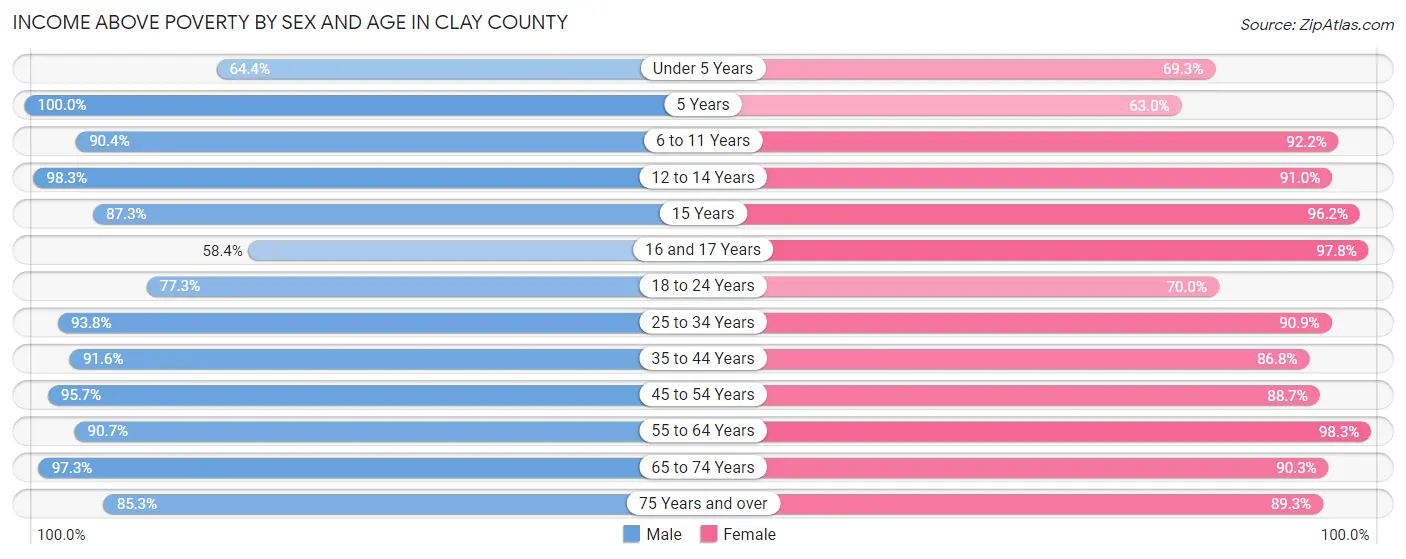
| Age Bracket | Male | Female |
| Under 5 Years | 148 (64.3%) | 178 (69.3%) |
| 5 Years | 48 (100.0%) | 29 (63.0%) |
| 6 to 11 Years | 396 (90.4%) | 237 (92.2%) |
| 12 to 14 Years | 117 (98.3%) | 182 (91.0%) |
| 15 Years | 48 (87.3%) | 50 (96.2%) |
| 16 and 17 Years | 59 (58.4%) | 88 (97.8%) |
| 18 to 24 Years | 208 (77.3%) | 163 (70.0%) |
| 25 to 34 Years | 362 (93.8%) | 329 (90.9%) |
| 35 to 44 Years | 489 (91.6%) | 413 (86.8%) |
| 45 to 54 Years | 421 (95.7%) | 376 (88.7%) |
| 55 to 64 Years | 468 (90.7%) | 506 (98.3%) |
| 65 to 74 Years | 513 (97.3%) | 448 (90.3%) |
| 75 Years and over | 284 (85.3%) | 459 (89.3%) |
| Total | 3,561 (89.1%) | 3,458 (88.2%) |
Income Below Poverty Among Married-Couple Families in Clay County
The poverty statistics for married-couple families in Clay County show that 4.2% or 74 of the total 1,769 families live below the poverty line. Families with 5 or more children have the highest poverty rate of 89.5%, comprising of 17 families. On the other hand, families with 1 or 2 children have the lowest poverty rate of 0.8%, which includes 3 families.
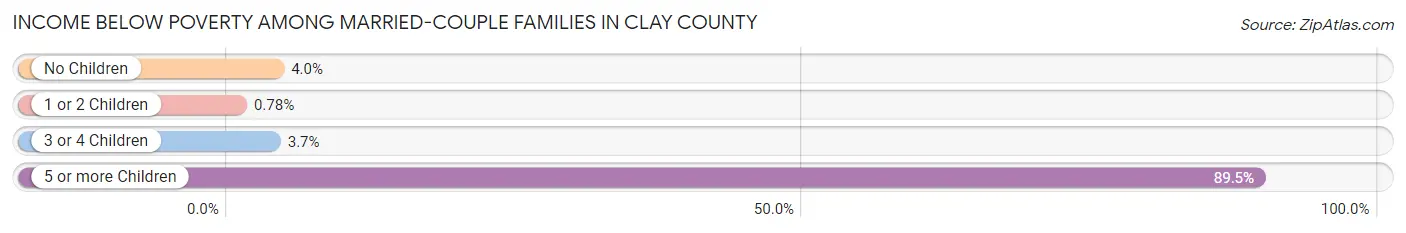
| Children | Above Poverty | Below Poverty |
| No Children | 1,050 (96.0%) | 44 (4.0%) |
| 1 or 2 Children | 384 (99.2%) | 3 (0.8%) |
| 3 or 4 Children | 259 (96.3%) | 10 (3.7%) |
| 5 or more Children | 2 (10.5%) | 17 (89.5%) |
| Total | 1,695 (95.8%) | 74 (4.2%) |
Income Below Poverty Among Single-Parent Households in Clay County
According to the poverty data in Clay County, 14.1% or 26 single-father households and 37.6% or 100 single-mother households are living below the poverty line. Among single-father households, those with 1 or 2 children have the highest poverty rate, with 26 households (31.3%) experiencing poverty. Likewise, among single-mother households, those with 1 or 2 children have the highest poverty rate, with 98 households (70.0%) falling below the poverty line.
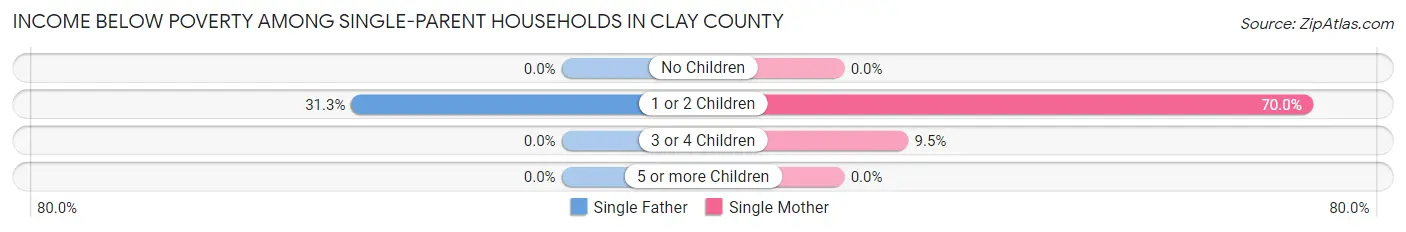
| Children | Single Father | Single Mother |
| No Children | 0 (0.0%) | 0 (0.0%) |
| 1 or 2 Children | 26 (31.3%) | 98 (70.0%) |
| 3 or 4 Children | 0 (0.0%) | 2 (9.5%) |
| 5 or more Children | 0 (0.0%) | 0 (0.0%) |
| Total | 26 (14.1%) | 100 (37.6%) |
Income Below Poverty Among Married-Couple vs Single-Parent Households in Clay County
The poverty data for Clay County shows that 74 of the married-couple family households (4.2%) and 126 of the single-parent households (28.0%) are living below the poverty level. Within the married-couple family households, those with 5 or more children have the highest poverty rate, with 17 households (89.5%) falling below the poverty line. Among the single-parent households, those with 1 or 2 children have the highest poverty rate, with 124 household (55.6%) living below poverty.
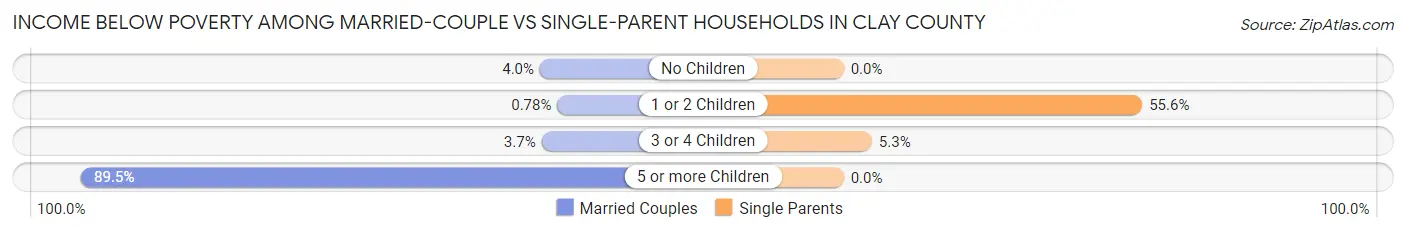
| Children | Married-Couple Families | Single-Parent Households |
| No Children | 44 (4.0%) | 0 (0.0%) |
| 1 or 2 Children | 3 (0.8%) | 124 (55.6%) |
| 3 or 4 Children | 10 (3.7%) | 2 (5.3%) |
| 5 or more Children | 17 (89.5%) | 0 (0.0%) |
| Total | 74 (4.2%) | 126 (28.0%) |
Employment Characteristics in Clay County
Employment by Class of Employer in Clay County
Among the 3,851 employed individuals in Clay County, private company employees (1,966 | 51.0%), self-employed (not incorporated) (567 | 14.7%), and local government employees (408 | 10.6%) make up the most common classes of employment.

| Employer Class | # Employees | % Employees |
| Private Company Employees | 1,966 | 51.0% |
| Self-Employed (Incorporated) | 91 | 2.4% |
| Self-Employed (Not Incorporated) | 567 | 14.7% |
| Not-for-profit Organizations | 270 | 7.0% |
| Local Government Employees | 408 | 10.6% |
| State Government Employees | 163 | 4.2% |
| Federal Government Employees | 381 | 9.9% |
| Unpaid Family Workers | 5 | 0.1% |
| Total | 3,851 | 100.0% |
Employment Status by Age in Clay County
According to the labor force statistics for Clay County, out of the total population over 16 years of age (6,382), 61.7% or 3,938 individuals are in the labor force, with 1.4% or 55 of them unemployed. The age group with the highest labor force participation rate is 55 to 59 years, with 88.6% or 406 individuals in the labor force. Within the labor force, the 25 to 29 years age range has the highest percentage of unemployed individuals, with 4.4% or 12 of them being unemployed.

| Age Bracket | In Labor Force | Unemployed |
| 16 to 19 Years | 206 (64.2%) | 8 (3.9%) |
| 20 to 24 Years | 300 (76.1%) | 0 (0.0%) |
| 25 to 29 Years | 280 (77.1%) | 12 (4.4%) |
| 30 to 34 Years | 299 (74.0%) | 3 (1.0%) |
| 35 to 44 Years | 877 (86.1%) | 24 (2.7%) |
| 45 to 54 Years | 715 (82.0%) | 6 (0.9%) |
| 55 to 59 Years | 406 (88.6%) | 2 (0.5%) |
| 60 to 64 Years | 442 (75.6%) | 0 (0.0%) |
| 65 to 74 Years | 340 (32.4%) | 0 (0.0%) |
| 75 Years and over | 74 (8.1%) | 0 (0.0%) |
| Total | 3,938 (61.7%) | 55 (1.4%) |
Employment Status by Educational Attainment in Clay County
According to labor force statistics for Clay County, 81.6% of individuals (3,020) out of the total population between 25 and 64 years of age (3,701) are in the labor force, with 1.5% or 45 of them being unemployed. The group with the highest labor force participation rate are those with the educational attainment of bachelor's degree or higher, with 88.2% or 1,042 individuals in the labor force. Within the labor force, individuals with high school diploma education have the highest percentage of unemployment, with 3.7% or 32 of them being unemployed.
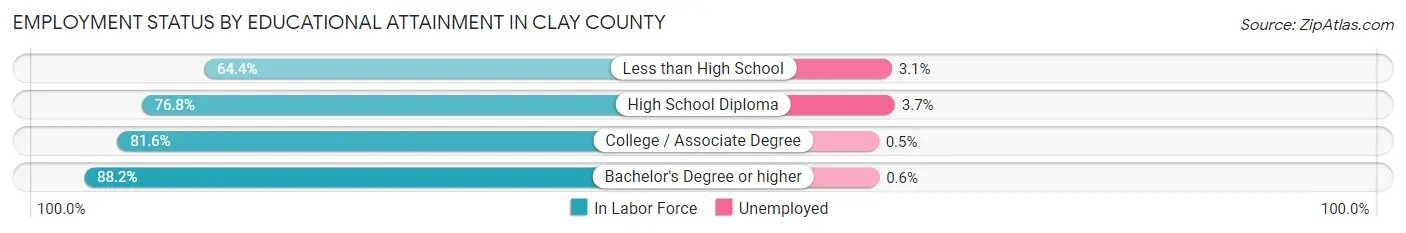
| Educational Attainment | In Labor Force | Unemployed |
| Less than High School | 96 (64.4%) | 5 (3.1%) |
| High School Diploma | 872 (76.8%) | 42 (3.7%) |
| College / Associate Degree | 1,009 (81.6%) | 6 (0.5%) |
| Bachelor's Degree or higher | 1,042 (88.2%) | 7 (0.6%) |
| Total | 3,020 (81.6%) | 56 (1.5%) |
Employment Occupations by Sex in Clay County
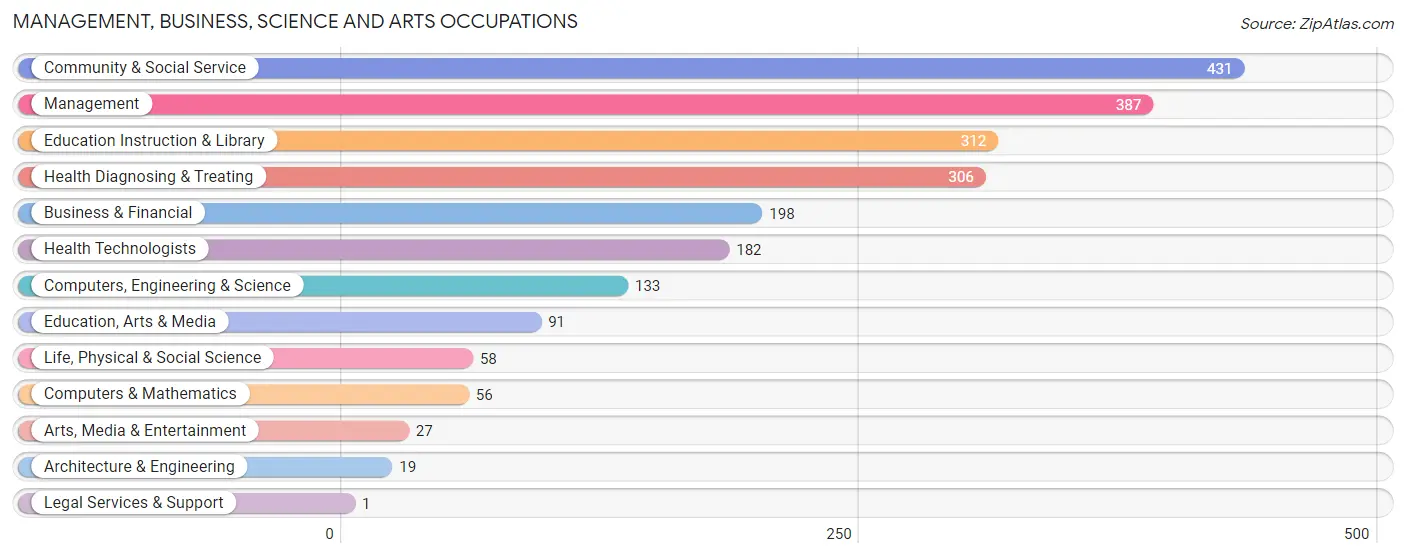
Management, Business, Science and Arts Occupations
The most common Management, Business, Science and Arts occupations in Clay County are Community & Social Service (431 | 11.4%), Management (387 | 10.2%), Education Instruction & Library (312 | 8.2%), Health Diagnosing & Treating (306 | 8.1%), and Business & Financial (198 | 5.2%).
Management, Business, Science and Arts Occupations by Sex
Within the Management, Business, Science and Arts occupations in Clay County, the most male-oriented occupations are Computers & Mathematics (100.0%), Legal Services & Support (100.0%), and Architecture & Engineering (89.5%), while the most female-oriented occupations are Health Diagnosing & Treating (90.2%), Education Instruction & Library (86.5%), and Health Technologists (83.5%).

| Occupation | Male | Female |
| Management | 246 (63.6%) | 141 (36.4%) |
| Business & Financial | 46 (23.2%) | 152 (76.8%) |
| Computers, Engineering & Science | 115 (86.5%) | 18 (13.5%) |
| Computers & Mathematics | 56 (100.0%) | 0 (0.0%) |
| Architecture & Engineering | 17 (89.5%) | 2 (10.5%) |
| Life, Physical & Social Science | 42 (72.4%) | 16 (27.6%) |
| Community & Social Service | 99 (23.0%) | 332 (77.0%) |
| Education, Arts & Media | 34 (37.4%) | 57 (62.6%) |
| Legal Services & Support | 1 (100.0%) | 0 (0.0%) |
| Education Instruction & Library | 42 (13.5%) | 270 (86.5%) |
| Arts, Media & Entertainment | 22 (81.5%) | 5 (18.5%) |
| Health Diagnosing & Treating | 30 (9.8%) | 276 (90.2%) |
| Health Technologists | 30 (16.5%) | 152 (83.5%) |
| Total (Category) | 536 (36.8%) | 919 (63.2%) |
| Total (Overall) | 2,041 (53.8%) | 1,753 (46.2%) |
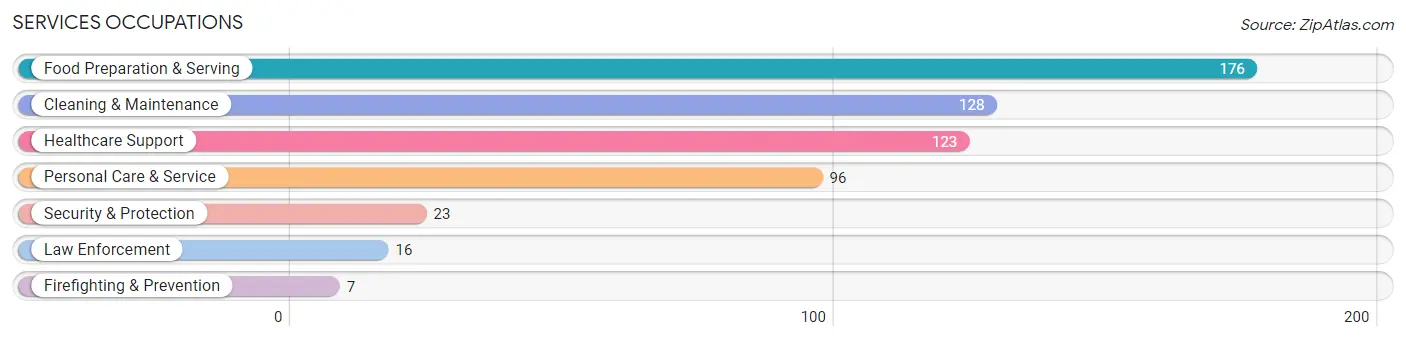
Services Occupations
The most common Services occupations in Clay County are Food Preparation & Serving (176 | 4.6%), Cleaning & Maintenance (128 | 3.4%), Healthcare Support (123 | 3.2%), Personal Care & Service (96 | 2.5%), and Security & Protection (23 | 0.6%).
Services Occupations by Sex
Within the Services occupations in Clay County, the most male-oriented occupations are Law Enforcement (100.0%), Security & Protection (95.7%), and Firefighting & Prevention (85.7%), while the most female-oriented occupations are Healthcare Support (100.0%), Personal Care & Service (78.1%), and Food Preparation & Serving (62.5%).

| Occupation | Male | Female |
| Healthcare Support | 0 (0.0%) | 123 (100.0%) |
| Security & Protection | 22 (95.7%) | 1 (4.3%) |
| Firefighting & Prevention | 6 (85.7%) | 1 (14.3%) |
| Law Enforcement | 16 (100.0%) | 0 (0.0%) |
| Food Preparation & Serving | 66 (37.5%) | 110 (62.5%) |
| Cleaning & Maintenance | 96 (75.0%) | 32 (25.0%) |
| Personal Care & Service | 21 (21.9%) | 75 (78.1%) |
| Total (Category) | 205 (37.6%) | 341 (62.5%) |
| Total (Overall) | 2,041 (53.8%) | 1,753 (46.2%) |
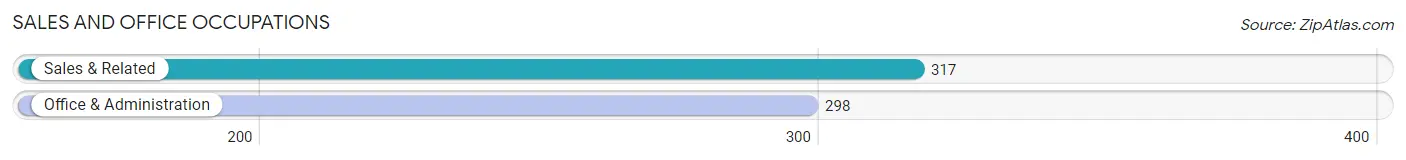
Sales and Office Occupations
The most common Sales and Office occupations in Clay County are Sales & Related (317 | 8.4%), and Office & Administration (298 | 7.9%).
Sales and Office Occupations by Sex

| Occupation | Male | Female |
| Sales & Related | 170 (53.6%) | 147 (46.4%) |
| Office & Administration | 53 (17.8%) | 245 (82.2%) |
| Total (Category) | 223 (36.3%) | 392 (63.7%) |
| Total (Overall) | 2,041 (53.8%) | 1,753 (46.2%) |
Natural Resources, Construction and Maintenance Occupations
The most common Natural Resources, Construction and Maintenance occupations in Clay County are Construction & Extraction (266 | 7.0%), Installation, Maintenance & Repair (164 | 4.3%), and Farming, Fishing & Forestry (60 | 1.6%).
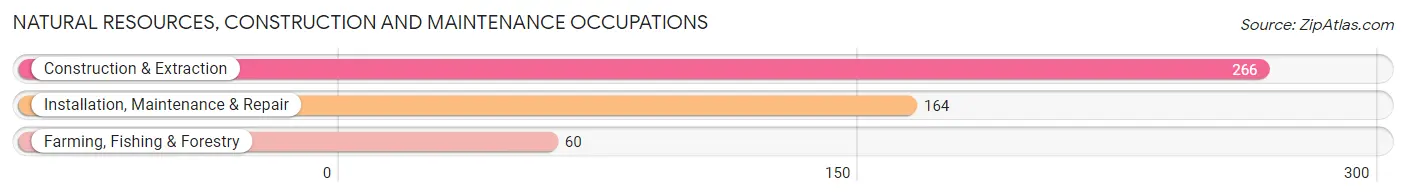
Natural Resources, Construction and Maintenance Occupations by Sex
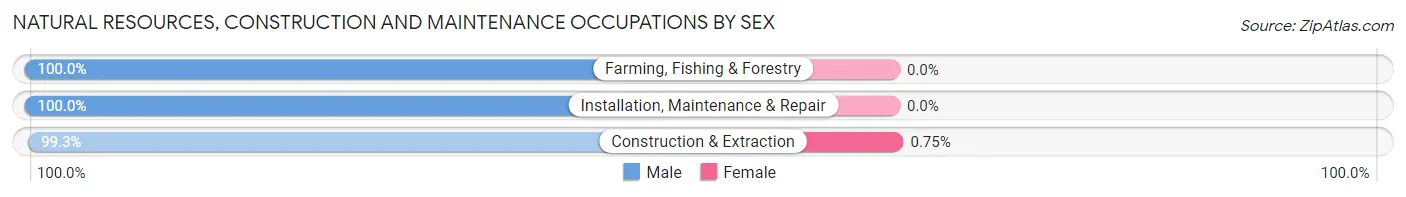
| Occupation | Male | Female |
| Farming, Fishing & Forestry | 60 (100.0%) | 0 (0.0%) |
| Construction & Extraction | 264 (99.3%) | 2 (0.7%) |
| Installation, Maintenance & Repair | 164 (100.0%) | 0 (0.0%) |
| Total (Category) | 488 (99.6%) | 2 (0.4%) |
| Total (Overall) | 2,041 (53.8%) | 1,753 (46.2%) |
Production, Transportation and Moving Occupations
The most common Production, Transportation and Moving occupations in Clay County are Production (325 | 8.6%), Transportation (204 | 5.4%), and Material Moving (159 | 4.2%).
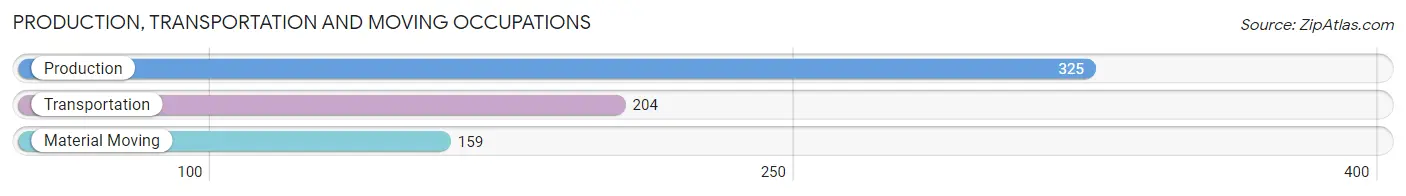
Production, Transportation and Moving Occupations by Sex

| Occupation | Male | Female |
| Production | 266 (81.9%) | 59 (18.1%) |
| Transportation | 166 (81.4%) | 38 (18.6%) |
| Material Moving | 157 (98.7%) | 2 (1.3%) |
| Total (Category) | 589 (85.6%) | 99 (14.4%) |
| Total (Overall) | 2,041 (53.8%) | 1,753 (46.2%) |
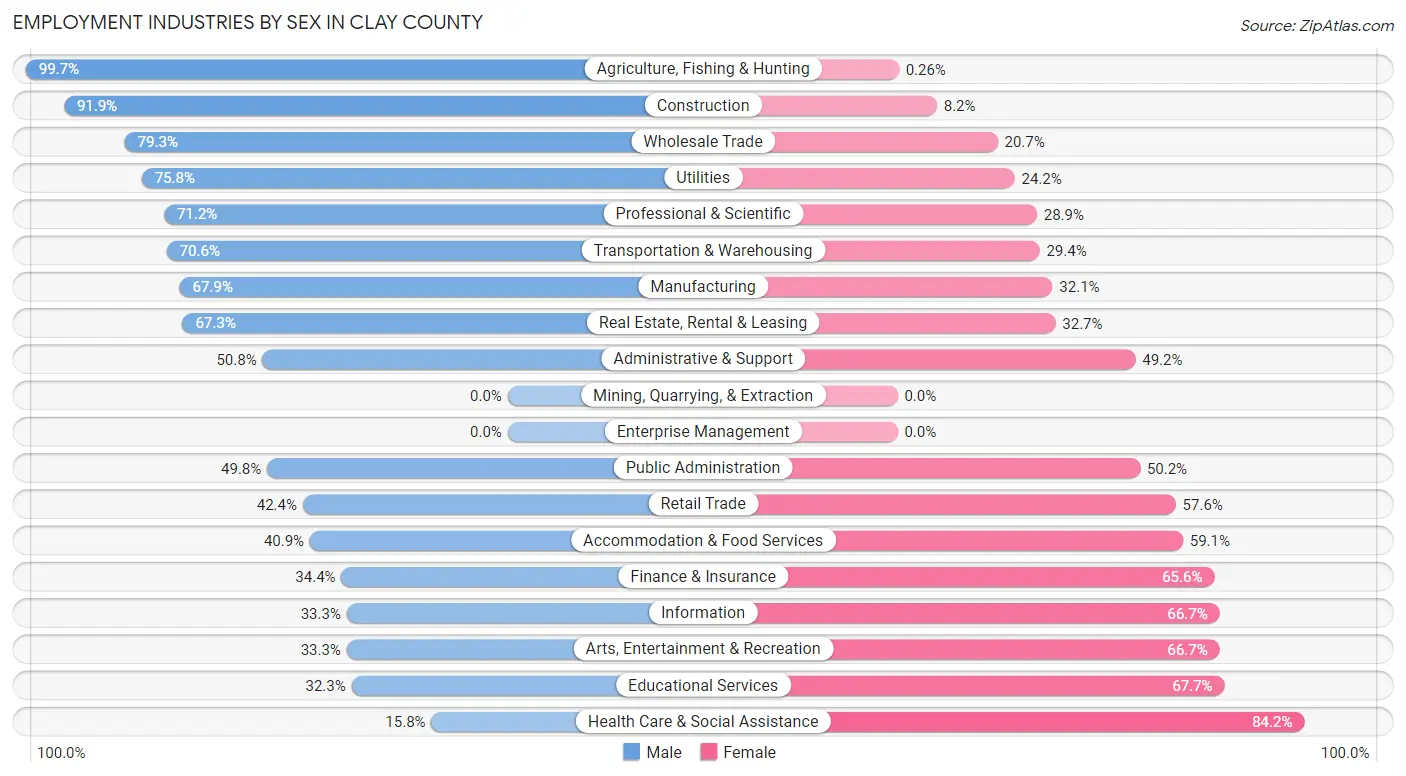
Employment Industries by Sex in Clay County
Employment Industries in Clay County
The major employment industries in Clay County include Health Care & Social Assistance (633 | 16.7%), Manufacturing (424 | 11.2%), Agriculture, Fishing & Hunting (382 | 10.1%), Construction (356 | 9.4%), and Retail Trade (323 | 8.5%).
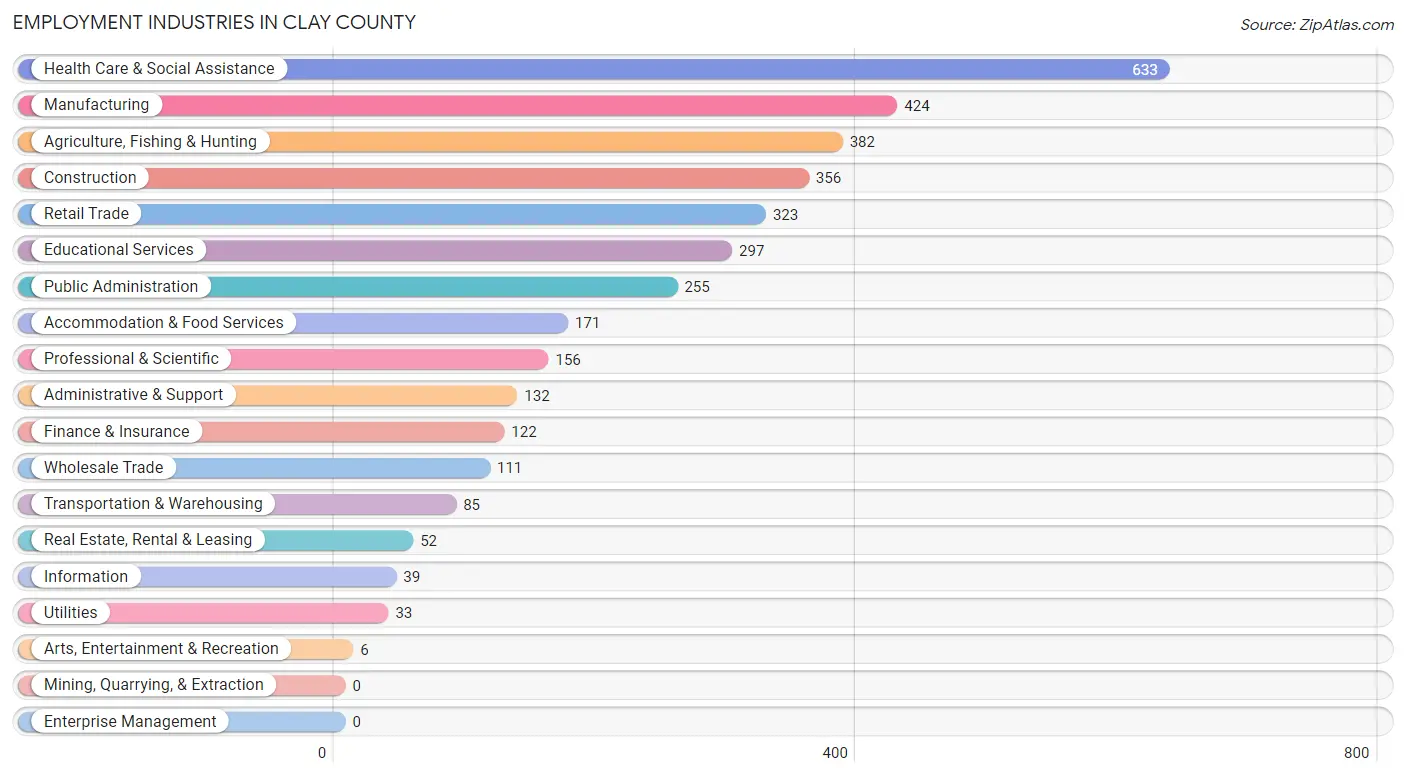
Employment Industries by Sex in Clay County
The Clay County industries that see more men than women are Agriculture, Fishing & Hunting (99.7%), Construction (91.8%), and Wholesale Trade (79.3%), whereas the industries that tend to have a higher number of women are Health Care & Social Assistance (84.2%), Educational Services (67.7%), and Information (66.7%).
| Industry | Male | Female |
| Agriculture, Fishing & Hunting | 381 (99.7%) | 1 (0.3%) |
| Mining, Quarrying, & Extraction | 0 (0.0%) | 0 (0.0%) |
| Construction | 327 (91.8%) | 29 (8.2%) |
| Manufacturing | 288 (67.9%) | 136 (32.1%) |
| Wholesale Trade | 88 (79.3%) | 23 (20.7%) |
| Retail Trade | 137 (42.4%) | 186 (57.6%) |
| Transportation & Warehousing | 60 (70.6%) | 25 (29.4%) |
| Utilities | 25 (75.8%) | 8 (24.2%) |
| Information | 13 (33.3%) | 26 (66.7%) |
| Finance & Insurance | 42 (34.4%) | 80 (65.6%) |
| Real Estate, Rental & Leasing | 35 (67.3%) | 17 (32.7%) |
| Professional & Scientific | 111 (71.2%) | 45 (28.8%) |
| Enterprise Management | 0 (0.0%) | 0 (0.0%) |
| Administrative & Support | 67 (50.8%) | 65 (49.2%) |
| Educational Services | 96 (32.3%) | 201 (67.7%) |
| Health Care & Social Assistance | 100 (15.8%) | 533 (84.2%) |
| Arts, Entertainment & Recreation | 2 (33.3%) | 4 (66.7%) |
| Accommodation & Food Services | 70 (40.9%) | 101 (59.1%) |
| Public Administration | 127 (49.8%) | 128 (50.2%) |
| Total | 2,041 (53.8%) | 1,753 (46.2%) |
Education in Clay County
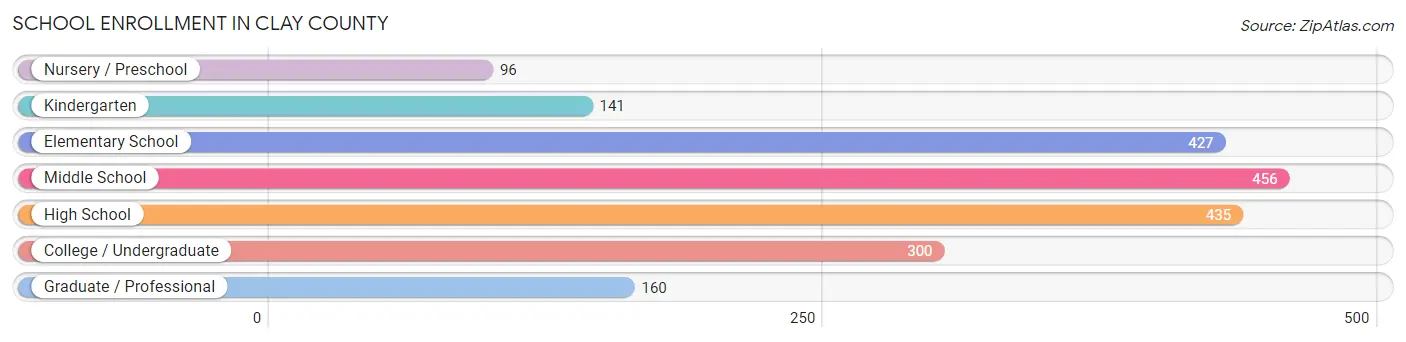
School Enrollment in Clay County
The most common levels of schooling among the 2,015 students in Clay County are middle school (456 | 22.6%), high school (435 | 21.6%), and elementary school (427 | 21.2%).
| School Level | # Students | % Students |
| Nursery / Preschool | 96 | 4.8% |
| Kindergarten | 141 | 7.0% |
| Elementary School | 427 | 21.2% |
| Middle School | 456 | 22.6% |
| High School | 435 | 21.6% |
| College / Undergraduate | 300 | 14.9% |
| Graduate / Professional | 160 | 7.9% |
| Total | 2,015 | 100.0% |
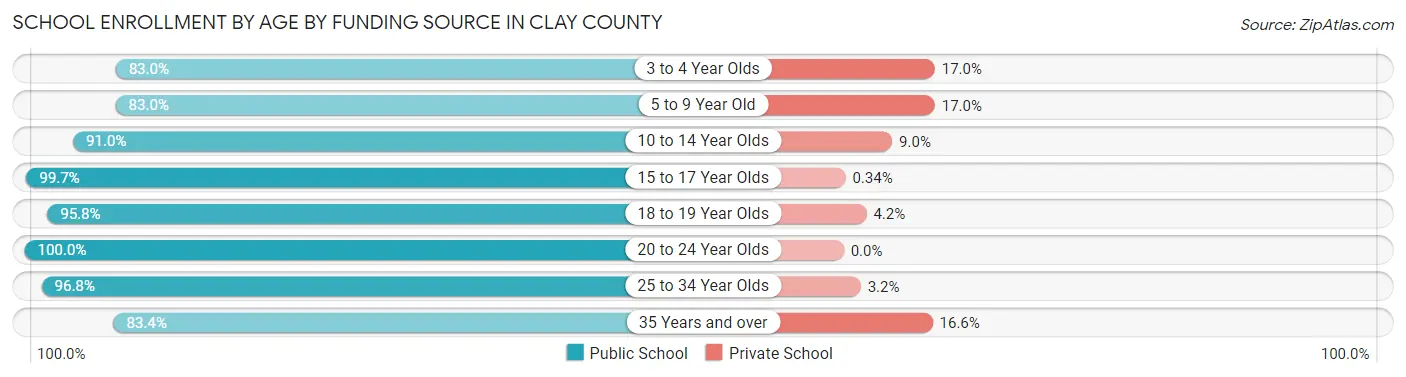
School Enrollment by Age by Funding Source in Clay County
Out of a total of 2,015 students who are enrolled in schools in Clay County, 193 (9.6%) attend a private institution, while the remaining 1,822 (90.4%) are enrolled in public schools. The age group of 3 to 4 year olds has the highest likelihood of being enrolled in private schools, with 9 (17.0% in the age bracket) enrolled. Conversely, the age group of 20 to 24 year olds has the lowest likelihood of being enrolled in a private school, with 30 (100.0% in the age bracket) attending a public institution.
| Age Bracket | Public School | Private School |
| 3 to 4 Year Olds | 44 (83.0%) | 9 (17.0%) |
| 5 to 9 Year Old | 460 (83.0%) | 94 (17.0%) |
| 10 to 14 Year Olds | 504 (91.0%) | 50 (9.0%) |
| 15 to 17 Year Olds | 296 (99.7%) | 1 (0.3%) |
| 18 to 19 Year Olds | 113 (95.8%) | 5 (4.2%) |
| 20 to 24 Year Olds | 30 (100.0%) | 0 (0.0%) |
| 25 to 34 Year Olds | 244 (96.8%) | 8 (3.2%) |
| 35 Years and over | 131 (83.4%) | 26 (16.6%) |
| Total | 1,822 (90.4%) | 193 (9.6%) |
Educational Attainment by Field of Study in Clay County
Education (450 | 28.0%), bio, nature & agricultural (326 | 20.3%), business (307 | 19.1%), science & technology (103 | 6.4%), and visual & performing arts (91 | 5.7%) are the most common fields of study among 1,610 individuals in Clay County who have obtained a bachelor's degree or higher.

| Field of Study | # Graduates | % Graduates |
| Computers & Mathematics | 23 | 1.4% |
| Bio, Nature & Agricultural | 326 | 20.3% |
| Physical & Health Sciences | 20 | 1.2% |
| Psychology | 1 | 0.1% |
| Social Sciences | 26 | 1.6% |
| Engineering | 79 | 4.9% |
| Multidisciplinary Studies | 23 | 1.4% |
| Science & Technology | 103 | 6.4% |
| Business | 307 | 19.1% |
| Education | 450 | 28.0% |
| Literature & Languages | 3 | 0.2% |
| Liberal Arts & History | 62 | 3.8% |
| Visual & Performing Arts | 91 | 5.7% |
| Communications | 32 | 2.0% |
| Arts & Humanities | 64 | 4.0% |
| Total | 1,610 | 100.0% |
Transportation & Commute in Clay County
Vehicle Availability by Sex in Clay County
The most prevalent vehicle ownership categories in Clay County are males with 2 vehicles (902, accounting for 42.5%) and females with 2 vehicles (535, making up 52.3%).

| Vehicles Available | Male | Female |
| No Vehicle | 51 (2.4%) | 18 (1.0%) |
| 1 Vehicle | 286 (13.5%) | 365 (21.2%) |
| 2 Vehicles | 902 (42.5%) | 535 (31.0%) |
| 3 Vehicles | 510 (24.0%) | 532 (30.8%) |
| 4 Vehicles | 236 (11.1%) | 169 (9.8%) |
| 5 or more Vehicles | 138 (6.5%) | 106 (6.1%) |
| Total | 2,123 (100.0%) | 1,725 (100.0%) |
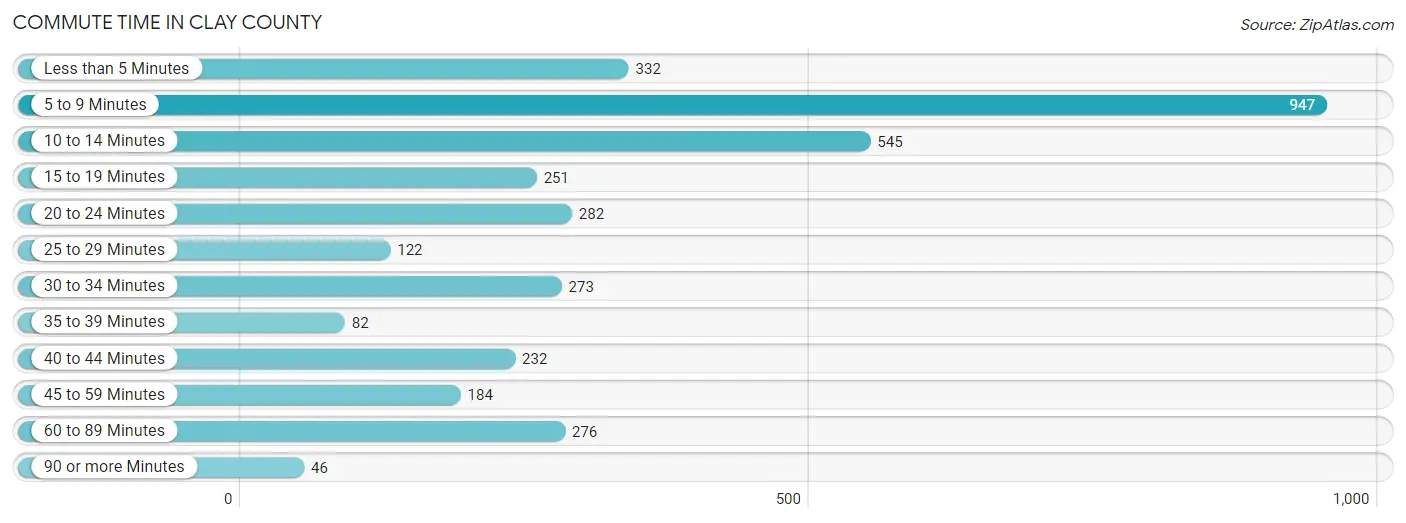
Commute Time in Clay County
The most frequently occuring commute durations in Clay County are 5 to 9 minutes (947 commuters, 26.5%), 10 to 14 minutes (545 commuters, 15.3%), and less than 5 minutes (332 commuters, 9.3%).
| Commute Time | # Commuters | % Commuters |
| Less than 5 Minutes | 332 | 9.3% |
| 5 to 9 Minutes | 947 | 26.5% |
| 10 to 14 Minutes | 545 | 15.3% |
| 15 to 19 Minutes | 251 | 7.0% |
| 20 to 24 Minutes | 282 | 7.9% |
| 25 to 29 Minutes | 122 | 3.4% |
| 30 to 34 Minutes | 273 | 7.6% |
| 35 to 39 Minutes | 82 | 2.3% |
| 40 to 44 Minutes | 232 | 6.5% |
| 45 to 59 Minutes | 184 | 5.1% |
| 60 to 89 Minutes | 276 | 7.7% |
| 90 or more Minutes | 46 | 1.3% |
Commute Time by Sex in Clay County
The most common commute times in Clay County are 5 to 9 minutes (661 commuters, 33.4%) for males and 10 to 14 minutes (320 commuters, 20.1%) for females.
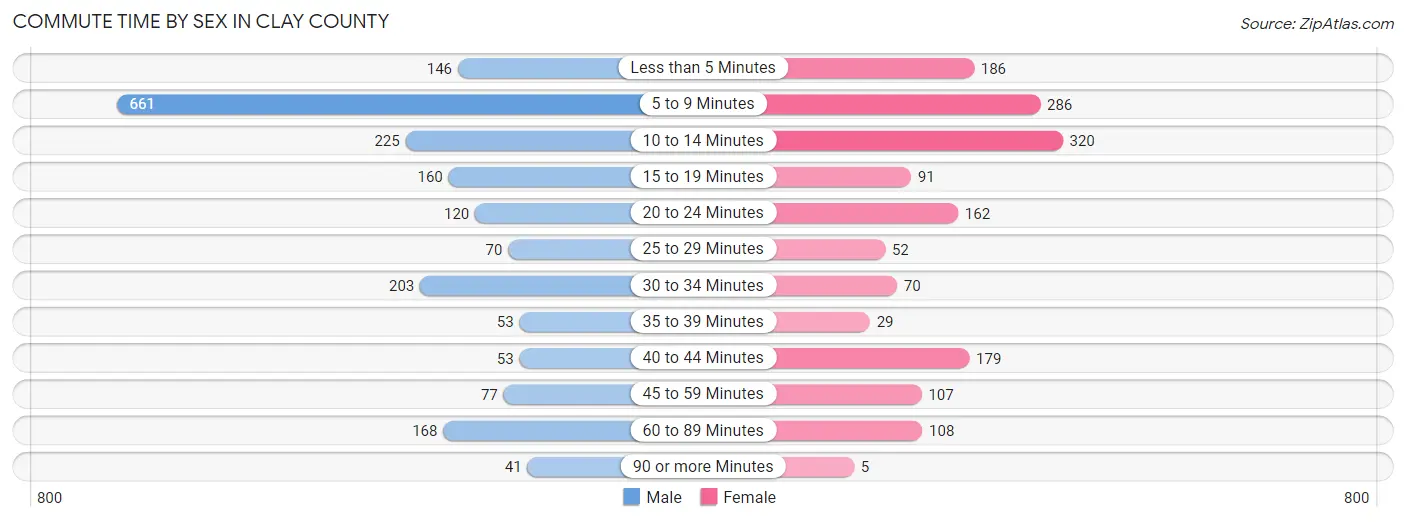
| Commute Time | Male | Female |
| Less than 5 Minutes | 146 (7.4%) | 186 (11.7%) |
| 5 to 9 Minutes | 661 (33.4%) | 286 (17.9%) |
| 10 to 14 Minutes | 225 (11.4%) | 320 (20.1%) |
| 15 to 19 Minutes | 160 (8.1%) | 91 (5.7%) |
| 20 to 24 Minutes | 120 (6.1%) | 162 (10.2%) |
| 25 to 29 Minutes | 70 (3.5%) | 52 (3.3%) |
| 30 to 34 Minutes | 203 (10.3%) | 70 (4.4%) |
| 35 to 39 Minutes | 53 (2.7%) | 29 (1.8%) |
| 40 to 44 Minutes | 53 (2.7%) | 179 (11.2%) |
| 45 to 59 Minutes | 77 (3.9%) | 107 (6.7%) |
| 60 to 89 Minutes | 168 (8.5%) | 108 (6.8%) |
| 90 or more Minutes | 41 (2.1%) | 5 (0.3%) |
Time of Departure to Work by Sex in Clay County
The most frequent times of departure to work in Clay County are 7:00 AM to 7:29 AM (481, 24.3%) for males and 7:30 AM to 7:59 AM (336, 21.1%) for females.

| Time of Departure | Male | Female |
| 12:00 AM to 4:59 AM | 31 (1.6%) | 23 (1.4%) |
| 5:00 AM to 5:29 AM | 75 (3.8%) | 25 (1.6%) |
| 5:30 AM to 5:59 AM | 200 (10.1%) | 64 (4.0%) |
| 6:00 AM to 6:29 AM | 166 (8.4%) | 77 (4.8%) |
| 6:30 AM to 6:59 AM | 212 (10.7%) | 166 (10.4%) |
| 7:00 AM to 7:29 AM | 481 (24.3%) | 241 (15.1%) |
| 7:30 AM to 7:59 AM | 355 (18.0%) | 336 (21.1%) |
| 8:00 AM to 8:29 AM | 224 (11.3%) | 151 (9.5%) |
| 8:30 AM to 8:59 AM | 57 (2.9%) | 49 (3.1%) |
| 9:00 AM to 9:59 AM | 13 (0.7%) | 121 (7.6%) |
| 10:00 AM to 10:59 AM | 24 (1.2%) | 56 (3.5%) |
| 11:00 AM to 11:59 AM | 1 (0.1%) | 1 (0.1%) |
| 12:00 PM to 3:59 PM | 87 (4.4%) | 183 (11.5%) |
| 4:00 PM to 11:59 PM | 51 (2.6%) | 102 (6.4%) |
| Total | 1,977 (100.0%) | 1,595 (100.0%) |
Housing Occupancy in Clay County
Occupancy by Ownership in Clay County
Of the total 3,570 dwellings in Clay County, owner-occupied units account for 2,549 (71.4%), while renter-occupied units make up 1,021 (28.6%).
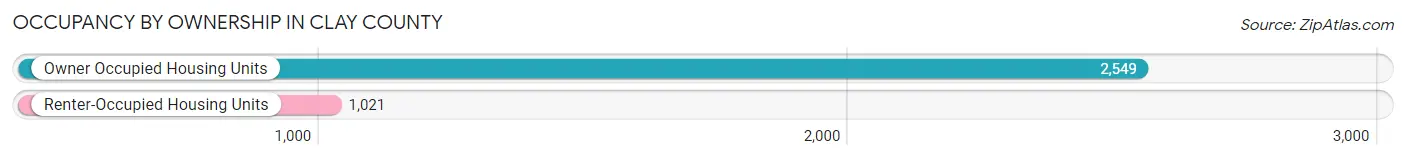
| Occupancy | # Housing Units | % Housing Units |
| Owner Occupied Housing Units | 2,549 | 71.4% |
| Renter-Occupied Housing Units | 1,021 | 28.6% |
| Total Occupied Housing Units | 3,570 | 100.0% |
Occupancy by Household Size in Clay County
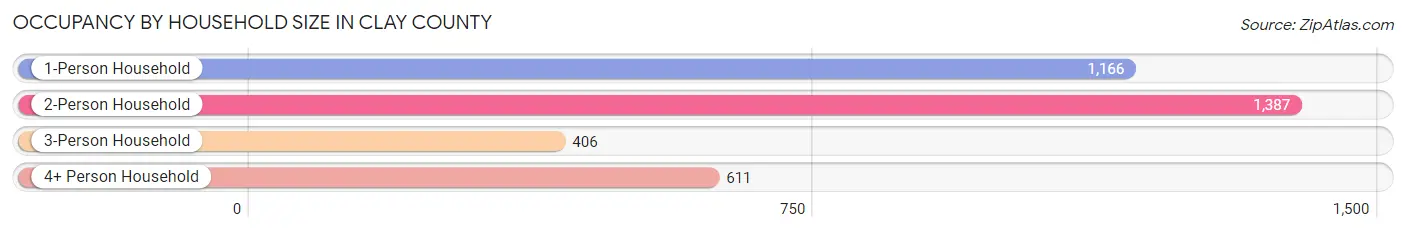
| Household Size | # Housing Units | % Housing Units |
| 1-Person Household | 1,166 | 32.7% |
| 2-Person Household | 1,387 | 38.9% |
| 3-Person Household | 406 | 11.4% |
| 4+ Person Household | 611 | 17.1% |
| Total Housing Units | 3,570 | 100.0% |
Occupancy by Ownership by Household Size in Clay County
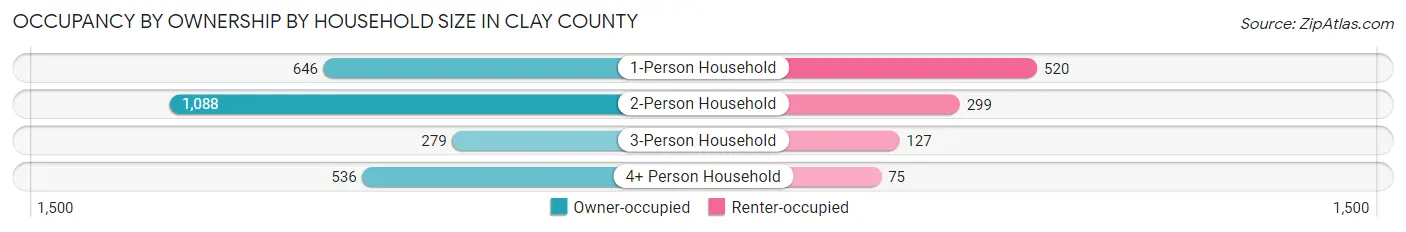
| Household Size | Owner-occupied | Renter-occupied |
| 1-Person Household | 646 (55.4%) | 520 (44.6%) |
| 2-Person Household | 1,088 (78.4%) | 299 (21.6%) |
| 3-Person Household | 279 (68.7%) | 127 (31.3%) |
| 4+ Person Household | 536 (87.7%) | 75 (12.3%) |
| Total Housing Units | 2,549 (71.4%) | 1,021 (28.6%) |
Occupancy by Educational Attainment in Clay County
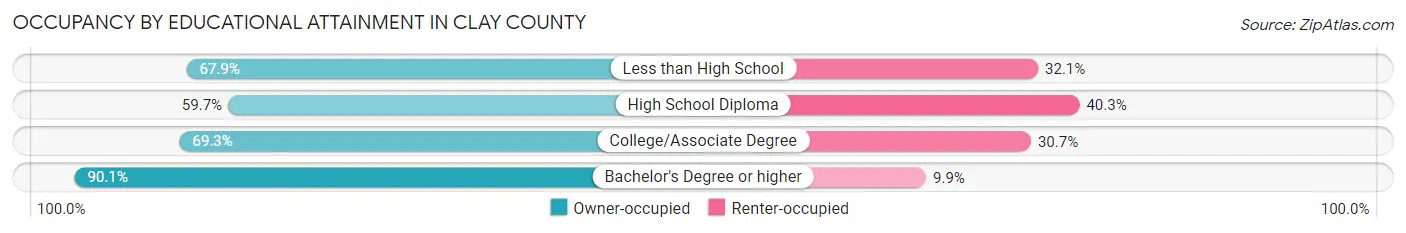
| Household Size | Owner-occupied | Renter-occupied |
| Less than High School | 148 (67.9%) | 70 (32.1%) |
| High School Diploma | 665 (59.7%) | 449 (40.3%) |
| College/Associate Degree | 935 (69.3%) | 414 (30.7%) |
| Bachelor's Degree or higher | 801 (90.1%) | 88 (9.9%) |
Occupancy by Age of Householder in Clay County
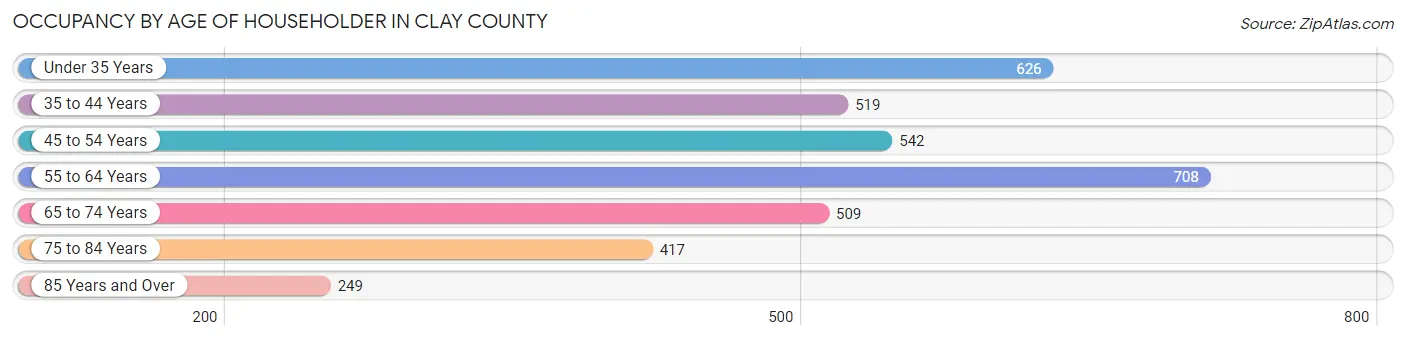
| Age Bracket | # Households | % Households |
| Under 35 Years | 626 | 17.5% |
| 35 to 44 Years | 519 | 14.5% |
| 45 to 54 Years | 542 | 15.2% |
| 55 to 64 Years | 708 | 19.8% |
| 65 to 74 Years | 509 | 14.3% |
| 75 to 84 Years | 417 | 11.7% |
| 85 Years and Over | 249 | 7.0% |
| Total | 3,570 | 100.0% |
Housing Finances in Clay County
Median Income by Occupancy in Clay County
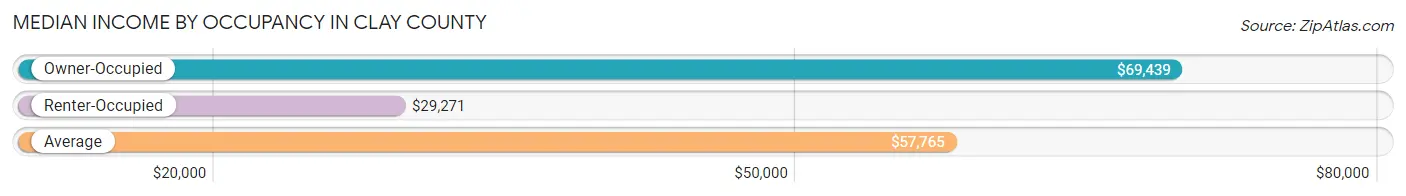
| Occupancy Type | # Households | Median Income |
| Owner-Occupied | 2,549 (71.4%) | $69,439 |
| Renter-Occupied | 1,021 (28.6%) | $29,271 |
| Average | 3,570 (100.0%) | $57,765 |
Occupancy by Householder Income Bracket in Clay County
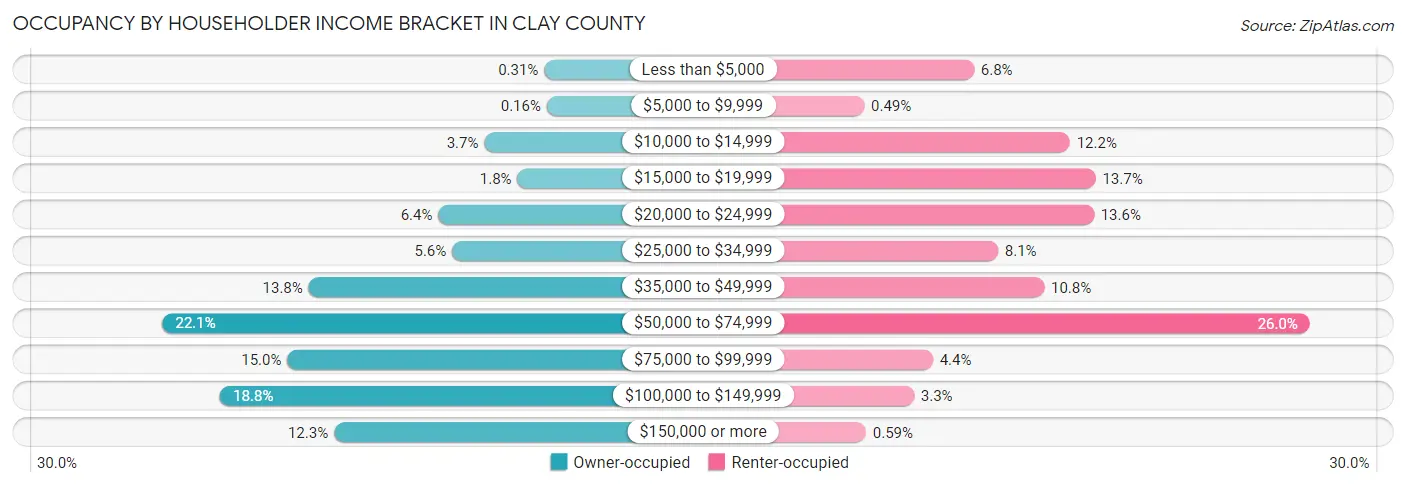
| Income Bracket | Owner-occupied | Renter-occupied |
| Less than $5,000 | 8 (0.3%) | 69 (6.8%) |
| $5,000 to $9,999 | 4 (0.2%) | 5 (0.5%) |
| $10,000 to $14,999 | 95 (3.7%) | 125 (12.2%) |
| $15,000 to $19,999 | 47 (1.8%) | 140 (13.7%) |
| $20,000 to $24,999 | 162 (6.4%) | 139 (13.6%) |
| $25,000 to $34,999 | 142 (5.6%) | 83 (8.1%) |
| $35,000 to $49,999 | 351 (13.8%) | 110 (10.8%) |
| $50,000 to $74,999 | 564 (22.1%) | 265 (26.0%) |
| $75,000 to $99,999 | 382 (15.0%) | 45 (4.4%) |
| $100,000 to $149,999 | 480 (18.8%) | 34 (3.3%) |
| $150,000 or more | 314 (12.3%) | 6 (0.6%) |
| Total | 2,549 (100.0%) | 1,021 (100.0%) |
Monthly Housing Cost Tiers in Clay County
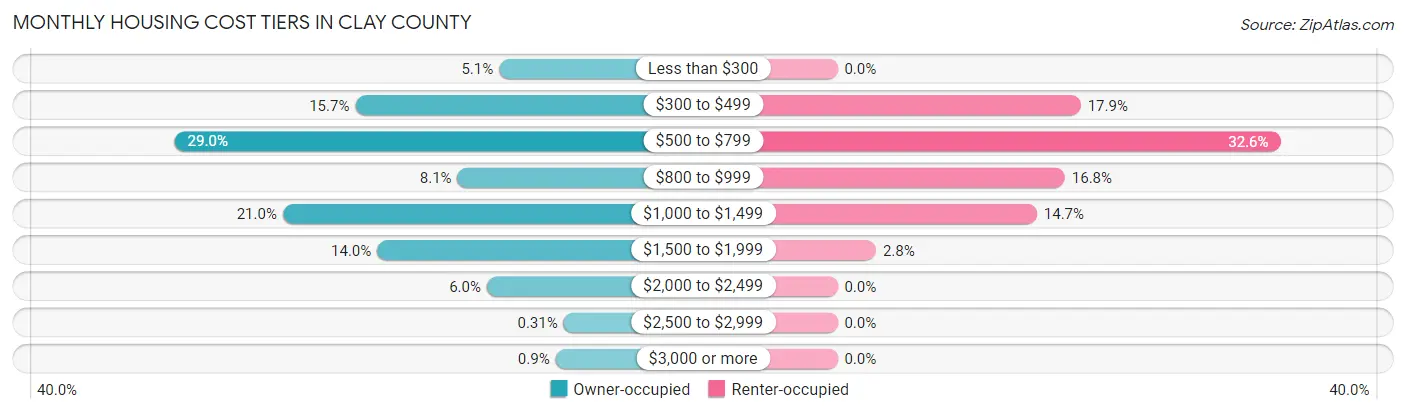
| Monthly Cost | Owner-occupied | Renter-occupied |
| Less than $300 | 129 (5.1%) | 0 (0.0%) |
| $300 to $499 | 399 (15.7%) | 183 (17.9%) |
| $500 to $799 | 738 (28.9%) | 333 (32.6%) |
| $800 to $999 | 207 (8.1%) | 171 (16.8%) |
| $1,000 to $1,499 | 535 (21.0%) | 150 (14.7%) |
| $1,500 to $1,999 | 358 (14.0%) | 29 (2.8%) |
| $2,000 to $2,499 | 152 (6.0%) | 0 (0.0%) |
| $2,500 to $2,999 | 8 (0.3%) | 0 (0.0%) |
| $3,000 or more | 23 (0.9%) | 0 (0.0%) |
| Total | 2,549 (100.0%) | 1,021 (100.0%) |
Physical Housing Characteristics in Clay County
Housing Structures in Clay County
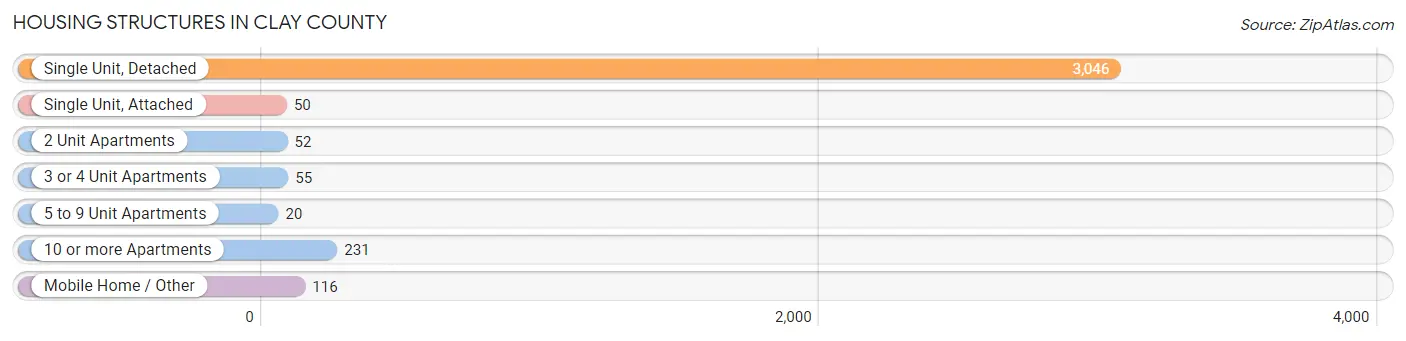
| Structure Type | # Housing Units | % Housing Units |
| Single Unit, Detached | 3,046 | 85.3% |
| Single Unit, Attached | 50 | 1.4% |
| 2 Unit Apartments | 52 | 1.5% |
| 3 or 4 Unit Apartments | 55 | 1.5% |
| 5 to 9 Unit Apartments | 20 | 0.6% |
| 10 or more Apartments | 231 | 6.5% |
| Mobile Home / Other | 116 | 3.3% |
| Total | 3,570 | 100.0% |
Housing Structures by Occupancy in Clay County
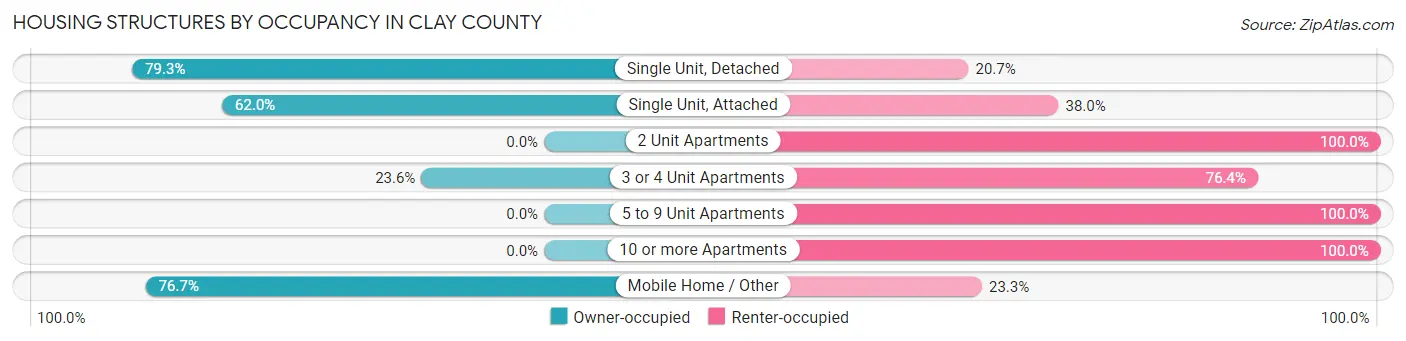
| Structure Type | Owner-occupied | Renter-occupied |
| Single Unit, Detached | 2,416 (79.3%) | 630 (20.7%) |
| Single Unit, Attached | 31 (62.0%) | 19 (38.0%) |
| 2 Unit Apartments | 0 (0.0%) | 52 (100.0%) |
| 3 or 4 Unit Apartments | 13 (23.6%) | 42 (76.4%) |
| 5 to 9 Unit Apartments | 0 (0.0%) | 20 (100.0%) |
| 10 or more Apartments | 0 (0.0%) | 231 (100.0%) |
| Mobile Home / Other | 89 (76.7%) | 27 (23.3%) |
| Total | 2,549 (71.4%) | 1,021 (28.6%) |
Housing Structures by Number of Rooms in Clay County
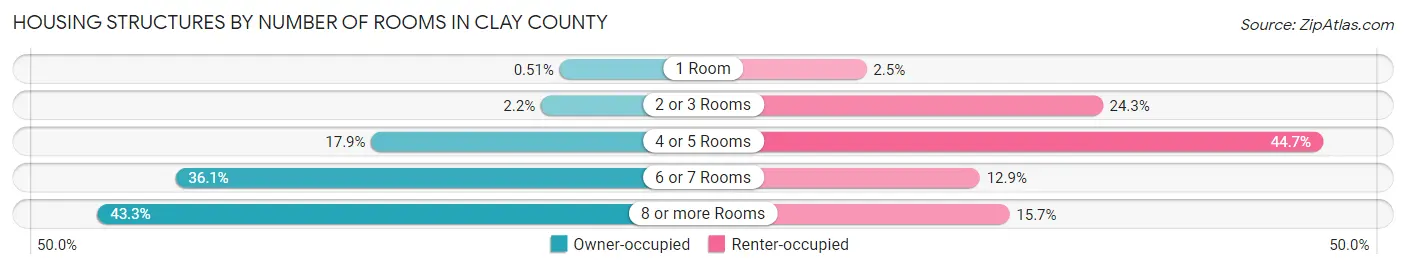
| Number of Rooms | Owner-occupied | Renter-occupied |
| 1 Room | 13 (0.5%) | 25 (2.5%) |
| 2 or 3 Rooms | 57 (2.2%) | 248 (24.3%) |
| 4 or 5 Rooms | 457 (17.9%) | 456 (44.7%) |
| 6 or 7 Rooms | 919 (36.0%) | 132 (12.9%) |
| 8 or more Rooms | 1,103 (43.3%) | 160 (15.7%) |
| Total | 2,549 (100.0%) | 1,021 (100.0%) |
Housing Structure by Heating Type in Clay County
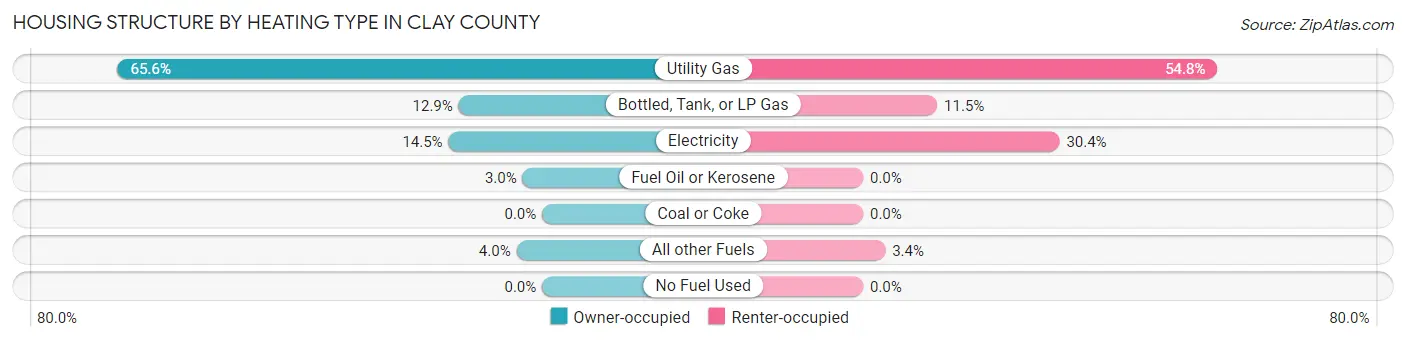
| Heating Type | Owner-occupied | Renter-occupied |
| Utility Gas | 1,673 (65.6%) | 559 (54.7%) |
| Bottled, Tank, or LP Gas | 329 (12.9%) | 117 (11.5%) |
| Electricity | 369 (14.5%) | 310 (30.4%) |
| Fuel Oil or Kerosene | 77 (3.0%) | 0 (0.0%) |
| Coal or Coke | 0 (0.0%) | 0 (0.0%) |
| All other Fuels | 101 (4.0%) | 35 (3.4%) |
| No Fuel Used | 0 (0.0%) | 0 (0.0%) |
| Total | 2,549 (100.0%) | 1,021 (100.0%) |
Household Vehicle Usage in Clay County

| Vehicles per Household | Owner-occupied | Renter-occupied |
| No Vehicle | 78 (3.1%) | 187 (18.3%) |
| 1 Vehicle | 431 (16.9%) | 501 (49.1%) |
| 2 Vehicles | 1,077 (42.2%) | 261 (25.6%) |
| 3 or more Vehicles | 963 (37.8%) | 72 (7.0%) |
| Total | 2,549 (100.0%) | 1,021 (100.0%) |
Real Estate & Mortgages in Clay County
Real Estate and Mortgage Overview in Clay County
| Characteristic | Without Mortgage | With Mortgage |
| Housing Units | 1,253 | 1,296 |
| Median Property Value | $117,600 | $145,700 |
| Median Household Income | $57,261 | $206 |
| Monthly Housing Costs | $544 | $23 |
| Real Estate Taxes | $1,604 | $52 |
Property Value by Mortgage Status in Clay County
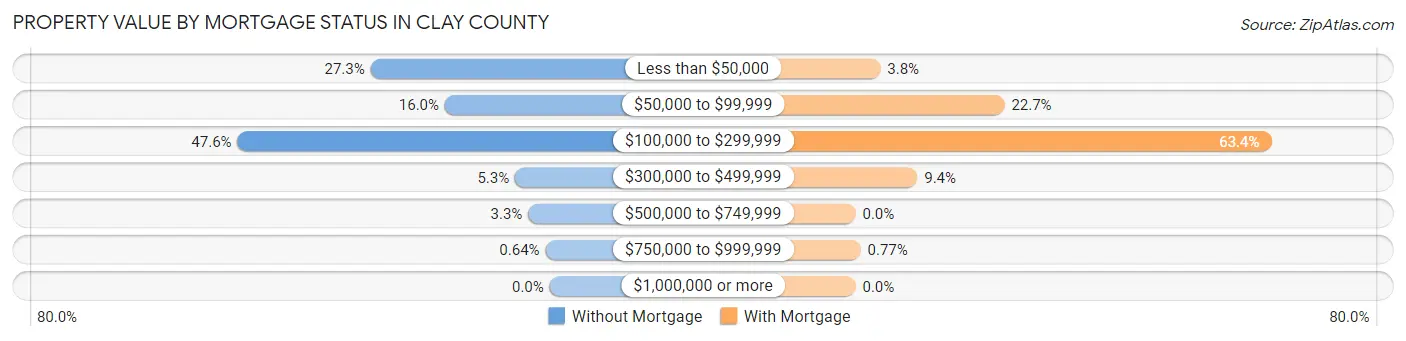
| Property Value | Without Mortgage | With Mortgage |
| Less than $50,000 | 342 (27.3%) | 49 (3.8%) |
| $50,000 to $99,999 | 200 (16.0%) | 294 (22.7%) |
| $100,000 to $299,999 | 596 (47.6%) | 821 (63.3%) |
| $300,000 to $499,999 | 66 (5.3%) | 122 (9.4%) |
| $500,000 to $749,999 | 41 (3.3%) | 0 (0.0%) |
| $750,000 to $999,999 | 8 (0.6%) | 10 (0.8%) |
| $1,000,000 or more | 0 (0.0%) | 0 (0.0%) |
| Total | 1,253 (100.0%) | 1,296 (100.0%) |
Household Income by Mortgage Status in Clay County
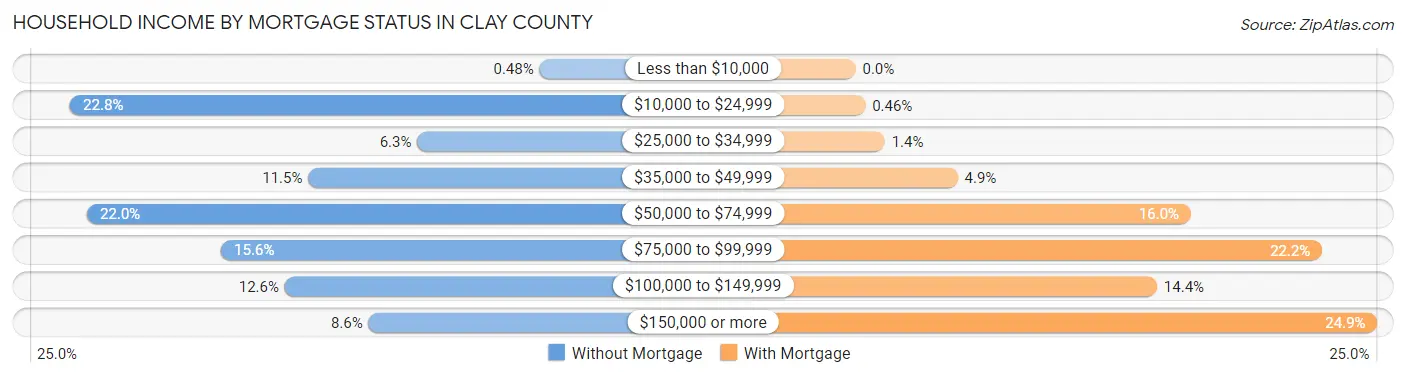
| Household Income | Without Mortgage | With Mortgage |
| Less than $10,000 | 6 (0.5%) | 0 (0.0%) |
| $10,000 to $24,999 | 286 (22.8%) | 6 (0.5%) |
| $25,000 to $34,999 | 79 (6.3%) | 18 (1.4%) |
| $35,000 to $49,999 | 144 (11.5%) | 63 (4.9%) |
| $50,000 to $74,999 | 276 (22.0%) | 207 (16.0%) |
| $75,000 to $99,999 | 196 (15.6%) | 288 (22.2%) |
| $100,000 to $149,999 | 158 (12.6%) | 186 (14.3%) |
| $150,000 or more | 108 (8.6%) | 322 (24.8%) |
| Total | 1,253 (100.0%) | 1,296 (100.0%) |
Property Value to Household Income Ratio in Clay County

| Value-to-Income Ratio | Without Mortgage | With Mortgage |
| Less than 2.0x | 702 (56.0%) | 80,333 (6,198.5%) |
| 2.0x to 2.9x | 150 (12.0%) | 738 (56.9%) |
| 3.0x to 3.9x | 117 (9.3%) | 223 (17.2%) |
| 4.0x or more | 284 (22.7%) | 178 (13.7%) |
| Total | 1,253 (100.0%) | 1,296 (100.0%) |
Real Estate Taxes by Mortgage Status in Clay County
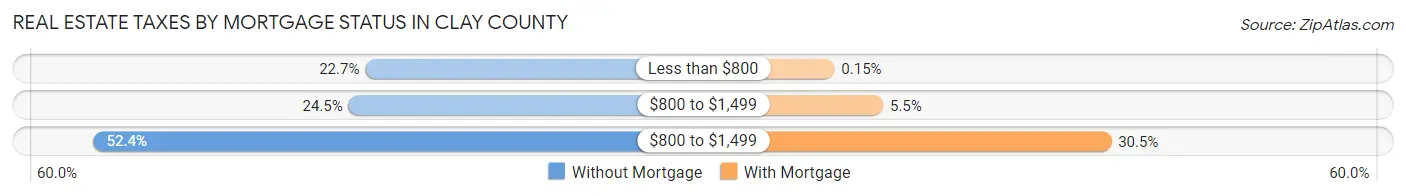
| Property Taxes | Without Mortgage | With Mortgage |
| Less than $800 | 284 (22.7%) | 2 (0.2%) |
| $800 to $1,499 | 307 (24.5%) | 71 (5.5%) |
| $800 to $1,499 | 657 (52.4%) | 395 (30.5%) |
| Total | 1,253 (100.0%) | 1,296 (100.0%) |
Health & Disability in Clay County
Health Insurance Coverage by Age in Clay County

| Age Bracket | With Coverage | Without Coverage |
| Under 6 Years | 577 (98.6%) | 8 (1.4%) |
| 6 to 18 Years | 1,399 (98.9%) | 16 (1.1%) |
| 19 to 25 Years | 372 (86.7%) | 57 (13.3%) |
| 26 to 34 Years | 594 (85.1%) | 104 (14.9%) |
| 35 to 44 Years | 874 (91.7%) | 79 (8.3%) |
| 45 to 54 Years | 803 (94.6%) | 46 (5.4%) |
| 55 to 64 Years | 909 (88.2%) | 122 (11.8%) |
| 65 to 74 Years | 1,023 (100.0%) | 0 (0.0%) |
| 75 Years and older | 847 (100.0%) | 0 (0.0%) |
| Total | 7,398 (94.5%) | 432 (5.5%) |
Health Insurance Coverage by Citizenship Status in Clay County
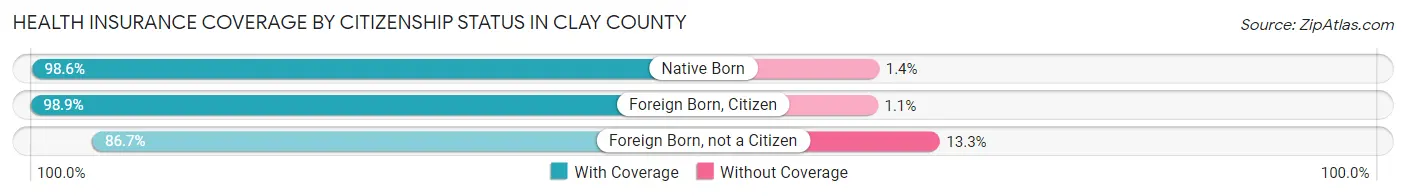
| Citizenship Status | With Coverage | Without Coverage |
| Native Born | 577 (98.6%) | 8 (1.4%) |
| Foreign Born, Citizen | 1,399 (98.9%) | 16 (1.1%) |
| Foreign Born, not a Citizen | 372 (86.7%) | 57 (13.3%) |
Health Insurance Coverage by Household Income in Clay County
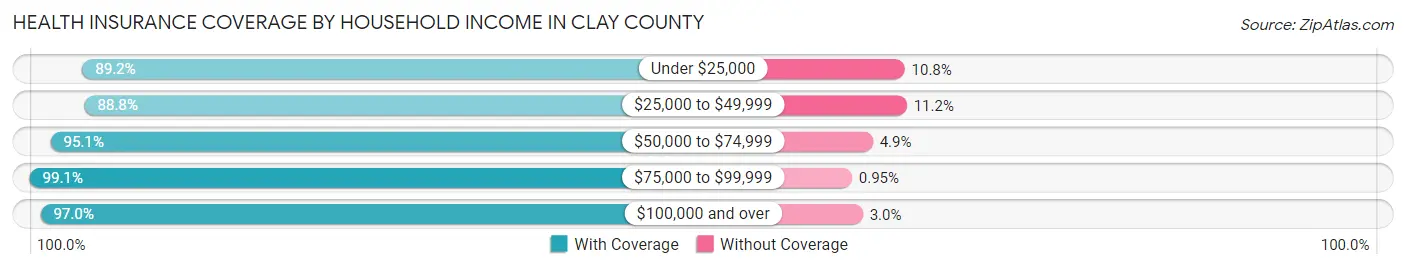
| Household Income | With Coverage | Without Coverage |
| Under $25,000 | 914 (89.2%) | 111 (10.8%) |
| $25,000 to $49,999 | 1,225 (88.8%) | 155 (11.2%) |
| $50,000 to $74,999 | 1,429 (95.1%) | 73 (4.9%) |
| $75,000 to $99,999 | 1,255 (99.1%) | 12 (0.9%) |
| $100,000 and over | 2,568 (97.0%) | 79 (3.0%) |
Public vs Private Health Insurance Coverage by Age in Clay County

| Age Bracket | Public Insurance | Private Insurance |
| Under 6 | 283 (48.4%) | 394 (67.3%) |
| 6 to 18 Years | 330 (23.3%) | 1,174 (83.0%) |
| 19 to 25 Years | 82 (19.1%) | 298 (69.5%) |
| 25 to 34 Years | 206 (29.5%) | 470 (67.3%) |
| 35 to 44 Years | 198 (20.8%) | 813 (85.3%) |
| 45 to 54 Years | 176 (20.7%) | 735 (86.6%) |
| 55 to 64 Years | 170 (16.5%) | 840 (81.5%) |
| 65 to 74 Years | 1,012 (98.9%) | 741 (72.4%) |
| 75 Years and over | 847 (100.0%) | 659 (77.8%) |
| Total | 3,304 (42.2%) | 6,124 (78.2%) |
Disability Status by Sex by Age in Clay County
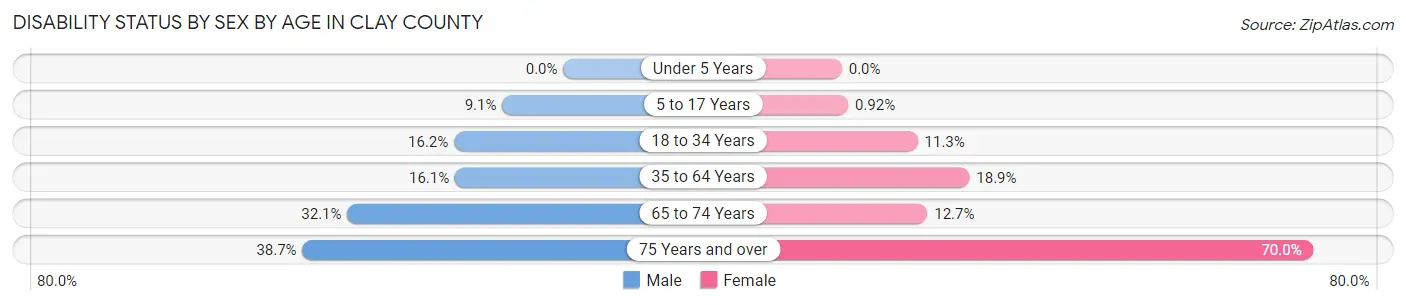
| Age Bracket | Male | Female |
| Under 5 Years | 0 (0.0%) | 0 (0.0%) |
| 5 to 17 Years | 69 (9.1%) | 6 (0.9%) |
| 18 to 34 Years | 103 (16.2%) | 67 (11.3%) |
| 35 to 64 Years | 228 (16.1%) | 268 (18.9%) |
| 65 to 74 Years | 169 (32.1%) | 63 (12.7%) |
| 75 Years and over | 129 (38.7%) | 360 (70.0%) |
Disability Class by Sex by Age in Clay County
Disability Class: Hearing Difficulty
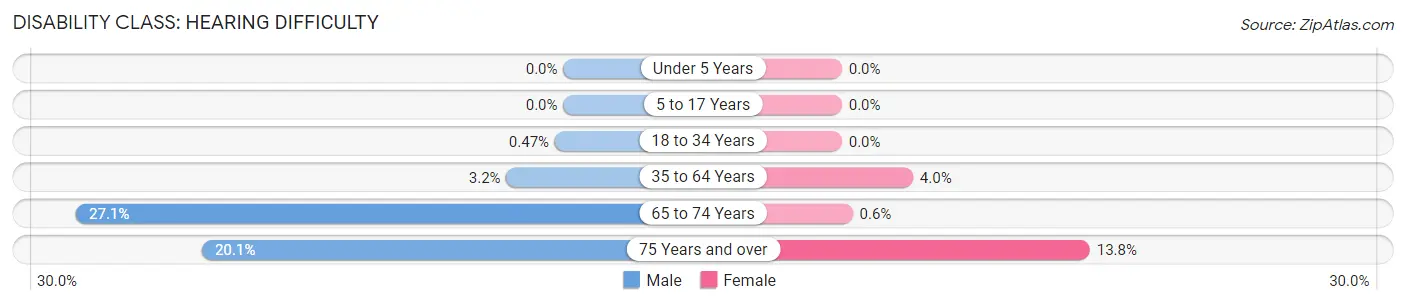
| Age Bracket | Male | Female |
| Under 5 Years | 0 (0.0%) | 0 (0.0%) |
| 5 to 17 Years | 0 (0.0%) | 0 (0.0%) |
| 18 to 34 Years | 3 (0.5%) | 0 (0.0%) |
| 35 to 64 Years | 45 (3.2%) | 56 (4.0%) |
| 65 to 74 Years | 143 (27.1%) | 3 (0.6%) |
| 75 Years and over | 67 (20.1%) | 71 (13.8%) |
Disability Class: Vision Difficulty
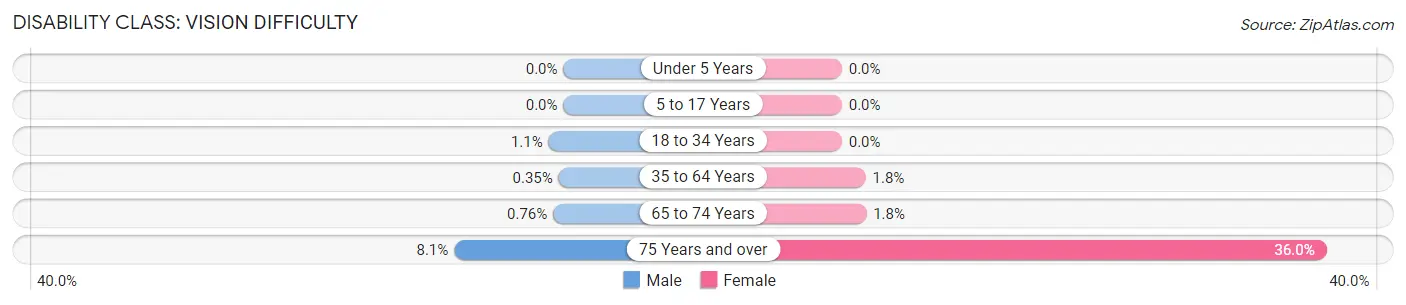
| Age Bracket | Male | Female |
| Under 5 Years | 0 (0.0%) | 0 (0.0%) |
| 5 to 17 Years | 0 (0.0%) | 0 (0.0%) |
| 18 to 34 Years | 7 (1.1%) | 0 (0.0%) |
| 35 to 64 Years | 5 (0.4%) | 25 (1.8%) |
| 65 to 74 Years | 4 (0.8%) | 9 (1.8%) |
| 75 Years and over | 27 (8.1%) | 185 (36.0%) |
Disability Class: Cognitive Difficulty
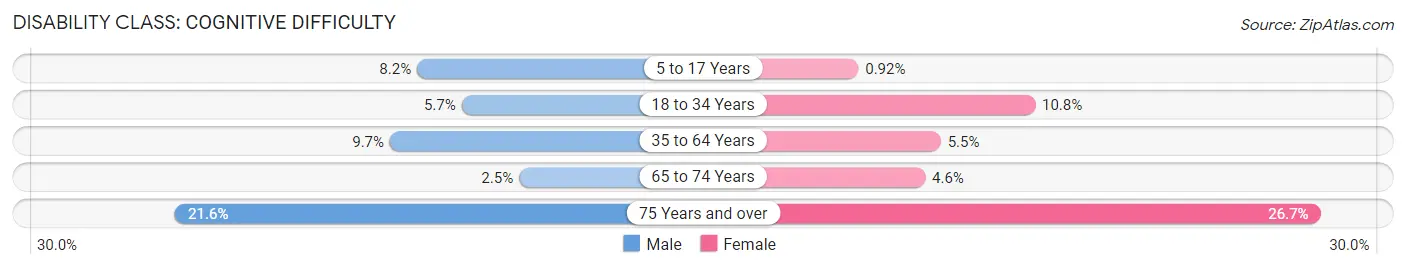
| Age Bracket | Male | Female |
| 5 to 17 Years | 62 (8.2%) | 6 (0.9%) |
| 18 to 34 Years | 36 (5.7%) | 64 (10.8%) |
| 35 to 64 Years | 137 (9.7%) | 78 (5.5%) |
| 65 to 74 Years | 13 (2.5%) | 23 (4.6%) |
| 75 Years and over | 72 (21.6%) | 137 (26.7%) |
Disability Class: Ambulatory Difficulty
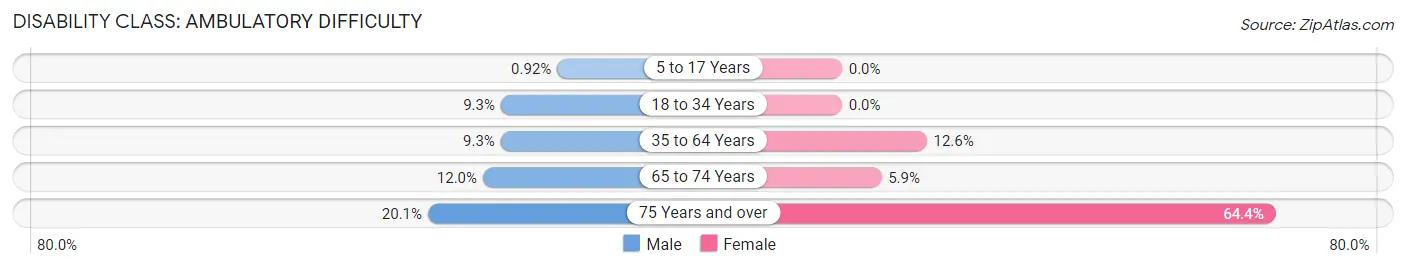
| Age Bracket | Male | Female |
| 5 to 17 Years | 7 (0.9%) | 0 (0.0%) |
| 18 to 34 Years | 59 (9.3%) | 0 (0.0%) |
| 35 to 64 Years | 132 (9.3%) | 178 (12.6%) |
| 65 to 74 Years | 63 (11.9%) | 29 (5.9%) |
| 75 Years and over | 67 (20.1%) | 331 (64.4%) |
Disability Class: Self-Care Difficulty
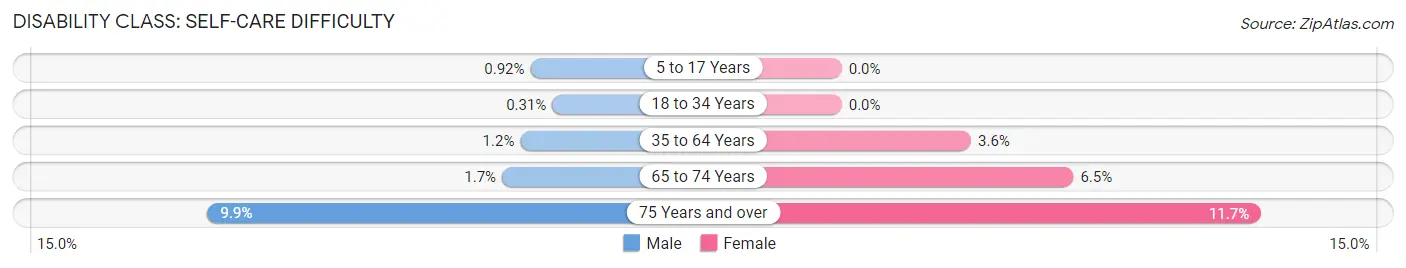
| Age Bracket | Male | Female |
| 5 to 17 Years | 7 (0.9%) | 0 (0.0%) |
| 18 to 34 Years | 2 (0.3%) | 0 (0.0%) |
| 35 to 64 Years | 17 (1.2%) | 51 (3.6%) |
| 65 to 74 Years | 9 (1.7%) | 32 (6.5%) |
| 75 Years and over | 33 (9.9%) | 60 (11.7%) |
Technology Access in Clay County
Computing Device Access in Clay County
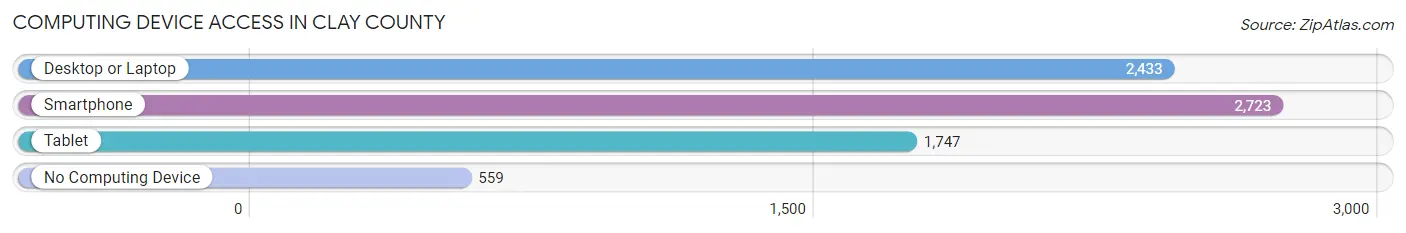
| Device Type | # Households | % Households |
| Desktop or Laptop | 2,433 | 68.1% |
| Smartphone | 2,723 | 76.3% |
| Tablet | 1,747 | 48.9% |
| No Computing Device | 559 | 15.7% |
| Total | 3,570 | 100.0% |
Internet Access in Clay County
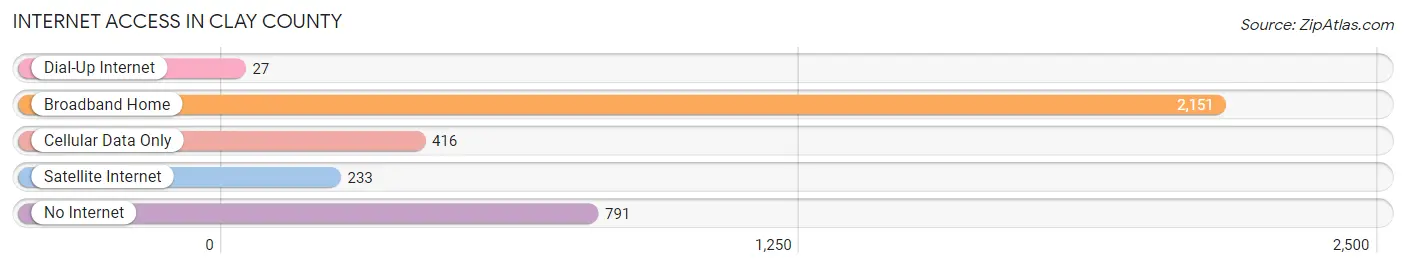
| Internet Type | # Households | % Households |
| Dial-Up Internet | 27 | 0.8% |
| Broadband Home | 2,151 | 60.3% |
| Cellular Data Only | 416 | 11.7% |
| Satellite Internet | 233 | 6.5% |
| No Internet | 791 | 22.2% |
| Total | 3,570 | 100.0% |
Clay County Summary
Clay County, Kansas is located in the north-central part of the state, and is bordered by Washington County to the north, Republic County to the east, Cloud County to the south, and Ottawa County to the west. Clay County is part of the North Central Kansas region, and is home to a population of 8,845 people, according to the 2010 census.
History
Clay County was established in 1867, and was named after Henry Clay, a prominent statesman and politician from Kentucky. The county was originally part of Washington County, and was created in order to provide better access to the county seat of Washington County. Clay County was originally populated by Native American tribes, including the Pawnee, Kansa, and Osage.
The first settlers in Clay County arrived in the late 1860s, and the county was officially organized in 1871. The first county seat was located in Clay Center, which was established in 1872. The county seat was moved to Clay Center in 1873, and has remained there ever since.
Geography
Clay County is located in the north-central part of Kansas, and is bordered by Washington County to the north, Republic County to the east, Cloud County to the south, and Ottawa County to the west. The county covers an area of 576 square miles, and is home to a population of 8,845 people, according to the 2010 census.
The county is mostly flat, with some rolling hills in the western part of the county. The county is drained by the Republican River, which flows through the county from north to south. The county is also home to several small lakes, including Lake Waconda, Lake Hiawatha, and Lake Washington.
Economy
Clay County is primarily an agricultural county, with the majority of the population employed in farming and ranching. The county is home to several large farms, including the Clay Center Farms, which is one of the largest farms in the state.
The county is also home to several small businesses, including a number of retail stores, restaurants, and other services. Clay County is also home to a number of manufacturing companies, including the Clay Center Manufacturing Company, which produces a variety of products, including furniture, clothing, and other items.
Demographics
According to the 2010 census, Clay County has a population of 8,845 people. The population is spread out, with 48.3% of the population being male and 51.7% being female. The median age of the population is 40.7 years, and the median household income is $45,845.
The racial makeup of the county is 95.2% White, 0.7% African American, 0.3% Native American, 0.3% Asian, 0.1% Pacific Islander, 1.7% from other races, and 1.9% from two or more races. The largest ancestry groups in the county are German (30.2%), Irish (14.2%), English (13.2%), and American (10.2%).
Conclusion
Clay County, Kansas is a rural county located in the north-central part of the state. The county is home to a population of 8,845 people, and is primarily an agricultural county, with the majority of the population employed in farming and ranching. The county is also home to several small businesses, and is home to a diverse population, with the largest ancestry groups being German, Irish, English, and American.
Common Questions
What is the Total Population of Clay County?
Total Population of Clay County is 8,088.
What is the Total Male Population of Clay County?
Total Male Population of Clay County is 4,113.
What is the Total Female Population of Clay County?
Total Female Population of Clay County is 3,975.
What is the Ratio of Males per 100 Females in Clay County?
There are 103.47 Males per 100 Females in Clay County.
What is the Ratio of Females per 100 Males in Clay County?
There are 96.64 Females per 100 Males in Clay County.
What is the Median Population Age in Clay County?
Median Population Age in Clay County is 43.1 Years.
What is the Average Family Size in Clay County
Average Family Size in Clay County is 2.8 People.
What is the Average Household Size in Clay County
Average Household Size in Clay County is 2.2 People.
What is Per Capita Income in Clay County?
Per Capita income in Clay County is $32,628.
What is the Median Family Income in Clay County?
Median Family Income in Clay County is $75,615.
What is the Median Household income in Clay County?
Median Household Income in Clay County is $57,765.
What is Income or Wage Gap in Clay County?
Income or Wage Gap in Clay County is 39.3%.
Women in Clay County earn 60.7 cents for every dollar earned by a man.
What is Inequality or Gini Index in Clay County?
Inequality or Gini Index in Clay County is 0.42.
How Large is the Labor Force in Clay County?
There are 3,938 People in the Labor Forcein in Clay County.
What is the Percentage of People in the Labor Force in Clay County?
61.7% of People are in the Labor Force in Clay County.
What is the Unemployment Rate in Clay County?
Unemployment Rate in Clay County is 1.4%.