Clark County, KS
Clark County Map
Clark County Overview
1,977
TOTAL POPULATION
1,017
MALE POPULATION
960
FEMALE POPULATION
105.94
MALES / 100 FEMALES
94.40
FEMALES / 100 MALES
46.3
MEDIAN AGE
3.0
AVG FAMILY SIZE
2.4
AVG HOUSEHOLD SIZE
$30,253
PER CAPITA INCOME
$71,458
AVG FAMILY INCOME
$58,287
AVG HOUSEHOLD INCOME
29.0%
WAGE / INCOME GAP [ % ]
71.0¢/ $1
WAGE / INCOME GAP [ $ ]
0.39
INEQUALITY / GINI INDEX
955
LABOR FORCE [ PEOPLE ]
62.0%
PERCENT IN LABOR FORCE
1.0%
UNEMPLOYMENT RATE
Clark County Area Codes
Race in Clark County
The most populous races in Clark County are White / Caucasian (1,721 | 87.1%), Two or more Races (170 | 8.6%), and Hispanic or Latino (142 | 7.2%).

| Race | # Population | % Population |
| Asian | 18 | 0.9% |
| Black / African American | 0 | 0.0% |
| Hawaiian / Pacific | 0 | 0.0% |
| Hispanic or Latino | 142 | 7.2% |
| Native / Alaskan | 48 | 2.4% |
| White / Caucasian | 1,721 | 87.1% |
| Two or more Races | 170 | 8.6% |
| Some other Race | 20 | 1.0% |
| Total | 1,977 | 100.0% |
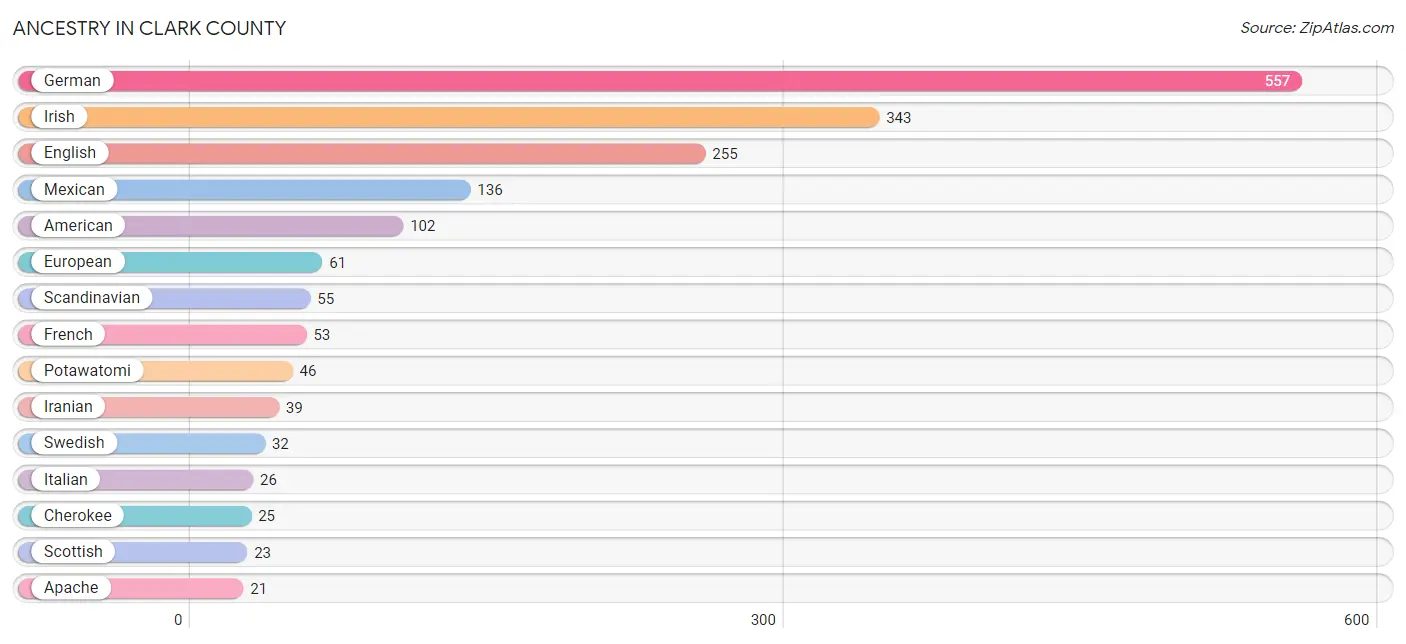
Ancestry in Clark County
The most populous ancestries reported in Clark County are German (557 | 28.2%), Irish (343 | 17.3%), English (255 | 12.9%), Mexican (136 | 6.9%), and American (102 | 5.2%), together accounting for 70.5% of all Clark County residents.
| Ancestry | # Population | % Population |
| American | 102 | 5.2% |
| Apache | 21 | 1.1% |
| Belgian | 6 | 0.3% |
| British | 16 | 0.8% |
| Canadian | 2 | 0.1% |
| Cherokee | 25 | 1.3% |
| Czech | 4 | 0.2% |
| Czechoslovakian | 4 | 0.2% |
| Danish | 2 | 0.1% |
| Dutch | 20 | 1.0% |
| English | 255 | 12.9% |
| European | 61 | 3.1% |
| French | 53 | 2.7% |
| French Canadian | 11 | 0.6% |
| German | 557 | 28.2% |
| German Russian | 4 | 0.2% |
| Iranian | 39 | 2.0% |
| Irish | 343 | 17.3% |
| Italian | 26 | 1.3% |
| Korean | 8 | 0.4% |
| Mexican | 136 | 6.9% |
| Norwegian | 13 | 0.7% |
| Polish | 16 | 0.8% |
| Potawatomi | 46 | 2.3% |
| Russian | 9 | 0.5% |
| Scandinavian | 55 | 2.8% |
| Scotch-Irish | 12 | 0.6% |
| Scottish | 23 | 1.2% |
| Seminole | 2 | 0.1% |
| South American Indian | 13 | 0.7% |
| Swedish | 32 | 1.6% |
| Thai | 10 | 0.5% |
| Welsh | 3 | 0.2% | View All 33 Rows |
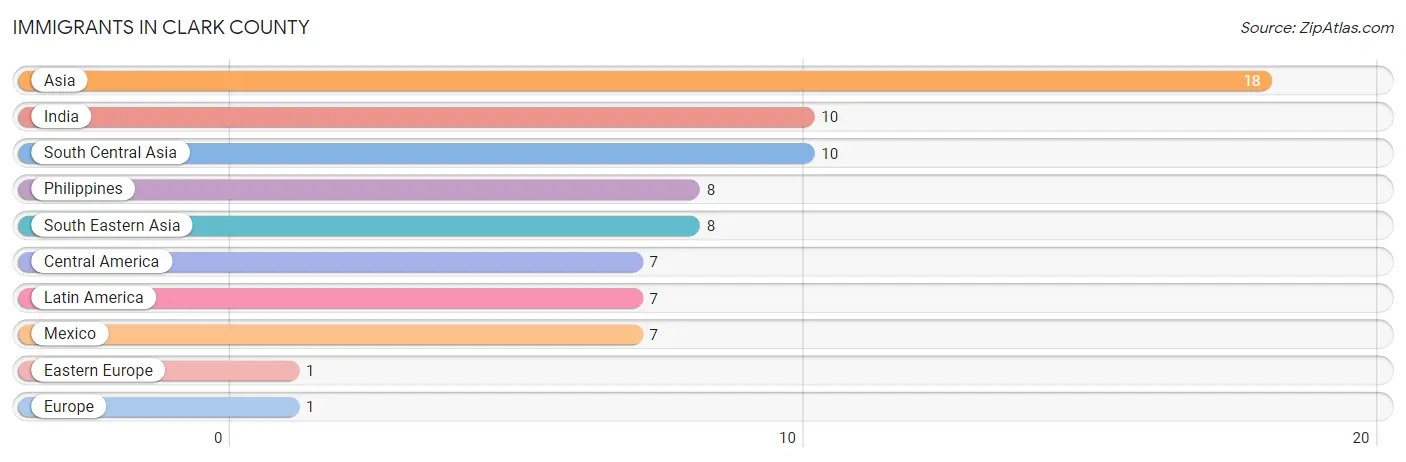
Immigrants in Clark County
The most numerous immigrant groups reported in Clark County came from Asia (18 | 0.9%), India (10 | 0.5%), South Central Asia (10 | 0.5%), Philippines (8 | 0.4%), and South Eastern Asia (8 | 0.4%), together accounting for 2.7% of all Clark County residents.
| Immigration Origin | # Population | % Population |
| Asia | 18 | 0.9% |
| Central America | 7 | 0.4% |
| Eastern Europe | 1 | 0.1% |
| Europe | 1 | 0.1% |
| India | 10 | 0.5% |
| Latin America | 7 | 0.4% |
| Mexico | 7 | 0.4% |
| Philippines | 8 | 0.4% |
| South Central Asia | 10 | 0.5% |
| South Eastern Asia | 8 | 0.4% | View All 10 Rows |
Sex and Age in Clark County
Sex and Age in Clark County
The most populous age groups in Clark County are 10 to 14 Years (96 | 9.4%) for men and 50 to 54 Years (86 | 9.0%) for women.

| Age Bracket | Male | Female |
| Under 5 Years | 85 (8.4%) | 66 (6.9%) |
| 5 to 9 Years | 73 (7.2%) | 50 (5.2%) |
| 10 to 14 Years | 96 (9.4%) | 56 (5.8%) |
| 15 to 19 Years | 28 (2.8%) | 74 (7.7%) |
| 20 to 24 Years | 28 (2.8%) | 66 (6.9%) |
| 25 to 29 Years | 53 (5.2%) | 29 (3.0%) |
| 30 to 34 Years | 33 (3.2%) | 47 (4.9%) |
| 35 to 39 Years | 61 (6.0%) | 43 (4.5%) |
| 40 to 44 Years | 43 (4.2%) | 39 (4.1%) |
| 45 to 49 Years | 69 (6.8%) | 35 (3.6%) |
| 50 to 54 Years | 63 (6.2%) | 86 (9.0%) |
| 55 to 59 Years | 95 (9.3%) | 55 (5.7%) |
| 60 to 64 Years | 59 (5.8%) | 85 (8.8%) |
| 65 to 69 Years | 46 (4.5%) | 57 (5.9%) |
| 70 to 74 Years | 45 (4.4%) | 28 (2.9%) |
| 75 to 79 Years | 65 (6.4%) | 29 (3.0%) |
| 80 to 84 Years | 26 (2.6%) | 52 (5.4%) |
| 85 Years and over | 49 (4.8%) | 63 (6.6%) |
| Total | 1,017 (100.0%) | 960 (100.0%) |
Families and Households in Clark County
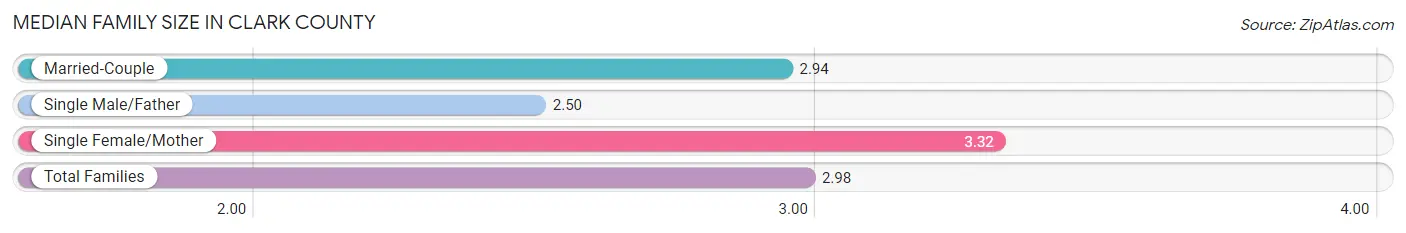
Median Family Size in Clark County
The median family size in Clark County is 2.98 persons per family, with single female/mother families (69 | 14.3%) accounting for the largest median family size of 3.32 persons per family. On the other hand, single male/father families (18 | 3.7%) represent the smallest median family size with 2.50 persons per family.
| Family Type | # Families | Family Size |
| Married-Couple | 397 (82.0%) | 2.94 |
| Single Male/Father | 18 (3.7%) | 2.50 |
| Single Female/Mother | 69 (14.3%) | 3.32 |
| Total Families | 484 (100.0%) | 2.98 |
Median Household Size in Clark County
The median household size in Clark County is 2.38 persons per household, with single female/mother households (69 | 8.6%) accounting for the largest median household size of 3.55 persons per household. non-family households (323 | 40.0%) represent the smallest median household size with 1.33 persons per household.

| Household Type | # Households | Household Size |
| Married-Couple | 397 (49.2%) | 2.99 |
| Single Male/Father | 18 (2.2%) | 3.22 |
| Single Female/Mother | 69 (8.6%) | 3.55 |
| Non-family | 323 (40.0%) | 1.33 |
| Total Households | 807 (100.0%) | 2.38 |
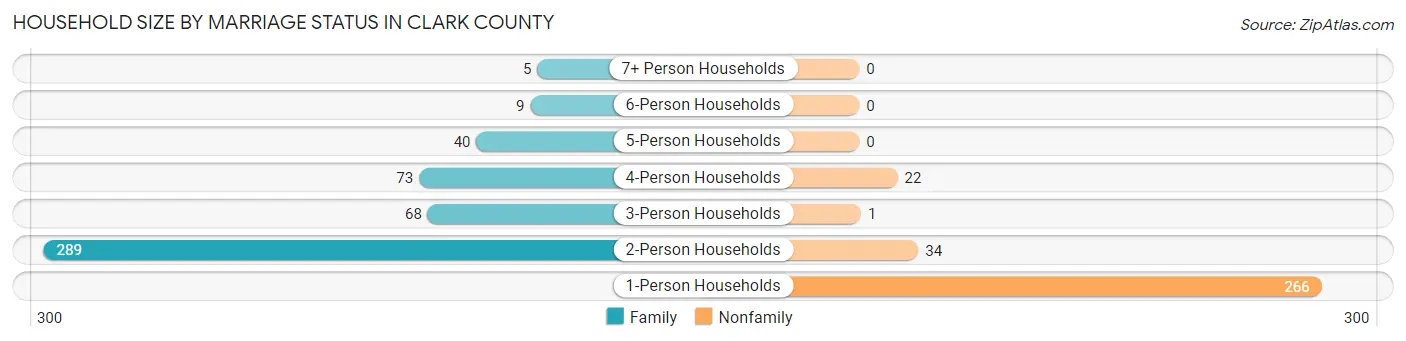
Household Size by Marriage Status in Clark County
Out of a total of 807 households in Clark County, 484 (60.0%) are family households, while 323 (40.0%) are nonfamily households. The most numerous type of family households are 2-person households, comprising 289, and the most common type of nonfamily households are 1-person households, comprising 266.
| Household Size | Family Households | Nonfamily Households |
| 1-Person Households | - | 266 (33.0%) |
| 2-Person Households | 289 (35.8%) | 34 (4.2%) |
| 3-Person Households | 68 (8.4%) | 1 (0.1%) |
| 4-Person Households | 73 (9.0%) | 22 (2.7%) |
| 5-Person Households | 40 (5.0%) | 0 (0.0%) |
| 6-Person Households | 9 (1.1%) | 0 (0.0%) |
| 7+ Person Households | 5 (0.6%) | 0 (0.0%) |
| Total | 484 (60.0%) | 323 (40.0%) |
Female Fertility in Clark County
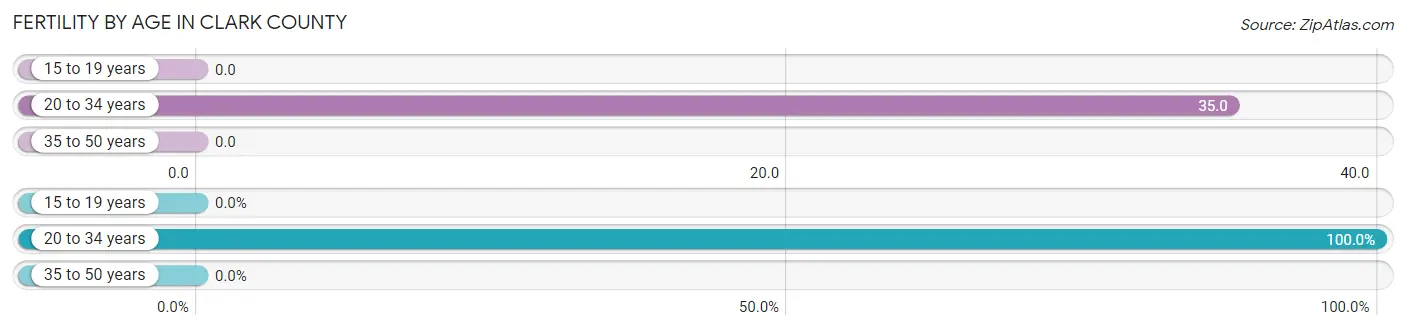
Fertility by Age in Clark County
Average fertility rate in Clark County is 14.0 births per 1,000 women. Women in the age bracket of 20 to 34 years have the highest fertility rate with 35.0 births per 1,000 women. Women in the age bracket of 20 to 34 years acount for 100.0% of all women with births.
| Age Bracket | Women with Births | Births / 1,000 Women |
| 15 to 19 years | 0 (0.0%) | 0.0 |
| 20 to 34 years | 5 (100.0%) | 35.0 |
| 35 to 50 years | 0 (0.0%) | 0.0 |
| Total | 5 (100.0%) | 14.0 |
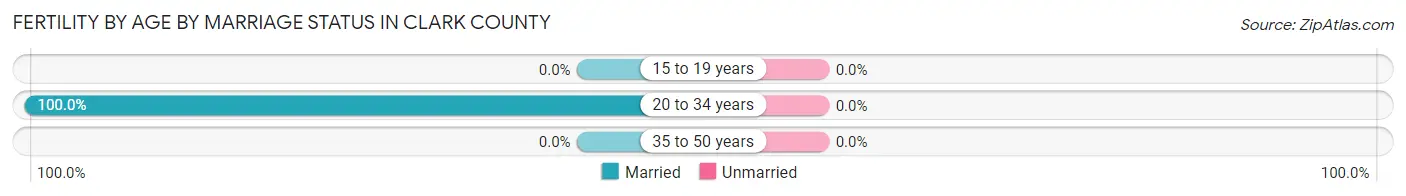
Fertility by Age by Marriage Status in Clark County
| Age Bracket | Married | Unmarried |
| 15 to 19 years | 0 (0.0%) | 0 (0.0%) |
| 20 to 34 years | 5 (100.0%) | 0 (0.0%) |
| 35 to 50 years | 0 (0.0%) | 0 (0.0%) |
| Total | 5 (100.0%) | 0 (0.0%) |
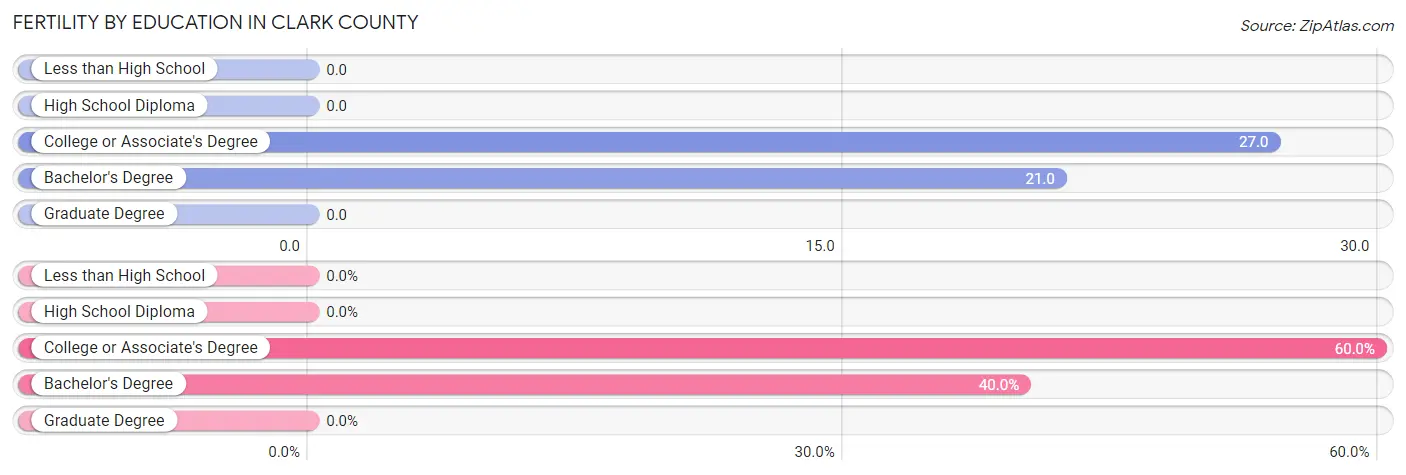
Fertility by Education in Clark County
| Educational Attainment | Women with Births | Births / 1,000 Women |
| Less than High School | 0 (0.0%) | 0.0 |
| High School Diploma | 0 (0.0%) | 0.0 |
| College or Associate's Degree | 3 (60.0%) | 27.0 |
| Bachelor's Degree | 2 (40.0%) | 21.0 |
| Graduate Degree | 0 (0.0%) | 0.0 |
| Total | 5 (100.0%) | 14.0 |
Fertility by Education by Marriage Status in Clark County
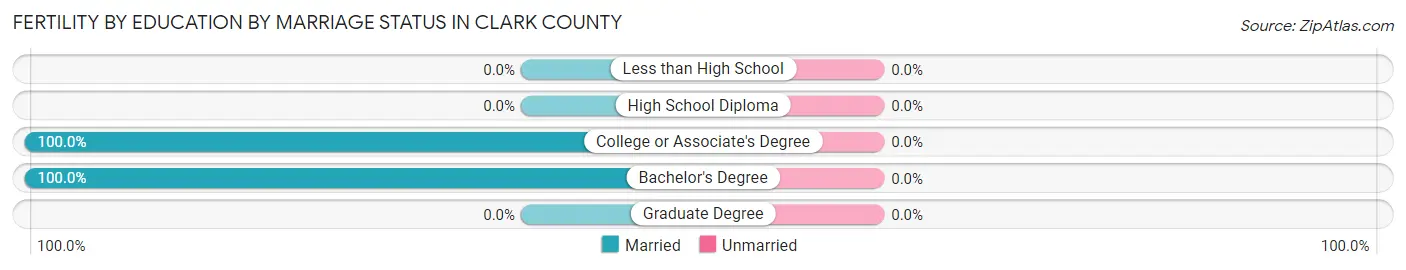
| Educational Attainment | Married | Unmarried |
| Less than High School | 0 (0.0%) | 0 (0.0%) |
| High School Diploma | 0 (0.0%) | 0 (0.0%) |
| College or Associate's Degree | 3 (100.0%) | 0 (0.0%) |
| Bachelor's Degree | 2 (100.0%) | 0 (0.0%) |
| Graduate Degree | 0 (0.0%) | 0 (0.0%) |
| Total | 5 (100.0%) | 0 (0.0%) |
Income in Clark County
Income Overview in Clark County
Per Capita Income in Clark County is $30,253, while median incomes of families and households are $71,458 and $58,287 respectively.
| Characteristic | Number | Measure |
| Per Capita Income | 1,977 | $30,253 |
| Median Family Income | 484 | $71,458 |
| Mean Family Income | 484 | $80,395 |
| Median Household Income | 807 | $58,287 |
| Mean Household Income | 807 | $70,781 |
| Income Deficit | 484 | $0 |
| Wage / Income Gap (%) | 1,977 | 29.01% |
| Wage / Income Gap ($) | 1,977 | 70.99¢ per $1 |
| Gini / Inequality Index | 1,977 | 0.39 |
Earnings by Sex in Clark County
Average Earnings in Clark County are $37,500, $41,307 for men and $29,323 for women, a difference of 29.0%.
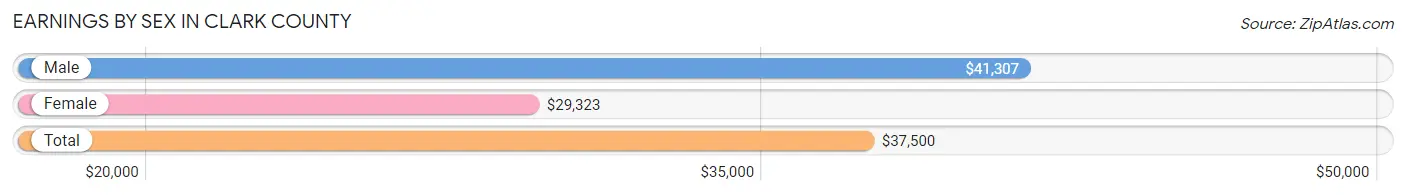
| Sex | Number | Average Earnings |
| Male | 527 (51.5%) | $41,307 |
| Female | 497 (48.5%) | $29,323 |
| Total | 1,024 (100.0%) | $37,500 |
Earnings by Sex by Income Bracket in Clark County
The most common earnings brackets in Clark County are $25,000 to $29,999 for men (68 | 12.9%) and $55,000 to $64,999 for women (54 | 10.9%).
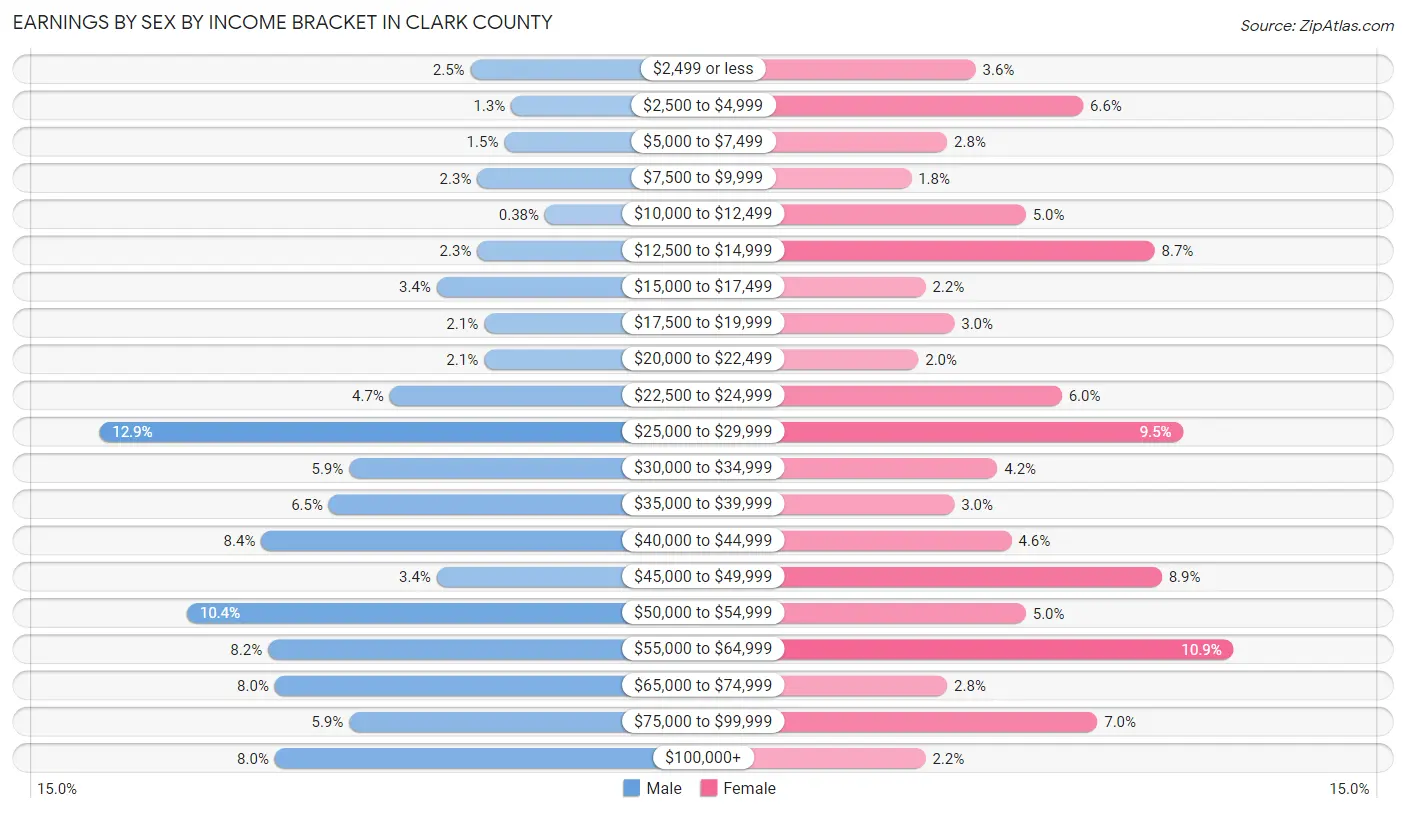
| Income | Male | Female |
| $2,499 or less | 13 (2.5%) | 18 (3.6%) |
| $2,500 to $4,999 | 7 (1.3%) | 33 (6.6%) |
| $5,000 to $7,499 | 8 (1.5%) | 14 (2.8%) |
| $7,500 to $9,999 | 12 (2.3%) | 9 (1.8%) |
| $10,000 to $12,499 | 2 (0.4%) | 25 (5.0%) |
| $12,500 to $14,999 | 12 (2.3%) | 43 (8.6%) |
| $15,000 to $17,499 | 18 (3.4%) | 11 (2.2%) |
| $17,500 to $19,999 | 11 (2.1%) | 15 (3.0%) |
| $20,000 to $22,499 | 11 (2.1%) | 10 (2.0%) |
| $22,500 to $24,999 | 25 (4.7%) | 30 (6.0%) |
| $25,000 to $29,999 | 68 (12.9%) | 47 (9.5%) |
| $30,000 to $34,999 | 31 (5.9%) | 21 (4.2%) |
| $35,000 to $39,999 | 34 (6.5%) | 15 (3.0%) |
| $40,000 to $44,999 | 44 (8.4%) | 23 (4.6%) |
| $45,000 to $49,999 | 18 (3.4%) | 44 (8.8%) |
| $50,000 to $54,999 | 55 (10.4%) | 25 (5.0%) |
| $55,000 to $64,999 | 43 (8.2%) | 54 (10.9%) |
| $65,000 to $74,999 | 42 (8.0%) | 14 (2.8%) |
| $75,000 to $99,999 | 31 (5.9%) | 35 (7.0%) |
| $100,000+ | 42 (8.0%) | 11 (2.2%) |
| Total | 527 (100.0%) | 497 (100.0%) |
Earnings by Sex by Educational Attainment in Clark County
Average earnings in Clark County are $43,182 for men and $42,125 for women, a difference of 2.5%. Men with an educational attainment of graduate degree enjoy the highest average annual earnings of $250,001, while those with bachelor's degree education earn the least with $35,000. Women with an educational attainment of graduate degree earn the most with the average annual earnings of $50,833, while those with less than high school education have the smallest earnings of $18,750.
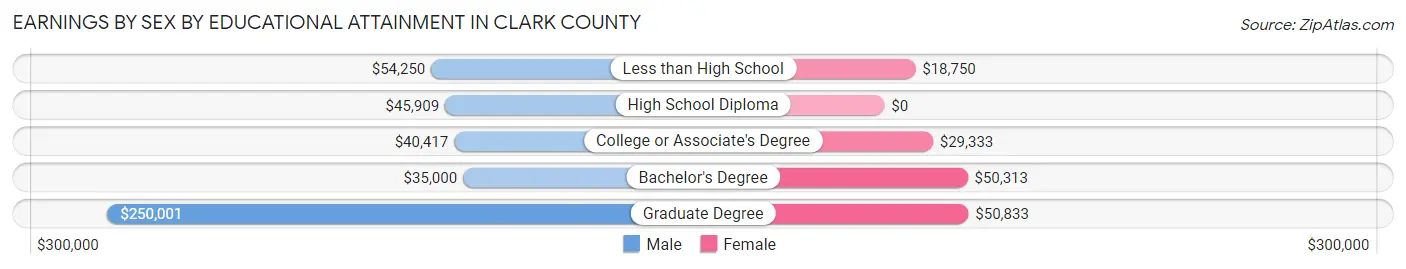
| Educational Attainment | Male Income | Female Income |
| Less than High School | $54,250 | $18,750 |
| High School Diploma | $45,909 | $0 |
| College or Associate's Degree | $40,417 | $29,333 |
| Bachelor's Degree | $35,000 | $50,313 |
| Graduate Degree | $250,001 | $50,833 |
| Total | $43,182 | $42,125 |
Family Income in Clark County
Family Income Brackets in Clark County
According to the Clark County family income data, there are 135 families falling into the $50,000 to $74,999 income range, which is the most common income bracket and makes up 27.9% of all families. Conversely, the $10,000 to $14,999 income bracket is the least frequent group with only 10 families (2.1%) belonging to this category.
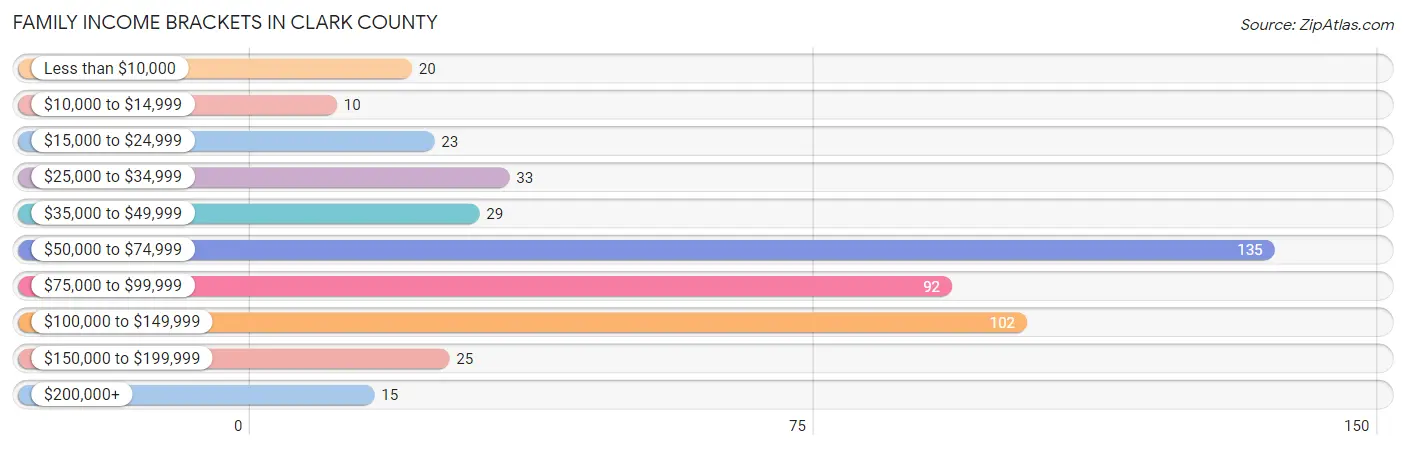
| Income Bracket | # Families | % Families |
| Less than $10,000 | 20 | 4.1% |
| $10,000 to $14,999 | 10 | 2.1% |
| $15,000 to $24,999 | 23 | 4.8% |
| $25,000 to $34,999 | 33 | 6.8% |
| $35,000 to $49,999 | 29 | 6.0% |
| $50,000 to $74,999 | 135 | 27.9% |
| $75,000 to $99,999 | 92 | 19.0% |
| $100,000 to $149,999 | 102 | 21.1% |
| $150,000 to $199,999 | 25 | 5.2% |
| $200,000+ | 15 | 3.1% |
Family Income by Famaliy Size in Clark County
3-person families (84 | 17.4%) account for the highest median family income in Clark County with $107,647 per family, while 3-person families (84 | 17.4%) have the highest median income of $35,882 per family member.
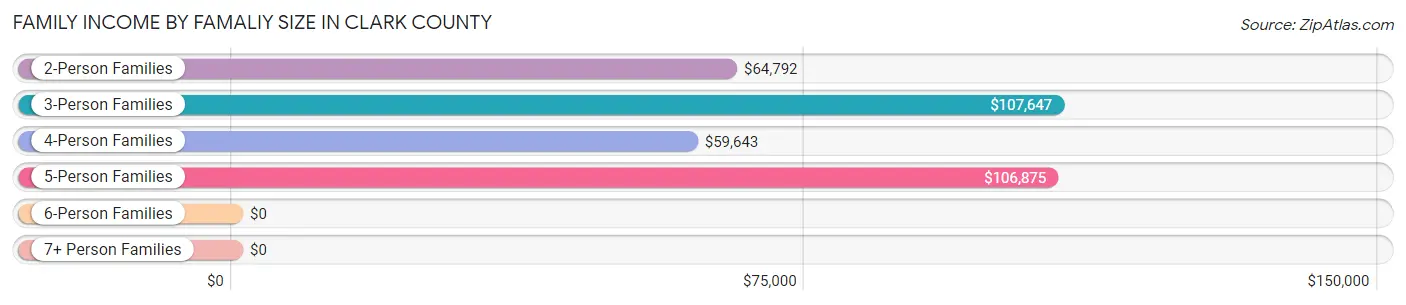
| Income Bracket | # Families | Median Income |
| 2-Person Families | 297 (61.4%) | $64,792 |
| 3-Person Families | 84 (17.4%) | $107,647 |
| 4-Person Families | 64 (13.2%) | $59,643 |
| 5-Person Families | 25 (5.2%) | $106,875 |
| 6-Person Families | 9 (1.9%) | $0 |
| 7+ Person Families | 5 (1.0%) | $0 |
| Total | 484 (100.0%) | $71,458 |
Family Income by Number of Earners in Clark County
The median family income in Clark County is $71,458, with families comprising 3+ earners (25) having the highest median family income of $178,125, while families with no earners (112) have the lowest median family income of $50,625, accounting for 5.2% and 23.1% of families, respectively.
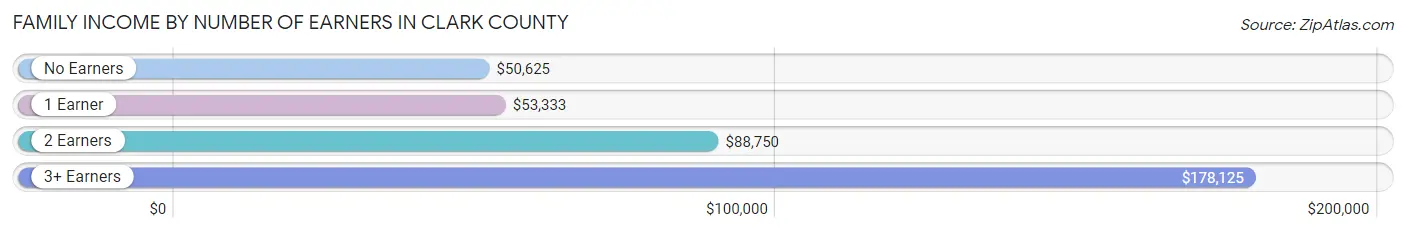
| Number of Earners | # Families | Median Income |
| No Earners | 112 (23.1%) | $50,625 |
| 1 Earner | 98 (20.3%) | $53,333 |
| 2 Earners | 249 (51.4%) | $88,750 |
| 3+ Earners | 25 (5.2%) | $178,125 |
| Total | 484 (100.0%) | $71,458 |
Household Income in Clark County
Household Income Brackets in Clark County
With 190 households falling in the category, the $50,000 to $74,999 income range is the most frequent in Clark County, accounting for 23.5% of all households. In contrast, only 20 households (2.5%) fall into the $10,000 to $14,999 income bracket, making it the least populous group.
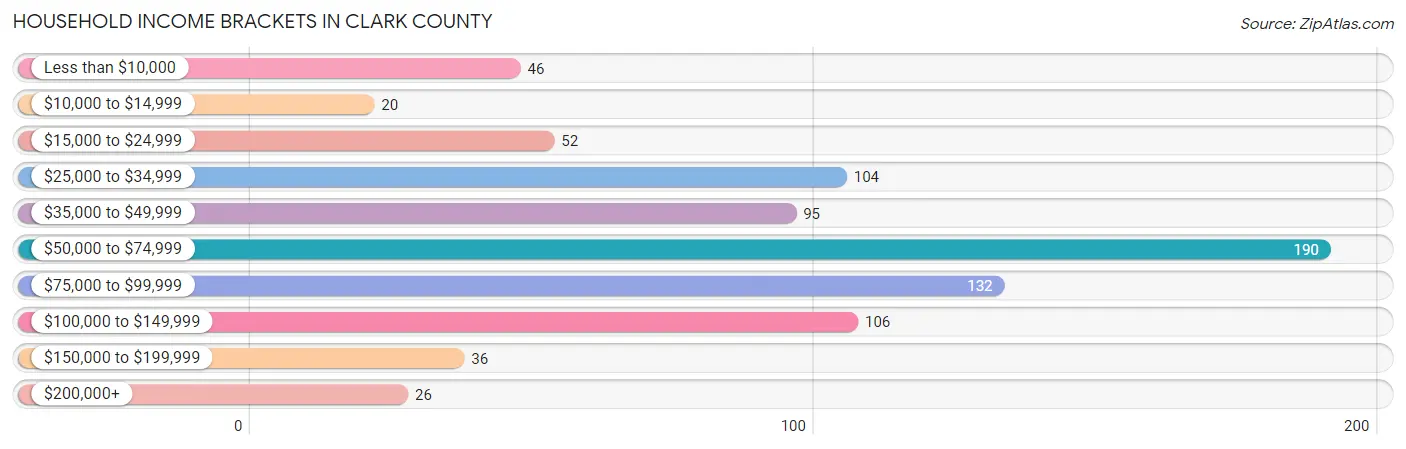
| Income Bracket | # Households | % Households |
| Less than $10,000 | 46 | 5.7% |
| $10,000 to $14,999 | 20 | 2.5% |
| $15,000 to $24,999 | 52 | 6.4% |
| $25,000 to $34,999 | 104 | 12.9% |
| $35,000 to $49,999 | 95 | 11.8% |
| $50,000 to $74,999 | 190 | 23.5% |
| $75,000 to $99,999 | 132 | 16.4% |
| $100,000 to $149,999 | 106 | 13.1% |
| $150,000 to $199,999 | 36 | 4.5% |
| $200,000+ | 26 | 3.2% |
Household Income by Householder Age in Clark County
The median household income in Clark County is $58,287, with the highest median household income of $82,857 found in the 25 to 44 years age bracket for the primary householder. A total of 154 households (19.1%) fall into this category. Meanwhile, the 65+ years age bracket for the primary householder has the lowest median household income of $47,500, with 268 households (33.2%) in this group.

| Income Bracket | # Households | Median Income |
| 15 to 24 Years | 65 (8.1%) | $59,107 |
| 25 to 44 Years | 154 (19.1%) | $82,857 |
| 45 to 64 Years | 320 (39.7%) | $76,667 |
| 65+ Years | 268 (33.2%) | $47,500 |
| Total | 807 (100.0%) | $58,287 |
Poverty in Clark County
Income Below Poverty by Sex and Age in Clark County
With 8.9% poverty level for males and 14.7% for females among the residents of Clark County, 12 to 14 year old males and under 5 year old females are the most vulnerable to poverty, with 17 males (33.3%) and 31 females (50.8%) in their respective age groups living below the poverty level.
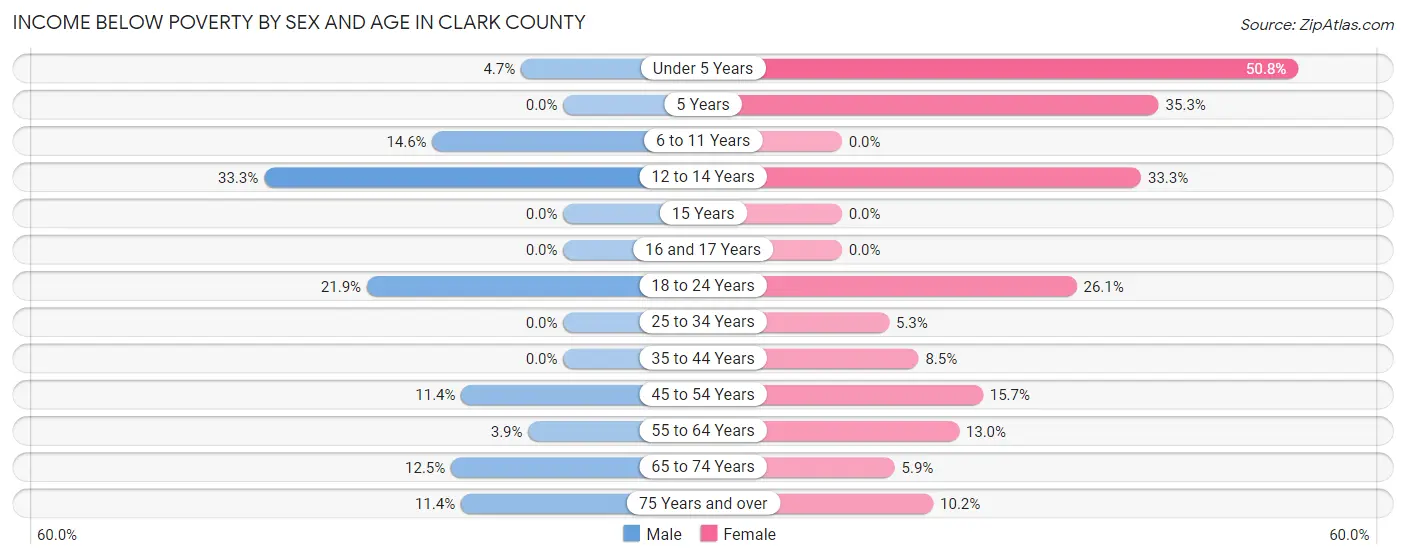
| Age Bracket | Male | Female |
| Under 5 Years | 4 (4.7%) | 31 (50.8%) |
| 5 Years | 0 (0.0%) | 6 (35.3%) |
| 6 to 11 Years | 14 (14.6%) | 0 (0.0%) |
| 12 to 14 Years | 17 (33.3%) | 8 (33.3%) |
| 15 Years | 0 (0.0%) | 0 (0.0%) |
| 16 and 17 Years | 0 (0.0%) | 0 (0.0%) |
| 18 to 24 Years | 7 (21.9%) | 23 (26.1%) |
| 25 to 34 Years | 0 (0.0%) | 4 (5.3%) |
| 35 to 44 Years | 0 (0.0%) | 7 (8.5%) |
| 45 to 54 Years | 15 (11.4%) | 19 (15.7%) |
| 55 to 64 Years | 6 (3.9%) | 18 (13.0%) |
| 65 to 74 Years | 11 (12.5%) | 5 (5.9%) |
| 75 Years and over | 13 (11.4%) | 12 (10.2%) |
| Total | 87 (8.9%) | 133 (14.7%) |
Income Above Poverty by Sex and Age in Clark County
According to the poverty statistics in Clark County, males aged 5 years and females aged 6 to 11 years are the age groups that are most secure financially, with 100.0% of males and 100.0% of females in these age groups living above the poverty line.
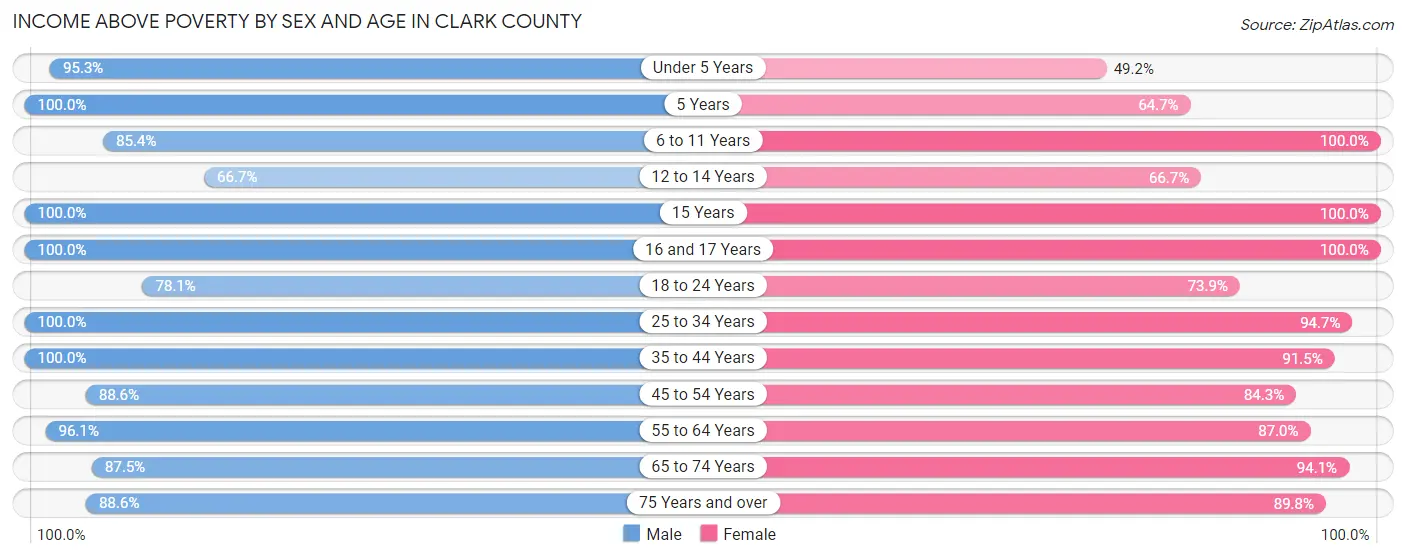
| Age Bracket | Male | Female |
| Under 5 Years | 81 (95.3%) | 30 (49.2%) |
| 5 Years | 6 (100.0%) | 11 (64.7%) |
| 6 to 11 Years | 82 (85.4%) | 40 (100.0%) |
| 12 to 14 Years | 34 (66.7%) | 16 (66.7%) |
| 15 Years | 1 (100.0%) | 9 (100.0%) |
| 16 and 17 Years | 23 (100.0%) | 43 (100.0%) |
| 18 to 24 Years | 25 (78.1%) | 65 (73.9%) |
| 25 to 34 Years | 86 (100.0%) | 72 (94.7%) |
| 35 to 44 Years | 104 (100.0%) | 75 (91.5%) |
| 45 to 54 Years | 117 (88.6%) | 102 (84.3%) |
| 55 to 64 Years | 148 (96.1%) | 120 (87.0%) |
| 65 to 74 Years | 77 (87.5%) | 80 (94.1%) |
| 75 Years and over | 101 (88.6%) | 106 (89.8%) |
| Total | 885 (91.0%) | 769 (85.3%) |
Income Below Poverty Among Married-Couple Families in Clark County
The poverty statistics for married-couple families in Clark County show that 6.0% or 24 of the total 397 families live below the poverty line. Families with no children have the highest poverty rate of 9.3%, comprising of 24 families. On the other hand, families with 1 or 2 children have the lowest poverty rate of 0.0%, which includes 0 families.
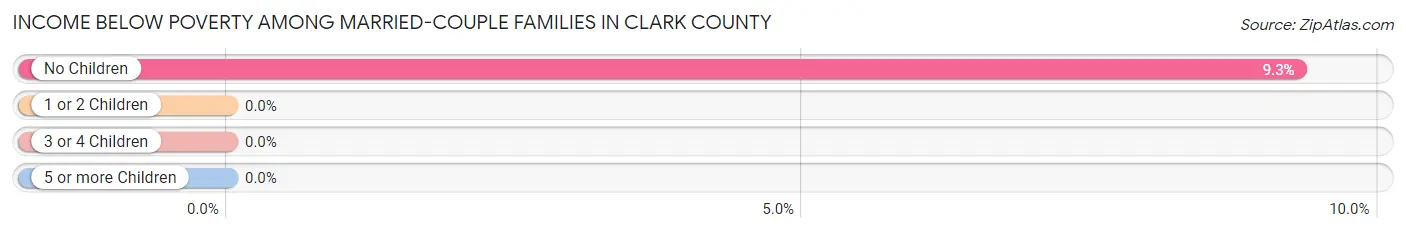
| Children | Above Poverty | Below Poverty |
| No Children | 234 (90.7%) | 24 (9.3%) |
| 1 or 2 Children | 113 (100.0%) | 0 (0.0%) |
| 3 or 4 Children | 21 (100.0%) | 0 (0.0%) |
| 5 or more Children | 5 (100.0%) | 0 (0.0%) |
| Total | 373 (94.0%) | 24 (6.0%) |
Income Below Poverty Among Single-Parent Households in Clark County
According to the poverty data in Clark County, 27.8% or 5 single-father households and 31.9% or 22 single-mother households are living below the poverty line. Among single-father households, those with 3 or 4 children have the highest poverty rate, with 5 households (100.0%) experiencing poverty. Likewise, among single-mother households, those with 3 or 4 children have the highest poverty rate, with 13 households (86.7%) falling below the poverty line.
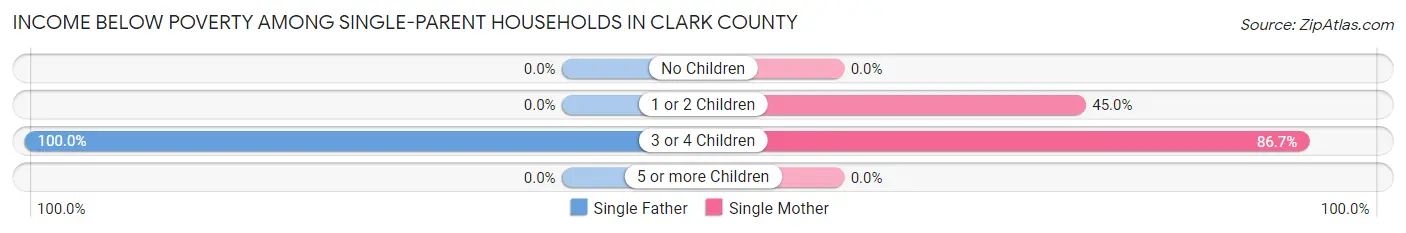
| Children | Single Father | Single Mother |
| No Children | 0 (0.0%) | 0 (0.0%) |
| 1 or 2 Children | 0 (0.0%) | 9 (45.0%) |
| 3 or 4 Children | 5 (100.0%) | 13 (86.7%) |
| 5 or more Children | 0 (0.0%) | 0 (0.0%) |
| Total | 5 (27.8%) | 22 (31.9%) |
Income Below Poverty Among Married-Couple vs Single-Parent Households in Clark County
The poverty data for Clark County shows that 24 of the married-couple family households (6.0%) and 27 of the single-parent households (31.0%) are living below the poverty level. Within the married-couple family households, those with no children have the highest poverty rate, with 24 households (9.3%) falling below the poverty line. Among the single-parent households, those with 3 or 4 children have the highest poverty rate, with 18 household (90.0%) living below poverty.
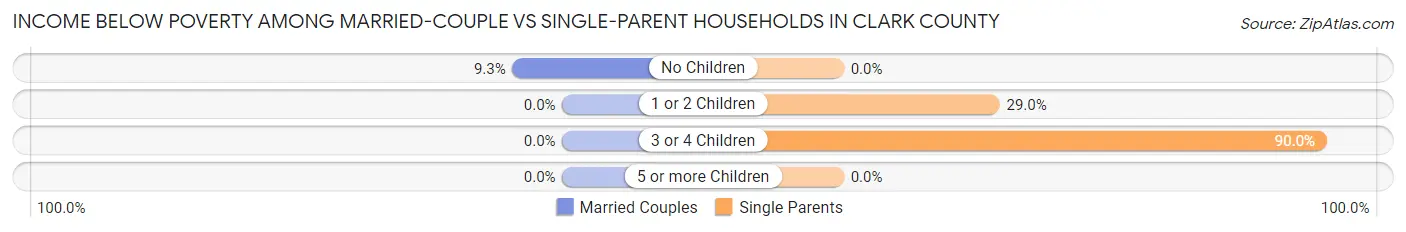
| Children | Married-Couple Families | Single-Parent Households |
| No Children | 24 (9.3%) | 0 (0.0%) |
| 1 or 2 Children | 0 (0.0%) | 9 (29.0%) |
| 3 or 4 Children | 0 (0.0%) | 18 (90.0%) |
| 5 or more Children | 0 (0.0%) | 0 (0.0%) |
| Total | 24 (6.0%) | 27 (31.0%) |
Employment Characteristics in Clark County
Employment by Class of Employer in Clark County
Among the 912 employed individuals in Clark County, private company employees (494 | 54.2%), local government employees (131 | 14.4%), and self-employed (not incorporated) (123 | 13.5%) make up the most common classes of employment.
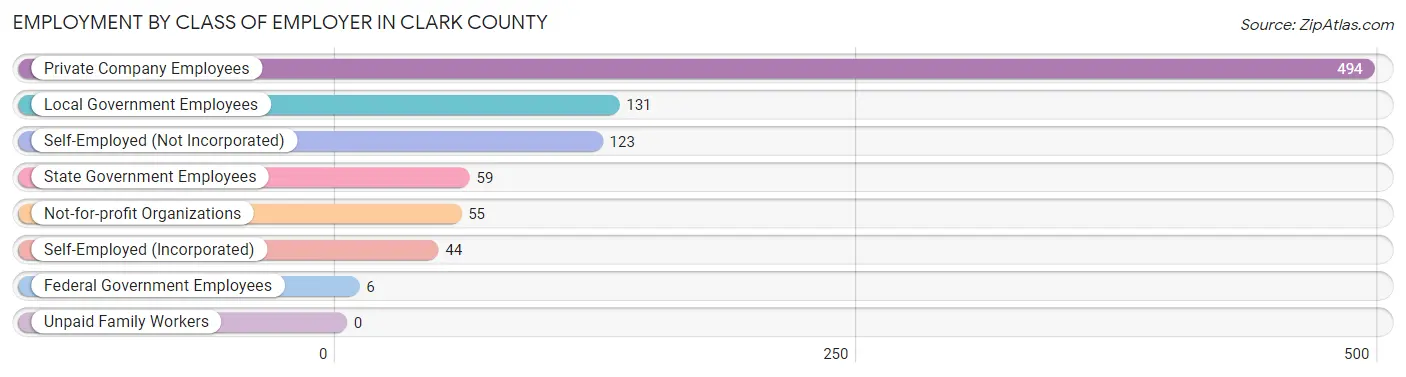
| Employer Class | # Employees | % Employees |
| Private Company Employees | 494 | 54.2% |
| Self-Employed (Incorporated) | 44 | 4.8% |
| Self-Employed (Not Incorporated) | 123 | 13.5% |
| Not-for-profit Organizations | 55 | 6.0% |
| Local Government Employees | 131 | 14.4% |
| State Government Employees | 59 | 6.5% |
| Federal Government Employees | 6 | 0.7% |
| Unpaid Family Workers | 0 | 0.0% |
| Total | 912 | 100.0% |
Employment Status by Age in Clark County
According to the labor force statistics for Clark County, out of the total population over 16 years of age (1,541), 62.0% or 955 individuals are in the labor force, with 1.0% or 10 of them unemployed. The age group with the highest labor force participation rate is 20 to 24 years, with 96.8% or 91 individuals in the labor force. Within the labor force, the 20 to 24 years age range has the highest percentage of unemployed individuals, with 9.9% or 9 of them being unemployed.
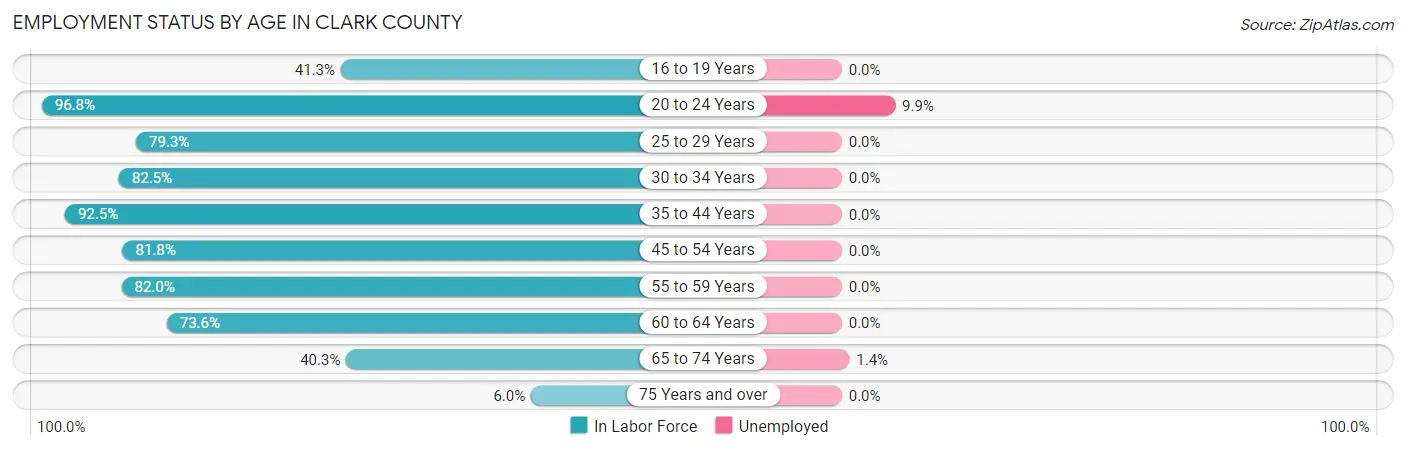
| Age Bracket | In Labor Force | Unemployed |
| 16 to 19 Years | 38 (41.3%) | 0 (0.0%) |
| 20 to 24 Years | 91 (96.8%) | 9 (9.9%) |
| 25 to 29 Years | 65 (79.3%) | 0 (0.0%) |
| 30 to 34 Years | 66 (82.5%) | 0 (0.0%) |
| 35 to 44 Years | 172 (92.5%) | 0 (0.0%) |
| 45 to 54 Years | 207 (81.8%) | 0 (0.0%) |
| 55 to 59 Years | 123 (82.0%) | 0 (0.0%) |
| 60 to 64 Years | 106 (73.6%) | 0 (0.0%) |
| 65 to 74 Years | 71 (40.3%) | 1 (1.4%) |
| 75 Years and over | 17 (6.0%) | 0 (0.0%) |
| Total | 955 (62.0%) | 10 (1.0%) |
Employment Status by Educational Attainment in Clark County

| Educational Attainment | In Labor Force | Unemployed |
| Less than High School | 36 (76.6%) | 0 (0.0%) |
| High School Diploma | 126 (79.7%) | 0 (0.0%) |
| College / Associate Degree | 350 (82.4%) | 0 (0.0%) |
| Bachelor's Degree or higher | 227 (85.7%) | 0 (0.0%) |
| Total | 739 (82.6%) | 0 (0.0%) |
Employment Occupations by Sex in Clark County
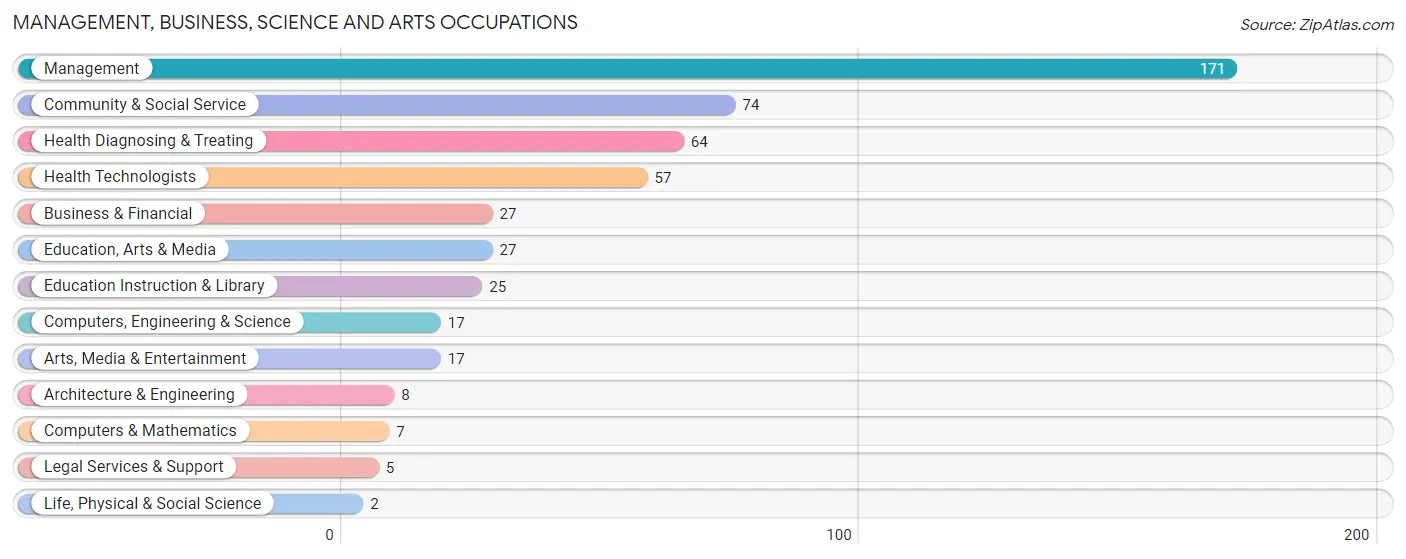
Management, Business, Science and Arts Occupations
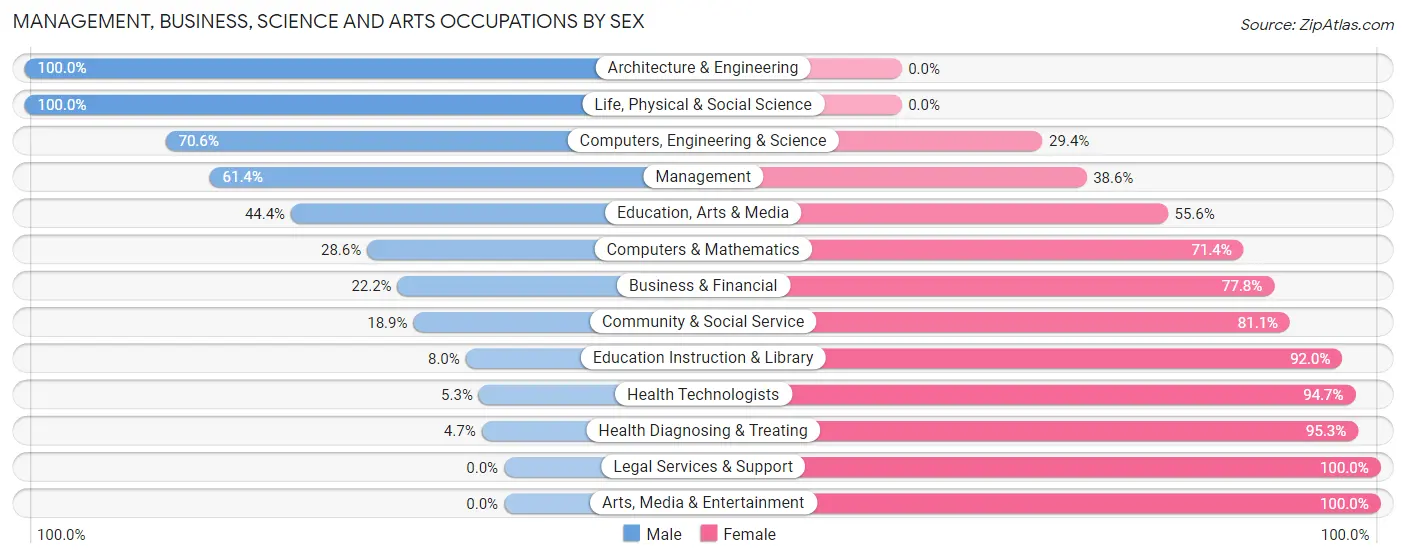
The most common Management, Business, Science and Arts occupations in Clark County are Management (171 | 18.1%), Community & Social Service (74 | 7.8%), Health Diagnosing & Treating (64 | 6.8%), Health Technologists (57 | 6.0%), and Business & Financial (27 | 2.9%).
Management, Business, Science and Arts Occupations by Sex
Within the Management, Business, Science and Arts occupations in Clark County, the most male-oriented occupations are Architecture & Engineering (100.0%), Life, Physical & Social Science (100.0%), and Computers, Engineering & Science (70.6%), while the most female-oriented occupations are Legal Services & Support (100.0%), Arts, Media & Entertainment (100.0%), and Health Diagnosing & Treating (95.3%).
| Occupation | Male | Female |
| Management | 105 (61.4%) | 66 (38.6%) |
| Business & Financial | 6 (22.2%) | 21 (77.8%) |
| Computers, Engineering & Science | 12 (70.6%) | 5 (29.4%) |
| Computers & Mathematics | 2 (28.6%) | 5 (71.4%) |
| Architecture & Engineering | 8 (100.0%) | 0 (0.0%) |
| Life, Physical & Social Science | 2 (100.0%) | 0 (0.0%) |
| Community & Social Service | 14 (18.9%) | 60 (81.1%) |
| Education, Arts & Media | 12 (44.4%) | 15 (55.6%) |
| Legal Services & Support | 0 (0.0%) | 5 (100.0%) |
| Education Instruction & Library | 2 (8.0%) | 23 (92.0%) |
| Arts, Media & Entertainment | 0 (0.0%) | 17 (100.0%) |
| Health Diagnosing & Treating | 3 (4.7%) | 61 (95.3%) |
| Health Technologists | 3 (5.3%) | 54 (94.7%) |
| Total (Category) | 140 (39.7%) | 213 (60.3%) |
| Total (Overall) | 504 (53.3%) | 442 (46.7%) |
Services Occupations
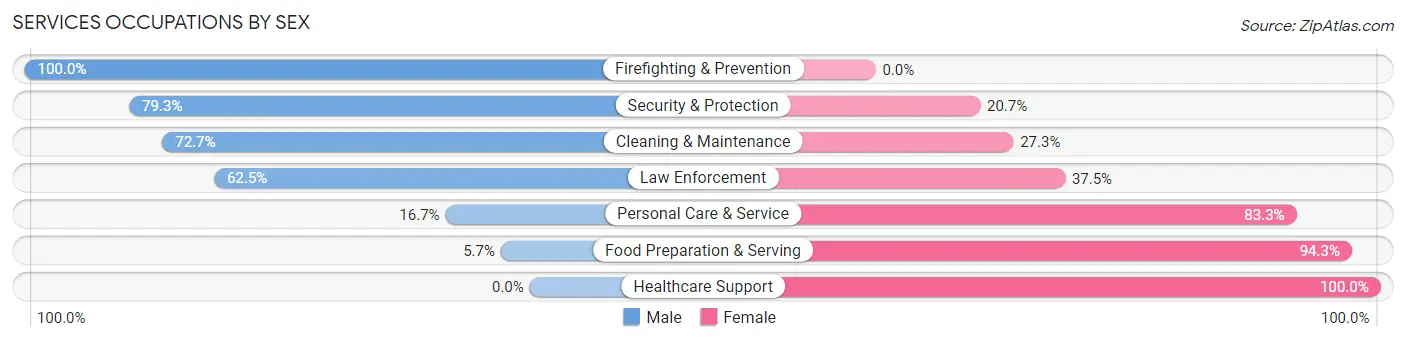
The most common Services occupations in Clark County are Cleaning & Maintenance (66 | 7.0%), Food Preparation & Serving (35 | 3.7%), Security & Protection (29 | 3.1%), Law Enforcement (16 | 1.7%), and Firefighting & Prevention (13 | 1.4%).

Services Occupations by Sex
Within the Services occupations in Clark County, the most male-oriented occupations are Firefighting & Prevention (100.0%), Security & Protection (79.3%), and Cleaning & Maintenance (72.7%), while the most female-oriented occupations are Healthcare Support (100.0%), Food Preparation & Serving (94.3%), and Personal Care & Service (83.3%).
| Occupation | Male | Female |
| Healthcare Support | 0 (0.0%) | 9 (100.0%) |
| Security & Protection | 23 (79.3%) | 6 (20.7%) |
| Firefighting & Prevention | 13 (100.0%) | 0 (0.0%) |
| Law Enforcement | 10 (62.5%) | 6 (37.5%) |
| Food Preparation & Serving | 2 (5.7%) | 33 (94.3%) |
| Cleaning & Maintenance | 48 (72.7%) | 18 (27.3%) |
| Personal Care & Service | 2 (16.7%) | 10 (83.3%) |
| Total (Category) | 75 (49.7%) | 76 (50.3%) |
| Total (Overall) | 504 (53.3%) | 442 (46.7%) |
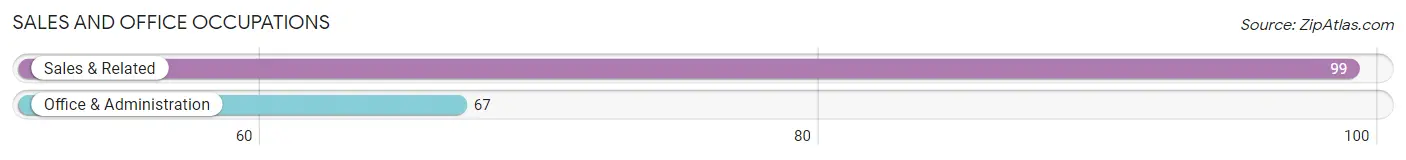
Sales and Office Occupations
The most common Sales and Office occupations in Clark County are Sales & Related (99 | 10.5%), and Office & Administration (67 | 7.1%).
Sales and Office Occupations by Sex
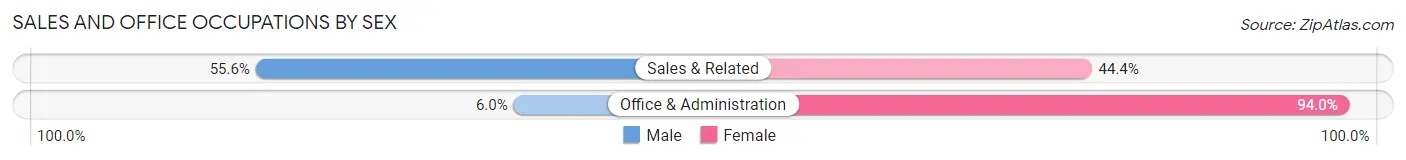
| Occupation | Male | Female |
| Sales & Related | 55 (55.6%) | 44 (44.4%) |
| Office & Administration | 4 (6.0%) | 63 (94.0%) |
| Total (Category) | 59 (35.5%) | 107 (64.5%) |
| Total (Overall) | 504 (53.3%) | 442 (46.7%) |
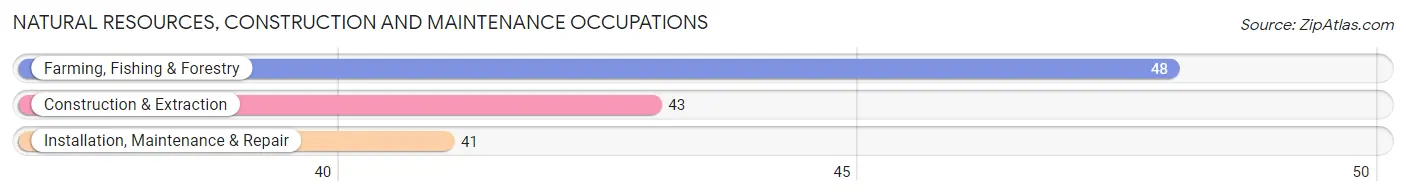
Natural Resources, Construction and Maintenance Occupations
The most common Natural Resources, Construction and Maintenance occupations in Clark County are Farming, Fishing & Forestry (48 | 5.1%), Construction & Extraction (43 | 4.5%), and Installation, Maintenance & Repair (41 | 4.3%).
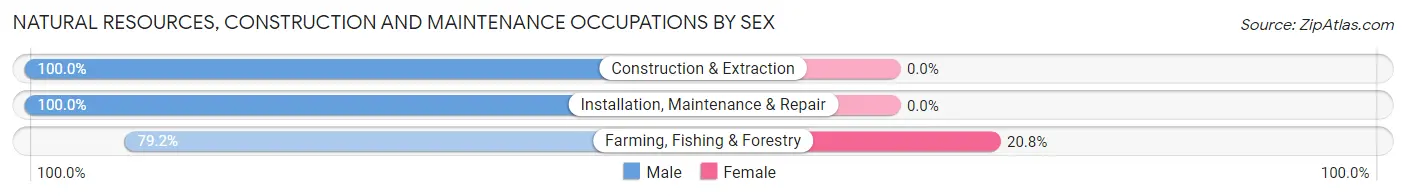
Natural Resources, Construction and Maintenance Occupations by Sex
| Occupation | Male | Female |
| Farming, Fishing & Forestry | 38 (79.2%) | 10 (20.8%) |
| Construction & Extraction | 43 (100.0%) | 0 (0.0%) |
| Installation, Maintenance & Repair | 41 (100.0%) | 0 (0.0%) |
| Total (Category) | 122 (92.4%) | 10 (7.6%) |
| Total (Overall) | 504 (53.3%) | 442 (46.7%) |
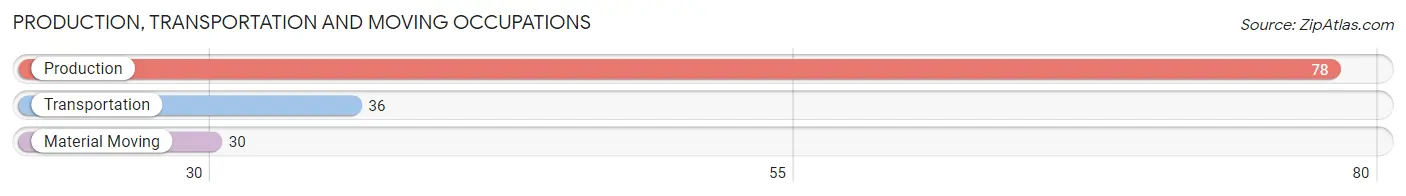
Production, Transportation and Moving Occupations
The most common Production, Transportation and Moving occupations in Clark County are Production (78 | 8.3%), Transportation (36 | 3.8%), and Material Moving (30 | 3.2%).
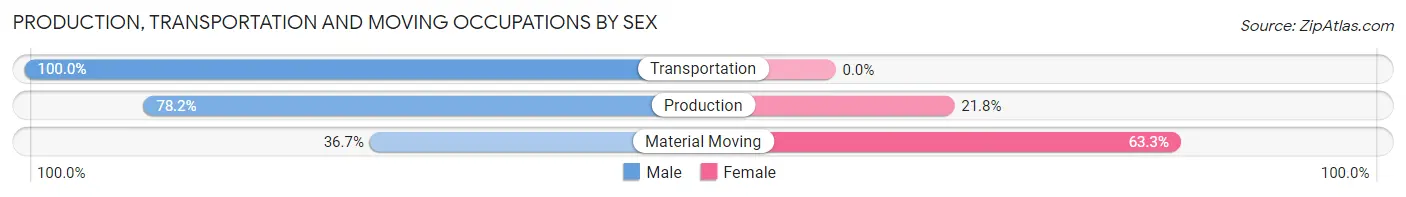
Production, Transportation and Moving Occupations by Sex
| Occupation | Male | Female |
| Production | 61 (78.2%) | 17 (21.8%) |
| Transportation | 36 (100.0%) | 0 (0.0%) |
| Material Moving | 11 (36.7%) | 19 (63.3%) |
| Total (Category) | 108 (75.0%) | 36 (25.0%) |
| Total (Overall) | 504 (53.3%) | 442 (46.7%) |
Employment Industries by Sex in Clark County
Employment Industries in Clark County
The major employment industries in Clark County include Retail Trade (146 | 15.4%), Agriculture, Fishing & Hunting (129 | 13.6%), Health Care & Social Assistance (125 | 13.2%), Educational Services (90 | 9.5%), and Construction (71 | 7.5%).

Employment Industries by Sex in Clark County
The Clark County industries that see more men than women are Construction (100.0%), Wholesale Trade (100.0%), and Utilities (100.0%), whereas the industries that tend to have a higher number of women are Information (100.0%), Real Estate, Rental & Leasing (100.0%), and Administrative & Support (100.0%).

| Industry | Male | Female |
| Agriculture, Fishing & Hunting | 102 (79.1%) | 27 (20.9%) |
| Mining, Quarrying, & Extraction | 5 (71.4%) | 2 (28.6%) |
| Construction | 71 (100.0%) | 0 (0.0%) |
| Manufacturing | 47 (78.3%) | 13 (21.7%) |
| Wholesale Trade | 27 (100.0%) | 0 (0.0%) |
| Retail Trade | 53 (36.3%) | 93 (63.7%) |
| Transportation & Warehousing | 19 (82.6%) | 4 (17.4%) |
| Utilities | 16 (100.0%) | 0 (0.0%) |
| Information | 0 (0.0%) | 3 (100.0%) |
| Finance & Insurance | 22 (64.7%) | 12 (35.3%) |
| Real Estate, Rental & Leasing | 0 (0.0%) | 8 (100.0%) |
| Professional & Scientific | 15 (36.6%) | 26 (63.4%) |
| Enterprise Management | 0 (0.0%) | 0 (0.0%) |
| Administrative & Support | 0 (0.0%) | 13 (100.0%) |
| Educational Services | 52 (57.8%) | 38 (42.2%) |
| Health Care & Social Assistance | 11 (8.8%) | 114 (91.2%) |
| Arts, Entertainment & Recreation | 2 (20.0%) | 8 (80.0%) |
| Accommodation & Food Services | 10 (33.3%) | 20 (66.7%) |
| Public Administration | 30 (42.2%) | 41 (57.8%) |
| Total | 504 (53.3%) | 442 (46.7%) |
Education in Clark County
School Enrollment in Clark County
The most common levels of schooling among the 439 students in Clark County are middle school (109 | 24.8%), high school (108 | 24.6%), and elementary school (94 | 21.4%).

| School Level | # Students | % Students |
| Nursery / Preschool | 37 | 8.4% |
| Kindergarten | 23 | 5.2% |
| Elementary School | 94 | 21.4% |
| Middle School | 109 | 24.8% |
| High School | 108 | 24.6% |
| College / Undergraduate | 60 | 13.7% |
| Graduate / Professional | 8 | 1.8% |
| Total | 439 | 100.0% |
School Enrollment by Age by Funding Source in Clark County
Out of a total of 439 students who are enrolled in schools in Clark County, 63 (14.4%) attend a private institution, while the remaining 376 (85.6%) are enrolled in public schools. The age group of 20 to 24 year olds has the highest likelihood of being enrolled in private schools, with 4 (30.8% in the age bracket) enrolled. Conversely, the age group of 35 years and over has the lowest likelihood of being enrolled in a private school, with 17 (100.0% in the age bracket) attending a public institution.
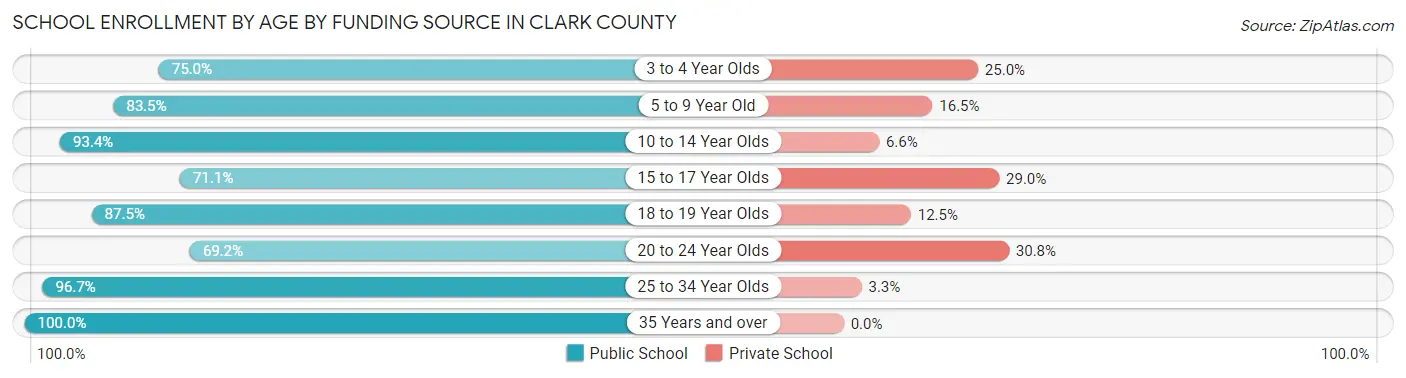
| Age Bracket | Public School | Private School |
| 3 to 4 Year Olds | 15 (75.0%) | 5 (25.0%) |
| 5 to 9 Year Old | 96 (83.5%) | 19 (16.5%) |
| 10 to 14 Year Olds | 142 (93.4%) | 10 (6.6%) |
| 15 to 17 Year Olds | 54 (71.1%) | 22 (28.9%) |
| 18 to 19 Year Olds | 14 (87.5%) | 2 (12.5%) |
| 20 to 24 Year Olds | 9 (69.2%) | 4 (30.8%) |
| 25 to 34 Year Olds | 29 (96.7%) | 1 (3.3%) |
| 35 Years and over | 17 (100.0%) | 0 (0.0%) |
| Total | 376 (85.6%) | 63 (14.4%) |
Educational Attainment by Field of Study in Clark County
Bio, nature & agricultural (71 | 19.3%), business (67 | 18.2%), education (65 | 17.7%), computers & mathematics (45 | 12.2%), and science & technology (37 | 10.1%) are the most common fields of study among 368 individuals in Clark County who have obtained a bachelor's degree or higher.
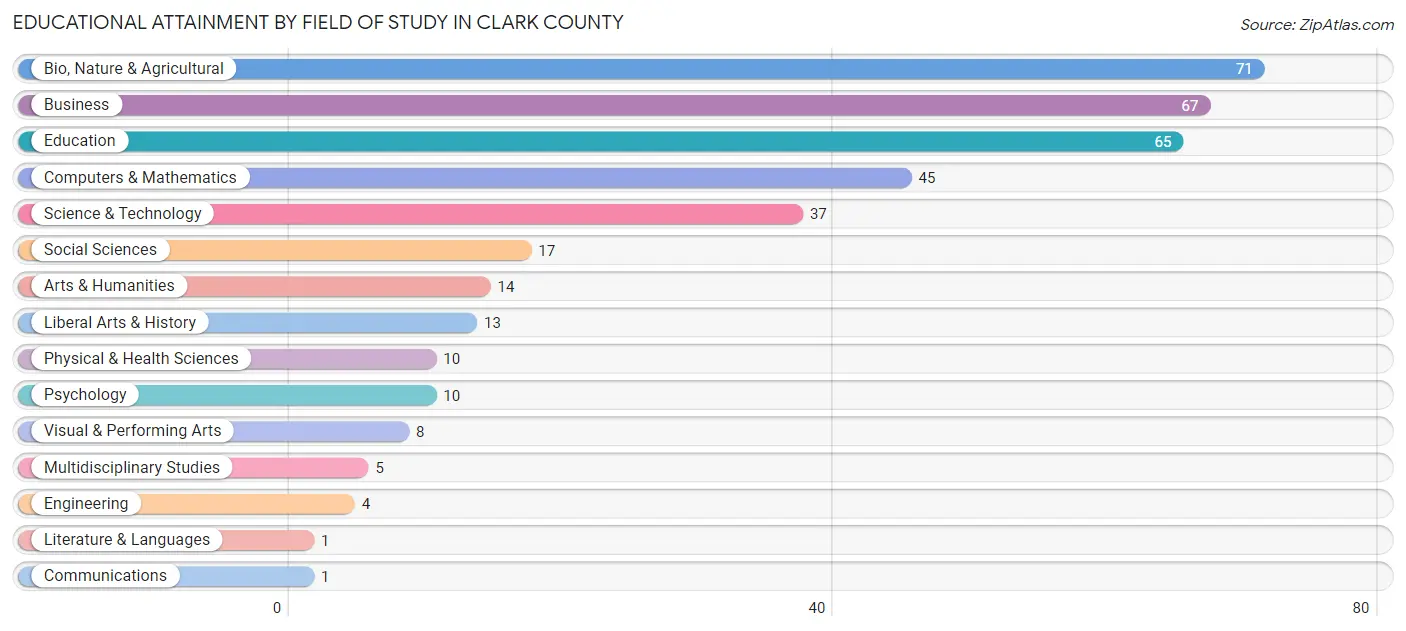
| Field of Study | # Graduates | % Graduates |
| Computers & Mathematics | 45 | 12.2% |
| Bio, Nature & Agricultural | 71 | 19.3% |
| Physical & Health Sciences | 10 | 2.7% |
| Psychology | 10 | 2.7% |
| Social Sciences | 17 | 4.6% |
| Engineering | 4 | 1.1% |
| Multidisciplinary Studies | 5 | 1.4% |
| Science & Technology | 37 | 10.1% |
| Business | 67 | 18.2% |
| Education | 65 | 17.7% |
| Literature & Languages | 1 | 0.3% |
| Liberal Arts & History | 13 | 3.5% |
| Visual & Performing Arts | 8 | 2.2% |
| Communications | 1 | 0.3% |
| Arts & Humanities | 14 | 3.8% |
| Total | 368 | 100.0% |
Transportation & Commute in Clark County
Vehicle Availability by Sex in Clark County
The most prevalent vehicle ownership categories in Clark County are males with 2 vehicles (163, accounting for 33.8%) and females with 2 vehicles (141, making up 38.0%).
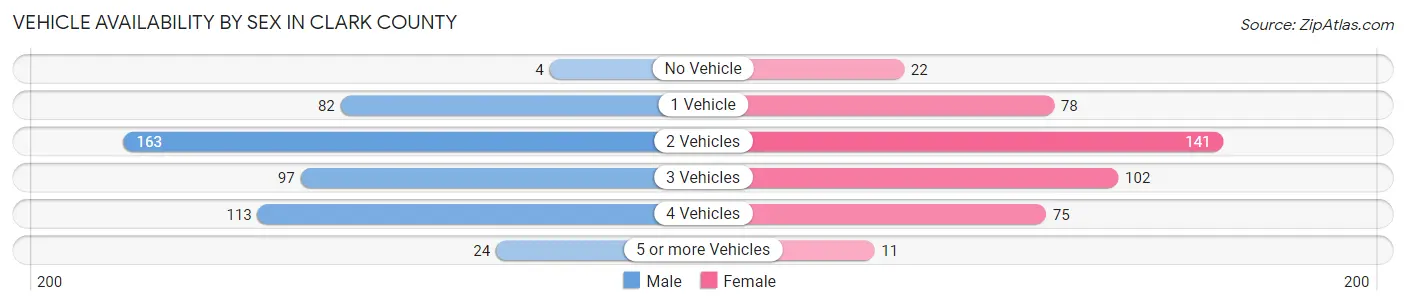
| Vehicles Available | Male | Female |
| No Vehicle | 4 (0.8%) | 22 (5.1%) |
| 1 Vehicle | 82 (17.0%) | 78 (18.2%) |
| 2 Vehicles | 163 (33.8%) | 141 (32.9%) |
| 3 Vehicles | 97 (20.1%) | 102 (23.8%) |
| 4 Vehicles | 113 (23.4%) | 75 (17.5%) |
| 5 or more Vehicles | 24 (5.0%) | 11 (2.6%) |
| Total | 483 (100.0%) | 429 (100.0%) |
Commute Time in Clark County
The most frequently occuring commute durations in Clark County are less than 5 minutes (248 commuters, 28.8%), 5 to 9 minutes (154 commuters, 17.9%), and 10 to 14 minutes (91 commuters, 10.6%).
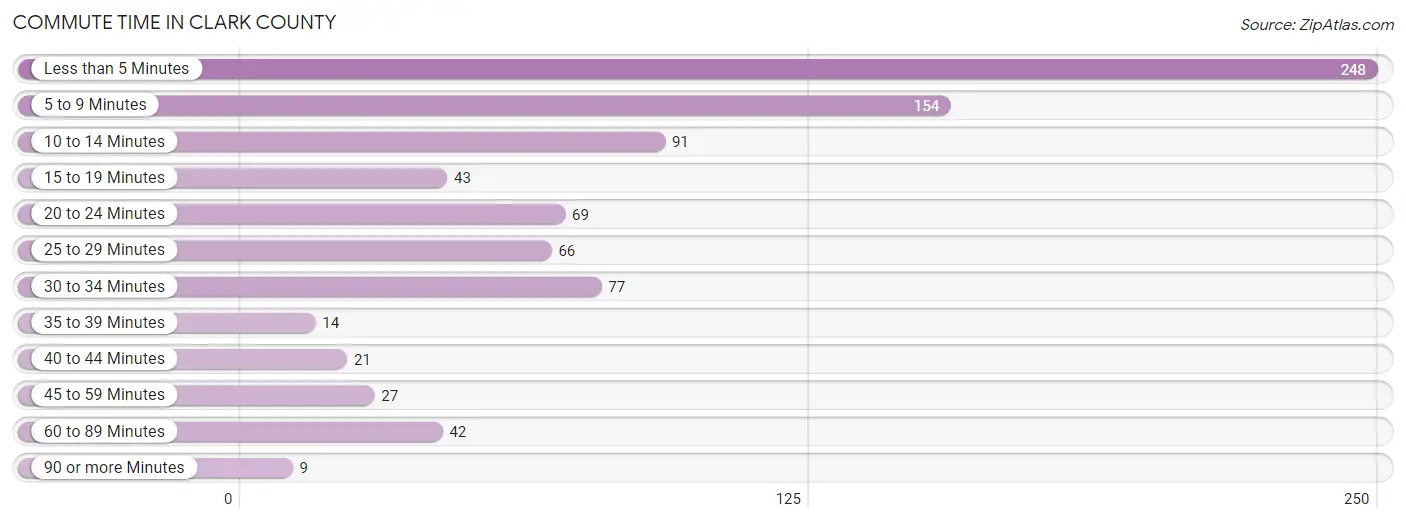
| Commute Time | # Commuters | % Commuters |
| Less than 5 Minutes | 248 | 28.8% |
| 5 to 9 Minutes | 154 | 17.9% |
| 10 to 14 Minutes | 91 | 10.6% |
| 15 to 19 Minutes | 43 | 5.0% |
| 20 to 24 Minutes | 69 | 8.0% |
| 25 to 29 Minutes | 66 | 7.7% |
| 30 to 34 Minutes | 77 | 8.9% |
| 35 to 39 Minutes | 14 | 1.6% |
| 40 to 44 Minutes | 21 | 2.4% |
| 45 to 59 Minutes | 27 | 3.1% |
| 60 to 89 Minutes | 42 | 4.9% |
| 90 or more Minutes | 9 | 1.1% |
Commute Time by Sex in Clark County
The most common commute times in Clark County are less than 5 minutes (113 commuters, 24.3%) for males and less than 5 minutes (135 commuters, 34.0%) for females.

| Commute Time | Male | Female |
| Less than 5 Minutes | 113 (24.3%) | 135 (34.0%) |
| 5 to 9 Minutes | 103 (22.2%) | 51 (12.9%) |
| 10 to 14 Minutes | 44 (9.5%) | 47 (11.8%) |
| 15 to 19 Minutes | 21 (4.5%) | 22 (5.5%) |
| 20 to 24 Minutes | 46 (9.9%) | 23 (5.8%) |
| 25 to 29 Minutes | 40 (8.6%) | 26 (6.6%) |
| 30 to 34 Minutes | 40 (8.6%) | 37 (9.3%) |
| 35 to 39 Minutes | 8 (1.7%) | 6 (1.5%) |
| 40 to 44 Minutes | 0 (0.0%) | 21 (5.3%) |
| 45 to 59 Minutes | 23 (5.0%) | 4 (1.0%) |
| 60 to 89 Minutes | 23 (5.0%) | 19 (4.8%) |
| 90 or more Minutes | 3 (0.6%) | 6 (1.5%) |
Time of Departure to Work by Sex in Clark County
The most frequent times of departure to work in Clark County are 7:00 AM to 7:29 AM (121, 26.1%) for males and 7:30 AM to 7:59 AM (110, 27.7%) for females.
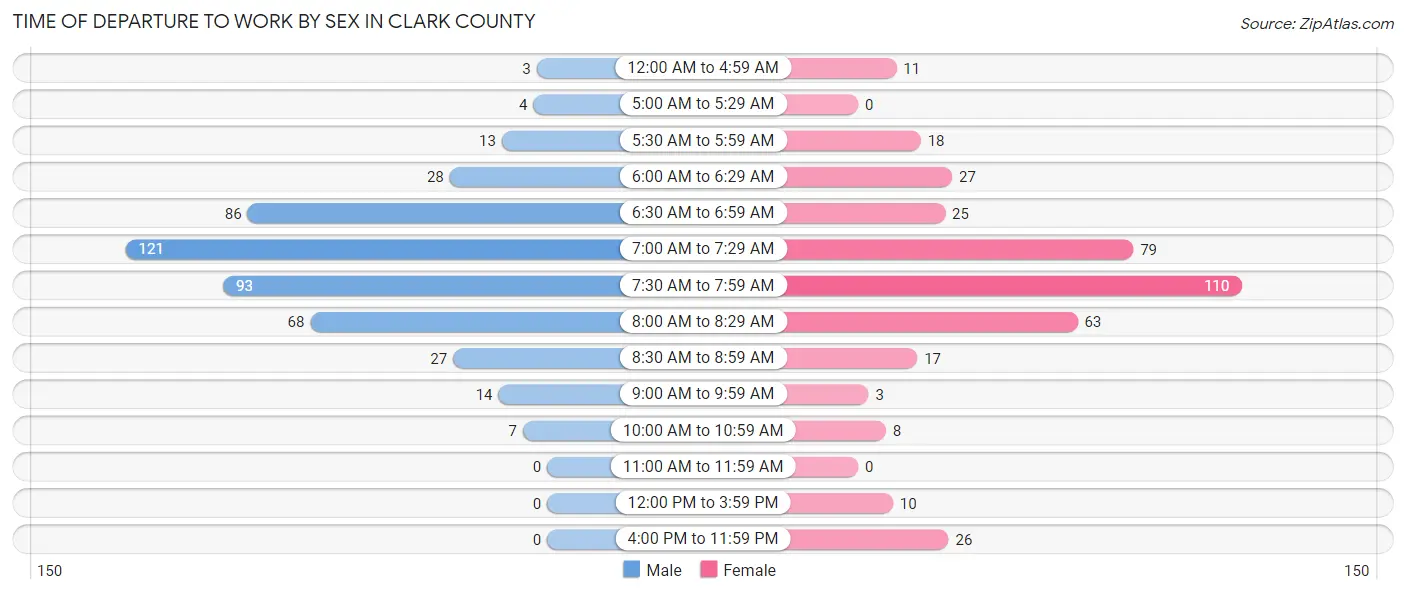
| Time of Departure | Male | Female |
| 12:00 AM to 4:59 AM | 3 (0.6%) | 11 (2.8%) |
| 5:00 AM to 5:29 AM | 4 (0.9%) | 0 (0.0%) |
| 5:30 AM to 5:59 AM | 13 (2.8%) | 18 (4.5%) |
| 6:00 AM to 6:29 AM | 28 (6.0%) | 27 (6.8%) |
| 6:30 AM to 6:59 AM | 86 (18.5%) | 25 (6.3%) |
| 7:00 AM to 7:29 AM | 121 (26.1%) | 79 (19.9%) |
| 7:30 AM to 7:59 AM | 93 (20.0%) | 110 (27.7%) |
| 8:00 AM to 8:29 AM | 68 (14.7%) | 63 (15.9%) |
| 8:30 AM to 8:59 AM | 27 (5.8%) | 17 (4.3%) |
| 9:00 AM to 9:59 AM | 14 (3.0%) | 3 (0.8%) |
| 10:00 AM to 10:59 AM | 7 (1.5%) | 8 (2.0%) |
| 11:00 AM to 11:59 AM | 0 (0.0%) | 0 (0.0%) |
| 12:00 PM to 3:59 PM | 0 (0.0%) | 10 (2.5%) |
| 4:00 PM to 11:59 PM | 0 (0.0%) | 26 (6.6%) |
| Total | 464 (100.0%) | 397 (100.0%) |
Housing Occupancy in Clark County
Occupancy by Ownership in Clark County
Of the total 807 dwellings in Clark County, owner-occupied units account for 595 (73.7%), while renter-occupied units make up 212 (26.3%).

| Occupancy | # Housing Units | % Housing Units |
| Owner Occupied Housing Units | 595 | 73.7% |
| Renter-Occupied Housing Units | 212 | 26.3% |
| Total Occupied Housing Units | 807 | 100.0% |
Occupancy by Household Size in Clark County

| Household Size | # Housing Units | % Housing Units |
| 1-Person Household | 266 | 33.0% |
| 2-Person Household | 323 | 40.0% |
| 3-Person Household | 69 | 8.6% |
| 4+ Person Household | 149 | 18.5% |
| Total Housing Units | 807 | 100.0% |
Occupancy by Ownership by Household Size in Clark County

| Household Size | Owner-occupied | Renter-occupied |
| 1-Person Household | 199 (74.8%) | 67 (25.2%) |
| 2-Person Household | 267 (82.7%) | 56 (17.3%) |
| 3-Person Household | 44 (63.8%) | 25 (36.2%) |
| 4+ Person Household | 85 (57.1%) | 64 (42.9%) |
| Total Housing Units | 595 (73.7%) | 212 (26.3%) |
Occupancy by Educational Attainment in Clark County

| Household Size | Owner-occupied | Renter-occupied |
| Less than High School | 11 (36.7%) | 19 (63.3%) |
| High School Diploma | 160 (72.4%) | 61 (27.6%) |
| College/Associate Degree | 248 (78.0%) | 70 (22.0%) |
| Bachelor's Degree or higher | 176 (74.0%) | 62 (26.1%) |
Occupancy by Age of Householder in Clark County
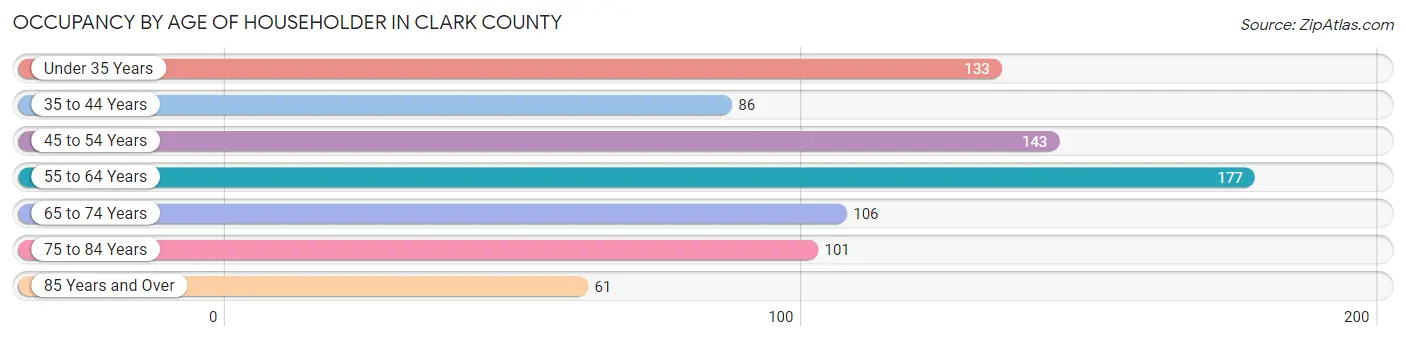
| Age Bracket | # Households | % Households |
| Under 35 Years | 133 | 16.5% |
| 35 to 44 Years | 86 | 10.7% |
| 45 to 54 Years | 143 | 17.7% |
| 55 to 64 Years | 177 | 21.9% |
| 65 to 74 Years | 106 | 13.1% |
| 75 to 84 Years | 101 | 12.5% |
| 85 Years and Over | 61 | 7.6% |
| Total | 807 | 100.0% |
Housing Finances in Clark County
Median Income by Occupancy in Clark County
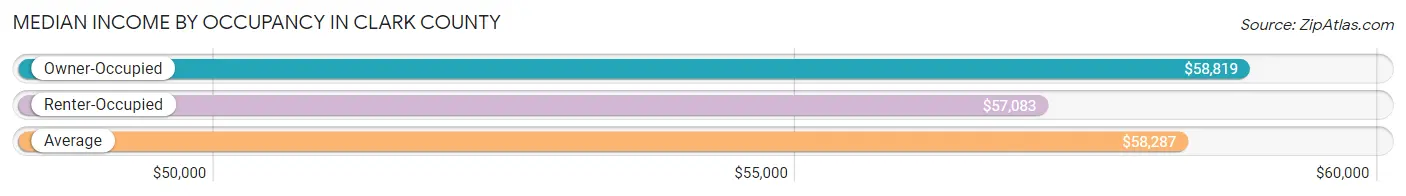
| Occupancy Type | # Households | Median Income |
| Owner-Occupied | 595 (73.7%) | $58,819 |
| Renter-Occupied | 212 (26.3%) | $57,083 |
| Average | 807 (100.0%) | $58,287 |
Occupancy by Householder Income Bracket in Clark County

| Income Bracket | Owner-occupied | Renter-occupied |
| Less than $5,000 | 18 (3.0%) | 13 (6.1%) |
| $5,000 to $9,999 | 6 (1.0%) | 9 (4.3%) |
| $10,000 to $14,999 | 6 (1.0%) | 14 (6.6%) |
| $15,000 to $19,999 | 19 (3.2%) | 9 (4.3%) |
| $20,000 to $24,999 | 20 (3.4%) | 4 (1.9%) |
| $25,000 to $34,999 | 83 (14.0%) | 21 (9.9%) |
| $35,000 to $49,999 | 80 (13.5%) | 15 (7.1%) |
| $50,000 to $74,999 | 127 (21.3%) | 63 (29.7%) |
| $75,000 to $99,999 | 96 (16.1%) | 36 (17.0%) |
| $100,000 to $149,999 | 95 (16.0%) | 11 (5.2%) |
| $150,000 or more | 45 (7.6%) | 17 (8.0%) |
| Total | 595 (100.0%) | 212 (100.0%) |
Monthly Housing Cost Tiers in Clark County
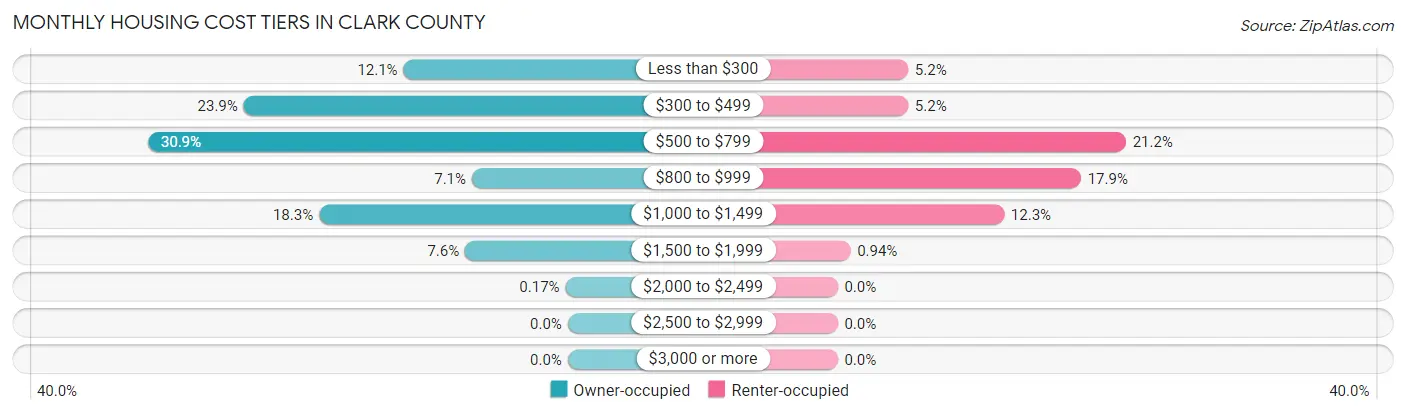
| Monthly Cost | Owner-occupied | Renter-occupied |
| Less than $300 | 72 (12.1%) | 11 (5.2%) |
| $300 to $499 | 142 (23.9%) | 11 (5.2%) |
| $500 to $799 | 184 (30.9%) | 45 (21.2%) |
| $800 to $999 | 42 (7.1%) | 38 (17.9%) |
| $1,000 to $1,499 | 109 (18.3%) | 26 (12.3%) |
| $1,500 to $1,999 | 45 (7.6%) | 2 (0.9%) |
| $2,000 to $2,499 | 1 (0.2%) | 0 (0.0%) |
| $2,500 to $2,999 | 0 (0.0%) | 0 (0.0%) |
| $3,000 or more | 0 (0.0%) | 0 (0.0%) |
| Total | 595 (100.0%) | 212 (100.0%) |
Physical Housing Characteristics in Clark County
Housing Structures in Clark County
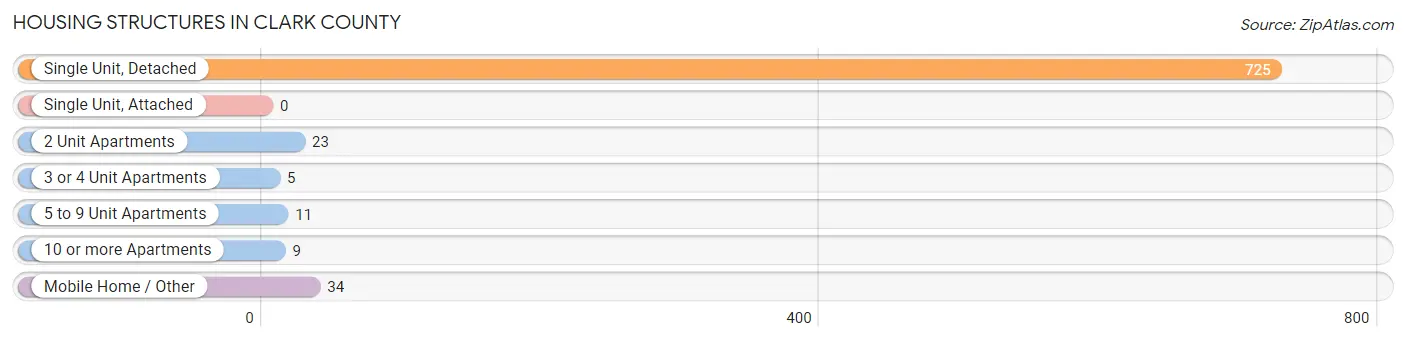
| Structure Type | # Housing Units | % Housing Units |
| Single Unit, Detached | 725 | 89.8% |
| Single Unit, Attached | 0 | 0.0% |
| 2 Unit Apartments | 23 | 2.9% |
| 3 or 4 Unit Apartments | 5 | 0.6% |
| 5 to 9 Unit Apartments | 11 | 1.4% |
| 10 or more Apartments | 9 | 1.1% |
| Mobile Home / Other | 34 | 4.2% |
| Total | 807 | 100.0% |
Housing Structures by Occupancy in Clark County

| Structure Type | Owner-occupied | Renter-occupied |
| Single Unit, Detached | 553 (76.3%) | 172 (23.7%) |
| Single Unit, Attached | 0 (0.0%) | 0 (0.0%) |
| 2 Unit Apartments | 8 (34.8%) | 15 (65.2%) |
| 3 or 4 Unit Apartments | 0 (0.0%) | 5 (100.0%) |
| 5 to 9 Unit Apartments | 0 (0.0%) | 11 (100.0%) |
| 10 or more Apartments | 0 (0.0%) | 9 (100.0%) |
| Mobile Home / Other | 34 (100.0%) | 0 (0.0%) |
| Total | 595 (73.7%) | 212 (26.3%) |
Housing Structures by Number of Rooms in Clark County
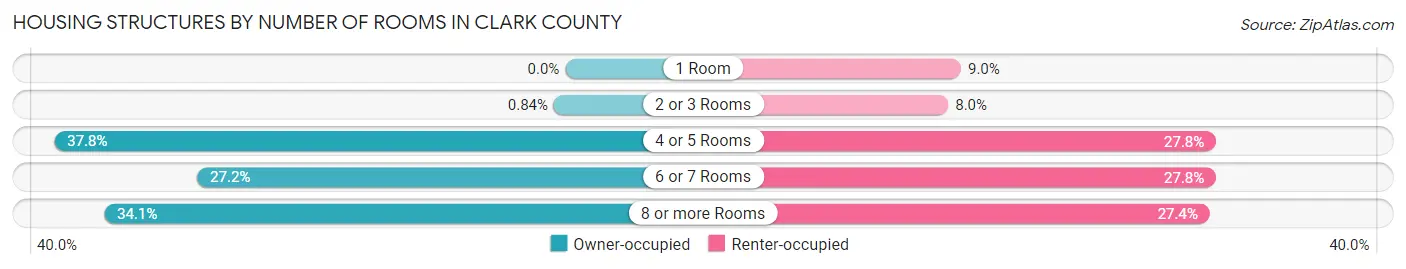
| Number of Rooms | Owner-occupied | Renter-occupied |
| 1 Room | 0 (0.0%) | 19 (9.0%) |
| 2 or 3 Rooms | 5 (0.8%) | 17 (8.0%) |
| 4 or 5 Rooms | 225 (37.8%) | 59 (27.8%) |
| 6 or 7 Rooms | 162 (27.2%) | 59 (27.8%) |
| 8 or more Rooms | 203 (34.1%) | 58 (27.4%) |
| Total | 595 (100.0%) | 212 (100.0%) |
Housing Structure by Heating Type in Clark County

| Heating Type | Owner-occupied | Renter-occupied |
| Utility Gas | 416 (69.9%) | 109 (51.4%) |
| Bottled, Tank, or LP Gas | 80 (13.5%) | 51 (24.1%) |
| Electricity | 85 (14.3%) | 50 (23.6%) |
| Fuel Oil or Kerosene | 0 (0.0%) | 2 (0.9%) |
| Coal or Coke | 0 (0.0%) | 0 (0.0%) |
| All other Fuels | 14 (2.4%) | 0 (0.0%) |
| No Fuel Used | 0 (0.0%) | 0 (0.0%) |
| Total | 595 (100.0%) | 212 (100.0%) |
Household Vehicle Usage in Clark County

| Vehicles per Household | Owner-occupied | Renter-occupied |
| No Vehicle | 22 (3.7%) | 11 (5.2%) |
| 1 Vehicle | 147 (24.7%) | 87 (41.0%) |
| 2 Vehicles | 223 (37.5%) | 58 (27.4%) |
| 3 or more Vehicles | 203 (34.1%) | 56 (26.4%) |
| Total | 595 (100.0%) | 212 (100.0%) |
Real Estate & Mortgages in Clark County
Real Estate and Mortgage Overview in Clark County
| Characteristic | Without Mortgage | With Mortgage |
| Housing Units | 361 | 234 |
| Median Property Value | $74,800 | $87,000 |
| Median Household Income | $50,063 | $25 |
| Monthly Housing Costs | $468 | $0 |
| Real Estate Taxes | $1,280 | $0 |
Property Value by Mortgage Status in Clark County

| Property Value | Without Mortgage | With Mortgage |
| Less than $50,000 | 111 (30.7%) | 31 (13.3%) |
| $50,000 to $99,999 | 160 (44.3%) | 103 (44.0%) |
| $100,000 to $299,999 | 90 (24.9%) | 99 (42.3%) |
| $300,000 to $499,999 | 0 (0.0%) | 1 (0.4%) |
| $500,000 to $749,999 | 0 (0.0%) | 0 (0.0%) |
| $750,000 to $999,999 | 0 (0.0%) | 0 (0.0%) |
| $1,000,000 or more | 0 (0.0%) | 0 (0.0%) |
| Total | 361 (100.0%) | 234 (100.0%) |
Household Income by Mortgage Status in Clark County
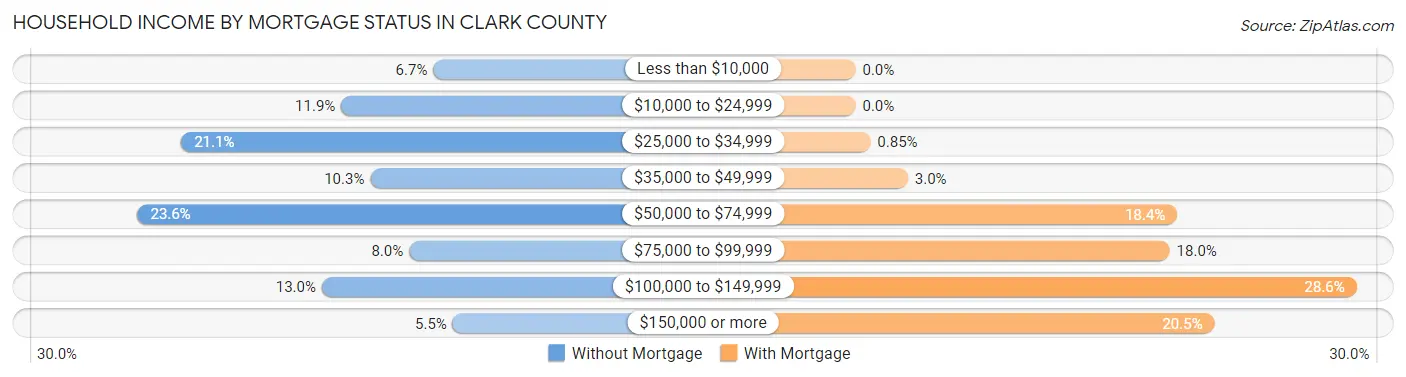
| Household Income | Without Mortgage | With Mortgage |
| Less than $10,000 | 24 (6.7%) | 0 (0.0%) |
| $10,000 to $24,999 | 43 (11.9%) | 0 (0.0%) |
| $25,000 to $34,999 | 76 (21.0%) | 2 (0.9%) |
| $35,000 to $49,999 | 37 (10.2%) | 7 (3.0%) |
| $50,000 to $74,999 | 85 (23.5%) | 43 (18.4%) |
| $75,000 to $99,999 | 29 (8.0%) | 42 (17.9%) |
| $100,000 to $149,999 | 47 (13.0%) | 67 (28.6%) |
| $150,000 or more | 20 (5.5%) | 48 (20.5%) |
| Total | 361 (100.0%) | 234 (100.0%) |
Property Value to Household Income Ratio in Clark County

| Value-to-Income Ratio | Without Mortgage | With Mortgage |
| Less than 2.0x | 244 (67.6%) | 86,250 (36,859.0%) |
| 2.0x to 2.9x | 41 (11.4%) | 185 (79.1%) |
| 3.0x to 3.9x | 29 (8.0%) | 18 (7.7%) |
| 4.0x or more | 47 (13.0%) | 22 (9.4%) |
| Total | 361 (100.0%) | 234 (100.0%) |
Real Estate Taxes by Mortgage Status in Clark County
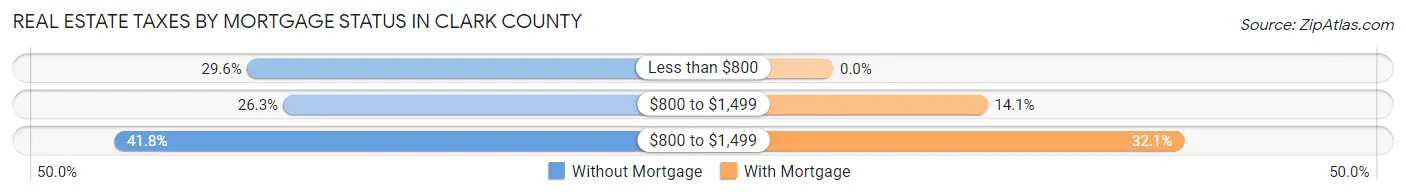
| Property Taxes | Without Mortgage | With Mortgage |
| Less than $800 | 107 (29.6%) | 0 (0.0%) |
| $800 to $1,499 | 95 (26.3%) | 33 (14.1%) |
| $800 to $1,499 | 151 (41.8%) | 75 (32.1%) |
| Total | 361 (100.0%) | 234 (100.0%) |
Health & Disability in Clark County
Health Insurance Coverage by Age in Clark County

| Age Bracket | With Coverage | Without Coverage |
| Under 6 Years | 172 (98.9%) | 2 (1.1%) |
| 6 to 18 Years | 303 (89.4%) | 36 (10.6%) |
| 19 to 25 Years | 127 (89.4%) | 15 (10.6%) |
| 26 to 34 Years | 128 (99.2%) | 1 (0.8%) |
| 35 to 44 Years | 150 (80.6%) | 36 (19.4%) |
| 45 to 54 Years | 239 (94.5%) | 14 (5.5%) |
| 55 to 64 Years | 274 (93.8%) | 18 (6.2%) |
| 65 to 74 Years | 173 (100.0%) | 0 (0.0%) |
| 75 Years and older | 232 (100.0%) | 0 (0.0%) |
| Total | 1,798 (93.6%) | 122 (6.4%) |
Health Insurance Coverage by Citizenship Status in Clark County

| Citizenship Status | With Coverage | Without Coverage |
| Native Born | 172 (98.9%) | 2 (1.1%) |
| Foreign Born, Citizen | 303 (89.4%) | 36 (10.6%) |
| Foreign Born, not a Citizen | 127 (89.4%) | 15 (10.6%) |
Health Insurance Coverage by Household Income in Clark County
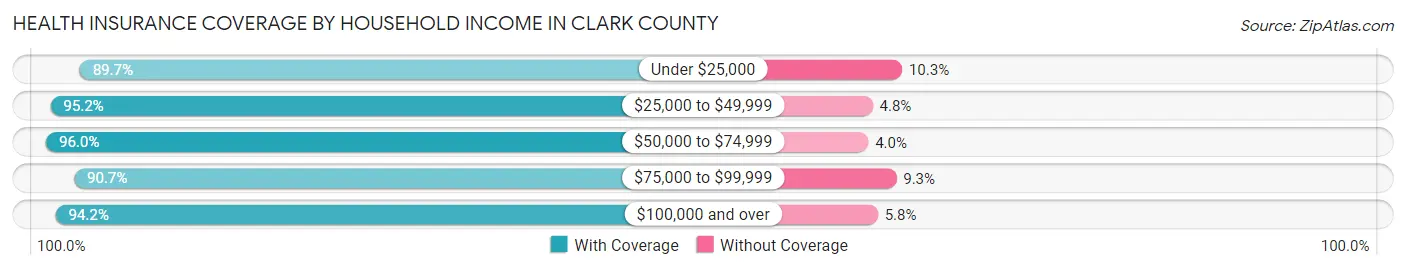
| Household Income | With Coverage | Without Coverage |
| Under $25,000 | 182 (89.7%) | 21 (10.3%) |
| $25,000 to $49,999 | 334 (95.2%) | 17 (4.8%) |
| $50,000 to $74,999 | 406 (96.0%) | 17 (4.0%) |
| $75,000 to $99,999 | 323 (90.7%) | 33 (9.3%) |
| $100,000 and over | 553 (94.2%) | 34 (5.8%) |
Public vs Private Health Insurance Coverage by Age in Clark County

| Age Bracket | Public Insurance | Private Insurance |
| Under 6 | 56 (32.2%) | 121 (69.5%) |
| 6 to 18 Years | 49 (14.4%) | 259 (76.4%) |
| 19 to 25 Years | 30 (21.1%) | 100 (70.4%) |
| 25 to 34 Years | 10 (7.7%) | 123 (95.4%) |
| 35 to 44 Years | 13 (7.0%) | 141 (75.8%) |
| 45 to 54 Years | 14 (5.5%) | 234 (92.5%) |
| 55 to 64 Years | 25 (8.6%) | 267 (91.4%) |
| 65 to 74 Years | 163 (94.2%) | 87 (50.3%) |
| 75 Years and over | 232 (100.0%) | 171 (73.7%) |
| Total | 592 (30.8%) | 1,503 (78.3%) |
Disability Status by Sex by Age in Clark County
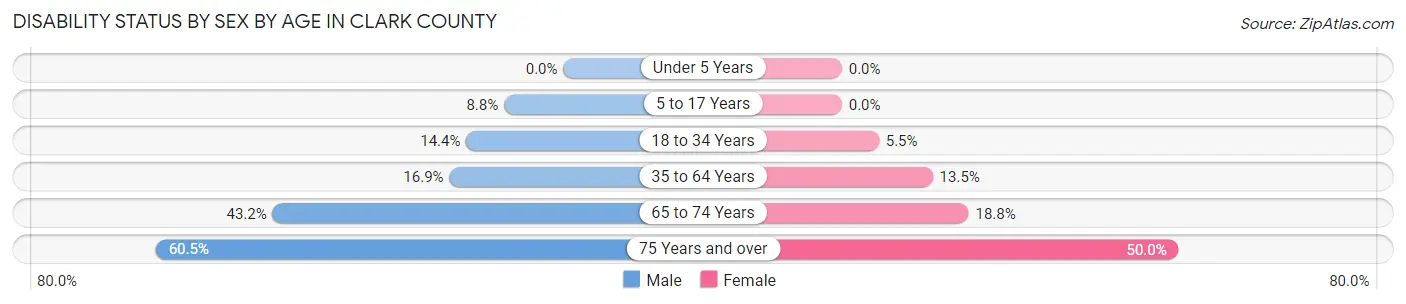
| Age Bracket | Male | Female |
| Under 5 Years | 0 (0.0%) | 0 (0.0%) |
| 5 to 17 Years | 17 (8.8%) | 0 (0.0%) |
| 18 to 34 Years | 17 (14.4%) | 9 (5.5%) |
| 35 to 64 Years | 66 (16.9%) | 46 (13.5%) |
| 65 to 74 Years | 38 (43.2%) | 16 (18.8%) |
| 75 Years and over | 69 (60.5%) | 59 (50.0%) |
Disability Class by Sex by Age in Clark County
Disability Class: Hearing Difficulty
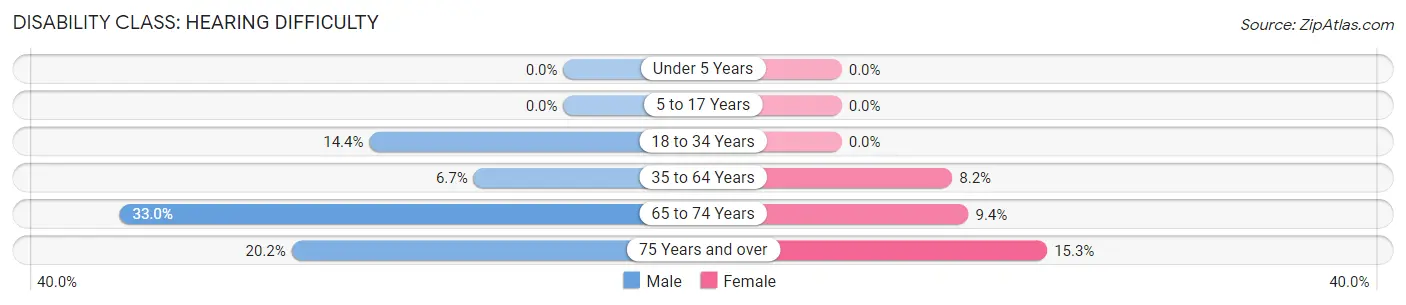
| Age Bracket | Male | Female |
| Under 5 Years | 0 (0.0%) | 0 (0.0%) |
| 5 to 17 Years | 0 (0.0%) | 0 (0.0%) |
| 18 to 34 Years | 17 (14.4%) | 0 (0.0%) |
| 35 to 64 Years | 26 (6.7%) | 28 (8.2%) |
| 65 to 74 Years | 29 (33.0%) | 8 (9.4%) |
| 75 Years and over | 23 (20.2%) | 18 (15.2%) |
Disability Class: Vision Difficulty

| Age Bracket | Male | Female |
| Under 5 Years | 0 (0.0%) | 0 (0.0%) |
| 5 to 17 Years | 0 (0.0%) | 0 (0.0%) |
| 18 to 34 Years | 17 (14.4%) | 6 (3.7%) |
| 35 to 64 Years | 10 (2.6%) | 2 (0.6%) |
| 65 to 74 Years | 9 (10.2%) | 1 (1.2%) |
| 75 Years and over | 39 (34.2%) | 24 (20.3%) |
Disability Class: Cognitive Difficulty
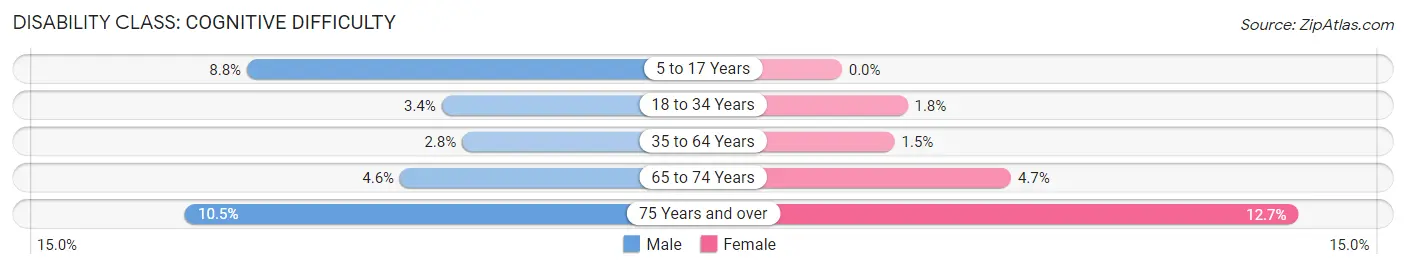
| Age Bracket | Male | Female |
| 5 to 17 Years | 17 (8.8%) | 0 (0.0%) |
| 18 to 34 Years | 4 (3.4%) | 3 (1.8%) |
| 35 to 64 Years | 11 (2.8%) | 5 (1.5%) |
| 65 to 74 Years | 4 (4.5%) | 4 (4.7%) |
| 75 Years and over | 12 (10.5%) | 15 (12.7%) |
Disability Class: Ambulatory Difficulty

| Age Bracket | Male | Female |
| 5 to 17 Years | 0 (0.0%) | 0 (0.0%) |
| 18 to 34 Years | 0 (0.0%) | 0 (0.0%) |
| 35 to 64 Years | 33 (8.5%) | 26 (7.6%) |
| 65 to 74 Years | 5 (5.7%) | 12 (14.1%) |
| 75 Years and over | 33 (28.9%) | 36 (30.5%) |
Disability Class: Self-Care Difficulty
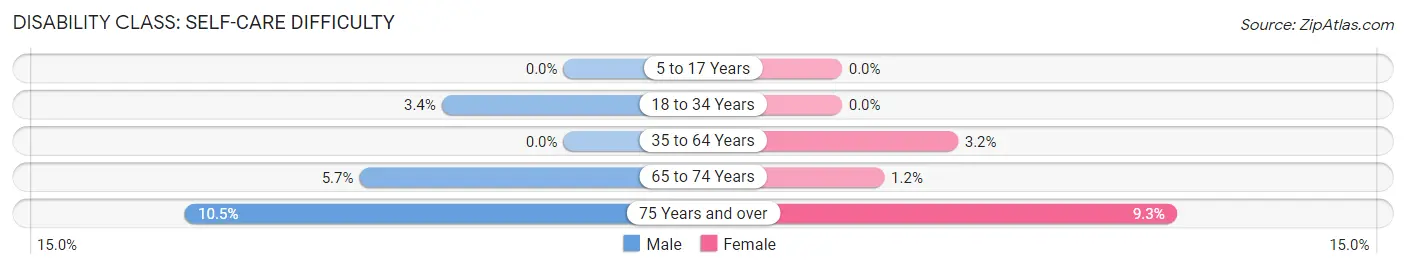
| Age Bracket | Male | Female |
| 5 to 17 Years | 0 (0.0%) | 0 (0.0%) |
| 18 to 34 Years | 4 (3.4%) | 0 (0.0%) |
| 35 to 64 Years | 0 (0.0%) | 11 (3.2%) |
| 65 to 74 Years | 5 (5.7%) | 1 (1.2%) |
| 75 Years and over | 12 (10.5%) | 11 (9.3%) |
Technology Access in Clark County
Computing Device Access in Clark County
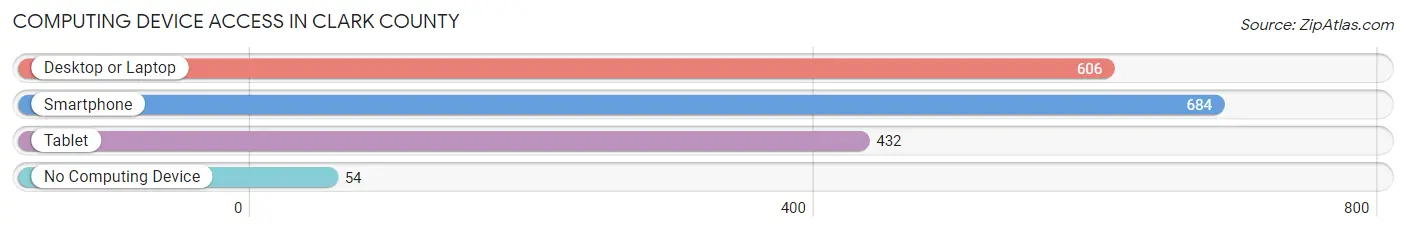
| Device Type | # Households | % Households |
| Desktop or Laptop | 606 | 75.1% |
| Smartphone | 684 | 84.8% |
| Tablet | 432 | 53.5% |
| No Computing Device | 54 | 6.7% |
| Total | 807 | 100.0% |
Internet Access in Clark County
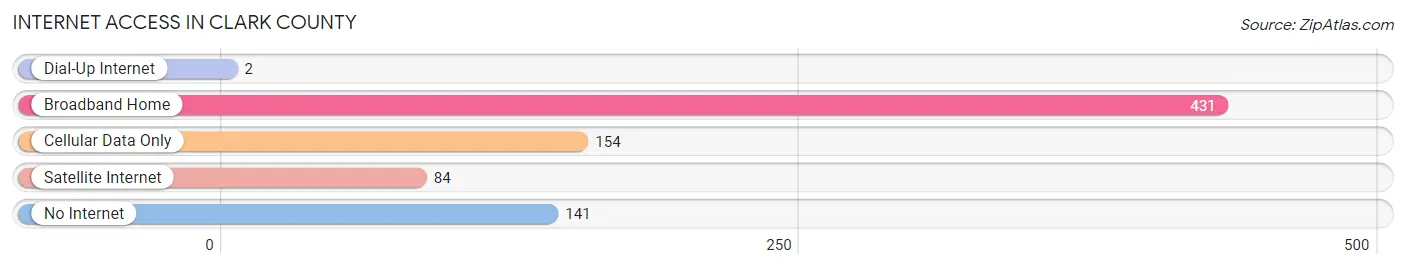
| Internet Type | # Households | % Households |
| Dial-Up Internet | 2 | 0.3% |
| Broadband Home | 431 | 53.4% |
| Cellular Data Only | 154 | 19.1% |
| Satellite Internet | 84 | 10.4% |
| No Internet | 141 | 17.5% |
| Total | 807 | 100.0% |
Clark County Summary
Clark County, Kansas is located in the north-central part of the state, and is bordered by Washington County to the north, Republic County to the east, Ottawa County to the south, and Clay County to the west. The county seat is Ashland, and the county was named for William Clark, a member of the Lewis and Clark Expedition.
Geography
Clark County is located in the Smoky Hills region of the Great Plains. The county is mostly flat, with some rolling hills in the northern and western parts. The county is drained by the Republican River, which flows through the county from north to south. The county has a total area of 576 square miles, of which 575 square miles is land and 1 square mile is water.
The climate of Clark County is characterized by hot, humid summers and cold, dry winters. The average annual temperature is 54°F, and the average annual precipitation is 28 inches.
Demographics
As of the 2010 census, there were 2,215 people, 890 households, and 617 families residing in the county. The population density was 3.9 people per square mile. The racial makeup of the county was 97.2% White, 0.2% Black or African American, 0.2% Native American, 0.2% Asian, 0.1% Pacific Islander, 0.9% from other races, and 1.2% from two or more races. Hispanic or Latino of any race were 2.2% of the population.
The median income for a household in the county was $41,250, and the median income for a family was $50,000. The per capita income for the county was $19,945. About 10.2% of families and 13.2% of the population were below the poverty line, including 16.2% of those under age 18 and 8.2% of those age 65 or over.
Economy
Agriculture is the main economic activity in Clark County. The county is home to a variety of crops, including corn, wheat, soybeans, sorghum, and hay. Livestock production is also important to the county’s economy, with cattle, hogs, and sheep being raised in the area.
The county is also home to several manufacturing companies, including a furniture manufacturer, a plastics manufacturer, and a metal fabrication company. The county also has a number of small businesses, including restaurants, retail stores, and service providers.
History
Clark County was established in 1867, and was named for William Clark, a member of the Lewis and Clark Expedition. The county was originally part of Washington County, but was split off in 1867.
The first settlers in the county were mostly German immigrants, who began arriving in the area in the late 1860s. The county was largely agricultural, and the settlers built small farms and raised livestock.
In the late 19th century, the county began to develop more industry, with several manufacturing companies being established in the area. The county also began to develop more infrastructure, with the construction of roads and bridges.
In the early 20th century, the county continued to grow, with the population increasing from 2,000 in 1900 to 4,000 in 1920. The county also continued to develop more industry, with several new manufacturing companies being established in the area.
In the late 20th century, the county continued to grow, with the population increasing to 6,000 in 2000. The county also continued to develop more industry, with several new manufacturing companies being established in the area.
Today, Clark County is a rural county with a population of around 2,200. The county is still largely agricultural, with a variety of crops and livestock being raised in the area. The county also has a number of small businesses, including restaurants, retail stores, and service providers.
Common Questions
What is the Total Population of Clark County?
Total Population of Clark County is 1,977.
What is the Total Male Population of Clark County?
Total Male Population of Clark County is 1,017.
What is the Total Female Population of Clark County?
Total Female Population of Clark County is 960.
What is the Ratio of Males per 100 Females in Clark County?
There are 105.94 Males per 100 Females in Clark County.
What is the Ratio of Females per 100 Males in Clark County?
There are 94.40 Females per 100 Males in Clark County.
What is the Median Population Age in Clark County?
Median Population Age in Clark County is 46.3 Years.
What is the Average Family Size in Clark County
Average Family Size in Clark County is 3.0 People.
What is the Average Household Size in Clark County
Average Household Size in Clark County is 2.4 People.
What is Per Capita Income in Clark County?
Per Capita income in Clark County is $30,253.
What is the Median Family Income in Clark County?
Median Family Income in Clark County is $71,458.
What is the Median Household income in Clark County?
Median Household Income in Clark County is $58,287.
What is Income or Wage Gap in Clark County?
Income or Wage Gap in Clark County is 29.0%.
Women in Clark County earn 71.0 cents for every dollar earned by a man.
What is Inequality or Gini Index in Clark County?
Inequality or Gini Index in Clark County is 0.39.
How Large is the Labor Force in Clark County?
There are 955 People in the Labor Forcein in Clark County.
What is the Percentage of People in the Labor Force in Clark County?
62.0% of People are in the Labor Force in Clark County.
What is the Unemployment Rate in Clark County?
Unemployment Rate in Clark County is 1.0%.