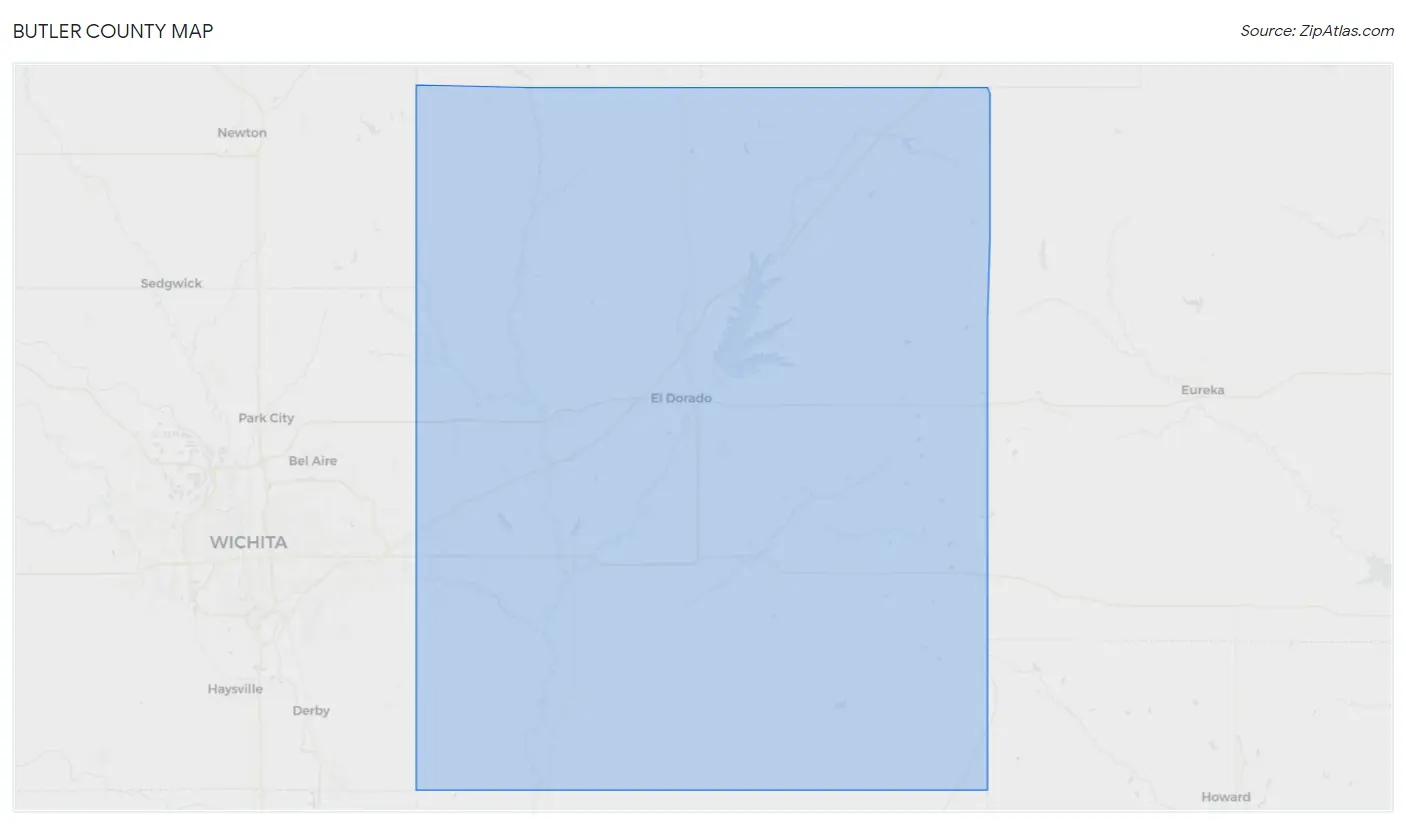
Butler County, KS
Butler County Map
Butler County Overview
67,618
TOTAL POPULATION
34,400
MALE POPULATION
33,218
FEMALE POPULATION
103.56
MALES / 100 FEMALES
96.56
FEMALES / 100 MALES
38.2
MEDIAN AGE
3.1
AVG FAMILY SIZE
2.6
AVG HOUSEHOLD SIZE
$35,209
PER CAPITA INCOME
$94,028
AVG FAMILY INCOME
$77,724
AVG HOUSEHOLD INCOME
35.8%
WAGE / INCOME GAP [ % ]
64.2¢/ $1
WAGE / INCOME GAP [ $ ]
$11,809
FAMILY INCOME DEFICIT
0.40
INEQUALITY / GINI INDEX
33,091
LABOR FORCE [ PEOPLE ]
62.8%
PERCENT IN LABOR FORCE
3.1%
UNEMPLOYMENT RATE
Race in Butler County
The most populous races in Butler County are White / Caucasian (60,166 | 89.0%), Hispanic or Latino (3,741 | 5.5%), and Two or more Races (3,423 | 5.1%).
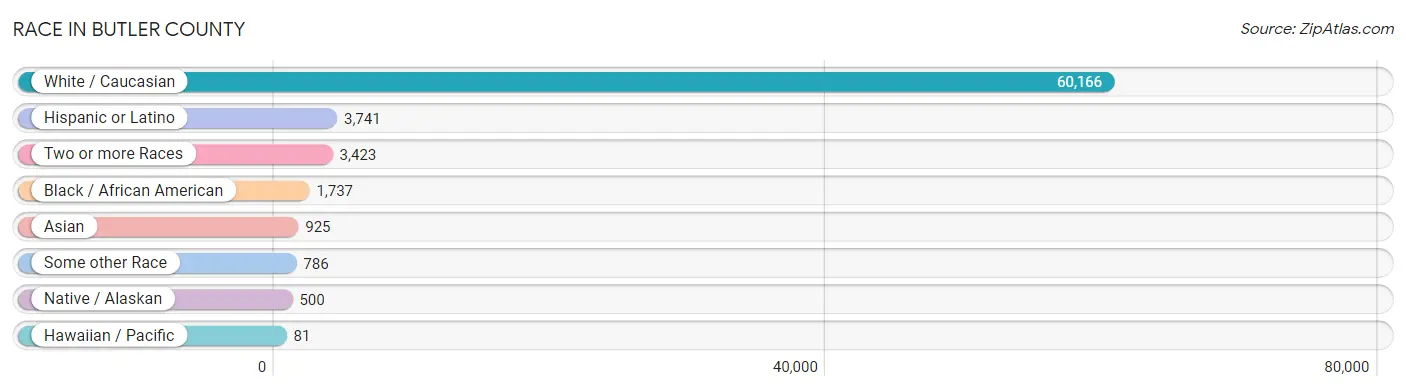
| Race | # Population | % Population |
| Asian | 925 | 1.4% |
| Black / African American | 1,737 | 2.6% |
| Hawaiian / Pacific | 81 | 0.1% |
| Hispanic or Latino | 3,741 | 5.5% |
| Native / Alaskan | 500 | 0.7% |
| White / Caucasian | 60,166 | 89.0% |
| Two or more Races | 3,423 | 5.1% |
| Some other Race | 786 | 1.2% |
| Total | 67,618 | 100.0% |
Ancestry in Butler County
The most populous ancestries reported in Butler County are German (14,941 | 22.1%), English (8,822 | 13.1%), Irish (7,049 | 10.4%), American (5,977 | 8.8%), and Mexican (2,452 | 3.6%), together accounting for 58.0% of all Butler County residents.
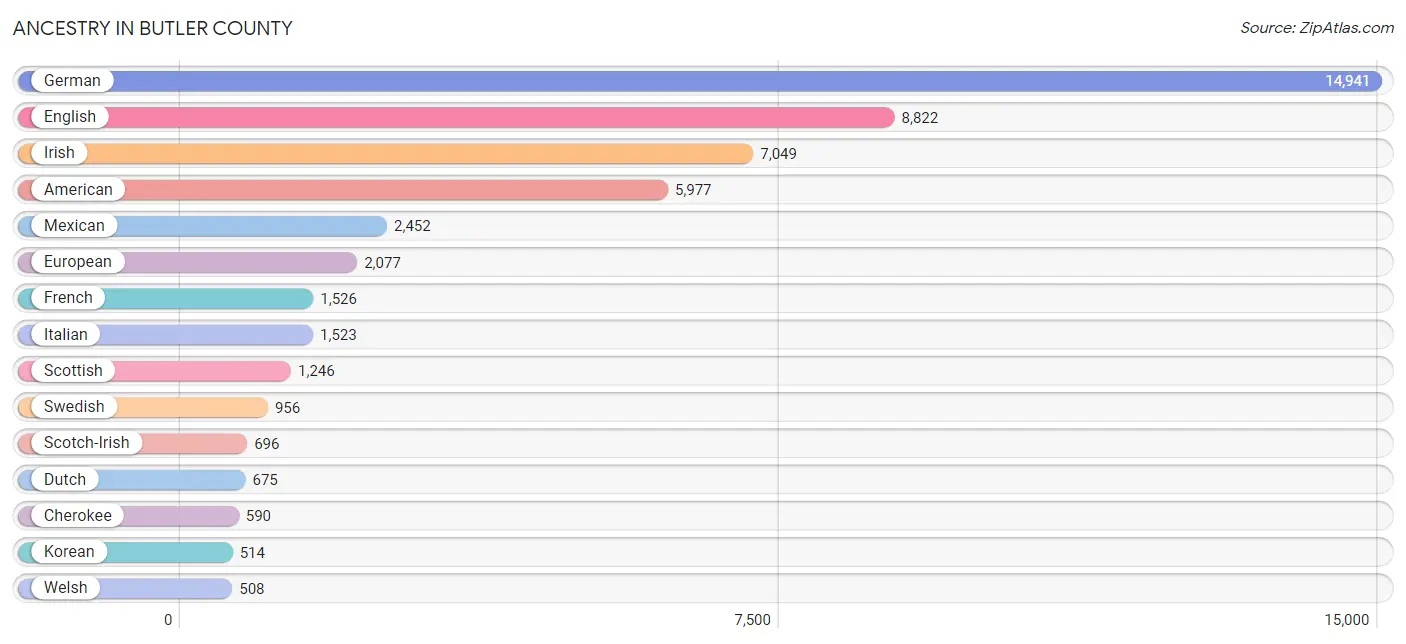
| Ancestry | # Population | % Population |
| African | 85 | 0.1% |
| Alaska Native | 1 | 0.0% |
| American | 5,977 | 8.8% |
| Apache | 9 | 0.0% |
| Arab | 220 | 0.3% |
| Argentinean | 21 | 0.0% |
| Armenian | 2 | 0.0% |
| Austrian | 91 | 0.1% |
| Belgian | 17 | 0.0% |
| Belizean | 5 | 0.0% |
| Bhutanese | 104 | 0.2% |
| British | 406 | 0.6% |
| Bulgarian | 17 | 0.0% |
| Burmese | 118 | 0.2% |
| Cajun | 10 | 0.0% |
| Canadian | 102 | 0.2% |
| Central American | 414 | 0.6% |
| Cherokee | 590 | 0.9% |
| Cheyenne | 4 | 0.0% |
| Chickasaw | 46 | 0.1% |
| Chippewa | 110 | 0.2% |
| Choctaw | 123 | 0.2% |
| Comanche | 8 | 0.0% |
| Costa Rican | 14 | 0.0% |
| Creek | 63 | 0.1% |
| Croatian | 29 | 0.0% |
| Cuban | 210 | 0.3% |
| Czech | 413 | 0.6% |
| Czechoslovakian | 92 | 0.1% |
| Danish | 256 | 0.4% |
| Dominican | 177 | 0.3% |
| Dutch | 675 | 1.0% |
| Dutch West Indian | 4 | 0.0% |
| Eastern European | 59 | 0.1% |
| Egyptian | 118 | 0.2% |
| English | 8,822 | 13.1% |
| European | 2,077 | 3.1% |
| Finnish | 42 | 0.1% |
| French | 1,526 | 2.3% |
| French American Indian | 6 | 0.0% |
| French Canadian | 130 | 0.2% |
| German | 14,941 | 22.1% |
| Greek | 231 | 0.3% |
| Guamanian / Chamorro | 5 | 0.0% |
| Guatemalan | 29 | 0.0% |
| Honduran | 283 | 0.4% |
| Hungarian | 28 | 0.0% |
| Indian (Asian) | 211 | 0.3% |
| Indonesian | 10 | 0.0% |
| Iranian | 134 | 0.2% |
| Irish | 7,049 | 10.4% |
| Iroquois | 5 | 0.0% |
| Italian | 1,523 | 2.2% |
| Korean | 514 | 0.8% |
| Latvian | 111 | 0.2% |
| Lebanese | 53 | 0.1% |
| Lithuanian | 30 | 0.0% |
| Mexican | 2,452 | 3.6% |
| Native Hawaiian | 20 | 0.0% |
| Navajo | 11 | 0.0% |
| Northern European | 100 | 0.2% |
| Norwegian | 405 | 0.6% |
| Osage | 2 | 0.0% |
| Ottawa | 1 | 0.0% |
| Pakistani | 33 | 0.1% |
| Panamanian | 27 | 0.0% |
| Pennsylvania German | 96 | 0.1% |
| Polish | 241 | 0.4% |
| Portuguese | 18 | 0.0% |
| Potawatomi | 30 | 0.0% |
| Pueblo | 26 | 0.0% |
| Puerto Rican | 210 | 0.3% |
| Romanian | 23 | 0.0% |
| Russian | 420 | 0.6% |
| Salvadoran | 61 | 0.1% |
| Samoan | 26 | 0.0% |
| Scandinavian | 107 | 0.2% |
| Scotch-Irish | 696 | 1.0% |
| Scottish | 1,246 | 1.8% |
| Seminole | 7 | 0.0% |
| Sioux | 73 | 0.1% |
| Slovak | 35 | 0.1% |
| Slovene | 17 | 0.0% |
| South American | 58 | 0.1% |
| Spaniard | 34 | 0.1% |
| Spanish | 96 | 0.1% |
| Sri Lankan | 55 | 0.1% |
| Subsaharan African | 85 | 0.1% |
| Swedish | 956 | 1.4% |
| Swiss | 111 | 0.2% |
| Thai | 369 | 0.5% |
| Tohono O'Odham | 2 | 0.0% |
| Tongan | 36 | 0.1% |
| Ukrainian | 81 | 0.1% |
| Uruguayan | 37 | 0.1% |
| Welsh | 508 | 0.7% | View All 96 Rows |
Immigrants in Butler County
The most numerous immigrant groups reported in Butler County came from Latin America (892 | 1.3%), Asia (740 | 1.1%), Central America (722 | 1.1%), Europe (426 | 0.6%), and Mexico (416 | 0.6%), together accounting for 4.7% of all Butler County residents.
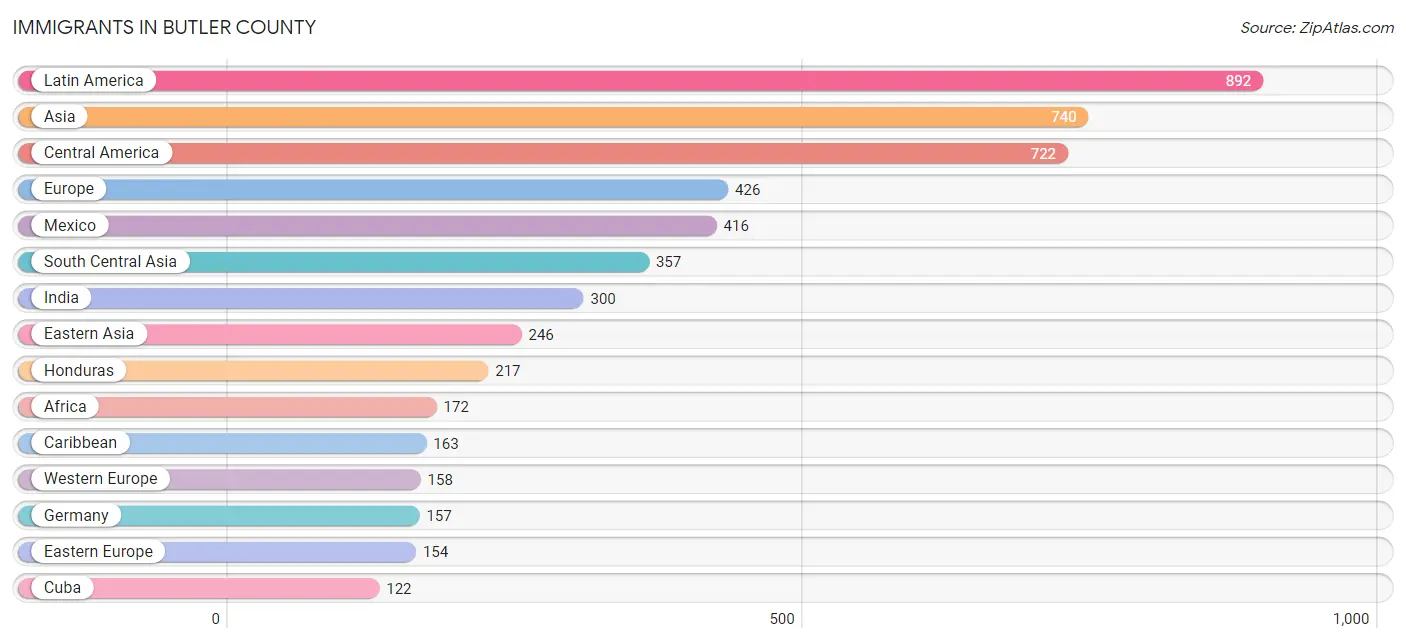
| Immigration Origin | # Population | % Population |
| Africa | 172 | 0.3% |
| Argentina | 7 | 0.0% |
| Asia | 740 | 1.1% |
| Belize | 5 | 0.0% |
| Bulgaria | 9 | 0.0% |
| Canada | 94 | 0.1% |
| Caribbean | 163 | 0.2% |
| Central America | 722 | 1.1% |
| China | 98 | 0.1% |
| Costa Rica | 12 | 0.0% |
| Cuba | 122 | 0.2% |
| Czechoslovakia | 10 | 0.0% |
| Denmark | 10 | 0.0% |
| Dominica | 1 | 0.0% |
| Dominican Republic | 29 | 0.0% |
| Eastern Africa | 3 | 0.0% |
| Eastern Asia | 246 | 0.4% |
| Eastern Europe | 154 | 0.2% |
| Egypt | 84 | 0.1% |
| El Salvador | 45 | 0.1% |
| England | 19 | 0.0% |
| Europe | 426 | 0.6% |
| Germany | 157 | 0.2% |
| Honduras | 217 | 0.3% |
| Hong Kong | 42 | 0.1% |
| India | 300 | 0.4% |
| Iran | 2 | 0.0% |
| Ireland | 10 | 0.0% |
| Japan | 95 | 0.1% |
| Kenya | 3 | 0.0% |
| Korea | 53 | 0.1% |
| Laos | 19 | 0.0% |
| Latin America | 892 | 1.3% |
| Lebanon | 30 | 0.0% |
| Mexico | 416 | 0.6% |
| Moldova | 23 | 0.0% |
| Nepal | 33 | 0.1% |
| Netherlands | 1 | 0.0% |
| Northern Africa | 120 | 0.2% |
| Northern Europe | 111 | 0.2% |
| Norway | 1 | 0.0% |
| Oceania | 72 | 0.1% |
| Pakistan | 22 | 0.0% |
| Panama | 27 | 0.0% |
| Philippines | 31 | 0.1% |
| Russia | 62 | 0.1% |
| Scotland | 18 | 0.0% |
| South America | 7 | 0.0% |
| South Central Asia | 357 | 0.5% |
| South Eastern Asia | 107 | 0.2% |
| Southern Europe | 3 | 0.0% |
| Spain | 3 | 0.0% |
| Sudan | 16 | 0.0% |
| Thailand | 33 | 0.1% |
| Ukraine | 50 | 0.1% |
| Vietnam | 24 | 0.0% |
| West Indies | 11 | 0.0% |
| Western Asia | 30 | 0.0% |
| Western Europe | 158 | 0.2% | View All 59 Rows |
Sex and Age in Butler County
Sex and Age in Butler County
The most populous age groups in Butler County are 35 to 39 Years (2,688 | 7.8%) for men and 15 to 19 Years (2,626 | 7.9%) for women.
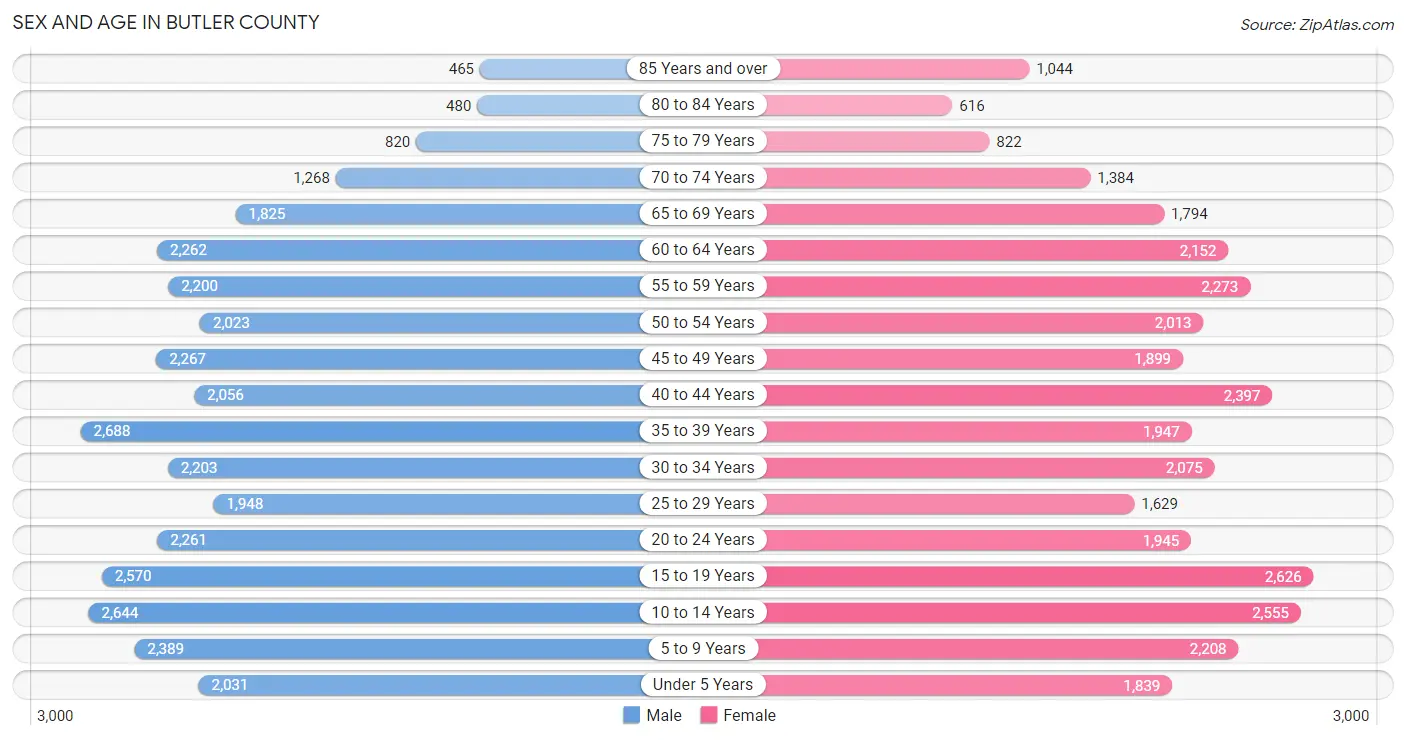
| Age Bracket | Male | Female |
| Under 5 Years | 2,031 (5.9%) | 1,839 (5.5%) |
| 5 to 9 Years | 2,389 (6.9%) | 2,208 (6.7%) |
| 10 to 14 Years | 2,644 (7.7%) | 2,555 (7.7%) |
| 15 to 19 Years | 2,570 (7.5%) | 2,626 (7.9%) |
| 20 to 24 Years | 2,261 (6.6%) | 1,945 (5.9%) |
| 25 to 29 Years | 1,948 (5.7%) | 1,629 (4.9%) |
| 30 to 34 Years | 2,203 (6.4%) | 2,075 (6.2%) |
| 35 to 39 Years | 2,688 (7.8%) | 1,947 (5.9%) |
| 40 to 44 Years | 2,056 (6.0%) | 2,397 (7.2%) |
| 45 to 49 Years | 2,267 (6.6%) | 1,899 (5.7%) |
| 50 to 54 Years | 2,023 (5.9%) | 2,013 (6.1%) |
| 55 to 59 Years | 2,200 (6.4%) | 2,273 (6.8%) |
| 60 to 64 Years | 2,262 (6.6%) | 2,152 (6.5%) |
| 65 to 69 Years | 1,825 (5.3%) | 1,794 (5.4%) |
| 70 to 74 Years | 1,268 (3.7%) | 1,384 (4.2%) |
| 75 to 79 Years | 820 (2.4%) | 822 (2.5%) |
| 80 to 84 Years | 480 (1.4%) | 616 (1.8%) |
| 85 Years and over | 465 (1.3%) | 1,044 (3.1%) |
| Total | 34,400 (100.0%) | 33,218 (100.0%) |
Families and Households in Butler County
Median Family Size in Butler County
The median family size in Butler County is 3.09 persons per family, with married-couple families (15,040 | 83.5%) accounting for the largest median family size of 3.15 persons per family. On the other hand, single male/father families (1,036 | 5.8%) represent the smallest median family size with 2.63 persons per family.
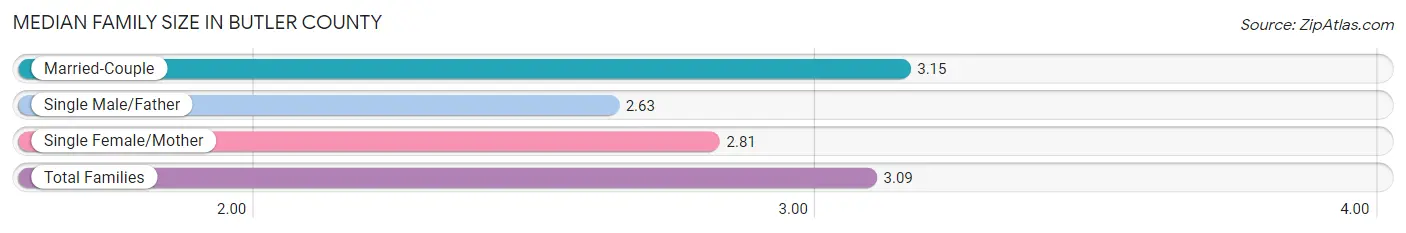
| Family Type | # Families | Family Size |
| Married-Couple | 15,040 (83.5%) | 3.15 |
| Single Male/Father | 1,036 (5.8%) | 2.63 |
| Single Female/Mother | 1,928 (10.7%) | 2.81 |
| Total Families | 18,004 (100.0%) | 3.09 |
Median Household Size in Butler County
The median household size in Butler County is 2.60 persons per household, with married-couple households (15,040 | 60.7%) accounting for the largest median household size of 3.17 persons per household. non-family households (6,756 | 27.3%) represent the smallest median household size with 1.18 persons per household.
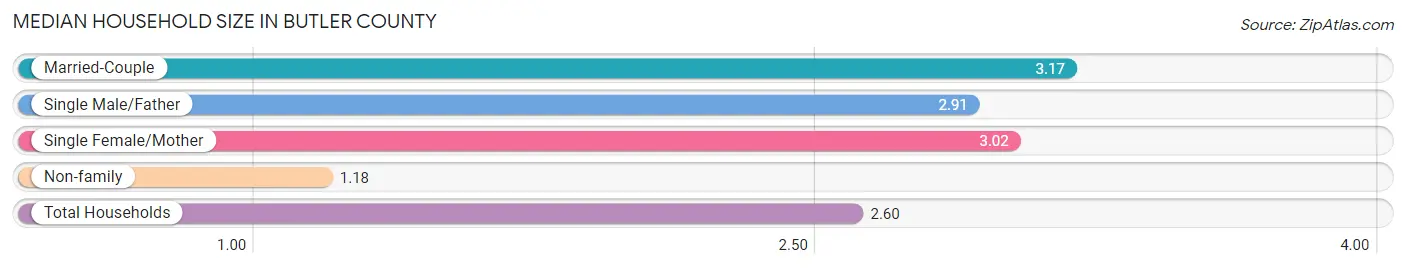
| Household Type | # Households | Household Size |
| Married-Couple | 15,040 (60.7%) | 3.17 |
| Single Male/Father | 1,036 (4.2%) | 2.91 |
| Single Female/Mother | 1,928 (7.8%) | 3.02 |
| Non-family | 6,756 (27.3%) | 1.18 |
| Total Households | 24,760 (100.0%) | 2.60 |
Household Size by Marriage Status in Butler County
Out of a total of 24,760 households in Butler County, 18,004 (72.7%) are family households, while 6,756 (27.3%) are nonfamily households. The most numerous type of family households are 2-person households, comprising 7,768, and the most common type of nonfamily households are 1-person households, comprising 5,747.
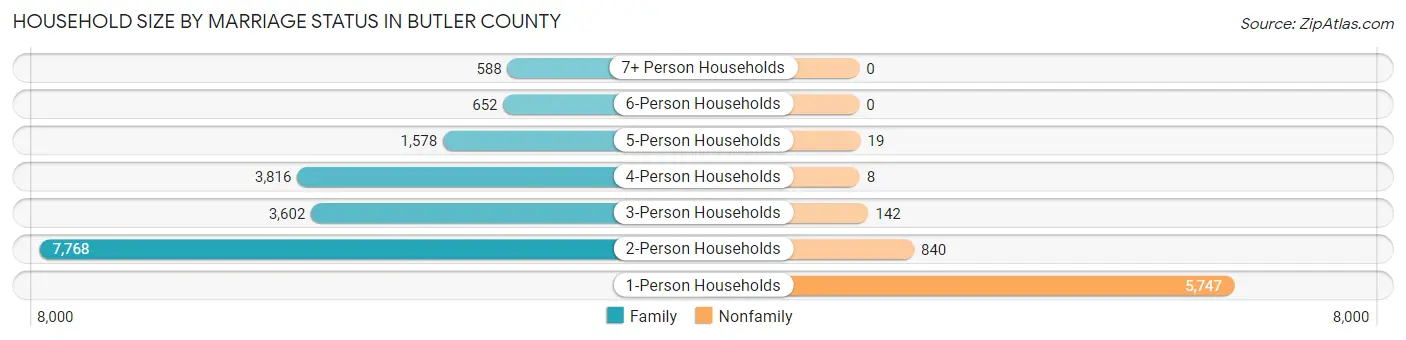
| Household Size | Family Households | Nonfamily Households |
| 1-Person Households | - | 5,747 (23.2%) |
| 2-Person Households | 7,768 (31.4%) | 840 (3.4%) |
| 3-Person Households | 3,602 (14.5%) | 142 (0.6%) |
| 4-Person Households | 3,816 (15.4%) | 8 (0.0%) |
| 5-Person Households | 1,578 (6.4%) | 19 (0.1%) |
| 6-Person Households | 652 (2.6%) | 0 (0.0%) |
| 7+ Person Households | 588 (2.4%) | 0 (0.0%) |
| Total | 18,004 (72.7%) | 6,756 (27.3%) |
Female Fertility in Butler County
Fertility by Age in Butler County
Average fertility rate in Butler County is 66.0 births per 1,000 women. Women in the age bracket of 20 to 34 years have the highest fertility rate with 163.0 births per 1,000 women. Women in the age bracket of 20 to 34 years acount for 93.2% of all women with births.
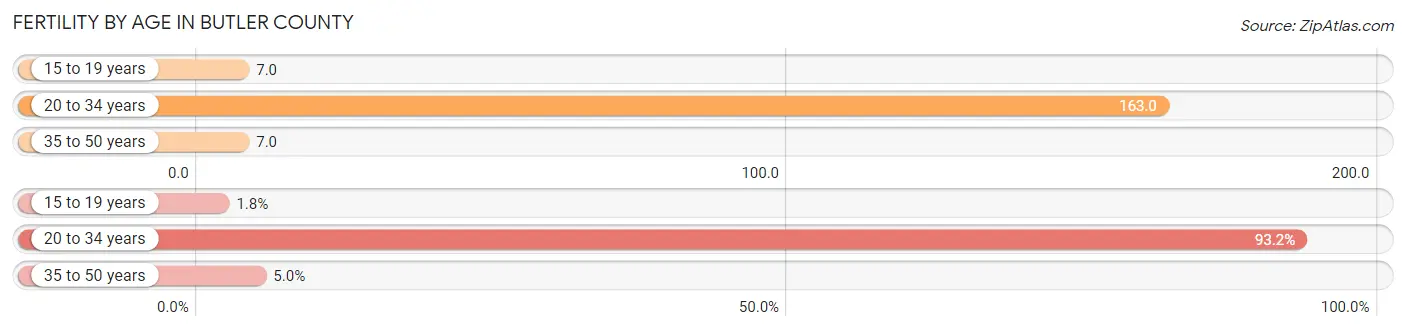
| Age Bracket | Women with Births | Births / 1,000 Women |
| 15 to 19 years | 18 (1.8%) | 7.0 |
| 20 to 34 years | 922 (93.2%) | 163.0 |
| 35 to 50 years | 49 (5.0%) | 7.0 |
| Total | 989 (100.0%) | 66.0 |
Fertility by Age by Marriage Status in Butler County
81.1% of women with births (989) in Butler County are married. The highest percentage of unmarried women with births falls into 15 to 19 years age bracket with 100.0% of them unmarried at the time of birth, while the lowest percentage of unmarried women with births belong to 35 to 50 years age bracket with 0.0% of them unmarried.
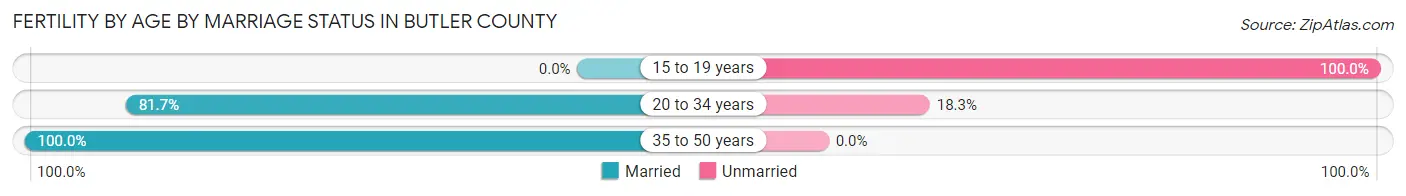
| Age Bracket | Married | Unmarried |
| 15 to 19 years | 0 (0.0%) | 18 (100.0%) |
| 20 to 34 years | 753 (81.7%) | 169 (18.3%) |
| 35 to 50 years | 49 (100.0%) | 0 (0.0%) |
| Total | 802 (81.1%) | 187 (18.9%) |
Fertility by Education in Butler County
Average fertility rate in Butler County is 66.0 births per 1,000 women. Women with the education attainment of bachelor's degree have the highest fertility rate of 113.0 births per 1,000 women, while women with the education attainment of less than high school have the lowest fertility at 29.0 births per 1,000 women. Women with the education attainment of bachelor's degree represent 37.5% of all women with births.
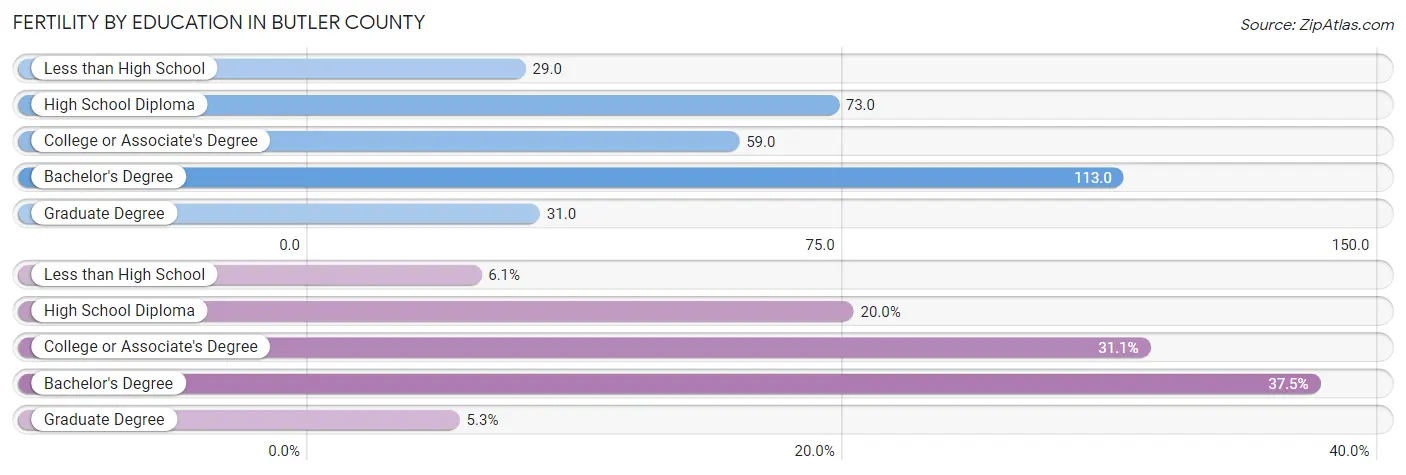
| Educational Attainment | Women with Births | Births / 1,000 Women |
| Less than High School | 60 (6.1%) | 29.0 |
| High School Diploma | 198 (20.0%) | 73.0 |
| College or Associate's Degree | 308 (31.1%) | 59.0 |
| Bachelor's Degree | 371 (37.5%) | 113.0 |
| Graduate Degree | 52 (5.3%) | 31.0 |
| Total | 989 (100.0%) | 66.0 |
Fertility by Education by Marriage Status in Butler County
18.9% of women with births in Butler County are unmarried. Women with the educational attainment of bachelor's degree are most likely to be married with 100.0% of them married at childbirth, while women with the educational attainment of high school diploma are least likely to be married with 43.9% of them unmarried at childbirth.
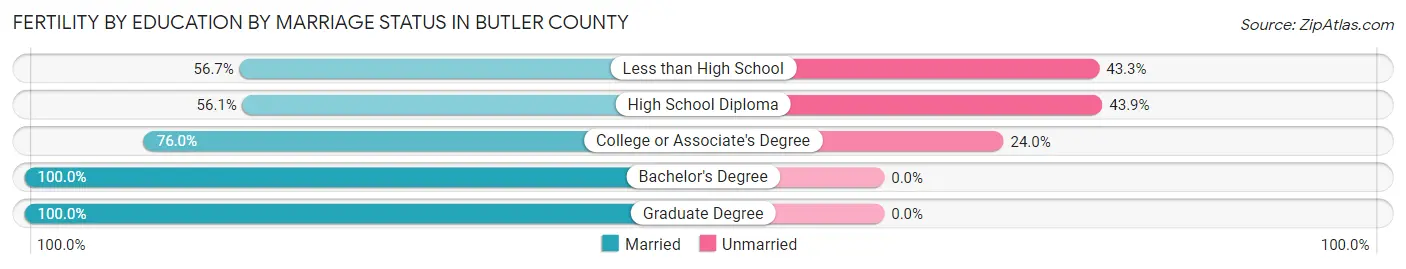
| Educational Attainment | Married | Unmarried |
| Less than High School | 34 (56.7%) | 26 (43.3%) |
| High School Diploma | 111 (56.1%) | 87 (43.9%) |
| College or Associate's Degree | 234 (76.0%) | 74 (24.0%) |
| Bachelor's Degree | 371 (100.0%) | 0 (0.0%) |
| Graduate Degree | 52 (100.0%) | 0 (0.0%) |
| Total | 802 (81.1%) | 187 (18.9%) |
Income in Butler County
Income Overview in Butler County
Per Capita Income in Butler County is $35,209, while median incomes of families and households are $94,028 and $77,724 respectively.
| Characteristic | Number | Measure |
| Per Capita Income | 67,618 | $35,209 |
| Median Family Income | 18,004 | $94,028 |
| Mean Family Income | 18,004 | $108,787 |
| Median Household Income | 24,760 | $77,724 |
| Mean Household Income | 24,760 | $94,378 |
| Income Deficit | 18,004 | $11,809 |
| Wage / Income Gap (%) | 67,618 | 35.78% |
| Wage / Income Gap ($) | 67,618 | 64.22¢ per $1 |
| Gini / Inequality Index | 67,618 | 0.40 |
Earnings by Sex in Butler County
Average Earnings in Butler County are $42,435, $52,504 for men and $33,720 for women, a difference of 35.8%.
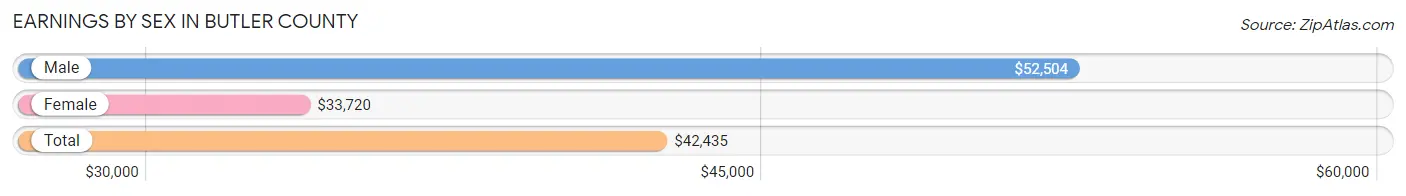
| Sex | Number | Average Earnings |
| Male | 18,425 (51.9%) | $52,504 |
| Female | 17,058 (48.1%) | $33,720 |
| Total | 35,483 (100.0%) | $42,435 |
Earnings by Sex by Income Bracket in Butler County
The most common earnings brackets in Butler County are $100,000+ for men (3,024 | 16.4%) and $75,000 to $99,999 for women (1,587 | 9.3%).
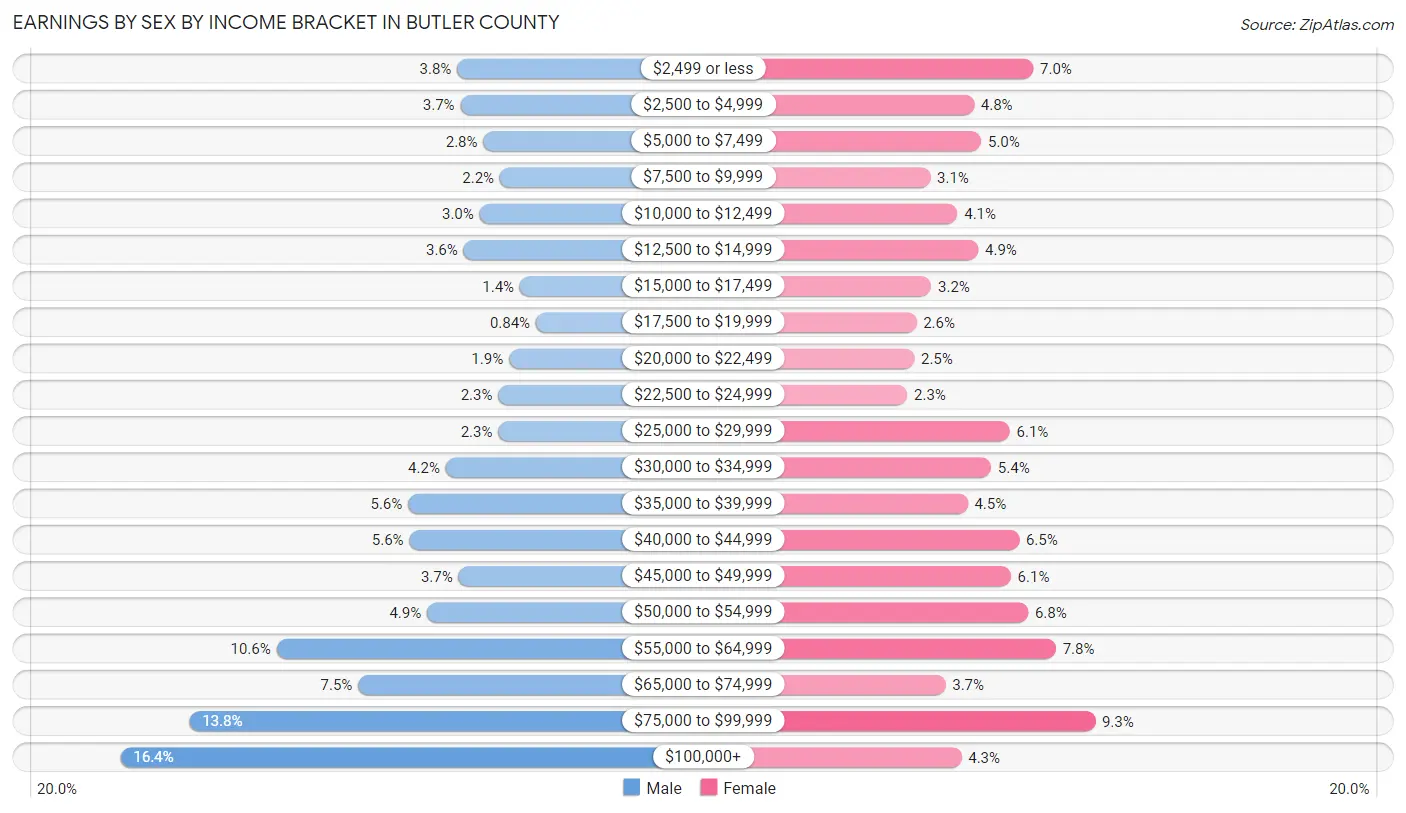
| Income | Male | Female |
| $2,499 or less | 699 (3.8%) | 1,191 (7.0%) |
| $2,500 to $4,999 | 676 (3.7%) | 812 (4.8%) |
| $5,000 to $7,499 | 517 (2.8%) | 858 (5.0%) |
| $7,500 to $9,999 | 404 (2.2%) | 532 (3.1%) |
| $10,000 to $12,499 | 543 (2.9%) | 707 (4.1%) |
| $12,500 to $14,999 | 655 (3.5%) | 839 (4.9%) |
| $15,000 to $17,499 | 266 (1.4%) | 539 (3.2%) |
| $17,500 to $19,999 | 155 (0.8%) | 443 (2.6%) |
| $20,000 to $22,499 | 341 (1.8%) | 430 (2.5%) |
| $22,500 to $24,999 | 415 (2.2%) | 385 (2.3%) |
| $25,000 to $29,999 | 415 (2.2%) | 1,041 (6.1%) |
| $30,000 to $34,999 | 777 (4.2%) | 921 (5.4%) |
| $35,000 to $39,999 | 1,038 (5.6%) | 771 (4.5%) |
| $40,000 to $44,999 | 1,028 (5.6%) | 1,100 (6.5%) |
| $45,000 to $49,999 | 690 (3.7%) | 1,047 (6.1%) |
| $50,000 to $54,999 | 906 (4.9%) | 1,158 (6.8%) |
| $55,000 to $64,999 | 1,946 (10.6%) | 1,335 (7.8%) |
| $65,000 to $74,999 | 1,381 (7.5%) | 630 (3.7%) |
| $75,000 to $99,999 | 2,549 (13.8%) | 1,587 (9.3%) |
| $100,000+ | 3,024 (16.4%) | 732 (4.3%) |
| Total | 18,425 (100.0%) | 17,058 (100.0%) |
Earnings by Sex by Educational Attainment in Butler County
Average earnings in Butler County are $60,432 for men and $41,454 for women, a difference of 31.4%. Men with an educational attainment of bachelor's degree enjoy the highest average annual earnings of $87,083, while those with less than high school education earn the least with $38,375. Women with an educational attainment of graduate degree earn the most with the average annual earnings of $61,044, while those with less than high school education have the smallest earnings of $24,695.
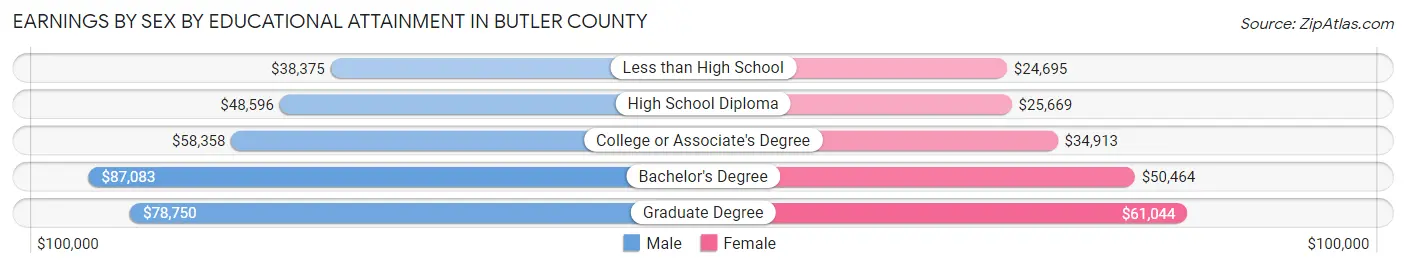
| Educational Attainment | Male Income | Female Income |
| Less than High School | $38,375 | $24,695 |
| High School Diploma | $48,596 | $25,669 |
| College or Associate's Degree | $58,358 | $34,913 |
| Bachelor's Degree | $87,083 | $50,464 |
| Graduate Degree | $78,750 | $61,044 |
| Total | $60,432 | $41,454 |
Family Income in Butler County
Family Income Brackets in Butler County
According to the Butler County family income data, there are 4,735 families falling into the $100,000 to $149,999 income range, which is the most common income bracket and makes up 26.3% of all families. Conversely, the $10,000 to $14,999 income bracket is the least frequent group with only 144 families (0.8%) belonging to this category.
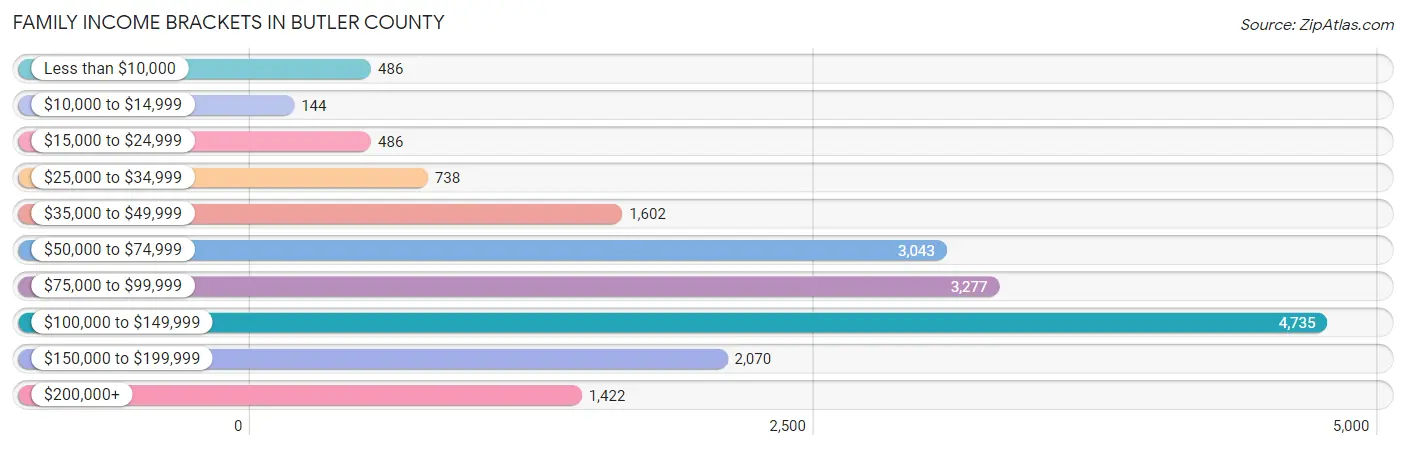
| Income Bracket | # Families | % Families |
| Less than $10,000 | 486 | 2.7% |
| $10,000 to $14,999 | 144 | 0.8% |
| $15,000 to $24,999 | 486 | 2.7% |
| $25,000 to $34,999 | 738 | 4.1% |
| $35,000 to $49,999 | 1,602 | 8.9% |
| $50,000 to $74,999 | 3,043 | 16.9% |
| $75,000 to $99,999 | 3,277 | 18.2% |
| $100,000 to $149,999 | 4,735 | 26.3% |
| $150,000 to $199,999 | 2,070 | 11.5% |
| $200,000+ | 1,422 | 7.9% |
Family Income by Famaliy Size in Butler County
7+ person families (519 | 2.9%) account for the highest median family income in Butler County with $124,952 per family, while 2-person families (8,118 | 45.1%) have the highest median income of $39,812 per family member.
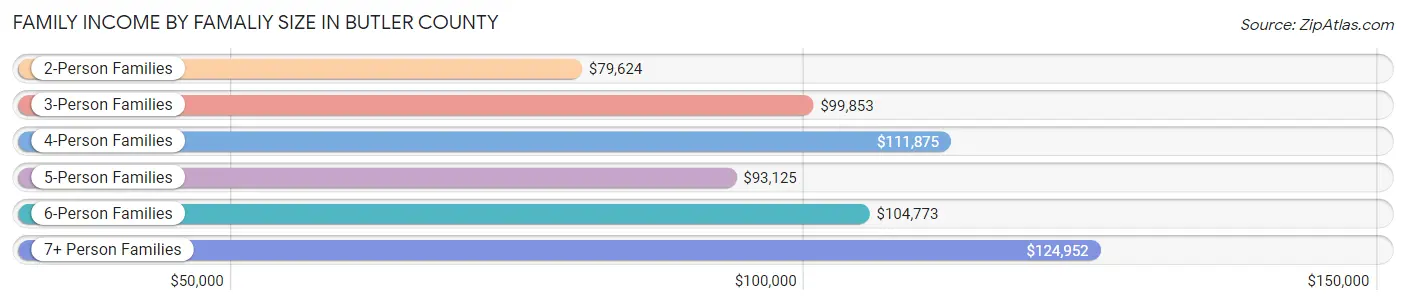
| Income Bracket | # Families | Median Income |
| 2-Person Families | 8,118 (45.1%) | $79,624 |
| 3-Person Families | 3,492 (19.4%) | $99,853 |
| 4-Person Families | 3,657 (20.3%) | $111,875 |
| 5-Person Families | 1,532 (8.5%) | $93,125 |
| 6-Person Families | 686 (3.8%) | $104,773 |
| 7+ Person Families | 519 (2.9%) | $124,952 |
| Total | 18,004 (100.0%) | $94,028 |
Family Income by Number of Earners in Butler County
The median family income in Butler County is $94,028, with families comprising 3+ earners (2,271) having the highest median family income of $146,490, while families with no earners (2,261) have the lowest median family income of $52,166, accounting for 12.6% and 12.6% of families, respectively.
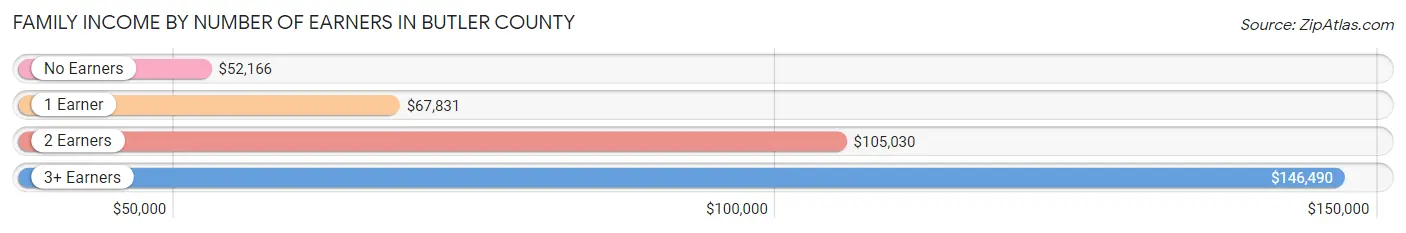
| Number of Earners | # Families | Median Income |
| No Earners | 2,261 (12.6%) | $52,166 |
| 1 Earner | 5,022 (27.9%) | $67,831 |
| 2 Earners | 8,450 (46.9%) | $105,030 |
| 3+ Earners | 2,271 (12.6%) | $146,490 |
| Total | 18,004 (100.0%) | $94,028 |
Household Income in Butler County
Household Income Brackets in Butler County
With 5,224 households falling in the category, the $100,000 to $149,999 income range is the most frequent in Butler County, accounting for 21.1% of all households. In contrast, only 768 households (3.1%) fall into the $10,000 to $14,999 income bracket, making it the least populous group.
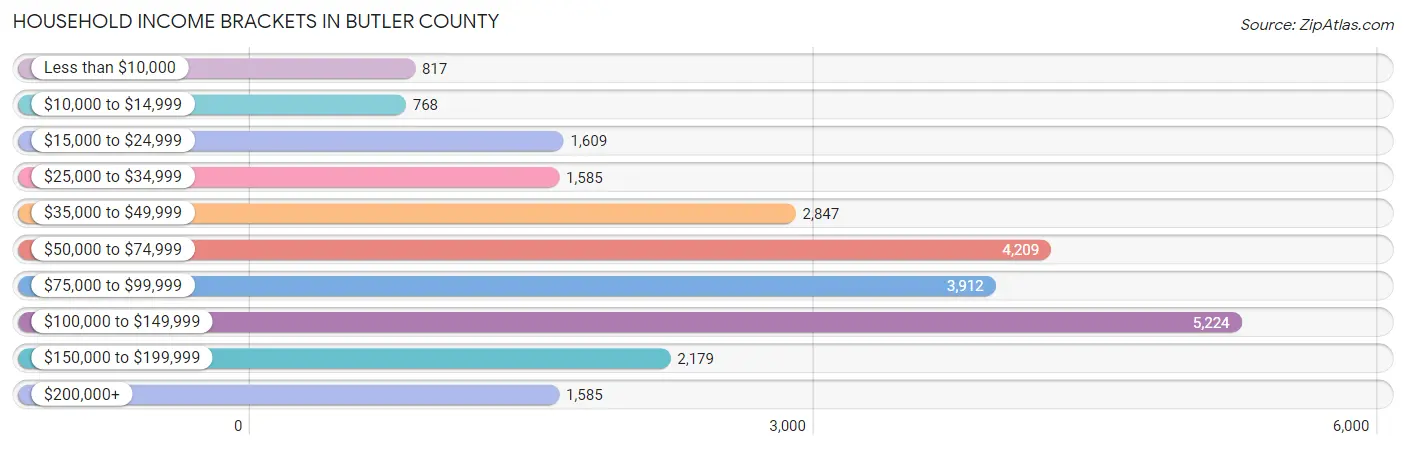
| Income Bracket | # Households | % Households |
| Less than $10,000 | 817 | 3.3% |
| $10,000 to $14,999 | 768 | 3.1% |
| $15,000 to $24,999 | 1,609 | 6.5% |
| $25,000 to $34,999 | 1,585 | 6.4% |
| $35,000 to $49,999 | 2,847 | 11.5% |
| $50,000 to $74,999 | 4,209 | 17.0% |
| $75,000 to $99,999 | 3,912 | 15.8% |
| $100,000 to $149,999 | 5,224 | 21.1% |
| $150,000 to $199,999 | 2,179 | 8.8% |
| $200,000+ | 1,585 | 6.4% |
Household Income by Householder Age in Butler County
The median household income in Butler County is $77,724, with the highest median household income of $95,053 found in the 45 to 64 years age bracket for the primary householder. A total of 9,208 households (37.2%) fall into this category. Meanwhile, the 15 to 24 years age bracket for the primary householder has the lowest median household income of $37,741, with 1,187 households (4.8%) in this group.
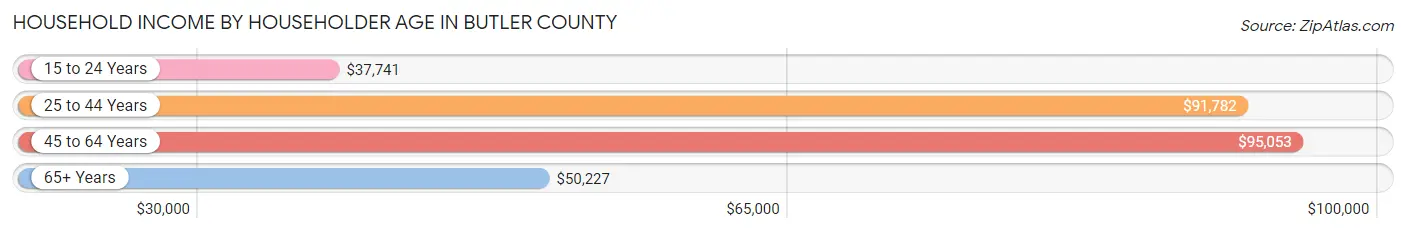
| Income Bracket | # Households | Median Income |
| 15 to 24 Years | 1,187 (4.8%) | $37,741 |
| 25 to 44 Years | 7,889 (31.9%) | $91,782 |
| 45 to 64 Years | 9,208 (37.2%) | $95,053 |
| 65+ Years | 6,476 (26.2%) | $50,227 |
| Total | 24,760 (100.0%) | $77,724 |
Poverty in Butler County
Income Below Poverty by Sex and Age in Butler County
With 8.0% poverty level for males and 7.8% for females among the residents of Butler County, under 5 year old males and 18 to 24 year old females are the most vulnerable to poverty, with 308 males (15.4%) and 526 females (20.3%) in their respective age groups living below the poverty level.
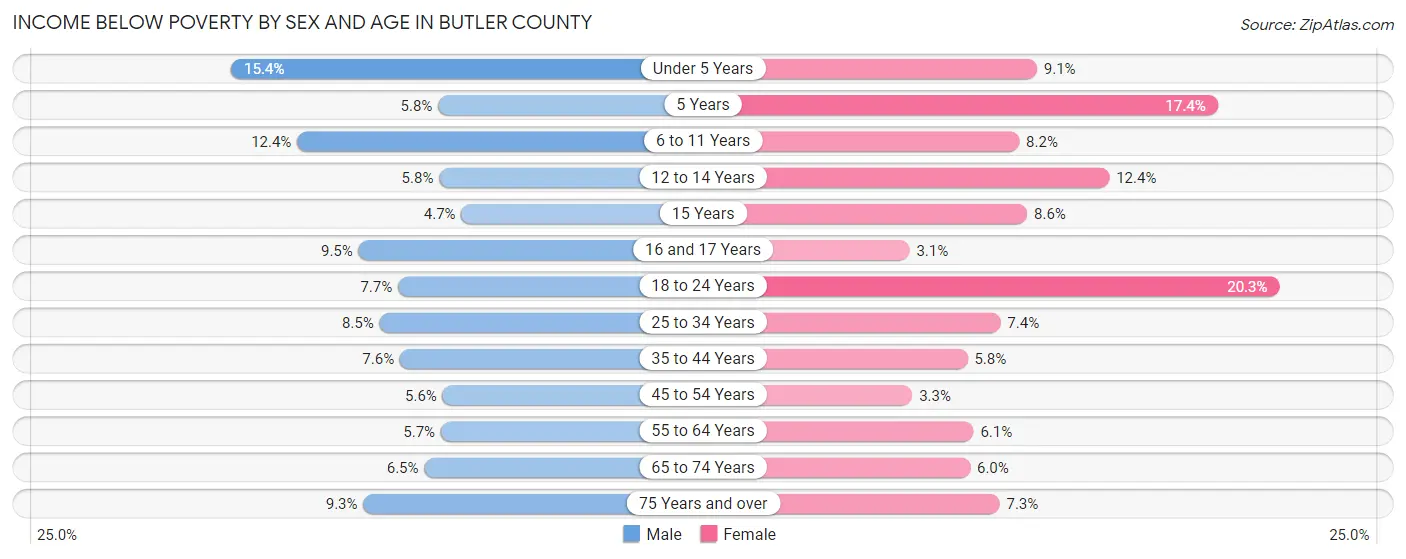
| Age Bracket | Male | Female |
| Under 5 Years | 308 (15.4%) | 158 (9.0%) |
| 5 Years | 24 (5.8%) | 68 (17.4%) |
| 6 to 11 Years | 361 (12.3%) | 208 (8.2%) |
| 12 to 14 Years | 94 (5.8%) | 219 (12.4%) |
| 15 Years | 26 (4.7%) | 61 (8.6%) |
| 16 and 17 Years | 93 (9.5%) | 31 (3.1%) |
| 18 to 24 Years | 222 (7.7%) | 526 (20.3%) |
| 25 to 34 Years | 292 (8.5%) | 272 (7.4%) |
| 35 to 44 Years | 304 (7.6%) | 253 (5.8%) |
| 45 to 54 Years | 229 (5.6%) | 128 (3.3%) |
| 55 to 64 Years | 246 (5.7%) | 268 (6.1%) |
| 65 to 74 Years | 191 (6.5%) | 186 (5.9%) |
| 75 Years and over | 153 (9.3%) | 167 (7.3%) |
| Total | 2,543 (8.0%) | 2,545 (7.8%) |
Income Above Poverty by Sex and Age in Butler County
According to the poverty statistics in Butler County, males aged 15 years and females aged 16 and 17 years are the age groups that are most secure financially, with 95.3% of males and 96.9% of females in these age groups living above the poverty line.
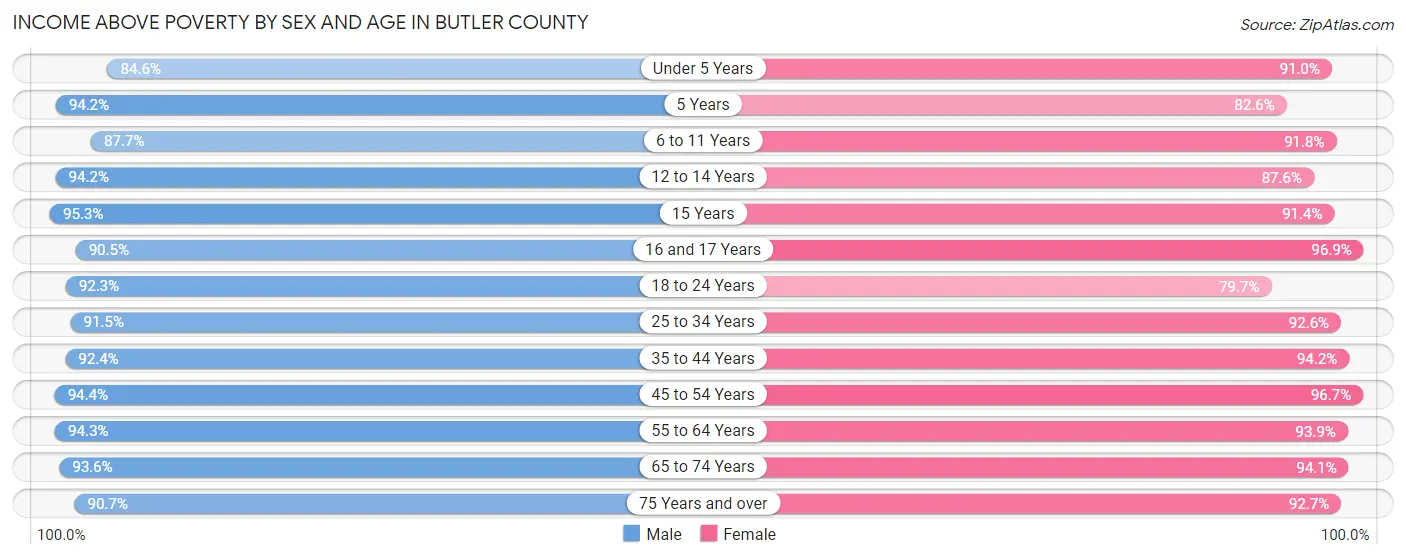
| Age Bracket | Male | Female |
| Under 5 Years | 1,689 (84.6%) | 1,588 (90.9%) |
| 5 Years | 389 (94.2%) | 322 (82.6%) |
| 6 to 11 Years | 2,563 (87.6%) | 2,320 (91.8%) |
| 12 to 14 Years | 1,539 (94.2%) | 1,546 (87.6%) |
| 15 Years | 524 (95.3%) | 648 (91.4%) |
| 16 and 17 Years | 886 (90.5%) | 956 (96.9%) |
| 18 to 24 Years | 2,674 (92.3%) | 2,065 (79.7%) |
| 25 to 34 Years | 3,132 (91.5%) | 3,426 (92.6%) |
| 35 to 44 Years | 3,704 (92.4%) | 4,085 (94.2%) |
| 45 to 54 Years | 3,862 (94.4%) | 3,782 (96.7%) |
| 55 to 64 Years | 4,085 (94.3%) | 4,121 (93.9%) |
| 65 to 74 Years | 2,772 (93.5%) | 2,939 (94.1%) |
| 75 Years and over | 1,495 (90.7%) | 2,114 (92.7%) |
| Total | 29,314 (92.0%) | 29,912 (92.2%) |
Income Below Poverty Among Married-Couple Families in Butler County
The poverty statistics for married-couple families in Butler County show that 2.9% or 432 of the total 15,040 families live below the poverty line. Families with 5 or more children have the highest poverty rate of 20.2%, comprising of 41 families. On the other hand, families with no children have the lowest poverty rate of 2.5%, which includes 202 families.
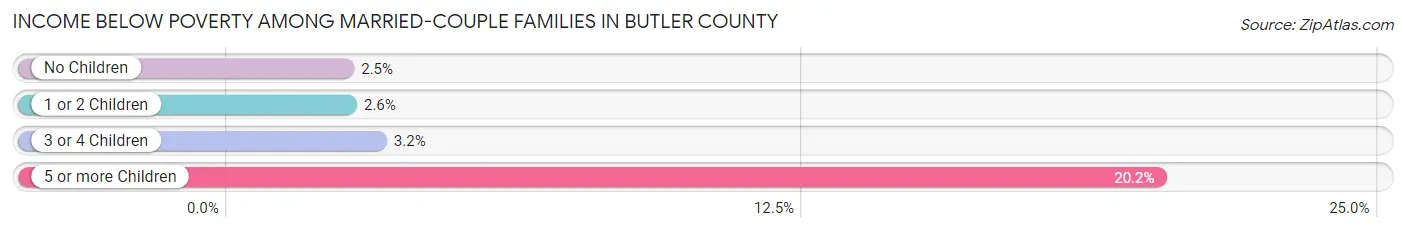
| Children | Above Poverty | Below Poverty |
| No Children | 7,796 (97.5%) | 202 (2.5%) |
| 1 or 2 Children | 4,887 (97.4%) | 130 (2.6%) |
| 3 or 4 Children | 1,763 (96.8%) | 59 (3.2%) |
| 5 or more Children | 162 (79.8%) | 41 (20.2%) |
| Total | 14,608 (97.1%) | 432 (2.9%) |
Income Below Poverty Among Single-Parent Households in Butler County
According to the poverty data in Butler County, 25.9% or 268 single-father households and 17.2% or 332 single-mother households are living below the poverty line. Among single-father households, those with 1 or 2 children have the highest poverty rate, with 212 households (37.5%) experiencing poverty. Likewise, among single-mother households, those with 5 or more children have the highest poverty rate, with 33 households (100.0%) falling below the poverty line.
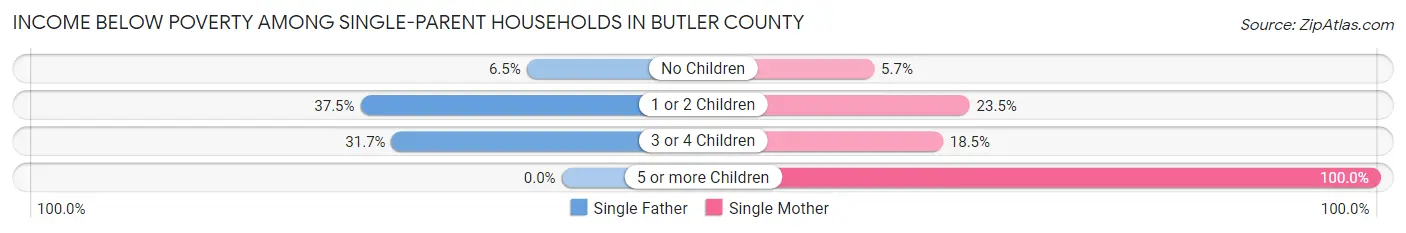
| Children | Single Father | Single Mother |
| No Children | 24 (6.5%) | 44 (5.7%) |
| 1 or 2 Children | 212 (37.5%) | 226 (23.5%) |
| 3 or 4 Children | 32 (31.7%) | 29 (18.5%) |
| 5 or more Children | 0 (0.0%) | 33 (100.0%) |
| Total | 268 (25.9%) | 332 (17.2%) |
Income Below Poverty Among Married-Couple vs Single-Parent Households in Butler County
The poverty data for Butler County shows that 432 of the married-couple family households (2.9%) and 600 of the single-parent households (20.2%) are living below the poverty level. Within the married-couple family households, those with 5 or more children have the highest poverty rate, with 41 households (20.2%) falling below the poverty line. Among the single-parent households, those with 5 or more children have the highest poverty rate, with 33 household (100.0%) living below poverty.
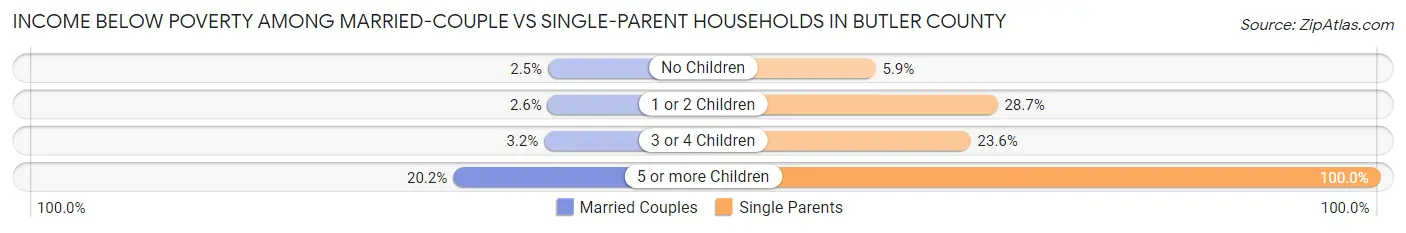
| Children | Married-Couple Families | Single-Parent Households |
| No Children | 202 (2.5%) | 68 (5.9%) |
| 1 or 2 Children | 130 (2.6%) | 438 (28.6%) |
| 3 or 4 Children | 59 (3.2%) | 61 (23.6%) |
| 5 or more Children | 41 (20.2%) | 33 (100.0%) |
| Total | 432 (2.9%) | 600 (20.2%) |
Employment Characteristics in Butler County
Employment by Class of Employer in Butler County
Among the 31,549 employed individuals in Butler County, private company employees (20,459 | 64.8%), local government employees (3,695 | 11.7%), and not-for-profit organizations (2,165 | 6.9%) make up the most common classes of employment.
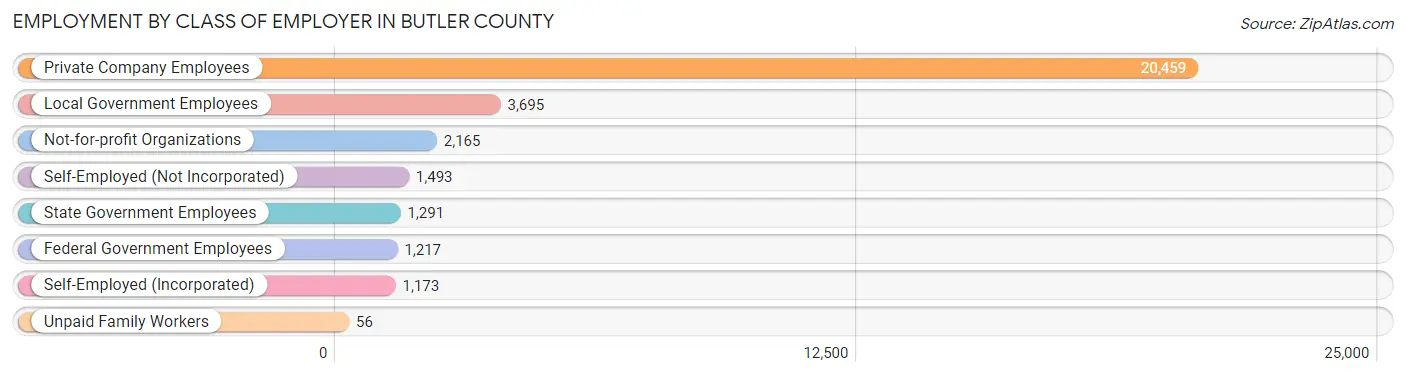
| Employer Class | # Employees | % Employees |
| Private Company Employees | 20,459 | 64.8% |
| Self-Employed (Incorporated) | 1,173 | 3.7% |
| Self-Employed (Not Incorporated) | 1,493 | 4.7% |
| Not-for-profit Organizations | 2,165 | 6.9% |
| Local Government Employees | 3,695 | 11.7% |
| State Government Employees | 1,291 | 4.1% |
| Federal Government Employees | 1,217 | 3.9% |
| Unpaid Family Workers | 56 | 0.2% |
| Total | 31,549 | 100.0% |
Employment Status by Age in Butler County
According to the labor force statistics for Butler County, out of the total population over 16 years of age (52,693), 62.8% or 33,091 individuals are in the labor force, with 3.1% or 1,026 of them unemployed. The age group with the highest labor force participation rate is 45 to 54 years, with 85.6% or 7,021 individuals in the labor force. Within the labor force, the 16 to 19 years age range has the highest percentage of unemployed individuals, with 7.7% or 149 of them being unemployed.
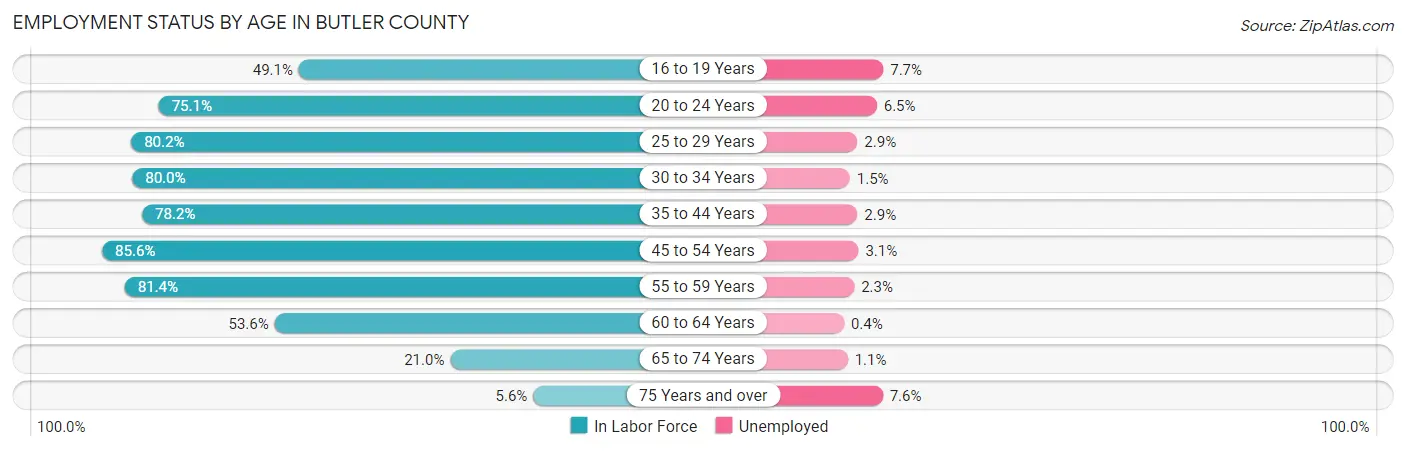
| Age Bracket | In Labor Force | Unemployed |
| 16 to 19 Years | 1,933 (49.1%) | 149 (7.7%) |
| 20 to 24 Years | 3,159 (75.1%) | 205 (6.5%) |
| 25 to 29 Years | 2,869 (80.2%) | 83 (2.9%) |
| 30 to 34 Years | 3,422 (80.0%) | 51 (1.5%) |
| 35 to 44 Years | 7,107 (78.2%) | 206 (2.9%) |
| 45 to 54 Years | 7,021 (85.6%) | 218 (3.1%) |
| 55 to 59 Years | 3,641 (81.4%) | 84 (2.3%) |
| 60 to 64 Years | 2,366 (53.6%) | 9 (0.4%) |
| 65 to 74 Years | 1,317 (21.0%) | 14 (1.1%) |
| 75 Years and over | 238 (5.6%) | 18 (7.6%) |
| Total | 33,091 (62.8%) | 1,026 (3.1%) |
Employment Status by Educational Attainment in Butler County
According to labor force statistics for Butler County, 77.6% of individuals (26,409) out of the total population between 25 and 64 years of age (34,032) are in the labor force, with 2.5% or 660 of them being unemployed. The group with the highest labor force participation rate are those with the educational attainment of bachelor's degree or higher, with 88.2% or 10,365 individuals in the labor force. Within the labor force, individuals with high school diploma education have the highest percentage of unemployment, with 4.8% or 270 of them being unemployed.
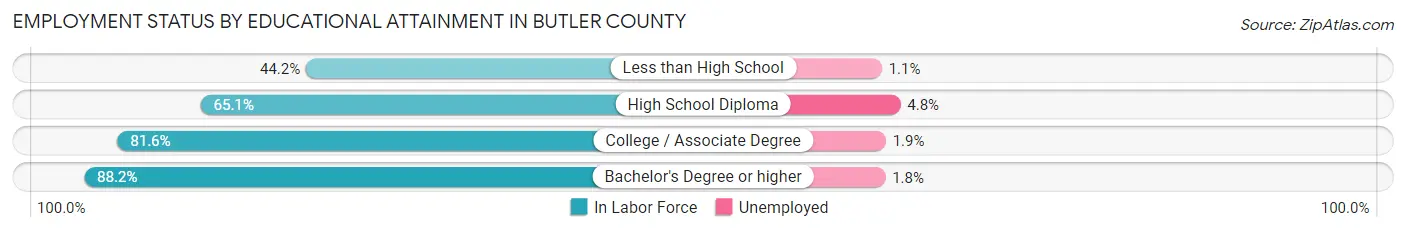
| Educational Attainment | In Labor Force | Unemployed |
| Less than High School | 825 (44.2%) | 21 (1.1%) |
| High School Diploma | 5,616 (65.1%) | 414 (4.8%) |
| College / Associate Degree | 9,617 (81.6%) | 224 (1.9%) |
| Bachelor's Degree or higher | 10,365 (88.2%) | 212 (1.8%) |
| Total | 26,409 (77.6%) | 851 (2.5%) |
Employment Occupations by Sex in Butler County
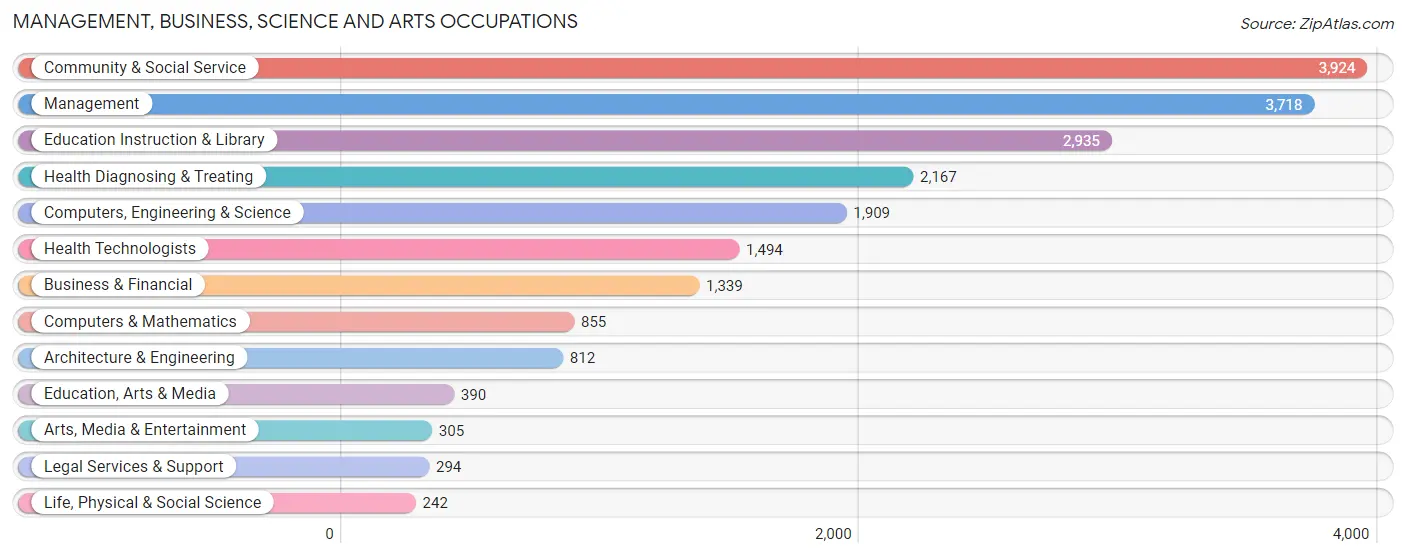
Management, Business, Science and Arts Occupations
The most common Management, Business, Science and Arts occupations in Butler County are Community & Social Service (3,924 | 12.4%), Management (3,718 | 11.7%), Education Instruction & Library (2,935 | 9.3%), Health Diagnosing & Treating (2,167 | 6.9%), and Computers, Engineering & Science (1,909 | 6.0%).
Management, Business, Science and Arts Occupations by Sex
Within the Management, Business, Science and Arts occupations in Butler County, the most male-oriented occupations are Architecture & Engineering (94.1%), Computers, Engineering & Science (80.0%), and Computers & Mathematics (75.6%), while the most female-oriented occupations are Health Diagnosing & Treating (85.0%), Health Technologists (82.0%), and Education Instruction & Library (75.1%).
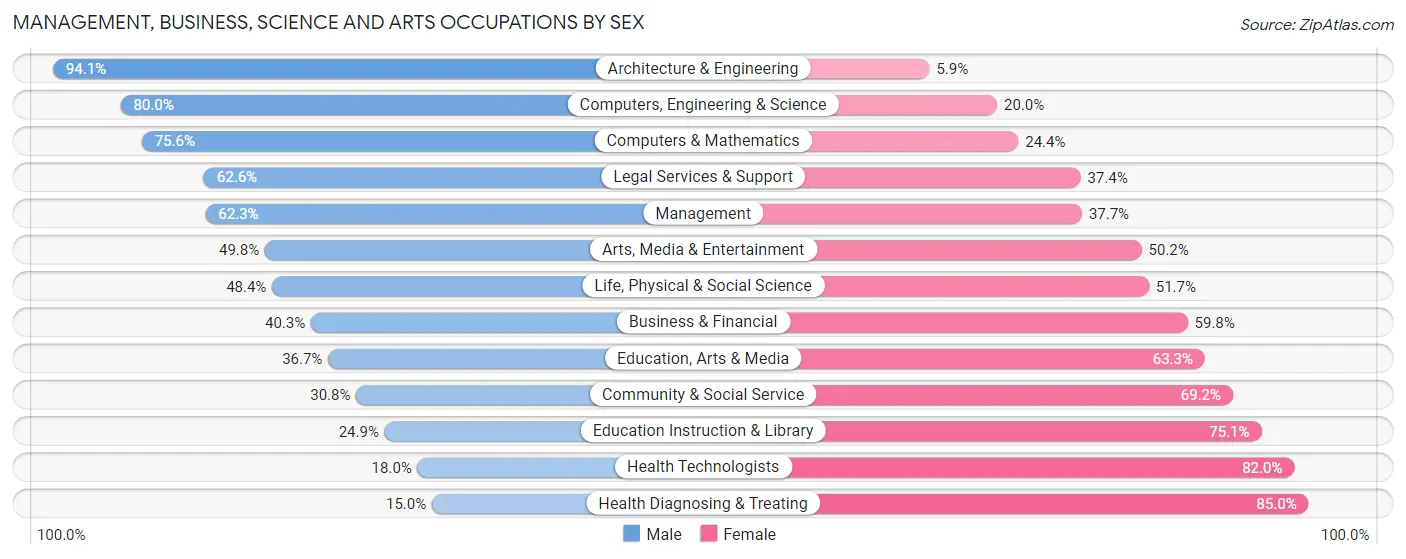
| Occupation | Male | Female |
| Management | 2,316 (62.3%) | 1,402 (37.7%) |
| Business & Financial | 539 (40.3%) | 800 (59.8%) |
| Computers, Engineering & Science | 1,527 (80.0%) | 382 (20.0%) |
| Computers & Mathematics | 646 (75.6%) | 209 (24.4%) |
| Architecture & Engineering | 764 (94.1%) | 48 (5.9%) |
| Life, Physical & Social Science | 117 (48.3%) | 125 (51.6%) |
| Community & Social Service | 1,209 (30.8%) | 2,715 (69.2%) |
| Education, Arts & Media | 143 (36.7%) | 247 (63.3%) |
| Legal Services & Support | 184 (62.6%) | 110 (37.4%) |
| Education Instruction & Library | 730 (24.9%) | 2,205 (75.1%) |
| Arts, Media & Entertainment | 152 (49.8%) | 153 (50.2%) |
| Health Diagnosing & Treating | 325 (15.0%) | 1,842 (85.0%) |
| Health Technologists | 269 (18.0%) | 1,225 (82.0%) |
| Total (Category) | 5,916 (45.3%) | 7,141 (54.7%) |
| Total (Overall) | 16,597 (52.5%) | 15,039 (47.5%) |
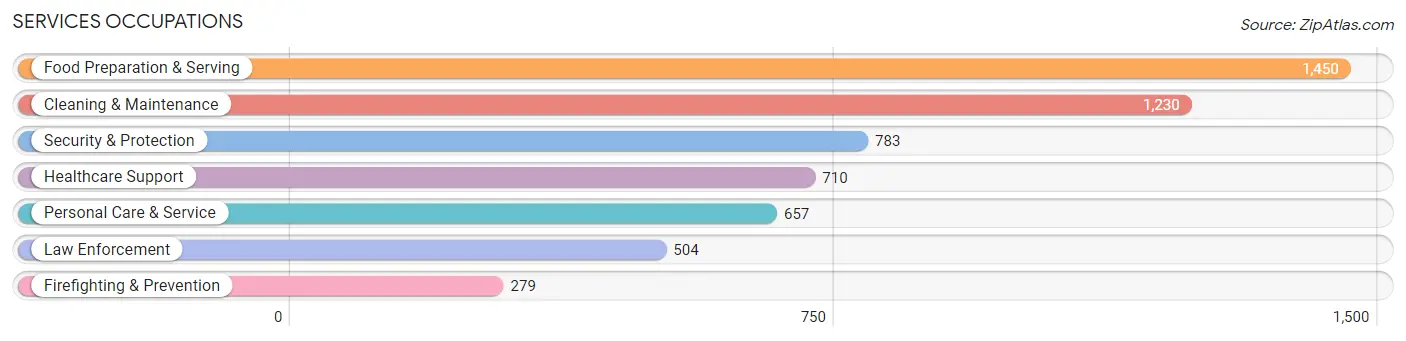
Services Occupations
The most common Services occupations in Butler County are Food Preparation & Serving (1,450 | 4.6%), Cleaning & Maintenance (1,230 | 3.9%), Security & Protection (783 | 2.5%), Healthcare Support (710 | 2.2%), and Personal Care & Service (657 | 2.1%).
Services Occupations by Sex
Within the Services occupations in Butler County, the most male-oriented occupations are Law Enforcement (89.9%), Security & Protection (86.7%), and Firefighting & Prevention (81.0%), while the most female-oriented occupations are Healthcare Support (96.6%), Personal Care & Service (77.9%), and Food Preparation & Serving (63.6%).
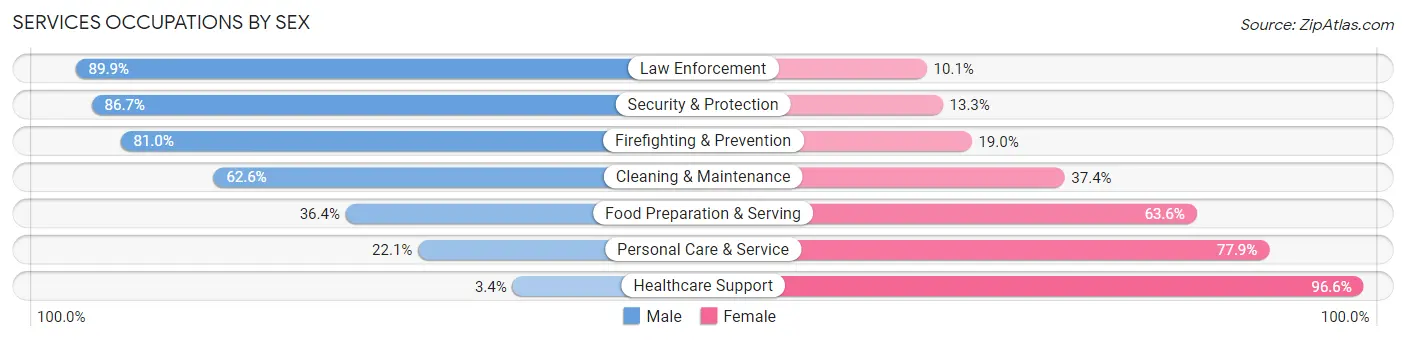
| Occupation | Male | Female |
| Healthcare Support | 24 (3.4%) | 686 (96.6%) |
| Security & Protection | 679 (86.7%) | 104 (13.3%) |
| Firefighting & Prevention | 226 (81.0%) | 53 (19.0%) |
| Law Enforcement | 453 (89.9%) | 51 (10.1%) |
| Food Preparation & Serving | 528 (36.4%) | 922 (63.6%) |
| Cleaning & Maintenance | 770 (62.6%) | 460 (37.4%) |
| Personal Care & Service | 145 (22.1%) | 512 (77.9%) |
| Total (Category) | 2,146 (44.4%) | 2,684 (55.6%) |
| Total (Overall) | 16,597 (52.5%) | 15,039 (47.5%) |
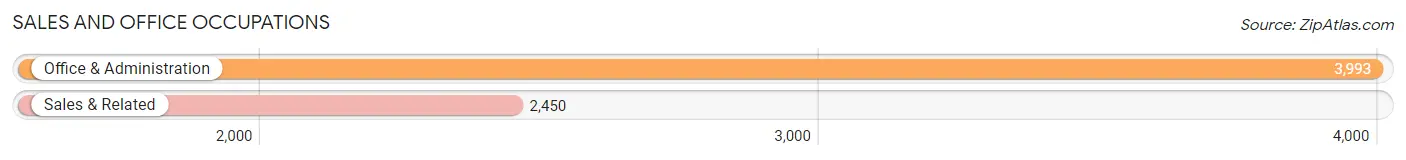
Sales and Office Occupations
The most common Sales and Office occupations in Butler County are Office & Administration (3,993 | 12.6%), and Sales & Related (2,450 | 7.7%).
Sales and Office Occupations by Sex
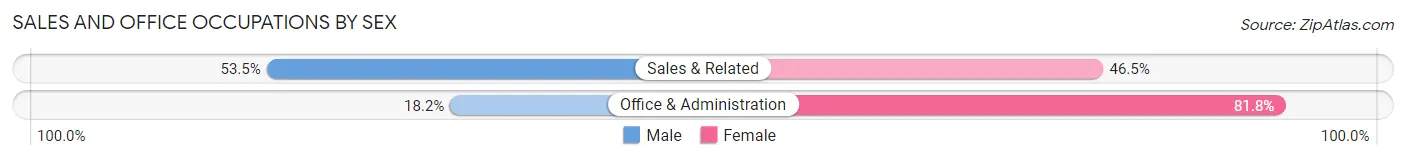
| Occupation | Male | Female |
| Sales & Related | 1,310 (53.5%) | 1,140 (46.5%) |
| Office & Administration | 725 (18.2%) | 3,268 (81.8%) |
| Total (Category) | 2,035 (31.6%) | 4,408 (68.4%) |
| Total (Overall) | 16,597 (52.5%) | 15,039 (47.5%) |
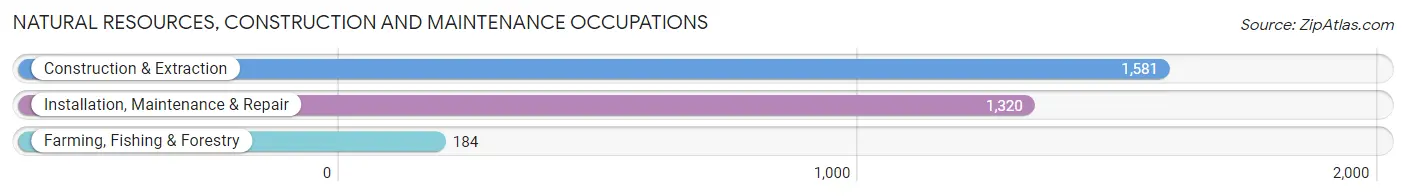
Natural Resources, Construction and Maintenance Occupations
The most common Natural Resources, Construction and Maintenance occupations in Butler County are Construction & Extraction (1,581 | 5.0%), Installation, Maintenance & Repair (1,320 | 4.2%), and Farming, Fishing & Forestry (184 | 0.6%).
Natural Resources, Construction and Maintenance Occupations by Sex
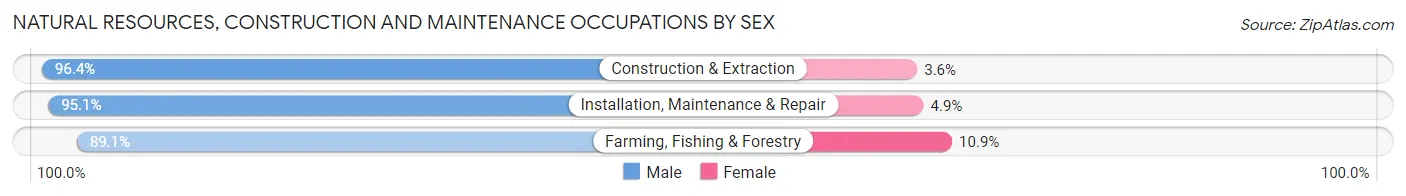
| Occupation | Male | Female |
| Farming, Fishing & Forestry | 164 (89.1%) | 20 (10.9%) |
| Construction & Extraction | 1,524 (96.4%) | 57 (3.6%) |
| Installation, Maintenance & Repair | 1,255 (95.1%) | 65 (4.9%) |
| Total (Category) | 2,943 (95.4%) | 142 (4.6%) |
| Total (Overall) | 16,597 (52.5%) | 15,039 (47.5%) |
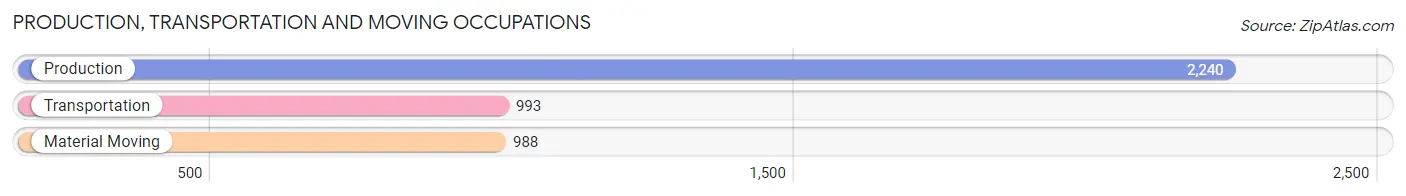
Production, Transportation and Moving Occupations
The most common Production, Transportation and Moving occupations in Butler County are Production (2,240 | 7.1%), Transportation (993 | 3.1%), and Material Moving (988 | 3.1%).
Production, Transportation and Moving Occupations by Sex
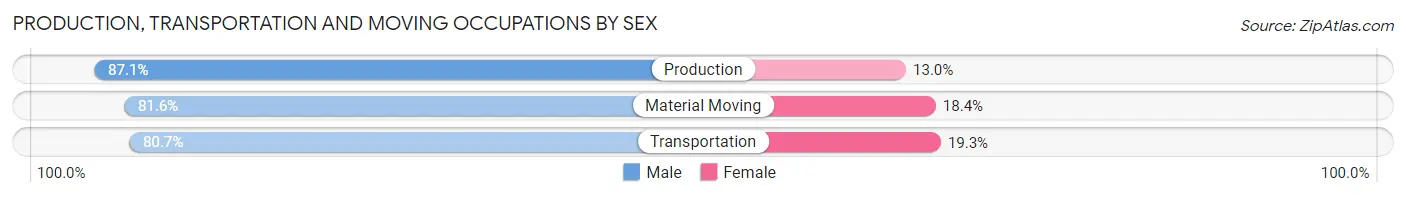
| Occupation | Male | Female |
| Production | 1,950 (87.1%) | 290 (13.0%) |
| Transportation | 801 (80.7%) | 192 (19.3%) |
| Material Moving | 806 (81.6%) | 182 (18.4%) |
| Total (Category) | 3,557 (84.3%) | 664 (15.7%) |
| Total (Overall) | 16,597 (52.5%) | 15,039 (47.5%) |
Employment Industries by Sex in Butler County
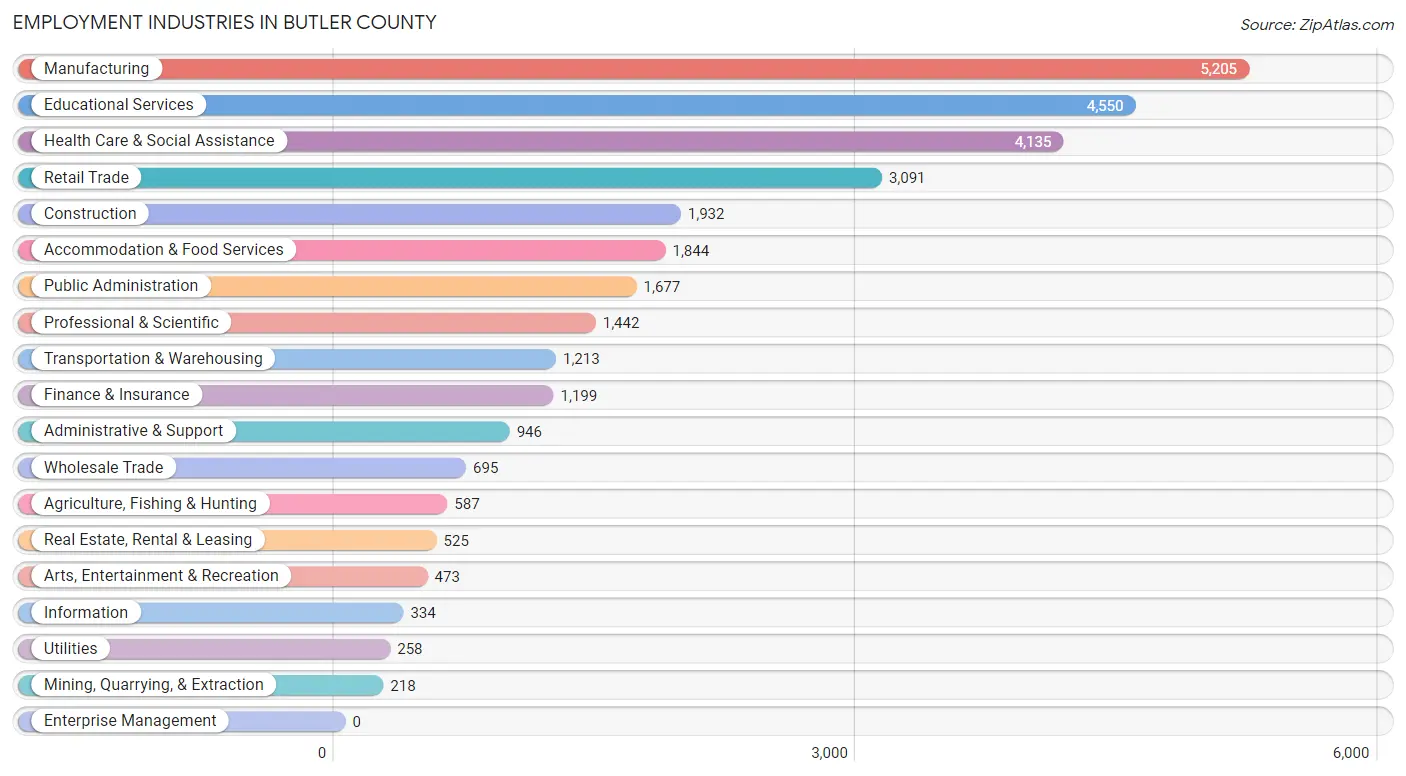
Employment Industries in Butler County
The major employment industries in Butler County include Manufacturing (5,205 | 16.5%), Educational Services (4,550 | 14.4%), Health Care & Social Assistance (4,135 | 13.1%), Retail Trade (3,091 | 9.8%), and Construction (1,932 | 6.1%).
Employment Industries by Sex in Butler County
The Butler County industries that see more men than women are Construction (90.0%), Agriculture, Fishing & Hunting (86.2%), and Wholesale Trade (82.3%), whereas the industries that tend to have a higher number of women are Health Care & Social Assistance (81.4%), Finance & Insurance (72.4%), and Educational Services (69.6%).
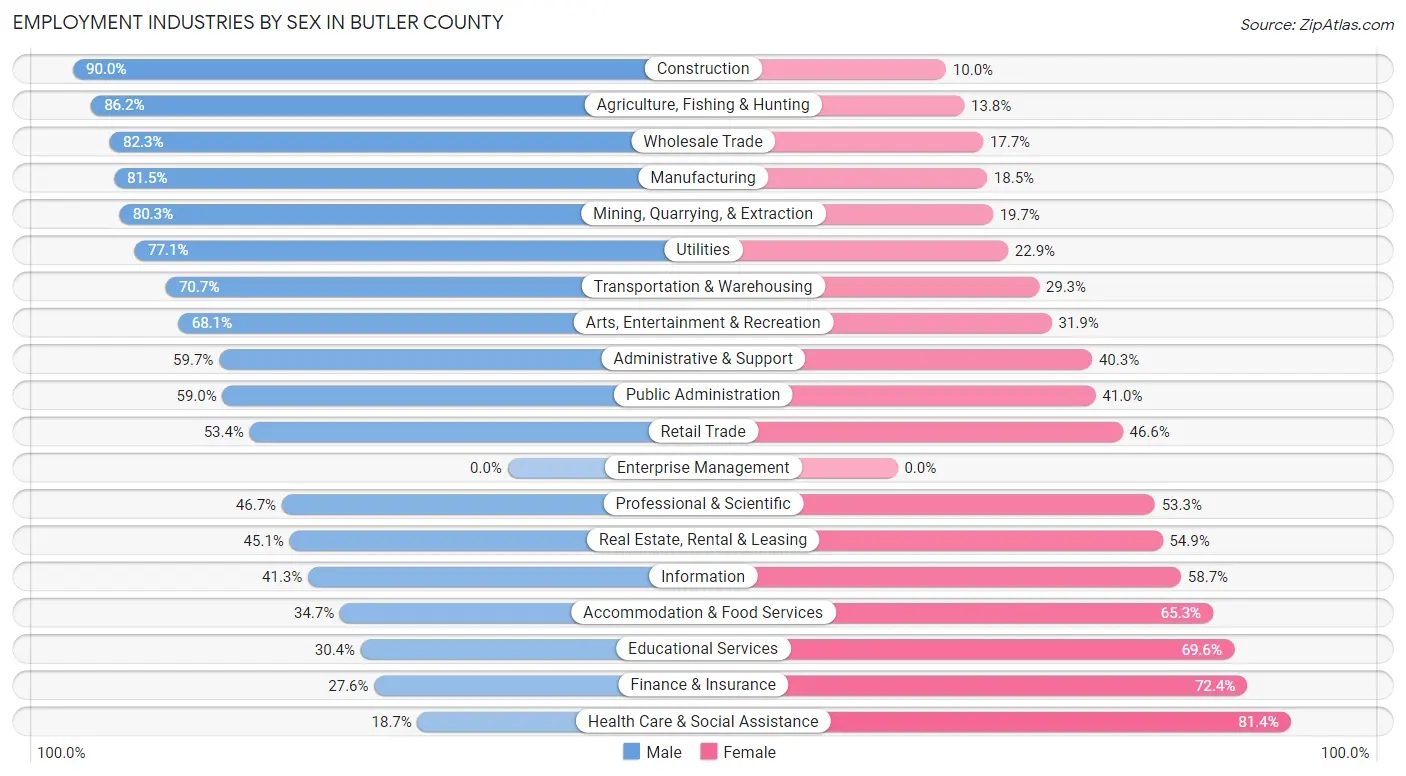
| Industry | Male | Female |
| Agriculture, Fishing & Hunting | 506 (86.2%) | 81 (13.8%) |
| Mining, Quarrying, & Extraction | 175 (80.3%) | 43 (19.7%) |
| Construction | 1,738 (90.0%) | 194 (10.0%) |
| Manufacturing | 4,241 (81.5%) | 964 (18.5%) |
| Wholesale Trade | 572 (82.3%) | 123 (17.7%) |
| Retail Trade | 1,651 (53.4%) | 1,440 (46.6%) |
| Transportation & Warehousing | 858 (70.7%) | 355 (29.3%) |
| Utilities | 199 (77.1%) | 59 (22.9%) |
| Information | 138 (41.3%) | 196 (58.7%) |
| Finance & Insurance | 331 (27.6%) | 868 (72.4%) |
| Real Estate, Rental & Leasing | 237 (45.1%) | 288 (54.9%) |
| Professional & Scientific | 674 (46.7%) | 768 (53.3%) |
| Enterprise Management | 0 (0.0%) | 0 (0.0%) |
| Administrative & Support | 565 (59.7%) | 381 (40.3%) |
| Educational Services | 1,383 (30.4%) | 3,167 (69.6%) |
| Health Care & Social Assistance | 771 (18.6%) | 3,364 (81.4%) |
| Arts, Entertainment & Recreation | 322 (68.1%) | 151 (31.9%) |
| Accommodation & Food Services | 640 (34.7%) | 1,204 (65.3%) |
| Public Administration | 990 (59.0%) | 687 (41.0%) |
| Total | 16,597 (52.5%) | 15,039 (47.5%) |
Education in Butler County
School Enrollment in Butler County
The most common levels of schooling among the 17,963 students in Butler County are middle school (4,190 | 23.3%), high school (4,081 | 22.7%), and elementary school (3,977 | 22.1%).
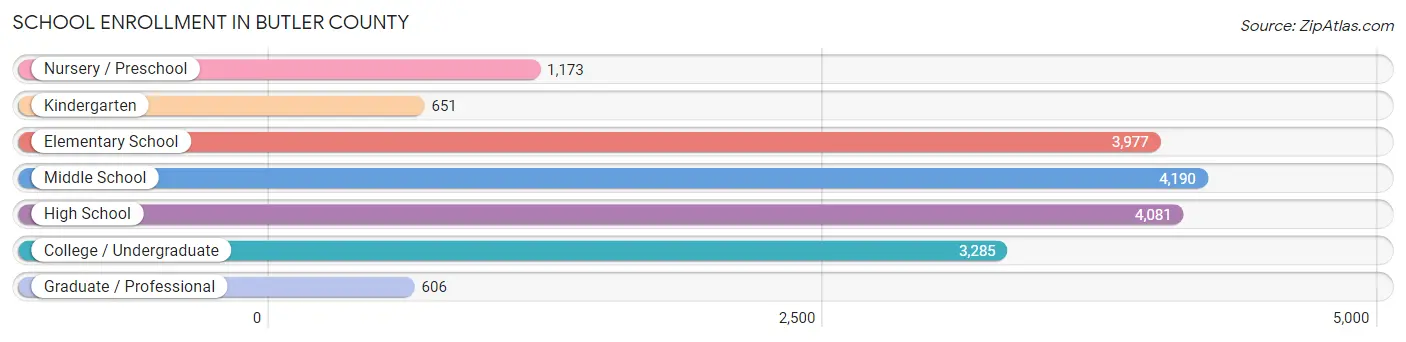
| School Level | # Students | % Students |
| Nursery / Preschool | 1,173 | 6.5% |
| Kindergarten | 651 | 3.6% |
| Elementary School | 3,977 | 22.1% |
| Middle School | 4,190 | 23.3% |
| High School | 4,081 | 22.7% |
| College / Undergraduate | 3,285 | 18.3% |
| Graduate / Professional | 606 | 3.4% |
| Total | 17,963 | 100.0% |
School Enrollment by Age by Funding Source in Butler County
Out of a total of 17,963 students who are enrolled in schools in Butler County, 2,120 (11.8%) attend a private institution, while the remaining 15,843 (88.2%) are enrolled in public schools. The age group of 3 to 4 year olds has the highest likelihood of being enrolled in private schools, with 271 (32.3% in the age bracket) enrolled. Conversely, the age group of 18 to 19 year olds has the lowest likelihood of being enrolled in a private school, with 1,239 (94.9% in the age bracket) attending a public institution.
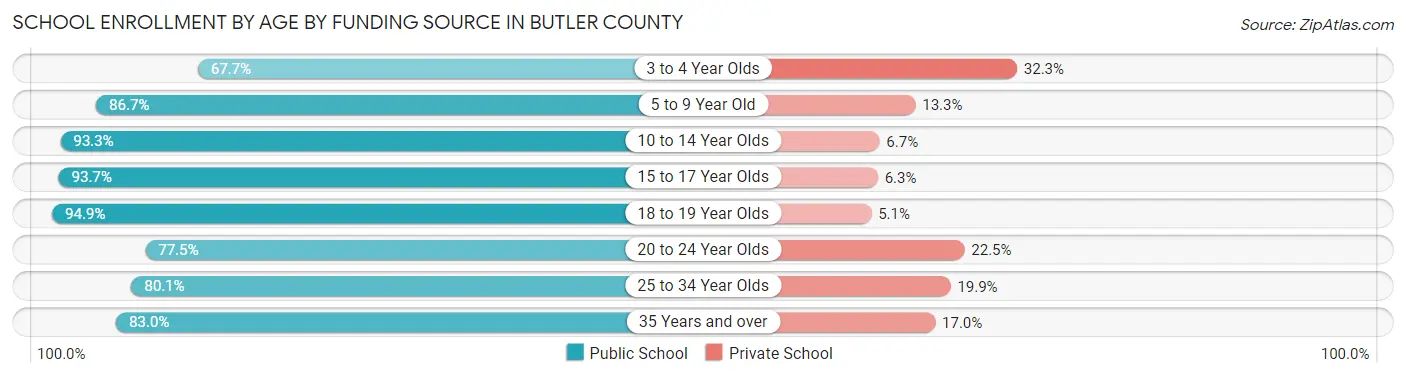
| Age Bracket | Public School | Private School |
| 3 to 4 Year Olds | 569 (67.7%) | 271 (32.3%) |
| 5 to 9 Year Old | 3,813 (86.7%) | 587 (13.3%) |
| 10 to 14 Year Olds | 4,762 (93.3%) | 340 (6.7%) |
| 15 to 17 Year Olds | 2,925 (93.7%) | 198 (6.3%) |
| 18 to 19 Year Olds | 1,239 (94.9%) | 67 (5.1%) |
| 20 to 24 Year Olds | 1,286 (77.5%) | 373 (22.5%) |
| 25 to 34 Year Olds | 560 (80.1%) | 139 (19.9%) |
| 35 Years and over | 692 (83.0%) | 142 (17.0%) |
| Total | 15,843 (88.2%) | 2,120 (11.8%) |
Educational Attainment by Field of Study in Butler County
Education (3,466 | 22.7%), business (3,378 | 22.1%), science & technology (1,880 | 12.3%), bio, nature & agricultural (895 | 5.9%), and engineering (864 | 5.7%) are the most common fields of study among 15,264 individuals in Butler County who have obtained a bachelor's degree or higher.
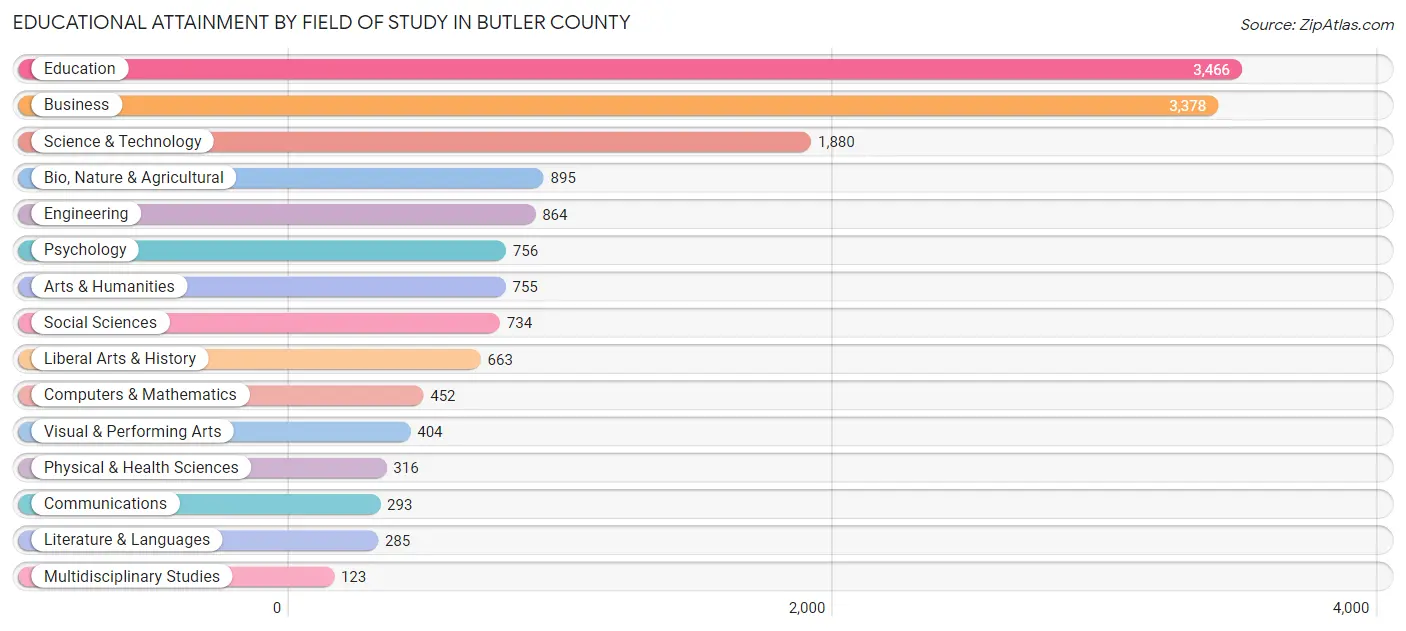
| Field of Study | # Graduates | % Graduates |
| Computers & Mathematics | 452 | 3.0% |
| Bio, Nature & Agricultural | 895 | 5.9% |
| Physical & Health Sciences | 316 | 2.1% |
| Psychology | 756 | 5.0% |
| Social Sciences | 734 | 4.8% |
| Engineering | 864 | 5.7% |
| Multidisciplinary Studies | 123 | 0.8% |
| Science & Technology | 1,880 | 12.3% |
| Business | 3,378 | 22.1% |
| Education | 3,466 | 22.7% |
| Literature & Languages | 285 | 1.9% |
| Liberal Arts & History | 663 | 4.3% |
| Visual & Performing Arts | 404 | 2.6% |
| Communications | 293 | 1.9% |
| Arts & Humanities | 755 | 5.0% |
| Total | 15,264 | 100.0% |
Transportation & Commute in Butler County
Vehicle Availability by Sex in Butler County
The most prevalent vehicle ownership categories in Butler County are males with 2 vehicles (6,831, accounting for 41.3%) and females with 2 vehicles (5,729, making up 46.1%).
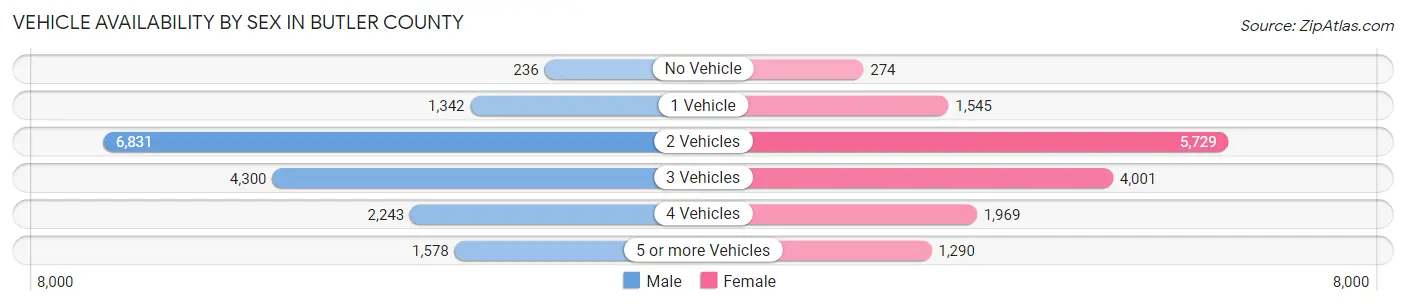
| Vehicles Available | Male | Female |
| No Vehicle | 236 (1.4%) | 274 (1.8%) |
| 1 Vehicle | 1,342 (8.1%) | 1,545 (10.4%) |
| 2 Vehicles | 6,831 (41.3%) | 5,729 (38.7%) |
| 3 Vehicles | 4,300 (26.0%) | 4,001 (27.0%) |
| 4 Vehicles | 2,243 (13.6%) | 1,969 (13.3%) |
| 5 or more Vehicles | 1,578 (9.6%) | 1,290 (8.7%) |
| Total | 16,530 (100.0%) | 14,808 (100.0%) |
Commute Time in Butler County
The most frequently occuring commute durations in Butler County are 30 to 34 minutes (5,065 commuters, 17.3%), 15 to 19 minutes (4,241 commuters, 14.5%), and 5 to 9 minutes (4,056 commuters, 13.9%).
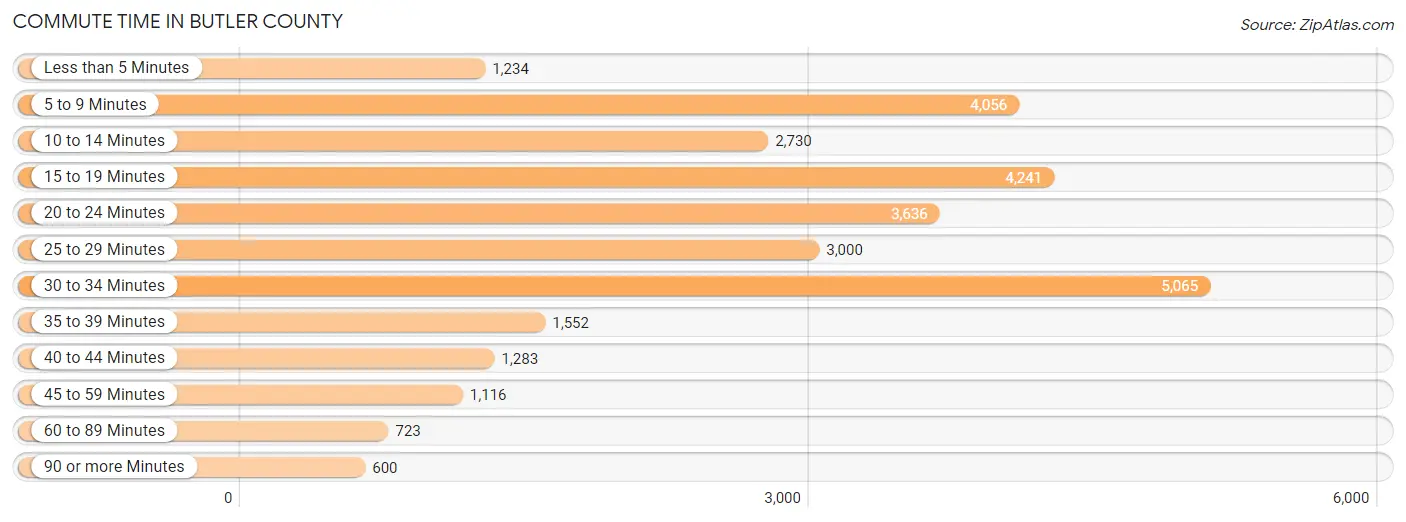
| Commute Time | # Commuters | % Commuters |
| Less than 5 Minutes | 1,234 | 4.2% |
| 5 to 9 Minutes | 4,056 | 13.9% |
| 10 to 14 Minutes | 2,730 | 9.3% |
| 15 to 19 Minutes | 4,241 | 14.5% |
| 20 to 24 Minutes | 3,636 | 12.4% |
| 25 to 29 Minutes | 3,000 | 10.3% |
| 30 to 34 Minutes | 5,065 | 17.3% |
| 35 to 39 Minutes | 1,552 | 5.3% |
| 40 to 44 Minutes | 1,283 | 4.4% |
| 45 to 59 Minutes | 1,116 | 3.8% |
| 60 to 89 Minutes | 723 | 2.5% |
| 90 or more Minutes | 600 | 2.1% |
Commute Time by Sex in Butler County
The most common commute times in Butler County are 30 to 34 minutes (3,032 commuters, 19.5%) for males and 15 to 19 minutes (2,245 commuters, 16.4%) for females.
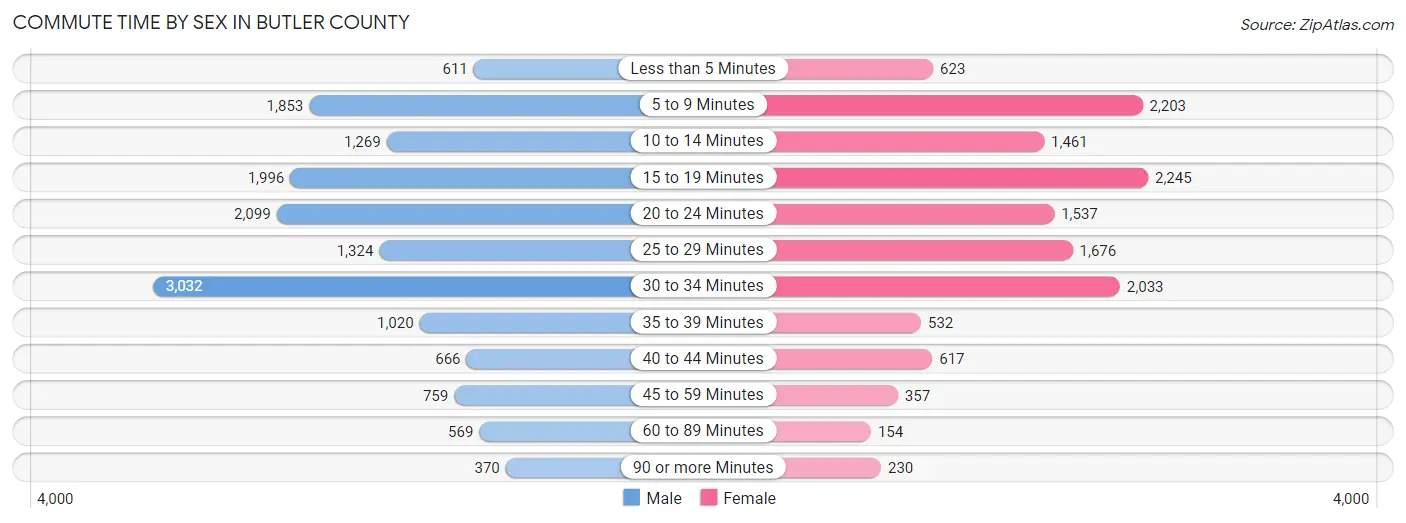
| Commute Time | Male | Female |
| Less than 5 Minutes | 611 (3.9%) | 623 (4.6%) |
| 5 to 9 Minutes | 1,853 (11.9%) | 2,203 (16.1%) |
| 10 to 14 Minutes | 1,269 (8.2%) | 1,461 (10.7%) |
| 15 to 19 Minutes | 1,996 (12.8%) | 2,245 (16.4%) |
| 20 to 24 Minutes | 2,099 (13.5%) | 1,537 (11.3%) |
| 25 to 29 Minutes | 1,324 (8.5%) | 1,676 (12.3%) |
| 30 to 34 Minutes | 3,032 (19.5%) | 2,033 (14.9%) |
| 35 to 39 Minutes | 1,020 (6.6%) | 532 (3.9%) |
| 40 to 44 Minutes | 666 (4.3%) | 617 (4.5%) |
| 45 to 59 Minutes | 759 (4.9%) | 357 (2.6%) |
| 60 to 89 Minutes | 569 (3.6%) | 154 (1.1%) |
| 90 or more Minutes | 370 (2.4%) | 230 (1.7%) |
Time of Departure to Work by Sex in Butler County
The most frequent times of departure to work in Butler County are 7:00 AM to 7:29 AM (2,495, 16.0%) for males and 7:00 AM to 7:29 AM (3,111, 22.8%) for females.
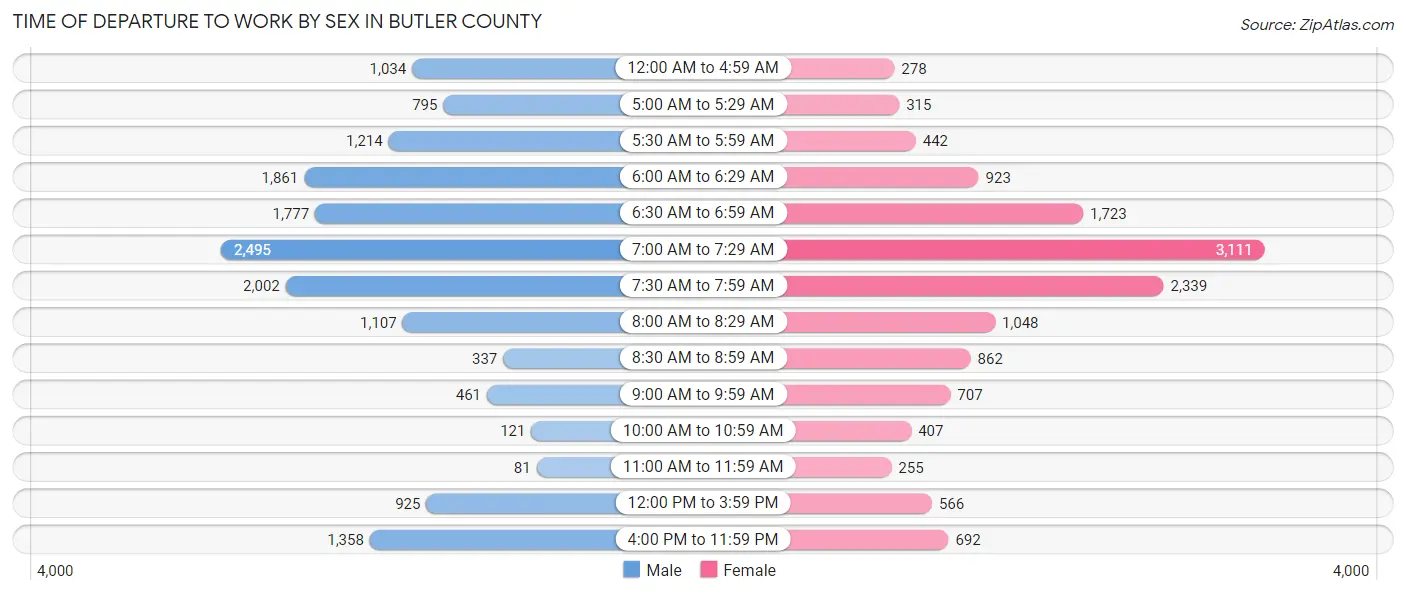
| Time of Departure | Male | Female |
| 12:00 AM to 4:59 AM | 1,034 (6.6%) | 278 (2.0%) |
| 5:00 AM to 5:29 AM | 795 (5.1%) | 315 (2.3%) |
| 5:30 AM to 5:59 AM | 1,214 (7.8%) | 442 (3.2%) |
| 6:00 AM to 6:29 AM | 1,861 (11.9%) | 923 (6.8%) |
| 6:30 AM to 6:59 AM | 1,777 (11.4%) | 1,723 (12.6%) |
| 7:00 AM to 7:29 AM | 2,495 (16.0%) | 3,111 (22.8%) |
| 7:30 AM to 7:59 AM | 2,002 (12.9%) | 2,339 (17.1%) |
| 8:00 AM to 8:29 AM | 1,107 (7.1%) | 1,048 (7.7%) |
| 8:30 AM to 8:59 AM | 337 (2.2%) | 862 (6.3%) |
| 9:00 AM to 9:59 AM | 461 (3.0%) | 707 (5.2%) |
| 10:00 AM to 10:59 AM | 121 (0.8%) | 407 (3.0%) |
| 11:00 AM to 11:59 AM | 81 (0.5%) | 255 (1.9%) |
| 12:00 PM to 3:59 PM | 925 (5.9%) | 566 (4.1%) |
| 4:00 PM to 11:59 PM | 1,358 (8.7%) | 692 (5.1%) |
| Total | 15,568 (100.0%) | 13,668 (100.0%) |
Housing Occupancy in Butler County
Occupancy by Ownership in Butler County
Of the total 24,760 dwellings in Butler County, owner-occupied units account for 19,351 (78.1%), while renter-occupied units make up 5,409 (21.8%).
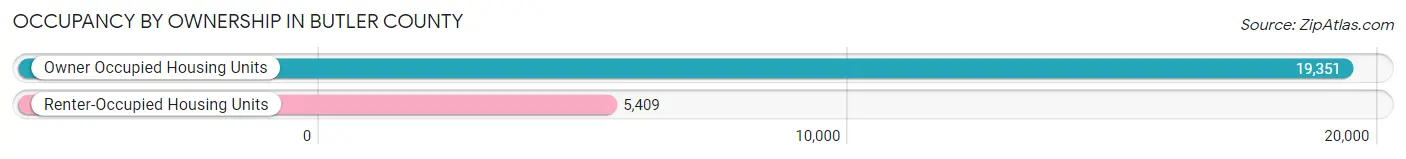
| Occupancy | # Housing Units | % Housing Units |
| Owner Occupied Housing Units | 19,351 | 78.1% |
| Renter-Occupied Housing Units | 5,409 | 21.8% |
| Total Occupied Housing Units | 24,760 | 100.0% |
Occupancy by Household Size in Butler County
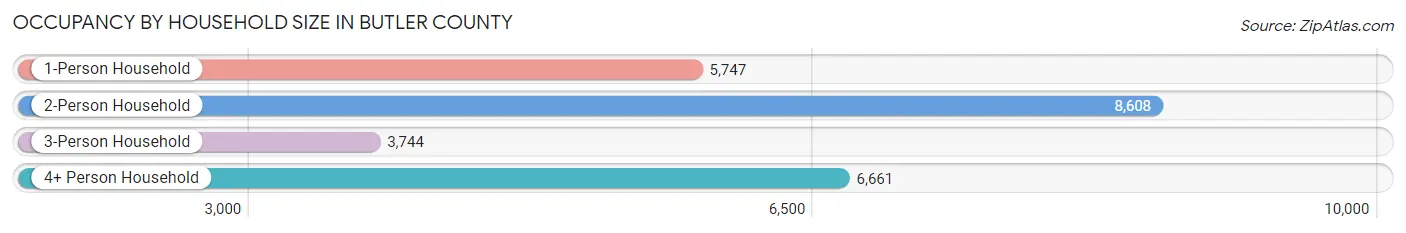
| Household Size | # Housing Units | % Housing Units |
| 1-Person Household | 5,747 | 23.2% |
| 2-Person Household | 8,608 | 34.8% |
| 3-Person Household | 3,744 | 15.1% |
| 4+ Person Household | 6,661 | 26.9% |
| Total Housing Units | 24,760 | 100.0% |
Occupancy by Ownership by Household Size in Butler County
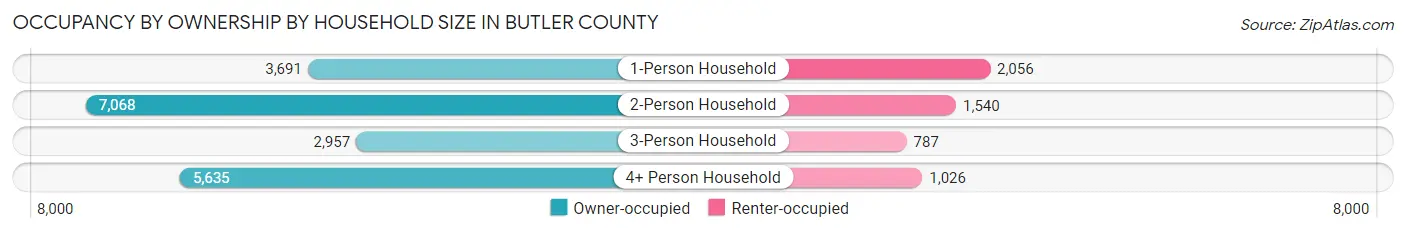
| Household Size | Owner-occupied | Renter-occupied |
| 1-Person Household | 3,691 (64.2%) | 2,056 (35.8%) |
| 2-Person Household | 7,068 (82.1%) | 1,540 (17.9%) |
| 3-Person Household | 2,957 (79.0%) | 787 (21.0%) |
| 4+ Person Household | 5,635 (84.6%) | 1,026 (15.4%) |
| Total Housing Units | 19,351 (78.1%) | 5,409 (21.8%) |
Occupancy by Educational Attainment in Butler County
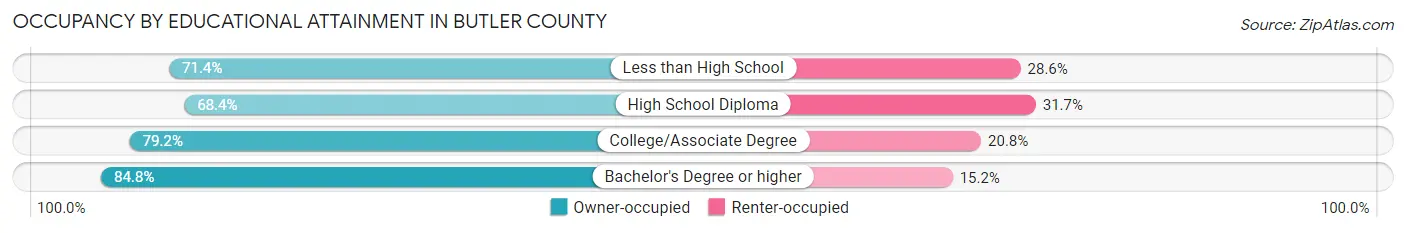
| Household Size | Owner-occupied | Renter-occupied |
| Less than High School | 775 (71.4%) | 311 (28.6%) |
| High School Diploma | 4,067 (68.3%) | 1,883 (31.7%) |
| College/Associate Degree | 7,399 (79.2%) | 1,944 (20.8%) |
| Bachelor's Degree or higher | 7,110 (84.8%) | 1,271 (15.2%) |
Occupancy by Age of Householder in Butler County
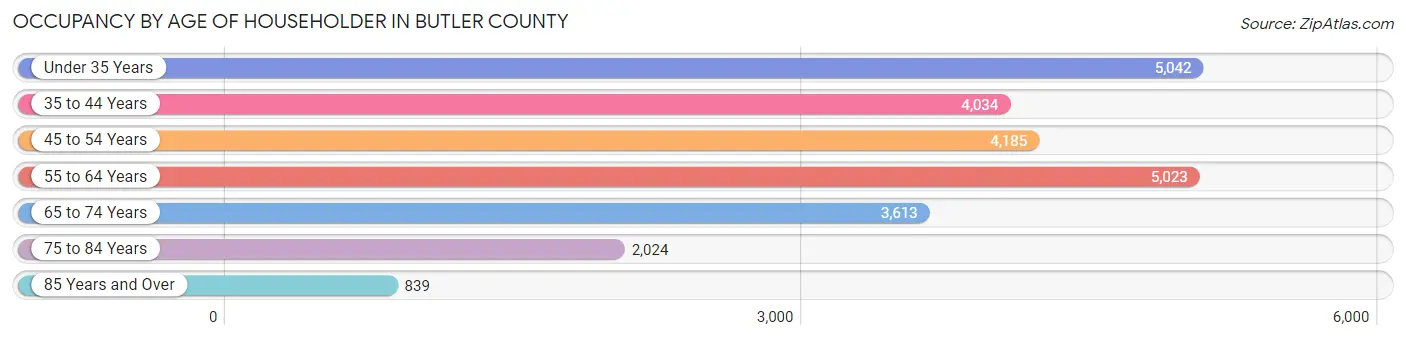
| Age Bracket | # Households | % Households |
| Under 35 Years | 5,042 | 20.4% |
| 35 to 44 Years | 4,034 | 16.3% |
| 45 to 54 Years | 4,185 | 16.9% |
| 55 to 64 Years | 5,023 | 20.3% |
| 65 to 74 Years | 3,613 | 14.6% |
| 75 to 84 Years | 2,024 | 8.2% |
| 85 Years and Over | 839 | 3.4% |
| Total | 24,760 | 100.0% |
Housing Finances in Butler County
Median Income by Occupancy in Butler County

| Occupancy Type | # Households | Median Income |
| Owner-Occupied | 19,351 (78.1%) | $88,338 |
| Renter-Occupied | 5,409 (21.8%) | $43,848 |
| Average | 24,760 (100.0%) | $77,724 |
Occupancy by Householder Income Bracket in Butler County
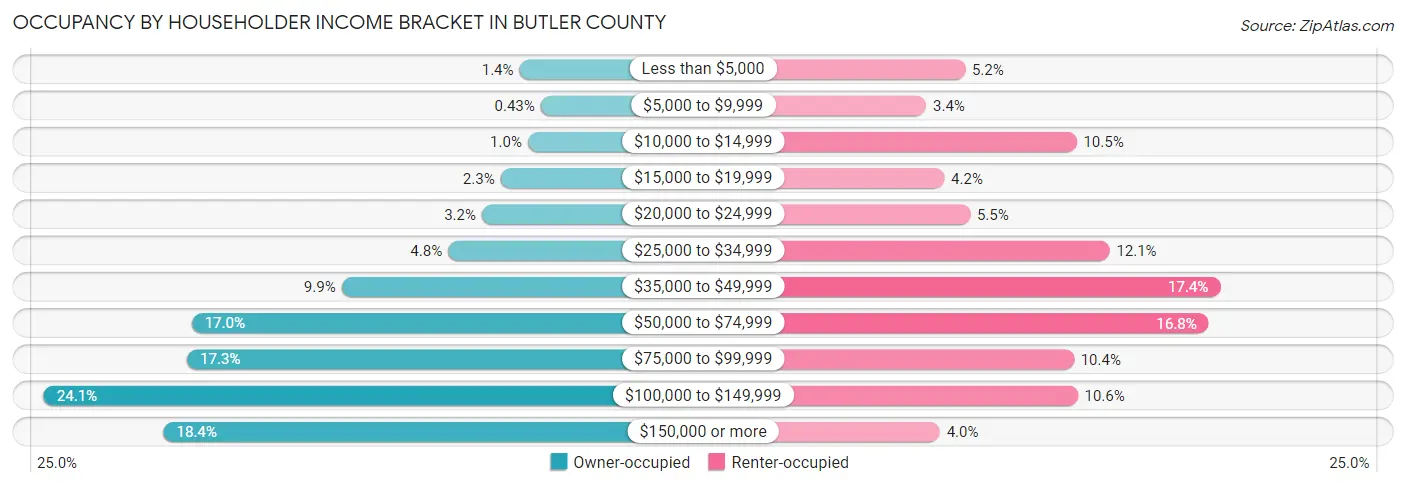
| Income Bracket | Owner-occupied | Renter-occupied |
| Less than $5,000 | 279 (1.4%) | 282 (5.2%) |
| $5,000 to $9,999 | 83 (0.4%) | 182 (3.4%) |
| $10,000 to $14,999 | 202 (1.0%) | 569 (10.5%) |
| $15,000 to $19,999 | 453 (2.3%) | 228 (4.2%) |
| $20,000 to $24,999 | 626 (3.2%) | 295 (5.4%) |
| $25,000 to $34,999 | 936 (4.8%) | 654 (12.1%) |
| $35,000 to $49,999 | 1,917 (9.9%) | 939 (17.4%) |
| $50,000 to $74,999 | 3,298 (17.0%) | 909 (16.8%) |
| $75,000 to $99,999 | 3,340 (17.3%) | 562 (10.4%) |
| $100,000 to $149,999 | 4,660 (24.1%) | 572 (10.6%) |
| $150,000 or more | 3,557 (18.4%) | 217 (4.0%) |
| Total | 19,351 (100.0%) | 5,409 (100.0%) |
Monthly Housing Cost Tiers in Butler County
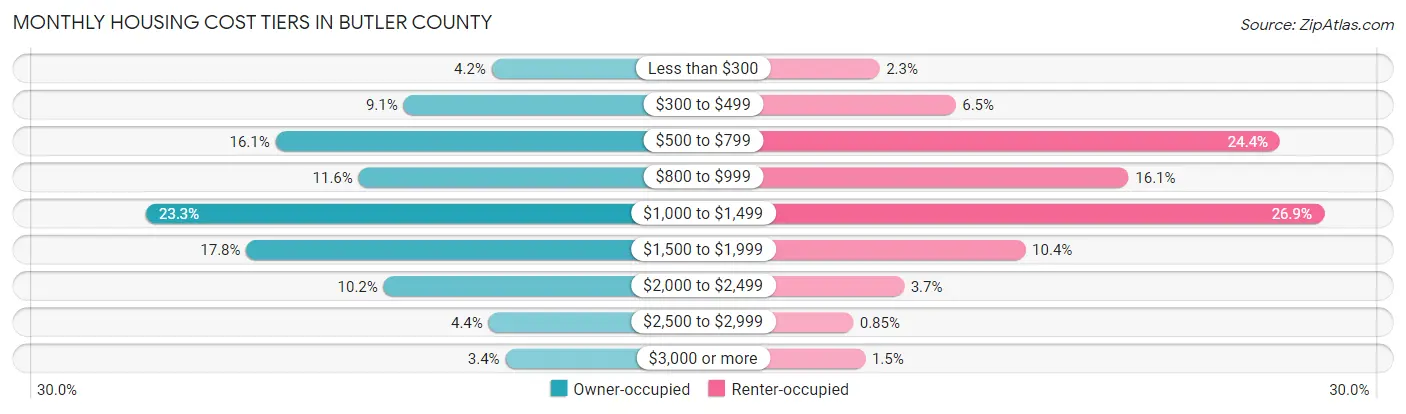
| Monthly Cost | Owner-occupied | Renter-occupied |
| Less than $300 | 813 (4.2%) | 125 (2.3%) |
| $300 to $499 | 1,756 (9.1%) | 352 (6.5%) |
| $500 to $799 | 3,123 (16.1%) | 1,322 (24.4%) |
| $800 to $999 | 2,236 (11.6%) | 869 (16.1%) |
| $1,000 to $1,499 | 4,508 (23.3%) | 1,453 (26.9%) |
| $1,500 to $1,999 | 3,435 (17.7%) | 561 (10.4%) |
| $2,000 to $2,499 | 1,968 (10.2%) | 198 (3.7%) |
| $2,500 to $2,999 | 846 (4.4%) | 46 (0.9%) |
| $3,000 or more | 666 (3.4%) | 82 (1.5%) |
| Total | 19,351 (100.0%) | 5,409 (100.0%) |
Physical Housing Characteristics in Butler County
Housing Structures in Butler County
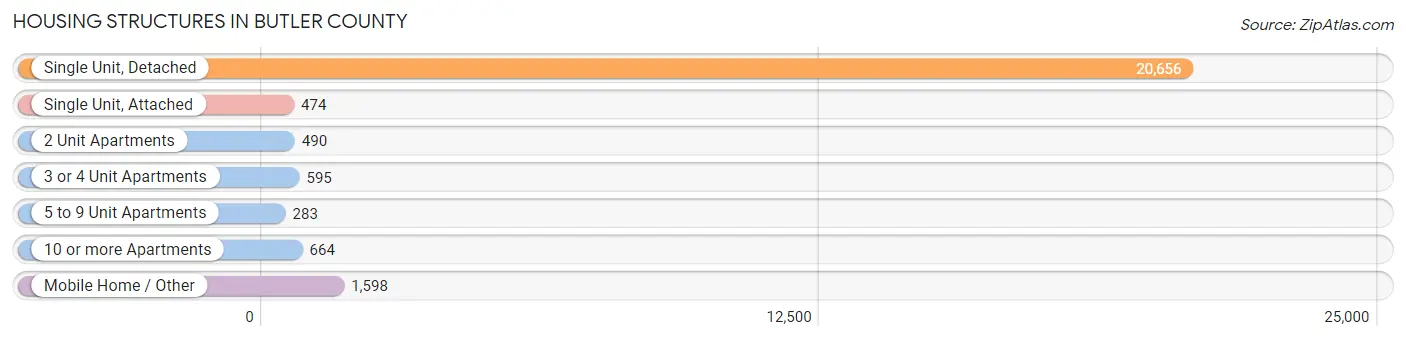
| Structure Type | # Housing Units | % Housing Units |
| Single Unit, Detached | 20,656 | 83.4% |
| Single Unit, Attached | 474 | 1.9% |
| 2 Unit Apartments | 490 | 2.0% |
| 3 or 4 Unit Apartments | 595 | 2.4% |
| 5 to 9 Unit Apartments | 283 | 1.1% |
| 10 or more Apartments | 664 | 2.7% |
| Mobile Home / Other | 1,598 | 6.5% |
| Total | 24,760 | 100.0% |
Housing Structures by Occupancy in Butler County
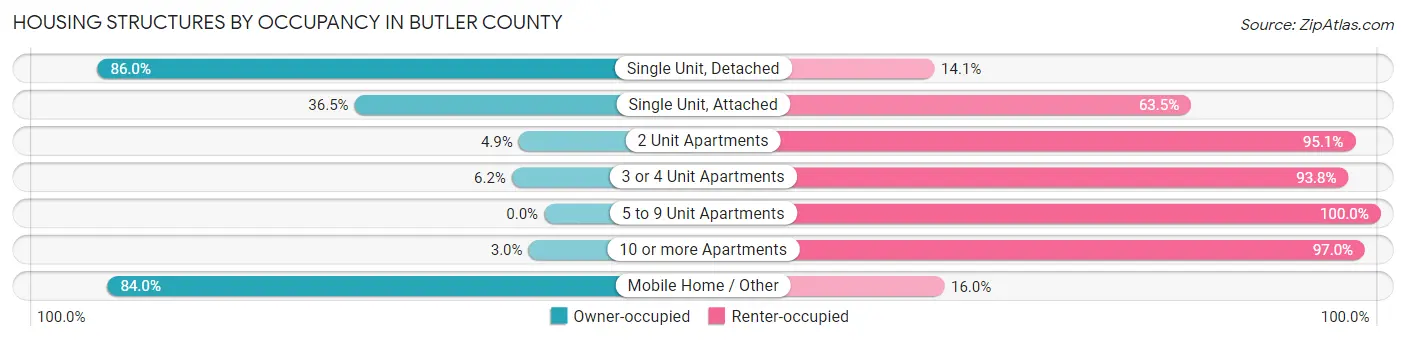
| Structure Type | Owner-occupied | Renter-occupied |
| Single Unit, Detached | 17,754 (86.0%) | 2,902 (14.1%) |
| Single Unit, Attached | 173 (36.5%) | 301 (63.5%) |
| 2 Unit Apartments | 24 (4.9%) | 466 (95.1%) |
| 3 or 4 Unit Apartments | 37 (6.2%) | 558 (93.8%) |
| 5 to 9 Unit Apartments | 0 (0.0%) | 283 (100.0%) |
| 10 or more Apartments | 20 (3.0%) | 644 (97.0%) |
| Mobile Home / Other | 1,343 (84.0%) | 255 (16.0%) |
| Total | 19,351 (78.1%) | 5,409 (21.8%) |
Housing Structures by Number of Rooms in Butler County
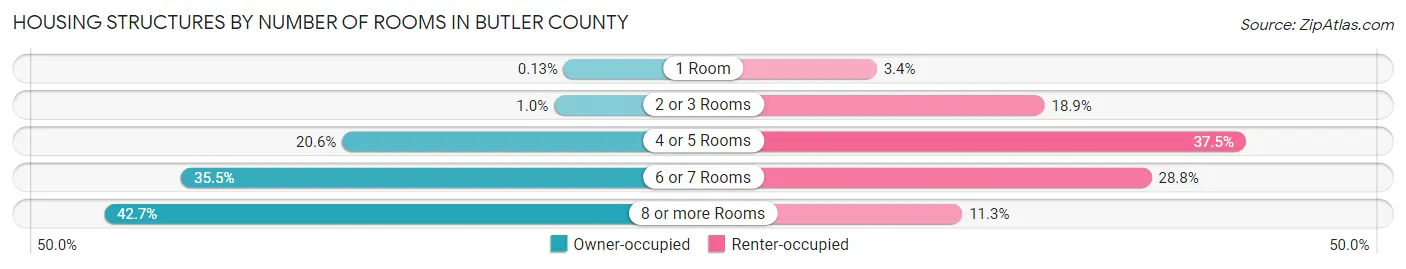
| Number of Rooms | Owner-occupied | Renter-occupied |
| 1 Room | 26 (0.1%) | 184 (3.4%) |
| 2 or 3 Rooms | 202 (1.0%) | 1,024 (18.9%) |
| 4 or 5 Rooms | 3,993 (20.6%) | 2,030 (37.5%) |
| 6 or 7 Rooms | 6,874 (35.5%) | 1,559 (28.8%) |
| 8 or more Rooms | 8,256 (42.7%) | 612 (11.3%) |
| Total | 19,351 (100.0%) | 5,409 (100.0%) |
Housing Structure by Heating Type in Butler County
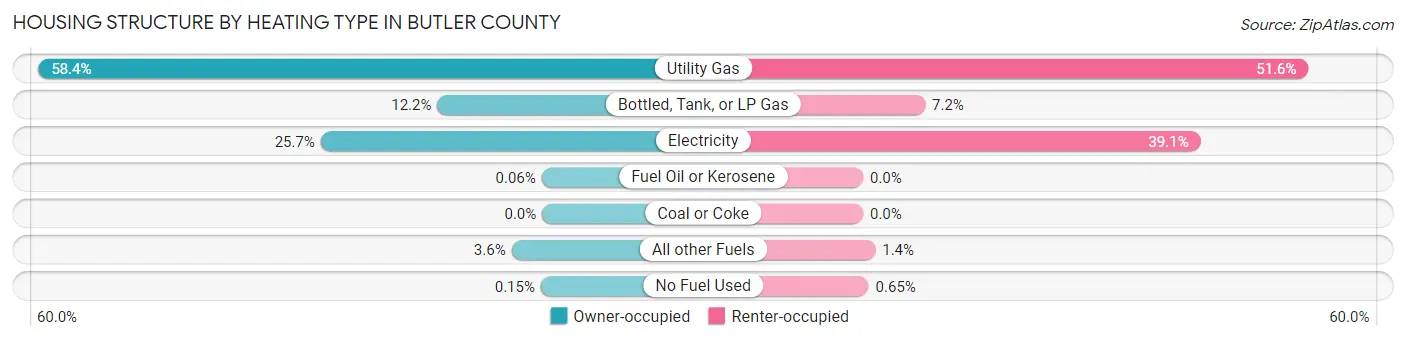
| Heating Type | Owner-occupied | Renter-occupied |
| Utility Gas | 11,305 (58.4%) | 2,792 (51.6%) |
| Bottled, Tank, or LP Gas | 2,351 (12.1%) | 389 (7.2%) |
| Electricity | 4,968 (25.7%) | 2,116 (39.1%) |
| Fuel Oil or Kerosene | 12 (0.1%) | 0 (0.0%) |
| Coal or Coke | 0 (0.0%) | 0 (0.0%) |
| All other Fuels | 686 (3.5%) | 77 (1.4%) |
| No Fuel Used | 29 (0.2%) | 35 (0.6%) |
| Total | 19,351 (100.0%) | 5,409 (100.0%) |
Household Vehicle Usage in Butler County
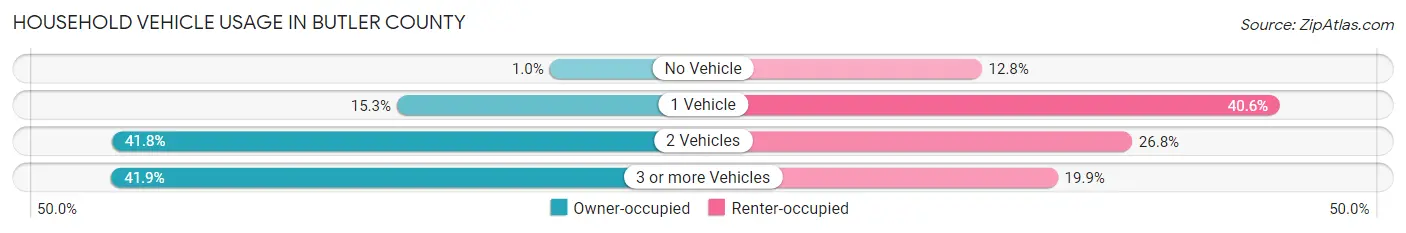
| Vehicles per Household | Owner-occupied | Renter-occupied |
| No Vehicle | 193 (1.0%) | 690 (12.8%) |
| 1 Vehicle | 2,952 (15.3%) | 2,196 (40.6%) |
| 2 Vehicles | 8,097 (41.8%) | 1,449 (26.8%) |
| 3 or more Vehicles | 8,109 (41.9%) | 1,074 (19.9%) |
| Total | 19,351 (100.0%) | 5,409 (100.0%) |
Real Estate & Mortgages in Butler County
Real Estate and Mortgage Overview in Butler County
| Characteristic | Without Mortgage | With Mortgage |
| Housing Units | 7,410 | 11,941 |
| Median Property Value | $157,500 | $191,200 |
| Median Household Income | $65,159 | $2,678 |
| Monthly Housing Costs | $624 | $634 |
| Real Estate Taxes | $2,609 | $96 |
Property Value by Mortgage Status in Butler County
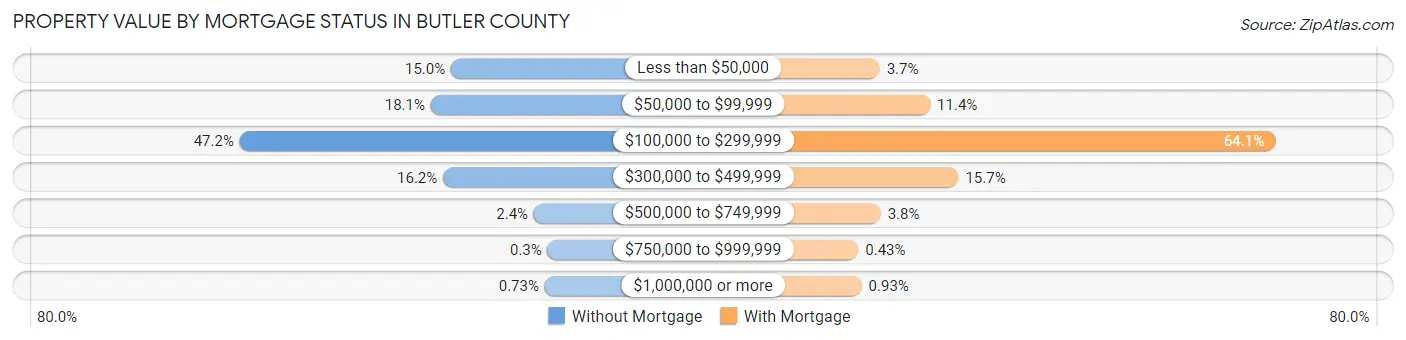
| Property Value | Without Mortgage | With Mortgage |
| Less than $50,000 | 1,113 (15.0%) | 440 (3.7%) |
| $50,000 to $99,999 | 1,342 (18.1%) | 1,358 (11.4%) |
| $100,000 to $299,999 | 3,499 (47.2%) | 7,649 (64.1%) |
| $300,000 to $499,999 | 1,203 (16.2%) | 1,874 (15.7%) |
| $500,000 to $749,999 | 177 (2.4%) | 458 (3.8%) |
| $750,000 to $999,999 | 22 (0.3%) | 51 (0.4%) |
| $1,000,000 or more | 54 (0.7%) | 111 (0.9%) |
| Total | 7,410 (100.0%) | 11,941 (100.0%) |
Household Income by Mortgage Status in Butler County
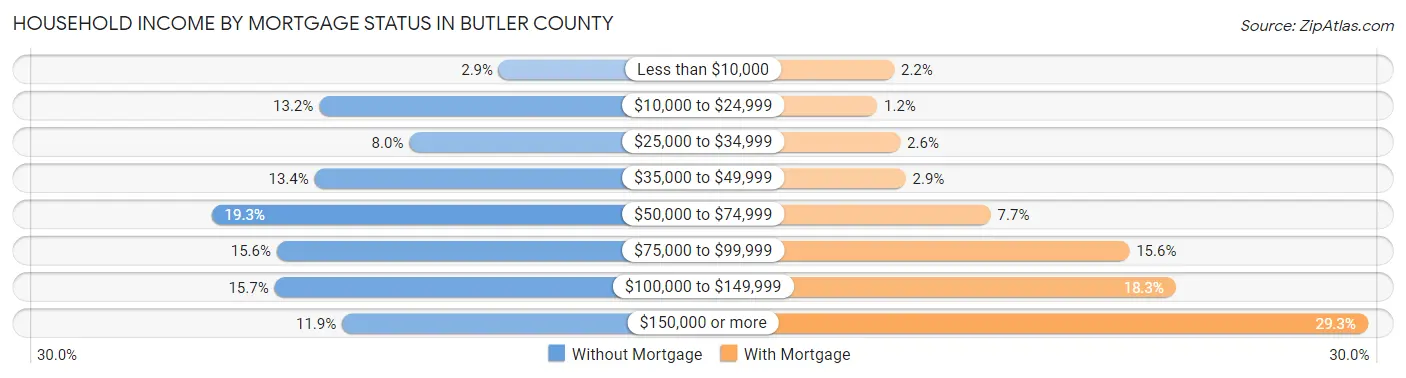
| Household Income | Without Mortgage | With Mortgage |
| Less than $10,000 | 215 (2.9%) | 263 (2.2%) |
| $10,000 to $24,999 | 976 (13.2%) | 147 (1.2%) |
| $25,000 to $34,999 | 594 (8.0%) | 305 (2.5%) |
| $35,000 to $49,999 | 995 (13.4%) | 342 (2.9%) |
| $50,000 to $74,999 | 1,431 (19.3%) | 922 (7.7%) |
| $75,000 to $99,999 | 1,155 (15.6%) | 1,867 (15.6%) |
| $100,000 to $149,999 | 1,165 (15.7%) | 2,185 (18.3%) |
| $150,000 or more | 879 (11.9%) | 3,495 (29.3%) |
| Total | 7,410 (100.0%) | 11,941 (100.0%) |
Property Value to Household Income Ratio in Butler County
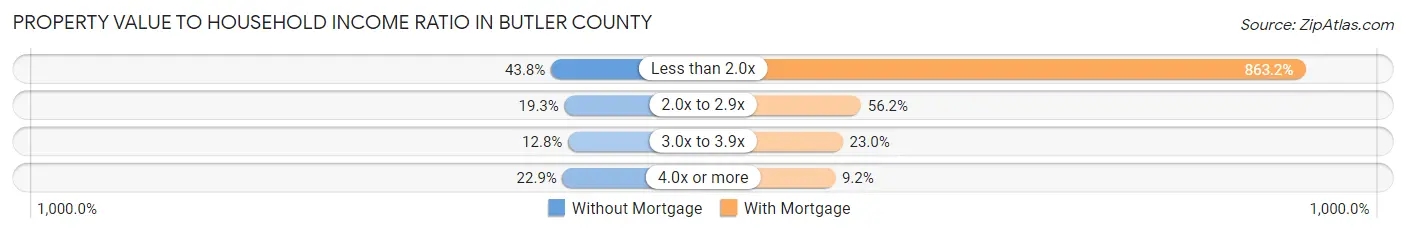
| Value-to-Income Ratio | Without Mortgage | With Mortgage |
| Less than 2.0x | 3,242 (43.8%) | 103,076 (863.2%) |
| 2.0x to 2.9x | 1,427 (19.3%) | 6,712 (56.2%) |
| 3.0x to 3.9x | 951 (12.8%) | 2,743 (23.0%) |
| 4.0x or more | 1,695 (22.9%) | 1,099 (9.2%) |
| Total | 7,410 (100.0%) | 11,941 (100.0%) |
Real Estate Taxes by Mortgage Status in Butler County
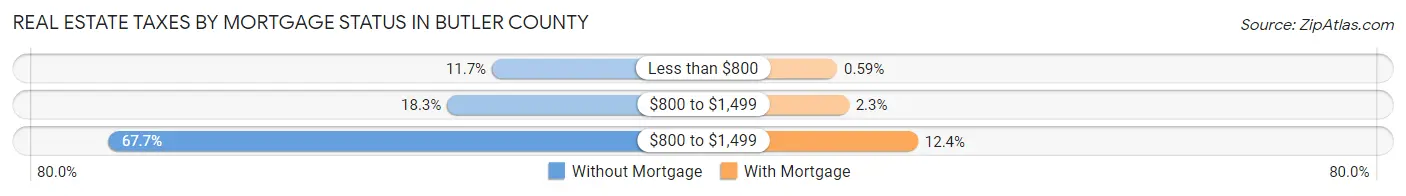
| Property Taxes | Without Mortgage | With Mortgage |
| Less than $800 | 868 (11.7%) | 71 (0.6%) |
| $800 to $1,499 | 1,353 (18.3%) | 273 (2.3%) |
| $800 to $1,499 | 5,016 (67.7%) | 1,479 (12.4%) |
| Total | 7,410 (100.0%) | 11,941 (100.0%) |
Health & Disability in Butler County
Health Insurance Coverage by Age in Butler County
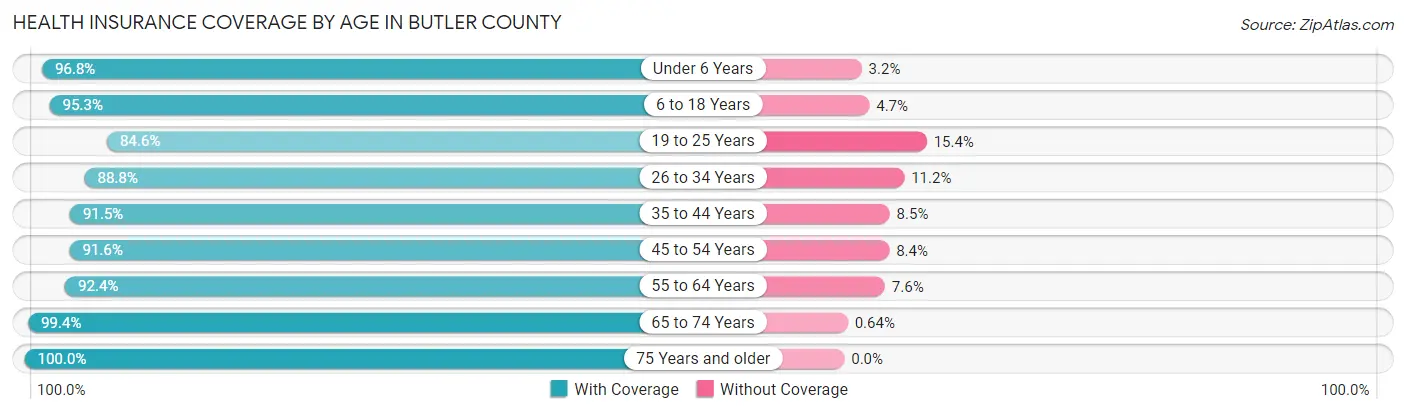
| Age Bracket | With Coverage | Without Coverage |
| Under 6 Years | 4,533 (96.8%) | 152 (3.2%) |
| 6 to 18 Years | 12,487 (95.3%) | 611 (4.7%) |
| 19 to 25 Years | 4,701 (84.6%) | 854 (15.4%) |
| 26 to 34 Years | 5,718 (88.8%) | 720 (11.2%) |
| 35 to 44 Years | 7,427 (91.5%) | 686 (8.5%) |
| 45 to 54 Years | 7,301 (91.6%) | 668 (8.4%) |
| 55 to 64 Years | 8,050 (92.4%) | 659 (7.6%) |
| 65 to 74 Years | 6,049 (99.4%) | 39 (0.6%) |
| 75 Years and older | 3,929 (100.0%) | 0 (0.0%) |
| Total | 60,195 (93.2%) | 4,389 (6.8%) |
Health Insurance Coverage by Citizenship Status in Butler County
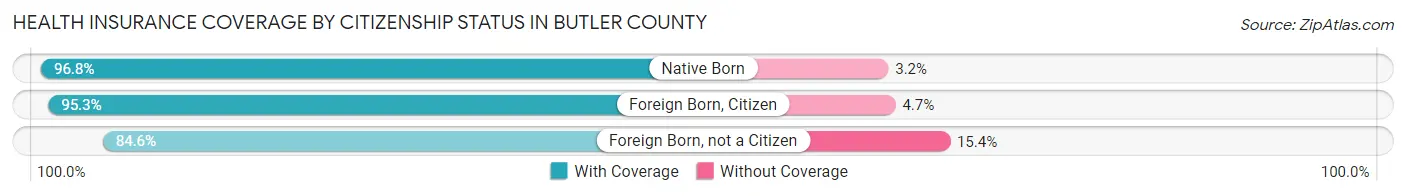
| Citizenship Status | With Coverage | Without Coverage |
| Native Born | 4,533 (96.8%) | 152 (3.2%) |
| Foreign Born, Citizen | 12,487 (95.3%) | 611 (4.7%) |
| Foreign Born, not a Citizen | 4,701 (84.6%) | 854 (15.4%) |
Health Insurance Coverage by Household Income in Butler County
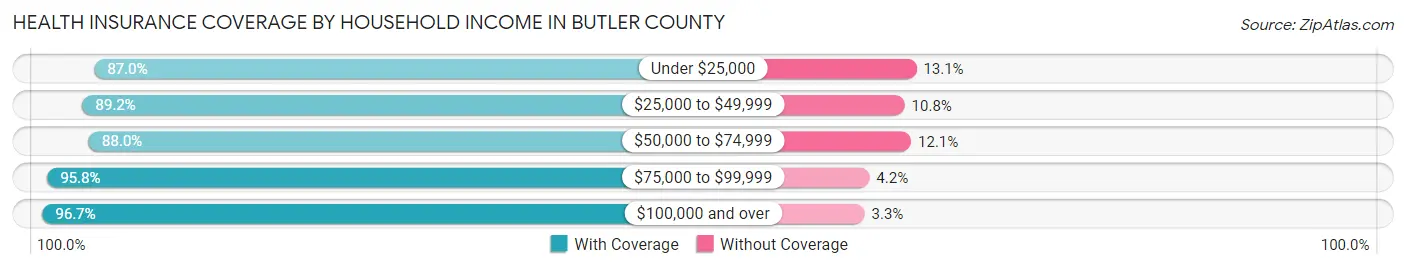
| Household Income | With Coverage | Without Coverage |
| Under $25,000 | 4,470 (87.0%) | 671 (13.1%) |
| $25,000 to $49,999 | 7,728 (89.2%) | 940 (10.8%) |
| $50,000 to $74,999 | 9,151 (87.9%) | 1,254 (12.0%) |
| $75,000 to $99,999 | 10,688 (95.8%) | 473 (4.2%) |
| $100,000 and over | 27,753 (96.7%) | 957 (3.3%) |
Public vs Private Health Insurance Coverage by Age in Butler County
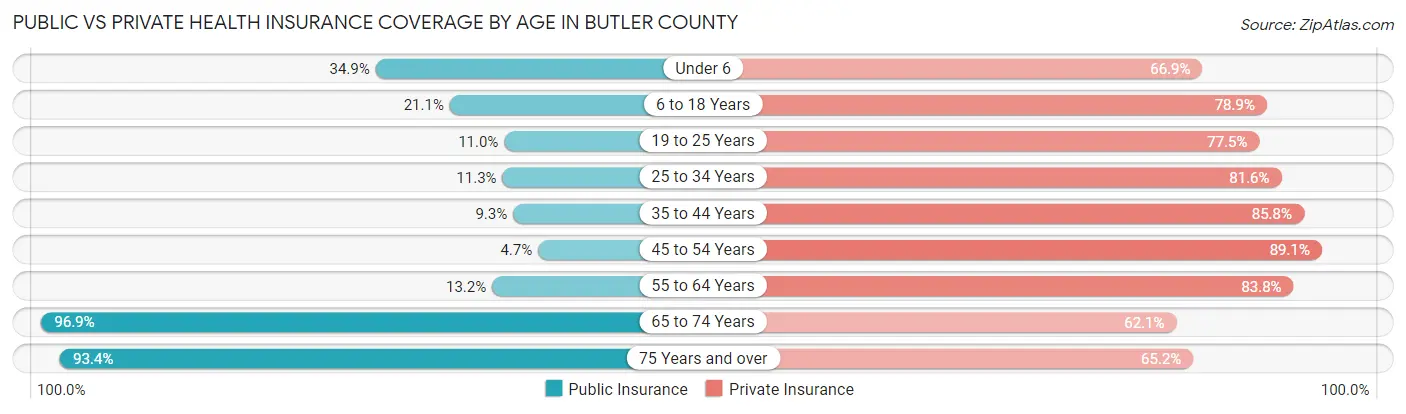
| Age Bracket | Public Insurance | Private Insurance |
| Under 6 | 1,633 (34.9%) | 3,135 (66.9%) |
| 6 to 18 Years | 2,763 (21.1%) | 10,330 (78.9%) |
| 19 to 25 Years | 610 (11.0%) | 4,304 (77.5%) |
| 25 to 34 Years | 728 (11.3%) | 5,252 (81.6%) |
| 35 to 44 Years | 757 (9.3%) | 6,957 (85.8%) |
| 45 to 54 Years | 374 (4.7%) | 7,099 (89.1%) |
| 55 to 64 Years | 1,152 (13.2%) | 7,301 (83.8%) |
| 65 to 74 Years | 5,898 (96.9%) | 3,780 (62.1%) |
| 75 Years and over | 3,670 (93.4%) | 2,562 (65.2%) |
| Total | 17,585 (27.2%) | 50,720 (78.5%) |
Disability Status by Sex by Age in Butler County
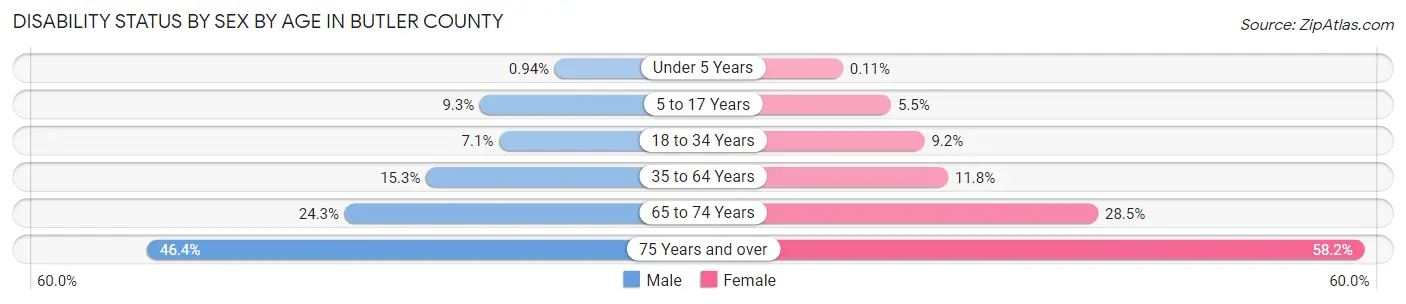
| Age Bracket | Male | Female |
| Under 5 Years | 19 (0.9%) | 2 (0.1%) |
| 5 to 17 Years | 609 (9.3%) | 354 (5.5%) |
| 18 to 34 Years | 451 (7.1%) | 605 (9.2%) |
| 35 to 64 Years | 1,888 (15.3%) | 1,470 (11.8%) |
| 65 to 74 Years | 721 (24.3%) | 892 (28.5%) |
| 75 Years and over | 764 (46.4%) | 1,328 (58.2%) |
Disability Class by Sex by Age in Butler County
Disability Class: Hearing Difficulty
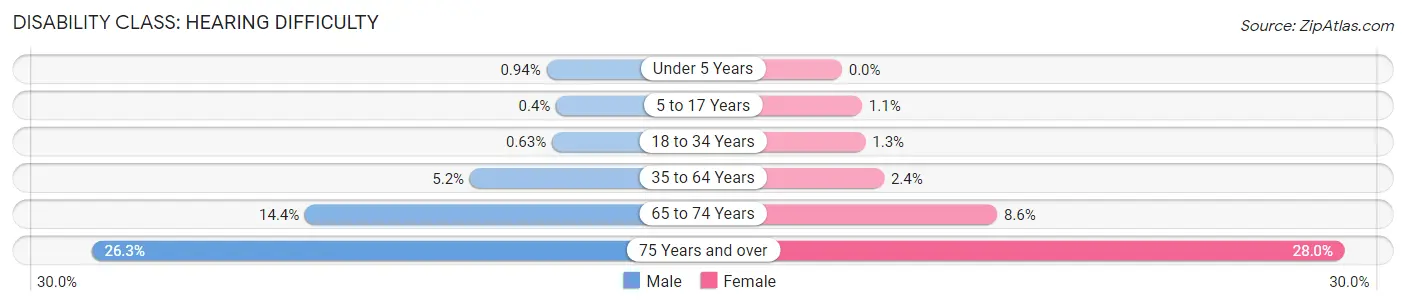
| Age Bracket | Male | Female |
| Under 5 Years | 19 (0.9%) | 0 (0.0%) |
| 5 to 17 Years | 26 (0.4%) | 72 (1.1%) |
| 18 to 34 Years | 40 (0.6%) | 86 (1.3%) |
| 35 to 64 Years | 643 (5.2%) | 292 (2.4%) |
| 65 to 74 Years | 426 (14.4%) | 270 (8.6%) |
| 75 Years and over | 433 (26.3%) | 639 (28.0%) |
Disability Class: Vision Difficulty
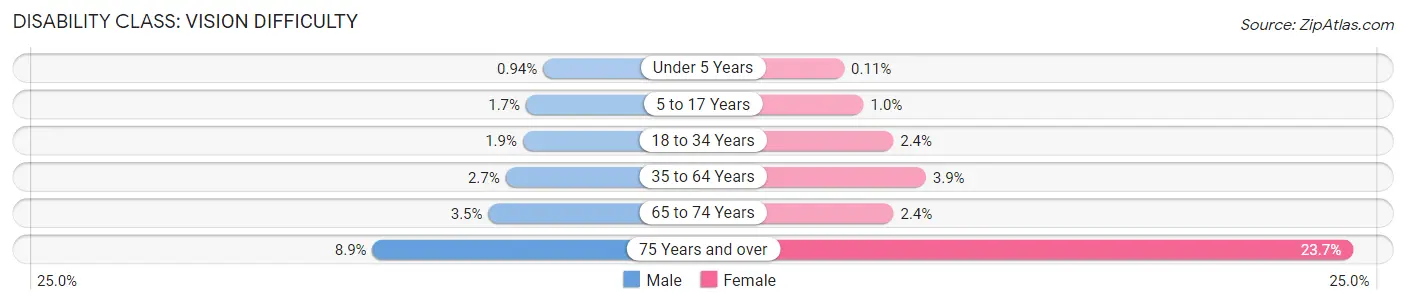
| Age Bracket | Male | Female |
| Under 5 Years | 19 (0.9%) | 2 (0.1%) |
| 5 to 17 Years | 114 (1.7%) | 65 (1.0%) |
| 18 to 34 Years | 119 (1.9%) | 157 (2.4%) |
| 35 to 64 Years | 331 (2.7%) | 485 (3.9%) |
| 65 to 74 Years | 103 (3.5%) | 75 (2.4%) |
| 75 Years and over | 146 (8.9%) | 541 (23.7%) |
Disability Class: Cognitive Difficulty
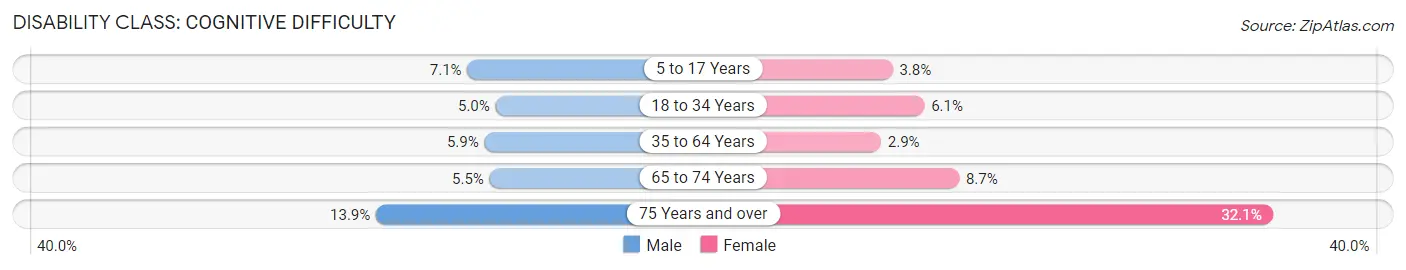
| Age Bracket | Male | Female |
| 5 to 17 Years | 467 (7.1%) | 243 (3.8%) |
| 18 to 34 Years | 318 (5.0%) | 402 (6.1%) |
| 35 to 64 Years | 723 (5.9%) | 360 (2.9%) |
| 65 to 74 Years | 162 (5.5%) | 272 (8.7%) |
| 75 Years and over | 229 (13.9%) | 731 (32.1%) |
Disability Class: Ambulatory Difficulty
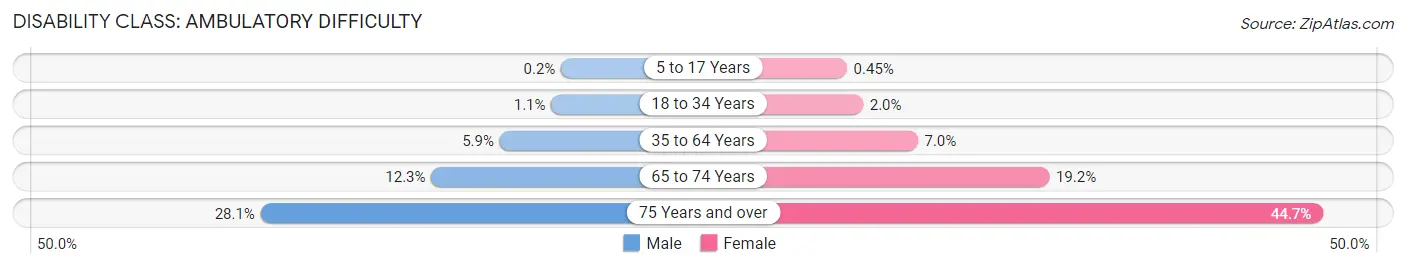
| Age Bracket | Male | Female |
| 5 to 17 Years | 13 (0.2%) | 29 (0.4%) |
| 18 to 34 Years | 70 (1.1%) | 128 (1.9%) |
| 35 to 64 Years | 730 (5.9%) | 873 (7.0%) |
| 65 to 74 Years | 363 (12.2%) | 601 (19.2%) |
| 75 Years and over | 463 (28.1%) | 1,019 (44.7%) |
Disability Class: Self-Care Difficulty
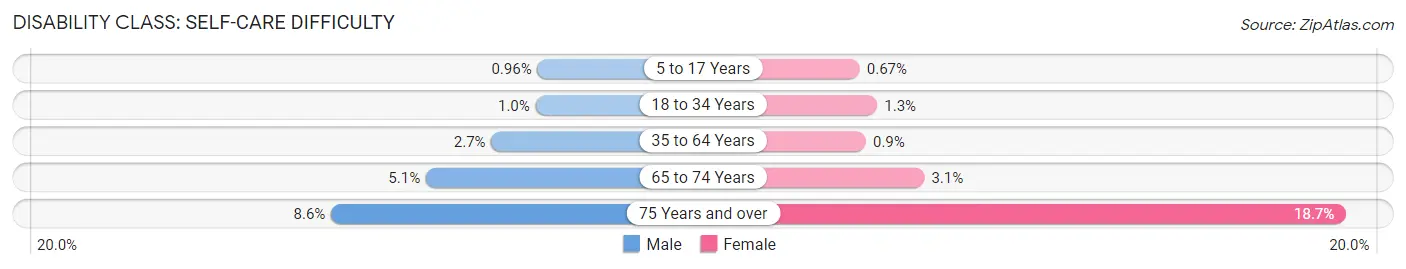
| Age Bracket | Male | Female |
| 5 to 17 Years | 63 (1.0%) | 43 (0.7%) |
| 18 to 34 Years | 65 (1.0%) | 87 (1.3%) |
| 35 to 64 Years | 330 (2.7%) | 112 (0.9%) |
| 65 to 74 Years | 151 (5.1%) | 96 (3.1%) |
| 75 Years and over | 142 (8.6%) | 427 (18.7%) |
Technology Access in Butler County
Computing Device Access in Butler County
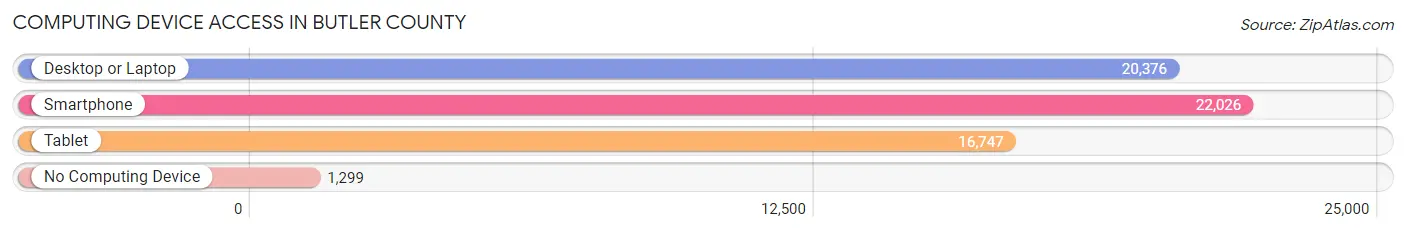
| Device Type | # Households | % Households |
| Desktop or Laptop | 20,376 | 82.3% |
| Smartphone | 22,026 | 89.0% |
| Tablet | 16,747 | 67.6% |
| No Computing Device | 1,299 | 5.2% |
| Total | 24,760 | 100.0% |
Internet Access in Butler County
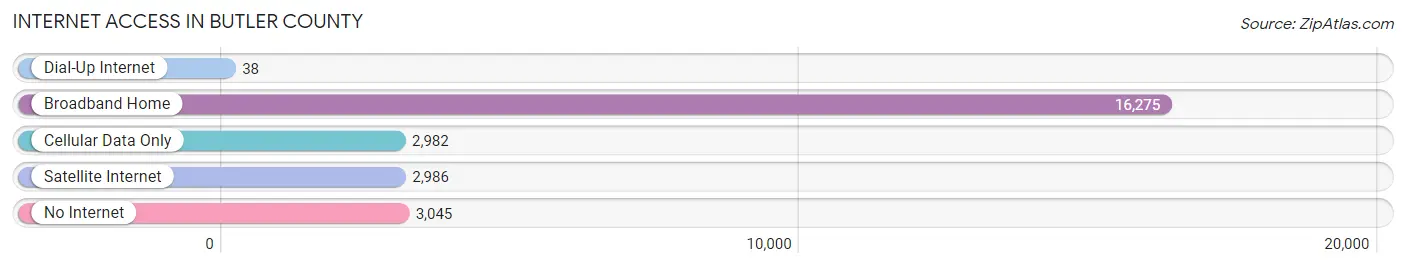
| Internet Type | # Households | % Households |
| Dial-Up Internet | 38 | 0.2% |
| Broadband Home | 16,275 | 65.7% |
| Cellular Data Only | 2,982 | 12.0% |
| Satellite Internet | 2,986 | 12.1% |
| No Internet | 3,045 | 12.3% |
| Total | 24,760 | 100.0% |
Butler County Summary
Butler County, Kansas is located in the south-central part of the state and is part of the Wichita metropolitan area. It is bordered by Cowley County to the north, Sedgwick County to the east, Sumner County to the south, and Harper County to the west. The county seat is El Dorado, and the largest city is Augusta.
History
Butler County was established in 1855 and named after Andrew Pickens Butler, a U.S. Senator from South Carolina. The county was originally part of the Osage Indian Reservation, and the first settlers arrived in the area in the late 1850s. The county was organized in 1867, and the first courthouse was built in El Dorado in 1868.
The county experienced rapid growth in the late 19th and early 20th centuries, due to the discovery of oil and natural gas in the area. The oil and gas industry continues to be an important part of the local economy.
Geography
Butler County covers an area of 845 square miles and is located in the Flint Hills region of Kansas. The county is mostly flat, with some rolling hills in the northern and western parts. The Walnut River runs through the county, and there are several small lakes and ponds.
The climate is semi-arid, with hot summers and cold winters. The average annual precipitation is about 28 inches.
Economy
Butler County’s economy is largely based on agriculture and oil and gas production. The county is home to several large farms, and the main crops are wheat, corn, soybeans, and sorghum.
The oil and gas industry is also an important part of the local economy. There are several oil and gas wells in the county, and the industry provides jobs for many local residents.
Demographics
As of the 2010 census, the population of Butler County was 65,880. The population has grown steadily since the 2000 census, when it was 58,945.
The racial makeup of the county is 92.3% White, 2.7% Hispanic or Latino, 1.7% African American, 1.2% Native American, 0.5% Asian, and 1.6% from other races.
The median household income in the county is $50,845, and the median family income is $60,945. The per capita income is $25,845. The unemployment rate is 4.2%.
Conclusion
Butler County, Kansas is a rural county located in the south-central part of the state. It is bordered by Cowley County to the north, Sedgwick County to the east, Sumner County to the south, and Harper County to the west. The county seat is El Dorado, and the largest city is Augusta. The economy is largely based on agriculture and oil and gas production, and the population is growing steadily.
Common Questions
What is the Total Population of Butler County?
Total Population of Butler County is 67,618.
What is the Total Male Population of Butler County?
Total Male Population of Butler County is 34,400.
What is the Total Female Population of Butler County?
Total Female Population of Butler County is 33,218.
What is the Ratio of Males per 100 Females in Butler County?
There are 103.56 Males per 100 Females in Butler County.
What is the Ratio of Females per 100 Males in Butler County?
There are 96.56 Females per 100 Males in Butler County.
What is the Median Population Age in Butler County?
Median Population Age in Butler County is 38.2 Years.
What is the Average Family Size in Butler County
Average Family Size in Butler County is 3.1 People.
What is the Average Household Size in Butler County
Average Household Size in Butler County is 2.6 People.
What is Per Capita Income in Butler County?
Per Capita income in Butler County is $35,209.
What is the Median Family Income in Butler County?
Median Family Income in Butler County is $94,028.
What is the Median Household income in Butler County?
Median Household Income in Butler County is $77,724.
What is Income or Wage Gap in Butler County?
Income or Wage Gap in Butler County is 35.8%.
Women in Butler County earn 64.2 cents for every dollar earned by a man.
What is Family Income Deficit in Butler County?
Family Income Deficit in Butler County is $11,809.
Families that are below poverty line in Butler County earn $11,809 less on average than the poverty threshold level.
What is Inequality or Gini Index in Butler County?
Inequality or Gini Index in Butler County is 0.40.
How Large is the Labor Force in Butler County?
There are 33,091 People in the Labor Forcein in Butler County.
What is the Percentage of People in the Labor Force in Butler County?
62.8% of People are in the Labor Force in Butler County.
What is the Unemployment Rate in Butler County?
Unemployment Rate in Butler County is 3.1%.