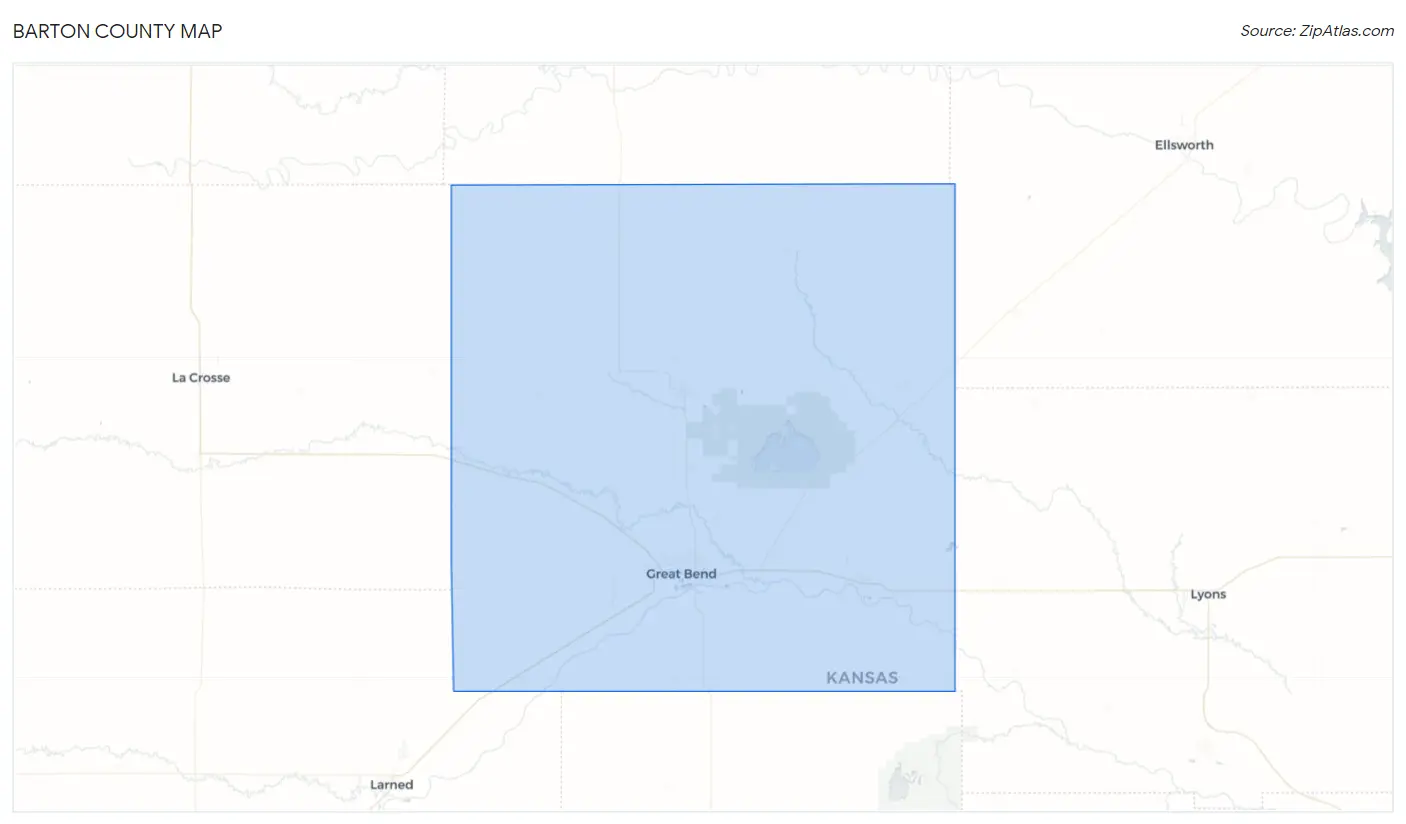
Barton County, KS
Barton County Map
Barton County Overview
25,477
TOTAL POPULATION
12,548
MALE POPULATION
12,929
FEMALE POPULATION
97.05
MALES / 100 FEMALES
103.04
FEMALES / 100 MALES
39.2
MEDIAN AGE
3.1
AVG FAMILY SIZE
2.5
AVG HOUSEHOLD SIZE
$31,516
PER CAPITA INCOME
$72,172
AVG FAMILY INCOME
$54,634
AVG HOUSEHOLD INCOME
33.1%
WAGE / INCOME GAP [ % ]
66.9¢/ $1
WAGE / INCOME GAP [ $ ]
$11,616
FAMILY INCOME DEFICIT
0.43
INEQUALITY / GINI INDEX
12,945
LABOR FORCE [ PEOPLE ]
64.4%
PERCENT IN LABOR FORCE
4.1%
UNEMPLOYMENT RATE
Barton County Area Codes
Race in Barton County
The most populous races in Barton County are White / Caucasian (21,931 | 86.1%), Hispanic or Latino (4,054 | 15.9%), and Two or more Races (2,413 | 9.5%).
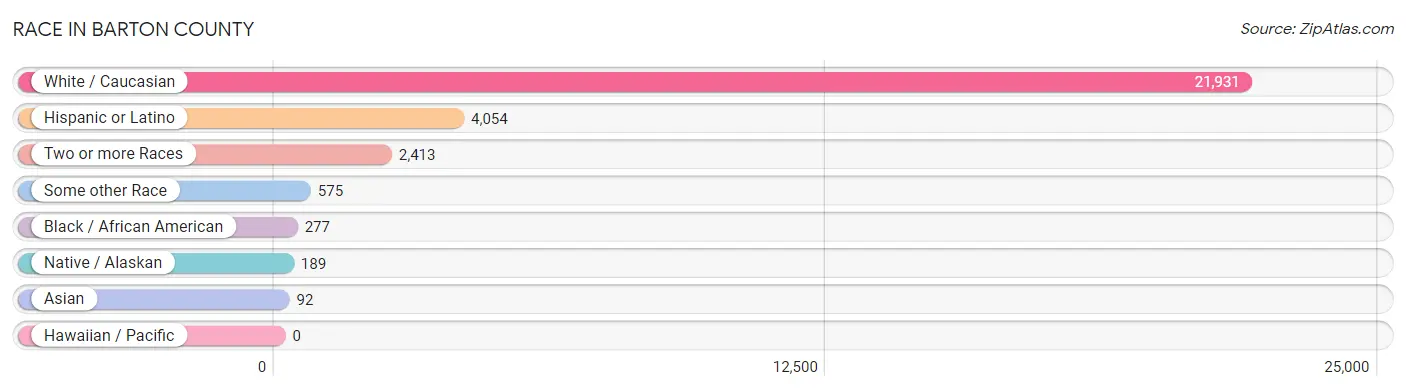
| Race | # Population | % Population |
| Asian | 92 | 0.4% |
| Black / African American | 277 | 1.1% |
| Hawaiian / Pacific | 0 | 0.0% |
| Hispanic or Latino | 4,054 | 15.9% |
| Native / Alaskan | 189 | 0.7% |
| White / Caucasian | 21,931 | 86.1% |
| Two or more Races | 2,413 | 9.5% |
| Some other Race | 575 | 2.3% |
| Total | 25,477 | 100.0% |
Ancestry in Barton County
The most populous ancestries reported in Barton County are German (7,883 | 30.9%), Mexican (3,790 | 14.9%), English (2,501 | 9.8%), Irish (2,027 | 8.0%), and American (901 | 3.5%), together accounting for 67.1% of all Barton County residents.
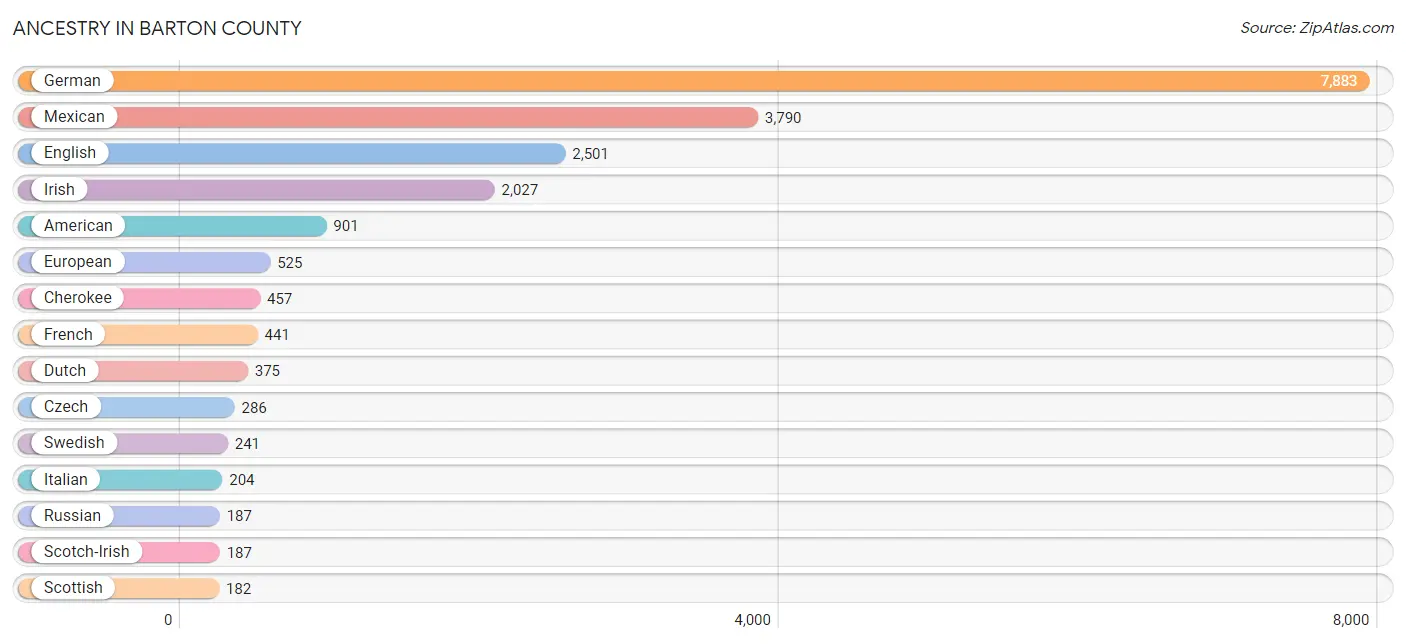
| Ancestry | # Population | % Population |
| African | 1 | 0.0% |
| American | 901 | 3.5% |
| Arab | 31 | 0.1% |
| Armenian | 1 | 0.0% |
| Austrian | 137 | 0.5% |
| Belgian | 6 | 0.0% |
| Bhutanese | 4 | 0.0% |
| Blackfeet | 8 | 0.0% |
| British | 165 | 0.6% |
| Burmese | 51 | 0.2% |
| Cambodian | 17 | 0.1% |
| Canadian | 84 | 0.3% |
| Cherokee | 457 | 1.8% |
| Chickasaw | 15 | 0.1% |
| Choctaw | 10 | 0.0% |
| Cuban | 2 | 0.0% |
| Czech | 286 | 1.1% |
| Czechoslovakian | 23 | 0.1% |
| Danish | 86 | 0.3% |
| Dutch | 375 | 1.5% |
| Eastern European | 12 | 0.1% |
| English | 2,501 | 9.8% |
| European | 525 | 2.1% |
| Finnish | 77 | 0.3% |
| French | 441 | 1.7% |
| French Canadian | 36 | 0.1% |
| German | 7,883 | 30.9% |
| German Russian | 141 | 0.5% |
| Greek | 14 | 0.1% |
| Hungarian | 23 | 0.1% |
| Indian (Asian) | 16 | 0.1% |
| Irish | 2,027 | 8.0% |
| Italian | 204 | 0.8% |
| Lebanese | 28 | 0.1% |
| Lithuanian | 41 | 0.2% |
| Malaysian | 1 | 0.0% |
| Mexican | 3,790 | 14.9% |
| Mexican American Indian | 6 | 0.0% |
| Native Hawaiian | 6 | 0.0% |
| Navajo | 18 | 0.1% |
| Nigerian | 11 | 0.0% |
| Northern European | 17 | 0.1% |
| Norwegian | 96 | 0.4% |
| Osage | 8 | 0.0% |
| Pennsylvania German | 70 | 0.3% |
| Polish | 135 | 0.5% |
| Portuguese | 39 | 0.2% |
| Potawatomi | 4 | 0.0% |
| Puerto Rican | 25 | 0.1% |
| Russian | 187 | 0.7% |
| Scandinavian | 36 | 0.1% |
| Scotch-Irish | 187 | 0.7% |
| Scottish | 182 | 0.7% |
| Sioux | 53 | 0.2% |
| Slovak | 14 | 0.1% |
| Slovene | 5 | 0.0% |
| Spaniard | 46 | 0.2% |
| Spanish | 15 | 0.1% |
| Subsaharan African | 12 | 0.1% |
| Swedish | 241 | 0.9% |
| Swiss | 68 | 0.3% |
| Syrian | 3 | 0.0% |
| Thai | 21 | 0.1% |
| Tlingit-Haida | 42 | 0.2% |
| Tsimshian | 42 | 0.2% |
| Welsh | 139 | 0.5% | View All 66 Rows |
Immigrants in Barton County
The most numerous immigrant groups reported in Barton County came from Latin America (954 | 3.7%), Central America (861 | 3.4%), Mexico (861 | 3.4%), South America (93 | 0.4%), and Brazil (71 | 0.3%), together accounting for 11.1% of all Barton County residents.
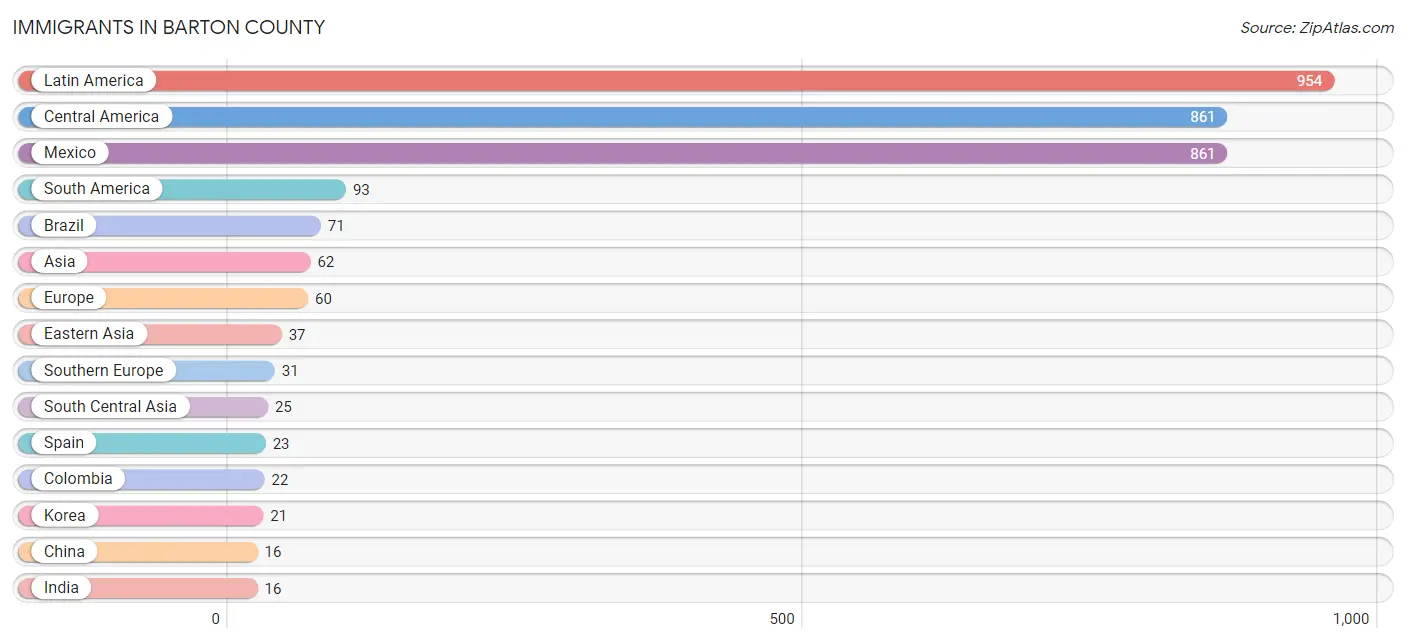
| Immigration Origin | # Population | % Population |
| Africa | 11 | 0.0% |
| Asia | 62 | 0.2% |
| Australia | 6 | 0.0% |
| Brazil | 71 | 0.3% |
| Canada | 10 | 0.0% |
| Central America | 861 | 3.4% |
| China | 16 | 0.1% |
| Colombia | 22 | 0.1% |
| Eastern Asia | 37 | 0.2% |
| Europe | 60 | 0.2% |
| Germany | 14 | 0.1% |
| India | 16 | 0.1% |
| Ireland | 15 | 0.1% |
| Italy | 8 | 0.0% |
| Korea | 21 | 0.1% |
| Latin America | 954 | 3.7% |
| Mexico | 861 | 3.4% |
| Nigeria | 11 | 0.0% |
| Northern Europe | 15 | 0.1% |
| Oceania | 11 | 0.0% |
| Pakistan | 9 | 0.0% |
| South America | 93 | 0.4% |
| South Central Asia | 25 | 0.1% |
| Southern Europe | 31 | 0.1% |
| Spain | 23 | 0.1% |
| Western Africa | 11 | 0.0% |
| Western Europe | 14 | 0.1% | View All 27 Rows |
Sex and Age in Barton County
Sex and Age in Barton County
The most populous age groups in Barton County are 60 to 64 Years (1,010 | 8.1%) for men and 30 to 34 Years (971 | 7.5%) for women.
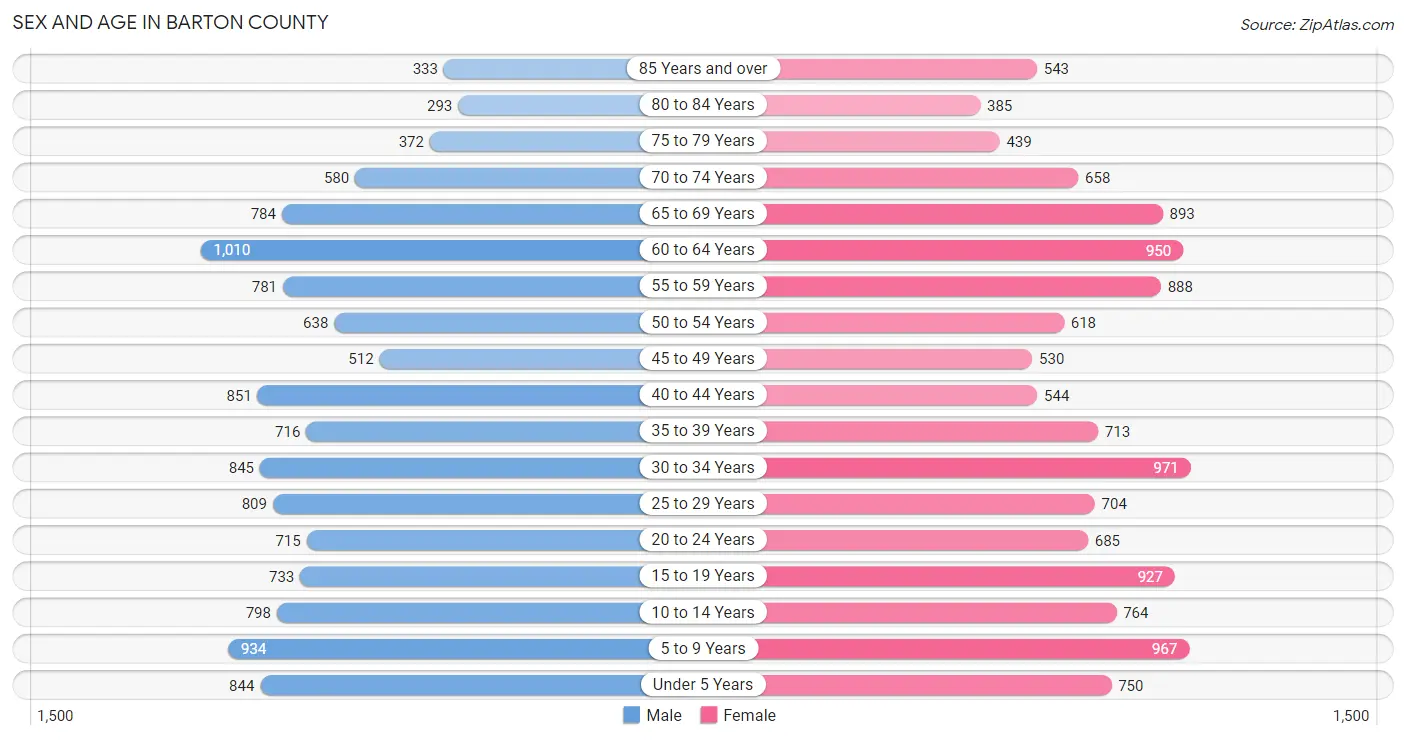
| Age Bracket | Male | Female |
| Under 5 Years | 844 (6.7%) | 750 (5.8%) |
| 5 to 9 Years | 934 (7.4%) | 967 (7.5%) |
| 10 to 14 Years | 798 (6.4%) | 764 (5.9%) |
| 15 to 19 Years | 733 (5.8%) | 927 (7.2%) |
| 20 to 24 Years | 715 (5.7%) | 685 (5.3%) |
| 25 to 29 Years | 809 (6.5%) | 704 (5.4%) |
| 30 to 34 Years | 845 (6.7%) | 971 (7.5%) |
| 35 to 39 Years | 716 (5.7%) | 713 (5.5%) |
| 40 to 44 Years | 851 (6.8%) | 544 (4.2%) |
| 45 to 49 Years | 512 (4.1%) | 530 (4.1%) |
| 50 to 54 Years | 638 (5.1%) | 618 (4.8%) |
| 55 to 59 Years | 781 (6.2%) | 888 (6.9%) |
| 60 to 64 Years | 1,010 (8.1%) | 950 (7.3%) |
| 65 to 69 Years | 784 (6.2%) | 893 (6.9%) |
| 70 to 74 Years | 580 (4.6%) | 658 (5.1%) |
| 75 to 79 Years | 372 (3.0%) | 439 (3.4%) |
| 80 to 84 Years | 293 (2.3%) | 385 (3.0%) |
| 85 Years and over | 333 (2.6%) | 543 (4.2%) |
| Total | 12,548 (100.0%) | 12,929 (100.0%) |
Families and Households in Barton County
Median Family Size in Barton County
The median family size in Barton County is 3.10 persons per family, with single female/mother families (976 | 15.4%) accounting for the largest median family size of 3.49 persons per family. On the other hand, single male/father families (525 | 8.3%) represent the smallest median family size with 2.78 persons per family.
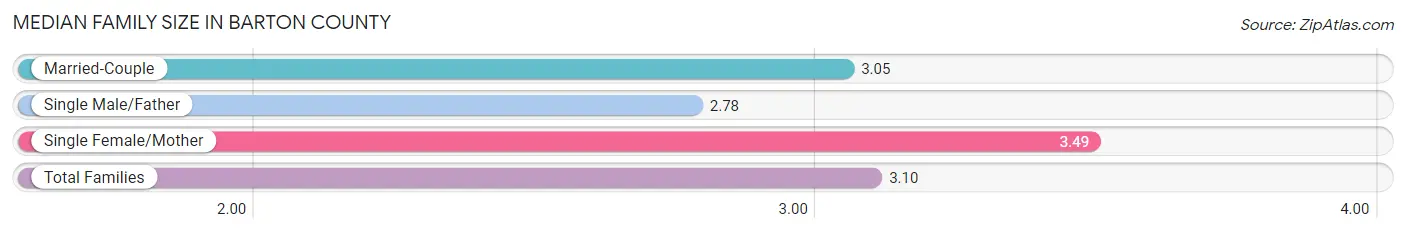
| Family Type | # Families | Family Size |
| Married-Couple | 4,828 (76.3%) | 3.05 |
| Single Male/Father | 525 (8.3%) | 2.78 |
| Single Female/Mother | 976 (15.4%) | 3.49 |
| Total Families | 6,329 (100.0%) | 3.10 |
Median Household Size in Barton County
The median household size in Barton County is 2.48 persons per household, with single female/mother households (976 | 9.7%) accounting for the largest median household size of 4.05 persons per household. non-family households (3,726 | 37.1%) represent the smallest median household size with 1.18 persons per household.
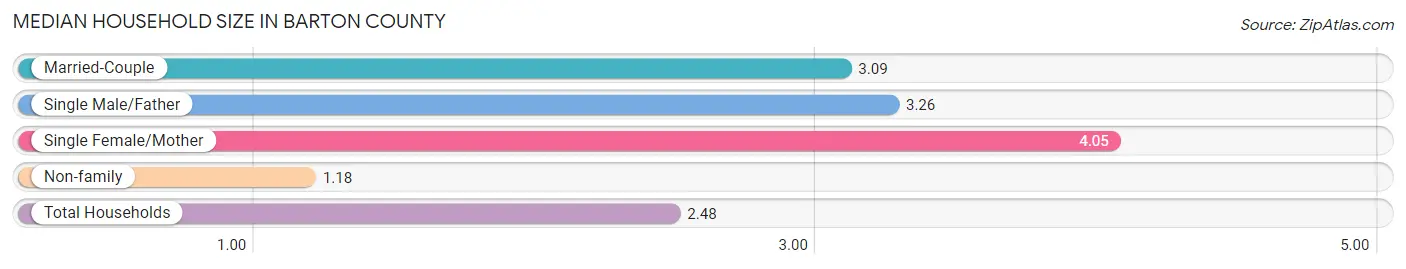
| Household Type | # Households | Household Size |
| Married-Couple | 4,828 (48.0%) | 3.09 |
| Single Male/Father | 525 (5.2%) | 3.26 |
| Single Female/Mother | 976 (9.7%) | 4.05 |
| Non-family | 3,726 (37.1%) | 1.18 |
| Total Households | 10,055 (100.0%) | 2.48 |
Household Size by Marriage Status in Barton County
Out of a total of 10,055 households in Barton County, 6,329 (62.9%) are family households, while 3,726 (37.1%) are nonfamily households. The most numerous type of family households are 2-person households, comprising 3,465, and the most common type of nonfamily households are 1-person households, comprising 3,322.
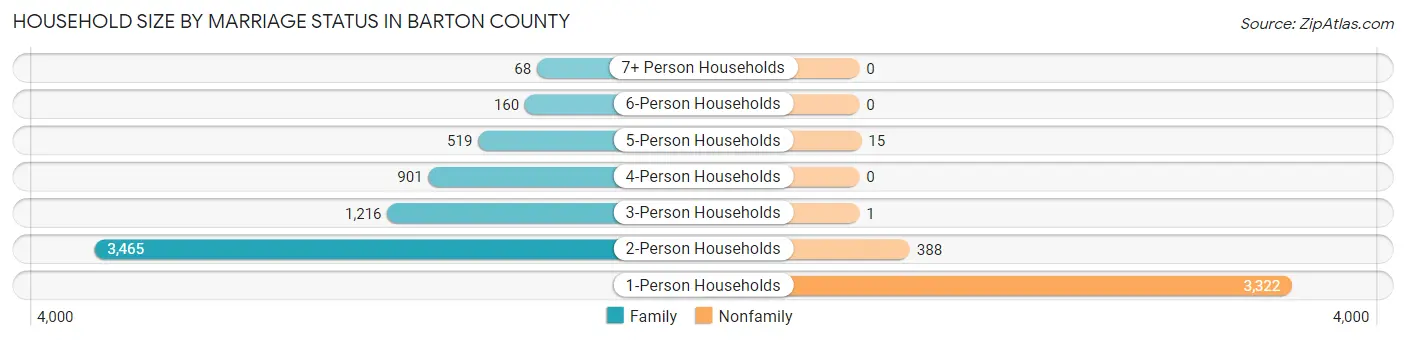
| Household Size | Family Households | Nonfamily Households |
| 1-Person Households | - | 3,322 (33.0%) |
| 2-Person Households | 3,465 (34.5%) | 388 (3.9%) |
| 3-Person Households | 1,216 (12.1%) | 1 (0.0%) |
| 4-Person Households | 901 (9.0%) | 0 (0.0%) |
| 5-Person Households | 519 (5.2%) | 15 (0.2%) |
| 6-Person Households | 160 (1.6%) | 0 (0.0%) |
| 7+ Person Households | 68 (0.7%) | 0 (0.0%) |
| Total | 6,329 (62.9%) | 3,726 (37.1%) |
Female Fertility in Barton County
Fertility by Age in Barton County
Average fertility rate in Barton County is 74.0 births per 1,000 women. Women in the age bracket of 20 to 34 years have the highest fertility rate with 133.0 births per 1,000 women. Women in the age bracket of 20 to 34 years acount for 81.6% of all women with births.
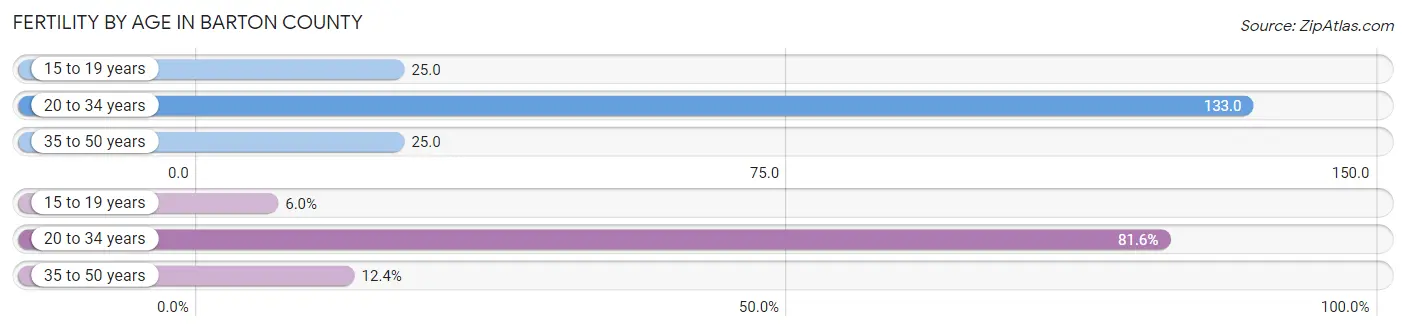
| Age Bracket | Women with Births | Births / 1,000 Women |
| 15 to 19 years | 23 (6.0%) | 25.0 |
| 20 to 34 years | 315 (81.6%) | 133.0 |
| 35 to 50 years | 48 (12.4%) | 25.0 |
| Total | 386 (100.0%) | 74.0 |
Fertility by Age by Marriage Status in Barton County
75.4% of women with births (386) in Barton County are married. The highest percentage of unmarried women with births falls into 15 to 19 years age bracket with 100.0% of them unmarried at the time of birth, while the lowest percentage of unmarried women with births belong to 20 to 34 years age bracket with 17.5% of them unmarried.
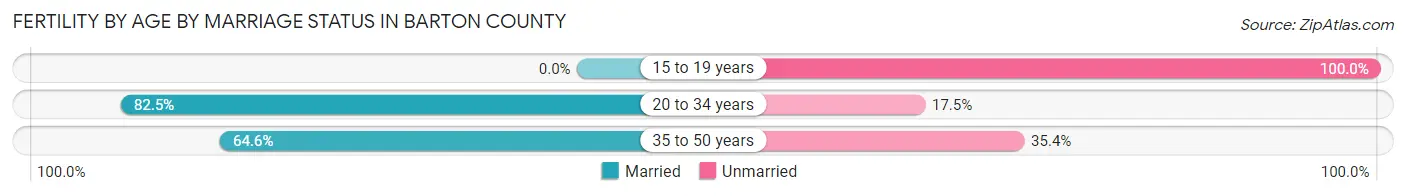
| Age Bracket | Married | Unmarried |
| 15 to 19 years | 0 (0.0%) | 23 (100.0%) |
| 20 to 34 years | 260 (82.5%) | 55 (17.5%) |
| 35 to 50 years | 31 (64.6%) | 17 (35.4%) |
| Total | 291 (75.4%) | 95 (24.6%) |
Fertility by Education in Barton County
Average fertility rate in Barton County is 74.0 births per 1,000 women. Women with the education attainment of graduate degree have the highest fertility rate of 249.0 births per 1,000 women, while women with the education attainment of less than high school have the lowest fertility at 37.0 births per 1,000 women. Women with the education attainment of high school diploma represent 35.0% of all women with births.
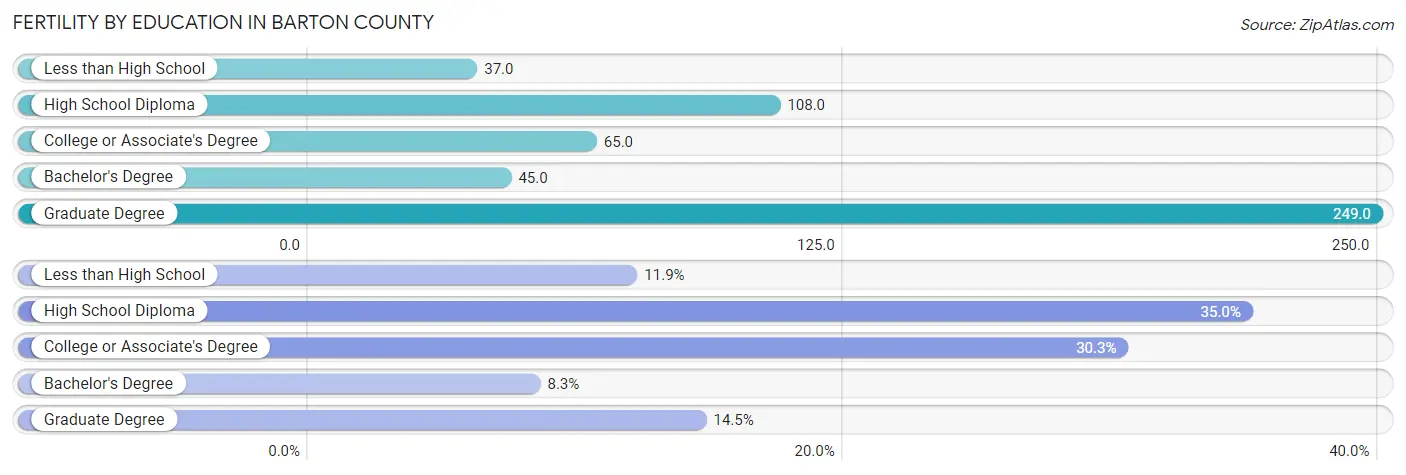
| Educational Attainment | Women with Births | Births / 1,000 Women |
| Less than High School | 46 (11.9%) | 37.0 |
| High School Diploma | 135 (35.0%) | 108.0 |
| College or Associate's Degree | 117 (30.3%) | 65.0 |
| Bachelor's Degree | 32 (8.3%) | 45.0 |
| Graduate Degree | 56 (14.5%) | 249.0 |
| Total | 386 (100.0%) | 74.0 |
Fertility by Education by Marriage Status in Barton County
24.6% of women with births in Barton County are unmarried. Women with the educational attainment of bachelor's degree are most likely to be married with 100.0% of them married at childbirth, while women with the educational attainment of less than high school are least likely to be married with 89.1% of them unmarried at childbirth.
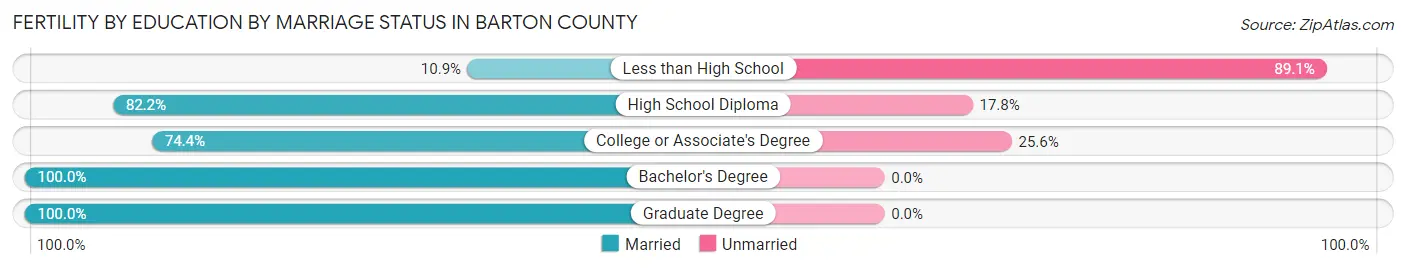
| Educational Attainment | Married | Unmarried |
| Less than High School | 5 (10.9%) | 41 (89.1%) |
| High School Diploma | 111 (82.2%) | 24 (17.8%) |
| College or Associate's Degree | 87 (74.4%) | 30 (25.6%) |
| Bachelor's Degree | 32 (100.0%) | 0 (0.0%) |
| Graduate Degree | 56 (100.0%) | 0 (0.0%) |
| Total | 291 (75.4%) | 95 (24.6%) |
Income in Barton County
Income Overview in Barton County
Per Capita Income in Barton County is $31,516, while median incomes of families and households are $72,172 and $54,634 respectively.
| Characteristic | Number | Measure |
| Per Capita Income | 25,477 | $31,516 |
| Median Family Income | 6,329 | $72,172 |
| Mean Family Income | 6,329 | $88,958 |
| Median Household Income | 10,055 | $54,634 |
| Mean Household Income | 10,055 | $72,632 |
| Income Deficit | 6,329 | $11,616 |
| Wage / Income Gap (%) | 25,477 | 33.08% |
| Wage / Income Gap ($) | 25,477 | 66.92¢ per $1 |
| Gini / Inequality Index | 25,477 | 0.43 |
Earnings by Sex in Barton County
Average Earnings in Barton County are $35,070, $41,969 for men and $28,086 for women, a difference of 33.1%.
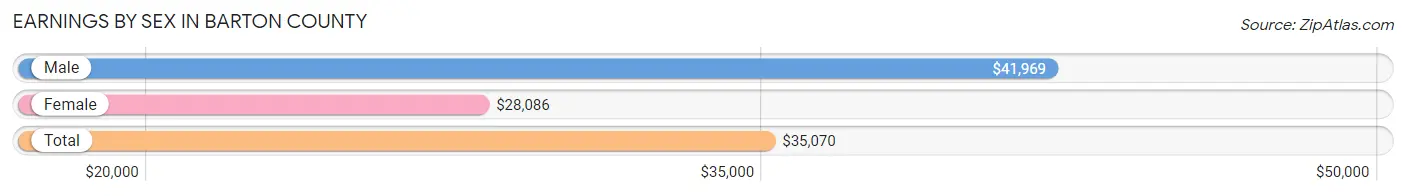
| Sex | Number | Average Earnings |
| Male | 7,051 (52.5%) | $41,969 |
| Female | 6,385 (47.5%) | $28,086 |
| Total | 13,436 (100.0%) | $35,070 |
Earnings by Sex by Income Bracket in Barton County
The most common earnings brackets in Barton County are $55,000 to $64,999 for men (872 | 12.4%) and $35,000 to $39,999 for women (505 | 7.9%).
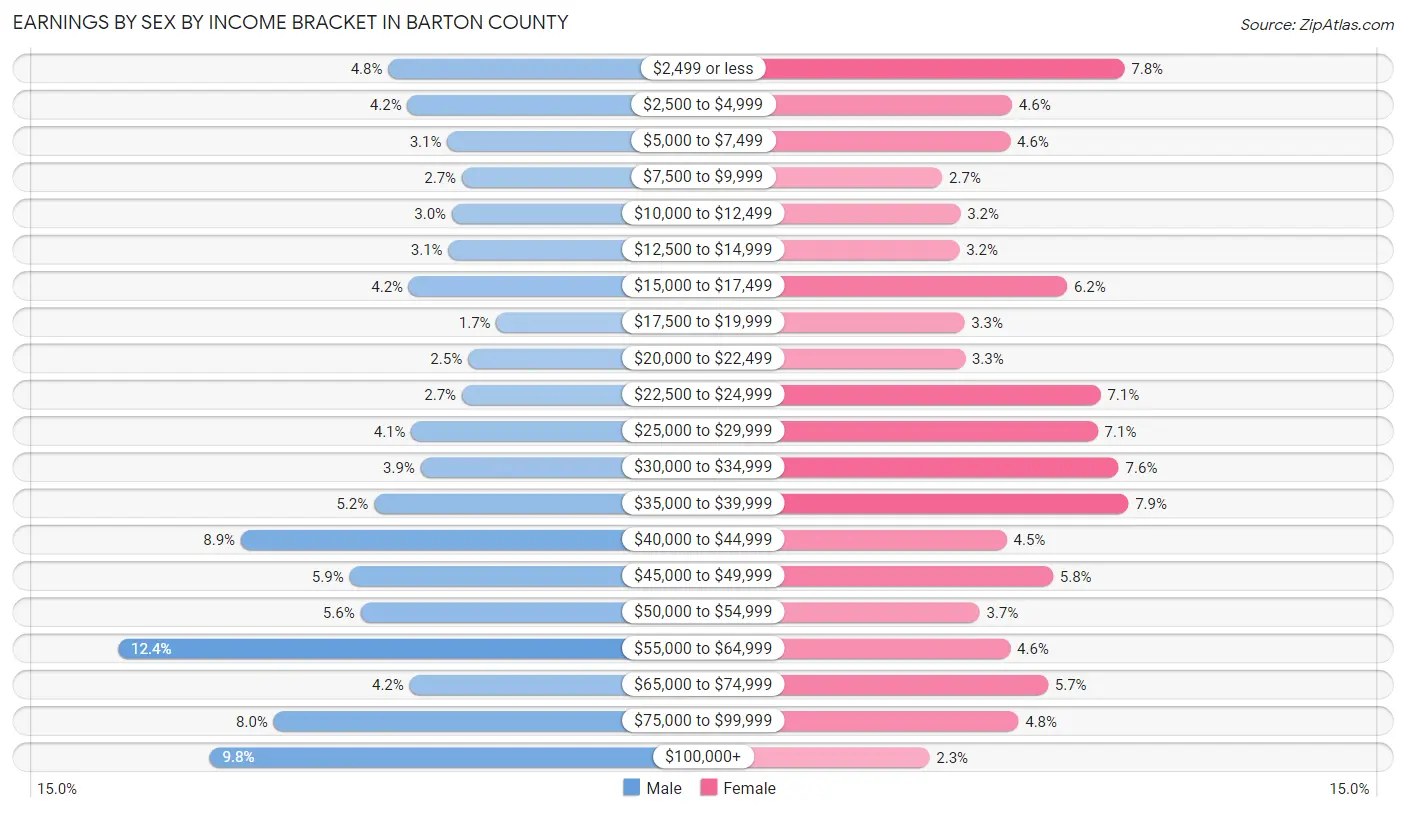
| Income | Male | Female |
| $2,499 or less | 337 (4.8%) | 498 (7.8%) |
| $2,500 to $4,999 | 299 (4.2%) | 296 (4.6%) |
| $5,000 to $7,499 | 220 (3.1%) | 293 (4.6%) |
| $7,500 to $9,999 | 191 (2.7%) | 171 (2.7%) |
| $10,000 to $12,499 | 211 (3.0%) | 204 (3.2%) |
| $12,500 to $14,999 | 218 (3.1%) | 202 (3.2%) |
| $15,000 to $17,499 | 296 (4.2%) | 395 (6.2%) |
| $17,500 to $19,999 | 123 (1.7%) | 211 (3.3%) |
| $20,000 to $22,499 | 179 (2.5%) | 212 (3.3%) |
| $22,500 to $24,999 | 191 (2.7%) | 455 (7.1%) |
| $25,000 to $29,999 | 291 (4.1%) | 450 (7.0%) |
| $30,000 to $34,999 | 273 (3.9%) | 488 (7.6%) |
| $35,000 to $39,999 | 365 (5.2%) | 505 (7.9%) |
| $40,000 to $44,999 | 629 (8.9%) | 287 (4.5%) |
| $45,000 to $49,999 | 414 (5.9%) | 370 (5.8%) |
| $50,000 to $54,999 | 392 (5.6%) | 238 (3.7%) |
| $55,000 to $64,999 | 872 (12.4%) | 293 (4.6%) |
| $65,000 to $74,999 | 295 (4.2%) | 361 (5.7%) |
| $75,000 to $99,999 | 564 (8.0%) | 308 (4.8%) |
| $100,000+ | 691 (9.8%) | 148 (2.3%) |
| Total | 7,051 (100.0%) | 6,385 (100.0%) |
Earnings by Sex by Educational Attainment in Barton County
Average earnings in Barton County are $46,276 for men and $32,605 for women, a difference of 29.5%. Men with an educational attainment of graduate degree enjoy the highest average annual earnings of $59,423, while those with high school diploma education earn the least with $41,888. Women with an educational attainment of graduate degree earn the most with the average annual earnings of $71,339, while those with less than high school education have the smallest earnings of $20,441.
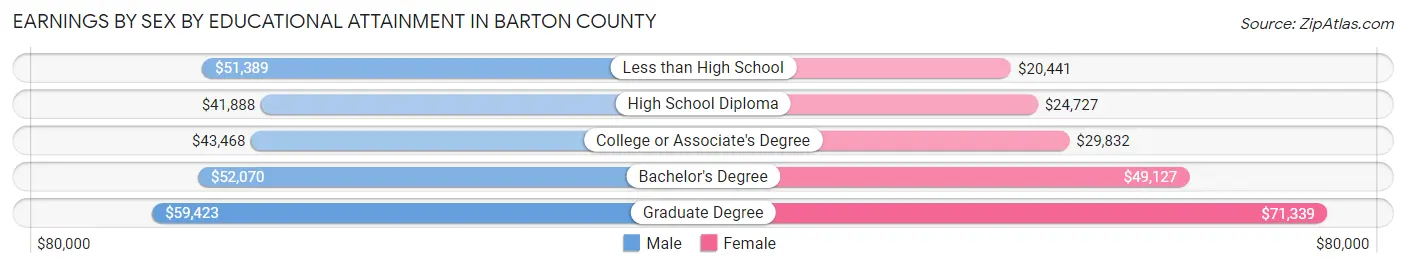
| Educational Attainment | Male Income | Female Income |
| Less than High School | $51,389 | $20,441 |
| High School Diploma | $41,888 | $24,727 |
| College or Associate's Degree | $43,468 | $29,832 |
| Bachelor's Degree | $52,070 | $49,127 |
| Graduate Degree | $59,423 | $71,339 |
| Total | $46,276 | $32,605 |
Family Income in Barton County
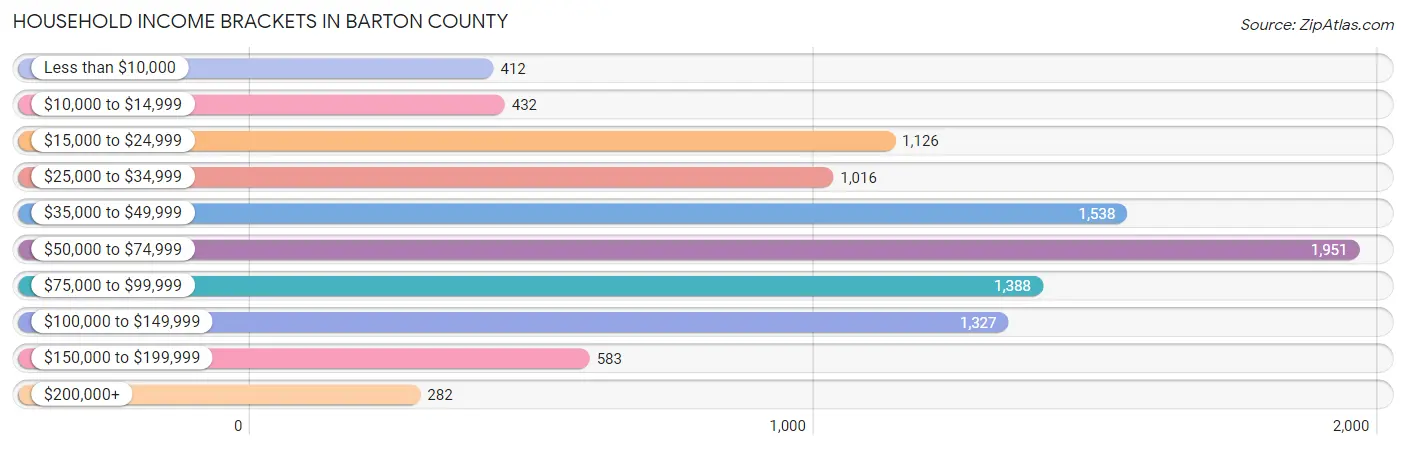
Family Income Brackets in Barton County
According to the Barton County family income data, there are 1,158 families falling into the $75,000 to $99,999 income range, which is the most common income bracket and makes up 18.3% of all families. Conversely, the $10,000 to $14,999 income bracket is the least frequent group with only 70 families (1.1%) belonging to this category.
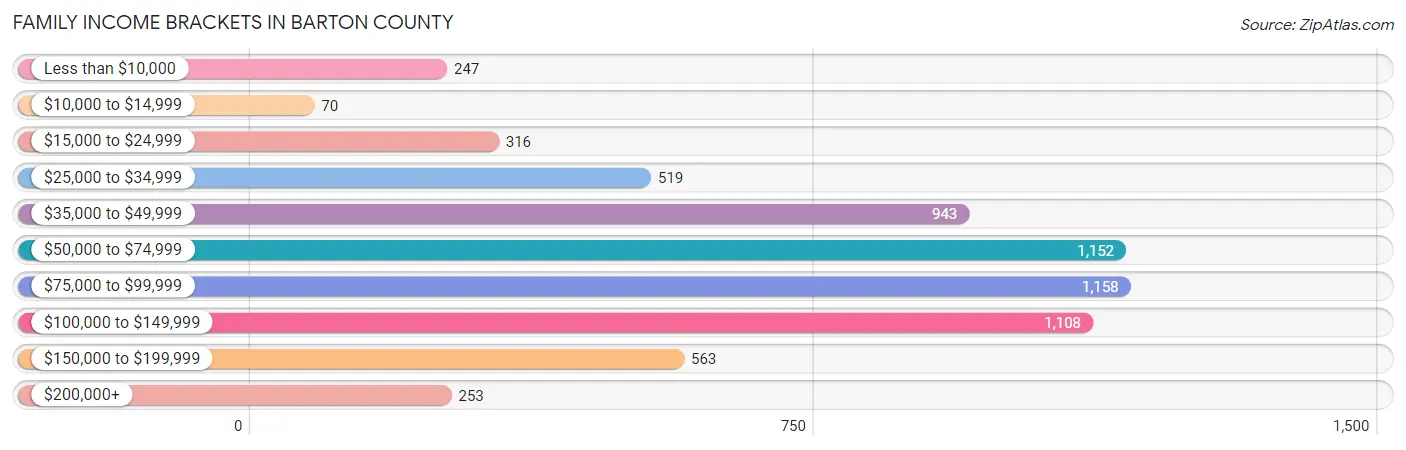
| Income Bracket | # Families | % Families |
| Less than $10,000 | 247 | 3.9% |
| $10,000 to $14,999 | 70 | 1.1% |
| $15,000 to $24,999 | 316 | 5.0% |
| $25,000 to $34,999 | 519 | 8.2% |
| $35,000 to $49,999 | 943 | 14.9% |
| $50,000 to $74,999 | 1,152 | 18.2% |
| $75,000 to $99,999 | 1,158 | 18.3% |
| $100,000 to $149,999 | 1,108 | 17.5% |
| $150,000 to $199,999 | 563 | 8.9% |
| $200,000+ | 253 | 4.0% |
Family Income by Famaliy Size in Barton County
5-person families (322 | 5.1%) account for the highest median family income in Barton County with $102,188 per family, while 2-person families (3,799 | 60.0%) have the highest median income of $33,924 per family member.
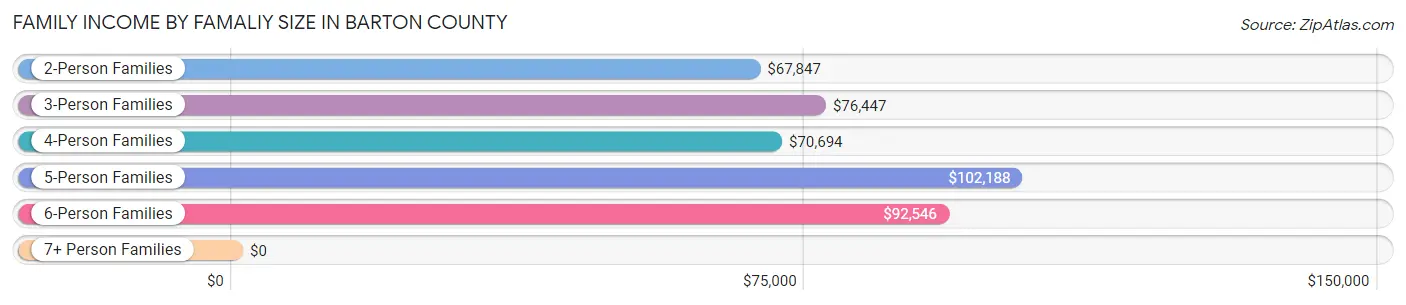
| Income Bracket | # Families | Median Income |
| 2-Person Families | 3,799 (60.0%) | $67,847 |
| 3-Person Families | 1,094 (17.3%) | $76,447 |
| 4-Person Families | 889 (14.1%) | $70,694 |
| 5-Person Families | 322 (5.1%) | $102,188 |
| 6-Person Families | 173 (2.7%) | $92,546 |
| 7+ Person Families | 52 (0.8%) | $0 |
| Total | 6,329 (100.0%) | $72,172 |
Family Income by Number of Earners in Barton County
The median family income in Barton County is $72,172, with families comprising 3+ earners (431) having the highest median family income of $123,750, while families with no earners (998) have the lowest median family income of $45,868, accounting for 6.8% and 15.8% of families, respectively.
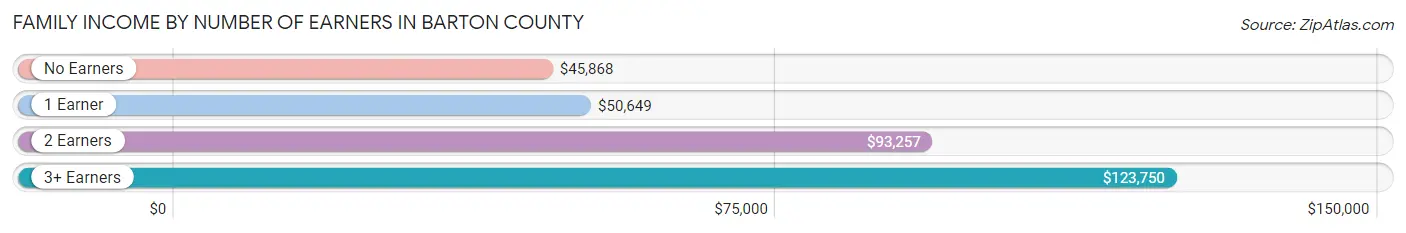
| Number of Earners | # Families | Median Income |
| No Earners | 998 (15.8%) | $45,868 |
| 1 Earner | 2,173 (34.3%) | $50,649 |
| 2 Earners | 2,727 (43.1%) | $93,257 |
| 3+ Earners | 431 (6.8%) | $123,750 |
| Total | 6,329 (100.0%) | $72,172 |
Household Income in Barton County
Household Income Brackets in Barton County
With 1,951 households falling in the category, the $50,000 to $74,999 income range is the most frequent in Barton County, accounting for 19.4% of all households. In contrast, only 282 households (2.8%) fall into the $200,000+ income bracket, making it the least populous group.
| Income Bracket | # Households | % Households |
| Less than $10,000 | 412 | 4.1% |
| $10,000 to $14,999 | 432 | 4.3% |
| $15,000 to $24,999 | 1,126 | 11.2% |
| $25,000 to $34,999 | 1,016 | 10.1% |
| $35,000 to $49,999 | 1,538 | 15.3% |
| $50,000 to $74,999 | 1,951 | 19.4% |
| $75,000 to $99,999 | 1,388 | 13.8% |
| $100,000 to $149,999 | 1,327 | 13.2% |
| $150,000 to $199,999 | 583 | 5.8% |
| $200,000+ | 282 | 2.8% |
Household Income by Householder Age in Barton County
The median household income in Barton County is $54,634, with the highest median household income of $69,816 found in the 45 to 64 years age bracket for the primary householder. A total of 3,493 households (34.7%) fall into this category. Meanwhile, the 15 to 24 years age bracket for the primary householder has the lowest median household income of $22,612, with 559 households (5.6%) in this group.
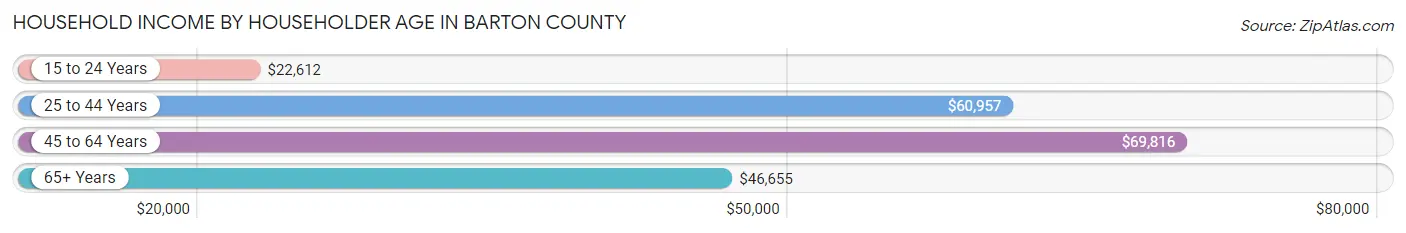
| Income Bracket | # Households | Median Income |
| 15 to 24 Years | 559 (5.6%) | $22,612 |
| 25 to 44 Years | 2,802 (27.9%) | $60,957 |
| 45 to 64 Years | 3,493 (34.7%) | $69,816 |
| 65+ Years | 3,201 (31.8%) | $46,655 |
| Total | 10,055 (100.0%) | $54,634 |
Poverty in Barton County
Income Below Poverty by Sex and Age in Barton County
With 12.2% poverty level for males and 16.7% for females among the residents of Barton County, 18 to 24 year old males and under 5 year old females are the most vulnerable to poverty, with 300 males (33.1%) and 306 females (43.4%) in their respective age groups living below the poverty level.
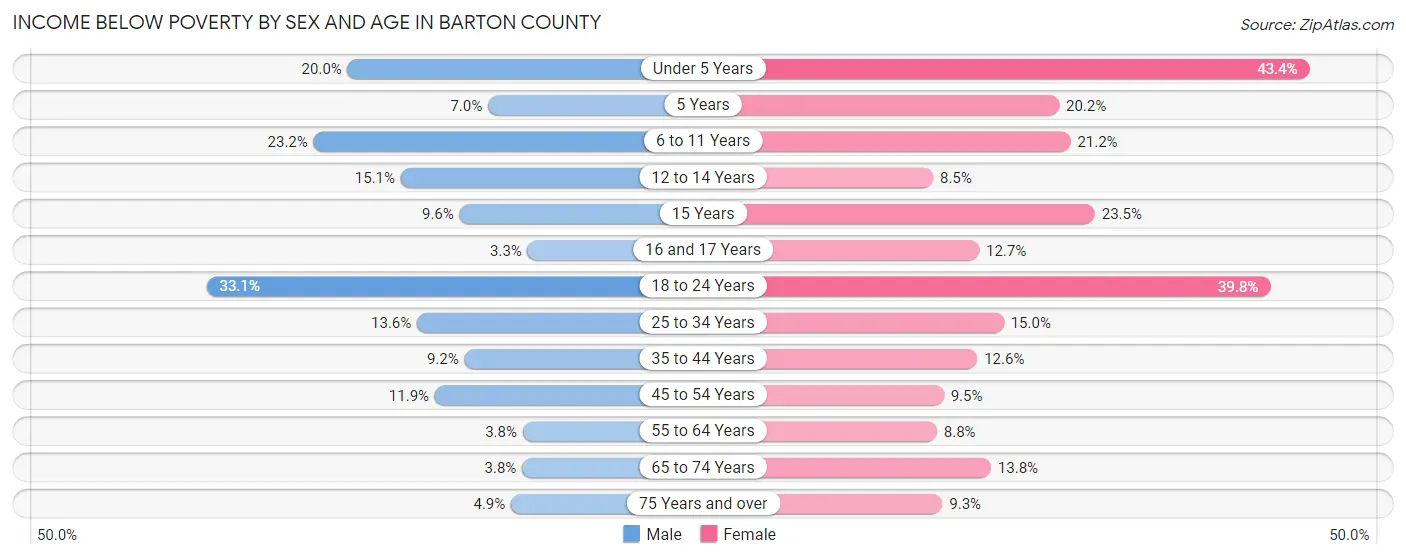
| Age Bracket | Male | Female |
| Under 5 Years | 165 (20.0%) | 306 (43.4%) |
| 5 Years | 10 (7.0%) | 26 (20.2%) |
| 6 to 11 Years | 270 (23.2%) | 226 (21.2%) |
| 12 to 14 Years | 54 (15.1%) | 36 (8.5%) |
| 15 Years | 18 (9.6%) | 31 (23.5%) |
| 16 and 17 Years | 10 (3.3%) | 53 (12.7%) |
| 18 to 24 Years | 300 (33.1%) | 421 (39.8%) |
| 25 to 34 Years | 221 (13.6%) | 251 (15.0%) |
| 35 to 44 Years | 140 (9.2%) | 157 (12.6%) |
| 45 to 54 Years | 136 (11.9%) | 108 (9.5%) |
| 55 to 64 Years | 67 (3.8%) | 162 (8.8%) |
| 65 to 74 Years | 51 (3.8%) | 214 (13.8%) |
| 75 Years and over | 45 (4.9%) | 114 (9.3%) |
| Total | 1,487 (12.2%) | 2,105 (16.7%) |
Income Above Poverty by Sex and Age in Barton County
According to the poverty statistics in Barton County, males aged 16 and 17 years and females aged 12 to 14 years are the age groups that are most secure financially, with 96.7% of males and 91.5% of females in these age groups living above the poverty line.
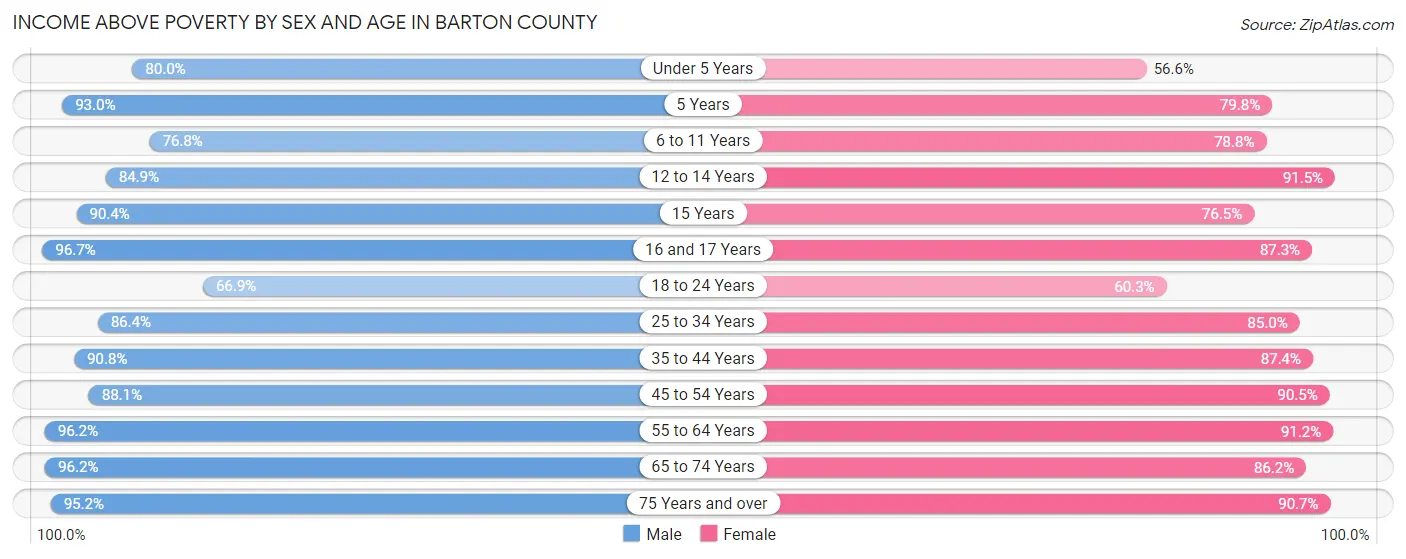
| Age Bracket | Male | Female |
| Under 5 Years | 659 (80.0%) | 399 (56.6%) |
| 5 Years | 133 (93.0%) | 103 (79.8%) |
| 6 to 11 Years | 895 (76.8%) | 839 (78.8%) |
| 12 to 14 Years | 304 (84.9%) | 389 (91.5%) |
| 15 Years | 169 (90.4%) | 101 (76.5%) |
| 16 and 17 Years | 292 (96.7%) | 363 (87.3%) |
| 18 to 24 Years | 606 (66.9%) | 638 (60.3%) |
| 25 to 34 Years | 1,408 (86.4%) | 1,419 (85.0%) |
| 35 to 44 Years | 1,387 (90.8%) | 1,092 (87.4%) |
| 45 to 54 Years | 1,005 (88.1%) | 1,034 (90.5%) |
| 55 to 64 Years | 1,716 (96.2%) | 1,675 (91.2%) |
| 65 to 74 Years | 1,285 (96.2%) | 1,332 (86.2%) |
| 75 Years and over | 883 (95.2%) | 1,108 (90.7%) |
| Total | 10,742 (87.8%) | 10,492 (83.3%) |
Income Below Poverty Among Married-Couple Families in Barton County
The poverty statistics for married-couple families in Barton County show that 4.7% or 228 of the total 4,828 families live below the poverty line. Families with 5 or more children have the highest poverty rate of 43.8%, comprising of 14 families. On the other hand, families with no children have the lowest poverty rate of 2.1%, which includes 66 families.
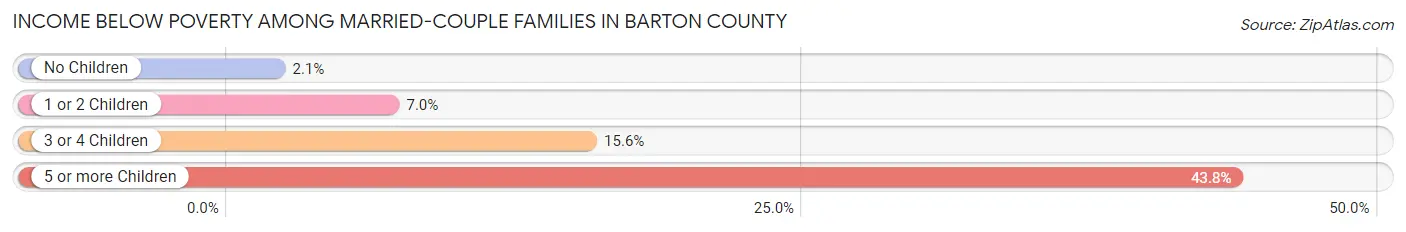
| Children | Above Poverty | Below Poverty |
| No Children | 3,118 (97.9%) | 66 (2.1%) |
| 1 or 2 Children | 1,124 (93.0%) | 85 (7.0%) |
| 3 or 4 Children | 340 (84.4%) | 63 (15.6%) |
| 5 or more Children | 18 (56.2%) | 14 (43.8%) |
| Total | 4,600 (95.3%) | 228 (4.7%) |
Income Below Poverty Among Single-Parent Households in Barton County
According to the poverty data in Barton County, 10.1% or 53 single-father households and 33.5% or 327 single-mother households are living below the poverty line. Among single-father households, those with 3 or 4 children have the highest poverty rate, with 35 households (85.4%) experiencing poverty. Likewise, among single-mother households, those with 5 or more children have the highest poverty rate, with 3 households (100.0%) falling below the poverty line.
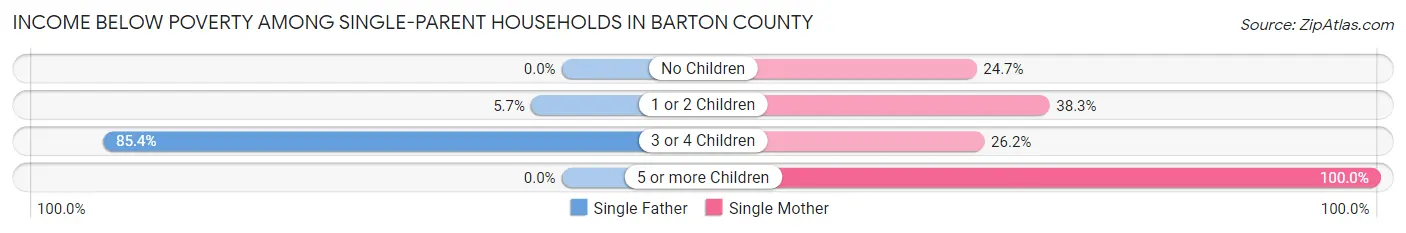
| Children | Single Father | Single Mother |
| No Children | 0 (0.0%) | 65 (24.7%) |
| 1 or 2 Children | 18 (5.7%) | 231 (38.3%) |
| 3 or 4 Children | 35 (85.4%) | 28 (26.2%) |
| 5 or more Children | 0 (0.0%) | 3 (100.0%) |
| Total | 53 (10.1%) | 327 (33.5%) |
Income Below Poverty Among Married-Couple vs Single-Parent Households in Barton County
The poverty data for Barton County shows that 228 of the married-couple family households (4.7%) and 380 of the single-parent households (25.3%) are living below the poverty level. Within the married-couple family households, those with 5 or more children have the highest poverty rate, with 14 households (43.8%) falling below the poverty line. Among the single-parent households, those with 5 or more children have the highest poverty rate, with 3 household (100.0%) living below poverty.
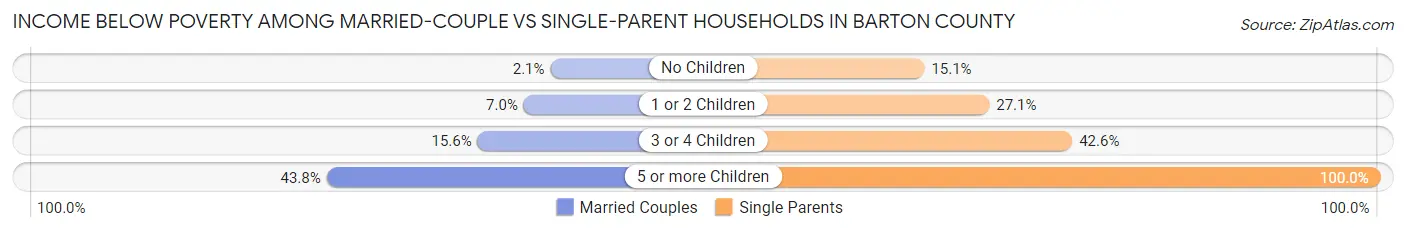
| Children | Married-Couple Families | Single-Parent Households |
| No Children | 66 (2.1%) | 65 (15.0%) |
| 1 or 2 Children | 85 (7.0%) | 249 (27.1%) |
| 3 or 4 Children | 63 (15.6%) | 63 (42.6%) |
| 5 or more Children | 14 (43.8%) | 3 (100.0%) |
| Total | 228 (4.7%) | 380 (25.3%) |
Employment Characteristics in Barton County
Employment by Class of Employer in Barton County
Among the 12,256 employed individuals in Barton County, private company employees (7,858 | 64.1%), local government employees (1,231 | 10.0%), and not-for-profit organizations (1,119 | 9.1%) make up the most common classes of employment.
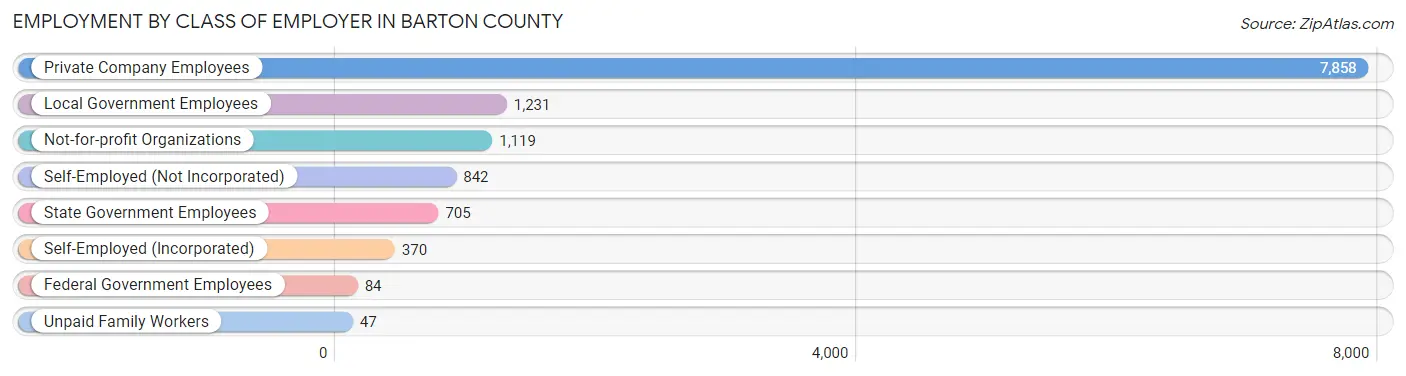
| Employer Class | # Employees | % Employees |
| Private Company Employees | 7,858 | 64.1% |
| Self-Employed (Incorporated) | 370 | 3.0% |
| Self-Employed (Not Incorporated) | 842 | 6.9% |
| Not-for-profit Organizations | 1,119 | 9.1% |
| Local Government Employees | 1,231 | 10.0% |
| State Government Employees | 705 | 5.8% |
| Federal Government Employees | 84 | 0.7% |
| Unpaid Family Workers | 47 | 0.4% |
| Total | 12,256 | 100.0% |
Employment Status by Age in Barton County
According to the labor force statistics for Barton County, out of the total population over 16 years of age (20,101), 64.4% or 12,945 individuals are in the labor force, with 4.1% or 531 of them unemployed. The age group with the highest labor force participation rate is 25 to 29 years, with 88.8% or 1,344 individuals in the labor force. Within the labor force, the 16 to 19 years age range has the highest percentage of unemployed individuals, with 14.4% or 114 of them being unemployed.
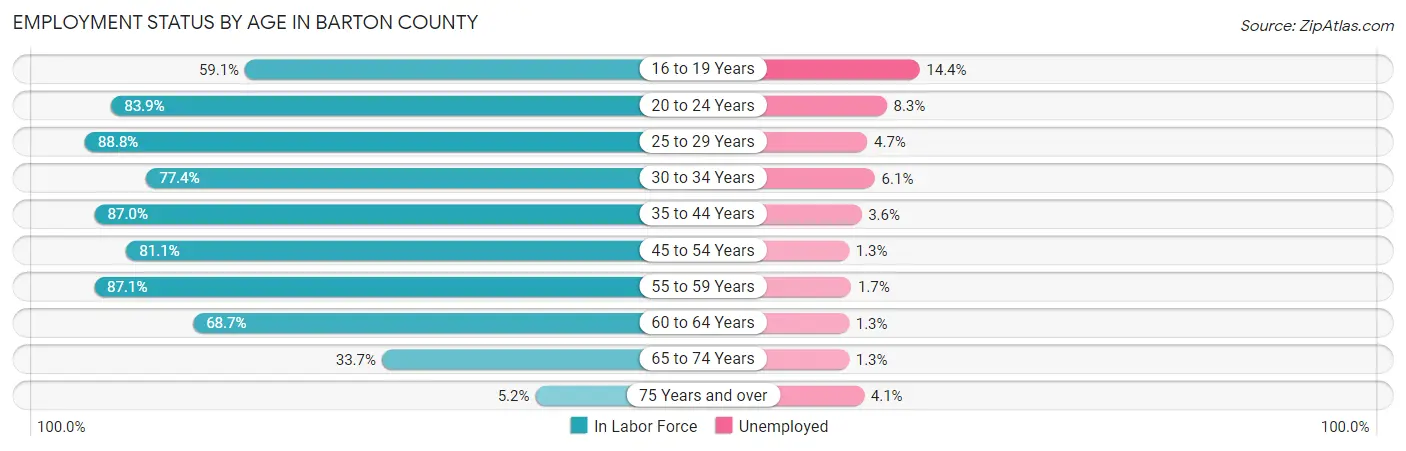
| Age Bracket | In Labor Force | Unemployed |
| 16 to 19 Years | 793 (59.1%) | 114 (14.4%) |
| 20 to 24 Years | 1,175 (83.9%) | 98 (8.3%) |
| 25 to 29 Years | 1,344 (88.8%) | 63 (4.7%) |
| 30 to 34 Years | 1,406 (77.4%) | 86 (6.1%) |
| 35 to 44 Years | 2,457 (87.0%) | 88 (3.6%) |
| 45 to 54 Years | 1,864 (81.1%) | 24 (1.3%) |
| 55 to 59 Years | 1,454 (87.1%) | 25 (1.7%) |
| 60 to 64 Years | 1,347 (68.7%) | 18 (1.3%) |
| 65 to 74 Years | 982 (33.7%) | 13 (1.3%) |
| 75 Years and over | 123 (5.2%) | 5 (4.1%) |
| Total | 12,945 (64.4%) | 531 (4.1%) |
Employment Status by Educational Attainment in Barton County
According to labor force statistics for Barton County, 81.7% of individuals (9,869) out of the total population between 25 and 64 years of age (12,080) are in the labor force, with 3.1% or 306 of them being unemployed. The group with the highest labor force participation rate are those with the educational attainment of bachelor's degree or higher, with 92.7% or 2,340 individuals in the labor force. Within the labor force, individuals with less than high school education have the highest percentage of unemployment, with 13.3% or 103 of them being unemployed.
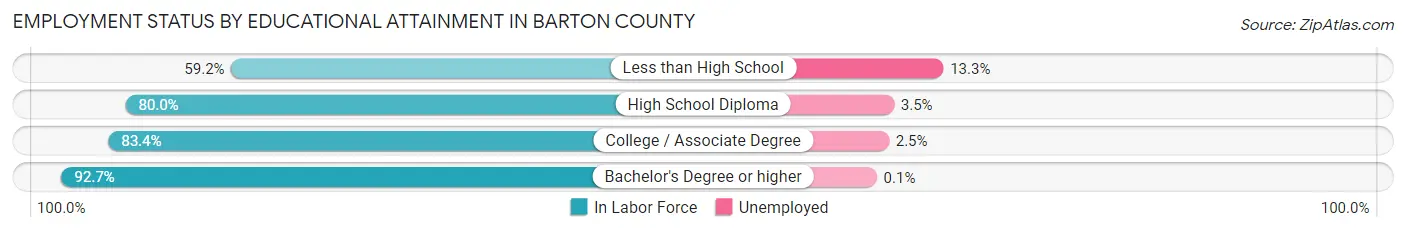
| Educational Attainment | In Labor Force | Unemployed |
| Less than High School | 776 (59.2%) | 174 (13.3%) |
| High School Diploma | 2,821 (80.0%) | 123 (3.5%) |
| College / Associate Degree | 3,936 (83.4%) | 118 (2.5%) |
| Bachelor's Degree or higher | 2,340 (92.7%) | 3 (0.1%) |
| Total | 9,869 (81.7%) | 374 (3.1%) |
Employment Occupations by Sex in Barton County
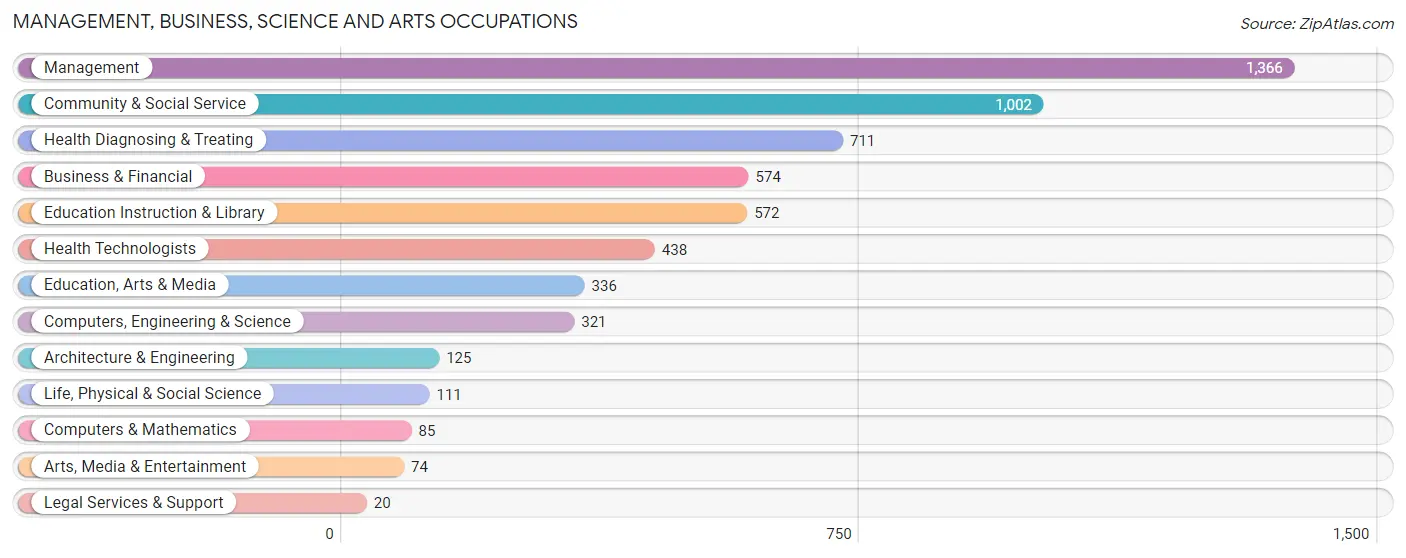
Management, Business, Science and Arts Occupations
The most common Management, Business, Science and Arts occupations in Barton County are Management (1,366 | 11.0%), Community & Social Service (1,002 | 8.1%), Health Diagnosing & Treating (711 | 5.7%), Business & Financial (574 | 4.6%), and Education Instruction & Library (572 | 4.6%).
Management, Business, Science and Arts Occupations by Sex
Within the Management, Business, Science and Arts occupations in Barton County, the most male-oriented occupations are Legal Services & Support (95.0%), Architecture & Engineering (91.2%), and Life, Physical & Social Science (88.3%), while the most female-oriented occupations are Health Technologists (79.0%), Health Diagnosing & Treating (77.5%), and Education Instruction & Library (73.1%).
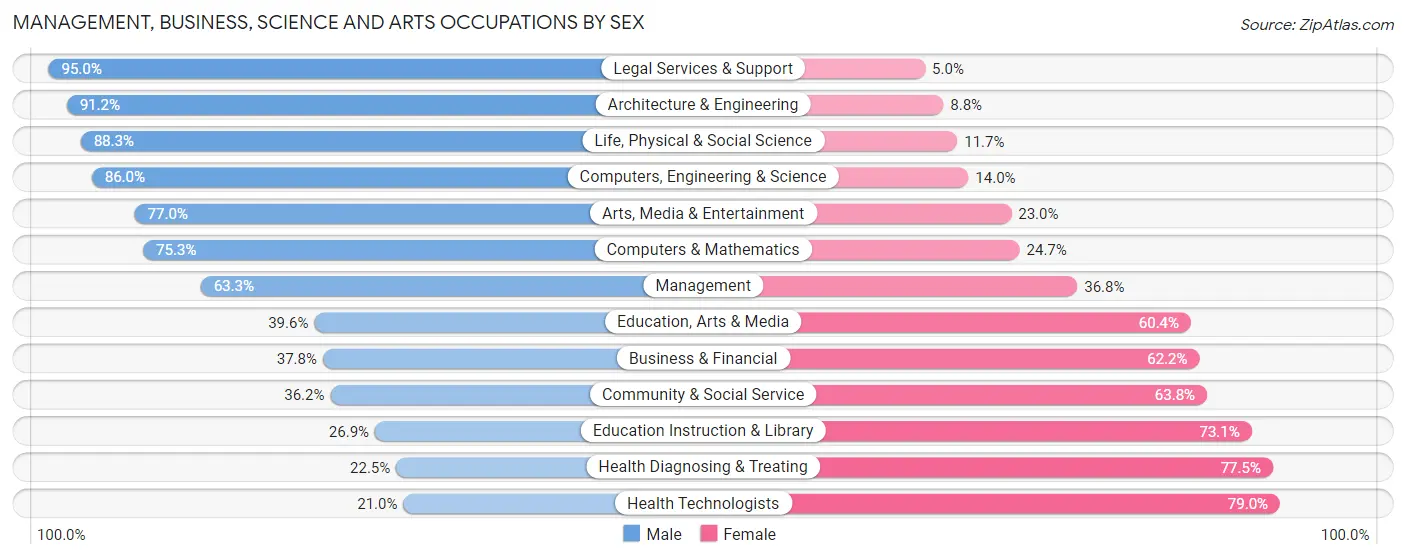
| Occupation | Male | Female |
| Management | 864 (63.2%) | 502 (36.7%) |
| Business & Financial | 217 (37.8%) | 357 (62.2%) |
| Computers, Engineering & Science | 276 (86.0%) | 45 (14.0%) |
| Computers & Mathematics | 64 (75.3%) | 21 (24.7%) |
| Architecture & Engineering | 114 (91.2%) | 11 (8.8%) |
| Life, Physical & Social Science | 98 (88.3%) | 13 (11.7%) |
| Community & Social Service | 363 (36.2%) | 639 (63.8%) |
| Education, Arts & Media | 133 (39.6%) | 203 (60.4%) |
| Legal Services & Support | 19 (95.0%) | 1 (5.0%) |
| Education Instruction & Library | 154 (26.9%) | 418 (73.1%) |
| Arts, Media & Entertainment | 57 (77.0%) | 17 (23.0%) |
| Health Diagnosing & Treating | 160 (22.5%) | 551 (77.5%) |
| Health Technologists | 92 (21.0%) | 346 (79.0%) |
| Total (Category) | 1,880 (47.3%) | 2,094 (52.7%) |
| Total (Overall) | 6,512 (52.5%) | 5,884 (47.5%) |
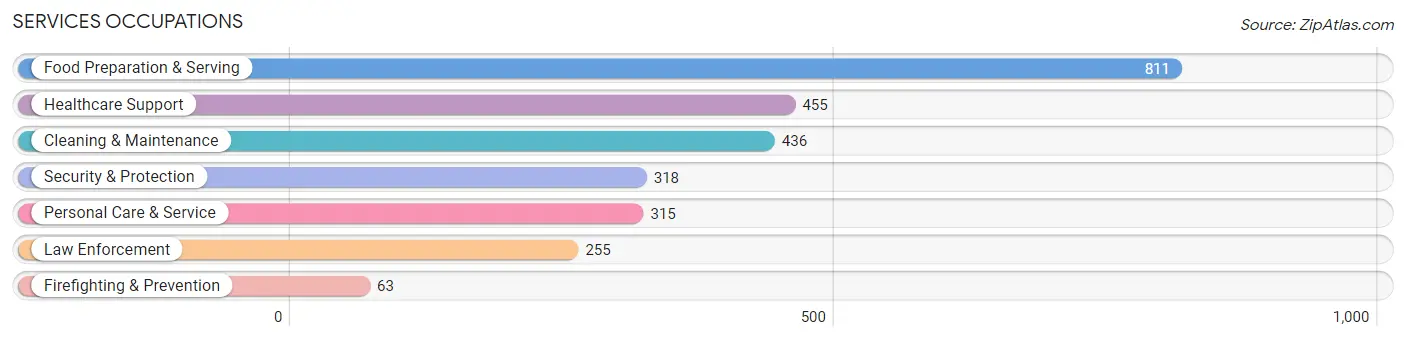
Services Occupations
The most common Services occupations in Barton County are Food Preparation & Serving (811 | 6.5%), Healthcare Support (455 | 3.7%), Cleaning & Maintenance (436 | 3.5%), Security & Protection (318 | 2.6%), and Personal Care & Service (315 | 2.5%).
Services Occupations by Sex
Within the Services occupations in Barton County, the most male-oriented occupations are Law Enforcement (91.4%), Security & Protection (90.9%), and Firefighting & Prevention (88.9%), while the most female-oriented occupations are Food Preparation & Serving (87.5%), Healthcare Support (79.6%), and Cleaning & Maintenance (50.5%).
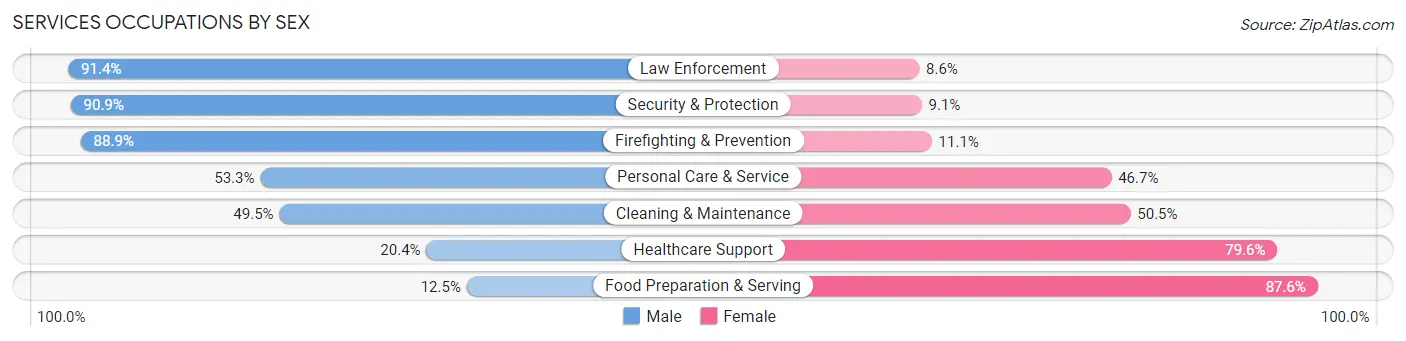
| Occupation | Male | Female |
| Healthcare Support | 93 (20.4%) | 362 (79.6%) |
| Security & Protection | 289 (90.9%) | 29 (9.1%) |
| Firefighting & Prevention | 56 (88.9%) | 7 (11.1%) |
| Law Enforcement | 233 (91.4%) | 22 (8.6%) |
| Food Preparation & Serving | 101 (12.4%) | 710 (87.5%) |
| Cleaning & Maintenance | 216 (49.5%) | 220 (50.5%) |
| Personal Care & Service | 168 (53.3%) | 147 (46.7%) |
| Total (Category) | 867 (37.1%) | 1,468 (62.9%) |
| Total (Overall) | 6,512 (52.5%) | 5,884 (47.5%) |
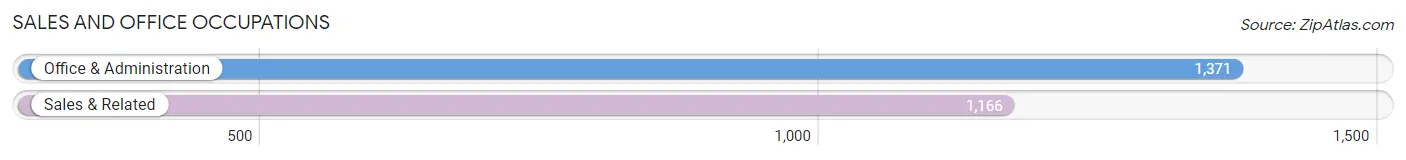
Sales and Office Occupations
The most common Sales and Office occupations in Barton County are Office & Administration (1,371 | 11.1%), and Sales & Related (1,166 | 9.4%).
Sales and Office Occupations by Sex
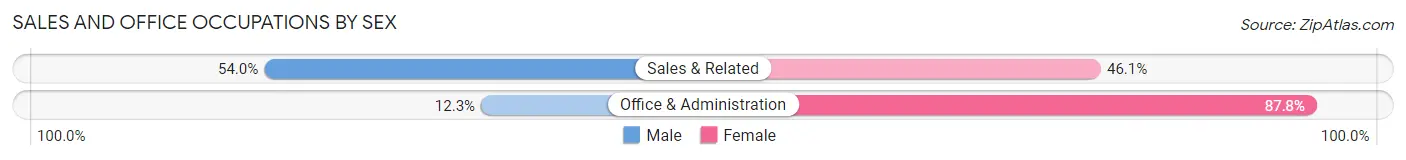
| Occupation | Male | Female |
| Sales & Related | 629 (53.9%) | 537 (46.1%) |
| Office & Administration | 168 (12.2%) | 1,203 (87.7%) |
| Total (Category) | 797 (31.4%) | 1,740 (68.6%) |
| Total (Overall) | 6,512 (52.5%) | 5,884 (47.5%) |
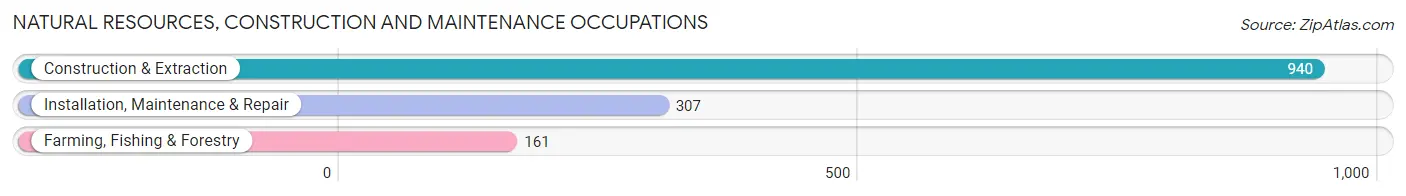
Natural Resources, Construction and Maintenance Occupations
The most common Natural Resources, Construction and Maintenance occupations in Barton County are Construction & Extraction (940 | 7.6%), Installation, Maintenance & Repair (307 | 2.5%), and Farming, Fishing & Forestry (161 | 1.3%).
Natural Resources, Construction and Maintenance Occupations by Sex
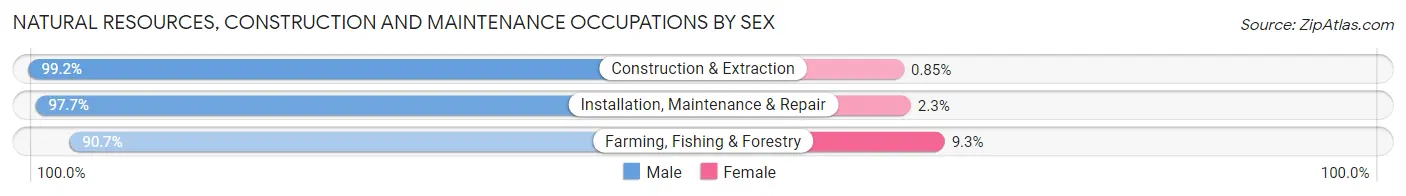
| Occupation | Male | Female |
| Farming, Fishing & Forestry | 146 (90.7%) | 15 (9.3%) |
| Construction & Extraction | 932 (99.2%) | 8 (0.9%) |
| Installation, Maintenance & Repair | 300 (97.7%) | 7 (2.3%) |
| Total (Category) | 1,378 (97.9%) | 30 (2.1%) |
| Total (Overall) | 6,512 (52.5%) | 5,884 (47.5%) |
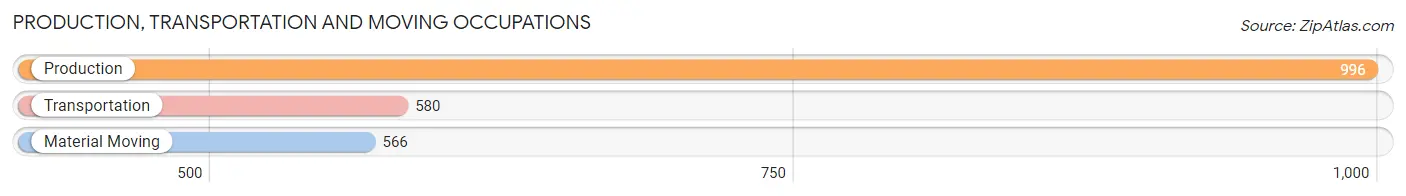
Production, Transportation and Moving Occupations
The most common Production, Transportation and Moving occupations in Barton County are Production (996 | 8.0%), Transportation (580 | 4.7%), and Material Moving (566 | 4.6%).
Production, Transportation and Moving Occupations by Sex
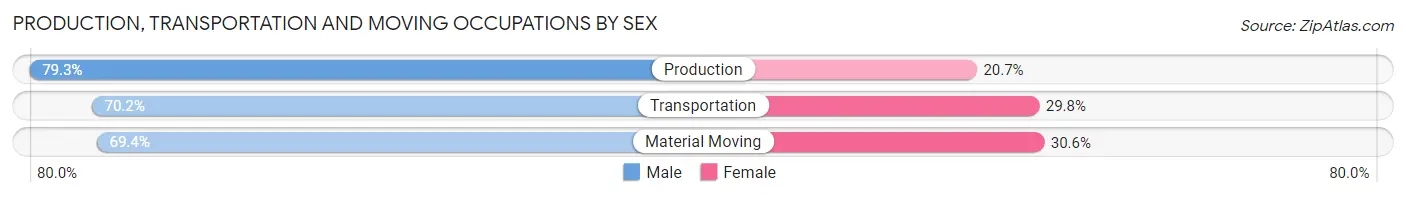
| Occupation | Male | Female |
| Production | 790 (79.3%) | 206 (20.7%) |
| Transportation | 407 (70.2%) | 173 (29.8%) |
| Material Moving | 393 (69.4%) | 173 (30.6%) |
| Total (Category) | 1,590 (74.2%) | 552 (25.8%) |
| Total (Overall) | 6,512 (52.5%) | 5,884 (47.5%) |
Employment Industries by Sex in Barton County
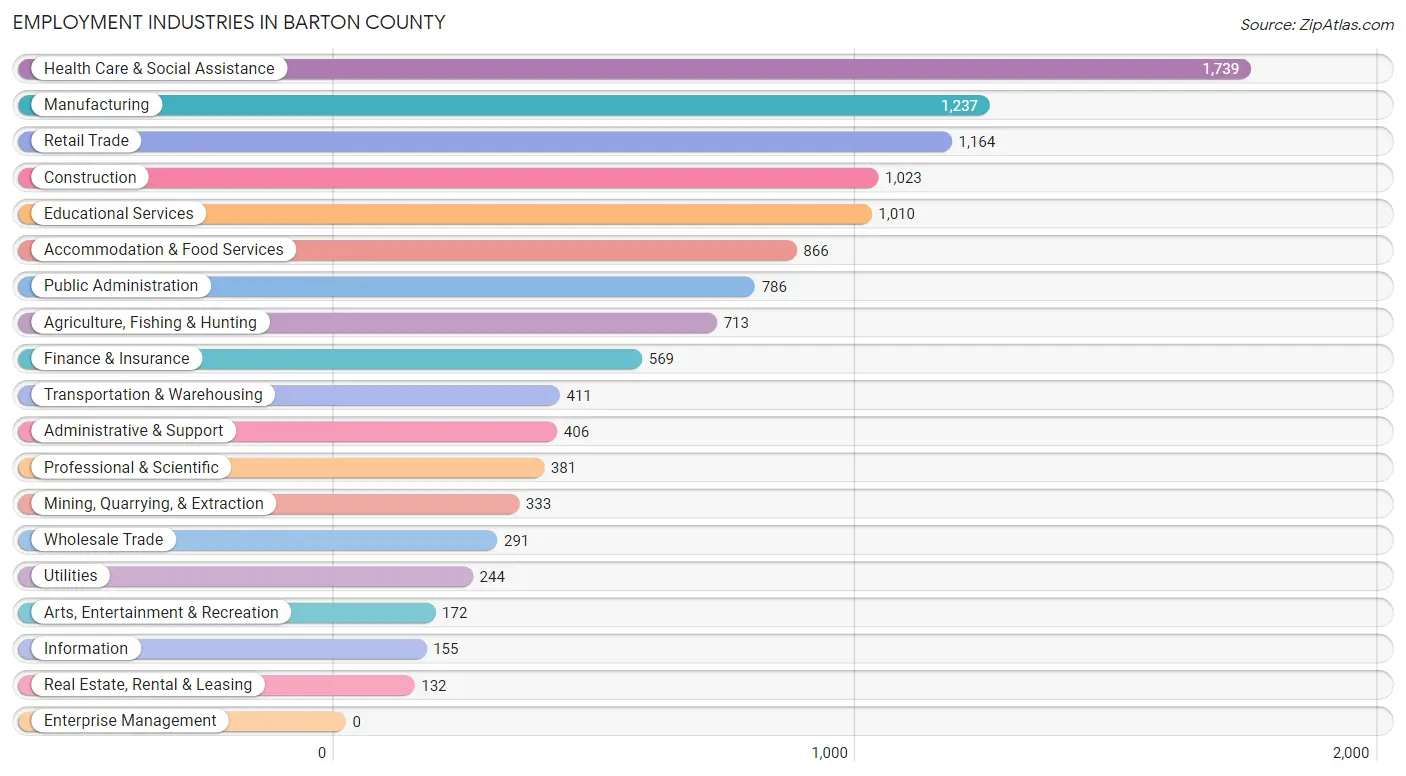
Employment Industries in Barton County
The major employment industries in Barton County include Health Care & Social Assistance (1,739 | 14.0%), Manufacturing (1,237 | 10.0%), Retail Trade (1,164 | 9.4%), Construction (1,023 | 8.3%), and Educational Services (1,010 | 8.2%).
Employment Industries by Sex in Barton County
The Barton County industries that see more men than women are Construction (95.4%), Utilities (94.7%), and Agriculture, Fishing & Hunting (88.1%), whereas the industries that tend to have a higher number of women are Accommodation & Food Services (85.5%), Health Care & Social Assistance (84.1%), and Arts, Entertainment & Recreation (70.9%).
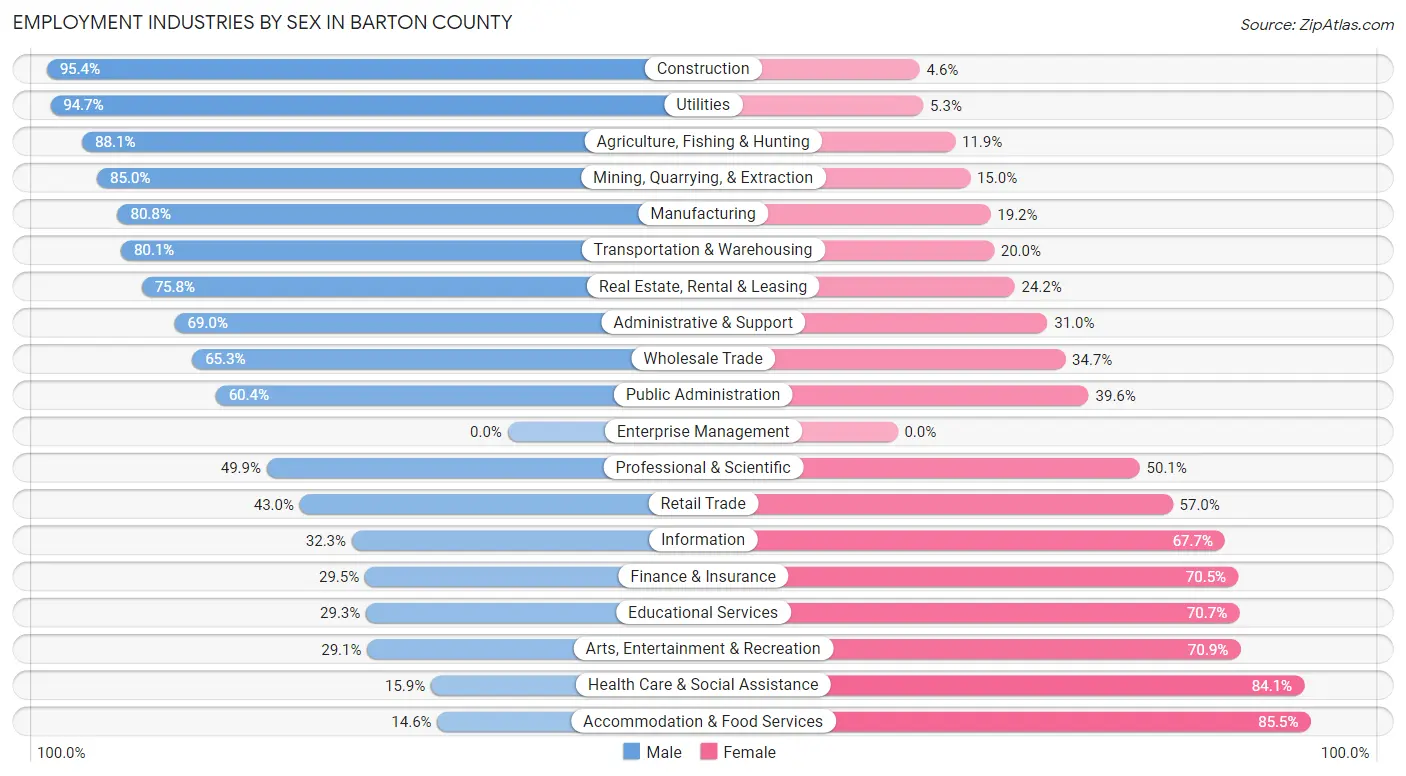
| Industry | Male | Female |
| Agriculture, Fishing & Hunting | 628 (88.1%) | 85 (11.9%) |
| Mining, Quarrying, & Extraction | 283 (85.0%) | 50 (15.0%) |
| Construction | 976 (95.4%) | 47 (4.6%) |
| Manufacturing | 999 (80.8%) | 238 (19.2%) |
| Wholesale Trade | 190 (65.3%) | 101 (34.7%) |
| Retail Trade | 501 (43.0%) | 663 (57.0%) |
| Transportation & Warehousing | 329 (80.0%) | 82 (20.0%) |
| Utilities | 231 (94.7%) | 13 (5.3%) |
| Information | 50 (32.3%) | 105 (67.7%) |
| Finance & Insurance | 168 (29.5%) | 401 (70.5%) |
| Real Estate, Rental & Leasing | 100 (75.8%) | 32 (24.2%) |
| Professional & Scientific | 190 (49.9%) | 191 (50.1%) |
| Enterprise Management | 0 (0.0%) | 0 (0.0%) |
| Administrative & Support | 280 (69.0%) | 126 (31.0%) |
| Educational Services | 296 (29.3%) | 714 (70.7%) |
| Health Care & Social Assistance | 276 (15.9%) | 1,463 (84.1%) |
| Arts, Entertainment & Recreation | 50 (29.1%) | 122 (70.9%) |
| Accommodation & Food Services | 126 (14.5%) | 740 (85.5%) |
| Public Administration | 475 (60.4%) | 311 (39.6%) |
| Total | 6,512 (52.5%) | 5,884 (47.5%) |
Education in Barton County
School Enrollment in Barton County
The most common levels of schooling among the 5,744 students in Barton County are elementary school (1,599 | 27.8%), high school (1,390 | 24.2%), and middle school (1,032 | 18.0%).
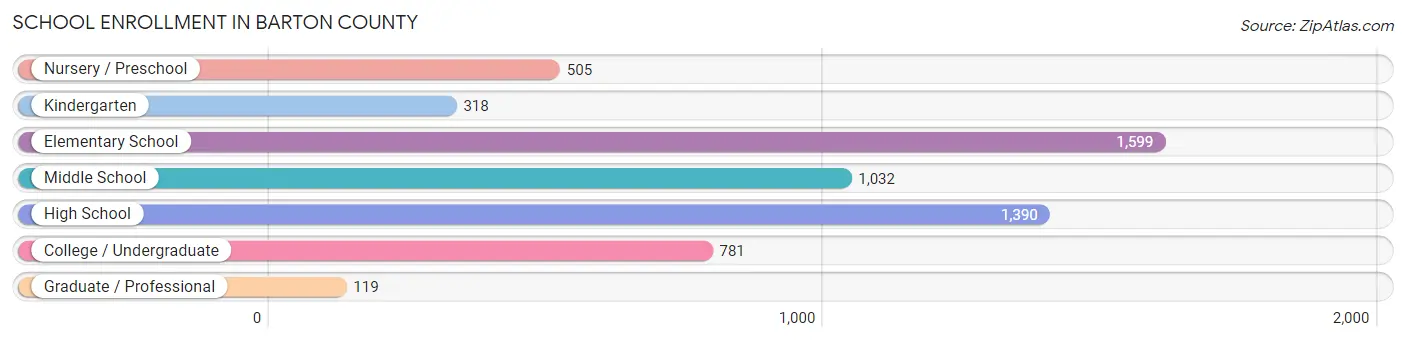
| School Level | # Students | % Students |
| Nursery / Preschool | 505 | 8.8% |
| Kindergarten | 318 | 5.5% |
| Elementary School | 1,599 | 27.8% |
| Middle School | 1,032 | 18.0% |
| High School | 1,390 | 24.2% |
| College / Undergraduate | 781 | 13.6% |
| Graduate / Professional | 119 | 2.1% |
| Total | 5,744 | 100.0% |
School Enrollment by Age by Funding Source in Barton County
Out of a total of 5,744 students who are enrolled in schools in Barton County, 655 (11.4%) attend a private institution, while the remaining 5,089 (88.6%) are enrolled in public schools. The age group of 35 years and over has the highest likelihood of being enrolled in private schools, with 51 (21.7% in the age bracket) enrolled. Conversely, the age group of 25 to 34 year olds has the lowest likelihood of being enrolled in a private school, with 181 (94.8% in the age bracket) attending a public institution.
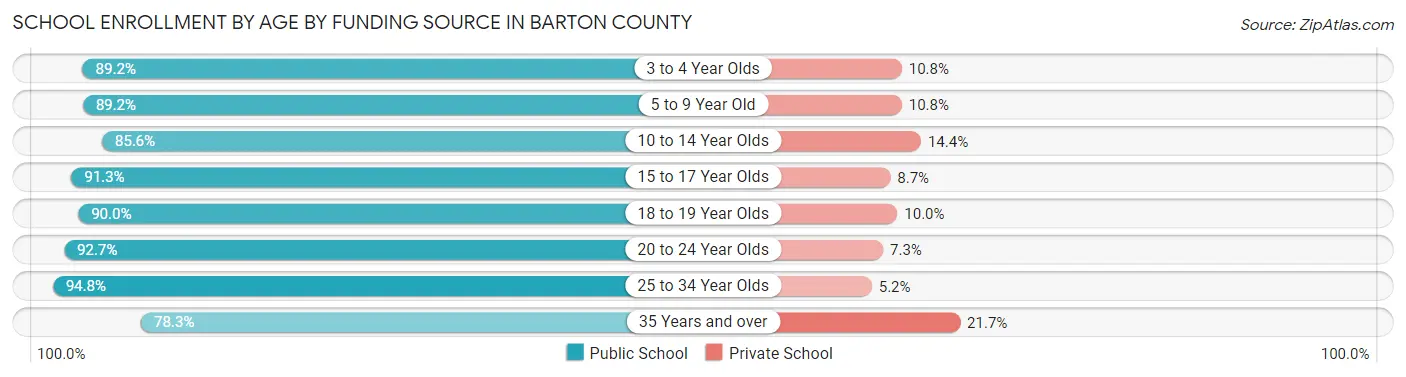
| Age Bracket | Public School | Private School |
| 3 to 4 Year Olds | 338 (89.2%) | 41 (10.8%) |
| 5 to 9 Year Old | 1,556 (89.2%) | 189 (10.8%) |
| 10 to 14 Year Olds | 1,296 (85.6%) | 218 (14.4%) |
| 15 to 17 Year Olds | 944 (91.3%) | 90 (8.7%) |
| 18 to 19 Year Olds | 324 (90.0%) | 36 (10.0%) |
| 20 to 24 Year Olds | 265 (92.7%) | 21 (7.3%) |
| 25 to 34 Year Olds | 181 (94.8%) | 10 (5.2%) |
| 35 Years and over | 184 (78.3%) | 51 (21.7%) |
| Total | 5,089 (88.6%) | 655 (11.4%) |
Educational Attainment by Field of Study in Barton County
Education (828 | 20.5%), business (802 | 19.9%), bio, nature & agricultural (472 | 11.7%), science & technology (431 | 10.7%), and arts & humanities (271 | 6.7%) are the most common fields of study among 4,029 individuals in Barton County who have obtained a bachelor's degree or higher.
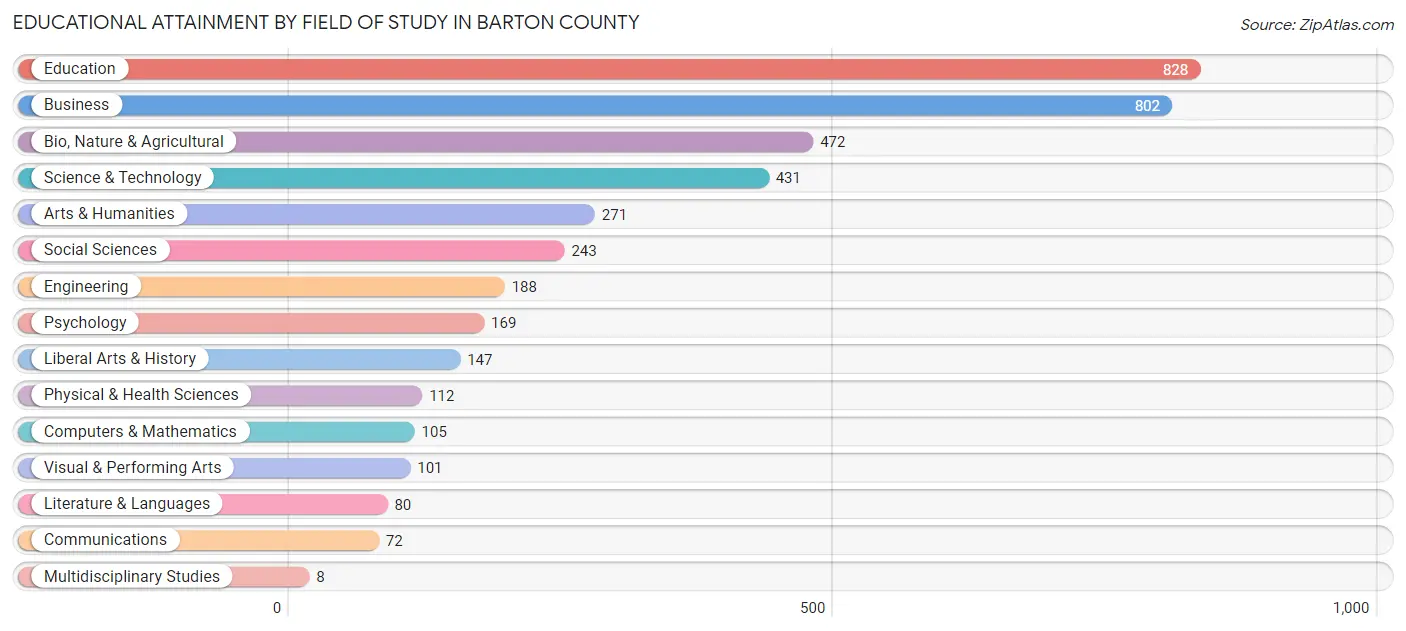
| Field of Study | # Graduates | % Graduates |
| Computers & Mathematics | 105 | 2.6% |
| Bio, Nature & Agricultural | 472 | 11.7% |
| Physical & Health Sciences | 112 | 2.8% |
| Psychology | 169 | 4.2% |
| Social Sciences | 243 | 6.0% |
| Engineering | 188 | 4.7% |
| Multidisciplinary Studies | 8 | 0.2% |
| Science & Technology | 431 | 10.7% |
| Business | 802 | 19.9% |
| Education | 828 | 20.5% |
| Literature & Languages | 80 | 2.0% |
| Liberal Arts & History | 147 | 3.6% |
| Visual & Performing Arts | 101 | 2.5% |
| Communications | 72 | 1.8% |
| Arts & Humanities | 271 | 6.7% |
| Total | 4,029 | 100.0% |
Transportation & Commute in Barton County
Vehicle Availability by Sex in Barton County
The most prevalent vehicle ownership categories in Barton County are males with 2 vehicles (2,721, accounting for 42.3%) and females with 2 vehicles (2,230, making up 46.9%).
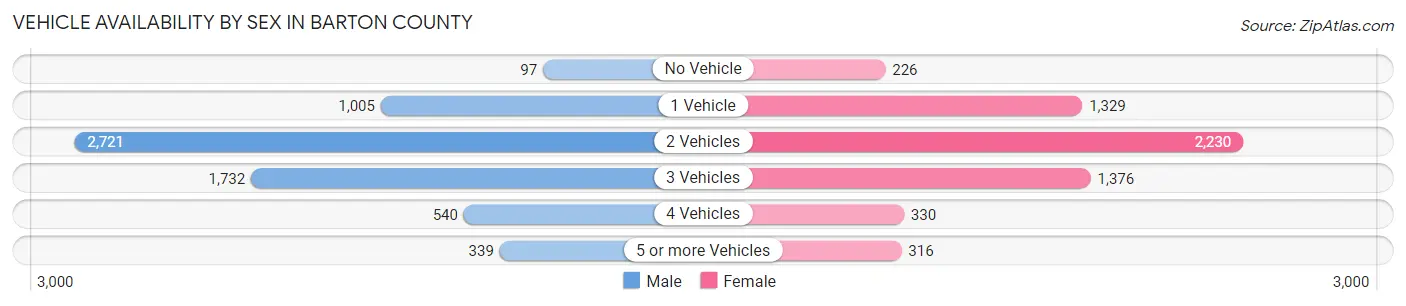
| Vehicles Available | Male | Female |
| No Vehicle | 97 (1.5%) | 226 (3.9%) |
| 1 Vehicle | 1,005 (15.6%) | 1,329 (22.9%) |
| 2 Vehicles | 2,721 (42.3%) | 2,230 (38.4%) |
| 3 Vehicles | 1,732 (26.9%) | 1,376 (23.7%) |
| 4 Vehicles | 540 (8.4%) | 330 (5.7%) |
| 5 or more Vehicles | 339 (5.3%) | 316 (5.4%) |
| Total | 6,434 (100.0%) | 5,807 (100.0%) |
Commute Time in Barton County
The most frequently occuring commute durations in Barton County are 5 to 9 minutes (3,254 commuters, 28.7%), 10 to 14 minutes (2,281 commuters, 20.2%), and 15 to 19 minutes (1,732 commuters, 15.3%).
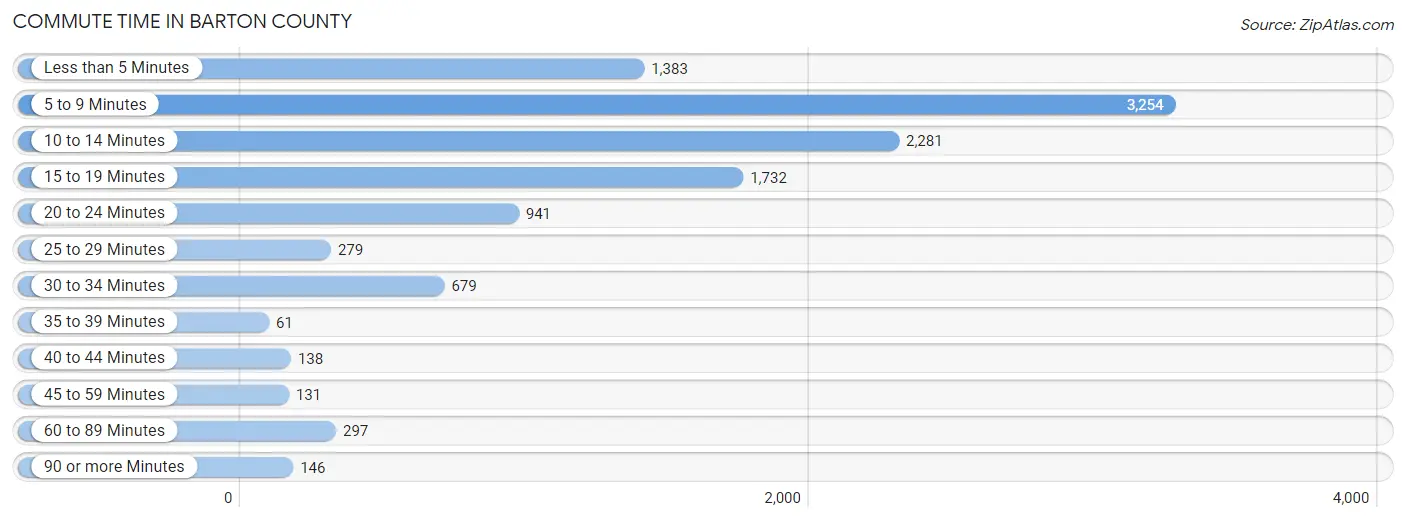
| Commute Time | # Commuters | % Commuters |
| Less than 5 Minutes | 1,383 | 12.2% |
| 5 to 9 Minutes | 3,254 | 28.7% |
| 10 to 14 Minutes | 2,281 | 20.2% |
| 15 to 19 Minutes | 1,732 | 15.3% |
| 20 to 24 Minutes | 941 | 8.3% |
| 25 to 29 Minutes | 279 | 2.5% |
| 30 to 34 Minutes | 679 | 6.0% |
| 35 to 39 Minutes | 61 | 0.5% |
| 40 to 44 Minutes | 138 | 1.2% |
| 45 to 59 Minutes | 131 | 1.2% |
| 60 to 89 Minutes | 297 | 2.6% |
| 90 or more Minutes | 146 | 1.3% |
Commute Time by Sex in Barton County
The most common commute times in Barton County are 5 to 9 minutes (1,522 commuters, 25.3%) for males and 5 to 9 minutes (1,732 commuters, 32.7%) for females.
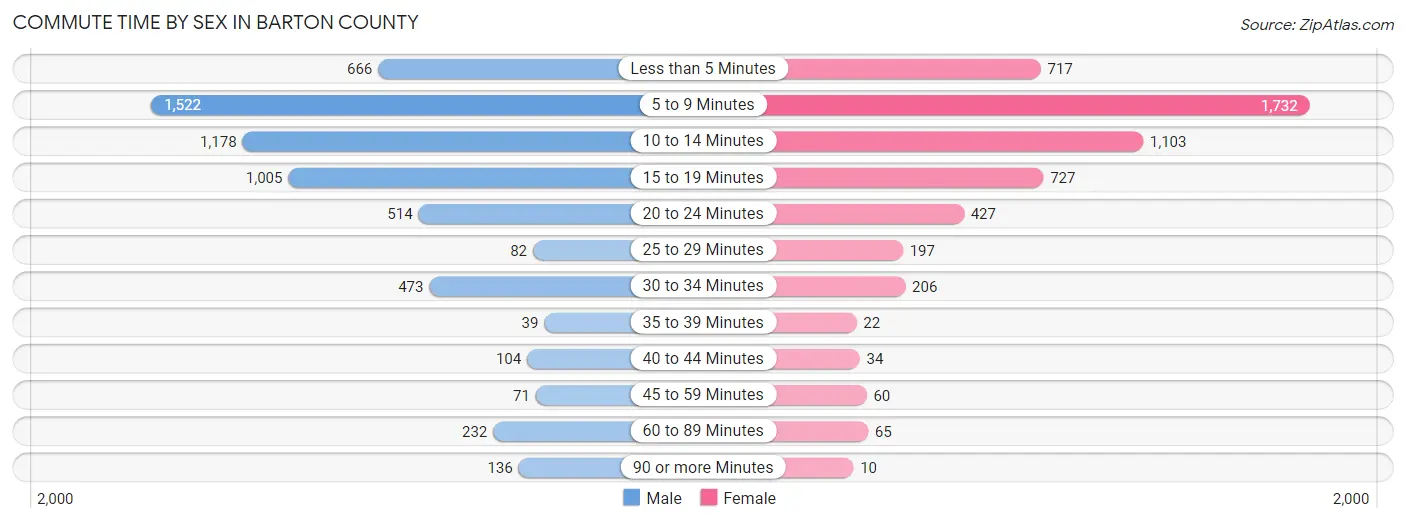
| Commute Time | Male | Female |
| Less than 5 Minutes | 666 (11.1%) | 717 (13.5%) |
| 5 to 9 Minutes | 1,522 (25.3%) | 1,732 (32.7%) |
| 10 to 14 Minutes | 1,178 (19.6%) | 1,103 (20.8%) |
| 15 to 19 Minutes | 1,005 (16.7%) | 727 (13.7%) |
| 20 to 24 Minutes | 514 (8.5%) | 427 (8.1%) |
| 25 to 29 Minutes | 82 (1.4%) | 197 (3.7%) |
| 30 to 34 Minutes | 473 (7.9%) | 206 (3.9%) |
| 35 to 39 Minutes | 39 (0.6%) | 22 (0.4%) |
| 40 to 44 Minutes | 104 (1.7%) | 34 (0.6%) |
| 45 to 59 Minutes | 71 (1.2%) | 60 (1.1%) |
| 60 to 89 Minutes | 232 (3.8%) | 65 (1.2%) |
| 90 or more Minutes | 136 (2.3%) | 10 (0.2%) |
Time of Departure to Work by Sex in Barton County
The most frequent times of departure to work in Barton County are 7:00 AM to 7:29 AM (1,173, 19.5%) for males and 7:30 AM to 7:59 AM (1,581, 29.8%) for females.
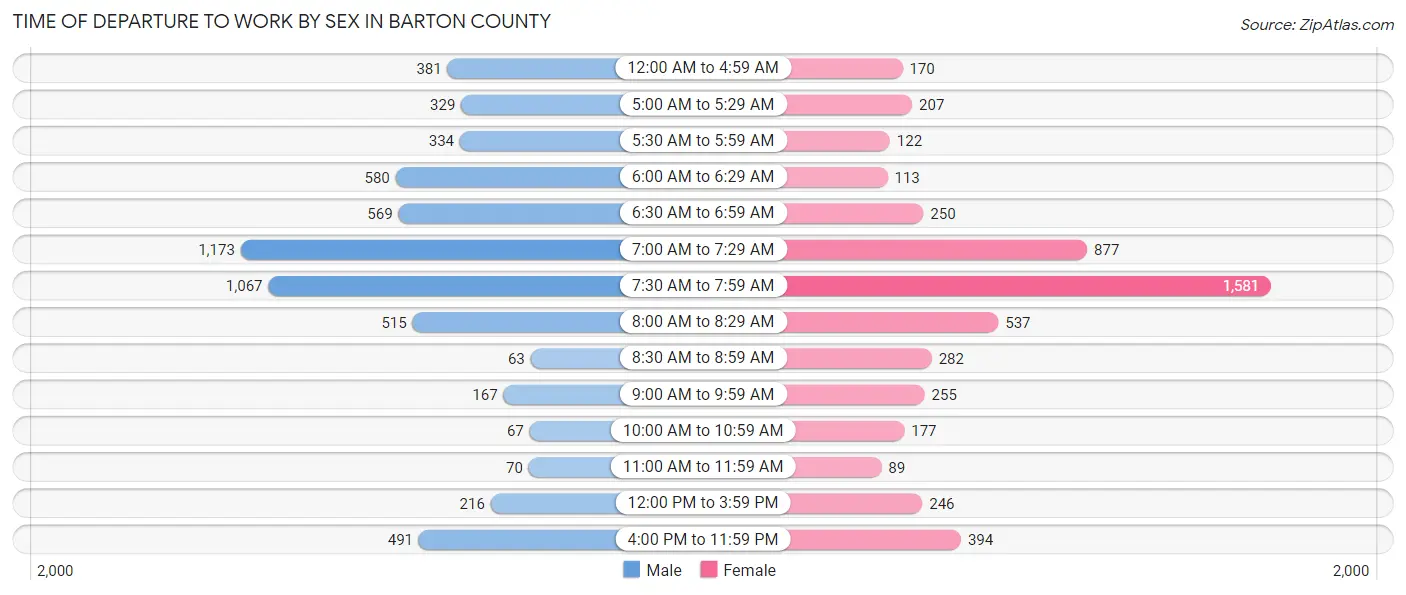
| Time of Departure | Male | Female |
| 12:00 AM to 4:59 AM | 381 (6.3%) | 170 (3.2%) |
| 5:00 AM to 5:29 AM | 329 (5.5%) | 207 (3.9%) |
| 5:30 AM to 5:59 AM | 334 (5.6%) | 122 (2.3%) |
| 6:00 AM to 6:29 AM | 580 (9.6%) | 113 (2.1%) |
| 6:30 AM to 6:59 AM | 569 (9.5%) | 250 (4.7%) |
| 7:00 AM to 7:29 AM | 1,173 (19.5%) | 877 (16.6%) |
| 7:30 AM to 7:59 AM | 1,067 (17.7%) | 1,581 (29.8%) |
| 8:00 AM to 8:29 AM | 515 (8.6%) | 537 (10.1%) |
| 8:30 AM to 8:59 AM | 63 (1.1%) | 282 (5.3%) |
| 9:00 AM to 9:59 AM | 167 (2.8%) | 255 (4.8%) |
| 10:00 AM to 10:59 AM | 67 (1.1%) | 177 (3.3%) |
| 11:00 AM to 11:59 AM | 70 (1.2%) | 89 (1.7%) |
| 12:00 PM to 3:59 PM | 216 (3.6%) | 246 (4.6%) |
| 4:00 PM to 11:59 PM | 491 (8.2%) | 394 (7.4%) |
| Total | 6,022 (100.0%) | 5,300 (100.0%) |
Housing Occupancy in Barton County
Occupancy by Ownership in Barton County
Of the total 10,055 dwellings in Barton County, owner-occupied units account for 6,773 (67.4%), while renter-occupied units make up 3,282 (32.6%).
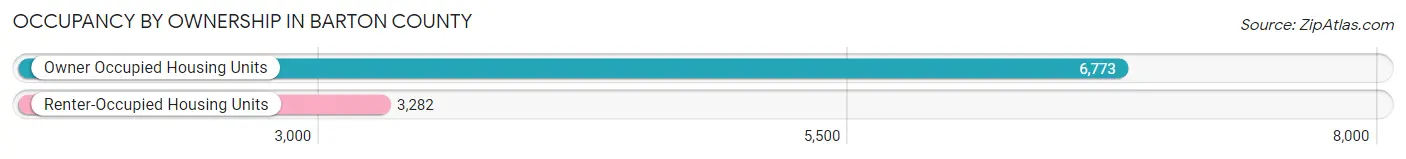
| Occupancy | # Housing Units | % Housing Units |
| Owner Occupied Housing Units | 6,773 | 67.4% |
| Renter-Occupied Housing Units | 3,282 | 32.6% |
| Total Occupied Housing Units | 10,055 | 100.0% |
Occupancy by Household Size in Barton County
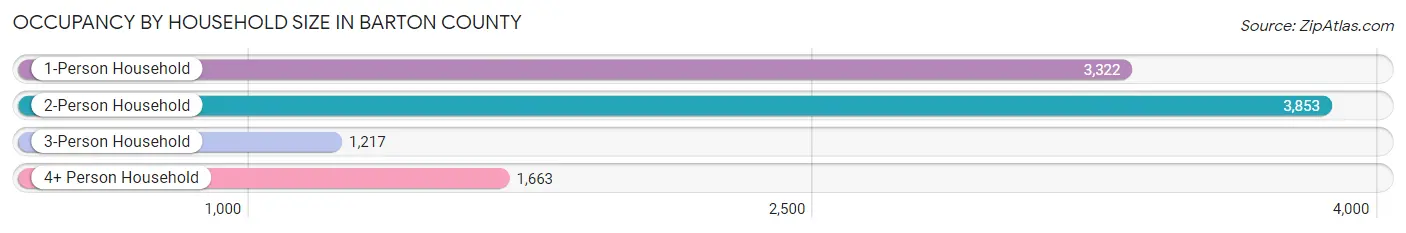
| Household Size | # Housing Units | % Housing Units |
| 1-Person Household | 3,322 | 33.0% |
| 2-Person Household | 3,853 | 38.3% |
| 3-Person Household | 1,217 | 12.1% |
| 4+ Person Household | 1,663 | 16.5% |
| Total Housing Units | 10,055 | 100.0% |
Occupancy by Ownership by Household Size in Barton County
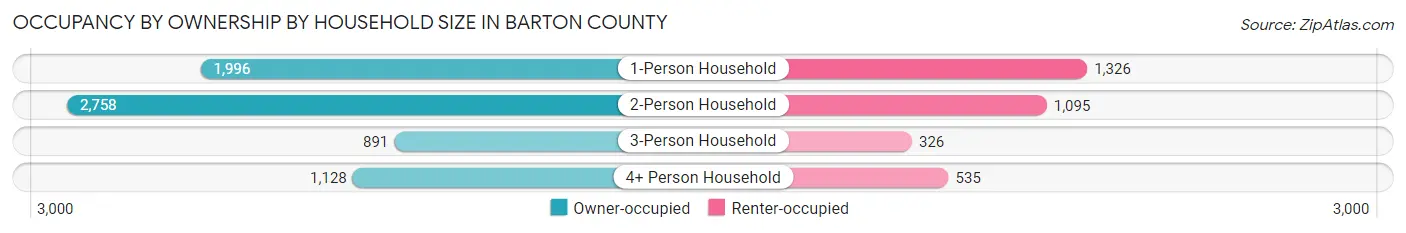
| Household Size | Owner-occupied | Renter-occupied |
| 1-Person Household | 1,996 (60.1%) | 1,326 (39.9%) |
| 2-Person Household | 2,758 (71.6%) | 1,095 (28.4%) |
| 3-Person Household | 891 (73.2%) | 326 (26.8%) |
| 4+ Person Household | 1,128 (67.8%) | 535 (32.2%) |
| Total Housing Units | 6,773 (67.4%) | 3,282 (32.6%) |
Occupancy by Educational Attainment in Barton County
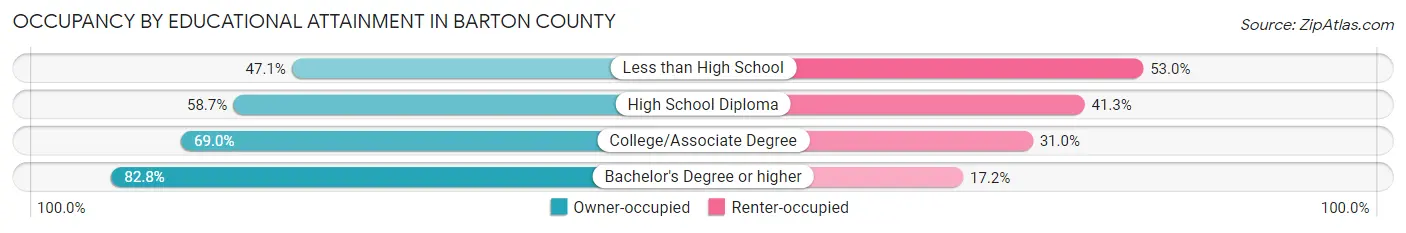
| Household Size | Owner-occupied | Renter-occupied |
| Less than High School | 343 (47.0%) | 386 (52.9%) |
| High School Diploma | 1,755 (58.7%) | 1,236 (41.3%) |
| College/Associate Degree | 2,839 (69.0%) | 1,278 (31.0%) |
| Bachelor's Degree or higher | 1,836 (82.8%) | 382 (17.2%) |
Occupancy by Age of Householder in Barton County
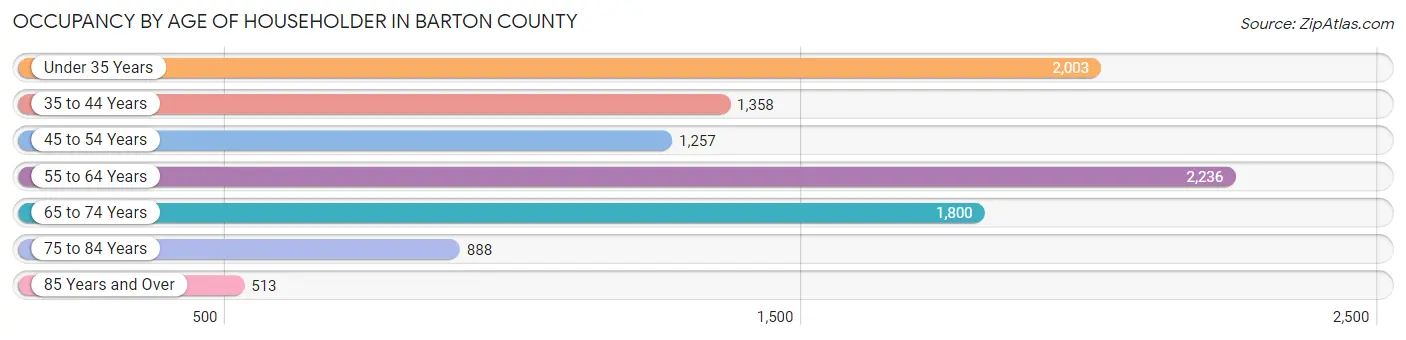
| Age Bracket | # Households | % Households |
| Under 35 Years | 2,003 | 19.9% |
| 35 to 44 Years | 1,358 | 13.5% |
| 45 to 54 Years | 1,257 | 12.5% |
| 55 to 64 Years | 2,236 | 22.2% |
| 65 to 74 Years | 1,800 | 17.9% |
| 75 to 84 Years | 888 | 8.8% |
| 85 Years and Over | 513 | 5.1% |
| Total | 10,055 | 100.0% |
Housing Finances in Barton County
Median Income by Occupancy in Barton County
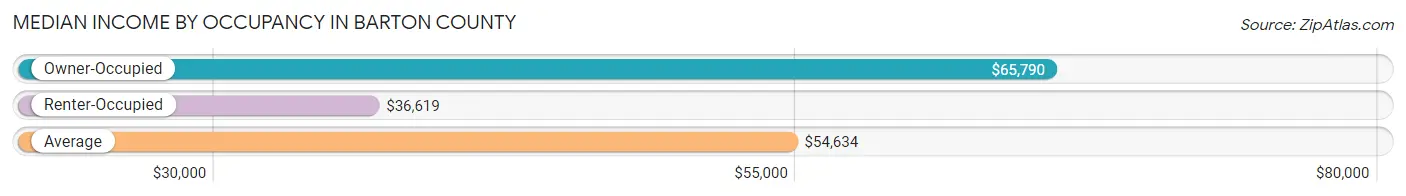
| Occupancy Type | # Households | Median Income |
| Owner-Occupied | 6,773 (67.4%) | $65,790 |
| Renter-Occupied | 3,282 (32.6%) | $36,619 |
| Average | 10,055 (100.0%) | $54,634 |
Occupancy by Householder Income Bracket in Barton County
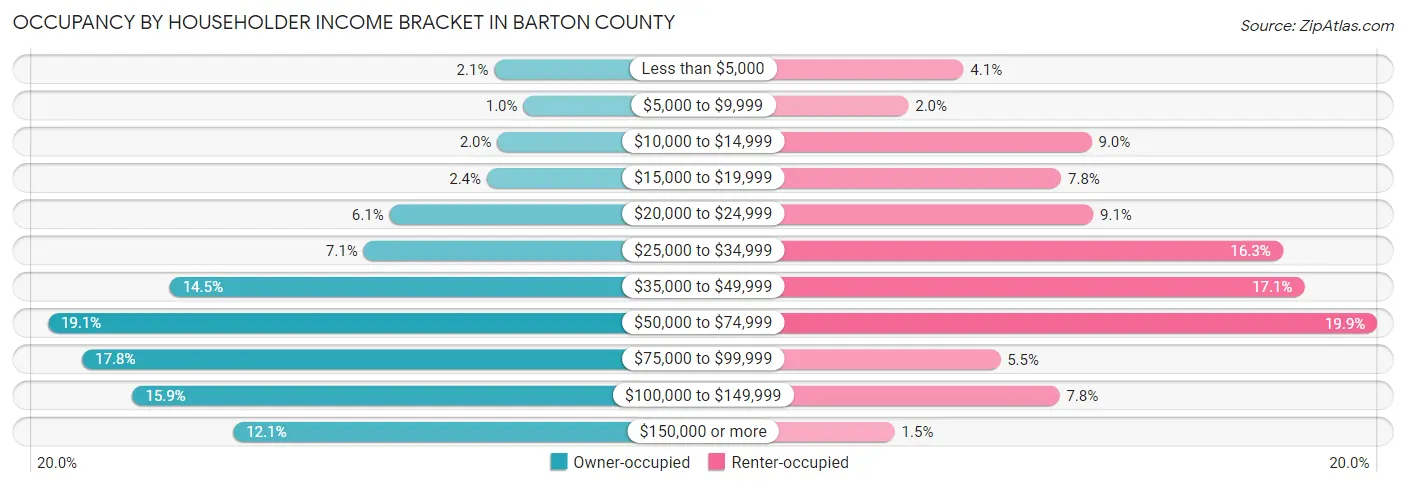
| Income Bracket | Owner-occupied | Renter-occupied |
| Less than $5,000 | 143 (2.1%) | 135 (4.1%) |
| $5,000 to $9,999 | 68 (1.0%) | 66 (2.0%) |
| $10,000 to $14,999 | 135 (2.0%) | 295 (9.0%) |
| $15,000 to $19,999 | 162 (2.4%) | 257 (7.8%) |
| $20,000 to $24,999 | 413 (6.1%) | 297 (9.0%) |
| $25,000 to $34,999 | 480 (7.1%) | 534 (16.3%) |
| $35,000 to $49,999 | 980 (14.5%) | 561 (17.1%) |
| $50,000 to $74,999 | 1,294 (19.1%) | 652 (19.9%) |
| $75,000 to $99,999 | 1,206 (17.8%) | 181 (5.5%) |
| $100,000 to $149,999 | 1,076 (15.9%) | 255 (7.8%) |
| $150,000 or more | 816 (12.0%) | 49 (1.5%) |
| Total | 6,773 (100.0%) | 3,282 (100.0%) |
Monthly Housing Cost Tiers in Barton County
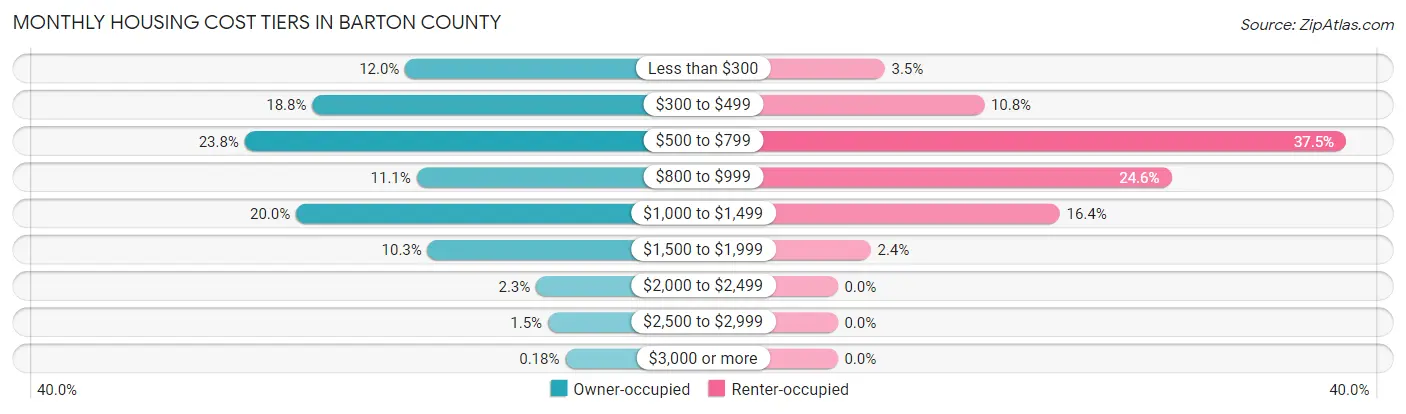
| Monthly Cost | Owner-occupied | Renter-occupied |
| Less than $300 | 811 (12.0%) | 114 (3.5%) |
| $300 to $499 | 1,274 (18.8%) | 354 (10.8%) |
| $500 to $799 | 1,611 (23.8%) | 1,229 (37.4%) |
| $800 to $999 | 754 (11.1%) | 807 (24.6%) |
| $1,000 to $1,499 | 1,355 (20.0%) | 537 (16.4%) |
| $1,500 to $1,999 | 699 (10.3%) | 80 (2.4%) |
| $2,000 to $2,499 | 158 (2.3%) | 0 (0.0%) |
| $2,500 to $2,999 | 99 (1.5%) | 0 (0.0%) |
| $3,000 or more | 12 (0.2%) | 0 (0.0%) |
| Total | 6,773 (100.0%) | 3,282 (100.0%) |
Physical Housing Characteristics in Barton County
Housing Structures in Barton County
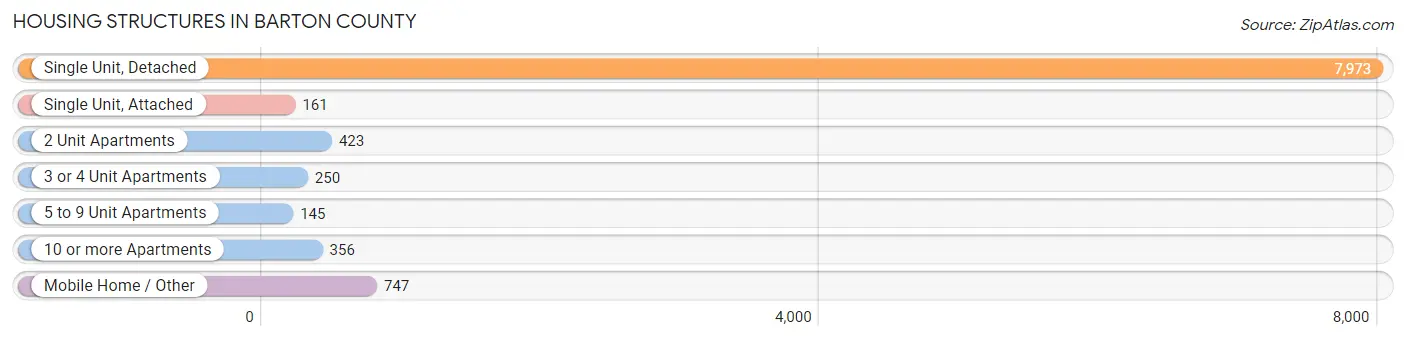
| Structure Type | # Housing Units | % Housing Units |
| Single Unit, Detached | 7,973 | 79.3% |
| Single Unit, Attached | 161 | 1.6% |
| 2 Unit Apartments | 423 | 4.2% |
| 3 or 4 Unit Apartments | 250 | 2.5% |
| 5 to 9 Unit Apartments | 145 | 1.4% |
| 10 or more Apartments | 356 | 3.5% |
| Mobile Home / Other | 747 | 7.4% |
| Total | 10,055 | 100.0% |
Housing Structures by Occupancy in Barton County
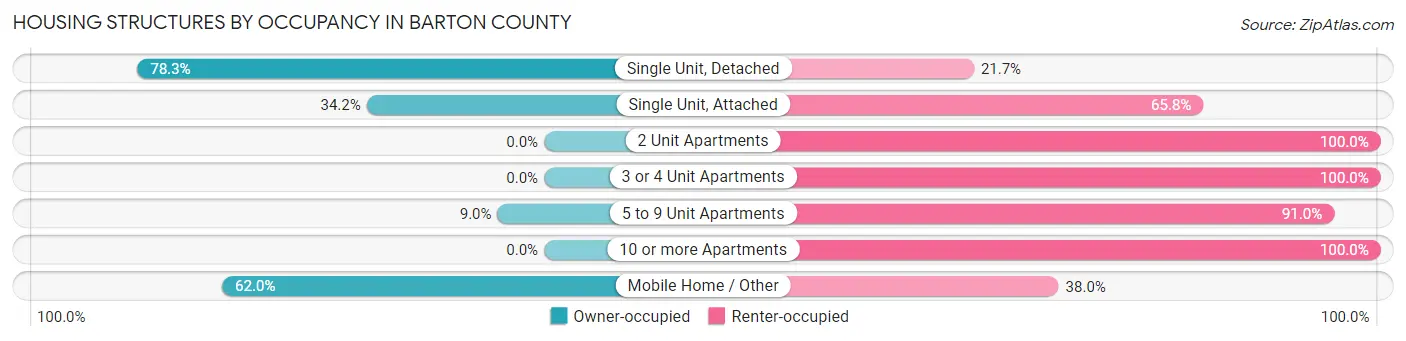
| Structure Type | Owner-occupied | Renter-occupied |
| Single Unit, Detached | 6,242 (78.3%) | 1,731 (21.7%) |
| Single Unit, Attached | 55 (34.2%) | 106 (65.8%) |
| 2 Unit Apartments | 0 (0.0%) | 423 (100.0%) |
| 3 or 4 Unit Apartments | 0 (0.0%) | 250 (100.0%) |
| 5 to 9 Unit Apartments | 13 (9.0%) | 132 (91.0%) |
| 10 or more Apartments | 0 (0.0%) | 356 (100.0%) |
| Mobile Home / Other | 463 (62.0%) | 284 (38.0%) |
| Total | 6,773 (67.4%) | 3,282 (32.6%) |
Housing Structures by Number of Rooms in Barton County
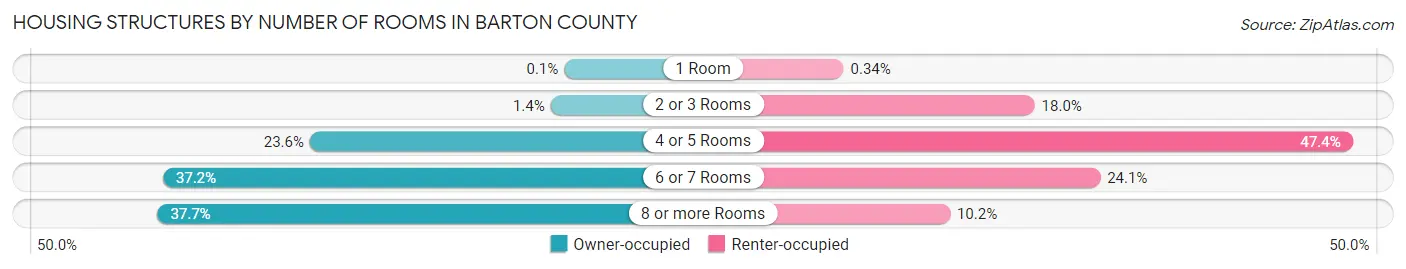
| Number of Rooms | Owner-occupied | Renter-occupied |
| 1 Room | 7 (0.1%) | 11 (0.3%) |
| 2 or 3 Rooms | 92 (1.4%) | 591 (18.0%) |
| 4 or 5 Rooms | 1,600 (23.6%) | 1,556 (47.4%) |
| 6 or 7 Rooms | 2,520 (37.2%) | 790 (24.1%) |
| 8 or more Rooms | 2,554 (37.7%) | 334 (10.2%) |
| Total | 6,773 (100.0%) | 3,282 (100.0%) |
Housing Structure by Heating Type in Barton County
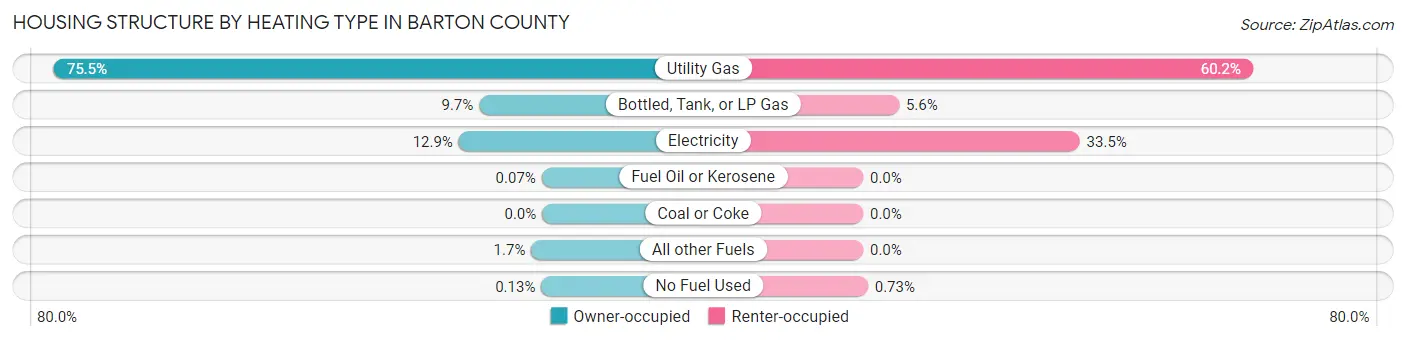
| Heating Type | Owner-occupied | Renter-occupied |
| Utility Gas | 5,112 (75.5%) | 1,977 (60.2%) |
| Bottled, Tank, or LP Gas | 660 (9.7%) | 182 (5.6%) |
| Electricity | 873 (12.9%) | 1,099 (33.5%) |
| Fuel Oil or Kerosene | 5 (0.1%) | 0 (0.0%) |
| Coal or Coke | 0 (0.0%) | 0 (0.0%) |
| All other Fuels | 114 (1.7%) | 0 (0.0%) |
| No Fuel Used | 9 (0.1%) | 24 (0.7%) |
| Total | 6,773 (100.0%) | 3,282 (100.0%) |
Household Vehicle Usage in Barton County
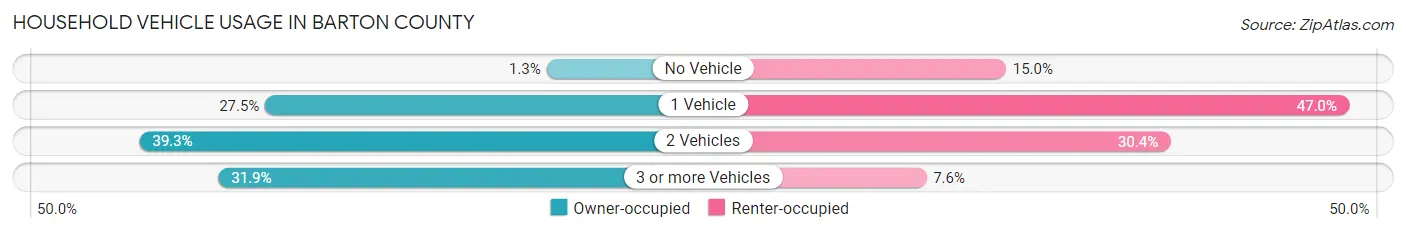
| Vehicles per Household | Owner-occupied | Renter-occupied |
| No Vehicle | 86 (1.3%) | 493 (15.0%) |
| 1 Vehicle | 1,865 (27.5%) | 1,544 (47.0%) |
| 2 Vehicles | 2,661 (39.3%) | 996 (30.3%) |
| 3 or more Vehicles | 2,161 (31.9%) | 249 (7.6%) |
| Total | 6,773 (100.0%) | 3,282 (100.0%) |
Real Estate & Mortgages in Barton County
Real Estate and Mortgage Overview in Barton County
| Characteristic | Without Mortgage | With Mortgage |
| Housing Units | 3,853 | 2,920 |
| Median Property Value | $103,400 | $129,500 |
| Median Household Income | $54,697 | $374 |
| Monthly Housing Costs | $487 | $10 |
| Real Estate Taxes | $1,795 | $65 |
Property Value by Mortgage Status in Barton County
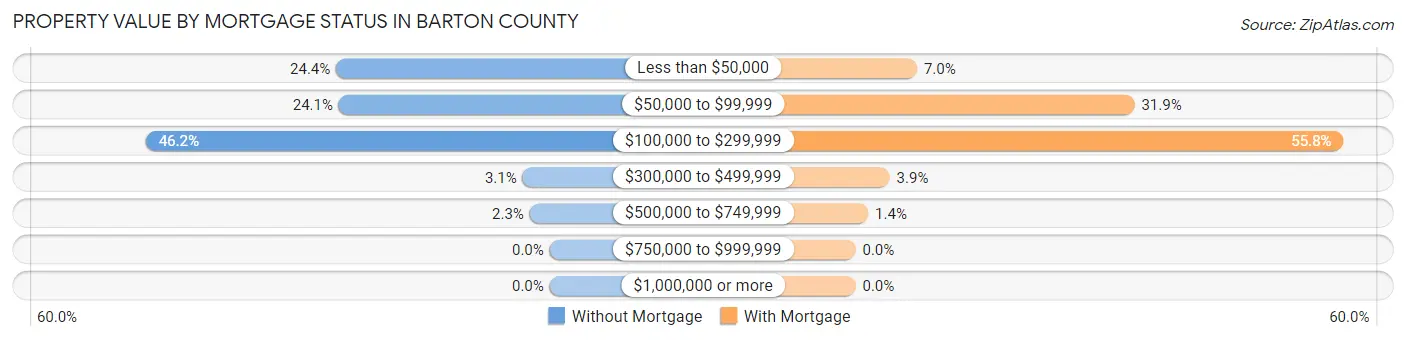
| Property Value | Without Mortgage | With Mortgage |
| Less than $50,000 | 940 (24.4%) | 205 (7.0%) |
| $50,000 to $99,999 | 928 (24.1%) | 931 (31.9%) |
| $100,000 to $299,999 | 1,778 (46.2%) | 1,628 (55.7%) |
| $300,000 to $499,999 | 119 (3.1%) | 114 (3.9%) |
| $500,000 to $749,999 | 88 (2.3%) | 42 (1.4%) |
| $750,000 to $999,999 | 0 (0.0%) | 0 (0.0%) |
| $1,000,000 or more | 0 (0.0%) | 0 (0.0%) |
| Total | 3,853 (100.0%) | 2,920 (100.0%) |
Household Income by Mortgage Status in Barton County
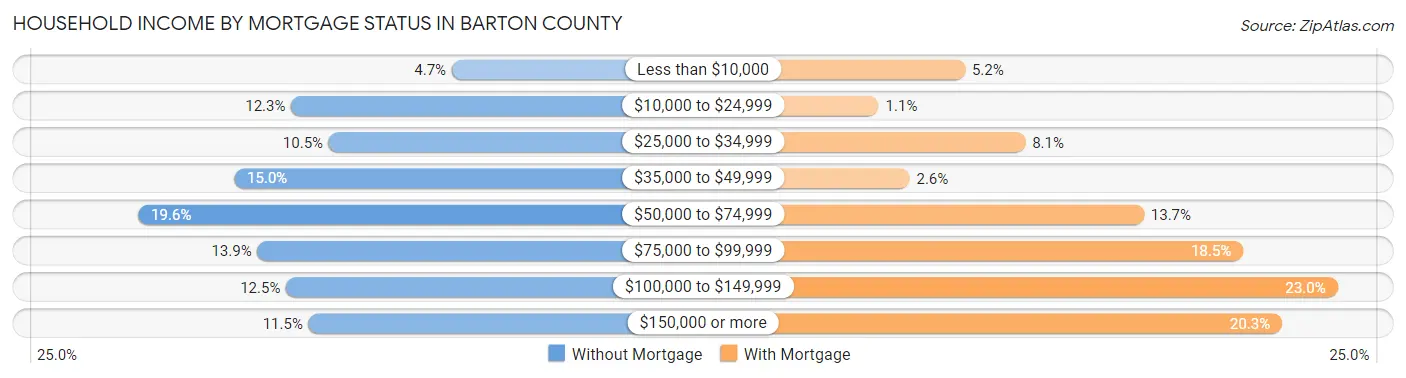
| Household Income | Without Mortgage | With Mortgage |
| Less than $10,000 | 179 (4.6%) | 152 (5.2%) |
| $10,000 to $24,999 | 474 (12.3%) | 32 (1.1%) |
| $25,000 to $34,999 | 405 (10.5%) | 236 (8.1%) |
| $35,000 to $49,999 | 579 (15.0%) | 75 (2.6%) |
| $50,000 to $74,999 | 755 (19.6%) | 401 (13.7%) |
| $75,000 to $99,999 | 536 (13.9%) | 539 (18.5%) |
| $100,000 to $149,999 | 483 (12.5%) | 670 (23.0%) |
| $150,000 or more | 442 (11.5%) | 593 (20.3%) |
| Total | 3,853 (100.0%) | 2,920 (100.0%) |
Property Value to Household Income Ratio in Barton County
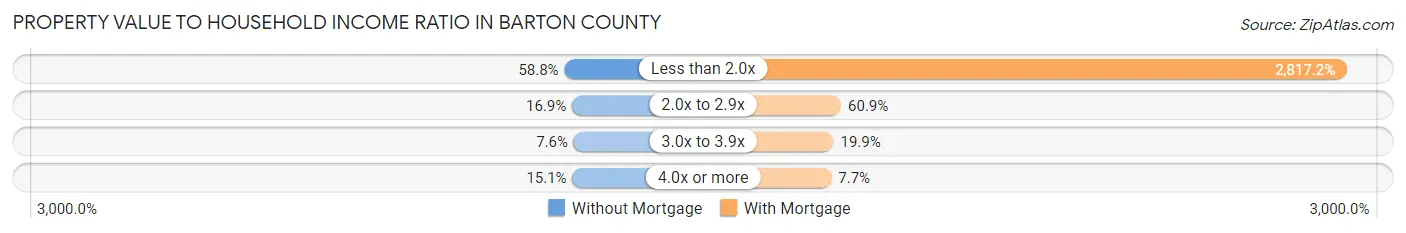
| Value-to-Income Ratio | Without Mortgage | With Mortgage |
| Less than 2.0x | 2,265 (58.8%) | 82,263 (2,817.2%) |
| 2.0x to 2.9x | 652 (16.9%) | 1,779 (60.9%) |
| 3.0x to 3.9x | 292 (7.6%) | 581 (19.9%) |
| 4.0x or more | 581 (15.1%) | 224 (7.7%) |
| Total | 3,853 (100.0%) | 2,920 (100.0%) |
Real Estate Taxes by Mortgage Status in Barton County
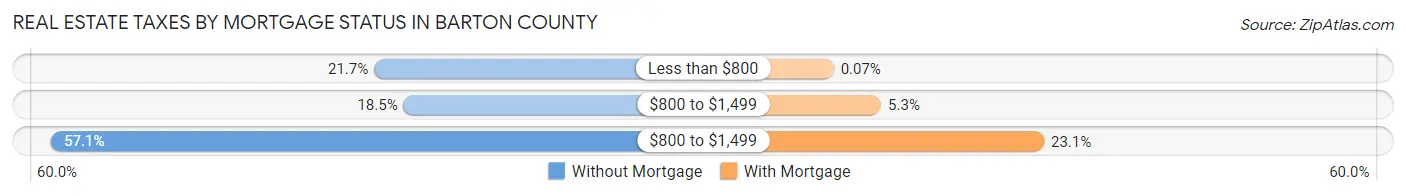
| Property Taxes | Without Mortgage | With Mortgage |
| Less than $800 | 836 (21.7%) | 2 (0.1%) |
| $800 to $1,499 | 712 (18.5%) | 154 (5.3%) |
| $800 to $1,499 | 2,200 (57.1%) | 675 (23.1%) |
| Total | 3,853 (100.0%) | 2,920 (100.0%) |
Health & Disability in Barton County
Health Insurance Coverage by Age in Barton County
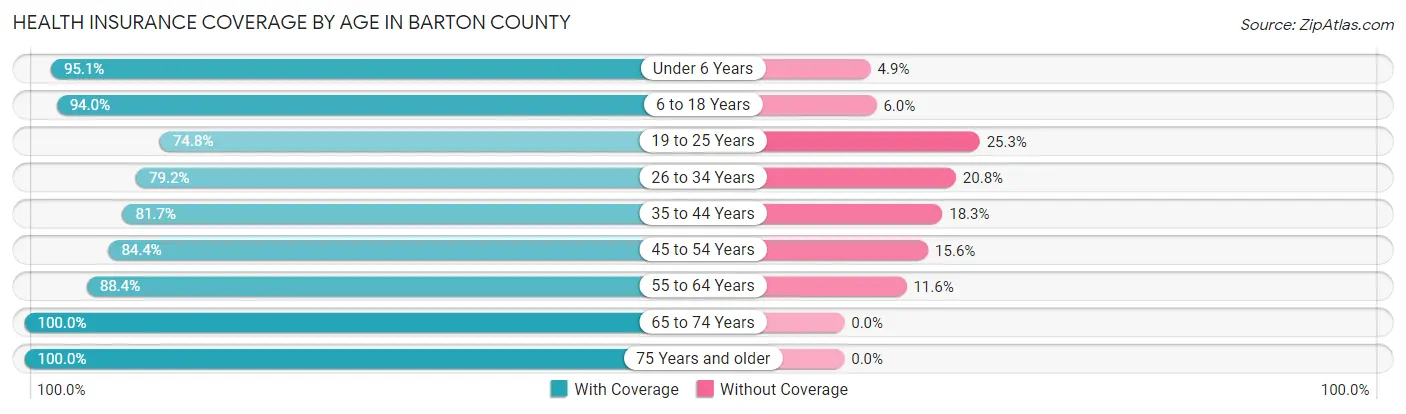
| Age Bracket | With Coverage | Without Coverage |
| Under 6 Years | 1,834 (95.1%) | 95 (4.9%) |
| 6 to 18 Years | 4,164 (94.0%) | 266 (6.0%) |
| 19 to 25 Years | 1,483 (74.8%) | 501 (25.3%) |
| 26 to 34 Years | 2,420 (79.2%) | 636 (20.8%) |
| 35 to 44 Years | 2,258 (81.7%) | 505 (18.3%) |
| 45 to 54 Years | 1,926 (84.4%) | 357 (15.6%) |
| 55 to 64 Years | 3,200 (88.4%) | 420 (11.6%) |
| 65 to 74 Years | 2,882 (100.0%) | 0 (0.0%) |
| 75 Years and older | 2,150 (100.0%) | 0 (0.0%) |
| Total | 22,317 (88.9%) | 2,780 (11.1%) |
Health Insurance Coverage by Citizenship Status in Barton County
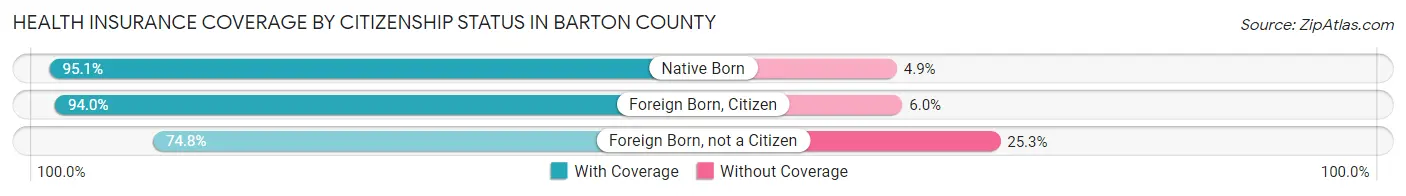
| Citizenship Status | With Coverage | Without Coverage |
| Native Born | 1,834 (95.1%) | 95 (4.9%) |
| Foreign Born, Citizen | 4,164 (94.0%) | 266 (6.0%) |
| Foreign Born, not a Citizen | 1,483 (74.8%) | 501 (25.3%) |
Health Insurance Coverage by Household Income in Barton County
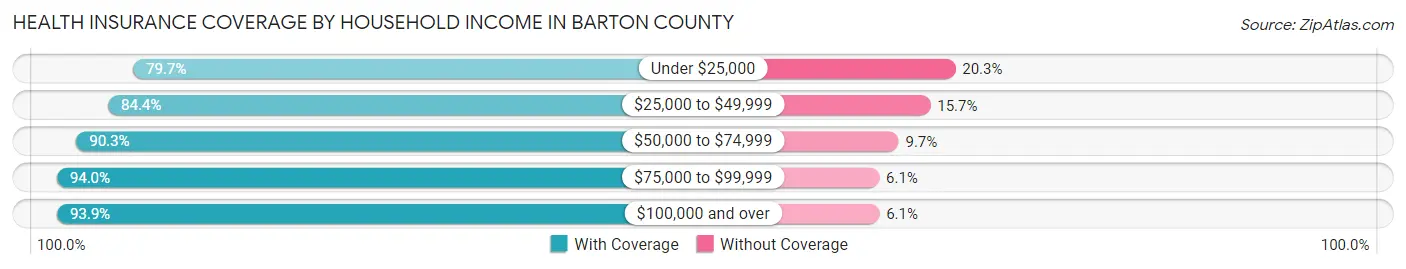
| Household Income | With Coverage | Without Coverage |
| Under $25,000 | 3,010 (79.7%) | 768 (20.3%) |
| $25,000 to $49,999 | 4,804 (84.4%) | 891 (15.7%) |
| $50,000 to $74,999 | 3,765 (90.3%) | 404 (9.7%) |
| $75,000 to $99,999 | 3,807 (94.0%) | 245 (6.0%) |
| $100,000 and over | 6,822 (93.9%) | 441 (6.1%) |
Public vs Private Health Insurance Coverage by Age in Barton County
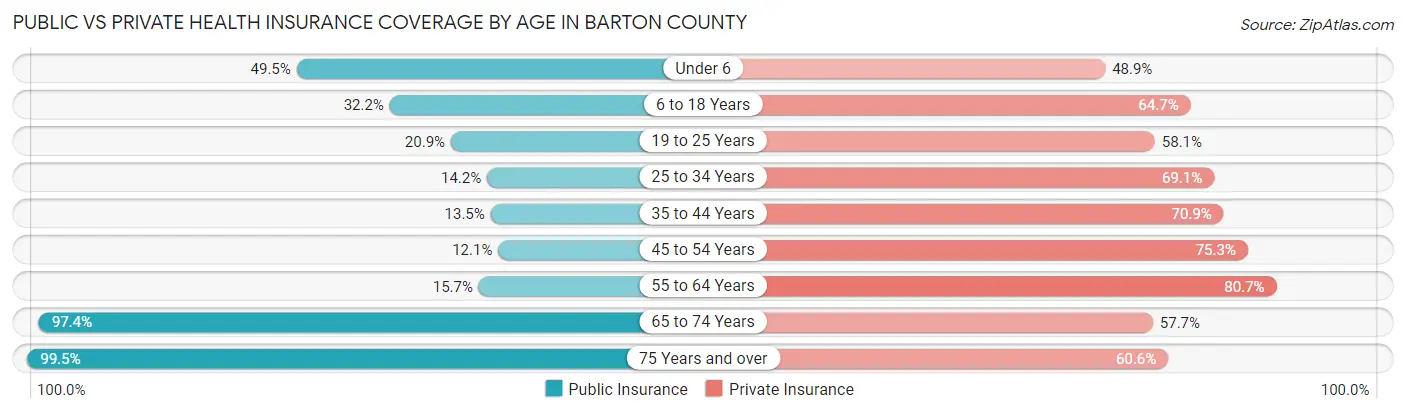
| Age Bracket | Public Insurance | Private Insurance |
| Under 6 | 955 (49.5%) | 943 (48.9%) |
| 6 to 18 Years | 1,428 (32.2%) | 2,868 (64.7%) |
| 19 to 25 Years | 414 (20.9%) | 1,153 (58.1%) |
| 25 to 34 Years | 433 (14.2%) | 2,111 (69.1%) |
| 35 to 44 Years | 373 (13.5%) | 1,958 (70.9%) |
| 45 to 54 Years | 276 (12.1%) | 1,720 (75.3%) |
| 55 to 64 Years | 568 (15.7%) | 2,920 (80.7%) |
| 65 to 74 Years | 2,806 (97.4%) | 1,664 (57.7%) |
| 75 Years and over | 2,139 (99.5%) | 1,302 (60.6%) |
| Total | 9,392 (37.4%) | 16,639 (66.3%) |
Disability Status by Sex by Age in Barton County
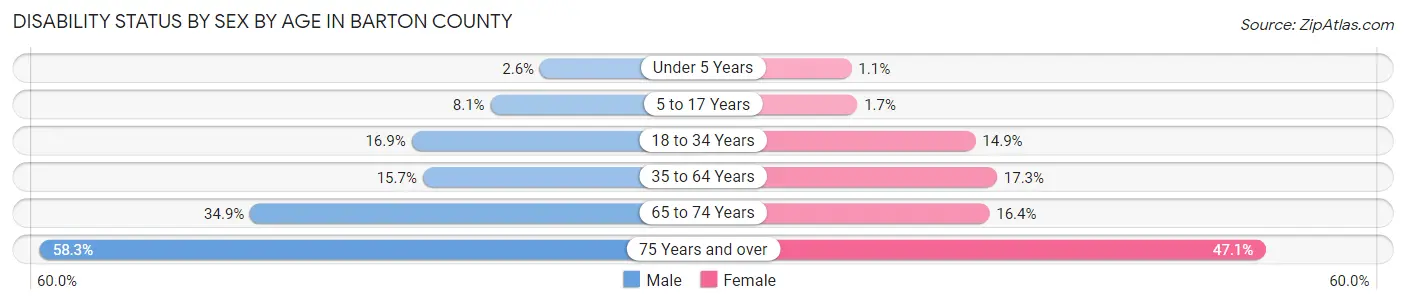
| Age Bracket | Male | Female |
| Under 5 Years | 22 (2.6%) | 8 (1.1%) |
| 5 to 17 Years | 180 (8.1%) | 39 (1.7%) |
| 18 to 34 Years | 437 (16.9%) | 406 (14.9%) |
| 35 to 64 Years | 695 (15.7%) | 730 (17.3%) |
| 65 to 74 Years | 466 (34.9%) | 254 (16.4%) |
| 75 Years and over | 541 (58.3%) | 576 (47.1%) |
Disability Class by Sex by Age in Barton County
Disability Class: Hearing Difficulty
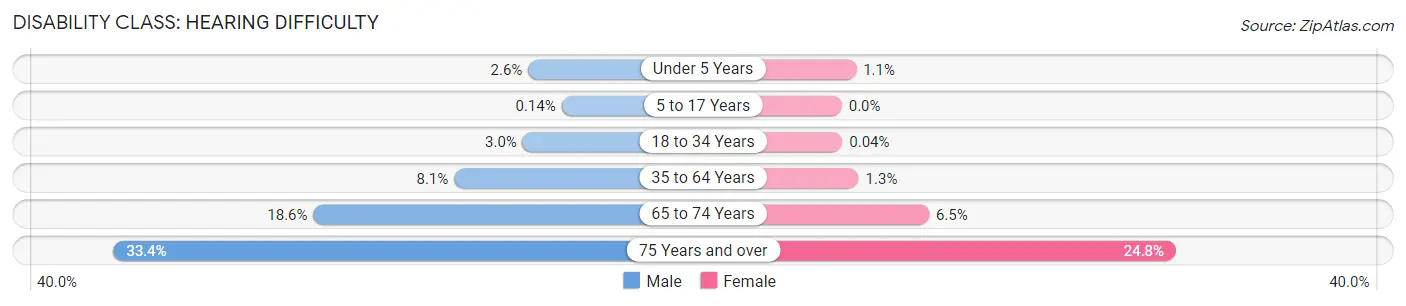
| Age Bracket | Male | Female |
| Under 5 Years | 22 (2.6%) | 8 (1.1%) |
| 5 to 17 Years | 3 (0.1%) | 0 (0.0%) |
| 18 to 34 Years | 78 (3.0%) | 1 (0.0%) |
| 35 to 64 Years | 360 (8.1%) | 53 (1.3%) |
| 65 to 74 Years | 248 (18.6%) | 100 (6.5%) |
| 75 Years and over | 310 (33.4%) | 303 (24.8%) |
Disability Class: Vision Difficulty
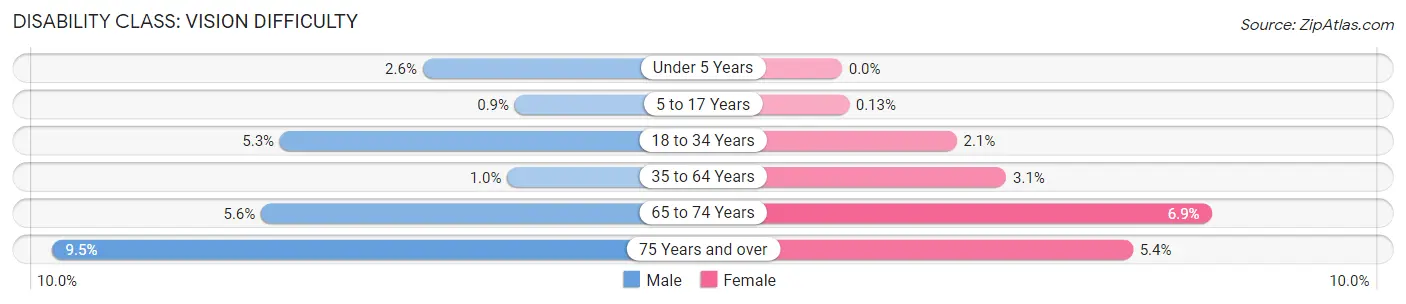
| Age Bracket | Male | Female |
| Under 5 Years | 22 (2.6%) | 0 (0.0%) |
| 5 to 17 Years | 20 (0.9%) | 3 (0.1%) |
| 18 to 34 Years | 136 (5.3%) | 58 (2.1%) |
| 35 to 64 Years | 46 (1.0%) | 129 (3.0%) |
| 65 to 74 Years | 75 (5.6%) | 106 (6.9%) |
| 75 Years and over | 88 (9.5%) | 66 (5.4%) |
Disability Class: Cognitive Difficulty
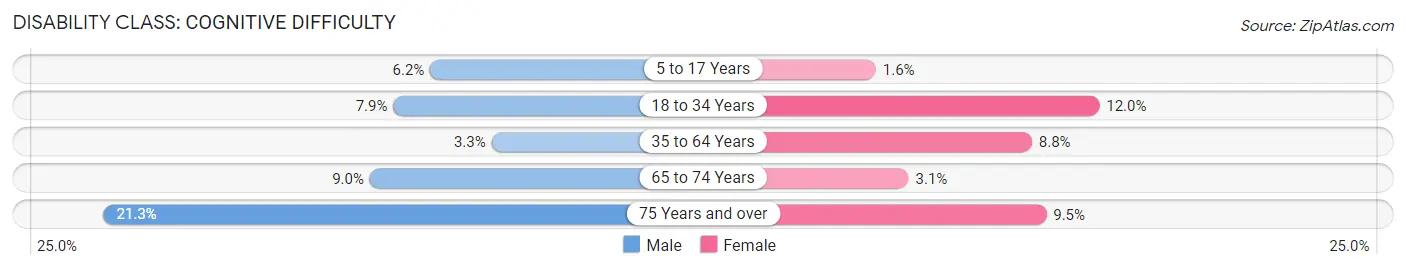
| Age Bracket | Male | Female |
| 5 to 17 Years | 137 (6.2%) | 36 (1.6%) |
| 18 to 34 Years | 204 (7.9%) | 326 (11.9%) |
| 35 to 64 Years | 148 (3.3%) | 373 (8.8%) |
| 65 to 74 Years | 120 (9.0%) | 48 (3.1%) |
| 75 Years and over | 198 (21.3%) | 116 (9.5%) |
Disability Class: Ambulatory Difficulty
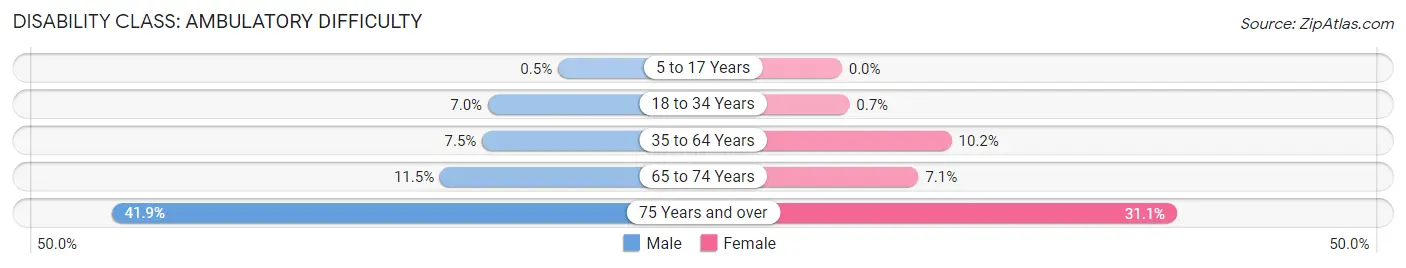
| Age Bracket | Male | Female |
| 5 to 17 Years | 11 (0.5%) | 0 (0.0%) |
| 18 to 34 Years | 181 (7.0%) | 19 (0.7%) |
| 35 to 64 Years | 334 (7.5%) | 431 (10.2%) |
| 65 to 74 Years | 153 (11.5%) | 110 (7.1%) |
| 75 Years and over | 389 (41.9%) | 380 (31.1%) |
Disability Class: Self-Care Difficulty
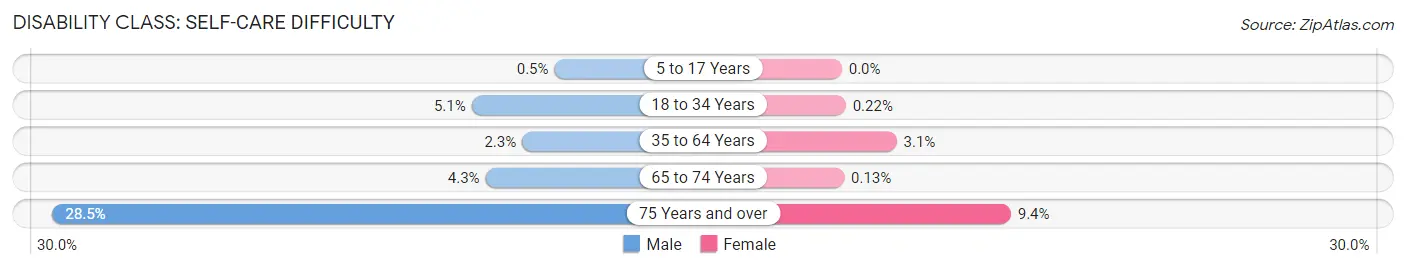
| Age Bracket | Male | Female |
| 5 to 17 Years | 11 (0.5%) | 0 (0.0%) |
| 18 to 34 Years | 132 (5.1%) | 6 (0.2%) |
| 35 to 64 Years | 102 (2.3%) | 129 (3.0%) |
| 65 to 74 Years | 58 (4.3%) | 2 (0.1%) |
| 75 Years and over | 264 (28.4%) | 115 (9.4%) |
Technology Access in Barton County
Computing Device Access in Barton County
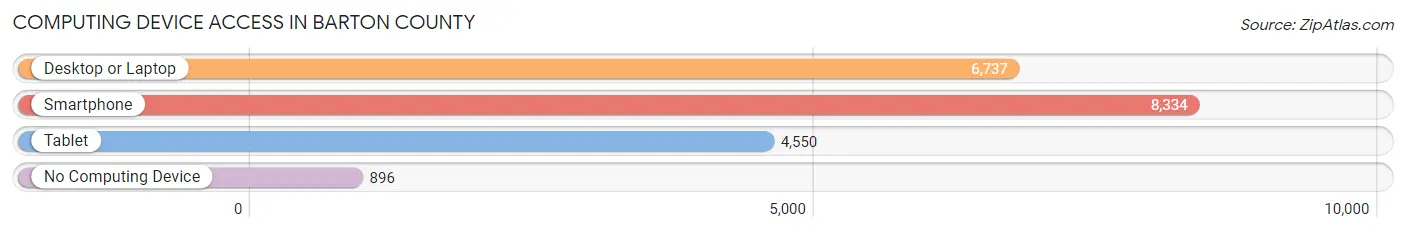
| Device Type | # Households | % Households |
| Desktop or Laptop | 6,737 | 67.0% |
| Smartphone | 8,334 | 82.9% |
| Tablet | 4,550 | 45.3% |
| No Computing Device | 896 | 8.9% |
| Total | 10,055 | 100.0% |
Internet Access in Barton County
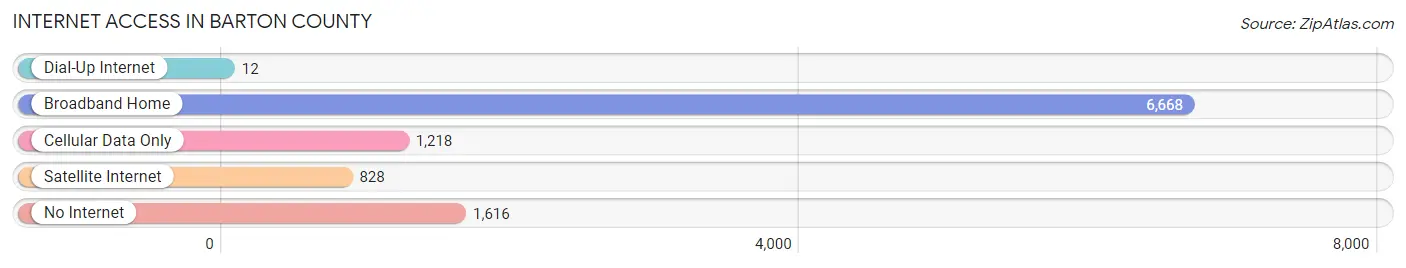
| Internet Type | # Households | % Households |
| Dial-Up Internet | 12 | 0.1% |
| Broadband Home | 6,668 | 66.3% |
| Cellular Data Only | 1,218 | 12.1% |
| Satellite Internet | 828 | 8.2% |
| No Internet | 1,616 | 16.1% |
| Total | 10,055 | 100.0% |
Barton County Summary
Barton County, Kansas is located in the south-central region of the state and is part of the Great Plains region. The county was established in 1867 and is named after Clara Barton, the founder of the American Red Cross. Barton County is bordered by Ellsworth County to the north, Russell County to the east, Stafford County to the south, and Pawnee County to the west. The county seat is located in Great Bend, which is also the largest city in the county.
Geography
Barton County covers an area of 1,072 square miles and is located in the Great Plains region of Kansas. The county is mostly flat with some rolling hills and is mostly covered in prairie grasses. The Arkansas River runs through the county and is a major source of water for the area. The county is also home to several small lakes and ponds, including Cheyenne Bottoms, which is a major migratory bird habitat.
The climate in Barton County is generally semi-arid, with hot summers and cold winters. The average annual temperature is around 54 degrees Fahrenheit, with average highs in the summer reaching around 90 degrees and average lows in the winter reaching around 20 degrees. The average annual precipitation is around 22 inches, with most of it falling in the spring and summer months.
Demographics
As of the 2010 census, Barton County had a population of 27,674. The population was spread out with 24.3% under the age of 18, 8.2% from 18 to 24, 25.2% from 25 to 44, 25.2% from 45 to 64, and 17.1% who were 65 years of age or older. The median age was 38.4 years. The gender makeup of the county was 49.7% male and 50.3% female.
The racial makeup of the county was 92.2% White, 0.7% African American, 0.5% Native American, 0.4% Asian, 0.1% Pacific Islander, 4.3% from other races, and 1.8% from two or more races. Hispanic or Latino of any race were 8.7% of the population.
Economy
Barton County’s economy is largely based on agriculture, with the majority of the county’s land being used for farming and ranching. The county is also home to several manufacturing and industrial businesses, including a large ethanol plant. The county is also home to several oil and gas production companies.
The median household income in Barton County was $45,845 in 2019, and the median family income was $54,845. The per capita income was $24,845. About 11.2% of the population was below the poverty line.
Conclusion
Barton County, Kansas is located in the south-central region of the state and is part of the Great Plains region. The county was established in 1867 and is named after Clara Barton, the founder of the American Red Cross. The county covers an area of 1,072 square miles and is mostly flat with some rolling hills and is mostly covered in prairie grasses. The population of Barton County was 27,674 as of the 2010 census, and the median household income was $45,845 in 2019. The economy of the county is largely based on agriculture, with the majority of the county’s land being used for farming and ranching. The county is also home to several manufacturing and industrial businesses, including a large ethanol plant.
Common Questions
What is the Total Population of Barton County?
Total Population of Barton County is 25,477.
What is the Total Male Population of Barton County?
Total Male Population of Barton County is 12,548.
What is the Total Female Population of Barton County?
Total Female Population of Barton County is 12,929.
What is the Ratio of Males per 100 Females in Barton County?
There are 97.05 Males per 100 Females in Barton County.
What is the Ratio of Females per 100 Males in Barton County?
There are 103.04 Females per 100 Males in Barton County.
What is the Median Population Age in Barton County?
Median Population Age in Barton County is 39.2 Years.
What is the Average Family Size in Barton County
Average Family Size in Barton County is 3.1 People.
What is the Average Household Size in Barton County
Average Household Size in Barton County is 2.5 People.
What is Per Capita Income in Barton County?
Per Capita income in Barton County is $31,516.
What is the Median Family Income in Barton County?
Median Family Income in Barton County is $72,172.
What is the Median Household income in Barton County?
Median Household Income in Barton County is $54,634.
What is Income or Wage Gap in Barton County?
Income or Wage Gap in Barton County is 33.1%.
Women in Barton County earn 66.9 cents for every dollar earned by a man.
What is Family Income Deficit in Barton County?
Family Income Deficit in Barton County is $11,616.
Families that are below poverty line in Barton County earn $11,616 less on average than the poverty threshold level.
What is Inequality or Gini Index in Barton County?
Inequality or Gini Index in Barton County is 0.43.
How Large is the Labor Force in Barton County?
There are 12,945 People in the Labor Forcein in Barton County.
What is the Percentage of People in the Labor Force in Barton County?
64.4% of People are in the Labor Force in Barton County.
What is the Unemployment Rate in Barton County?
Unemployment Rate in Barton County is 4.1%.