Anderson County, KS
Anderson County Map

Anderson County Overview
7,799
TOTAL POPULATION
3,886
MALE POPULATION
3,913
FEMALE POPULATION
99.31
MALES / 100 FEMALES
100.69
FEMALES / 100 MALES
39.7
MEDIAN AGE
3.0
AVG FAMILY SIZE
2.4
AVG HOUSEHOLD SIZE
$29,665
PER CAPITA INCOME
$79,089
AVG FAMILY INCOME
$67,651
AVG HOUSEHOLD INCOME
30.6%
WAGE / INCOME GAP [ % ]
69.4¢/ $1
WAGE / INCOME GAP [ $ ]
0.42
INEQUALITY / GINI INDEX
3,649
LABOR FORCE [ PEOPLE ]
60.1%
PERCENT IN LABOR FORCE
3.3%
UNEMPLOYMENT RATE
Race in Anderson County
The most populous races in Anderson County are White / Caucasian (7,369 | 94.5%), Two or more Races (264 | 3.4%), and Hispanic or Latino (204 | 2.6%).

| Race | # Population | % Population |
| Asian | 4 | 0.1% |
| Black / African American | 77 | 1.0% |
| Hawaiian / Pacific | 0 | 0.0% |
| Hispanic or Latino | 204 | 2.6% |
| Native / Alaskan | 67 | 0.9% |
| White / Caucasian | 7,369 | 94.5% |
| Two or more Races | 264 | 3.4% |
| Some other Race | 18 | 0.2% |
| Total | 7,799 | 100.0% |
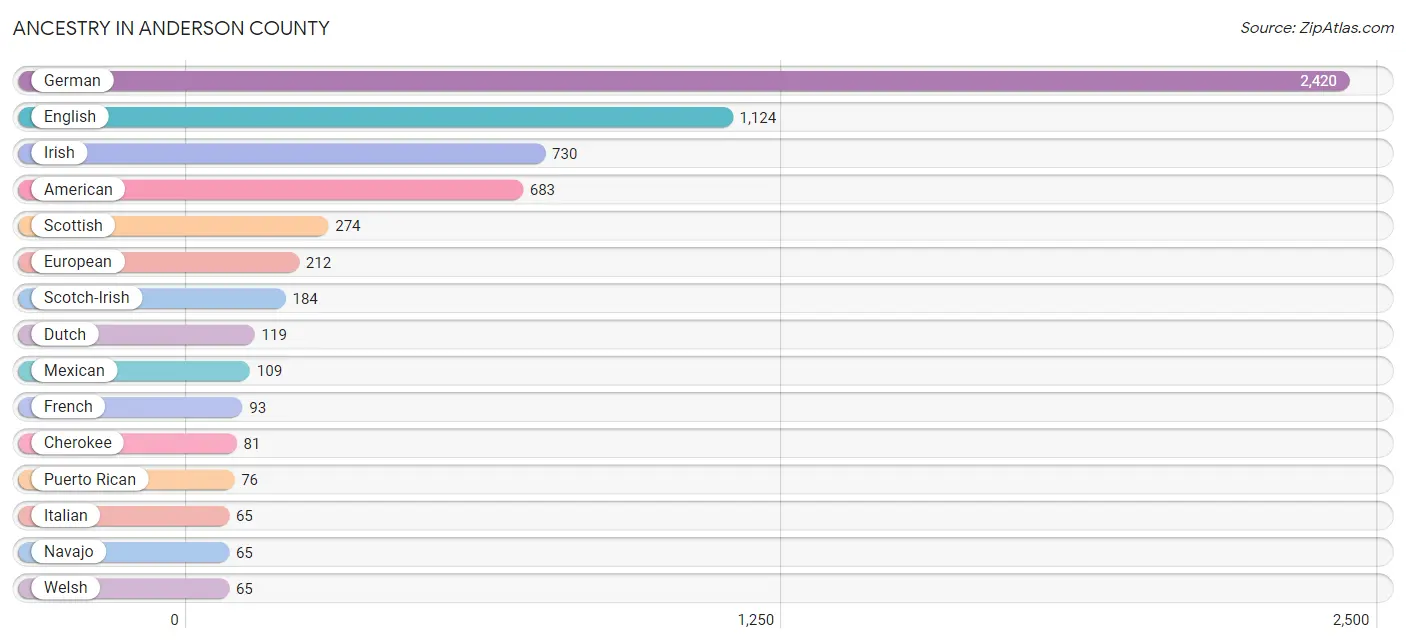
Ancestry in Anderson County
The most populous ancestries reported in Anderson County are German (2,420 | 31.0%), English (1,124 | 14.4%), Irish (730 | 9.4%), American (683 | 8.8%), and Scottish (274 | 3.5%), together accounting for 67.1% of all Anderson County residents.
| Ancestry | # Population | % Population |
| American | 683 | 8.8% |
| Arab | 4 | 0.1% |
| Austrian | 6 | 0.1% |
| British | 7 | 0.1% |
| Cherokee | 81 | 1.0% |
| Chickasaw | 3 | 0.0% |
| Colombian | 19 | 0.2% |
| Czech | 40 | 0.5% |
| Danish | 43 | 0.5% |
| Dutch | 119 | 1.5% |
| Eastern European | 14 | 0.2% |
| Egyptian | 4 | 0.1% |
| English | 1,124 | 14.4% |
| European | 212 | 2.7% |
| French | 93 | 1.2% |
| French Canadian | 6 | 0.1% |
| German | 2,420 | 31.0% |
| Iranian | 4 | 0.1% |
| Irish | 730 | 9.4% |
| Italian | 65 | 0.8% |
| Korean | 4 | 0.1% |
| Mexican | 109 | 1.4% |
| Navajo | 65 | 0.8% |
| Norwegian | 3 | 0.0% |
| Polish | 53 | 0.7% |
| Puerto Rican | 76 | 1.0% |
| Russian | 7 | 0.1% |
| Scandinavian | 25 | 0.3% |
| Scotch-Irish | 184 | 2.4% |
| Scottish | 274 | 3.5% |
| Sioux | 56 | 0.7% |
| Slovak | 40 | 0.5% |
| South American | 19 | 0.2% |
| Swedish | 31 | 0.4% |
| Swiss | 48 | 0.6% |
| Welsh | 65 | 0.8% | View All 36 Rows |
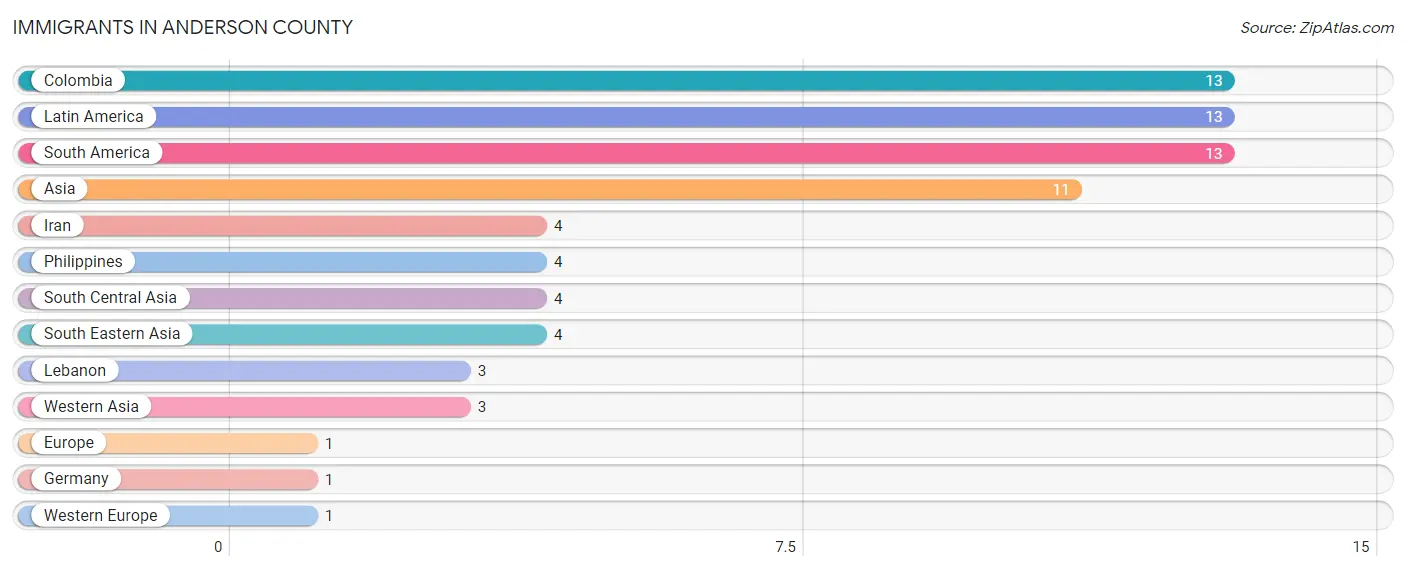
Immigrants in Anderson County
The most numerous immigrant groups reported in Anderson County came from Colombia (13 | 0.2%), Latin America (13 | 0.2%), South America (13 | 0.2%), Asia (11 | 0.1%), and Iran (4 | 0.1%), together accounting for 0.7% of all Anderson County residents.
| Immigration Origin | # Population | % Population |
| Asia | 11 | 0.1% |
| Colombia | 13 | 0.2% |
| Europe | 1 | 0.0% |
| Germany | 1 | 0.0% |
| Iran | 4 | 0.1% |
| Latin America | 13 | 0.2% |
| Lebanon | 3 | 0.0% |
| Philippines | 4 | 0.1% |
| South America | 13 | 0.2% |
| South Central Asia | 4 | 0.1% |
| South Eastern Asia | 4 | 0.1% |
| Western Asia | 3 | 0.0% |
| Western Europe | 1 | 0.0% | View All 13 Rows |
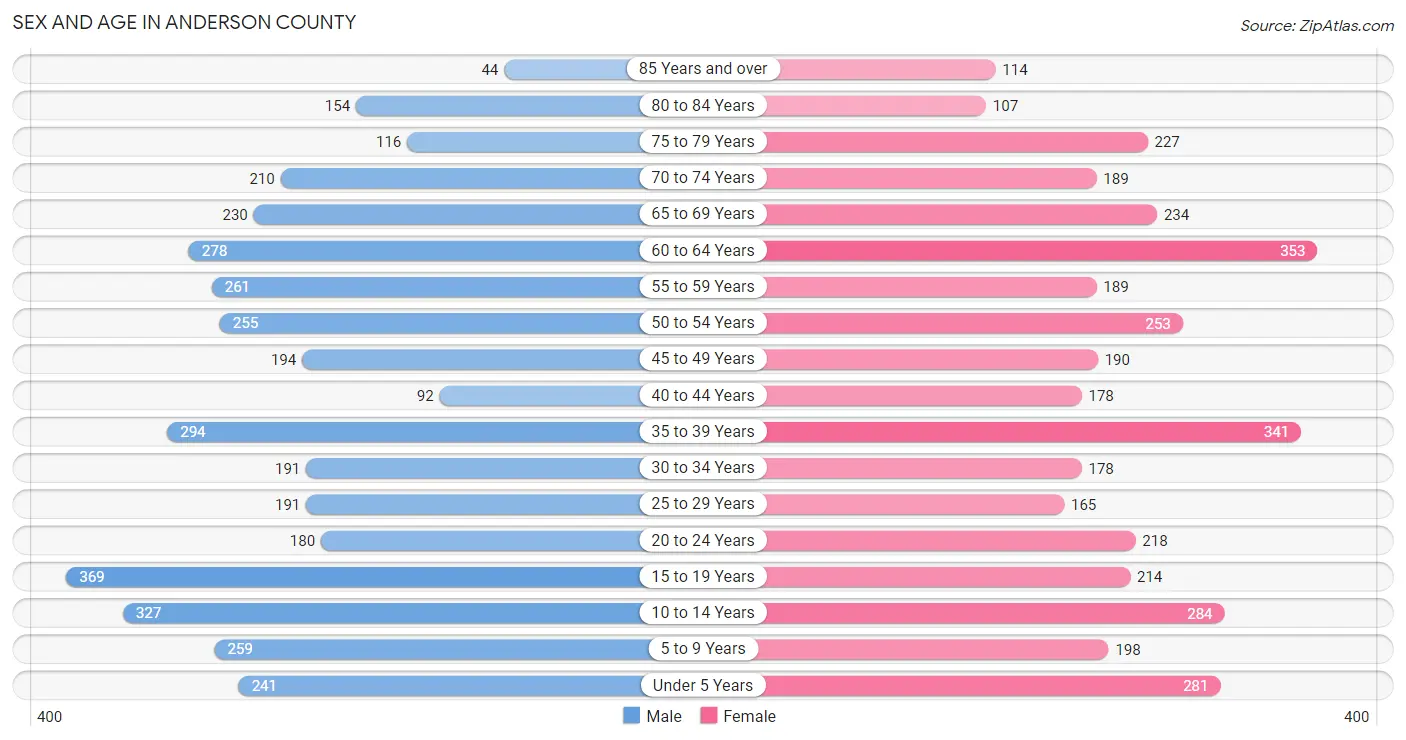
Sex and Age in Anderson County
Sex and Age in Anderson County
The most populous age groups in Anderson County are 15 to 19 Years (369 | 9.5%) for men and 60 to 64 Years (353 | 9.0%) for women.
| Age Bracket | Male | Female |
| Under 5 Years | 241 (6.2%) | 281 (7.2%) |
| 5 to 9 Years | 259 (6.7%) | 198 (5.1%) |
| 10 to 14 Years | 327 (8.4%) | 284 (7.3%) |
| 15 to 19 Years | 369 (9.5%) | 214 (5.5%) |
| 20 to 24 Years | 180 (4.6%) | 218 (5.6%) |
| 25 to 29 Years | 191 (4.9%) | 165 (4.2%) |
| 30 to 34 Years | 191 (4.9%) | 178 (4.5%) |
| 35 to 39 Years | 294 (7.6%) | 341 (8.7%) |
| 40 to 44 Years | 92 (2.4%) | 178 (4.5%) |
| 45 to 49 Years | 194 (5.0%) | 190 (4.9%) |
| 50 to 54 Years | 255 (6.6%) | 253 (6.5%) |
| 55 to 59 Years | 261 (6.7%) | 189 (4.8%) |
| 60 to 64 Years | 278 (7.1%) | 353 (9.0%) |
| 65 to 69 Years | 230 (5.9%) | 234 (6.0%) |
| 70 to 74 Years | 210 (5.4%) | 189 (4.8%) |
| 75 to 79 Years | 116 (3.0%) | 227 (5.8%) |
| 80 to 84 Years | 154 (4.0%) | 107 (2.7%) |
| 85 Years and over | 44 (1.1%) | 114 (2.9%) |
| Total | 3,886 (100.0%) | 3,913 (100.0%) |
Families and Households in Anderson County
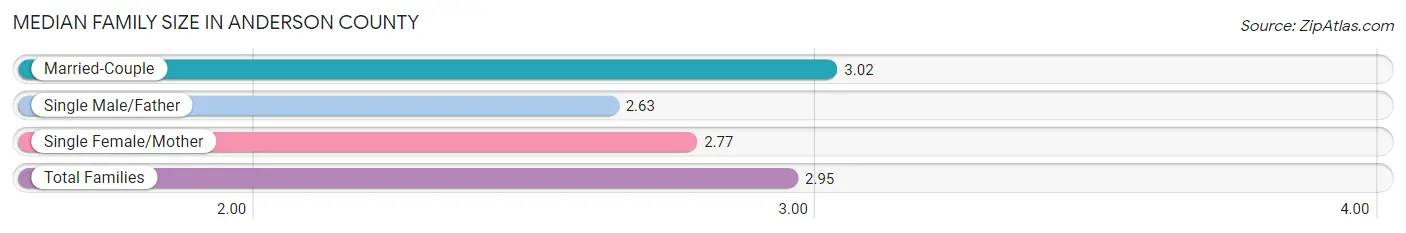
Median Family Size in Anderson County
The median family size in Anderson County is 2.95 persons per family, with married-couple families (1,711 | 77.6%) accounting for the largest median family size of 3.02 persons per family. On the other hand, single male/father families (222 | 10.1%) represent the smallest median family size with 2.63 persons per family.
| Family Type | # Families | Family Size |
| Married-Couple | 1,711 (77.6%) | 3.02 |
| Single Male/Father | 222 (10.1%) | 2.63 |
| Single Female/Mother | 272 (12.3%) | 2.77 |
| Total Families | 2,205 (100.0%) | 2.95 |
Median Household Size in Anderson County
The median household size in Anderson County is 2.43 persons per household, with single female/mother households (272 | 8.6%) accounting for the largest median household size of 3.11 persons per household. non-family households (960 | 30.3%) represent the smallest median household size with 1.05 persons per household.
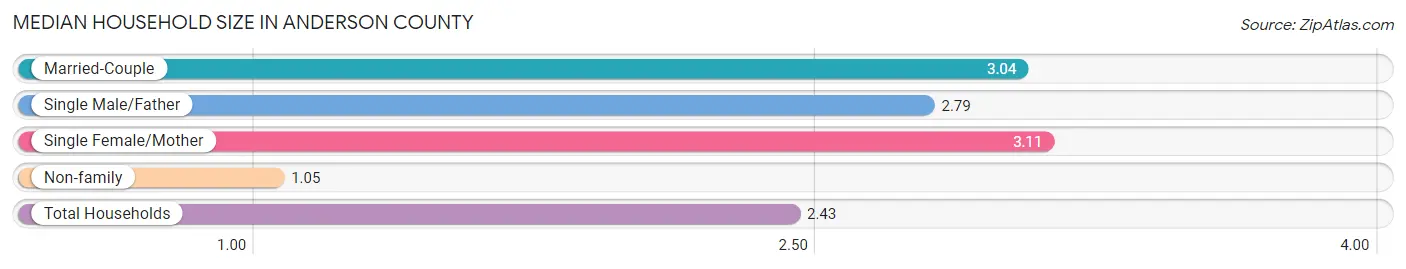
| Household Type | # Households | Household Size |
| Married-Couple | 1,711 (54.1%) | 3.04 |
| Single Male/Father | 222 (7.0%) | 2.79 |
| Single Female/Mother | 272 (8.6%) | 3.11 |
| Non-family | 960 (30.3%) | 1.05 |
| Total Households | 3,165 (100.0%) | 2.43 |
Household Size by Marriage Status in Anderson County
Out of a total of 3,165 households in Anderson County, 2,205 (69.7%) are family households, while 960 (30.3%) are nonfamily households. The most numerous type of family households are 2-person households, comprising 1,203, and the most common type of nonfamily households are 1-person households, comprising 915.
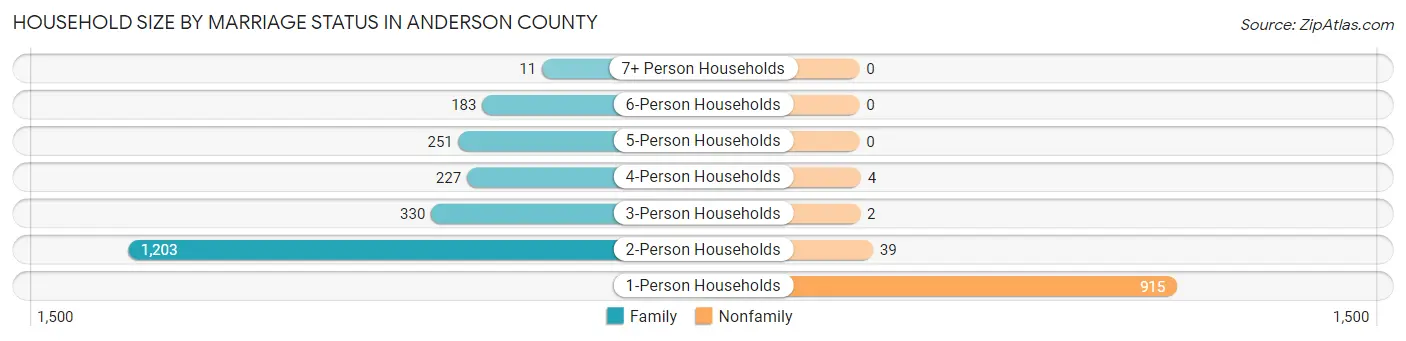
| Household Size | Family Households | Nonfamily Households |
| 1-Person Households | - | 915 (28.9%) |
| 2-Person Households | 1,203 (38.0%) | 39 (1.2%) |
| 3-Person Households | 330 (10.4%) | 2 (0.1%) |
| 4-Person Households | 227 (7.2%) | 4 (0.1%) |
| 5-Person Households | 251 (7.9%) | 0 (0.0%) |
| 6-Person Households | 183 (5.8%) | 0 (0.0%) |
| 7+ Person Households | 11 (0.4%) | 0 (0.0%) |
| Total | 2,205 (69.7%) | 960 (30.3%) |
Female Fertility in Anderson County
Fertility by Age in Anderson County
Average fertility rate in Anderson County is 75.0 births per 1,000 women. Women in the age bracket of 20 to 34 years have the highest fertility rate with 205.0 births per 1,000 women. Women in the age bracket of 20 to 34 years acount for 100.0% of all women with births.
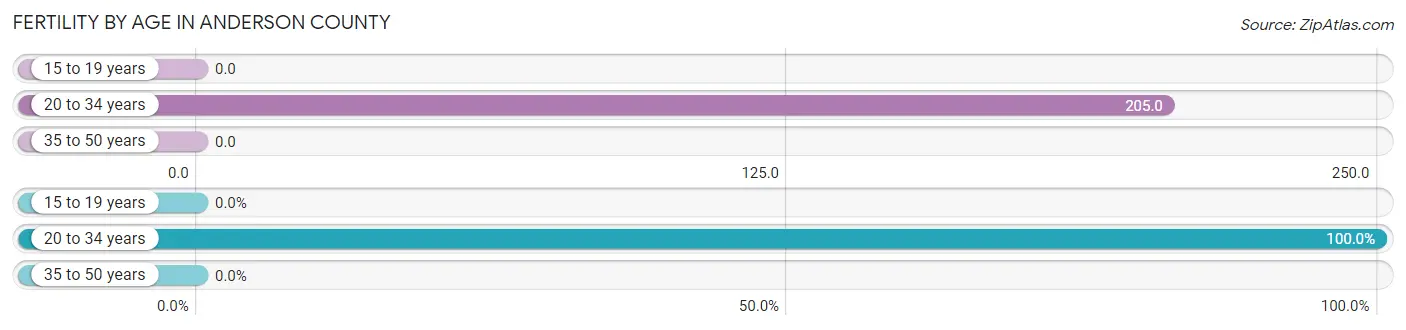
| Age Bracket | Women with Births | Births / 1,000 Women |
| 15 to 19 years | 0 (0.0%) | 0.0 |
| 20 to 34 years | 115 (100.0%) | 205.0 |
| 35 to 50 years | 0 (0.0%) | 0.0 |
| Total | 115 (100.0%) | 75.0 |
Fertility by Age by Marriage Status in Anderson County
27.8% of women with births (115) in Anderson County are married. The highest percentage of unmarried women with births falls into 20 to 34 years age bracket with 72.2% of them unmarried at the time of birth, while the lowest percentage of unmarried women with births belong to 20 to 34 years age bracket with 72.2% of them unmarried.
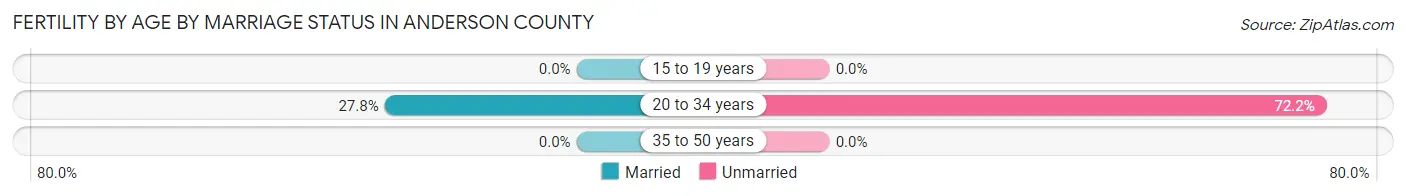
| Age Bracket | Married | Unmarried |
| 15 to 19 years | 0 (0.0%) | 0 (0.0%) |
| 20 to 34 years | 32 (27.8%) | 83 (72.2%) |
| 35 to 50 years | 0 (0.0%) | 0 (0.0%) |
| Total | 32 (27.8%) | 83 (72.2%) |
Fertility by Education in Anderson County
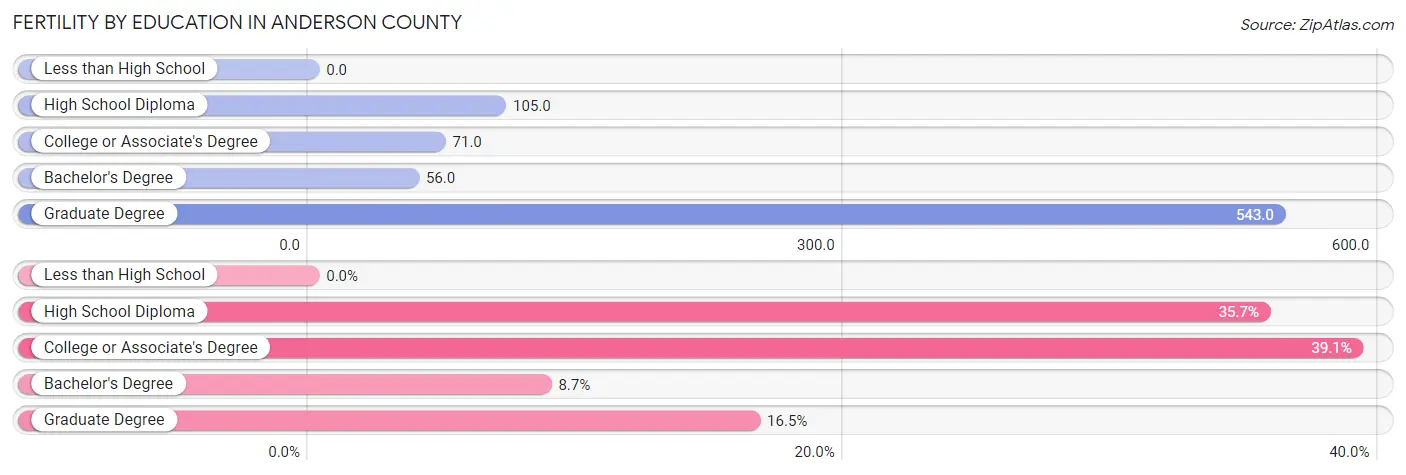
| Educational Attainment | Women with Births | Births / 1,000 Women |
| Less than High School | 0 (0.0%) | 0.0 |
| High School Diploma | 41 (35.6%) | 105.0 |
| College or Associate's Degree | 45 (39.1%) | 71.0 |
| Bachelor's Degree | 10 (8.7%) | 56.0 |
| Graduate Degree | 19 (16.5%) | 543.0 |
| Total | 115 (100.0%) | 75.0 |
Fertility by Education by Marriage Status in Anderson County
72.2% of women with births in Anderson County are unmarried. Women with the educational attainment of bachelor's degree are most likely to be married with 100.0% of them married at childbirth, while women with the educational attainment of college or associate's degree are least likely to be married with 100.0% of them unmarried at childbirth.
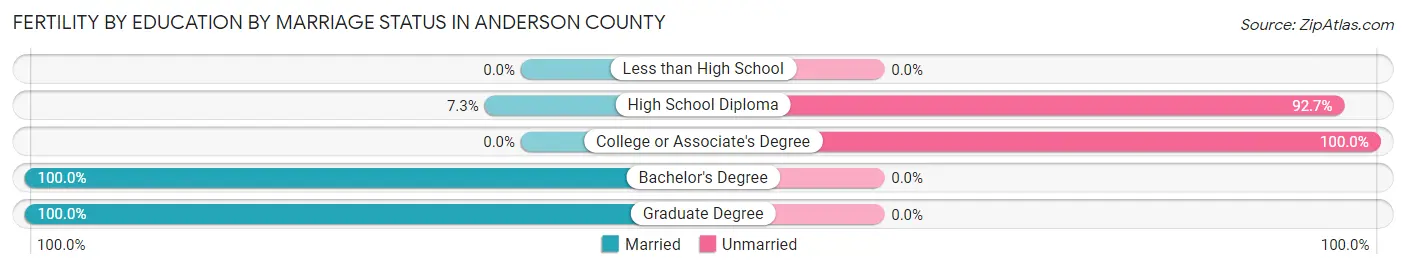
| Educational Attainment | Married | Unmarried |
| Less than High School | 0 (0.0%) | 0 (0.0%) |
| High School Diploma | 3 (7.3%) | 38 (92.7%) |
| College or Associate's Degree | 0 (0.0%) | 45 (100.0%) |
| Bachelor's Degree | 10 (100.0%) | 0 (0.0%) |
| Graduate Degree | 19 (100.0%) | 0 (0.0%) |
| Total | 32 (27.8%) | 83 (72.2%) |
Income in Anderson County
Income Overview in Anderson County
Per Capita Income in Anderson County is $29,665, while median incomes of families and households are $79,089 and $67,651 respectively.
| Characteristic | Number | Measure |
| Per Capita Income | 7,799 | $29,665 |
| Median Family Income | 2,205 | $79,089 |
| Mean Family Income | 2,205 | $88,821 |
| Median Household Income | 3,165 | $67,651 |
| Mean Household Income | 3,165 | $74,368 |
| Income Deficit | 2,205 | $0 |
| Wage / Income Gap (%) | 7,799 | 30.63% |
| Wage / Income Gap ($) | 7,799 | 69.37¢ per $1 |
| Gini / Inequality Index | 7,799 | 0.42 |
Earnings by Sex in Anderson County
Average Earnings in Anderson County are $35,453, $40,673 for men and $28,214 for women, a difference of 30.6%.
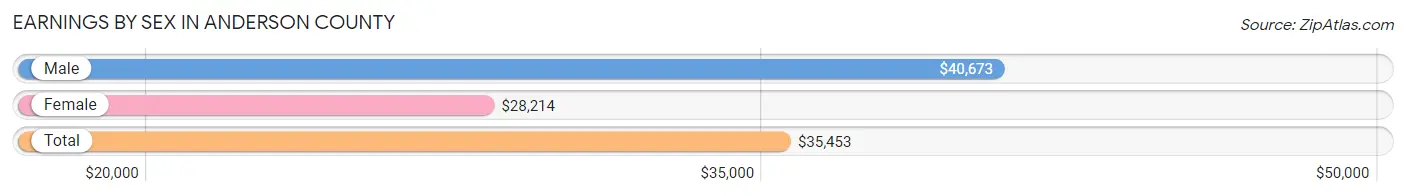
| Sex | Number | Average Earnings |
| Male | 2,118 (55.8%) | $40,673 |
| Female | 1,676 (44.2%) | $28,214 |
| Total | 3,794 (100.0%) | $35,453 |
Earnings by Sex by Income Bracket in Anderson County
The most common earnings brackets in Anderson County are $100,000+ for men (312 | 14.7%) and $25,000 to $29,999 for women (252 | 15.0%).
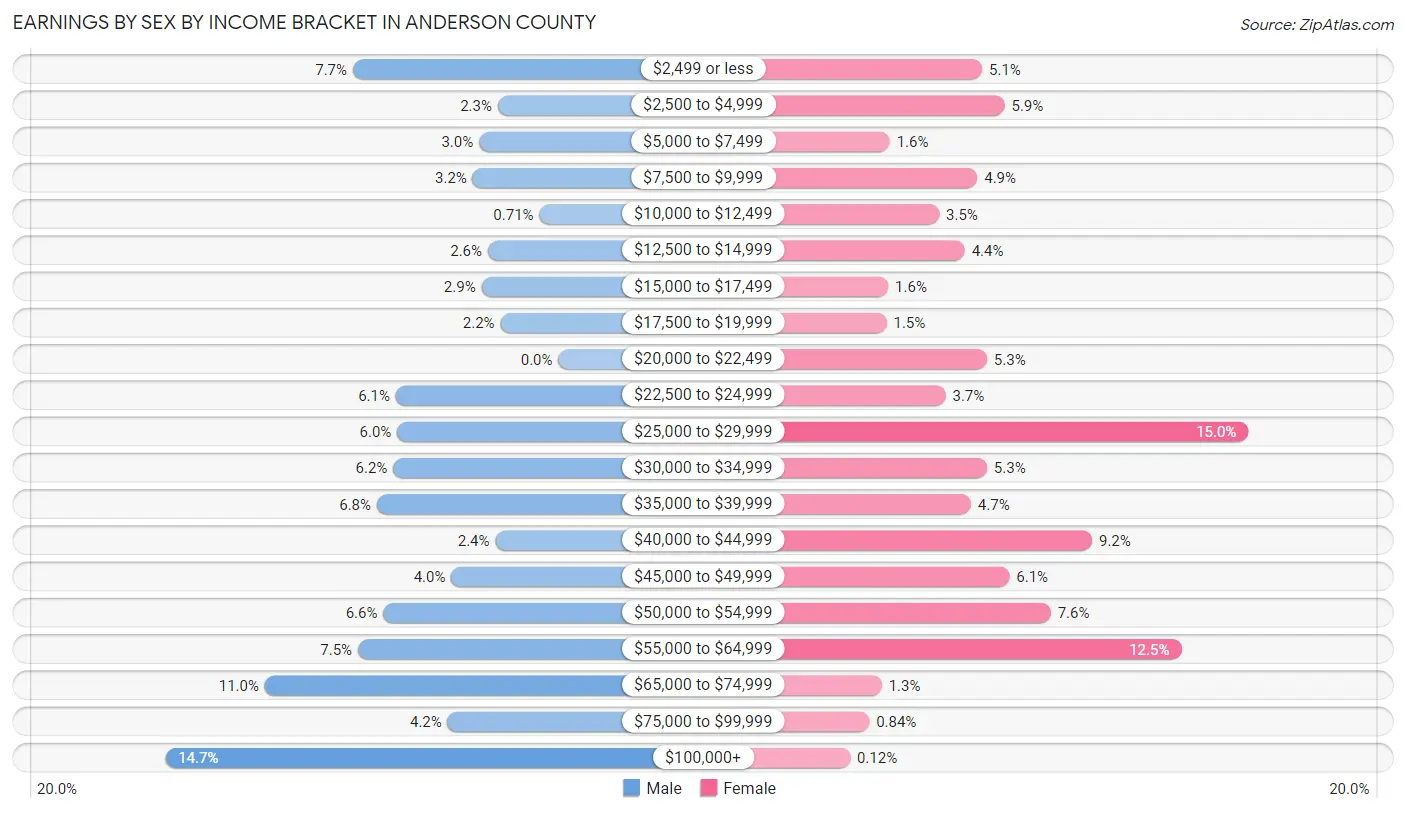
| Income | Male | Female |
| $2,499 or less | 163 (7.7%) | 85 (5.1%) |
| $2,500 to $4,999 | 48 (2.3%) | 99 (5.9%) |
| $5,000 to $7,499 | 63 (3.0%) | 27 (1.6%) |
| $7,500 to $9,999 | 68 (3.2%) | 82 (4.9%) |
| $10,000 to $12,499 | 15 (0.7%) | 58 (3.5%) |
| $12,500 to $14,999 | 56 (2.6%) | 74 (4.4%) |
| $15,000 to $17,499 | 61 (2.9%) | 26 (1.5%) |
| $17,500 to $19,999 | 46 (2.2%) | 25 (1.5%) |
| $20,000 to $22,499 | 0 (0.0%) | 88 (5.2%) |
| $22,500 to $24,999 | 129 (6.1%) | 62 (3.7%) |
| $25,000 to $29,999 | 128 (6.0%) | 252 (15.0%) |
| $30,000 to $34,999 | 131 (6.2%) | 88 (5.2%) |
| $35,000 to $39,999 | 144 (6.8%) | 78 (4.6%) |
| $40,000 to $44,999 | 50 (2.4%) | 154 (9.2%) |
| $45,000 to $49,999 | 85 (4.0%) | 102 (6.1%) |
| $50,000 to $54,999 | 139 (6.6%) | 128 (7.6%) |
| $55,000 to $64,999 | 159 (7.5%) | 210 (12.5%) |
| $65,000 to $74,999 | 233 (11.0%) | 22 (1.3%) |
| $75,000 to $99,999 | 88 (4.2%) | 14 (0.8%) |
| $100,000+ | 312 (14.7%) | 2 (0.1%) |
| Total | 2,118 (100.0%) | 1,676 (100.0%) |
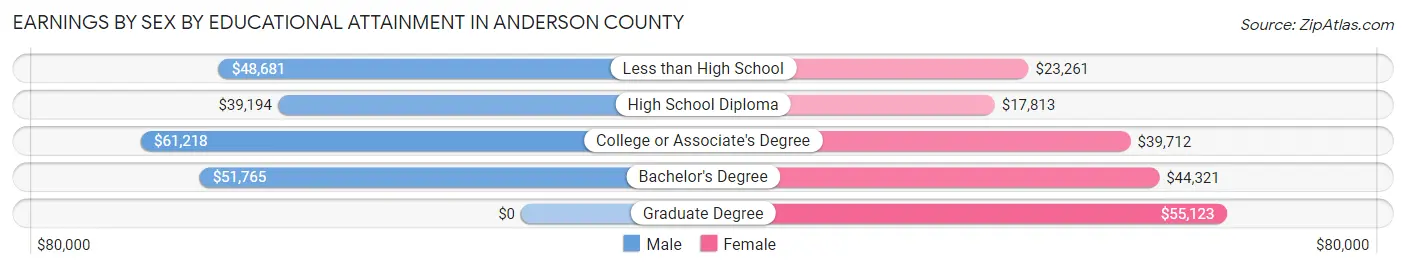
Earnings by Sex by Educational Attainment in Anderson County
Average earnings in Anderson County are $50,446 for men and $31,961 for women, a difference of 36.6%. Men with an educational attainment of college or associate's degree enjoy the highest average annual earnings of $61,218, while those with high school diploma education earn the least with $39,194. Women with an educational attainment of graduate degree earn the most with the average annual earnings of $55,123, while those with high school diploma education have the smallest earnings of $17,813.
| Educational Attainment | Male Income | Female Income |
| Less than High School | $48,681 | $23,261 |
| High School Diploma | $39,194 | $17,813 |
| College or Associate's Degree | $61,218 | $39,712 |
| Bachelor's Degree | $51,765 | $44,321 |
| Graduate Degree | - | - |
| Total | $50,446 | $31,961 |
Family Income in Anderson County
Family Income Brackets in Anderson County
According to the Anderson County family income data, there are 567 families falling into the $75,000 to $99,999 income range, which is the most common income bracket and makes up 25.7% of all families. Conversely, the less than $10,000 income bracket is the least frequent group with only 15 families (0.7%) belonging to this category.

| Income Bracket | # Families | % Families |
| Less than $10,000 | 15 | 0.7% |
| $10,000 to $14,999 | 132 | 6.0% |
| $15,000 to $24,999 | 135 | 6.1% |
| $25,000 to $34,999 | 209 | 9.5% |
| $35,000 to $49,999 | 137 | 6.2% |
| $50,000 to $74,999 | 368 | 16.7% |
| $75,000 to $99,999 | 567 | 25.7% |
| $100,000 to $149,999 | 415 | 18.8% |
| $150,000 to $199,999 | 99 | 4.5% |
| $200,000+ | 130 | 5.9% |
Family Income by Famaliy Size in Anderson County
6-person families (149 | 6.8%) account for the highest median family income in Anderson County with $108,781 per family, while 2-person families (1,239 | 56.2%) have the highest median income of $40,129 per family member.

| Income Bracket | # Families | Median Income |
| 2-Person Families | 1,239 (56.2%) | $80,258 |
| 3-Person Families | 399 (18.1%) | $26,655 |
| 4-Person Families | 219 (9.9%) | $77,181 |
| 5-Person Families | 190 (8.6%) | $102,684 |
| 6-Person Families | 149 (6.8%) | $108,781 |
| 7+ Person Families | 9 (0.4%) | $0 |
| Total | 2,205 (100.0%) | $79,089 |
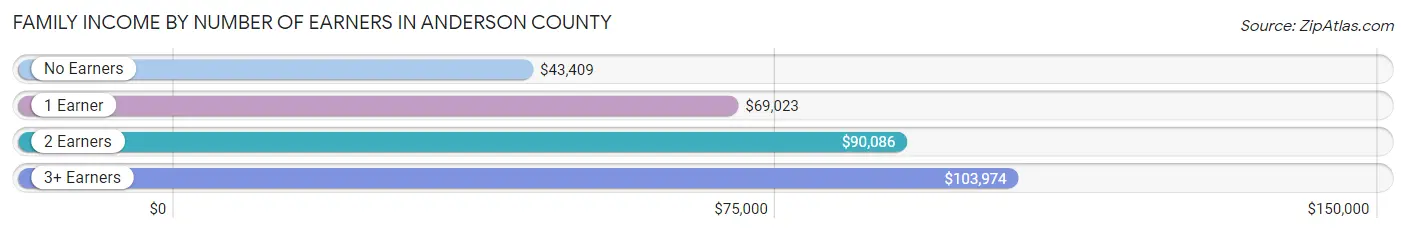
Family Income by Number of Earners in Anderson County
The median family income in Anderson County is $79,089, with families comprising 3+ earners (120) having the highest median family income of $103,974, while families with no earners (322) have the lowest median family income of $43,409, accounting for 5.4% and 14.6% of families, respectively.
| Number of Earners | # Families | Median Income |
| No Earners | 322 (14.6%) | $43,409 |
| 1 Earner | 747 (33.9%) | $69,023 |
| 2 Earners | 1,016 (46.1%) | $90,086 |
| 3+ Earners | 120 (5.4%) | $103,974 |
| Total | 2,205 (100.0%) | $79,089 |
Household Income in Anderson County
Household Income Brackets in Anderson County
With 633 households falling in the category, the $75,000 to $99,999 income range is the most frequent in Anderson County, accounting for 20.0% of all households. In contrast, only 89 households (2.8%) fall into the less than $10,000 income bracket, making it the least populous group.

| Income Bracket | # Households | % Households |
| Less than $10,000 | 89 | 2.8% |
| $10,000 to $14,999 | 187 | 5.9% |
| $15,000 to $24,999 | 329 | 10.4% |
| $25,000 to $34,999 | 468 | 14.8% |
| $35,000 to $49,999 | 241 | 7.6% |
| $50,000 to $74,999 | 510 | 16.1% |
| $75,000 to $99,999 | 633 | 20.0% |
| $100,000 to $149,999 | 481 | 15.2% |
| $150,000 to $199,999 | 101 | 3.2% |
| $200,000+ | 130 | 4.1% |
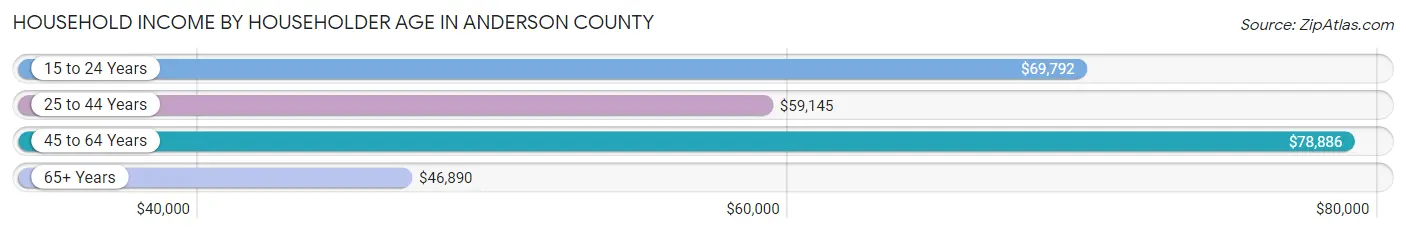
Household Income by Householder Age in Anderson County
The median household income in Anderson County is $67,651, with the highest median household income of $78,886 found in the 45 to 64 years age bracket for the primary householder. A total of 1,149 households (36.3%) fall into this category. Meanwhile, the 65+ years age bracket for the primary householder has the lowest median household income of $46,890, with 1,009 households (31.9%) in this group.
| Income Bracket | # Households | Median Income |
| 15 to 24 Years | 134 (4.2%) | $69,792 |
| 25 to 44 Years | 873 (27.6%) | $59,145 |
| 45 to 64 Years | 1,149 (36.3%) | $78,886 |
| 65+ Years | 1,009 (31.9%) | $46,890 |
| Total | 3,165 (100.0%) | $67,651 |
Poverty in Anderson County
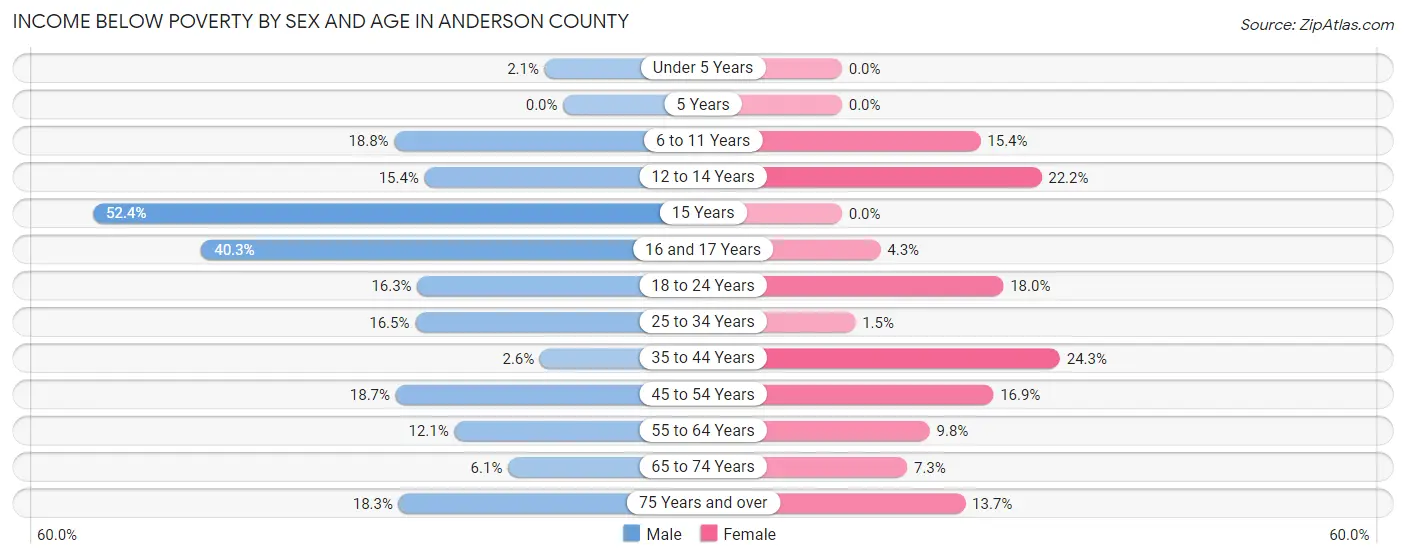
Income Below Poverty by Sex and Age in Anderson County
With 14.0% poverty level for males and 12.4% for females among the residents of Anderson County, 15 year old males and 35 to 44 year old females are the most vulnerable to poverty, with 22 males (52.4%) and 126 females (24.3%) in their respective age groups living below the poverty level.
| Age Bracket | Male | Female |
| Under 5 Years | 5 (2.1%) | 0 (0.0%) |
| 5 Years | 0 (0.0%) | 0 (0.0%) |
| 6 to 11 Years | 73 (18.8%) | 29 (15.4%) |
| 12 to 14 Years | 23 (15.4%) | 46 (22.2%) |
| 15 Years | 22 (52.4%) | 0 (0.0%) |
| 16 and 17 Years | 50 (40.3%) | 3 (4.3%) |
| 18 to 24 Years | 58 (16.3%) | 48 (18.0%) |
| 25 to 34 Years | 63 (16.5%) | 5 (1.5%) |
| 35 to 44 Years | 10 (2.6%) | 126 (24.3%) |
| 45 to 54 Years | 83 (18.6%) | 74 (16.9%) |
| 55 to 64 Years | 64 (12.1%) | 53 (9.8%) |
| 65 to 74 Years | 27 (6.1%) | 30 (7.3%) |
| 75 Years and over | 55 (18.3%) | 57 (13.7%) |
| Total | 533 (14.0%) | 471 (12.4%) |
Income Above Poverty by Sex and Age in Anderson County
According to the poverty statistics in Anderson County, males aged 5 years and females aged under 5 years are the age groups that are most secure financially, with 100.0% of males and 100.0% of females in these age groups living above the poverty line.
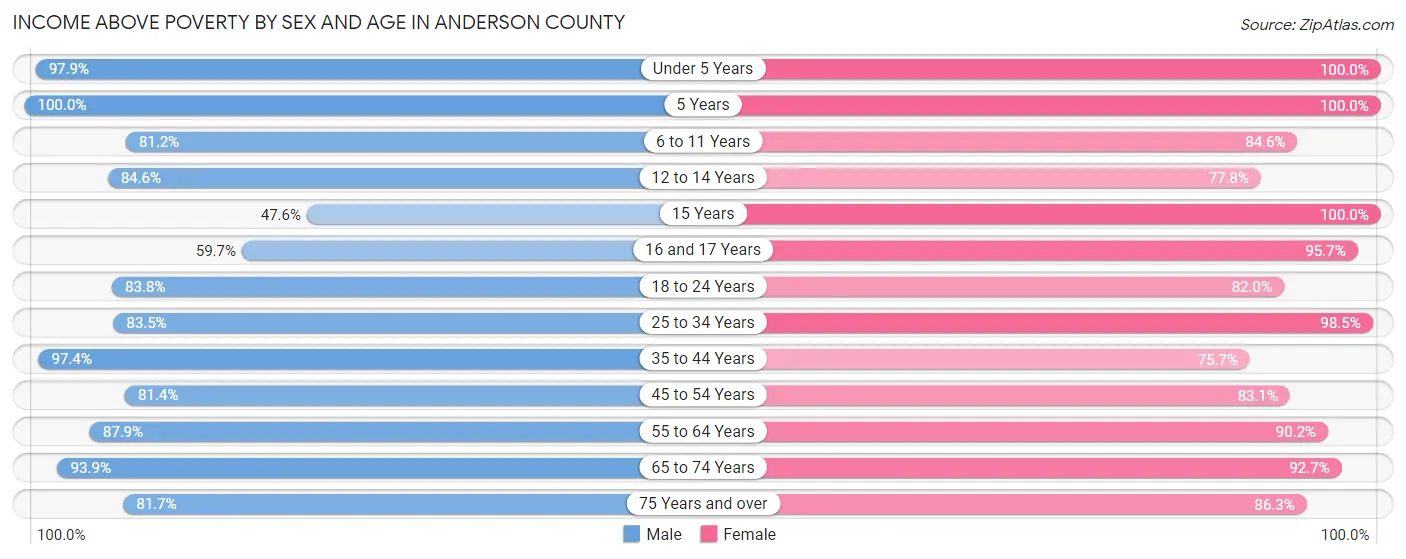
| Age Bracket | Male | Female |
| Under 5 Years | 236 (97.9%) | 281 (100.0%) |
| 5 Years | 31 (100.0%) | 41 (100.0%) |
| 6 to 11 Years | 315 (81.2%) | 159 (84.6%) |
| 12 to 14 Years | 126 (84.6%) | 161 (77.8%) |
| 15 Years | 20 (47.6%) | 95 (100.0%) |
| 16 and 17 Years | 74 (59.7%) | 67 (95.7%) |
| 18 to 24 Years | 299 (83.8%) | 219 (82.0%) |
| 25 to 34 Years | 319 (83.5%) | 330 (98.5%) |
| 35 to 44 Years | 376 (97.4%) | 393 (75.7%) |
| 45 to 54 Years | 362 (81.4%) | 365 (83.1%) |
| 55 to 64 Years | 464 (87.9%) | 489 (90.2%) |
| 65 to 74 Years | 413 (93.9%) | 383 (92.7%) |
| 75 Years and over | 245 (81.7%) | 358 (86.3%) |
| Total | 3,280 (86.0%) | 3,341 (87.6%) |
Income Below Poverty Among Married-Couple Families in Anderson County
The poverty statistics for married-couple families in Anderson County show that 7.7% or 132 of the total 1,711 families live below the poverty line. Families with 3 or 4 children have the highest poverty rate of 10.6%, comprising of 28 families. On the other hand, families with 5 or more children have the lowest poverty rate of 0.0%, which includes 0 families.
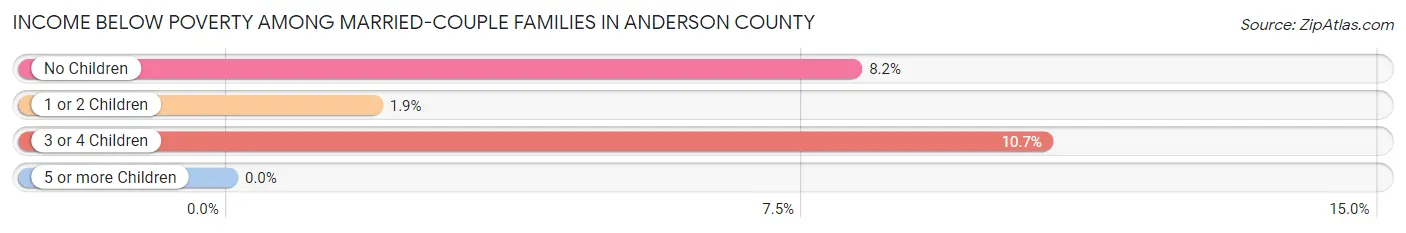
| Children | Above Poverty | Below Poverty |
| No Children | 1,127 (91.8%) | 100 (8.2%) |
| 1 or 2 Children | 208 (98.1%) | 4 (1.9%) |
| 3 or 4 Children | 235 (89.3%) | 28 (10.6%) |
| 5 or more Children | 9 (100.0%) | 0 (0.0%) |
| Total | 1,579 (92.3%) | 132 (7.7%) |
Income Below Poverty Among Single-Parent Households in Anderson County
According to the poverty data in Anderson County, 16.2% or 36 single-father households and 33.8% or 92 single-mother households are living below the poverty line. Among single-father households, those with 1 or 2 children have the highest poverty rate, with 32 households (27.4%) experiencing poverty. Likewise, among single-mother households, those with 1 or 2 children have the highest poverty rate, with 87 households (34.1%) falling below the poverty line.
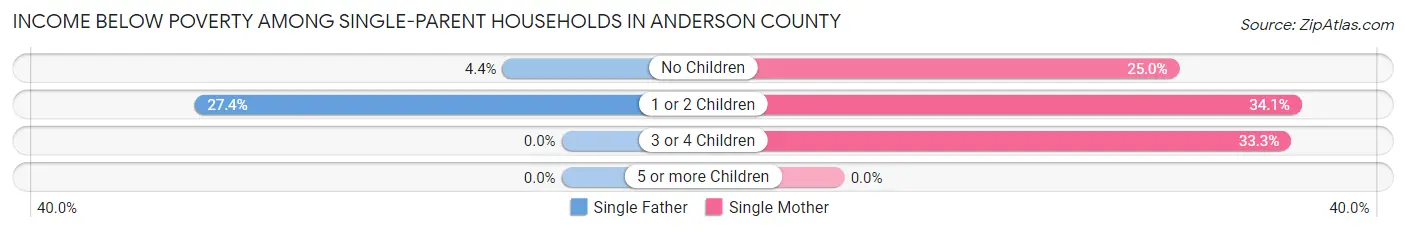
| Children | Single Father | Single Mother |
| No Children | 4 (4.4%) | 2 (25.0%) |
| 1 or 2 Children | 32 (27.4%) | 87 (34.1%) |
| 3 or 4 Children | 0 (0.0%) | 3 (33.3%) |
| 5 or more Children | 0 (0.0%) | 0 (0.0%) |
| Total | 36 (16.2%) | 92 (33.8%) |
Income Below Poverty Among Married-Couple vs Single-Parent Households in Anderson County
The poverty data for Anderson County shows that 132 of the married-couple family households (7.7%) and 128 of the single-parent households (25.9%) are living below the poverty level. Within the married-couple family households, those with 3 or 4 children have the highest poverty rate, with 28 households (10.6%) falling below the poverty line. Among the single-parent households, those with 1 or 2 children have the highest poverty rate, with 119 household (32.0%) living below poverty.
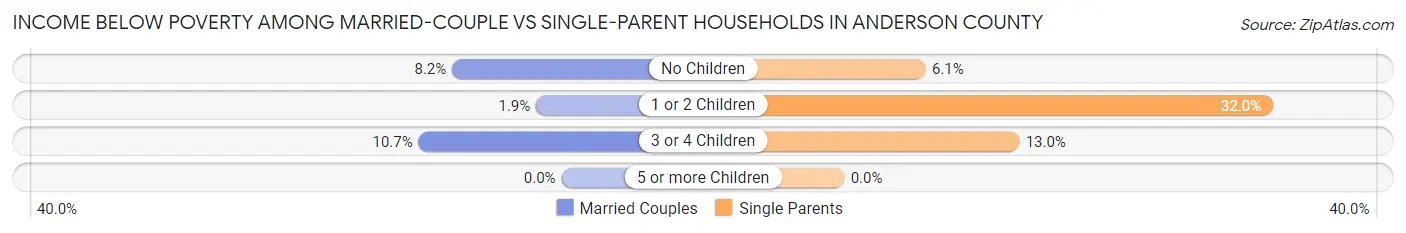
| Children | Married-Couple Families | Single-Parent Households |
| No Children | 100 (8.2%) | 6 (6.1%) |
| 1 or 2 Children | 4 (1.9%) | 119 (32.0%) |
| 3 or 4 Children | 28 (10.6%) | 3 (13.0%) |
| 5 or more Children | 0 (0.0%) | 0 (0.0%) |
| Total | 132 (7.7%) | 128 (25.9%) |
Employment Characteristics in Anderson County
Employment by Class of Employer in Anderson County
Among the 3,378 employed individuals in Anderson County, private company employees (1,885 | 55.8%), self-employed (not incorporated) (454 | 13.4%), and not-for-profit organizations (365 | 10.8%) make up the most common classes of employment.
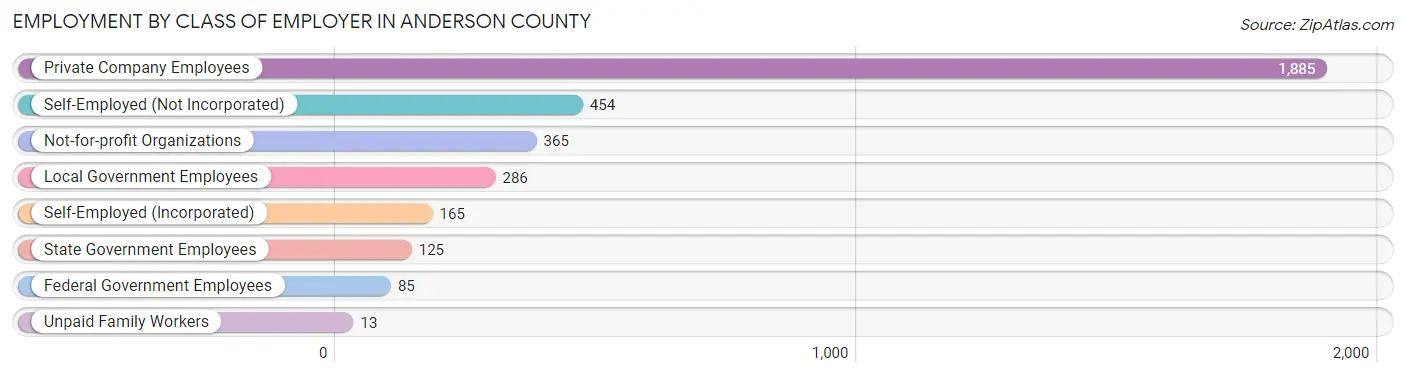
| Employer Class | # Employees | % Employees |
| Private Company Employees | 1,885 | 55.8% |
| Self-Employed (Incorporated) | 165 | 4.9% |
| Self-Employed (Not Incorporated) | 454 | 13.4% |
| Not-for-profit Organizations | 365 | 10.8% |
| Local Government Employees | 286 | 8.5% |
| State Government Employees | 125 | 3.7% |
| Federal Government Employees | 85 | 2.5% |
| Unpaid Family Workers | 13 | 0.4% |
| Total | 3,378 | 100.0% |
Employment Status by Age in Anderson County
According to the labor force statistics for Anderson County, out of the total population over 16 years of age (6,072), 60.1% or 3,649 individuals are in the labor force, with 3.3% or 120 of them unemployed. The age group with the highest labor force participation rate is 35 to 44 years, with 85.1% or 770 individuals in the labor force. Within the labor force, the 75 years and over age range has the highest percentage of unemployed individuals, with 19.4% or 18 of them being unemployed.
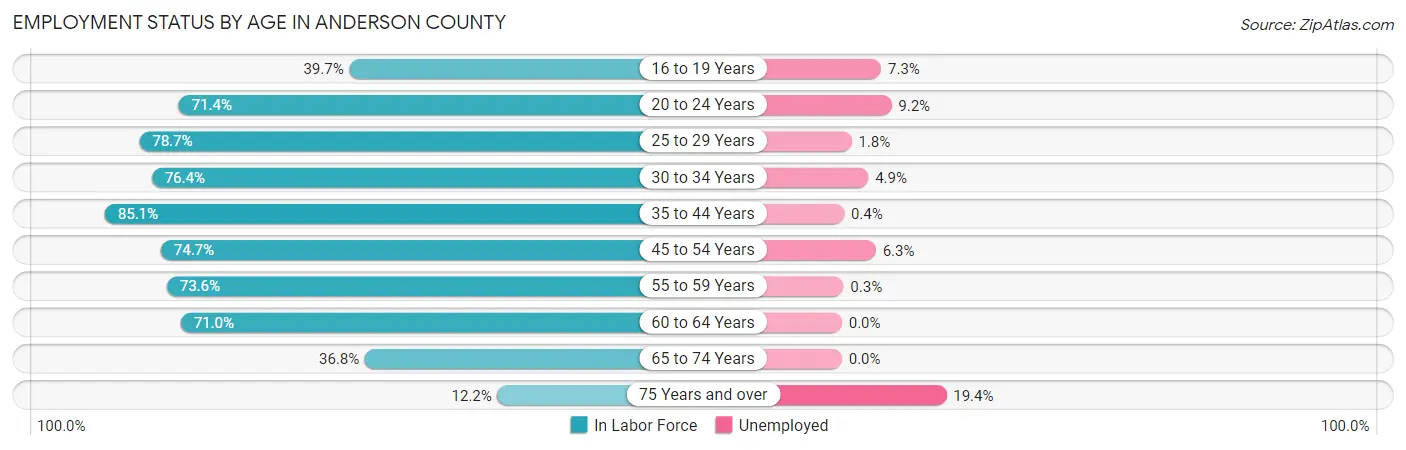
| Age Bracket | In Labor Force | Unemployed |
| 16 to 19 Years | 177 (39.7%) | 13 (7.3%) |
| 20 to 24 Years | 284 (71.4%) | 26 (9.2%) |
| 25 to 29 Years | 280 (78.7%) | 5 (1.8%) |
| 30 to 34 Years | 282 (76.4%) | 14 (4.9%) |
| 35 to 44 Years | 770 (85.1%) | 3 (0.4%) |
| 45 to 54 Years | 666 (74.7%) | 42 (6.3%) |
| 55 to 59 Years | 331 (73.6%) | 1 (0.3%) |
| 60 to 64 Years | 448 (71.0%) | 0 (0.0%) |
| 65 to 74 Years | 318 (36.8%) | 0 (0.0%) |
| 75 Years and over | 93 (12.2%) | 18 (19.4%) |
| Total | 3,649 (60.1%) | 120 (3.3%) |
Employment Status by Educational Attainment in Anderson County
According to labor force statistics for Anderson County, 77.1% of individuals (2,778) out of the total population between 25 and 64 years of age (3,603) are in the labor force, with 2.3% or 64 of them being unemployed. The group with the highest labor force participation rate are those with the educational attainment of bachelor's degree or higher, with 91.3% or 566 individuals in the labor force. Within the labor force, individuals with less than high school education have the highest percentage of unemployment, with 4.7% or 13 of them being unemployed.
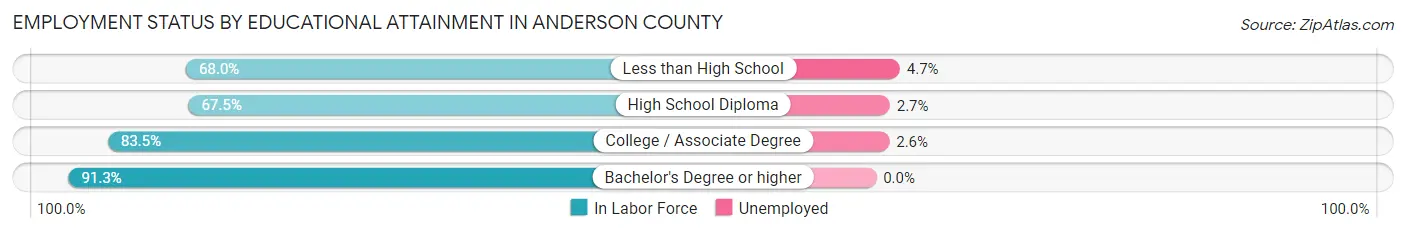
| Educational Attainment | In Labor Force | Unemployed |
| Less than High School | 278 (68.0%) | 19 (4.7%) |
| High School Diploma | 915 (67.5%) | 37 (2.7%) |
| College / Associate Degree | 1,018 (83.5%) | 32 (2.6%) |
| Bachelor's Degree or higher | 566 (91.3%) | 0 (0.0%) |
| Total | 2,778 (77.1%) | 83 (2.3%) |
Employment Occupations by Sex in Anderson County
Management, Business, Science and Arts Occupations
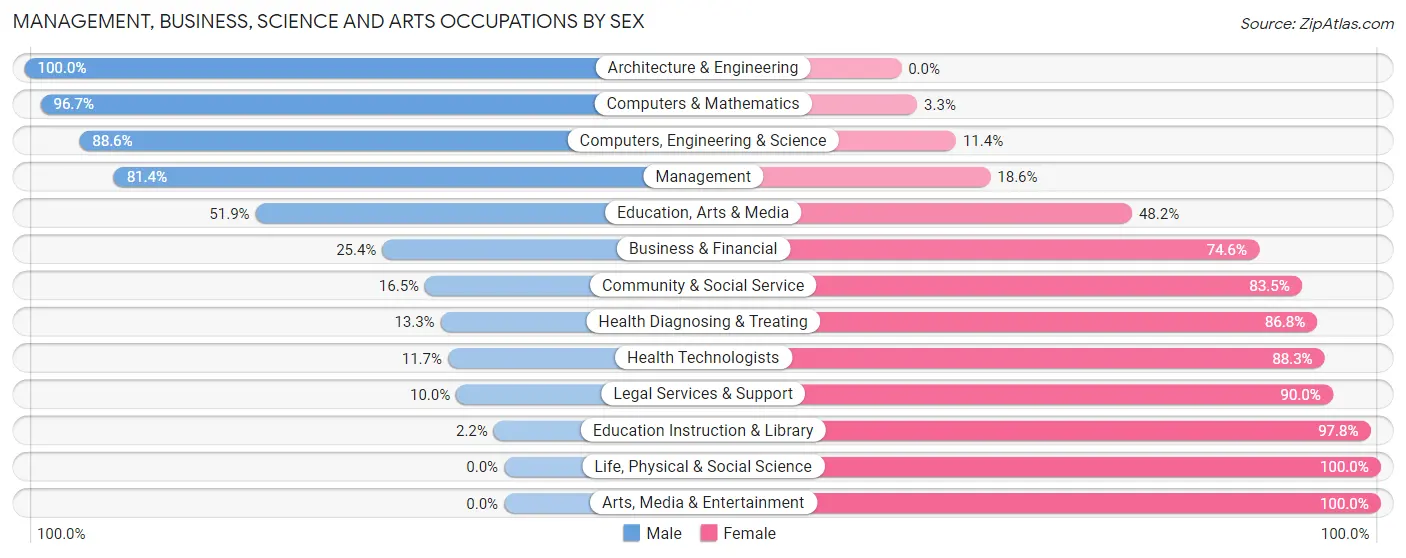
The most common Management, Business, Science and Arts occupations in Anderson County are Management (387 | 11.0%), Community & Social Service (382 | 10.9%), Education Instruction & Library (231 | 6.6%), Health Diagnosing & Treating (166 | 4.7%), and Business & Financial (126 | 3.6%).
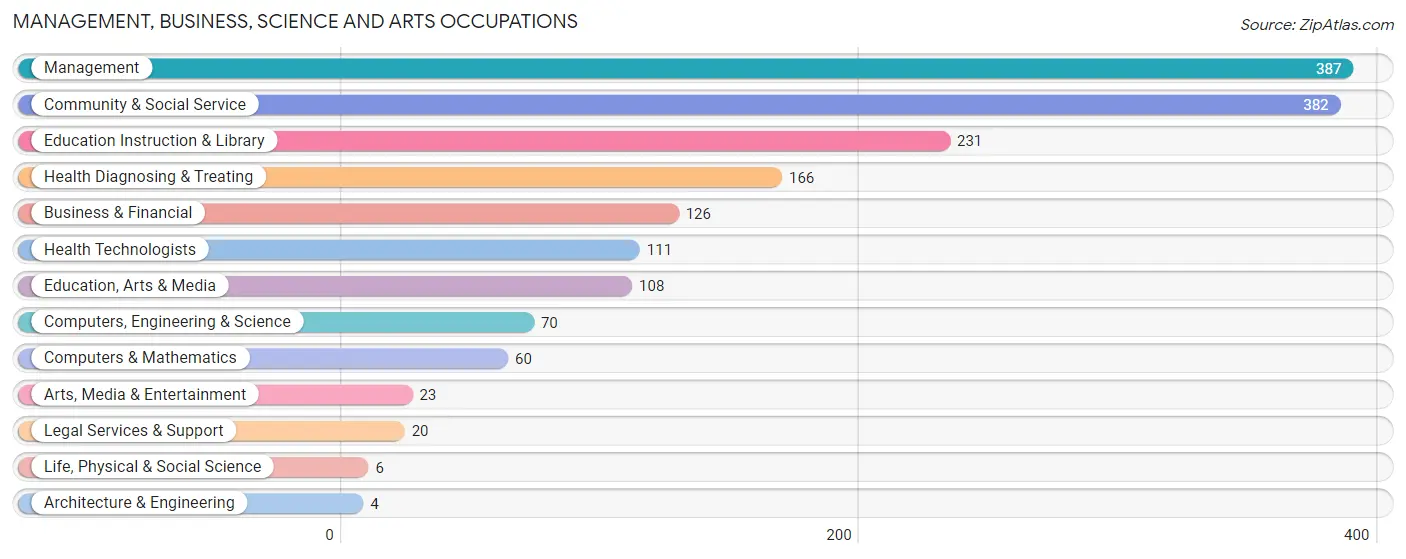
Management, Business, Science and Arts Occupations by Sex
Within the Management, Business, Science and Arts occupations in Anderson County, the most male-oriented occupations are Architecture & Engineering (100.0%), Computers & Mathematics (96.7%), and Computers, Engineering & Science (88.6%), while the most female-oriented occupations are Life, Physical & Social Science (100.0%), Arts, Media & Entertainment (100.0%), and Education Instruction & Library (97.8%).
| Occupation | Male | Female |
| Management | 315 (81.4%) | 72 (18.6%) |
| Business & Financial | 32 (25.4%) | 94 (74.6%) |
| Computers, Engineering & Science | 62 (88.6%) | 8 (11.4%) |
| Computers & Mathematics | 58 (96.7%) | 2 (3.3%) |
| Architecture & Engineering | 4 (100.0%) | 0 (0.0%) |
| Life, Physical & Social Science | 0 (0.0%) | 6 (100.0%) |
| Community & Social Service | 63 (16.5%) | 319 (83.5%) |
| Education, Arts & Media | 56 (51.8%) | 52 (48.1%) |
| Legal Services & Support | 2 (10.0%) | 18 (90.0%) |
| Education Instruction & Library | 5 (2.2%) | 226 (97.8%) |
| Arts, Media & Entertainment | 0 (0.0%) | 23 (100.0%) |
| Health Diagnosing & Treating | 22 (13.3%) | 144 (86.8%) |
| Health Technologists | 13 (11.7%) | 98 (88.3%) |
| Total (Category) | 494 (43.7%) | 637 (56.3%) |
| Total (Overall) | 1,938 (55.1%) | 1,576 (44.9%) |
Services Occupations
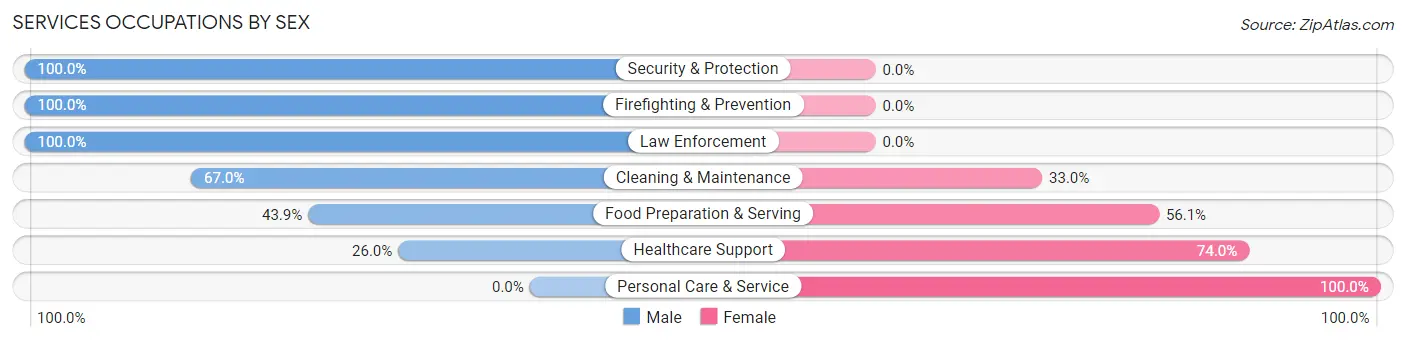
The most common Services occupations in Anderson County are Food Preparation & Serving (196 | 5.6%), Healthcare Support (192 | 5.5%), Personal Care & Service (137 | 3.9%), Cleaning & Maintenance (94 | 2.7%), and Security & Protection (60 | 1.7%).

Services Occupations by Sex
Within the Services occupations in Anderson County, the most male-oriented occupations are Security & Protection (100.0%), Firefighting & Prevention (100.0%), and Law Enforcement (100.0%), while the most female-oriented occupations are Personal Care & Service (100.0%), Healthcare Support (74.0%), and Food Preparation & Serving (56.1%).
| Occupation | Male | Female |
| Healthcare Support | 50 (26.0%) | 142 (74.0%) |
| Security & Protection | 60 (100.0%) | 0 (0.0%) |
| Firefighting & Prevention | 15 (100.0%) | 0 (0.0%) |
| Law Enforcement | 45 (100.0%) | 0 (0.0%) |
| Food Preparation & Serving | 86 (43.9%) | 110 (56.1%) |
| Cleaning & Maintenance | 63 (67.0%) | 31 (33.0%) |
| Personal Care & Service | 0 (0.0%) | 137 (100.0%) |
| Total (Category) | 259 (38.1%) | 420 (61.9%) |
| Total (Overall) | 1,938 (55.1%) | 1,576 (44.9%) |
Sales and Office Occupations
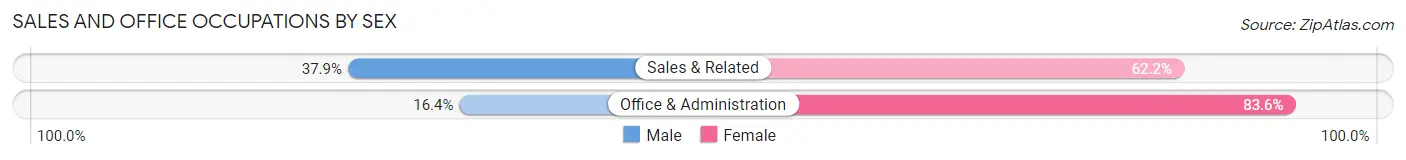
The most common Sales and Office occupations in Anderson County are Office & Administration (256 | 7.3%), and Sales & Related (214 | 6.1%).

Sales and Office Occupations by Sex
| Occupation | Male | Female |
| Sales & Related | 81 (37.9%) | 133 (62.2%) |
| Office & Administration | 42 (16.4%) | 214 (83.6%) |
| Total (Category) | 123 (26.2%) | 347 (73.8%) |
| Total (Overall) | 1,938 (55.1%) | 1,576 (44.9%) |
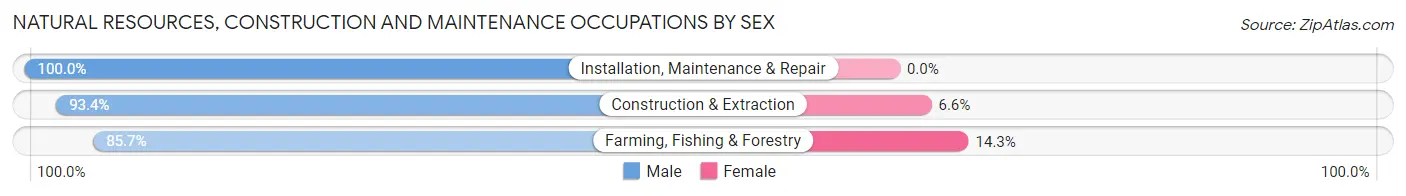
Natural Resources, Construction and Maintenance Occupations
The most common Natural Resources, Construction and Maintenance occupations in Anderson County are Construction & Extraction (441 | 12.6%), Installation, Maintenance & Repair (268 | 7.6%), and Farming, Fishing & Forestry (63 | 1.8%).
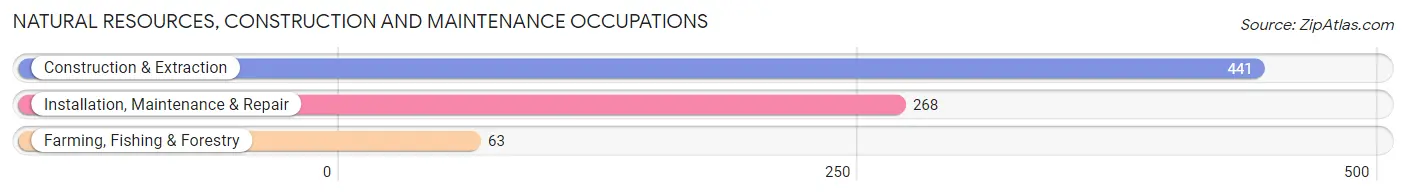
Natural Resources, Construction and Maintenance Occupations by Sex
| Occupation | Male | Female |
| Farming, Fishing & Forestry | 54 (85.7%) | 9 (14.3%) |
| Construction & Extraction | 412 (93.4%) | 29 (6.6%) |
| Installation, Maintenance & Repair | 268 (100.0%) | 0 (0.0%) |
| Total (Category) | 734 (95.1%) | 38 (4.9%) |
| Total (Overall) | 1,938 (55.1%) | 1,576 (44.9%) |
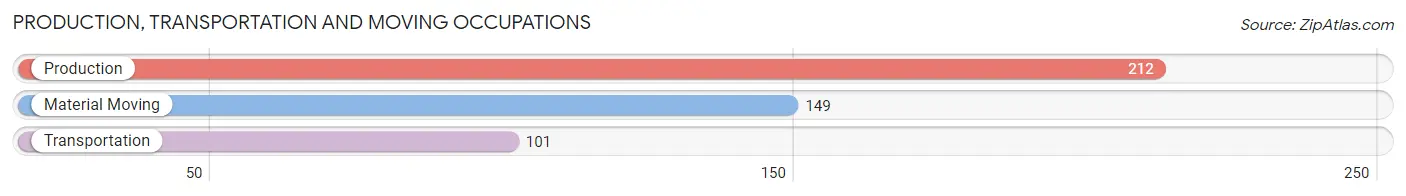
Production, Transportation and Moving Occupations
The most common Production, Transportation and Moving occupations in Anderson County are Production (212 | 6.0%), Material Moving (149 | 4.2%), and Transportation (101 | 2.9%).
Production, Transportation and Moving Occupations by Sex
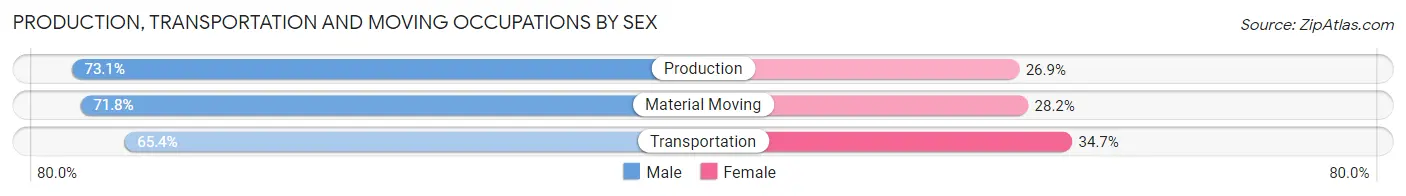
| Occupation | Male | Female |
| Production | 155 (73.1%) | 57 (26.9%) |
| Transportation | 66 (65.3%) | 35 (34.6%) |
| Material Moving | 107 (71.8%) | 42 (28.2%) |
| Total (Category) | 328 (71.0%) | 134 (29.0%) |
| Total (Overall) | 1,938 (55.1%) | 1,576 (44.9%) |
Employment Industries by Sex in Anderson County
Employment Industries in Anderson County
The major employment industries in Anderson County include Health Care & Social Assistance (569 | 16.2%), Construction (456 | 13.0%), Manufacturing (362 | 10.3%), Retail Trade (338 | 9.6%), and Educational Services (330 | 9.4%).

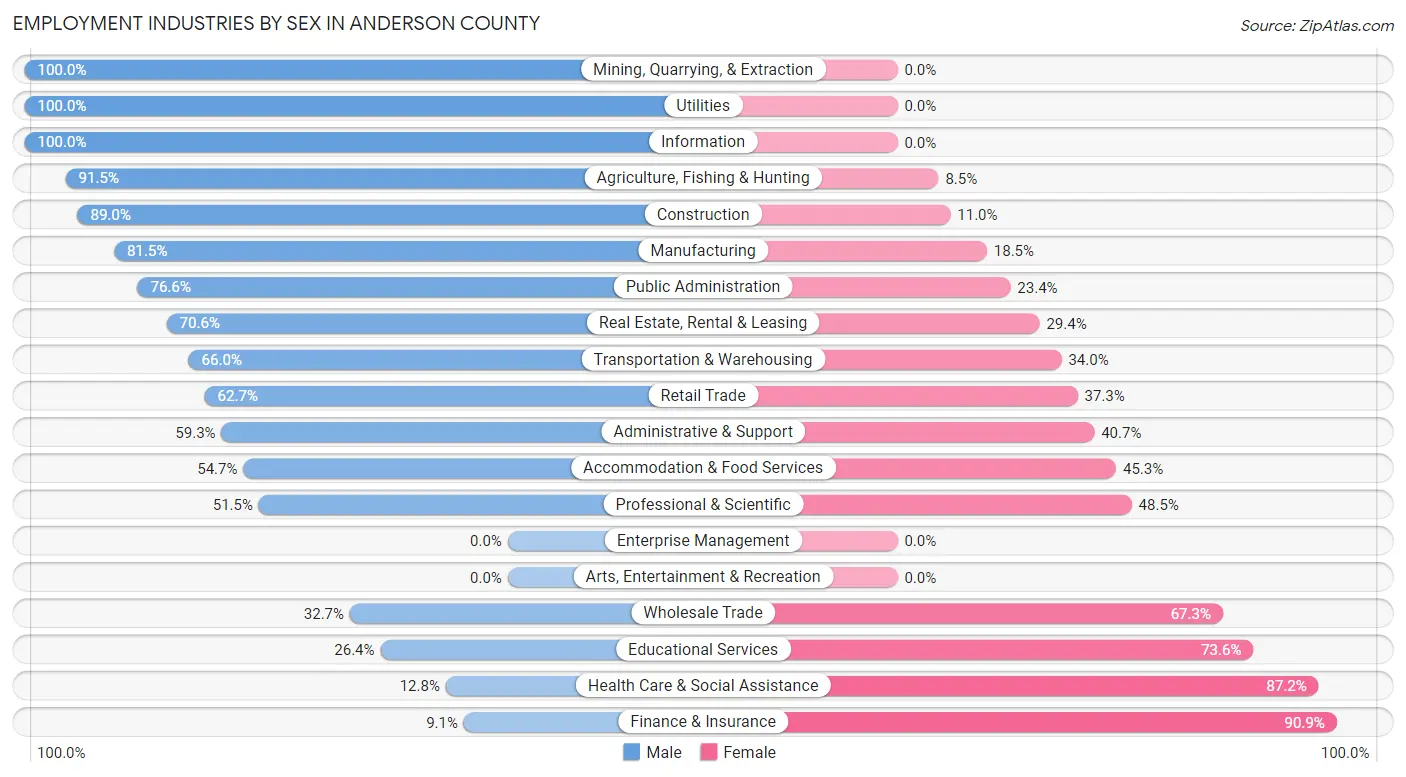
Employment Industries by Sex in Anderson County
The Anderson County industries that see more men than women are Mining, Quarrying, & Extraction (100.0%), Utilities (100.0%), and Information (100.0%), whereas the industries that tend to have a higher number of women are Finance & Insurance (90.9%), Health Care & Social Assistance (87.2%), and Educational Services (73.6%).
| Industry | Male | Female |
| Agriculture, Fishing & Hunting | 237 (91.5%) | 22 (8.5%) |
| Mining, Quarrying, & Extraction | 40 (100.0%) | 0 (0.0%) |
| Construction | 406 (89.0%) | 50 (11.0%) |
| Manufacturing | 295 (81.5%) | 67 (18.5%) |
| Wholesale Trade | 49 (32.7%) | 101 (67.3%) |
| Retail Trade | 212 (62.7%) | 126 (37.3%) |
| Transportation & Warehousing | 70 (66.0%) | 36 (34.0%) |
| Utilities | 50 (100.0%) | 0 (0.0%) |
| Information | 5 (100.0%) | 0 (0.0%) |
| Finance & Insurance | 15 (9.1%) | 150 (90.9%) |
| Real Estate, Rental & Leasing | 36 (70.6%) | 15 (29.4%) |
| Professional & Scientific | 51 (51.5%) | 48 (48.5%) |
| Enterprise Management | 0 (0.0%) | 0 (0.0%) |
| Administrative & Support | 16 (59.3%) | 11 (40.7%) |
| Educational Services | 87 (26.4%) | 243 (73.6%) |
| Health Care & Social Assistance | 73 (12.8%) | 496 (87.2%) |
| Arts, Entertainment & Recreation | 0 (0.0%) | 0 (0.0%) |
| Accommodation & Food Services | 75 (54.7%) | 62 (45.3%) |
| Public Administration | 95 (76.6%) | 29 (23.4%) |
| Total | 1,938 (55.1%) | 1,576 (44.9%) |
Education in Anderson County
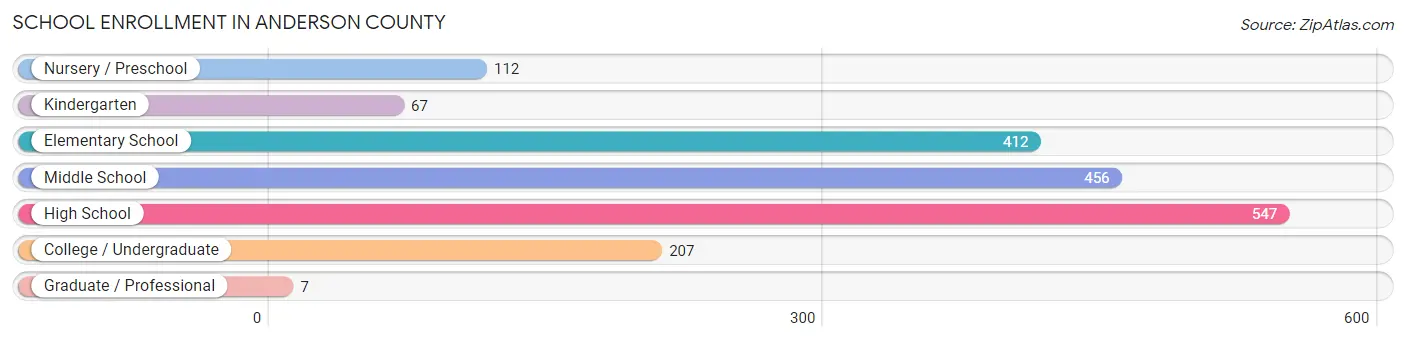
School Enrollment in Anderson County
The most common levels of schooling among the 1,808 students in Anderson County are high school (547 | 30.2%), middle school (456 | 25.2%), and elementary school (412 | 22.8%).
| School Level | # Students | % Students |
| Nursery / Preschool | 112 | 6.2% |
| Kindergarten | 67 | 3.7% |
| Elementary School | 412 | 22.8% |
| Middle School | 456 | 25.2% |
| High School | 547 | 30.2% |
| College / Undergraduate | 207 | 11.5% |
| Graduate / Professional | 7 | 0.4% |
| Total | 1,808 | 100.0% |
School Enrollment by Age by Funding Source in Anderson County
Out of a total of 1,808 students who are enrolled in schools in Anderson County, 278 (15.4%) attend a private institution, while the remaining 1,530 (84.6%) are enrolled in public schools. The age group of 20 to 24 year olds has the highest likelihood of being enrolled in private schools, with 45 (52.9% in the age bracket) enrolled. Conversely, the age group of 3 to 4 year olds has the lowest likelihood of being enrolled in a private school, with 82 (100.0% in the age bracket) attending a public institution.

| Age Bracket | Public School | Private School |
| 3 to 4 Year Olds | 82 (100.0%) | 0 (0.0%) |
| 5 to 9 Year Old | 320 (71.3%) | 129 (28.7%) |
| 10 to 14 Year Olds | 537 (87.9%) | 74 (12.1%) |
| 15 to 17 Year Olds | 316 (91.6%) | 29 (8.4%) |
| 18 to 19 Year Olds | 117 (100.0%) | 0 (0.0%) |
| 20 to 24 Year Olds | 40 (47.1%) | 45 (52.9%) |
| 25 to 34 Year Olds | 57 (100.0%) | 0 (0.0%) |
| 35 Years and over | 60 (96.8%) | 2 (3.2%) |
| Total | 1,530 (84.6%) | 278 (15.4%) |
Educational Attainment by Field of Study in Anderson County
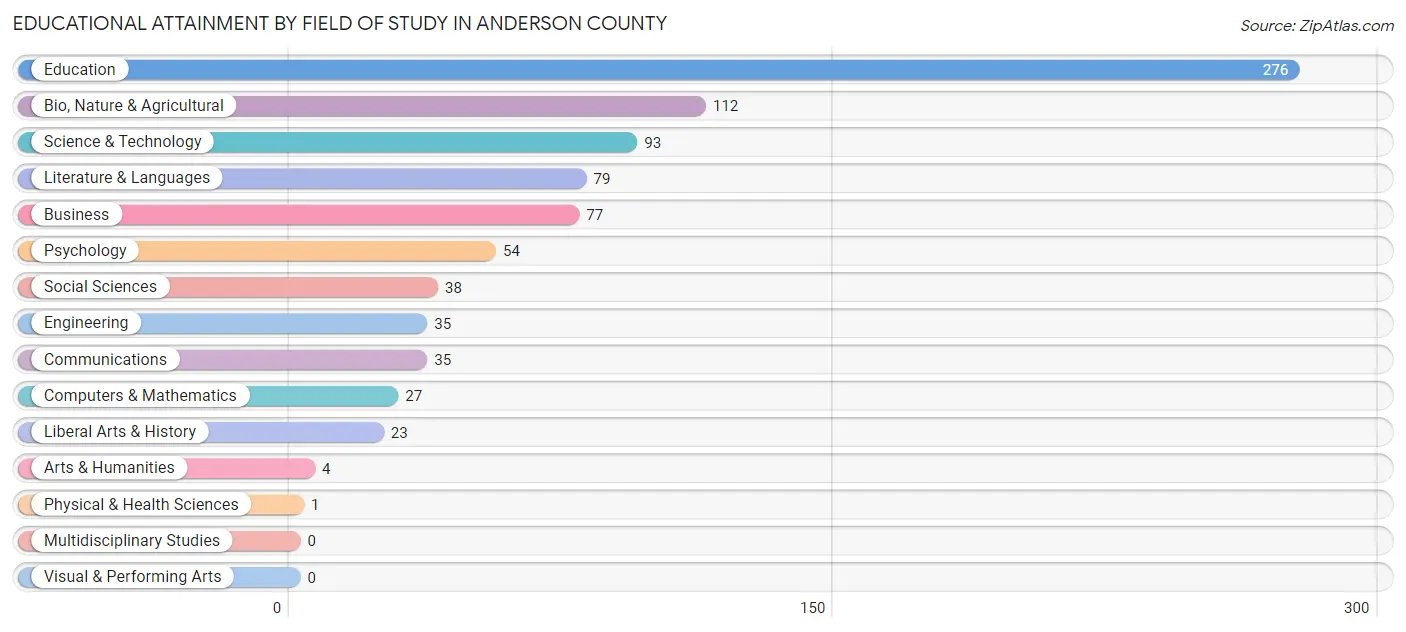
Education (276 | 32.3%), bio, nature & agricultural (112 | 13.1%), science & technology (93 | 10.9%), literature & languages (79 | 9.2%), and business (77 | 9.0%) are the most common fields of study among 854 individuals in Anderson County who have obtained a bachelor's degree or higher.
| Field of Study | # Graduates | % Graduates |
| Computers & Mathematics | 27 | 3.2% |
| Bio, Nature & Agricultural | 112 | 13.1% |
| Physical & Health Sciences | 1 | 0.1% |
| Psychology | 54 | 6.3% |
| Social Sciences | 38 | 4.4% |
| Engineering | 35 | 4.1% |
| Multidisciplinary Studies | 0 | 0.0% |
| Science & Technology | 93 | 10.9% |
| Business | 77 | 9.0% |
| Education | 276 | 32.3% |
| Literature & Languages | 79 | 9.2% |
| Liberal Arts & History | 23 | 2.7% |
| Visual & Performing Arts | 0 | 0.0% |
| Communications | 35 | 4.1% |
| Arts & Humanities | 4 | 0.5% |
| Total | 854 | 100.0% |
Transportation & Commute in Anderson County
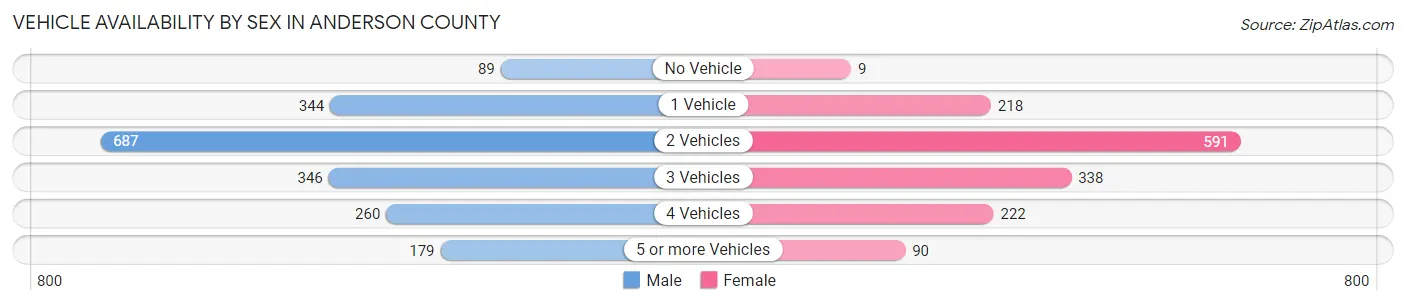
Vehicle Availability by Sex in Anderson County
The most prevalent vehicle ownership categories in Anderson County are males with 2 vehicles (687, accounting for 36.1%) and females with 2 vehicles (591, making up 46.8%).
| Vehicles Available | Male | Female |
| No Vehicle | 89 (4.7%) | 9 (0.6%) |
| 1 Vehicle | 344 (18.1%) | 218 (14.8%) |
| 2 Vehicles | 687 (36.1%) | 591 (40.3%) |
| 3 Vehicles | 346 (18.2%) | 338 (23.0%) |
| 4 Vehicles | 260 (13.7%) | 222 (15.1%) |
| 5 or more Vehicles | 179 (9.4%) | 90 (6.1%) |
| Total | 1,905 (100.0%) | 1,468 (100.0%) |
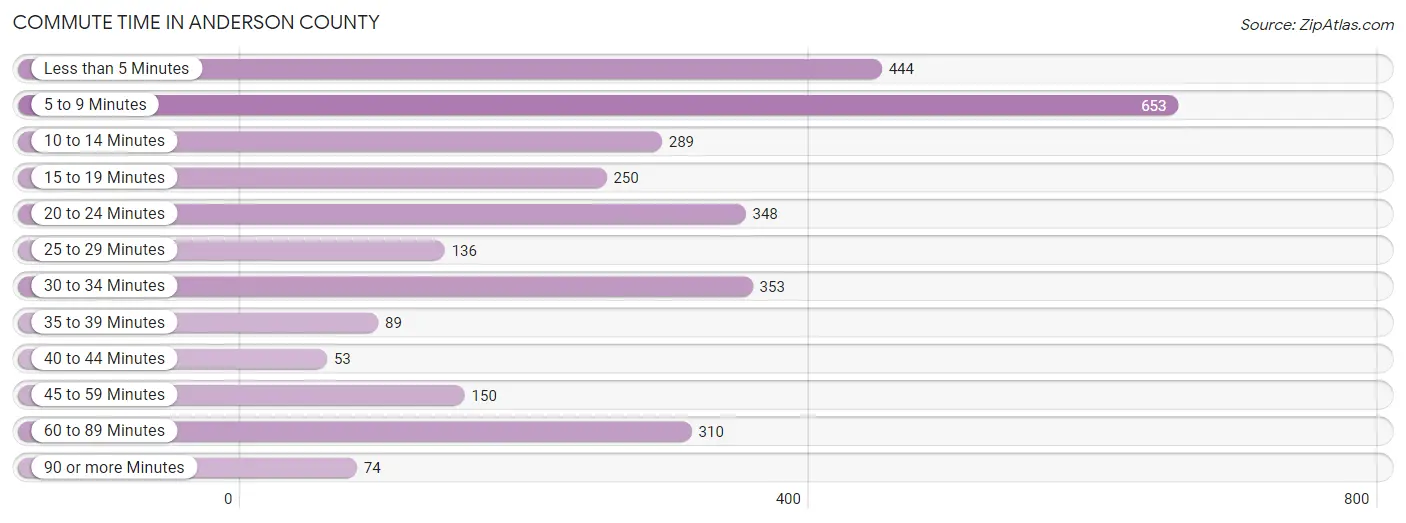
Commute Time in Anderson County
The most frequently occuring commute durations in Anderson County are 5 to 9 minutes (653 commuters, 20.7%), less than 5 minutes (444 commuters, 14.1%), and 30 to 34 minutes (353 commuters, 11.2%).
| Commute Time | # Commuters | % Commuters |
| Less than 5 Minutes | 444 | 14.1% |
| 5 to 9 Minutes | 653 | 20.7% |
| 10 to 14 Minutes | 289 | 9.2% |
| 15 to 19 Minutes | 250 | 7.9% |
| 20 to 24 Minutes | 348 | 11.1% |
| 25 to 29 Minutes | 136 | 4.3% |
| 30 to 34 Minutes | 353 | 11.2% |
| 35 to 39 Minutes | 89 | 2.8% |
| 40 to 44 Minutes | 53 | 1.7% |
| 45 to 59 Minutes | 150 | 4.8% |
| 60 to 89 Minutes | 310 | 9.8% |
| 90 or more Minutes | 74 | 2.4% |
Commute Time by Sex in Anderson County
The most common commute times in Anderson County are 5 to 9 minutes (307 commuters, 17.3%) for males and 5 to 9 minutes (346 commuters, 25.1%) for females.
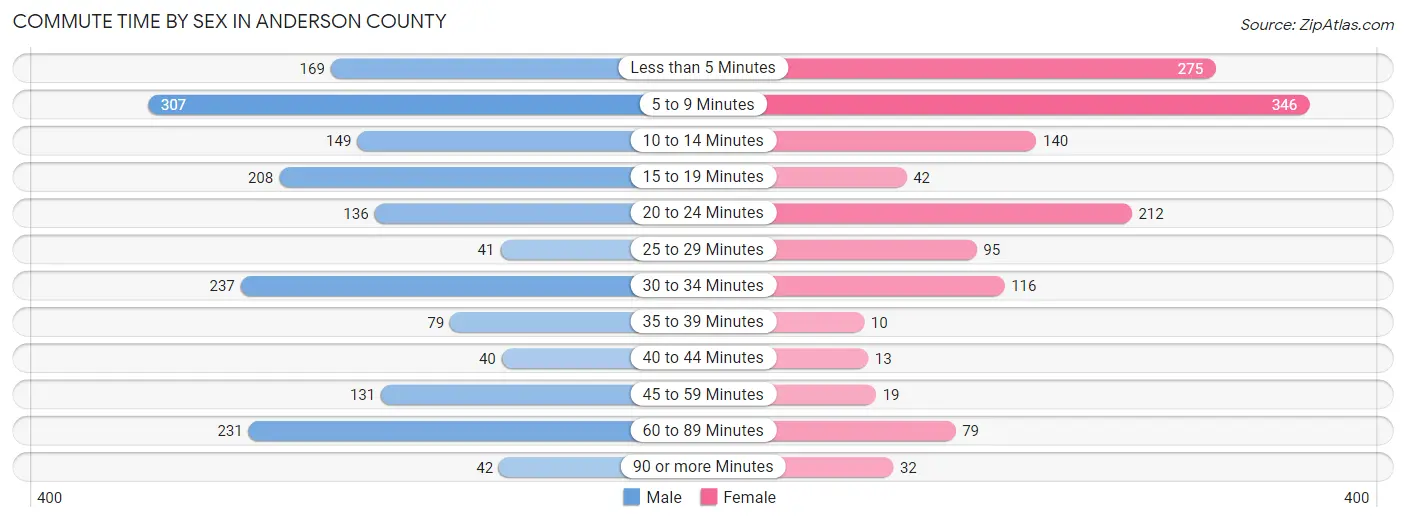
| Commute Time | Male | Female |
| Less than 5 Minutes | 169 (9.6%) | 275 (19.9%) |
| 5 to 9 Minutes | 307 (17.3%) | 346 (25.1%) |
| 10 to 14 Minutes | 149 (8.4%) | 140 (10.2%) |
| 15 to 19 Minutes | 208 (11.7%) | 42 (3.0%) |
| 20 to 24 Minutes | 136 (7.7%) | 212 (15.4%) |
| 25 to 29 Minutes | 41 (2.3%) | 95 (6.9%) |
| 30 to 34 Minutes | 237 (13.4%) | 116 (8.4%) |
| 35 to 39 Minutes | 79 (4.5%) | 10 (0.7%) |
| 40 to 44 Minutes | 40 (2.3%) | 13 (0.9%) |
| 45 to 59 Minutes | 131 (7.4%) | 19 (1.4%) |
| 60 to 89 Minutes | 231 (13.1%) | 79 (5.7%) |
| 90 or more Minutes | 42 (2.4%) | 32 (2.3%) |
Time of Departure to Work by Sex in Anderson County
The most frequent times of departure to work in Anderson County are 7:00 AM to 7:29 AM (299, 16.9%) for males and 7:30 AM to 7:59 AM (340, 24.7%) for females.
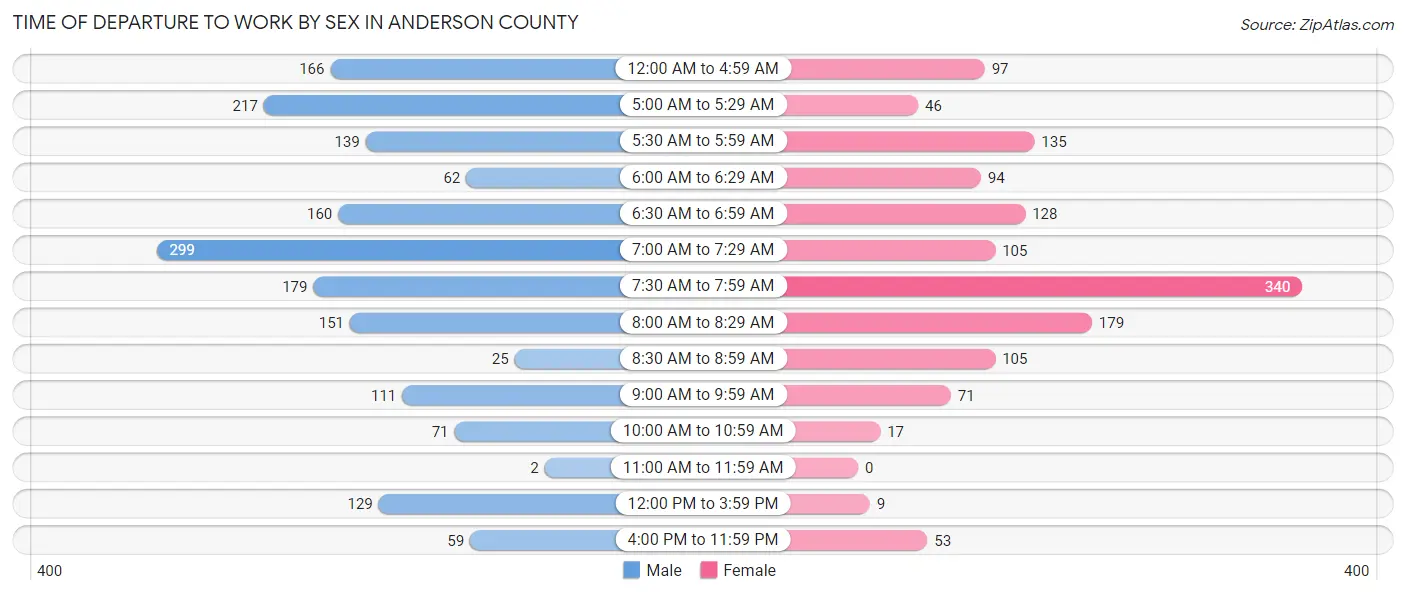
| Time of Departure | Male | Female |
| 12:00 AM to 4:59 AM | 166 (9.4%) | 97 (7.0%) |
| 5:00 AM to 5:29 AM | 217 (12.3%) | 46 (3.3%) |
| 5:30 AM to 5:59 AM | 139 (7.9%) | 135 (9.8%) |
| 6:00 AM to 6:29 AM | 62 (3.5%) | 94 (6.8%) |
| 6:30 AM to 6:59 AM | 160 (9.0%) | 128 (9.3%) |
| 7:00 AM to 7:29 AM | 299 (16.9%) | 105 (7.6%) |
| 7:30 AM to 7:59 AM | 179 (10.1%) | 340 (24.7%) |
| 8:00 AM to 8:29 AM | 151 (8.5%) | 179 (13.0%) |
| 8:30 AM to 8:59 AM | 25 (1.4%) | 105 (7.6%) |
| 9:00 AM to 9:59 AM | 111 (6.3%) | 71 (5.1%) |
| 10:00 AM to 10:59 AM | 71 (4.0%) | 17 (1.2%) |
| 11:00 AM to 11:59 AM | 2 (0.1%) | 0 (0.0%) |
| 12:00 PM to 3:59 PM | 129 (7.3%) | 9 (0.6%) |
| 4:00 PM to 11:59 PM | 59 (3.3%) | 53 (3.8%) |
| Total | 1,770 (100.0%) | 1,379 (100.0%) |
Housing Occupancy in Anderson County
Occupancy by Ownership in Anderson County
Of the total 3,165 dwellings in Anderson County, owner-occupied units account for 2,478 (78.3%), while renter-occupied units make up 687 (21.7%).

| Occupancy | # Housing Units | % Housing Units |
| Owner Occupied Housing Units | 2,478 | 78.3% |
| Renter-Occupied Housing Units | 687 | 21.7% |
| Total Occupied Housing Units | 3,165 | 100.0% |
Occupancy by Household Size in Anderson County
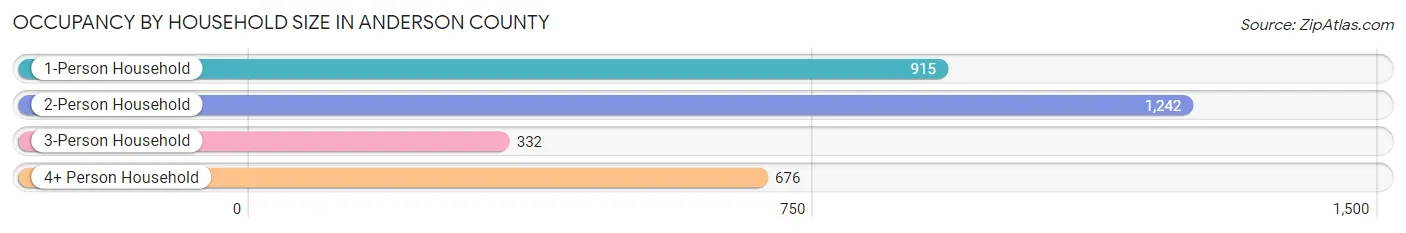
| Household Size | # Housing Units | % Housing Units |
| 1-Person Household | 915 | 28.9% |
| 2-Person Household | 1,242 | 39.2% |
| 3-Person Household | 332 | 10.5% |
| 4+ Person Household | 676 | 21.4% |
| Total Housing Units | 3,165 | 100.0% |
Occupancy by Ownership by Household Size in Anderson County
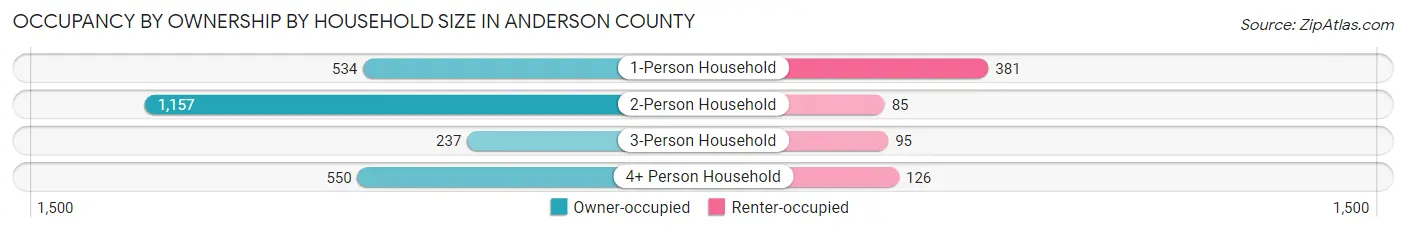
| Household Size | Owner-occupied | Renter-occupied |
| 1-Person Household | 534 (58.4%) | 381 (41.6%) |
| 2-Person Household | 1,157 (93.2%) | 85 (6.8%) |
| 3-Person Household | 237 (71.4%) | 95 (28.6%) |
| 4+ Person Household | 550 (81.4%) | 126 (18.6%) |
| Total Housing Units | 2,478 (78.3%) | 687 (21.7%) |
Occupancy by Educational Attainment in Anderson County
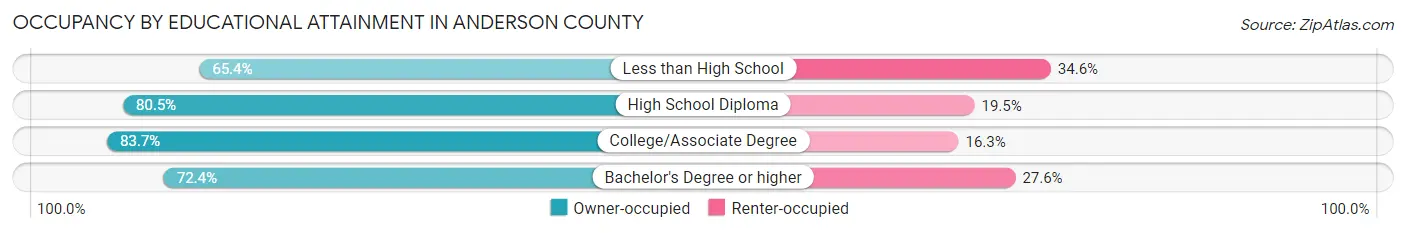
| Household Size | Owner-occupied | Renter-occupied |
| Less than High School | 266 (65.4%) | 141 (34.6%) |
| High School Diploma | 974 (80.5%) | 236 (19.5%) |
| College/Associate Degree | 871 (83.7%) | 170 (16.3%) |
| Bachelor's Degree or higher | 367 (72.4%) | 140 (27.6%) |
Occupancy by Age of Householder in Anderson County
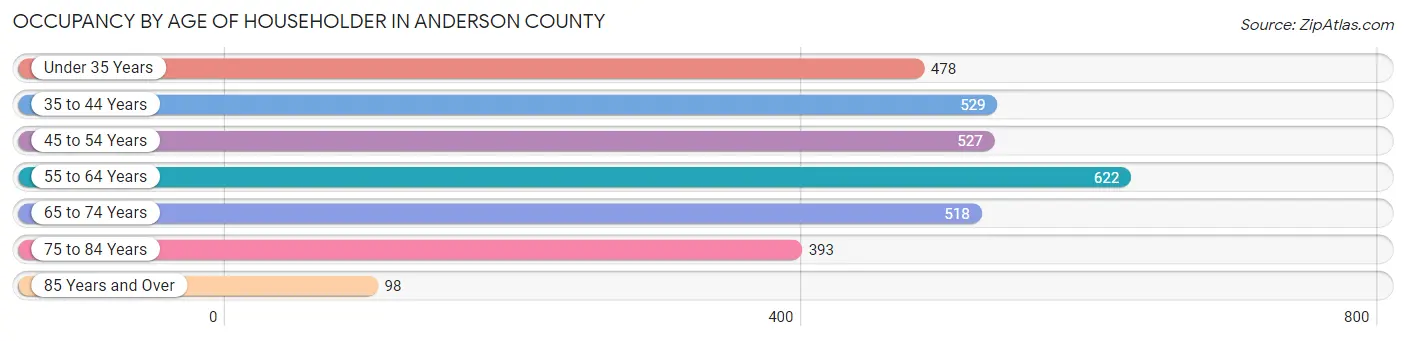
| Age Bracket | # Households | % Households |
| Under 35 Years | 478 | 15.1% |
| 35 to 44 Years | 529 | 16.7% |
| 45 to 54 Years | 527 | 16.7% |
| 55 to 64 Years | 622 | 19.7% |
| 65 to 74 Years | 518 | 16.4% |
| 75 to 84 Years | 393 | 12.4% |
| 85 Years and Over | 98 | 3.1% |
| Total | 3,165 | 100.0% |
Housing Finances in Anderson County
Median Income by Occupancy in Anderson County

| Occupancy Type | # Households | Median Income |
| Owner-Occupied | 2,478 (78.3%) | $73,875 |
| Renter-Occupied | 687 (21.7%) | $30,536 |
| Average | 3,165 (100.0%) | $67,651 |
Occupancy by Householder Income Bracket in Anderson County

| Income Bracket | Owner-occupied | Renter-occupied |
| Less than $5,000 | 38 (1.5%) | 28 (4.1%) |
| $5,000 to $9,999 | 22 (0.9%) | 0 (0.0%) |
| $10,000 to $14,999 | 113 (4.6%) | 75 (10.9%) |
| $15,000 to $19,999 | 97 (3.9%) | 86 (12.5%) |
| $20,000 to $24,999 | 111 (4.5%) | 34 (5.0%) |
| $25,000 to $34,999 | 245 (9.9%) | 223 (32.5%) |
| $35,000 to $49,999 | 228 (9.2%) | 12 (1.8%) |
| $50,000 to $74,999 | 430 (17.3%) | 80 (11.6%) |
| $75,000 to $99,999 | 538 (21.7%) | 96 (14.0%) |
| $100,000 to $149,999 | 427 (17.2%) | 53 (7.7%) |
| $150,000 or more | 229 (9.2%) | 0 (0.0%) |
| Total | 2,478 (100.0%) | 687 (100.0%) |
Monthly Housing Cost Tiers in Anderson County

| Monthly Cost | Owner-occupied | Renter-occupied |
| Less than $300 | 291 (11.7%) | 0 (0.0%) |
| $300 to $499 | 284 (11.5%) | 108 (15.7%) |
| $500 to $799 | 494 (19.9%) | 239 (34.8%) |
| $800 to $999 | 629 (25.4%) | 177 (25.8%) |
| $1,000 to $1,499 | 319 (12.9%) | 66 (9.6%) |
| $1,500 to $1,999 | 370 (14.9%) | 14 (2.0%) |
| $2,000 to $2,499 | 45 (1.8%) | 0 (0.0%) |
| $2,500 to $2,999 | 11 (0.4%) | 0 (0.0%) |
| $3,000 or more | 35 (1.4%) | 0 (0.0%) |
| Total | 2,478 (100.0%) | 687 (100.0%) |
Physical Housing Characteristics in Anderson County
Housing Structures in Anderson County
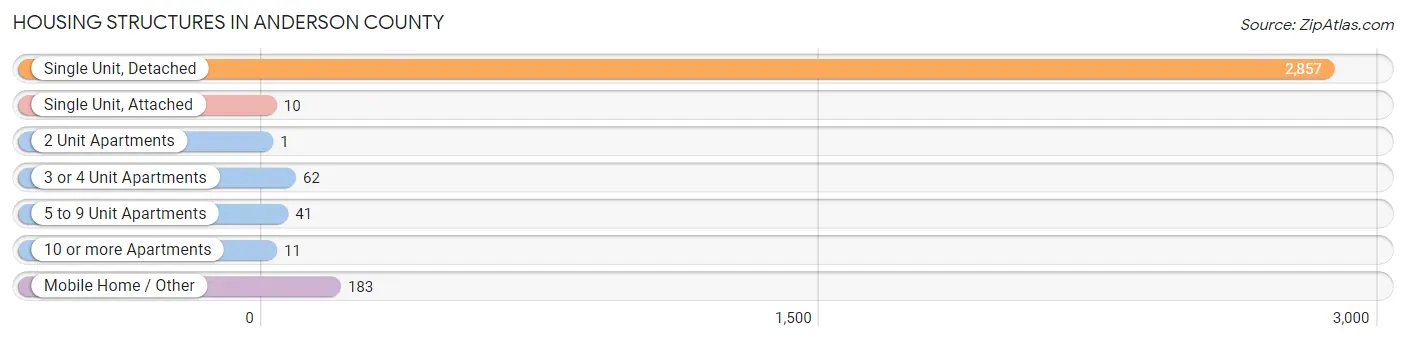
| Structure Type | # Housing Units | % Housing Units |
| Single Unit, Detached | 2,857 | 90.3% |
| Single Unit, Attached | 10 | 0.3% |
| 2 Unit Apartments | 1 | 0.0% |
| 3 or 4 Unit Apartments | 62 | 2.0% |
| 5 to 9 Unit Apartments | 41 | 1.3% |
| 10 or more Apartments | 11 | 0.4% |
| Mobile Home / Other | 183 | 5.8% |
| Total | 3,165 | 100.0% |
Housing Structures by Occupancy in Anderson County
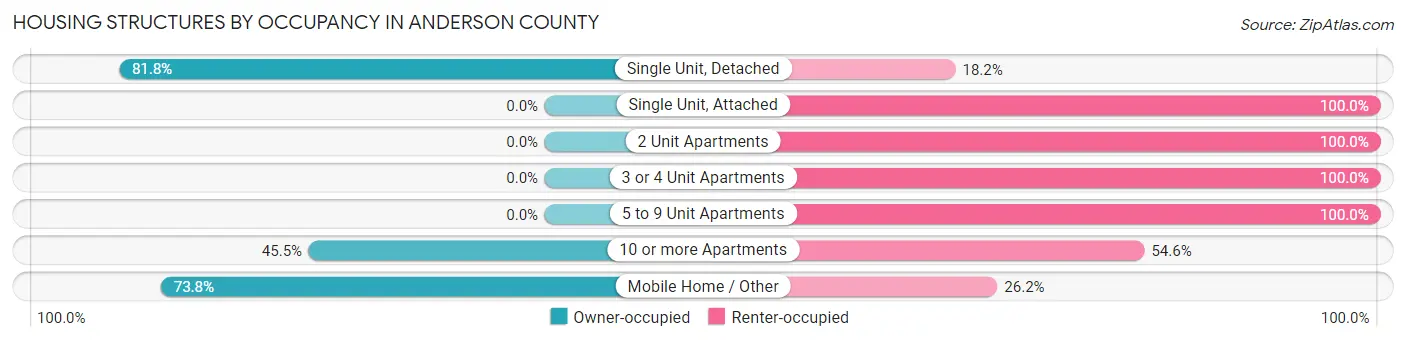
| Structure Type | Owner-occupied | Renter-occupied |
| Single Unit, Detached | 2,338 (81.8%) | 519 (18.2%) |
| Single Unit, Attached | 0 (0.0%) | 10 (100.0%) |
| 2 Unit Apartments | 0 (0.0%) | 1 (100.0%) |
| 3 or 4 Unit Apartments | 0 (0.0%) | 62 (100.0%) |
| 5 to 9 Unit Apartments | 0 (0.0%) | 41 (100.0%) |
| 10 or more Apartments | 5 (45.5%) | 6 (54.5%) |
| Mobile Home / Other | 135 (73.8%) | 48 (26.2%) |
| Total | 2,478 (78.3%) | 687 (21.7%) |
Housing Structures by Number of Rooms in Anderson County

| Number of Rooms | Owner-occupied | Renter-occupied |
| 1 Room | 51 (2.1%) | 1 (0.2%) |
| 2 or 3 Rooms | 70 (2.8%) | 62 (9.0%) |
| 4 or 5 Rooms | 628 (25.3%) | 216 (31.4%) |
| 6 or 7 Rooms | 992 (40.0%) | 122 (17.8%) |
| 8 or more Rooms | 737 (29.7%) | 286 (41.6%) |
| Total | 2,478 (100.0%) | 687 (100.0%) |
Housing Structure by Heating Type in Anderson County
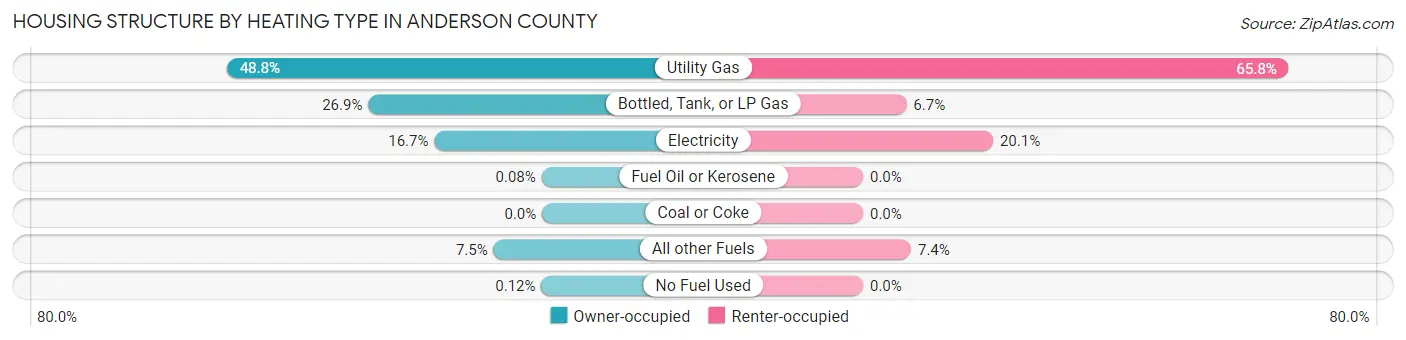
| Heating Type | Owner-occupied | Renter-occupied |
| Utility Gas | 1,208 (48.7%) | 452 (65.8%) |
| Bottled, Tank, or LP Gas | 666 (26.9%) | 46 (6.7%) |
| Electricity | 413 (16.7%) | 138 (20.1%) |
| Fuel Oil or Kerosene | 2 (0.1%) | 0 (0.0%) |
| Coal or Coke | 0 (0.0%) | 0 (0.0%) |
| All other Fuels | 186 (7.5%) | 51 (7.4%) |
| No Fuel Used | 3 (0.1%) | 0 (0.0%) |
| Total | 2,478 (100.0%) | 687 (100.0%) |
Household Vehicle Usage in Anderson County
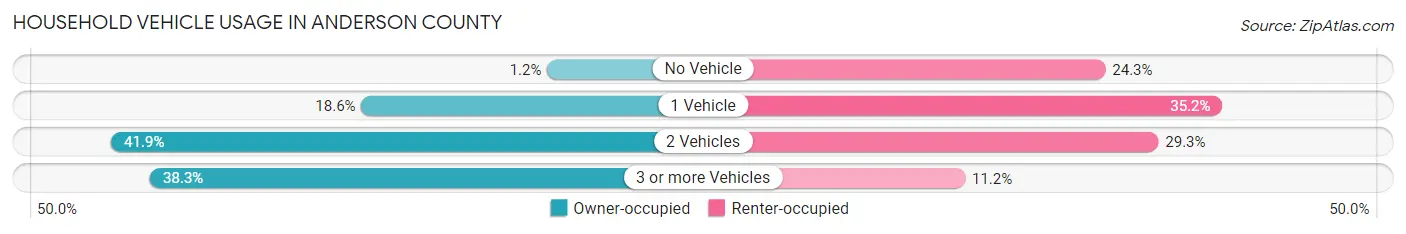
| Vehicles per Household | Owner-occupied | Renter-occupied |
| No Vehicle | 30 (1.2%) | 167 (24.3%) |
| 1 Vehicle | 460 (18.6%) | 242 (35.2%) |
| 2 Vehicles | 1,039 (41.9%) | 201 (29.3%) |
| 3 or more Vehicles | 949 (38.3%) | 77 (11.2%) |
| Total | 2,478 (100.0%) | 687 (100.0%) |
Real Estate & Mortgages in Anderson County
Real Estate and Mortgage Overview in Anderson County
| Characteristic | Without Mortgage | With Mortgage |
| Housing Units | 1,381 | 1,097 |
| Median Property Value | $124,200 | $168,700 |
| Median Household Income | $62,449 | $98 |
| Monthly Housing Costs | $591 | $35 |
| Real Estate Taxes | $2,084 | $24 |
Property Value by Mortgage Status in Anderson County
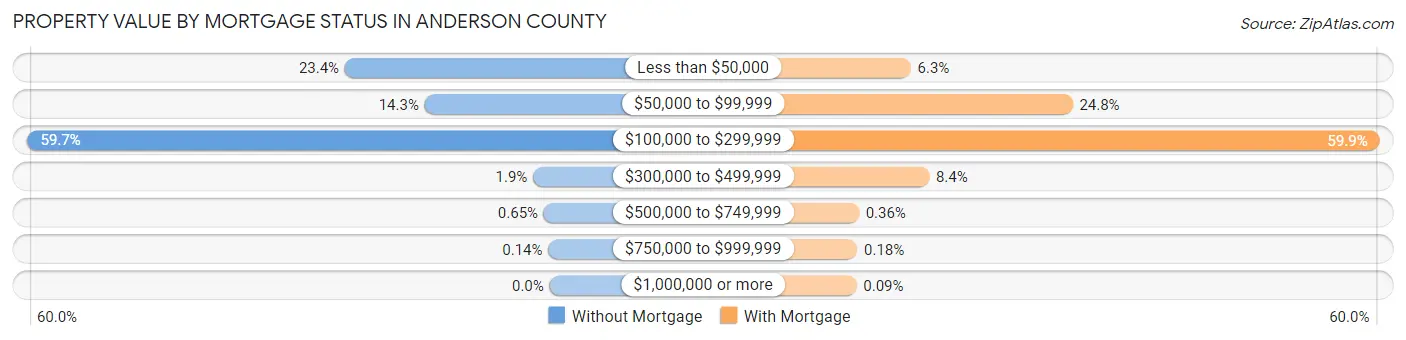
| Property Value | Without Mortgage | With Mortgage |
| Less than $50,000 | 323 (23.4%) | 69 (6.3%) |
| $50,000 to $99,999 | 197 (14.3%) | 272 (24.8%) |
| $100,000 to $299,999 | 824 (59.7%) | 657 (59.9%) |
| $300,000 to $499,999 | 26 (1.9%) | 92 (8.4%) |
| $500,000 to $749,999 | 9 (0.6%) | 4 (0.4%) |
| $750,000 to $999,999 | 2 (0.1%) | 2 (0.2%) |
| $1,000,000 or more | 0 (0.0%) | 1 (0.1%) |
| Total | 1,381 (100.0%) | 1,097 (100.0%) |
Household Income by Mortgage Status in Anderson County
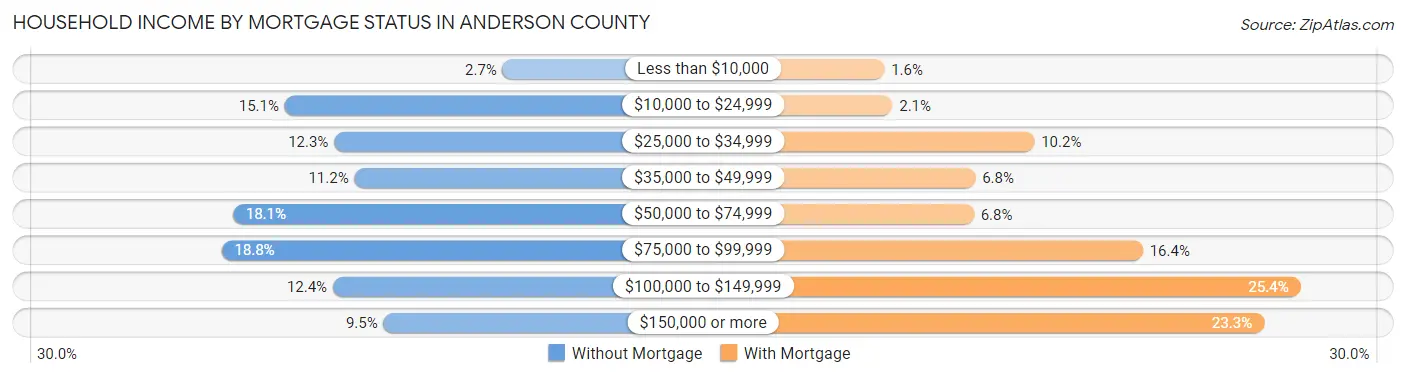
| Household Income | Without Mortgage | With Mortgage |
| Less than $10,000 | 37 (2.7%) | 18 (1.6%) |
| $10,000 to $24,999 | 209 (15.1%) | 23 (2.1%) |
| $25,000 to $34,999 | 170 (12.3%) | 112 (10.2%) |
| $35,000 to $49,999 | 154 (11.2%) | 75 (6.8%) |
| $50,000 to $74,999 | 250 (18.1%) | 74 (6.8%) |
| $75,000 to $99,999 | 259 (18.8%) | 180 (16.4%) |
| $100,000 to $149,999 | 171 (12.4%) | 279 (25.4%) |
| $150,000 or more | 131 (9.5%) | 256 (23.3%) |
| Total | 1,381 (100.0%) | 1,097 (100.0%) |
Property Value to Household Income Ratio in Anderson County
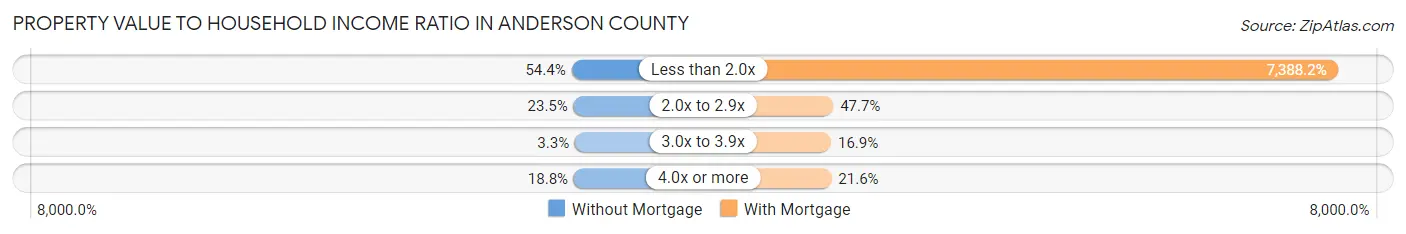
| Value-to-Income Ratio | Without Mortgage | With Mortgage |
| Less than 2.0x | 751 (54.4%) | 81,049 (7,388.2%) |
| 2.0x to 2.9x | 324 (23.5%) | 523 (47.7%) |
| 3.0x to 3.9x | 46 (3.3%) | 185 (16.9%) |
| 4.0x or more | 259 (18.8%) | 237 (21.6%) |
| Total | 1,381 (100.0%) | 1,097 (100.0%) |
Real Estate Taxes by Mortgage Status in Anderson County
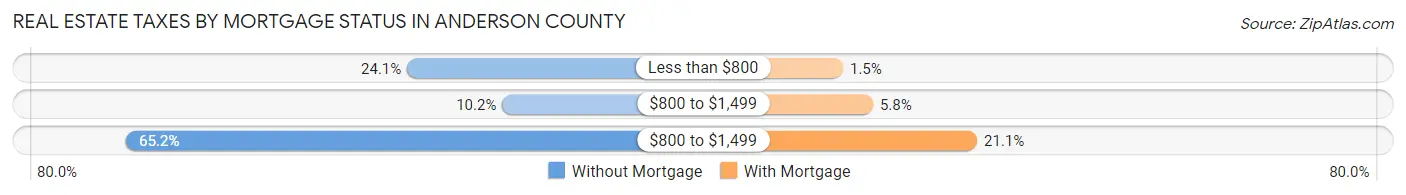
| Property Taxes | Without Mortgage | With Mortgage |
| Less than $800 | 333 (24.1%) | 16 (1.5%) |
| $800 to $1,499 | 141 (10.2%) | 64 (5.8%) |
| $800 to $1,499 | 900 (65.2%) | 231 (21.1%) |
| Total | 1,381 (100.0%) | 1,097 (100.0%) |
Health & Disability in Anderson County
Health Insurance Coverage by Age in Anderson County
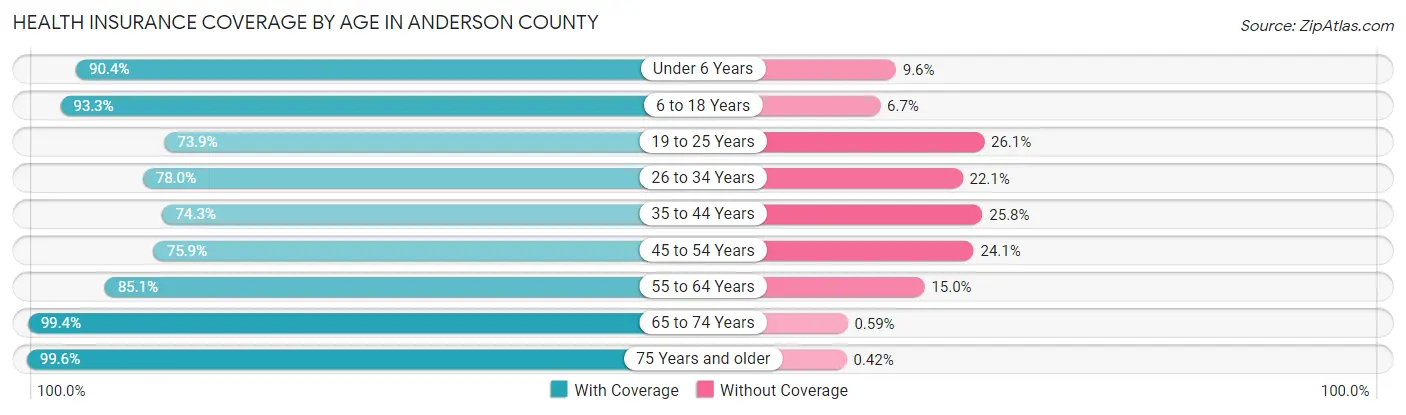
| Age Bracket | With Coverage | Without Coverage |
| Under 6 Years | 537 (90.4%) | 57 (9.6%) |
| 6 to 18 Years | 1,371 (93.3%) | 98 (6.7%) |
| 19 to 25 Years | 437 (73.9%) | 154 (26.1%) |
| 26 to 34 Years | 463 (77.9%) | 131 (22.1%) |
| 35 to 44 Years | 672 (74.3%) | 233 (25.8%) |
| 45 to 54 Years | 671 (75.9%) | 213 (24.1%) |
| 55 to 64 Years | 910 (85.1%) | 160 (14.9%) |
| 65 to 74 Years | 848 (99.4%) | 5 (0.6%) |
| 75 Years and older | 712 (99.6%) | 3 (0.4%) |
| Total | 6,621 (86.3%) | 1,054 (13.7%) |
Health Insurance Coverage by Citizenship Status in Anderson County
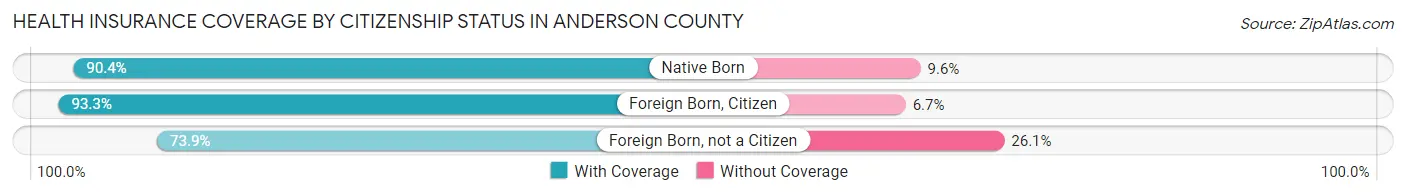
| Citizenship Status | With Coverage | Without Coverage |
| Native Born | 537 (90.4%) | 57 (9.6%) |
| Foreign Born, Citizen | 1,371 (93.3%) | 98 (6.7%) |
| Foreign Born, not a Citizen | 437 (73.9%) | 154 (26.1%) |
Health Insurance Coverage by Household Income in Anderson County
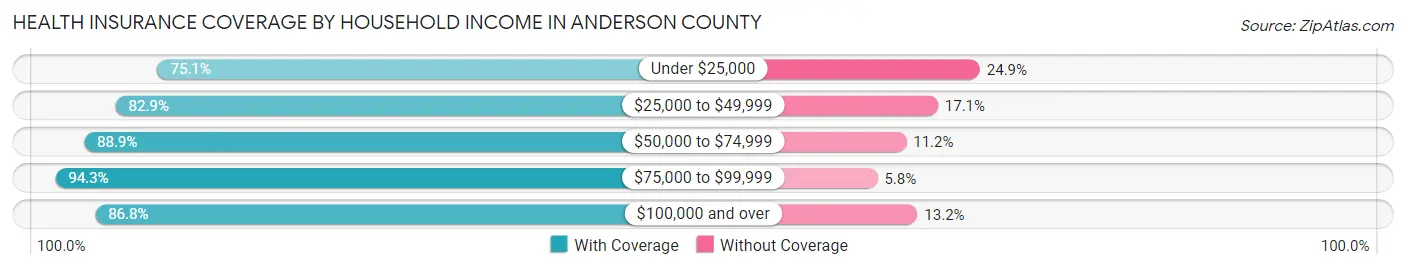
| Household Income | With Coverage | Without Coverage |
| Under $25,000 | 795 (75.1%) | 264 (24.9%) |
| $25,000 to $49,999 | 1,133 (82.9%) | 233 (17.1%) |
| $50,000 to $74,999 | 1,108 (88.8%) | 139 (11.2%) |
| $75,000 to $99,999 | 1,459 (94.3%) | 89 (5.8%) |
| $100,000 and over | 2,119 (86.8%) | 323 (13.2%) |
Public vs Private Health Insurance Coverage by Age in Anderson County
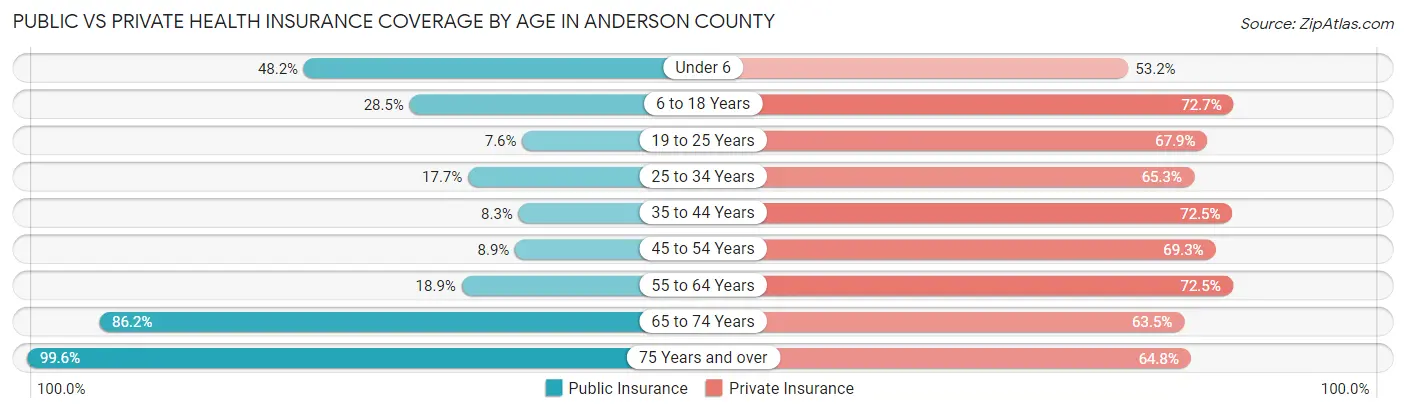
| Age Bracket | Public Insurance | Private Insurance |
| Under 6 | 286 (48.1%) | 316 (53.2%) |
| 6 to 18 Years | 419 (28.5%) | 1,068 (72.7%) |
| 19 to 25 Years | 45 (7.6%) | 401 (67.8%) |
| 25 to 34 Years | 105 (17.7%) | 388 (65.3%) |
| 35 to 44 Years | 75 (8.3%) | 656 (72.5%) |
| 45 to 54 Years | 79 (8.9%) | 613 (69.3%) |
| 55 to 64 Years | 202 (18.9%) | 776 (72.5%) |
| 65 to 74 Years | 735 (86.2%) | 542 (63.5%) |
| 75 Years and over | 712 (99.6%) | 463 (64.8%) |
| Total | 2,658 (34.6%) | 5,223 (68.0%) |
Disability Status by Sex by Age in Anderson County
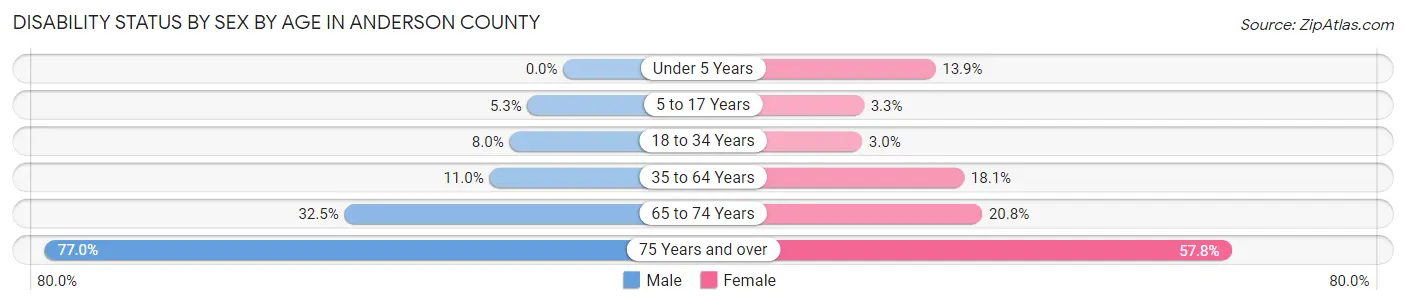
| Age Bracket | Male | Female |
| Under 5 Years | 0 (0.0%) | 39 (13.9%) |
| 5 to 17 Years | 40 (5.3%) | 21 (3.3%) |
| 18 to 34 Years | 58 (8.0%) | 18 (3.0%) |
| 35 to 64 Years | 149 (11.0%) | 272 (18.1%) |
| 65 to 74 Years | 143 (32.5%) | 86 (20.8%) |
| 75 Years and over | 231 (77.0%) | 240 (57.8%) |
Disability Class by Sex by Age in Anderson County
Disability Class: Hearing Difficulty
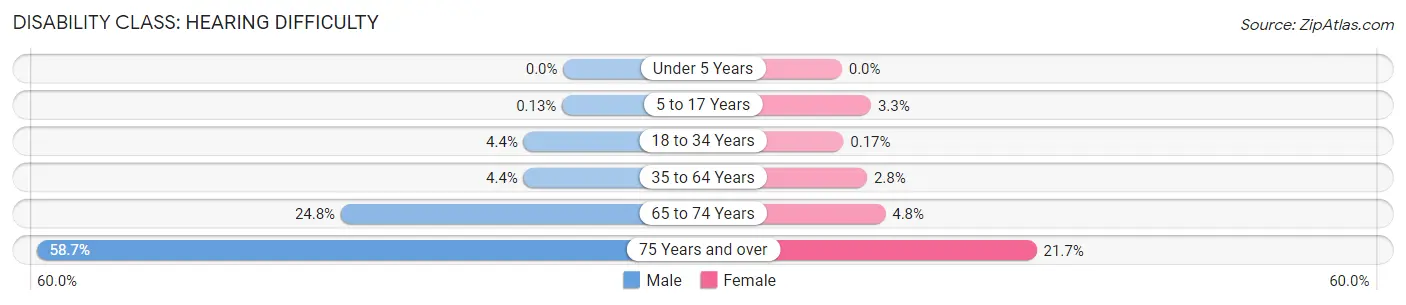
| Age Bracket | Male | Female |
| Under 5 Years | 0 (0.0%) | 0 (0.0%) |
| 5 to 17 Years | 1 (0.1%) | 21 (3.3%) |
| 18 to 34 Years | 32 (4.4%) | 1 (0.2%) |
| 35 to 64 Years | 60 (4.4%) | 42 (2.8%) |
| 65 to 74 Years | 109 (24.8%) | 20 (4.8%) |
| 75 Years and over | 176 (58.7%) | 90 (21.7%) |
Disability Class: Vision Difficulty
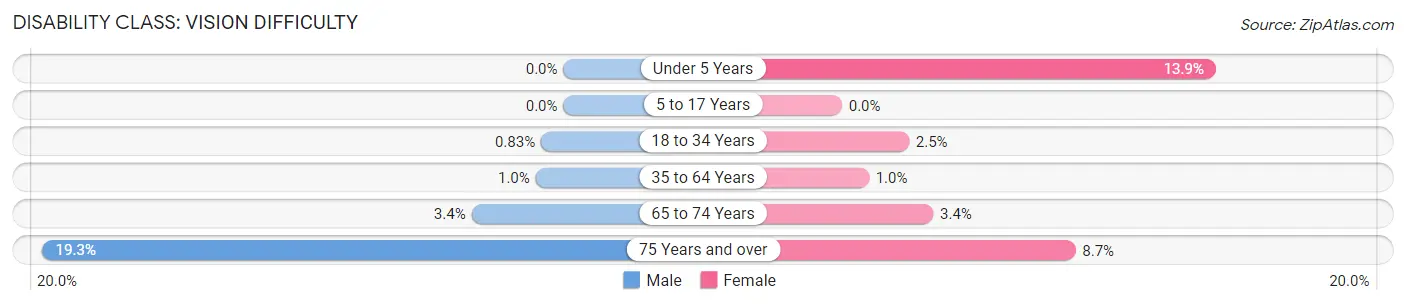
| Age Bracket | Male | Female |
| Under 5 Years | 0 (0.0%) | 39 (13.9%) |
| 5 to 17 Years | 0 (0.0%) | 0 (0.0%) |
| 18 to 34 Years | 6 (0.8%) | 15 (2.5%) |
| 35 to 64 Years | 14 (1.0%) | 15 (1.0%) |
| 65 to 74 Years | 15 (3.4%) | 14 (3.4%) |
| 75 Years and over | 58 (19.3%) | 36 (8.7%) |
Disability Class: Cognitive Difficulty

| Age Bracket | Male | Female |
| 5 to 17 Years | 40 (5.3%) | 0 (0.0%) |
| 18 to 34 Years | 24 (3.3%) | 17 (2.8%) |
| 35 to 64 Years | 40 (2.9%) | 92 (6.1%) |
| 65 to 74 Years | 15 (3.4%) | 1 (0.2%) |
| 75 Years and over | 16 (5.3%) | 34 (8.2%) |
Disability Class: Ambulatory Difficulty
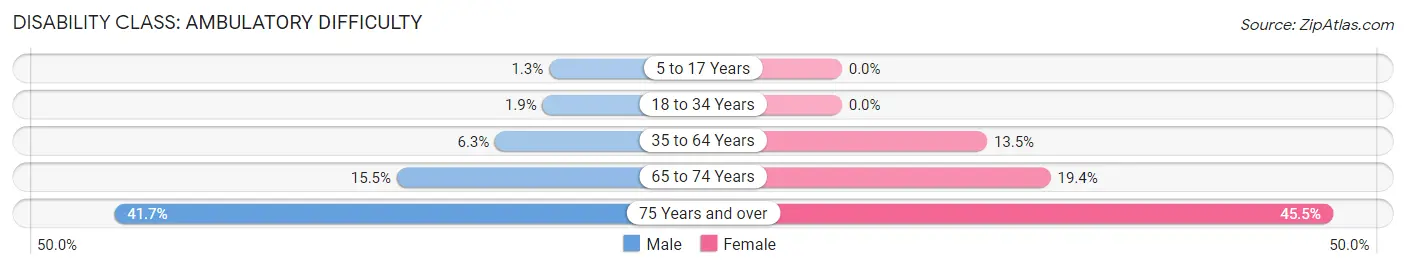
| Age Bracket | Male | Female |
| 5 to 17 Years | 10 (1.3%) | 0 (0.0%) |
| 18 to 34 Years | 14 (1.9%) | 0 (0.0%) |
| 35 to 64 Years | 86 (6.3%) | 202 (13.5%) |
| 65 to 74 Years | 68 (15.4%) | 80 (19.4%) |
| 75 Years and over | 125 (41.7%) | 189 (45.5%) |
Disability Class: Self-Care Difficulty
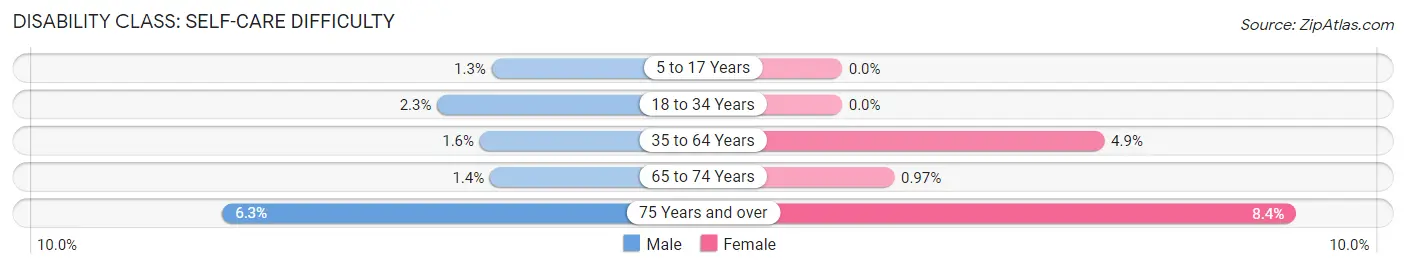
| Age Bracket | Male | Female |
| 5 to 17 Years | 10 (1.3%) | 0 (0.0%) |
| 18 to 34 Years | 17 (2.3%) | 0 (0.0%) |
| 35 to 64 Years | 21 (1.5%) | 73 (4.9%) |
| 65 to 74 Years | 6 (1.4%) | 4 (1.0%) |
| 75 Years and over | 19 (6.3%) | 35 (8.4%) |
Technology Access in Anderson County
Computing Device Access in Anderson County
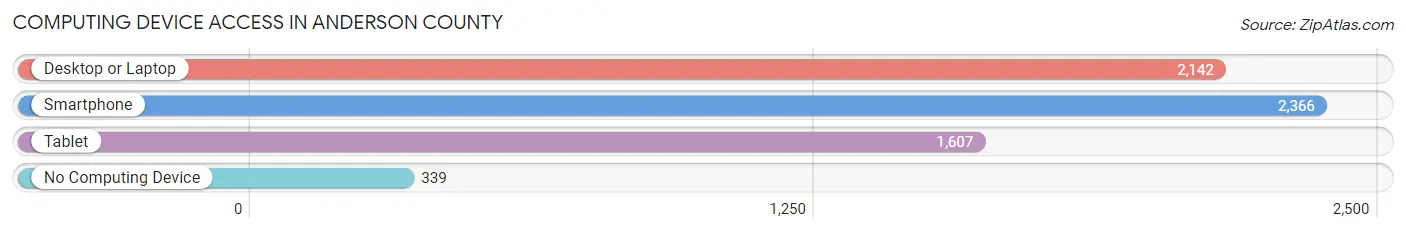
| Device Type | # Households | % Households |
| Desktop or Laptop | 2,142 | 67.7% |
| Smartphone | 2,366 | 74.8% |
| Tablet | 1,607 | 50.8% |
| No Computing Device | 339 | 10.7% |
| Total | 3,165 | 100.0% |
Internet Access in Anderson County

| Internet Type | # Households | % Households |
| Dial-Up Internet | 31 | 1.0% |
| Broadband Home | 1,466 | 46.3% |
| Cellular Data Only | 413 | 13.1% |
| Satellite Internet | 486 | 15.4% |
| No Internet | 863 | 27.3% |
| Total | 3,165 | 100.0% |
Anderson County Summary
Anderson County is located in the east-central part of the state of Kansas. It is bordered by Franklin County to the north, Coffey County to the east, Woodson County to the south, and Lyon County to the west. The county seat is Garnett, and the largest city is Greeley. The county was named for Joseph C. Anderson, a member of the first Kansas Territorial Legislature.
Geography
Anderson County covers an area of 576 square miles, of which 575 square miles is land and 1 square mile is water. The county is located in the Osage Plains region of Kansas, and is characterized by rolling hills and open prairies. The county is drained by the Marais des Cygnes River, which flows through the northern part of the county. The county also contains several small lakes, including Lake Garnett, Lake Greeley, and Lake Anderson.
Demographics
As of the 2010 census, there were 8,102 people, 3,093 households, and 2,097 families residing in the county. The population density was 14 people per square mile. The racial makeup of the county was 95.2% White, 0.7% Black or African American, 0.5% Native American, 0.3% Asian, 0.1% Pacific Islander, 1.7% from other races, and 1.5% from two or more races. Hispanic or Latino of any race were 4.2% of the population.
The median income for a household in the county was $41,845, and the median income for a family was $50,945. The per capita income for the county was $20,845. About 10.2% of families and 13.2% of the population were below the poverty line, including 17.2% of those under age 18 and 8.2% of those age 65 or over.
Economy
Agriculture is the main economic activity in Anderson County. The county is home to a variety of crops, including corn, soybeans, wheat, and sorghum. Livestock production is also important to the local economy, with cattle, hogs, and poultry being the main types of livestock raised in the county.
The county also has a number of manufacturing and service-based businesses. The largest employers in the county are the Anderson County Hospital, the Anderson County Unified School District, and the Anderson County Sheriff's Office.
History
The area that is now Anderson County was first settled by European Americans in the 1830s. The county was officially organized in 1855, and was named for Joseph C. Anderson, a member of the first Kansas Territorial Legislature.
During the Civil War, Anderson County was a hotbed of pro-Confederate sentiment. In 1863, a group of Confederate sympathizers known as the "Anderson County Rangers" formed in the county. The group was eventually disbanded by Union forces, but the county remained divided in its loyalties throughout the war.
In the late 19th century, Anderson County experienced a period of rapid growth and development. The county was home to several railroads, and the population increased steadily throughout the late 1800s and early 1900s.
Today, Anderson County is a largely rural county with a population of just over 8,000. The county is home to a variety of small towns and communities, and is known for its agricultural production and outdoor recreation opportunities.
Common Questions
What is the Total Population of Anderson County?
Total Population of Anderson County is 7,799.
What is the Total Male Population of Anderson County?
Total Male Population of Anderson County is 3,886.
What is the Total Female Population of Anderson County?
Total Female Population of Anderson County is 3,913.
What is the Ratio of Males per 100 Females in Anderson County?
There are 99.31 Males per 100 Females in Anderson County.
What is the Ratio of Females per 100 Males in Anderson County?
There are 100.69 Females per 100 Males in Anderson County.
What is the Median Population Age in Anderson County?
Median Population Age in Anderson County is 39.7 Years.
What is the Average Family Size in Anderson County
Average Family Size in Anderson County is 3.0 People.
What is the Average Household Size in Anderson County
Average Household Size in Anderson County is 2.4 People.
What is Per Capita Income in Anderson County?
Per Capita income in Anderson County is $29,665.
What is the Median Family Income in Anderson County?
Median Family Income in Anderson County is $79,089.
What is the Median Household income in Anderson County?
Median Household Income in Anderson County is $67,651.
What is Income or Wage Gap in Anderson County?
Income or Wage Gap in Anderson County is 30.6%.
Women in Anderson County earn 69.4 cents for every dollar earned by a man.
What is Inequality or Gini Index in Anderson County?
Inequality or Gini Index in Anderson County is 0.42.
How Large is the Labor Force in Anderson County?
There are 3,649 People in the Labor Forcein in Anderson County.
What is the Percentage of People in the Labor Force in Anderson County?
60.1% of People are in the Labor Force in Anderson County.
What is the Unemployment Rate in Anderson County?
Unemployment Rate in Anderson County is 3.3%.