Williston Highlands, FL
Williston Highlands Map
Williston Highlands Overview
3,164
TOTAL POPULATION
1,747
MALE POPULATION
1,417
FEMALE POPULATION
123.29
MALES / 100 FEMALES
81.11
FEMALES / 100 MALES
36.1
MEDIAN AGE
2.9
AVG FAMILY SIZE
2.6
AVG HOUSEHOLD SIZE
$49,315
PER CAPITA INCOME
$80,556
AVG FAMILY INCOME
$67,348
AVG HOUSEHOLD INCOME
23.7%
WAGE / INCOME GAP [ % ]
76.3¢/ $1
WAGE / INCOME GAP [ $ ]
0.60
INEQUALITY / GINI INDEX
1,454
LABOR FORCE [ PEOPLE ]
59.6%
PERCENT IN LABOR FORCE
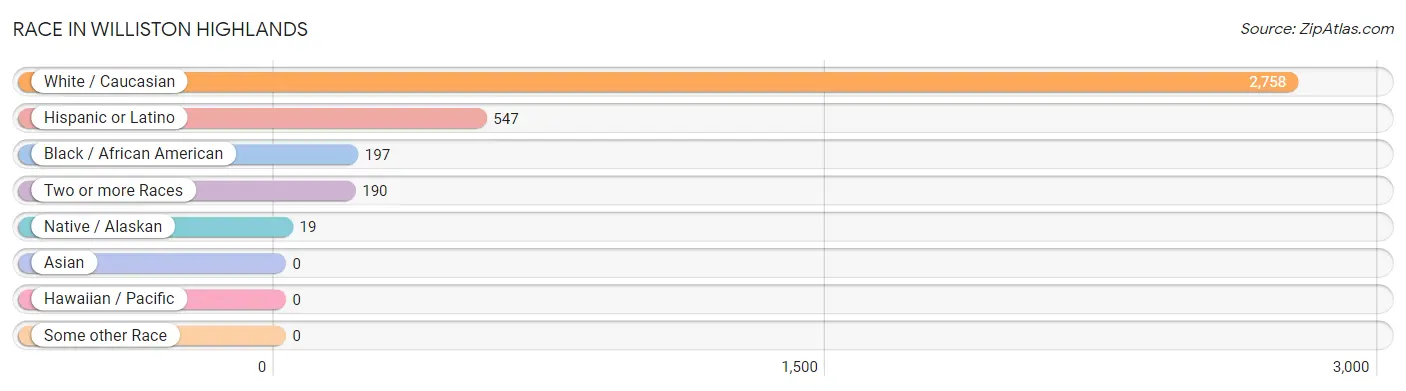
Race in Williston Highlands
The most populous races in Williston Highlands are White / Caucasian (2,758 | 87.2%), Hispanic or Latino (547 | 17.3%), and Black / African American (197 | 6.2%).
| Race | # Population | % Population |
| Asian | 0 | 0.0% |
| Black / African American | 197 | 6.2% |
| Hawaiian / Pacific | 0 | 0.0% |
| Hispanic or Latino | 547 | 17.3% |
| Native / Alaskan | 19 | 0.6% |
| White / Caucasian | 2,758 | 87.2% |
| Two or more Races | 190 | 6.0% |
| Some other Race | 0 | 0.0% |
| Total | 3,164 | 100.0% |
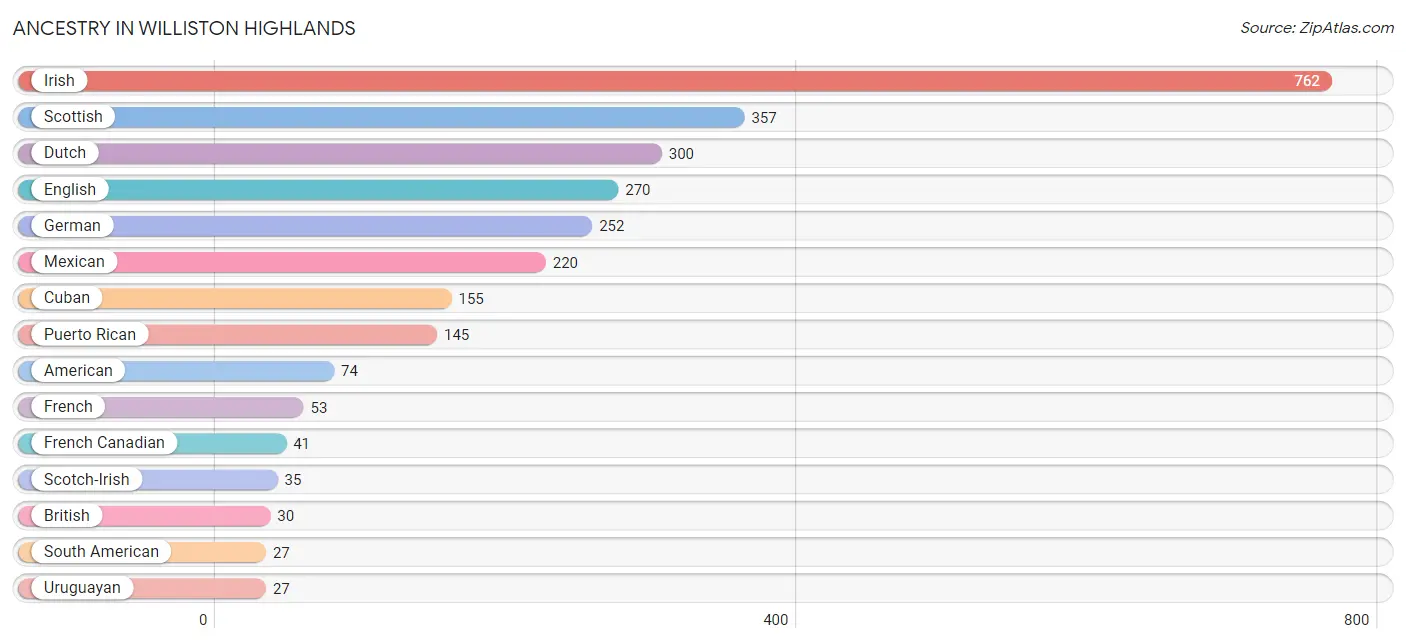
Ancestry in Williston Highlands
The most populous ancestries reported in Williston Highlands are Irish (762 | 24.1%), Scottish (357 | 11.3%), Dutch (300 | 9.5%), English (270 | 8.5%), and German (252 | 8.0%), together accounting for 61.3% of all Williston Highlands residents.
| Ancestry | # Population | % Population |
| American | 74 | 2.3% |
| British | 30 | 0.9% |
| Cherokee | 19 | 0.6% |
| Cuban | 155 | 4.9% |
| Czech | 8 | 0.3% |
| Dutch | 300 | 9.5% |
| English | 270 | 8.5% |
| European | 13 | 0.4% |
| French | 53 | 1.7% |
| French Canadian | 41 | 1.3% |
| German | 252 | 8.0% |
| Irish | 762 | 24.1% |
| Italian | 23 | 0.7% |
| Mexican | 220 | 7.0% |
| Portuguese | 11 | 0.4% |
| Puerto Rican | 145 | 4.6% |
| Scotch-Irish | 35 | 1.1% |
| Scottish | 357 | 11.3% |
| South American | 27 | 0.9% |
| Uruguayan | 27 | 0.9% | View All 20 Rows |
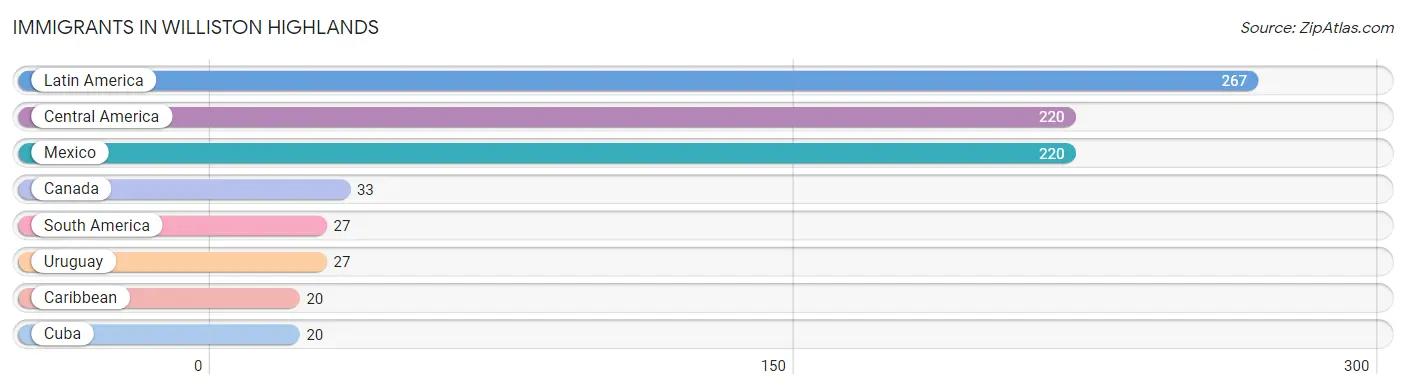
Immigrants in Williston Highlands
The most numerous immigrant groups reported in Williston Highlands came from Latin America (267 | 8.4%), Central America (220 | 7.0%), Mexico (220 | 7.0%), Canada (33 | 1.0%), and South America (27 | 0.9%), together accounting for 24.2% of all Williston Highlands residents.
| Immigration Origin | # Population | % Population |
| Canada | 33 | 1.0% |
| Caribbean | 20 | 0.6% |
| Central America | 220 | 7.0% |
| Cuba | 20 | 0.6% |
| Latin America | 267 | 8.4% |
| Mexico | 220 | 7.0% |
| South America | 27 | 0.9% |
| Uruguay | 27 | 0.9% | View All 8 Rows |
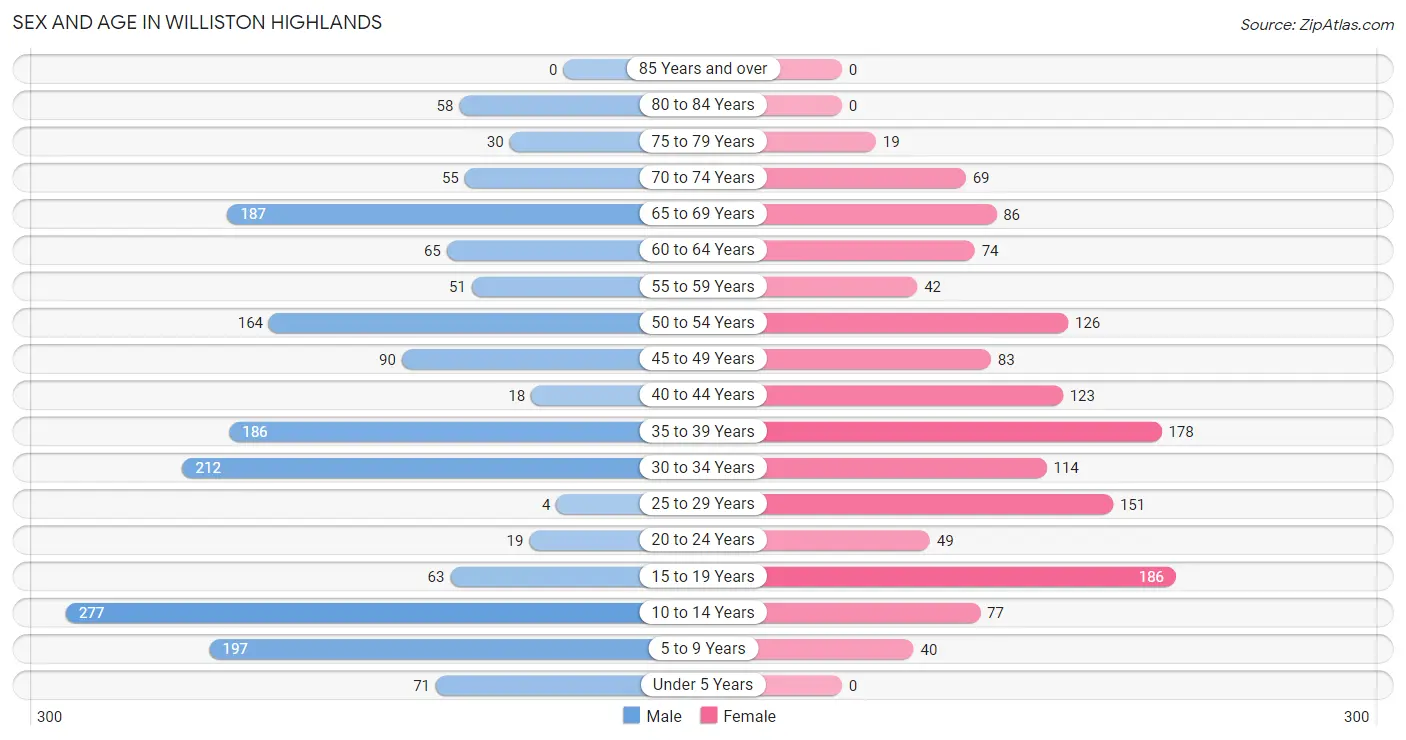
Sex and Age in Williston Highlands
Sex and Age in Williston Highlands
The most populous age groups in Williston Highlands are 10 to 14 Years (277 | 15.9%) for men and 15 to 19 Years (186 | 13.1%) for women.
| Age Bracket | Male | Female |
| Under 5 Years | 71 (4.1%) | 0 (0.0%) |
| 5 to 9 Years | 197 (11.3%) | 40 (2.8%) |
| 10 to 14 Years | 277 (15.9%) | 77 (5.4%) |
| 15 to 19 Years | 63 (3.6%) | 186 (13.1%) |
| 20 to 24 Years | 19 (1.1%) | 49 (3.5%) |
| 25 to 29 Years | 4 (0.2%) | 151 (10.7%) |
| 30 to 34 Years | 212 (12.1%) | 114 (8.1%) |
| 35 to 39 Years | 186 (10.6%) | 178 (12.6%) |
| 40 to 44 Years | 18 (1.0%) | 123 (8.7%) |
| 45 to 49 Years | 90 (5.1%) | 83 (5.9%) |
| 50 to 54 Years | 164 (9.4%) | 126 (8.9%) |
| 55 to 59 Years | 51 (2.9%) | 42 (3.0%) |
| 60 to 64 Years | 65 (3.7%) | 74 (5.2%) |
| 65 to 69 Years | 187 (10.7%) | 86 (6.1%) |
| 70 to 74 Years | 55 (3.2%) | 69 (4.9%) |
| 75 to 79 Years | 30 (1.7%) | 19 (1.3%) |
| 80 to 84 Years | 58 (3.3%) | 0 (0.0%) |
| 85 Years and over | 0 (0.0%) | 0 (0.0%) |
| Total | 1,747 (100.0%) | 1,417 (100.0%) |
Families and Households in Williston Highlands
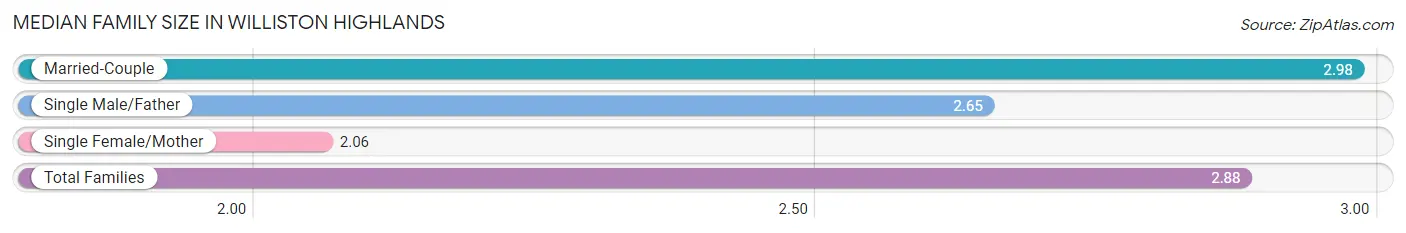
Median Family Size in Williston Highlands
The median family size in Williston Highlands is 2.88 persons per family, with married-couple families (841 | 86.0%) accounting for the largest median family size of 2.98 persons per family. On the other hand, single female/mother families (85 | 8.7%) represent the smallest median family size with 2.06 persons per family.
| Family Type | # Families | Family Size |
| Married-Couple | 841 (86.0%) | 2.98 |
| Single Male/Father | 52 (5.3%) | 2.65 |
| Single Female/Mother | 85 (8.7%) | 2.06 |
| Total Families | 978 (100.0%) | 2.88 |
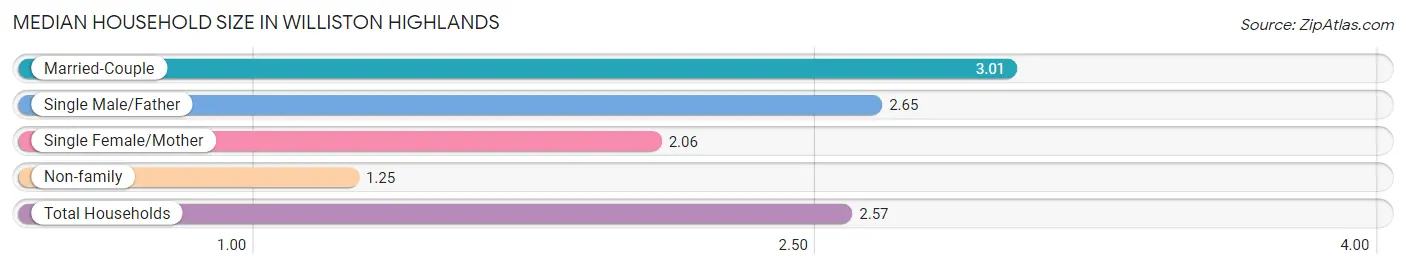
Median Household Size in Williston Highlands
The median household size in Williston Highlands is 2.57 persons per household, with married-couple households (841 | 68.2%) accounting for the largest median household size of 3.01 persons per household. non-family households (255 | 20.7%) represent the smallest median household size with 1.25 persons per household.
| Household Type | # Households | Household Size |
| Married-Couple | 841 (68.2%) | 3.01 |
| Single Male/Father | 52 (4.2%) | 2.65 |
| Single Female/Mother | 85 (6.9%) | 2.06 |
| Non-family | 255 (20.7%) | 1.25 |
| Total Households | 1,233 (100.0%) | 2.57 |
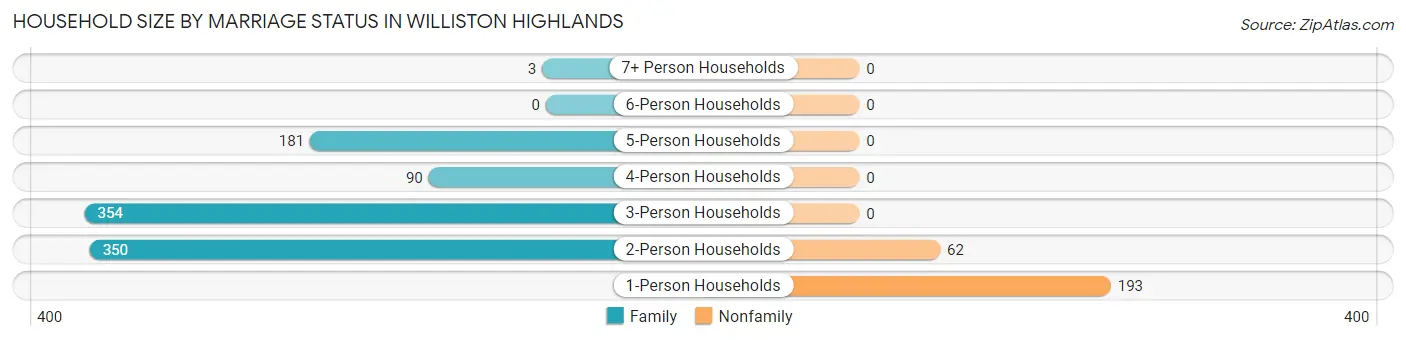
Household Size by Marriage Status in Williston Highlands
Out of a total of 1,233 households in Williston Highlands, 978 (79.3%) are family households, while 255 (20.7%) are nonfamily households. The most numerous type of family households are 3-person households, comprising 354, and the most common type of nonfamily households are 1-person households, comprising 193.
| Household Size | Family Households | Nonfamily Households |
| 1-Person Households | - | 193 (15.7%) |
| 2-Person Households | 350 (28.4%) | 62 (5.0%) |
| 3-Person Households | 354 (28.7%) | 0 (0.0%) |
| 4-Person Households | 90 (7.3%) | 0 (0.0%) |
| 5-Person Households | 181 (14.7%) | 0 (0.0%) |
| 6-Person Households | 0 (0.0%) | 0 (0.0%) |
| 7+ Person Households | 3 (0.2%) | 0 (0.0%) |
| Total | 978 (79.3%) | 255 (20.7%) |
Female Fertility in Williston Highlands
Fertility by Age in Williston Highlands
| Age Bracket | Women with Births | Births / 1,000 Women |
| 15 to 19 years | 0 (0.0%) | 0.0 |
| 20 to 34 years | 0 (0.0%) | 0.0 |
| 35 to 50 years | 0 (0.0%) | 0.0 |
| Total | 0 (0.0%) | 0.0 |
Fertility by Age by Marriage Status in Williston Highlands
| Age Bracket | Married | Unmarried |
| 15 to 19 years | 0 (0.0%) | 0 (0.0%) |
| 20 to 34 years | 0 (0.0%) | 0 (0.0%) |
| 35 to 50 years | 0 (0.0%) | 0 (0.0%) |
| Total | 0 (0.0%) | 0 (0.0%) |
Fertility by Education in Williston Highlands
| Educational Attainment | Women with Births | Births / 1,000 Women |
| Less than High School | 0 (0.0%) | 0.0 |
| High School Diploma | 0 (0.0%) | 0.0 |
| College or Associate's Degree | 0 (0.0%) | 0.0 |
| Bachelor's Degree | 0 (0.0%) | 0.0 |
| Graduate Degree | 0 (0.0%) | 0.0 |
| Total | 0 (0.0%) | 0.0 |
Fertility by Education by Marriage Status in Williston Highlands
| Educational Attainment | Married | Unmarried |
| Less than High School | 0 (0.0%) | 0 (0.0%) |
| High School Diploma | 0 (0.0%) | 0 (0.0%) |
| College or Associate's Degree | 0 (0.0%) | 0 (0.0%) |
| Bachelor's Degree | 0 (0.0%) | 0 (0.0%) |
| Graduate Degree | 0 (0.0%) | 0 (0.0%) |
| Total | 0 (0.0%) | 0 (0.0%) |
Income in Williston Highlands
Income Overview in Williston Highlands
Per Capita Income in Williston Highlands is $49,315, while median incomes of families and households are $80,556 and $67,348 respectively.
| Characteristic | Number | Measure |
| Per Capita Income | 3,164 | $49,315 |
| Median Family Income | 978 | $80,556 |
| Mean Family Income | 978 | $154,550 |
| Median Household Income | 1,233 | $67,348 |
| Mean Household Income | 1,233 | $131,236 |
| Income Deficit | 978 | $0 |
| Wage / Income Gap (%) | 3,164 | 23.68% |
| Wage / Income Gap ($) | 3,164 | 76.32¢ per $1 |
| Gini / Inequality Index | 3,164 | 0.60 |
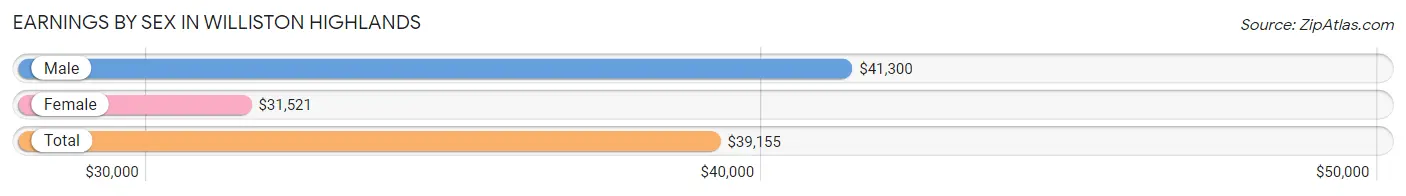
Earnings by Sex in Williston Highlands
Average Earnings in Williston Highlands are $39,155, $41,300 for men and $31,521 for women, a difference of 23.7%.
| Sex | Number | Average Earnings |
| Male | 718 (46.5%) | $41,300 |
| Female | 827 (53.5%) | $31,521 |
| Total | 1,545 (100.0%) | $39,155 |
Earnings by Sex by Income Bracket in Williston Highlands
The most common earnings brackets in Williston Highlands are $35,000 to $39,999 for men (132 | 18.4%) and $2,499 or less for women (146 | 17.6%).
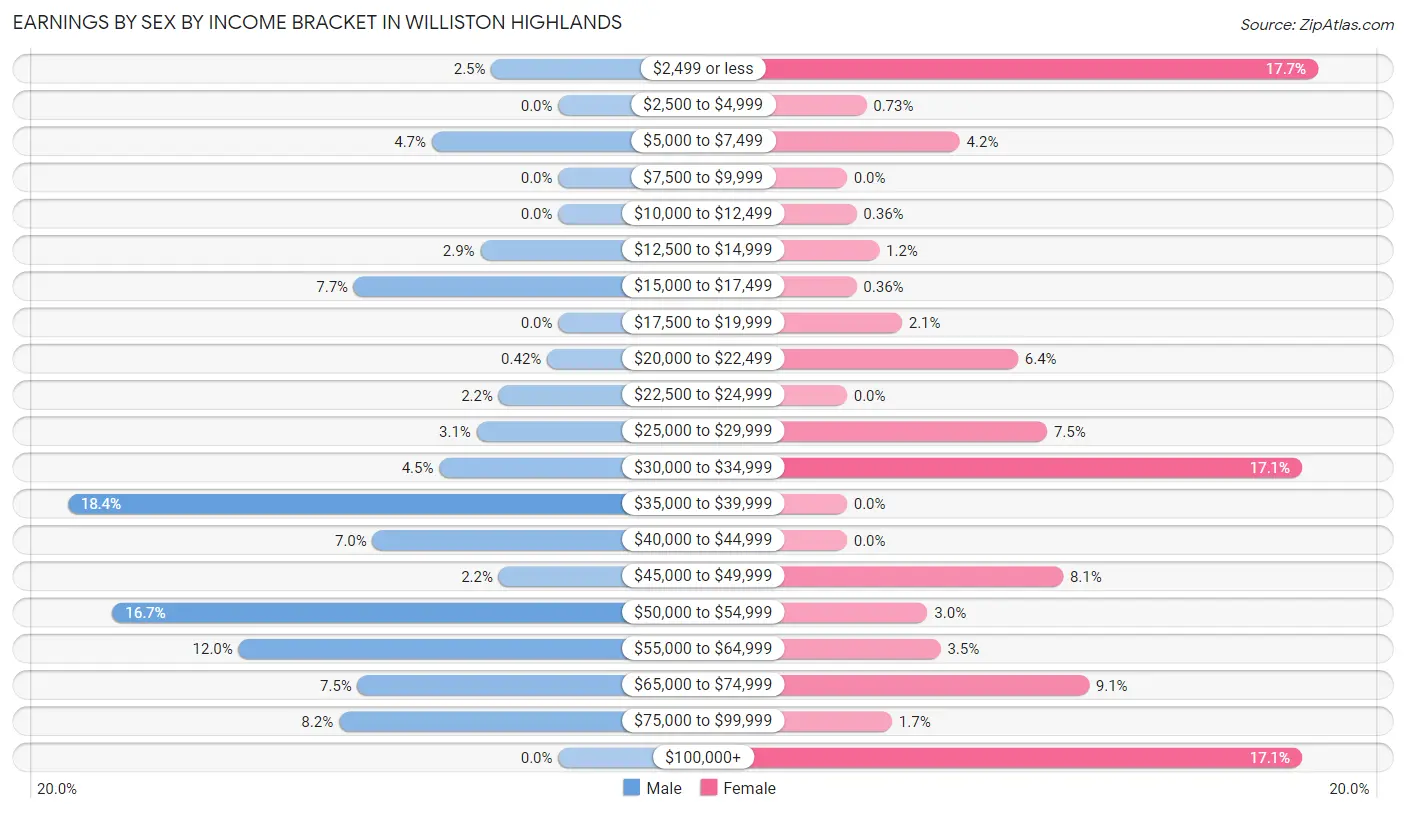
| Income | Male | Female |
| $2,499 or less | 18 (2.5%) | 146 (17.6%) |
| $2,500 to $4,999 | 0 (0.0%) | 6 (0.7%) |
| $5,000 to $7,499 | 34 (4.7%) | 35 (4.2%) |
| $7,500 to $9,999 | 0 (0.0%) | 0 (0.0%) |
| $10,000 to $12,499 | 0 (0.0%) | 3 (0.4%) |
| $12,500 to $14,999 | 21 (2.9%) | 10 (1.2%) |
| $15,000 to $17,499 | 55 (7.7%) | 3 (0.4%) |
| $17,500 to $19,999 | 0 (0.0%) | 17 (2.1%) |
| $20,000 to $22,499 | 3 (0.4%) | 53 (6.4%) |
| $22,500 to $24,999 | 16 (2.2%) | 0 (0.0%) |
| $25,000 to $29,999 | 22 (3.1%) | 62 (7.5%) |
| $30,000 to $34,999 | 32 (4.5%) | 141 (17.1%) |
| $35,000 to $39,999 | 132 (18.4%) | 0 (0.0%) |
| $40,000 to $44,999 | 50 (7.0%) | 0 (0.0%) |
| $45,000 to $49,999 | 16 (2.2%) | 67 (8.1%) |
| $50,000 to $54,999 | 120 (16.7%) | 25 (3.0%) |
| $55,000 to $64,999 | 86 (12.0%) | 29 (3.5%) |
| $65,000 to $74,999 | 54 (7.5%) | 75 (9.1%) |
| $75,000 to $99,999 | 59 (8.2%) | 14 (1.7%) |
| $100,000+ | 0 (0.0%) | 141 (17.1%) |
| Total | 718 (100.0%) | 827 (100.0%) |
Earnings by Sex by Educational Attainment in Williston Highlands
Average earnings in Williston Highlands are $41,775 for men and $33,854 for women, a difference of 19.0%. Men with an educational attainment of bachelor's degree enjoy the highest average annual earnings of $63,634, while those with less than high school education earn the least with $15,682. Women with an educational attainment of bachelor's degree earn the most with the average annual earnings of $250,001, while those with high school diploma education have the smallest earnings of $30,029.
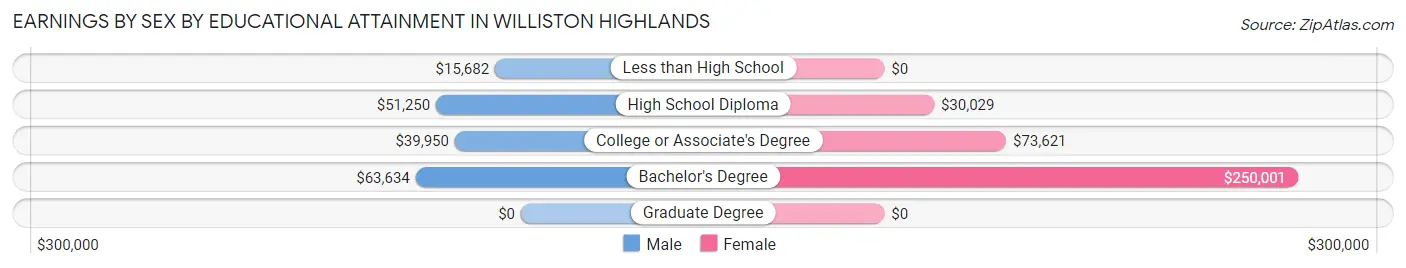
| Educational Attainment | Male Income | Female Income |
| Less than High School | $15,682 | $0 |
| High School Diploma | $51,250 | $30,029 |
| College or Associate's Degree | $39,950 | $73,621 |
| Bachelor's Degree | $63,634 | $250,001 |
| Graduate Degree | - | - |
| Total | $41,775 | $33,854 |
Family Income in Williston Highlands
Family Income Brackets in Williston Highlands
According to the Williston Highlands family income data, there are 338 families falling into the $75,000 to $99,999 income range, which is the most common income bracket and makes up 34.6% of all families.
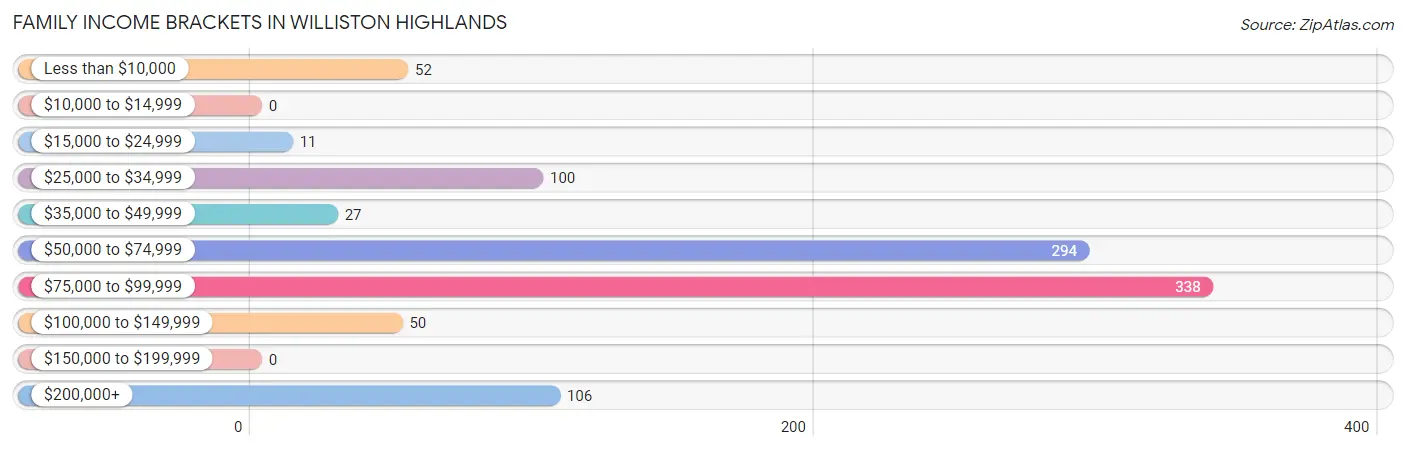
| Income Bracket | # Families | % Families |
| Less than $10,000 | 52 | 5.3% |
| $10,000 to $14,999 | 0 | 0.0% |
| $15,000 to $24,999 | 11 | 1.1% |
| $25,000 to $34,999 | 100 | 10.2% |
| $35,000 to $49,999 | 27 | 2.8% |
| $50,000 to $74,999 | 294 | 30.1% |
| $75,000 to $99,999 | 338 | 34.6% |
| $100,000 to $149,999 | 50 | 5.1% |
| $150,000 to $199,999 | 0 | 0.0% |
| $200,000+ | 106 | 10.8% |
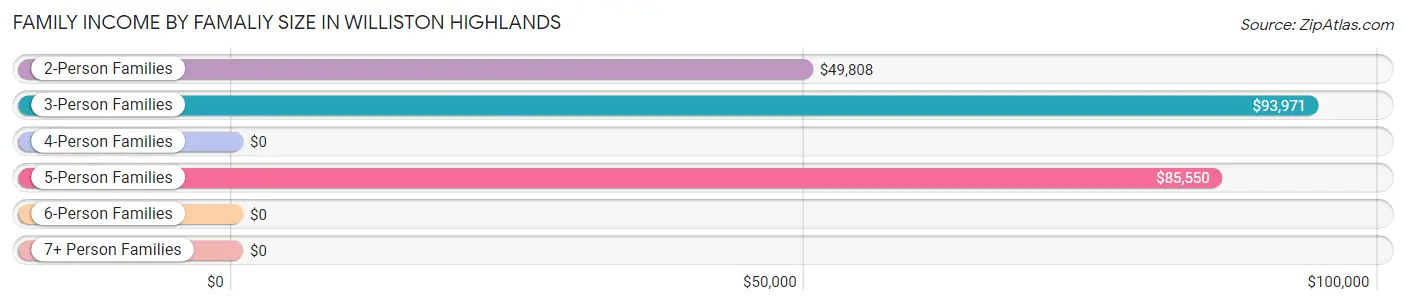
Family Income by Famaliy Size in Williston Highlands
3-person families (368 | 37.6%) account for the highest median family income in Williston Highlands with $93,971 per family, while 3-person families (368 | 37.6%) have the highest median income of $31,324 per family member.
| Income Bracket | # Families | Median Income |
| 2-Person Families | 350 (35.8%) | $49,808 |
| 3-Person Families | 368 (37.6%) | $93,971 |
| 4-Person Families | 76 (7.8%) | $0 |
| 5-Person Families | 181 (18.5%) | $85,550 |
| 6-Person Families | 0 (0.0%) | $0 |
| 7+ Person Families | 3 (0.3%) | $0 |
| Total | 978 (100.0%) | $80,556 |
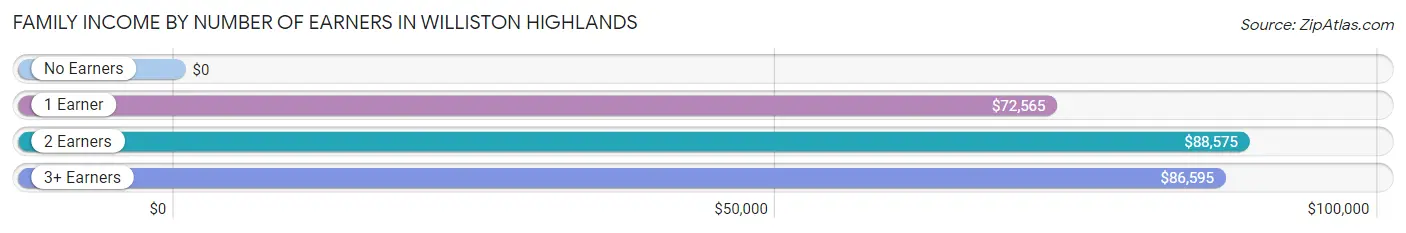
Family Income by Number of Earners in Williston Highlands
| Number of Earners | # Families | Median Income |
| No Earners | 196 (20.0%) | $0 |
| 1 Earner | 231 (23.6%) | $72,565 |
| 2 Earners | 397 (40.6%) | $88,575 |
| 3+ Earners | 154 (15.8%) | $86,595 |
| Total | 978 (100.0%) | $80,556 |
Household Income in Williston Highlands
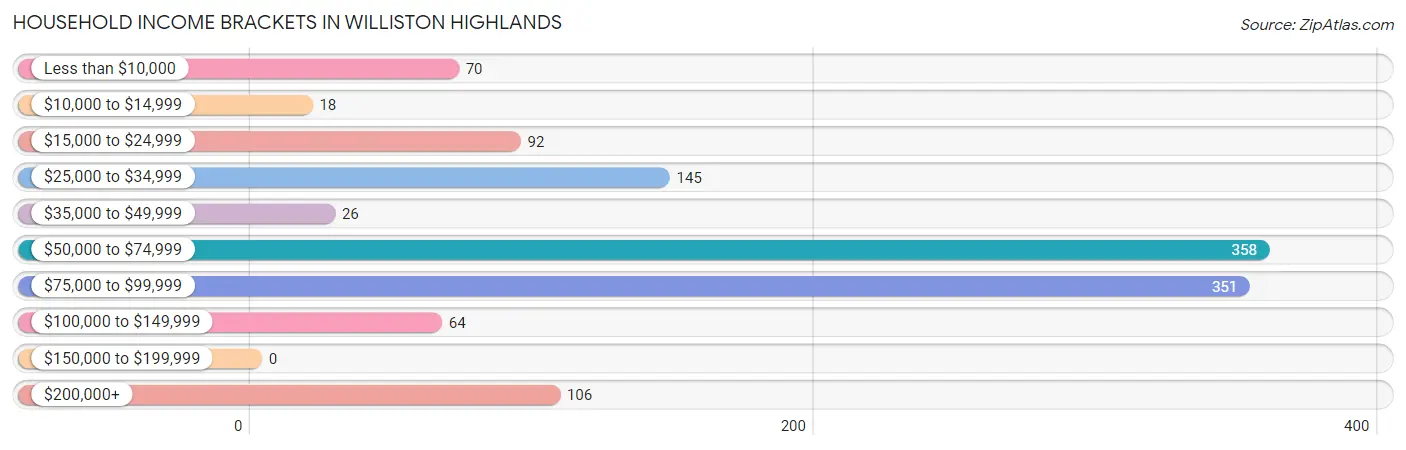
Household Income Brackets in Williston Highlands
With 358 households falling in the category, the $50,000 to $74,999 income range is the most frequent in Williston Highlands, accounting for 29.0% of all households.
| Income Bracket | # Households | % Households |
| Less than $10,000 | 70 | 5.7% |
| $10,000 to $14,999 | 18 | 1.5% |
| $15,000 to $24,999 | 92 | 7.5% |
| $25,000 to $34,999 | 145 | 11.8% |
| $35,000 to $49,999 | 26 | 2.1% |
| $50,000 to $74,999 | 358 | 29.0% |
| $75,000 to $99,999 | 351 | 28.5% |
| $100,000 to $149,999 | 64 | 5.2% |
| $150,000 to $199,999 | 0 | 0.0% |
| $200,000+ | 106 | 8.6% |
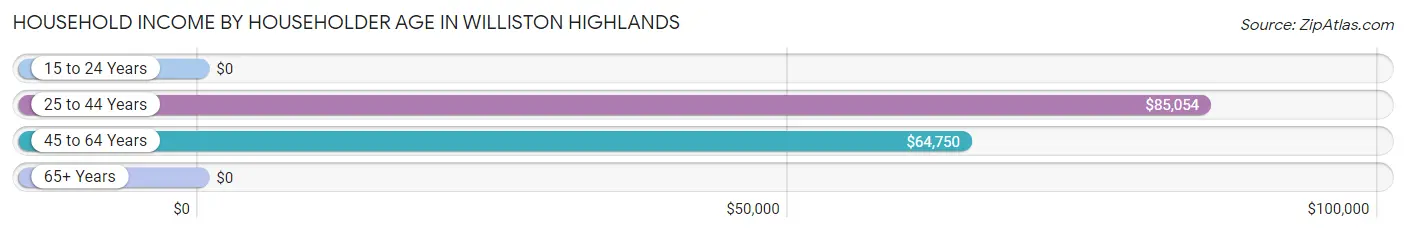
Household Income by Householder Age in Williston Highlands
The median household income in Williston Highlands is $67,348, with the highest median household income of $85,054 found in the 25 to 44 years age bracket for the primary householder. A total of 573 households (46.5%) fall into this category. Meanwhile, the 15 to 24 years age bracket for the primary householder has the lowest median household income of $0, with 19 households (1.5%) in this group.
| Income Bracket | # Households | Median Income |
| 15 to 24 Years | 19 (1.5%) | $0 |
| 25 to 44 Years | 573 (46.5%) | $85,054 |
| 45 to 64 Years | 347 (28.1%) | $64,750 |
| 65+ Years | 294 (23.8%) | $0 |
| Total | 1,233 (100.0%) | $67,348 |
Poverty in Williston Highlands
Income Below Poverty by Sex and Age in Williston Highlands
With 10.4% poverty level for males and 3.5% for females among the residents of Williston Highlands, 25 to 34 year old males and 65 to 74 year old females are the most vulnerable to poverty, with 86 males (39.8%) and 19 females (12.3%) in their respective age groups living below the poverty level.
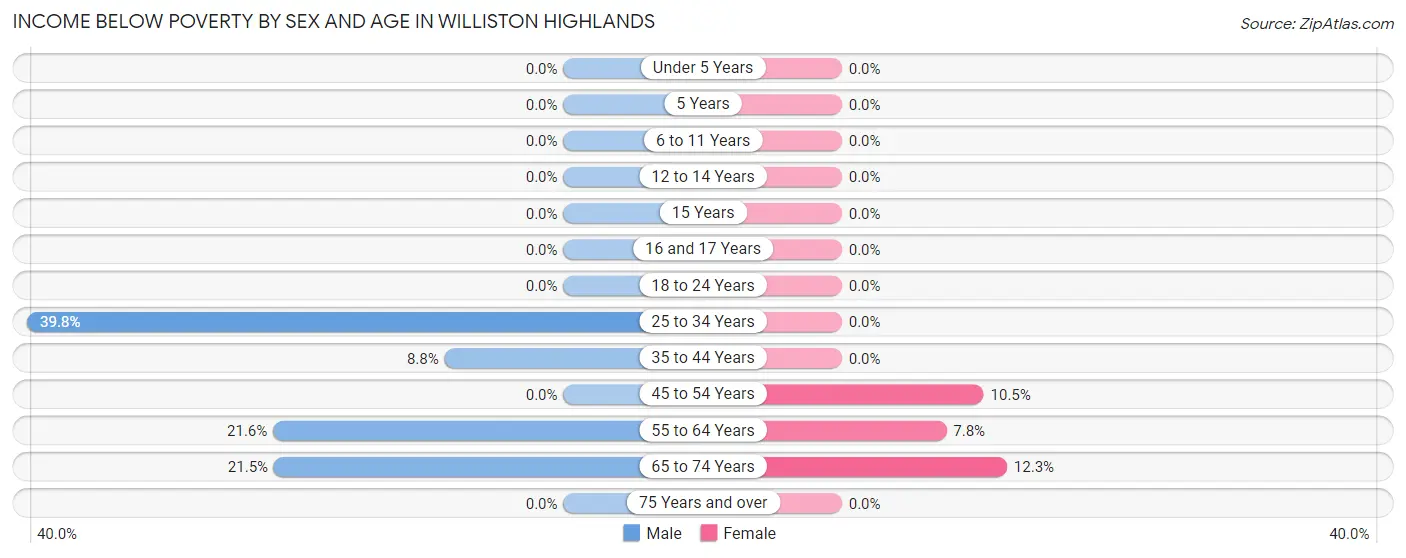
| Age Bracket | Male | Female |
| Under 5 Years | 0 (0.0%) | 0 (0.0%) |
| 5 Years | 0 (0.0%) | 0 (0.0%) |
| 6 to 11 Years | 0 (0.0%) | 0 (0.0%) |
| 12 to 14 Years | 0 (0.0%) | 0 (0.0%) |
| 15 Years | 0 (0.0%) | 0 (0.0%) |
| 16 and 17 Years | 0 (0.0%) | 0 (0.0%) |
| 18 to 24 Years | 0 (0.0%) | 0 (0.0%) |
| 25 to 34 Years | 86 (39.8%) | 0 (0.0%) |
| 35 to 44 Years | 18 (8.8%) | 0 (0.0%) |
| 45 to 54 Years | 0 (0.0%) | 22 (10.5%) |
| 55 to 64 Years | 25 (21.5%) | 9 (7.8%) |
| 65 to 74 Years | 52 (21.5%) | 19 (12.3%) |
| 75 Years and over | 0 (0.0%) | 0 (0.0%) |
| Total | 181 (10.4%) | 50 (3.5%) |
Income Above Poverty by Sex and Age in Williston Highlands
According to the poverty statistics in Williston Highlands, males aged under 5 years and females aged 6 to 11 years are the age groups that are most secure financially, with 100.0% of males and 100.0% of females in these age groups living above the poverty line.
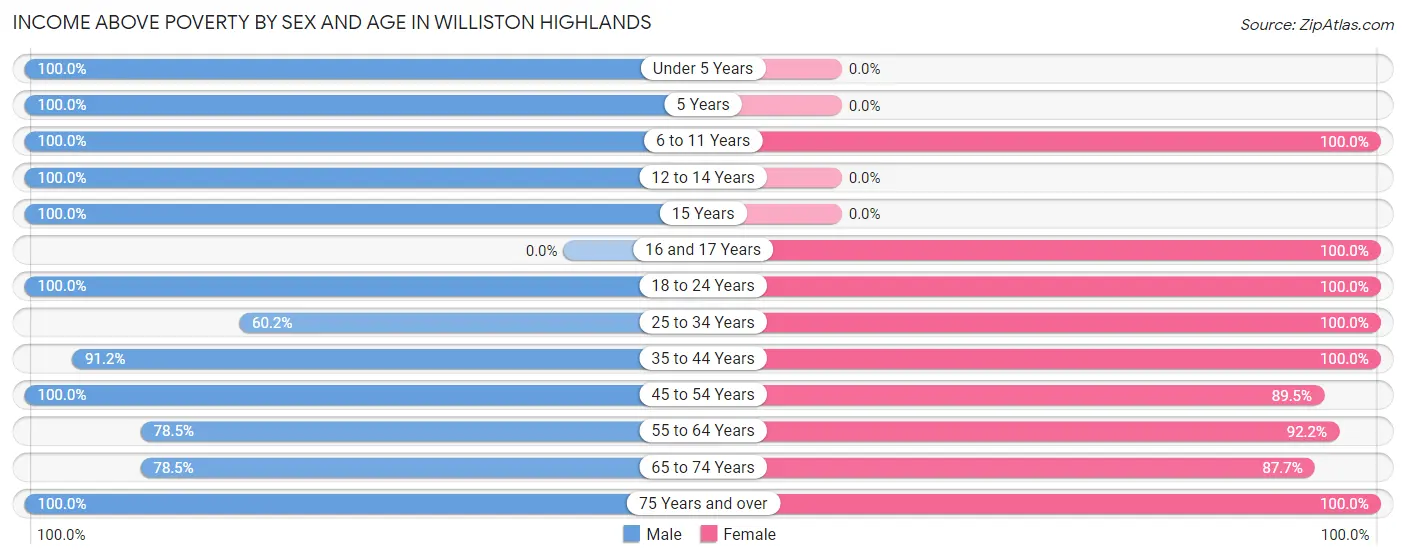
| Age Bracket | Male | Female |
| Under 5 Years | 71 (100.0%) | 0 (0.0%) |
| 5 Years | 53 (100.0%) | 0 (0.0%) |
| 6 to 11 Years | 278 (100.0%) | 117 (100.0%) |
| 12 to 14 Years | 143 (100.0%) | 0 (0.0%) |
| 15 Years | 63 (100.0%) | 0 (0.0%) |
| 16 and 17 Years | 0 (0.0%) | 134 (100.0%) |
| 18 to 24 Years | 19 (100.0%) | 101 (100.0%) |
| 25 to 34 Years | 130 (60.2%) | 265 (100.0%) |
| 35 to 44 Years | 186 (91.2%) | 301 (100.0%) |
| 45 to 54 Years | 254 (100.0%) | 187 (89.5%) |
| 55 to 64 Years | 91 (78.4%) | 107 (92.2%) |
| 65 to 74 Years | 190 (78.5%) | 136 (87.7%) |
| 75 Years and over | 88 (100.0%) | 19 (100.0%) |
| Total | 1,566 (89.6%) | 1,367 (96.5%) |
Income Below Poverty Among Married-Couple Families in Williston Highlands
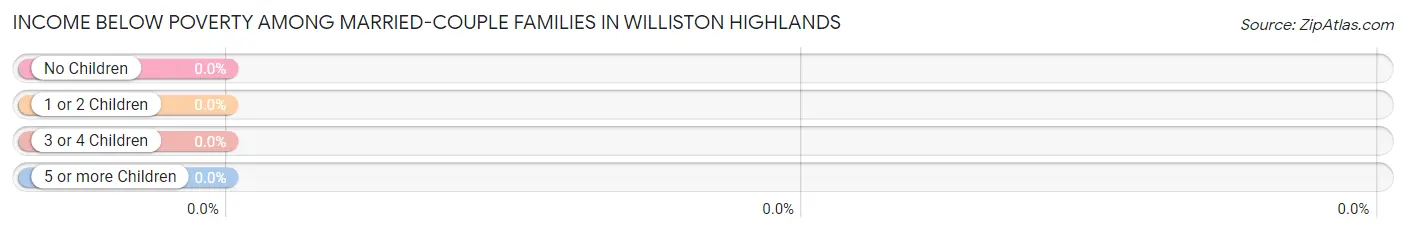
| Children | Above Poverty | Below Poverty |
| No Children | 391 (100.0%) | 0 (0.0%) |
| 1 or 2 Children | 266 (100.0%) | 0 (0.0%) |
| 3 or 4 Children | 184 (100.0%) | 0 (0.0%) |
| 5 or more Children | 0 (0.0%) | 0 (0.0%) |
| Total | 841 (100.0%) | 0 (0.0%) |
Income Below Poverty Among Single-Parent Households in Williston Highlands
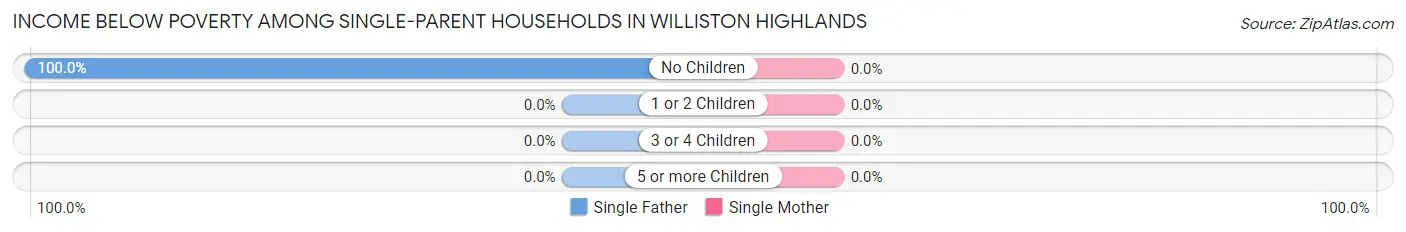
| Children | Single Father | Single Mother |
| No Children | 52 (100.0%) | 0 (0.0%) |
| 1 or 2 Children | 0 (0.0%) | 0 (0.0%) |
| 3 or 4 Children | 0 (0.0%) | 0 (0.0%) |
| 5 or more Children | 0 (0.0%) | 0 (0.0%) |
| Total | 52 (100.0%) | 0 (0.0%) |
Income Below Poverty Among Married-Couple vs Single-Parent Households in Williston Highlands
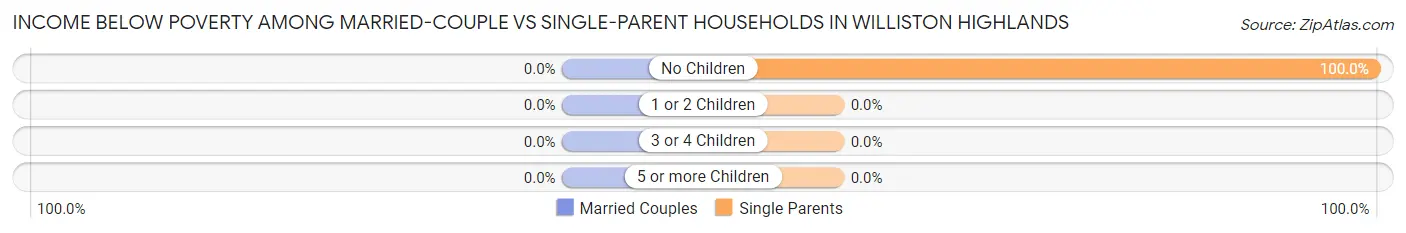
| Children | Married-Couple Families | Single-Parent Households |
| No Children | 0 (0.0%) | 52 (100.0%) |
| 1 or 2 Children | 0 (0.0%) | 0 (0.0%) |
| 3 or 4 Children | 0 (0.0%) | 0 (0.0%) |
| 5 or more Children | 0 (0.0%) | 0 (0.0%) |
| Total | 0 (0.0%) | 52 (38.0%) |
Employment Characteristics in Williston Highlands
Employment by Class of Employer in Williston Highlands
Among the 1,438 employed individuals in Williston Highlands, private company employees (933 | 64.9%), local government employees (212 | 14.7%), and not-for-profit organizations (101 | 7.0%) make up the most common classes of employment.
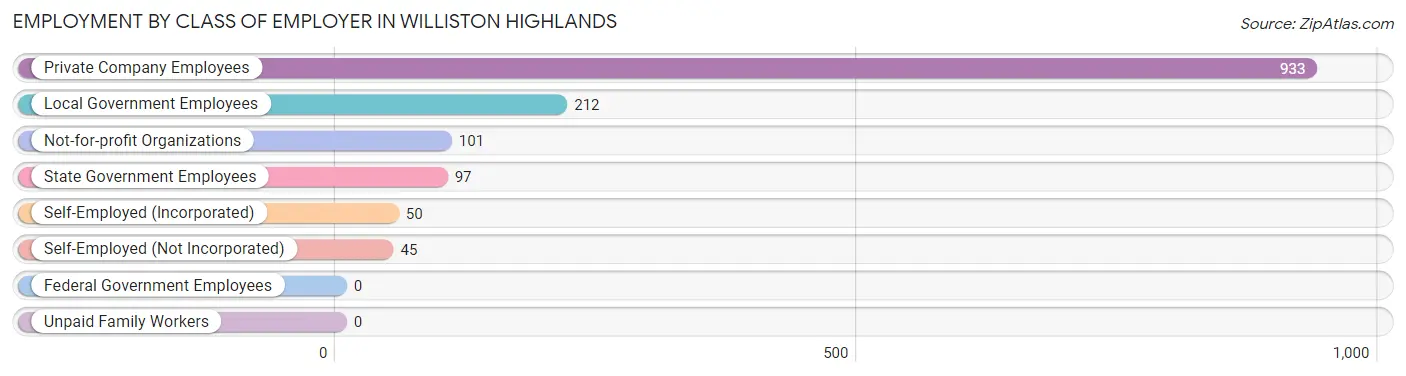
| Employer Class | # Employees | % Employees |
| Private Company Employees | 933 | 64.9% |
| Self-Employed (Incorporated) | 50 | 3.5% |
| Self-Employed (Not Incorporated) | 45 | 3.1% |
| Not-for-profit Organizations | 101 | 7.0% |
| Local Government Employees | 212 | 14.7% |
| State Government Employees | 97 | 6.8% |
| Federal Government Employees | 0 | 0.0% |
| Unpaid Family Workers | 0 | 0.0% |
| Total | 1,438 | 100.0% |
Employment Status by Age in Williston Highlands
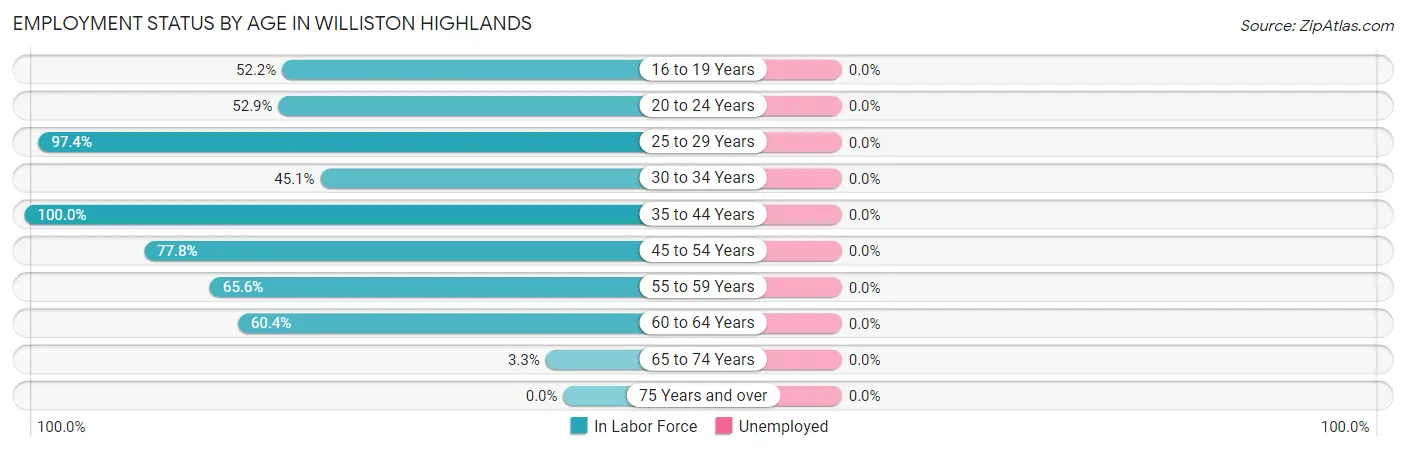
| Age Bracket | In Labor Force | Unemployed |
| 16 to 19 Years | 97 (52.2%) | 0 (0.0%) |
| 20 to 24 Years | 36 (52.9%) | 0 (0.0%) |
| 25 to 29 Years | 151 (97.4%) | 0 (0.0%) |
| 30 to 34 Years | 147 (45.1%) | 0 (0.0%) |
| 35 to 44 Years | 505 (100.0%) | 0 (0.0%) |
| 45 to 54 Years | 360 (77.8%) | 0 (0.0%) |
| 55 to 59 Years | 61 (65.6%) | 0 (0.0%) |
| 60 to 64 Years | 84 (60.4%) | 0 (0.0%) |
| 65 to 74 Years | 13 (3.3%) | 0 (0.0%) |
| 75 Years and over | 0 (0.0%) | 0 (0.0%) |
| Total | 1,454 (59.6%) | 0 (0.0%) |
Employment Status by Educational Attainment in Williston Highlands
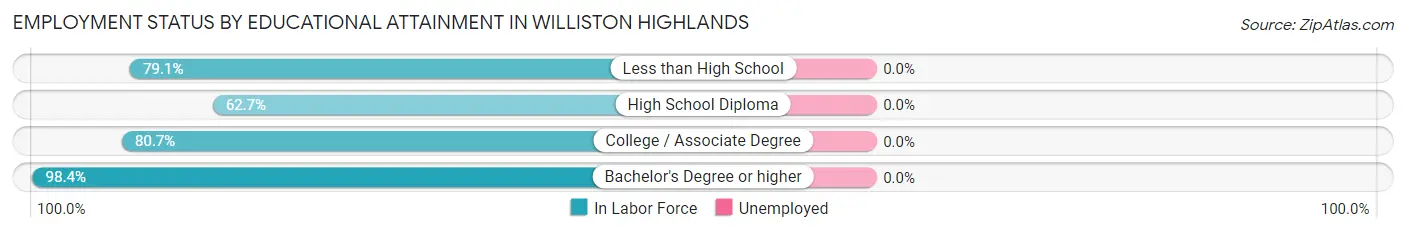
| Educational Attainment | In Labor Force | Unemployed |
| Less than High School | 155 (79.1%) | 0 (0.0%) |
| High School Diploma | 385 (62.7%) | 0 (0.0%) |
| College / Associate Degree | 406 (80.7%) | 0 (0.0%) |
| Bachelor's Degree or higher | 362 (98.4%) | 0 (0.0%) |
| Total | 1,308 (77.8%) | 0 (0.0%) |
Employment Occupations by Sex in Williston Highlands
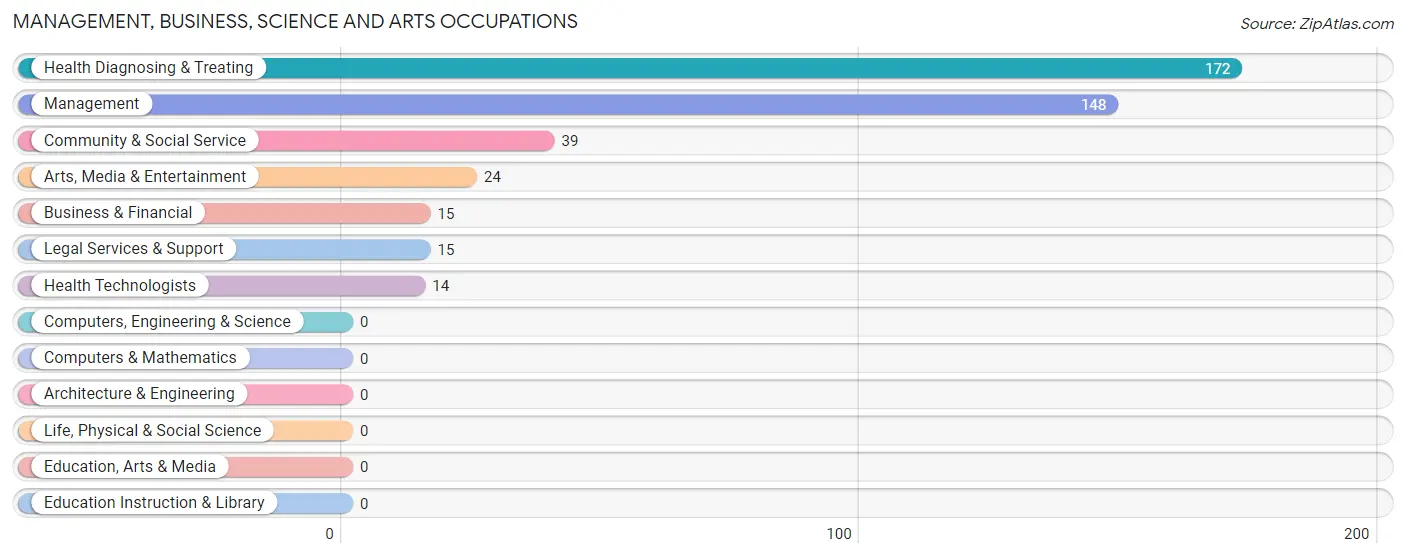
Management, Business, Science and Arts Occupations
The most common Management, Business, Science and Arts occupations in Williston Highlands are Health Diagnosing & Treating (172 | 11.8%), Management (148 | 10.2%), Community & Social Service (39 | 2.7%), Arts, Media & Entertainment (24 | 1.7%), and Business & Financial (15 | 1.0%).
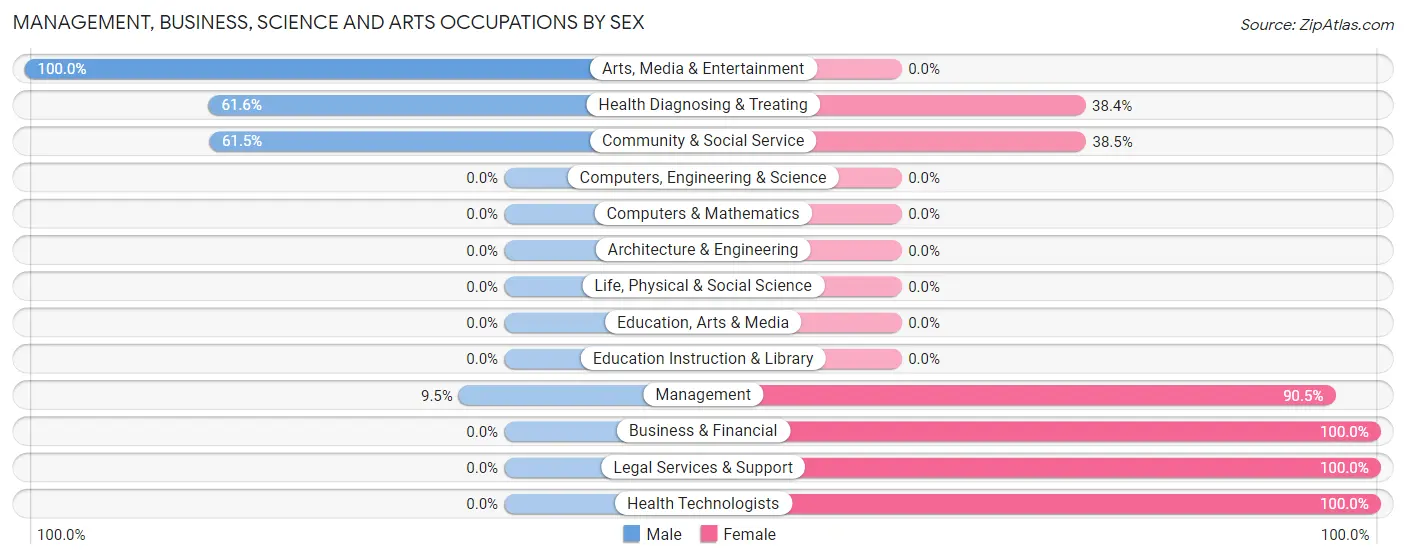
Management, Business, Science and Arts Occupations by Sex
Within the Management, Business, Science and Arts occupations in Williston Highlands, the most male-oriented occupations are Arts, Media & Entertainment (100.0%), Health Diagnosing & Treating (61.6%), and Community & Social Service (61.5%), while the most female-oriented occupations are Business & Financial (100.0%), Legal Services & Support (100.0%), and Health Technologists (100.0%).
| Occupation | Male | Female |
| Management | 14 (9.5%) | 134 (90.5%) |
| Business & Financial | 0 (0.0%) | 15 (100.0%) |
| Computers, Engineering & Science | 0 (0.0%) | 0 (0.0%) |
| Computers & Mathematics | 0 (0.0%) | 0 (0.0%) |
| Architecture & Engineering | 0 (0.0%) | 0 (0.0%) |
| Life, Physical & Social Science | 0 (0.0%) | 0 (0.0%) |
| Community & Social Service | 24 (61.5%) | 15 (38.5%) |
| Education, Arts & Media | 0 (0.0%) | 0 (0.0%) |
| Legal Services & Support | 0 (0.0%) | 15 (100.0%) |
| Education Instruction & Library | 0 (0.0%) | 0 (0.0%) |
| Arts, Media & Entertainment | 24 (100.0%) | 0 (0.0%) |
| Health Diagnosing & Treating | 106 (61.6%) | 66 (38.4%) |
| Health Technologists | 0 (0.0%) | 14 (100.0%) |
| Total (Category) | 144 (38.5%) | 230 (61.5%) |
| Total (Overall) | 714 (49.1%) | 740 (50.9%) |
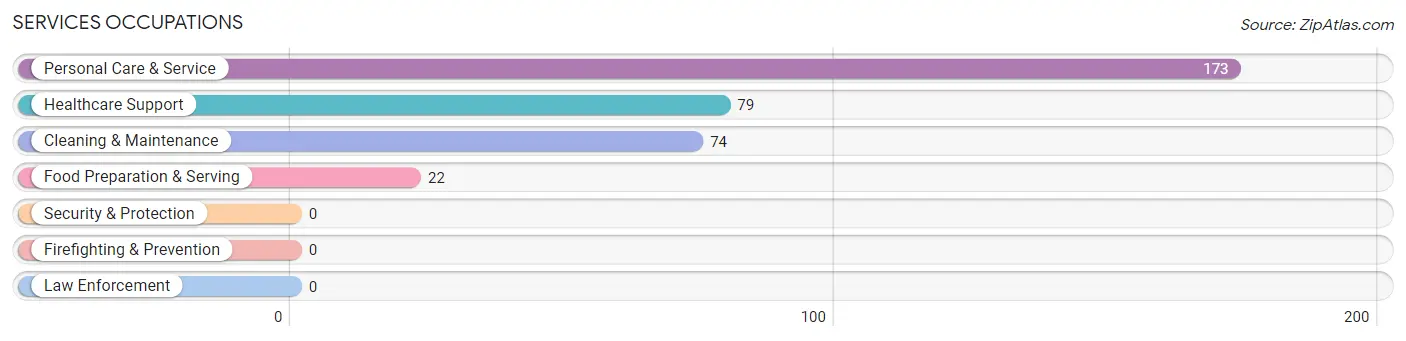
Services Occupations
The most common Services occupations in Williston Highlands are Personal Care & Service (173 | 11.9%), Healthcare Support (79 | 5.4%), Cleaning & Maintenance (74 | 5.1%), and Food Preparation & Serving (22 | 1.5%).
Services Occupations by Sex
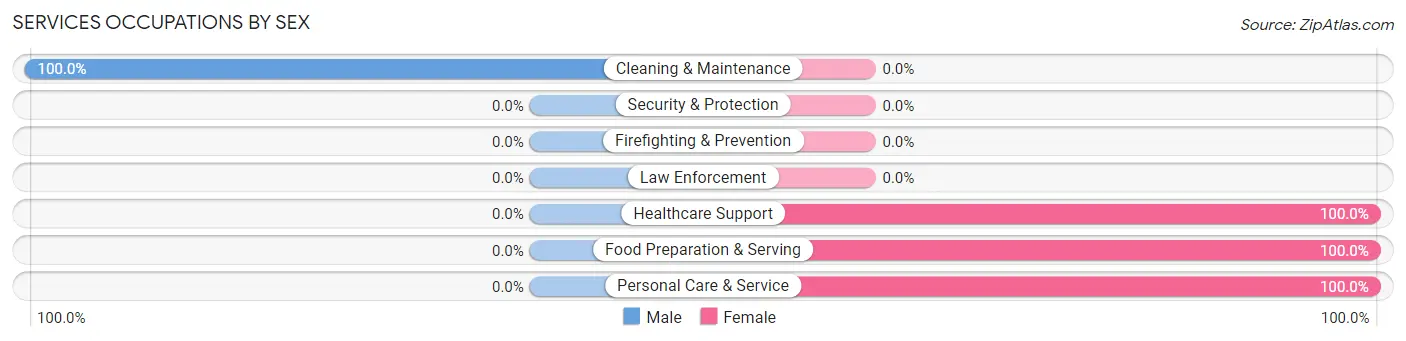
| Occupation | Male | Female |
| Healthcare Support | 0 (0.0%) | 79 (100.0%) |
| Security & Protection | 0 (0.0%) | 0 (0.0%) |
| Firefighting & Prevention | 0 (0.0%) | 0 (0.0%) |
| Law Enforcement | 0 (0.0%) | 0 (0.0%) |
| Food Preparation & Serving | 0 (0.0%) | 22 (100.0%) |
| Cleaning & Maintenance | 74 (100.0%) | 0 (0.0%) |
| Personal Care & Service | 0 (0.0%) | 173 (100.0%) |
| Total (Category) | 74 (21.3%) | 274 (78.7%) |
| Total (Overall) | 714 (49.1%) | 740 (50.9%) |
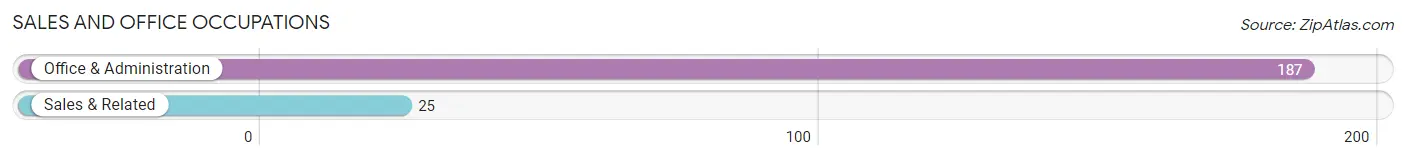
Sales and Office Occupations
The most common Sales and Office occupations in Williston Highlands are Office & Administration (187 | 12.9%), and Sales & Related (25 | 1.7%).
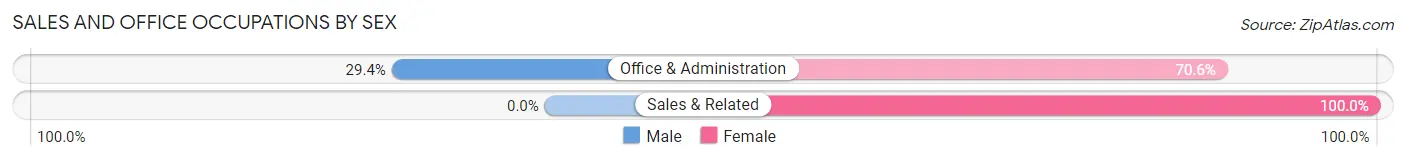
Sales and Office Occupations by Sex
| Occupation | Male | Female |
| Sales & Related | 0 (0.0%) | 25 (100.0%) |
| Office & Administration | 55 (29.4%) | 132 (70.6%) |
| Total (Category) | 55 (25.9%) | 157 (74.1%) |
| Total (Overall) | 714 (49.1%) | 740 (50.9%) |
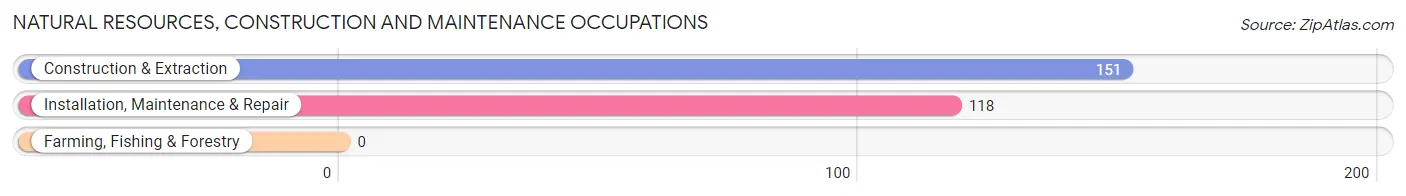
Natural Resources, Construction and Maintenance Occupations
The most common Natural Resources, Construction and Maintenance occupations in Williston Highlands are Construction & Extraction (151 | 10.4%), and Installation, Maintenance & Repair (118 | 8.1%).
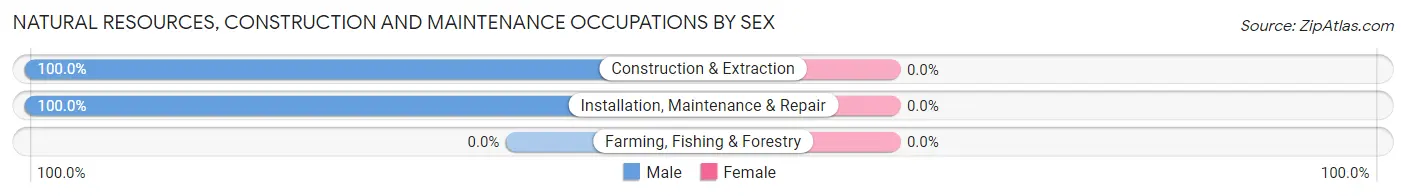
Natural Resources, Construction and Maintenance Occupations by Sex
| Occupation | Male | Female |
| Farming, Fishing & Forestry | 0 (0.0%) | 0 (0.0%) |
| Construction & Extraction | 151 (100.0%) | 0 (0.0%) |
| Installation, Maintenance & Repair | 118 (100.0%) | 0 (0.0%) |
| Total (Category) | 269 (100.0%) | 0 (0.0%) |
| Total (Overall) | 714 (49.1%) | 740 (50.9%) |
Production, Transportation and Moving Occupations
The most common Production, Transportation and Moving occupations in Williston Highlands are Transportation (118 | 8.1%), Production (70 | 4.8%), and Material Moving (63 | 4.3%).
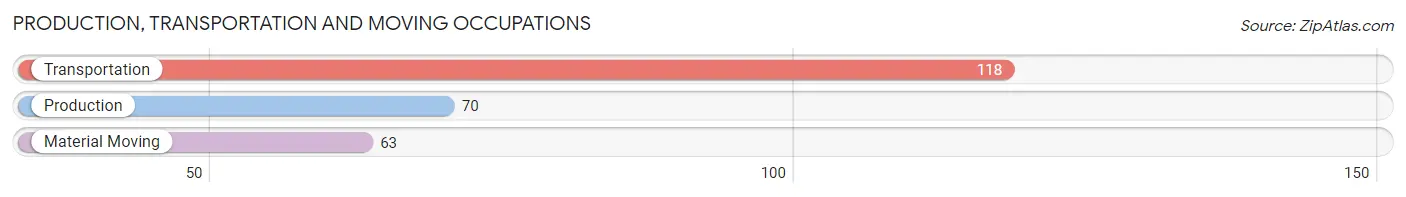
Production, Transportation and Moving Occupations by Sex
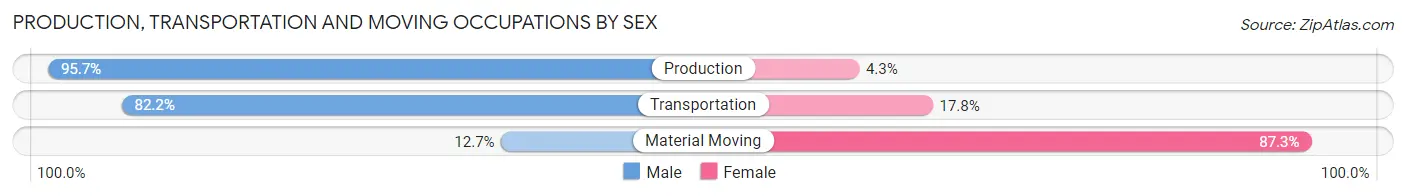
| Occupation | Male | Female |
| Production | 67 (95.7%) | 3 (4.3%) |
| Transportation | 97 (82.2%) | 21 (17.8%) |
| Material Moving | 8 (12.7%) | 55 (87.3%) |
| Total (Category) | 172 (68.5%) | 79 (31.5%) |
| Total (Overall) | 714 (49.1%) | 740 (50.9%) |
Employment Industries by Sex in Williston Highlands
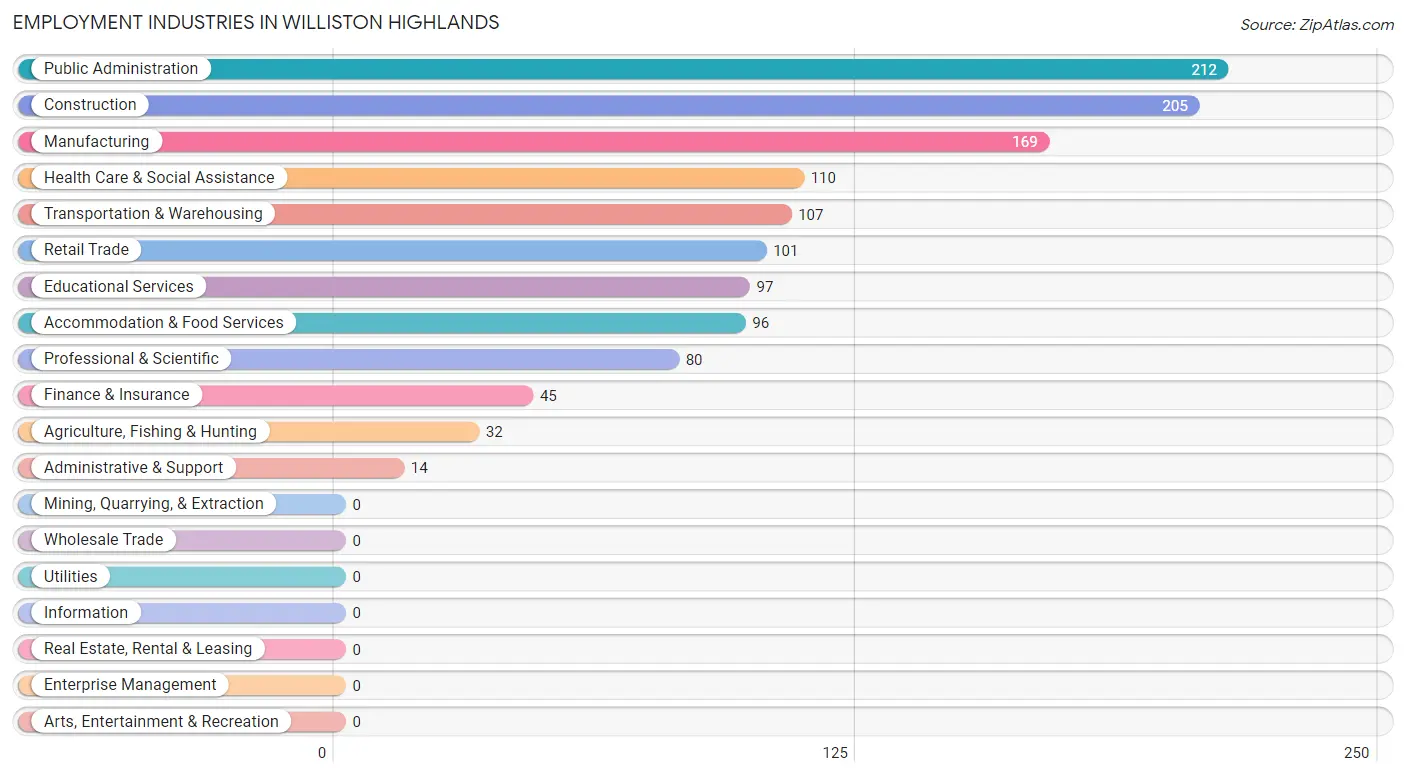
Employment Industries in Williston Highlands
The major employment industries in Williston Highlands include Public Administration (212 | 14.6%), Construction (205 | 14.1%), Manufacturing (169 | 11.6%), Health Care & Social Assistance (110 | 7.6%), and Transportation & Warehousing (107 | 7.4%).
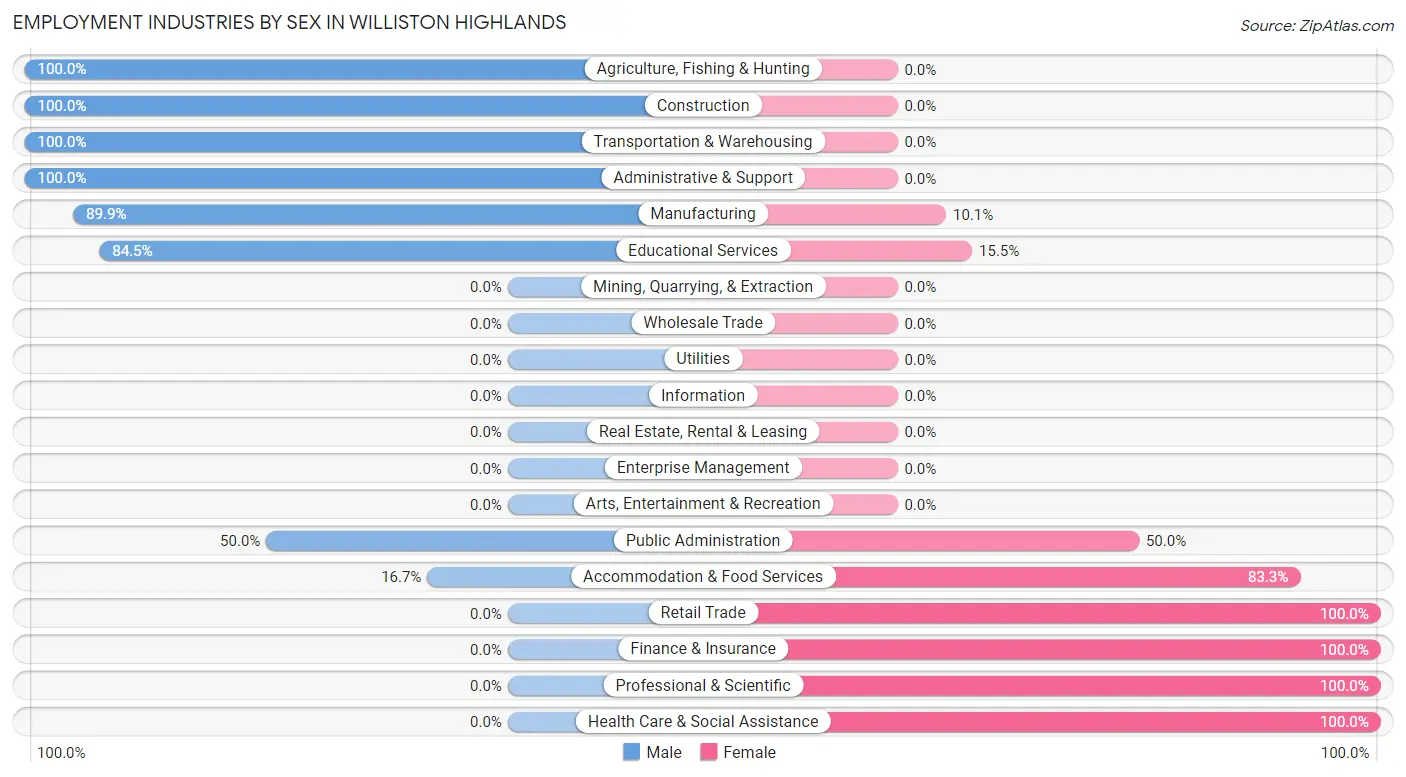
Employment Industries by Sex in Williston Highlands
The Williston Highlands industries that see more men than women are Agriculture, Fishing & Hunting (100.0%), Construction (100.0%), and Transportation & Warehousing (100.0%), whereas the industries that tend to have a higher number of women are Retail Trade (100.0%), Finance & Insurance (100.0%), and Professional & Scientific (100.0%).
| Industry | Male | Female |
| Agriculture, Fishing & Hunting | 32 (100.0%) | 0 (0.0%) |
| Mining, Quarrying, & Extraction | 0 (0.0%) | 0 (0.0%) |
| Construction | 205 (100.0%) | 0 (0.0%) |
| Manufacturing | 152 (89.9%) | 17 (10.1%) |
| Wholesale Trade | 0 (0.0%) | 0 (0.0%) |
| Retail Trade | 0 (0.0%) | 101 (100.0%) |
| Transportation & Warehousing | 107 (100.0%) | 0 (0.0%) |
| Utilities | 0 (0.0%) | 0 (0.0%) |
| Information | 0 (0.0%) | 0 (0.0%) |
| Finance & Insurance | 0 (0.0%) | 45 (100.0%) |
| Real Estate, Rental & Leasing | 0 (0.0%) | 0 (0.0%) |
| Professional & Scientific | 0 (0.0%) | 80 (100.0%) |
| Enterprise Management | 0 (0.0%) | 0 (0.0%) |
| Administrative & Support | 14 (100.0%) | 0 (0.0%) |
| Educational Services | 82 (84.5%) | 15 (15.5%) |
| Health Care & Social Assistance | 0 (0.0%) | 110 (100.0%) |
| Arts, Entertainment & Recreation | 0 (0.0%) | 0 (0.0%) |
| Accommodation & Food Services | 16 (16.7%) | 80 (83.3%) |
| Public Administration | 106 (50.0%) | 106 (50.0%) |
| Total | 714 (49.1%) | 740 (50.9%) |
Education in Williston Highlands
School Enrollment in Williston Highlands
The most common levels of schooling among the 816 students in Williston Highlands are middle school (321 | 39.3%), elementary school (193 | 23.6%), and high school (159 | 19.5%).
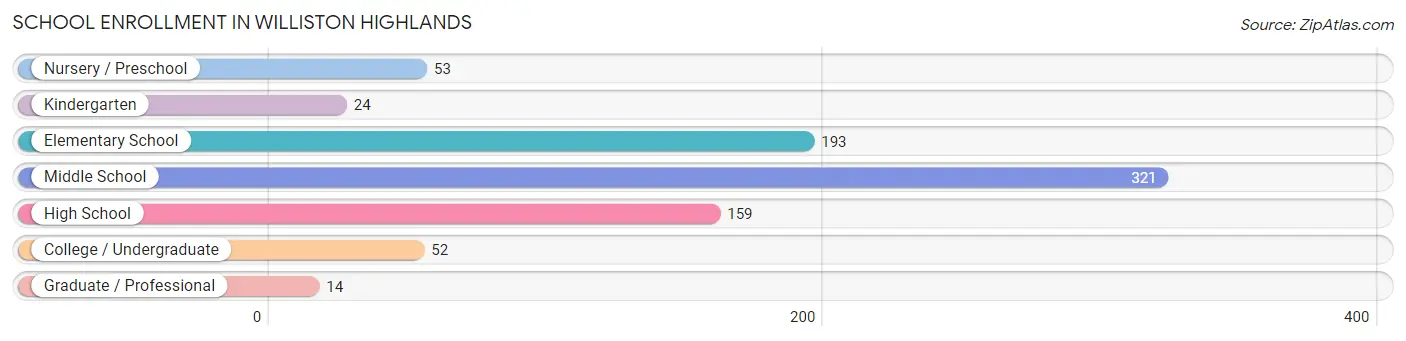
| School Level | # Students | % Students |
| Nursery / Preschool | 53 | 6.5% |
| Kindergarten | 24 | 2.9% |
| Elementary School | 193 | 23.6% |
| Middle School | 321 | 39.3% |
| High School | 159 | 19.5% |
| College / Undergraduate | 52 | 6.4% |
| Graduate / Professional | 14 | 1.7% |
| Total | 816 | 100.0% |
School Enrollment by Age by Funding Source in Williston Highlands
Out of a total of 816 students who are enrolled in schools in Williston Highlands, 111 (13.6%) attend a private institution, while the remaining 705 (86.4%) are enrolled in public schools. The age group of 5 to 9 year old has the highest likelihood of being enrolled in private schools, with 67 (28.3% in the age bracket) enrolled. Conversely, the age group of 15 to 17 year olds has the lowest likelihood of being enrolled in a private school, with 159 (100.0% in the age bracket) attending a public institution.
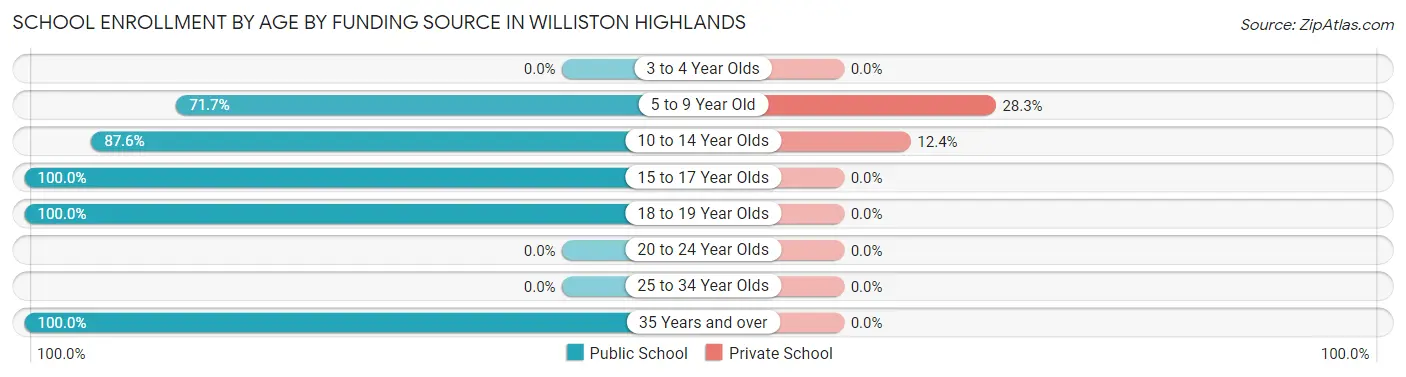
| Age Bracket | Public School | Private School |
| 3 to 4 Year Olds | 0 (0.0%) | 0 (0.0%) |
| 5 to 9 Year Old | 170 (71.7%) | 67 (28.3%) |
| 10 to 14 Year Olds | 310 (87.6%) | 44 (12.4%) |
| 15 to 17 Year Olds | 159 (100.0%) | 0 (0.0%) |
| 18 to 19 Year Olds | 52 (100.0%) | 0 (0.0%) |
| 20 to 24 Year Olds | 0 (0.0%) | 0 (0.0%) |
| 25 to 34 Year Olds | 0 (0.0%) | 0 (0.0%) |
| 35 Years and over | 14 (100.0%) | 0 (0.0%) |
| Total | 705 (86.4%) | 111 (13.6%) |
Educational Attainment by Field of Study in Williston Highlands
Bio, nature & agricultural (158 | 31.6%), arts & humanities (113 | 22.6%), business (103 | 20.6%), engineering (50 | 10.0%), and social sciences (36 | 7.2%) are the most common fields of study among 500 individuals in Williston Highlands who have obtained a bachelor's degree or higher.
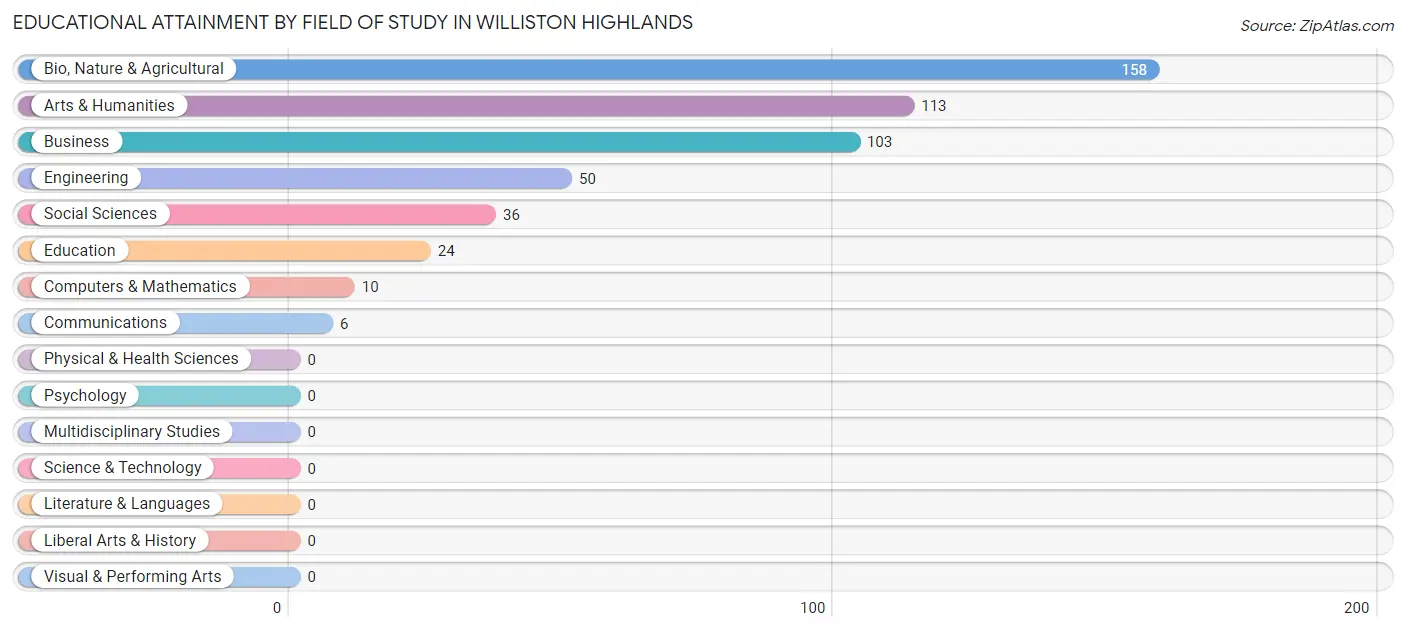
| Field of Study | # Graduates | % Graduates |
| Computers & Mathematics | 10 | 2.0% |
| Bio, Nature & Agricultural | 158 | 31.6% |
| Physical & Health Sciences | 0 | 0.0% |
| Psychology | 0 | 0.0% |
| Social Sciences | 36 | 7.2% |
| Engineering | 50 | 10.0% |
| Multidisciplinary Studies | 0 | 0.0% |
| Science & Technology | 0 | 0.0% |
| Business | 103 | 20.6% |
| Education | 24 | 4.8% |
| Literature & Languages | 0 | 0.0% |
| Liberal Arts & History | 0 | 0.0% |
| Visual & Performing Arts | 0 | 0.0% |
| Communications | 6 | 1.2% |
| Arts & Humanities | 113 | 22.6% |
| Total | 500 | 100.0% |
Transportation & Commute in Williston Highlands
Vehicle Availability by Sex in Williston Highlands
The most prevalent vehicle ownership categories in Williston Highlands are males with 2 vehicles (311, accounting for 44.6%) and females with 2 vehicles (128, making up 42.0%).
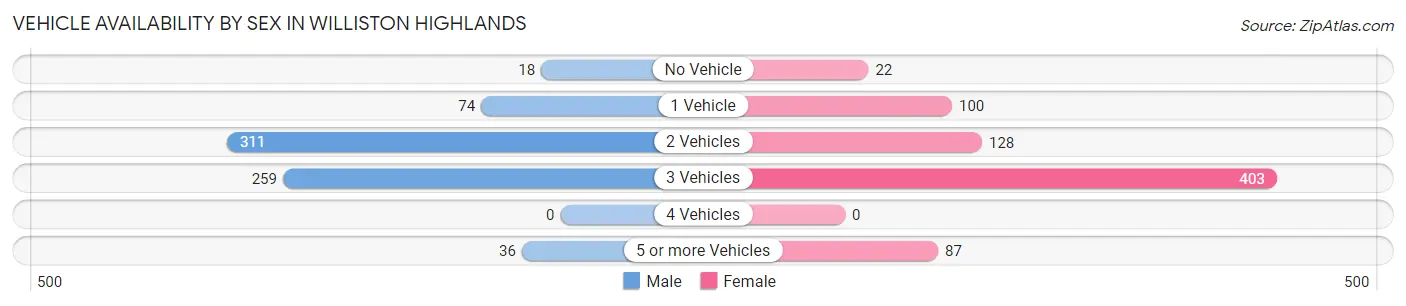
| Vehicles Available | Male | Female |
| No Vehicle | 18 (2.6%) | 22 (3.0%) |
| 1 Vehicle | 74 (10.6%) | 100 (13.5%) |
| 2 Vehicles | 311 (44.6%) | 128 (17.3%) |
| 3 Vehicles | 259 (37.1%) | 403 (54.5%) |
| 4 Vehicles | 0 (0.0%) | 0 (0.0%) |
| 5 or more Vehicles | 36 (5.2%) | 87 (11.8%) |
| Total | 698 (100.0%) | 740 (100.0%) |
Commute Time in Williston Highlands
The most frequently occuring commute durations in Williston Highlands are 5 to 9 minutes (335 commuters, 25.2%), 30 to 34 minutes (171 commuters, 12.8%), and 10 to 14 minutes (162 commuters, 12.2%).
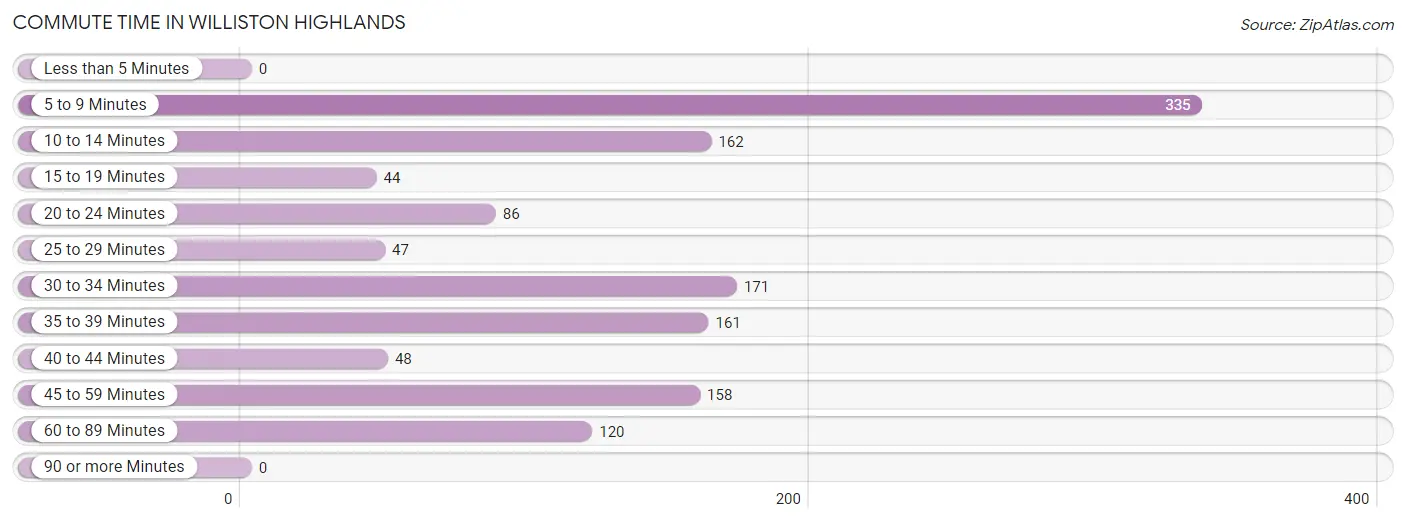
| Commute Time | # Commuters | % Commuters |
| Less than 5 Minutes | 0 | 0.0% |
| 5 to 9 Minutes | 335 | 25.2% |
| 10 to 14 Minutes | 162 | 12.2% |
| 15 to 19 Minutes | 44 | 3.3% |
| 20 to 24 Minutes | 86 | 6.5% |
| 25 to 29 Minutes | 47 | 3.5% |
| 30 to 34 Minutes | 171 | 12.8% |
| 35 to 39 Minutes | 161 | 12.1% |
| 40 to 44 Minutes | 48 | 3.6% |
| 45 to 59 Minutes | 158 | 11.9% |
| 60 to 89 Minutes | 120 | 9.0% |
| 90 or more Minutes | 0 | 0.0% |
Commute Time by Sex in Williston Highlands
The most common commute times in Williston Highlands are 30 to 34 minutes (171 commuters, 24.5%) for males and 5 to 9 minutes (189 commuters, 29.8%) for females.
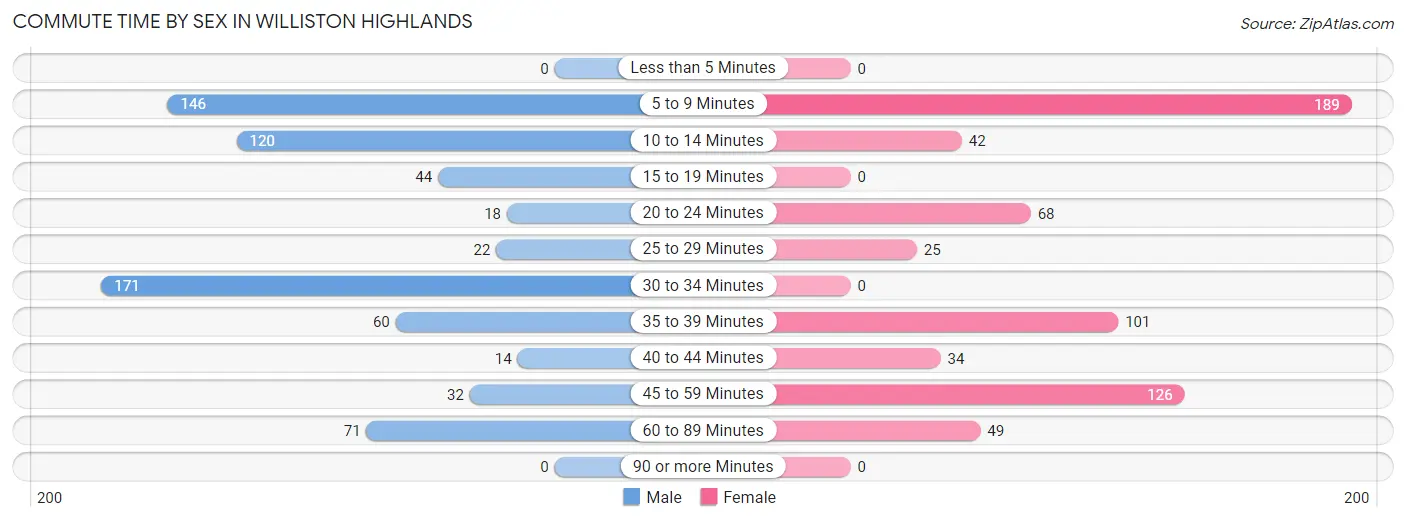
| Commute Time | Male | Female |
| Less than 5 Minutes | 0 (0.0%) | 0 (0.0%) |
| 5 to 9 Minutes | 146 (20.9%) | 189 (29.8%) |
| 10 to 14 Minutes | 120 (17.2%) | 42 (6.6%) |
| 15 to 19 Minutes | 44 (6.3%) | 0 (0.0%) |
| 20 to 24 Minutes | 18 (2.6%) | 68 (10.7%) |
| 25 to 29 Minutes | 22 (3.2%) | 25 (3.9%) |
| 30 to 34 Minutes | 171 (24.5%) | 0 (0.0%) |
| 35 to 39 Minutes | 60 (8.6%) | 101 (15.9%) |
| 40 to 44 Minutes | 14 (2.0%) | 34 (5.4%) |
| 45 to 59 Minutes | 32 (4.6%) | 126 (19.9%) |
| 60 to 89 Minutes | 71 (10.2%) | 49 (7.7%) |
| 90 or more Minutes | 0 (0.0%) | 0 (0.0%) |
Time of Departure to Work by Sex in Williston Highlands
The most frequent times of departure to work in Williston Highlands are 6:30 AM to 6:59 AM (179, 25.6%) for males and 7:00 AM to 7:29 AM (220, 34.7%) for females.
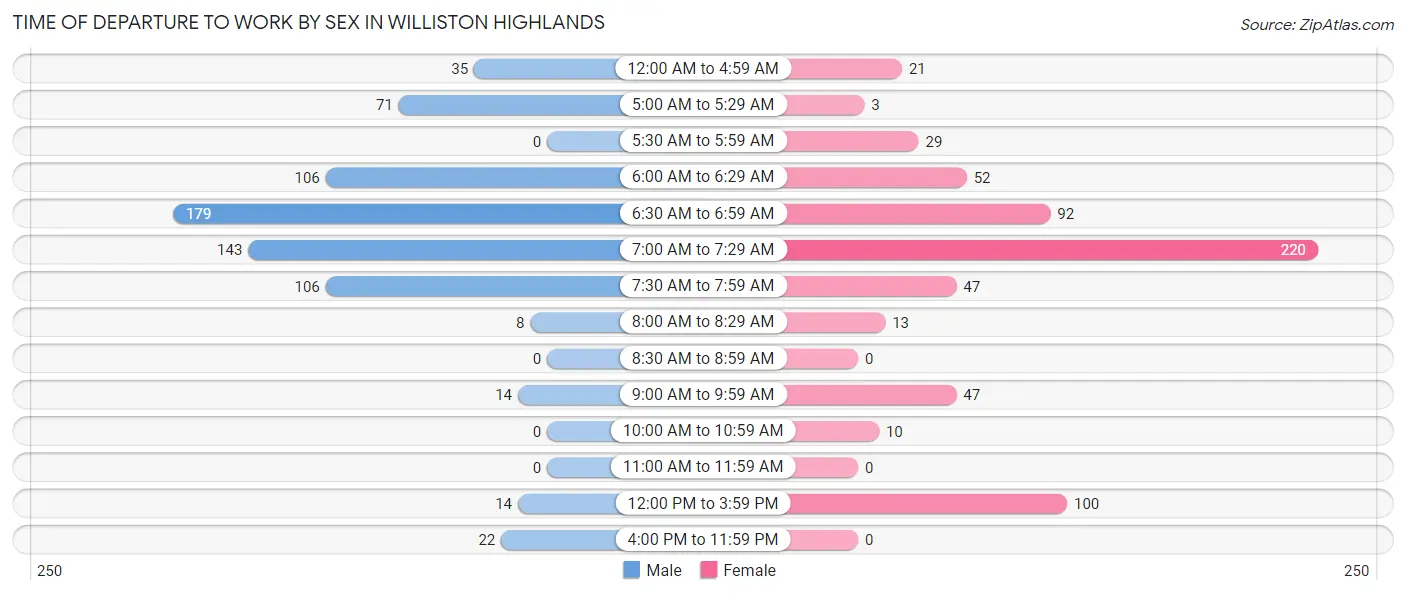
| Time of Departure | Male | Female |
| 12:00 AM to 4:59 AM | 35 (5.0%) | 21 (3.3%) |
| 5:00 AM to 5:29 AM | 71 (10.2%) | 3 (0.5%) |
| 5:30 AM to 5:59 AM | 0 (0.0%) | 29 (4.6%) |
| 6:00 AM to 6:29 AM | 106 (15.2%) | 52 (8.2%) |
| 6:30 AM to 6:59 AM | 179 (25.6%) | 92 (14.5%) |
| 7:00 AM to 7:29 AM | 143 (20.5%) | 220 (34.7%) |
| 7:30 AM to 7:59 AM | 106 (15.2%) | 47 (7.4%) |
| 8:00 AM to 8:29 AM | 8 (1.1%) | 13 (2.1%) |
| 8:30 AM to 8:59 AM | 0 (0.0%) | 0 (0.0%) |
| 9:00 AM to 9:59 AM | 14 (2.0%) | 47 (7.4%) |
| 10:00 AM to 10:59 AM | 0 (0.0%) | 10 (1.6%) |
| 11:00 AM to 11:59 AM | 0 (0.0%) | 0 (0.0%) |
| 12:00 PM to 3:59 PM | 14 (2.0%) | 100 (15.8%) |
| 4:00 PM to 11:59 PM | 22 (3.2%) | 0 (0.0%) |
| Total | 698 (100.0%) | 634 (100.0%) |
Housing Occupancy in Williston Highlands
Occupancy by Ownership in Williston Highlands
Of the total 1,233 dwellings in Williston Highlands, owner-occupied units account for 982 (79.6%), while renter-occupied units make up 251 (20.4%).
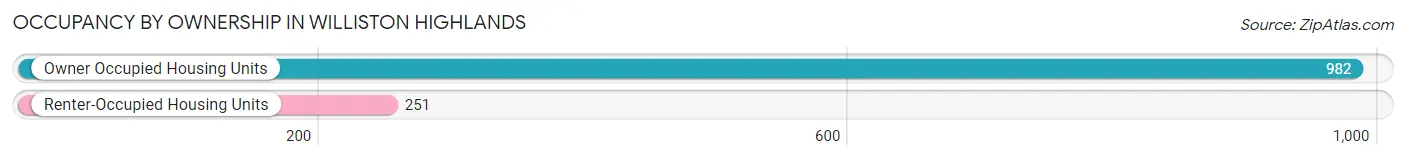
| Occupancy | # Housing Units | % Housing Units |
| Owner Occupied Housing Units | 982 | 79.6% |
| Renter-Occupied Housing Units | 251 | 20.4% |
| Total Occupied Housing Units | 1,233 | 100.0% |
Occupancy by Household Size in Williston Highlands
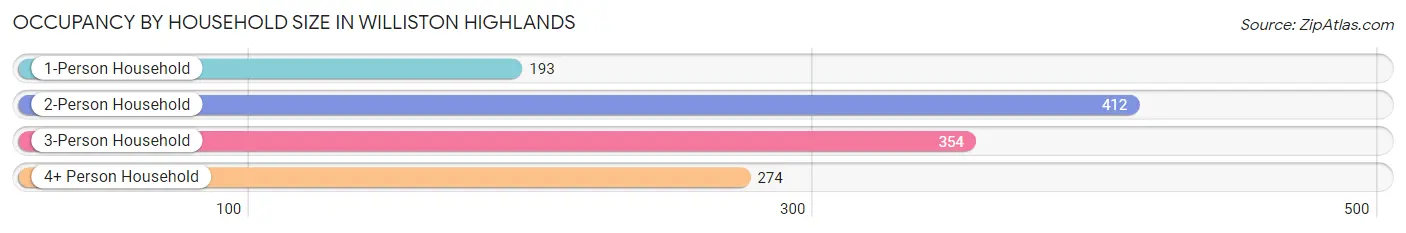
| Household Size | # Housing Units | % Housing Units |
| 1-Person Household | 193 | 15.7% |
| 2-Person Household | 412 | 33.4% |
| 3-Person Household | 354 | 28.7% |
| 4+ Person Household | 274 | 22.2% |
| Total Housing Units | 1,233 | 100.0% |
Occupancy by Ownership by Household Size in Williston Highlands
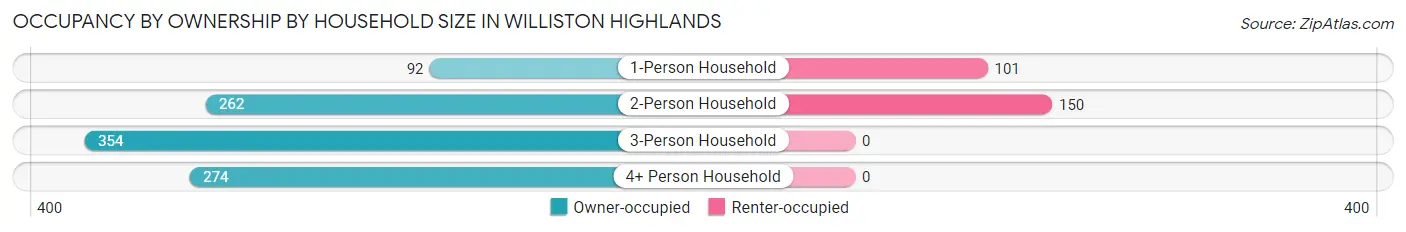
| Household Size | Owner-occupied | Renter-occupied |
| 1-Person Household | 92 (47.7%) | 101 (52.3%) |
| 2-Person Household | 262 (63.6%) | 150 (36.4%) |
| 3-Person Household | 354 (100.0%) | 0 (0.0%) |
| 4+ Person Household | 274 (100.0%) | 0 (0.0%) |
| Total Housing Units | 982 (79.6%) | 251 (20.4%) |
Occupancy by Educational Attainment in Williston Highlands
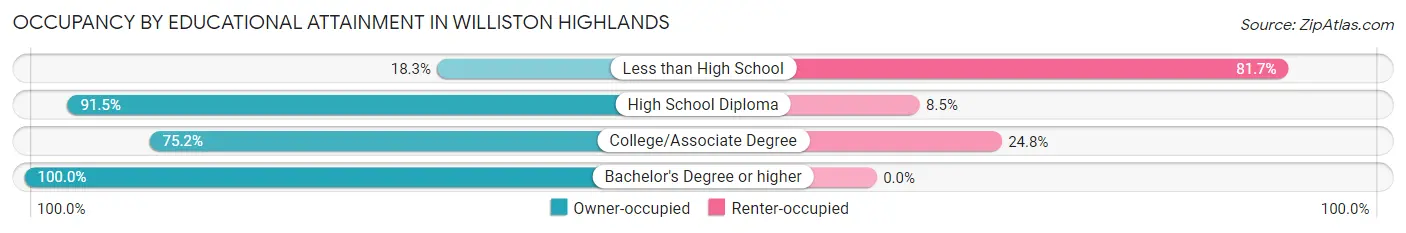
| Household Size | Owner-occupied | Renter-occupied |
| Less than High School | 34 (18.3%) | 152 (81.7%) |
| High School Diploma | 440 (91.5%) | 41 (8.5%) |
| College/Associate Degree | 176 (75.2%) | 58 (24.8%) |
| Bachelor's Degree or higher | 332 (100.0%) | 0 (0.0%) |
Occupancy by Age of Householder in Williston Highlands
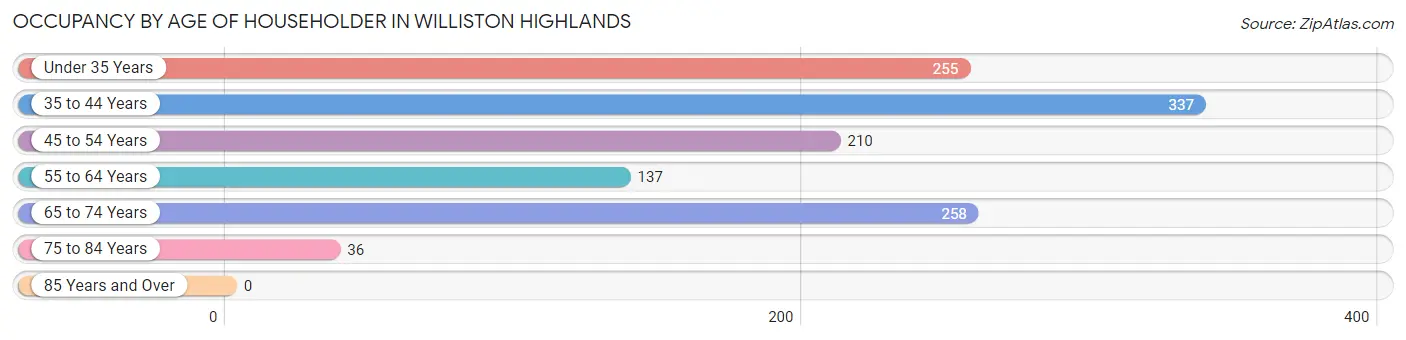
| Age Bracket | # Households | % Households |
| Under 35 Years | 255 | 20.7% |
| 35 to 44 Years | 337 | 27.3% |
| 45 to 54 Years | 210 | 17.0% |
| 55 to 64 Years | 137 | 11.1% |
| 65 to 74 Years | 258 | 20.9% |
| 75 to 84 Years | 36 | 2.9% |
| 85 Years and Over | 0 | 0.0% |
| Total | 1,233 | 100.0% |
Housing Finances in Williston Highlands
Median Income by Occupancy in Williston Highlands
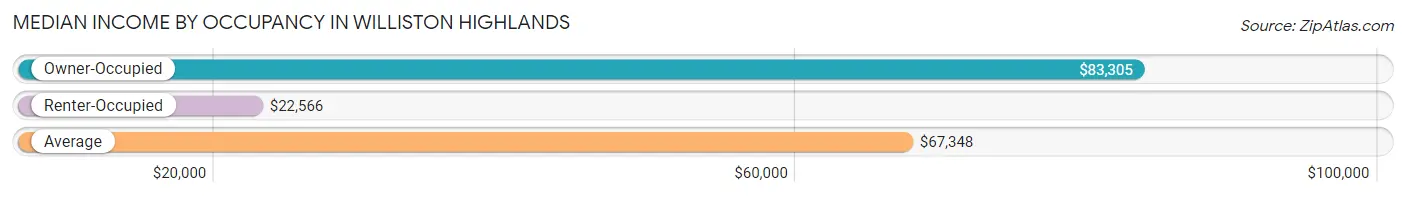
| Occupancy Type | # Households | Median Income |
| Owner-Occupied | 982 (79.6%) | $83,305 |
| Renter-Occupied | 251 (20.4%) | $22,566 |
| Average | 1,233 (100.0%) | $67,348 |
Occupancy by Householder Income Bracket in Williston Highlands
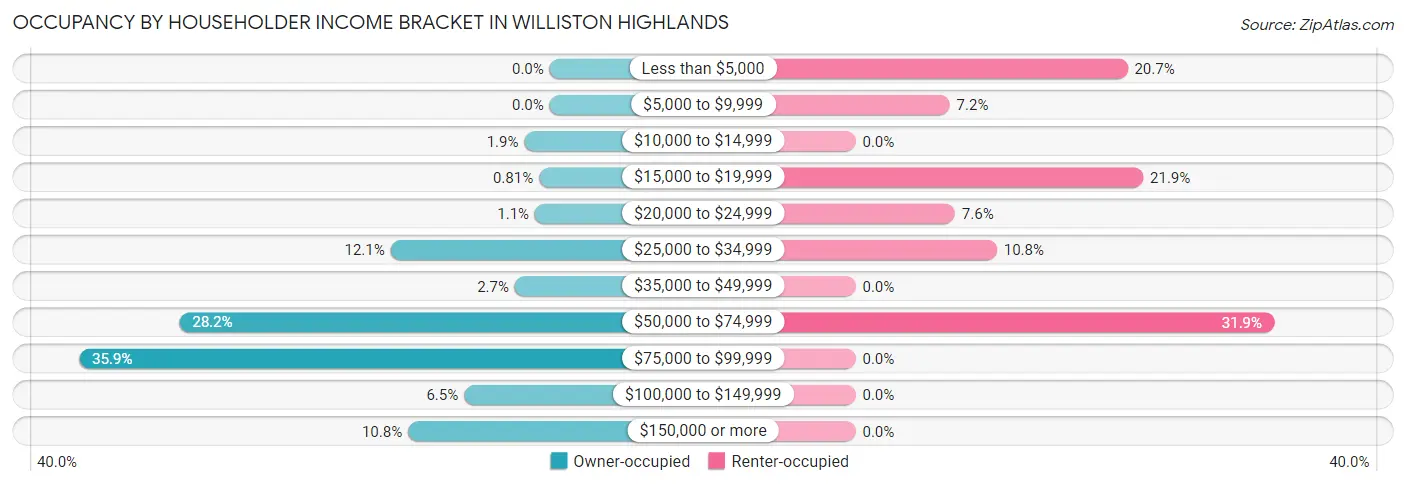
| Income Bracket | Owner-occupied | Renter-occupied |
| Less than $5,000 | 0 (0.0%) | 52 (20.7%) |
| $5,000 to $9,999 | 0 (0.0%) | 18 (7.2%) |
| $10,000 to $14,999 | 19 (1.9%) | 0 (0.0%) |
| $15,000 to $19,999 | 8 (0.8%) | 55 (21.9%) |
| $20,000 to $24,999 | 11 (1.1%) | 19 (7.6%) |
| $25,000 to $34,999 | 119 (12.1%) | 27 (10.8%) |
| $35,000 to $49,999 | 26 (2.6%) | 0 (0.0%) |
| $50,000 to $74,999 | 277 (28.2%) | 80 (31.9%) |
| $75,000 to $99,999 | 352 (35.8%) | 0 (0.0%) |
| $100,000 to $149,999 | 64 (6.5%) | 0 (0.0%) |
| $150,000 or more | 106 (10.8%) | 0 (0.0%) |
| Total | 982 (100.0%) | 251 (100.0%) |
Monthly Housing Cost Tiers in Williston Highlands
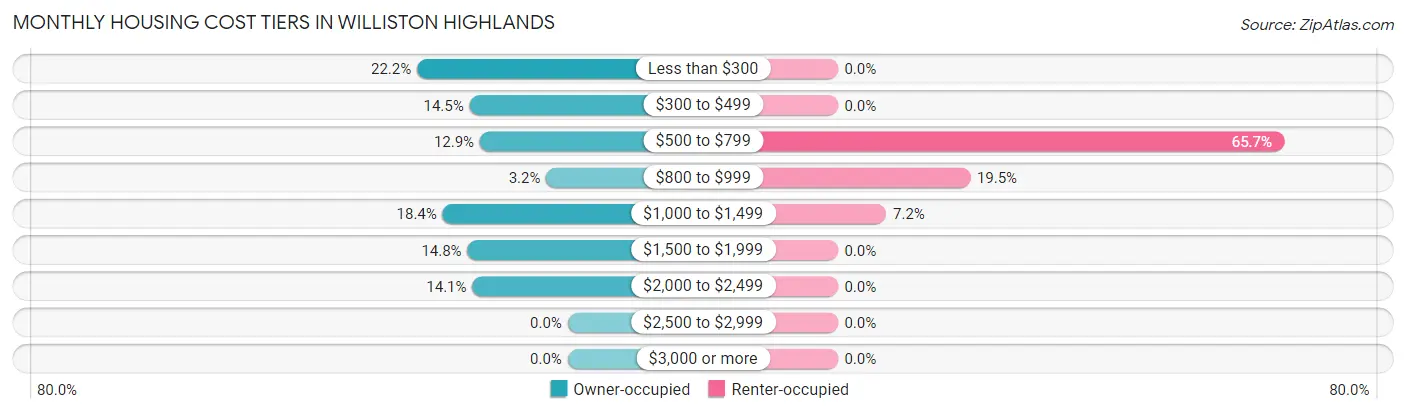
| Monthly Cost | Owner-occupied | Renter-occupied |
| Less than $300 | 218 (22.2%) | 0 (0.0%) |
| $300 to $499 | 142 (14.5%) | 0 (0.0%) |
| $500 to $799 | 127 (12.9%) | 165 (65.7%) |
| $800 to $999 | 31 (3.2%) | 49 (19.5%) |
| $1,000 to $1,499 | 181 (18.4%) | 18 (7.2%) |
| $1,500 to $1,999 | 145 (14.8%) | 0 (0.0%) |
| $2,000 to $2,499 | 138 (14.1%) | 0 (0.0%) |
| $2,500 to $2,999 | 0 (0.0%) | 0 (0.0%) |
| $3,000 or more | 0 (0.0%) | 0 (0.0%) |
| Total | 982 (100.0%) | 251 (100.0%) |
Physical Housing Characteristics in Williston Highlands
Housing Structures in Williston Highlands
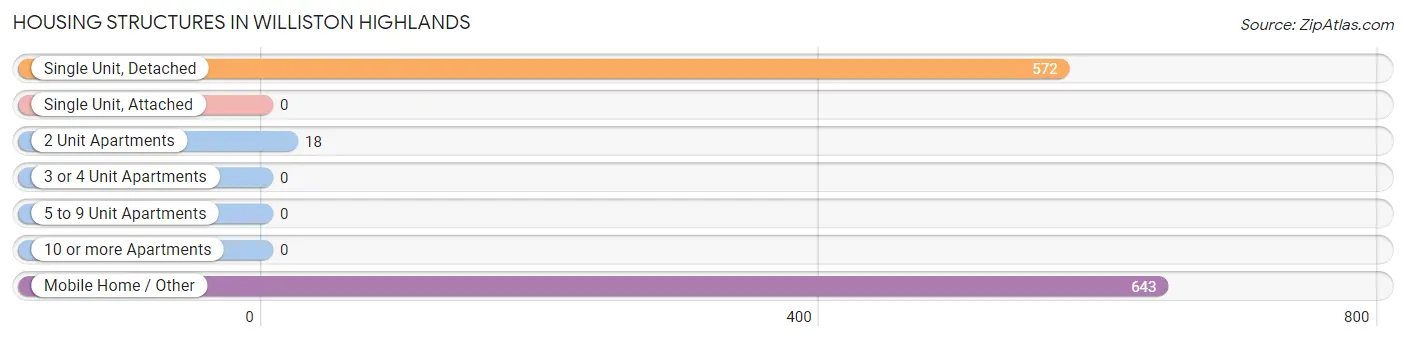
| Structure Type | # Housing Units | % Housing Units |
| Single Unit, Detached | 572 | 46.4% |
| Single Unit, Attached | 0 | 0.0% |
| 2 Unit Apartments | 18 | 1.5% |
| 3 or 4 Unit Apartments | 0 | 0.0% |
| 5 to 9 Unit Apartments | 0 | 0.0% |
| 10 or more Apartments | 0 | 0.0% |
| Mobile Home / Other | 643 | 52.1% |
| Total | 1,233 | 100.0% |
Housing Structures by Occupancy in Williston Highlands
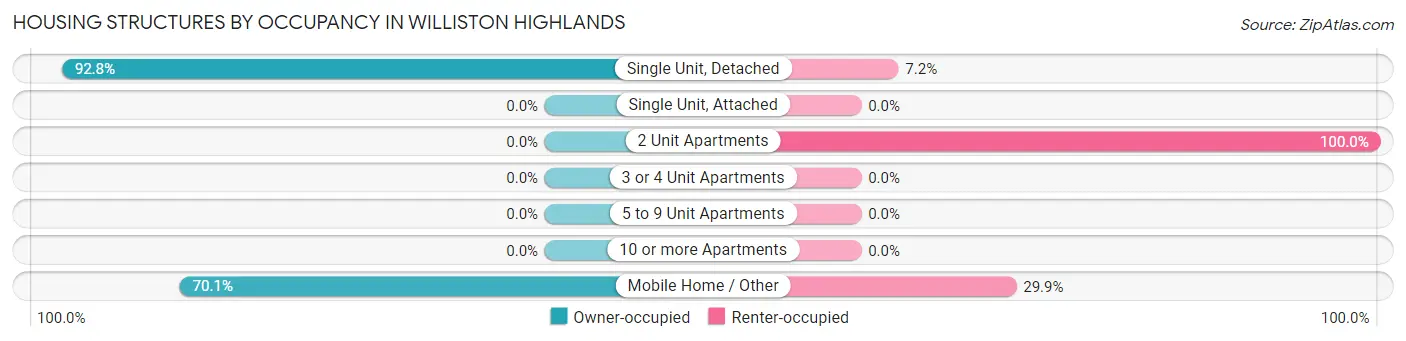
| Structure Type | Owner-occupied | Renter-occupied |
| Single Unit, Detached | 531 (92.8%) | 41 (7.2%) |
| Single Unit, Attached | 0 (0.0%) | 0 (0.0%) |
| 2 Unit Apartments | 0 (0.0%) | 18 (100.0%) |
| 3 or 4 Unit Apartments | 0 (0.0%) | 0 (0.0%) |
| 5 to 9 Unit Apartments | 0 (0.0%) | 0 (0.0%) |
| 10 or more Apartments | 0 (0.0%) | 0 (0.0%) |
| Mobile Home / Other | 451 (70.1%) | 192 (29.9%) |
| Total | 982 (79.6%) | 251 (20.4%) |
Housing Structures by Number of Rooms in Williston Highlands
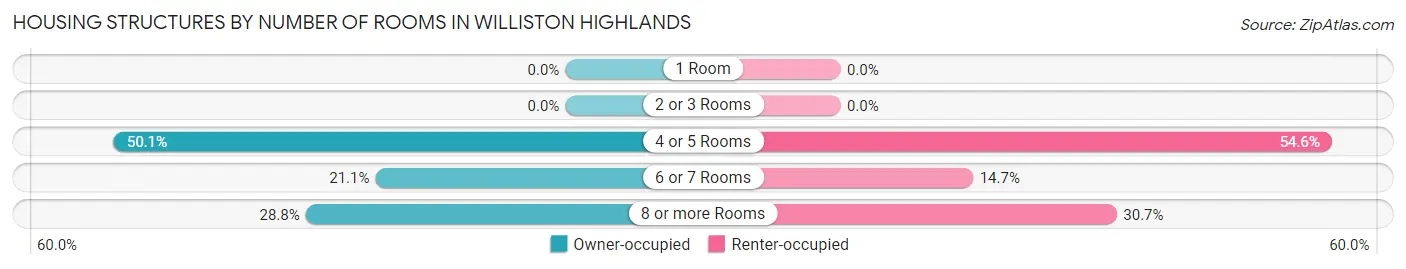
| Number of Rooms | Owner-occupied | Renter-occupied |
| 1 Room | 0 (0.0%) | 0 (0.0%) |
| 2 or 3 Rooms | 0 (0.0%) | 0 (0.0%) |
| 4 or 5 Rooms | 492 (50.1%) | 137 (54.6%) |
| 6 or 7 Rooms | 207 (21.1%) | 37 (14.7%) |
| 8 or more Rooms | 283 (28.8%) | 77 (30.7%) |
| Total | 982 (100.0%) | 251 (100.0%) |
Housing Structure by Heating Type in Williston Highlands
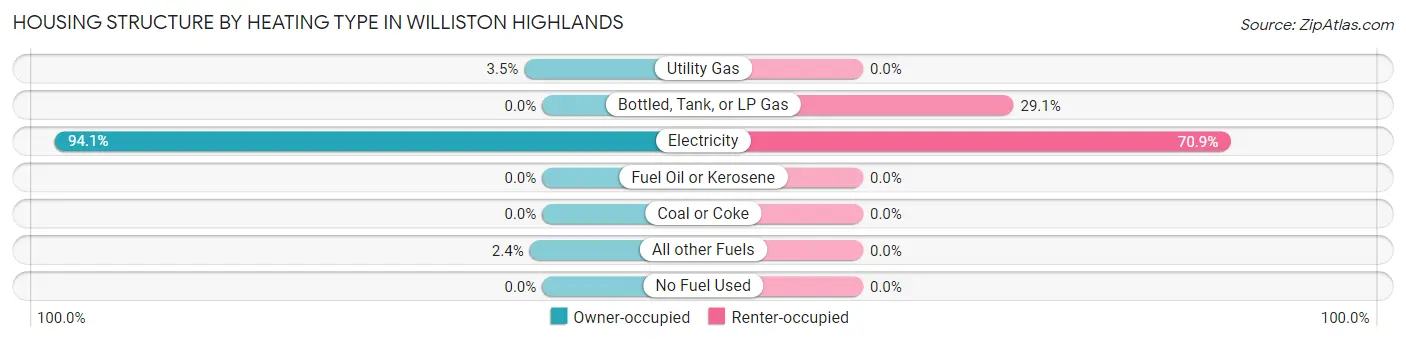
| Heating Type | Owner-occupied | Renter-occupied |
| Utility Gas | 34 (3.5%) | 0 (0.0%) |
| Bottled, Tank, or LP Gas | 0 (0.0%) | 73 (29.1%) |
| Electricity | 924 (94.1%) | 178 (70.9%) |
| Fuel Oil or Kerosene | 0 (0.0%) | 0 (0.0%) |
| Coal or Coke | 0 (0.0%) | 0 (0.0%) |
| All other Fuels | 24 (2.4%) | 0 (0.0%) |
| No Fuel Used | 0 (0.0%) | 0 (0.0%) |
| Total | 982 (100.0%) | 251 (100.0%) |
Household Vehicle Usage in Williston Highlands
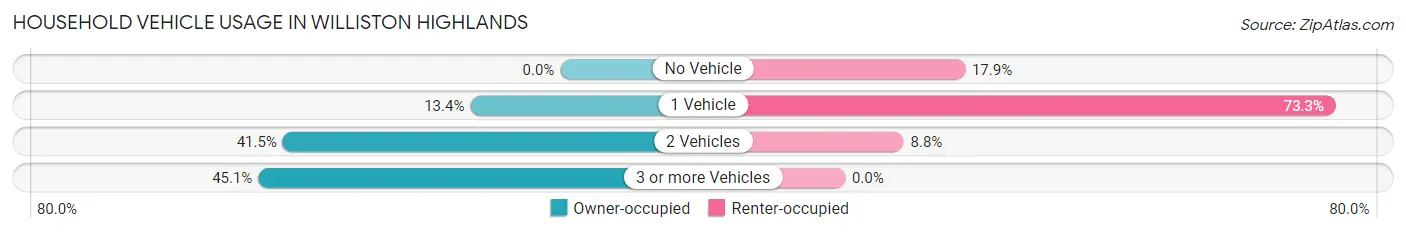
| Vehicles per Household | Owner-occupied | Renter-occupied |
| No Vehicle | 0 (0.0%) | 45 (17.9%) |
| 1 Vehicle | 132 (13.4%) | 184 (73.3%) |
| 2 Vehicles | 407 (41.4%) | 22 (8.8%) |
| 3 or more Vehicles | 443 (45.1%) | 0 (0.0%) |
| Total | 982 (100.0%) | 251 (100.0%) |
Real Estate & Mortgages in Williston Highlands
Real Estate and Mortgage Overview in Williston Highlands
| Characteristic | Without Mortgage | With Mortgage |
| Housing Units | 400 | 582 |
| Median Property Value | $97,700 | $239,800 |
| Median Household Income | $66,250 | $106 |
| Monthly Housing Costs | $243 | $0 |
| Real Estate Taxes | $517 | $0 |
Property Value by Mortgage Status in Williston Highlands
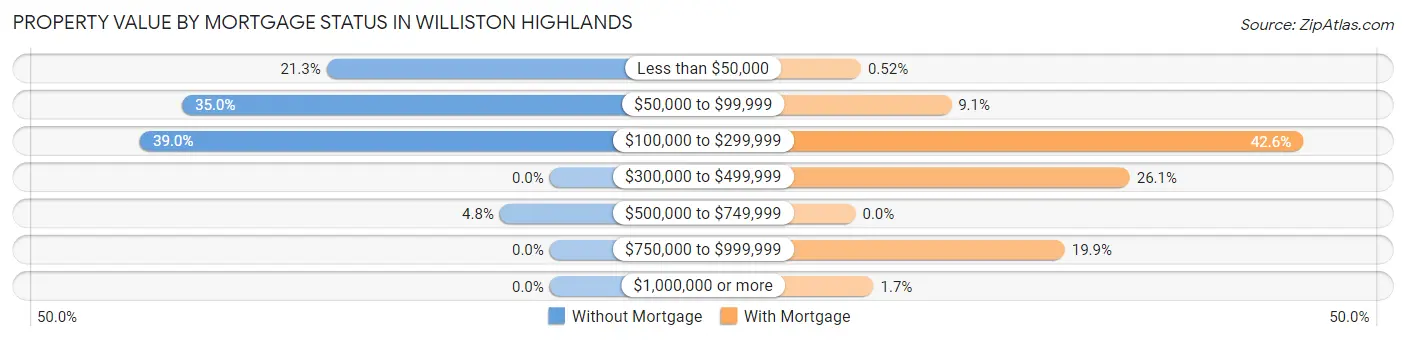
| Property Value | Without Mortgage | With Mortgage |
| Less than $50,000 | 85 (21.2%) | 3 (0.5%) |
| $50,000 to $99,999 | 140 (35.0%) | 53 (9.1%) |
| $100,000 to $299,999 | 156 (39.0%) | 248 (42.6%) |
| $300,000 to $499,999 | 0 (0.0%) | 152 (26.1%) |
| $500,000 to $749,999 | 19 (4.8%) | 0 (0.0%) |
| $750,000 to $999,999 | 0 (0.0%) | 116 (19.9%) |
| $1,000,000 or more | 0 (0.0%) | 10 (1.7%) |
| Total | 400 (100.0%) | 582 (100.0%) |
Household Income by Mortgage Status in Williston Highlands
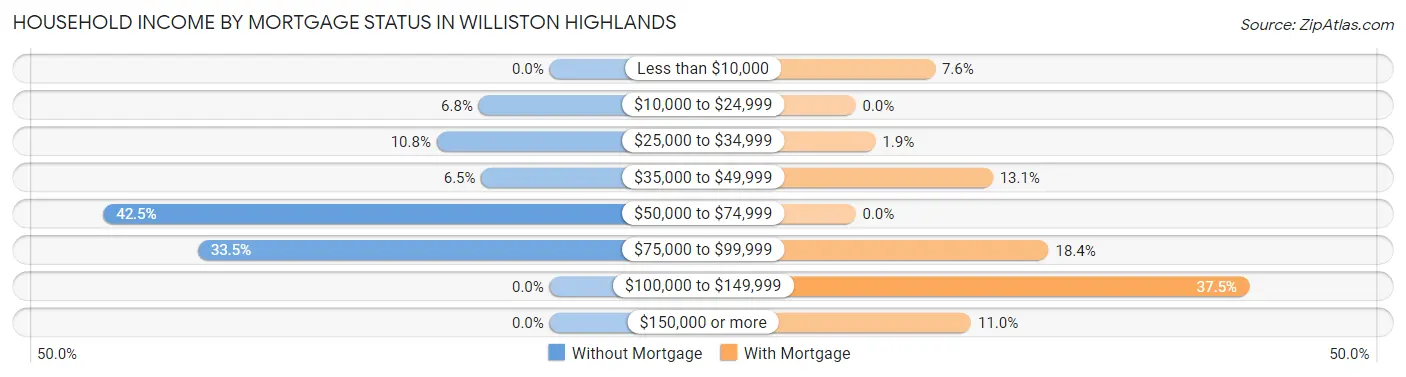
| Household Income | Without Mortgage | With Mortgage |
| Less than $10,000 | 0 (0.0%) | 44 (7.6%) |
| $10,000 to $24,999 | 27 (6.8%) | 0 (0.0%) |
| $25,000 to $34,999 | 43 (10.7%) | 11 (1.9%) |
| $35,000 to $49,999 | 26 (6.5%) | 76 (13.1%) |
| $50,000 to $74,999 | 170 (42.5%) | 0 (0.0%) |
| $75,000 to $99,999 | 134 (33.5%) | 107 (18.4%) |
| $100,000 to $149,999 | 0 (0.0%) | 218 (37.5%) |
| $150,000 or more | 0 (0.0%) | 64 (11.0%) |
| Total | 400 (100.0%) | 582 (100.0%) |
Property Value to Household Income Ratio in Williston Highlands
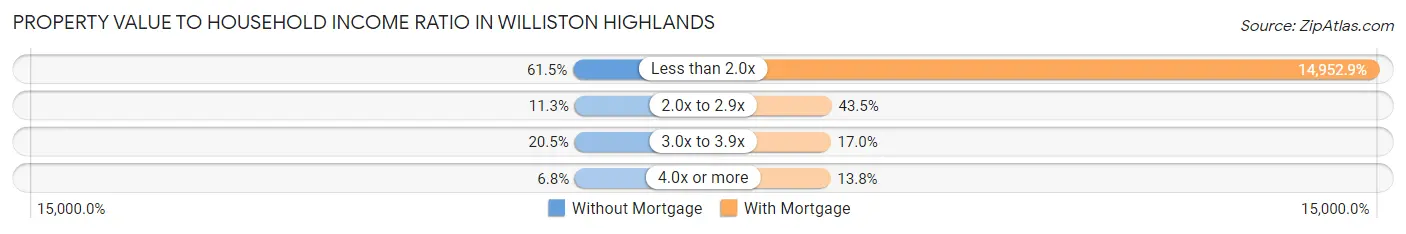
| Value-to-Income Ratio | Without Mortgage | With Mortgage |
| Less than 2.0x | 246 (61.5%) | 87,026 (14,952.9%) |
| 2.0x to 2.9x | 45 (11.3%) | 253 (43.5%) |
| 3.0x to 3.9x | 82 (20.5%) | 99 (17.0%) |
| 4.0x or more | 27 (6.8%) | 80 (13.8%) |
| Total | 400 (100.0%) | 582 (100.0%) |
Real Estate Taxes by Mortgage Status in Williston Highlands
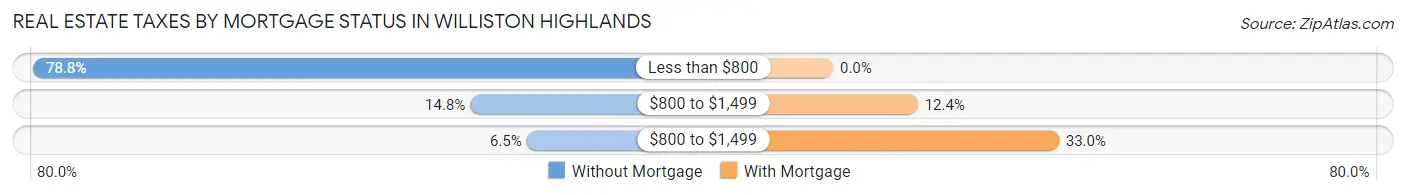
| Property Taxes | Without Mortgage | With Mortgage |
| Less than $800 | 315 (78.7%) | 0 (0.0%) |
| $800 to $1,499 | 59 (14.7%) | 72 (12.4%) |
| $800 to $1,499 | 26 (6.5%) | 192 (33.0%) |
| Total | 400 (100.0%) | 582 (100.0%) |
Health & Disability in Williston Highlands
Health Insurance Coverage by Age in Williston Highlands
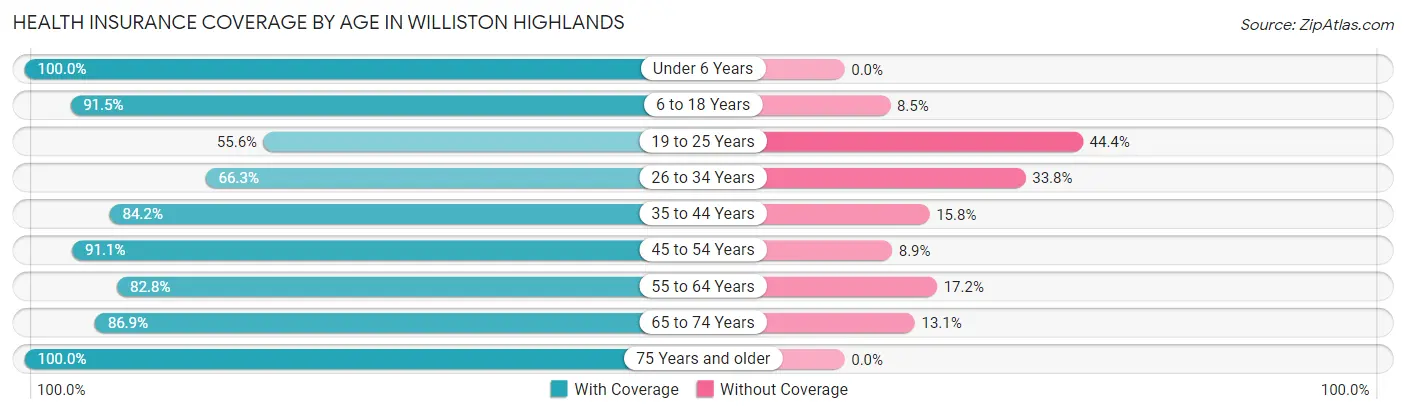
| Age Bracket | With Coverage | Without Coverage |
| Under 6 Years | 124 (100.0%) | 0 (0.0%) |
| 6 to 18 Years | 720 (91.5%) | 67 (8.5%) |
| 19 to 25 Years | 40 (55.6%) | 32 (44.4%) |
| 26 to 34 Years | 316 (66.2%) | 161 (33.8%) |
| 35 to 44 Years | 425 (84.2%) | 80 (15.8%) |
| 45 to 54 Years | 422 (91.1%) | 41 (8.9%) |
| 55 to 64 Years | 192 (82.8%) | 40 (17.2%) |
| 65 to 74 Years | 345 (86.9%) | 52 (13.1%) |
| 75 Years and older | 107 (100.0%) | 0 (0.0%) |
| Total | 2,691 (85.1%) | 473 (14.9%) |
Health Insurance Coverage by Citizenship Status in Williston Highlands
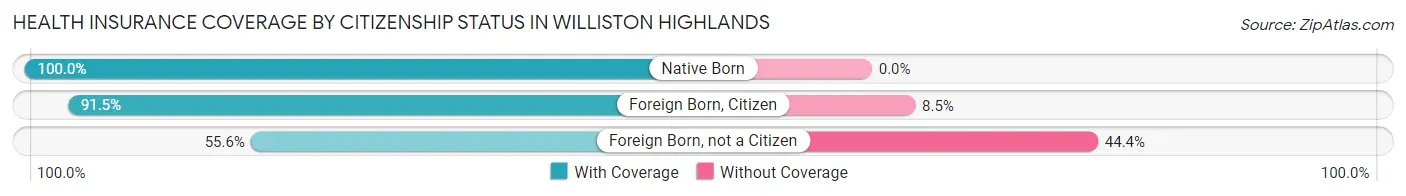
| Citizenship Status | With Coverage | Without Coverage |
| Native Born | 124 (100.0%) | 0 (0.0%) |
| Foreign Born, Citizen | 720 (91.5%) | 67 (8.5%) |
| Foreign Born, not a Citizen | 40 (55.6%) | 32 (44.4%) |
Health Insurance Coverage by Household Income in Williston Highlands
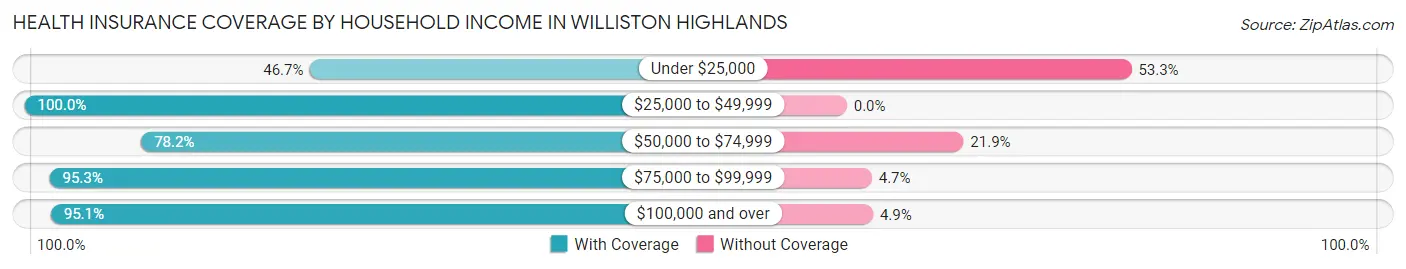
| Household Income | With Coverage | Without Coverage |
| Under $25,000 | 147 (46.7%) | 168 (53.3%) |
| $25,000 to $49,999 | 279 (100.0%) | 0 (0.0%) |
| $50,000 to $74,999 | 837 (78.1%) | 234 (21.8%) |
| $75,000 to $99,999 | 1,099 (95.3%) | 54 (4.7%) |
| $100,000 and over | 329 (95.1%) | 17 (4.9%) |
Public vs Private Health Insurance Coverage by Age in Williston Highlands
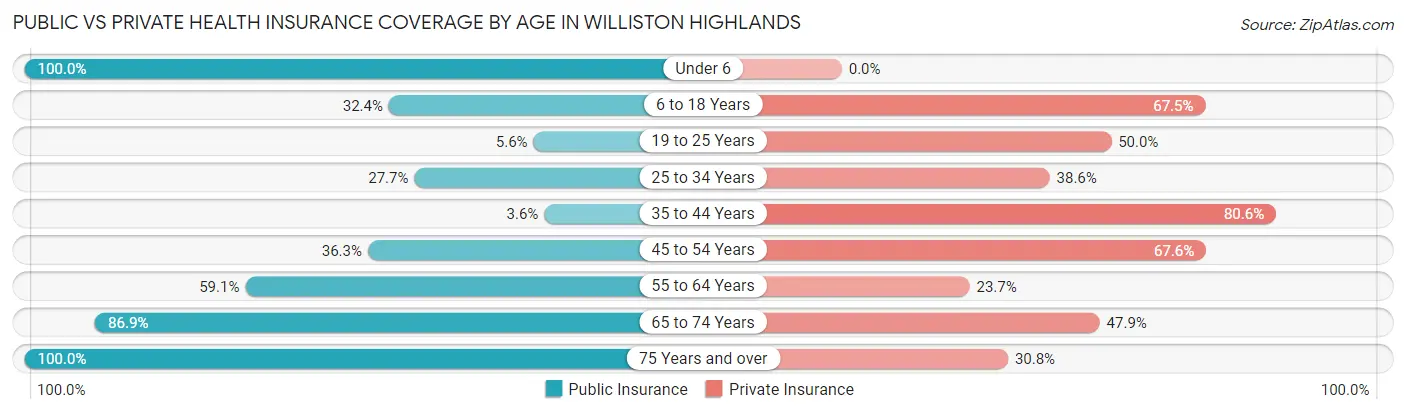
| Age Bracket | Public Insurance | Private Insurance |
| Under 6 | 124 (100.0%) | 0 (0.0%) |
| 6 to 18 Years | 255 (32.4%) | 531 (67.5%) |
| 19 to 25 Years | 4 (5.6%) | 36 (50.0%) |
| 25 to 34 Years | 132 (27.7%) | 184 (38.6%) |
| 35 to 44 Years | 18 (3.6%) | 407 (80.6%) |
| 45 to 54 Years | 168 (36.3%) | 313 (67.6%) |
| 55 to 64 Years | 137 (59.1%) | 55 (23.7%) |
| 65 to 74 Years | 345 (86.9%) | 190 (47.9%) |
| 75 Years and over | 107 (100.0%) | 33 (30.8%) |
| Total | 1,290 (40.8%) | 1,749 (55.3%) |
Disability Status by Sex by Age in Williston Highlands
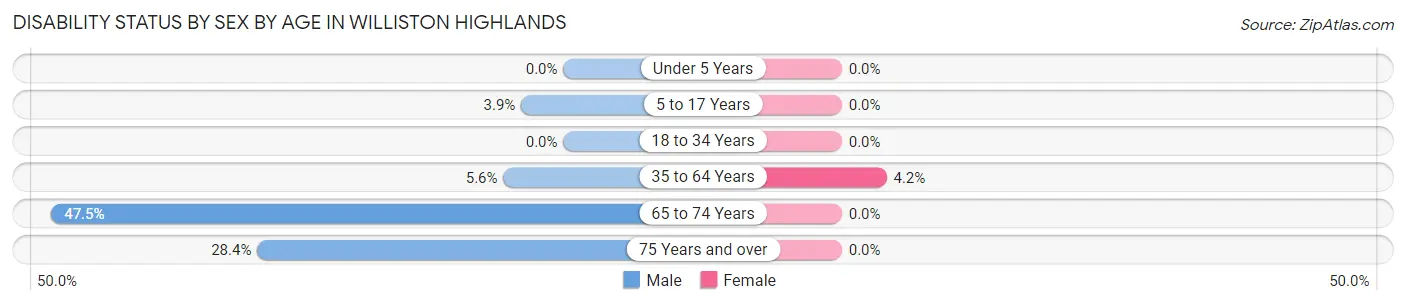
| Age Bracket | Male | Female |
| Under 5 Years | 0 (0.0%) | 0 (0.0%) |
| 5 to 17 Years | 21 (3.9%) | 0 (0.0%) |
| 18 to 34 Years | 0 (0.0%) | 0 (0.0%) |
| 35 to 64 Years | 32 (5.6%) | 26 (4.2%) |
| 65 to 74 Years | 115 (47.5%) | 0 (0.0%) |
| 75 Years and over | 25 (28.4%) | 0 (0.0%) |
Disability Class by Sex by Age in Williston Highlands
Disability Class: Hearing Difficulty
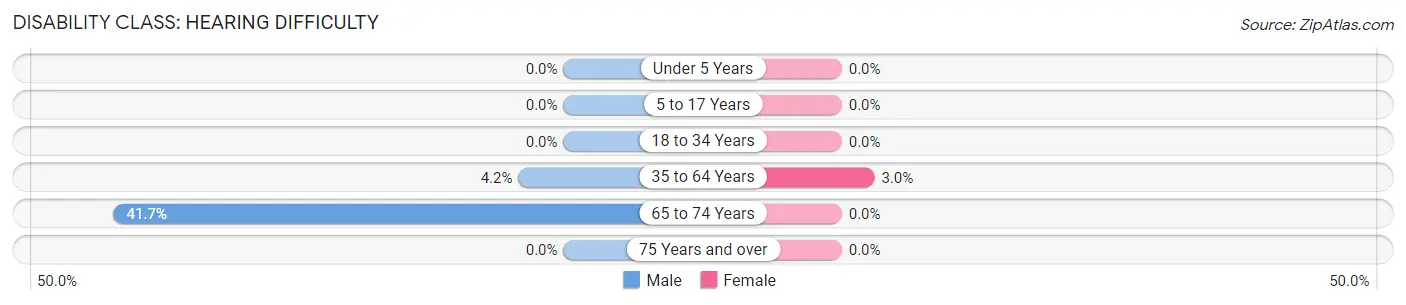
| Age Bracket | Male | Female |
| Under 5 Years | 0 (0.0%) | 0 (0.0%) |
| 5 to 17 Years | 0 (0.0%) | 0 (0.0%) |
| 18 to 34 Years | 0 (0.0%) | 0 (0.0%) |
| 35 to 64 Years | 24 (4.2%) | 19 (3.0%) |
| 65 to 74 Years | 101 (41.7%) | 0 (0.0%) |
| 75 Years and over | 0 (0.0%) | 0 (0.0%) |
Disability Class: Vision Difficulty
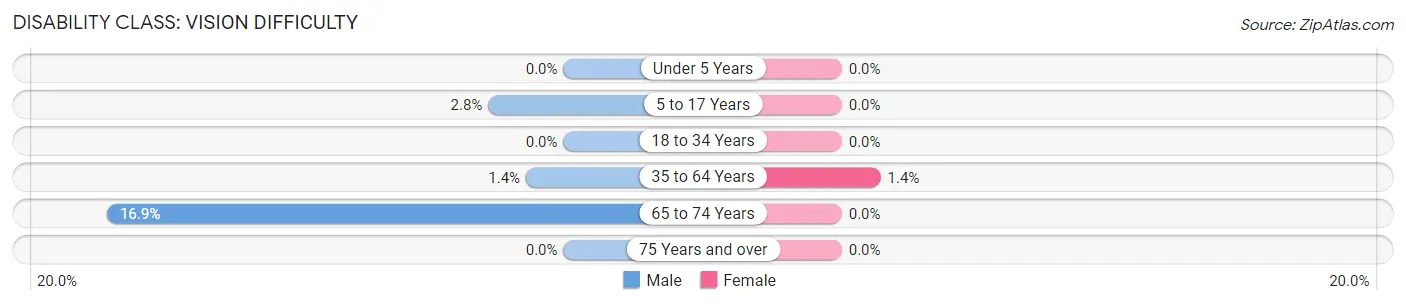
| Age Bracket | Male | Female |
| Under 5 Years | 0 (0.0%) | 0 (0.0%) |
| 5 to 17 Years | 15 (2.8%) | 0 (0.0%) |
| 18 to 34 Years | 0 (0.0%) | 0 (0.0%) |
| 35 to 64 Years | 8 (1.4%) | 9 (1.4%) |
| 65 to 74 Years | 41 (16.9%) | 0 (0.0%) |
| 75 Years and over | 0 (0.0%) | 0 (0.0%) |
Disability Class: Cognitive Difficulty
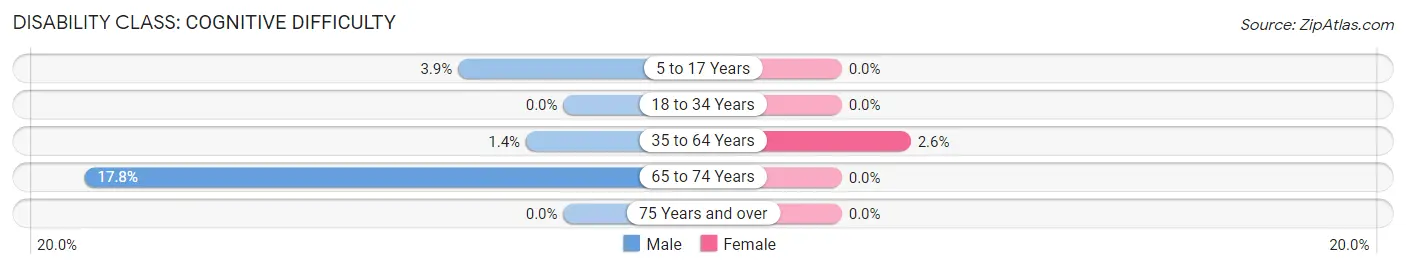
| Age Bracket | Male | Female |
| 5 to 17 Years | 21 (3.9%) | 0 (0.0%) |
| 18 to 34 Years | 0 (0.0%) | 0 (0.0%) |
| 35 to 64 Years | 8 (1.4%) | 16 (2.6%) |
| 65 to 74 Years | 43 (17.8%) | 0 (0.0%) |
| 75 Years and over | 0 (0.0%) | 0 (0.0%) |
Disability Class: Ambulatory Difficulty
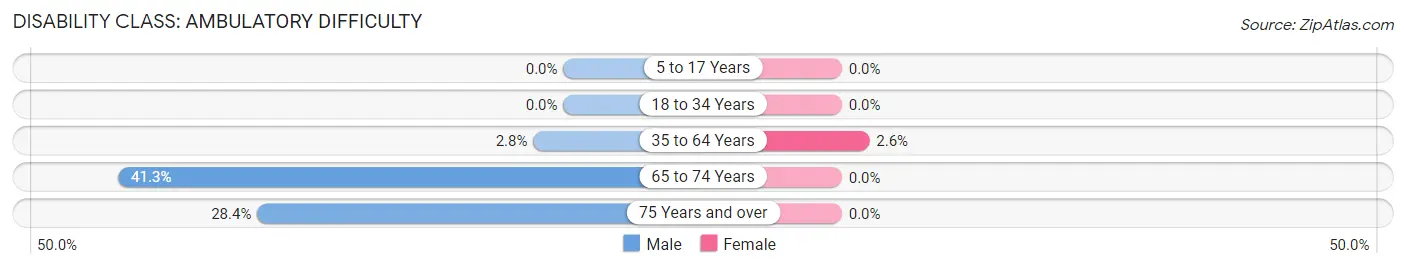
| Age Bracket | Male | Female |
| 5 to 17 Years | 0 (0.0%) | 0 (0.0%) |
| 18 to 34 Years | 0 (0.0%) | 0 (0.0%) |
| 35 to 64 Years | 16 (2.8%) | 16 (2.6%) |
| 65 to 74 Years | 100 (41.3%) | 0 (0.0%) |
| 75 Years and over | 25 (28.4%) | 0 (0.0%) |
Disability Class: Self-Care Difficulty
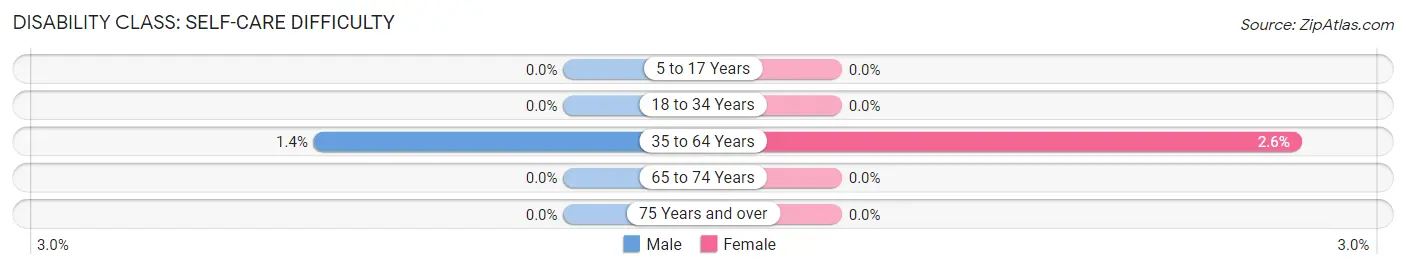
| Age Bracket | Male | Female |
| 5 to 17 Years | 0 (0.0%) | 0 (0.0%) |
| 18 to 34 Years | 0 (0.0%) | 0 (0.0%) |
| 35 to 64 Years | 8 (1.4%) | 16 (2.6%) |
| 65 to 74 Years | 0 (0.0%) | 0 (0.0%) |
| 75 Years and over | 0 (0.0%) | 0 (0.0%) |
Technology Access in Williston Highlands
Computing Device Access in Williston Highlands
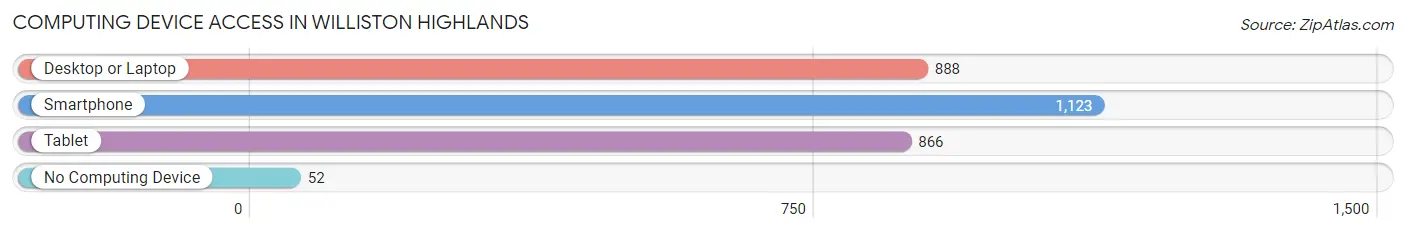
| Device Type | # Households | % Households |
| Desktop or Laptop | 888 | 72.0% |
| Smartphone | 1,123 | 91.1% |
| Tablet | 866 | 70.2% |
| No Computing Device | 52 | 4.2% |
| Total | 1,233 | 100.0% |
Internet Access in Williston Highlands
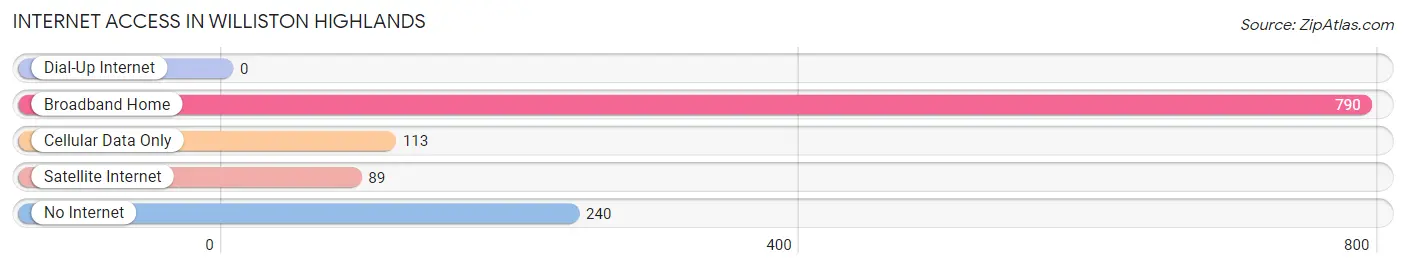
| Internet Type | # Households | % Households |
| Dial-Up Internet | 0 | 0.0% |
| Broadband Home | 790 | 64.1% |
| Cellular Data Only | 113 | 9.2% |
| Satellite Internet | 89 | 7.2% |
| No Internet | 240 | 19.5% |
| Total | 1,233 | 100.0% |
Williston Highlands Summary
Williston Highlands is a small unincorporated community located in Levy County, Florida. It is situated in the north-central part of the county, approximately 20 miles south of Gainesville and 25 miles west of Ocala. The community is bordered by the Withlacoochee River to the east and the Goethe State Forest to the west. The population of Williston Highlands was estimated to be 1,845 in 2019.
History
Williston Highlands was first settled in the late 1800s by settlers from the nearby town of Williston. The settlers were attracted to the area due to its fertile soil and abundant wildlife. The community was originally known as “Williston’s Highlands” and was later shortened to “Williston Highlands”. The town was officially incorporated in 1925 and was named after the nearby town of Williston.
Geography
Williston Highlands is located in Levy County, Florida. It is situated in the north-central part of the county, approximately 20 miles south of Gainesville and 25 miles west of Ocala. The community is bordered by the Withlacoochee River to the east and the Goethe State Forest to the west. The terrain of the area is mostly flat with some rolling hills. The climate is humid subtropical with hot summers and mild winters.
Economy
The economy of Williston Highlands is largely based on agriculture and forestry. The area is home to several farms and ranches that produce a variety of crops, including corn, soybeans, and hay. The nearby Goethe State Forest is also a major source of employment for the community, providing jobs in forestry and timber harvesting. In addition, the community is home to several small businesses, including restaurants, convenience stores, and auto repair shops.
Demographics
As of 2019, the population of Williston Highlands was estimated to be 1,845. The racial makeup of the community was 94.3% White, 2.2% African American, 0.7% Native American, 0.4% Asian, 0.1% Pacific Islander, and 2.3% from other races. The median household income was $37,917 and the median age was 44.7 years. The majority of the population (90.3%) was over the age of 18 and the majority of the population (87.2%) was married.
Williston Highlands is a small, rural community with a rich history and a diverse population. The area is home to a variety of businesses and industries, providing employment opportunities for its residents. The community is also home to several parks and recreational areas, making it a great place to live and work.
Common Questions
What is the Total Population of Williston Highlands?
Total Population of Williston Highlands is 3,164.
What is the Total Male Population of Williston Highlands?
Total Male Population of Williston Highlands is 1,747.
What is the Total Female Population of Williston Highlands?
Total Female Population of Williston Highlands is 1,417.
What is the Ratio of Males per 100 Females in Williston Highlands?
There are 123.29 Males per 100 Females in Williston Highlands.
What is the Ratio of Females per 100 Males in Williston Highlands?
There are 81.11 Females per 100 Males in Williston Highlands.
What is the Median Population Age in Williston Highlands?
Median Population Age in Williston Highlands is 36.1 Years.
What is the Average Family Size in Williston Highlands
Average Family Size in Williston Highlands is 2.9 People.
What is the Average Household Size in Williston Highlands
Average Household Size in Williston Highlands is 2.6 People.
What is Per Capita Income in Williston Highlands?
Per Capita income in Williston Highlands is $49,315.
What is the Median Family Income in Williston Highlands?
Median Family Income in Williston Highlands is $80,556.
What is the Median Household income in Williston Highlands?
Median Household Income in Williston Highlands is $67,348.
What is Income or Wage Gap in Williston Highlands?
Income or Wage Gap in Williston Highlands is 23.7%.
Women in Williston Highlands earn 76.3 cents for every dollar earned by a man.
What is Inequality or Gini Index in Williston Highlands?
Inequality or Gini Index in Williston Highlands is 0.60.
How Large is the Labor Force in Williston Highlands?
There are 1,454 People in the Labor Forcein in Williston Highlands.
What is the Percentage of People in the Labor Force in Williston Highlands?
59.6% of People are in the Labor Force in Williston Highlands.