White City, FL
White City Map
White City Overview
5,494
TOTAL POPULATION
2,939
MALE POPULATION
2,555
FEMALE POPULATION
115.03
MALES / 100 FEMALES
86.93
FEMALES / 100 MALES
53.1
MEDIAN AGE
3.2
AVG FAMILY SIZE
2.9
AVG HOUSEHOLD SIZE
$39,562
PER CAPITA INCOME
$110,884
AVG FAMILY INCOME
$96,932
AVG HOUSEHOLD INCOME
35.5%
WAGE / INCOME GAP [ % ]
64.5¢/ $1
WAGE / INCOME GAP [ $ ]
0.43
INEQUALITY / GINI INDEX
2,557
LABOR FORCE [ PEOPLE ]
51.9%
PERCENT IN LABOR FORCE
2.7%
UNEMPLOYMENT RATE
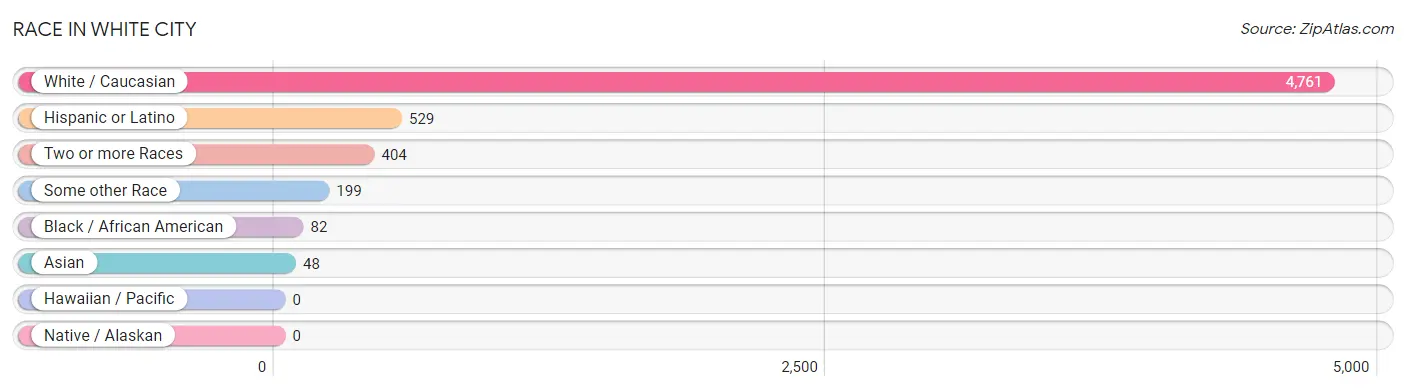
Race in White City
The most populous races in White City are White / Caucasian (4,761 | 86.7%), Hispanic or Latino (529 | 9.6%), and Two or more Races (404 | 7.3%).
| Race | # Population | % Population |
| Asian | 48 | 0.9% |
| Black / African American | 82 | 1.5% |
| Hawaiian / Pacific | 0 | 0.0% |
| Hispanic or Latino | 529 | 9.6% |
| Native / Alaskan | 0 | 0.0% |
| White / Caucasian | 4,761 | 86.7% |
| Two or more Races | 404 | 7.3% |
| Some other Race | 199 | 3.6% |
| Total | 5,494 | 100.0% |
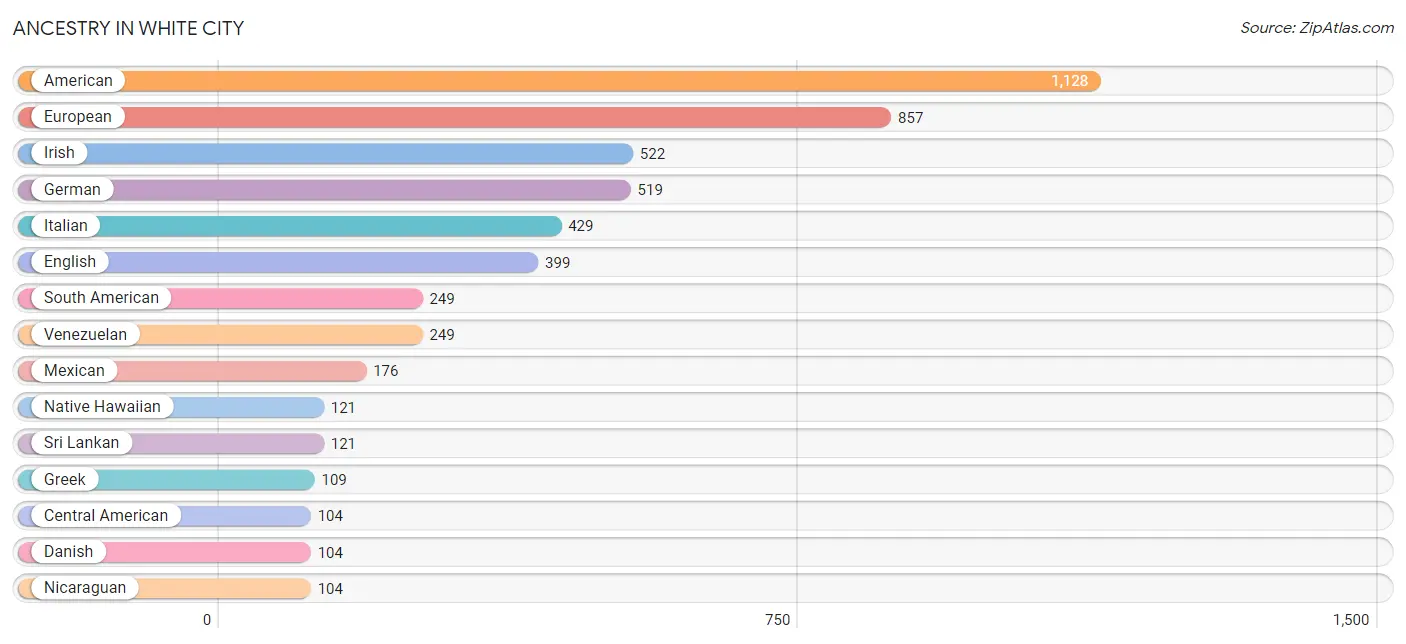
Ancestry in White City
The most populous ancestries reported in White City are American (1,128 | 20.5%), European (857 | 15.6%), Irish (522 | 9.5%), German (519 | 9.5%), and Italian (429 | 7.8%), together accounting for 62.9% of all White City residents.
| Ancestry | # Population | % Population |
| American | 1,128 | 20.5% |
| Burmese | 51 | 0.9% |
| Central American | 104 | 1.9% |
| Danish | 104 | 1.9% |
| Dutch | 8 | 0.2% |
| English | 399 | 7.3% |
| European | 857 | 15.6% |
| French | 39 | 0.7% |
| French Canadian | 29 | 0.5% |
| German | 519 | 9.5% |
| Greek | 109 | 2.0% |
| Hungarian | 28 | 0.5% |
| Indian (Asian) | 31 | 0.6% |
| Irish | 522 | 9.5% |
| Italian | 429 | 7.8% |
| Jamaican | 1 | 0.0% |
| Lithuanian | 14 | 0.3% |
| Mexican | 176 | 3.2% |
| Native Hawaiian | 121 | 2.2% |
| Nicaraguan | 104 | 1.9% |
| Polish | 104 | 1.9% |
| Portuguese | 89 | 1.6% |
| Scandinavian | 18 | 0.3% |
| Scotch-Irish | 40 | 0.7% |
| Scottish | 55 | 1.0% |
| Serbian | 25 | 0.5% |
| South American | 249 | 4.5% |
| Sri Lankan | 121 | 2.2% |
| Swedish | 22 | 0.4% |
| Venezuelan | 249 | 4.5% |
| Welsh | 27 | 0.5% | View All 31 Rows |
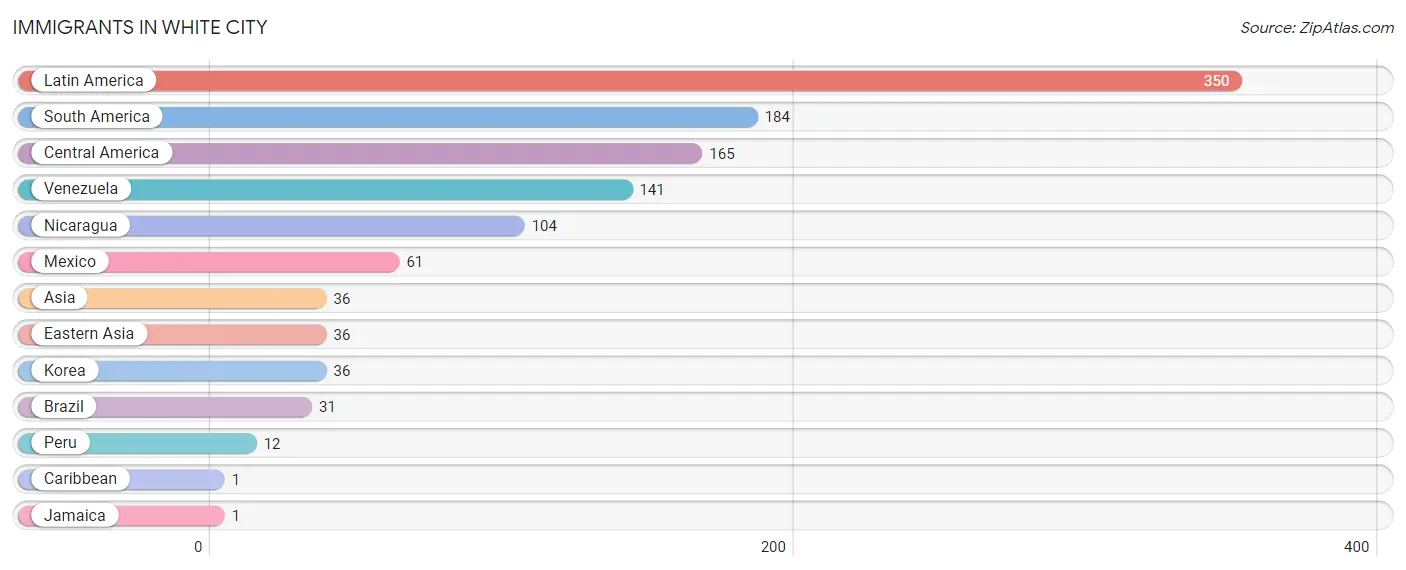
Immigrants in White City
The most numerous immigrant groups reported in White City came from Latin America (350 | 6.4%), South America (184 | 3.4%), Central America (165 | 3.0%), Venezuela (141 | 2.6%), and Nicaragua (104 | 1.9%), together accounting for 17.2% of all White City residents.
| Immigration Origin | # Population | % Population |
| Asia | 36 | 0.7% |
| Brazil | 31 | 0.6% |
| Caribbean | 1 | 0.0% |
| Central America | 165 | 3.0% |
| Eastern Asia | 36 | 0.7% |
| Jamaica | 1 | 0.0% |
| Korea | 36 | 0.7% |
| Latin America | 350 | 6.4% |
| Mexico | 61 | 1.1% |
| Nicaragua | 104 | 1.9% |
| Peru | 12 | 0.2% |
| South America | 184 | 3.4% |
| Venezuela | 141 | 2.6% | View All 13 Rows |
Sex and Age in White City
Sex and Age in White City
The most populous age groups in White City are 65 to 69 Years (416 | 14.1%) for men and 65 to 69 Years (499 | 19.5%) for women.
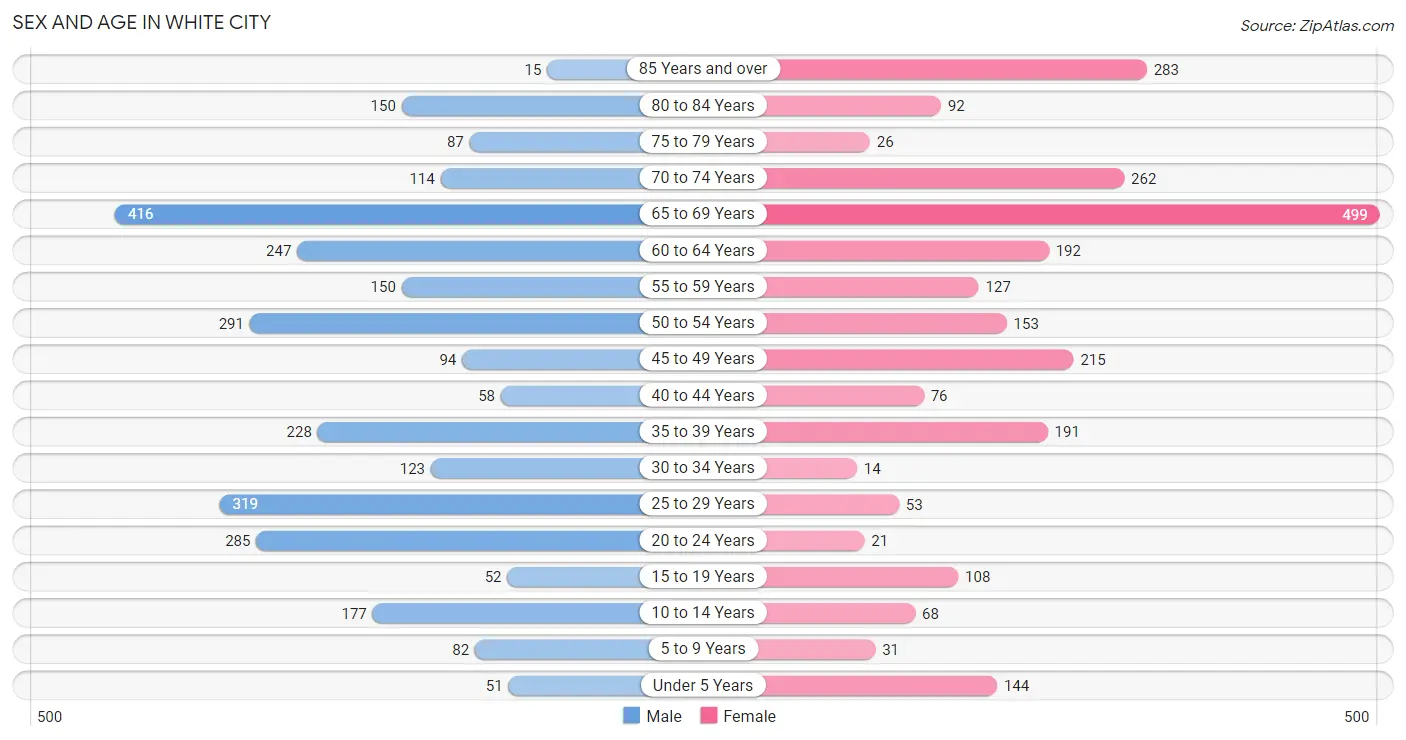
| Age Bracket | Male | Female |
| Under 5 Years | 51 (1.7%) | 144 (5.6%) |
| 5 to 9 Years | 82 (2.8%) | 31 (1.2%) |
| 10 to 14 Years | 177 (6.0%) | 68 (2.7%) |
| 15 to 19 Years | 52 (1.8%) | 108 (4.2%) |
| 20 to 24 Years | 285 (9.7%) | 21 (0.8%) |
| 25 to 29 Years | 319 (10.8%) | 53 (2.1%) |
| 30 to 34 Years | 123 (4.2%) | 14 (0.5%) |
| 35 to 39 Years | 228 (7.8%) | 191 (7.5%) |
| 40 to 44 Years | 58 (2.0%) | 76 (3.0%) |
| 45 to 49 Years | 94 (3.2%) | 215 (8.4%) |
| 50 to 54 Years | 291 (9.9%) | 153 (6.0%) |
| 55 to 59 Years | 150 (5.1%) | 127 (5.0%) |
| 60 to 64 Years | 247 (8.4%) | 192 (7.5%) |
| 65 to 69 Years | 416 (14.1%) | 499 (19.5%) |
| 70 to 74 Years | 114 (3.9%) | 262 (10.2%) |
| 75 to 79 Years | 87 (3.0%) | 26 (1.0%) |
| 80 to 84 Years | 150 (5.1%) | 92 (3.6%) |
| 85 Years and over | 15 (0.5%) | 283 (11.1%) |
| Total | 2,939 (100.0%) | 2,555 (100.0%) |
Families and Households in White City
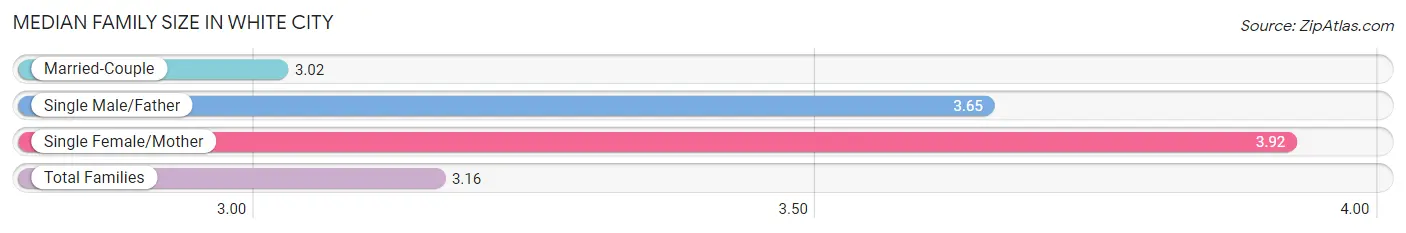
Median Family Size in White City
The median family size in White City is 3.16 persons per family, with single female/mother families (61 | 4.0%) accounting for the largest median family size of 3.92 persons per family. On the other hand, married-couple families (1,219 | 79.8%) represent the smallest median family size with 3.02 persons per family.
| Family Type | # Families | Family Size |
| Married-Couple | 1,219 (79.8%) | 3.02 |
| Single Male/Father | 248 (16.2%) | 3.65 |
| Single Female/Mother | 61 (4.0%) | 3.92 |
| Total Families | 1,528 (100.0%) | 3.16 |
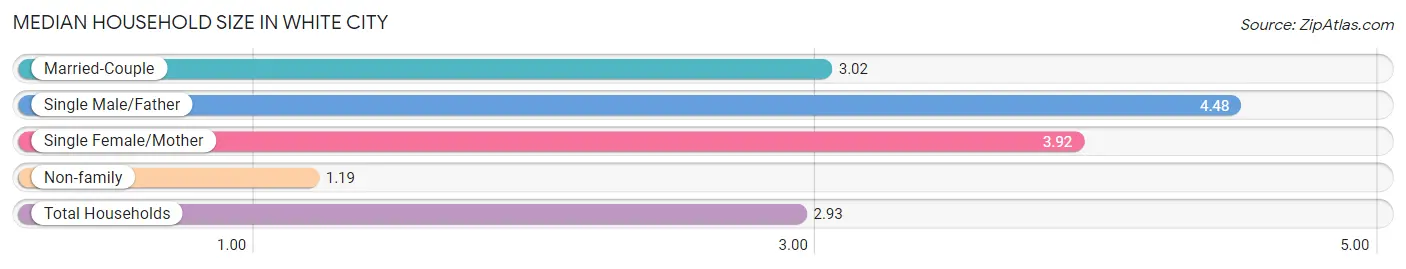
Median Household Size in White City
The median household size in White City is 2.93 persons per household, with single male/father households (248 | 13.4%) accounting for the largest median household size of 4.48 persons per household. non-family households (320 | 17.3%) represent the smallest median household size with 1.19 persons per household.
| Household Type | # Households | Household Size |
| Married-Couple | 1,219 (66.0%) | 3.02 |
| Single Male/Father | 248 (13.4%) | 4.48 |
| Single Female/Mother | 61 (3.3%) | 3.92 |
| Non-family | 320 (17.3%) | 1.19 |
| Total Households | 1,848 (100.0%) | 2.93 |
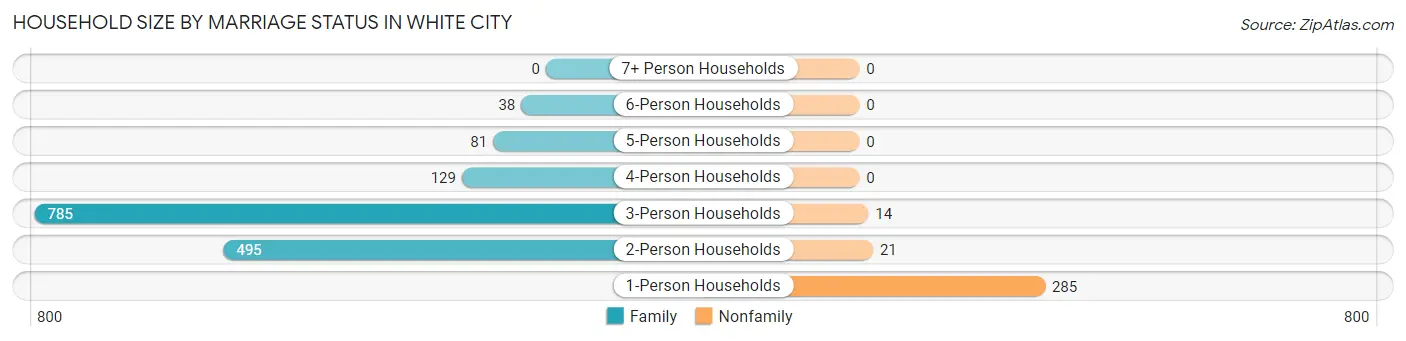
Household Size by Marriage Status in White City
Out of a total of 1,848 households in White City, 1,528 (82.7%) are family households, while 320 (17.3%) are nonfamily households. The most numerous type of family households are 3-person households, comprising 785, and the most common type of nonfamily households are 1-person households, comprising 285.
| Household Size | Family Households | Nonfamily Households |
| 1-Person Households | - | 285 (15.4%) |
| 2-Person Households | 495 (26.8%) | 21 (1.1%) |
| 3-Person Households | 785 (42.5%) | 14 (0.8%) |
| 4-Person Households | 129 (7.0%) | 0 (0.0%) |
| 5-Person Households | 81 (4.4%) | 0 (0.0%) |
| 6-Person Households | 38 (2.1%) | 0 (0.0%) |
| 7+ Person Households | 0 (0.0%) | 0 (0.0%) |
| Total | 1,528 (82.7%) | 320 (17.3%) |
Female Fertility in White City
Fertility by Age in White City
Average fertility rate in White City is 49.0 births per 1,000 women. Women in the age bracket of 20 to 34 years have the highest fertility rate with 398.0 births per 1,000 women. Women in the age bracket of 20 to 34 years acount for 100.0% of all women with births.
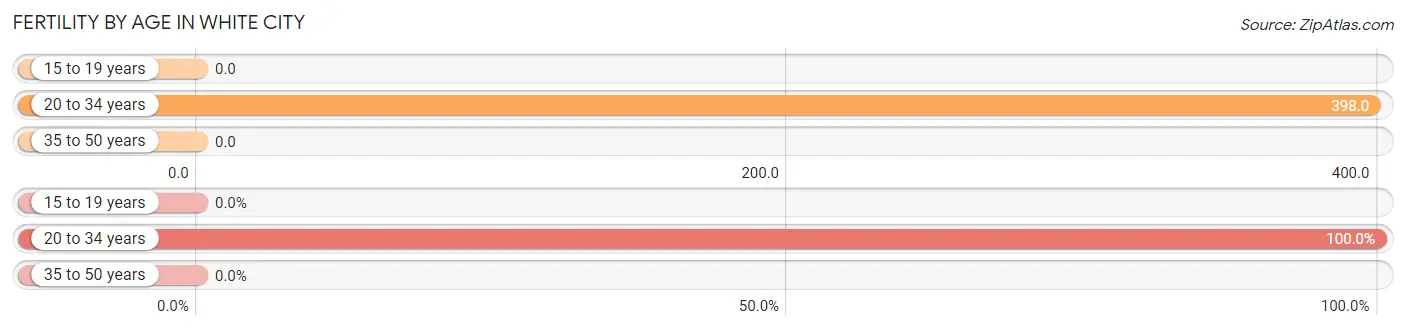
| Age Bracket | Women with Births | Births / 1,000 Women |
| 15 to 19 years | 0 (0.0%) | 0.0 |
| 20 to 34 years | 35 (100.0%) | 398.0 |
| 35 to 50 years | 0 (0.0%) | 0.0 |
| Total | 35 (100.0%) | 49.0 |
Fertility by Age by Marriage Status in White City
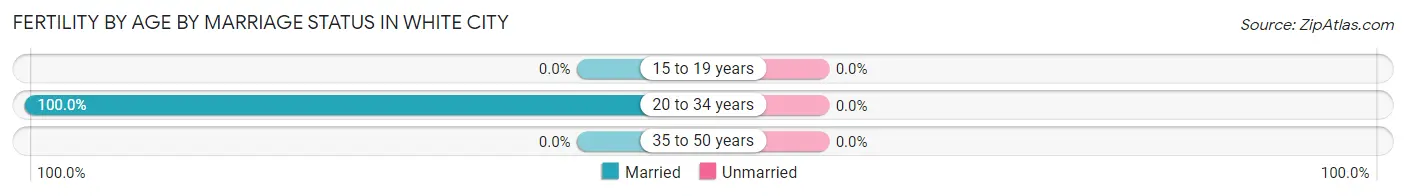
| Age Bracket | Married | Unmarried |
| 15 to 19 years | 0 (0.0%) | 0 (0.0%) |
| 20 to 34 years | 35 (100.0%) | 0 (0.0%) |
| 35 to 50 years | 0 (0.0%) | 0 (0.0%) |
| Total | 35 (100.0%) | 0 (0.0%) |
Fertility by Education in White City
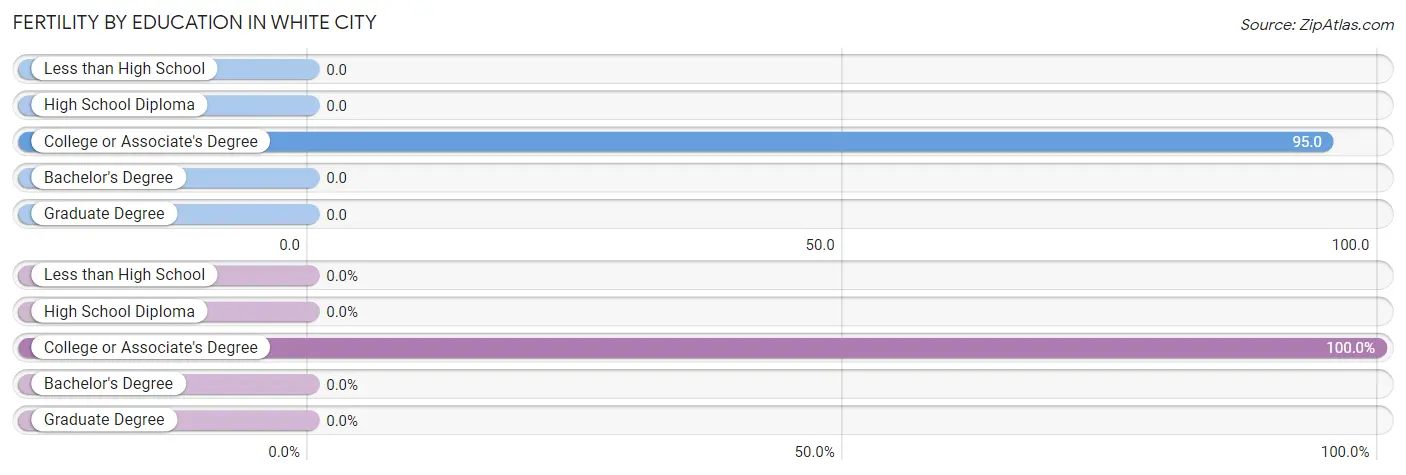
| Educational Attainment | Women with Births | Births / 1,000 Women |
| Less than High School | 0 (0.0%) | 0.0 |
| High School Diploma | 0 (0.0%) | 0.0 |
| College or Associate's Degree | 35 (100.0%) | 95.0 |
| Bachelor's Degree | 0 (0.0%) | 0.0 |
| Graduate Degree | 0 (0.0%) | 0.0 |
| Total | 35 (100.0%) | 49.0 |
Fertility by Education by Marriage Status in White City
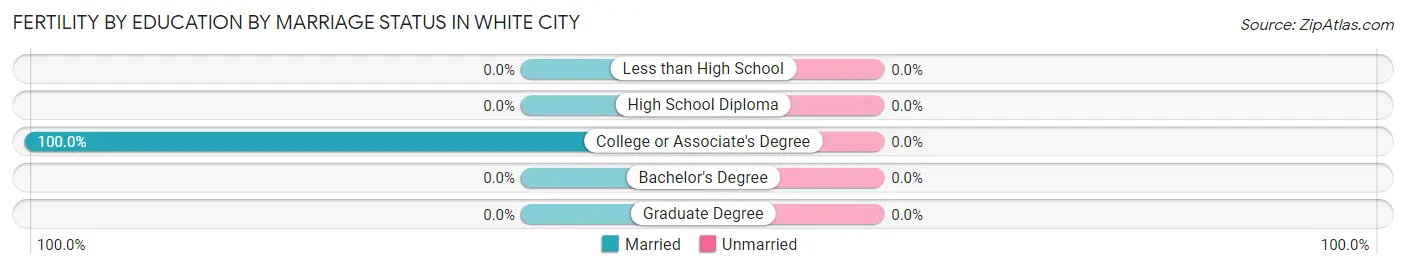
| Educational Attainment | Married | Unmarried |
| Less than High School | 0 (0.0%) | 0 (0.0%) |
| High School Diploma | 0 (0.0%) | 0 (0.0%) |
| College or Associate's Degree | 35 (100.0%) | 0 (0.0%) |
| Bachelor's Degree | 0 (0.0%) | 0 (0.0%) |
| Graduate Degree | 0 (0.0%) | 0 (0.0%) |
| Total | 35 (100.0%) | 0 (0.0%) |
Income in White City
Income Overview in White City
Per Capita Income in White City is $39,562, while median incomes of families and households are $110,884 and $96,932 respectively.
| Characteristic | Number | Measure |
| Per Capita Income | 5,494 | $39,562 |
| Median Family Income | 1,528 | $110,884 |
| Mean Family Income | 1,528 | $119,156 |
| Median Household Income | 1,848 | $96,932 |
| Mean Household Income | 1,848 | $108,395 |
| Income Deficit | 1,528 | $0 |
| Wage / Income Gap (%) | 5,494 | 35.49% |
| Wage / Income Gap ($) | 5,494 | 64.51¢ per $1 |
| Gini / Inequality Index | 5,494 | 0.43 |
Earnings by Sex in White City
Average Earnings in White City are $37,815, $39,679 for men and $25,597 for women, a difference of 35.5%.
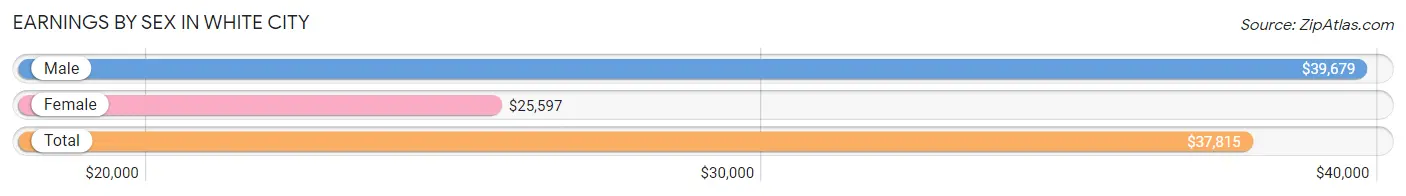
| Sex | Number | Average Earnings |
| Male | 1,515 (57.7%) | $39,679 |
| Female | 1,109 (42.3%) | $25,597 |
| Total | 2,624 (100.0%) | $37,815 |
Earnings by Sex by Income Bracket in White City
The most common earnings brackets in White City are $65,000 to $74,999 for men (275 | 18.1%) and $15,000 to $17,499 for women (376 | 33.9%).
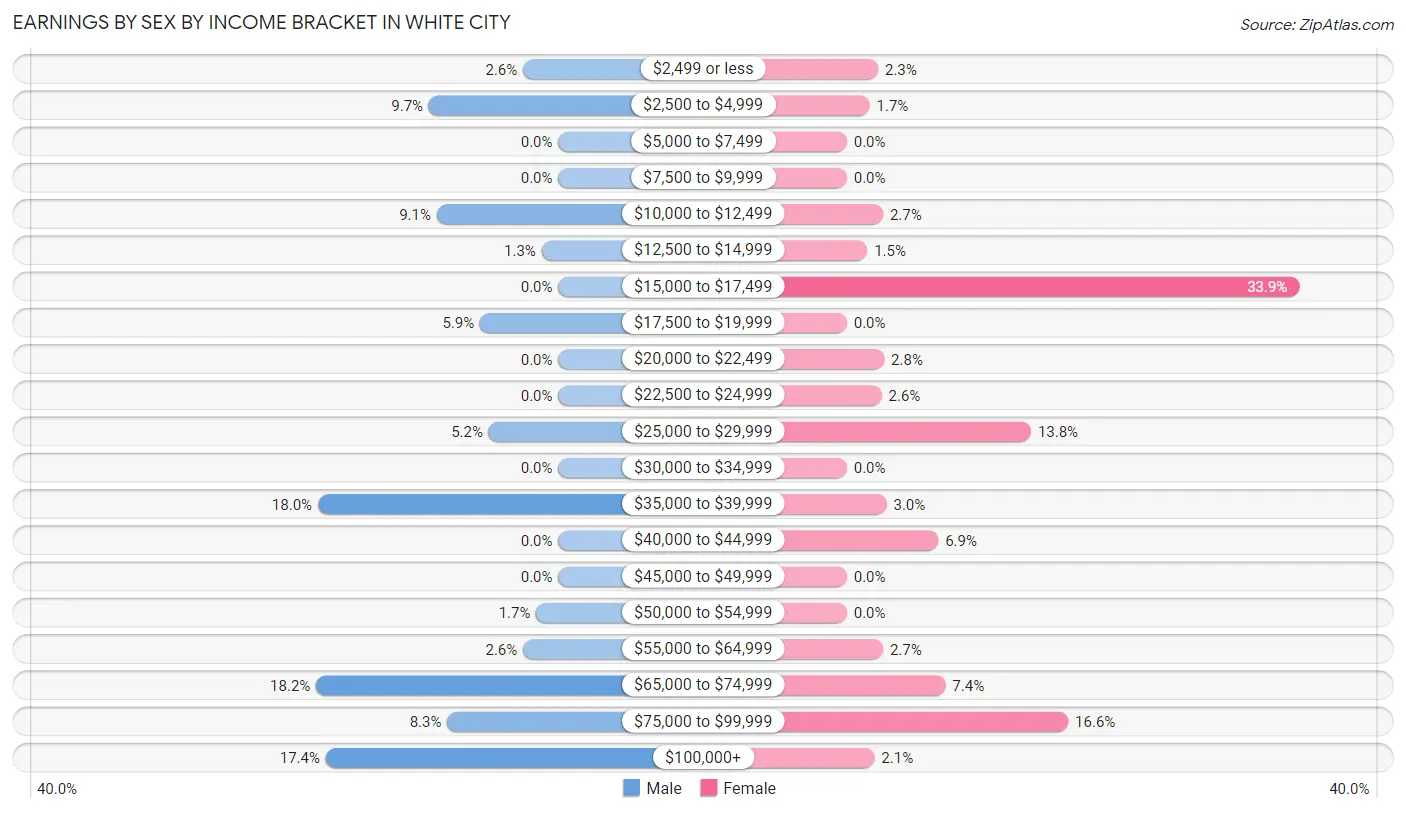
| Income | Male | Female |
| $2,499 or less | 40 (2.6%) | 26 (2.3%) |
| $2,500 to $4,999 | 147 (9.7%) | 19 (1.7%) |
| $5,000 to $7,499 | 0 (0.0%) | 0 (0.0%) |
| $7,500 to $9,999 | 0 (0.0%) | 0 (0.0%) |
| $10,000 to $12,499 | 138 (9.1%) | 30 (2.7%) |
| $12,500 to $14,999 | 19 (1.3%) | 17 (1.5%) |
| $15,000 to $17,499 | 0 (0.0%) | 376 (33.9%) |
| $17,500 to $19,999 | 89 (5.9%) | 0 (0.0%) |
| $20,000 to $22,499 | 0 (0.0%) | 31 (2.8%) |
| $22,500 to $24,999 | 0 (0.0%) | 29 (2.6%) |
| $25,000 to $29,999 | 79 (5.2%) | 153 (13.8%) |
| $30,000 to $34,999 | 0 (0.0%) | 0 (0.0%) |
| $35,000 to $39,999 | 273 (18.0%) | 33 (3.0%) |
| $40,000 to $44,999 | 0 (0.0%) | 76 (6.9%) |
| $45,000 to $49,999 | 0 (0.0%) | 0 (0.0%) |
| $50,000 to $54,999 | 25 (1.7%) | 0 (0.0%) |
| $55,000 to $64,999 | 40 (2.6%) | 30 (2.7%) |
| $65,000 to $74,999 | 275 (18.1%) | 82 (7.4%) |
| $75,000 to $99,999 | 126 (8.3%) | 184 (16.6%) |
| $100,000+ | 264 (17.4%) | 23 (2.1%) |
| Total | 1,515 (100.0%) | 1,109 (100.0%) |
Earnings by Sex by Educational Attainment in White City
Average earnings in White City are $65,842 for men and $25,811 for women, a difference of 60.8%. Men with an educational attainment of high school diploma enjoy the highest average annual earnings of $65,944, while those with high school diploma education earn the least with $65,944. Women with an educational attainment of bachelor's degree earn the most with the average annual earnings of $72,204, while those with high school diploma education have the smallest earnings of $26,622.
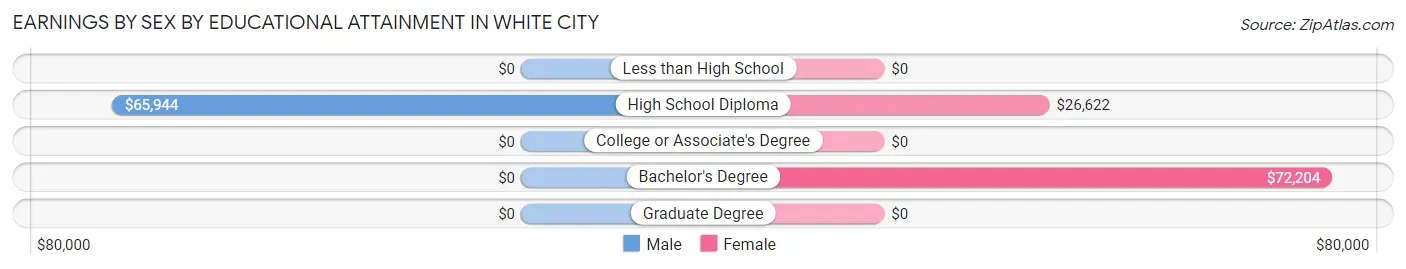
| Educational Attainment | Male Income | Female Income |
| Less than High School | - | - |
| High School Diploma | $65,944 | $26,622 |
| College or Associate's Degree | - | - |
| Bachelor's Degree | - | - |
| Graduate Degree | - | - |
| Total | $65,842 | $25,811 |
Family Income in White City
Family Income Brackets in White City
According to the White City family income data, there are 605 families falling into the $100,000 to $149,999 income range, which is the most common income bracket and makes up 39.6% of all families.
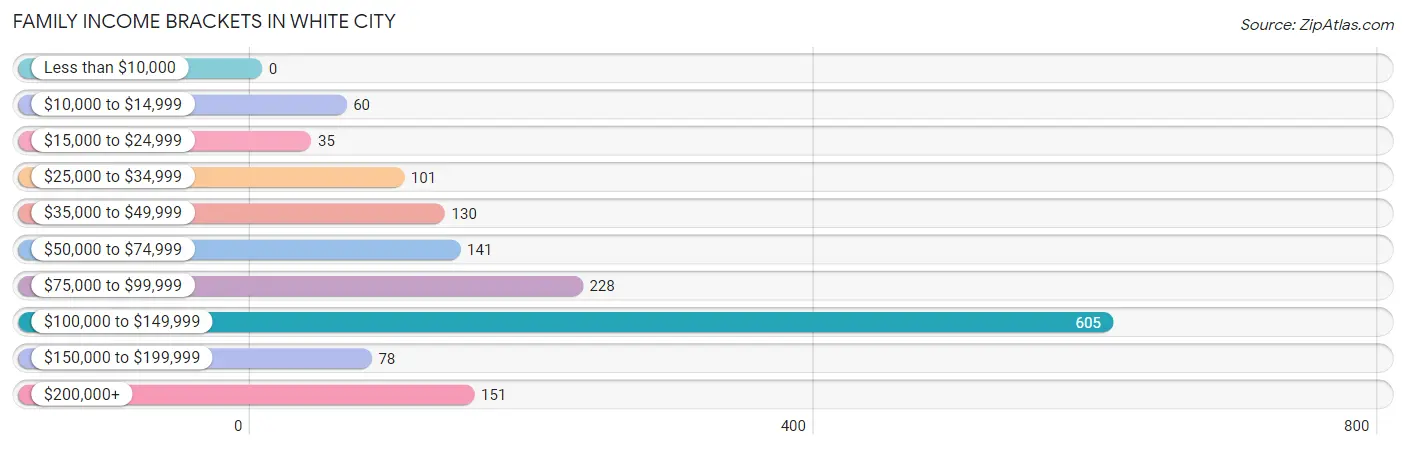
| Income Bracket | # Families | % Families |
| Less than $10,000 | 0 | 0.0% |
| $10,000 to $14,999 | 60 | 3.9% |
| $15,000 to $24,999 | 35 | 2.3% |
| $25,000 to $34,999 | 101 | 6.6% |
| $35,000 to $49,999 | 130 | 8.5% |
| $50,000 to $74,999 | 141 | 9.2% |
| $75,000 to $99,999 | 228 | 14.9% |
| $100,000 to $149,999 | 605 | 39.6% |
| $150,000 to $199,999 | 78 | 5.1% |
| $200,000+ | 151 | 9.9% |
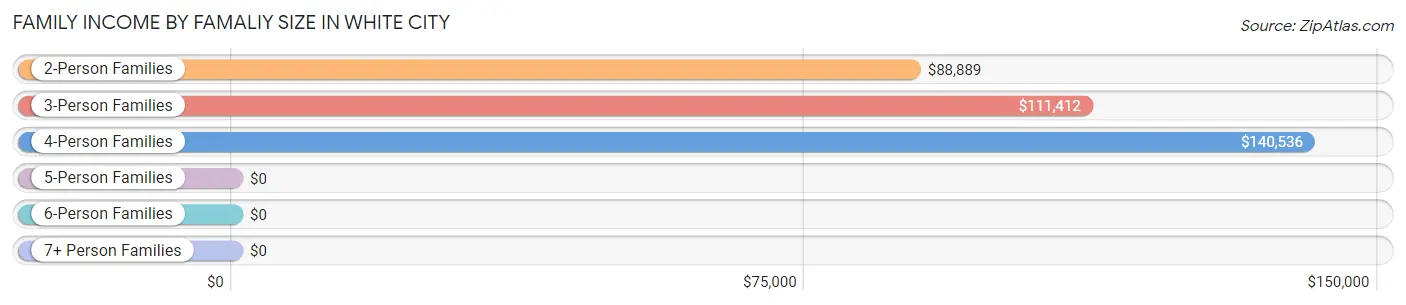
Family Income by Famaliy Size in White City
4-person families (100 | 6.5%) account for the highest median family income in White City with $140,536 per family, while 2-person families (572 | 37.4%) have the highest median income of $44,444 per family member.
| Income Bracket | # Families | Median Income |
| 2-Person Families | 572 (37.4%) | $88,889 |
| 3-Person Families | 763 (49.9%) | $111,412 |
| 4-Person Families | 100 (6.5%) | $140,536 |
| 5-Person Families | 55 (3.6%) | $0 |
| 6-Person Families | 38 (2.5%) | $0 |
| 7+ Person Families | 0 (0.0%) | $0 |
| Total | 1,528 (100.0%) | $110,884 |
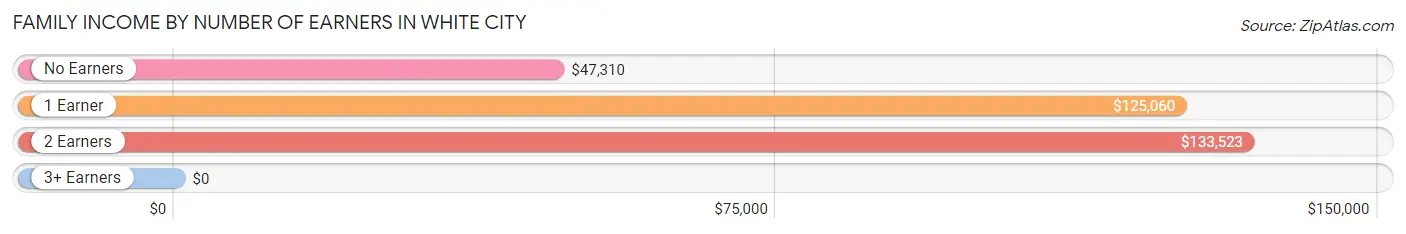
Family Income by Number of Earners in White City
| Number of Earners | # Families | Median Income |
| No Earners | 378 (24.7%) | $47,310 |
| 1 Earner | 571 (37.4%) | $125,060 |
| 2 Earners | 395 (25.9%) | $133,523 |
| 3+ Earners | 184 (12.0%) | $0 |
| Total | 1,528 (100.0%) | $110,884 |
Household Income in White City
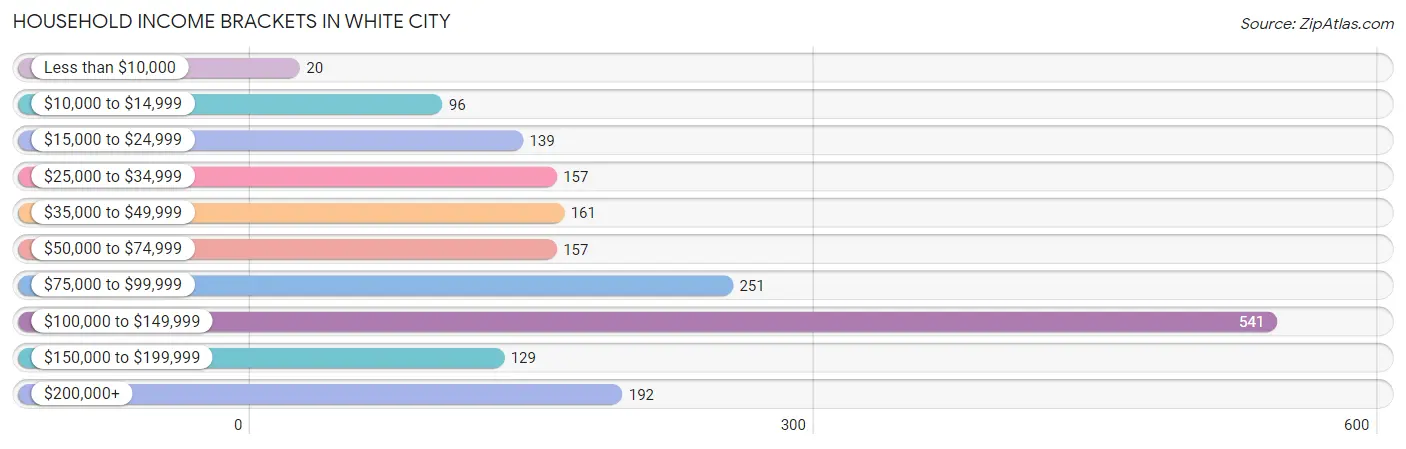
Household Income Brackets in White City
With 541 households falling in the category, the $100,000 to $149,999 income range is the most frequent in White City, accounting for 29.3% of all households. In contrast, only 20 households (1.1%) fall into the less than $10,000 income bracket, making it the least populous group.
| Income Bracket | # Households | % Households |
| Less than $10,000 | 20 | 1.1% |
| $10,000 to $14,999 | 96 | 5.2% |
| $15,000 to $24,999 | 139 | 7.5% |
| $25,000 to $34,999 | 157 | 8.5% |
| $35,000 to $49,999 | 161 | 8.7% |
| $50,000 to $74,999 | 157 | 8.5% |
| $75,000 to $99,999 | 251 | 13.6% |
| $100,000 to $149,999 | 541 | 29.3% |
| $150,000 to $199,999 | 129 | 7.0% |
| $200,000+ | 192 | 10.4% |
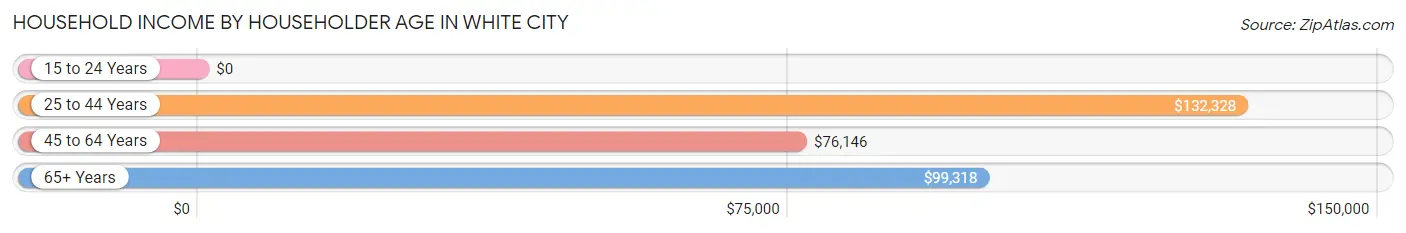
Household Income by Householder Age in White City
The median household income in White City is $96,932, with the highest median household income of $132,328 found in the 25 to 44 years age bracket for the primary householder. A total of 218 households (11.8%) fall into this category. Meanwhile, the 15 to 24 years age bracket for the primary householder has the lowest median household income of $0, with 116 households (6.3%) in this group.
| Income Bracket | # Households | Median Income |
| 15 to 24 Years | 116 (6.3%) | $0 |
| 25 to 44 Years | 218 (11.8%) | $132,328 |
| 45 to 64 Years | 702 (38.0%) | $76,146 |
| 65+ Years | 812 (43.9%) | $99,318 |
| Total | 1,848 (100.0%) | $96,932 |
Poverty in White City
Income Below Poverty by Sex and Age in White City
With 4.6% poverty level for males and 5.1% for females among the residents of White City, 75 year old and over males and 16 and 17 year old females are the most vulnerable to poverty, with 60 males (23.8%) and 19 females (31.7%) in their respective age groups living below the poverty level.
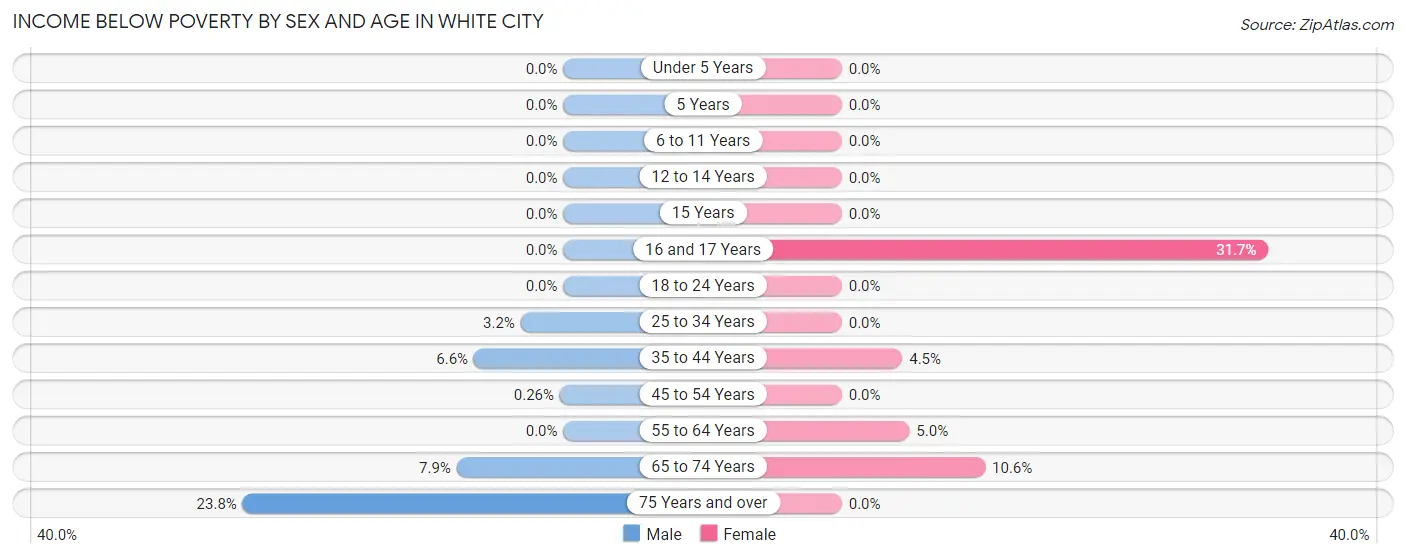
| Age Bracket | Male | Female |
| Under 5 Years | 0 (0.0%) | 0 (0.0%) |
| 5 Years | 0 (0.0%) | 0 (0.0%) |
| 6 to 11 Years | 0 (0.0%) | 0 (0.0%) |
| 12 to 14 Years | 0 (0.0%) | 0 (0.0%) |
| 15 Years | 0 (0.0%) | 0 (0.0%) |
| 16 and 17 Years | 0 (0.0%) | 19 (31.7%) |
| 18 to 24 Years | 0 (0.0%) | 0 (0.0%) |
| 25 to 34 Years | 14 (3.2%) | 0 (0.0%) |
| 35 to 44 Years | 19 (6.6%) | 12 (4.5%) |
| 45 to 54 Years | 1 (0.3%) | 0 (0.0%) |
| 55 to 64 Years | 0 (0.0%) | 16 (5.0%) |
| 65 to 74 Years | 42 (7.9%) | 81 (10.6%) |
| 75 Years and over | 60 (23.8%) | 0 (0.0%) |
| Total | 136 (4.6%) | 128 (5.1%) |
Income Above Poverty by Sex and Age in White City
According to the poverty statistics in White City, males aged under 5 years and females aged under 5 years are the age groups that are most secure financially, with 100.0% of males and 100.0% of females in these age groups living above the poverty line.
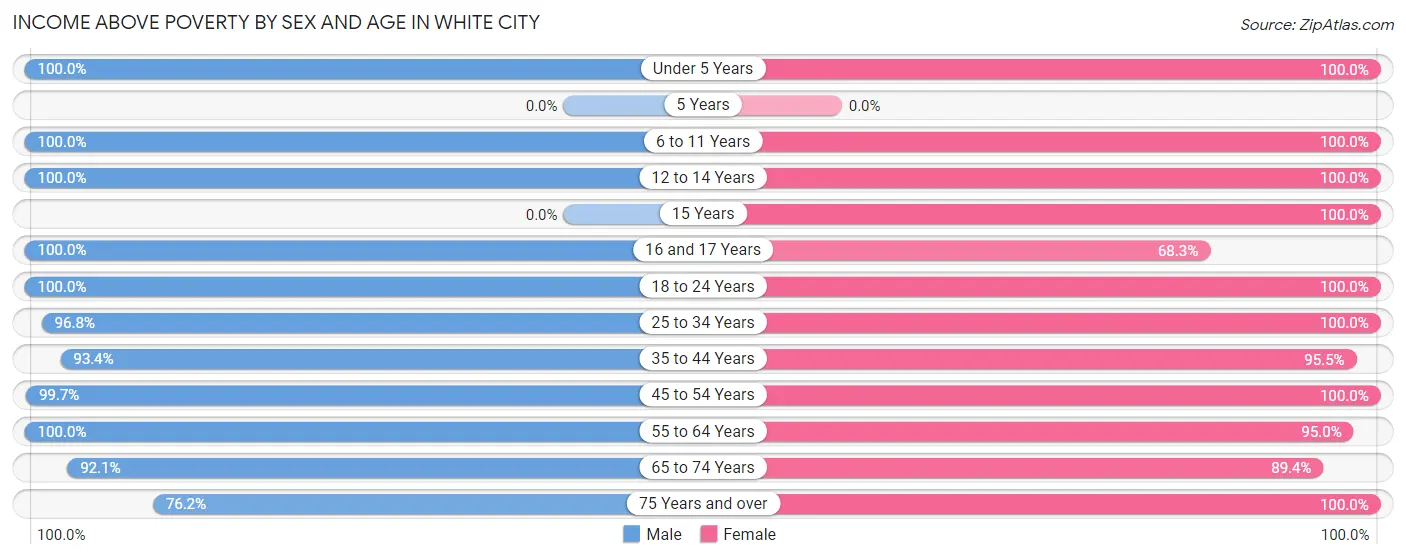
| Age Bracket | Male | Female |
| Under 5 Years | 51 (100.0%) | 144 (100.0%) |
| 5 Years | 0 (0.0%) | 0 (0.0%) |
| 6 to 11 Years | 180 (100.0%) | 31 (100.0%) |
| 12 to 14 Years | 79 (100.0%) | 33 (100.0%) |
| 15 Years | 0 (0.0%) | 15 (100.0%) |
| 16 and 17 Years | 24 (100.0%) | 41 (68.3%) |
| 18 to 24 Years | 313 (100.0%) | 54 (100.0%) |
| 25 to 34 Years | 428 (96.8%) | 67 (100.0%) |
| 35 to 44 Years | 267 (93.4%) | 255 (95.5%) |
| 45 to 54 Years | 384 (99.7%) | 368 (100.0%) |
| 55 to 64 Years | 397 (100.0%) | 303 (95.0%) |
| 65 to 74 Years | 488 (92.1%) | 680 (89.4%) |
| 75 Years and over | 192 (76.2%) | 401 (100.0%) |
| Total | 2,803 (95.4%) | 2,392 (94.9%) |
Income Below Poverty Among Married-Couple Families in White City
The poverty statistics for married-couple families in White City show that 4.8% or 59 of the total 1,219 families live below the poverty line. Families with no children have the highest poverty rate of 6.2%, comprising of 59 families. On the other hand, families with 1 or 2 children have the lowest poverty rate of 0.0%, which includes 0 families.
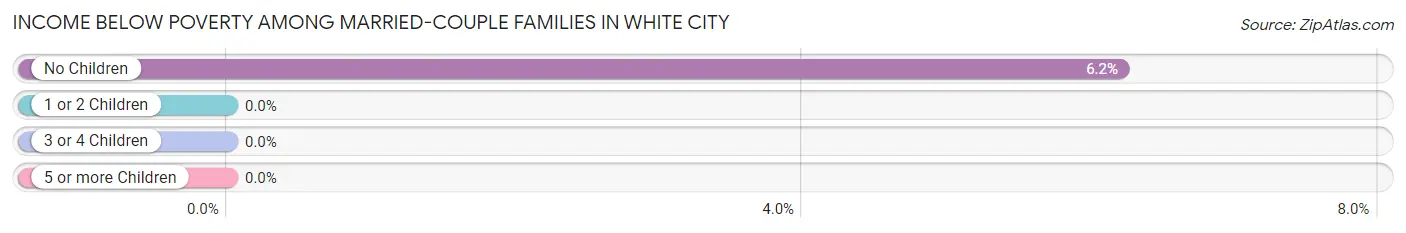
| Children | Above Poverty | Below Poverty |
| No Children | 891 (93.8%) | 59 (6.2%) |
| 1 or 2 Children | 206 (100.0%) | 0 (0.0%) |
| 3 or 4 Children | 63 (100.0%) | 0 (0.0%) |
| 5 or more Children | 0 (0.0%) | 0 (0.0%) |
| Total | 1,160 (95.2%) | 59 (4.8%) |
Income Below Poverty Among Single-Parent Households in White City
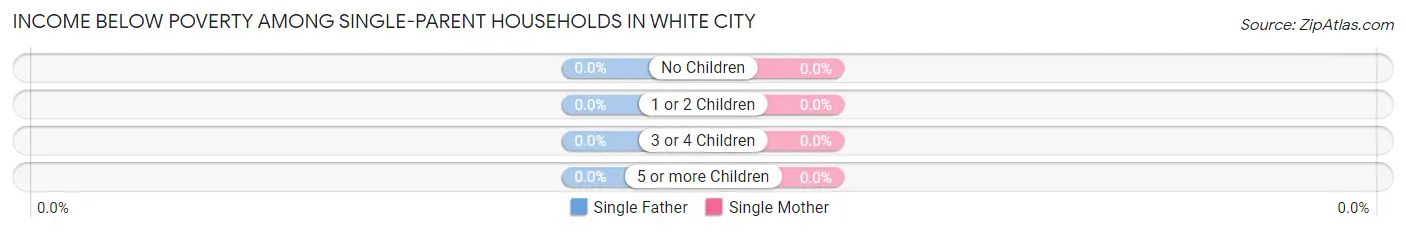
| Children | Single Father | Single Mother |
| No Children | 0 (0.0%) | 0 (0.0%) |
| 1 or 2 Children | 0 (0.0%) | 0 (0.0%) |
| 3 or 4 Children | 0 (0.0%) | 0 (0.0%) |
| 5 or more Children | 0 (0.0%) | 0 (0.0%) |
| Total | 0 (0.0%) | 0 (0.0%) |
Income Below Poverty Among Married-Couple vs Single-Parent Households in White City
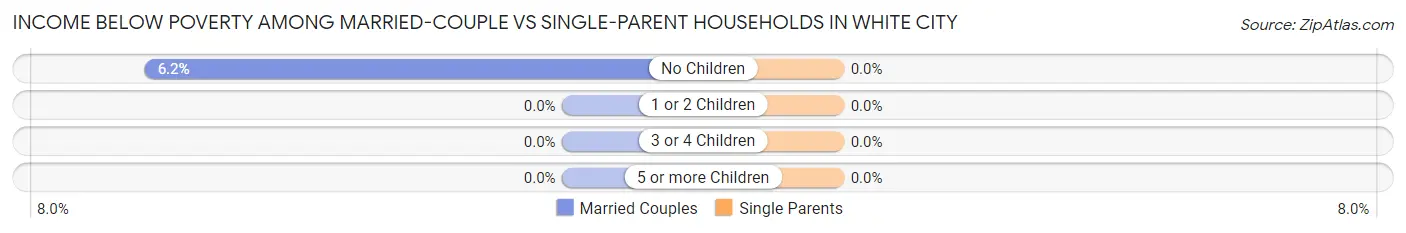
| Children | Married-Couple Families | Single-Parent Households |
| No Children | 59 (6.2%) | 0 (0.0%) |
| 1 or 2 Children | 0 (0.0%) | 0 (0.0%) |
| 3 or 4 Children | 0 (0.0%) | 0 (0.0%) |
| 5 or more Children | 0 (0.0%) | 0 (0.0%) |
| Total | 59 (4.8%) | 0 (0.0%) |
Employment Characteristics in White City
Employment by Class of Employer in White City
Among the 2,447 employed individuals in White City, private company employees (1,429 | 58.4%), self-employed (not incorporated) (444 | 18.1%), and self-employed (incorporated) (240 | 9.8%) make up the most common classes of employment.
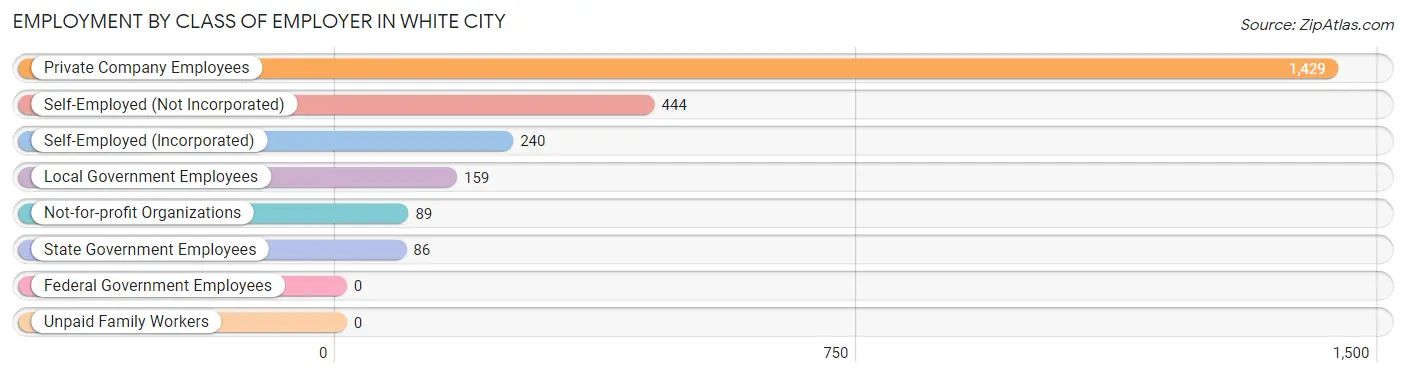
| Employer Class | # Employees | % Employees |
| Private Company Employees | 1,429 | 58.4% |
| Self-Employed (Incorporated) | 240 | 9.8% |
| Self-Employed (Not Incorporated) | 444 | 18.1% |
| Not-for-profit Organizations | 89 | 3.6% |
| Local Government Employees | 159 | 6.5% |
| State Government Employees | 86 | 3.5% |
| Federal Government Employees | 0 | 0.0% |
| Unpaid Family Workers | 0 | 0.0% |
| Total | 2,447 | 100.0% |
Employment Status by Age in White City
According to the labor force statistics for White City, out of the total population over 16 years of age (4,926), 51.9% or 2,557 individuals are in the labor force, with 2.7% or 69 of them unemployed. The age group with the highest labor force participation rate is 45 to 54 years, with 83.1% or 626 individuals in the labor force. Within the labor force, the 16 to 19 years age range has the highest percentage of unemployed individuals, with 78.4% or 69 of them being unemployed.
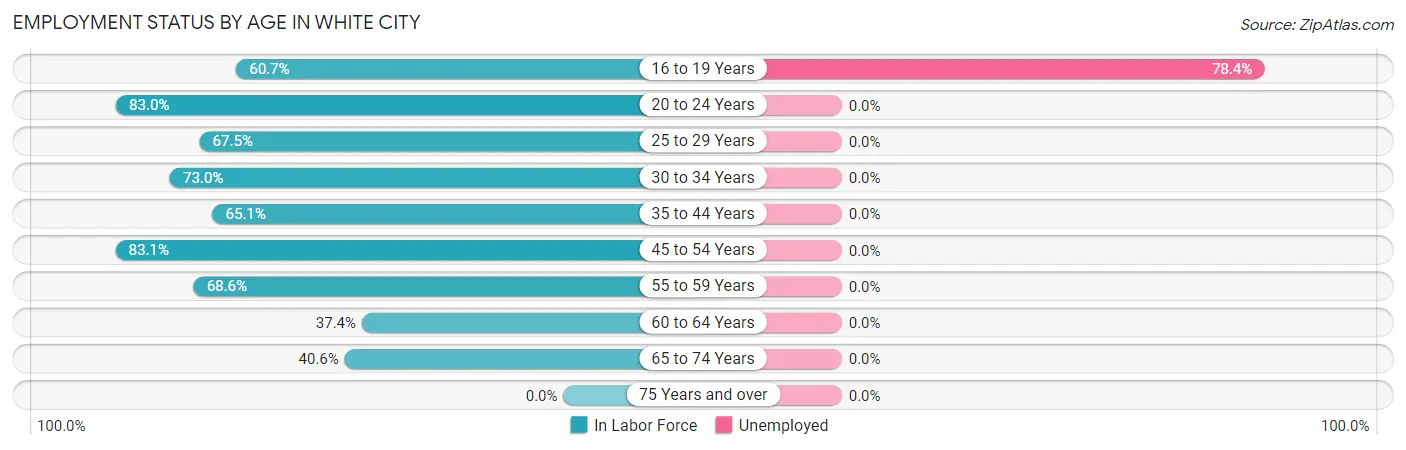
| Age Bracket | In Labor Force | Unemployed |
| 16 to 19 Years | 88 (60.7%) | 69 (78.4%) |
| 20 to 24 Years | 254 (83.0%) | 0 (0.0%) |
| 25 to 29 Years | 251 (67.5%) | 0 (0.0%) |
| 30 to 34 Years | 100 (73.0%) | 0 (0.0%) |
| 35 to 44 Years | 360 (65.1%) | 0 (0.0%) |
| 45 to 54 Years | 626 (83.1%) | 0 (0.0%) |
| 55 to 59 Years | 190 (68.6%) | 0 (0.0%) |
| 60 to 64 Years | 164 (37.4%) | 0 (0.0%) |
| 65 to 74 Years | 524 (40.6%) | 0 (0.0%) |
| 75 Years and over | 0 (0.0%) | 0 (0.0%) |
| Total | 2,557 (51.9%) | 69 (2.7%) |
Employment Status by Educational Attainment in White City
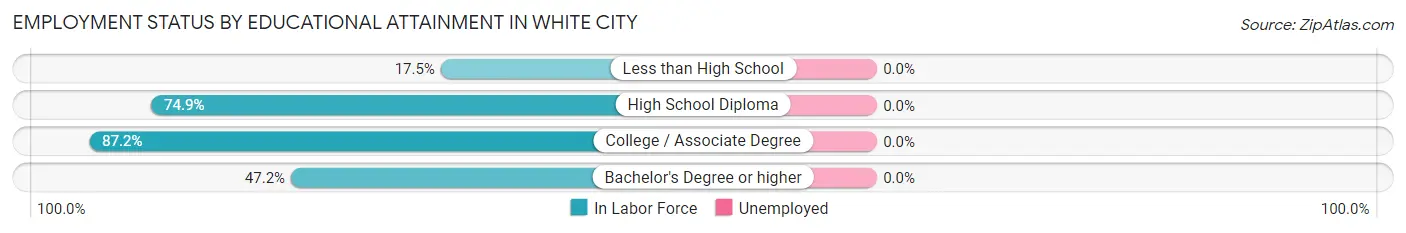
| Educational Attainment | In Labor Force | Unemployed |
| Less than High School | 50 (17.5%) | 0 (0.0%) |
| High School Diploma | 655 (74.9%) | 0 (0.0%) |
| College / Associate Degree | 738 (87.2%) | 0 (0.0%) |
| Bachelor's Degree or higher | 248 (47.2%) | 0 (0.0%) |
| Total | 1,691 (66.8%) | 0 (0.0%) |
Employment Occupations by Sex in White City
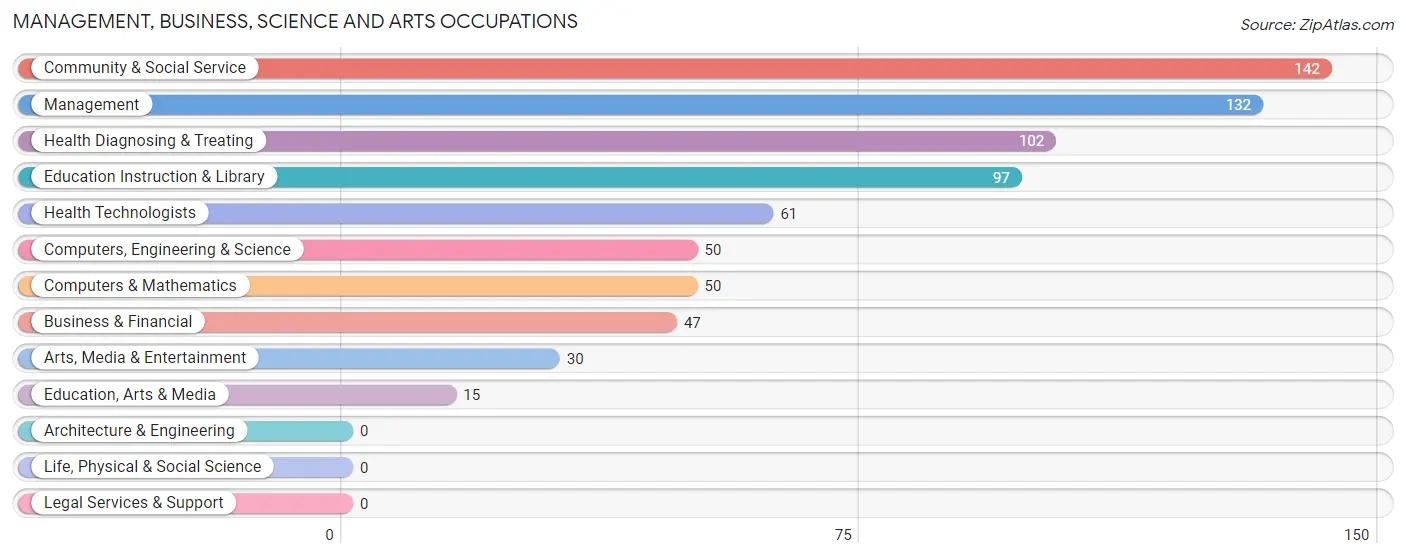
Management, Business, Science and Arts Occupations
The most common Management, Business, Science and Arts occupations in White City are Community & Social Service (142 | 5.7%), Management (132 | 5.3%), Health Diagnosing & Treating (102 | 4.1%), Education Instruction & Library (97 | 3.9%), and Health Technologists (61 | 2.5%).
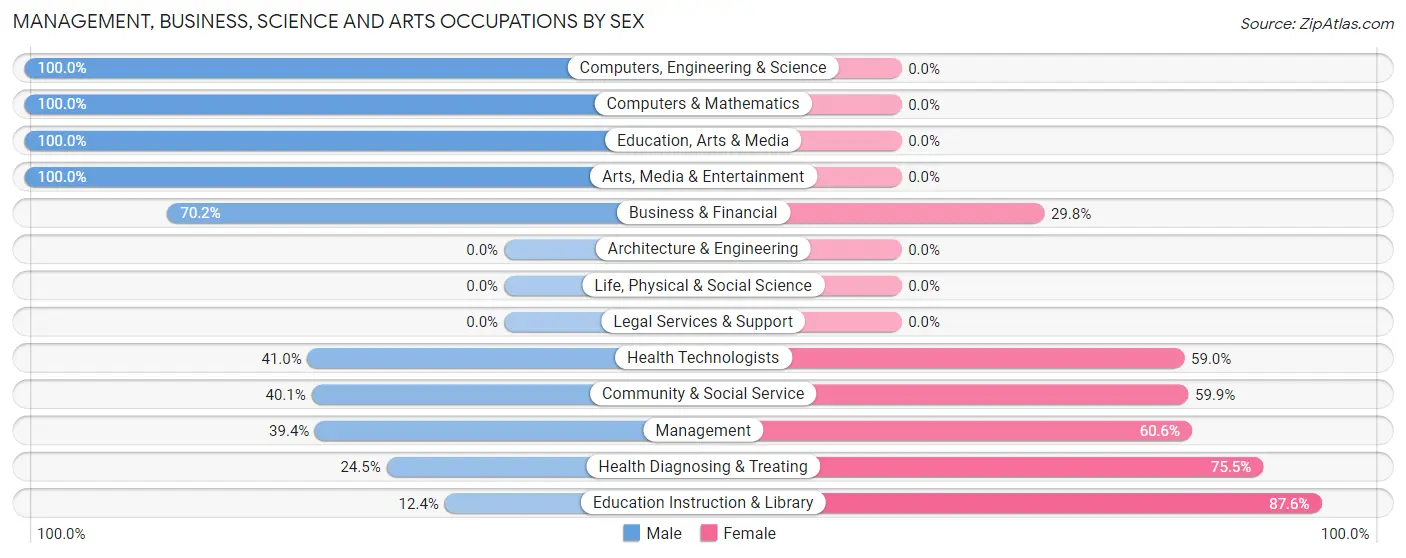
Management, Business, Science and Arts Occupations by Sex
Within the Management, Business, Science and Arts occupations in White City, the most male-oriented occupations are Computers, Engineering & Science (100.0%), Computers & Mathematics (100.0%), and Education, Arts & Media (100.0%), while the most female-oriented occupations are Education Instruction & Library (87.6%), Health Diagnosing & Treating (75.5%), and Management (60.6%).
| Occupation | Male | Female |
| Management | 52 (39.4%) | 80 (60.6%) |
| Business & Financial | 33 (70.2%) | 14 (29.8%) |
| Computers, Engineering & Science | 50 (100.0%) | 0 (0.0%) |
| Computers & Mathematics | 50 (100.0%) | 0 (0.0%) |
| Architecture & Engineering | 0 (0.0%) | 0 (0.0%) |
| Life, Physical & Social Science | 0 (0.0%) | 0 (0.0%) |
| Community & Social Service | 57 (40.1%) | 85 (59.9%) |
| Education, Arts & Media | 15 (100.0%) | 0 (0.0%) |
| Legal Services & Support | 0 (0.0%) | 0 (0.0%) |
| Education Instruction & Library | 12 (12.4%) | 85 (87.6%) |
| Arts, Media & Entertainment | 30 (100.0%) | 0 (0.0%) |
| Health Diagnosing & Treating | 25 (24.5%) | 77 (75.5%) |
| Health Technologists | 25 (41.0%) | 36 (59.0%) |
| Total (Category) | 217 (45.9%) | 256 (54.1%) |
| Total (Overall) | 1,409 (56.6%) | 1,079 (43.4%) |
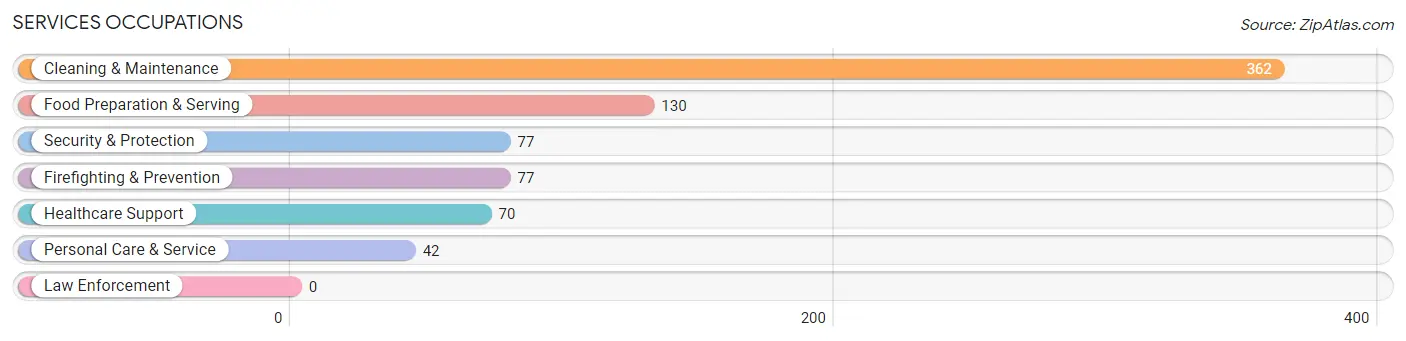
Services Occupations
The most common Services occupations in White City are Cleaning & Maintenance (362 | 14.5%), Food Preparation & Serving (130 | 5.2%), Security & Protection (77 | 3.1%), Firefighting & Prevention (77 | 3.1%), and Healthcare Support (70 | 2.8%).
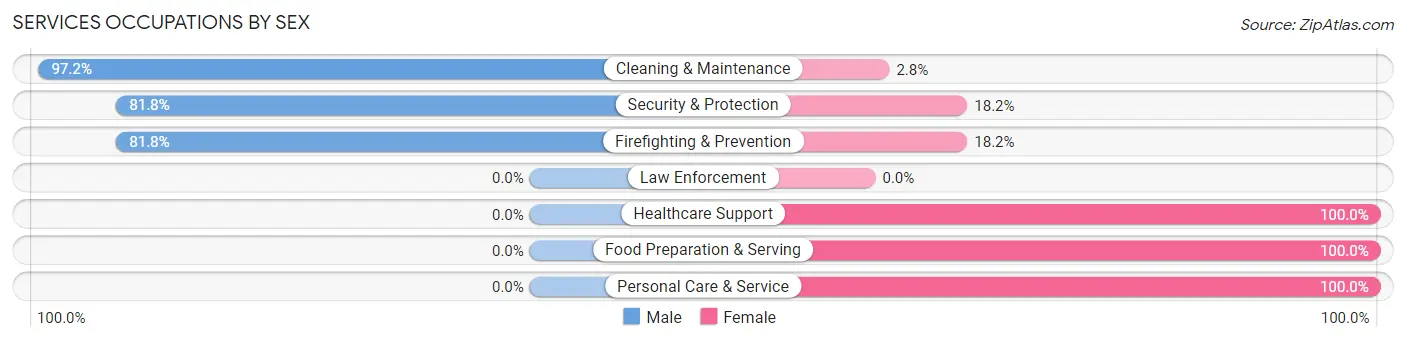
Services Occupations by Sex
Within the Services occupations in White City, the most male-oriented occupations are Cleaning & Maintenance (97.2%), Security & Protection (81.8%), and Firefighting & Prevention (81.8%), while the most female-oriented occupations are Healthcare Support (100.0%), Food Preparation & Serving (100.0%), and Personal Care & Service (100.0%).
| Occupation | Male | Female |
| Healthcare Support | 0 (0.0%) | 70 (100.0%) |
| Security & Protection | 63 (81.8%) | 14 (18.2%) |
| Firefighting & Prevention | 63 (81.8%) | 14 (18.2%) |
| Law Enforcement | 0 (0.0%) | 0 (0.0%) |
| Food Preparation & Serving | 0 (0.0%) | 130 (100.0%) |
| Cleaning & Maintenance | 352 (97.2%) | 10 (2.8%) |
| Personal Care & Service | 0 (0.0%) | 42 (100.0%) |
| Total (Category) | 415 (60.9%) | 266 (39.1%) |
| Total (Overall) | 1,409 (56.6%) | 1,079 (43.4%) |
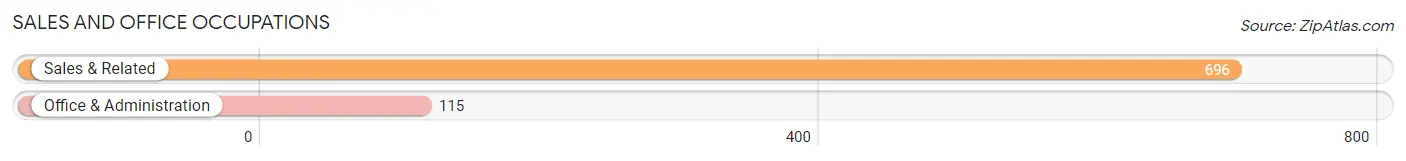
Sales and Office Occupations
The most common Sales and Office occupations in White City are Sales & Related (696 | 28.0%), and Office & Administration (115 | 4.6%).
Sales and Office Occupations by Sex
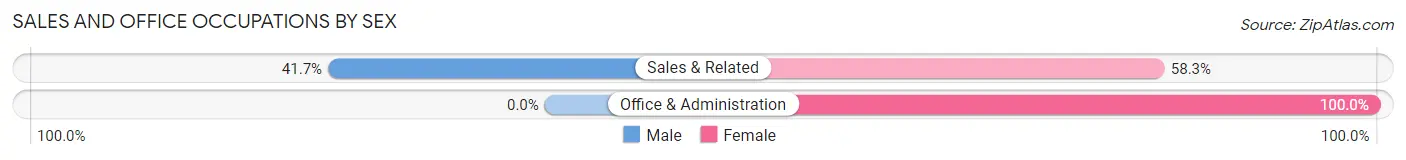
| Occupation | Male | Female |
| Sales & Related | 290 (41.7%) | 406 (58.3%) |
| Office & Administration | 0 (0.0%) | 115 (100.0%) |
| Total (Category) | 290 (35.8%) | 521 (64.2%) |
| Total (Overall) | 1,409 (56.6%) | 1,079 (43.4%) |
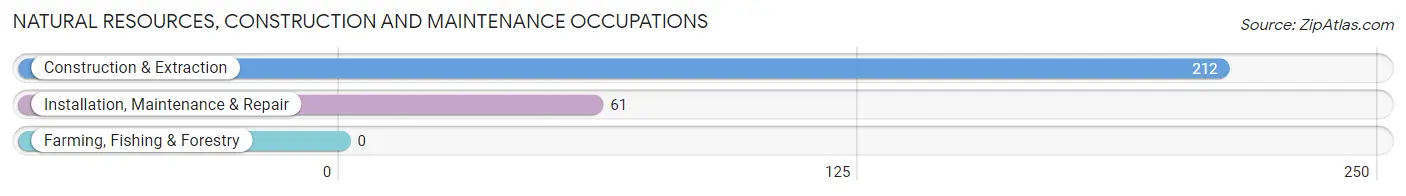
Natural Resources, Construction and Maintenance Occupations
The most common Natural Resources, Construction and Maintenance occupations in White City are Construction & Extraction (212 | 8.5%), and Installation, Maintenance & Repair (61 | 2.5%).
Natural Resources, Construction and Maintenance Occupations by Sex
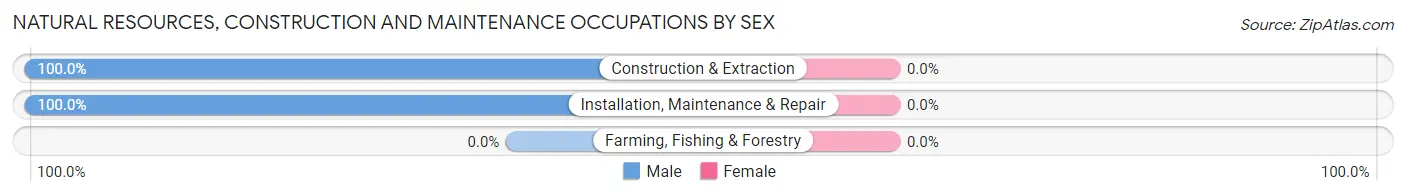
| Occupation | Male | Female |
| Farming, Fishing & Forestry | 0 (0.0%) | 0 (0.0%) |
| Construction & Extraction | 212 (100.0%) | 0 (0.0%) |
| Installation, Maintenance & Repair | 61 (100.0%) | 0 (0.0%) |
| Total (Category) | 273 (100.0%) | 0 (0.0%) |
| Total (Overall) | 1,409 (56.6%) | 1,079 (43.4%) |
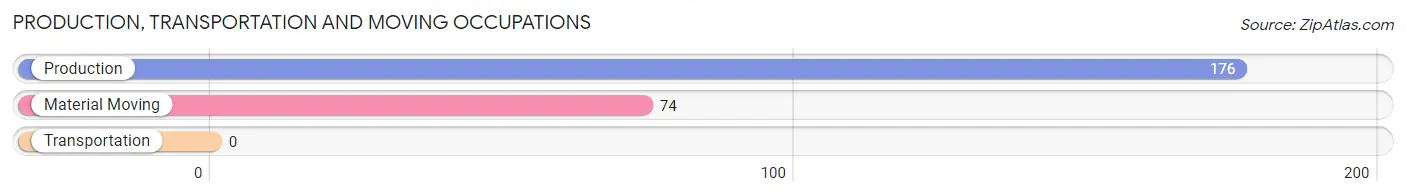
Production, Transportation and Moving Occupations
The most common Production, Transportation and Moving occupations in White City are Production (176 | 7.1%), and Material Moving (74 | 3.0%).
Production, Transportation and Moving Occupations by Sex
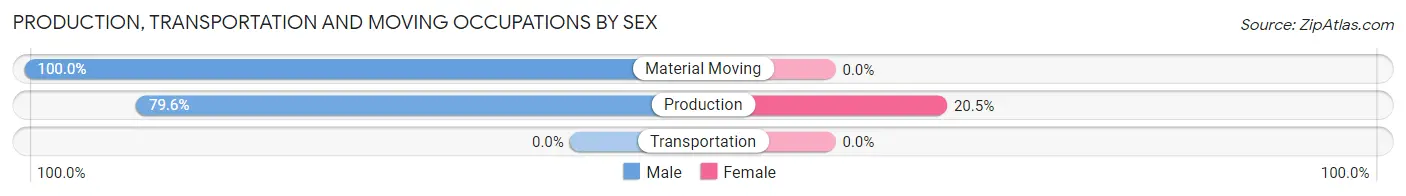
| Occupation | Male | Female |
| Production | 140 (79.5%) | 36 (20.4%) |
| Transportation | 0 (0.0%) | 0 (0.0%) |
| Material Moving | 74 (100.0%) | 0 (0.0%) |
| Total (Category) | 214 (85.6%) | 36 (14.4%) |
| Total (Overall) | 1,409 (56.6%) | 1,079 (43.4%) |
Employment Industries by Sex in White City
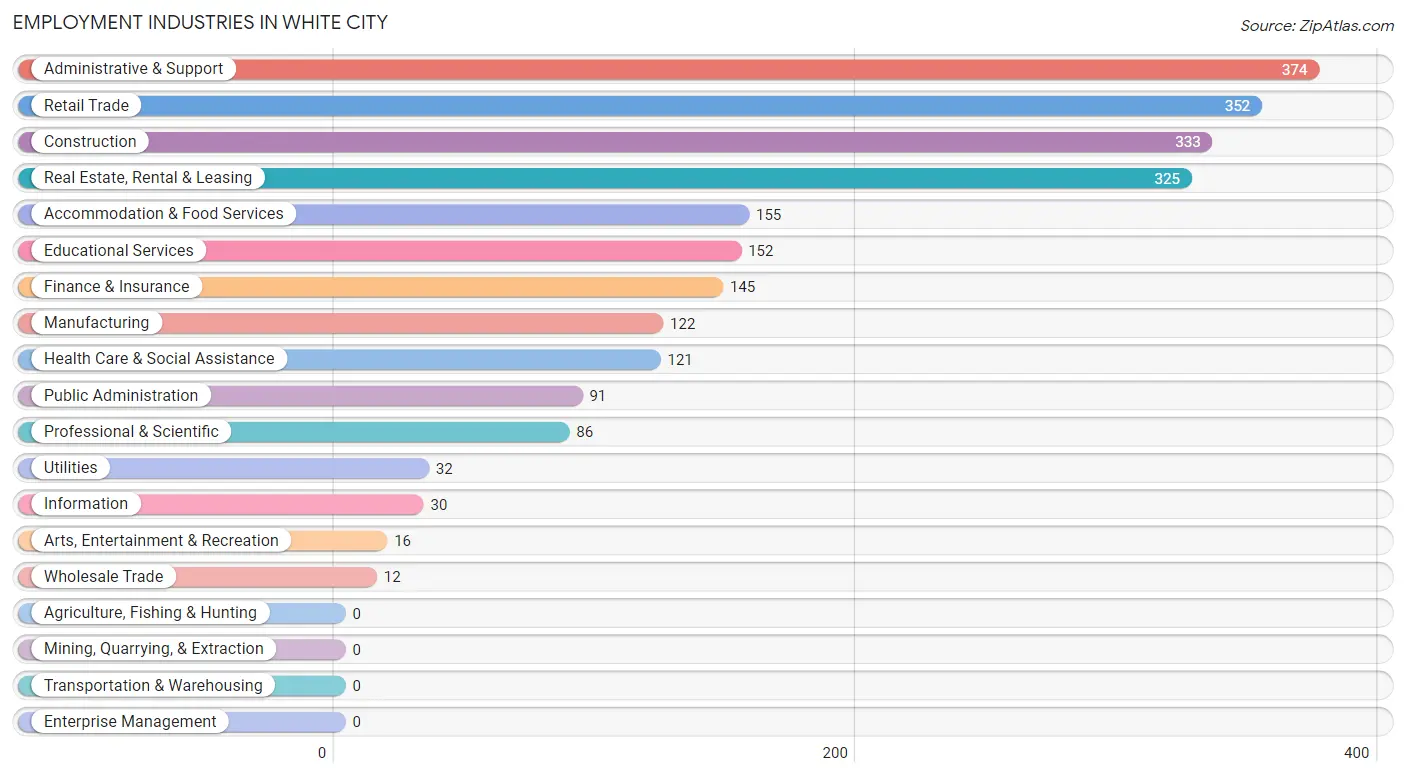
Employment Industries in White City
The major employment industries in White City include Administrative & Support (374 | 15.0%), Retail Trade (352 | 14.1%), Construction (333 | 13.4%), Real Estate, Rental & Leasing (325 | 13.1%), and Accommodation & Food Services (155 | 6.2%).
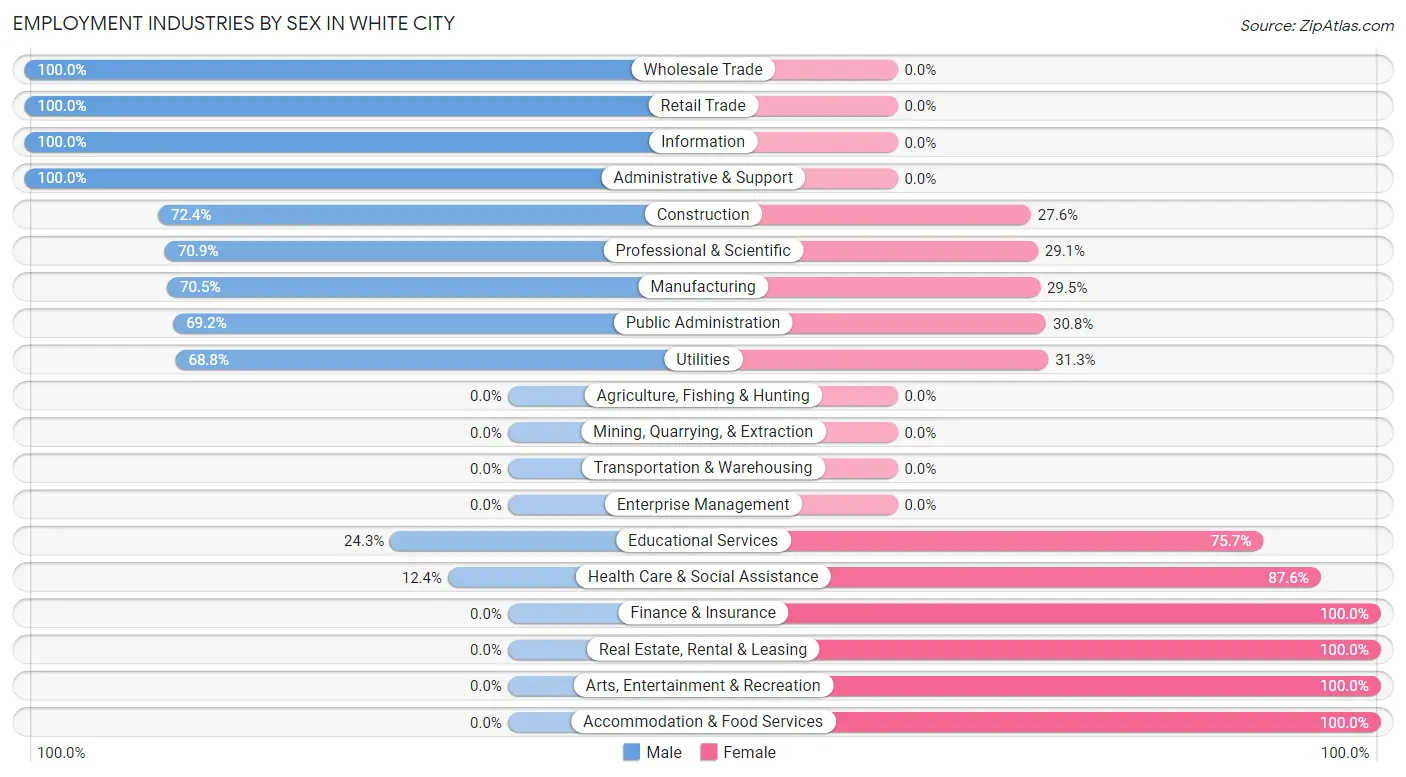
Employment Industries by Sex in White City
The White City industries that see more men than women are Wholesale Trade (100.0%), Retail Trade (100.0%), and Information (100.0%), whereas the industries that tend to have a higher number of women are Finance & Insurance (100.0%), Real Estate, Rental & Leasing (100.0%), and Arts, Entertainment & Recreation (100.0%).
| Industry | Male | Female |
| Agriculture, Fishing & Hunting | 0 (0.0%) | 0 (0.0%) |
| Mining, Quarrying, & Extraction | 0 (0.0%) | 0 (0.0%) |
| Construction | 241 (72.4%) | 92 (27.6%) |
| Manufacturing | 86 (70.5%) | 36 (29.5%) |
| Wholesale Trade | 12 (100.0%) | 0 (0.0%) |
| Retail Trade | 352 (100.0%) | 0 (0.0%) |
| Transportation & Warehousing | 0 (0.0%) | 0 (0.0%) |
| Utilities | 22 (68.8%) | 10 (31.2%) |
| Information | 30 (100.0%) | 0 (0.0%) |
| Finance & Insurance | 0 (0.0%) | 145 (100.0%) |
| Real Estate, Rental & Leasing | 0 (0.0%) | 325 (100.0%) |
| Professional & Scientific | 61 (70.9%) | 25 (29.1%) |
| Enterprise Management | 0 (0.0%) | 0 (0.0%) |
| Administrative & Support | 374 (100.0%) | 0 (0.0%) |
| Educational Services | 37 (24.3%) | 115 (75.7%) |
| Health Care & Social Assistance | 15 (12.4%) | 106 (87.6%) |
| Arts, Entertainment & Recreation | 0 (0.0%) | 16 (100.0%) |
| Accommodation & Food Services | 0 (0.0%) | 155 (100.0%) |
| Public Administration | 63 (69.2%) | 28 (30.8%) |
| Total | 1,409 (56.6%) | 1,079 (43.4%) |
Education in White City
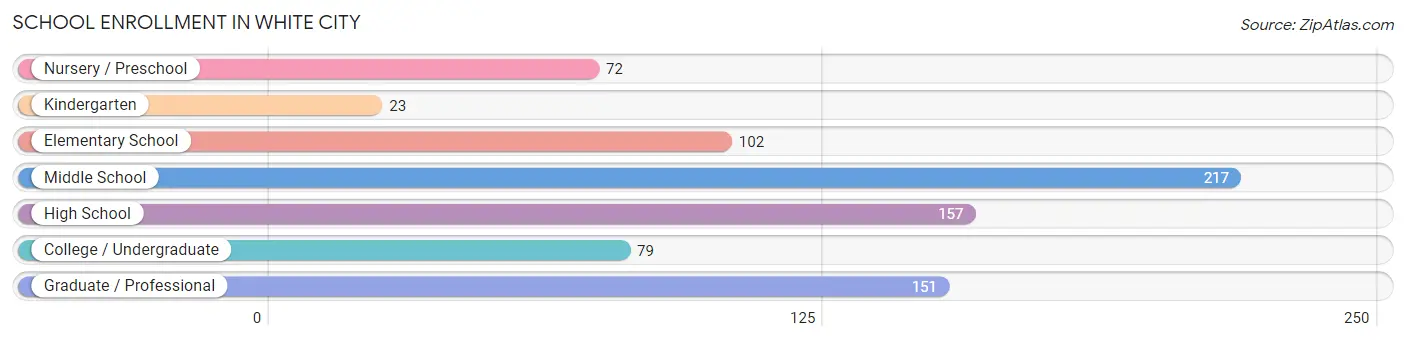
School Enrollment in White City
The most common levels of schooling among the 801 students in White City are middle school (217 | 27.1%), high school (157 | 19.6%), and graduate / professional (151 | 18.9%).
| School Level | # Students | % Students |
| Nursery / Preschool | 72 | 9.0% |
| Kindergarten | 23 | 2.9% |
| Elementary School | 102 | 12.7% |
| Middle School | 217 | 27.1% |
| High School | 157 | 19.6% |
| College / Undergraduate | 79 | 9.9% |
| Graduate / Professional | 151 | 18.9% |
| Total | 801 | 100.0% |
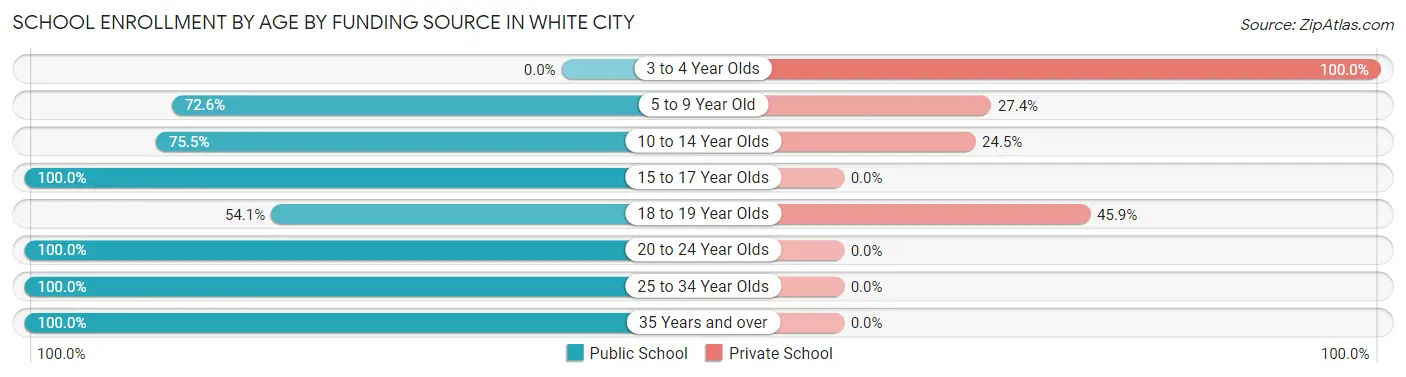
School Enrollment by Age by Funding Source in White City
Out of a total of 801 students who are enrolled in schools in White City, 191 (23.8%) attend a private institution, while the remaining 610 (76.2%) are enrolled in public schools. The age group of 3 to 4 year olds has the highest likelihood of being enrolled in private schools, with 72 (100.0% in the age bracket) enrolled. Conversely, the age group of 15 to 17 year olds has the lowest likelihood of being enrolled in a private school, with 99 (100.0% in the age bracket) attending a public institution.
| Age Bracket | Public School | Private School |
| 3 to 4 Year Olds | 0 (0.0%) | 72 (100.0%) |
| 5 to 9 Year Old | 82 (72.6%) | 31 (27.4%) |
| 10 to 14 Year Olds | 185 (75.5%) | 60 (24.5%) |
| 15 to 17 Year Olds | 99 (100.0%) | 0 (0.0%) |
| 18 to 19 Year Olds | 33 (54.1%) | 28 (45.9%) |
| 20 to 24 Year Olds | 31 (100.0%) | 0 (0.0%) |
| 25 to 34 Year Olds | 133 (100.0%) | 0 (0.0%) |
| 35 Years and over | 47 (100.0%) | 0 (0.0%) |
| Total | 610 (76.2%) | 191 (23.8%) |
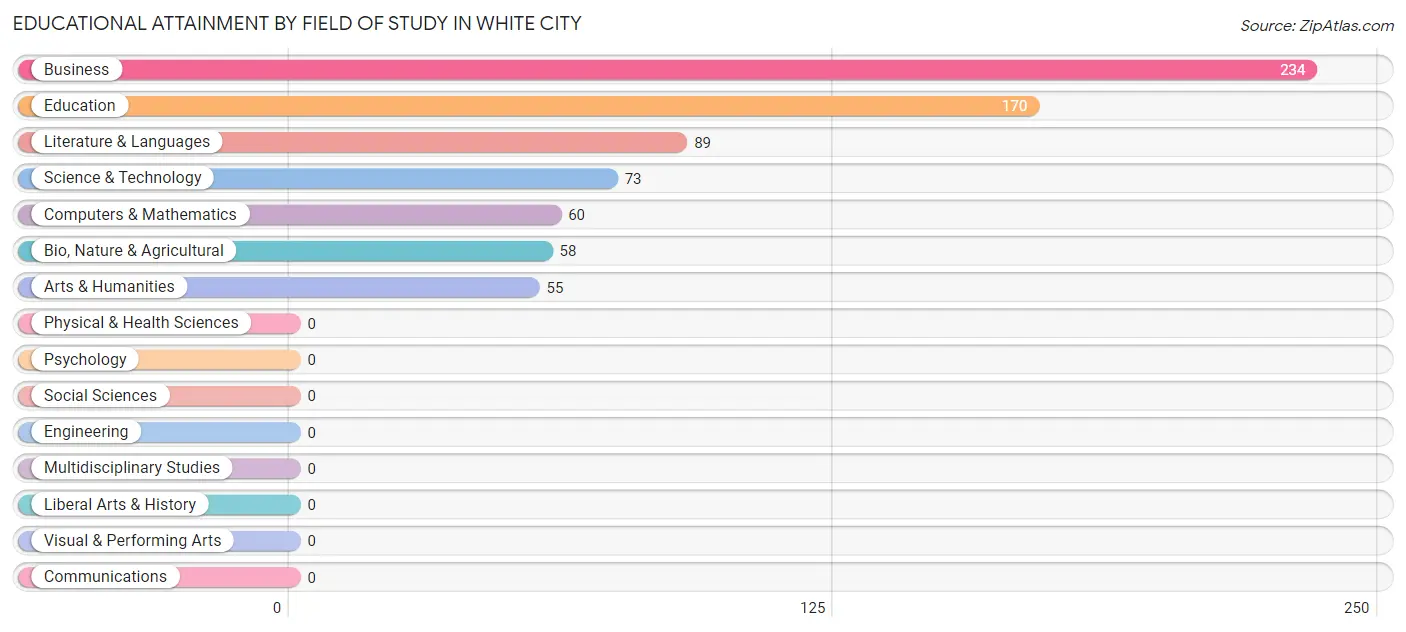
Educational Attainment by Field of Study in White City
Business (234 | 31.7%), education (170 | 23.0%), literature & languages (89 | 12.0%), science & technology (73 | 9.9%), and computers & mathematics (60 | 8.1%) are the most common fields of study among 739 individuals in White City who have obtained a bachelor's degree or higher.
| Field of Study | # Graduates | % Graduates |
| Computers & Mathematics | 60 | 8.1% |
| Bio, Nature & Agricultural | 58 | 7.9% |
| Physical & Health Sciences | 0 | 0.0% |
| Psychology | 0 | 0.0% |
| Social Sciences | 0 | 0.0% |
| Engineering | 0 | 0.0% |
| Multidisciplinary Studies | 0 | 0.0% |
| Science & Technology | 73 | 9.9% |
| Business | 234 | 31.7% |
| Education | 170 | 23.0% |
| Literature & Languages | 89 | 12.0% |
| Liberal Arts & History | 0 | 0.0% |
| Visual & Performing Arts | 0 | 0.0% |
| Communications | 0 | 0.0% |
| Arts & Humanities | 55 | 7.4% |
| Total | 739 | 100.0% |
Transportation & Commute in White City
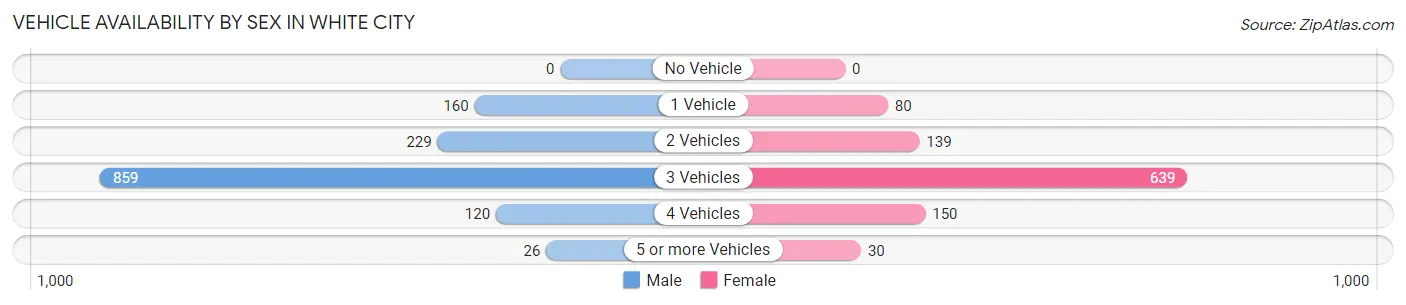
Vehicle Availability by Sex in White City
The most prevalent vehicle ownership categories in White City are males with 3 vehicles (859, accounting for 61.6%) and females with 3 vehicles (639, making up 82.8%).
| Vehicles Available | Male | Female |
| No Vehicle | 0 (0.0%) | 0 (0.0%) |
| 1 Vehicle | 160 (11.5%) | 80 (7.7%) |
| 2 Vehicles | 229 (16.4%) | 139 (13.4%) |
| 3 Vehicles | 859 (61.6%) | 639 (61.6%) |
| 4 Vehicles | 120 (8.6%) | 150 (14.4%) |
| 5 or more Vehicles | 26 (1.9%) | 30 (2.9%) |
| Total | 1,394 (100.0%) | 1,038 (100.0%) |
Commute Time in White City
The most frequently occuring commute durations in White City are 20 to 24 minutes (368 commuters, 19.9%), 30 to 34 minutes (337 commuters, 18.2%), and 10 to 14 minutes (329 commuters, 17.7%).
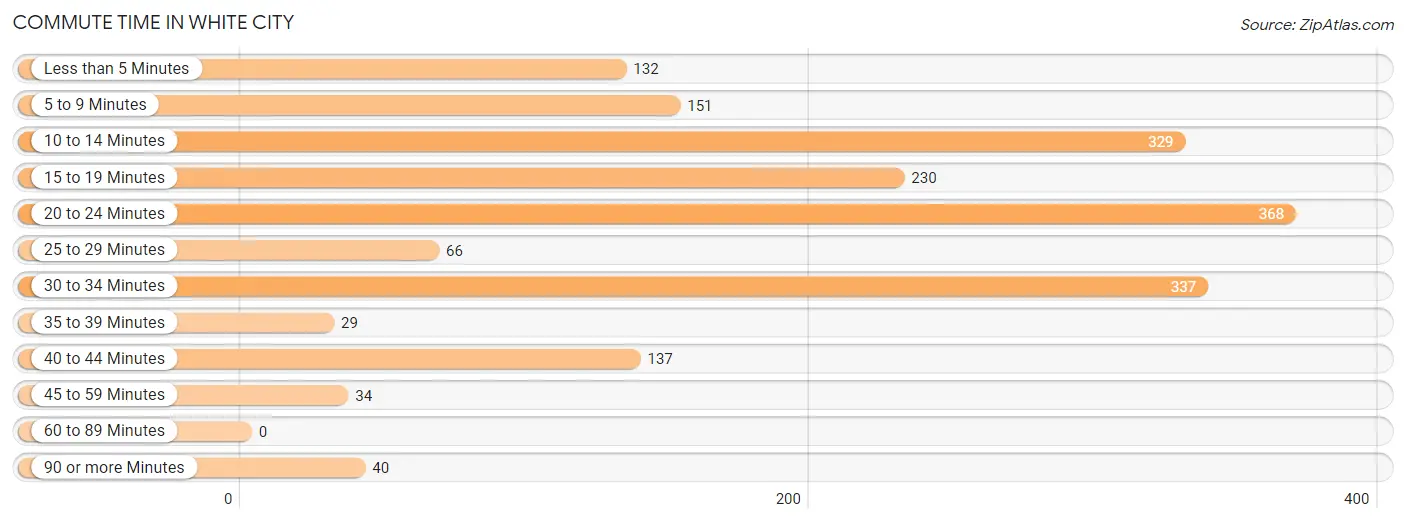
| Commute Time | # Commuters | % Commuters |
| Less than 5 Minutes | 132 | 7.1% |
| 5 to 9 Minutes | 151 | 8.2% |
| 10 to 14 Minutes | 329 | 17.7% |
| 15 to 19 Minutes | 230 | 12.4% |
| 20 to 24 Minutes | 368 | 19.9% |
| 25 to 29 Minutes | 66 | 3.6% |
| 30 to 34 Minutes | 337 | 18.2% |
| 35 to 39 Minutes | 29 | 1.6% |
| 40 to 44 Minutes | 137 | 7.4% |
| 45 to 59 Minutes | 34 | 1.8% |
| 60 to 89 Minutes | 0 | 0.0% |
| 90 or more Minutes | 40 | 2.2% |
Commute Time by Sex in White City
The most common commute times in White City are 20 to 24 minutes (368 commuters, 28.9%) for males and 15 to 19 minutes (139 commuters, 23.9%) for females.
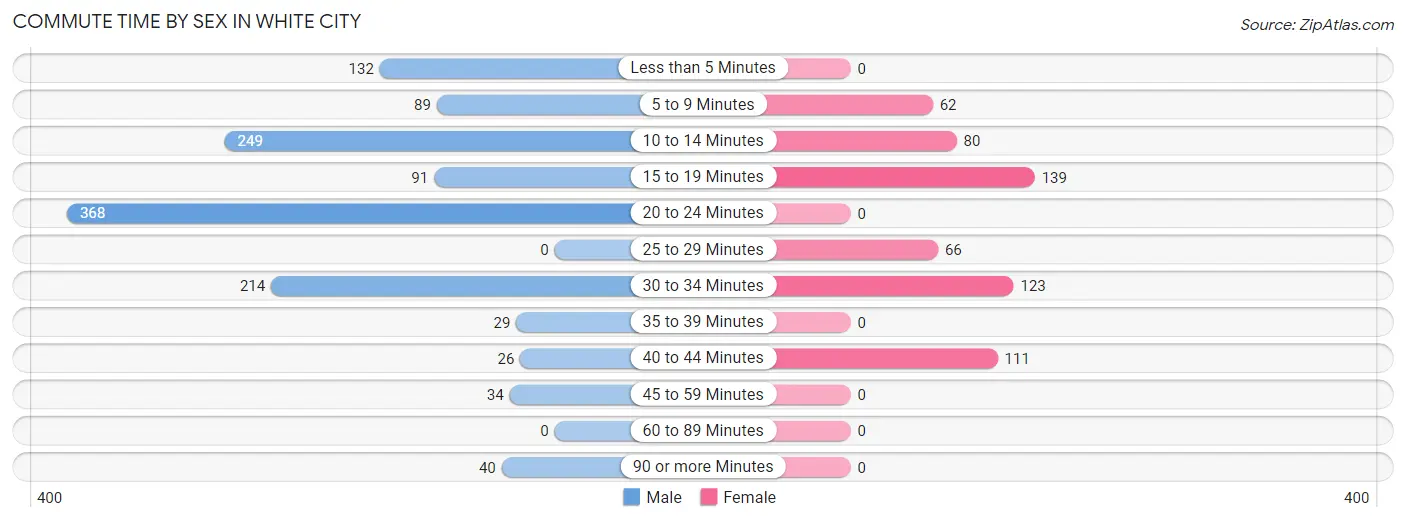
| Commute Time | Male | Female |
| Less than 5 Minutes | 132 (10.4%) | 0 (0.0%) |
| 5 to 9 Minutes | 89 (7.0%) | 62 (10.7%) |
| 10 to 14 Minutes | 249 (19.6%) | 80 (13.8%) |
| 15 to 19 Minutes | 91 (7.1%) | 139 (23.9%) |
| 20 to 24 Minutes | 368 (28.9%) | 0 (0.0%) |
| 25 to 29 Minutes | 0 (0.0%) | 66 (11.4%) |
| 30 to 34 Minutes | 214 (16.8%) | 123 (21.2%) |
| 35 to 39 Minutes | 29 (2.3%) | 0 (0.0%) |
| 40 to 44 Minutes | 26 (2.0%) | 111 (19.1%) |
| 45 to 59 Minutes | 34 (2.7%) | 0 (0.0%) |
| 60 to 89 Minutes | 0 (0.0%) | 0 (0.0%) |
| 90 or more Minutes | 40 (3.1%) | 0 (0.0%) |
Time of Departure to Work by Sex in White City
The most frequent times of departure to work in White City are 7:00 AM to 7:29 AM (523, 41.1%) for males and 8:00 AM to 8:29 AM (166, 28.6%) for females.
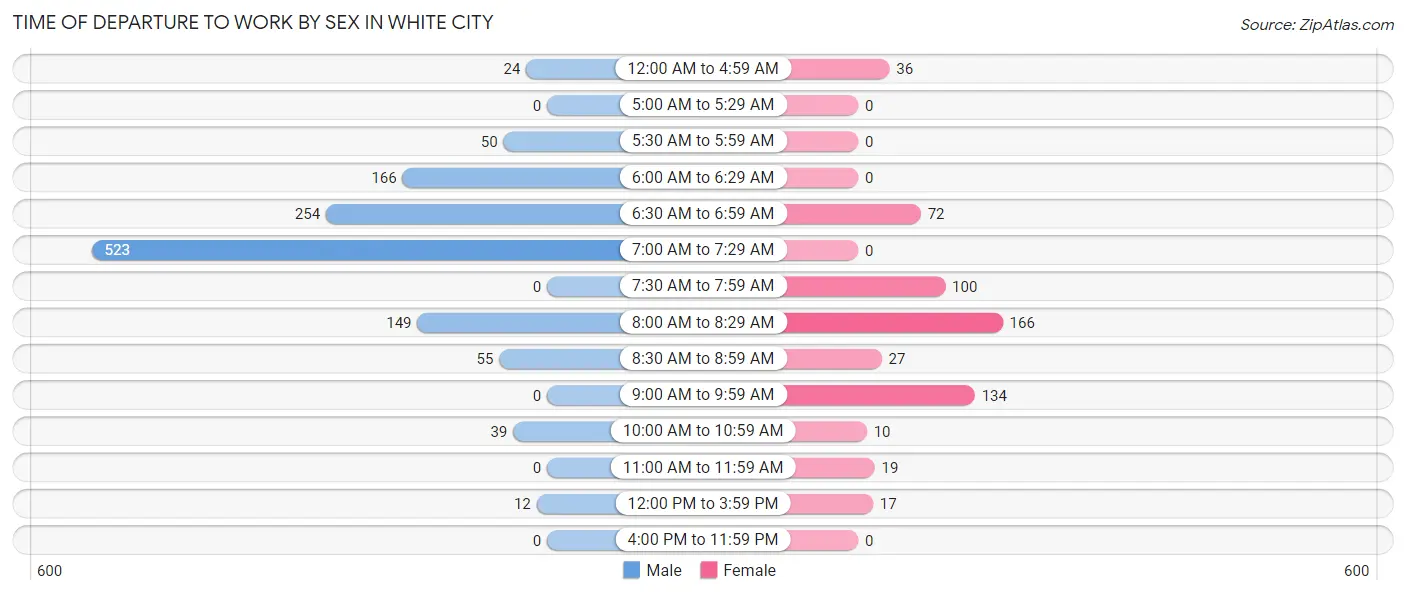
| Time of Departure | Male | Female |
| 12:00 AM to 4:59 AM | 24 (1.9%) | 36 (6.2%) |
| 5:00 AM to 5:29 AM | 0 (0.0%) | 0 (0.0%) |
| 5:30 AM to 5:59 AM | 50 (3.9%) | 0 (0.0%) |
| 6:00 AM to 6:29 AM | 166 (13.1%) | 0 (0.0%) |
| 6:30 AM to 6:59 AM | 254 (20.0%) | 72 (12.4%) |
| 7:00 AM to 7:29 AM | 523 (41.1%) | 0 (0.0%) |
| 7:30 AM to 7:59 AM | 0 (0.0%) | 100 (17.2%) |
| 8:00 AM to 8:29 AM | 149 (11.7%) | 166 (28.6%) |
| 8:30 AM to 8:59 AM | 55 (4.3%) | 27 (4.6%) |
| 9:00 AM to 9:59 AM | 0 (0.0%) | 134 (23.1%) |
| 10:00 AM to 10:59 AM | 39 (3.1%) | 10 (1.7%) |
| 11:00 AM to 11:59 AM | 0 (0.0%) | 19 (3.3%) |
| 12:00 PM to 3:59 PM | 12 (0.9%) | 17 (2.9%) |
| 4:00 PM to 11:59 PM | 0 (0.0%) | 0 (0.0%) |
| Total | 1,272 (100.0%) | 581 (100.0%) |
Housing Occupancy in White City
Occupancy by Ownership in White City
Of the total 1,848 dwellings in White City, owner-occupied units account for 1,703 (92.1%), while renter-occupied units make up 145 (7.9%).
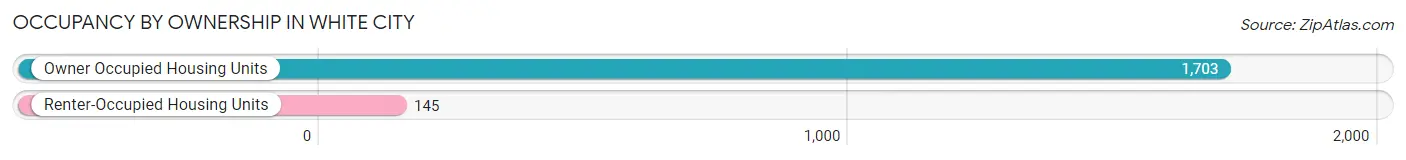
| Occupancy | # Housing Units | % Housing Units |
| Owner Occupied Housing Units | 1,703 | 92.1% |
| Renter-Occupied Housing Units | 145 | 7.9% |
| Total Occupied Housing Units | 1,848 | 100.0% |
Occupancy by Household Size in White City
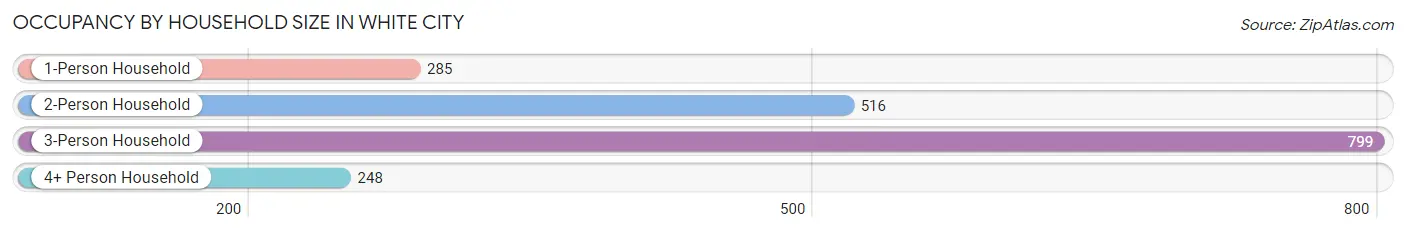
| Household Size | # Housing Units | % Housing Units |
| 1-Person Household | 285 | 15.4% |
| 2-Person Household | 516 | 27.9% |
| 3-Person Household | 799 | 43.2% |
| 4+ Person Household | 248 | 13.4% |
| Total Housing Units | 1,848 | 100.0% |
Occupancy by Ownership by Household Size in White City
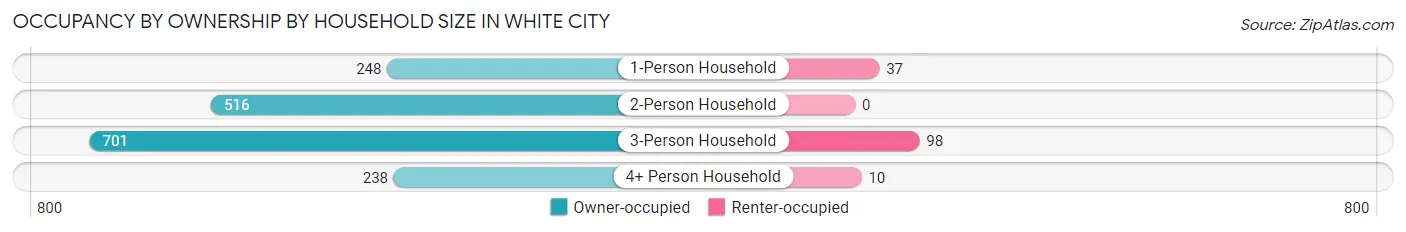
| Household Size | Owner-occupied | Renter-occupied |
| 1-Person Household | 248 (87.0%) | 37 (13.0%) |
| 2-Person Household | 516 (100.0%) | 0 (0.0%) |
| 3-Person Household | 701 (87.7%) | 98 (12.3%) |
| 4+ Person Household | 238 (96.0%) | 10 (4.0%) |
| Total Housing Units | 1,703 (92.1%) | 145 (7.9%) |
Occupancy by Educational Attainment in White City
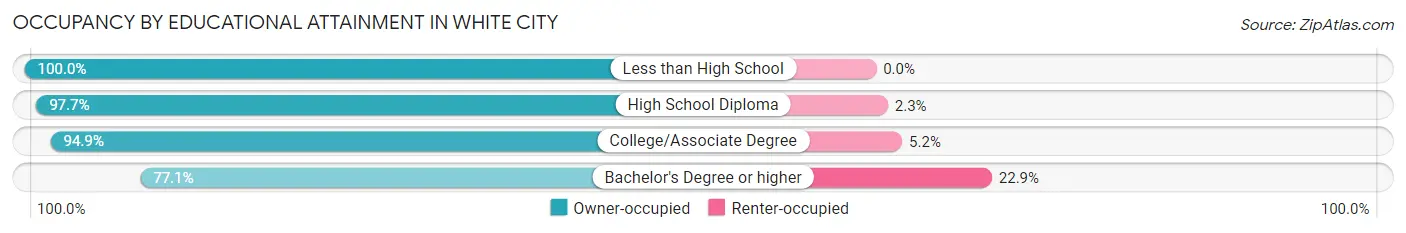
| Household Size | Owner-occupied | Renter-occupied |
| Less than High School | 133 (100.0%) | 0 (0.0%) |
| High School Diploma | 423 (97.7%) | 10 (2.3%) |
| College/Associate Degree | 848 (94.9%) | 46 (5.1%) |
| Bachelor's Degree or higher | 299 (77.1%) | 89 (22.9%) |
Occupancy by Age of Householder in White City
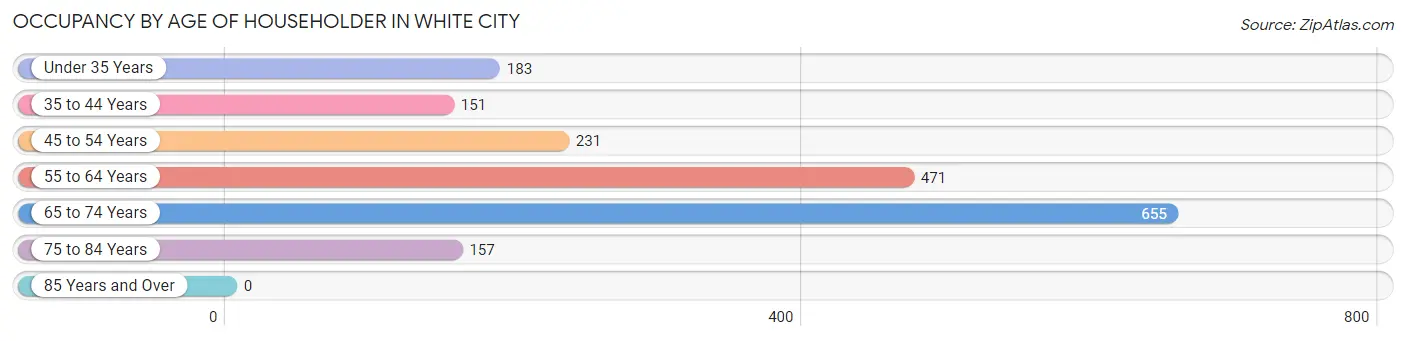
| Age Bracket | # Households | % Households |
| Under 35 Years | 183 | 9.9% |
| 35 to 44 Years | 151 | 8.2% |
| 45 to 54 Years | 231 | 12.5% |
| 55 to 64 Years | 471 | 25.5% |
| 65 to 74 Years | 655 | 35.4% |
| 75 to 84 Years | 157 | 8.5% |
| 85 Years and Over | 0 | 0.0% |
| Total | 1,848 | 100.0% |
Housing Finances in White City
Median Income by Occupancy in White City
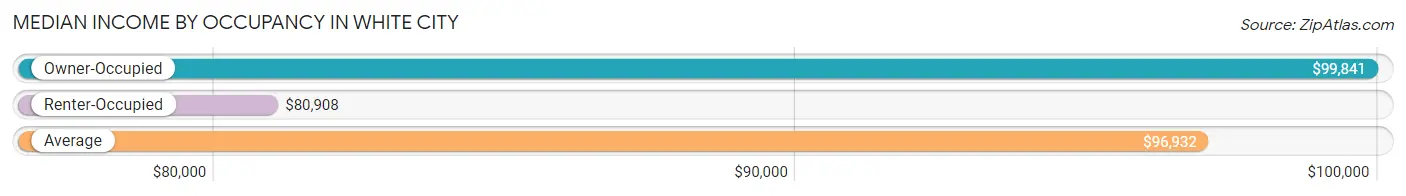
| Occupancy Type | # Households | Median Income |
| Owner-Occupied | 1,703 (92.1%) | $99,841 |
| Renter-Occupied | 145 (7.9%) | $80,908 |
| Average | 1,848 (100.0%) | $96,932 |
Occupancy by Householder Income Bracket in White City
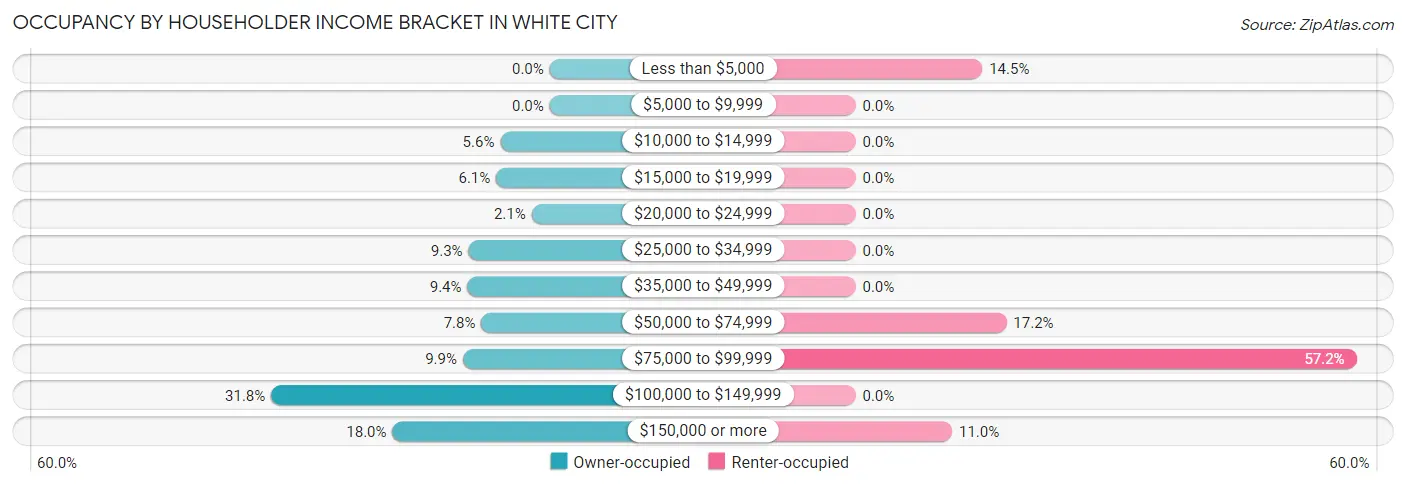
| Income Bracket | Owner-occupied | Renter-occupied |
| Less than $5,000 | 0 (0.0%) | 21 (14.5%) |
| $5,000 to $9,999 | 0 (0.0%) | 0 (0.0%) |
| $10,000 to $14,999 | 96 (5.6%) | 0 (0.0%) |
| $15,000 to $19,999 | 104 (6.1%) | 0 (0.0%) |
| $20,000 to $24,999 | 35 (2.1%) | 0 (0.0%) |
| $25,000 to $34,999 | 158 (9.3%) | 0 (0.0%) |
| $35,000 to $49,999 | 160 (9.4%) | 0 (0.0%) |
| $50,000 to $74,999 | 133 (7.8%) | 25 (17.2%) |
| $75,000 to $99,999 | 169 (9.9%) | 83 (57.2%) |
| $100,000 to $149,999 | 542 (31.8%) | 0 (0.0%) |
| $150,000 or more | 306 (18.0%) | 16 (11.0%) |
| Total | 1,703 (100.0%) | 145 (100.0%) |
Monthly Housing Cost Tiers in White City
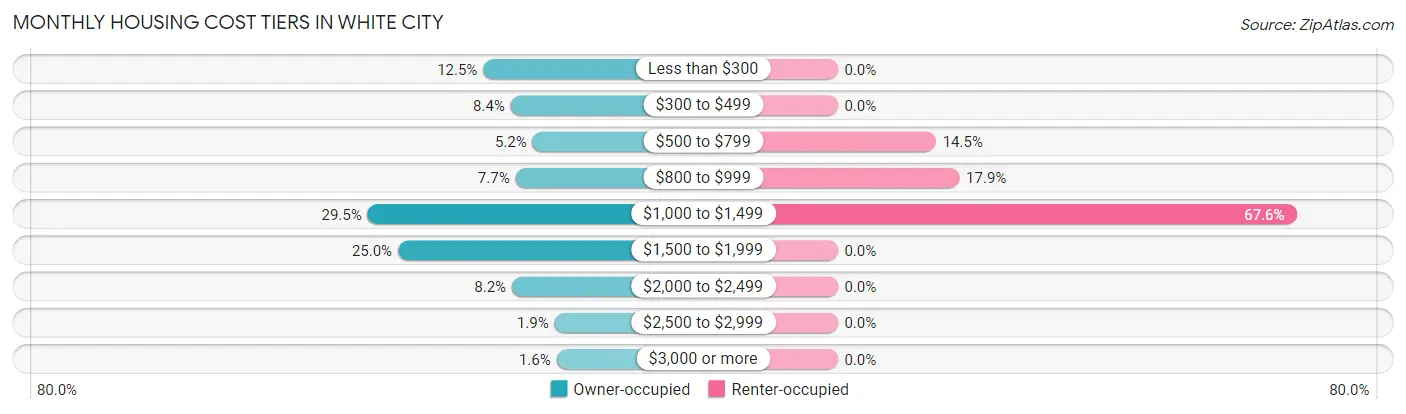
| Monthly Cost | Owner-occupied | Renter-occupied |
| Less than $300 | 212 (12.4%) | 0 (0.0%) |
| $300 to $499 | 143 (8.4%) | 0 (0.0%) |
| $500 to $799 | 88 (5.2%) | 21 (14.5%) |
| $800 to $999 | 131 (7.7%) | 26 (17.9%) |
| $1,000 to $1,499 | 502 (29.5%) | 98 (67.6%) |
| $1,500 to $1,999 | 426 (25.0%) | 0 (0.0%) |
| $2,000 to $2,499 | 140 (8.2%) | 0 (0.0%) |
| $2,500 to $2,999 | 33 (1.9%) | 0 (0.0%) |
| $3,000 or more | 28 (1.6%) | 0 (0.0%) |
| Total | 1,703 (100.0%) | 145 (100.0%) |
Physical Housing Characteristics in White City
Housing Structures in White City
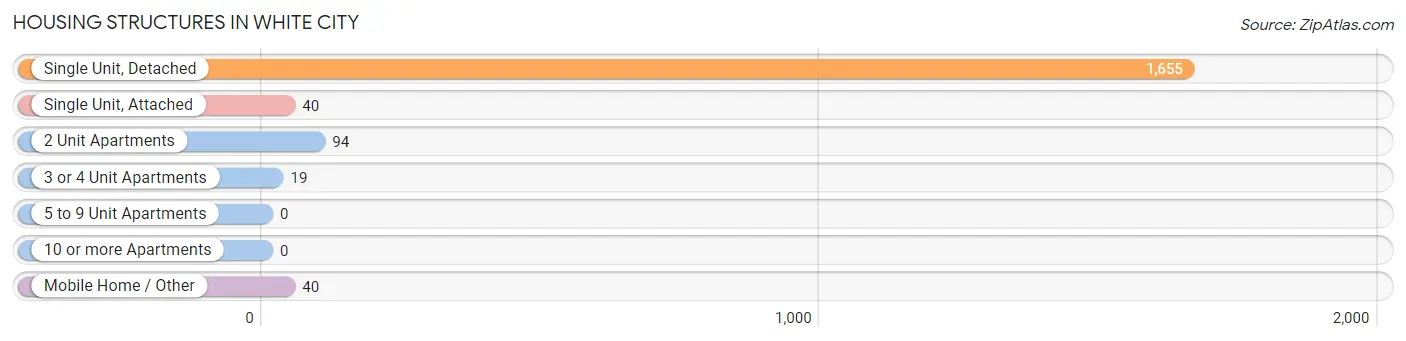
| Structure Type | # Housing Units | % Housing Units |
| Single Unit, Detached | 1,655 | 89.6% |
| Single Unit, Attached | 40 | 2.2% |
| 2 Unit Apartments | 94 | 5.1% |
| 3 or 4 Unit Apartments | 19 | 1.0% |
| 5 to 9 Unit Apartments | 0 | 0.0% |
| 10 or more Apartments | 0 | 0.0% |
| Mobile Home / Other | 40 | 2.2% |
| Total | 1,848 | 100.0% |
Housing Structures by Occupancy in White City
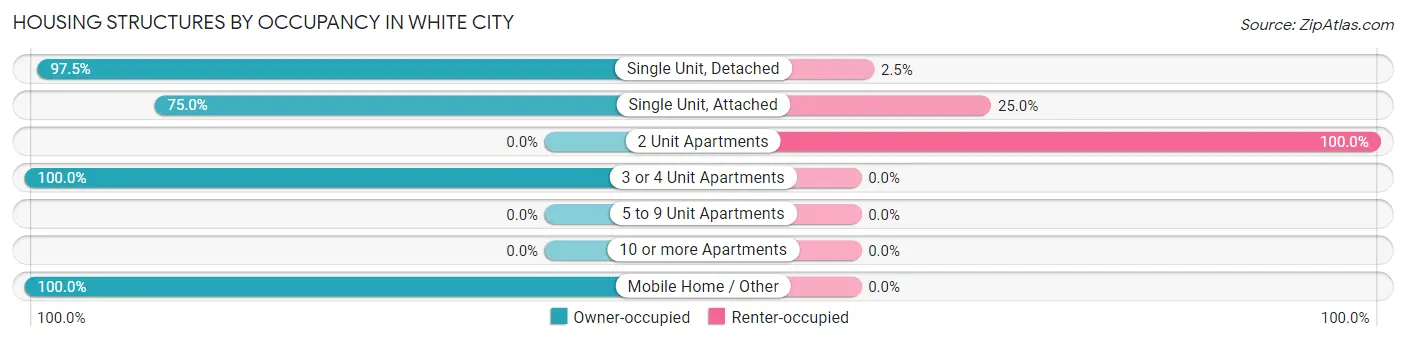
| Structure Type | Owner-occupied | Renter-occupied |
| Single Unit, Detached | 1,614 (97.5%) | 41 (2.5%) |
| Single Unit, Attached | 30 (75.0%) | 10 (25.0%) |
| 2 Unit Apartments | 0 (0.0%) | 94 (100.0%) |
| 3 or 4 Unit Apartments | 19 (100.0%) | 0 (0.0%) |
| 5 to 9 Unit Apartments | 0 (0.0%) | 0 (0.0%) |
| 10 or more Apartments | 0 (0.0%) | 0 (0.0%) |
| Mobile Home / Other | 40 (100.0%) | 0 (0.0%) |
| Total | 1,703 (92.1%) | 145 (7.9%) |
Housing Structures by Number of Rooms in White City
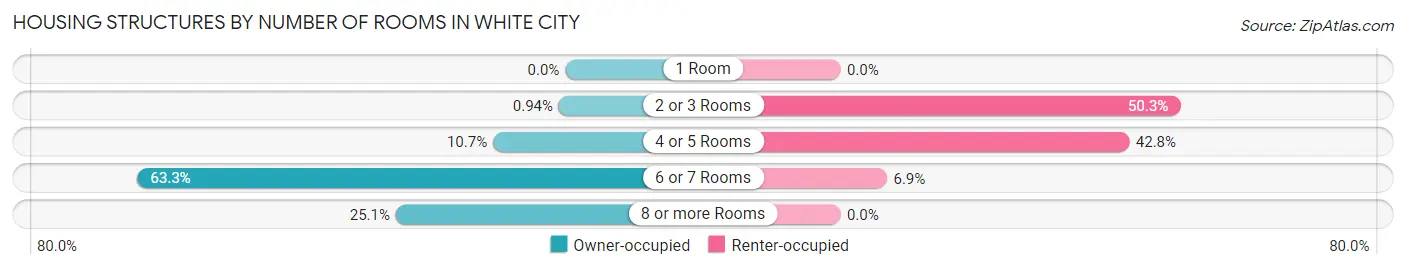
| Number of Rooms | Owner-occupied | Renter-occupied |
| 1 Room | 0 (0.0%) | 0 (0.0%) |
| 2 or 3 Rooms | 16 (0.9%) | 73 (50.3%) |
| 4 or 5 Rooms | 182 (10.7%) | 62 (42.8%) |
| 6 or 7 Rooms | 1,078 (63.3%) | 10 (6.9%) |
| 8 or more Rooms | 427 (25.1%) | 0 (0.0%) |
| Total | 1,703 (100.0%) | 145 (100.0%) |
Housing Structure by Heating Type in White City
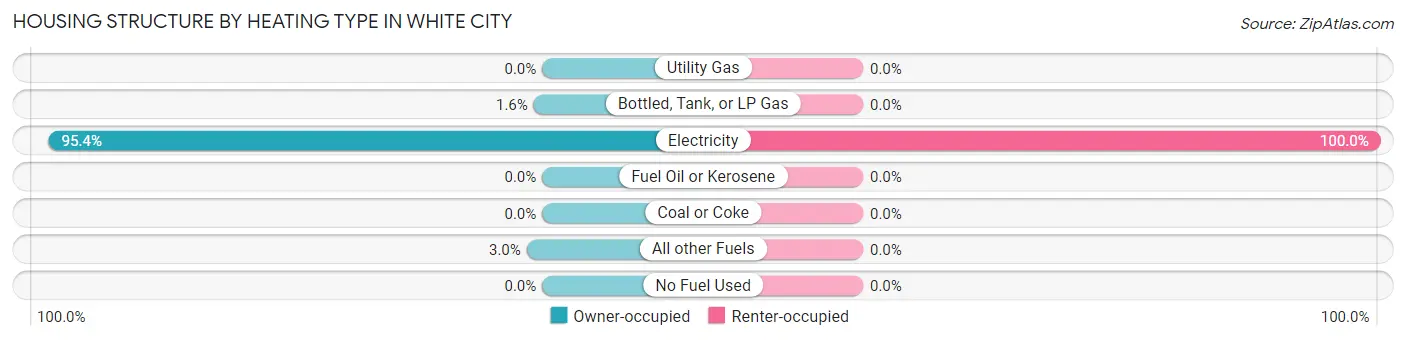
| Heating Type | Owner-occupied | Renter-occupied |
| Utility Gas | 0 (0.0%) | 0 (0.0%) |
| Bottled, Tank, or LP Gas | 28 (1.6%) | 0 (0.0%) |
| Electricity | 1,624 (95.4%) | 145 (100.0%) |
| Fuel Oil or Kerosene | 0 (0.0%) | 0 (0.0%) |
| Coal or Coke | 0 (0.0%) | 0 (0.0%) |
| All other Fuels | 51 (3.0%) | 0 (0.0%) |
| No Fuel Used | 0 (0.0%) | 0 (0.0%) |
| Total | 1,703 (100.0%) | 145 (100.0%) |
Household Vehicle Usage in White City
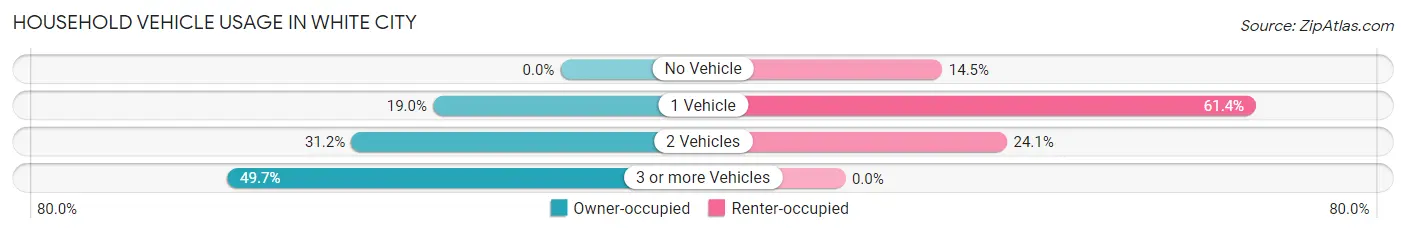
| Vehicles per Household | Owner-occupied | Renter-occupied |
| No Vehicle | 0 (0.0%) | 21 (14.5%) |
| 1 Vehicle | 324 (19.0%) | 89 (61.4%) |
| 2 Vehicles | 532 (31.2%) | 35 (24.1%) |
| 3 or more Vehicles | 847 (49.7%) | 0 (0.0%) |
| Total | 1,703 (100.0%) | 145 (100.0%) |
Real Estate & Mortgages in White City
Real Estate and Mortgage Overview in White City
| Characteristic | Without Mortgage | With Mortgage |
| Housing Units | 679 | 1,024 |
| Median Property Value | $252,600 | $323,700 |
| Median Household Income | $46,218 | $182 |
| Monthly Housing Costs | $489 | $28 |
| Real Estate Taxes | $1,358 | $0 |
Property Value by Mortgage Status in White City
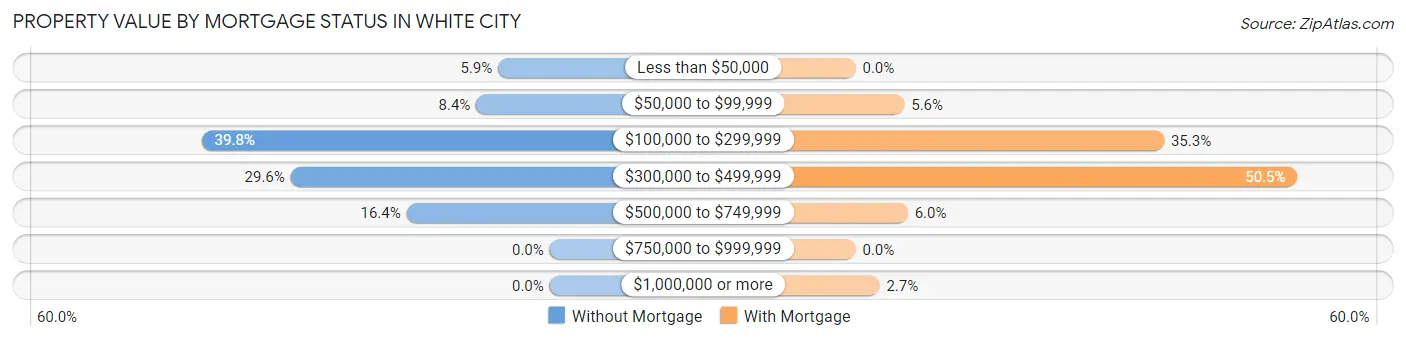
| Property Value | Without Mortgage | With Mortgage |
| Less than $50,000 | 40 (5.9%) | 0 (0.0%) |
| $50,000 to $99,999 | 57 (8.4%) | 57 (5.6%) |
| $100,000 to $299,999 | 270 (39.8%) | 361 (35.2%) |
| $300,000 to $499,999 | 201 (29.6%) | 517 (50.5%) |
| $500,000 to $749,999 | 111 (16.4%) | 61 (6.0%) |
| $750,000 to $999,999 | 0 (0.0%) | 0 (0.0%) |
| $1,000,000 or more | 0 (0.0%) | 28 (2.7%) |
| Total | 679 (100.0%) | 1,024 (100.0%) |
Household Income by Mortgage Status in White City
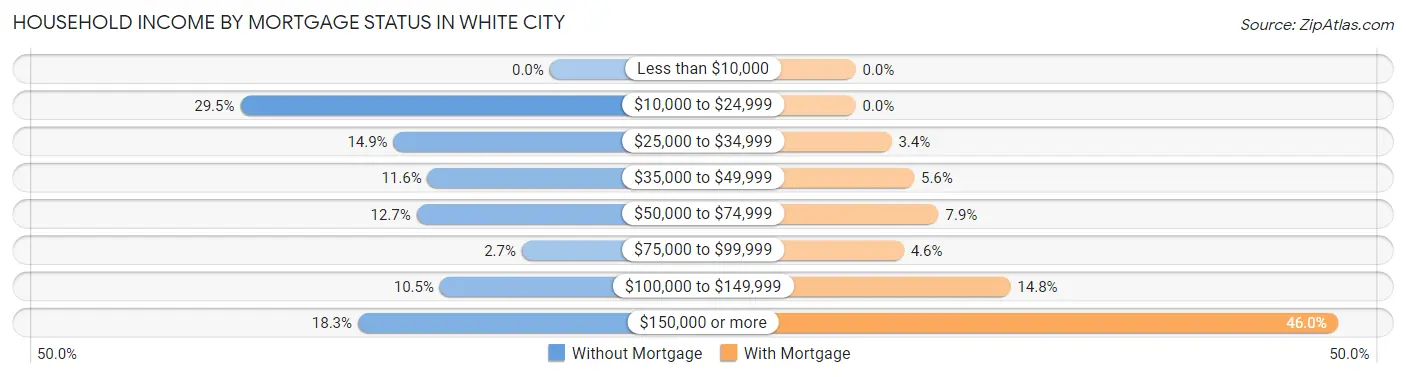
| Household Income | Without Mortgage | With Mortgage |
| Less than $10,000 | 0 (0.0%) | 0 (0.0%) |
| $10,000 to $24,999 | 200 (29.5%) | 0 (0.0%) |
| $25,000 to $34,999 | 101 (14.9%) | 35 (3.4%) |
| $35,000 to $49,999 | 79 (11.6%) | 57 (5.6%) |
| $50,000 to $74,999 | 86 (12.7%) | 81 (7.9%) |
| $75,000 to $99,999 | 18 (2.6%) | 47 (4.6%) |
| $100,000 to $149,999 | 71 (10.5%) | 151 (14.7%) |
| $150,000 or more | 124 (18.3%) | 471 (46.0%) |
| Total | 679 (100.0%) | 1,024 (100.0%) |
Property Value to Household Income Ratio in White City
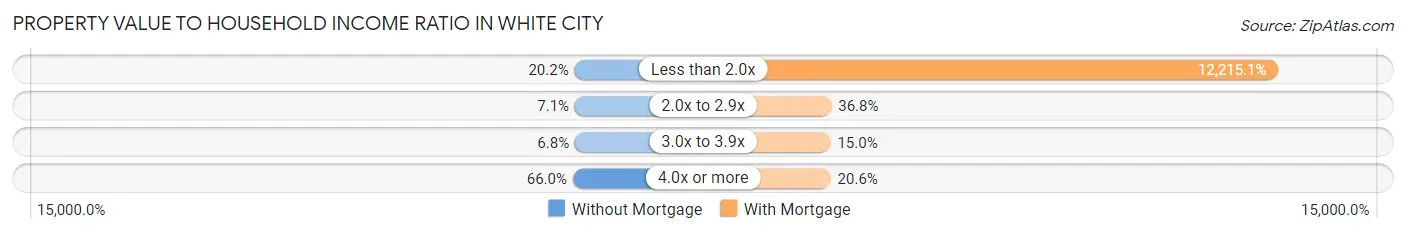
| Value-to-Income Ratio | Without Mortgage | With Mortgage |
| Less than 2.0x | 137 (20.2%) | 125,083 (12,215.1%) |
| 2.0x to 2.9x | 48 (7.1%) | 377 (36.8%) |
| 3.0x to 3.9x | 46 (6.8%) | 154 (15.0%) |
| 4.0x or more | 448 (66.0%) | 211 (20.6%) |
| Total | 679 (100.0%) | 1,024 (100.0%) |
Real Estate Taxes by Mortgage Status in White City
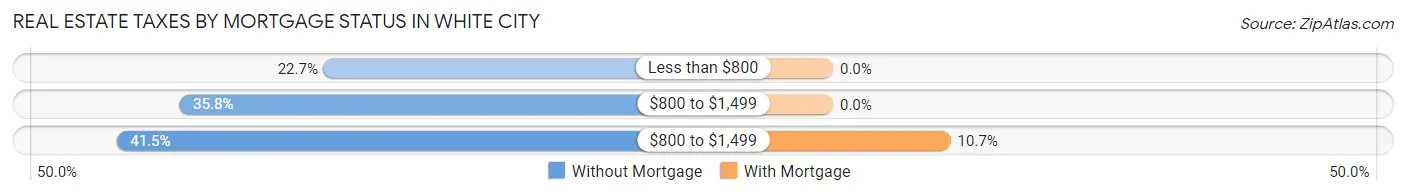
| Property Taxes | Without Mortgage | With Mortgage |
| Less than $800 | 154 (22.7%) | 0 (0.0%) |
| $800 to $1,499 | 243 (35.8%) | 0 (0.0%) |
| $800 to $1,499 | 282 (41.5%) | 110 (10.7%) |
| Total | 679 (100.0%) | 1,024 (100.0%) |
Health & Disability in White City
Health Insurance Coverage by Age in White City
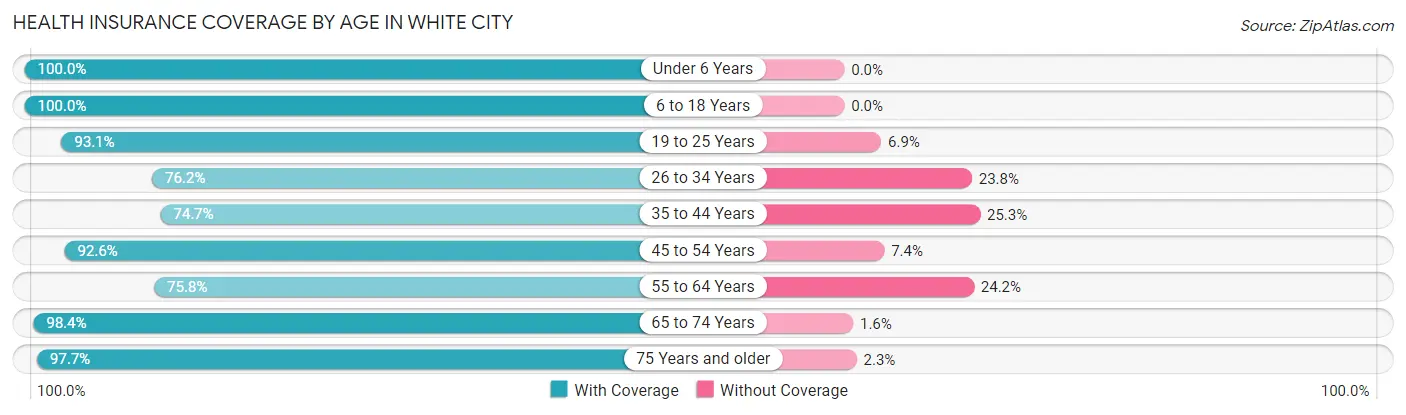
| Age Bracket | With Coverage | Without Coverage |
| Under 6 Years | 195 (100.0%) | 0 (0.0%) |
| 6 to 18 Years | 518 (100.0%) | 0 (0.0%) |
| 19 to 25 Years | 285 (93.1%) | 21 (6.9%) |
| 26 to 34 Years | 388 (76.2%) | 121 (23.8%) |
| 35 to 44 Years | 413 (74.7%) | 140 (25.3%) |
| 45 to 54 Years | 697 (92.6%) | 56 (7.4%) |
| 55 to 64 Years | 543 (75.8%) | 173 (24.2%) |
| 65 to 74 Years | 1,270 (98.4%) | 21 (1.6%) |
| 75 Years and older | 638 (97.7%) | 15 (2.3%) |
| Total | 4,947 (90.0%) | 547 (10.0%) |
Health Insurance Coverage by Citizenship Status in White City
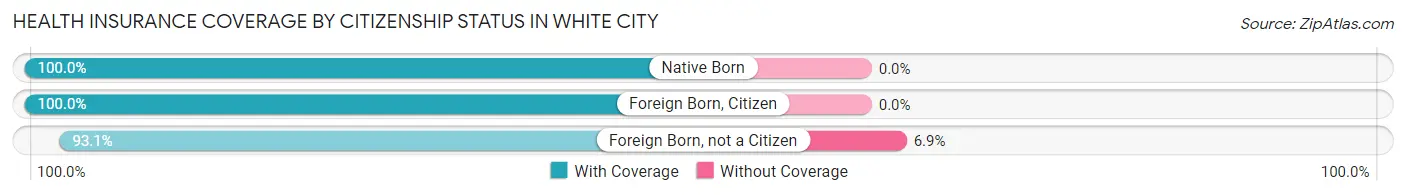
| Citizenship Status | With Coverage | Without Coverage |
| Native Born | 195 (100.0%) | 0 (0.0%) |
| Foreign Born, Citizen | 518 (100.0%) | 0 (0.0%) |
| Foreign Born, not a Citizen | 285 (93.1%) | 21 (6.9%) |
Health Insurance Coverage by Household Income in White City
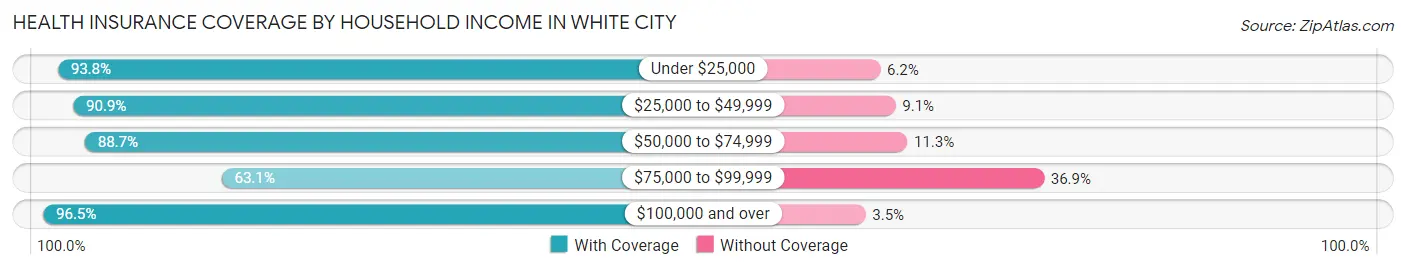
| Household Income | With Coverage | Without Coverage |
| Under $25,000 | 316 (93.8%) | 21 (6.2%) |
| $25,000 to $49,999 | 610 (90.9%) | 61 (9.1%) |
| $50,000 to $74,999 | 448 (88.7%) | 57 (11.3%) |
| $75,000 to $99,999 | 460 (63.1%) | 269 (36.9%) |
| $100,000 and over | 3,058 (96.5%) | 110 (3.5%) |
Public vs Private Health Insurance Coverage by Age in White City
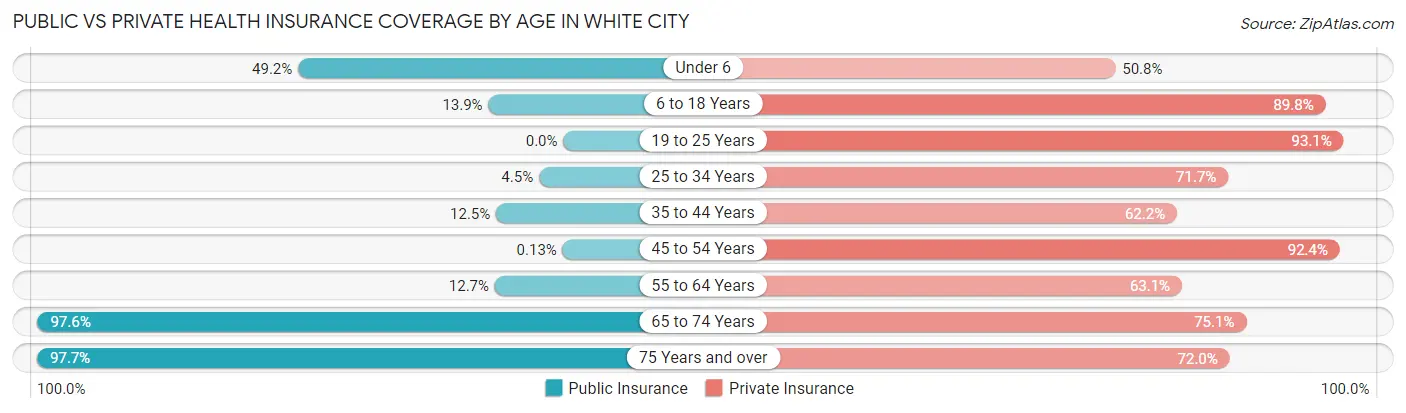
| Age Bracket | Public Insurance | Private Insurance |
| Under 6 | 96 (49.2%) | 99 (50.8%) |
| 6 to 18 Years | 72 (13.9%) | 465 (89.8%) |
| 19 to 25 Years | 0 (0.0%) | 285 (93.1%) |
| 25 to 34 Years | 23 (4.5%) | 365 (71.7%) |
| 35 to 44 Years | 69 (12.5%) | 344 (62.2%) |
| 45 to 54 Years | 1 (0.1%) | 696 (92.4%) |
| 55 to 64 Years | 91 (12.7%) | 452 (63.1%) |
| 65 to 74 Years | 1,260 (97.6%) | 969 (75.1%) |
| 75 Years and over | 638 (97.7%) | 470 (72.0%) |
| Total | 2,250 (40.9%) | 4,145 (75.4%) |
Disability Status by Sex by Age in White City
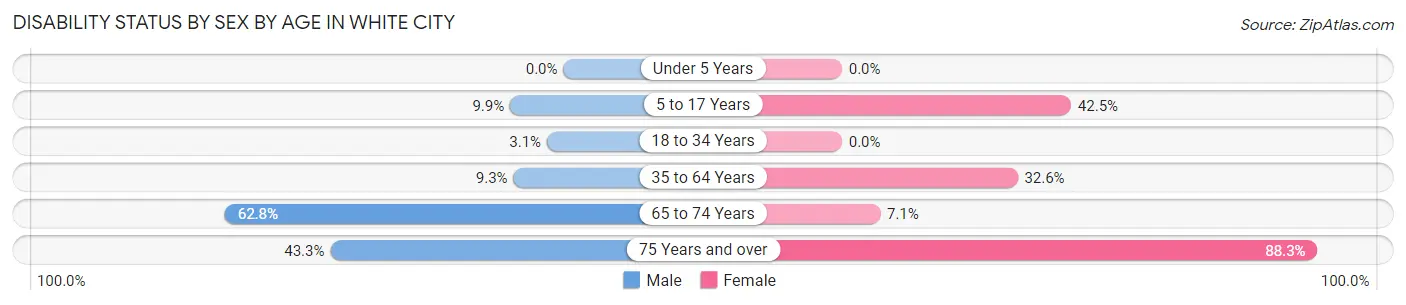
| Age Bracket | Male | Female |
| Under 5 Years | 0 (0.0%) | 0 (0.0%) |
| 5 to 17 Years | 28 (9.9%) | 74 (42.5%) |
| 18 to 34 Years | 23 (3.0%) | 0 (0.0%) |
| 35 to 64 Years | 99 (9.3%) | 311 (32.6%) |
| 65 to 74 Years | 333 (62.8%) | 54 (7.1%) |
| 75 Years and over | 109 (43.2%) | 354 (88.3%) |
Disability Class by Sex by Age in White City
Disability Class: Hearing Difficulty
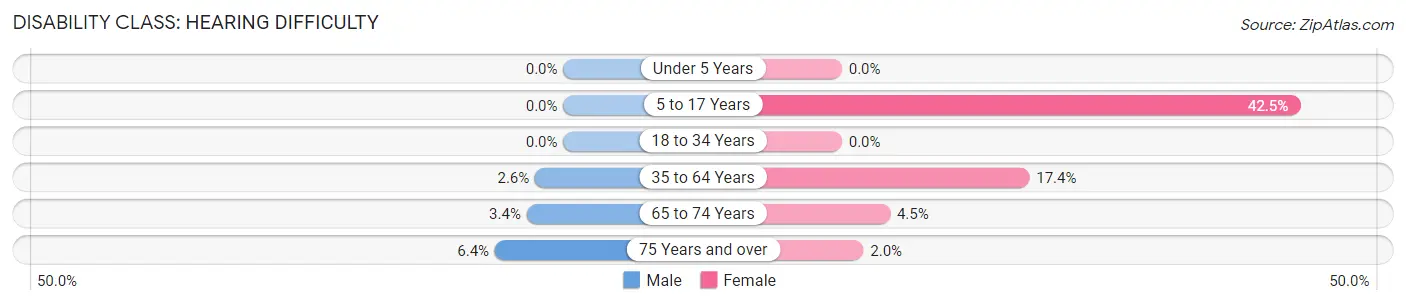
| Age Bracket | Male | Female |
| Under 5 Years | 0 (0.0%) | 0 (0.0%) |
| 5 to 17 Years | 0 (0.0%) | 74 (42.5%) |
| 18 to 34 Years | 0 (0.0%) | 0 (0.0%) |
| 35 to 64 Years | 28 (2.6%) | 166 (17.4%) |
| 65 to 74 Years | 18 (3.4%) | 34 (4.5%) |
| 75 Years and over | 16 (6.4%) | 8 (2.0%) |
Disability Class: Vision Difficulty
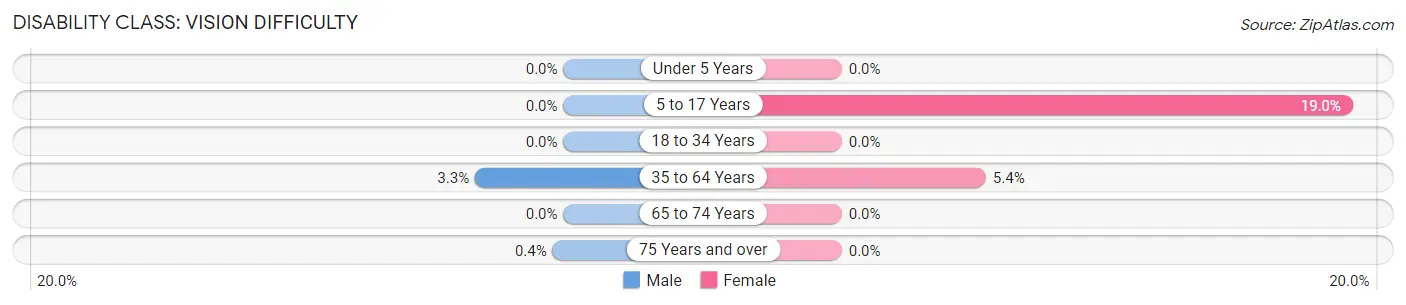
| Age Bracket | Male | Female |
| Under 5 Years | 0 (0.0%) | 0 (0.0%) |
| 5 to 17 Years | 0 (0.0%) | 33 (19.0%) |
| 18 to 34 Years | 0 (0.0%) | 0 (0.0%) |
| 35 to 64 Years | 35 (3.3%) | 51 (5.3%) |
| 65 to 74 Years | 0 (0.0%) | 0 (0.0%) |
| 75 Years and over | 1 (0.4%) | 0 (0.0%) |
Disability Class: Cognitive Difficulty
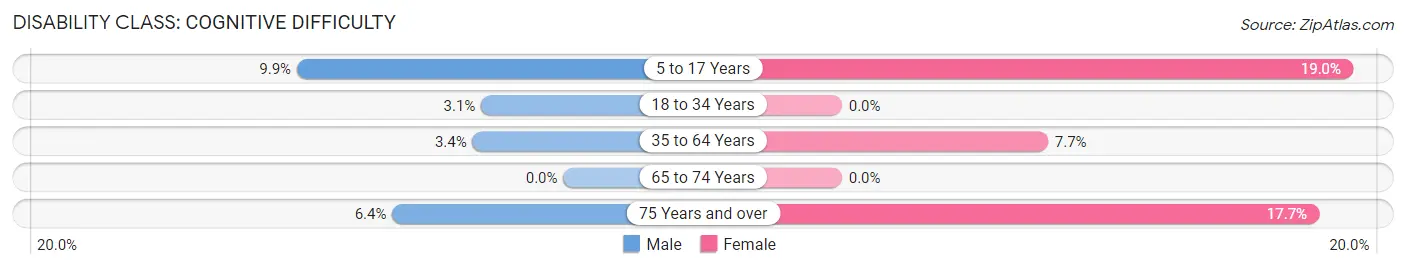
| Age Bracket | Male | Female |
| 5 to 17 Years | 28 (9.9%) | 33 (19.0%) |
| 18 to 34 Years | 23 (3.0%) | 0 (0.0%) |
| 35 to 64 Years | 36 (3.4%) | 73 (7.6%) |
| 65 to 74 Years | 0 (0.0%) | 0 (0.0%) |
| 75 Years and over | 16 (6.4%) | 71 (17.7%) |
Disability Class: Ambulatory Difficulty
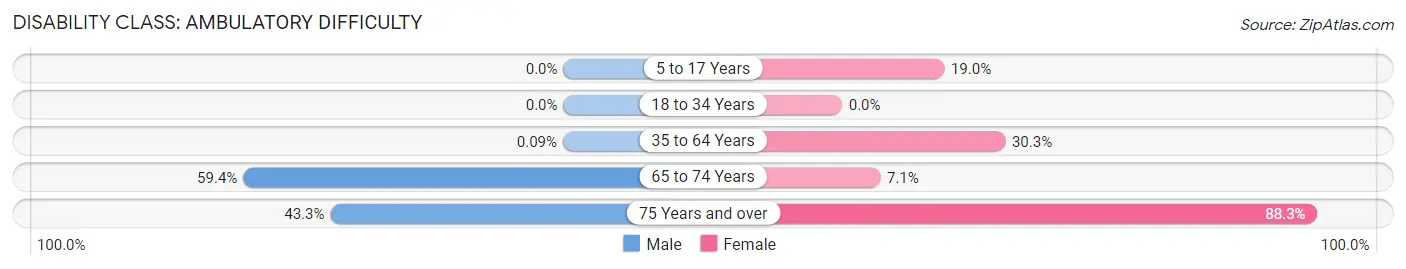
| Age Bracket | Male | Female |
| 5 to 17 Years | 0 (0.0%) | 33 (19.0%) |
| 18 to 34 Years | 0 (0.0%) | 0 (0.0%) |
| 35 to 64 Years | 1 (0.1%) | 289 (30.3%) |
| 65 to 74 Years | 315 (59.4%) | 54 (7.1%) |
| 75 Years and over | 109 (43.2%) | 354 (88.3%) |
Disability Class: Self-Care Difficulty
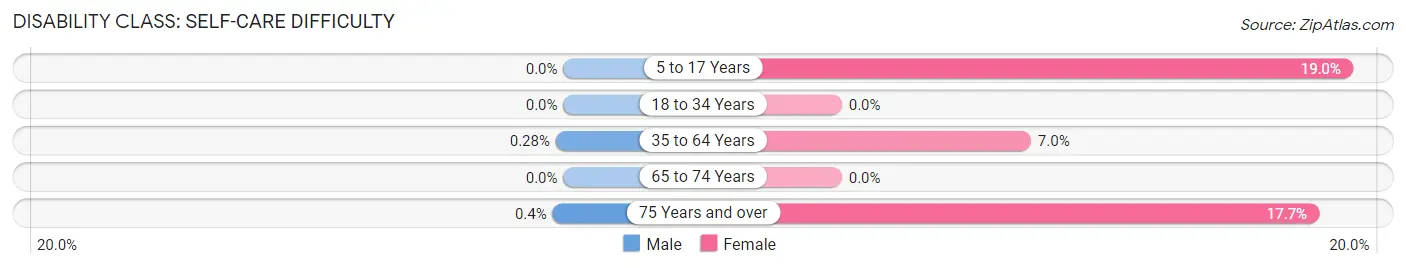
| Age Bracket | Male | Female |
| 5 to 17 Years | 0 (0.0%) | 33 (19.0%) |
| 18 to 34 Years | 0 (0.0%) | 0 (0.0%) |
| 35 to 64 Years | 3 (0.3%) | 67 (7.0%) |
| 65 to 74 Years | 0 (0.0%) | 0 (0.0%) |
| 75 Years and over | 1 (0.4%) | 71 (17.7%) |
Technology Access in White City
Computing Device Access in White City
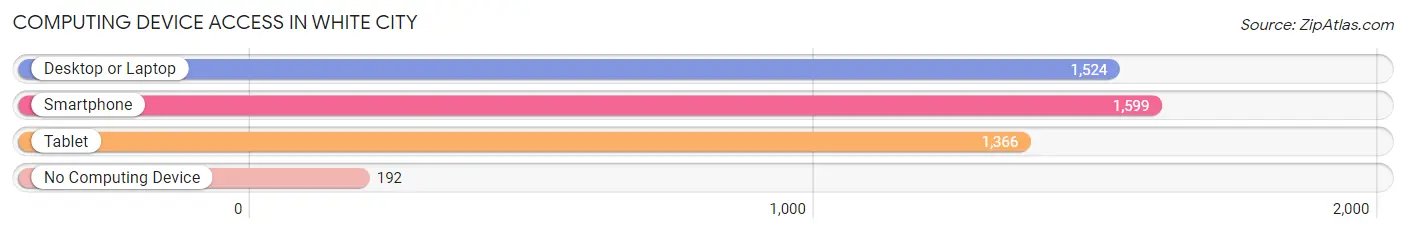
| Device Type | # Households | % Households |
| Desktop or Laptop | 1,524 | 82.5% |
| Smartphone | 1,599 | 86.5% |
| Tablet | 1,366 | 73.9% |
| No Computing Device | 192 | 10.4% |
| Total | 1,848 | 100.0% |
Internet Access in White City
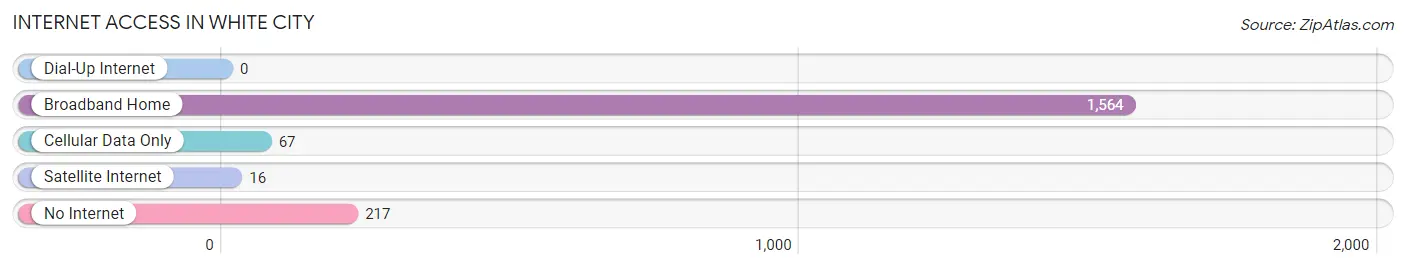
| Internet Type | # Households | % Households |
| Dial-Up Internet | 0 | 0.0% |
| Broadband Home | 1,564 | 84.6% |
| Cellular Data Only | 67 | 3.6% |
| Satellite Internet | 16 | 0.9% |
| No Internet | 217 | 11.7% |
| Total | 1,848 | 100.0% |
White City Summary
White City is a small unincorporated community located in St. Lucie County, Florida. It is situated on the east side of the St. Lucie River, just south of Fort Pierce. The community is part of the Port St. Lucie Metropolitan Statistical Area.
History
White City was founded in the late 19th century by settlers from the Bahamas. The settlers were attracted to the area by the abundance of fish and wildlife in the St. Lucie River. The community was originally known as “White’s City” after the first settler, William White. The name was later shortened to White City.
In the early 20th century, White City was a thriving agricultural community. The area was known for its citrus groves, vegetable farms, and cattle ranches. The community also had a sawmill, a general store, and a post office.
In the 1950s, White City began to decline as the agricultural industry shifted to other parts of the state. The population dwindled and many of the businesses closed. In the late 1970s, the community was revitalized when the St. Lucie County government began to invest in the area. The county built a new library, a community center, and a park.
Geography
White City is located in St. Lucie County, Florida. It is situated on the east side of the St. Lucie River, just south of Fort Pierce. The community is part of the Port St. Lucie Metropolitan Statistical Area.
The area is mostly flat and is covered in pine and palmetto trees. The soil is sandy and the climate is subtropical. The average temperature is around 75 degrees Fahrenheit.
Economy
White City’s economy is largely based on agriculture and tourism. The area is known for its citrus groves, vegetable farms, and cattle ranches. The community also has a few small businesses, including a convenience store, a gas station, and a restaurant.
The St. Lucie County government is also a major employer in the area. The county employs many people in the fields of education, public safety, and public works.
Demographics
As of the 2010 census, White City had a population of 1,845. The racial makeup of the community was 79.3% White, 15.2% African American, 0.7% Native American, 0.7% Asian, and 3.9% from other races.
The median household income in White City was $37,917, and the median family income was $41,917. The per capita income was $17,917. About 17.3% of the population was below the poverty line.
White City is served by the St. Lucie County School District. The community has one elementary school, one middle school, and one high school. The community also has a library and a community center.
Common Questions
What is the Total Population of White City?
Total Population of White City is 5,494.
What is the Total Male Population of White City?
Total Male Population of White City is 2,939.
What is the Total Female Population of White City?
Total Female Population of White City is 2,555.
What is the Ratio of Males per 100 Females in White City?
There are 115.03 Males per 100 Females in White City.
What is the Ratio of Females per 100 Males in White City?
There are 86.93 Females per 100 Males in White City.
What is the Median Population Age in White City?
Median Population Age in White City is 53.1 Years.
What is the Average Family Size in White City
Average Family Size in White City is 3.2 People.
What is the Average Household Size in White City
Average Household Size in White City is 2.9 People.
What is Per Capita Income in White City?
Per Capita income in White City is $39,562.
What is the Median Family Income in White City?
Median Family Income in White City is $110,884.
What is the Median Household income in White City?
Median Household Income in White City is $96,932.
What is Income or Wage Gap in White City?
Income or Wage Gap in White City is 35.5%.
Women in White City earn 64.5 cents for every dollar earned by a man.
What is Inequality or Gini Index in White City?
Inequality or Gini Index in White City is 0.43.
How Large is the Labor Force in White City?
There are 2,557 People in the Labor Forcein in White City.
What is the Percentage of People in the Labor Force in White City?
51.9% of People are in the Labor Force in White City.
What is the Unemployment Rate in White City?
Unemployment Rate in White City is 2.7%.