Sugarmill Woods, FL
Sugarmill Woods Map
Sugarmill Woods Overview
10,821
TOTAL POPULATION
5,343
MALE POPULATION
5,478
FEMALE POPULATION
97.54
MALES / 100 FEMALES
102.53
FEMALES / 100 MALES
64.8
MEDIAN AGE
2.6
AVG FAMILY SIZE
2.1
AVG HOUSEHOLD SIZE
$41,863
PER CAPITA INCOME
$86,935
AVG FAMILY INCOME
$66,824
AVG HOUSEHOLD INCOME
1.7%
WAGE / INCOME GAP [ % ]
98.3¢/ $1
WAGE / INCOME GAP [ $ ]
0.44
INEQUALITY / GINI INDEX
3,291
LABOR FORCE [ PEOPLE ]
33.8%
PERCENT IN LABOR FORCE
4.6%
UNEMPLOYMENT RATE
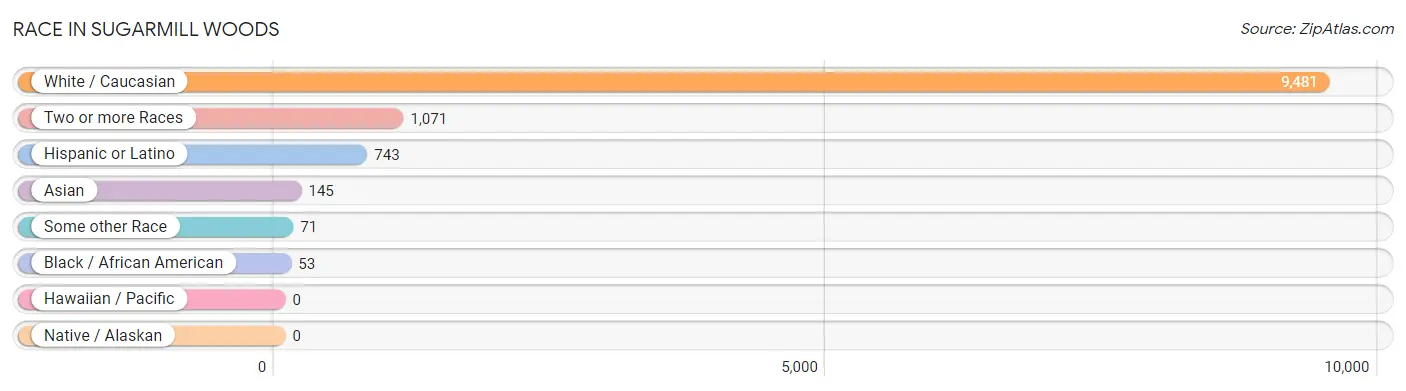
Race in Sugarmill Woods
The most populous races in Sugarmill Woods are White / Caucasian (9,481 | 87.6%), Two or more Races (1,071 | 9.9%), and Hispanic or Latino (743 | 6.9%).
| Race | # Population | % Population |
| Asian | 145 | 1.3% |
| Black / African American | 53 | 0.5% |
| Hawaiian / Pacific | 0 | 0.0% |
| Hispanic or Latino | 743 | 6.9% |
| Native / Alaskan | 0 | 0.0% |
| White / Caucasian | 9,481 | 87.6% |
| Two or more Races | 1,071 | 9.9% |
| Some other Race | 71 | 0.7% |
| Total | 10,821 | 100.0% |
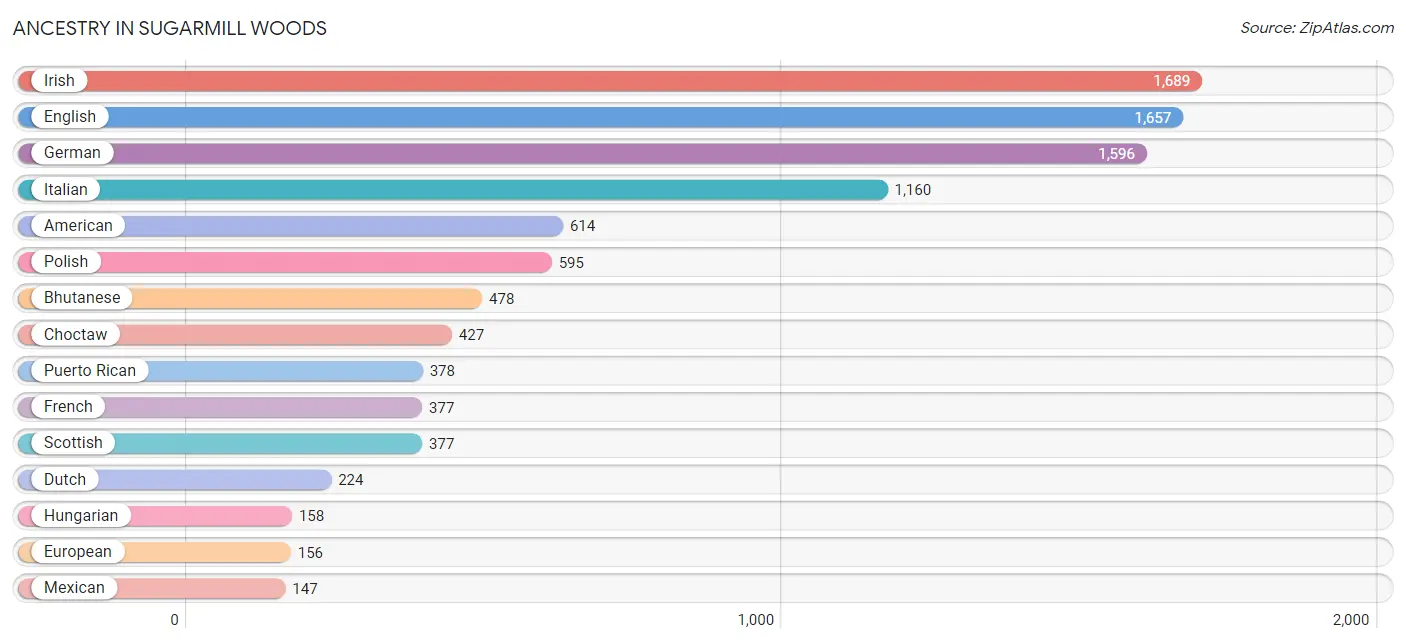
Ancestry in Sugarmill Woods
The most populous ancestries reported in Sugarmill Woods are Irish (1,689 | 15.6%), English (1,657 | 15.3%), German (1,596 | 14.7%), Italian (1,160 | 10.7%), and American (614 | 5.7%), together accounting for 62.1% of all Sugarmill Woods residents.
| Ancestry | # Population | % Population |
| African | 11 | 0.1% |
| American | 614 | 5.7% |
| Armenian | 7 | 0.1% |
| Austrian | 14 | 0.1% |
| Belgian | 11 | 0.1% |
| Bhutanese | 478 | 4.4% |
| British | 124 | 1.1% |
| Canadian | 12 | 0.1% |
| Central American | 41 | 0.4% |
| Cherokee | 6 | 0.1% |
| Choctaw | 427 | 4.0% |
| Colombian | 8 | 0.1% |
| Croatian | 84 | 0.8% |
| Cuban | 118 | 1.1% |
| Czech | 68 | 0.6% |
| Danish | 39 | 0.4% |
| Dutch | 224 | 2.1% |
| Eastern European | 37 | 0.3% |
| Ecuadorian | 39 | 0.4% |
| English | 1,657 | 15.3% |
| European | 156 | 1.4% |
| Finnish | 64 | 0.6% |
| French | 377 | 3.5% |
| French Canadian | 144 | 1.3% |
| German | 1,596 | 14.7% |
| Greek | 36 | 0.3% |
| Guatemalan | 12 | 0.1% |
| Haitian | 11 | 0.1% |
| Hungarian | 158 | 1.5% |
| Icelander | 13 | 0.1% |
| Indian (Asian) | 68 | 0.6% |
| Iranian | 16 | 0.2% |
| Irish | 1,689 | 15.6% |
| Italian | 1,160 | 10.7% |
| Korean | 91 | 0.8% |
| Lithuanian | 27 | 0.3% |
| Mexican | 147 | 1.4% |
| Nicaraguan | 29 | 0.3% |
| Norwegian | 112 | 1.0% |
| Pennsylvania German | 14 | 0.1% |
| Peruvian | 12 | 0.1% |
| Polish | 595 | 5.5% |
| Puerto Rican | 378 | 3.5% |
| Romanian | 130 | 1.2% |
| Russian | 111 | 1.0% |
| Scotch-Irish | 48 | 0.4% |
| Scottish | 377 | 3.5% |
| Slovak | 26 | 0.2% |
| Slovene | 21 | 0.2% |
| South American | 59 | 0.5% |
| Subsaharan African | 11 | 0.1% |
| Swedish | 146 | 1.3% |
| Swiss | 12 | 0.1% |
| Ukrainian | 81 | 0.7% |
| Welsh | 75 | 0.7% | View All 55 Rows |
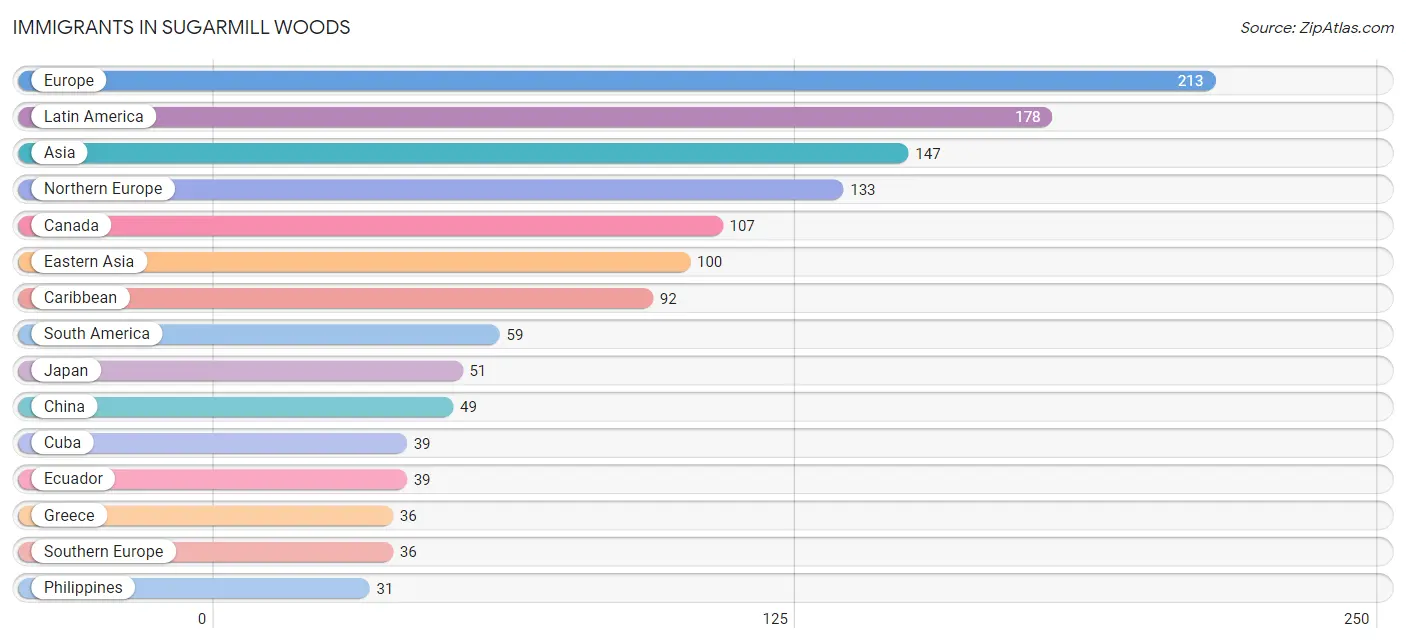
Immigrants in Sugarmill Woods
The most numerous immigrant groups reported in Sugarmill Woods came from Europe (213 | 2.0%), Latin America (178 | 1.6%), Asia (147 | 1.4%), Northern Europe (133 | 1.2%), and Canada (107 | 1.0%), together accounting for 7.2% of all Sugarmill Woods residents.
| Immigration Origin | # Population | % Population |
| Asia | 147 | 1.4% |
| Canada | 107 | 1.0% |
| Caribbean | 92 | 0.9% |
| Central America | 27 | 0.3% |
| China | 49 | 0.4% |
| Colombia | 8 | 0.1% |
| Cuba | 39 | 0.4% |
| Czechoslovakia | 16 | 0.2% |
| Dominica | 19 | 0.2% |
| Eastern Asia | 100 | 0.9% |
| Eastern Europe | 30 | 0.3% |
| Ecuador | 39 | 0.4% |
| England | 13 | 0.1% |
| Europe | 213 | 2.0% |
| Greece | 36 | 0.3% |
| Guatemala | 12 | 0.1% |
| Haiti | 21 | 0.2% |
| Hong Kong | 28 | 0.3% |
| Iran | 16 | 0.2% |
| Japan | 51 | 0.5% |
| Latin America | 178 | 1.6% |
| Netherlands | 14 | 0.1% |
| Nicaragua | 15 | 0.1% |
| Northern Europe | 133 | 1.2% |
| Peru | 12 | 0.1% |
| Philippines | 31 | 0.3% |
| Poland | 14 | 0.1% |
| South America | 59 | 0.5% |
| South Central Asia | 16 | 0.2% |
| South Eastern Asia | 31 | 0.3% |
| Southern Europe | 36 | 0.3% |
| Western Europe | 14 | 0.1% | View All 32 Rows |
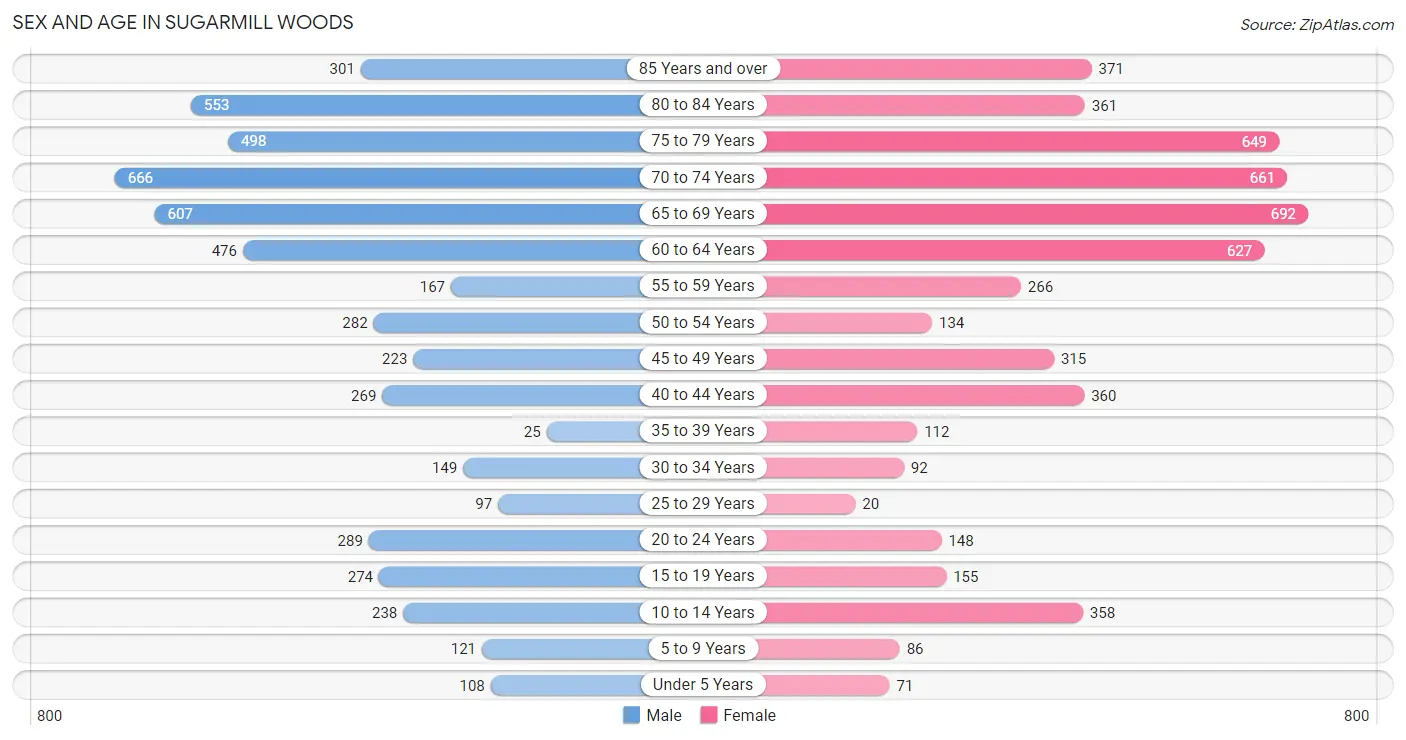
Sex and Age in Sugarmill Woods
Sex and Age in Sugarmill Woods
The most populous age groups in Sugarmill Woods are 70 to 74 Years (666 | 12.5%) for men and 65 to 69 Years (692 | 12.6%) for women.
| Age Bracket | Male | Female |
| Under 5 Years | 108 (2.0%) | 71 (1.3%) |
| 5 to 9 Years | 121 (2.3%) | 86 (1.6%) |
| 10 to 14 Years | 238 (4.4%) | 358 (6.5%) |
| 15 to 19 Years | 274 (5.1%) | 155 (2.8%) |
| 20 to 24 Years | 289 (5.4%) | 148 (2.7%) |
| 25 to 29 Years | 97 (1.8%) | 20 (0.4%) |
| 30 to 34 Years | 149 (2.8%) | 92 (1.7%) |
| 35 to 39 Years | 25 (0.5%) | 112 (2.0%) |
| 40 to 44 Years | 269 (5.0%) | 360 (6.6%) |
| 45 to 49 Years | 223 (4.2%) | 315 (5.8%) |
| 50 to 54 Years | 282 (5.3%) | 134 (2.5%) |
| 55 to 59 Years | 167 (3.1%) | 266 (4.9%) |
| 60 to 64 Years | 476 (8.9%) | 627 (11.5%) |
| 65 to 69 Years | 607 (11.4%) | 692 (12.6%) |
| 70 to 74 Years | 666 (12.5%) | 661 (12.1%) |
| 75 to 79 Years | 498 (9.3%) | 649 (11.8%) |
| 80 to 84 Years | 553 (10.3%) | 361 (6.6%) |
| 85 Years and over | 301 (5.6%) | 371 (6.8%) |
| Total | 5,343 (100.0%) | 5,478 (100.0%) |
Families and Households in Sugarmill Woods
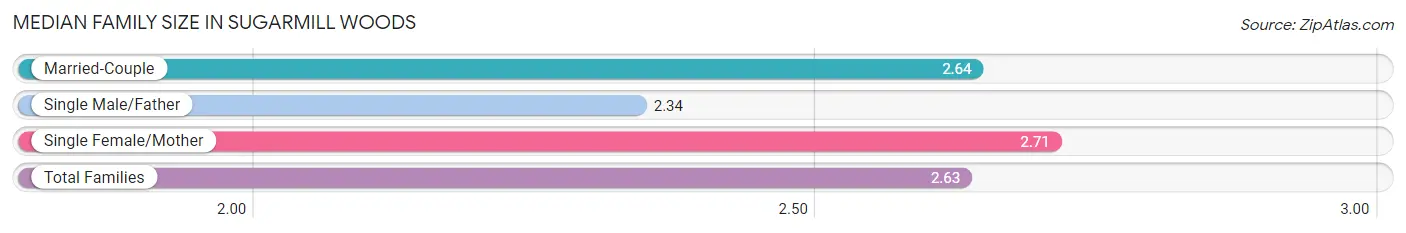
Median Family Size in Sugarmill Woods
The median family size in Sugarmill Woods is 2.63 persons per family, with single female/mother families (160 | 4.7%) accounting for the largest median family size of 2.71 persons per family. On the other hand, single male/father families (121 | 3.6%) represent the smallest median family size with 2.34 persons per family.
| Family Type | # Families | Family Size |
| Married-Couple | 3,108 (91.7%) | 2.64 |
| Single Male/Father | 121 (3.6%) | 2.34 |
| Single Female/Mother | 160 (4.7%) | 2.71 |
| Total Families | 3,389 (100.0%) | 2.63 |
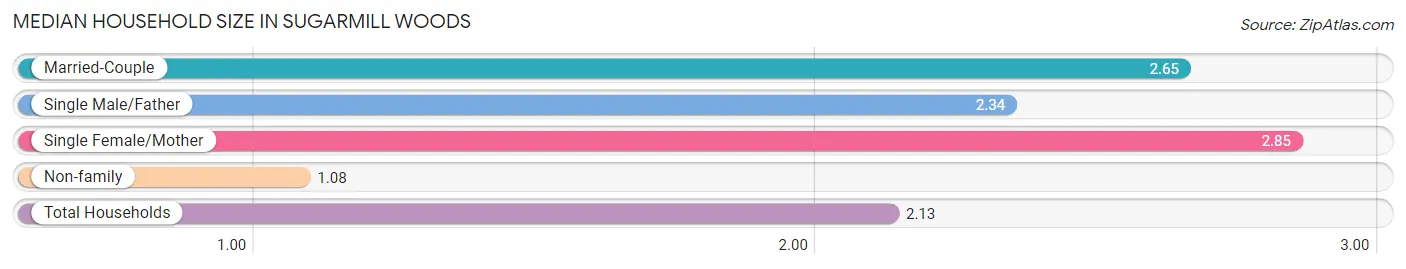
Median Household Size in Sugarmill Woods
The median household size in Sugarmill Woods is 2.13 persons per household, with single female/mother households (160 | 3.2%) accounting for the largest median household size of 2.85 persons per household. non-family households (1,677 | 33.1%) represent the smallest median household size with 1.08 persons per household.
| Household Type | # Households | Household Size |
| Married-Couple | 3,108 (61.4%) | 2.65 |
| Single Male/Father | 121 (2.4%) | 2.34 |
| Single Female/Mother | 160 (3.2%) | 2.85 |
| Non-family | 1,677 (33.1%) | 1.08 |
| Total Households | 5,066 (100.0%) | 2.13 |
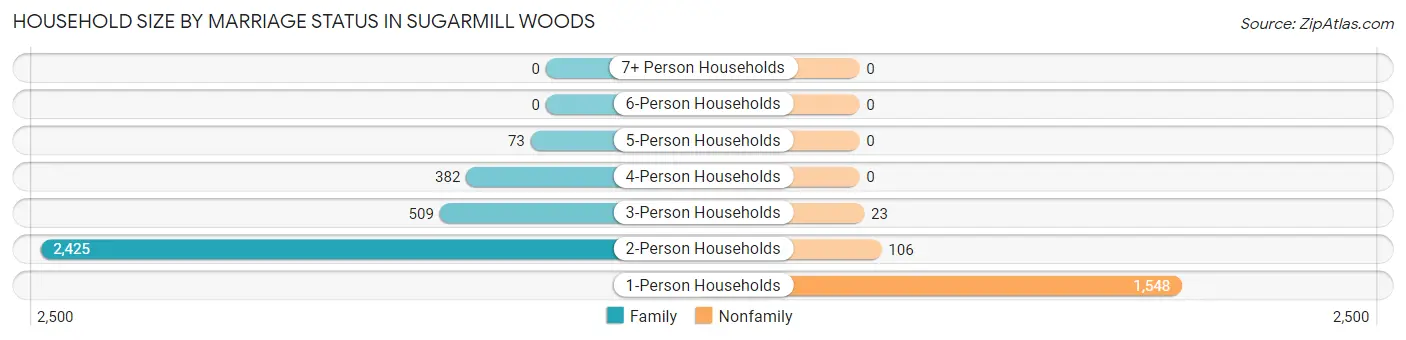
Household Size by Marriage Status in Sugarmill Woods
Out of a total of 5,066 households in Sugarmill Woods, 3,389 (66.9%) are family households, while 1,677 (33.1%) are nonfamily households. The most numerous type of family households are 2-person households, comprising 2,425, and the most common type of nonfamily households are 1-person households, comprising 1,548.
| Household Size | Family Households | Nonfamily Households |
| 1-Person Households | - | 1,548 (30.6%) |
| 2-Person Households | 2,425 (47.9%) | 106 (2.1%) |
| 3-Person Households | 509 (10.1%) | 23 (0.4%) |
| 4-Person Households | 382 (7.5%) | 0 (0.0%) |
| 5-Person Households | 73 (1.4%) | 0 (0.0%) |
| 6-Person Households | 0 (0.0%) | 0 (0.0%) |
| 7+ Person Households | 0 (0.0%) | 0 (0.0%) |
| Total | 3,389 (66.9%) | 1,677 (33.1%) |
Female Fertility in Sugarmill Woods
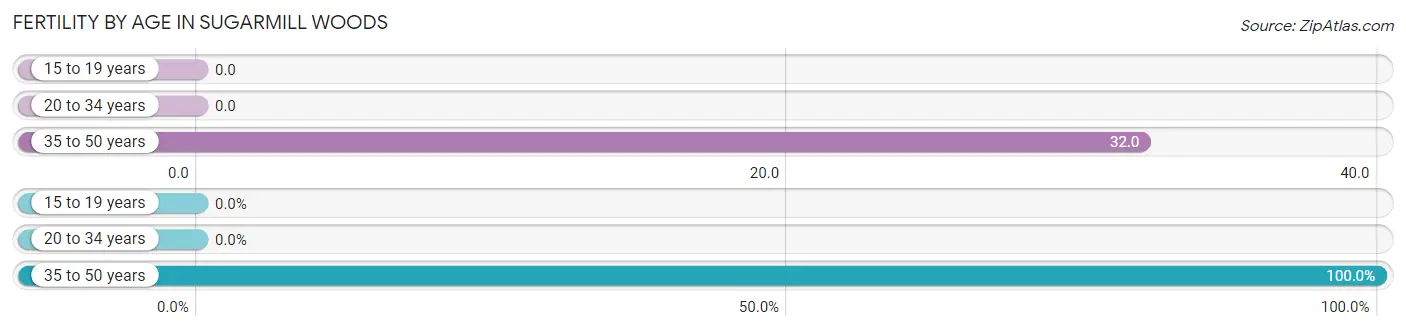
Fertility by Age in Sugarmill Woods
Average fertility rate in Sugarmill Woods is 21.0 births per 1,000 women. Women in the age bracket of 35 to 50 years have the highest fertility rate with 32.0 births per 1,000 women. Women in the age bracket of 35 to 50 years acount for 100.0% of all women with births.
| Age Bracket | Women with Births | Births / 1,000 Women |
| 15 to 19 years | 0 (0.0%) | 0.0 |
| 20 to 34 years | 0 (0.0%) | 0.0 |
| 35 to 50 years | 25 (100.0%) | 32.0 |
| Total | 25 (100.0%) | 21.0 |
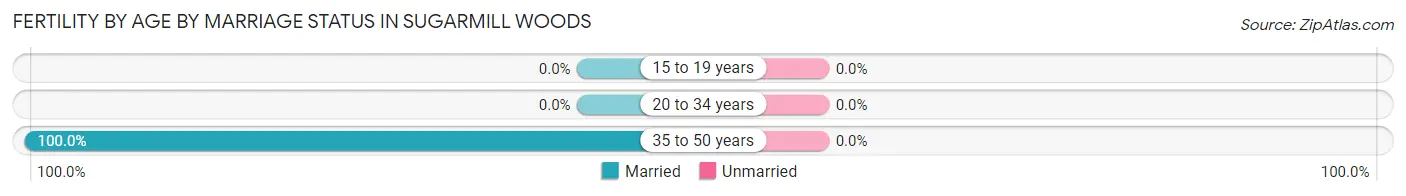
Fertility by Age by Marriage Status in Sugarmill Woods
| Age Bracket | Married | Unmarried |
| 15 to 19 years | 0 (0.0%) | 0 (0.0%) |
| 20 to 34 years | 0 (0.0%) | 0 (0.0%) |
| 35 to 50 years | 25 (100.0%) | 0 (0.0%) |
| Total | 25 (100.0%) | 0 (0.0%) |
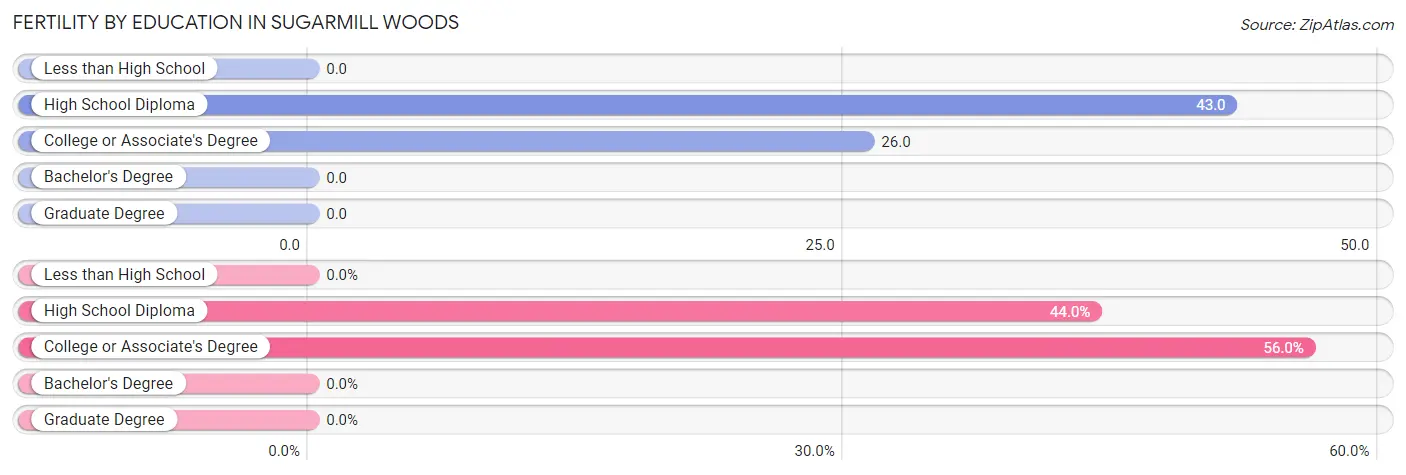
Fertility by Education in Sugarmill Woods
| Educational Attainment | Women with Births | Births / 1,000 Women |
| Less than High School | 0 (0.0%) | 0.0 |
| High School Diploma | 11 (44.0%) | 43.0 |
| College or Associate's Degree | 14 (56.0%) | 26.0 |
| Bachelor's Degree | 0 (0.0%) | 0.0 |
| Graduate Degree | 0 (0.0%) | 0.0 |
| Total | 25 (100.0%) | 21.0 |
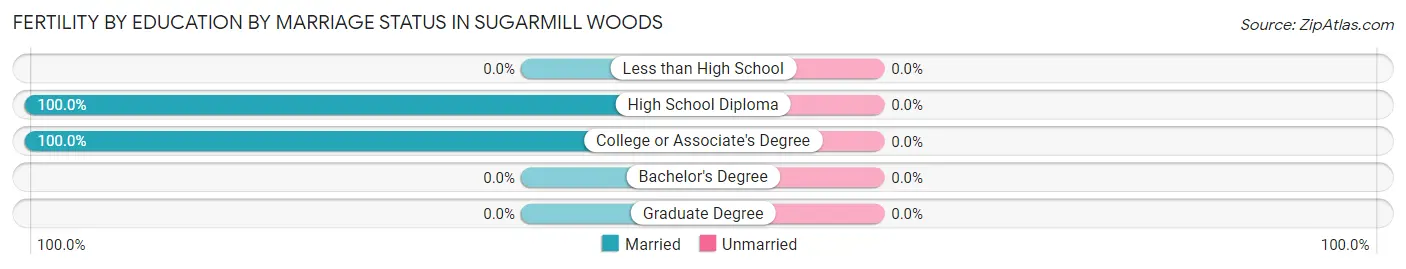
Fertility by Education by Marriage Status in Sugarmill Woods
| Educational Attainment | Married | Unmarried |
| Less than High School | 0 (0.0%) | 0 (0.0%) |
| High School Diploma | 11 (100.0%) | 0 (0.0%) |
| College or Associate's Degree | 14 (100.0%) | 0 (0.0%) |
| Bachelor's Degree | 0 (0.0%) | 0 (0.0%) |
| Graduate Degree | 0 (0.0%) | 0 (0.0%) |
| Total | 25 (100.0%) | 0 (0.0%) |
Income in Sugarmill Woods
Income Overview in Sugarmill Woods
Per Capita Income in Sugarmill Woods is $41,863, while median incomes of families and households are $86,935 and $66,824 respectively.
| Characteristic | Number | Measure |
| Per Capita Income | 10,821 | $41,863 |
| Median Family Income | 3,389 | $86,935 |
| Mean Family Income | 3,389 | $105,094 |
| Median Household Income | 5,066 | $66,824 |
| Mean Household Income | 5,066 | $85,320 |
| Income Deficit | 3,389 | $0 |
| Wage / Income Gap (%) | 10,821 | 1.72% |
| Wage / Income Gap ($) | 10,821 | 98.28¢ per $1 |
| Gini / Inequality Index | 10,821 | 0.44 |
Earnings by Sex in Sugarmill Woods
Average Earnings in Sugarmill Woods are $50,938, $51,145 for men and $50,265 for women, a difference of 1.7%.
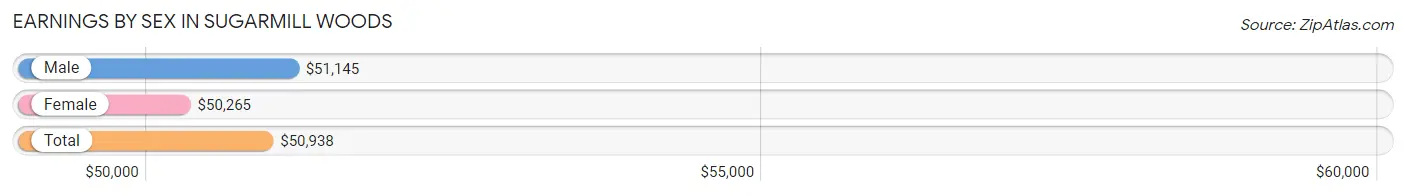
| Sex | Number | Average Earnings |
| Male | 1,916 (54.5%) | $51,145 |
| Female | 1,597 (45.5%) | $50,265 |
| Total | 3,513 (100.0%) | $50,938 |
Earnings by Sex by Income Bracket in Sugarmill Woods
The most common earnings brackets in Sugarmill Woods are $75,000 to $99,999 for men (378 | 19.7%) and $55,000 to $64,999 for women (362 | 22.7%).
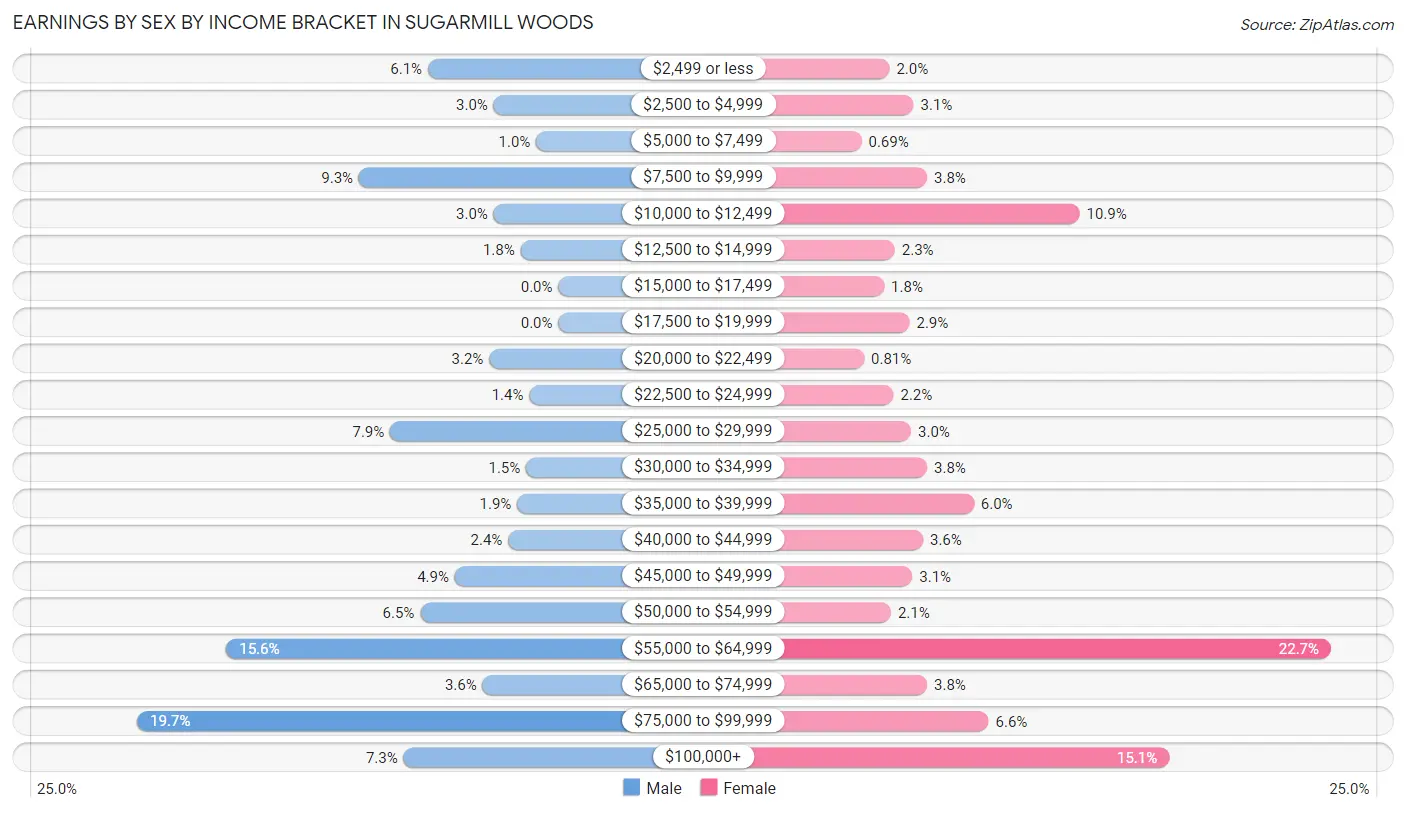
| Income | Male | Female |
| $2,499 or less | 117 (6.1%) | 32 (2.0%) |
| $2,500 to $4,999 | 58 (3.0%) | 50 (3.1%) |
| $5,000 to $7,499 | 20 (1.0%) | 11 (0.7%) |
| $7,500 to $9,999 | 179 (9.3%) | 60 (3.8%) |
| $10,000 to $12,499 | 58 (3.0%) | 174 (10.9%) |
| $12,500 to $14,999 | 34 (1.8%) | 36 (2.2%) |
| $15,000 to $17,499 | 0 (0.0%) | 28 (1.8%) |
| $17,500 to $19,999 | 0 (0.0%) | 47 (2.9%) |
| $20,000 to $22,499 | 62 (3.2%) | 13 (0.8%) |
| $22,500 to $24,999 | 26 (1.4%) | 35 (2.2%) |
| $25,000 to $29,999 | 151 (7.9%) | 48 (3.0%) |
| $30,000 to $34,999 | 29 (1.5%) | 60 (3.8%) |
| $35,000 to $39,999 | 37 (1.9%) | 95 (5.9%) |
| $40,000 to $44,999 | 45 (2.4%) | 57 (3.6%) |
| $45,000 to $49,999 | 93 (4.9%) | 49 (3.1%) |
| $50,000 to $54,999 | 124 (6.5%) | 33 (2.1%) |
| $55,000 to $64,999 | 298 (15.5%) | 362 (22.7%) |
| $65,000 to $74,999 | 68 (3.5%) | 60 (3.8%) |
| $75,000 to $99,999 | 378 (19.7%) | 106 (6.6%) |
| $100,000+ | 139 (7.2%) | 241 (15.1%) |
| Total | 1,916 (100.0%) | 1,597 (100.0%) |
Earnings by Sex by Educational Attainment in Sugarmill Woods
Average earnings in Sugarmill Woods are $59,160 for men and $55,867 for women, a difference of 5.6%. Men with an educational attainment of bachelor's degree enjoy the highest average annual earnings of $89,643, while those with graduate degree education earn the least with $47,269. Women with an educational attainment of bachelor's degree earn the most with the average annual earnings of $75,729, while those with less than high school education have the smallest earnings of $30,625.
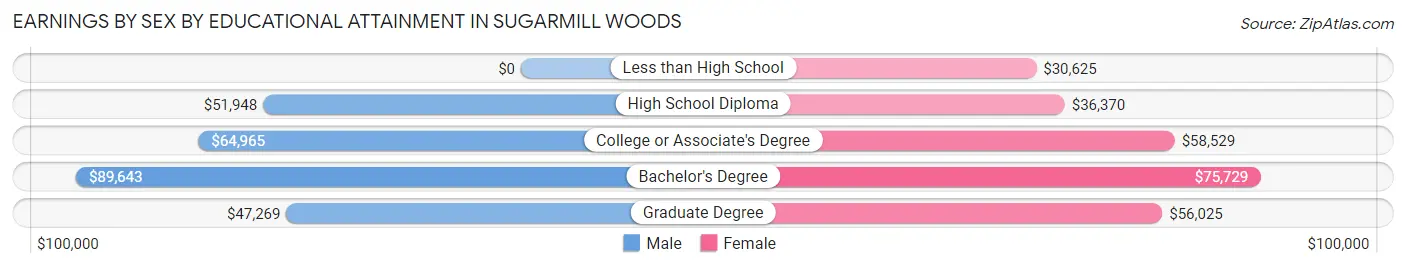
| Educational Attainment | Male Income | Female Income |
| Less than High School | - | - |
| High School Diploma | $51,948 | $36,370 |
| College or Associate's Degree | $64,965 | $58,529 |
| Bachelor's Degree | $89,643 | $75,729 |
| Graduate Degree | $47,269 | $56,025 |
| Total | $59,160 | $55,867 |
Family Income in Sugarmill Woods
Family Income Brackets in Sugarmill Woods
According to the Sugarmill Woods family income data, there are 783 families falling into the $50,000 to $74,999 income range, which is the most common income bracket and makes up 23.1% of all families. Conversely, the less than $10,000 income bracket is the least frequent group with only 27 families (0.8%) belonging to this category.
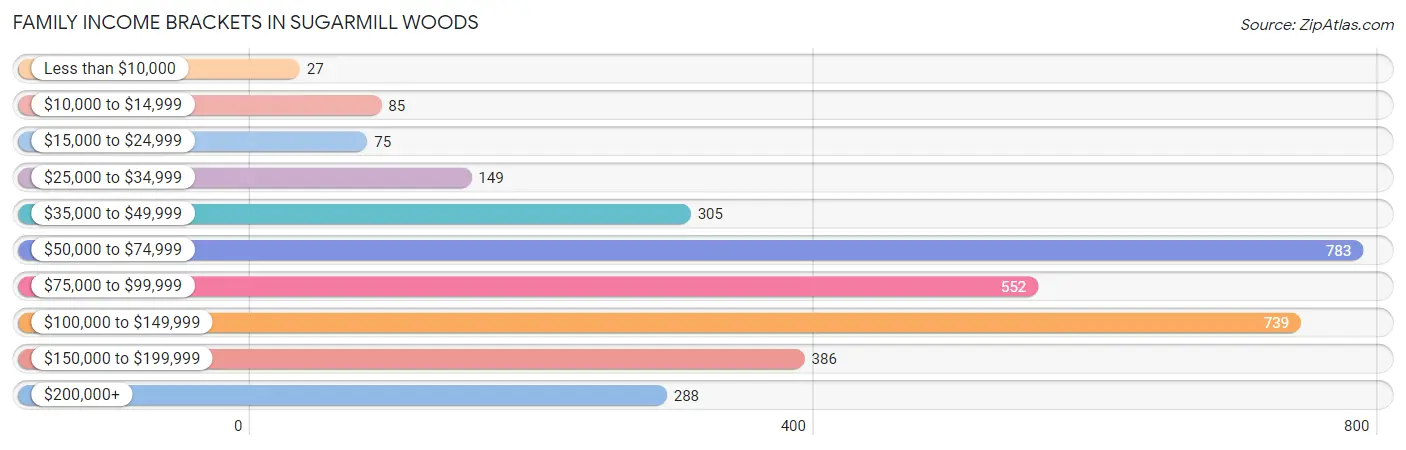
| Income Bracket | # Families | % Families |
| Less than $10,000 | 27 | 0.8% |
| $10,000 to $14,999 | 85 | 2.5% |
| $15,000 to $24,999 | 75 | 2.2% |
| $25,000 to $34,999 | 149 | 4.4% |
| $35,000 to $49,999 | 305 | 9.0% |
| $50,000 to $74,999 | 783 | 23.1% |
| $75,000 to $99,999 | 552 | 16.3% |
| $100,000 to $149,999 | 739 | 21.8% |
| $150,000 to $199,999 | 386 | 11.4% |
| $200,000+ | 288 | 8.5% |
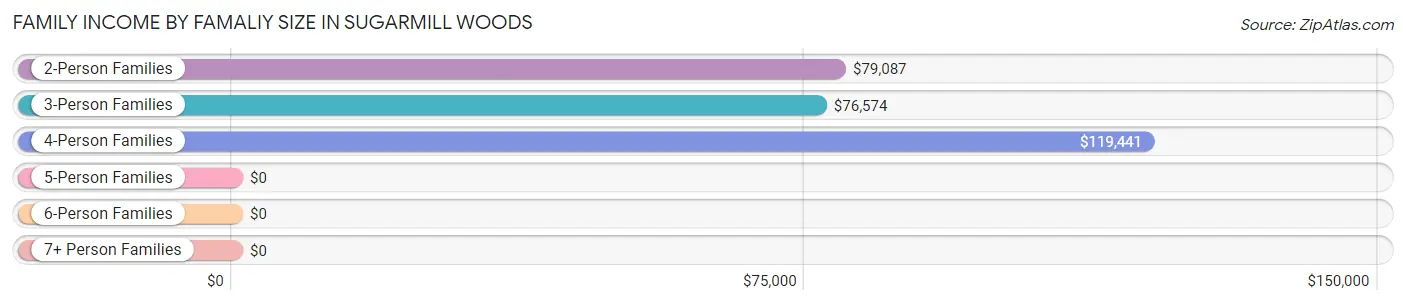
Family Income by Famaliy Size in Sugarmill Woods
4-person families (357 | 10.5%) account for the highest median family income in Sugarmill Woods with $119,441 per family, while 2-person families (2,425 | 71.6%) have the highest median income of $39,544 per family member.
| Income Bracket | # Families | Median Income |
| 2-Person Families | 2,425 (71.6%) | $79,087 |
| 3-Person Families | 534 (15.8%) | $76,574 |
| 4-Person Families | 357 (10.5%) | $119,441 |
| 5-Person Families | 73 (2.1%) | $0 |
| 6-Person Families | 0 (0.0%) | $0 |
| 7+ Person Families | 0 (0.0%) | $0 |
| Total | 3,389 (100.0%) | $86,935 |
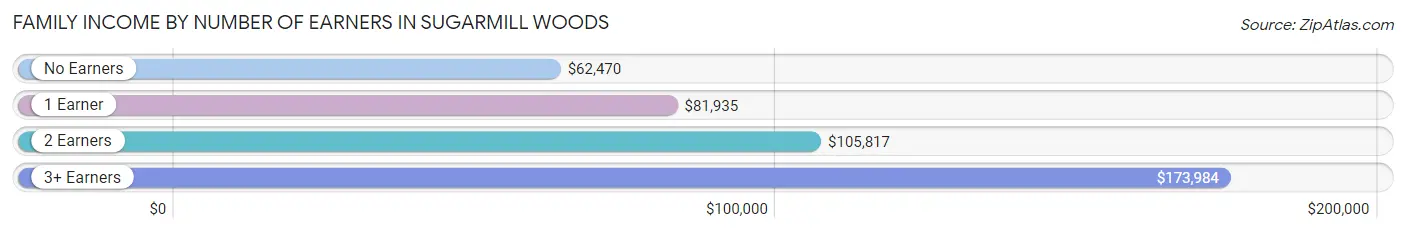
Family Income by Number of Earners in Sugarmill Woods
The median family income in Sugarmill Woods is $86,935, with families comprising 3+ earners (284) having the highest median family income of $173,984, while families with no earners (1,704) have the lowest median family income of $62,470, accounting for 8.4% and 50.3% of families, respectively.
| Number of Earners | # Families | Median Income |
| No Earners | 1,704 (50.3%) | $62,470 |
| 1 Earner | 926 (27.3%) | $81,935 |
| 2 Earners | 475 (14.0%) | $105,817 |
| 3+ Earners | 284 (8.4%) | $173,984 |
| Total | 3,389 (100.0%) | $86,935 |
Household Income in Sugarmill Woods
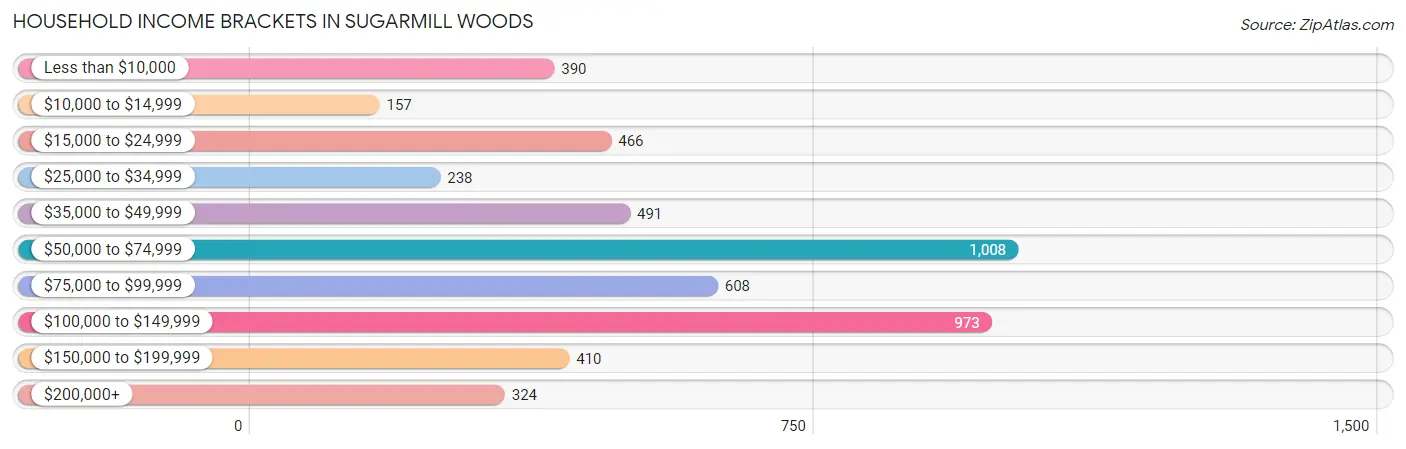
Household Income Brackets in Sugarmill Woods
With 1,008 households falling in the category, the $50,000 to $74,999 income range is the most frequent in Sugarmill Woods, accounting for 19.9% of all households. In contrast, only 157 households (3.1%) fall into the $10,000 to $14,999 income bracket, making it the least populous group.
| Income Bracket | # Households | % Households |
| Less than $10,000 | 390 | 7.7% |
| $10,000 to $14,999 | 157 | 3.1% |
| $15,000 to $24,999 | 466 | 9.2% |
| $25,000 to $34,999 | 238 | 4.7% |
| $35,000 to $49,999 | 491 | 9.7% |
| $50,000 to $74,999 | 1,008 | 19.9% |
| $75,000 to $99,999 | 608 | 12.0% |
| $100,000 to $149,999 | 973 | 19.2% |
| $150,000 to $199,999 | 410 | 8.1% |
| $200,000+ | 324 | 6.4% |
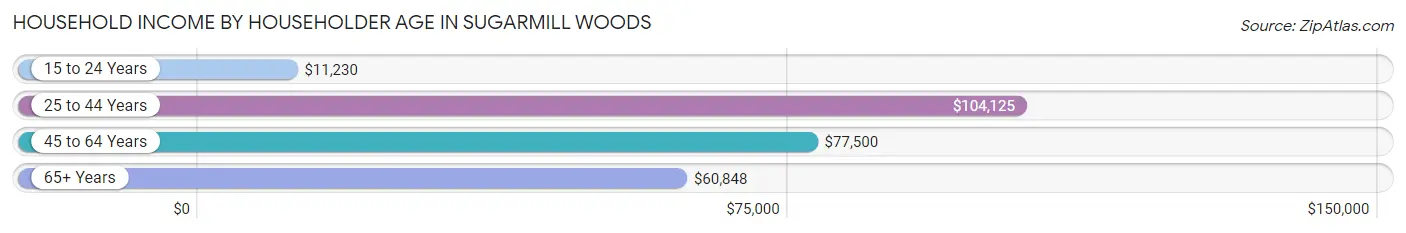
Household Income by Householder Age in Sugarmill Woods
The median household income in Sugarmill Woods is $66,824, with the highest median household income of $104,125 found in the 25 to 44 years age bracket for the primary householder. A total of 501 households (9.9%) fall into this category. Meanwhile, the 15 to 24 years age bracket for the primary householder has the lowest median household income of $11,230, with 75 households (1.5%) in this group.
| Income Bracket | # Households | Median Income |
| 15 to 24 Years | 75 (1.5%) | $11,230 |
| 25 to 44 Years | 501 (9.9%) | $104,125 |
| 45 to 64 Years | 1,186 (23.4%) | $77,500 |
| 65+ Years | 3,304 (65.2%) | $60,848 |
| Total | 5,066 (100.0%) | $66,824 |
Poverty in Sugarmill Woods
Income Below Poverty by Sex and Age in Sugarmill Woods
With 6.8% poverty level for males and 7.7% for females among the residents of Sugarmill Woods, under 5 year old males and 18 to 24 year old females are the most vulnerable to poverty, with 72 males (66.7%) and 69 females (34.3%) in their respective age groups living below the poverty level.
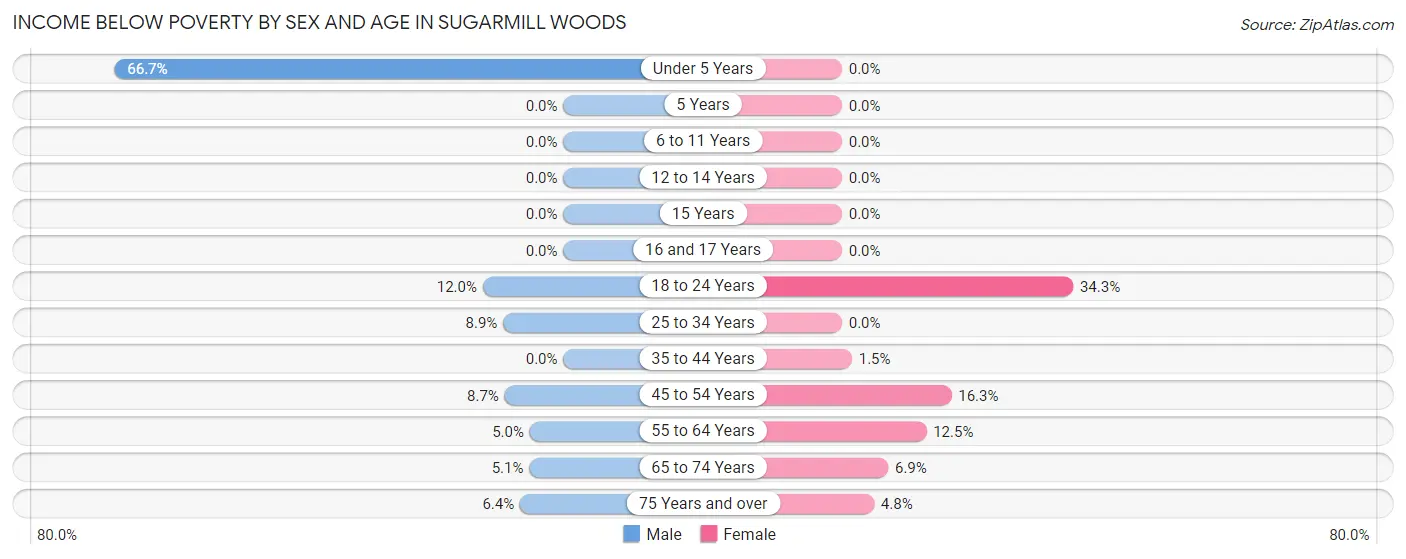
| Age Bracket | Male | Female |
| Under 5 Years | 72 (66.7%) | 0 (0.0%) |
| 5 Years | 0 (0.0%) | 0 (0.0%) |
| 6 to 11 Years | 0 (0.0%) | 0 (0.0%) |
| 12 to 14 Years | 0 (0.0%) | 0 (0.0%) |
| 15 Years | 0 (0.0%) | 0 (0.0%) |
| 16 and 17 Years | 0 (0.0%) | 0 (0.0%) |
| 18 to 24 Years | 39 (12.0%) | 69 (34.3%) |
| 25 to 34 Years | 22 (8.9%) | 0 (0.0%) |
| 35 to 44 Years | 0 (0.0%) | 7 (1.5%) |
| 45 to 54 Years | 44 (8.7%) | 73 (16.3%) |
| 55 to 64 Years | 32 (5.0%) | 112 (12.5%) |
| 65 to 74 Years | 64 (5.1%) | 93 (6.9%) |
| 75 Years and over | 87 (6.4%) | 65 (4.8%) |
| Total | 360 (6.8%) | 419 (7.7%) |
Income Above Poverty by Sex and Age in Sugarmill Woods
According to the poverty statistics in Sugarmill Woods, males aged 5 years and females aged under 5 years are the age groups that are most secure financially, with 100.0% of males and 100.0% of females in these age groups living above the poverty line.
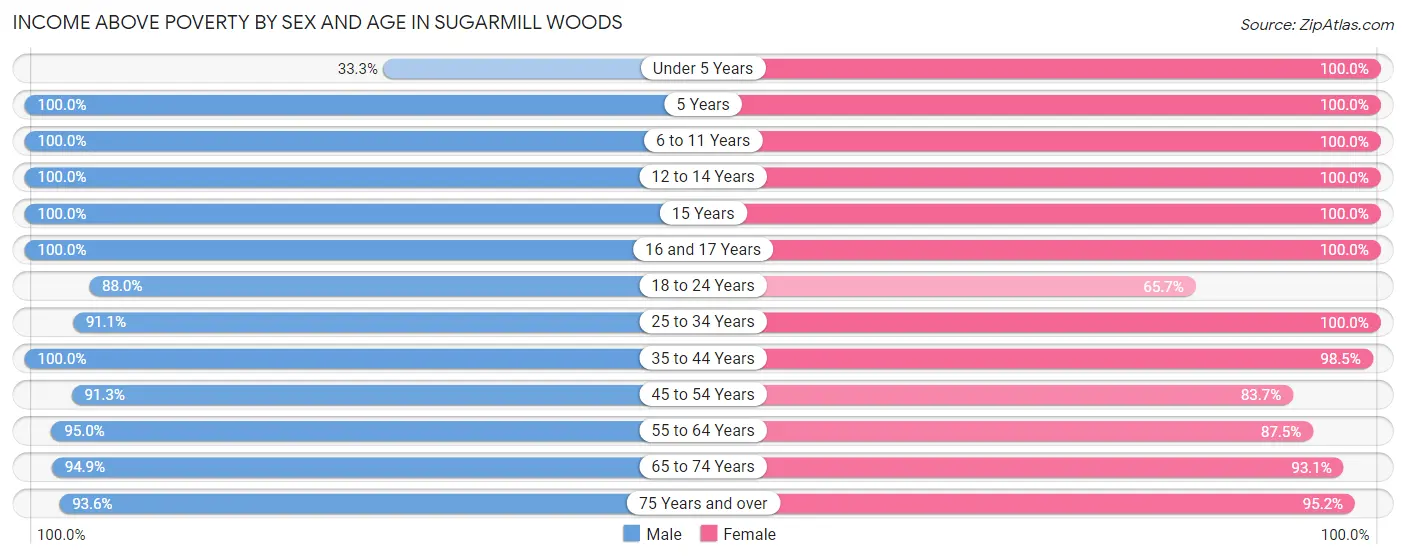
| Age Bracket | Male | Female |
| Under 5 Years | 36 (33.3%) | 71 (100.0%) |
| 5 Years | 35 (100.0%) | 21 (100.0%) |
| 6 to 11 Years | 136 (100.0%) | 73 (100.0%) |
| 12 to 14 Years | 188 (100.0%) | 334 (100.0%) |
| 15 Years | 37 (100.0%) | 64 (100.0%) |
| 16 and 17 Years | 200 (100.0%) | 38 (100.0%) |
| 18 to 24 Years | 287 (88.0%) | 132 (65.7%) |
| 25 to 34 Years | 224 (91.1%) | 112 (100.0%) |
| 35 to 44 Years | 294 (100.0%) | 465 (98.5%) |
| 45 to 54 Years | 461 (91.3%) | 376 (83.7%) |
| 55 to 64 Years | 611 (95.0%) | 781 (87.5%) |
| 65 to 74 Years | 1,202 (94.9%) | 1,260 (93.1%) |
| 75 Years and over | 1,265 (93.6%) | 1,299 (95.2%) |
| Total | 4,976 (93.2%) | 5,026 (92.3%) |
Income Below Poverty Among Married-Couple Families in Sugarmill Woods
The poverty statistics for married-couple families in Sugarmill Woods show that 1.8% or 55 of the total 3,108 families live below the poverty line. Families with no children have the highest poverty rate of 2.2%, comprising of 55 families. On the other hand, families with 1 or 2 children have the lowest poverty rate of 0.0%, which includes 0 families.
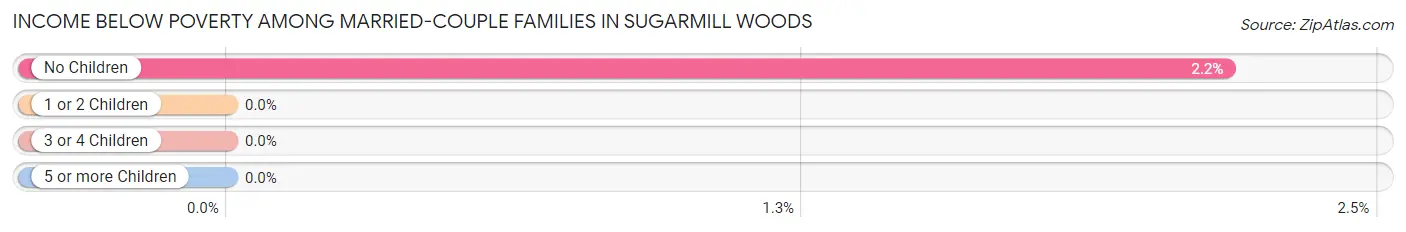
| Children | Above Poverty | Below Poverty |
| No Children | 2,478 (97.8%) | 55 (2.2%) |
| 1 or 2 Children | 527 (100.0%) | 0 (0.0%) |
| 3 or 4 Children | 48 (100.0%) | 0 (0.0%) |
| 5 or more Children | 0 (0.0%) | 0 (0.0%) |
| Total | 3,053 (98.2%) | 55 (1.8%) |
Income Below Poverty Among Single-Parent Households in Sugarmill Woods
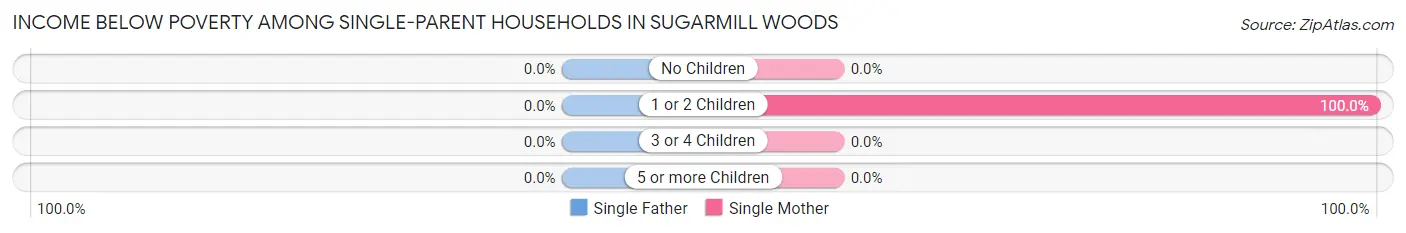
| Children | Single Father | Single Mother |
| No Children | 0 (0.0%) | 0 (0.0%) |
| 1 or 2 Children | 0 (0.0%) | 62 (100.0%) |
| 3 or 4 Children | 0 (0.0%) | 0 (0.0%) |
| 5 or more Children | 0 (0.0%) | 0 (0.0%) |
| Total | 0 (0.0%) | 62 (38.8%) |
Income Below Poverty Among Married-Couple vs Single-Parent Households in Sugarmill Woods
The poverty data for Sugarmill Woods shows that 55 of the married-couple family households (1.8%) and 62 of the single-parent households (22.1%) are living below the poverty level. Within the married-couple family households, those with no children have the highest poverty rate, with 55 households (2.2%) falling below the poverty line. Among the single-parent households, those with 1 or 2 children have the highest poverty rate, with 62 household (100.0%) living below poverty.
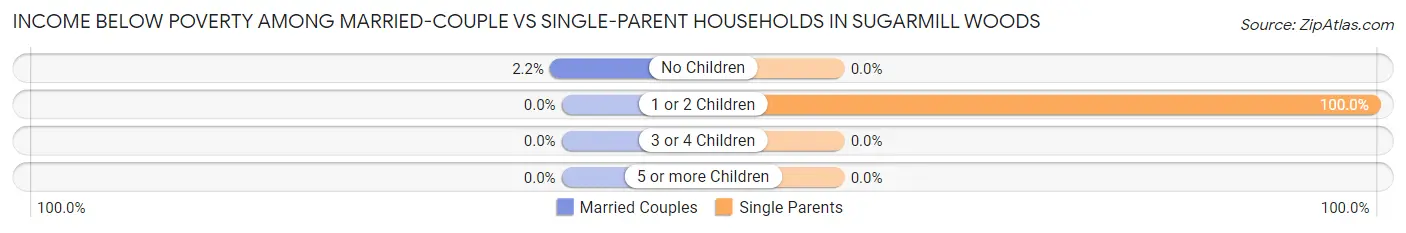
| Children | Married-Couple Families | Single-Parent Households |
| No Children | 55 (2.2%) | 0 (0.0%) |
| 1 or 2 Children | 0 (0.0%) | 62 (100.0%) |
| 3 or 4 Children | 0 (0.0%) | 0 (0.0%) |
| 5 or more Children | 0 (0.0%) | 0 (0.0%) |
| Total | 55 (1.8%) | 62 (22.1%) |
Employment Characteristics in Sugarmill Woods
Employment by Class of Employer in Sugarmill Woods
Among the 2,996 employed individuals in Sugarmill Woods, private company employees (2,254 | 75.2%), local government employees (361 | 12.0%), and self-employed (not incorporated) (203 | 6.8%) make up the most common classes of employment.
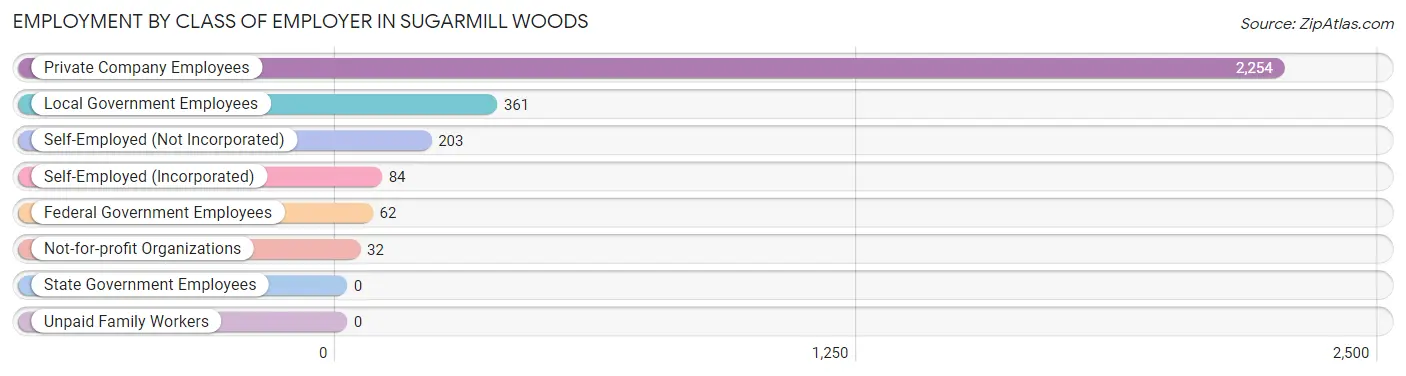
| Employer Class | # Employees | % Employees |
| Private Company Employees | 2,254 | 75.2% |
| Self-Employed (Incorporated) | 84 | 2.8% |
| Self-Employed (Not Incorporated) | 203 | 6.8% |
| Not-for-profit Organizations | 32 | 1.1% |
| Local Government Employees | 361 | 12.0% |
| State Government Employees | 0 | 0.0% |
| Federal Government Employees | 62 | 2.1% |
| Unpaid Family Workers | 0 | 0.0% |
| Total | 2,996 | 100.0% |
Employment Status by Age in Sugarmill Woods
According to the labor force statistics for Sugarmill Woods, out of the total population over 16 years of age (9,738), 33.8% or 3,291 individuals are in the labor force, with 4.6% or 151 of them unemployed. The age group with the highest labor force participation rate is 25 to 29 years, with 100.0% or 117 individuals in the labor force. Within the labor force, the 45 to 54 years age range has the highest percentage of unemployed individuals, with 11.5% or 79 of them being unemployed.
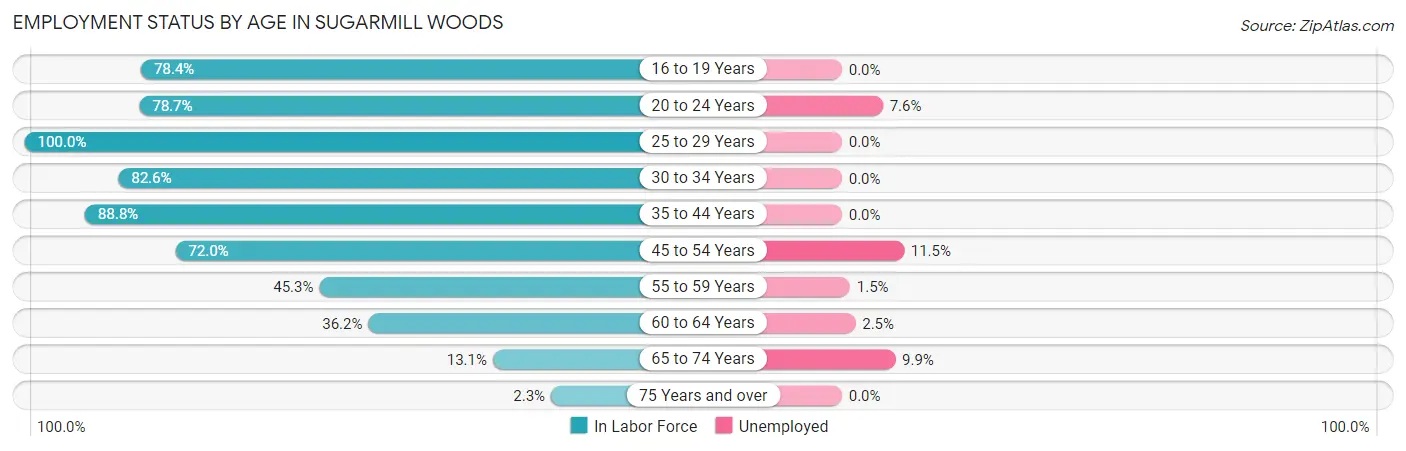
| Age Bracket | In Labor Force | Unemployed |
| 16 to 19 Years | 257 (78.4%) | 0 (0.0%) |
| 20 to 24 Years | 344 (78.7%) | 26 (7.6%) |
| 25 to 29 Years | 117 (100.0%) | 0 (0.0%) |
| 30 to 34 Years | 199 (82.6%) | 0 (0.0%) |
| 35 to 44 Years | 680 (88.8%) | 0 (0.0%) |
| 45 to 54 Years | 687 (72.0%) | 79 (11.5%) |
| 55 to 59 Years | 196 (45.3%) | 3 (1.5%) |
| 60 to 64 Years | 399 (36.2%) | 10 (2.5%) |
| 65 to 74 Years | 344 (13.1%) | 34 (9.9%) |
| 75 Years and over | 63 (2.3%) | 0 (0.0%) |
| Total | 3,291 (33.8%) | 151 (4.6%) |
Employment Status by Educational Attainment in Sugarmill Woods
According to labor force statistics for Sugarmill Woods, 63.0% of individuals (2,277) out of the total population between 25 and 64 years of age (3,614) are in the labor force, with 4.0% or 91 of them being unemployed. The group with the highest labor force participation rate are those with the educational attainment of bachelor's degree or higher, with 73.8% or 572 individuals in the labor force. Within the labor force, individuals with high school diploma education have the highest percentage of unemployment, with 8.1% or 48 of them being unemployed.
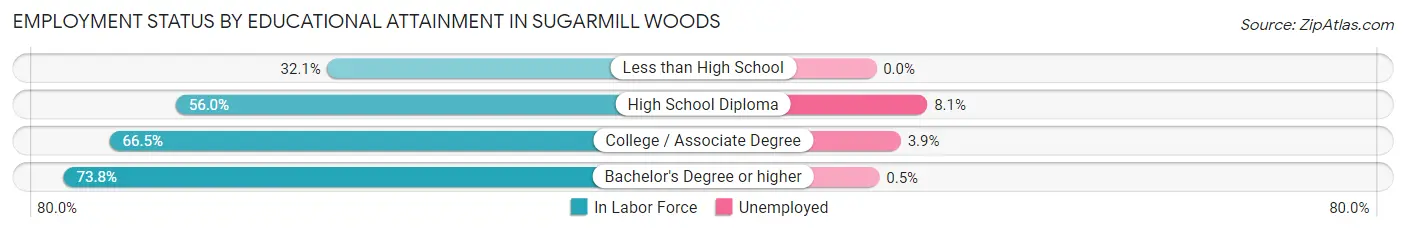
| Educational Attainment | In Labor Force | Unemployed |
| Less than High School | 67 (32.1%) | 0 (0.0%) |
| High School Diploma | 589 (56.0%) | 85 (8.1%) |
| College / Associate Degree | 1,050 (66.5%) | 62 (3.9%) |
| Bachelor's Degree or higher | 572 (73.8%) | 4 (0.5%) |
| Total | 2,277 (63.0%) | 145 (4.0%) |
Employment Occupations by Sex in Sugarmill Woods
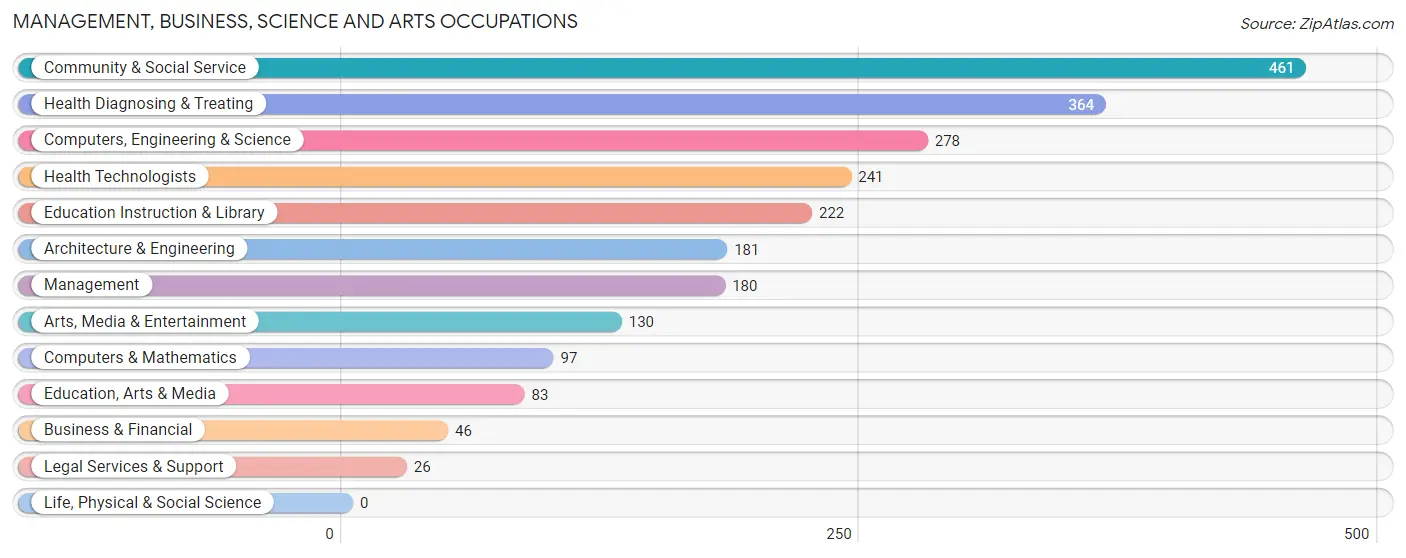
Management, Business, Science and Arts Occupations
The most common Management, Business, Science and Arts occupations in Sugarmill Woods are Community & Social Service (461 | 14.7%), Health Diagnosing & Treating (364 | 11.6%), Computers, Engineering & Science (278 | 8.9%), Health Technologists (241 | 7.7%), and Education Instruction & Library (222 | 7.1%).
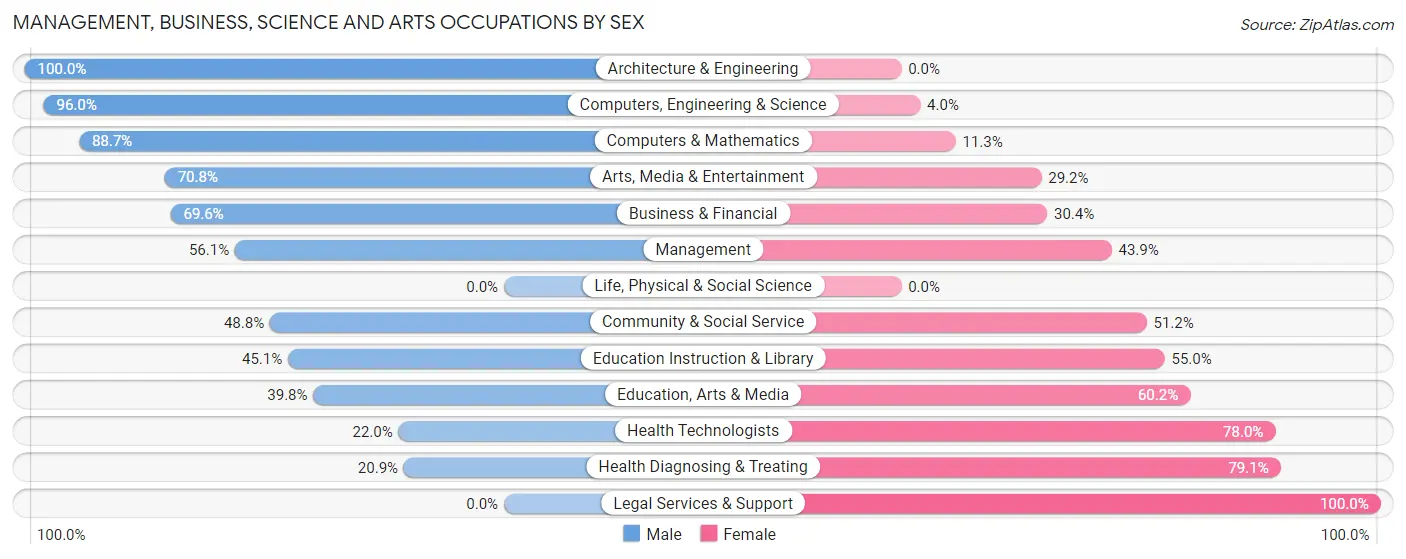
Management, Business, Science and Arts Occupations by Sex
Within the Management, Business, Science and Arts occupations in Sugarmill Woods, the most male-oriented occupations are Architecture & Engineering (100.0%), Computers, Engineering & Science (96.0%), and Computers & Mathematics (88.7%), while the most female-oriented occupations are Legal Services & Support (100.0%), Health Diagnosing & Treating (79.1%), and Health Technologists (78.0%).
| Occupation | Male | Female |
| Management | 101 (56.1%) | 79 (43.9%) |
| Business & Financial | 32 (69.6%) | 14 (30.4%) |
| Computers, Engineering & Science | 267 (96.0%) | 11 (4.0%) |
| Computers & Mathematics | 86 (88.7%) | 11 (11.3%) |
| Architecture & Engineering | 181 (100.0%) | 0 (0.0%) |
| Life, Physical & Social Science | 0 (0.0%) | 0 (0.0%) |
| Community & Social Service | 225 (48.8%) | 236 (51.2%) |
| Education, Arts & Media | 33 (39.8%) | 50 (60.2%) |
| Legal Services & Support | 0 (0.0%) | 26 (100.0%) |
| Education Instruction & Library | 100 (45.1%) | 122 (54.9%) |
| Arts, Media & Entertainment | 92 (70.8%) | 38 (29.2%) |
| Health Diagnosing & Treating | 76 (20.9%) | 288 (79.1%) |
| Health Technologists | 53 (22.0%) | 188 (78.0%) |
| Total (Category) | 701 (52.7%) | 628 (47.2%) |
| Total (Overall) | 1,720 (54.8%) | 1,416 (45.2%) |
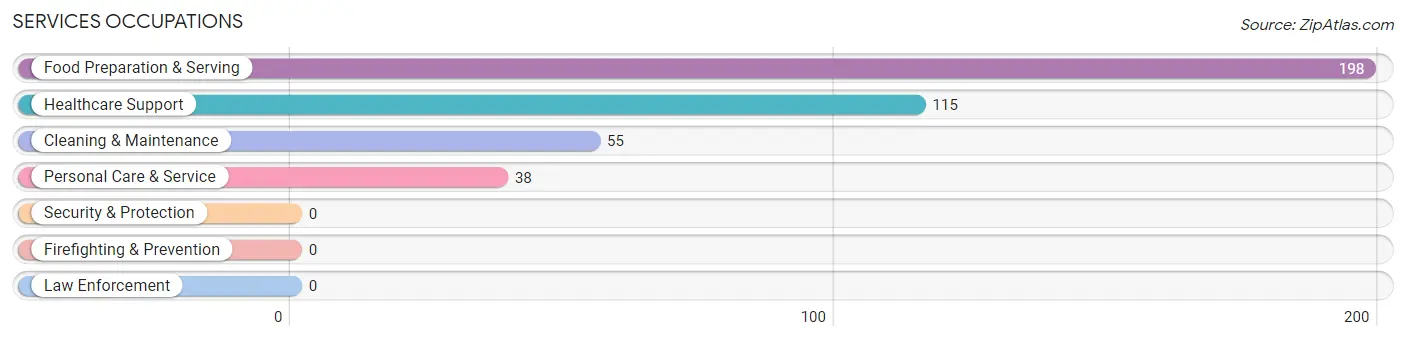
Services Occupations
The most common Services occupations in Sugarmill Woods are Food Preparation & Serving (198 | 6.3%), Healthcare Support (115 | 3.7%), Cleaning & Maintenance (55 | 1.8%), and Personal Care & Service (38 | 1.2%).
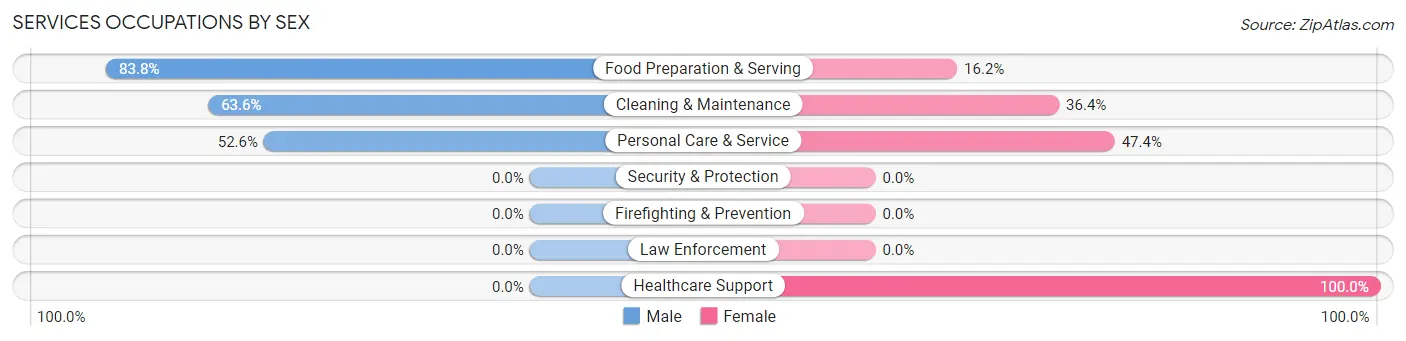
Services Occupations by Sex
Within the Services occupations in Sugarmill Woods, the most male-oriented occupations are Food Preparation & Serving (83.8%), Cleaning & Maintenance (63.6%), and Personal Care & Service (52.6%), while the most female-oriented occupations are Healthcare Support (100.0%), Personal Care & Service (47.4%), and Cleaning & Maintenance (36.4%).
| Occupation | Male | Female |
| Healthcare Support | 0 (0.0%) | 115 (100.0%) |
| Security & Protection | 0 (0.0%) | 0 (0.0%) |
| Firefighting & Prevention | 0 (0.0%) | 0 (0.0%) |
| Law Enforcement | 0 (0.0%) | 0 (0.0%) |
| Food Preparation & Serving | 166 (83.8%) | 32 (16.2%) |
| Cleaning & Maintenance | 35 (63.6%) | 20 (36.4%) |
| Personal Care & Service | 20 (52.6%) | 18 (47.4%) |
| Total (Category) | 221 (54.4%) | 185 (45.6%) |
| Total (Overall) | 1,720 (54.8%) | 1,416 (45.2%) |
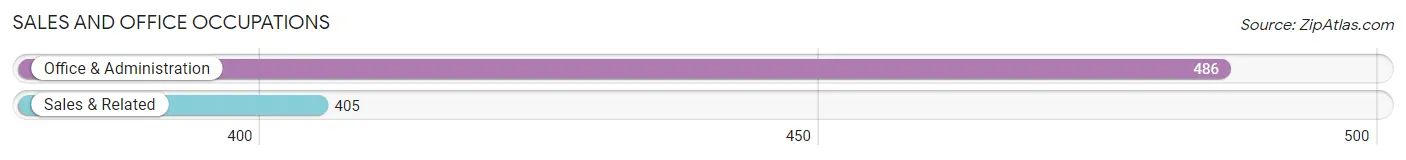
Sales and Office Occupations
The most common Sales and Office occupations in Sugarmill Woods are Office & Administration (486 | 15.5%), and Sales & Related (405 | 12.9%).
Sales and Office Occupations by Sex
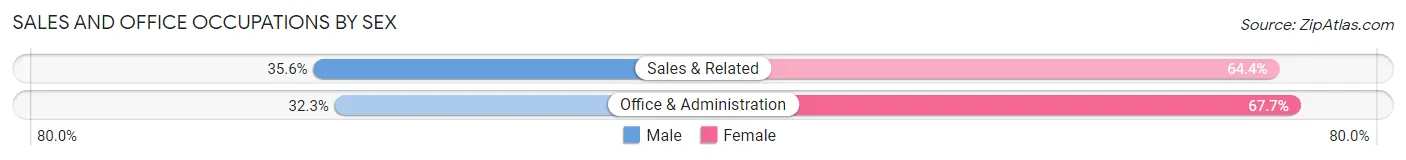
| Occupation | Male | Female |
| Sales & Related | 144 (35.6%) | 261 (64.4%) |
| Office & Administration | 157 (32.3%) | 329 (67.7%) |
| Total (Category) | 301 (33.8%) | 590 (66.2%) |
| Total (Overall) | 1,720 (54.8%) | 1,416 (45.2%) |
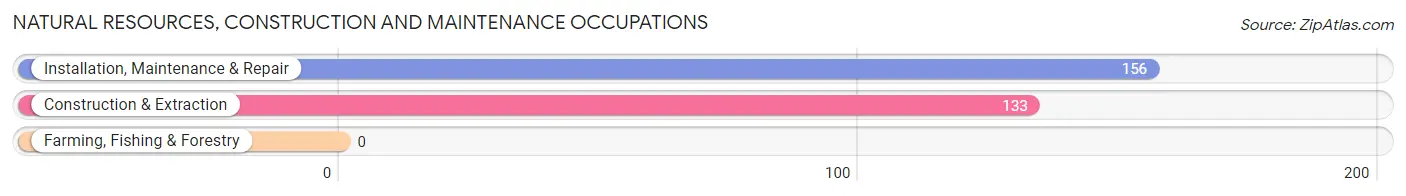
Natural Resources, Construction and Maintenance Occupations
The most common Natural Resources, Construction and Maintenance occupations in Sugarmill Woods are Installation, Maintenance & Repair (156 | 5.0%), and Construction & Extraction (133 | 4.2%).
Natural Resources, Construction and Maintenance Occupations by Sex
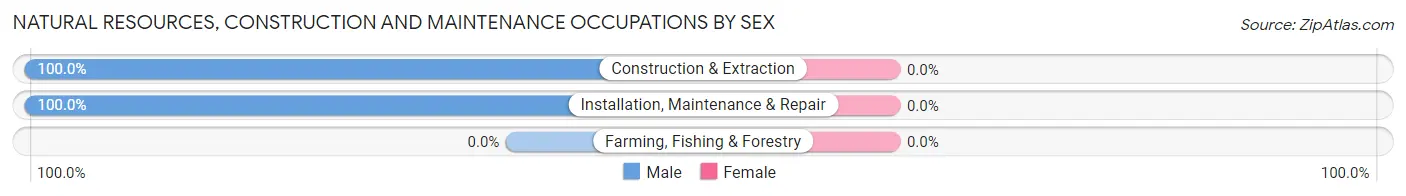
| Occupation | Male | Female |
| Farming, Fishing & Forestry | 0 (0.0%) | 0 (0.0%) |
| Construction & Extraction | 133 (100.0%) | 0 (0.0%) |
| Installation, Maintenance & Repair | 156 (100.0%) | 0 (0.0%) |
| Total (Category) | 289 (100.0%) | 0 (0.0%) |
| Total (Overall) | 1,720 (54.8%) | 1,416 (45.2%) |
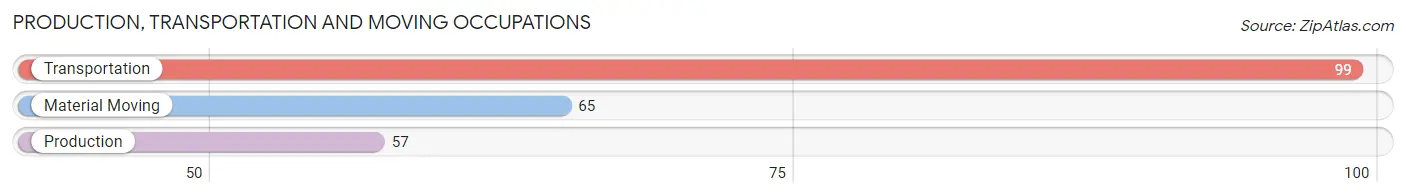
Production, Transportation and Moving Occupations
The most common Production, Transportation and Moving occupations in Sugarmill Woods are Transportation (99 | 3.2%), Material Moving (65 | 2.1%), and Production (57 | 1.8%).
Production, Transportation and Moving Occupations by Sex
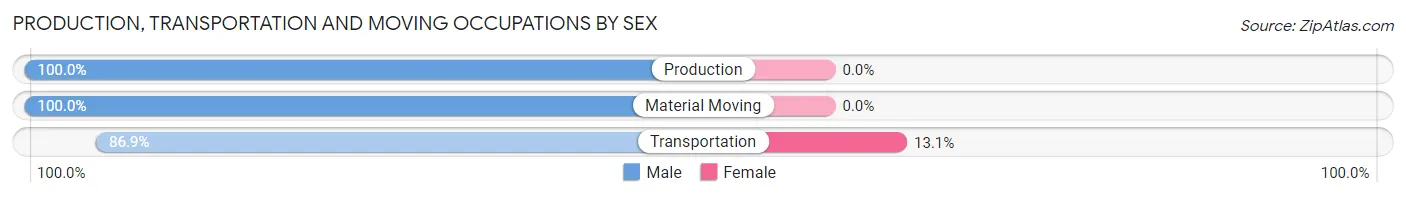
| Occupation | Male | Female |
| Production | 57 (100.0%) | 0 (0.0%) |
| Transportation | 86 (86.9%) | 13 (13.1%) |
| Material Moving | 65 (100.0%) | 0 (0.0%) |
| Total (Category) | 208 (94.1%) | 13 (5.9%) |
| Total (Overall) | 1,720 (54.8%) | 1,416 (45.2%) |
Employment Industries by Sex in Sugarmill Woods
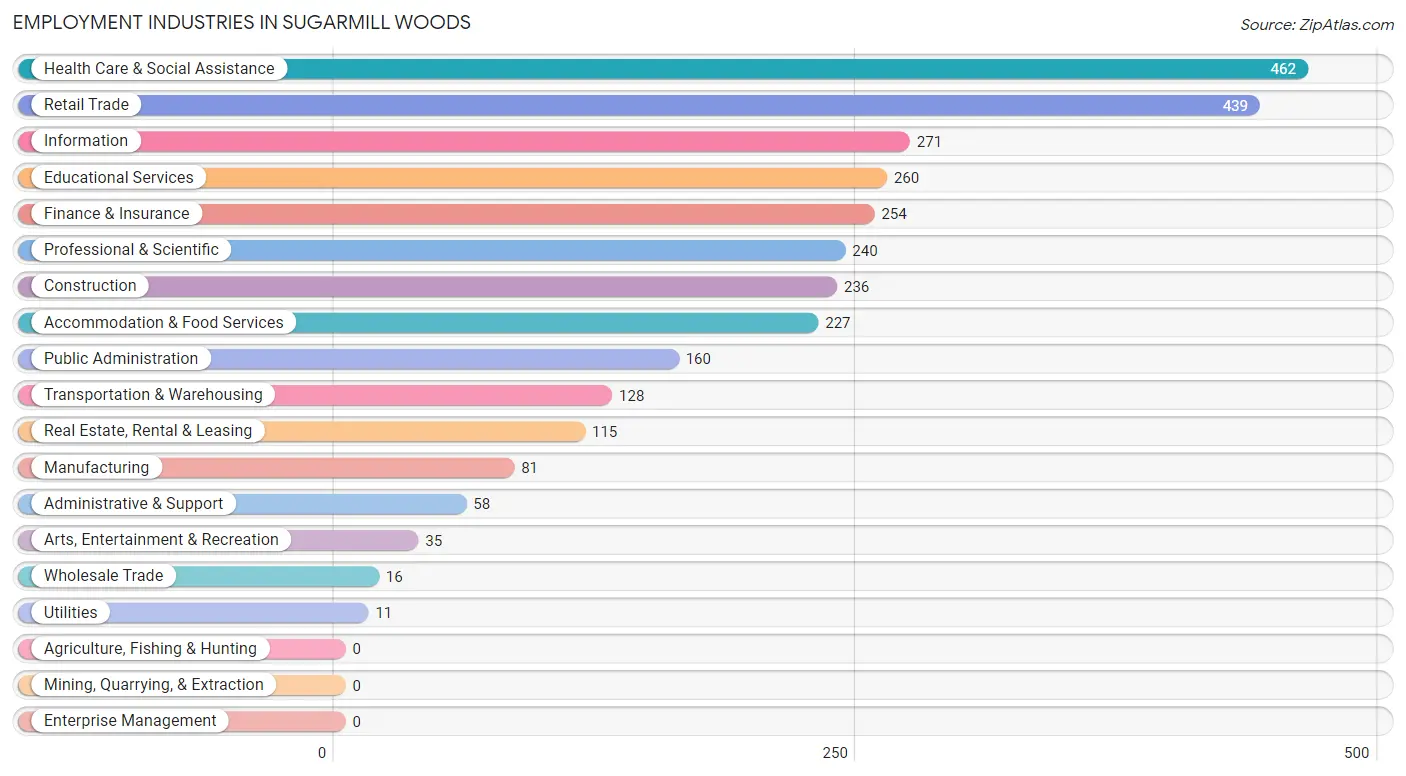
Employment Industries in Sugarmill Woods
The major employment industries in Sugarmill Woods include Health Care & Social Assistance (462 | 14.7%), Retail Trade (439 | 14.0%), Information (271 | 8.6%), Educational Services (260 | 8.3%), and Finance & Insurance (254 | 8.1%).
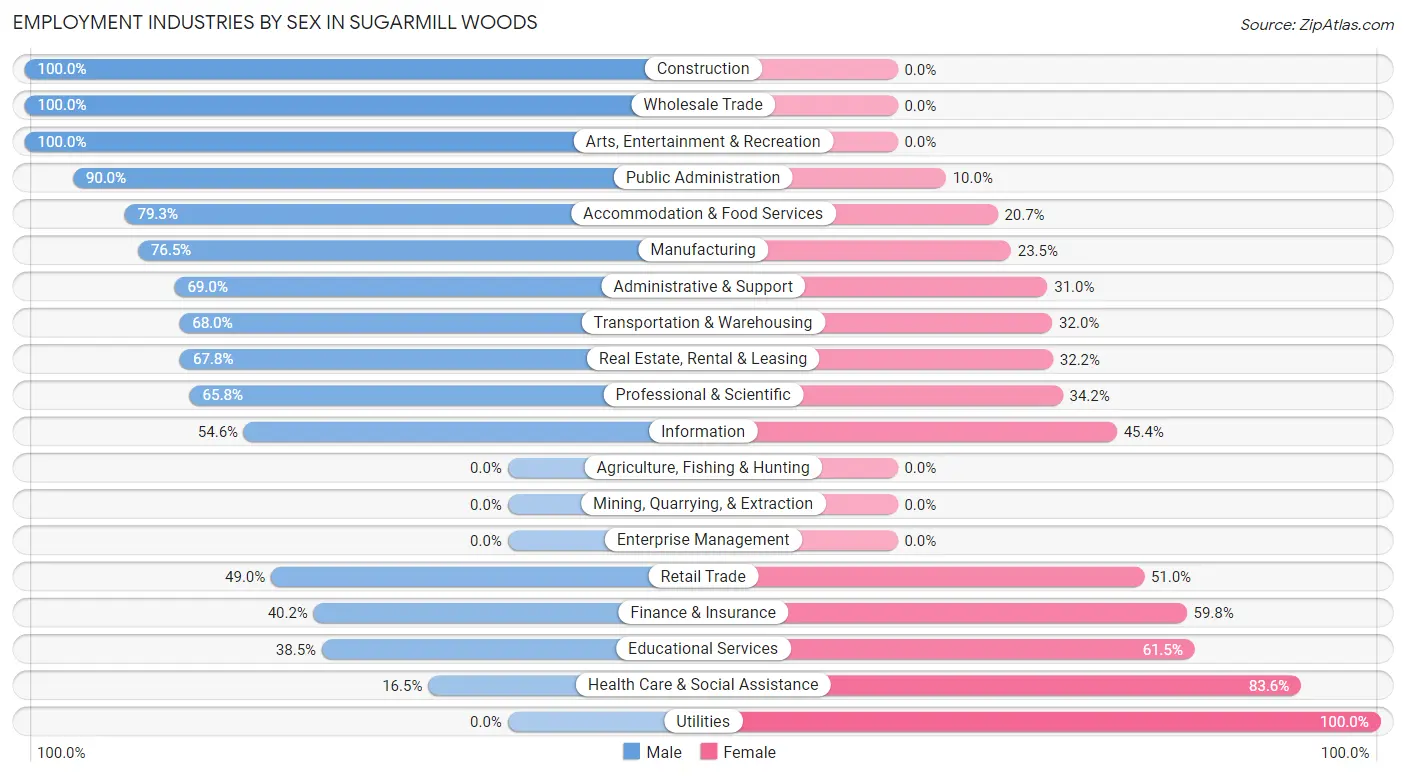
Employment Industries by Sex in Sugarmill Woods
The Sugarmill Woods industries that see more men than women are Construction (100.0%), Wholesale Trade (100.0%), and Arts, Entertainment & Recreation (100.0%), whereas the industries that tend to have a higher number of women are Utilities (100.0%), Health Care & Social Assistance (83.6%), and Educational Services (61.5%).
| Industry | Male | Female |
| Agriculture, Fishing & Hunting | 0 (0.0%) | 0 (0.0%) |
| Mining, Quarrying, & Extraction | 0 (0.0%) | 0 (0.0%) |
| Construction | 236 (100.0%) | 0 (0.0%) |
| Manufacturing | 62 (76.5%) | 19 (23.5%) |
| Wholesale Trade | 16 (100.0%) | 0 (0.0%) |
| Retail Trade | 215 (49.0%) | 224 (51.0%) |
| Transportation & Warehousing | 87 (68.0%) | 41 (32.0%) |
| Utilities | 0 (0.0%) | 11 (100.0%) |
| Information | 148 (54.6%) | 123 (45.4%) |
| Finance & Insurance | 102 (40.2%) | 152 (59.8%) |
| Real Estate, Rental & Leasing | 78 (67.8%) | 37 (32.2%) |
| Professional & Scientific | 158 (65.8%) | 82 (34.2%) |
| Enterprise Management | 0 (0.0%) | 0 (0.0%) |
| Administrative & Support | 40 (69.0%) | 18 (31.0%) |
| Educational Services | 100 (38.5%) | 160 (61.5%) |
| Health Care & Social Assistance | 76 (16.5%) | 386 (83.6%) |
| Arts, Entertainment & Recreation | 35 (100.0%) | 0 (0.0%) |
| Accommodation & Food Services | 180 (79.3%) | 47 (20.7%) |
| Public Administration | 144 (90.0%) | 16 (10.0%) |
| Total | 1,720 (54.8%) | 1,416 (45.2%) |
Education in Sugarmill Woods
School Enrollment in Sugarmill Woods
The most common levels of schooling among the 1,437 students in Sugarmill Woods are middle school (540 | 37.6%), high school (432 | 30.1%), and college / undergraduate (273 | 19.0%).
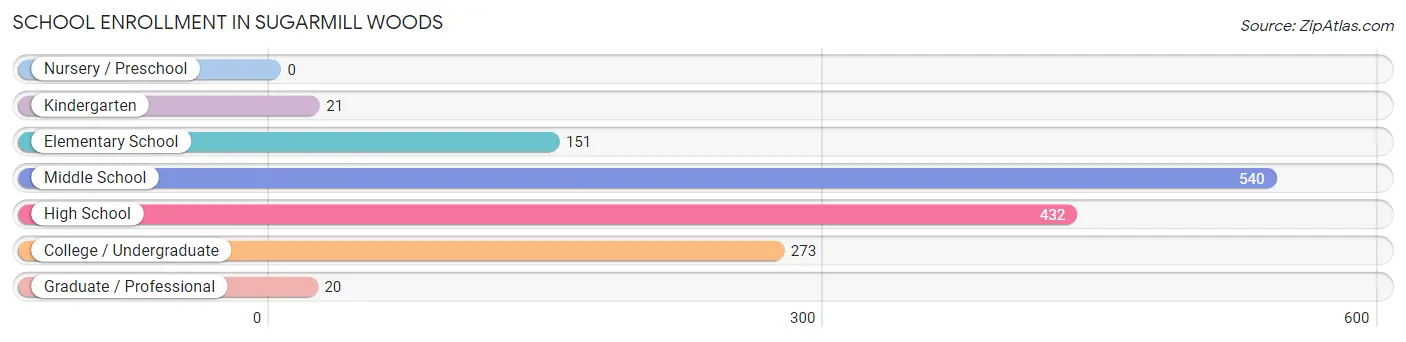
| School Level | # Students | % Students |
| Nursery / Preschool | 0 | 0.0% |
| Kindergarten | 21 | 1.5% |
| Elementary School | 151 | 10.5% |
| Middle School | 540 | 37.6% |
| High School | 432 | 30.1% |
| College / Undergraduate | 273 | 19.0% |
| Graduate / Professional | 20 | 1.4% |
| Total | 1,437 | 100.0% |
School Enrollment by Age by Funding Source in Sugarmill Woods
Out of a total of 1,437 students who are enrolled in schools in Sugarmill Woods, 33 (2.3%) attend a private institution, while the remaining 1,404 (97.7%) are enrolled in public schools. The age group of 20 to 24 year olds has the highest likelihood of being enrolled in private schools, with 33 (13.9% in the age bracket) enrolled. Conversely, the age group of 5 to 9 year old has the lowest likelihood of being enrolled in a private school, with 172 (100.0% in the age bracket) attending a public institution.
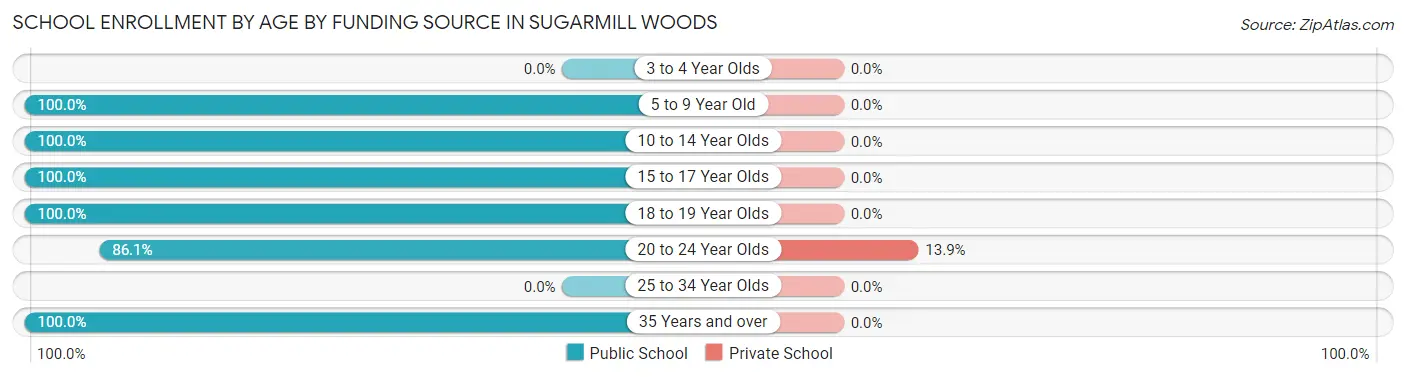
| Age Bracket | Public School | Private School |
| 3 to 4 Year Olds | 0 (0.0%) | 0 (0.0%) |
| 5 to 9 Year Old | 172 (100.0%) | 0 (0.0%) |
| 10 to 14 Year Olds | 596 (100.0%) | 0 (0.0%) |
| 15 to 17 Year Olds | 339 (100.0%) | 0 (0.0%) |
| 18 to 19 Year Olds | 50 (100.0%) | 0 (0.0%) |
| 20 to 24 Year Olds | 204 (86.1%) | 33 (13.9%) |
| 25 to 34 Year Olds | 0 (0.0%) | 0 (0.0%) |
| 35 Years and over | 43 (100.0%) | 0 (0.0%) |
| Total | 1,404 (97.7%) | 33 (2.3%) |
Educational Attainment by Field of Study in Sugarmill Woods
Education (619 | 26.8%), business (457 | 19.8%), science & technology (238 | 10.3%), engineering (204 | 8.8%), and arts & humanities (196 | 8.5%) are the most common fields of study among 2,313 individuals in Sugarmill Woods who have obtained a bachelor's degree or higher.
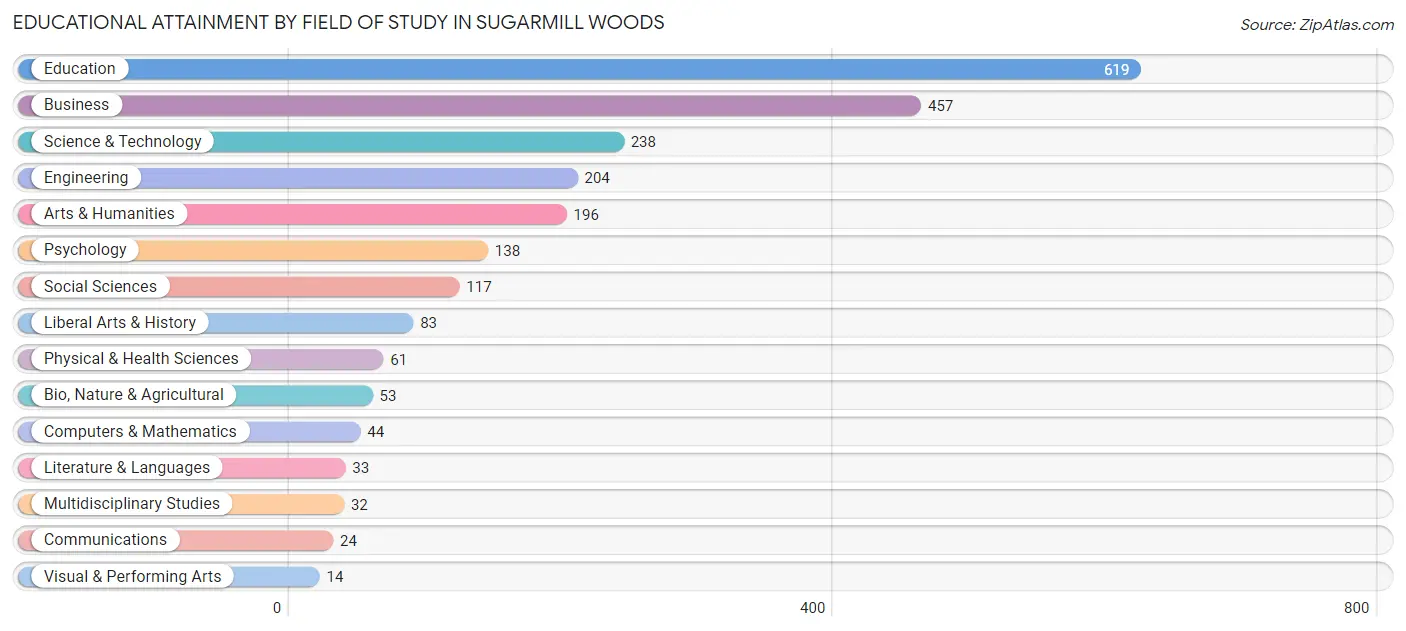
| Field of Study | # Graduates | % Graduates |
| Computers & Mathematics | 44 | 1.9% |
| Bio, Nature & Agricultural | 53 | 2.3% |
| Physical & Health Sciences | 61 | 2.6% |
| Psychology | 138 | 6.0% |
| Social Sciences | 117 | 5.1% |
| Engineering | 204 | 8.8% |
| Multidisciplinary Studies | 32 | 1.4% |
| Science & Technology | 238 | 10.3% |
| Business | 457 | 19.8% |
| Education | 619 | 26.8% |
| Literature & Languages | 33 | 1.4% |
| Liberal Arts & History | 83 | 3.6% |
| Visual & Performing Arts | 14 | 0.6% |
| Communications | 24 | 1.0% |
| Arts & Humanities | 196 | 8.5% |
| Total | 2,313 | 100.0% |
Transportation & Commute in Sugarmill Woods
Vehicle Availability by Sex in Sugarmill Woods
The most prevalent vehicle ownership categories in Sugarmill Woods are males with 3 vehicles (766, accounting for 46.5%) and females with 3 vehicles (304, making up 56.7%).
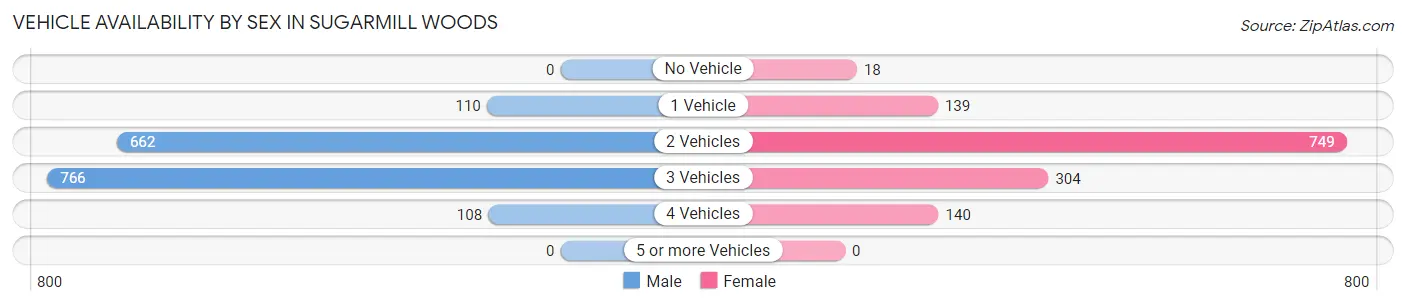
| Vehicles Available | Male | Female |
| No Vehicle | 0 (0.0%) | 18 (1.3%) |
| 1 Vehicle | 110 (6.7%) | 139 (10.3%) |
| 2 Vehicles | 662 (40.2%) | 749 (55.5%) |
| 3 Vehicles | 766 (46.5%) | 304 (22.5%) |
| 4 Vehicles | 108 (6.6%) | 140 (10.4%) |
| 5 or more Vehicles | 0 (0.0%) | 0 (0.0%) |
| Total | 1,646 (100.0%) | 1,350 (100.0%) |
Commute Time in Sugarmill Woods
The most frequently occuring commute durations in Sugarmill Woods are 30 to 34 minutes (789 commuters, 31.1%), 45 to 59 minutes (504 commuters, 19.9%), and 20 to 24 minutes (290 commuters, 11.5%).
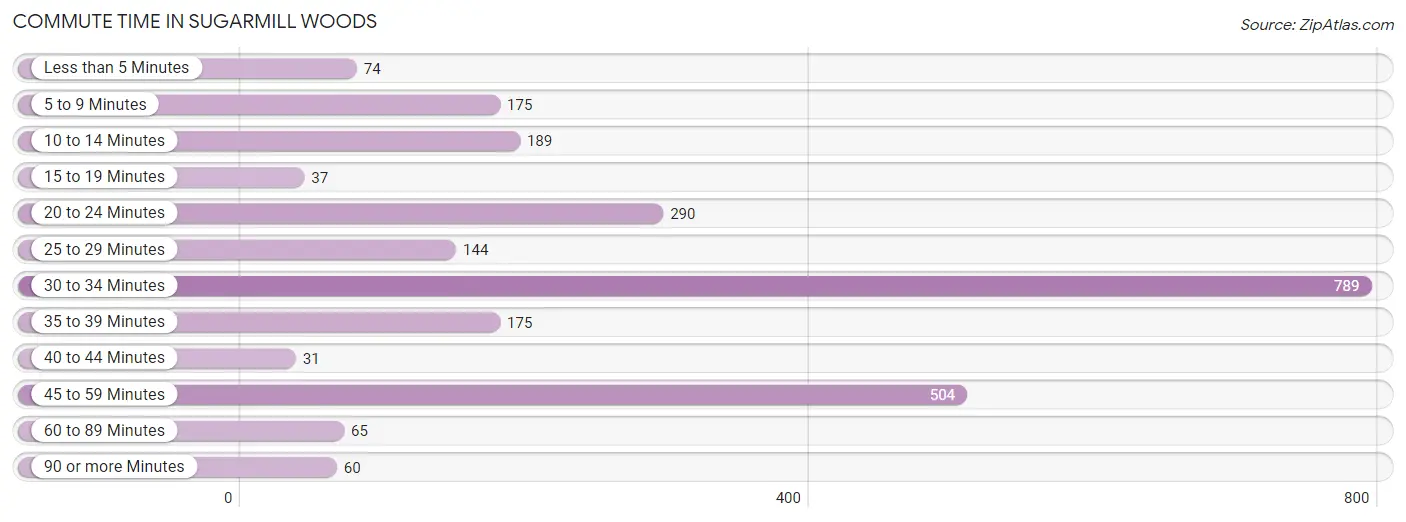
| Commute Time | # Commuters | % Commuters |
| Less than 5 Minutes | 74 | 2.9% |
| 5 to 9 Minutes | 175 | 6.9% |
| 10 to 14 Minutes | 189 | 7.5% |
| 15 to 19 Minutes | 37 | 1.5% |
| 20 to 24 Minutes | 290 | 11.5% |
| 25 to 29 Minutes | 144 | 5.7% |
| 30 to 34 Minutes | 789 | 31.1% |
| 35 to 39 Minutes | 175 | 6.9% |
| 40 to 44 Minutes | 31 | 1.2% |
| 45 to 59 Minutes | 504 | 19.9% |
| 60 to 89 Minutes | 65 | 2.6% |
| 90 or more Minutes | 60 | 2.4% |
Commute Time by Sex in Sugarmill Woods
The most common commute times in Sugarmill Woods are 30 to 34 minutes (499 commuters, 36.7%) for males and 45 to 59 minutes (302 commuters, 25.7%) for females.
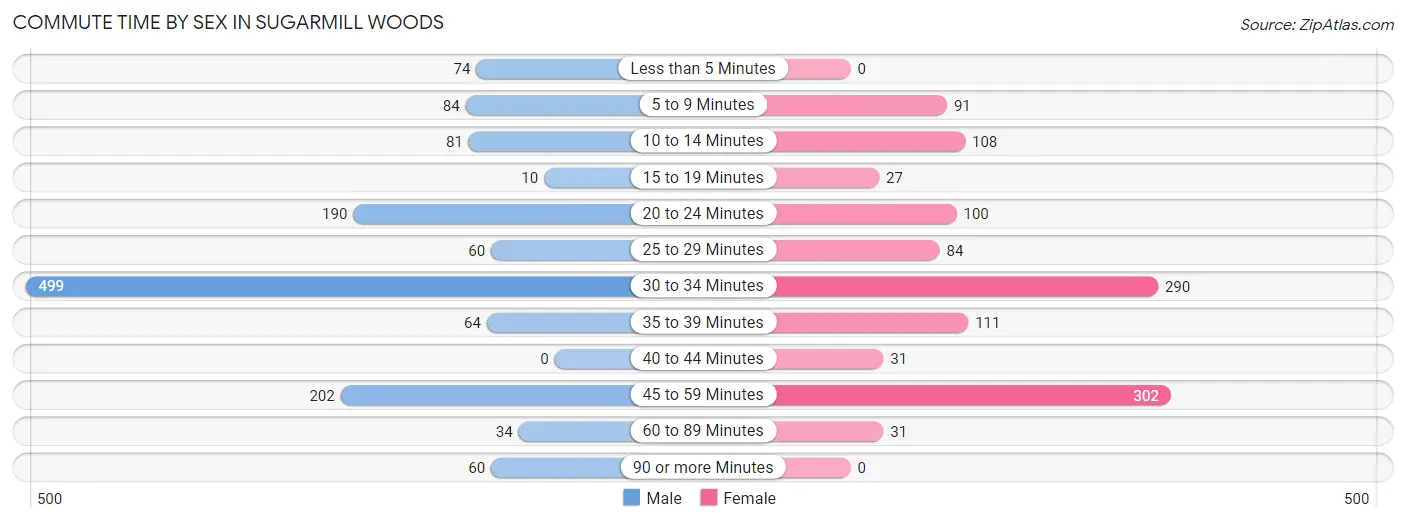
| Commute Time | Male | Female |
| Less than 5 Minutes | 74 (5.4%) | 0 (0.0%) |
| 5 to 9 Minutes | 84 (6.2%) | 91 (7.7%) |
| 10 to 14 Minutes | 81 (6.0%) | 108 (9.2%) |
| 15 to 19 Minutes | 10 (0.7%) | 27 (2.3%) |
| 20 to 24 Minutes | 190 (14.0%) | 100 (8.5%) |
| 25 to 29 Minutes | 60 (4.4%) | 84 (7.1%) |
| 30 to 34 Minutes | 499 (36.7%) | 290 (24.7%) |
| 35 to 39 Minutes | 64 (4.7%) | 111 (9.5%) |
| 40 to 44 Minutes | 0 (0.0%) | 31 (2.6%) |
| 45 to 59 Minutes | 202 (14.9%) | 302 (25.7%) |
| 60 to 89 Minutes | 34 (2.5%) | 31 (2.6%) |
| 90 or more Minutes | 60 (4.4%) | 0 (0.0%) |
Time of Departure to Work by Sex in Sugarmill Woods
The most frequent times of departure to work in Sugarmill Woods are 6:00 AM to 6:29 AM (275, 20.3%) for males and 4:00 PM to 11:59 PM (237, 20.2%) for females.
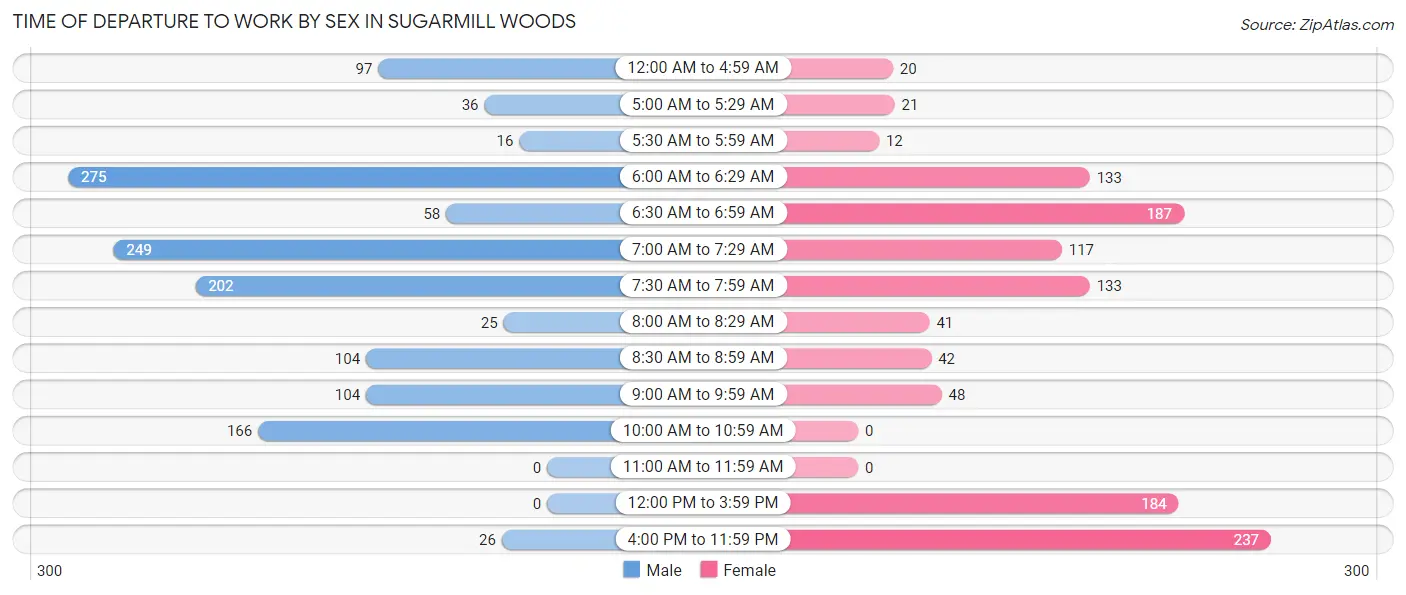
| Time of Departure | Male | Female |
| 12:00 AM to 4:59 AM | 97 (7.1%) | 20 (1.7%) |
| 5:00 AM to 5:29 AM | 36 (2.6%) | 21 (1.8%) |
| 5:30 AM to 5:59 AM | 16 (1.2%) | 12 (1.0%) |
| 6:00 AM to 6:29 AM | 275 (20.3%) | 133 (11.3%) |
| 6:30 AM to 6:59 AM | 58 (4.3%) | 187 (15.9%) |
| 7:00 AM to 7:29 AM | 249 (18.3%) | 117 (10.0%) |
| 7:30 AM to 7:59 AM | 202 (14.9%) | 133 (11.3%) |
| 8:00 AM to 8:29 AM | 25 (1.8%) | 41 (3.5%) |
| 8:30 AM to 8:59 AM | 104 (7.7%) | 42 (3.6%) |
| 9:00 AM to 9:59 AM | 104 (7.7%) | 48 (4.1%) |
| 10:00 AM to 10:59 AM | 166 (12.2%) | 0 (0.0%) |
| 11:00 AM to 11:59 AM | 0 (0.0%) | 0 (0.0%) |
| 12:00 PM to 3:59 PM | 0 (0.0%) | 184 (15.7%) |
| 4:00 PM to 11:59 PM | 26 (1.9%) | 237 (20.2%) |
| Total | 1,358 (100.0%) | 1,175 (100.0%) |
Housing Occupancy in Sugarmill Woods
Occupancy by Ownership in Sugarmill Woods
Of the total 5,066 dwellings in Sugarmill Woods, owner-occupied units account for 4,835 (95.4%), while renter-occupied units make up 231 (4.6%).
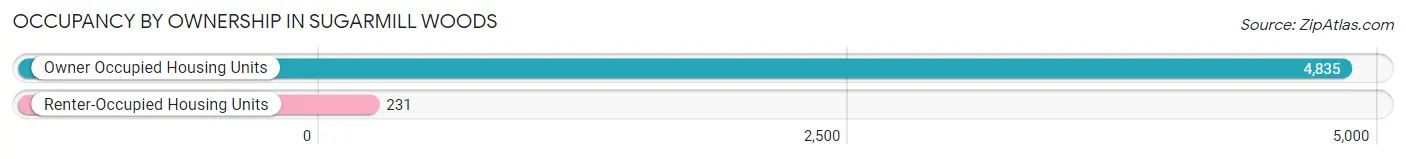
| Occupancy | # Housing Units | % Housing Units |
| Owner Occupied Housing Units | 4,835 | 95.4% |
| Renter-Occupied Housing Units | 231 | 4.6% |
| Total Occupied Housing Units | 5,066 | 100.0% |
Occupancy by Household Size in Sugarmill Woods
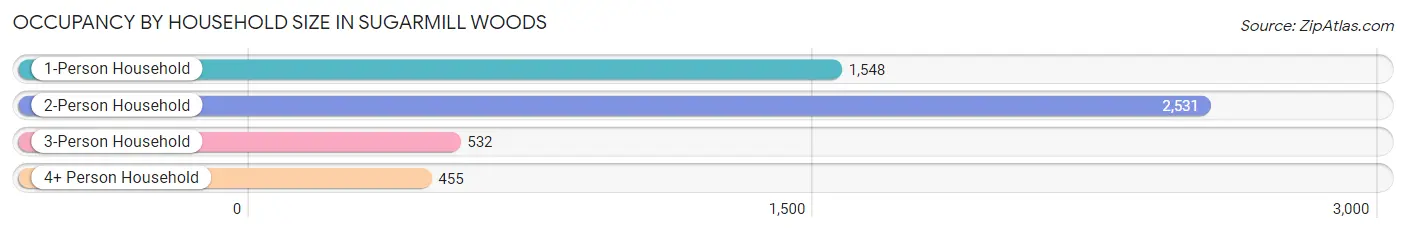
| Household Size | # Housing Units | % Housing Units |
| 1-Person Household | 1,548 | 30.6% |
| 2-Person Household | 2,531 | 50.0% |
| 3-Person Household | 532 | 10.5% |
| 4+ Person Household | 455 | 9.0% |
| Total Housing Units | 5,066 | 100.0% |
Occupancy by Ownership by Household Size in Sugarmill Woods
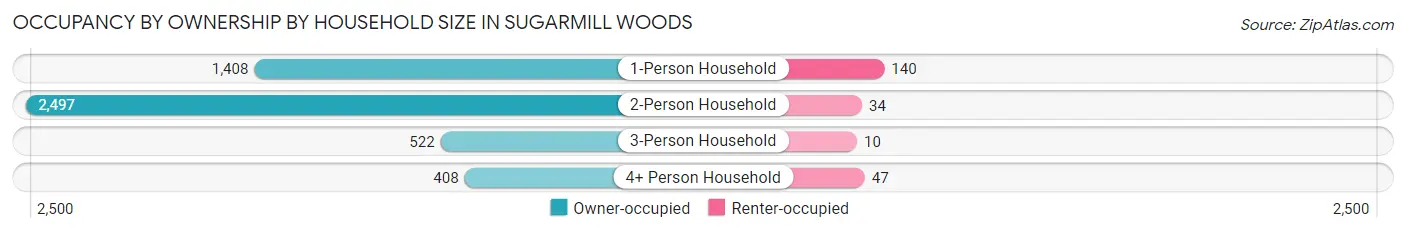
| Household Size | Owner-occupied | Renter-occupied |
| 1-Person Household | 1,408 (91.0%) | 140 (9.0%) |
| 2-Person Household | 2,497 (98.7%) | 34 (1.3%) |
| 3-Person Household | 522 (98.1%) | 10 (1.9%) |
| 4+ Person Household | 408 (89.7%) | 47 (10.3%) |
| Total Housing Units | 4,835 (95.4%) | 231 (4.6%) |
Occupancy by Educational Attainment in Sugarmill Woods
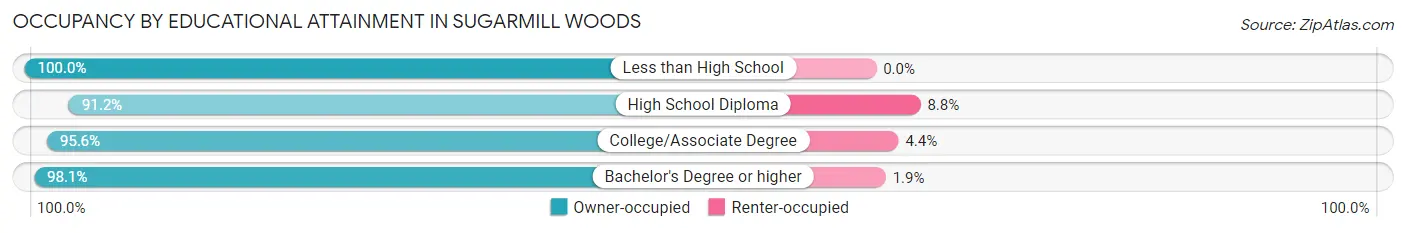
| Household Size | Owner-occupied | Renter-occupied |
| Less than High School | 273 (100.0%) | 0 (0.0%) |
| High School Diploma | 1,100 (91.2%) | 106 (8.8%) |
| College/Associate Degree | 2,163 (95.6%) | 100 (4.4%) |
| Bachelor's Degree or higher | 1,299 (98.1%) | 25 (1.9%) |
Occupancy by Age of Householder in Sugarmill Woods
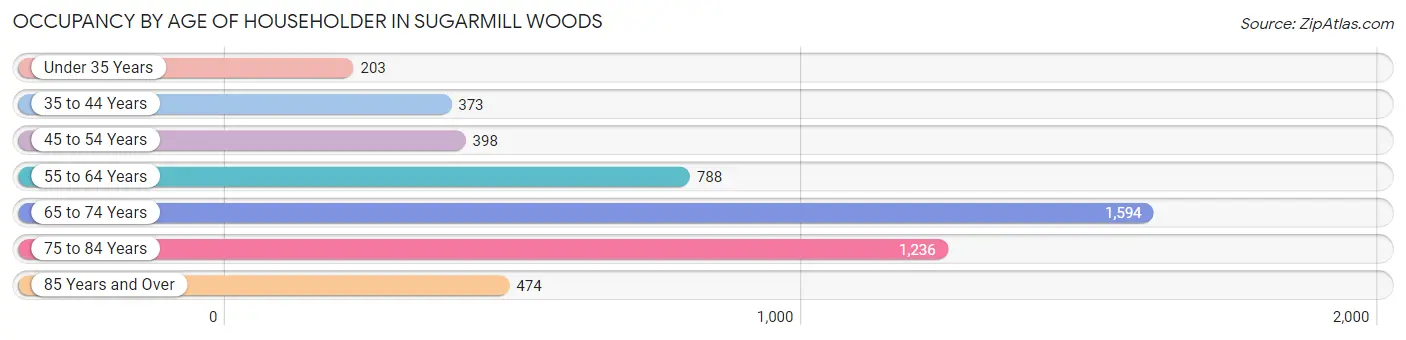
| Age Bracket | # Households | % Households |
| Under 35 Years | 203 | 4.0% |
| 35 to 44 Years | 373 | 7.4% |
| 45 to 54 Years | 398 | 7.9% |
| 55 to 64 Years | 788 | 15.5% |
| 65 to 74 Years | 1,594 | 31.5% |
| 75 to 84 Years | 1,236 | 24.4% |
| 85 Years and Over | 474 | 9.4% |
| Total | 5,066 | 100.0% |
Housing Finances in Sugarmill Woods
Median Income by Occupancy in Sugarmill Woods
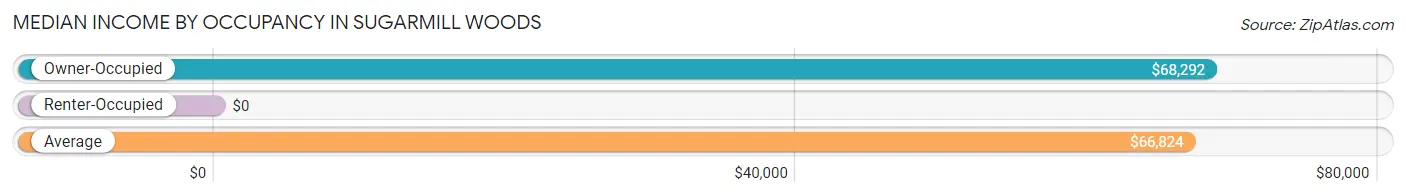
| Occupancy Type | # Households | Median Income |
| Owner-Occupied | 4,835 (95.4%) | $68,292 |
| Renter-Occupied | 231 (4.6%) | $0 |
| Average | 5,066 (100.0%) | $66,824 |
Occupancy by Householder Income Bracket in Sugarmill Woods
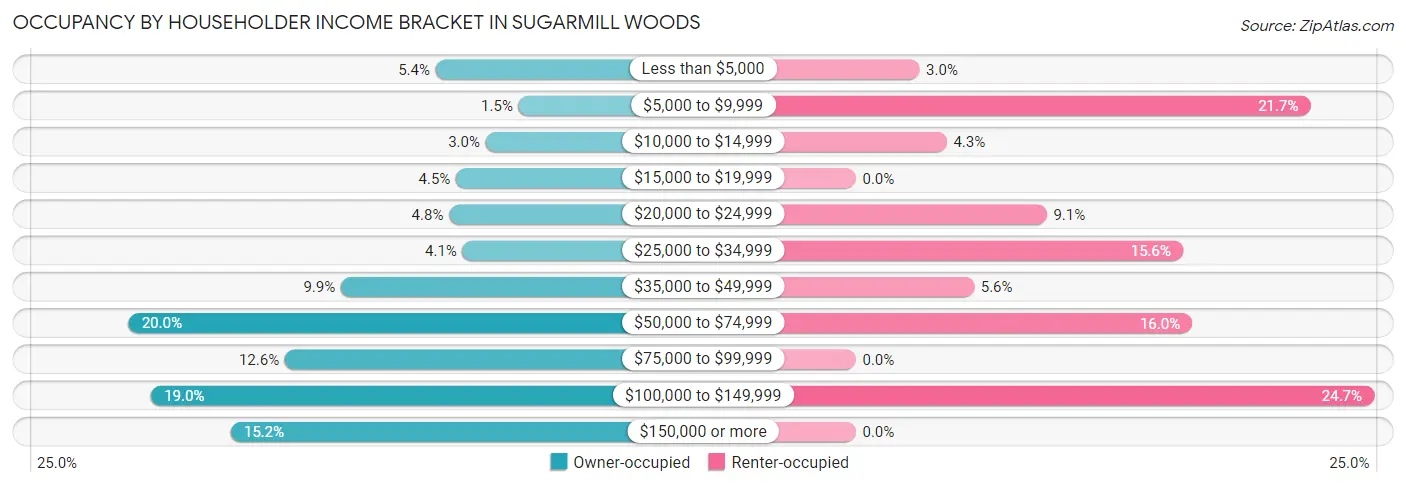
| Income Bracket | Owner-occupied | Renter-occupied |
| Less than $5,000 | 262 (5.4%) | 7 (3.0%) |
| $5,000 to $9,999 | 71 (1.5%) | 50 (21.6%) |
| $10,000 to $14,999 | 147 (3.0%) | 10 (4.3%) |
| $15,000 to $19,999 | 215 (4.4%) | 0 (0.0%) |
| $20,000 to $24,999 | 231 (4.8%) | 21 (9.1%) |
| $25,000 to $34,999 | 200 (4.1%) | 36 (15.6%) |
| $35,000 to $49,999 | 480 (9.9%) | 13 (5.6%) |
| $50,000 to $74,999 | 969 (20.0%) | 37 (16.0%) |
| $75,000 to $99,999 | 609 (12.6%) | 0 (0.0%) |
| $100,000 to $149,999 | 917 (19.0%) | 57 (24.7%) |
| $150,000 or more | 734 (15.2%) | 0 (0.0%) |
| Total | 4,835 (100.0%) | 231 (100.0%) |
Monthly Housing Cost Tiers in Sugarmill Woods
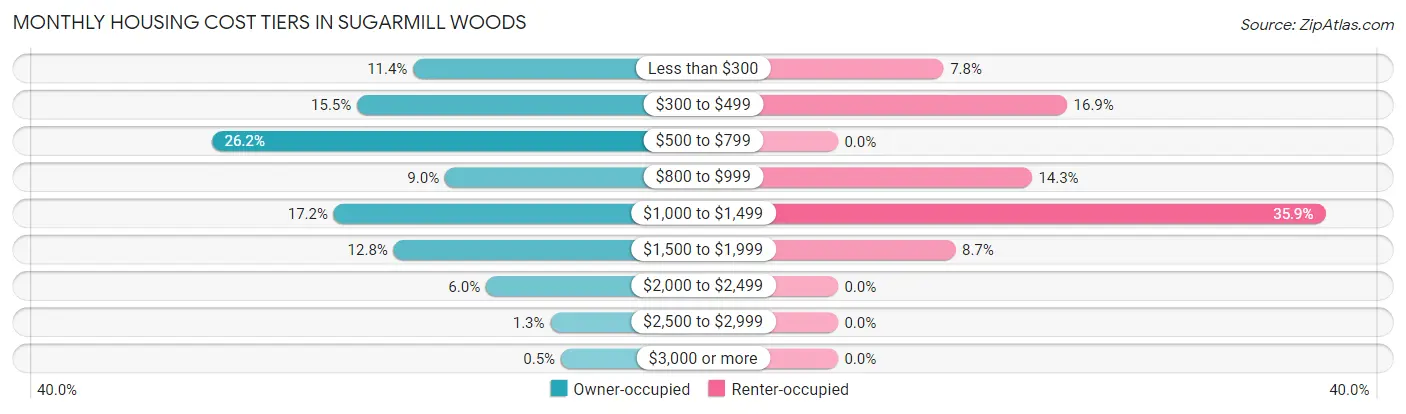
| Monthly Cost | Owner-occupied | Renter-occupied |
| Less than $300 | 550 (11.4%) | 18 (7.8%) |
| $300 to $499 | 750 (15.5%) | 39 (16.9%) |
| $500 to $799 | 1,268 (26.2%) | 0 (0.0%) |
| $800 to $999 | 437 (9.0%) | 33 (14.3%) |
| $1,000 to $1,499 | 833 (17.2%) | 83 (35.9%) |
| $1,500 to $1,999 | 620 (12.8%) | 20 (8.7%) |
| $2,000 to $2,499 | 291 (6.0%) | 0 (0.0%) |
| $2,500 to $2,999 | 62 (1.3%) | 0 (0.0%) |
| $3,000 or more | 24 (0.5%) | 0 (0.0%) |
| Total | 4,835 (100.0%) | 231 (100.0%) |
Physical Housing Characteristics in Sugarmill Woods
Housing Structures in Sugarmill Woods
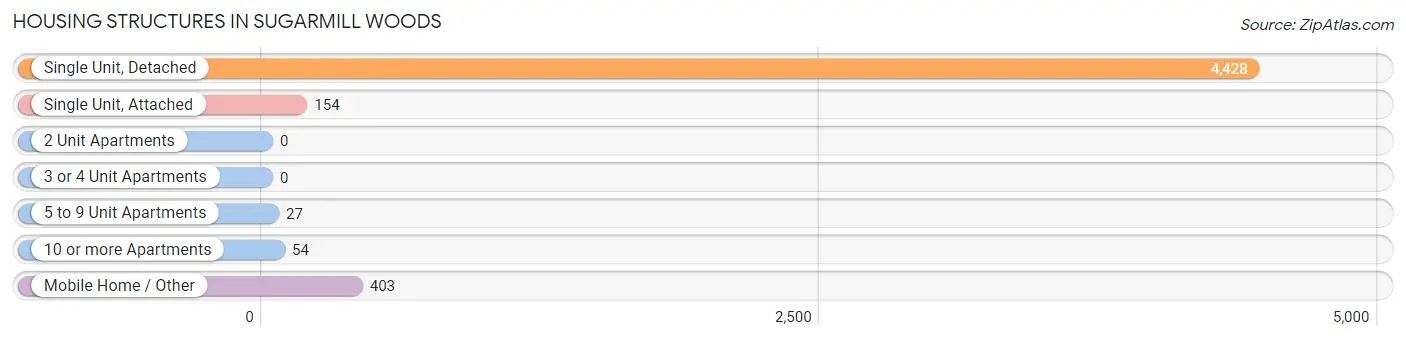
| Structure Type | # Housing Units | % Housing Units |
| Single Unit, Detached | 4,428 | 87.4% |
| Single Unit, Attached | 154 | 3.0% |
| 2 Unit Apartments | 0 | 0.0% |
| 3 or 4 Unit Apartments | 0 | 0.0% |
| 5 to 9 Unit Apartments | 27 | 0.5% |
| 10 or more Apartments | 54 | 1.1% |
| Mobile Home / Other | 403 | 8.0% |
| Total | 5,066 | 100.0% |
Housing Structures by Occupancy in Sugarmill Woods
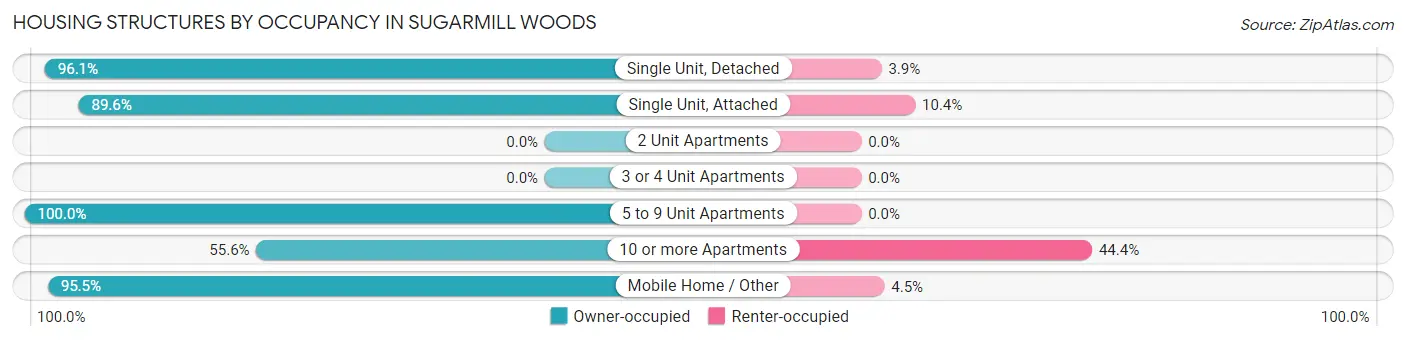
| Structure Type | Owner-occupied | Renter-occupied |
| Single Unit, Detached | 4,255 (96.1%) | 173 (3.9%) |
| Single Unit, Attached | 138 (89.6%) | 16 (10.4%) |
| 2 Unit Apartments | 0 (0.0%) | 0 (0.0%) |
| 3 or 4 Unit Apartments | 0 (0.0%) | 0 (0.0%) |
| 5 to 9 Unit Apartments | 27 (100.0%) | 0 (0.0%) |
| 10 or more Apartments | 30 (55.6%) | 24 (44.4%) |
| Mobile Home / Other | 385 (95.5%) | 18 (4.5%) |
| Total | 4,835 (95.4%) | 231 (4.6%) |
Housing Structures by Number of Rooms in Sugarmill Woods
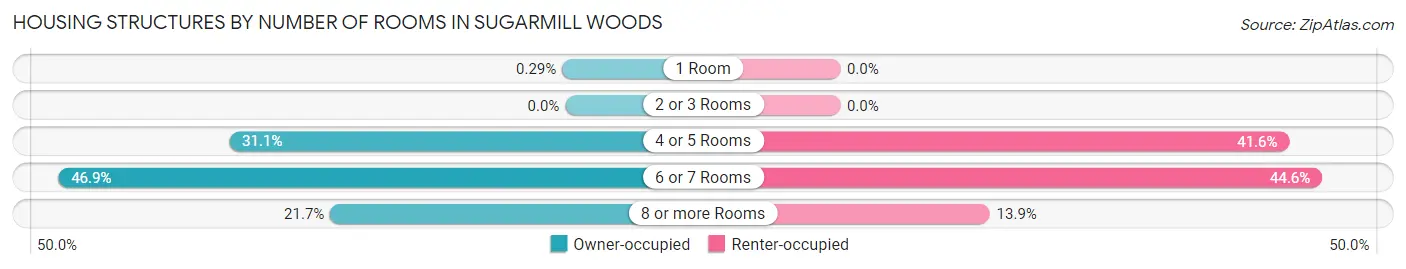
| Number of Rooms | Owner-occupied | Renter-occupied |
| 1 Room | 14 (0.3%) | 0 (0.0%) |
| 2 or 3 Rooms | 0 (0.0%) | 0 (0.0%) |
| 4 or 5 Rooms | 1,503 (31.1%) | 96 (41.6%) |
| 6 or 7 Rooms | 2,267 (46.9%) | 103 (44.6%) |
| 8 or more Rooms | 1,051 (21.7%) | 32 (13.9%) |
| Total | 4,835 (100.0%) | 231 (100.0%) |
Housing Structure by Heating Type in Sugarmill Woods
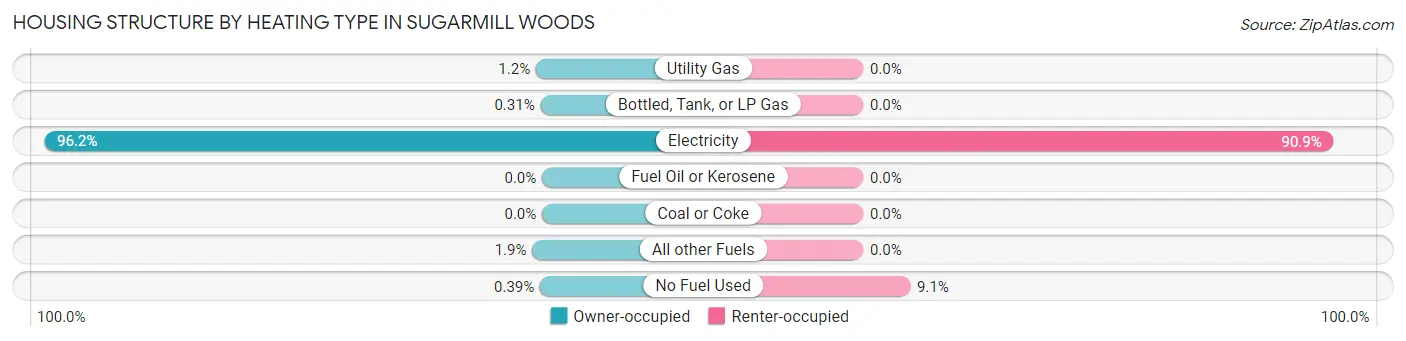
| Heating Type | Owner-occupied | Renter-occupied |
| Utility Gas | 57 (1.2%) | 0 (0.0%) |
| Bottled, Tank, or LP Gas | 15 (0.3%) | 0 (0.0%) |
| Electricity | 4,652 (96.2%) | 210 (90.9%) |
| Fuel Oil or Kerosene | 0 (0.0%) | 0 (0.0%) |
| Coal or Coke | 0 (0.0%) | 0 (0.0%) |
| All other Fuels | 92 (1.9%) | 0 (0.0%) |
| No Fuel Used | 19 (0.4%) | 21 (9.1%) |
| Total | 4,835 (100.0%) | 231 (100.0%) |
Household Vehicle Usage in Sugarmill Woods
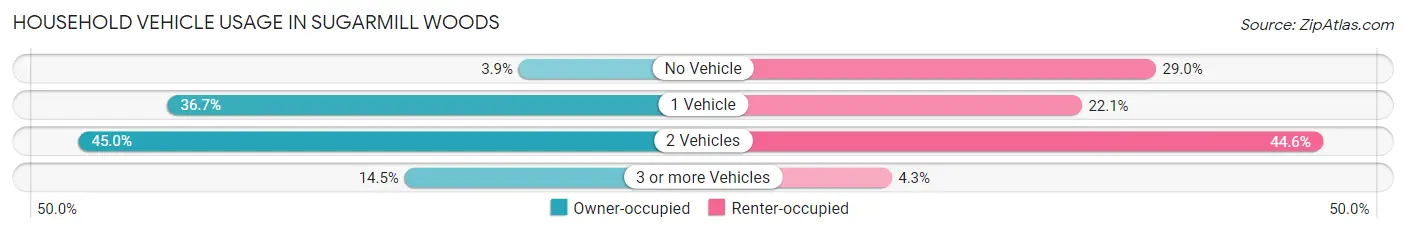
| Vehicles per Household | Owner-occupied | Renter-occupied |
| No Vehicle | 187 (3.9%) | 67 (29.0%) |
| 1 Vehicle | 1,772 (36.6%) | 51 (22.1%) |
| 2 Vehicles | 2,174 (45.0%) | 103 (44.6%) |
| 3 or more Vehicles | 702 (14.5%) | 10 (4.3%) |
| Total | 4,835 (100.0%) | 231 (100.0%) |
Real Estate & Mortgages in Sugarmill Woods
Real Estate and Mortgage Overview in Sugarmill Woods
| Characteristic | Without Mortgage | With Mortgage |
| Housing Units | 2,534 | 2,301 |
| Median Property Value | $242,000 | $274,100 |
| Median Household Income | $61,025 | $367 |
| Monthly Housing Costs | $508 | $24 |
| Real Estate Taxes | $1,785 | $67 |
Property Value by Mortgage Status in Sugarmill Woods
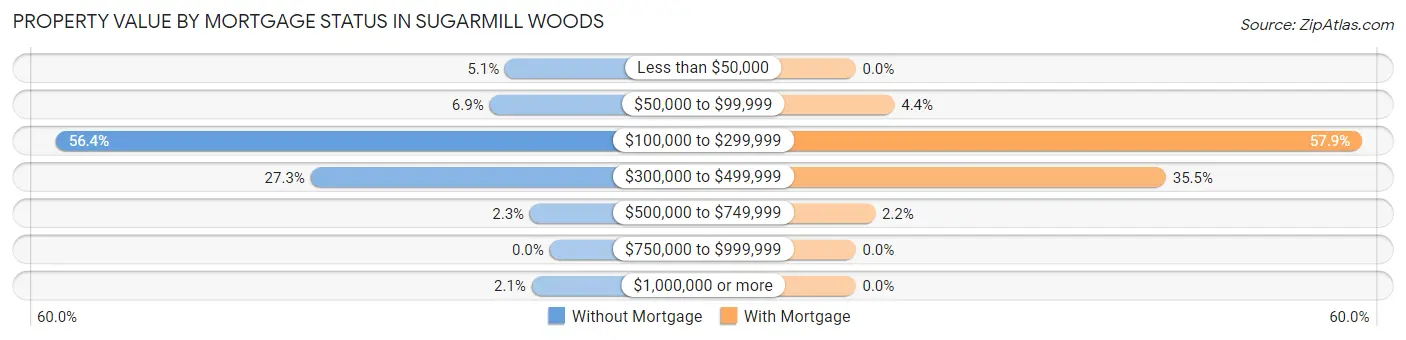
| Property Value | Without Mortgage | With Mortgage |
| Less than $50,000 | 129 (5.1%) | 0 (0.0%) |
| $50,000 to $99,999 | 174 (6.9%) | 102 (4.4%) |
| $100,000 to $299,999 | 1,430 (56.4%) | 1,332 (57.9%) |
| $300,000 to $499,999 | 692 (27.3%) | 816 (35.5%) |
| $500,000 to $749,999 | 57 (2.2%) | 51 (2.2%) |
| $750,000 to $999,999 | 0 (0.0%) | 0 (0.0%) |
| $1,000,000 or more | 52 (2.1%) | 0 (0.0%) |
| Total | 2,534 (100.0%) | 2,301 (100.0%) |
Household Income by Mortgage Status in Sugarmill Woods
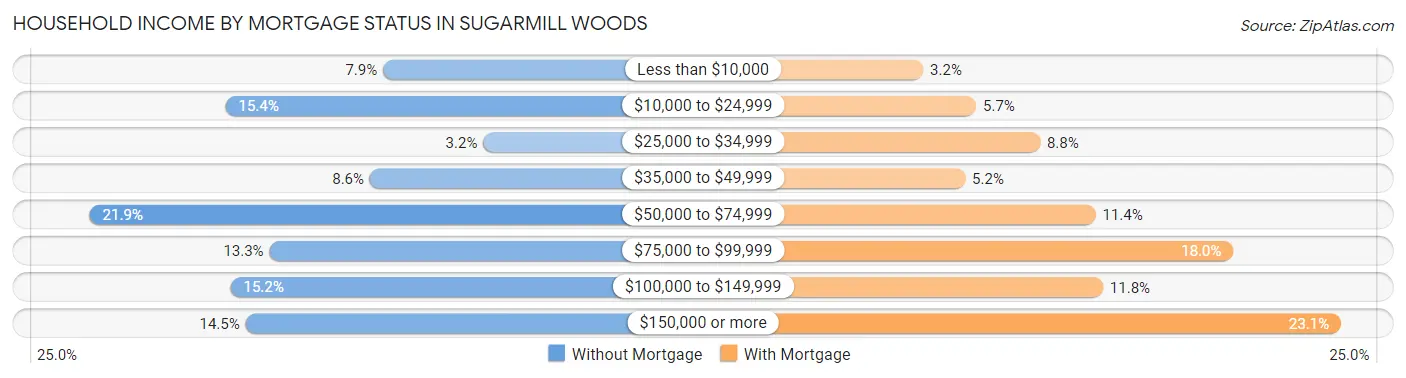
| Household Income | Without Mortgage | With Mortgage |
| Less than $10,000 | 201 (7.9%) | 74 (3.2%) |
| $10,000 to $24,999 | 391 (15.4%) | 132 (5.7%) |
| $25,000 to $34,999 | 80 (3.2%) | 202 (8.8%) |
| $35,000 to $49,999 | 217 (8.6%) | 120 (5.2%) |
| $50,000 to $74,999 | 555 (21.9%) | 263 (11.4%) |
| $75,000 to $99,999 | 338 (13.3%) | 414 (18.0%) |
| $100,000 to $149,999 | 385 (15.2%) | 271 (11.8%) |
| $150,000 or more | 367 (14.5%) | 532 (23.1%) |
| Total | 2,534 (100.0%) | 2,301 (100.0%) |
Property Value to Household Income Ratio in Sugarmill Woods
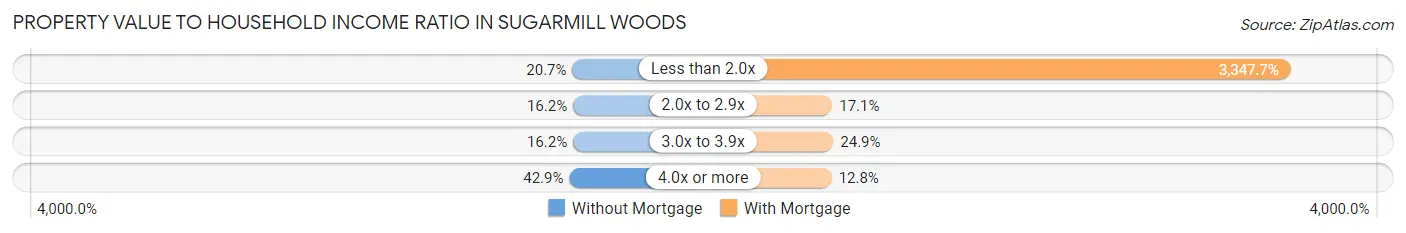
| Value-to-Income Ratio | Without Mortgage | With Mortgage |
| Less than 2.0x | 525 (20.7%) | 77,031 (3,347.7%) |
| 2.0x to 2.9x | 411 (16.2%) | 393 (17.1%) |
| 3.0x to 3.9x | 410 (16.2%) | 573 (24.9%) |
| 4.0x or more | 1,087 (42.9%) | 295 (12.8%) |
| Total | 2,534 (100.0%) | 2,301 (100.0%) |
Real Estate Taxes by Mortgage Status in Sugarmill Woods
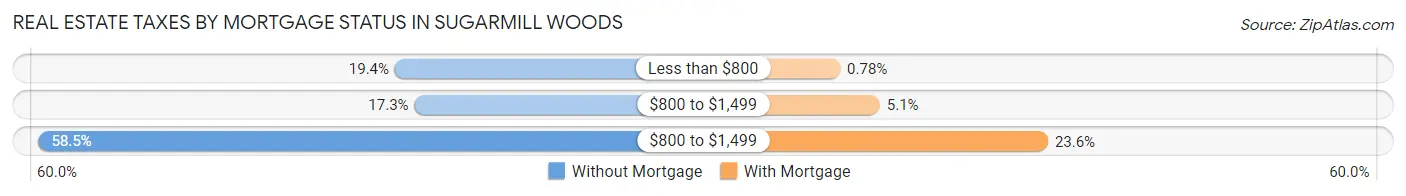
| Property Taxes | Without Mortgage | With Mortgage |
| Less than $800 | 492 (19.4%) | 18 (0.8%) |
| $800 to $1,499 | 438 (17.3%) | 118 (5.1%) |
| $800 to $1,499 | 1,482 (58.5%) | 542 (23.5%) |
| Total | 2,534 (100.0%) | 2,301 (100.0%) |
Health & Disability in Sugarmill Woods
Health Insurance Coverage by Age in Sugarmill Woods
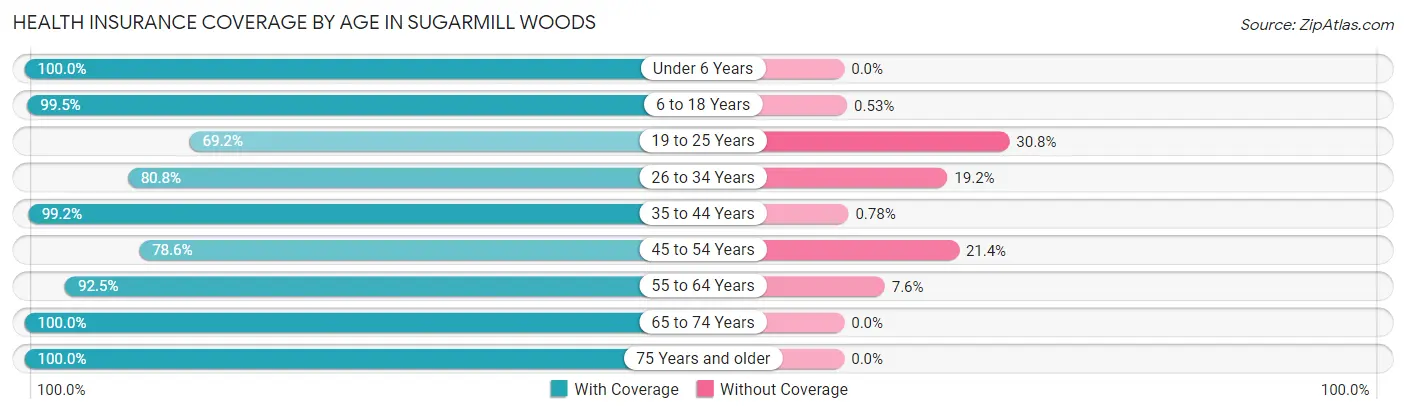
| Age Bracket | With Coverage | Without Coverage |
| Under 6 Years | 235 (100.0%) | 0 (0.0%) |
| 6 to 18 Years | 1,117 (99.5%) | 6 (0.5%) |
| 19 to 25 Years | 353 (69.2%) | 157 (30.8%) |
| 26 to 34 Years | 273 (80.8%) | 65 (19.2%) |
| 35 to 44 Years | 760 (99.2%) | 6 (0.8%) |
| 45 to 54 Years | 750 (78.6%) | 204 (21.4%) |
| 55 to 64 Years | 1,420 (92.4%) | 116 (7.5%) |
| 65 to 74 Years | 2,619 (100.0%) | 0 (0.0%) |
| 75 Years and older | 2,716 (100.0%) | 0 (0.0%) |
| Total | 10,243 (94.9%) | 554 (5.1%) |
Health Insurance Coverage by Citizenship Status in Sugarmill Woods
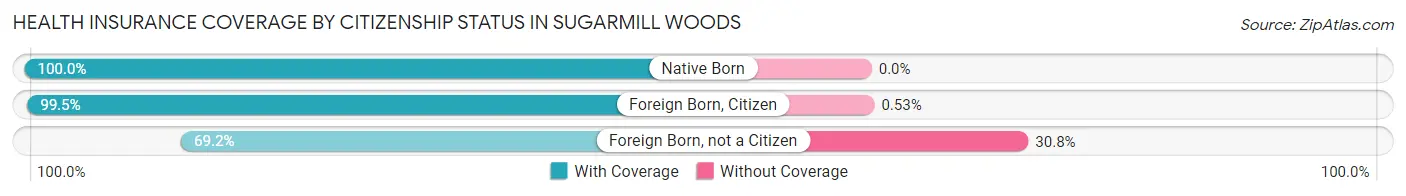
| Citizenship Status | With Coverage | Without Coverage |
| Native Born | 235 (100.0%) | 0 (0.0%) |
| Foreign Born, Citizen | 1,117 (99.5%) | 6 (0.5%) |
| Foreign Born, not a Citizen | 353 (69.2%) | 157 (30.8%) |
Health Insurance Coverage by Household Income in Sugarmill Woods
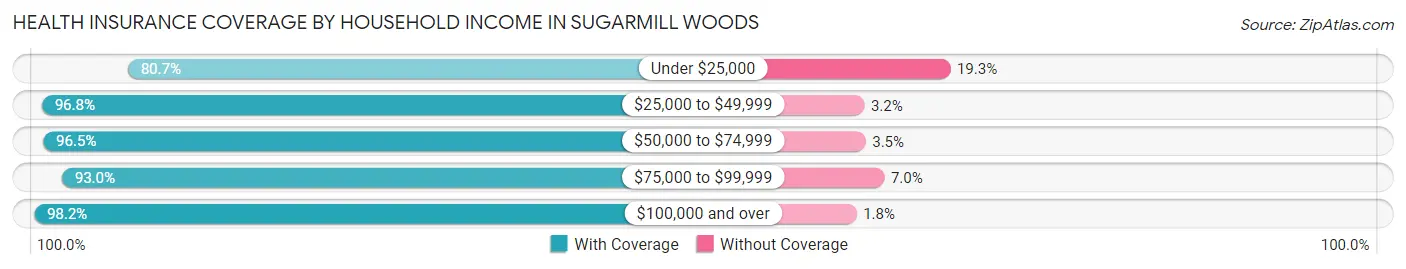
| Household Income | With Coverage | Without Coverage |
| Under $25,000 | 1,056 (80.7%) | 253 (19.3%) |
| $25,000 to $49,999 | 1,234 (96.8%) | 41 (3.2%) |
| $50,000 to $74,999 | 2,313 (96.5%) | 83 (3.5%) |
| $75,000 to $99,999 | 1,335 (93.0%) | 100 (7.0%) |
| $100,000 and over | 4,298 (98.2%) | 77 (1.8%) |
Public vs Private Health Insurance Coverage by Age in Sugarmill Woods
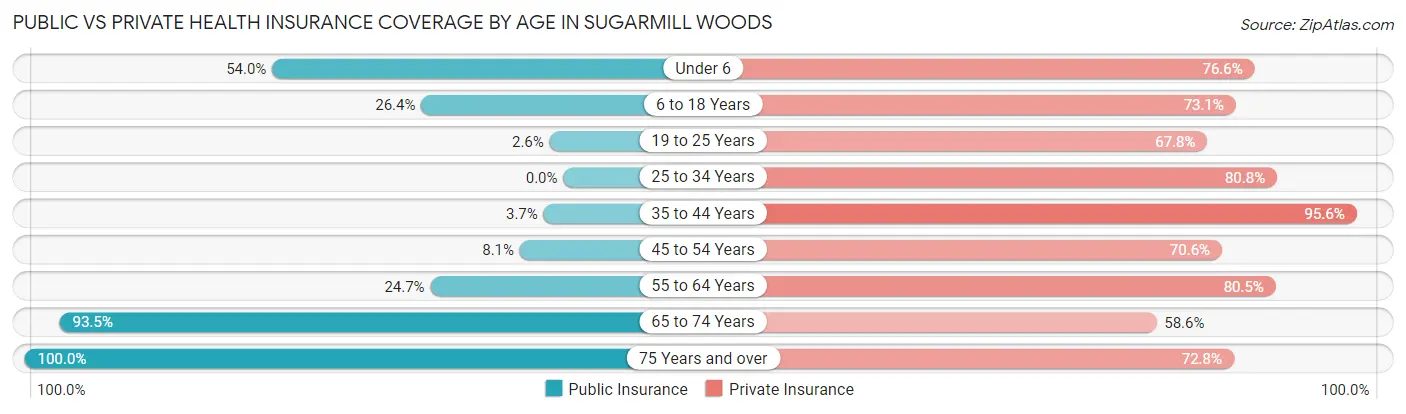
| Age Bracket | Public Insurance | Private Insurance |
| Under 6 | 127 (54.0%) | 180 (76.6%) |
| 6 to 18 Years | 296 (26.4%) | 821 (73.1%) |
| 19 to 25 Years | 13 (2.5%) | 346 (67.8%) |
| 25 to 34 Years | 0 (0.0%) | 273 (80.8%) |
| 35 to 44 Years | 28 (3.7%) | 732 (95.6%) |
| 45 to 54 Years | 77 (8.1%) | 673 (70.6%) |
| 55 to 64 Years | 379 (24.7%) | 1,237 (80.5%) |
| 65 to 74 Years | 2,449 (93.5%) | 1,534 (58.6%) |
| 75 Years and over | 2,716 (100.0%) | 1,976 (72.8%) |
| Total | 6,085 (56.4%) | 7,772 (72.0%) |
Disability Status by Sex by Age in Sugarmill Woods
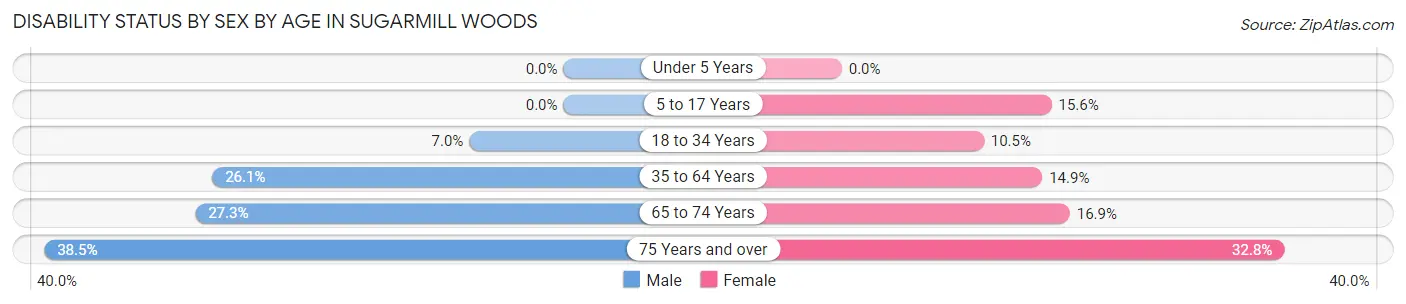
| Age Bracket | Male | Female |
| Under 5 Years | 0 (0.0%) | 0 (0.0%) |
| 5 to 17 Years | 0 (0.0%) | 85 (15.6%) |
| 18 to 34 Years | 40 (7.0%) | 33 (10.5%) |
| 35 to 64 Years | 376 (26.1%) | 270 (14.9%) |
| 65 to 74 Years | 346 (27.3%) | 229 (16.9%) |
| 75 Years and over | 521 (38.5%) | 448 (32.8%) |
Disability Class by Sex by Age in Sugarmill Woods
Disability Class: Hearing Difficulty
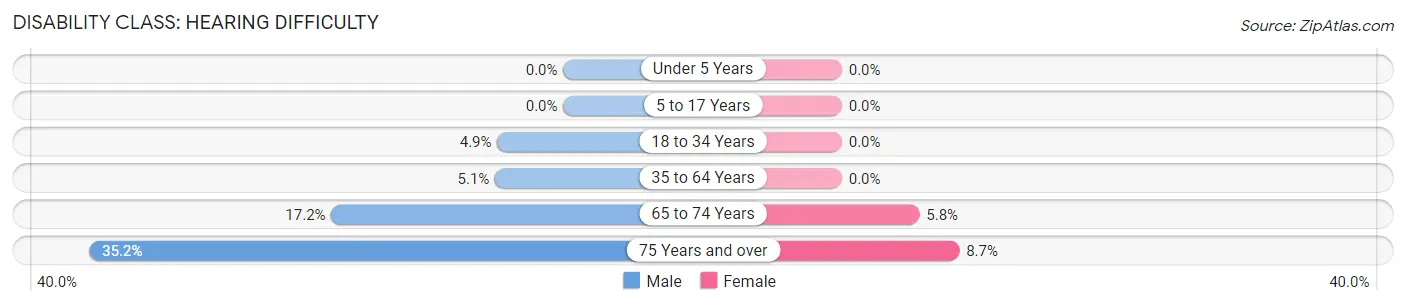
| Age Bracket | Male | Female |
| Under 5 Years | 0 (0.0%) | 0 (0.0%) |
| 5 to 17 Years | 0 (0.0%) | 0 (0.0%) |
| 18 to 34 Years | 28 (4.9%) | 0 (0.0%) |
| 35 to 64 Years | 73 (5.1%) | 0 (0.0%) |
| 65 to 74 Years | 218 (17.2%) | 78 (5.8%) |
| 75 Years and over | 476 (35.2%) | 119 (8.7%) |
Disability Class: Vision Difficulty
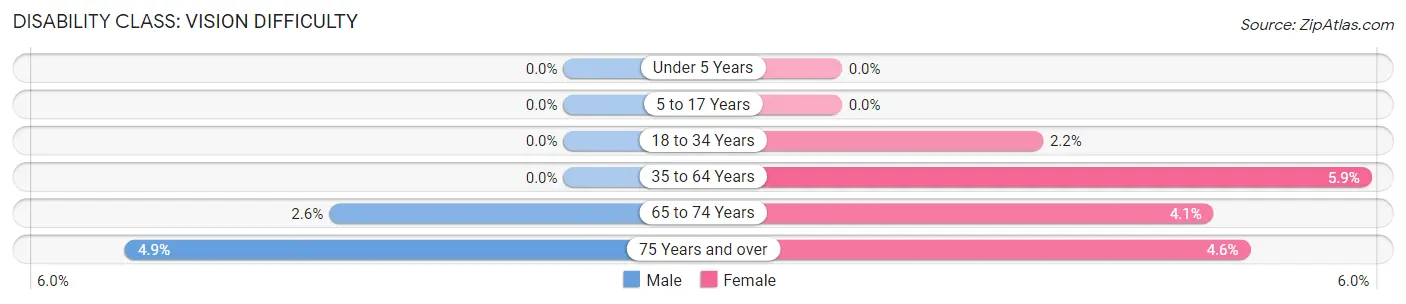
| Age Bracket | Male | Female |
| Under 5 Years | 0 (0.0%) | 0 (0.0%) |
| 5 to 17 Years | 0 (0.0%) | 0 (0.0%) |
| 18 to 34 Years | 0 (0.0%) | 7 (2.2%) |
| 35 to 64 Years | 0 (0.0%) | 107 (5.9%) |
| 65 to 74 Years | 33 (2.6%) | 56 (4.1%) |
| 75 Years and over | 66 (4.9%) | 62 (4.5%) |
Disability Class: Cognitive Difficulty
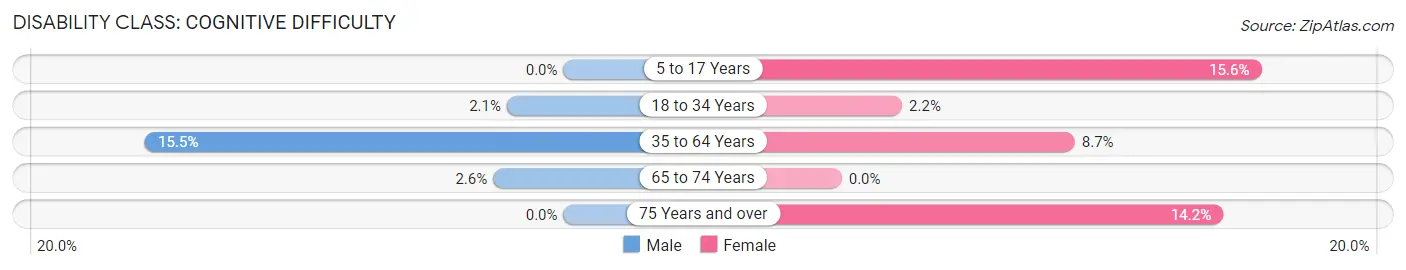
| Age Bracket | Male | Female |
| 5 to 17 Years | 0 (0.0%) | 85 (15.6%) |
| 18 to 34 Years | 12 (2.1%) | 7 (2.2%) |
| 35 to 64 Years | 224 (15.5%) | 157 (8.6%) |
| 65 to 74 Years | 33 (2.6%) | 0 (0.0%) |
| 75 Years and over | 0 (0.0%) | 193 (14.1%) |
Disability Class: Ambulatory Difficulty
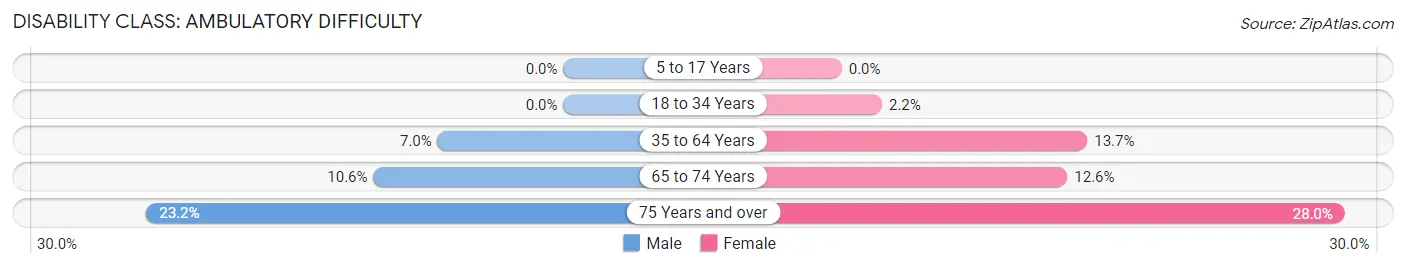
| Age Bracket | Male | Female |
| 5 to 17 Years | 0 (0.0%) | 0 (0.0%) |
| 18 to 34 Years | 0 (0.0%) | 7 (2.2%) |
| 35 to 64 Years | 101 (7.0%) | 248 (13.7%) |
| 65 to 74 Years | 134 (10.6%) | 170 (12.6%) |
| 75 Years and over | 314 (23.2%) | 382 (28.0%) |
Disability Class: Self-Care Difficulty
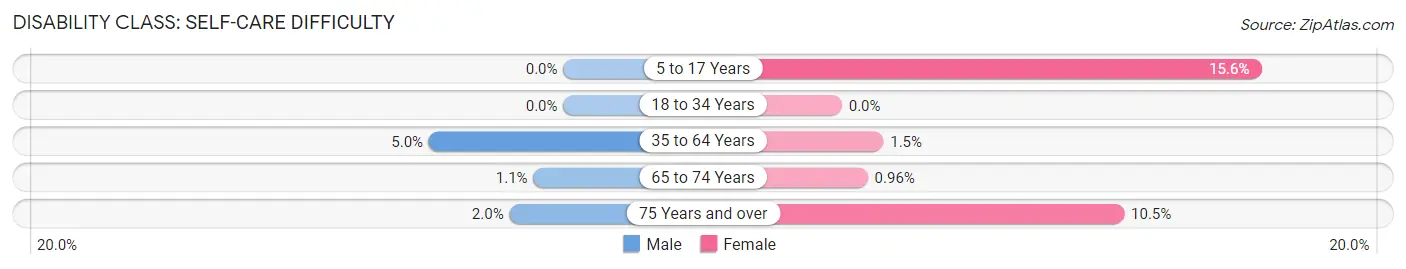
| Age Bracket | Male | Female |
| 5 to 17 Years | 0 (0.0%) | 85 (15.6%) |
| 18 to 34 Years | 0 (0.0%) | 0 (0.0%) |
| 35 to 64 Years | 72 (5.0%) | 28 (1.5%) |
| 65 to 74 Years | 14 (1.1%) | 13 (1.0%) |
| 75 Years and over | 27 (2.0%) | 143 (10.5%) |
Technology Access in Sugarmill Woods
Computing Device Access in Sugarmill Woods
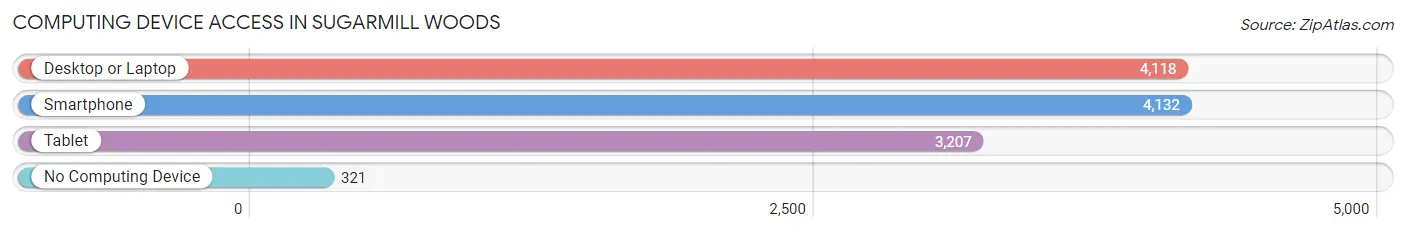
| Device Type | # Households | % Households |
| Desktop or Laptop | 4,118 | 81.3% |
| Smartphone | 4,132 | 81.6% |
| Tablet | 3,207 | 63.3% |
| No Computing Device | 321 | 6.3% |
| Total | 5,066 | 100.0% |
Internet Access in Sugarmill Woods
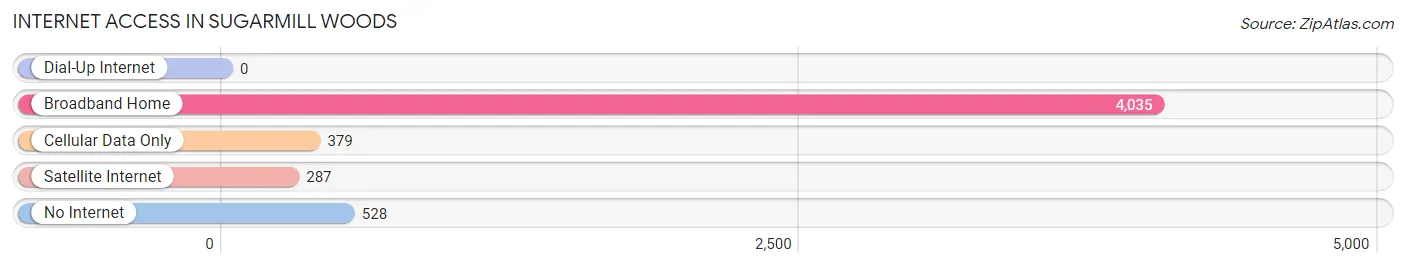
| Internet Type | # Households | % Households |
| Dial-Up Internet | 0 | 0.0% |
| Broadband Home | 4,035 | 79.6% |
| Cellular Data Only | 379 | 7.5% |
| Satellite Internet | 287 | 5.7% |
| No Internet | 528 | 10.4% |
| Total | 5,066 | 100.0% |
Sugarmill Woods Summary
Sugarmill Woods is an unincorporated community located in Citrus County, Florida, United States. It is located in the northern part of the county, approximately 20 miles north of the county seat of Inverness. The community is situated on the western side of the Withlacoochee River, and is bordered by the Withlacoochee State Forest to the east. The community is part of the Homosassa Springs Metropolitan Statistical Area.
History
Sugarmill Woods was originally part of the Withlacoochee State Forest, and was developed in the late 1970s as a planned community. The community was designed to be a self-contained residential area, with its own shopping center, golf course, and other amenities. The community was named after the nearby Sugarmill Plantation, which was established in the early 1800s. The plantation was owned by the prominent local family of the same name, and was used to produce sugar cane and other crops.
Geography
Sugarmill Woods is located in northern Citrus County, approximately 20 miles north of the county seat of Inverness. The community is situated on the western side of the Withlacoochee River, and is bordered by the Withlacoochee State Forest to the east. The community is part of the Homosassa Springs Metropolitan Statistical Area.
The terrain of Sugarmill Woods is mostly flat, with some rolling hills. The area is heavily forested, with a mix of pine and hardwood trees. The climate is subtropical, with hot, humid summers and mild winters.
Economy
The economy of Sugarmill Woods is largely based on tourism and retirement. The community is home to several golf courses, as well as a shopping center and other amenities. The area is also home to several small businesses, including restaurants, retail stores, and professional services.
Demographics
As of the 2010 census, the population of Sugarmill Woods was 8,839. The racial makeup of the community was 94.3% White, 1.3% African American, 0.7% Native American, 0.9% Asian, 0.1% Pacific Islander, 1.2% from other races, and 1.5% from two or more races. Hispanic or Latino of any race were 4.2% of the population.
The median household income in Sugarmill Woods was $50,945, and the median family income was $58,945. The per capita income was $25,945. About 8.3% of families and 10.2% of the population were below the poverty line, including 14.2% of those under age 18 and 5.2% of those age 65 or over.
Common Questions
What is the Total Population of Sugarmill Woods?
Total Population of Sugarmill Woods is 10,821.
What is the Total Male Population of Sugarmill Woods?
Total Male Population of Sugarmill Woods is 5,343.
What is the Total Female Population of Sugarmill Woods?
Total Female Population of Sugarmill Woods is 5,478.
What is the Ratio of Males per 100 Females in Sugarmill Woods?
There are 97.54 Males per 100 Females in Sugarmill Woods.
What is the Ratio of Females per 100 Males in Sugarmill Woods?
There are 102.53 Females per 100 Males in Sugarmill Woods.
What is the Median Population Age in Sugarmill Woods?
Median Population Age in Sugarmill Woods is 64.8 Years.
What is the Average Family Size in Sugarmill Woods
Average Family Size in Sugarmill Woods is 2.6 People.
What is the Average Household Size in Sugarmill Woods
Average Household Size in Sugarmill Woods is 2.1 People.
What is Per Capita Income in Sugarmill Woods?
Per Capita income in Sugarmill Woods is $41,863.
What is the Median Family Income in Sugarmill Woods?
Median Family Income in Sugarmill Woods is $86,935.
What is the Median Household income in Sugarmill Woods?
Median Household Income in Sugarmill Woods is $66,824.
What is Income or Wage Gap in Sugarmill Woods?
Income or Wage Gap in Sugarmill Woods is 1.7%.
Women in Sugarmill Woods earn 98.3 cents for every dollar earned by a man.
What is Inequality or Gini Index in Sugarmill Woods?
Inequality or Gini Index in Sugarmill Woods is 0.44.
How Large is the Labor Force in Sugarmill Woods?
There are 3,291 People in the Labor Forcein in Sugarmill Woods.
What is the Percentage of People in the Labor Force in Sugarmill Woods?
33.8% of People are in the Labor Force in Sugarmill Woods.
What is the Unemployment Rate in Sugarmill Woods?
Unemployment Rate in Sugarmill Woods is 4.6%.