St James City, FL
St James City Map
St James City Overview
3,494
TOTAL POPULATION
1,837
MALE POPULATION
1,657
FEMALE POPULATION
110.86
MALES / 100 FEMALES
90.20
FEMALES / 100 MALES
64.7
MEDIAN AGE
2.4
AVG FAMILY SIZE
2.0
AVG HOUSEHOLD SIZE
$59,153
PER CAPITA INCOME
$64,479
AVG FAMILY INCOME
$62,415
AVG HOUSEHOLD INCOME
0.57
INEQUALITY / GINI INDEX
1,251
LABOR FORCE [ PEOPLE ]
37.4%
PERCENT IN LABOR FORCE
10.4%
UNEMPLOYMENT RATE
St James City Area Codes
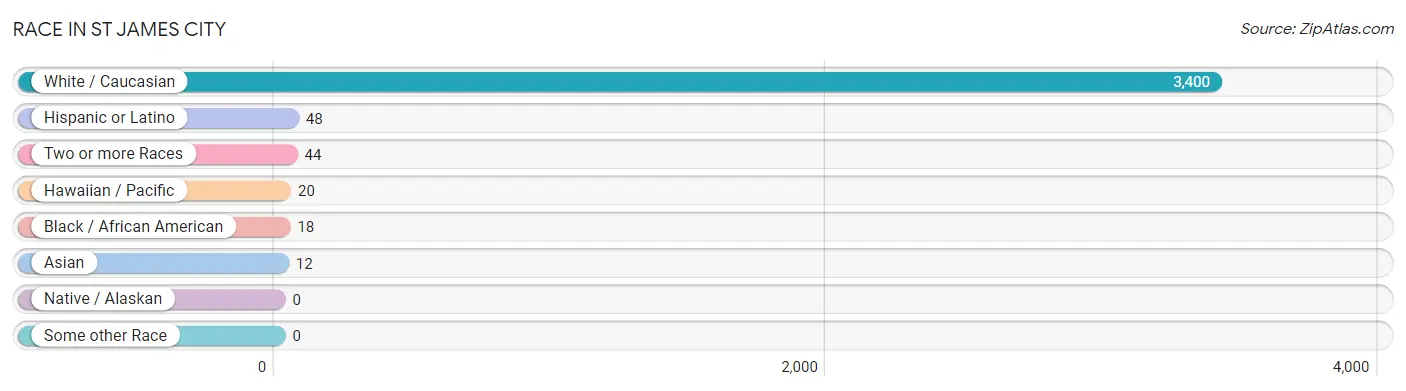
Race in St James City
The most populous races in St James City are White / Caucasian (3,400 | 97.3%), Hispanic or Latino (48 | 1.4%), and Two or more Races (44 | 1.3%).
| Race | # Population | % Population |
| Asian | 12 | 0.3% |
| Black / African American | 18 | 0.5% |
| Hawaiian / Pacific | 20 | 0.6% |
| Hispanic or Latino | 48 | 1.4% |
| Native / Alaskan | 0 | 0.0% |
| White / Caucasian | 3,400 | 97.3% |
| Two or more Races | 44 | 1.3% |
| Some other Race | 0 | 0.0% |
| Total | 3,494 | 100.0% |
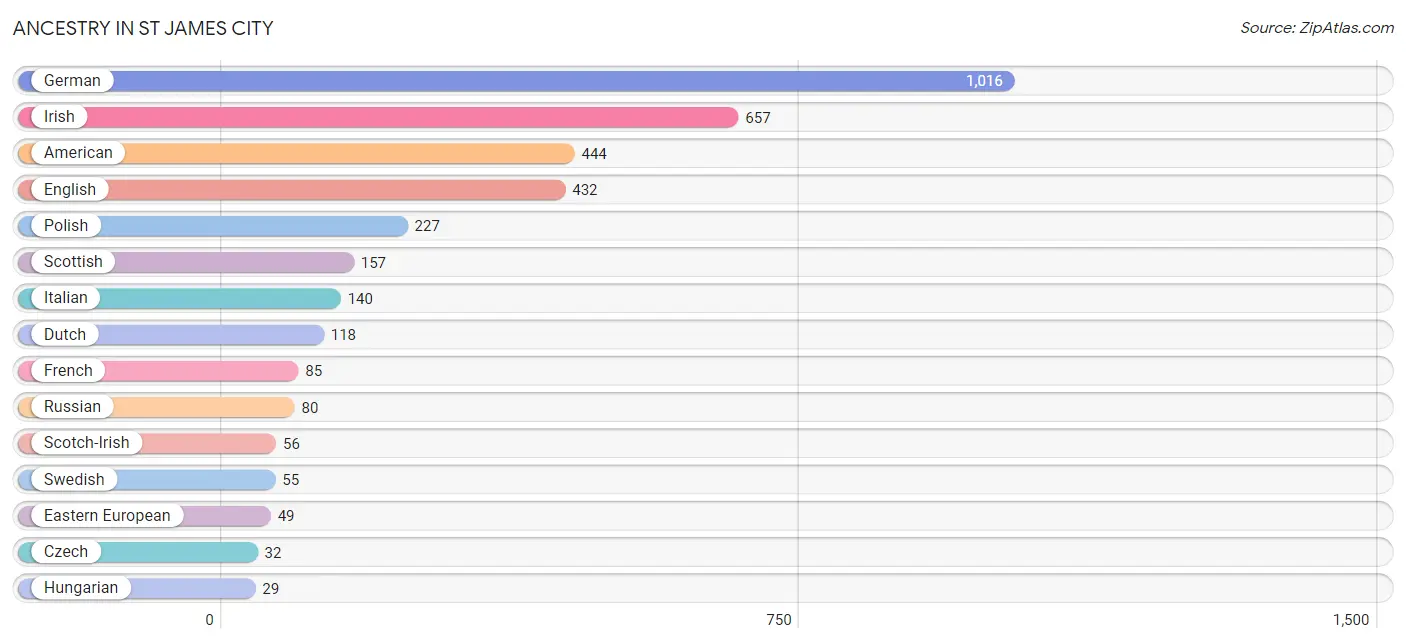
Ancestry in St James City
The most populous ancestries reported in St James City are German (1,016 | 29.1%), Irish (657 | 18.8%), American (444 | 12.7%), English (432 | 12.4%), and Polish (227 | 6.5%), together accounting for 79.4% of all St James City residents.
| Ancestry | # Population | % Population |
| American | 444 | 12.7% |
| British | 12 | 0.3% |
| Canadian | 28 | 0.8% |
| Central American | 8 | 0.2% |
| Cuban | 8 | 0.2% |
| Czech | 32 | 0.9% |
| Danish | 14 | 0.4% |
| Dutch | 118 | 3.4% |
| Eastern European | 49 | 1.4% |
| English | 432 | 12.4% |
| European | 14 | 0.4% |
| Finnish | 25 | 0.7% |
| French | 85 | 2.4% |
| German | 1,016 | 29.1% |
| Hungarian | 29 | 0.8% |
| Irish | 657 | 18.8% |
| Italian | 140 | 4.0% |
| Korean | 12 | 0.3% |
| Latvian | 18 | 0.5% |
| Lithuanian | 8 | 0.2% |
| Mexican | 18 | 0.5% |
| Native Hawaiian | 4 | 0.1% |
| Northern European | 6 | 0.2% |
| Norwegian | 13 | 0.4% |
| Panamanian | 8 | 0.2% |
| Polish | 227 | 6.5% |
| Puerto Rican | 14 | 0.4% |
| Russian | 80 | 2.3% |
| Samoan | 7 | 0.2% |
| Scandinavian | 25 | 0.7% |
| Scotch-Irish | 56 | 1.6% |
| Scottish | 157 | 4.5% |
| Slavic | 8 | 0.2% |
| Slovak | 14 | 0.4% |
| Swedish | 55 | 1.6% |
| Ukrainian | 12 | 0.3% | View All 36 Rows |
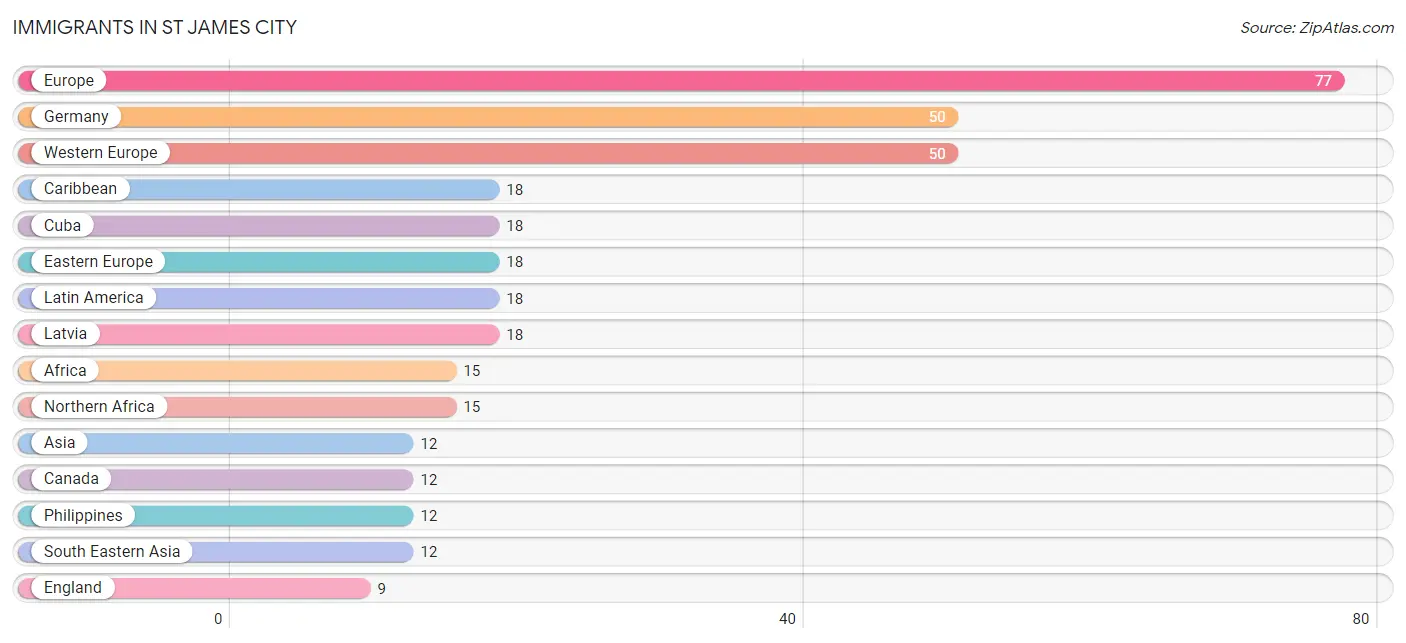
Immigrants in St James City
The most numerous immigrant groups reported in St James City came from Europe (77 | 2.2%), Germany (50 | 1.4%), Western Europe (50 | 1.4%), Caribbean (18 | 0.5%), and Cuba (18 | 0.5%), together accounting for 6.1% of all St James City residents.
| Immigration Origin | # Population | % Population |
| Africa | 15 | 0.4% |
| Asia | 12 | 0.3% |
| Canada | 12 | 0.3% |
| Caribbean | 18 | 0.5% |
| Cuba | 18 | 0.5% |
| Eastern Europe | 18 | 0.5% |
| England | 9 | 0.3% |
| Europe | 77 | 2.2% |
| Germany | 50 | 1.4% |
| Latin America | 18 | 0.5% |
| Latvia | 18 | 0.5% |
| Northern Africa | 15 | 0.4% |
| Northern Europe | 9 | 0.3% |
| Philippines | 12 | 0.3% |
| South Eastern Asia | 12 | 0.3% |
| Western Europe | 50 | 1.4% | View All 16 Rows |
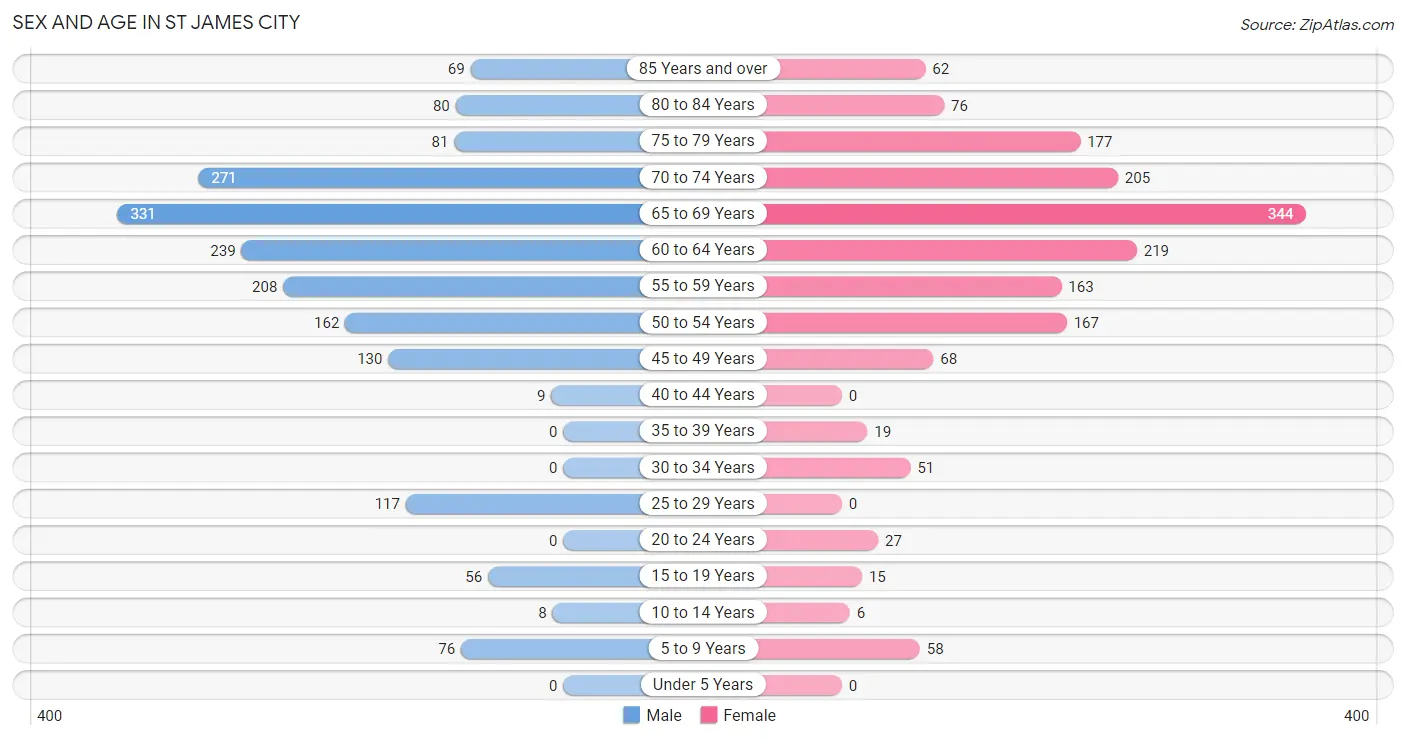
Sex and Age in St James City
Sex and Age in St James City
The most populous age groups in St James City are 65 to 69 Years (331 | 18.0%) for men and 65 to 69 Years (344 | 20.8%) for women.
| Age Bracket | Male | Female |
| Under 5 Years | 0 (0.0%) | 0 (0.0%) |
| 5 to 9 Years | 76 (4.1%) | 58 (3.5%) |
| 10 to 14 Years | 8 (0.4%) | 6 (0.4%) |
| 15 to 19 Years | 56 (3.0%) | 15 (0.9%) |
| 20 to 24 Years | 0 (0.0%) | 27 (1.6%) |
| 25 to 29 Years | 117 (6.4%) | 0 (0.0%) |
| 30 to 34 Years | 0 (0.0%) | 51 (3.1%) |
| 35 to 39 Years | 0 (0.0%) | 19 (1.1%) |
| 40 to 44 Years | 9 (0.5%) | 0 (0.0%) |
| 45 to 49 Years | 130 (7.1%) | 68 (4.1%) |
| 50 to 54 Years | 162 (8.8%) | 167 (10.1%) |
| 55 to 59 Years | 208 (11.3%) | 163 (9.8%) |
| 60 to 64 Years | 239 (13.0%) | 219 (13.2%) |
| 65 to 69 Years | 331 (18.0%) | 344 (20.8%) |
| 70 to 74 Years | 271 (14.7%) | 205 (12.4%) |
| 75 to 79 Years | 81 (4.4%) | 177 (10.7%) |
| 80 to 84 Years | 80 (4.3%) | 76 (4.6%) |
| 85 Years and over | 69 (3.8%) | 62 (3.7%) |
| Total | 1,837 (100.0%) | 1,657 (100.0%) |
Families and Households in St James City
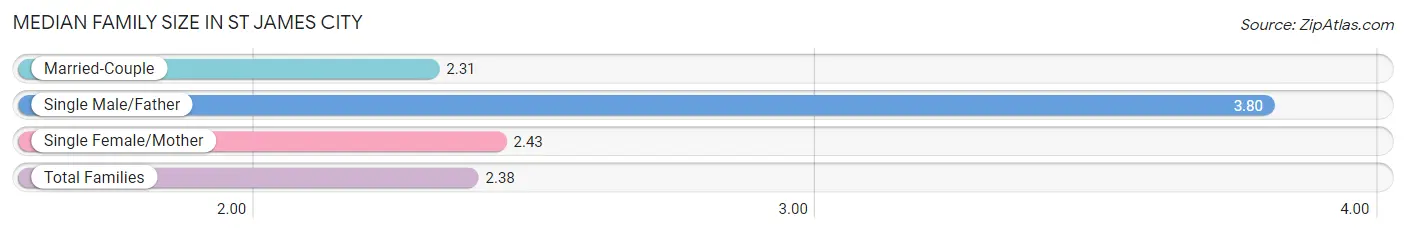
Median Family Size in St James City
The median family size in St James City is 2.38 persons per family, with single male/father families (46 | 4.1%) accounting for the largest median family size of 3.8 persons per family. On the other hand, married-couple families (1,005 | 90.2%) represent the smallest median family size with 2.31 persons per family.
| Family Type | # Families | Family Size |
| Married-Couple | 1,005 (90.2%) | 2.31 |
| Single Male/Father | 46 (4.1%) | 3.80 |
| Single Female/Mother | 63 (5.7%) | 2.43 |
| Total Families | 1,114 (100.0%) | 2.38 |
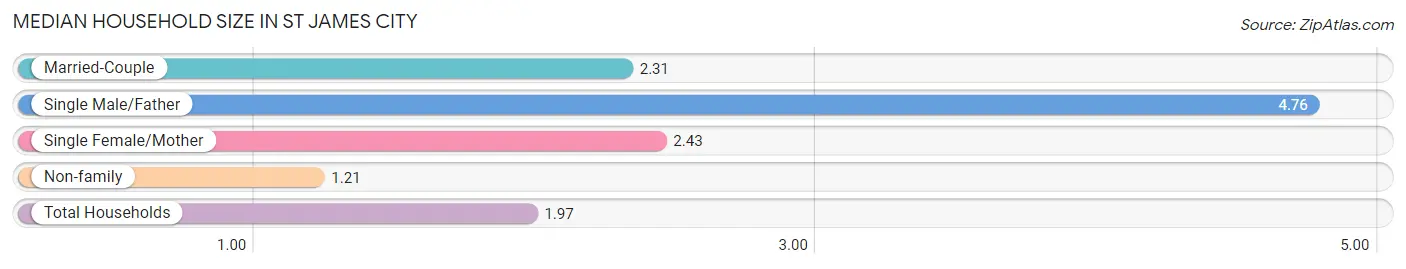
Median Household Size in St James City
The median household size in St James City is 1.97 persons per household, with single male/father households (46 | 2.6%) accounting for the largest median household size of 4.76 persons per household. non-family households (659 | 37.2%) represent the smallest median household size with 1.21 persons per household.
| Household Type | # Households | Household Size |
| Married-Couple | 1,005 (56.7%) | 2.31 |
| Single Male/Father | 46 (2.6%) | 4.76 |
| Single Female/Mother | 63 (3.5%) | 2.43 |
| Non-family | 659 (37.2%) | 1.21 |
| Total Households | 1,773 (100.0%) | 1.97 |
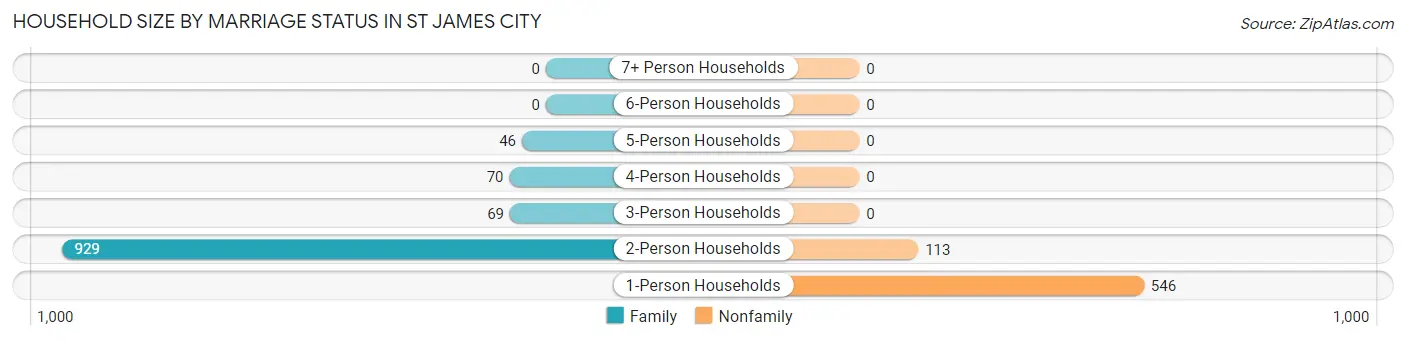
Household Size by Marriage Status in St James City
Out of a total of 1,773 households in St James City, 1,114 (62.8%) are family households, while 659 (37.2%) are nonfamily households. The most numerous type of family households are 2-person households, comprising 929, and the most common type of nonfamily households are 1-person households, comprising 546.
| Household Size | Family Households | Nonfamily Households |
| 1-Person Households | - | 546 (30.8%) |
| 2-Person Households | 929 (52.4%) | 113 (6.4%) |
| 3-Person Households | 69 (3.9%) | 0 (0.0%) |
| 4-Person Households | 70 (4.0%) | 0 (0.0%) |
| 5-Person Households | 46 (2.6%) | 0 (0.0%) |
| 6-Person Households | 0 (0.0%) | 0 (0.0%) |
| 7+ Person Households | 0 (0.0%) | 0 (0.0%) |
| Total | 1,114 (62.8%) | 659 (37.2%) |
Female Fertility in St James City
Fertility by Age in St James City
| Age Bracket | Women with Births | Births / 1,000 Women |
| 15 to 19 years | 0 (0.0%) | 0.0 |
| 20 to 34 years | 0 (0.0%) | 0.0 |
| 35 to 50 years | 0 (0.0%) | 0.0 |
| Total | 0 (0.0%) | 0.0 |
Fertility by Age by Marriage Status in St James City
| Age Bracket | Married | Unmarried |
| 15 to 19 years | 0 (0.0%) | 0 (0.0%) |
| 20 to 34 years | 0 (0.0%) | 0 (0.0%) |
| 35 to 50 years | 0 (0.0%) | 0 (0.0%) |
| Total | 0 (0.0%) | 0 (0.0%) |
Fertility by Education in St James City
| Educational Attainment | Women with Births | Births / 1,000 Women |
| Less than High School | 0 (0.0%) | 0.0 |
| High School Diploma | 0 (0.0%) | 0.0 |
| College or Associate's Degree | 0 (0.0%) | 0.0 |
| Bachelor's Degree | 0 (0.0%) | 0.0 |
| Graduate Degree | 0 (0.0%) | 0.0 |
| Total | 0 (0.0%) | 0.0 |
Fertility by Education by Marriage Status in St James City
| Educational Attainment | Married | Unmarried |
| Less than High School | 0 (0.0%) | 0 (0.0%) |
| High School Diploma | 0 (0.0%) | 0 (0.0%) |
| College or Associate's Degree | 0 (0.0%) | 0 (0.0%) |
| Bachelor's Degree | 0 (0.0%) | 0 (0.0%) |
| Graduate Degree | 0 (0.0%) | 0 (0.0%) |
| Total | 0 (0.0%) | 0 (0.0%) |
Income in St James City
Income Overview in St James City
Per Capita Income in St James City is $59,153, while median incomes of families and households are $64,479 and $62,415 respectively.
| Characteristic | Number | Measure |
| Per Capita Income | 3,494 | $59,153 |
| Median Family Income | 1,114 | $64,479 |
| Mean Family Income | 1,114 | $103,151 |
| Median Household Income | 1,773 | $62,415 |
| Mean Household Income | 1,773 | $114,805 |
| Income Deficit | 1,114 | $0 |
| Wage / Income Gap (%) | 3,494 | 0.00% |
| Wage / Income Gap ($) | 3,494 | 100.00¢ per $1 |
| Gini / Inequality Index | 3,494 | 0.57 |
Earnings by Sex in St James City
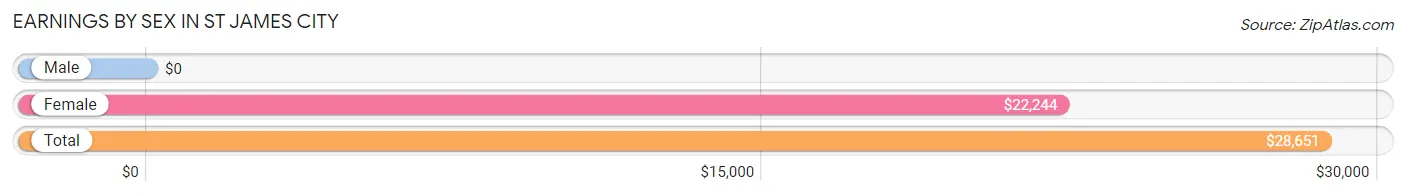
| Sex | Number | Average Earnings |
| Male | 778 (56.3%) | $0 |
| Female | 603 (43.7%) | $22,244 |
| Total | 1,381 (100.0%) | $28,651 |
Earnings by Sex by Income Bracket in St James City
The most common earnings brackets in St James City are $100,000+ for men (192 | 24.7%) and $12,500 to $14,999 for women (149 | 24.7%).
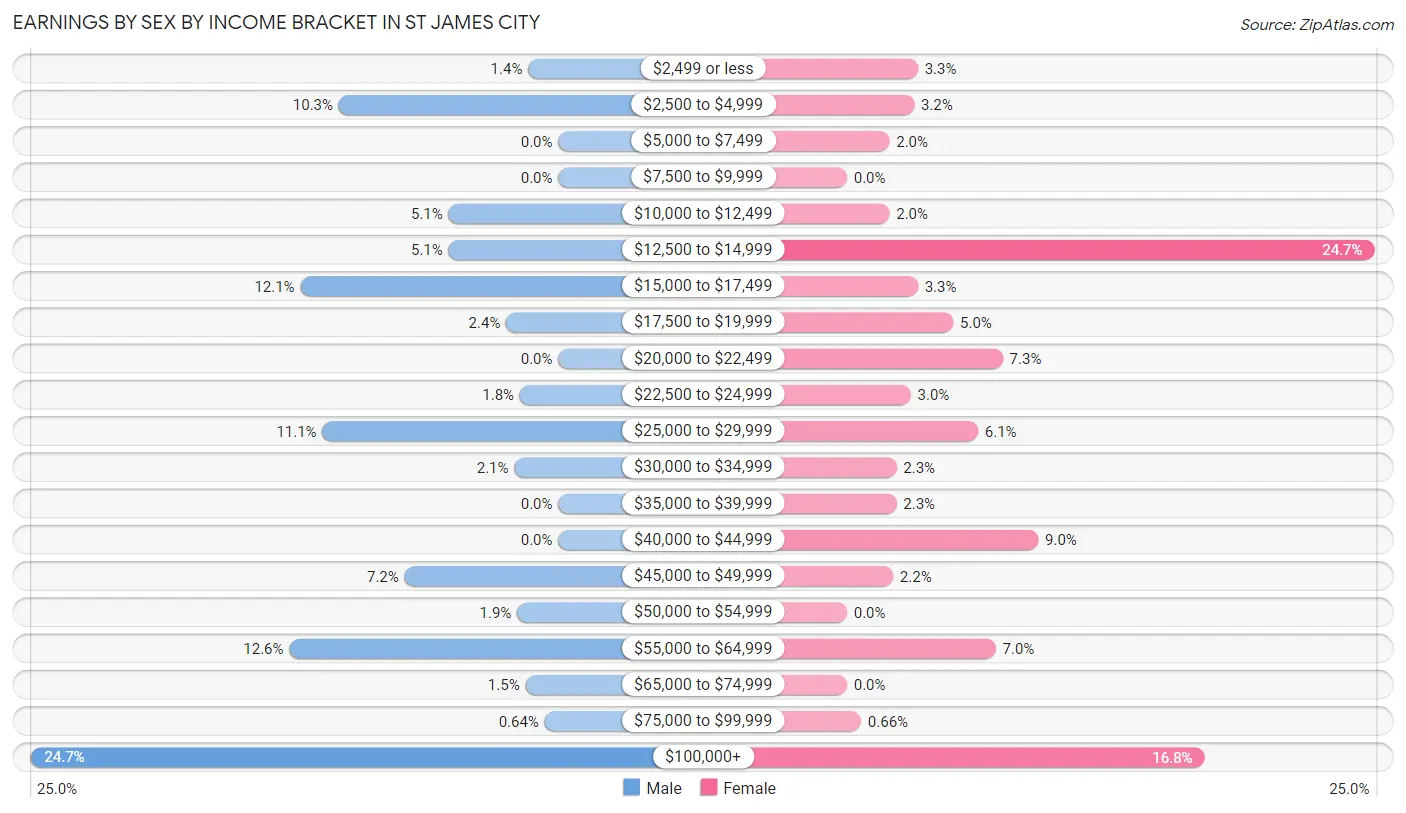
| Income | Male | Female |
| $2,499 or less | 11 (1.4%) | 20 (3.3%) |
| $2,500 to $4,999 | 80 (10.3%) | 19 (3.2%) |
| $5,000 to $7,499 | 0 (0.0%) | 12 (2.0%) |
| $7,500 to $9,999 | 0 (0.0%) | 0 (0.0%) |
| $10,000 to $12,499 | 40 (5.1%) | 12 (2.0%) |
| $12,500 to $14,999 | 40 (5.1%) | 149 (24.7%) |
| $15,000 to $17,499 | 94 (12.1%) | 20 (3.3%) |
| $17,500 to $19,999 | 19 (2.4%) | 30 (5.0%) |
| $20,000 to $22,499 | 0 (0.0%) | 44 (7.3%) |
| $22,500 to $24,999 | 14 (1.8%) | 18 (3.0%) |
| $25,000 to $29,999 | 86 (11.1%) | 37 (6.1%) |
| $30,000 to $34,999 | 16 (2.1%) | 14 (2.3%) |
| $35,000 to $39,999 | 0 (0.0%) | 14 (2.3%) |
| $40,000 to $44,999 | 0 (0.0%) | 54 (9.0%) |
| $45,000 to $49,999 | 56 (7.2%) | 13 (2.2%) |
| $50,000 to $54,999 | 15 (1.9%) | 0 (0.0%) |
| $55,000 to $64,999 | 98 (12.6%) | 42 (7.0%) |
| $65,000 to $74,999 | 12 (1.5%) | 0 (0.0%) |
| $75,000 to $99,999 | 5 (0.6%) | 4 (0.7%) |
| $100,000+ | 192 (24.7%) | 101 (16.8%) |
| Total | 778 (100.0%) | 603 (100.0%) |
Earnings by Sex by Educational Attainment in St James City
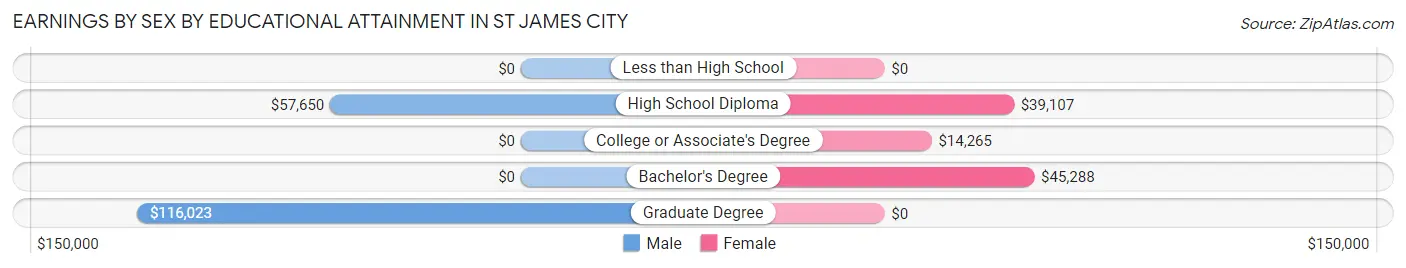
| Educational Attainment | Male Income | Female Income |
| Less than High School | - | - |
| High School Diploma | $57,650 | $39,107 |
| College or Associate's Degree | - | - |
| Bachelor's Degree | - | - |
| Graduate Degree | $116,023 | $0 |
| Total | - | - |
Family Income in St James City
Family Income Brackets in St James City
According to the St James City family income data, there are 201 families falling into the $100,000 to $149,999 income range, which is the most common income bracket and makes up 18.0% of all families. Conversely, the $10,000 to $14,999 income bracket is the least frequent group with only 16 families (1.4%) belonging to this category.
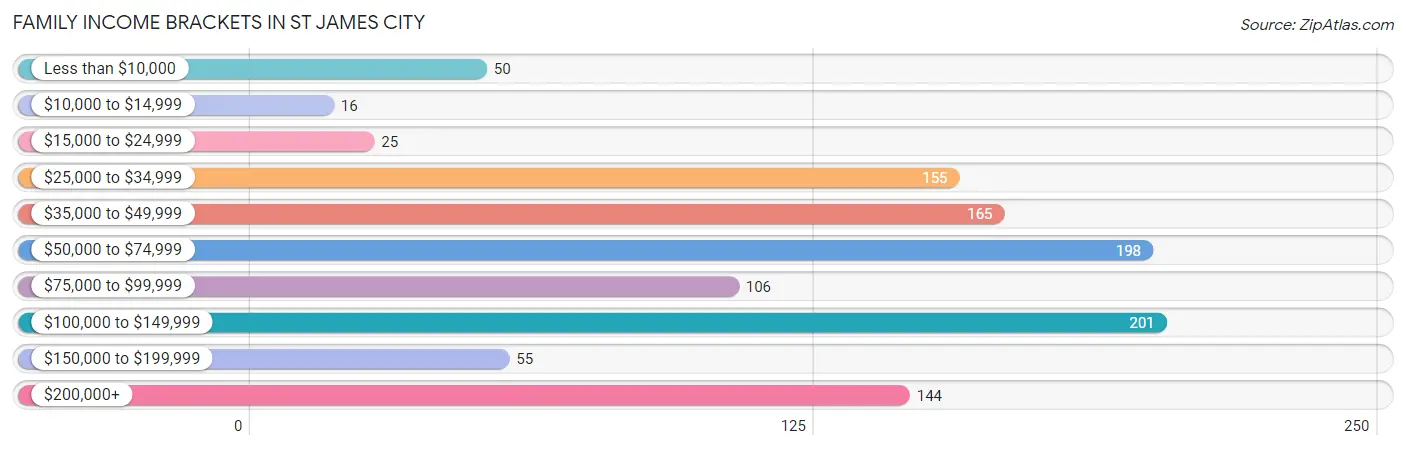
| Income Bracket | # Families | % Families |
| Less than $10,000 | 50 | 4.5% |
| $10,000 to $14,999 | 16 | 1.4% |
| $15,000 to $24,999 | 25 | 2.2% |
| $25,000 to $34,999 | 155 | 13.9% |
| $35,000 to $49,999 | 165 | 14.8% |
| $50,000 to $74,999 | 198 | 17.8% |
| $75,000 to $99,999 | 106 | 9.5% |
| $100,000 to $149,999 | 201 | 18.0% |
| $150,000 to $199,999 | 55 | 4.9% |
| $200,000+ | 144 | 12.9% |
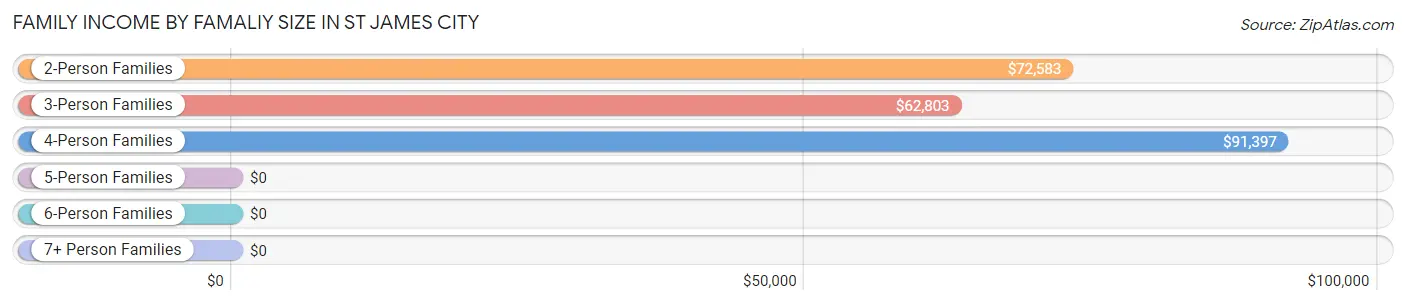
Family Income by Famaliy Size in St James City
4-person families (31 | 2.8%) account for the highest median family income in St James City with $91,397 per family, while 2-person families (929 | 83.4%) have the highest median income of $36,292 per family member.
| Income Bracket | # Families | Median Income |
| 2-Person Families | 929 (83.4%) | $72,583 |
| 3-Person Families | 108 (9.7%) | $62,803 |
| 4-Person Families | 31 (2.8%) | $91,397 |
| 5-Person Families | 46 (4.1%) | $0 |
| 6-Person Families | 0 (0.0%) | $0 |
| 7+ Person Families | 0 (0.0%) | $0 |
| Total | 1,114 (100.0%) | $64,479 |
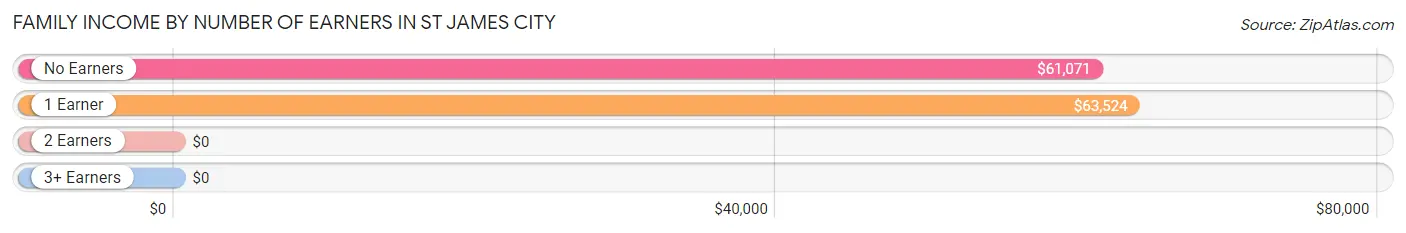
Family Income by Number of Earners in St James City
| Number of Earners | # Families | Median Income |
| No Earners | 450 (40.4%) | $61,071 |
| 1 Earner | 287 (25.8%) | $63,524 |
| 2 Earners | 369 (33.1%) | $0 |
| 3+ Earners | 8 (0.7%) | $0 |
| Total | 1,114 (100.0%) | $64,479 |
Household Income in St James City
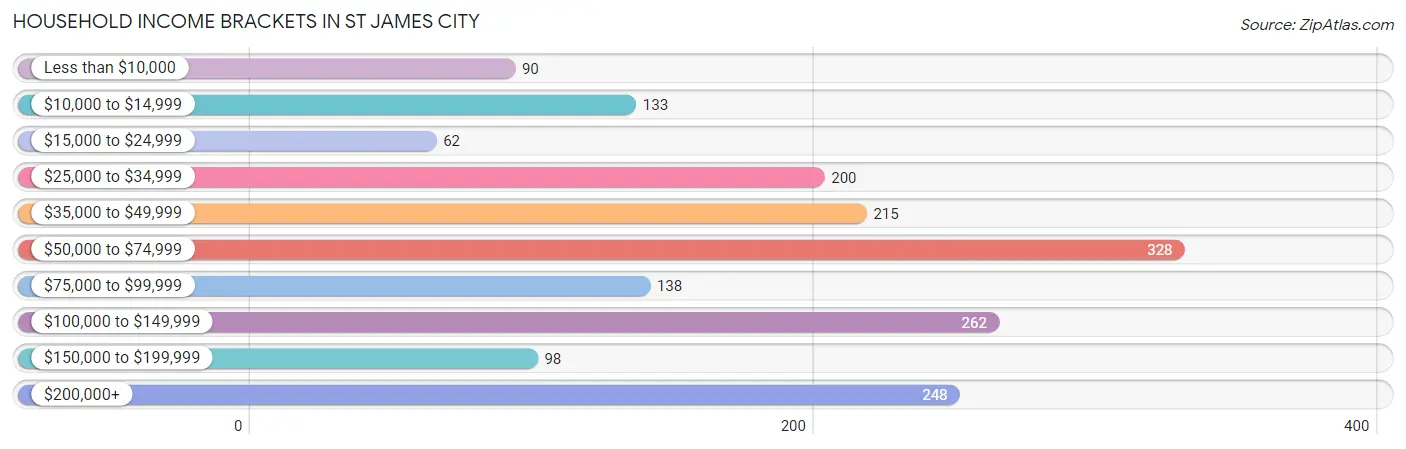
Household Income Brackets in St James City
With 328 households falling in the category, the $50,000 to $74,999 income range is the most frequent in St James City, accounting for 18.5% of all households. In contrast, only 62 households (3.5%) fall into the $15,000 to $24,999 income bracket, making it the least populous group.
| Income Bracket | # Households | % Households |
| Less than $10,000 | 90 | 5.1% |
| $10,000 to $14,999 | 133 | 7.5% |
| $15,000 to $24,999 | 62 | 3.5% |
| $25,000 to $34,999 | 200 | 11.3% |
| $35,000 to $49,999 | 215 | 12.1% |
| $50,000 to $74,999 | 328 | 18.5% |
| $75,000 to $99,999 | 138 | 7.8% |
| $100,000 to $149,999 | 262 | 14.8% |
| $150,000 to $199,999 | 98 | 5.5% |
| $200,000+ | 248 | 14.0% |
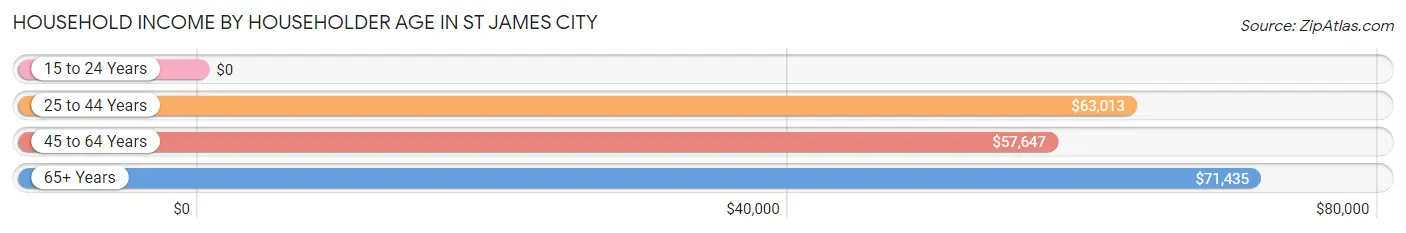
Household Income by Householder Age in St James City
The median household income in St James City is $62,415, with the highest median household income of $71,435 found in the 65+ years age bracket for the primary householder. A total of 989 households (55.8%) fall into this category. Meanwhile, the 15 to 24 years age bracket for the primary householder has the lowest median household income of $0, with 14 households (0.8%) in this group.
| Income Bracket | # Households | Median Income |
| 15 to 24 Years | 14 (0.8%) | $0 |
| 25 to 44 Years | 70 (4.0%) | $63,013 |
| 45 to 64 Years | 700 (39.5%) | $57,647 |
| 65+ Years | 989 (55.8%) | $71,435 |
| Total | 1,773 (100.0%) | $62,415 |
Poverty in St James City
Income Below Poverty by Sex and Age in St James City
With 8.9% poverty level for males and 10.4% for females among the residents of St James City, 55 to 64 year old males and 65 to 74 year old females are the most vulnerable to poverty, with 82 males (18.3%) and 107 females (19.5%) in their respective age groups living below the poverty level.

| Age Bracket | Male | Female |
| Under 5 Years | 0 (0.0%) | 0 (0.0%) |
| 5 Years | 0 (0.0%) | 0 (0.0%) |
| 6 to 11 Years | 0 (0.0%) | 0 (0.0%) |
| 12 to 14 Years | 0 (0.0%) | 0 (0.0%) |
| 15 Years | 0 (0.0%) | 0 (0.0%) |
| 16 and 17 Years | 0 (0.0%) | 0 (0.0%) |
| 18 to 24 Years | 0 (0.0%) | 0 (0.0%) |
| 25 to 34 Years | 0 (0.0%) | 0 (0.0%) |
| 35 to 44 Years | 0 (0.0%) | 0 (0.0%) |
| 45 to 54 Years | 0 (0.0%) | 9 (3.8%) |
| 55 to 64 Years | 82 (18.3%) | 35 (9.2%) |
| 65 to 74 Years | 82 (13.6%) | 107 (19.5%) |
| 75 Years and over | 0 (0.0%) | 22 (7.0%) |
| Total | 164 (8.9%) | 173 (10.4%) |
Income Above Poverty by Sex and Age in St James City
According to the poverty statistics in St James City, males aged 5 years and females aged 6 to 11 years are the age groups that are most secure financially, with 100.0% of males and 100.0% of females in these age groups living above the poverty line.
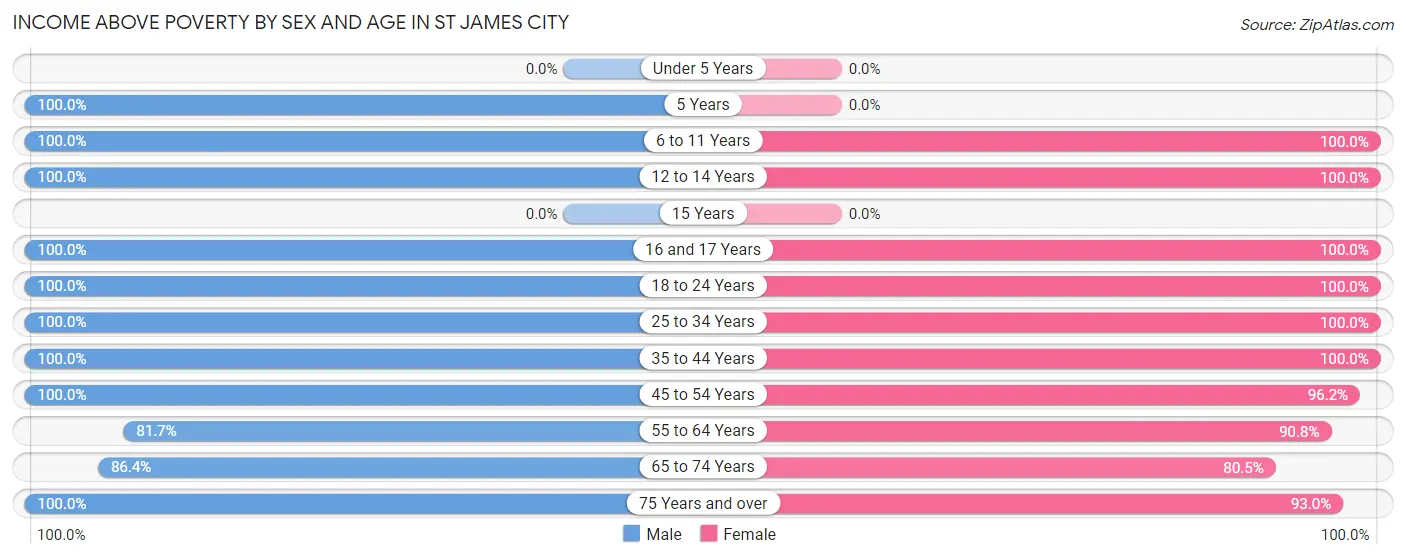
| Age Bracket | Male | Female |
| Under 5 Years | 0 (0.0%) | 0 (0.0%) |
| 5 Years | 38 (100.0%) | 0 (0.0%) |
| 6 to 11 Years | 38 (100.0%) | 58 (100.0%) |
| 12 to 14 Years | 8 (100.0%) | 6 (100.0%) |
| 15 Years | 0 (0.0%) | 0 (0.0%) |
| 16 and 17 Years | 47 (100.0%) | 15 (100.0%) |
| 18 to 24 Years | 9 (100.0%) | 27 (100.0%) |
| 25 to 34 Years | 117 (100.0%) | 51 (100.0%) |
| 35 to 44 Years | 9 (100.0%) | 19 (100.0%) |
| 45 to 54 Years | 292 (100.0%) | 226 (96.2%) |
| 55 to 64 Years | 365 (81.7%) | 347 (90.8%) |
| 65 to 74 Years | 520 (86.4%) | 442 (80.5%) |
| 75 Years and over | 230 (100.0%) | 293 (93.0%) |
| Total | 1,673 (91.1%) | 1,484 (89.6%) |
Income Below Poverty Among Married-Couple Families in St James City
The poverty statistics for married-couple families in St James City show that 5.9% or 59 of the total 1,005 families live below the poverty line. Families with no children have the highest poverty rate of 6.3%, comprising of 59 families. On the other hand, families with 1 or 2 children have the lowest poverty rate of 0.0%, which includes 0 families.
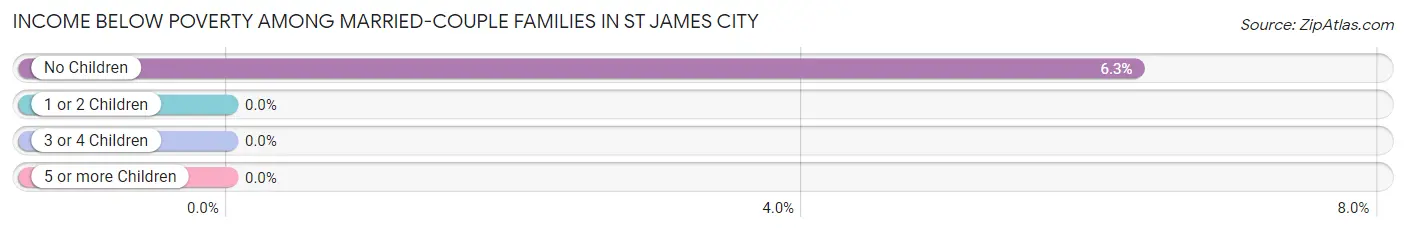
| Children | Above Poverty | Below Poverty |
| No Children | 876 (93.7%) | 59 (6.3%) |
| 1 or 2 Children | 31 (100.0%) | 0 (0.0%) |
| 3 or 4 Children | 39 (100.0%) | 0 (0.0%) |
| 5 or more Children | 0 (0.0%) | 0 (0.0%) |
| Total | 946 (94.1%) | 59 (5.9%) |
Income Below Poverty Among Single-Parent Households in St James City
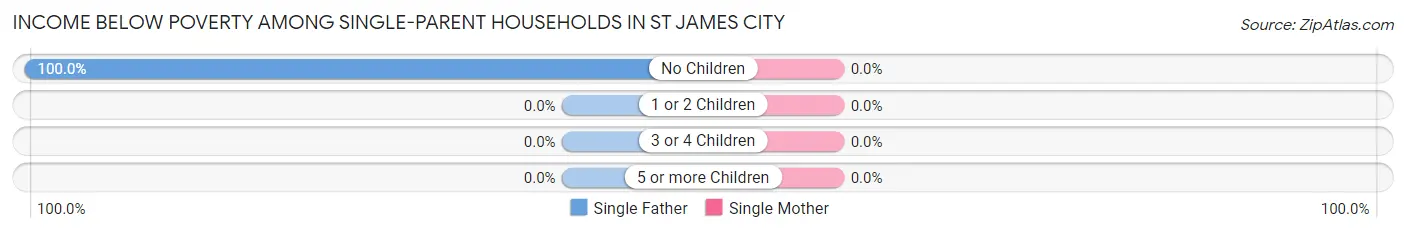
| Children | Single Father | Single Mother |
| No Children | 7 (100.0%) | 0 (0.0%) |
| 1 or 2 Children | 0 (0.0%) | 0 (0.0%) |
| 3 or 4 Children | 0 (0.0%) | 0 (0.0%) |
| 5 or more Children | 0 (0.0%) | 0 (0.0%) |
| Total | 7 (15.2%) | 0 (0.0%) |
Income Below Poverty Among Married-Couple vs Single-Parent Households in St James City
The poverty data for St James City shows that 59 of the married-couple family households (5.9%) and 7 of the single-parent households (6.4%) are living below the poverty level. Within the married-couple family households, those with no children have the highest poverty rate, with 59 households (6.3%) falling below the poverty line. Among the single-parent households, those with no children have the highest poverty rate, with 7 household (13.5%) living below poverty.
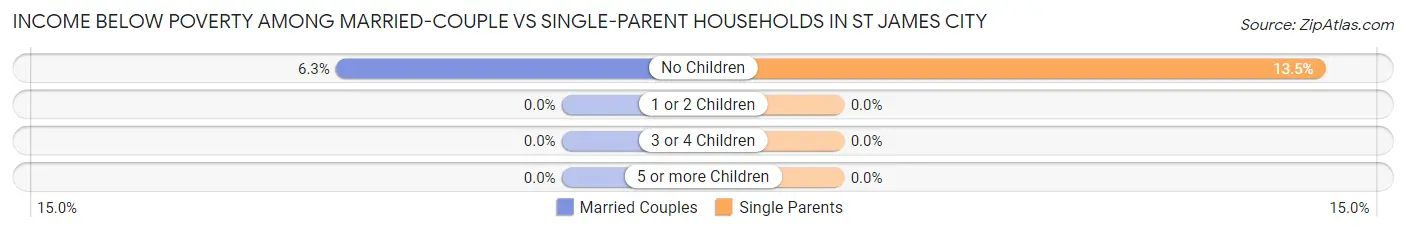
| Children | Married-Couple Families | Single-Parent Households |
| No Children | 59 (6.3%) | 7 (13.5%) |
| 1 or 2 Children | 0 (0.0%) | 0 (0.0%) |
| 3 or 4 Children | 0 (0.0%) | 0 (0.0%) |
| 5 or more Children | 0 (0.0%) | 0 (0.0%) |
| Total | 59 (5.9%) | 7 (6.4%) |
Employment Characteristics in St James City
Employment by Class of Employer in St James City
Among the 1,123 employed individuals in St James City, private company employees (661 | 58.9%), self-employed (not incorporated) (243 | 21.6%), and self-employed (incorporated) (94 | 8.4%) make up the most common classes of employment.
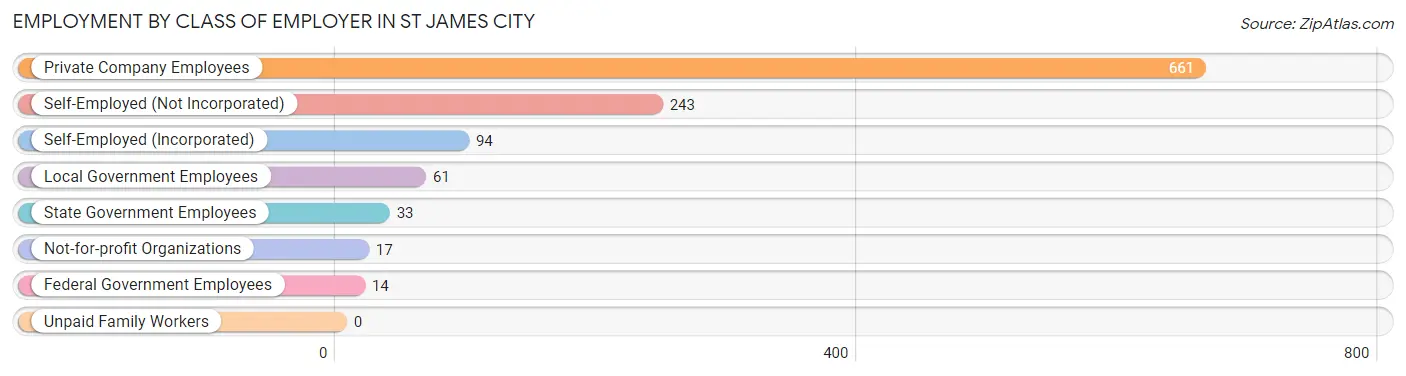
| Employer Class | # Employees | % Employees |
| Private Company Employees | 661 | 58.9% |
| Self-Employed (Incorporated) | 94 | 8.4% |
| Self-Employed (Not Incorporated) | 243 | 21.6% |
| Not-for-profit Organizations | 17 | 1.5% |
| Local Government Employees | 61 | 5.4% |
| State Government Employees | 33 | 2.9% |
| Federal Government Employees | 14 | 1.3% |
| Unpaid Family Workers | 0 | 0.0% |
| Total | 1,123 | 100.0% |
Employment Status by Age in St James City
According to the labor force statistics for St James City, out of the total population over 16 years of age (3,346), 37.4% or 1,251 individuals are in the labor force, with 10.4% or 130 of them unemployed. The age group with the highest labor force participation rate is 20 to 24 years, with 100.0% or 27 individuals in the labor force. Within the labor force, the 45 to 54 years age range has the highest percentage of unemployed individuals, with 20.1% or 98 of them being unemployed.
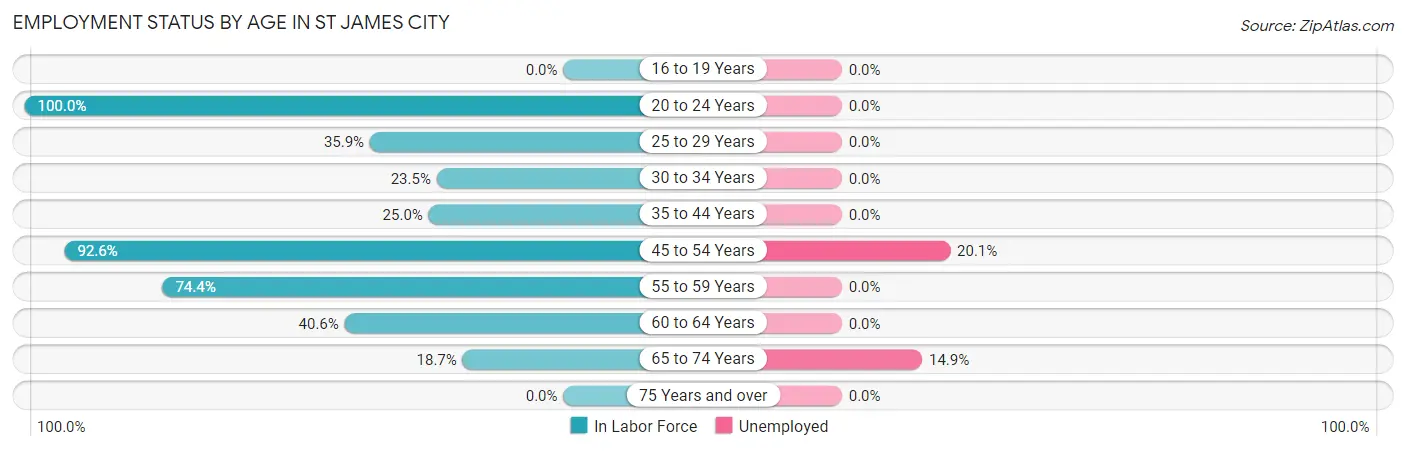
| Age Bracket | In Labor Force | Unemployed |
| 16 to 19 Years | 0 (0.0%) | 0 (0.0%) |
| 20 to 24 Years | 27 (100.0%) | 0 (0.0%) |
| 25 to 29 Years | 42 (35.9%) | 0 (0.0%) |
| 30 to 34 Years | 12 (23.5%) | 0 (0.0%) |
| 35 to 44 Years | 7 (25.0%) | 0 (0.0%) |
| 45 to 54 Years | 488 (92.6%) | 98 (20.1%) |
| 55 to 59 Years | 276 (74.4%) | 0 (0.0%) |
| 60 to 64 Years | 186 (40.6%) | 0 (0.0%) |
| 65 to 74 Years | 215 (18.7%) | 32 (14.9%) |
| 75 Years and over | 0 (0.0%) | 0 (0.0%) |
| Total | 1,251 (37.4%) | 130 (10.4%) |
Employment Status by Educational Attainment in St James City
According to labor force statistics for St James City, 65.1% of individuals (1,010) out of the total population between 25 and 64 years of age (1,552) are in the labor force, with 9.7% or 98 of them being unemployed. The group with the highest labor force participation rate are those with the educational attainment of college / associate degree, with 85.9% or 495 individuals in the labor force. Within the labor force, individuals with bachelor's degree or higher education have the highest percentage of unemployment, with 24.3% or 54 of them being unemployed.
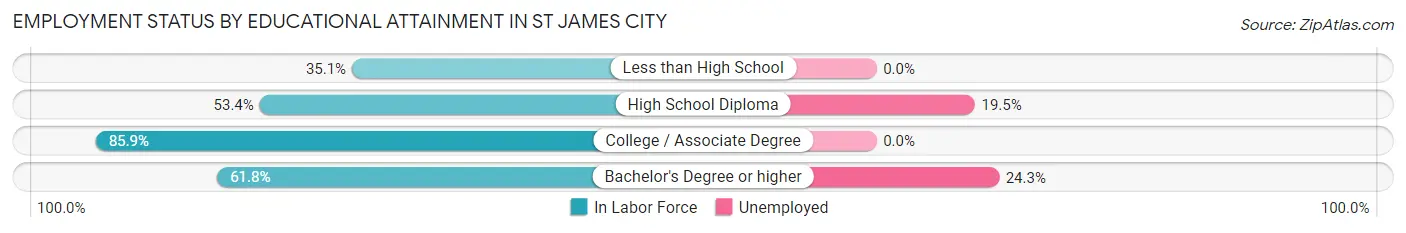
| Educational Attainment | In Labor Force | Unemployed |
| Less than High School | 68 (35.1%) | 0 (0.0%) |
| High School Diploma | 226 (53.4%) | 82 (19.5%) |
| College / Associate Degree | 495 (85.9%) | 0 (0.0%) |
| Bachelor's Degree or higher | 222 (61.8%) | 87 (24.3%) |
| Total | 1,010 (65.1%) | 151 (9.7%) |
Employment Occupations by Sex in St James City
Management, Business, Science and Arts Occupations
The most common Management, Business, Science and Arts occupations in St James City are Management (168 | 15.0%), Business & Financial (48 | 4.3%), Health Diagnosing & Treating (48 | 4.3%), Health Technologists (48 | 4.3%), and Community & Social Service (35 | 3.1%).
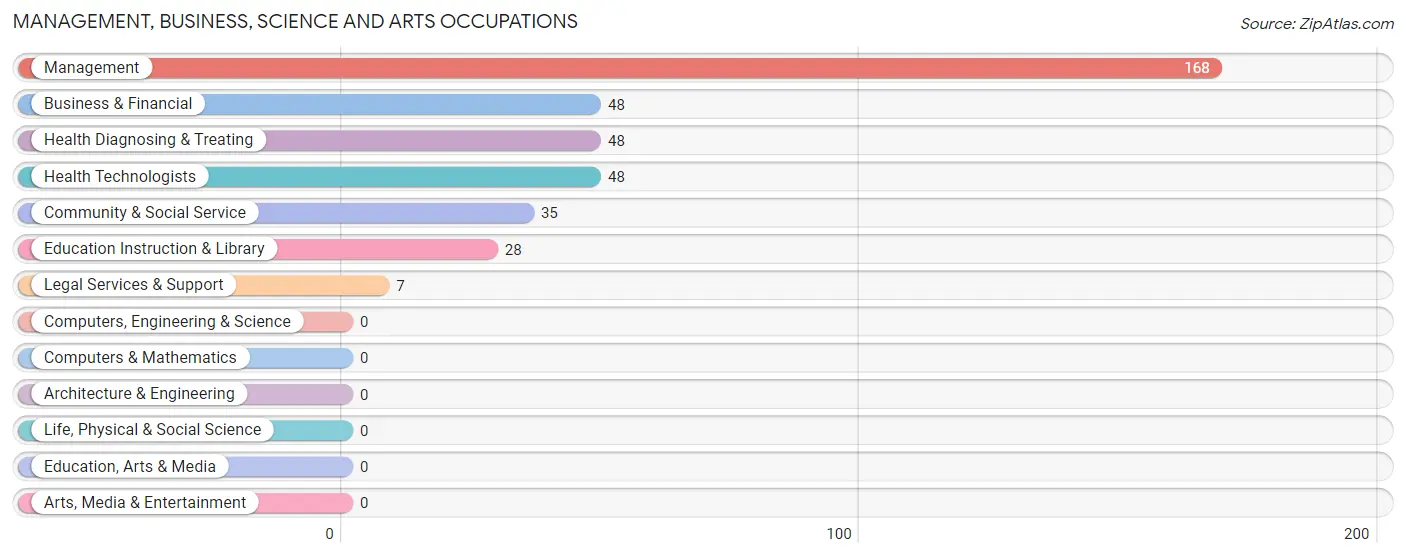
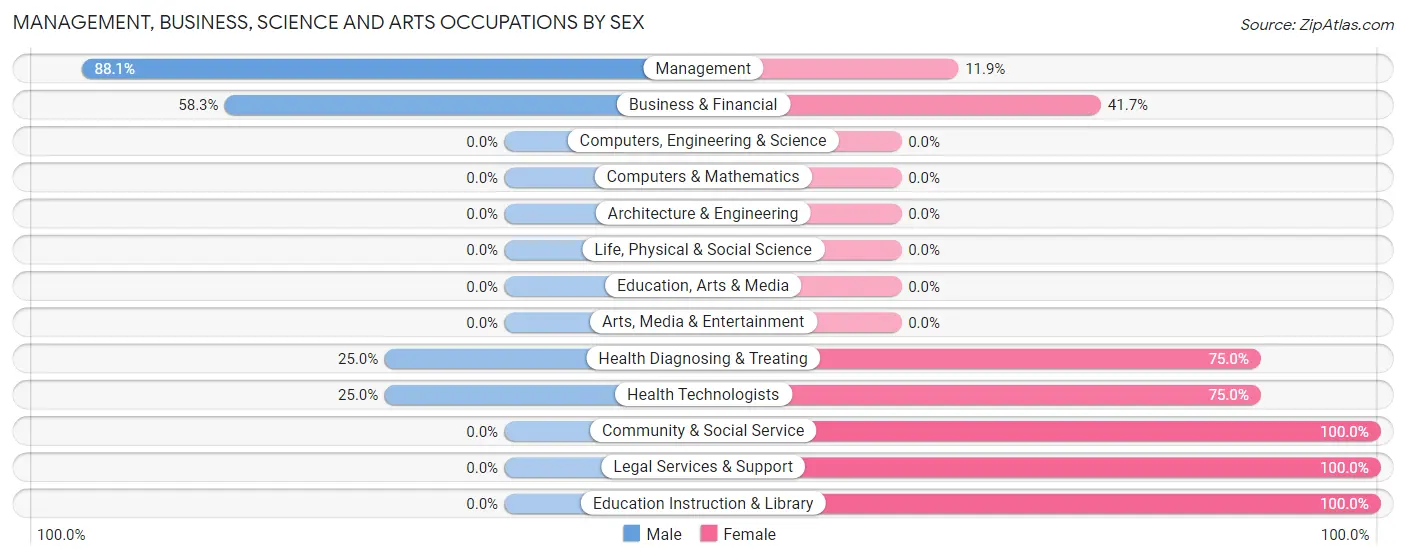
Management, Business, Science and Arts Occupations by Sex
Within the Management, Business, Science and Arts occupations in St James City, the most male-oriented occupations are Management (88.1%), Business & Financial (58.3%), and Health Diagnosing & Treating (25.0%), while the most female-oriented occupations are Community & Social Service (100.0%), Legal Services & Support (100.0%), and Education Instruction & Library (100.0%).
| Occupation | Male | Female |
| Management | 148 (88.1%) | 20 (11.9%) |
| Business & Financial | 28 (58.3%) | 20 (41.7%) |
| Computers, Engineering & Science | 0 (0.0%) | 0 (0.0%) |
| Computers & Mathematics | 0 (0.0%) | 0 (0.0%) |
| Architecture & Engineering | 0 (0.0%) | 0 (0.0%) |
| Life, Physical & Social Science | 0 (0.0%) | 0 (0.0%) |
| Community & Social Service | 0 (0.0%) | 35 (100.0%) |
| Education, Arts & Media | 0 (0.0%) | 0 (0.0%) |
| Legal Services & Support | 0 (0.0%) | 7 (100.0%) |
| Education Instruction & Library | 0 (0.0%) | 28 (100.0%) |
| Arts, Media & Entertainment | 0 (0.0%) | 0 (0.0%) |
| Health Diagnosing & Treating | 12 (25.0%) | 36 (75.0%) |
| Health Technologists | 12 (25.0%) | 36 (75.0%) |
| Total (Category) | 188 (62.9%) | 111 (37.1%) |
| Total (Overall) | 647 (57.6%) | 476 (42.4%) |
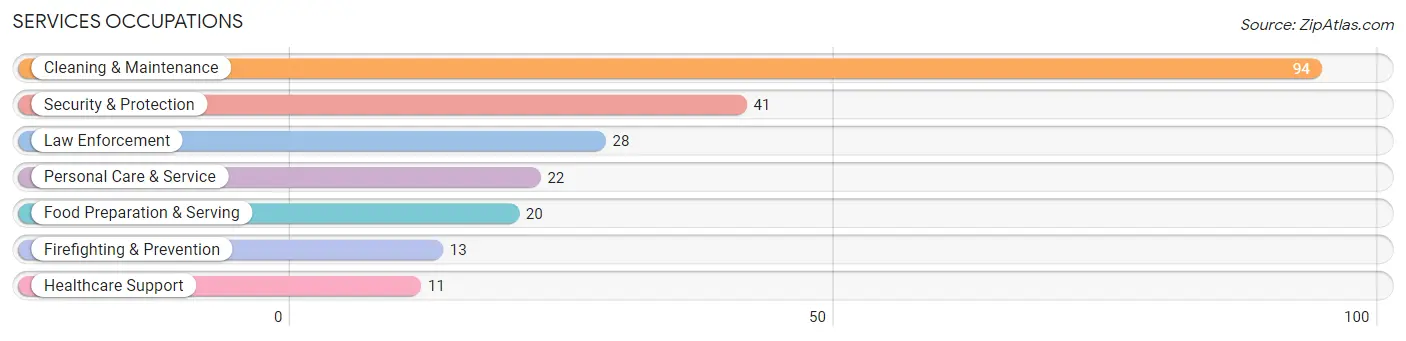
Services Occupations
The most common Services occupations in St James City are Cleaning & Maintenance (94 | 8.4%), Security & Protection (41 | 3.6%), Law Enforcement (28 | 2.5%), Personal Care & Service (22 | 2.0%), and Food Preparation & Serving (20 | 1.8%).
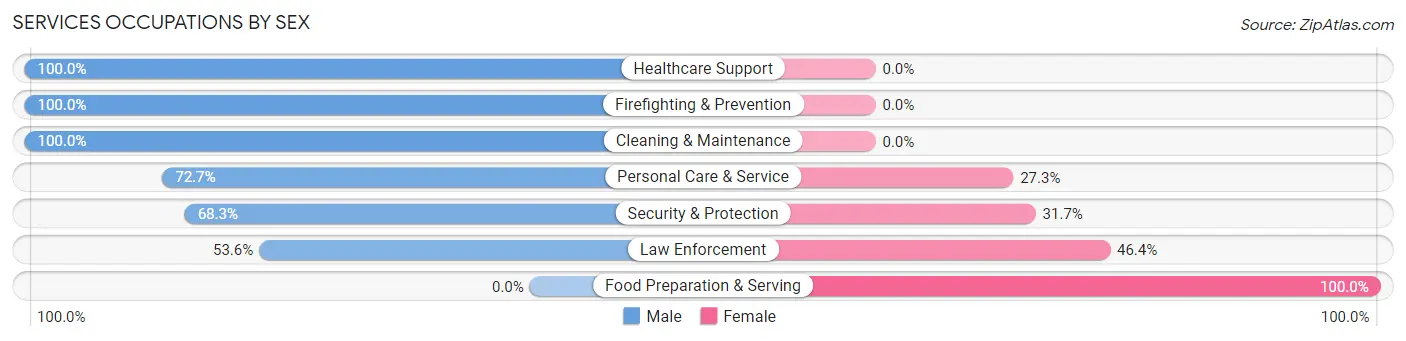
Services Occupations by Sex
Within the Services occupations in St James City, the most male-oriented occupations are Healthcare Support (100.0%), Firefighting & Prevention (100.0%), and Cleaning & Maintenance (100.0%), while the most female-oriented occupations are Food Preparation & Serving (100.0%), Law Enforcement (46.4%), and Security & Protection (31.7%).
| Occupation | Male | Female |
| Healthcare Support | 11 (100.0%) | 0 (0.0%) |
| Security & Protection | 28 (68.3%) | 13 (31.7%) |
| Firefighting & Prevention | 13 (100.0%) | 0 (0.0%) |
| Law Enforcement | 15 (53.6%) | 13 (46.4%) |
| Food Preparation & Serving | 0 (0.0%) | 20 (100.0%) |
| Cleaning & Maintenance | 94 (100.0%) | 0 (0.0%) |
| Personal Care & Service | 16 (72.7%) | 6 (27.3%) |
| Total (Category) | 149 (79.3%) | 39 (20.7%) |
| Total (Overall) | 647 (57.6%) | 476 (42.4%) |
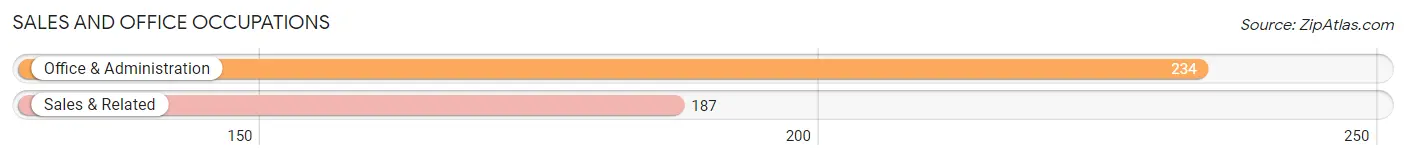
Sales and Office Occupations
The most common Sales and Office occupations in St James City are Office & Administration (234 | 20.8%), and Sales & Related (187 | 16.7%).
Sales and Office Occupations by Sex
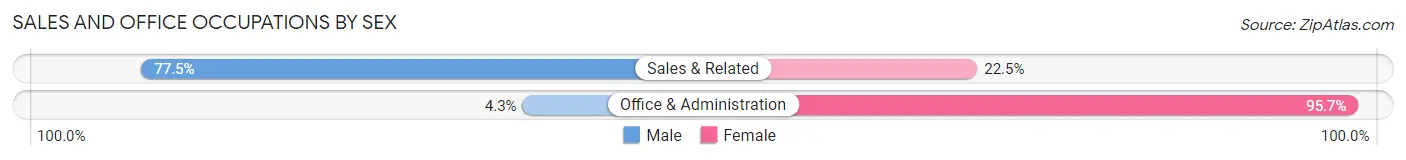
| Occupation | Male | Female |
| Sales & Related | 145 (77.5%) | 42 (22.5%) |
| Office & Administration | 10 (4.3%) | 224 (95.7%) |
| Total (Category) | 155 (36.8%) | 266 (63.2%) |
| Total (Overall) | 647 (57.6%) | 476 (42.4%) |
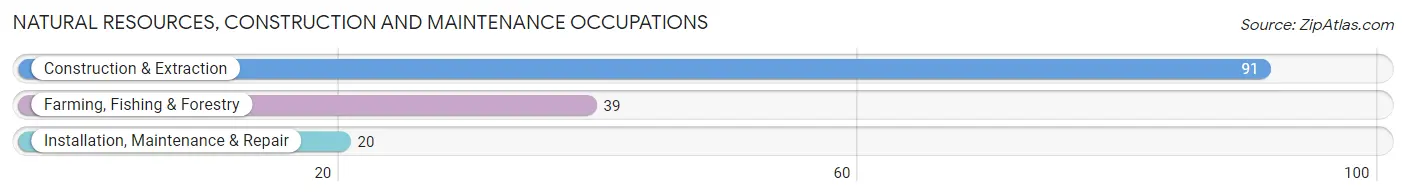
Natural Resources, Construction and Maintenance Occupations
The most common Natural Resources, Construction and Maintenance occupations in St James City are Construction & Extraction (91 | 8.1%), Farming, Fishing & Forestry (39 | 3.5%), and Installation, Maintenance & Repair (20 | 1.8%).
Natural Resources, Construction and Maintenance Occupations by Sex
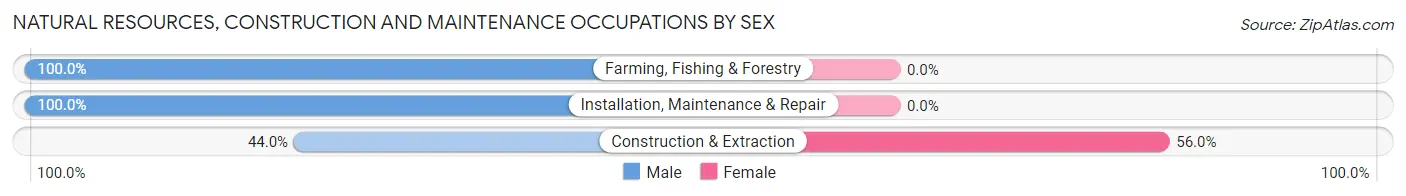
| Occupation | Male | Female |
| Farming, Fishing & Forestry | 39 (100.0%) | 0 (0.0%) |
| Construction & Extraction | 40 (44.0%) | 51 (56.0%) |
| Installation, Maintenance & Repair | 20 (100.0%) | 0 (0.0%) |
| Total (Category) | 99 (66.0%) | 51 (34.0%) |
| Total (Overall) | 647 (57.6%) | 476 (42.4%) |
Production, Transportation and Moving Occupations
The most common Production, Transportation and Moving occupations in St James City are Transportation (38 | 3.4%), Material Moving (22 | 2.0%), and Production (5 | 0.4%).
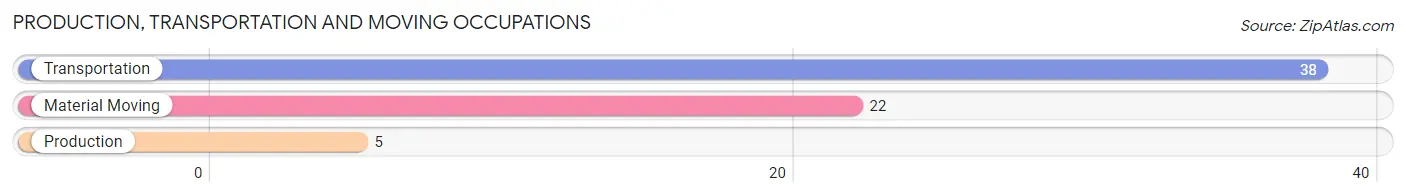
Production, Transportation and Moving Occupations by Sex
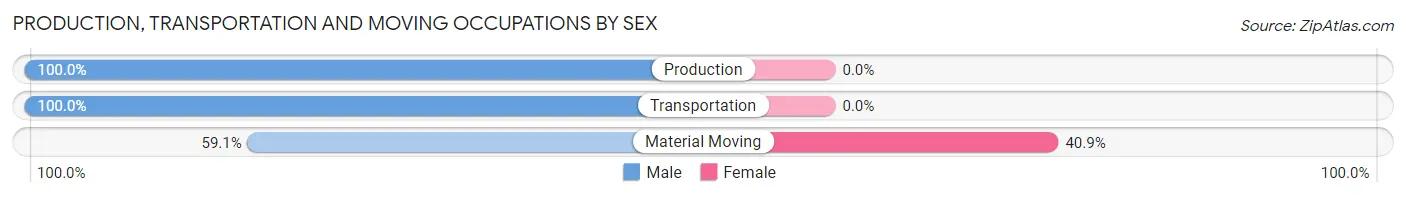
| Occupation | Male | Female |
| Production | 5 (100.0%) | 0 (0.0%) |
| Transportation | 38 (100.0%) | 0 (0.0%) |
| Material Moving | 13 (59.1%) | 9 (40.9%) |
| Total (Category) | 56 (86.2%) | 9 (13.9%) |
| Total (Overall) | 647 (57.6%) | 476 (42.4%) |
Employment Industries by Sex in St James City
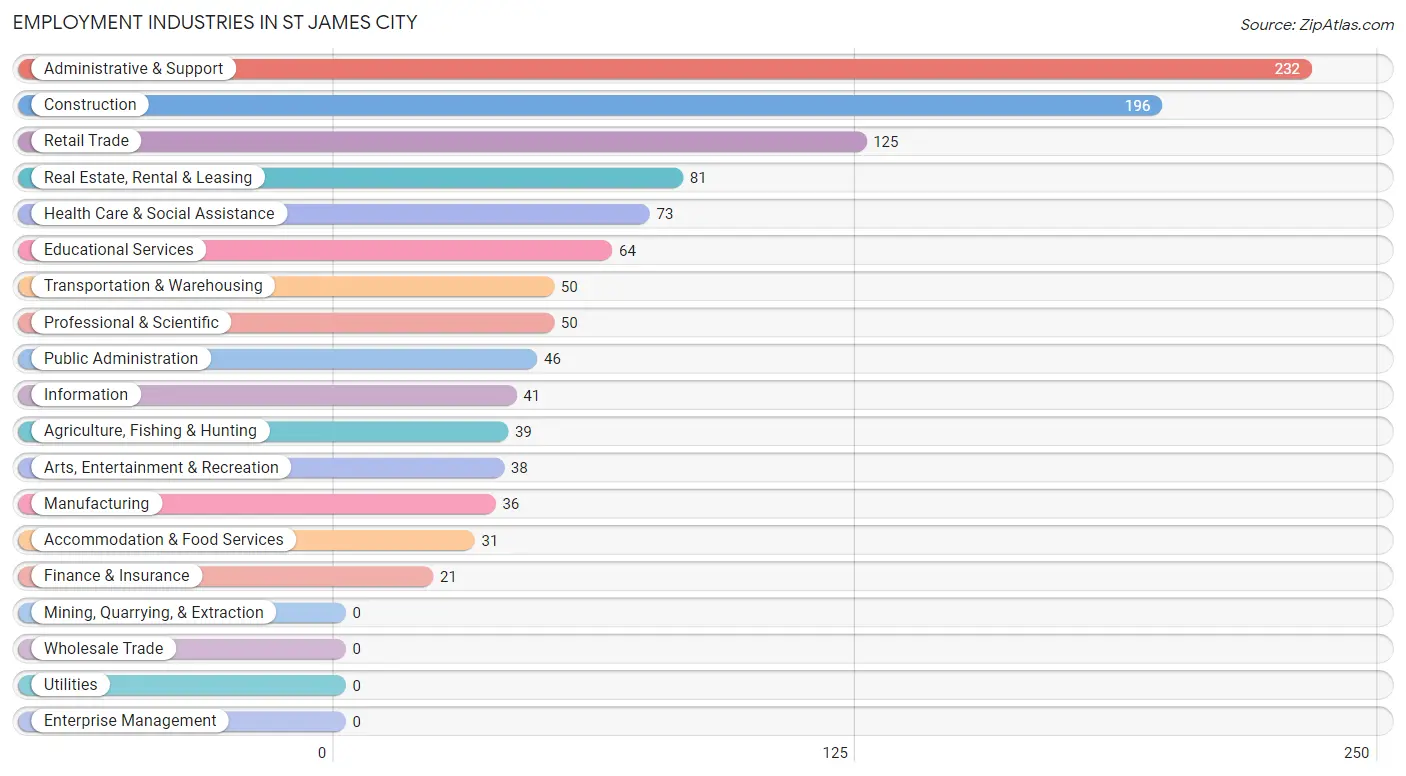
Employment Industries in St James City
The major employment industries in St James City include Administrative & Support (232 | 20.7%), Construction (196 | 17.4%), Retail Trade (125 | 11.1%), Real Estate, Rental & Leasing (81 | 7.2%), and Health Care & Social Assistance (73 | 6.5%).
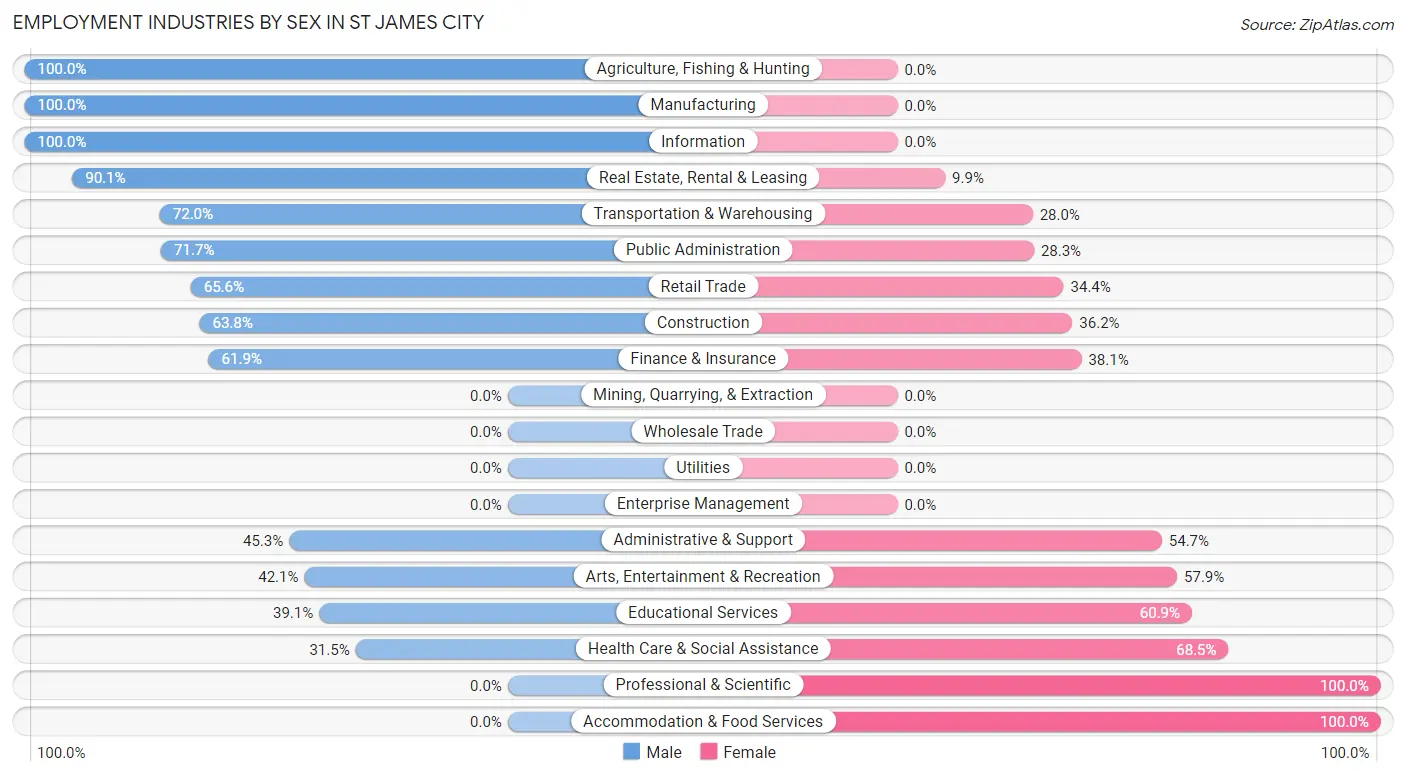
Employment Industries by Sex in St James City
The St James City industries that see more men than women are Agriculture, Fishing & Hunting (100.0%), Manufacturing (100.0%), and Information (100.0%), whereas the industries that tend to have a higher number of women are Professional & Scientific (100.0%), Accommodation & Food Services (100.0%), and Health Care & Social Assistance (68.5%).
| Industry | Male | Female |
| Agriculture, Fishing & Hunting | 39 (100.0%) | 0 (0.0%) |
| Mining, Quarrying, & Extraction | 0 (0.0%) | 0 (0.0%) |
| Construction | 125 (63.8%) | 71 (36.2%) |
| Manufacturing | 36 (100.0%) | 0 (0.0%) |
| Wholesale Trade | 0 (0.0%) | 0 (0.0%) |
| Retail Trade | 82 (65.6%) | 43 (34.4%) |
| Transportation & Warehousing | 36 (72.0%) | 14 (28.0%) |
| Utilities | 0 (0.0%) | 0 (0.0%) |
| Information | 41 (100.0%) | 0 (0.0%) |
| Finance & Insurance | 13 (61.9%) | 8 (38.1%) |
| Real Estate, Rental & Leasing | 73 (90.1%) | 8 (9.9%) |
| Professional & Scientific | 0 (0.0%) | 50 (100.0%) |
| Enterprise Management | 0 (0.0%) | 0 (0.0%) |
| Administrative & Support | 105 (45.3%) | 127 (54.7%) |
| Educational Services | 25 (39.1%) | 39 (60.9%) |
| Health Care & Social Assistance | 23 (31.5%) | 50 (68.5%) |
| Arts, Entertainment & Recreation | 16 (42.1%) | 22 (57.9%) |
| Accommodation & Food Services | 0 (0.0%) | 31 (100.0%) |
| Public Administration | 33 (71.7%) | 13 (28.3%) |
| Total | 647 (57.6%) | 476 (42.4%) |
Education in St James City
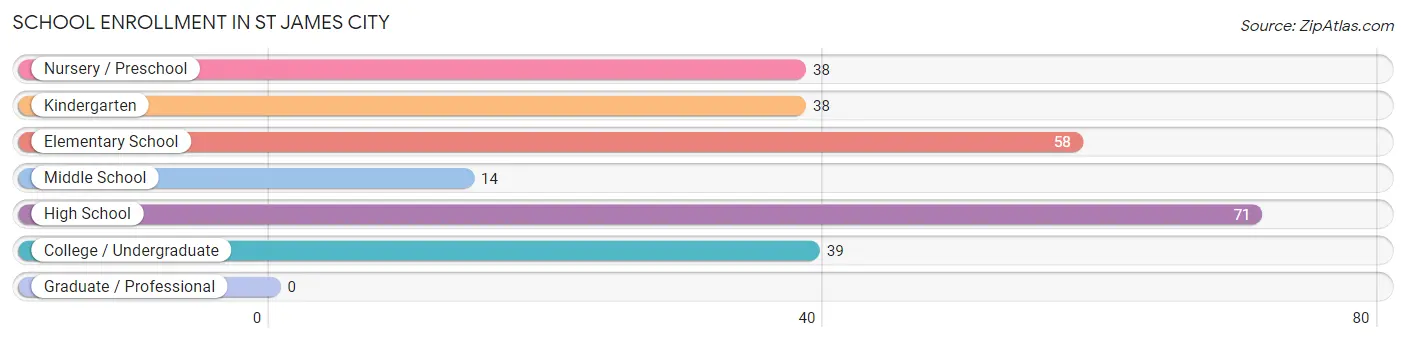
School Enrollment in St James City
The most common levels of schooling among the 258 students in St James City are high school (71 | 27.5%), elementary school (58 | 22.5%), and college / undergraduate (39 | 15.1%).
| School Level | # Students | % Students |
| Nursery / Preschool | 38 | 14.7% |
| Kindergarten | 38 | 14.7% |
| Elementary School | 58 | 22.5% |
| Middle School | 14 | 5.4% |
| High School | 71 | 27.5% |
| College / Undergraduate | 39 | 15.1% |
| Graduate / Professional | 0 | 0.0% |
| Total | 258 | 100.0% |
School Enrollment by Age by Funding Source in St James City
Out of a total of 258 students who are enrolled in schools in St James City, 64 (24.8%) attend a private institution, while the remaining 194 (75.2%) are enrolled in public schools. The age group of 25 to 34 year olds has the highest likelihood of being enrolled in private schools, with 11 (42.3% in the age bracket) enrolled. Conversely, the age group of 10 to 14 year olds has the lowest likelihood of being enrolled in a private school, with 14 (100.0% in the age bracket) attending a public institution.
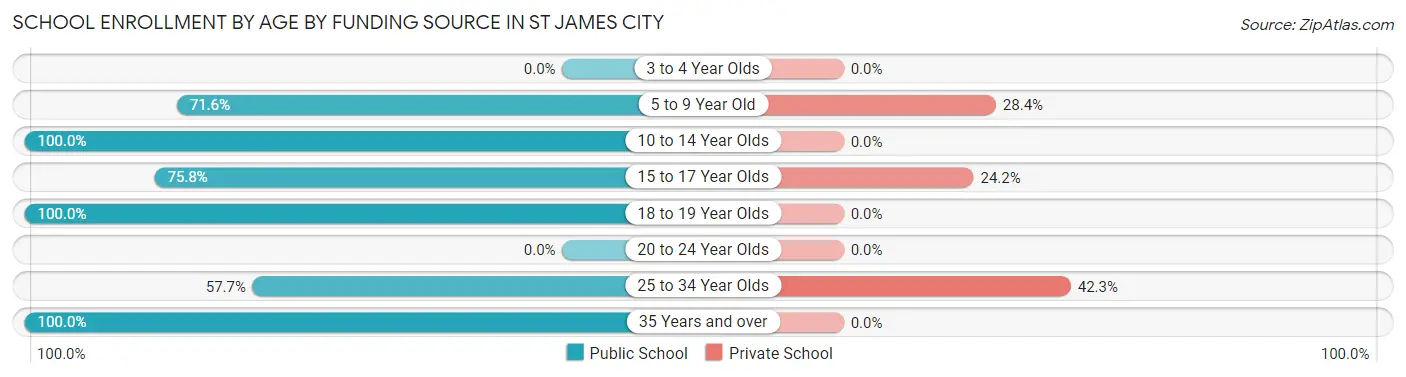
| Age Bracket | Public School | Private School |
| 3 to 4 Year Olds | 0 (0.0%) | 0 (0.0%) |
| 5 to 9 Year Old | 96 (71.6%) | 38 (28.4%) |
| 10 to 14 Year Olds | 14 (100.0%) | 0 (0.0%) |
| 15 to 17 Year Olds | 47 (75.8%) | 15 (24.2%) |
| 18 to 19 Year Olds | 9 (100.0%) | 0 (0.0%) |
| 20 to 24 Year Olds | 0 (0.0%) | 0 (0.0%) |
| 25 to 34 Year Olds | 15 (57.7%) | 11 (42.3%) |
| 35 Years and over | 13 (100.0%) | 0 (0.0%) |
| Total | 194 (75.2%) | 64 (24.8%) |
Educational Attainment by Field of Study in St James City
Business (242 | 29.6%), education (146 | 17.8%), science & technology (99 | 12.1%), bio, nature & agricultural (79 | 9.7%), and engineering (68 | 8.3%) are the most common fields of study among 818 individuals in St James City who have obtained a bachelor's degree or higher.
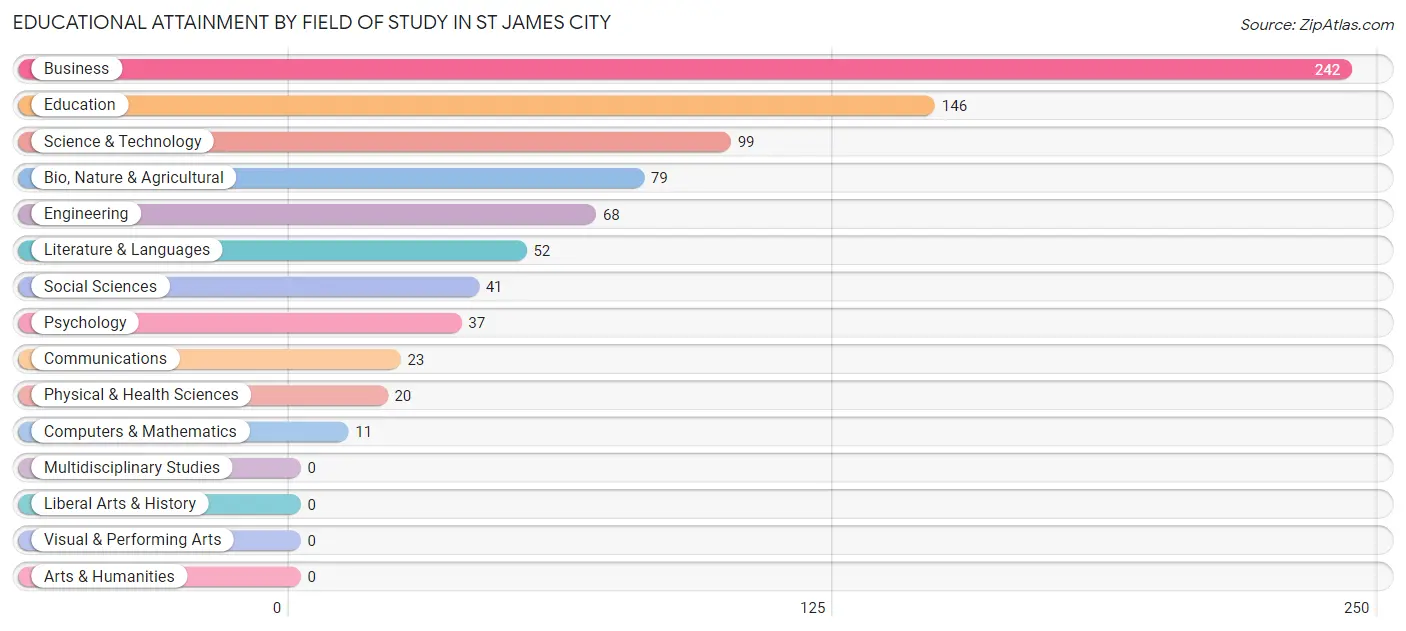
| Field of Study | # Graduates | % Graduates |
| Computers & Mathematics | 11 | 1.3% |
| Bio, Nature & Agricultural | 79 | 9.7% |
| Physical & Health Sciences | 20 | 2.4% |
| Psychology | 37 | 4.5% |
| Social Sciences | 41 | 5.0% |
| Engineering | 68 | 8.3% |
| Multidisciplinary Studies | 0 | 0.0% |
| Science & Technology | 99 | 12.1% |
| Business | 242 | 29.6% |
| Education | 146 | 17.8% |
| Literature & Languages | 52 | 6.4% |
| Liberal Arts & History | 0 | 0.0% |
| Visual & Performing Arts | 0 | 0.0% |
| Communications | 23 | 2.8% |
| Arts & Humanities | 0 | 0.0% |
| Total | 818 | 100.0% |
Transportation & Commute in St James City
Vehicle Availability by Sex in St James City
The most prevalent vehicle ownership categories in St James City are males with 2 vehicles (387, accounting for 59.8%) and females with 2 vehicles (299, making up 81.3%).
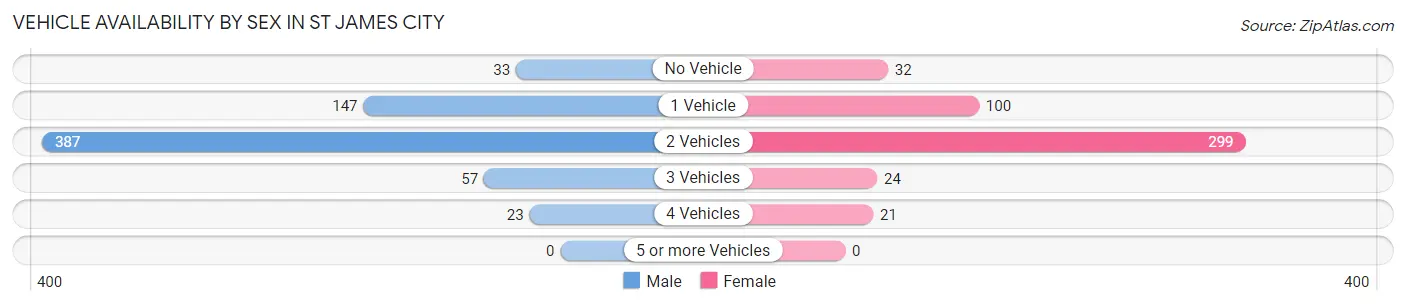
| Vehicles Available | Male | Female |
| No Vehicle | 33 (5.1%) | 32 (6.7%) |
| 1 Vehicle | 147 (22.7%) | 100 (21.0%) |
| 2 Vehicles | 387 (59.8%) | 299 (62.8%) |
| 3 Vehicles | 57 (8.8%) | 24 (5.0%) |
| 4 Vehicles | 23 (3.5%) | 21 (4.4%) |
| 5 or more Vehicles | 0 (0.0%) | 0 (0.0%) |
| Total | 647 (100.0%) | 476 (100.0%) |
Commute Time in St James City
The most frequently occuring commute durations in St James City are 5 to 9 minutes (319 commuters, 32.7%), 20 to 24 minutes (160 commuters, 16.4%), and 15 to 19 minutes (142 commuters, 14.5%).
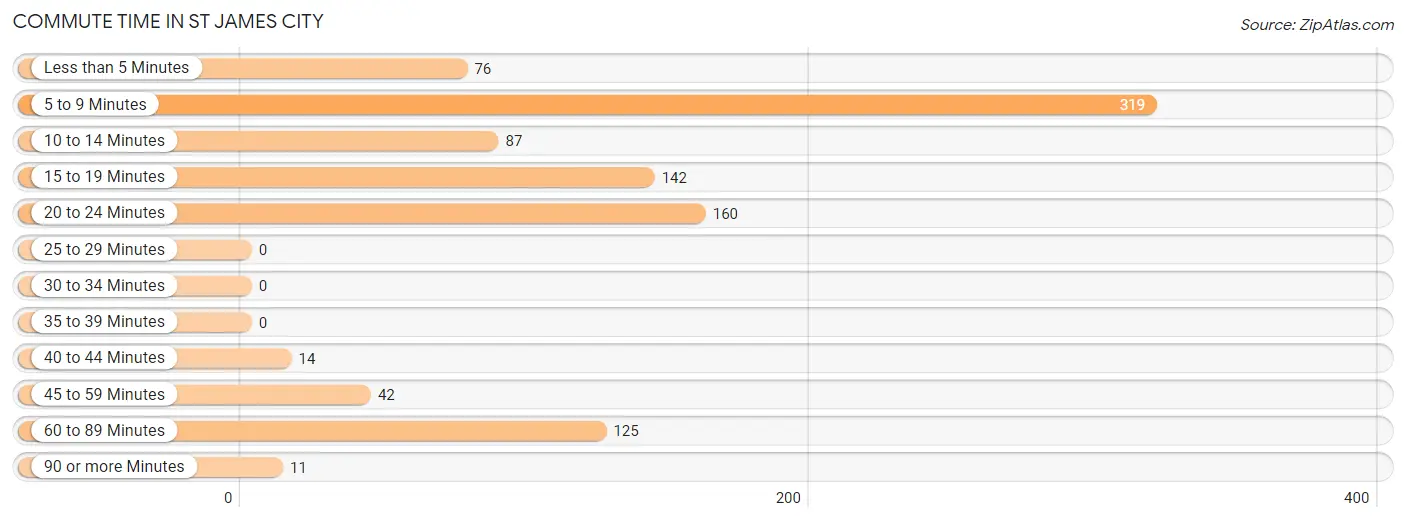
| Commute Time | # Commuters | % Commuters |
| Less than 5 Minutes | 76 | 7.8% |
| 5 to 9 Minutes | 319 | 32.7% |
| 10 to 14 Minutes | 87 | 8.9% |
| 15 to 19 Minutes | 142 | 14.5% |
| 20 to 24 Minutes | 160 | 16.4% |
| 25 to 29 Minutes | 0 | 0.0% |
| 30 to 34 Minutes | 0 | 0.0% |
| 35 to 39 Minutes | 0 | 0.0% |
| 40 to 44 Minutes | 14 | 1.4% |
| 45 to 59 Minutes | 42 | 4.3% |
| 60 to 89 Minutes | 125 | 12.8% |
| 90 or more Minutes | 11 | 1.1% |
Commute Time by Sex in St James City
The most common commute times in St James City are 5 to 9 minutes (192 commuters, 36.8%) for males and 5 to 9 minutes (127 commuters, 27.9%) for females.
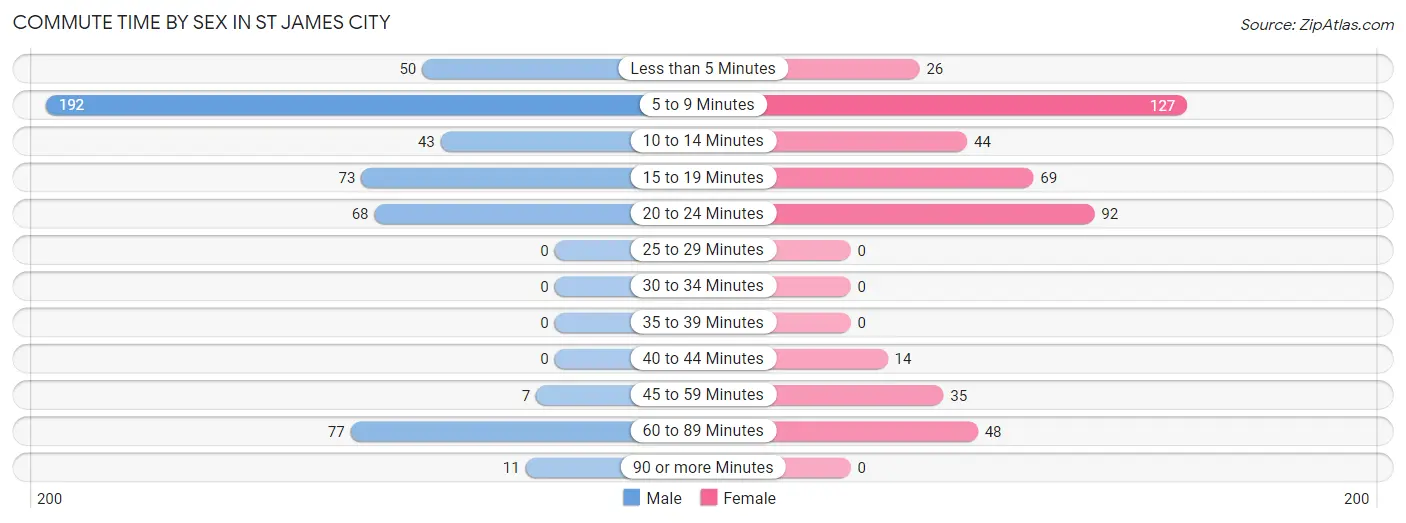
| Commute Time | Male | Female |
| Less than 5 Minutes | 50 (9.6%) | 26 (5.7%) |
| 5 to 9 Minutes | 192 (36.8%) | 127 (27.9%) |
| 10 to 14 Minutes | 43 (8.3%) | 44 (9.7%) |
| 15 to 19 Minutes | 73 (14.0%) | 69 (15.2%) |
| 20 to 24 Minutes | 68 (13.1%) | 92 (20.2%) |
| 25 to 29 Minutes | 0 (0.0%) | 0 (0.0%) |
| 30 to 34 Minutes | 0 (0.0%) | 0 (0.0%) |
| 35 to 39 Minutes | 0 (0.0%) | 0 (0.0%) |
| 40 to 44 Minutes | 0 (0.0%) | 14 (3.1%) |
| 45 to 59 Minutes | 7 (1.3%) | 35 (7.7%) |
| 60 to 89 Minutes | 77 (14.8%) | 48 (10.5%) |
| 90 or more Minutes | 11 (2.1%) | 0 (0.0%) |
Time of Departure to Work by Sex in St James City
The most frequent times of departure to work in St James City are 9:00 AM to 9:59 AM (103, 19.8%) for males and 10:00 AM to 10:59 AM (144, 31.7%) for females.
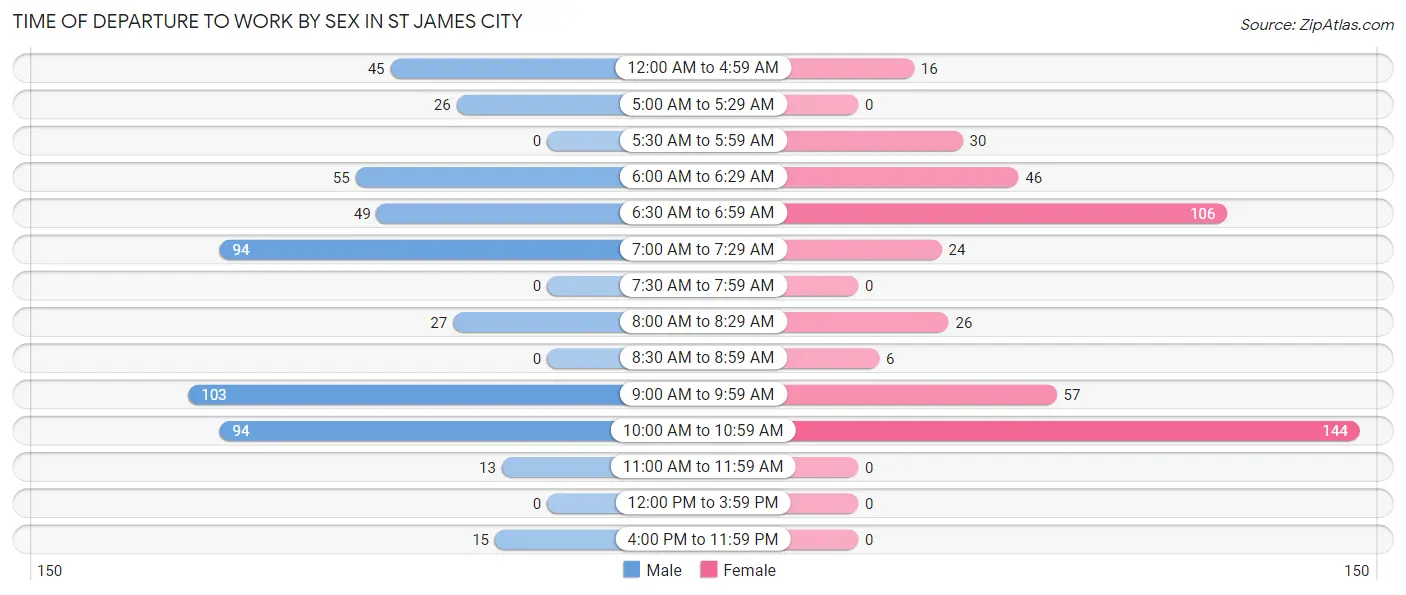
| Time of Departure | Male | Female |
| 12:00 AM to 4:59 AM | 45 (8.6%) | 16 (3.5%) |
| 5:00 AM to 5:29 AM | 26 (5.0%) | 0 (0.0%) |
| 5:30 AM to 5:59 AM | 0 (0.0%) | 30 (6.6%) |
| 6:00 AM to 6:29 AM | 55 (10.6%) | 46 (10.1%) |
| 6:30 AM to 6:59 AM | 49 (9.4%) | 106 (23.3%) |
| 7:00 AM to 7:29 AM | 94 (18.0%) | 24 (5.3%) |
| 7:30 AM to 7:59 AM | 0 (0.0%) | 0 (0.0%) |
| 8:00 AM to 8:29 AM | 27 (5.2%) | 26 (5.7%) |
| 8:30 AM to 8:59 AM | 0 (0.0%) | 6 (1.3%) |
| 9:00 AM to 9:59 AM | 103 (19.8%) | 57 (12.5%) |
| 10:00 AM to 10:59 AM | 94 (18.0%) | 144 (31.7%) |
| 11:00 AM to 11:59 AM | 13 (2.5%) | 0 (0.0%) |
| 12:00 PM to 3:59 PM | 0 (0.0%) | 0 (0.0%) |
| 4:00 PM to 11:59 PM | 15 (2.9%) | 0 (0.0%) |
| Total | 521 (100.0%) | 455 (100.0%) |
Housing Occupancy in St James City
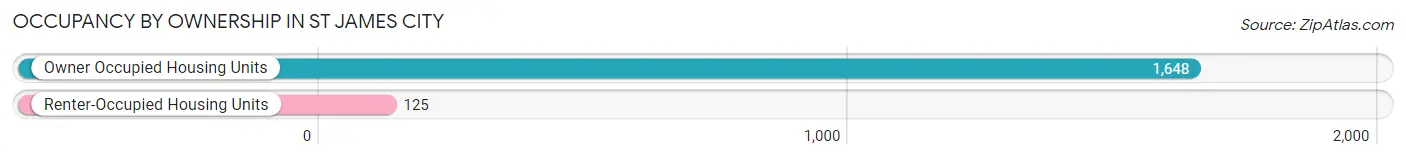
Occupancy by Ownership in St James City
Of the total 1,773 dwellings in St James City, owner-occupied units account for 1,648 (92.9%), while renter-occupied units make up 125 (7.0%).
| Occupancy | # Housing Units | % Housing Units |
| Owner Occupied Housing Units | 1,648 | 92.9% |
| Renter-Occupied Housing Units | 125 | 7.0% |
| Total Occupied Housing Units | 1,773 | 100.0% |
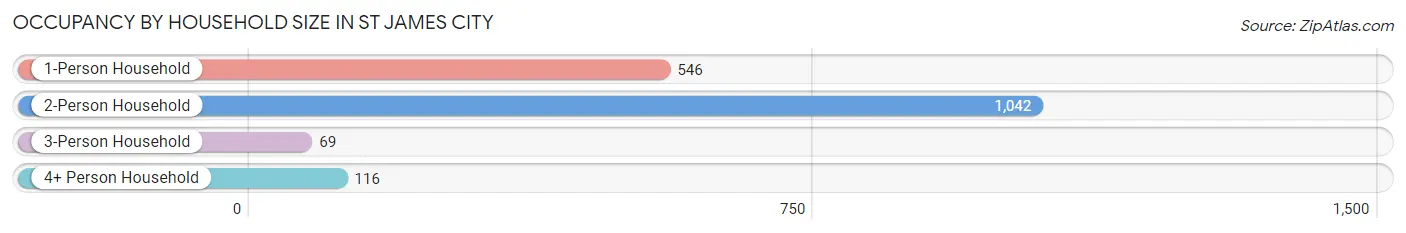
Occupancy by Household Size in St James City
| Household Size | # Housing Units | % Housing Units |
| 1-Person Household | 546 | 30.8% |
| 2-Person Household | 1,042 | 58.8% |
| 3-Person Household | 69 | 3.9% |
| 4+ Person Household | 116 | 6.5% |
| Total Housing Units | 1,773 | 100.0% |
Occupancy by Ownership by Household Size in St James City
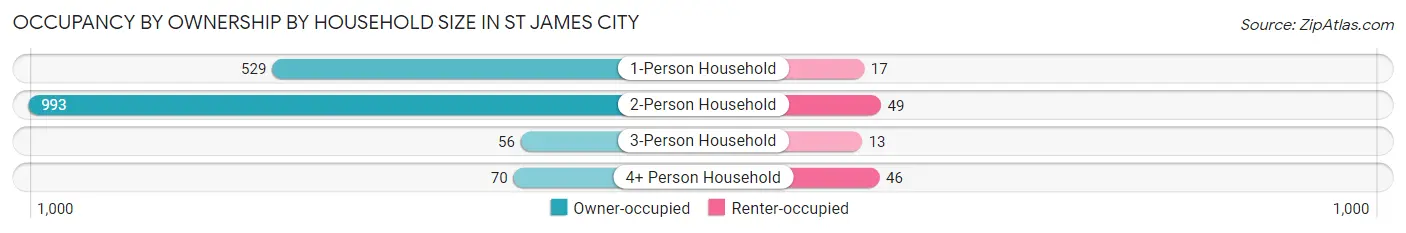
| Household Size | Owner-occupied | Renter-occupied |
| 1-Person Household | 529 (96.9%) | 17 (3.1%) |
| 2-Person Household | 993 (95.3%) | 49 (4.7%) |
| 3-Person Household | 56 (81.2%) | 13 (18.8%) |
| 4+ Person Household | 70 (60.3%) | 46 (39.7%) |
| Total Housing Units | 1,648 (92.9%) | 125 (7.0%) |
Occupancy by Educational Attainment in St James City
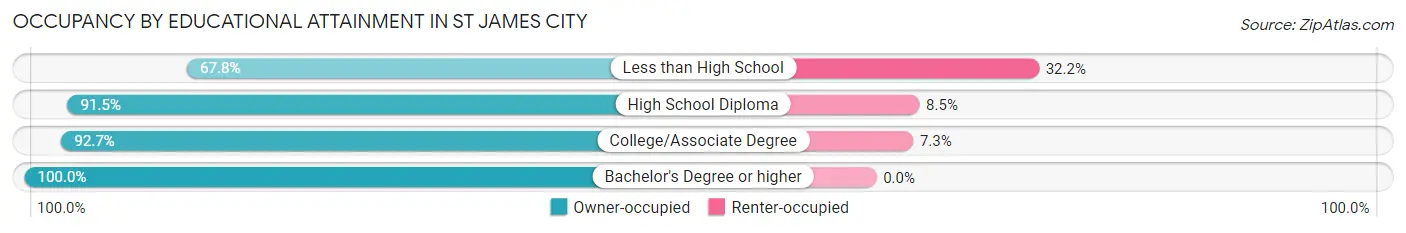
| Household Size | Owner-occupied | Renter-occupied |
| Less than High School | 82 (67.8%) | 39 (32.2%) |
| High School Diploma | 376 (91.5%) | 35 (8.5%) |
| College/Associate Degree | 648 (92.7%) | 51 (7.3%) |
| Bachelor's Degree or higher | 542 (100.0%) | 0 (0.0%) |
Occupancy by Age of Householder in St James City
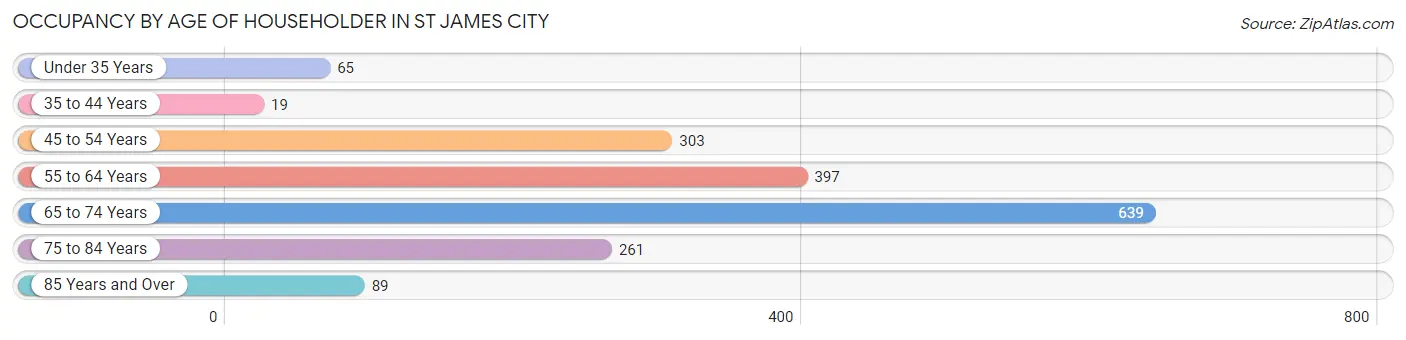
| Age Bracket | # Households | % Households |
| Under 35 Years | 65 | 3.7% |
| 35 to 44 Years | 19 | 1.1% |
| 45 to 54 Years | 303 | 17.1% |
| 55 to 64 Years | 397 | 22.4% |
| 65 to 74 Years | 639 | 36.0% |
| 75 to 84 Years | 261 | 14.7% |
| 85 Years and Over | 89 | 5.0% |
| Total | 1,773 | 100.0% |
Housing Finances in St James City
Median Income by Occupancy in St James City
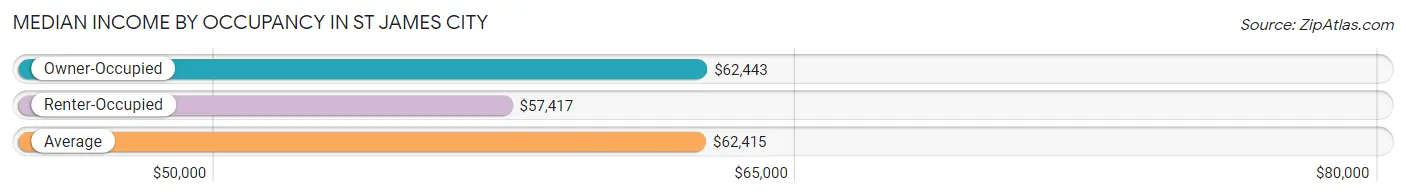
| Occupancy Type | # Households | Median Income |
| Owner-Occupied | 1,648 (92.9%) | $62,443 |
| Renter-Occupied | 125 (7.0%) | $57,417 |
| Average | 1,773 (100.0%) | $62,415 |
Occupancy by Householder Income Bracket in St James City
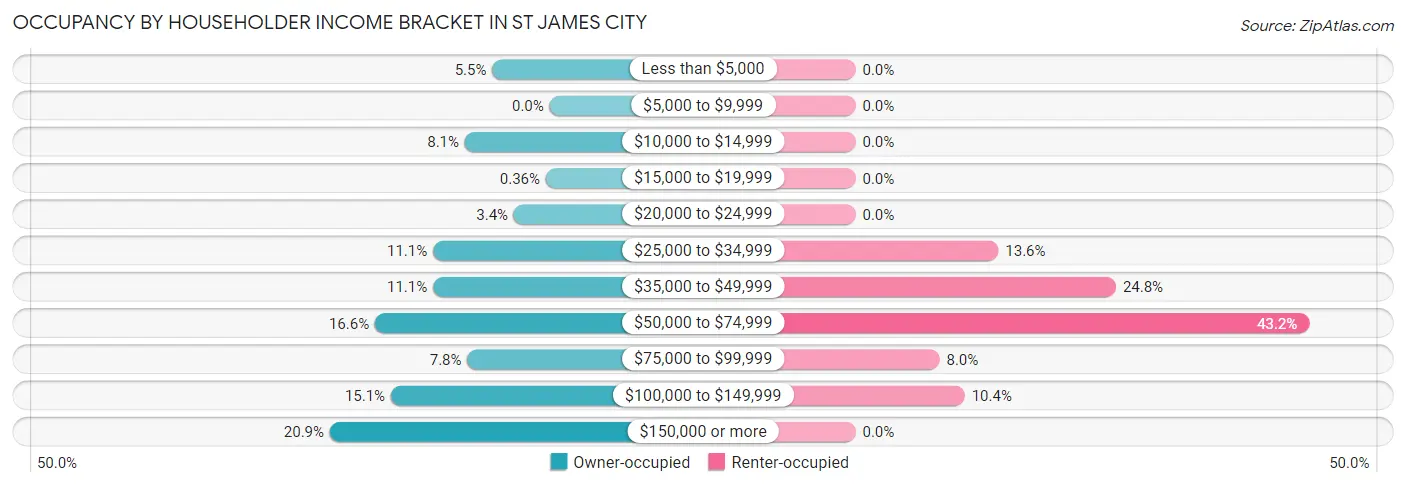
| Income Bracket | Owner-occupied | Renter-occupied |
| Less than $5,000 | 90 (5.5%) | 0 (0.0%) |
| $5,000 to $9,999 | 0 (0.0%) | 0 (0.0%) |
| $10,000 to $14,999 | 133 (8.1%) | 0 (0.0%) |
| $15,000 to $19,999 | 6 (0.4%) | 0 (0.0%) |
| $20,000 to $24,999 | 56 (3.4%) | 0 (0.0%) |
| $25,000 to $34,999 | 183 (11.1%) | 17 (13.6%) |
| $35,000 to $49,999 | 183 (11.1%) | 31 (24.8%) |
| $50,000 to $74,999 | 274 (16.6%) | 54 (43.2%) |
| $75,000 to $99,999 | 129 (7.8%) | 10 (8.0%) |
| $100,000 to $149,999 | 249 (15.1%) | 13 (10.4%) |
| $150,000 or more | 345 (20.9%) | 0 (0.0%) |
| Total | 1,648 (100.0%) | 125 (100.0%) |
Monthly Housing Cost Tiers in St James City
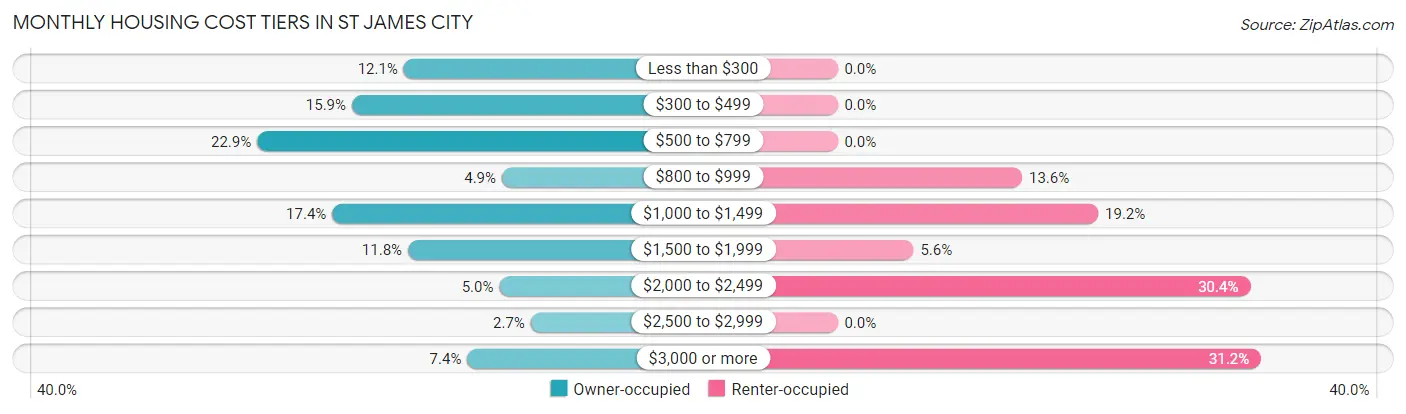
| Monthly Cost | Owner-occupied | Renter-occupied |
| Less than $300 | 199 (12.1%) | 0 (0.0%) |
| $300 to $499 | 262 (15.9%) | 0 (0.0%) |
| $500 to $799 | 377 (22.9%) | 0 (0.0%) |
| $800 to $999 | 80 (4.9%) | 17 (13.6%) |
| $1,000 to $1,499 | 286 (17.3%) | 24 (19.2%) |
| $1,500 to $1,999 | 194 (11.8%) | 7 (5.6%) |
| $2,000 to $2,499 | 83 (5.0%) | 38 (30.4%) |
| $2,500 to $2,999 | 45 (2.7%) | 0 (0.0%) |
| $3,000 or more | 122 (7.4%) | 39 (31.2%) |
| Total | 1,648 (100.0%) | 125 (100.0%) |
Physical Housing Characteristics in St James City
Housing Structures in St James City
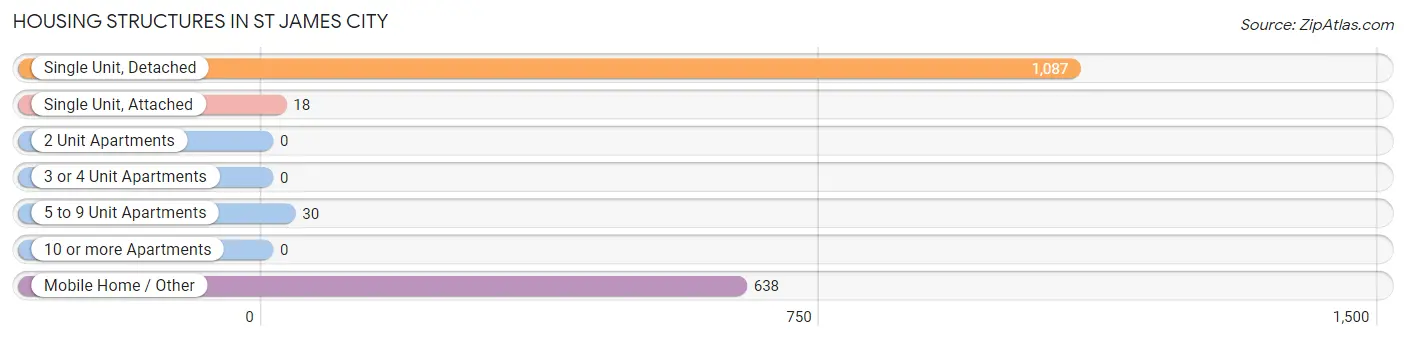
| Structure Type | # Housing Units | % Housing Units |
| Single Unit, Detached | 1,087 | 61.3% |
| Single Unit, Attached | 18 | 1.0% |
| 2 Unit Apartments | 0 | 0.0% |
| 3 or 4 Unit Apartments | 0 | 0.0% |
| 5 to 9 Unit Apartments | 30 | 1.7% |
| 10 or more Apartments | 0 | 0.0% |
| Mobile Home / Other | 638 | 36.0% |
| Total | 1,773 | 100.0% |
Housing Structures by Occupancy in St James City
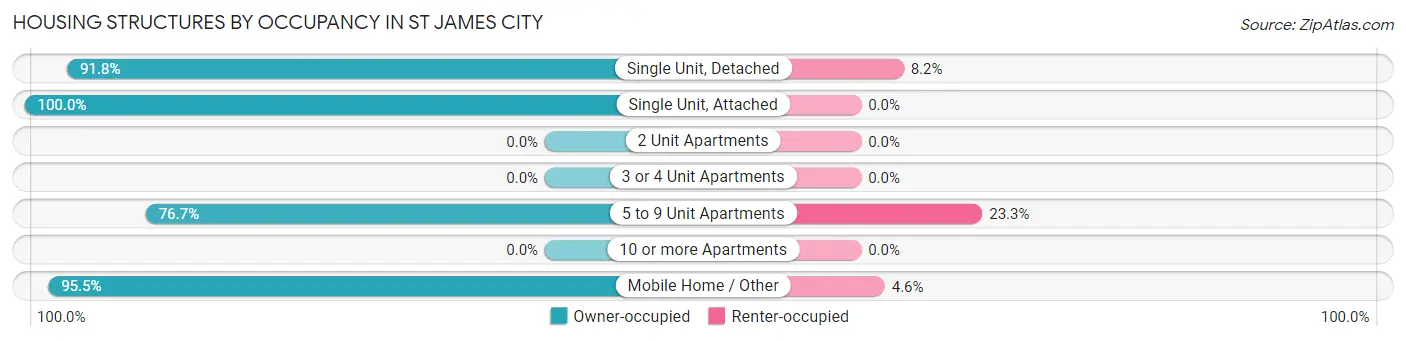
| Structure Type | Owner-occupied | Renter-occupied |
| Single Unit, Detached | 998 (91.8%) | 89 (8.2%) |
| Single Unit, Attached | 18 (100.0%) | 0 (0.0%) |
| 2 Unit Apartments | 0 (0.0%) | 0 (0.0%) |
| 3 or 4 Unit Apartments | 0 (0.0%) | 0 (0.0%) |
| 5 to 9 Unit Apartments | 23 (76.7%) | 7 (23.3%) |
| 10 or more Apartments | 0 (0.0%) | 0 (0.0%) |
| Mobile Home / Other | 609 (95.5%) | 29 (4.5%) |
| Total | 1,648 (92.9%) | 125 (7.0%) |
Housing Structures by Number of Rooms in St James City
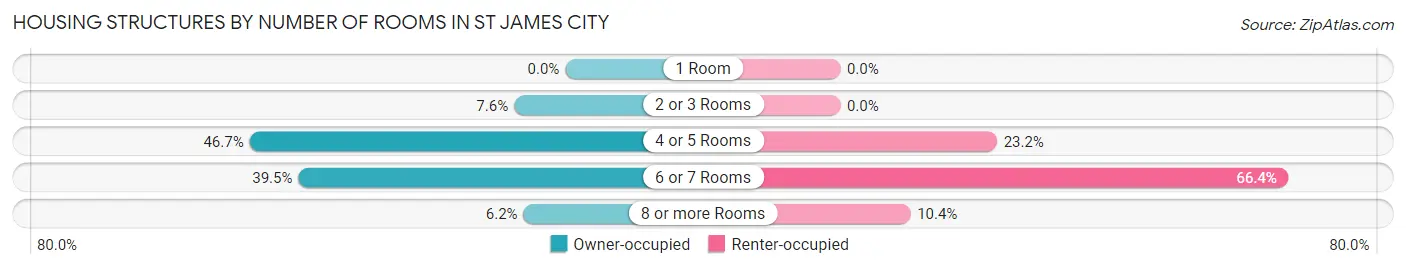
| Number of Rooms | Owner-occupied | Renter-occupied |
| 1 Room | 0 (0.0%) | 0 (0.0%) |
| 2 or 3 Rooms | 125 (7.6%) | 0 (0.0%) |
| 4 or 5 Rooms | 770 (46.7%) | 29 (23.2%) |
| 6 or 7 Rooms | 651 (39.5%) | 83 (66.4%) |
| 8 or more Rooms | 102 (6.2%) | 13 (10.4%) |
| Total | 1,648 (100.0%) | 125 (100.0%) |
Housing Structure by Heating Type in St James City
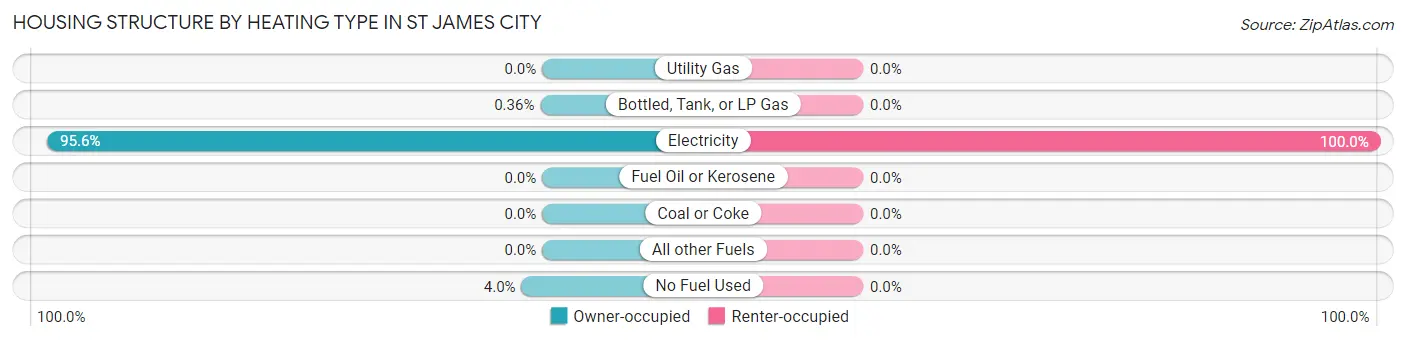
| Heating Type | Owner-occupied | Renter-occupied |
| Utility Gas | 0 (0.0%) | 0 (0.0%) |
| Bottled, Tank, or LP Gas | 6 (0.4%) | 0 (0.0%) |
| Electricity | 1,576 (95.6%) | 125 (100.0%) |
| Fuel Oil or Kerosene | 0 (0.0%) | 0 (0.0%) |
| Coal or Coke | 0 (0.0%) | 0 (0.0%) |
| All other Fuels | 0 (0.0%) | 0 (0.0%) |
| No Fuel Used | 66 (4.0%) | 0 (0.0%) |
| Total | 1,648 (100.0%) | 125 (100.0%) |
Household Vehicle Usage in St James City
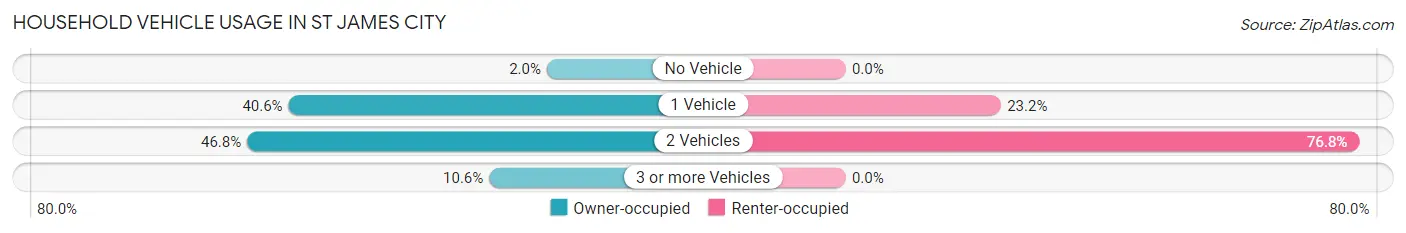
| Vehicles per Household | Owner-occupied | Renter-occupied |
| No Vehicle | 33 (2.0%) | 0 (0.0%) |
| 1 Vehicle | 669 (40.6%) | 29 (23.2%) |
| 2 Vehicles | 771 (46.8%) | 96 (76.8%) |
| 3 or more Vehicles | 175 (10.6%) | 0 (0.0%) |
| Total | 1,648 (100.0%) | 125 (100.0%) |
Real Estate & Mortgages in St James City
Real Estate and Mortgage Overview in St James City
| Characteristic | Without Mortgage | With Mortgage |
| Housing Units | 983 | 665 |
| Median Property Value | $237,200 | $324,200 |
| Median Household Income | $46,328 | $162 |
| Monthly Housing Costs | $560 | $122 |
| Real Estate Taxes | $2,710 | $0 |
Property Value by Mortgage Status in St James City
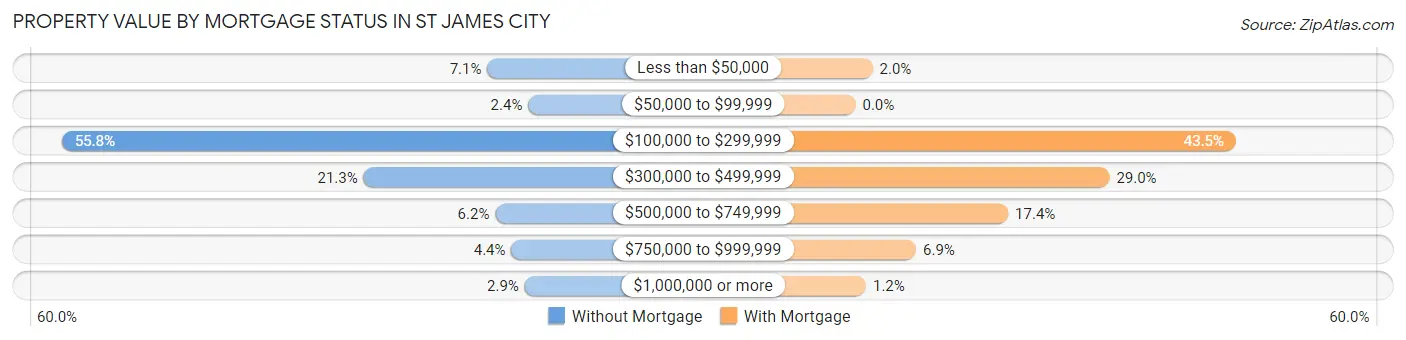
| Property Value | Without Mortgage | With Mortgage |
| Less than $50,000 | 70 (7.1%) | 13 (1.9%) |
| $50,000 to $99,999 | 24 (2.4%) | 0 (0.0%) |
| $100,000 to $299,999 | 548 (55.7%) | 289 (43.5%) |
| $300,000 to $499,999 | 209 (21.3%) | 193 (29.0%) |
| $500,000 to $749,999 | 61 (6.2%) | 116 (17.4%) |
| $750,000 to $999,999 | 43 (4.4%) | 46 (6.9%) |
| $1,000,000 or more | 28 (2.9%) | 8 (1.2%) |
| Total | 983 (100.0%) | 665 (100.0%) |
Household Income by Mortgage Status in St James City
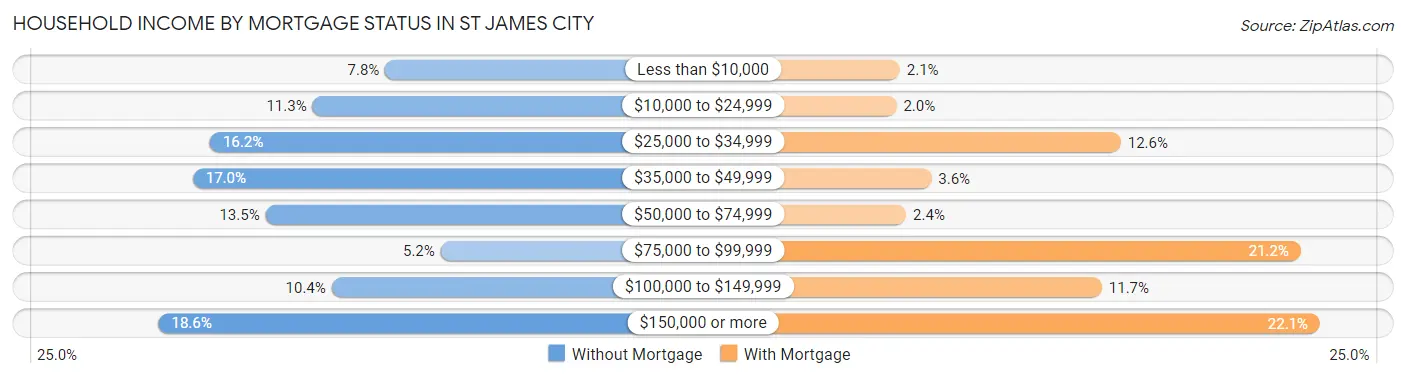
| Household Income | Without Mortgage | With Mortgage |
| Less than $10,000 | 77 (7.8%) | 14 (2.1%) |
| $10,000 to $24,999 | 111 (11.3%) | 13 (1.9%) |
| $25,000 to $34,999 | 159 (16.2%) | 84 (12.6%) |
| $35,000 to $49,999 | 167 (17.0%) | 24 (3.6%) |
| $50,000 to $74,999 | 133 (13.5%) | 16 (2.4%) |
| $75,000 to $99,999 | 51 (5.2%) | 141 (21.2%) |
| $100,000 to $149,999 | 102 (10.4%) | 78 (11.7%) |
| $150,000 or more | 183 (18.6%) | 147 (22.1%) |
| Total | 983 (100.0%) | 665 (100.0%) |
Property Value to Household Income Ratio in St James City
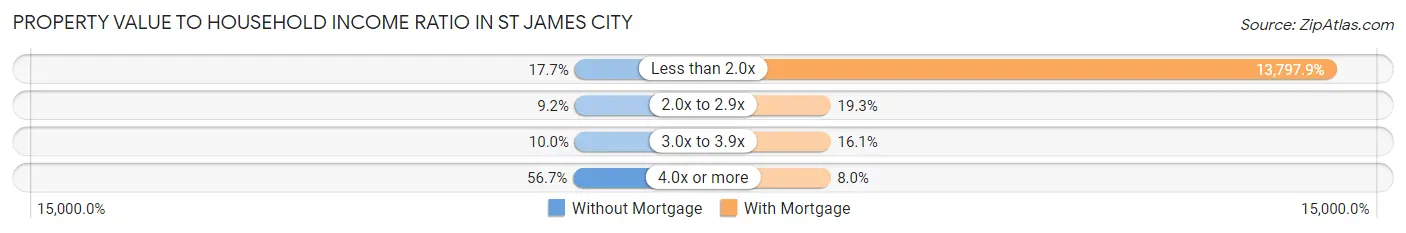
| Value-to-Income Ratio | Without Mortgage | With Mortgage |
| Less than 2.0x | 174 (17.7%) | 91,756 (13,797.9%) |
| 2.0x to 2.9x | 90 (9.2%) | 128 (19.3%) |
| 3.0x to 3.9x | 98 (10.0%) | 107 (16.1%) |
| 4.0x or more | 557 (56.7%) | 53 (8.0%) |
| Total | 983 (100.0%) | 665 (100.0%) |
Real Estate Taxes by Mortgage Status in St James City
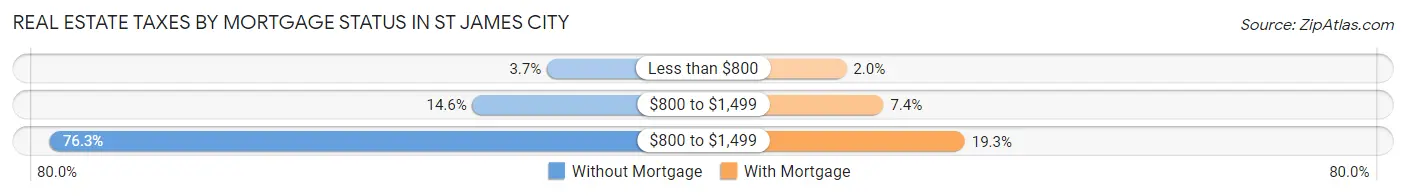
| Property Taxes | Without Mortgage | With Mortgage |
| Less than $800 | 36 (3.7%) | 13 (1.9%) |
| $800 to $1,499 | 143 (14.5%) | 49 (7.4%) |
| $800 to $1,499 | 750 (76.3%) | 128 (19.3%) |
| Total | 983 (100.0%) | 665 (100.0%) |
Health & Disability in St James City
Health Insurance Coverage by Age in St James City
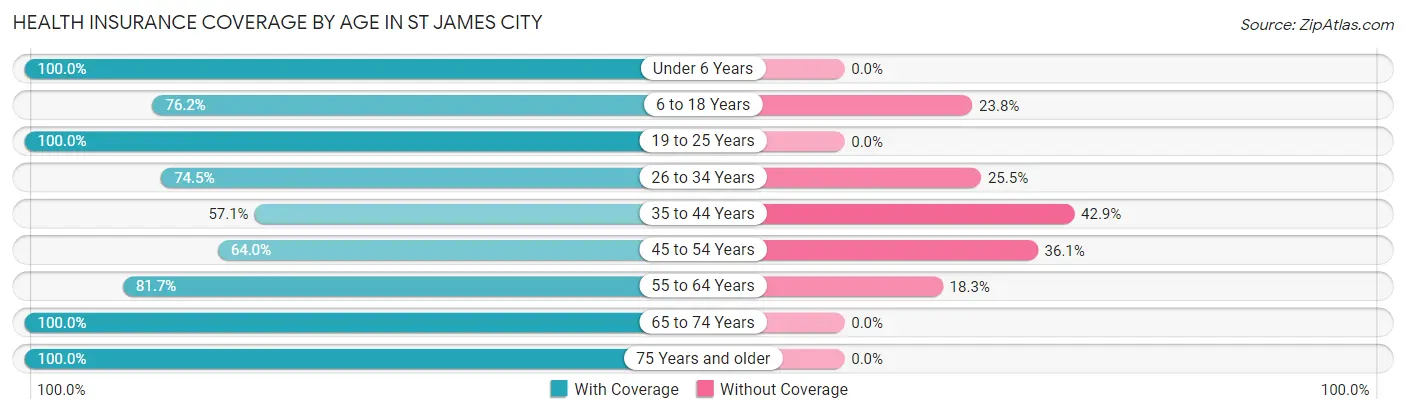
| Age Bracket | With Coverage | Without Coverage |
| Under 6 Years | 38 (100.0%) | 0 (0.0%) |
| 6 to 18 Years | 131 (76.2%) | 41 (23.8%) |
| 19 to 25 Years | 51 (100.0%) | 0 (0.0%) |
| 26 to 34 Years | 114 (74.5%) | 39 (25.5%) |
| 35 to 44 Years | 16 (57.1%) | 12 (42.9%) |
| 45 to 54 Years | 337 (63.9%) | 190 (36.0%) |
| 55 to 64 Years | 677 (81.7%) | 152 (18.3%) |
| 65 to 74 Years | 1,151 (100.0%) | 0 (0.0%) |
| 75 Years and older | 545 (100.0%) | 0 (0.0%) |
| Total | 3,060 (87.6%) | 434 (12.4%) |
Health Insurance Coverage by Citizenship Status in St James City
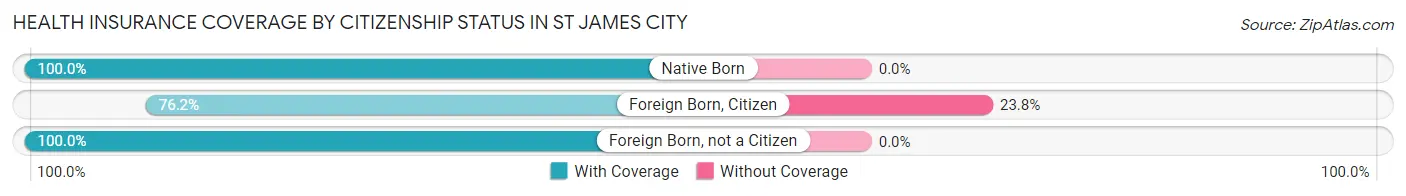
| Citizenship Status | With Coverage | Without Coverage |
| Native Born | 38 (100.0%) | 0 (0.0%) |
| Foreign Born, Citizen | 131 (76.2%) | 41 (23.8%) |
| Foreign Born, not a Citizen | 51 (100.0%) | 0 (0.0%) |
Health Insurance Coverage by Household Income in St James City
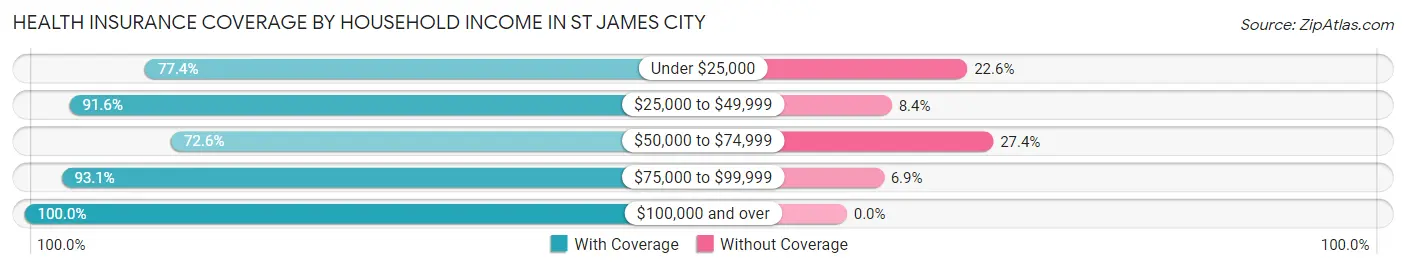
| Household Income | With Coverage | Without Coverage |
| Under $25,000 | 302 (77.4%) | 88 (22.6%) |
| $25,000 to $49,999 | 631 (91.6%) | 58 (8.4%) |
| $50,000 to $74,999 | 701 (72.6%) | 265 (27.4%) |
| $75,000 to $99,999 | 310 (93.1%) | 23 (6.9%) |
| $100,000 and over | 1,116 (100.0%) | 0 (0.0%) |
Public vs Private Health Insurance Coverage by Age in St James City
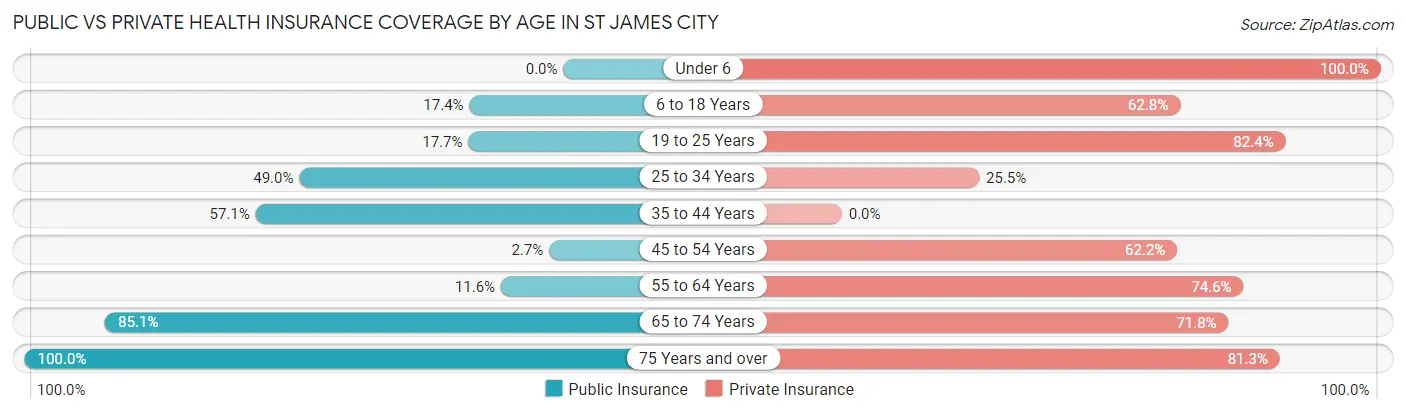
| Age Bracket | Public Insurance | Private Insurance |
| Under 6 | 0 (0.0%) | 38 (100.0%) |
| 6 to 18 Years | 30 (17.4%) | 108 (62.8%) |
| 19 to 25 Years | 9 (17.6%) | 42 (82.4%) |
| 25 to 34 Years | 75 (49.0%) | 39 (25.5%) |
| 35 to 44 Years | 16 (57.1%) | 0 (0.0%) |
| 45 to 54 Years | 14 (2.7%) | 328 (62.2%) |
| 55 to 64 Years | 96 (11.6%) | 618 (74.6%) |
| 65 to 74 Years | 979 (85.1%) | 826 (71.8%) |
| 75 Years and over | 545 (100.0%) | 443 (81.3%) |
| Total | 1,764 (50.5%) | 2,442 (69.9%) |
Disability Status by Sex by Age in St James City
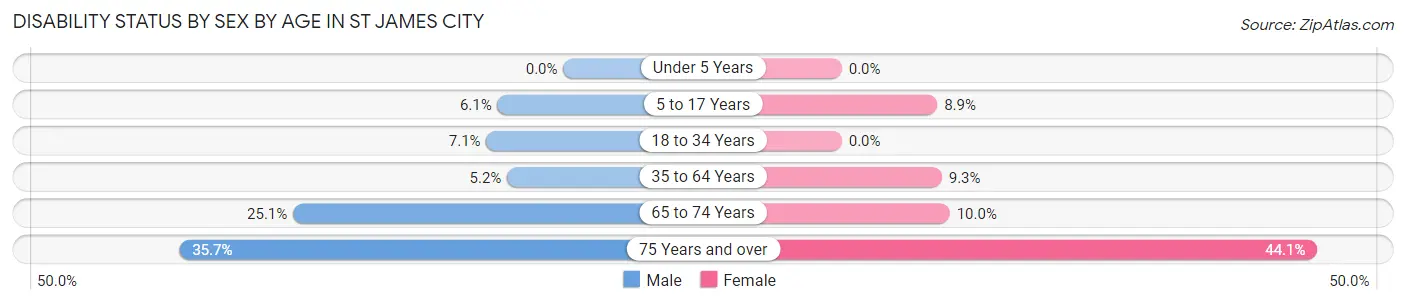
| Age Bracket | Male | Female |
| Under 5 Years | 0 (0.0%) | 0 (0.0%) |
| 5 to 17 Years | 8 (6.1%) | 7 (8.9%) |
| 18 to 34 Years | 9 (7.1%) | 0 (0.0%) |
| 35 to 64 Years | 39 (5.2%) | 59 (9.3%) |
| 65 to 74 Years | 151 (25.1%) | 55 (10.0%) |
| 75 Years and over | 82 (35.6%) | 139 (44.1%) |
Disability Class by Sex by Age in St James City
Disability Class: Hearing Difficulty
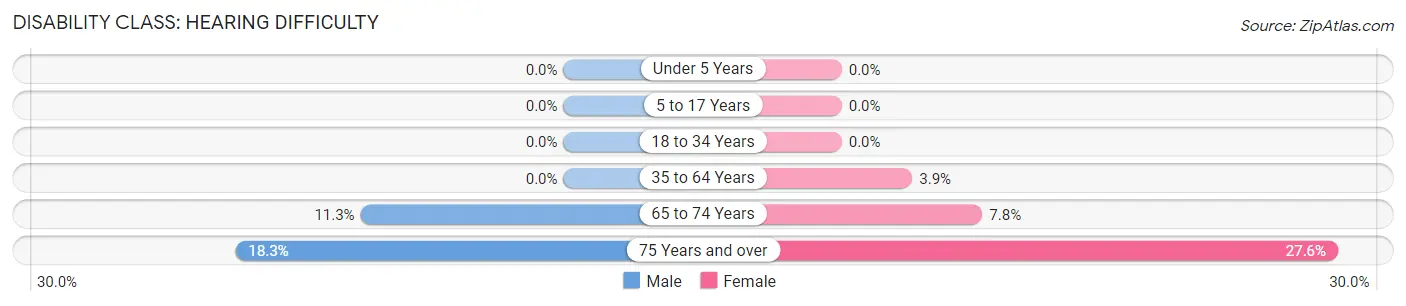
| Age Bracket | Male | Female |
| Under 5 Years | 0 (0.0%) | 0 (0.0%) |
| 5 to 17 Years | 0 (0.0%) | 0 (0.0%) |
| 18 to 34 Years | 0 (0.0%) | 0 (0.0%) |
| 35 to 64 Years | 0 (0.0%) | 25 (3.9%) |
| 65 to 74 Years | 68 (11.3%) | 43 (7.8%) |
| 75 Years and over | 42 (18.3%) | 87 (27.6%) |
Disability Class: Vision Difficulty
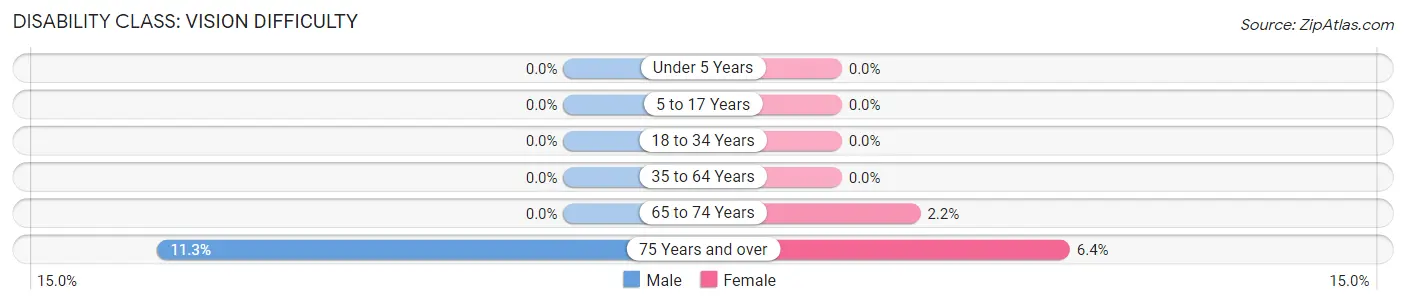
| Age Bracket | Male | Female |
| Under 5 Years | 0 (0.0%) | 0 (0.0%) |
| 5 to 17 Years | 0 (0.0%) | 0 (0.0%) |
| 18 to 34 Years | 0 (0.0%) | 0 (0.0%) |
| 35 to 64 Years | 0 (0.0%) | 0 (0.0%) |
| 65 to 74 Years | 0 (0.0%) | 12 (2.2%) |
| 75 Years and over | 26 (11.3%) | 20 (6.4%) |
Disability Class: Cognitive Difficulty
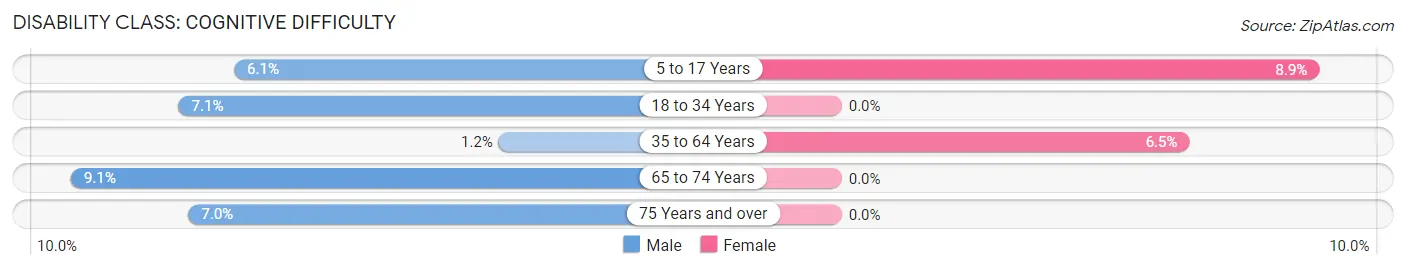
| Age Bracket | Male | Female |
| 5 to 17 Years | 8 (6.1%) | 7 (8.9%) |
| 18 to 34 Years | 9 (7.1%) | 0 (0.0%) |
| 35 to 64 Years | 9 (1.2%) | 41 (6.5%) |
| 65 to 74 Years | 55 (9.1%) | 0 (0.0%) |
| 75 Years and over | 16 (7.0%) | 0 (0.0%) |
Disability Class: Ambulatory Difficulty
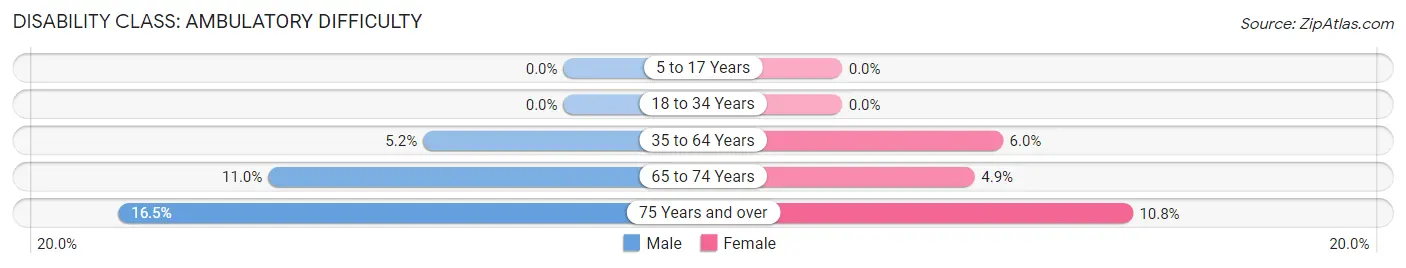
| Age Bracket | Male | Female |
| 5 to 17 Years | 0 (0.0%) | 0 (0.0%) |
| 18 to 34 Years | 0 (0.0%) | 0 (0.0%) |
| 35 to 64 Years | 39 (5.2%) | 38 (6.0%) |
| 65 to 74 Years | 66 (11.0%) | 27 (4.9%) |
| 75 Years and over | 38 (16.5%) | 34 (10.8%) |
Disability Class: Self-Care Difficulty
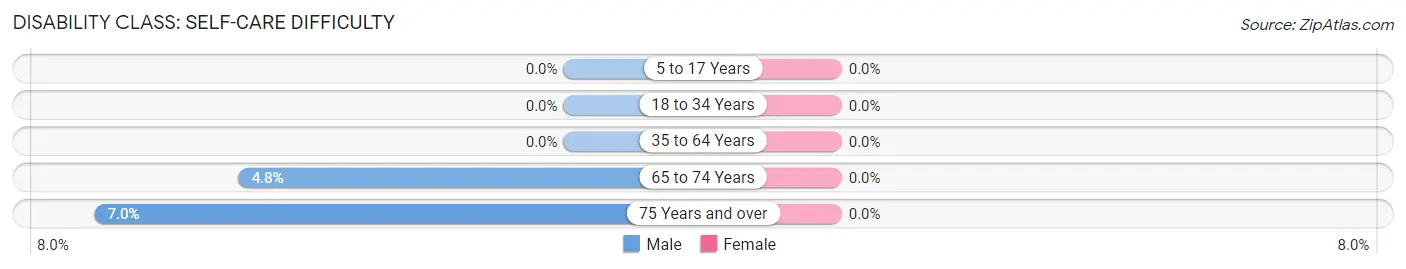
| Age Bracket | Male | Female |
| 5 to 17 Years | 0 (0.0%) | 0 (0.0%) |
| 18 to 34 Years | 0 (0.0%) | 0 (0.0%) |
| 35 to 64 Years | 0 (0.0%) | 0 (0.0%) |
| 65 to 74 Years | 29 (4.8%) | 0 (0.0%) |
| 75 Years and over | 16 (7.0%) | 0 (0.0%) |
Technology Access in St James City
Computing Device Access in St James City
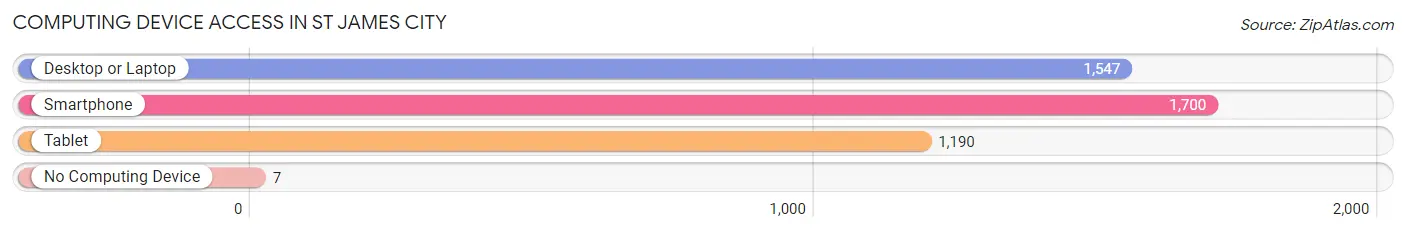
| Device Type | # Households | % Households |
| Desktop or Laptop | 1,547 | 87.3% |
| Smartphone | 1,700 | 95.9% |
| Tablet | 1,190 | 67.1% |
| No Computing Device | 7 | 0.4% |
| Total | 1,773 | 100.0% |
Internet Access in St James City
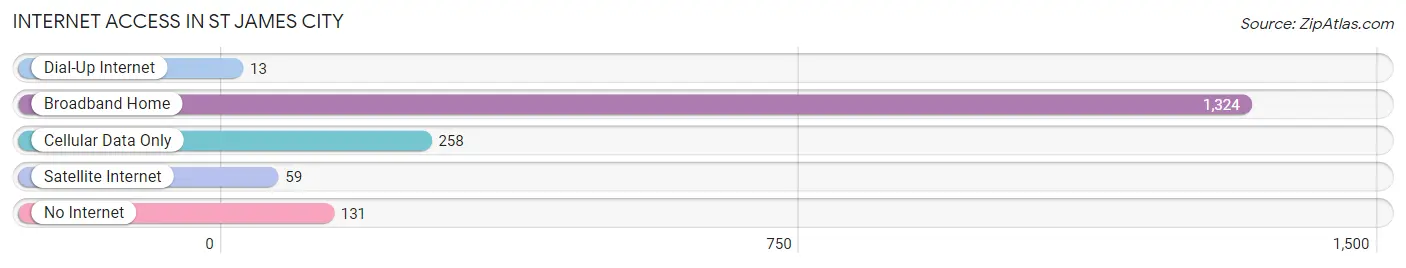
| Internet Type | # Households | % Households |
| Dial-Up Internet | 13 | 0.7% |
| Broadband Home | 1,324 | 74.7% |
| Cellular Data Only | 258 | 14.5% |
| Satellite Internet | 59 | 3.3% |
| No Internet | 131 | 7.4% |
| Total | 1,773 | 100.0% |
St James City Summary
Introduction
St. James City is a census-designated place (CDP) located in Lee County, Florida, United States. It is located on Pine Island, a barrier island in the Gulf of Mexico. The population was 2,743 at the 2010 census. It is part of the Cape Coral-Fort Myers, Florida Metropolitan Statistical Area.
History
St. James City was founded in 1884 by Captain James T. McKay, a former Confederate soldier. He named the town after his father, James McKay, who had served in the Seminole Wars. The town was originally a fishing village, and the first settlers were mostly fishermen and farmers.
In the early 1900s, St. James City began to grow as a tourist destination. The town was known for its fishing, and it was a popular spot for vacationers. In the 1920s, the town was home to a number of resorts, including the St. James Hotel, which was built in 1921.
In the 1950s, St. James City began to experience a decline in tourism. The town was hit hard by the Great Depression and World War II. In the 1960s, the town began to experience a resurgence in tourism, and it has since become a popular destination for fishing, boating, and other outdoor activities.
Geography
St. James City is located at 26°37'17" North, 82°2'17" West (26.6214, -82.0381). It is located on Pine Island, a barrier island in the Gulf of Mexico. The island is approximately 12 miles long and 2 miles wide.
The town is bordered by Matlacha to the north, Pine Island Sound to the east, San Carlos Bay to the south, and the Gulf of Mexico to the west.
Economy
St. James City is primarily a tourist destination. The town is known for its fishing, boating, and other outdoor activities. The town is also home to a number of restaurants, bars, and shops.
The town is also home to a number of businesses, including a marina, a boat repair shop, and a bait and tackle shop.
Demographics
As of the 2010 census, there were 2,743 people, 1,093 households, and 745 families residing in St. James City. The population density was 545.3 people per square mile (210.9/km2). There were 1,541 housing units at an average density of 302.3 per square mile (116.7/km2). The racial makeup of the town was 97.2% White, 0.7% African American, 0.3% Native American, 0.4% Asian, 0.1% Pacific Islander, 0.7% from other races, and 0.6% from two or more races. Hispanic or Latino of any race were 3.2% of the population.
There were 1,093 households, out of which 22.2% had children under the age of 18 living with them, 54.2% were married couples living together, 8.7% had a female householder with no husband present, and 32.7% were non-families. 25.7% of all households were made up of individuals, and 11.2% had someone living alone who was 65 years of age or older. The average household size was 2.50 and the average family size was 3.00.
In the town, the population was spread out, with 20.2% under the age of 18, 5.7% from 18 to 24, 22.3% from 25 to 44, 30.2% from 45 to 64, and 21.6% who were 65 years of age or older. The median age was 46 years. For every 100 females, there were 97.2 males. For every 100 females age 18 and over, there were 94.2 males.
The median income for a household in the town was $41,944, and the median income for a family was $50,000. Males had a median income of $31,250 versus $25,000 for females. The per capita income for the town was $22,845. About 6.2% of families and 8.7% of the population were below the poverty line, including 11.2% of those under age 18 and 5.2% of those age 65 or over.
Conclusion
St. James City is a census-designated place located in Lee County, Florida. It is located on Pine Island, a barrier island in the Gulf of Mexico. The town was founded in 1884 and was originally a fishing village. In the early 1900s, St. James City began to grow as a tourist destination. The town is now known for its fishing, boating, and other outdoor activities. The population of St. James City was 2,743 at the 2010 census. The town is primarily a tourist destination, and it is home to a number of businesses, including a marina, a boat repair shop, and a bait and tackle shop. The median income for a household in the town was $41,944, and the median income for a family was $50,000.
Common Questions
What is the Total Population of St James City?
Total Population of St James City is 3,494.
What is the Total Male Population of St James City?
Total Male Population of St James City is 1,837.
What is the Total Female Population of St James City?
Total Female Population of St James City is 1,657.
What is the Ratio of Males per 100 Females in St James City?
There are 110.86 Males per 100 Females in St James City.
What is the Ratio of Females per 100 Males in St James City?
There are 90.20 Females per 100 Males in St James City.
What is the Median Population Age in St James City?
Median Population Age in St James City is 64.7 Years.
What is the Average Family Size in St James City
Average Family Size in St James City is 2.4 People.
What is the Average Household Size in St James City
Average Household Size in St James City is 2.0 People.
What is Per Capita Income in St James City?
Per Capita income in St James City is $59,153.
What is the Median Family Income in St James City?
Median Family Income in St James City is $64,479.
What is the Median Household income in St James City?
Median Household Income in St James City is $62,415.
What is Inequality or Gini Index in St James City?
Inequality or Gini Index in St James City is 0.57.
How Large is the Labor Force in St James City?
There are 1,251 People in the Labor Forcein in St James City.
What is the Percentage of People in the Labor Force in St James City?
37.4% of People are in the Labor Force in St James City.
What is the Unemployment Rate in St James City?
Unemployment Rate in St James City is 10.4%.