South Daytona, FL
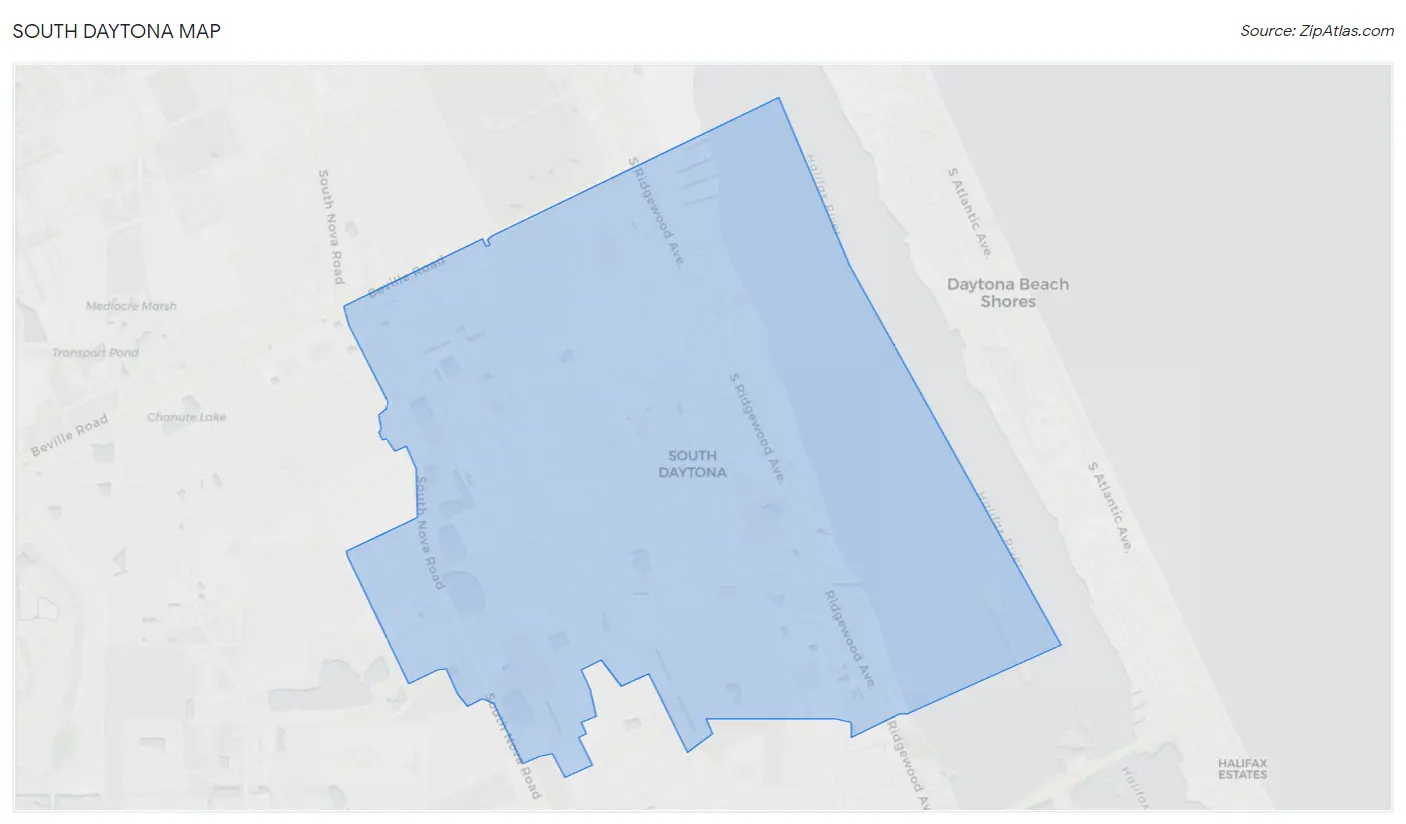
South Daytona Map
South Daytona Overview
13,132
TOTAL POPULATION
6,067
MALE POPULATION
7,065
FEMALE POPULATION
85.87
MALES / 100 FEMALES
116.45
FEMALES / 100 MALES
47.4
MEDIAN AGE
2.7
AVG FAMILY SIZE
2.2
AVG HOUSEHOLD SIZE
$30,713
PER CAPITA INCOME
$63,951
AVG FAMILY INCOME
$54,898
AVG HOUSEHOLD INCOME
14.5%
WAGE / INCOME GAP [ % ]
85.5¢/ $1
WAGE / INCOME GAP [ $ ]
0.43
INEQUALITY / GINI INDEX
6,266
LABOR FORCE [ PEOPLE ]
55.6%
PERCENT IN LABOR FORCE
4.1%
UNEMPLOYMENT RATE
South Daytona Area Codes
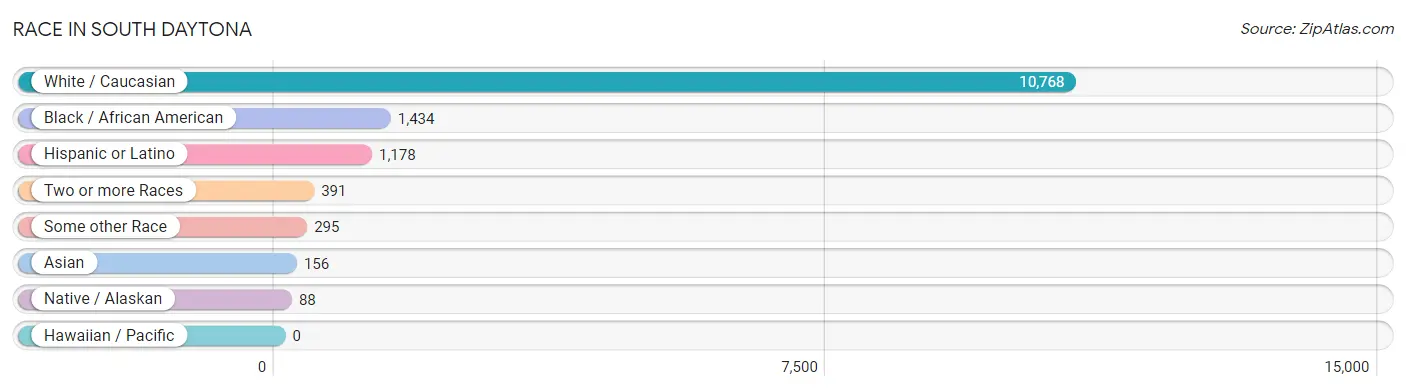
Race in South Daytona
The most populous races in South Daytona are White / Caucasian (10,768 | 82.0%), Black / African American (1,434 | 10.9%), and Hispanic or Latino (1,178 | 9.0%).
| Race | # Population | % Population |
| Asian | 156 | 1.2% |
| Black / African American | 1,434 | 10.9% |
| Hawaiian / Pacific | 0 | 0.0% |
| Hispanic or Latino | 1,178 | 9.0% |
| Native / Alaskan | 88 | 0.7% |
| White / Caucasian | 10,768 | 82.0% |
| Two or more Races | 391 | 3.0% |
| Some other Race | 295 | 2.2% |
| Total | 13,132 | 100.0% |
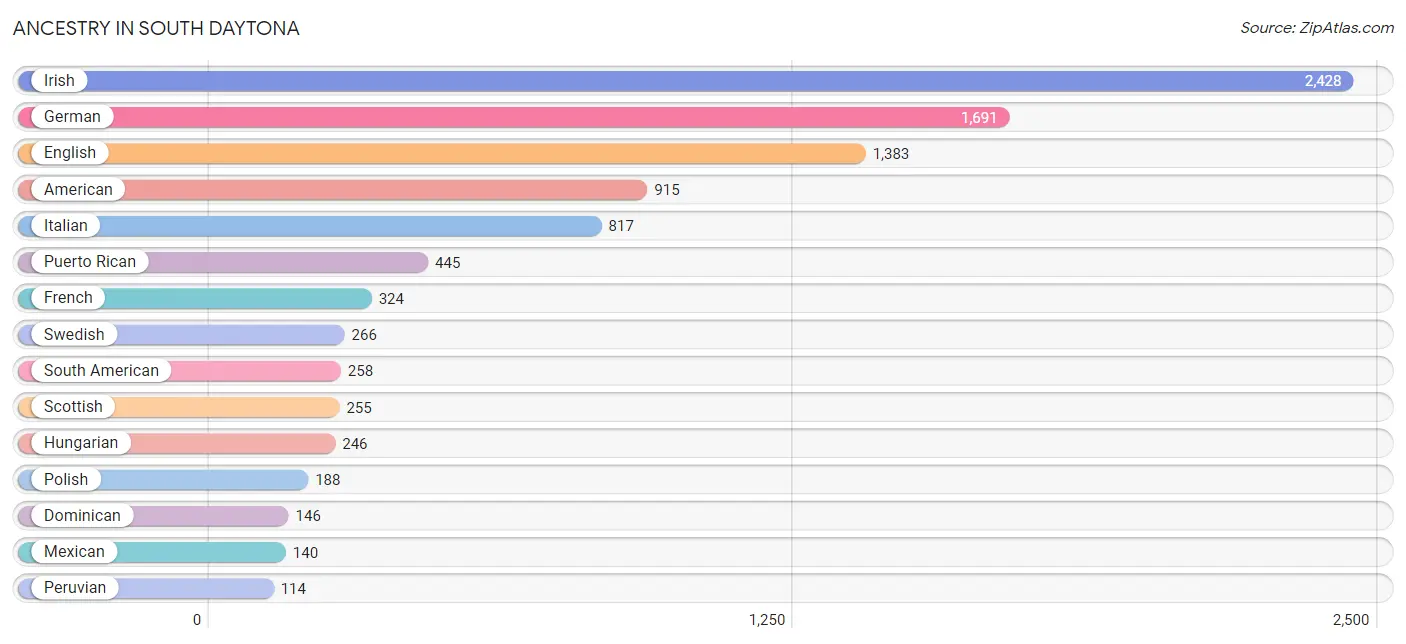
Ancestry in South Daytona
The most populous ancestries reported in South Daytona are Irish (2,428 | 18.5%), German (1,691 | 12.9%), English (1,383 | 10.5%), American (915 | 7.0%), and Italian (817 | 6.2%), together accounting for 55.1% of all South Daytona residents.
| Ancestry | # Population | % Population |
| American | 915 | 7.0% |
| Apache | 4 | 0.0% |
| Arab | 41 | 0.3% |
| Argentinean | 32 | 0.2% |
| Armenian | 22 | 0.2% |
| Australian | 9 | 0.1% |
| Austrian | 8 | 0.1% |
| Bhutanese | 9 | 0.1% |
| Blackfeet | 11 | 0.1% |
| Brazilian | 47 | 0.4% |
| British | 81 | 0.6% |
| Canadian | 51 | 0.4% |
| Central American | 34 | 0.3% |
| Cherokee | 27 | 0.2% |
| Chilean | 21 | 0.2% |
| Colombian | 59 | 0.4% |
| Croatian | 9 | 0.1% |
| Cuban | 77 | 0.6% |
| Czech | 55 | 0.4% |
| Dominican | 146 | 1.1% |
| Dutch | 104 | 0.8% |
| Eastern European | 58 | 0.4% |
| English | 1,383 | 10.5% |
| European | 40 | 0.3% |
| Finnish | 9 | 0.1% |
| French | 324 | 2.5% |
| French Canadian | 81 | 0.6% |
| German | 1,691 | 12.9% |
| Greek | 19 | 0.1% |
| Haitian | 8 | 0.1% |
| Hungarian | 246 | 1.9% |
| Icelander | 27 | 0.2% |
| Indian (Asian) | 30 | 0.2% |
| Iranian | 10 | 0.1% |
| Irish | 2,428 | 18.5% |
| Italian | 817 | 6.2% |
| Jamaican | 15 | 0.1% |
| Korean | 90 | 0.7% |
| Lebanese | 18 | 0.1% |
| Lithuanian | 34 | 0.3% |
| Mexican | 140 | 1.1% |
| Northern European | 18 | 0.1% |
| Norwegian | 51 | 0.4% |
| Pakistani | 6 | 0.1% |
| Panamanian | 25 | 0.2% |
| Pennsylvania German | 19 | 0.1% |
| Peruvian | 114 | 0.9% |
| Polish | 188 | 1.4% |
| Portuguese | 19 | 0.1% |
| Puerto Rican | 445 | 3.4% |
| Romanian | 23 | 0.2% |
| Russian | 28 | 0.2% |
| Salvadoran | 9 | 0.1% |
| Scandinavian | 23 | 0.2% |
| Scotch-Irish | 111 | 0.9% |
| Scottish | 255 | 1.9% |
| Slavic | 1 | 0.0% |
| Slovak | 3 | 0.0% |
| South African | 11 | 0.1% |
| South American | 258 | 2.0% |
| Spaniard | 37 | 0.3% |
| Spanish | 2 | 0.0% |
| Sri Lankan | 28 | 0.2% |
| Subsaharan African | 28 | 0.2% |
| Swedish | 266 | 2.0% |
| Swiss | 15 | 0.1% |
| Syrian | 12 | 0.1% |
| Thai | 45 | 0.3% |
| Trinidadian and Tobagonian | 23 | 0.2% |
| Ukrainian | 63 | 0.5% |
| Uruguayan | 18 | 0.1% |
| Welsh | 10 | 0.1% |
| West Indian | 88 | 0.7% |
| Yugoslavian | 13 | 0.1% | View All 74 Rows |
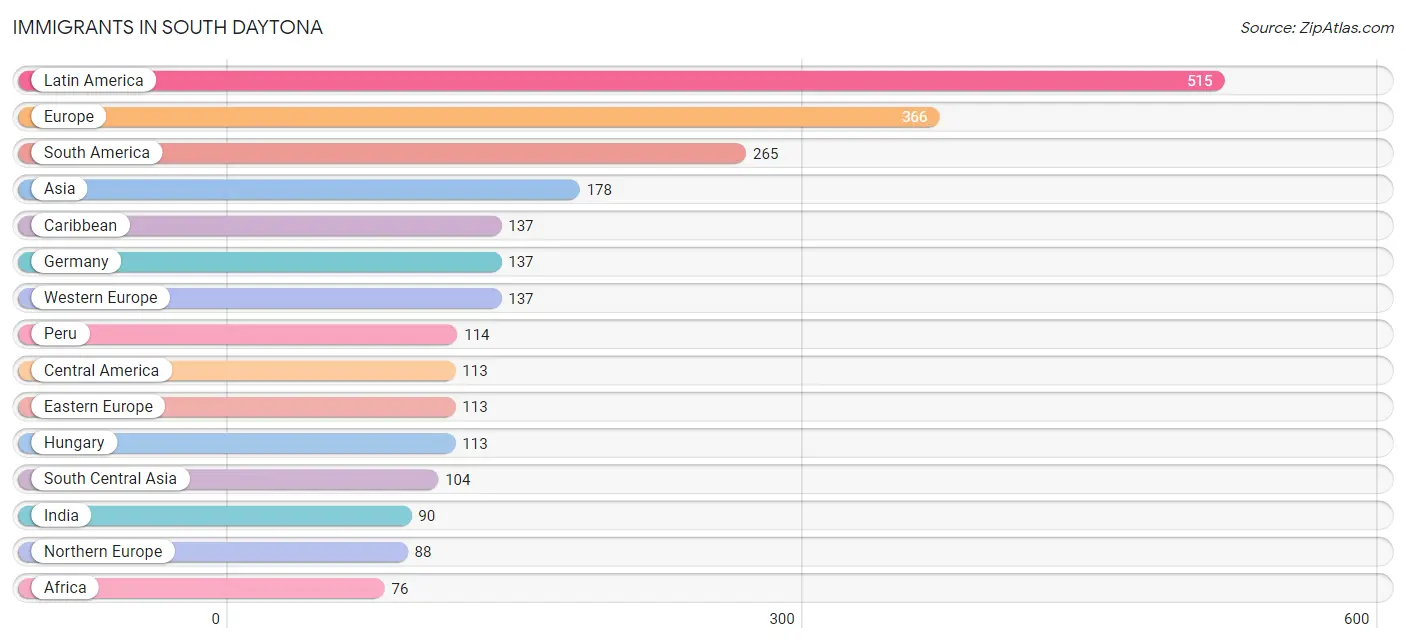
Immigrants in South Daytona
The most numerous immigrant groups reported in South Daytona came from Latin America (515 | 3.9%), Europe (366 | 2.8%), South America (265 | 2.0%), Asia (178 | 1.4%), and Caribbean (137 | 1.0%), together accounting for 11.1% of all South Daytona residents.
| Immigration Origin | # Population | % Population |
| Africa | 76 | 0.6% |
| Argentina | 38 | 0.3% |
| Asia | 178 | 1.4% |
| Brazil | 23 | 0.2% |
| Canada | 46 | 0.4% |
| Caribbean | 137 | 1.0% |
| Central America | 113 | 0.9% |
| China | 14 | 0.1% |
| Colombia | 18 | 0.1% |
| Costa Rica | 38 | 0.3% |
| Cuba | 9 | 0.1% |
| Dominican Republic | 32 | 0.2% |
| Eastern Asia | 23 | 0.2% |
| Eastern Europe | 113 | 0.9% |
| Ecuador | 37 | 0.3% |
| England | 7 | 0.1% |
| Europe | 366 | 2.8% |
| Germany | 137 | 1.0% |
| Guatemala | 30 | 0.2% |
| Haiti | 8 | 0.1% |
| Hungary | 113 | 0.9% |
| India | 90 | 0.7% |
| Iran | 10 | 0.1% |
| Italy | 11 | 0.1% |
| Jamaica | 65 | 0.5% |
| Japan | 9 | 0.1% |
| Latin America | 515 | 3.9% |
| Mexico | 31 | 0.2% |
| Middle Africa | 50 | 0.4% |
| Nigeria | 15 | 0.1% |
| Northern Europe | 88 | 0.7% |
| Pakistan | 4 | 0.0% |
| Panama | 14 | 0.1% |
| Peru | 114 | 0.9% |
| Philippines | 40 | 0.3% |
| Portugal | 17 | 0.1% |
| South Africa | 11 | 0.1% |
| South America | 265 | 2.0% |
| South Central Asia | 104 | 0.8% |
| South Eastern Asia | 40 | 0.3% |
| Southern Europe | 28 | 0.2% |
| Sweden | 40 | 0.3% |
| Syria | 11 | 0.1% |
| Trinidad and Tobago | 23 | 0.2% |
| Uruguay | 18 | 0.1% |
| Venezuela | 17 | 0.1% |
| Western Africa | 15 | 0.1% |
| Western Asia | 11 | 0.1% |
| Western Europe | 137 | 1.0% | View All 49 Rows |
Sex and Age in South Daytona
Sex and Age in South Daytona
The most populous age groups in South Daytona are 50 to 54 Years (569 | 9.4%) for men and 35 to 39 Years (668 | 9.5%) for women.
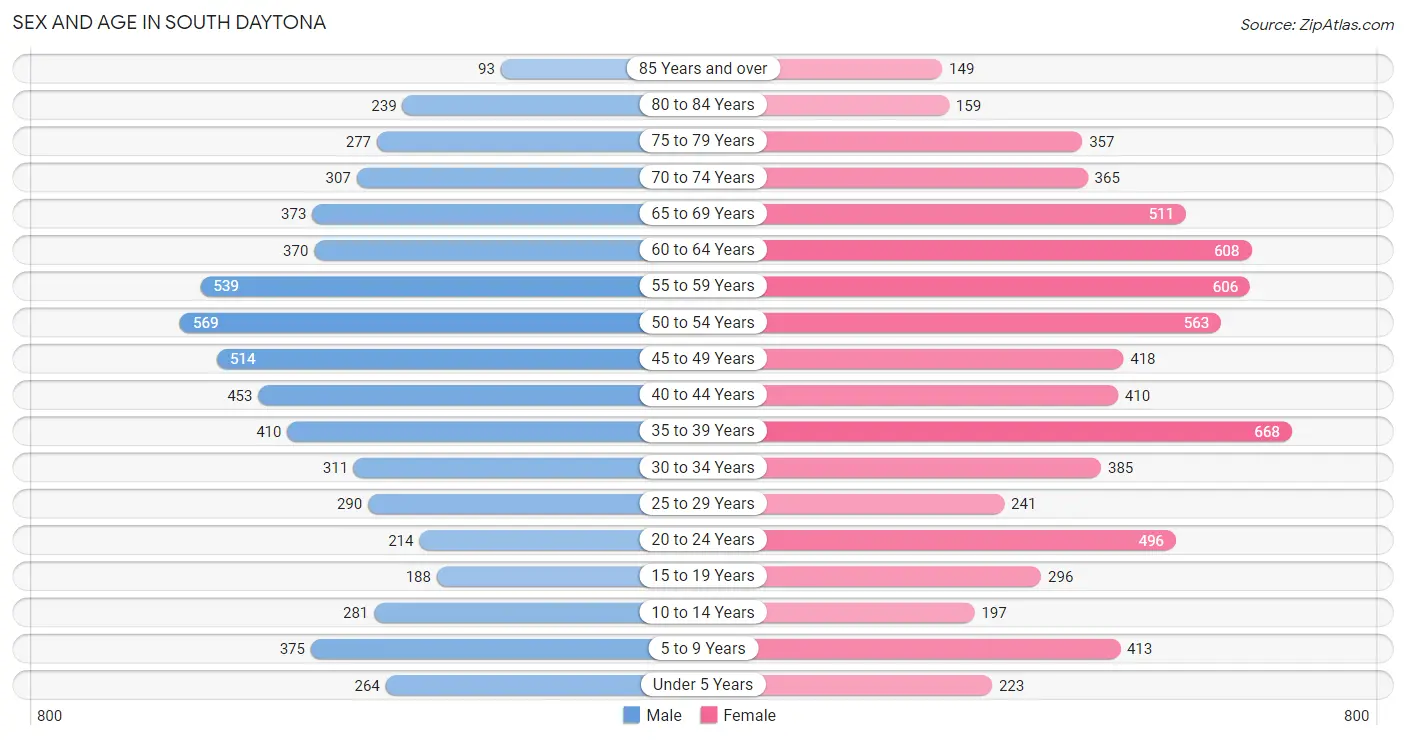
| Age Bracket | Male | Female |
| Under 5 Years | 264 (4.3%) | 223 (3.2%) |
| 5 to 9 Years | 375 (6.2%) | 413 (5.9%) |
| 10 to 14 Years | 281 (4.6%) | 197 (2.8%) |
| 15 to 19 Years | 188 (3.1%) | 296 (4.2%) |
| 20 to 24 Years | 214 (3.5%) | 496 (7.0%) |
| 25 to 29 Years | 290 (4.8%) | 241 (3.4%) |
| 30 to 34 Years | 311 (5.1%) | 385 (5.4%) |
| 35 to 39 Years | 410 (6.8%) | 668 (9.5%) |
| 40 to 44 Years | 453 (7.5%) | 410 (5.8%) |
| 45 to 49 Years | 514 (8.5%) | 418 (5.9%) |
| 50 to 54 Years | 569 (9.4%) | 563 (8.0%) |
| 55 to 59 Years | 539 (8.9%) | 606 (8.6%) |
| 60 to 64 Years | 370 (6.1%) | 608 (8.6%) |
| 65 to 69 Years | 373 (6.1%) | 511 (7.2%) |
| 70 to 74 Years | 307 (5.1%) | 365 (5.2%) |
| 75 to 79 Years | 277 (4.6%) | 357 (5.1%) |
| 80 to 84 Years | 239 (3.9%) | 159 (2.2%) |
| 85 Years and over | 93 (1.5%) | 149 (2.1%) |
| Total | 6,067 (100.0%) | 7,065 (100.0%) |
Families and Households in South Daytona
Median Family Size in South Daytona
The median family size in South Daytona is 2.67 persons per family, with single female/mother families (777 | 22.6%) accounting for the largest median family size of 2.7 persons per family. On the other hand, single male/father families (232 | 6.8%) represent the smallest median family size with 2.57 persons per family.
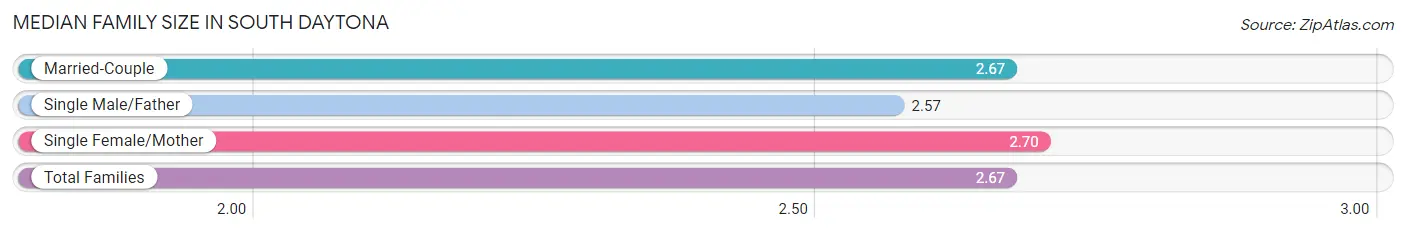
| Family Type | # Families | Family Size |
| Married-Couple | 2,427 (70.6%) | 2.67 |
| Single Male/Father | 232 (6.8%) | 2.57 |
| Single Female/Mother | 777 (22.6%) | 2.70 |
| Total Families | 3,436 (100.0%) | 2.67 |
Median Household Size in South Daytona
The median household size in South Daytona is 2.20 persons per household, with single female/mother households (777 | 13.1%) accounting for the largest median household size of 2.98 persons per household. non-family households (2,494 | 42.1%) represent the smallest median household size with 1.40 persons per household.
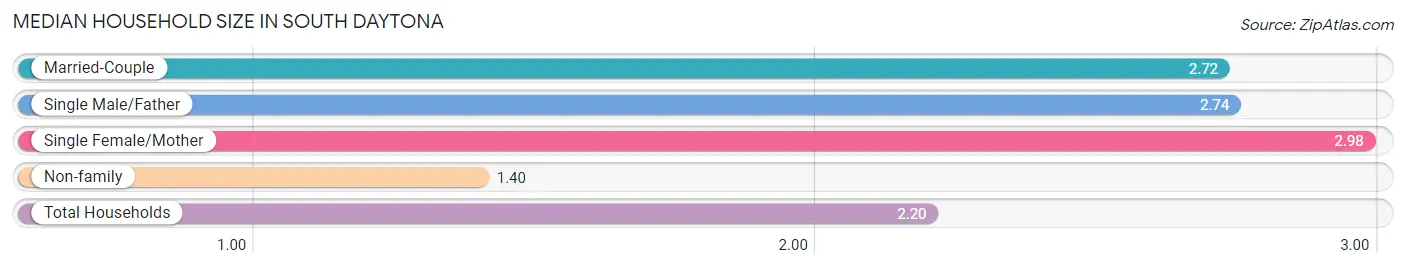
| Household Type | # Households | Household Size |
| Married-Couple | 2,427 (40.9%) | 2.72 |
| Single Male/Father | 232 (3.9%) | 2.74 |
| Single Female/Mother | 777 (13.1%) | 2.98 |
| Non-family | 2,494 (42.1%) | 1.40 |
| Total Households | 5,930 (100.0%) | 2.20 |
Household Size by Marriage Status in South Daytona
Out of a total of 5,930 households in South Daytona, 3,436 (57.9%) are family households, while 2,494 (42.1%) are nonfamily households. The most numerous type of family households are 2-person households, comprising 2,100, and the most common type of nonfamily households are 1-person households, comprising 1,761.
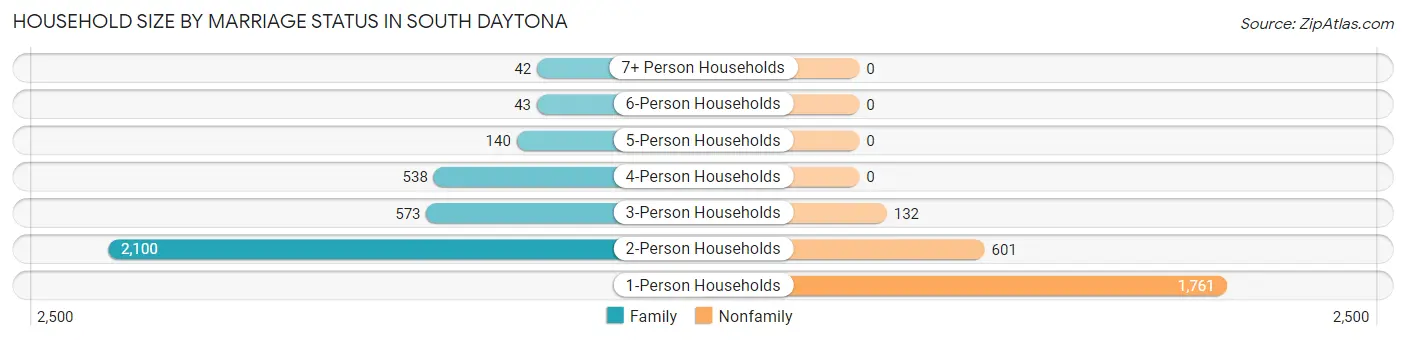
| Household Size | Family Households | Nonfamily Households |
| 1-Person Households | - | 1,761 (29.7%) |
| 2-Person Households | 2,100 (35.4%) | 601 (10.1%) |
| 3-Person Households | 573 (9.7%) | 132 (2.2%) |
| 4-Person Households | 538 (9.1%) | 0 (0.0%) |
| 5-Person Households | 140 (2.4%) | 0 (0.0%) |
| 6-Person Households | 43 (0.7%) | 0 (0.0%) |
| 7+ Person Households | 42 (0.7%) | 0 (0.0%) |
| Total | 3,436 (57.9%) | 2,494 (42.1%) |
Female Fertility in South Daytona
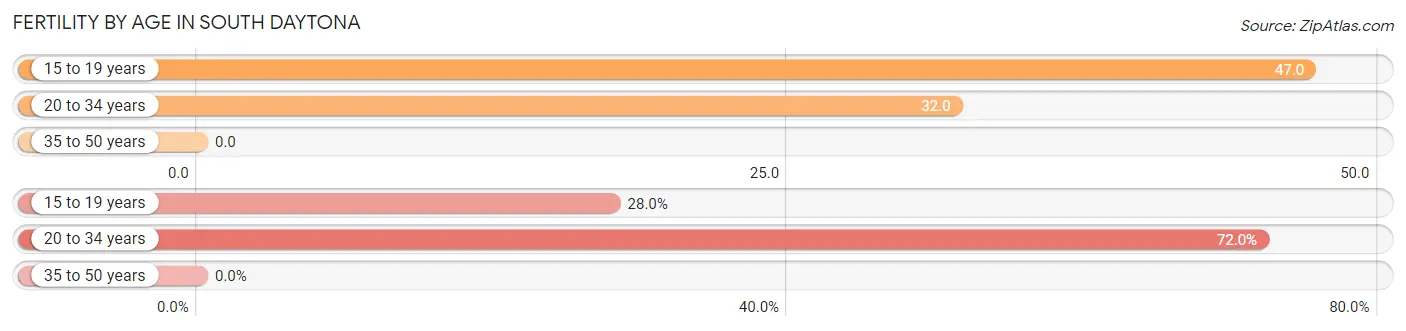
Fertility by Age in South Daytona
Average fertility rate in South Daytona is 16.0 births per 1,000 women. Women in the age bracket of 15 to 19 years have the highest fertility rate with 47.0 births per 1,000 women. Women in the age bracket of 20 to 34 years acount for 72.0% of all women with births.
| Age Bracket | Women with Births | Births / 1,000 Women |
| 15 to 19 years | 14 (28.0%) | 47.0 |
| 20 to 34 years | 36 (72.0%) | 32.0 |
| 35 to 50 years | 0 (0.0%) | 0.0 |
| Total | 50 (100.0%) | 16.0 |
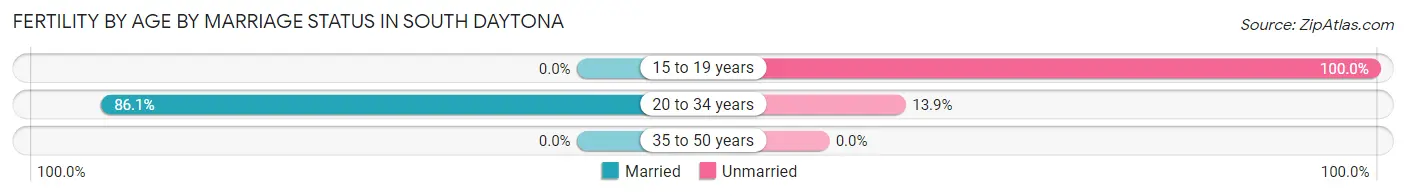
Fertility by Age by Marriage Status in South Daytona
62.0% of women with births (50) in South Daytona are married. The highest percentage of unmarried women with births falls into 15 to 19 years age bracket with 100.0% of them unmarried at the time of birth, while the lowest percentage of unmarried women with births belong to 20 to 34 years age bracket with 13.9% of them unmarried.
| Age Bracket | Married | Unmarried |
| 15 to 19 years | 0 (0.0%) | 14 (100.0%) |
| 20 to 34 years | 31 (86.1%) | 5 (13.9%) |
| 35 to 50 years | 0 (0.0%) | 0 (0.0%) |
| Total | 31 (62.0%) | 19 (38.0%) |
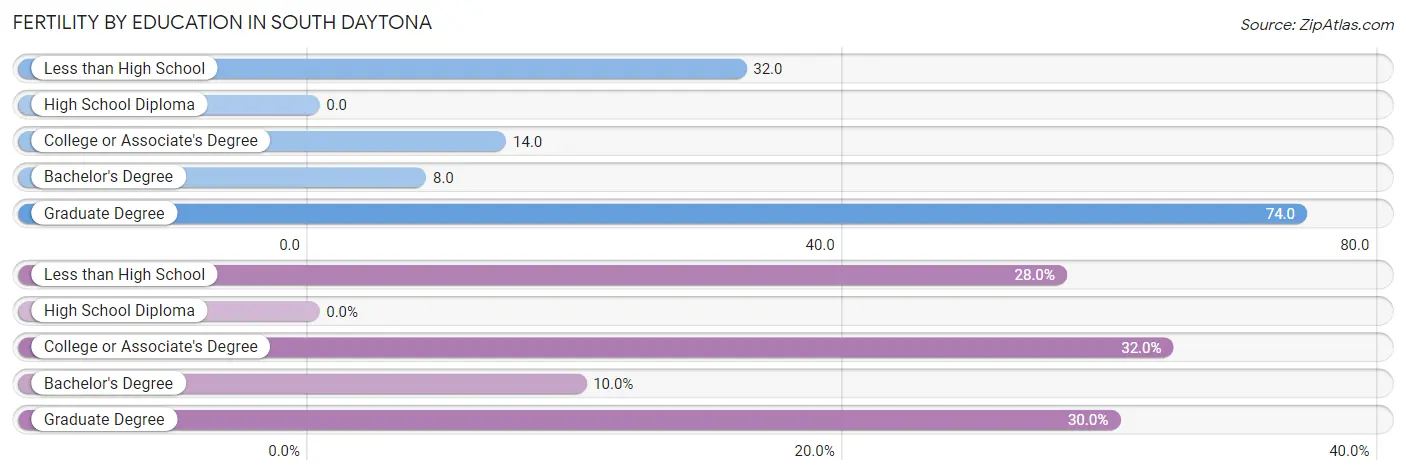
Fertility by Education in South Daytona
| Educational Attainment | Women with Births | Births / 1,000 Women |
| Less than High School | 14 (28.0%) | 32.0 |
| High School Diploma | 0 (0.0%) | 0.0 |
| College or Associate's Degree | 16 (32.0%) | 14.0 |
| Bachelor's Degree | 5 (10.0%) | 8.0 |
| Graduate Degree | 15 (30.0%) | 74.0 |
| Total | 50 (100.0%) | 16.0 |
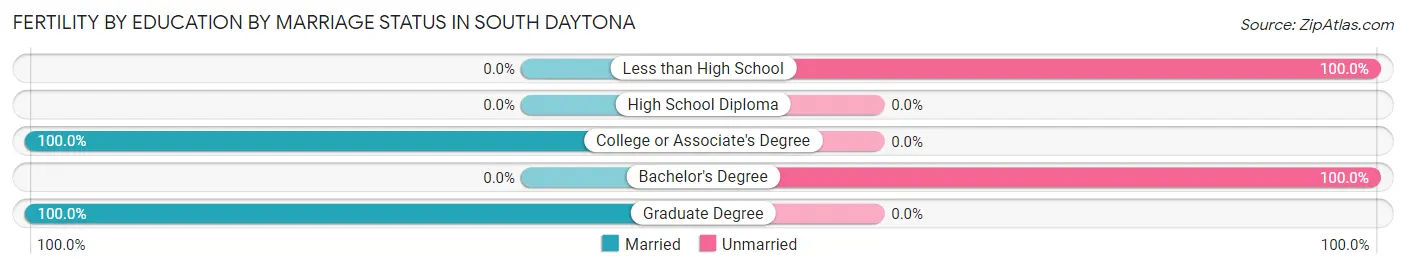
Fertility by Education by Marriage Status in South Daytona
38.0% of women with births in South Daytona are unmarried. Women with the educational attainment of college or associate's degree are most likely to be married with 100.0% of them married at childbirth, while women with the educational attainment of less than high school are least likely to be married with 100.0% of them unmarried at childbirth.
| Educational Attainment | Married | Unmarried |
| Less than High School | 0 (0.0%) | 14 (100.0%) |
| High School Diploma | 0 (0.0%) | 0 (0.0%) |
| College or Associate's Degree | 16 (100.0%) | 0 (0.0%) |
| Bachelor's Degree | 0 (0.0%) | 5 (100.0%) |
| Graduate Degree | 15 (100.0%) | 0 (0.0%) |
| Total | 31 (62.0%) | 19 (38.0%) |
Income in South Daytona
Income Overview in South Daytona
Per Capita Income in South Daytona is $30,713, while median incomes of families and households are $63,951 and $54,898 respectively.
| Characteristic | Number | Measure |
| Per Capita Income | 13,132 | $30,713 |
| Median Family Income | 3,436 | $63,951 |
| Mean Family Income | 3,436 | $72,160 |
| Median Household Income | 5,930 | $54,898 |
| Mean Household Income | 5,930 | $67,154 |
| Income Deficit | 3,436 | $0 |
| Wage / Income Gap (%) | 13,132 | 14.49% |
| Wage / Income Gap ($) | 13,132 | 85.51¢ per $1 |
| Gini / Inequality Index | 13,132 | 0.43 |
Earnings by Sex in South Daytona
Average Earnings in South Daytona are $34,320, $37,329 for men and $31,921 for women, a difference of 14.5%.
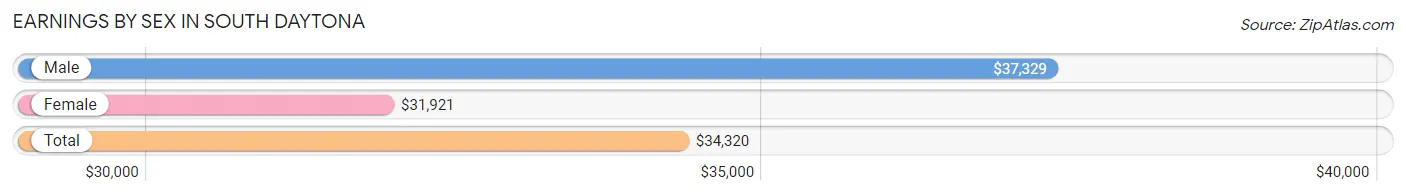
| Sex | Number | Average Earnings |
| Male | 3,139 (48.9%) | $37,329 |
| Female | 3,283 (51.1%) | $31,921 |
| Total | 6,422 (100.0%) | $34,320 |
Earnings by Sex by Income Bracket in South Daytona
The most common earnings brackets in South Daytona are $30,000 to $34,999 for men (489 | 15.6%) and $30,000 to $34,999 for women (333 | 10.1%).
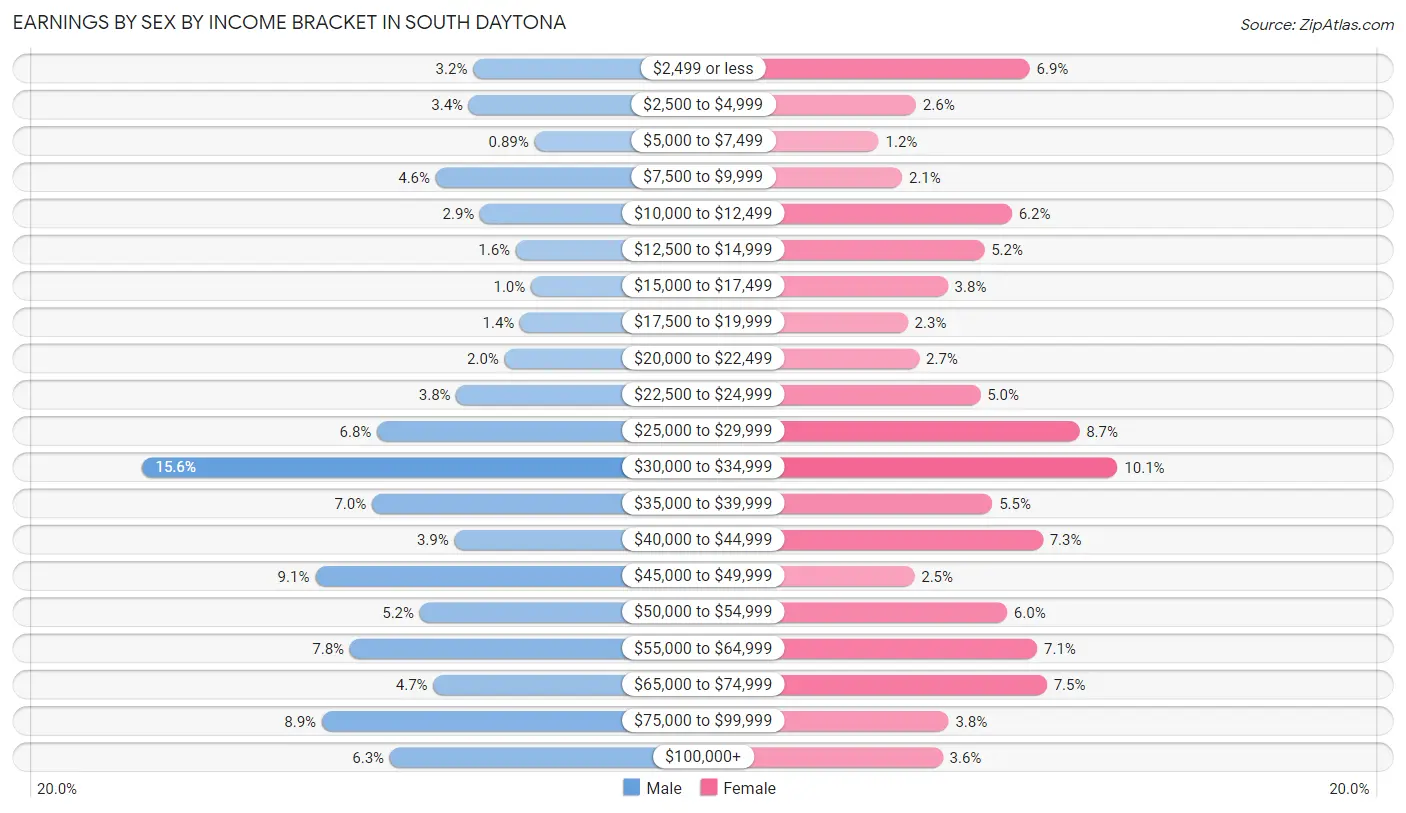
| Income | Male | Female |
| $2,499 or less | 100 (3.2%) | 225 (6.9%) |
| $2,500 to $4,999 | 105 (3.4%) | 85 (2.6%) |
| $5,000 to $7,499 | 28 (0.9%) | 39 (1.2%) |
| $7,500 to $9,999 | 144 (4.6%) | 68 (2.1%) |
| $10,000 to $12,499 | 92 (2.9%) | 203 (6.2%) |
| $12,500 to $14,999 | 50 (1.6%) | 169 (5.1%) |
| $15,000 to $17,499 | 32 (1.0%) | 124 (3.8%) |
| $17,500 to $19,999 | 45 (1.4%) | 75 (2.3%) |
| $20,000 to $22,499 | 63 (2.0%) | 89 (2.7%) |
| $22,500 to $24,999 | 120 (3.8%) | 164 (5.0%) |
| $25,000 to $29,999 | 213 (6.8%) | 286 (8.7%) |
| $30,000 to $34,999 | 489 (15.6%) | 333 (10.1%) |
| $35,000 to $39,999 | 219 (7.0%) | 179 (5.4%) |
| $40,000 to $44,999 | 122 (3.9%) | 241 (7.3%) |
| $45,000 to $49,999 | 286 (9.1%) | 83 (2.5%) |
| $50,000 to $54,999 | 163 (5.2%) | 197 (6.0%) |
| $55,000 to $64,999 | 245 (7.8%) | 234 (7.1%) |
| $65,000 to $74,999 | 147 (4.7%) | 246 (7.5%) |
| $75,000 to $99,999 | 278 (8.9%) | 125 (3.8%) |
| $100,000+ | 198 (6.3%) | 118 (3.6%) |
| Total | 3,139 (100.0%) | 3,283 (100.0%) |
Earnings by Sex by Educational Attainment in South Daytona
Average earnings in South Daytona are $39,289 for men and $34,531 for women, a difference of 12.1%. Men with an educational attainment of bachelor's degree enjoy the highest average annual earnings of $46,970, while those with less than high school education earn the least with $24,598. Women with an educational attainment of bachelor's degree earn the most with the average annual earnings of $52,059, while those with college or associate's degree education have the smallest earnings of $28,824.
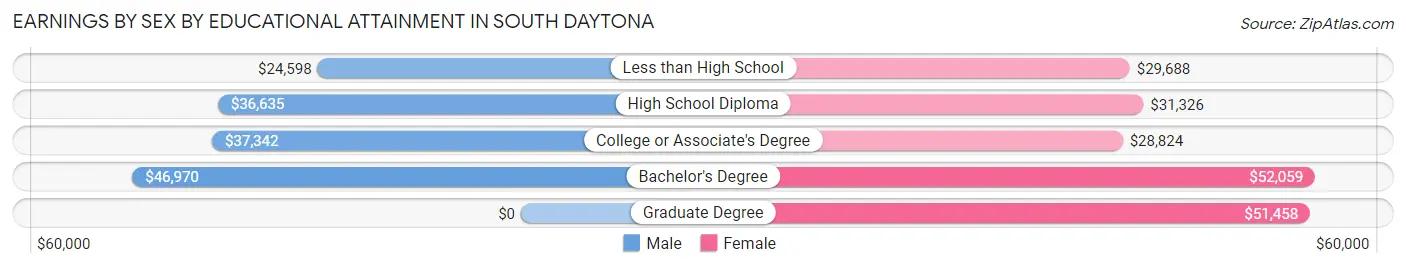
| Educational Attainment | Male Income | Female Income |
| Less than High School | $24,598 | $29,688 |
| High School Diploma | $36,635 | $31,326 |
| College or Associate's Degree | $37,342 | $28,824 |
| Bachelor's Degree | $46,970 | $52,059 |
| Graduate Degree | - | - |
| Total | $39,289 | $34,531 |
Family Income in South Daytona
Family Income Brackets in South Daytona
According to the South Daytona family income data, there are 838 families falling into the $50,000 to $74,999 income range, which is the most common income bracket and makes up 24.4% of all families. Conversely, the $200,000+ income bracket is the least frequent group with only 62 families (1.8%) belonging to this category.
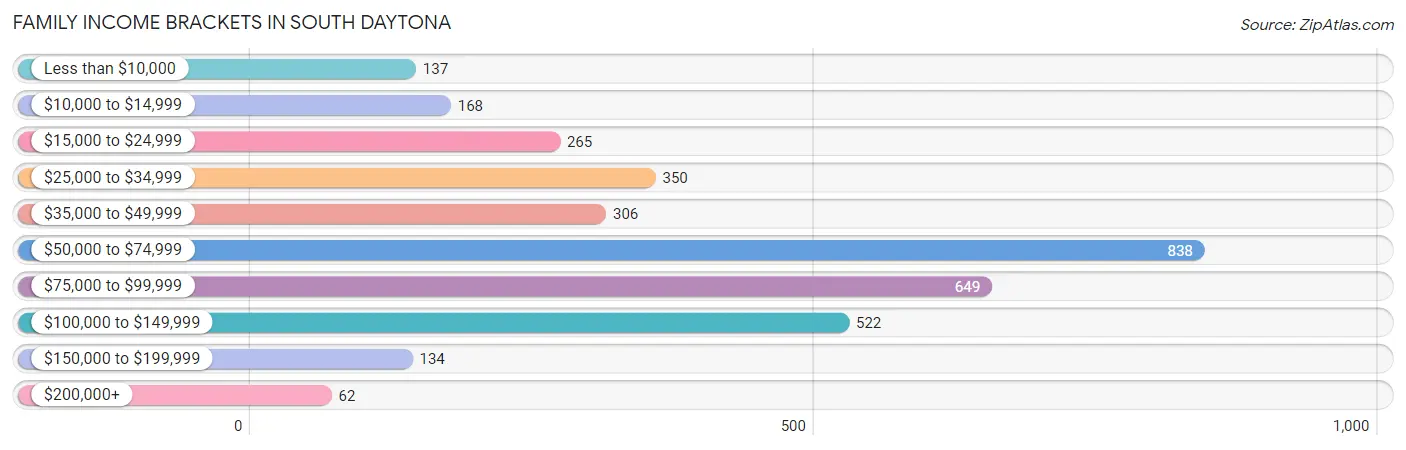
| Income Bracket | # Families | % Families |
| Less than $10,000 | 137 | 4.0% |
| $10,000 to $14,999 | 168 | 4.9% |
| $15,000 to $24,999 | 265 | 7.7% |
| $25,000 to $34,999 | 350 | 10.2% |
| $35,000 to $49,999 | 306 | 8.9% |
| $50,000 to $74,999 | 838 | 24.4% |
| $75,000 to $99,999 | 649 | 18.9% |
| $100,000 to $149,999 | 522 | 15.2% |
| $150,000 to $199,999 | 134 | 3.9% |
| $200,000+ | 62 | 1.8% |
Family Income by Famaliy Size in South Daytona
5-person families (133 | 3.9%) account for the highest median family income in South Daytona with $91,402 per family, while 2-person families (2,244 | 65.3%) have the highest median income of $27,954 per family member.
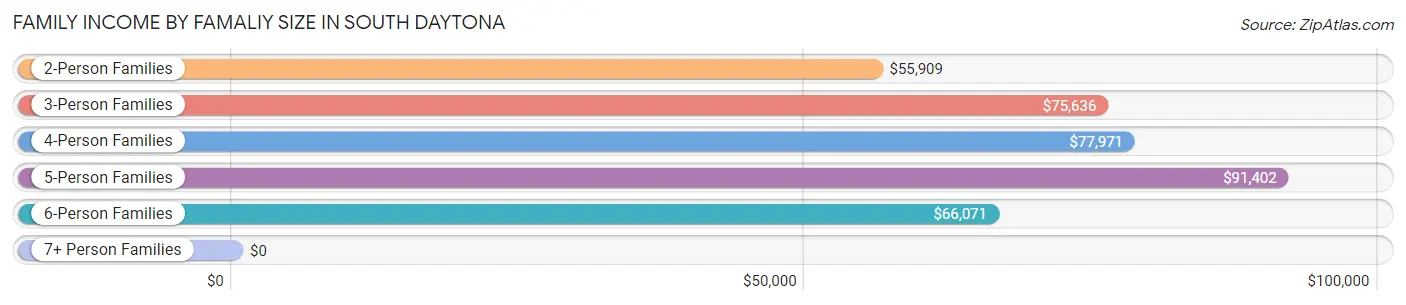
| Income Bracket | # Families | Median Income |
| 2-Person Families | 2,244 (65.3%) | $55,909 |
| 3-Person Families | 568 (16.5%) | $75,636 |
| 4-Person Families | 419 (12.2%) | $77,971 |
| 5-Person Families | 133 (3.9%) | $91,402 |
| 6-Person Families | 30 (0.9%) | $66,071 |
| 7+ Person Families | 42 (1.2%) | $0 |
| Total | 3,436 (100.0%) | $63,951 |
Family Income by Number of Earners in South Daytona
The median family income in South Daytona is $63,951, with families comprising 3+ earners (165) having the highest median family income of $94,196, while families with no earners (852) have the lowest median family income of $48,722, accounting for 4.8% and 24.8% of families, respectively.
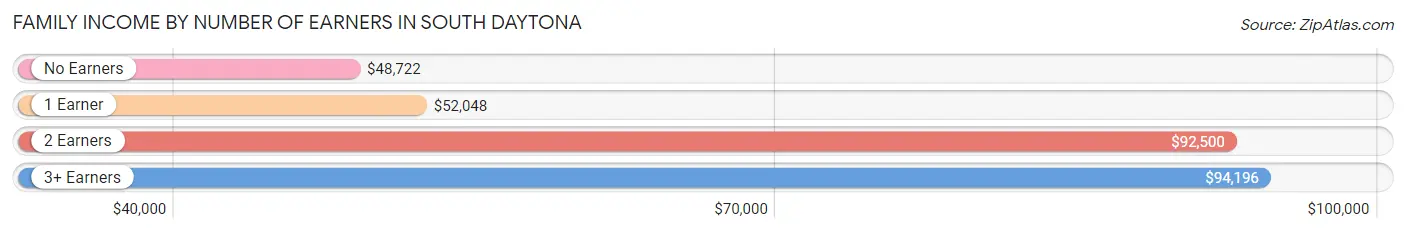
| Number of Earners | # Families | Median Income |
| No Earners | 852 (24.8%) | $48,722 |
| 1 Earner | 1,327 (38.6%) | $52,048 |
| 2 Earners | 1,092 (31.8%) | $92,500 |
| 3+ Earners | 165 (4.8%) | $94,196 |
| Total | 3,436 (100.0%) | $63,951 |
Household Income in South Daytona
Household Income Brackets in South Daytona
With 1,429 households falling in the category, the $50,000 to $74,999 income range is the most frequent in South Daytona, accounting for 24.1% of all households. In contrast, only 142 households (2.4%) fall into the $200,000+ income bracket, making it the least populous group.
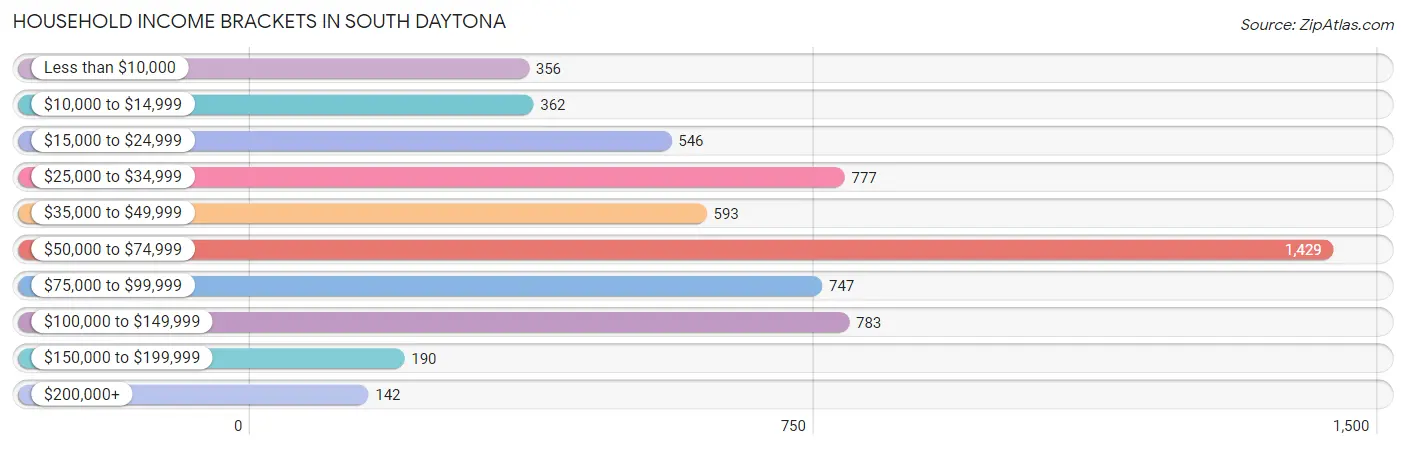
| Income Bracket | # Households | % Households |
| Less than $10,000 | 356 | 6.0% |
| $10,000 to $14,999 | 362 | 6.1% |
| $15,000 to $24,999 | 546 | 9.2% |
| $25,000 to $34,999 | 777 | 13.1% |
| $35,000 to $49,999 | 593 | 10.0% |
| $50,000 to $74,999 | 1,429 | 24.1% |
| $75,000 to $99,999 | 747 | 12.6% |
| $100,000 to $149,999 | 783 | 13.2% |
| $150,000 to $199,999 | 190 | 3.2% |
| $200,000+ | 142 | 2.4% |
Household Income by Householder Age in South Daytona
The median household income in South Daytona is $54,898, with the highest median household income of $72,917 found in the 25 to 44 years age bracket for the primary householder. A total of 1,657 households (27.9%) fall into this category. Meanwhile, the 65+ years age bracket for the primary householder has the lowest median household income of $45,375, with 1,781 households (30.0%) in this group.
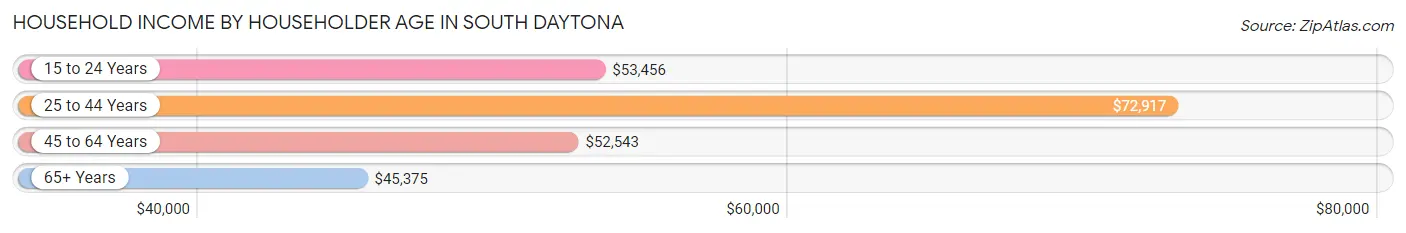
| Income Bracket | # Households | Median Income |
| 15 to 24 Years | 173 (2.9%) | $53,456 |
| 25 to 44 Years | 1,657 (27.9%) | $72,917 |
| 45 to 64 Years | 2,319 (39.1%) | $52,543 |
| 65+ Years | 1,781 (30.0%) | $45,375 |
| Total | 5,930 (100.0%) | $54,898 |
Poverty in South Daytona
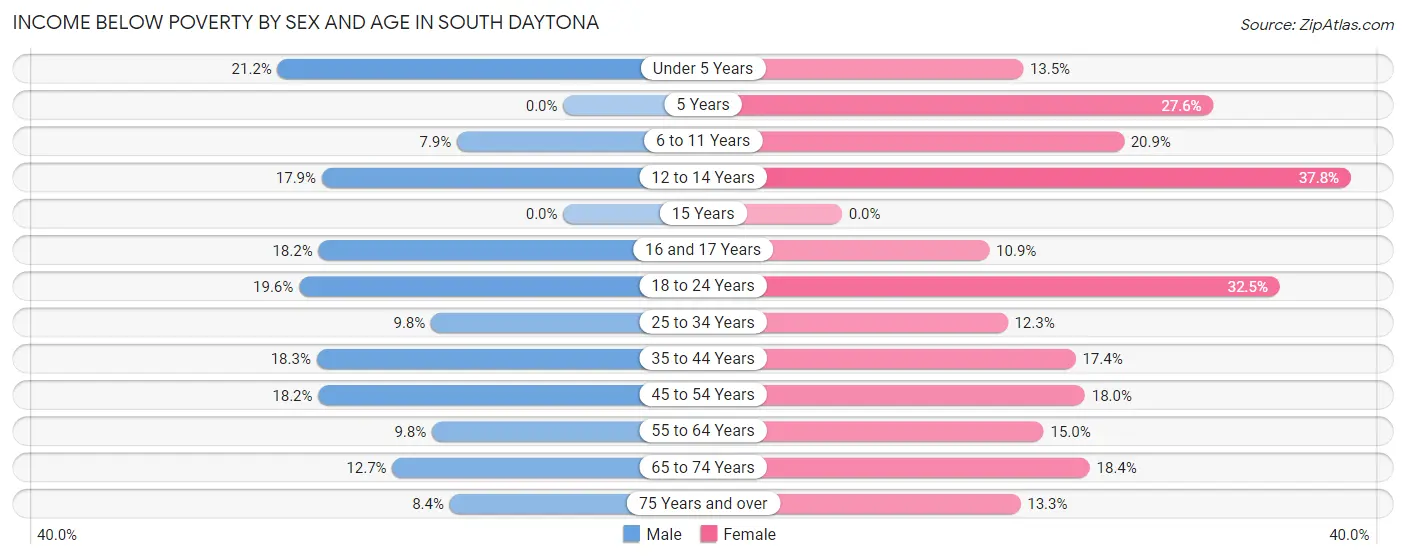
Income Below Poverty by Sex and Age in South Daytona
With 13.5% poverty level for males and 18.1% for females among the residents of South Daytona, under 5 year old males and 12 to 14 year old females are the most vulnerable to poverty, with 56 males (21.2%) and 62 females (37.8%) in their respective age groups living below the poverty level.
| Age Bracket | Male | Female |
| Under 5 Years | 56 (21.2%) | 30 (13.5%) |
| 5 Years | 0 (0.0%) | 40 (27.6%) |
| 6 to 11 Years | 31 (7.9%) | 63 (20.9%) |
| 12 to 14 Years | 26 (17.9%) | 62 (37.8%) |
| 15 Years | 0 (0.0%) | 0 (0.0%) |
| 16 and 17 Years | 14 (18.2%) | 14 (10.9%) |
| 18 to 24 Years | 52 (19.6%) | 200 (32.5%) |
| 25 to 34 Years | 59 (9.8%) | 77 (12.3%) |
| 35 to 44 Years | 158 (18.3%) | 187 (17.3%) |
| 45 to 54 Years | 197 (18.2%) | 177 (18.0%) |
| 55 to 64 Years | 88 (9.8%) | 181 (15.0%) |
| 65 to 74 Years | 85 (12.7%) | 154 (18.4%) |
| 75 Years and over | 51 (8.4%) | 86 (13.3%) |
| Total | 817 (13.5%) | 1,271 (18.1%) |
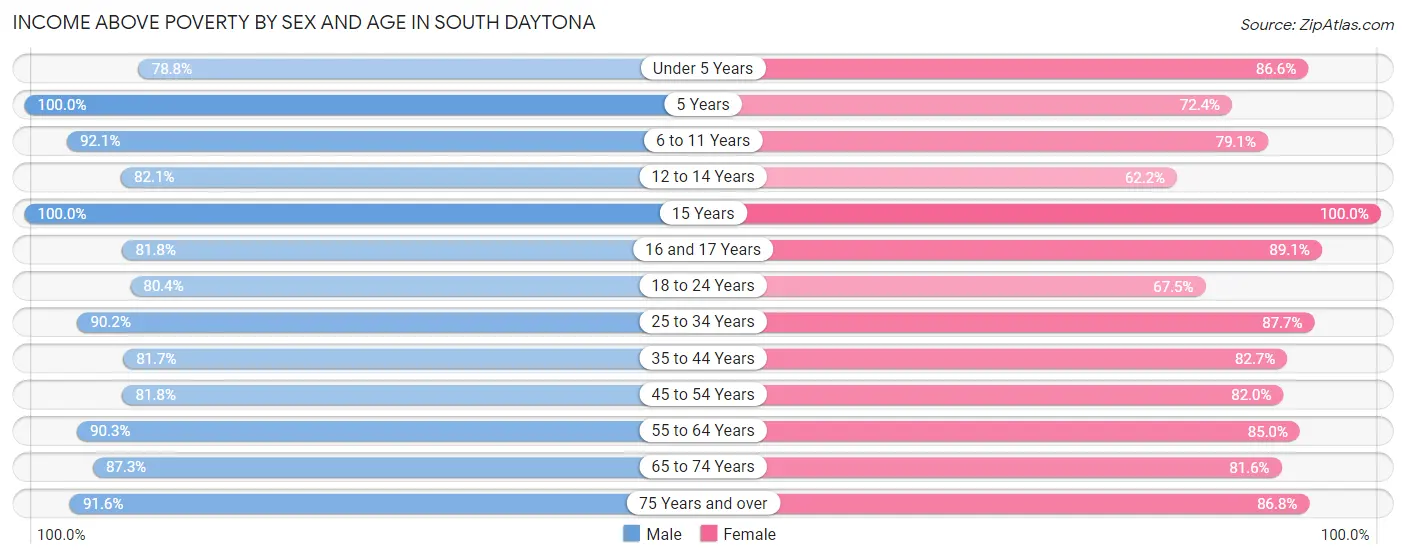
Income Above Poverty by Sex and Age in South Daytona
According to the poverty statistics in South Daytona, males aged 5 years and females aged 15 years are the age groups that are most secure financially, with 100.0% of males and 100.0% of females in these age groups living above the poverty line.
| Age Bracket | Male | Female |
| Under 5 Years | 208 (78.8%) | 193 (86.6%) |
| 5 Years | 106 (100.0%) | 105 (72.4%) |
| 6 to 11 Years | 362 (92.1%) | 238 (79.1%) |
| 12 to 14 Years | 119 (82.1%) | 102 (62.2%) |
| 15 Years | 60 (100.0%) | 49 (100.0%) |
| 16 and 17 Years | 63 (81.8%) | 114 (89.1%) |
| 18 to 24 Years | 213 (80.4%) | 415 (67.5%) |
| 25 to 34 Years | 542 (90.2%) | 549 (87.7%) |
| 35 to 44 Years | 705 (81.7%) | 891 (82.7%) |
| 45 to 54 Years | 886 (81.8%) | 804 (82.0%) |
| 55 to 64 Years | 815 (90.2%) | 1,027 (85.0%) |
| 65 to 74 Years | 585 (87.3%) | 683 (81.6%) |
| 75 Years and over | 554 (91.6%) | 563 (86.8%) |
| Total | 5,218 (86.5%) | 5,733 (81.9%) |
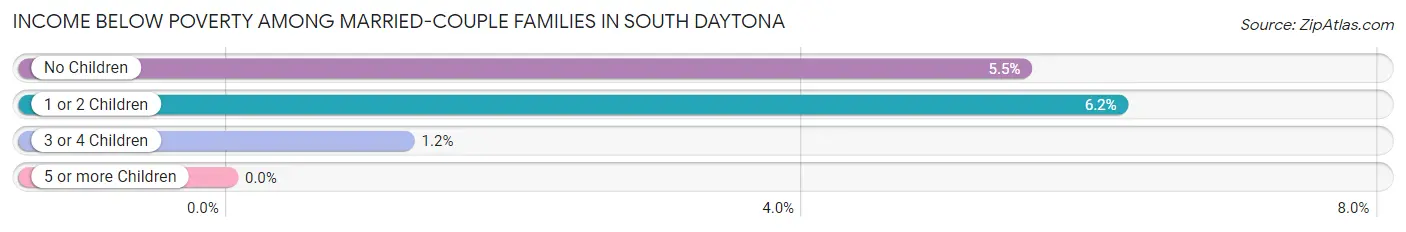
Income Below Poverty Among Married-Couple Families in South Daytona
The poverty statistics for married-couple families in South Daytona show that 5.5% or 133 of the total 2,427 families live below the poverty line. Families with 1 or 2 children have the highest poverty rate of 6.2%, comprising of 36 families. On the other hand, families with 5 or more children have the lowest poverty rate of 0.0%, which includes 0 families.
| Children | Above Poverty | Below Poverty |
| No Children | 1,639 (94.5%) | 96 (5.5%) |
| 1 or 2 Children | 545 (93.8%) | 36 (6.2%) |
| 3 or 4 Children | 80 (98.8%) | 1 (1.2%) |
| 5 or more Children | 30 (100.0%) | 0 (0.0%) |
| Total | 2,294 (94.5%) | 133 (5.5%) |
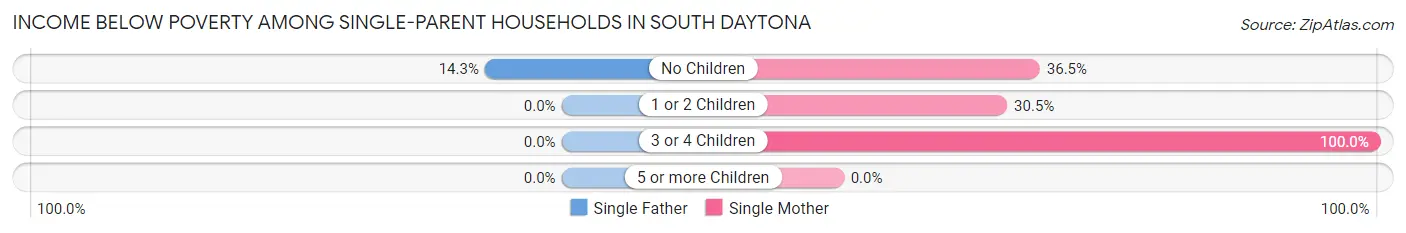
Income Below Poverty Among Single-Parent Households in South Daytona
According to the poverty data in South Daytona, 6.9% or 16 single-father households and 36.9% or 287 single-mother households are living below the poverty line. Among single-father households, those with no children have the highest poverty rate, with 16 households (14.3%) experiencing poverty. Likewise, among single-mother households, those with 3 or 4 children have the highest poverty rate, with 37 households (100.0%) falling below the poverty line.
| Children | Single Father | Single Mother |
| No Children | 16 (14.3%) | 148 (36.5%) |
| 1 or 2 Children | 0 (0.0%) | 102 (30.4%) |
| 3 or 4 Children | 0 (0.0%) | 37 (100.0%) |
| 5 or more Children | 0 (0.0%) | 0 (0.0%) |
| Total | 16 (6.9%) | 287 (36.9%) |
Income Below Poverty Among Married-Couple vs Single-Parent Households in South Daytona
The poverty data for South Daytona shows that 133 of the married-couple family households (5.5%) and 303 of the single-parent households (30.0%) are living below the poverty level. Within the married-couple family households, those with 1 or 2 children have the highest poverty rate, with 36 households (6.2%) falling below the poverty line. Among the single-parent households, those with 3 or 4 children have the highest poverty rate, with 37 household (100.0%) living below poverty.
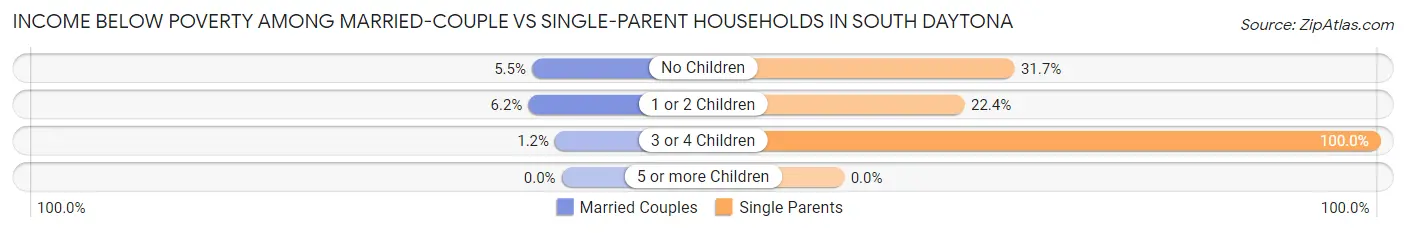
| Children | Married-Couple Families | Single-Parent Households |
| No Children | 96 (5.5%) | 164 (31.7%) |
| 1 or 2 Children | 36 (6.2%) | 102 (22.4%) |
| 3 or 4 Children | 1 (1.2%) | 37 (100.0%) |
| 5 or more Children | 0 (0.0%) | 0 (0.0%) |
| Total | 133 (5.5%) | 303 (30.0%) |
Employment Characteristics in South Daytona
Employment by Class of Employer in South Daytona
Among the 5,911 employed individuals in South Daytona, private company employees (4,305 | 72.8%), local government employees (525 | 8.9%), and state government employees (311 | 5.3%) make up the most common classes of employment.
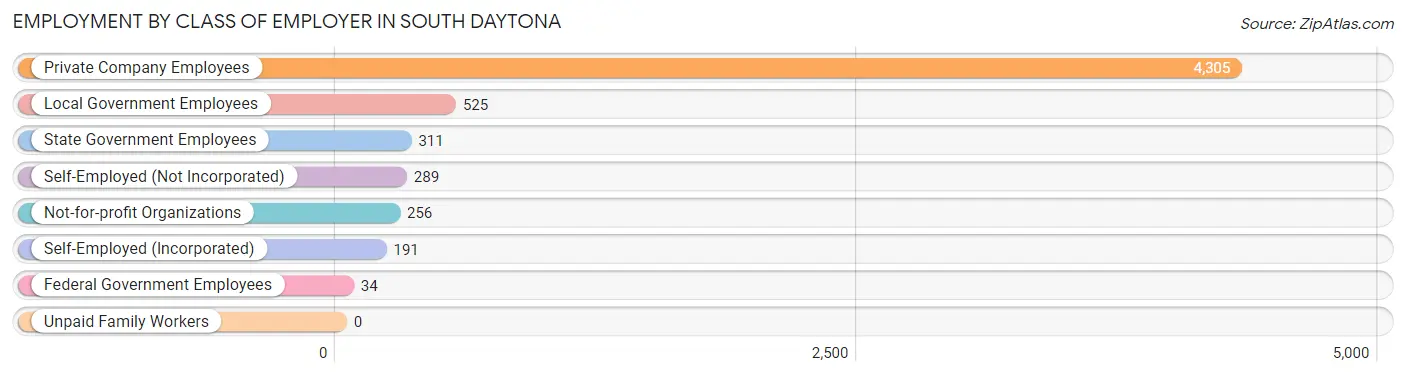
| Employer Class | # Employees | % Employees |
| Private Company Employees | 4,305 | 72.8% |
| Self-Employed (Incorporated) | 191 | 3.2% |
| Self-Employed (Not Incorporated) | 289 | 4.9% |
| Not-for-profit Organizations | 256 | 4.3% |
| Local Government Employees | 525 | 8.9% |
| State Government Employees | 311 | 5.3% |
| Federal Government Employees | 34 | 0.6% |
| Unpaid Family Workers | 0 | 0.0% |
| Total | 5,911 | 100.0% |
Employment Status by Age in South Daytona
According to the labor force statistics for South Daytona, out of the total population over 16 years of age (11,270), 55.6% or 6,266 individuals are in the labor force, with 4.1% or 257 of them unemployed. The age group with the highest labor force participation rate is 25 to 29 years, with 93.4% or 496 individuals in the labor force. Within the labor force, the 65 to 74 years age range has the highest percentage of unemployed individuals, with 12.6% or 41 of them being unemployed.
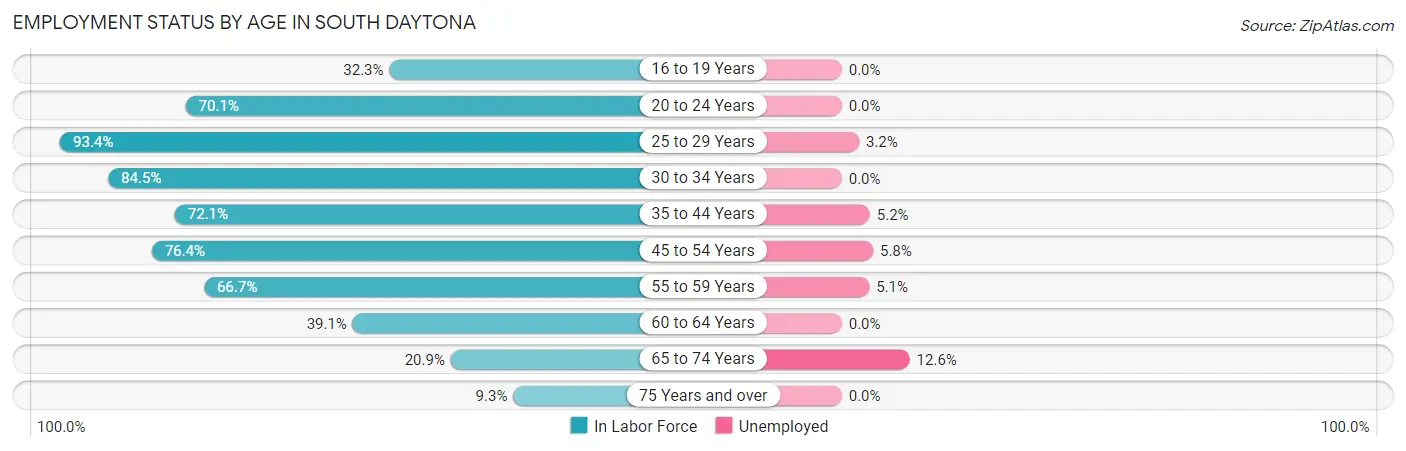
| Age Bracket | In Labor Force | Unemployed |
| 16 to 19 Years | 121 (32.3%) | 0 (0.0%) |
| 20 to 24 Years | 498 (70.1%) | 0 (0.0%) |
| 25 to 29 Years | 496 (93.4%) | 16 (3.2%) |
| 30 to 34 Years | 588 (84.5%) | 0 (0.0%) |
| 35 to 44 Years | 1,399 (72.1%) | 73 (5.2%) |
| 45 to 54 Years | 1,577 (76.4%) | 91 (5.8%) |
| 55 to 59 Years | 764 (66.7%) | 39 (5.1%) |
| 60 to 64 Years | 382 (39.1%) | 0 (0.0%) |
| 65 to 74 Years | 325 (20.9%) | 41 (12.6%) |
| 75 Years and over | 118 (9.3%) | 0 (0.0%) |
| Total | 6,266 (55.6%) | 257 (4.1%) |
Employment Status by Educational Attainment in South Daytona
According to labor force statistics for South Daytona, 70.8% of individuals (5,207) out of the total population between 25 and 64 years of age (7,355) are in the labor force, with 4.2% or 219 of them being unemployed. The group with the highest labor force participation rate are those with the educational attainment of bachelor's degree or higher, with 75.9% or 1,337 individuals in the labor force. Within the labor force, individuals with high school diploma education have the highest percentage of unemployment, with 5.8% or 97 of them being unemployed.
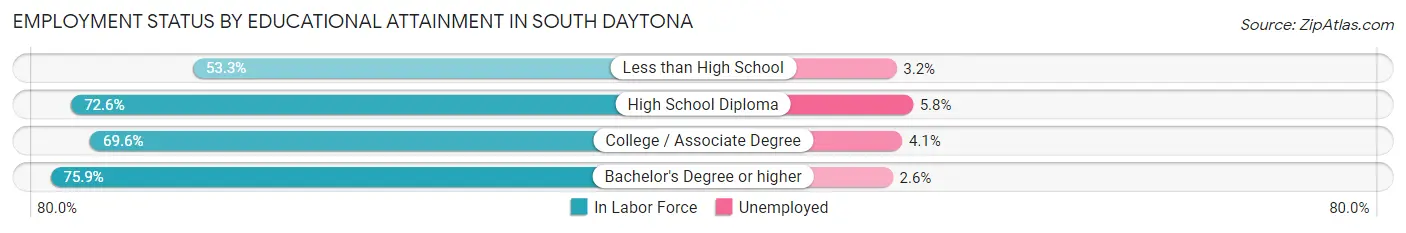
| Educational Attainment | In Labor Force | Unemployed |
| Less than High School | 308 (53.3%) | 18 (3.2%) |
| High School Diploma | 1,667 (72.6%) | 133 (5.8%) |
| College / Associate Degree | 1,893 (69.6%) | 112 (4.1%) |
| Bachelor's Degree or higher | 1,337 (75.9%) | 46 (2.6%) |
| Total | 5,207 (70.8%) | 309 (4.2%) |
Employment Occupations by Sex in South Daytona
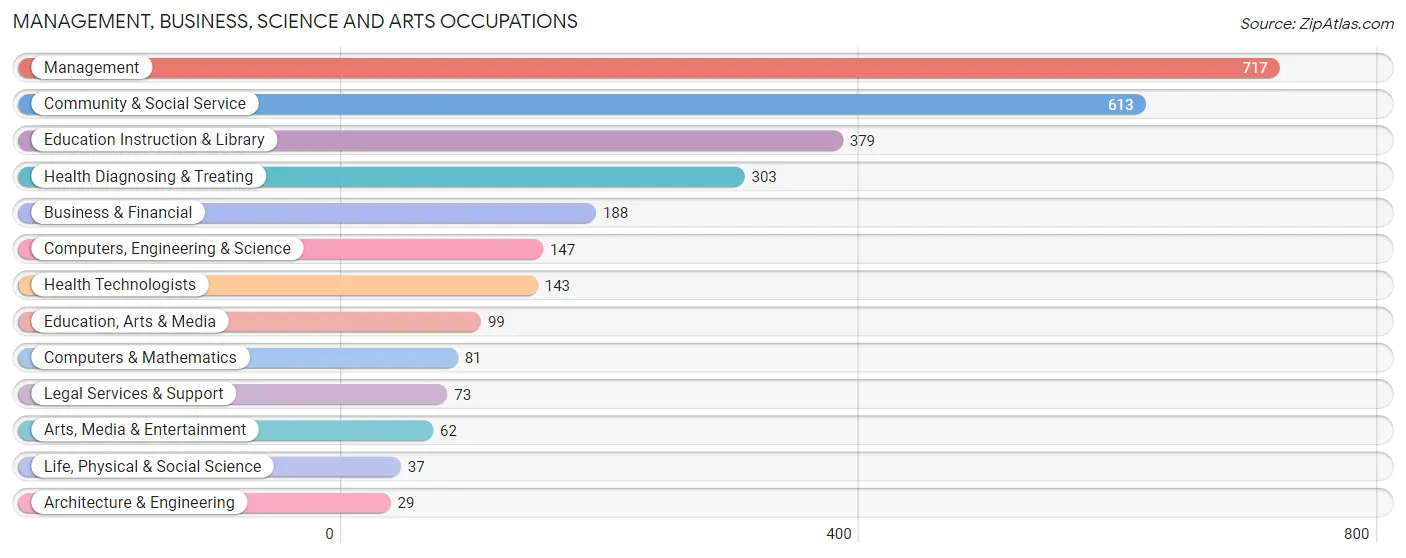
Management, Business, Science and Arts Occupations
The most common Management, Business, Science and Arts occupations in South Daytona are Management (717 | 11.9%), Community & Social Service (613 | 10.2%), Education Instruction & Library (379 | 6.3%), Health Diagnosing & Treating (303 | 5.0%), and Business & Financial (188 | 3.1%).
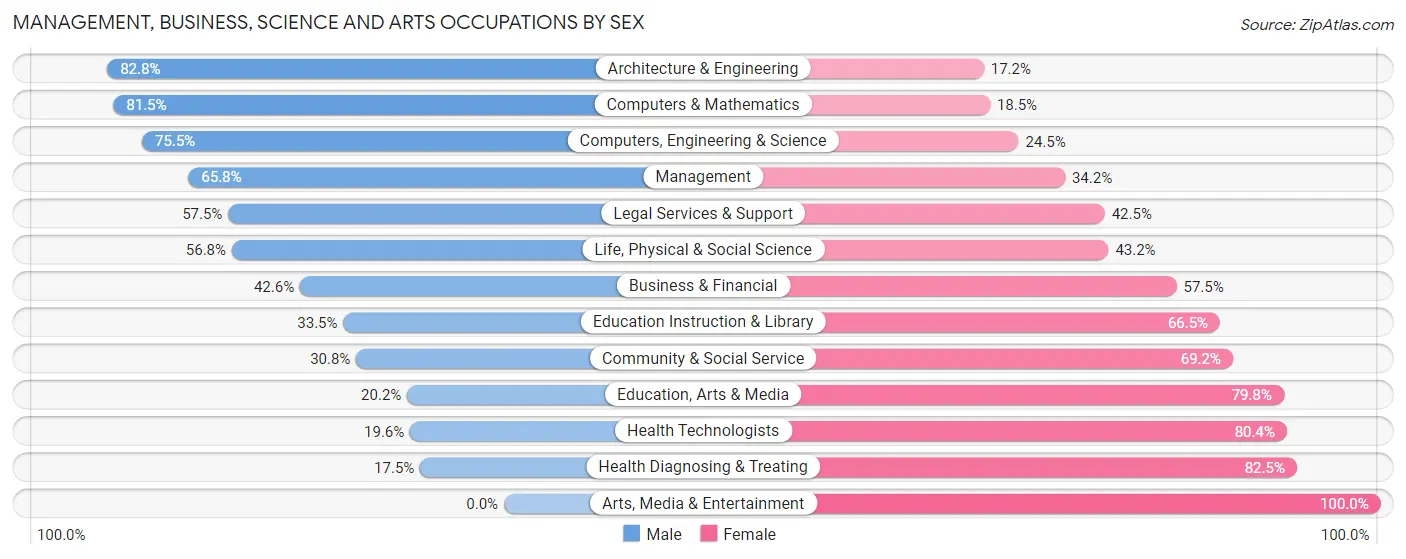
Management, Business, Science and Arts Occupations by Sex
Within the Management, Business, Science and Arts occupations in South Daytona, the most male-oriented occupations are Architecture & Engineering (82.8%), Computers & Mathematics (81.5%), and Computers, Engineering & Science (75.5%), while the most female-oriented occupations are Arts, Media & Entertainment (100.0%), Health Diagnosing & Treating (82.5%), and Health Technologists (80.4%).
| Occupation | Male | Female |
| Management | 472 (65.8%) | 245 (34.2%) |
| Business & Financial | 80 (42.5%) | 108 (57.5%) |
| Computers, Engineering & Science | 111 (75.5%) | 36 (24.5%) |
| Computers & Mathematics | 66 (81.5%) | 15 (18.5%) |
| Architecture & Engineering | 24 (82.8%) | 5 (17.2%) |
| Life, Physical & Social Science | 21 (56.8%) | 16 (43.2%) |
| Community & Social Service | 189 (30.8%) | 424 (69.2%) |
| Education, Arts & Media | 20 (20.2%) | 79 (79.8%) |
| Legal Services & Support | 42 (57.5%) | 31 (42.5%) |
| Education Instruction & Library | 127 (33.5%) | 252 (66.5%) |
| Arts, Media & Entertainment | 0 (0.0%) | 62 (100.0%) |
| Health Diagnosing & Treating | 53 (17.5%) | 250 (82.5%) |
| Health Technologists | 28 (19.6%) | 115 (80.4%) |
| Total (Category) | 905 (46.0%) | 1,063 (54.0%) |
| Total (Overall) | 2,976 (49.5%) | 3,031 (50.5%) |
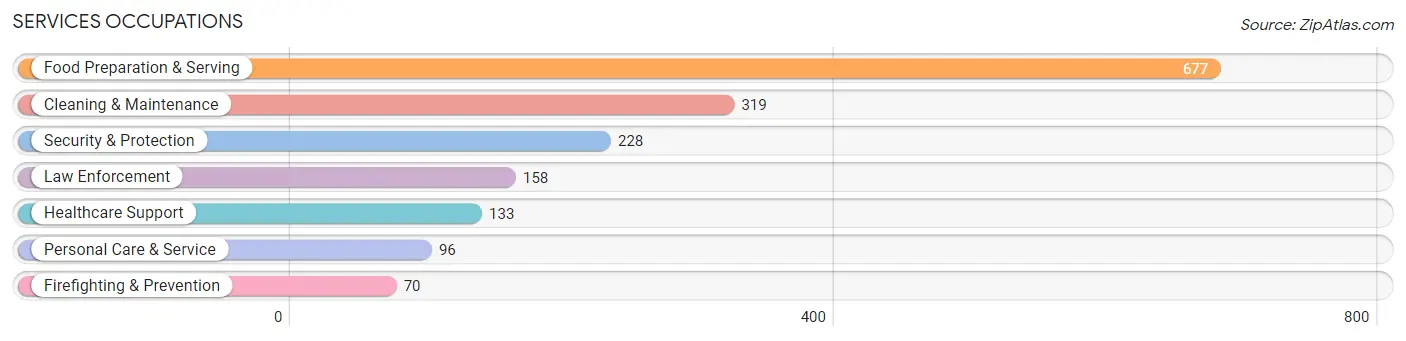
Services Occupations
The most common Services occupations in South Daytona are Food Preparation & Serving (677 | 11.3%), Cleaning & Maintenance (319 | 5.3%), Security & Protection (228 | 3.8%), Law Enforcement (158 | 2.6%), and Healthcare Support (133 | 2.2%).
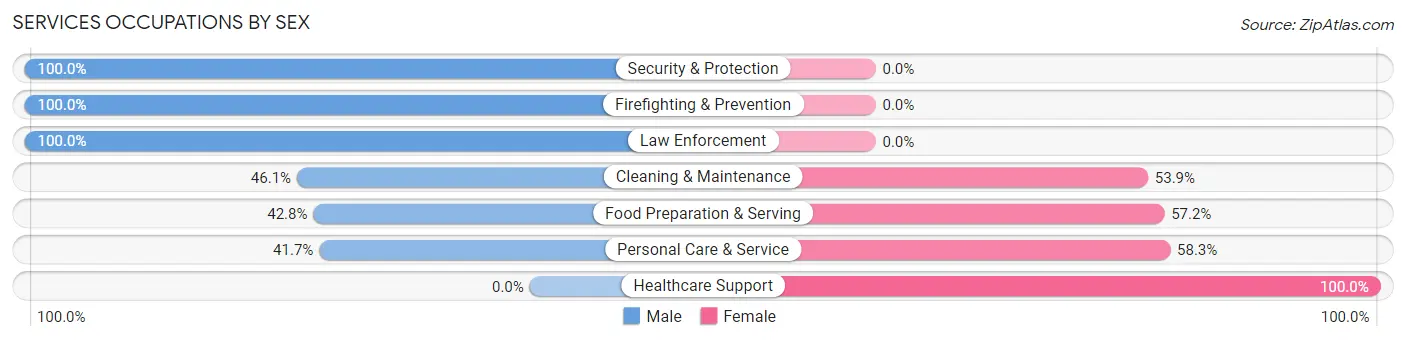
Services Occupations by Sex
Within the Services occupations in South Daytona, the most male-oriented occupations are Security & Protection (100.0%), Firefighting & Prevention (100.0%), and Law Enforcement (100.0%), while the most female-oriented occupations are Healthcare Support (100.0%), Personal Care & Service (58.3%), and Food Preparation & Serving (57.2%).
| Occupation | Male | Female |
| Healthcare Support | 0 (0.0%) | 133 (100.0%) |
| Security & Protection | 228 (100.0%) | 0 (0.0%) |
| Firefighting & Prevention | 70 (100.0%) | 0 (0.0%) |
| Law Enforcement | 158 (100.0%) | 0 (0.0%) |
| Food Preparation & Serving | 290 (42.8%) | 387 (57.2%) |
| Cleaning & Maintenance | 147 (46.1%) | 172 (53.9%) |
| Personal Care & Service | 40 (41.7%) | 56 (58.3%) |
| Total (Category) | 705 (48.5%) | 748 (51.5%) |
| Total (Overall) | 2,976 (49.5%) | 3,031 (50.5%) |
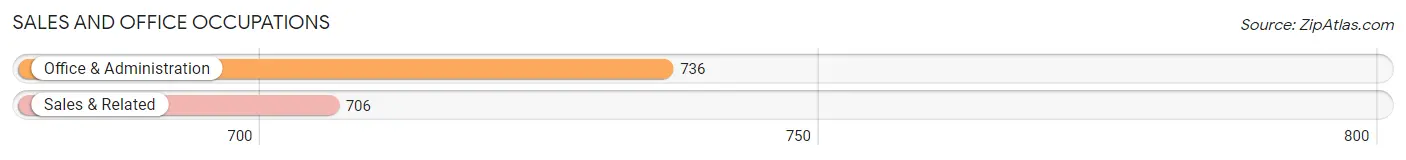
Sales and Office Occupations
The most common Sales and Office occupations in South Daytona are Office & Administration (736 | 12.2%), and Sales & Related (706 | 11.7%).
Sales and Office Occupations by Sex
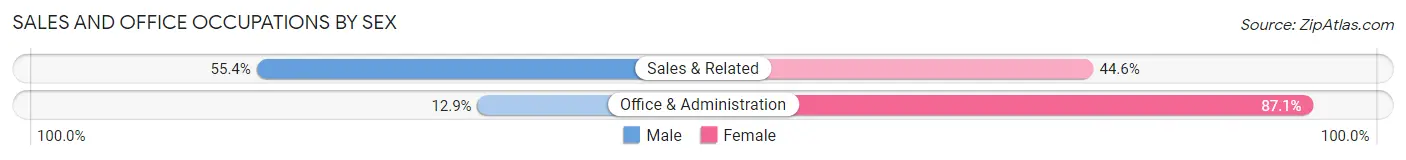
| Occupation | Male | Female |
| Sales & Related | 391 (55.4%) | 315 (44.6%) |
| Office & Administration | 95 (12.9%) | 641 (87.1%) |
| Total (Category) | 486 (33.7%) | 956 (66.3%) |
| Total (Overall) | 2,976 (49.5%) | 3,031 (50.5%) |
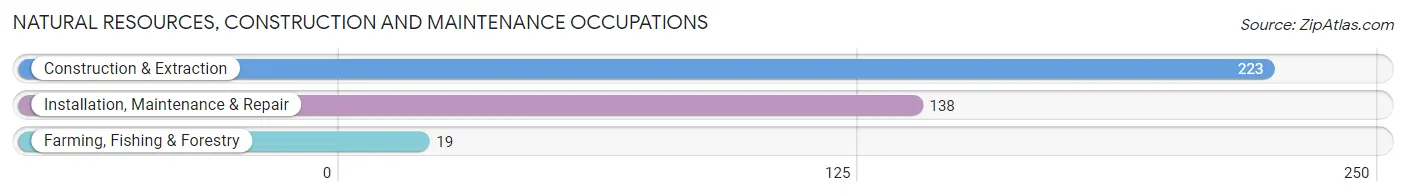
Natural Resources, Construction and Maintenance Occupations
The most common Natural Resources, Construction and Maintenance occupations in South Daytona are Construction & Extraction (223 | 3.7%), Installation, Maintenance & Repair (138 | 2.3%), and Farming, Fishing & Forestry (19 | 0.3%).
Natural Resources, Construction and Maintenance Occupations by Sex
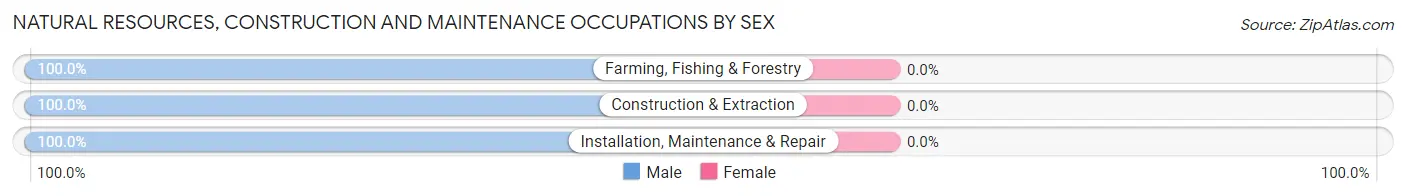
| Occupation | Male | Female |
| Farming, Fishing & Forestry | 19 (100.0%) | 0 (0.0%) |
| Construction & Extraction | 223 (100.0%) | 0 (0.0%) |
| Installation, Maintenance & Repair | 138 (100.0%) | 0 (0.0%) |
| Total (Category) | 380 (100.0%) | 0 (0.0%) |
| Total (Overall) | 2,976 (49.5%) | 3,031 (50.5%) |
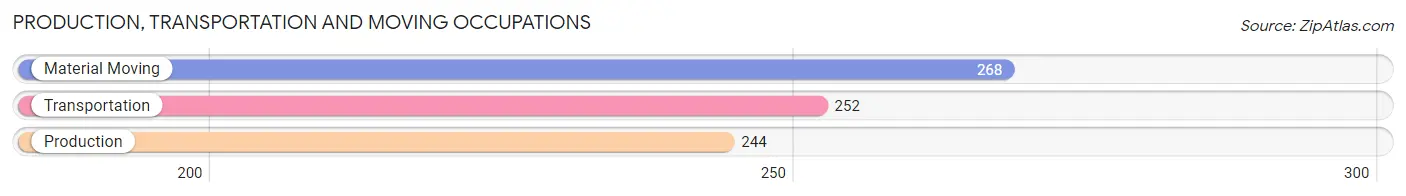
Production, Transportation and Moving Occupations
The most common Production, Transportation and Moving occupations in South Daytona are Material Moving (268 | 4.5%), Transportation (252 | 4.2%), and Production (244 | 4.1%).
Production, Transportation and Moving Occupations by Sex
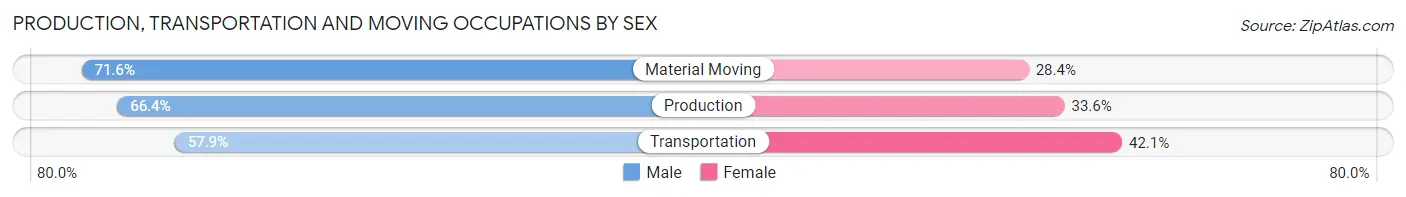
| Occupation | Male | Female |
| Production | 162 (66.4%) | 82 (33.6%) |
| Transportation | 146 (57.9%) | 106 (42.1%) |
| Material Moving | 192 (71.6%) | 76 (28.4%) |
| Total (Category) | 500 (65.4%) | 264 (34.5%) |
| Total (Overall) | 2,976 (49.5%) | 3,031 (50.5%) |
Employment Industries by Sex in South Daytona
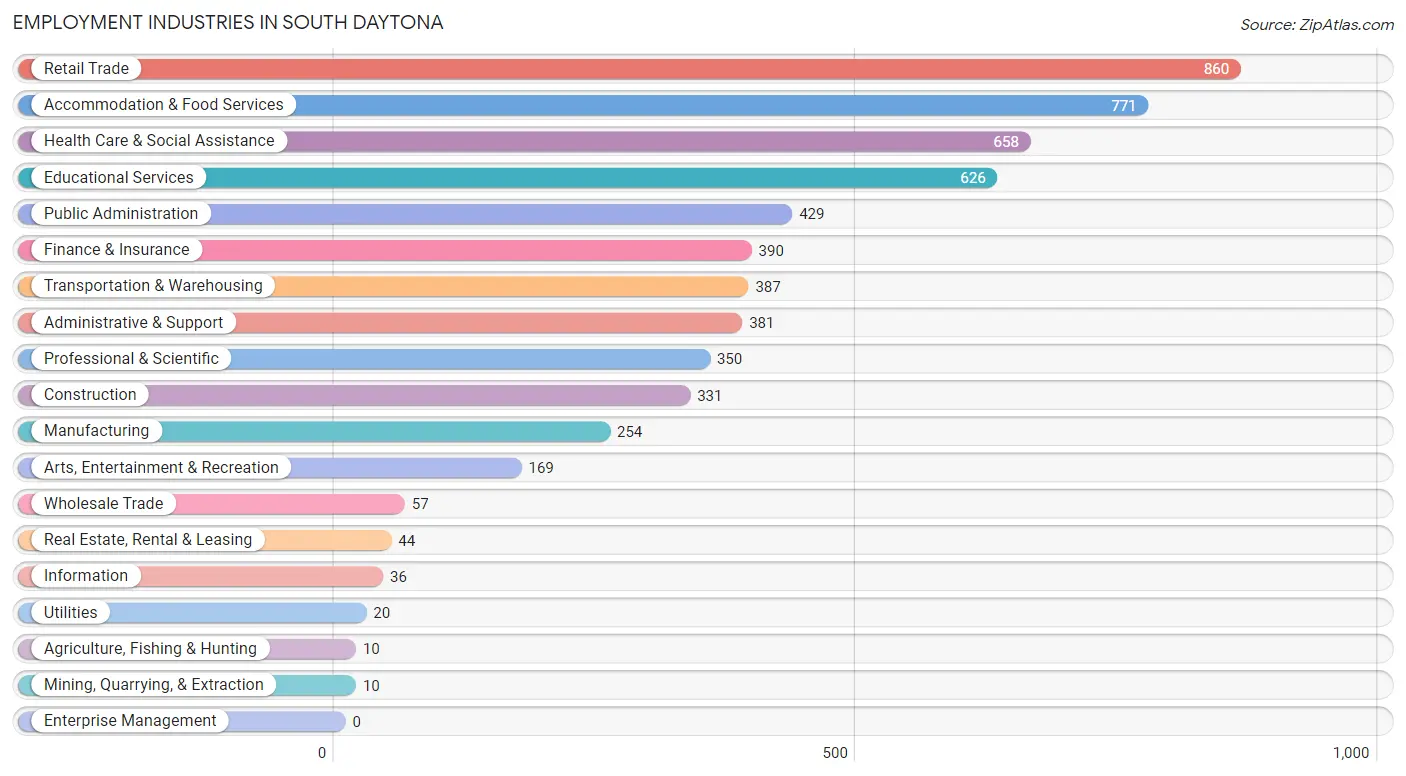
Employment Industries in South Daytona
The major employment industries in South Daytona include Retail Trade (860 | 14.3%), Accommodation & Food Services (771 | 12.8%), Health Care & Social Assistance (658 | 11.0%), Educational Services (626 | 10.4%), and Public Administration (429 | 7.1%).
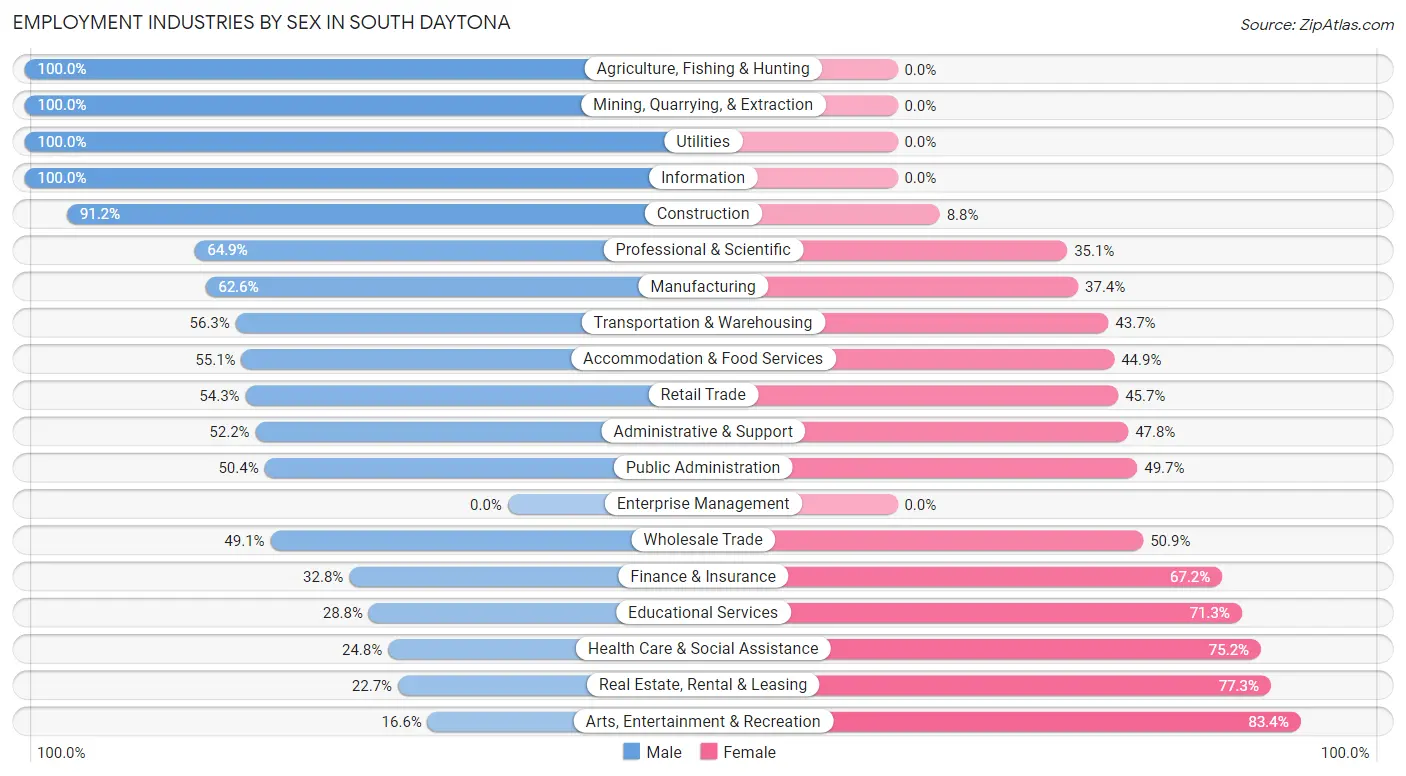
Employment Industries by Sex in South Daytona
The South Daytona industries that see more men than women are Agriculture, Fishing & Hunting (100.0%), Mining, Quarrying, & Extraction (100.0%), and Utilities (100.0%), whereas the industries that tend to have a higher number of women are Arts, Entertainment & Recreation (83.4%), Real Estate, Rental & Leasing (77.3%), and Health Care & Social Assistance (75.2%).
| Industry | Male | Female |
| Agriculture, Fishing & Hunting | 10 (100.0%) | 0 (0.0%) |
| Mining, Quarrying, & Extraction | 10 (100.0%) | 0 (0.0%) |
| Construction | 302 (91.2%) | 29 (8.8%) |
| Manufacturing | 159 (62.6%) | 95 (37.4%) |
| Wholesale Trade | 28 (49.1%) | 29 (50.9%) |
| Retail Trade | 467 (54.3%) | 393 (45.7%) |
| Transportation & Warehousing | 218 (56.3%) | 169 (43.7%) |
| Utilities | 20 (100.0%) | 0 (0.0%) |
| Information | 36 (100.0%) | 0 (0.0%) |
| Finance & Insurance | 128 (32.8%) | 262 (67.2%) |
| Real Estate, Rental & Leasing | 10 (22.7%) | 34 (77.3%) |
| Professional & Scientific | 227 (64.9%) | 123 (35.1%) |
| Enterprise Management | 0 (0.0%) | 0 (0.0%) |
| Administrative & Support | 199 (52.2%) | 182 (47.8%) |
| Educational Services | 180 (28.7%) | 446 (71.3%) |
| Health Care & Social Assistance | 163 (24.8%) | 495 (75.2%) |
| Arts, Entertainment & Recreation | 28 (16.6%) | 141 (83.4%) |
| Accommodation & Food Services | 425 (55.1%) | 346 (44.9%) |
| Public Administration | 216 (50.3%) | 213 (49.6%) |
| Total | 2,976 (49.5%) | 3,031 (50.5%) |
Education in South Daytona
School Enrollment in South Daytona
The most common levels of schooling among the 2,315 students in South Daytona are high school (551 | 23.8%), elementary school (505 | 21.8%), and college / undergraduate (501 | 21.6%).
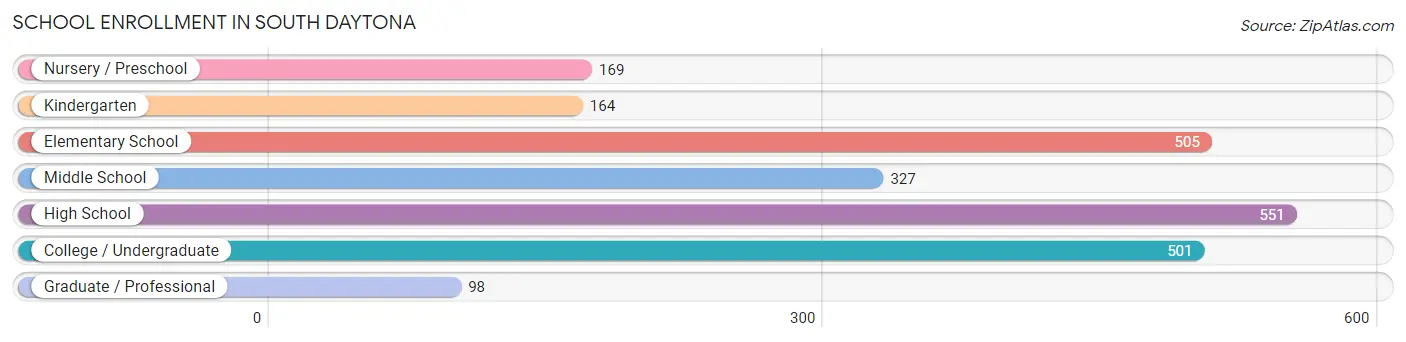
| School Level | # Students | % Students |
| Nursery / Preschool | 169 | 7.3% |
| Kindergarten | 164 | 7.1% |
| Elementary School | 505 | 21.8% |
| Middle School | 327 | 14.1% |
| High School | 551 | 23.8% |
| College / Undergraduate | 501 | 21.6% |
| Graduate / Professional | 98 | 4.2% |
| Total | 2,315 | 100.0% |
School Enrollment by Age by Funding Source in South Daytona
Out of a total of 2,315 students who are enrolled in schools in South Daytona, 560 (24.2%) attend a private institution, while the remaining 1,755 (75.8%) are enrolled in public schools. The age group of 35 years and over has the highest likelihood of being enrolled in private schools, with 58 (43.6% in the age bracket) enrolled. Conversely, the age group of 3 to 4 year olds has the lowest likelihood of being enrolled in a private school, with 105 (100.0% in the age bracket) attending a public institution.
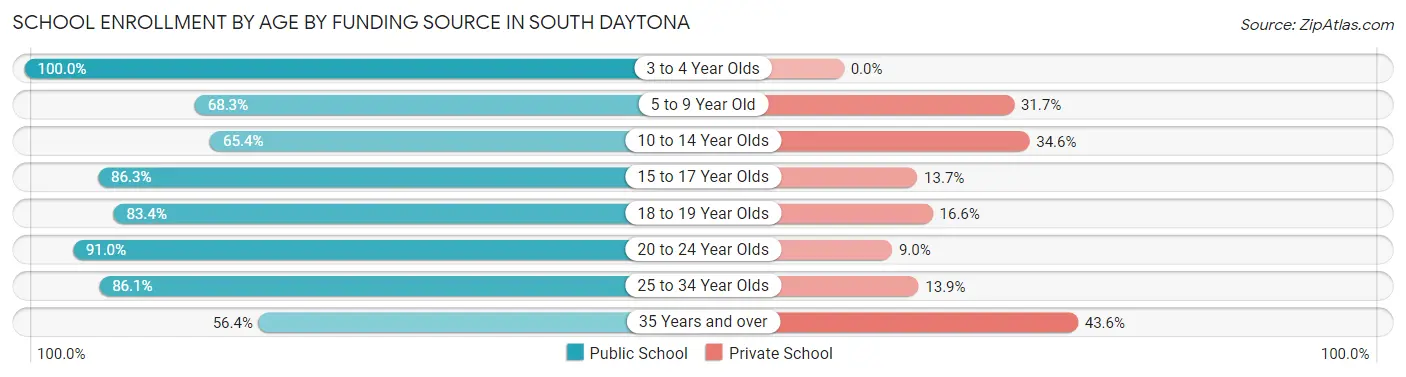
| Age Bracket | Public School | Private School |
| 3 to 4 Year Olds | 105 (100.0%) | 0 (0.0%) |
| 5 to 9 Year Old | 493 (68.3%) | 229 (31.7%) |
| 10 to 14 Year Olds | 301 (65.4%) | 159 (34.6%) |
| 15 to 17 Year Olds | 271 (86.3%) | 43 (13.7%) |
| 18 to 19 Year Olds | 136 (83.4%) | 27 (16.6%) |
| 20 to 24 Year Olds | 243 (91.0%) | 24 (9.0%) |
| 25 to 34 Year Olds | 130 (86.1%) | 21 (13.9%) |
| 35 Years and over | 75 (56.4%) | 58 (43.6%) |
| Total | 1,755 (75.8%) | 560 (24.2%) |
Educational Attainment by Field of Study in South Daytona
Business (504 | 20.1%), education (319 | 12.7%), arts & humanities (300 | 12.0%), science & technology (231 | 9.2%), and visual & performing arts (225 | 9.0%) are the most common fields of study among 2,507 individuals in South Daytona who have obtained a bachelor's degree or higher.
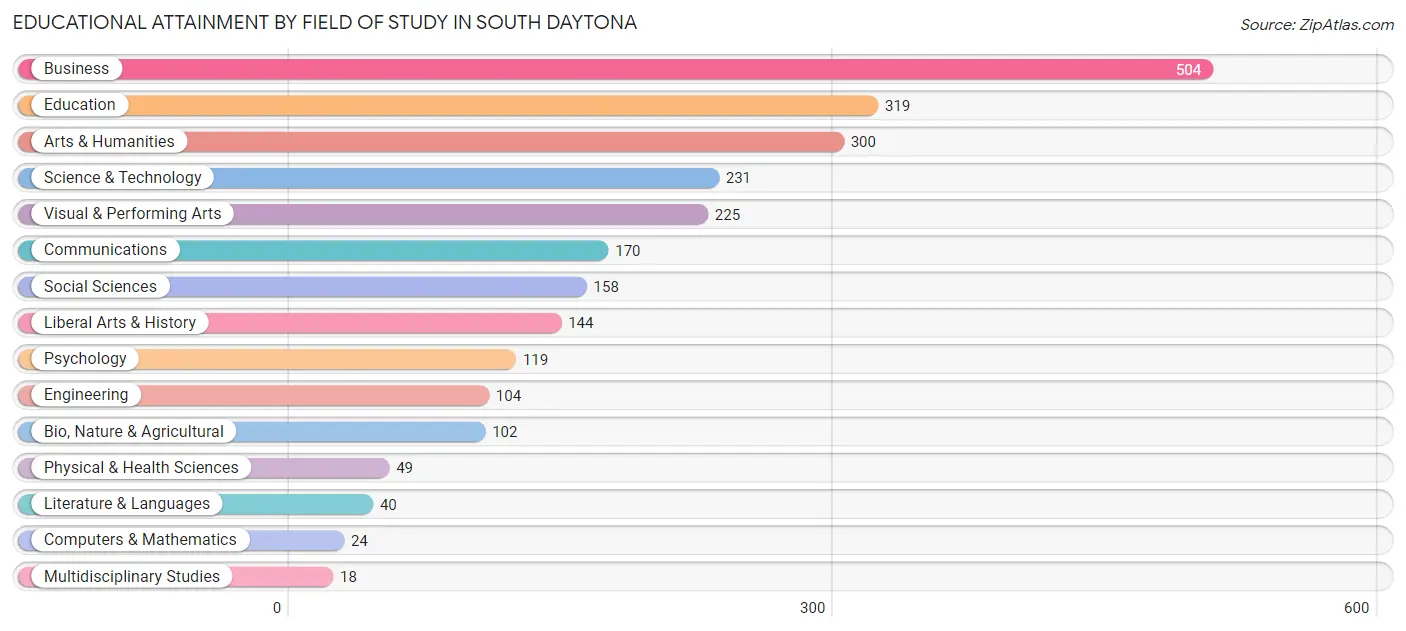
| Field of Study | # Graduates | % Graduates |
| Computers & Mathematics | 24 | 1.0% |
| Bio, Nature & Agricultural | 102 | 4.1% |
| Physical & Health Sciences | 49 | 1.9% |
| Psychology | 119 | 4.8% |
| Social Sciences | 158 | 6.3% |
| Engineering | 104 | 4.2% |
| Multidisciplinary Studies | 18 | 0.7% |
| Science & Technology | 231 | 9.2% |
| Business | 504 | 20.1% |
| Education | 319 | 12.7% |
| Literature & Languages | 40 | 1.6% |
| Liberal Arts & History | 144 | 5.7% |
| Visual & Performing Arts | 225 | 9.0% |
| Communications | 170 | 6.8% |
| Arts & Humanities | 300 | 12.0% |
| Total | 2,507 | 100.0% |
Transportation & Commute in South Daytona
Vehicle Availability by Sex in South Daytona
The most prevalent vehicle ownership categories in South Daytona are males with 2 vehicles (1,396, accounting for 48.2%) and females with 2 vehicles (1,278, making up 46.3%).
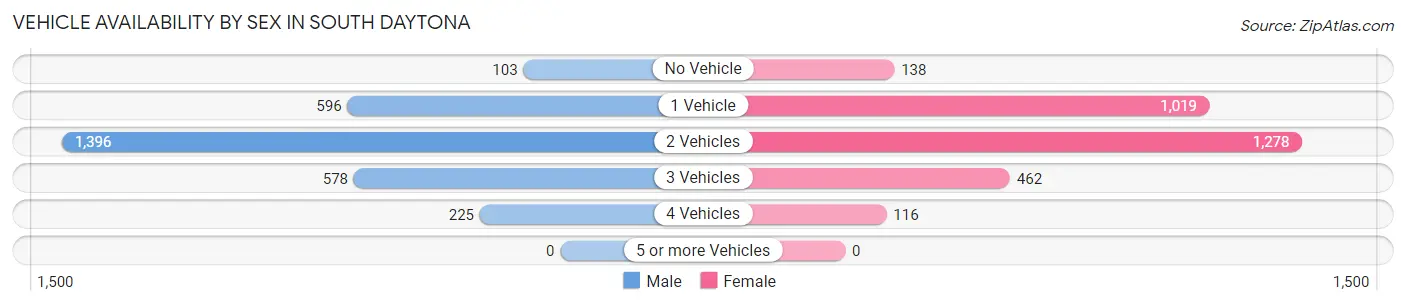
| Vehicles Available | Male | Female |
| No Vehicle | 103 (3.5%) | 138 (4.6%) |
| 1 Vehicle | 596 (20.6%) | 1,019 (33.8%) |
| 2 Vehicles | 1,396 (48.2%) | 1,278 (42.4%) |
| 3 Vehicles | 578 (19.9%) | 462 (15.3%) |
| 4 Vehicles | 225 (7.8%) | 116 (3.8%) |
| 5 or more Vehicles | 0 (0.0%) | 0 (0.0%) |
| Total | 2,898 (100.0%) | 3,013 (100.0%) |
Commute Time in South Daytona
The most frequently occuring commute durations in South Daytona are 10 to 14 minutes (1,318 commuters, 24.3%), 15 to 19 minutes (1,293 commuters, 23.9%), and 20 to 24 minutes (662 commuters, 12.2%).
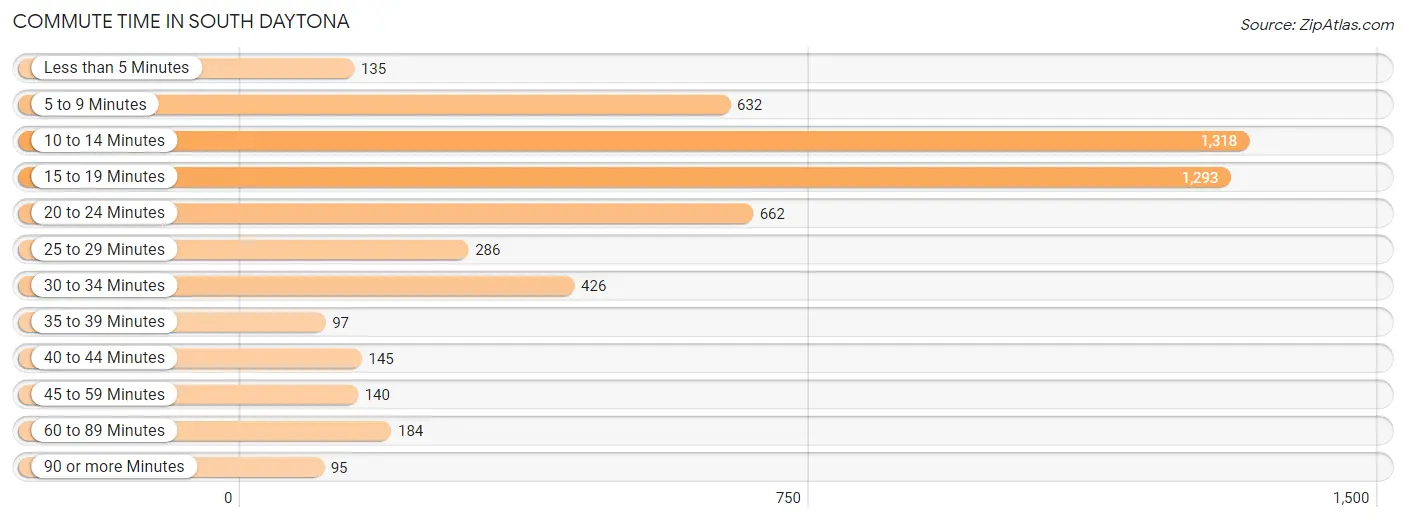
| Commute Time | # Commuters | % Commuters |
| Less than 5 Minutes | 135 | 2.5% |
| 5 to 9 Minutes | 632 | 11.7% |
| 10 to 14 Minutes | 1,318 | 24.3% |
| 15 to 19 Minutes | 1,293 | 23.9% |
| 20 to 24 Minutes | 662 | 12.2% |
| 25 to 29 Minutes | 286 | 5.3% |
| 30 to 34 Minutes | 426 | 7.9% |
| 35 to 39 Minutes | 97 | 1.8% |
| 40 to 44 Minutes | 145 | 2.7% |
| 45 to 59 Minutes | 140 | 2.6% |
| 60 to 89 Minutes | 184 | 3.4% |
| 90 or more Minutes | 95 | 1.8% |
Commute Time by Sex in South Daytona
The most common commute times in South Daytona are 10 to 14 minutes (832 commuters, 31.4%) for males and 15 to 19 minutes (803 commuters, 29.1%) for females.
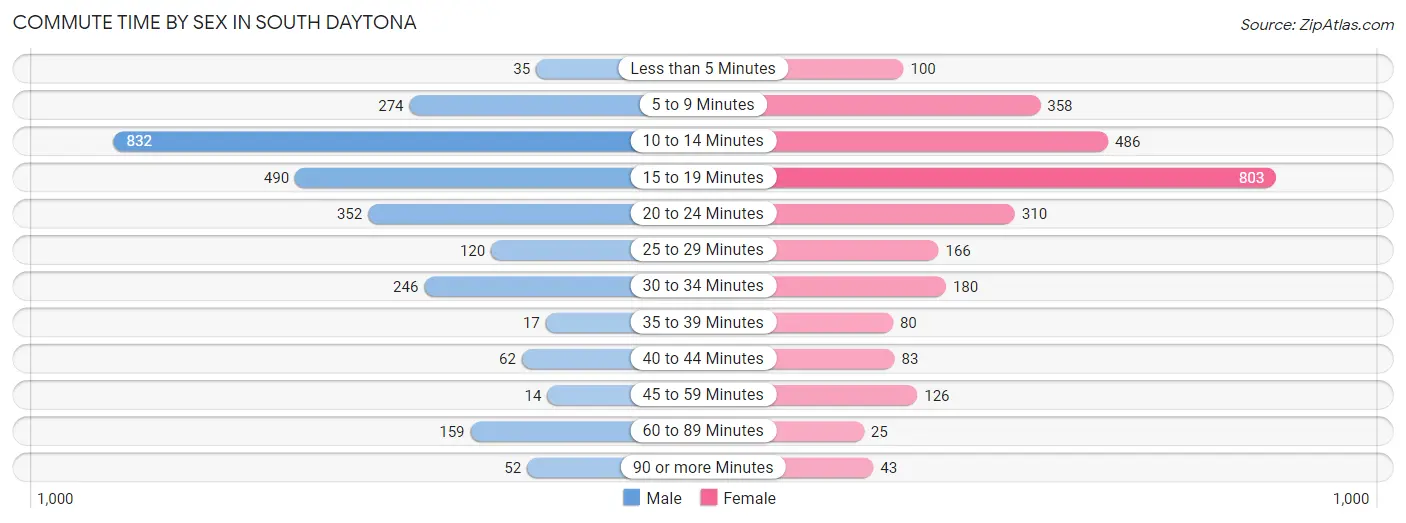
| Commute Time | Male | Female |
| Less than 5 Minutes | 35 (1.3%) | 100 (3.6%) |
| 5 to 9 Minutes | 274 (10.3%) | 358 (13.0%) |
| 10 to 14 Minutes | 832 (31.4%) | 486 (17.6%) |
| 15 to 19 Minutes | 490 (18.5%) | 803 (29.1%) |
| 20 to 24 Minutes | 352 (13.3%) | 310 (11.2%) |
| 25 to 29 Minutes | 120 (4.5%) | 166 (6.0%) |
| 30 to 34 Minutes | 246 (9.3%) | 180 (6.5%) |
| 35 to 39 Minutes | 17 (0.6%) | 80 (2.9%) |
| 40 to 44 Minutes | 62 (2.3%) | 83 (3.0%) |
| 45 to 59 Minutes | 14 (0.5%) | 126 (4.6%) |
| 60 to 89 Minutes | 159 (6.0%) | 25 (0.9%) |
| 90 or more Minutes | 52 (2.0%) | 43 (1.6%) |
Time of Departure to Work by Sex in South Daytona
The most frequent times of departure to work in South Daytona are 7:00 AM to 7:29 AM (447, 16.9%) for males and 7:00 AM to 7:29 AM (529, 19.2%) for females.
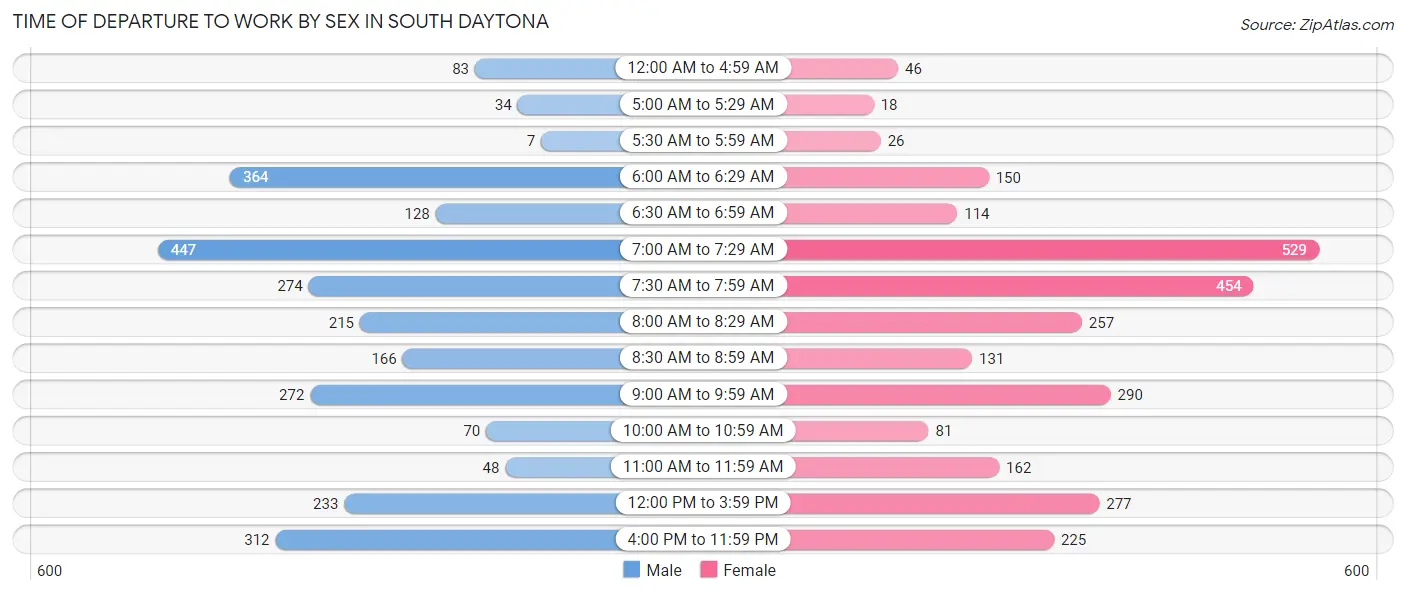
| Time of Departure | Male | Female |
| 12:00 AM to 4:59 AM | 83 (3.1%) | 46 (1.7%) |
| 5:00 AM to 5:29 AM | 34 (1.3%) | 18 (0.6%) |
| 5:30 AM to 5:59 AM | 7 (0.3%) | 26 (0.9%) |
| 6:00 AM to 6:29 AM | 364 (13.7%) | 150 (5.4%) |
| 6:30 AM to 6:59 AM | 128 (4.8%) | 114 (4.1%) |
| 7:00 AM to 7:29 AM | 447 (16.9%) | 529 (19.2%) |
| 7:30 AM to 7:59 AM | 274 (10.3%) | 454 (16.5%) |
| 8:00 AM to 8:29 AM | 215 (8.1%) | 257 (9.3%) |
| 8:30 AM to 8:59 AM | 166 (6.3%) | 131 (4.8%) |
| 9:00 AM to 9:59 AM | 272 (10.2%) | 290 (10.5%) |
| 10:00 AM to 10:59 AM | 70 (2.6%) | 81 (2.9%) |
| 11:00 AM to 11:59 AM | 48 (1.8%) | 162 (5.9%) |
| 12:00 PM to 3:59 PM | 233 (8.8%) | 277 (10.0%) |
| 4:00 PM to 11:59 PM | 312 (11.8%) | 225 (8.2%) |
| Total | 2,653 (100.0%) | 2,760 (100.0%) |
Housing Occupancy in South Daytona
Occupancy by Ownership in South Daytona
Of the total 5,930 dwellings in South Daytona, owner-occupied units account for 3,798 (64.0%), while renter-occupied units make up 2,132 (35.9%).
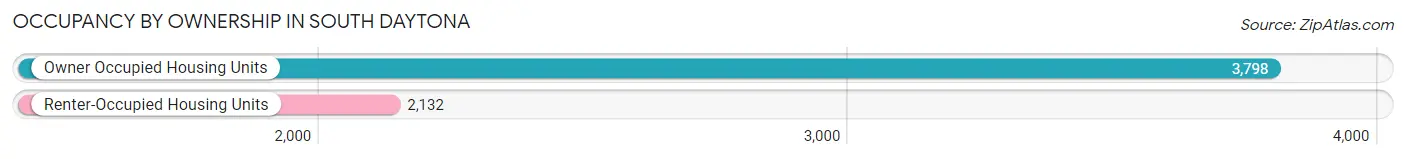
| Occupancy | # Housing Units | % Housing Units |
| Owner Occupied Housing Units | 3,798 | 64.0% |
| Renter-Occupied Housing Units | 2,132 | 35.9% |
| Total Occupied Housing Units | 5,930 | 100.0% |
Occupancy by Household Size in South Daytona
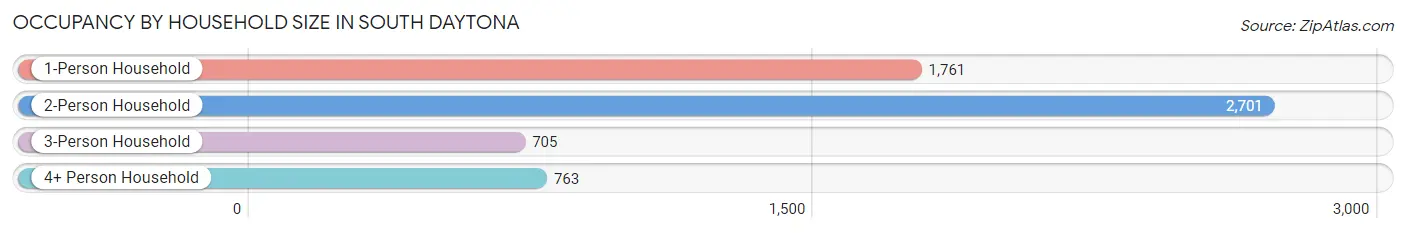
| Household Size | # Housing Units | % Housing Units |
| 1-Person Household | 1,761 | 29.7% |
| 2-Person Household | 2,701 | 45.6% |
| 3-Person Household | 705 | 11.9% |
| 4+ Person Household | 763 | 12.9% |
| Total Housing Units | 5,930 | 100.0% |
Occupancy by Ownership by Household Size in South Daytona
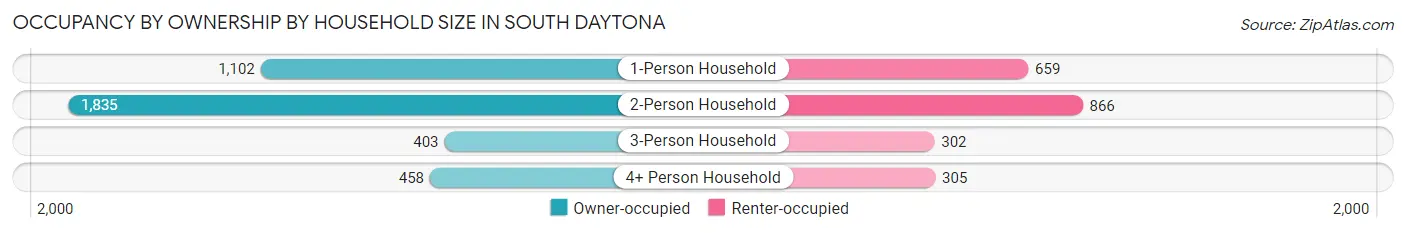
| Household Size | Owner-occupied | Renter-occupied |
| 1-Person Household | 1,102 (62.6%) | 659 (37.4%) |
| 2-Person Household | 1,835 (67.9%) | 866 (32.1%) |
| 3-Person Household | 403 (57.2%) | 302 (42.8%) |
| 4+ Person Household | 458 (60.0%) | 305 (40.0%) |
| Total Housing Units | 3,798 (64.0%) | 2,132 (35.9%) |
Occupancy by Educational Attainment in South Daytona
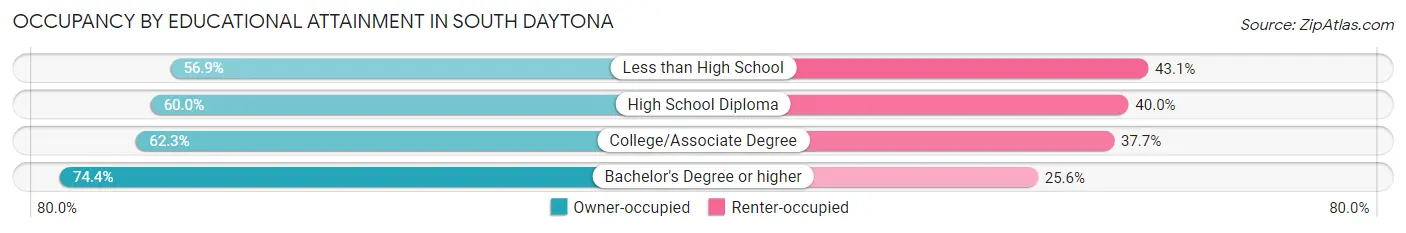
| Household Size | Owner-occupied | Renter-occupied |
| Less than High School | 348 (56.9%) | 264 (43.1%) |
| High School Diploma | 1,000 (60.0%) | 667 (40.0%) |
| College/Associate Degree | 1,365 (62.3%) | 827 (37.7%) |
| Bachelor's Degree or higher | 1,085 (74.4%) | 374 (25.6%) |
Occupancy by Age of Householder in South Daytona
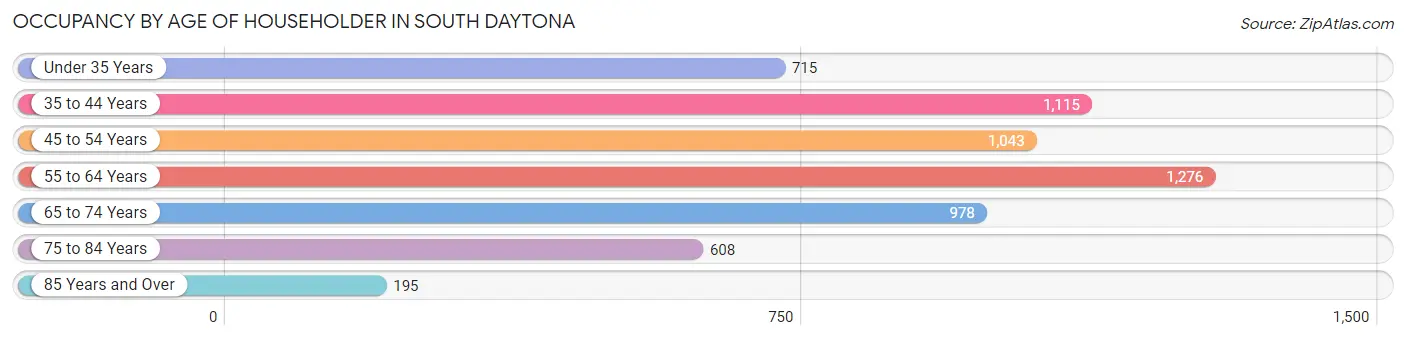
| Age Bracket | # Households | % Households |
| Under 35 Years | 715 | 12.1% |
| 35 to 44 Years | 1,115 | 18.8% |
| 45 to 54 Years | 1,043 | 17.6% |
| 55 to 64 Years | 1,276 | 21.5% |
| 65 to 74 Years | 978 | 16.5% |
| 75 to 84 Years | 608 | 10.2% |
| 85 Years and Over | 195 | 3.3% |
| Total | 5,930 | 100.0% |
Housing Finances in South Daytona
Median Income by Occupancy in South Daytona
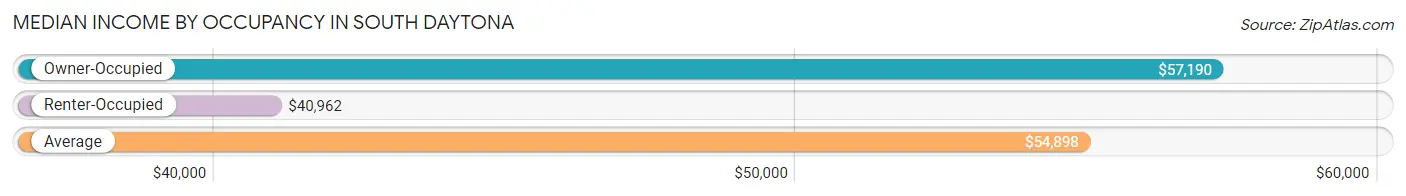
| Occupancy Type | # Households | Median Income |
| Owner-Occupied | 3,798 (64.0%) | $57,190 |
| Renter-Occupied | 2,132 (35.9%) | $40,962 |
| Average | 5,930 (100.0%) | $54,898 |
Occupancy by Householder Income Bracket in South Daytona
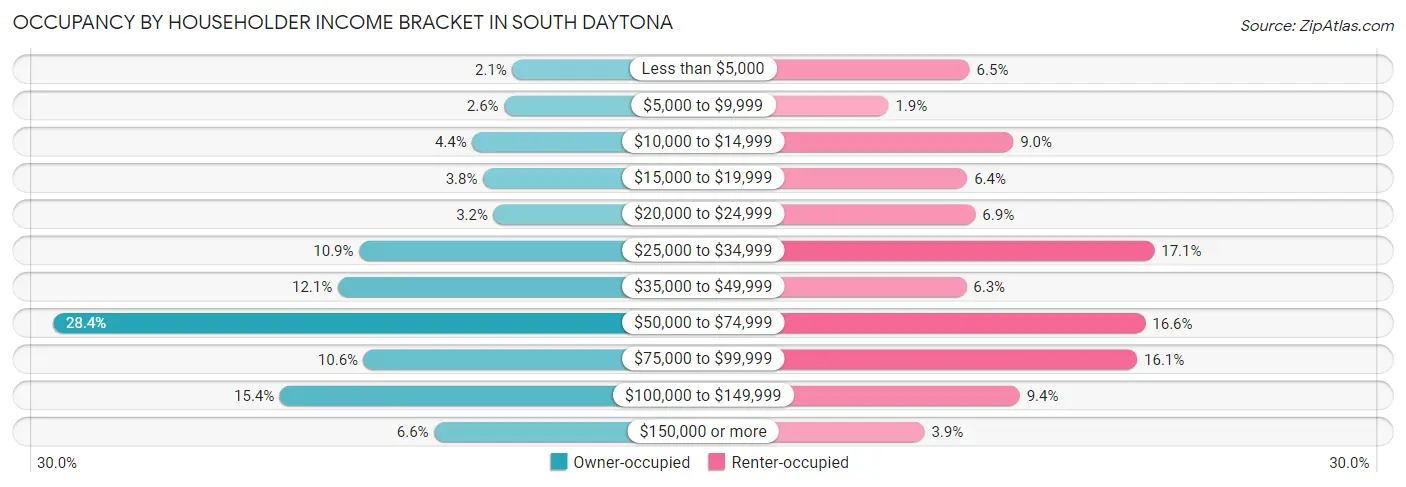
| Income Bracket | Owner-occupied | Renter-occupied |
| Less than $5,000 | 80 (2.1%) | 139 (6.5%) |
| $5,000 to $9,999 | 98 (2.6%) | 40 (1.9%) |
| $10,000 to $14,999 | 167 (4.4%) | 192 (9.0%) |
| $15,000 to $19,999 | 144 (3.8%) | 136 (6.4%) |
| $20,000 to $24,999 | 121 (3.2%) | 146 (6.9%) |
| $25,000 to $34,999 | 413 (10.9%) | 364 (17.1%) |
| $35,000 to $49,999 | 459 (12.1%) | 135 (6.3%) |
| $50,000 to $74,999 | 1,078 (28.4%) | 353 (16.6%) |
| $75,000 to $99,999 | 403 (10.6%) | 343 (16.1%) |
| $100,000 to $149,999 | 585 (15.4%) | 200 (9.4%) |
| $150,000 or more | 250 (6.6%) | 84 (3.9%) |
| Total | 3,798 (100.0%) | 2,132 (100.0%) |
Monthly Housing Cost Tiers in South Daytona
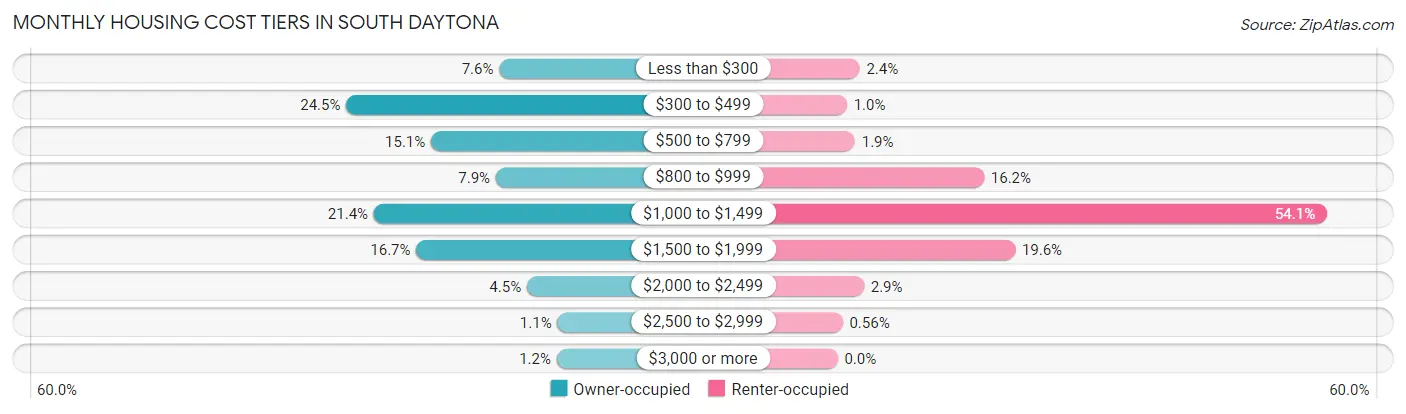
| Monthly Cost | Owner-occupied | Renter-occupied |
| Less than $300 | 287 (7.6%) | 52 (2.4%) |
| $300 to $499 | 929 (24.5%) | 22 (1.0%) |
| $500 to $799 | 573 (15.1%) | 41 (1.9%) |
| $800 to $999 | 301 (7.9%) | 345 (16.2%) |
| $1,000 to $1,499 | 813 (21.4%) | 1,153 (54.1%) |
| $1,500 to $1,999 | 635 (16.7%) | 418 (19.6%) |
| $2,000 to $2,499 | 171 (4.5%) | 62 (2.9%) |
| $2,500 to $2,999 | 43 (1.1%) | 12 (0.6%) |
| $3,000 or more | 46 (1.2%) | 0 (0.0%) |
| Total | 3,798 (100.0%) | 2,132 (100.0%) |
Physical Housing Characteristics in South Daytona
Housing Structures in South Daytona
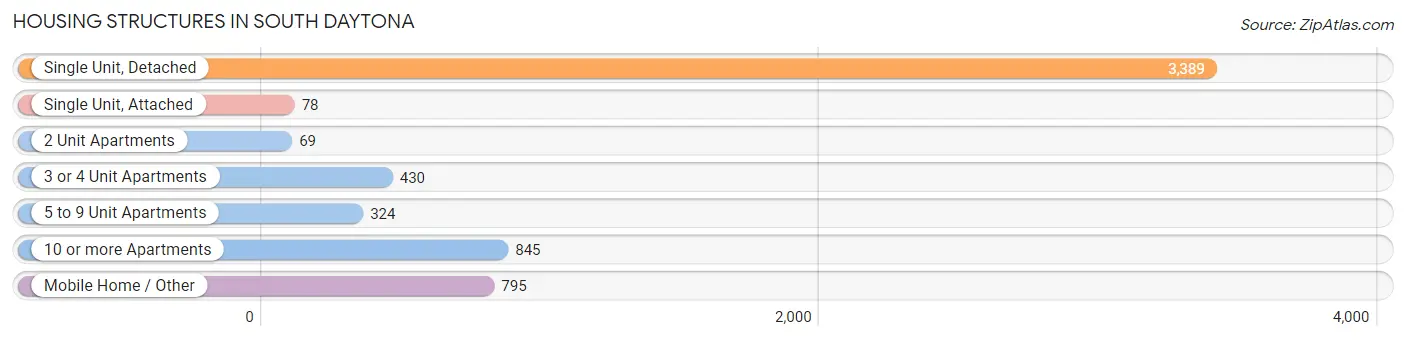
| Structure Type | # Housing Units | % Housing Units |
| Single Unit, Detached | 3,389 | 57.2% |
| Single Unit, Attached | 78 | 1.3% |
| 2 Unit Apartments | 69 | 1.2% |
| 3 or 4 Unit Apartments | 430 | 7.2% |
| 5 to 9 Unit Apartments | 324 | 5.5% |
| 10 or more Apartments | 845 | 14.2% |
| Mobile Home / Other | 795 | 13.4% |
| Total | 5,930 | 100.0% |
Housing Structures by Occupancy in South Daytona
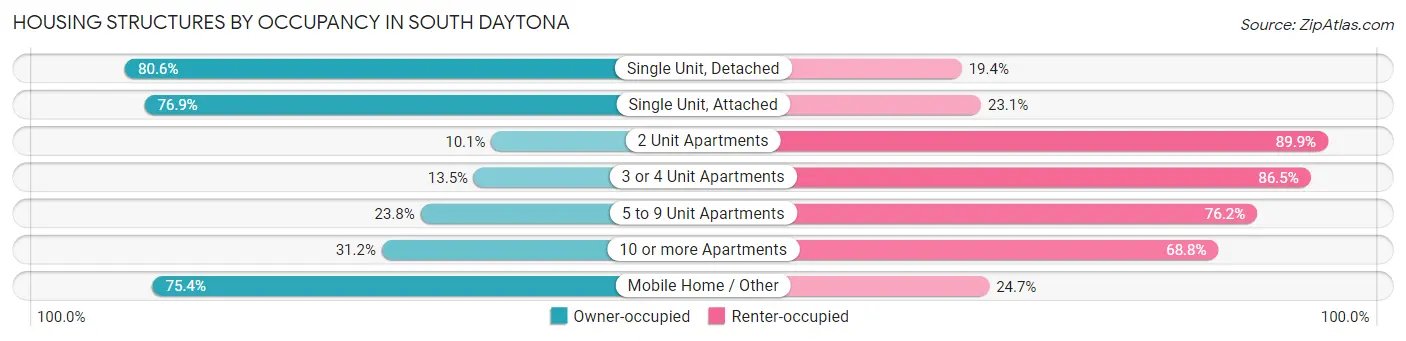
| Structure Type | Owner-occupied | Renter-occupied |
| Single Unit, Detached | 2,733 (80.6%) | 656 (19.4%) |
| Single Unit, Attached | 60 (76.9%) | 18 (23.1%) |
| 2 Unit Apartments | 7 (10.1%) | 62 (89.9%) |
| 3 or 4 Unit Apartments | 58 (13.5%) | 372 (86.5%) |
| 5 to 9 Unit Apartments | 77 (23.8%) | 247 (76.2%) |
| 10 or more Apartments | 264 (31.2%) | 581 (68.8%) |
| Mobile Home / Other | 599 (75.3%) | 196 (24.6%) |
| Total | 3,798 (64.0%) | 2,132 (35.9%) |
Housing Structures by Number of Rooms in South Daytona
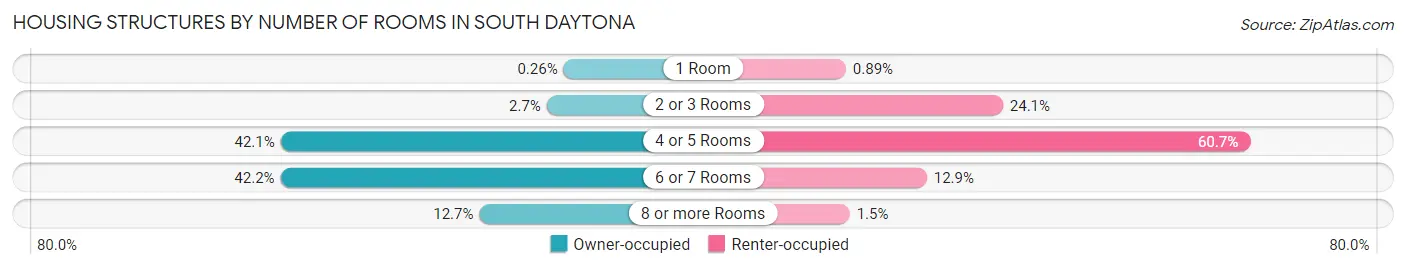
| Number of Rooms | Owner-occupied | Renter-occupied |
| 1 Room | 10 (0.3%) | 19 (0.9%) |
| 2 or 3 Rooms | 104 (2.7%) | 514 (24.1%) |
| 4 or 5 Rooms | 1,600 (42.1%) | 1,294 (60.7%) |
| 6 or 7 Rooms | 1,601 (42.1%) | 274 (12.9%) |
| 8 or more Rooms | 483 (12.7%) | 31 (1.5%) |
| Total | 3,798 (100.0%) | 2,132 (100.0%) |
Housing Structure by Heating Type in South Daytona
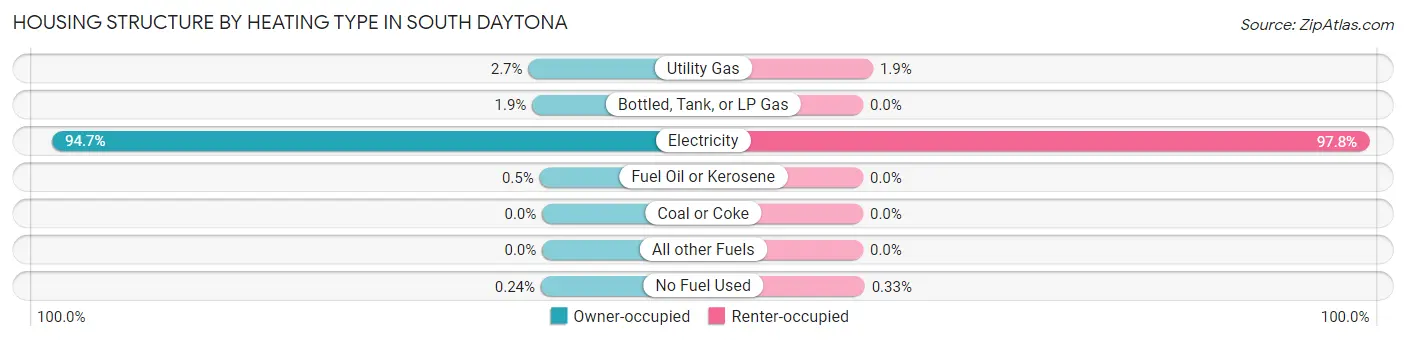
| Heating Type | Owner-occupied | Renter-occupied |
| Utility Gas | 101 (2.7%) | 41 (1.9%) |
| Bottled, Tank, or LP Gas | 73 (1.9%) | 0 (0.0%) |
| Electricity | 3,596 (94.7%) | 2,084 (97.8%) |
| Fuel Oil or Kerosene | 19 (0.5%) | 0 (0.0%) |
| Coal or Coke | 0 (0.0%) | 0 (0.0%) |
| All other Fuels | 0 (0.0%) | 0 (0.0%) |
| No Fuel Used | 9 (0.2%) | 7 (0.3%) |
| Total | 3,798 (100.0%) | 2,132 (100.0%) |
Household Vehicle Usage in South Daytona
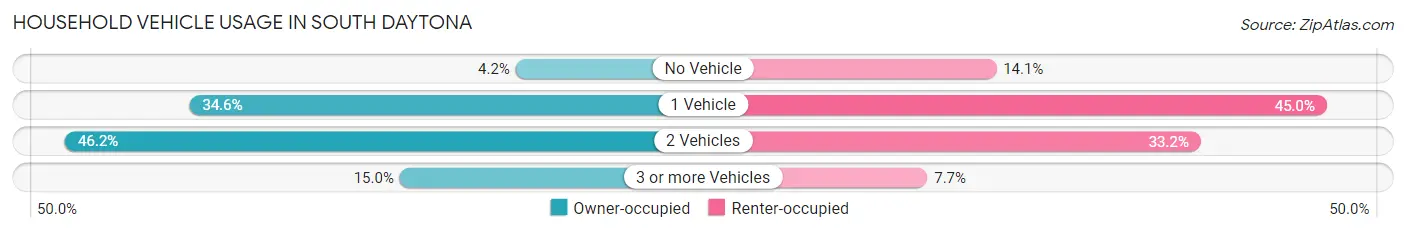
| Vehicles per Household | Owner-occupied | Renter-occupied |
| No Vehicle | 158 (4.2%) | 301 (14.1%) |
| 1 Vehicle | 1,315 (34.6%) | 959 (45.0%) |
| 2 Vehicles | 1,756 (46.2%) | 708 (33.2%) |
| 3 or more Vehicles | 569 (15.0%) | 164 (7.7%) |
| Total | 3,798 (100.0%) | 2,132 (100.0%) |
Real Estate & Mortgages in South Daytona
Real Estate and Mortgage Overview in South Daytona
| Characteristic | Without Mortgage | With Mortgage |
| Housing Units | 1,910 | 1,888 |
| Median Property Value | $132,000 | $228,300 |
| Median Household Income | $51,870 | $169 |
| Monthly Housing Costs | $439 | $36 |
| Real Estate Taxes | $1,356 | $98 |
Property Value by Mortgage Status in South Daytona
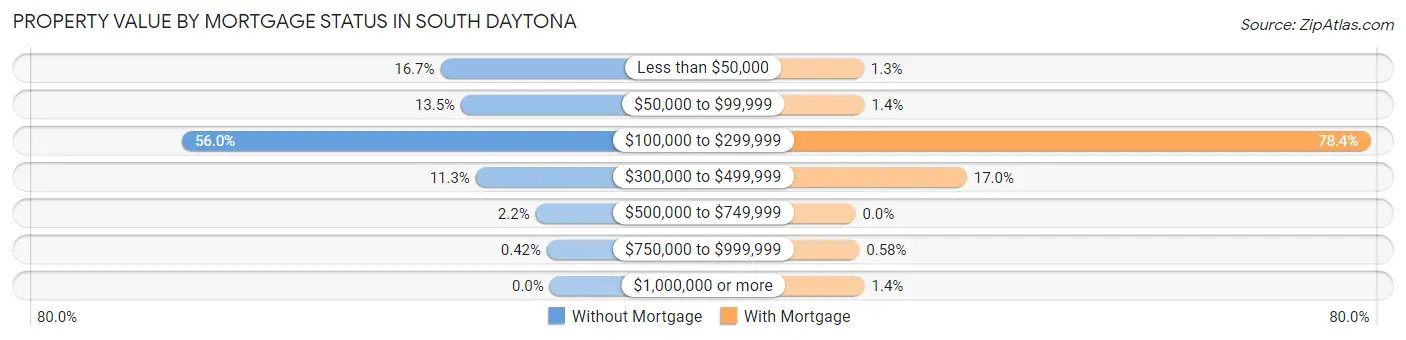
| Property Value | Without Mortgage | With Mortgage |
| Less than $50,000 | 318 (16.7%) | 24 (1.3%) |
| $50,000 to $99,999 | 258 (13.5%) | 26 (1.4%) |
| $100,000 to $299,999 | 1,070 (56.0%) | 1,481 (78.4%) |
| $300,000 to $499,999 | 215 (11.3%) | 320 (17.0%) |
| $500,000 to $749,999 | 41 (2.1%) | 0 (0.0%) |
| $750,000 to $999,999 | 8 (0.4%) | 11 (0.6%) |
| $1,000,000 or more | 0 (0.0%) | 26 (1.4%) |
| Total | 1,910 (100.0%) | 1,888 (100.0%) |
Household Income by Mortgage Status in South Daytona
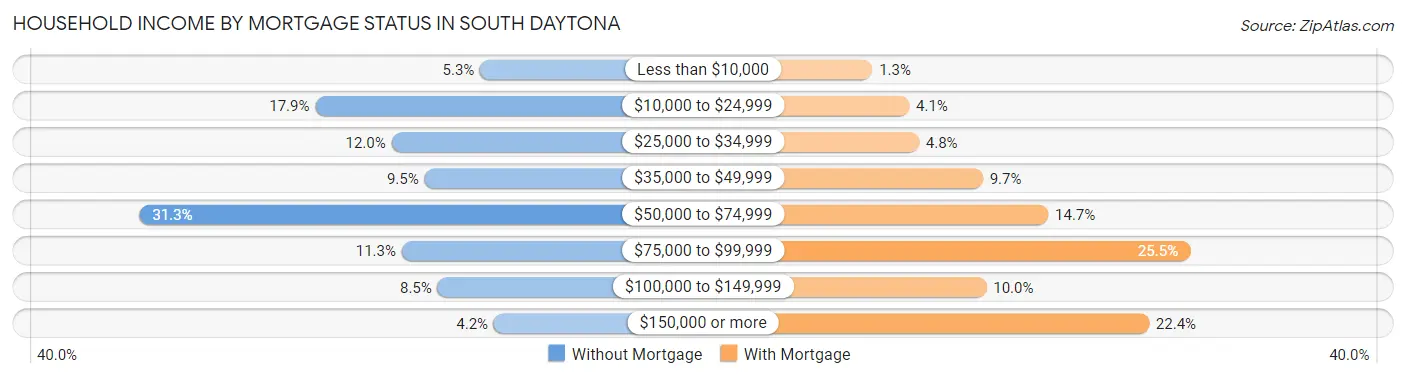
| Household Income | Without Mortgage | With Mortgage |
| Less than $10,000 | 101 (5.3%) | 24 (1.3%) |
| $10,000 to $24,999 | 341 (17.8%) | 77 (4.1%) |
| $25,000 to $34,999 | 230 (12.0%) | 91 (4.8%) |
| $35,000 to $49,999 | 182 (9.5%) | 183 (9.7%) |
| $50,000 to $74,999 | 597 (31.3%) | 277 (14.7%) |
| $75,000 to $99,999 | 215 (11.3%) | 481 (25.5%) |
| $100,000 to $149,999 | 163 (8.5%) | 188 (10.0%) |
| $150,000 or more | 81 (4.2%) | 422 (22.4%) |
| Total | 1,910 (100.0%) | 1,888 (100.0%) |
Property Value to Household Income Ratio in South Daytona
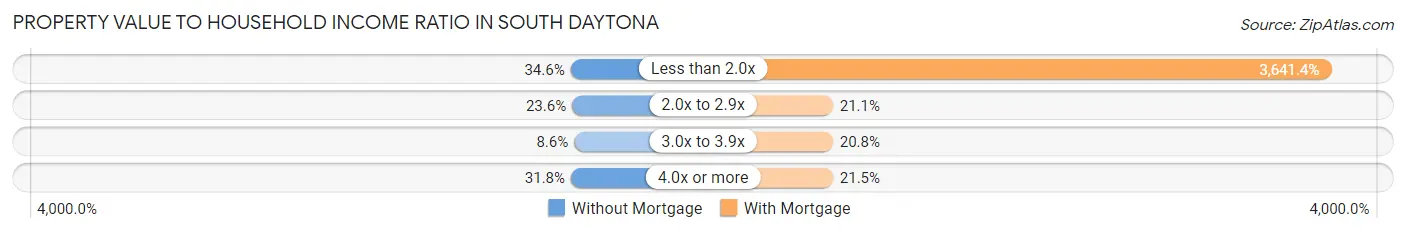
| Value-to-Income Ratio | Without Mortgage | With Mortgage |
| Less than 2.0x | 661 (34.6%) | 68,750 (3,641.4%) |
| 2.0x to 2.9x | 450 (23.6%) | 399 (21.1%) |
| 3.0x to 3.9x | 165 (8.6%) | 393 (20.8%) |
| 4.0x or more | 607 (31.8%) | 406 (21.5%) |
| Total | 1,910 (100.0%) | 1,888 (100.0%) |
Real Estate Taxes by Mortgage Status in South Daytona
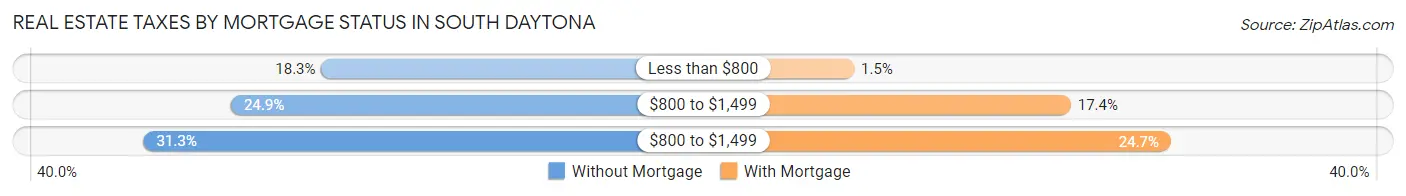
| Property Taxes | Without Mortgage | With Mortgage |
| Less than $800 | 350 (18.3%) | 29 (1.5%) |
| $800 to $1,499 | 476 (24.9%) | 328 (17.4%) |
| $800 to $1,499 | 598 (31.3%) | 466 (24.7%) |
| Total | 1,910 (100.0%) | 1,888 (100.0%) |
Health & Disability in South Daytona
Health Insurance Coverage by Age in South Daytona
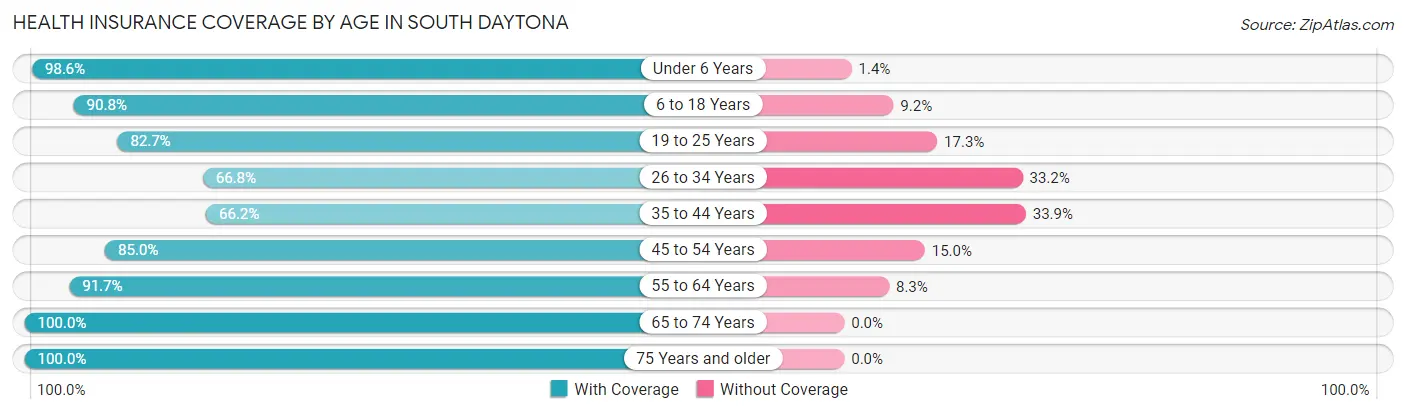
| Age Bracket | With Coverage | Without Coverage |
| Under 6 Years | 728 (98.6%) | 10 (1.4%) |
| 6 to 18 Years | 1,280 (90.8%) | 129 (9.2%) |
| 19 to 25 Years | 778 (82.7%) | 163 (17.3%) |
| 26 to 34 Years | 725 (66.8%) | 361 (33.2%) |
| 35 to 44 Years | 1,284 (66.1%) | 657 (33.9%) |
| 45 to 54 Years | 1,754 (85.0%) | 310 (15.0%) |
| 55 to 64 Years | 1,935 (91.7%) | 176 (8.3%) |
| 65 to 74 Years | 1,507 (100.0%) | 0 (0.0%) |
| 75 Years and older | 1,254 (100.0%) | 0 (0.0%) |
| Total | 11,245 (86.2%) | 1,806 (13.8%) |
Health Insurance Coverage by Citizenship Status in South Daytona
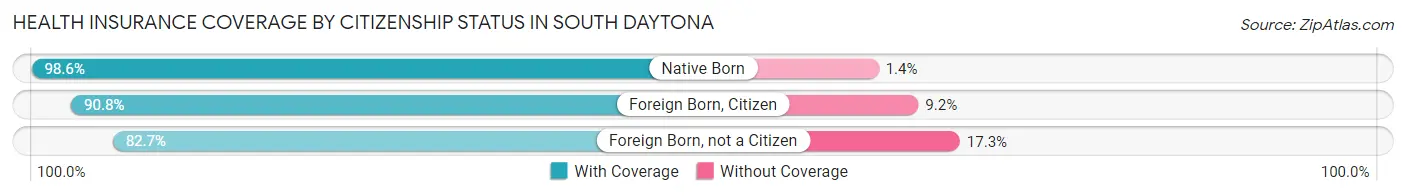
| Citizenship Status | With Coverage | Without Coverage |
| Native Born | 728 (98.6%) | 10 (1.4%) |
| Foreign Born, Citizen | 1,280 (90.8%) | 129 (9.2%) |
| Foreign Born, not a Citizen | 778 (82.7%) | 163 (17.3%) |
Health Insurance Coverage by Household Income in South Daytona
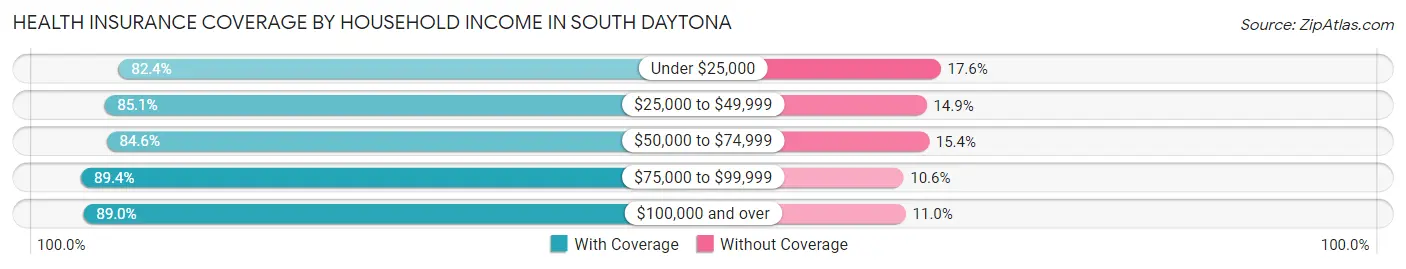
| Household Income | With Coverage | Without Coverage |
| Under $25,000 | 1,844 (82.4%) | 393 (17.6%) |
| $25,000 to $49,999 | 2,183 (85.1%) | 383 (14.9%) |
| $50,000 to $74,999 | 2,552 (84.6%) | 463 (15.4%) |
| $75,000 to $99,999 | 2,027 (89.4%) | 240 (10.6%) |
| $100,000 and over | 2,639 (89.0%) | 327 (11.0%) |
Public vs Private Health Insurance Coverage by Age in South Daytona
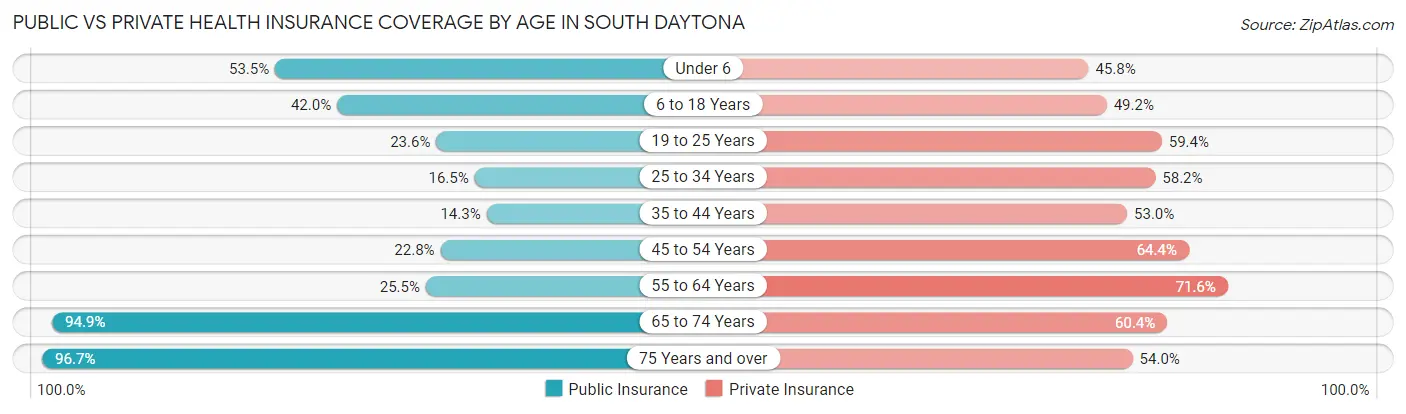
| Age Bracket | Public Insurance | Private Insurance |
| Under 6 | 395 (53.5%) | 338 (45.8%) |
| 6 to 18 Years | 592 (42.0%) | 693 (49.2%) |
| 19 to 25 Years | 222 (23.6%) | 559 (59.4%) |
| 25 to 34 Years | 179 (16.5%) | 632 (58.2%) |
| 35 to 44 Years | 277 (14.3%) | 1,028 (53.0%) |
| 45 to 54 Years | 471 (22.8%) | 1,329 (64.4%) |
| 55 to 64 Years | 539 (25.5%) | 1,512 (71.6%) |
| 65 to 74 Years | 1,430 (94.9%) | 910 (60.4%) |
| 75 Years and over | 1,213 (96.7%) | 677 (54.0%) |
| Total | 5,318 (40.7%) | 7,678 (58.8%) |
Disability Status by Sex by Age in South Daytona
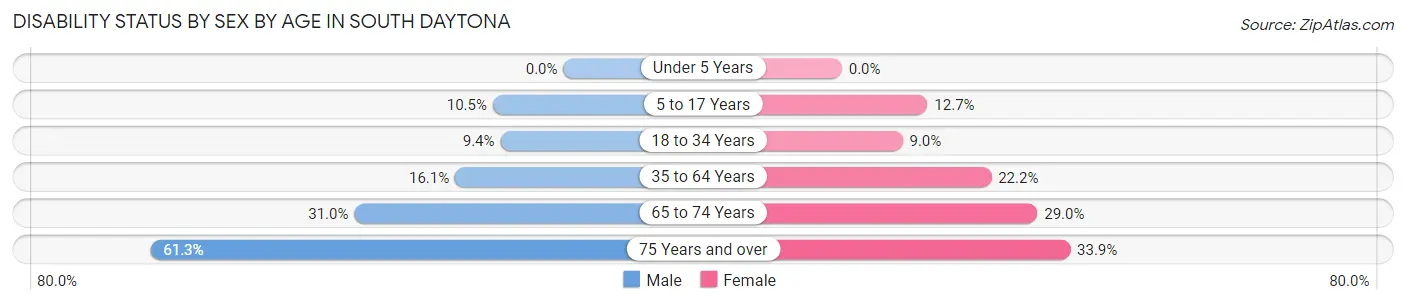
| Age Bracket | Male | Female |
| Under 5 Years | 0 (0.0%) | 0 (0.0%) |
| 5 to 17 Years | 83 (10.5%) | 100 (12.7%) |
| 18 to 34 Years | 81 (9.3%) | 112 (9.0%) |
| 35 to 64 Years | 458 (16.1%) | 725 (22.2%) |
| 65 to 74 Years | 208 (31.0%) | 243 (29.0%) |
| 75 Years and over | 371 (61.3%) | 220 (33.9%) |
Disability Class by Sex by Age in South Daytona
Disability Class: Hearing Difficulty
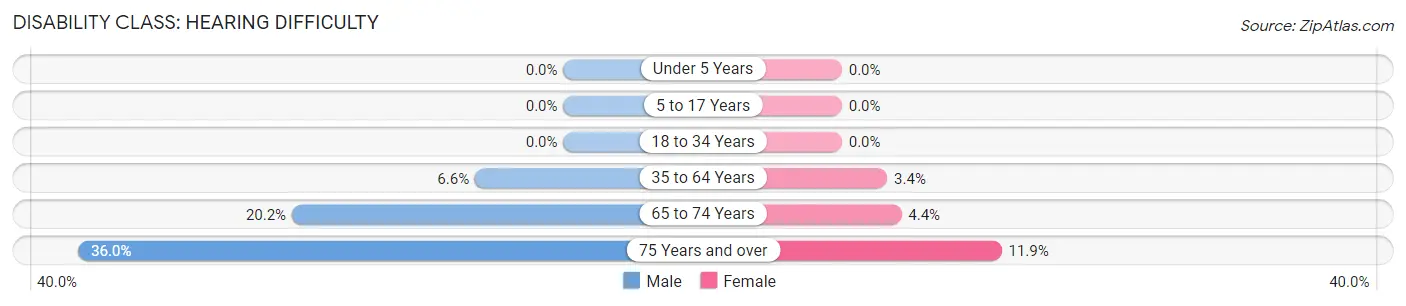
| Age Bracket | Male | Female |
| Under 5 Years | 0 (0.0%) | 0 (0.0%) |
| 5 to 17 Years | 0 (0.0%) | 0 (0.0%) |
| 18 to 34 Years | 0 (0.0%) | 0 (0.0%) |
| 35 to 64 Years | 187 (6.6%) | 110 (3.4%) |
| 65 to 74 Years | 135 (20.2%) | 37 (4.4%) |
| 75 Years and over | 218 (36.0%) | 77 (11.9%) |
Disability Class: Vision Difficulty
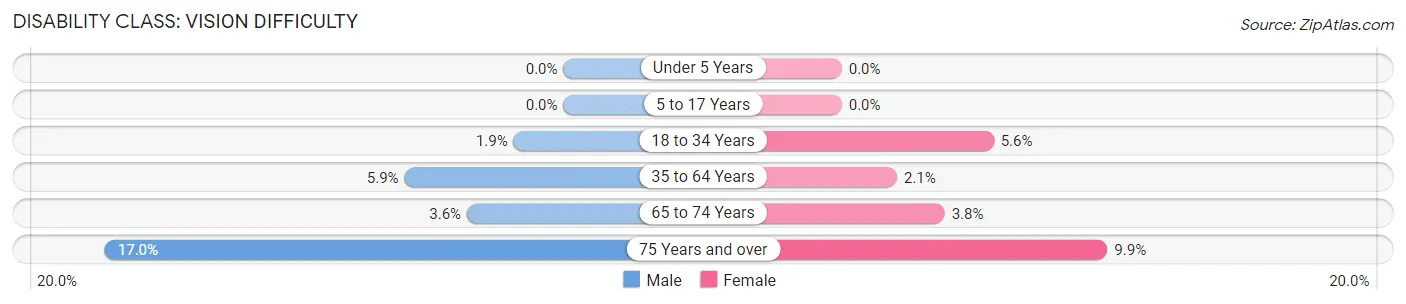
| Age Bracket | Male | Female |
| Under 5 Years | 0 (0.0%) | 0 (0.0%) |
| 5 to 17 Years | 0 (0.0%) | 0 (0.0%) |
| 18 to 34 Years | 16 (1.8%) | 70 (5.6%) |
| 35 to 64 Years | 168 (5.9%) | 67 (2.1%) |
| 65 to 74 Years | 24 (3.6%) | 32 (3.8%) |
| 75 Years and over | 103 (17.0%) | 64 (9.9%) |
Disability Class: Cognitive Difficulty
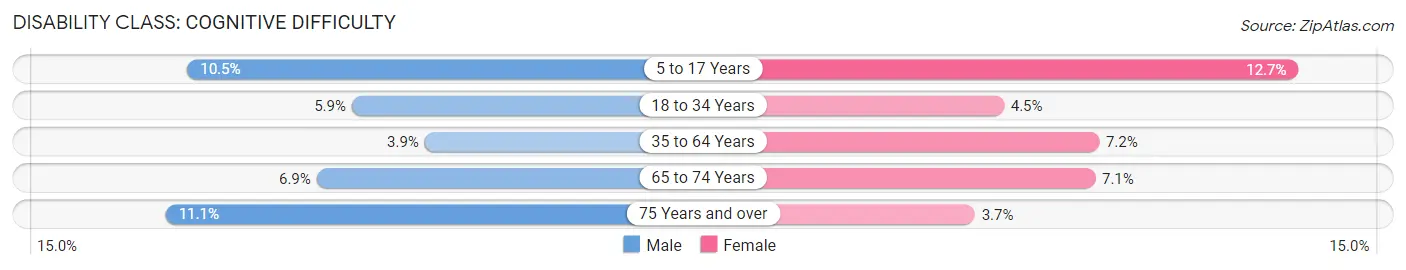
| Age Bracket | Male | Female |
| 5 to 17 Years | 83 (10.5%) | 100 (12.7%) |
| 18 to 34 Years | 51 (5.9%) | 56 (4.5%) |
| 35 to 64 Years | 110 (3.9%) | 234 (7.2%) |
| 65 to 74 Years | 46 (6.9%) | 59 (7.0%) |
| 75 Years and over | 67 (11.1%) | 24 (3.7%) |
Disability Class: Ambulatory Difficulty
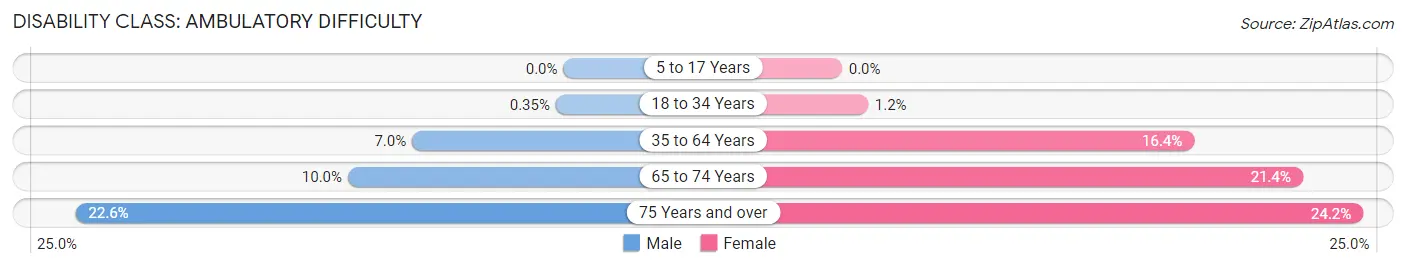
| Age Bracket | Male | Female |
| 5 to 17 Years | 0 (0.0%) | 0 (0.0%) |
| 18 to 34 Years | 3 (0.4%) | 15 (1.2%) |
| 35 to 64 Years | 200 (7.0%) | 534 (16.4%) |
| 65 to 74 Years | 67 (10.0%) | 179 (21.4%) |
| 75 Years and over | 137 (22.6%) | 157 (24.2%) |
Disability Class: Self-Care Difficulty
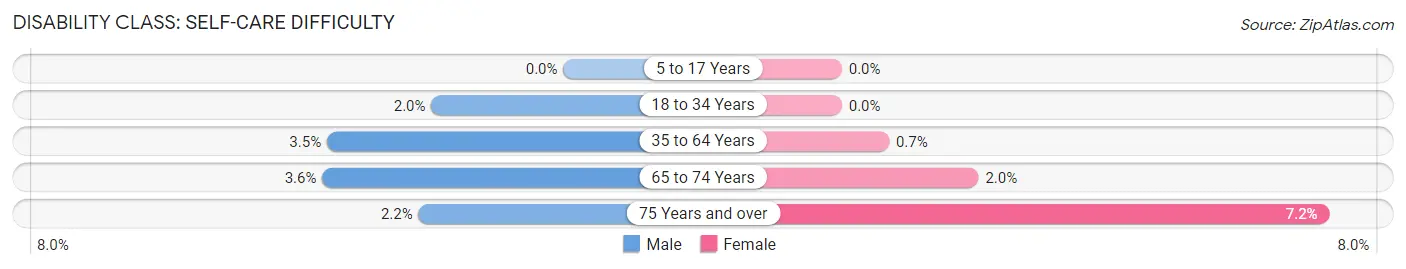
| Age Bracket | Male | Female |
| 5 to 17 Years | 0 (0.0%) | 0 (0.0%) |
| 18 to 34 Years | 17 (2.0%) | 0 (0.0%) |
| 35 to 64 Years | 100 (3.5%) | 23 (0.7%) |
| 65 to 74 Years | 24 (3.6%) | 17 (2.0%) |
| 75 Years and over | 13 (2.1%) | 47 (7.2%) |
Technology Access in South Daytona
Computing Device Access in South Daytona
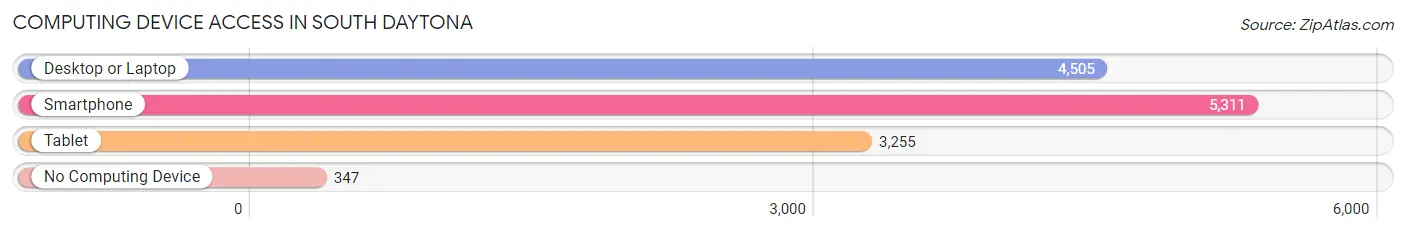
| Device Type | # Households | % Households |
| Desktop or Laptop | 4,505 | 76.0% |
| Smartphone | 5,311 | 89.6% |
| Tablet | 3,255 | 54.9% |
| No Computing Device | 347 | 5.9% |
| Total | 5,930 | 100.0% |
Internet Access in South Daytona
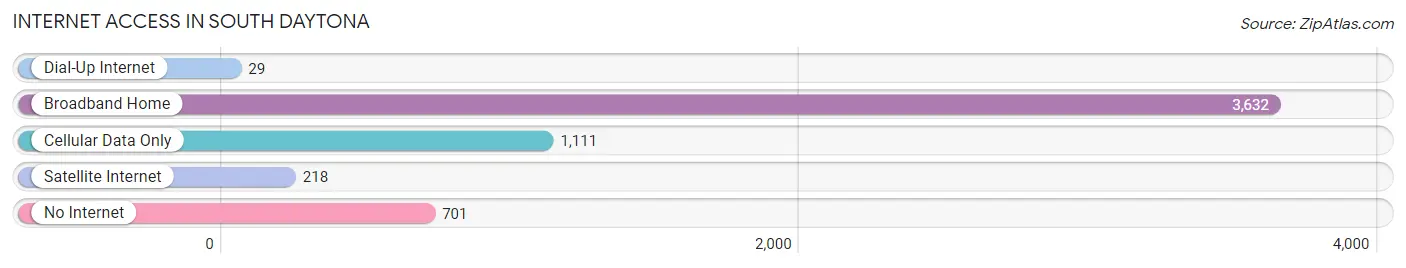
| Internet Type | # Households | % Households |
| Dial-Up Internet | 29 | 0.5% |
| Broadband Home | 3,632 | 61.3% |
| Cellular Data Only | 1,111 | 18.7% |
| Satellite Internet | 218 | 3.7% |
| No Internet | 701 | 11.8% |
| Total | 5,930 | 100.0% |
South Daytona Summary
History
South Daytona is a city located in Volusia County, Florida. It is situated on the Halifax River, just south of Daytona Beach. The city was incorporated in 1925 and has a population of approximately 12,000 people.
The area that is now South Daytona was originally inhabited by the Timucua Indians. The first European settlers arrived in the area in the late 1700s and early 1800s. The area was known as Daytona Beach South until 1925 when it was officially incorporated as South Daytona.
The city was originally a small fishing village and was home to a few small businesses. In the early 1900s, the city began to grow as more people moved to the area. The city was home to a number of tourist attractions, including the Daytona Beach Speedway, which opened in 1959.
The city continued to grow throughout the 20th century and by 2000, the population had grown to 12,000 people.
Geography
South Daytona is located in Volusia County, Florida. It is situated on the Halifax River, just south of Daytona Beach. The city covers an area of 8.3 square miles and has a population of approximately 12,000 people.
The city is located in a humid subtropical climate zone and experiences hot, humid summers and mild winters. The average temperature in the summer is around 90°F and the average temperature in the winter is around 60°F.
The city is home to a number of parks and recreational areas, including the South Daytona Beach Park, which offers a variety of activities such as swimming, fishing, and boating.
Economy
South Daytona’s economy is largely based on tourism and retail. The city is home to a number of tourist attractions, including the Daytona Beach Speedway, which attracts thousands of visitors each year.
The city is also home to a number of retail stores, restaurants, and other businesses. The city’s largest employer is the Halifax Health Medical Center, which employs over 2,000 people.
Demographics
As of the 2010 census, South Daytona had a population of 12,252 people. The racial makeup of the city was 79.3% White, 11.2% African American, 0.5% Native American, 1.7% Asian, 0.1% Pacific Islander, and 5.2% from other races. Hispanic or Latino of any race were 8.7% of the population.
The median household income in South Daytona was $37,945 and the median family income was $45,945. The per capita income for the city was $20,945. About 11.2% of families and 14.2% of the population were below the poverty line, including 19.2% of those under age 18 and 8.2% of those age 65 or over.
Common Questions
What is the Total Population of South Daytona?
Total Population of South Daytona is 13,132.
What is the Total Male Population of South Daytona?
Total Male Population of South Daytona is 6,067.
What is the Total Female Population of South Daytona?
Total Female Population of South Daytona is 7,065.
What is the Ratio of Males per 100 Females in South Daytona?
There are 85.87 Males per 100 Females in South Daytona.
What is the Ratio of Females per 100 Males in South Daytona?
There are 116.45 Females per 100 Males in South Daytona.
What is the Median Population Age in South Daytona?
Median Population Age in South Daytona is 47.4 Years.
What is the Average Family Size in South Daytona
Average Family Size in South Daytona is 2.7 People.
What is the Average Household Size in South Daytona
Average Household Size in South Daytona is 2.2 People.
What is Per Capita Income in South Daytona?
Per Capita income in South Daytona is $30,713.
What is the Median Family Income in South Daytona?
Median Family Income in South Daytona is $63,951.
What is the Median Household income in South Daytona?
Median Household Income in South Daytona is $54,898.
What is Income or Wage Gap in South Daytona?
Income or Wage Gap in South Daytona is 14.5%.
Women in South Daytona earn 85.5 cents for every dollar earned by a man.
What is Inequality or Gini Index in South Daytona?
Inequality or Gini Index in South Daytona is 0.43.
How Large is the Labor Force in South Daytona?
There are 6,266 People in the Labor Forcein in South Daytona.
What is the Percentage of People in the Labor Force in South Daytona?
55.6% of People are in the Labor Force in South Daytona.
What is the Unemployment Rate in South Daytona?
Unemployment Rate in South Daytona is 4.1%.