Rio, FL
Rio Map
Rio Overview
1,373
TOTAL POPULATION
511
MALE POPULATION
862
FEMALE POPULATION
59.28
MALES / 100 FEMALES
168.69
FEMALES / 100 MALES
57.4
MEDIAN AGE
3.7
AVG FAMILY SIZE
2.8
AVG HOUSEHOLD SIZE
$48,197
PER CAPITA INCOME
$94,202
AVG FAMILY INCOME
$93,720
AVG HOUSEHOLD INCOME
58.7%
WAGE / INCOME GAP [ % ]
41.3¢/ $1
WAGE / INCOME GAP [ $ ]
0.44
INEQUALITY / GINI INDEX
470
LABOR FORCE [ PEOPLE ]
43.0%
PERCENT IN LABOR FORCE
9.6%
UNEMPLOYMENT RATE
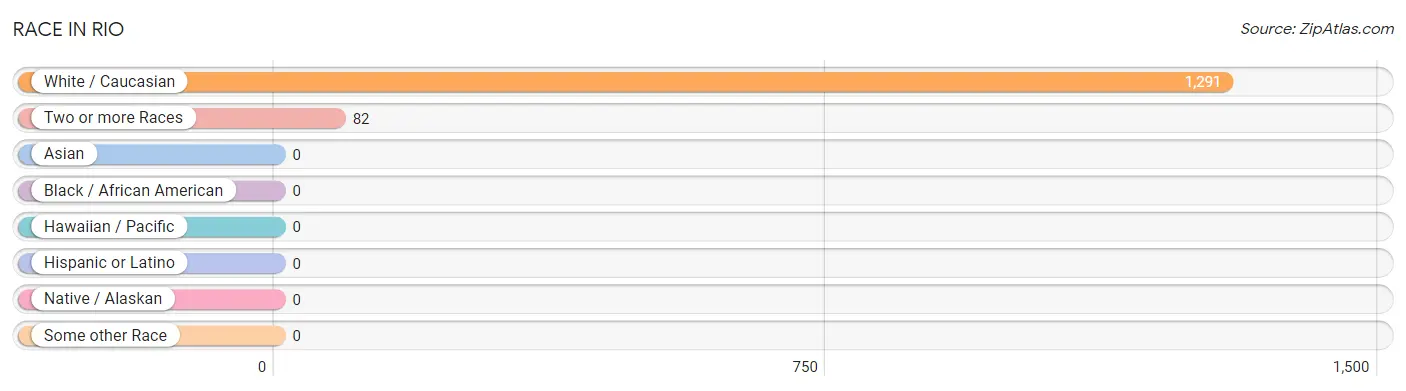
Race in Rio
The most populous races in Rio are White / Caucasian (1,291 | 94.0%), and Two or more Races (82 | 6.0%).
| Race | # Population | % Population |
| Asian | 0 | 0.0% |
| Black / African American | 0 | 0.0% |
| Hawaiian / Pacific | 0 | 0.0% |
| Hispanic or Latino | 0 | 0.0% |
| Native / Alaskan | 0 | 0.0% |
| White / Caucasian | 1,291 | 94.0% |
| Two or more Races | 82 | 6.0% |
| Some other Race | 0 | 0.0% |
| Total | 1,373 | 100.0% |
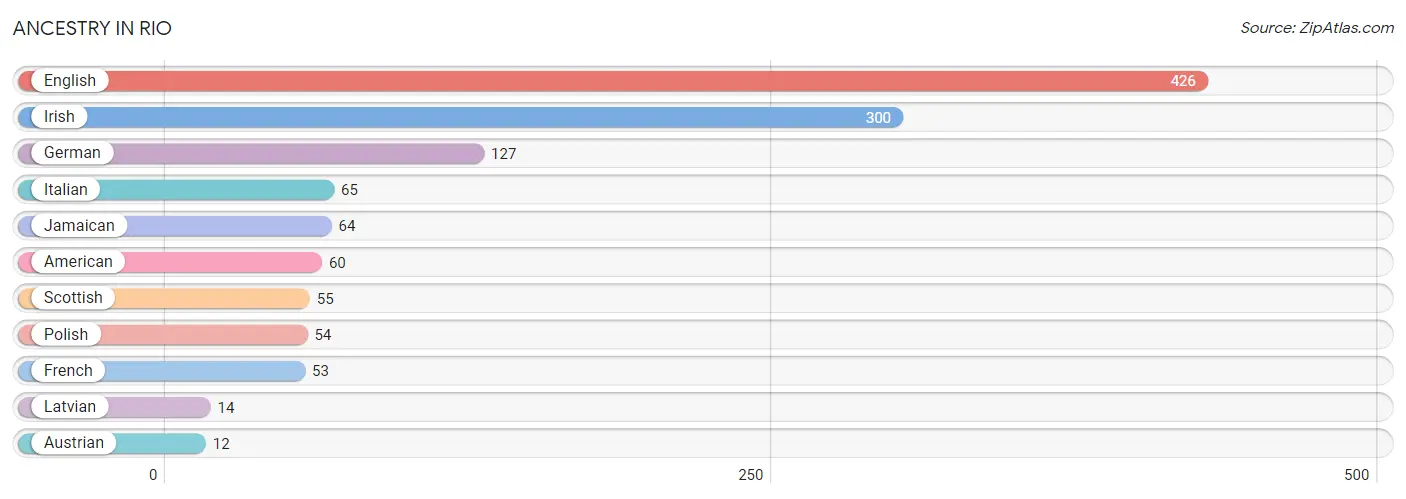
Ancestry in Rio
The most populous ancestries reported in Rio are English (426 | 31.0%), Irish (300 | 21.8%), German (127 | 9.2%), Italian (65 | 4.7%), and Jamaican (64 | 4.7%), together accounting for 71.5% of all Rio residents.
| Ancestry | # Population | % Population |
| American | 60 | 4.4% |
| Austrian | 12 | 0.9% |
| English | 426 | 31.0% |
| French | 53 | 3.9% |
| German | 127 | 9.2% |
| Irish | 300 | 21.8% |
| Italian | 65 | 4.7% |
| Jamaican | 64 | 4.7% |
| Latvian | 14 | 1.0% |
| Polish | 54 | 3.9% |
| Scottish | 55 | 4.0% | View All 11 Rows |
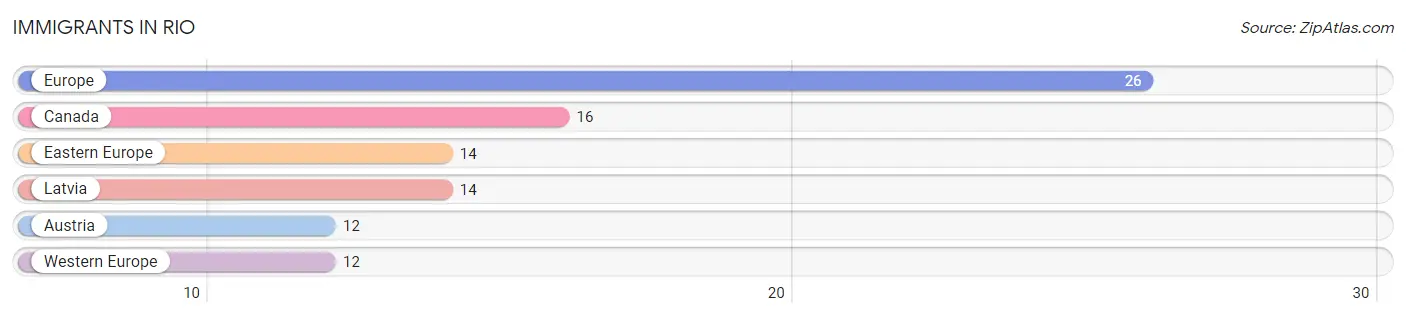
Immigrants in Rio
The most numerous immigrant groups reported in Rio came from Europe (26 | 1.9%), Canada (16 | 1.2%), Eastern Europe (14 | 1.0%), Latvia (14 | 1.0%), and Austria (12 | 0.9%), together accounting for 6.0% of all Rio residents.
| Immigration Origin | # Population | % Population |
| Austria | 12 | 0.9% |
| Canada | 16 | 1.2% |
| Eastern Europe | 14 | 1.0% |
| Europe | 26 | 1.9% |
| Latvia | 14 | 1.0% |
| Western Europe | 12 | 0.9% | View All 6 Rows |
Sex and Age in Rio
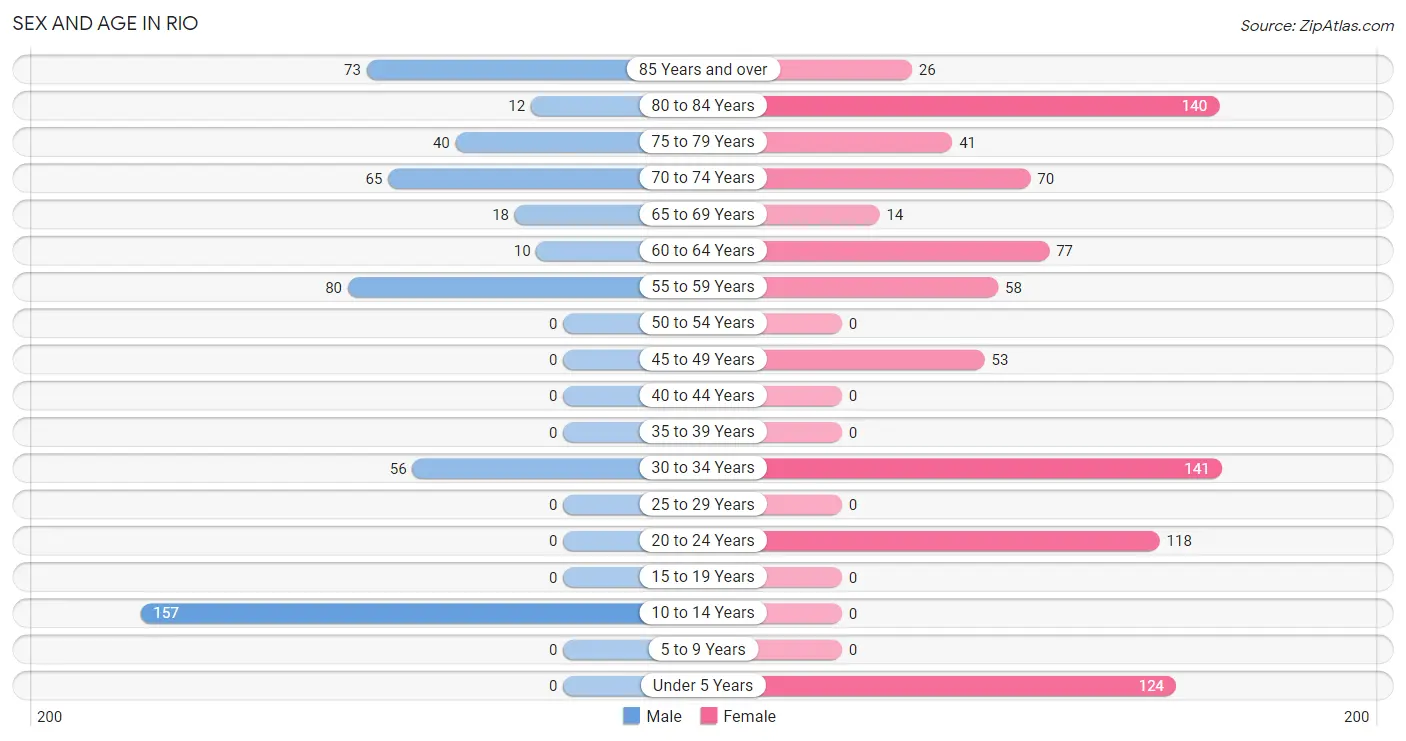
Sex and Age in Rio
The most populous age groups in Rio are 10 to 14 Years (157 | 30.7%) for men and 30 to 34 Years (141 | 16.4%) for women.
| Age Bracket | Male | Female |
| Under 5 Years | 0 (0.0%) | 124 (14.4%) |
| 5 to 9 Years | 0 (0.0%) | 0 (0.0%) |
| 10 to 14 Years | 157 (30.7%) | 0 (0.0%) |
| 15 to 19 Years | 0 (0.0%) | 0 (0.0%) |
| 20 to 24 Years | 0 (0.0%) | 118 (13.7%) |
| 25 to 29 Years | 0 (0.0%) | 0 (0.0%) |
| 30 to 34 Years | 56 (11.0%) | 141 (16.4%) |
| 35 to 39 Years | 0 (0.0%) | 0 (0.0%) |
| 40 to 44 Years | 0 (0.0%) | 0 (0.0%) |
| 45 to 49 Years | 0 (0.0%) | 53 (6.1%) |
| 50 to 54 Years | 0 (0.0%) | 0 (0.0%) |
| 55 to 59 Years | 80 (15.7%) | 58 (6.7%) |
| 60 to 64 Years | 10 (2.0%) | 77 (8.9%) |
| 65 to 69 Years | 18 (3.5%) | 14 (1.6%) |
| 70 to 74 Years | 65 (12.7%) | 70 (8.1%) |
| 75 to 79 Years | 40 (7.8%) | 41 (4.8%) |
| 80 to 84 Years | 12 (2.4%) | 140 (16.2%) |
| 85 Years and over | 73 (14.3%) | 26 (3.0%) |
| Total | 511 (100.0%) | 862 (100.0%) |
Families and Households in Rio
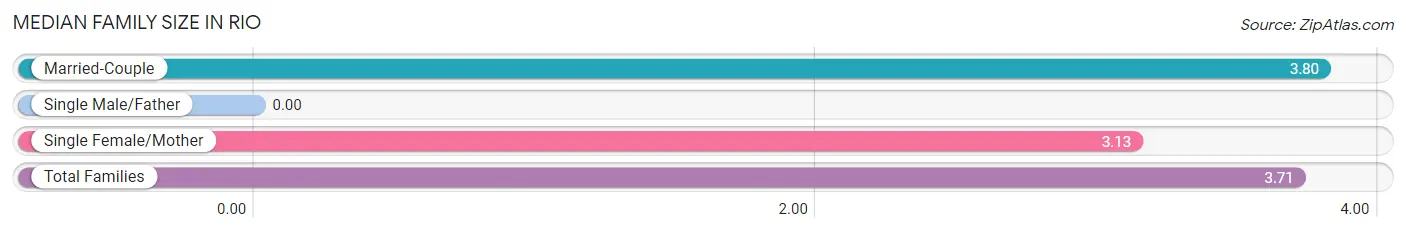
Median Family Size in Rio
| Family Type | # Families | Family Size |
| Married-Couple | 276 (86.0%) | 3.80 |
| Single Male/Father | 0 (0.0%) | - |
| Single Female/Mother | 45 (14.0%) | 3.13 |
| Total Families | 321 (100.0%) | 3.71 |
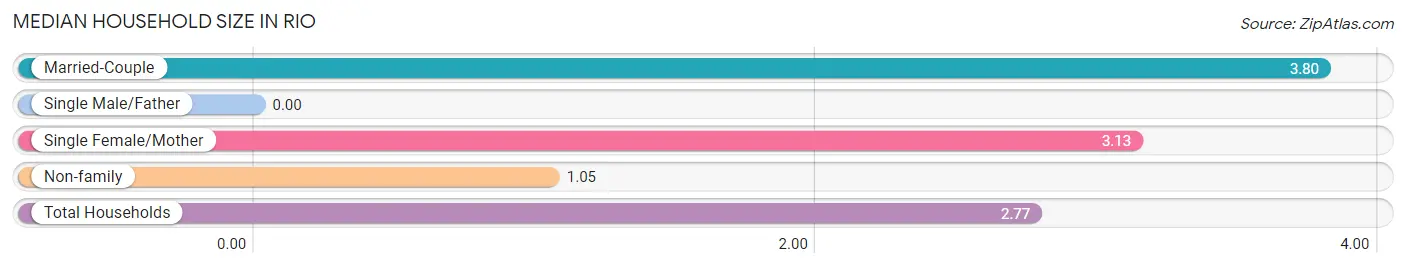
Median Household Size in Rio
| Household Type | # Households | Household Size |
| Married-Couple | 276 (55.8%) | 3.80 |
| Single Male/Father | 0 (0.0%) | - |
| Single Female/Mother | 45 (9.1%) | 3.13 |
| Non-family | 174 (35.1%) | 1.05 |
| Total Households | 495 (100.0%) | 2.77 |
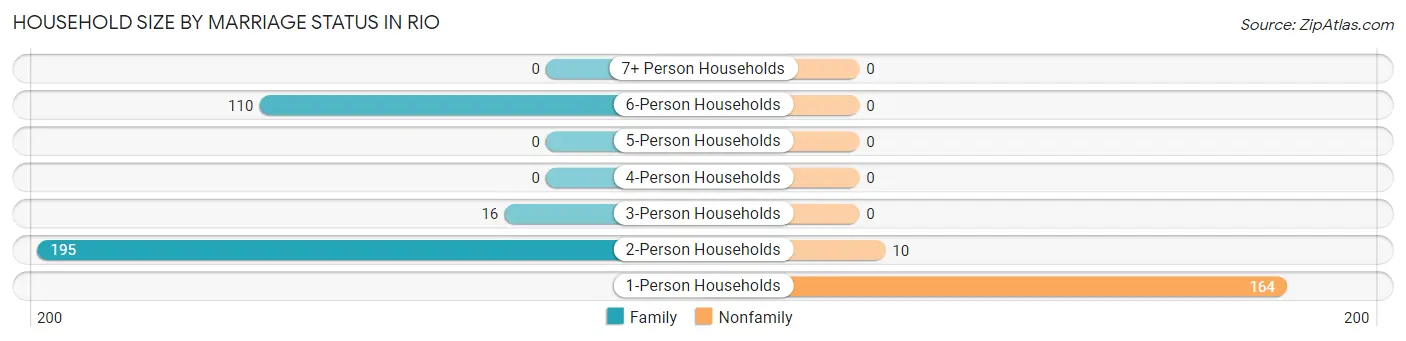
Household Size by Marriage Status in Rio
Out of a total of 495 households in Rio, 321 (64.8%) are family households, while 174 (35.1%) are nonfamily households. The most numerous type of family households are 2-person households, comprising 195, and the most common type of nonfamily households are 1-person households, comprising 164.
| Household Size | Family Households | Nonfamily Households |
| 1-Person Households | - | 164 (33.1%) |
| 2-Person Households | 195 (39.4%) | 10 (2.0%) |
| 3-Person Households | 16 (3.2%) | 0 (0.0%) |
| 4-Person Households | 0 (0.0%) | 0 (0.0%) |
| 5-Person Households | 0 (0.0%) | 0 (0.0%) |
| 6-Person Households | 110 (22.2%) | 0 (0.0%) |
| 7+ Person Households | 0 (0.0%) | 0 (0.0%) |
| Total | 321 (64.8%) | 174 (35.1%) |
Female Fertility in Rio
Fertility by Age in Rio
| Age Bracket | Women with Births | Births / 1,000 Women |
| 15 to 19 years | 0 (0.0%) | 0.0 |
| 20 to 34 years | 0 (0.0%) | 0.0 |
| 35 to 50 years | 0 (0.0%) | 0.0 |
| Total | 0 (0.0%) | 0.0 |
Fertility by Age by Marriage Status in Rio
| Age Bracket | Married | Unmarried |
| 15 to 19 years | 0 (0.0%) | 0 (0.0%) |
| 20 to 34 years | 0 (0.0%) | 0 (0.0%) |
| 35 to 50 years | 0 (0.0%) | 0 (0.0%) |
| Total | 0 (0.0%) | 0 (0.0%) |
Fertility by Education in Rio
| Educational Attainment | Women with Births | Births / 1,000 Women |
| Less than High School | 0 (0.0%) | 0.0 |
| High School Diploma | 0 (0.0%) | 0.0 |
| College or Associate's Degree | 0 (0.0%) | 0.0 |
| Bachelor's Degree | 0 (0.0%) | 0.0 |
| Graduate Degree | 0 (0.0%) | 0.0 |
| Total | 0 (0.0%) | 0.0 |
Fertility by Education by Marriage Status in Rio
| Educational Attainment | Married | Unmarried |
| Less than High School | 0 (0.0%) | 0 (0.0%) |
| High School Diploma | 0 (0.0%) | 0 (0.0%) |
| College or Associate's Degree | 0 (0.0%) | 0 (0.0%) |
| Bachelor's Degree | 0 (0.0%) | 0 (0.0%) |
| Graduate Degree | 0 (0.0%) | 0 (0.0%) |
| Total | 0 (0.0%) | 0 (0.0%) |
Income in Rio
Income Overview in Rio
Per Capita Income in Rio is $48,197, while median incomes of families and households are $94,202 and $93,720 respectively.
| Characteristic | Number | Measure |
| Per Capita Income | 1,373 | $48,197 |
| Median Family Income | 321 | $94,202 |
| Mean Family Income | 321 | $148,920 |
| Median Household Income | 495 | $93,720 |
| Mean Household Income | 495 | $129,116 |
| Income Deficit | 321 | $0 |
| Wage / Income Gap (%) | 1,373 | 58.68% |
| Wage / Income Gap ($) | 1,373 | 41.32¢ per $1 |
| Gini / Inequality Index | 1,373 | 0.44 |
Earnings by Sex in Rio
Average Earnings in Rio are $45,156, $88,304 for men and $36,483 for women, a difference of 58.7%.
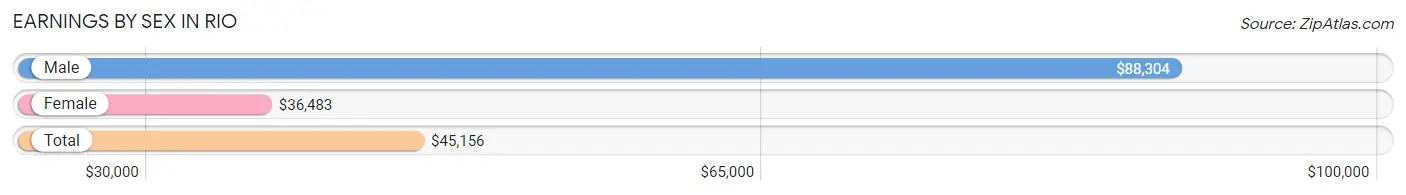
| Sex | Number | Average Earnings |
| Male | 188 (32.8%) | $88,304 |
| Female | 386 (67.2%) | $36,483 |
| Total | 574 (100.0%) | $45,156 |
Earnings by Sex by Income Bracket in Rio
The most common earnings brackets in Rio are $45,000 to $49,999 for men (64 | 34.0%) and $100,000+ for women (100 | 25.9%).
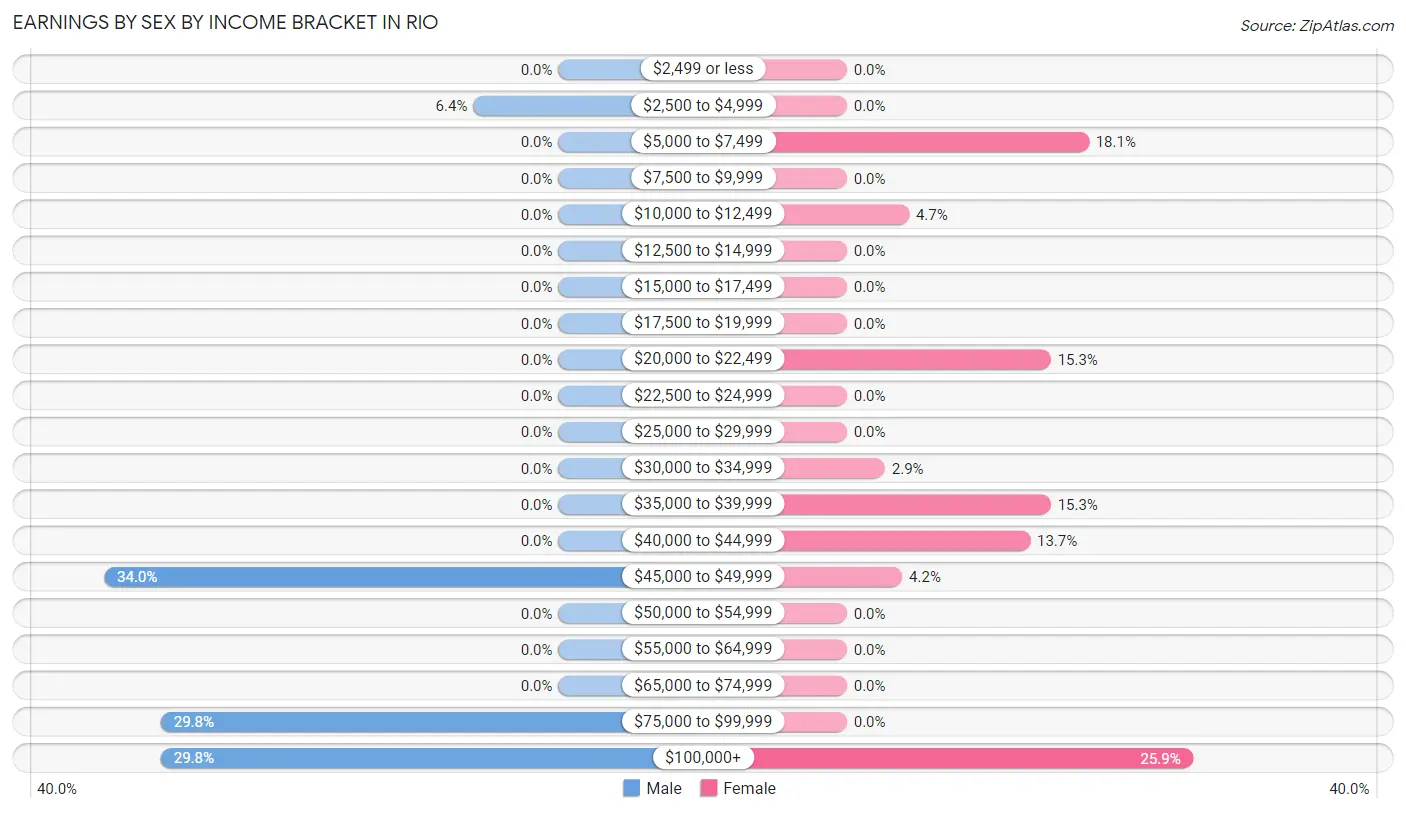
| Income | Male | Female |
| $2,499 or less | 0 (0.0%) | 0 (0.0%) |
| $2,500 to $4,999 | 12 (6.4%) | 0 (0.0%) |
| $5,000 to $7,499 | 0 (0.0%) | 70 (18.1%) |
| $7,500 to $9,999 | 0 (0.0%) | 0 (0.0%) |
| $10,000 to $12,499 | 0 (0.0%) | 18 (4.7%) |
| $12,500 to $14,999 | 0 (0.0%) | 0 (0.0%) |
| $15,000 to $17,499 | 0 (0.0%) | 0 (0.0%) |
| $17,500 to $19,999 | 0 (0.0%) | 0 (0.0%) |
| $20,000 to $22,499 | 0 (0.0%) | 59 (15.3%) |
| $22,500 to $24,999 | 0 (0.0%) | 0 (0.0%) |
| $25,000 to $29,999 | 0 (0.0%) | 0 (0.0%) |
| $30,000 to $34,999 | 0 (0.0%) | 11 (2.9%) |
| $35,000 to $39,999 | 0 (0.0%) | 59 (15.3%) |
| $40,000 to $44,999 | 0 (0.0%) | 53 (13.7%) |
| $45,000 to $49,999 | 64 (34.0%) | 16 (4.2%) |
| $50,000 to $54,999 | 0 (0.0%) | 0 (0.0%) |
| $55,000 to $64,999 | 0 (0.0%) | 0 (0.0%) |
| $65,000 to $74,999 | 0 (0.0%) | 0 (0.0%) |
| $75,000 to $99,999 | 56 (29.8%) | 0 (0.0%) |
| $100,000+ | 56 (29.8%) | 100 (25.9%) |
| Total | 188 (100.0%) | 386 (100.0%) |
Earnings by Sex by Educational Attainment in Rio
| Educational Attainment | Male Income | Female Income |
| Less than High School | - | - |
| High School Diploma | - | - |
| College or Associate's Degree | - | - |
| Bachelor's Degree | - | - |
| Graduate Degree | - | - |
| Total | $88,304 | $0 |
Family Income in Rio
Family Income Brackets in Rio
According to the Rio family income data, there are 139 families falling into the $75,000 to $99,999 income range, which is the most common income bracket and makes up 43.3% of all families.
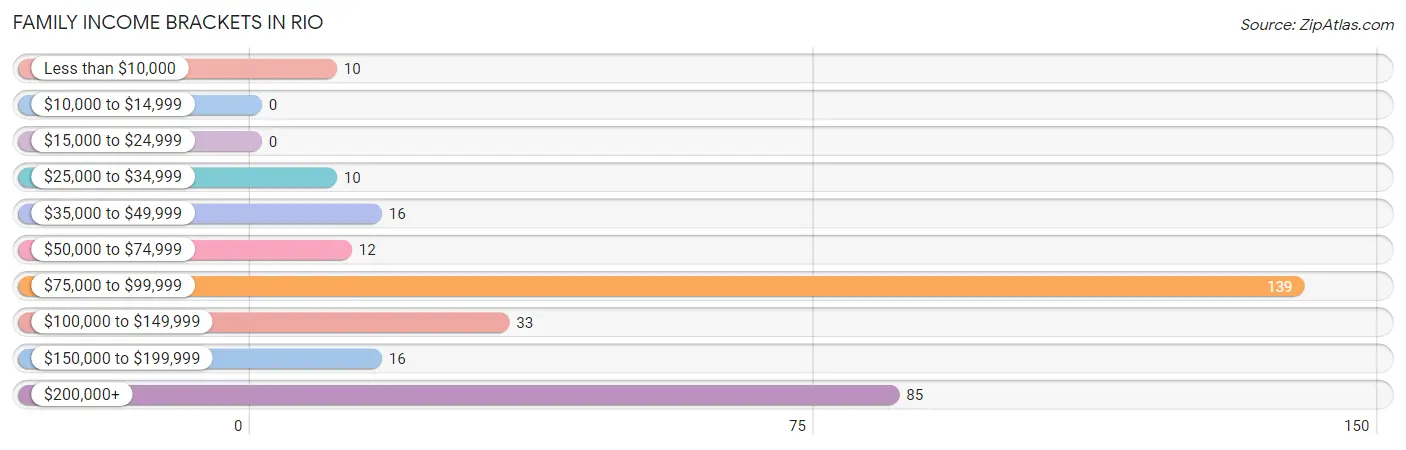
| Income Bracket | # Families | % Families |
| Less than $10,000 | 10 | 3.1% |
| $10,000 to $14,999 | 0 | 0.0% |
| $15,000 to $24,999 | 0 | 0.0% |
| $25,000 to $34,999 | 10 | 3.1% |
| $35,000 to $49,999 | 16 | 5.0% |
| $50,000 to $74,999 | 12 | 3.7% |
| $75,000 to $99,999 | 139 | 43.3% |
| $100,000 to $149,999 | 33 | 10.3% |
| $150,000 to $199,999 | 16 | 5.0% |
| $200,000+ | 85 | 26.5% |
Family Income by Famaliy Size in Rio
2-person families (195 | 60.8%) account for the highest median family income in Rio with $94,327 per family, while 2-person families (195 | 60.8%) have the highest median income of $47,164 per family member.
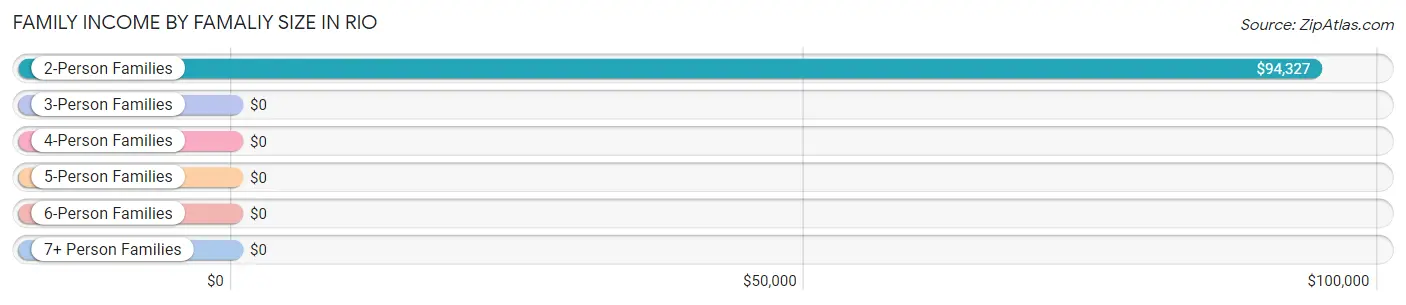
| Income Bracket | # Families | Median Income |
| 2-Person Families | 195 (60.8%) | $94,327 |
| 3-Person Families | 16 (5.0%) | $0 |
| 4-Person Families | 0 (0.0%) | $0 |
| 5-Person Families | 0 (0.0%) | $0 |
| 6-Person Families | 110 (34.3%) | $0 |
| 7+ Person Families | 0 (0.0%) | $0 |
| Total | 321 (100.0%) | $94,202 |
Family Income by Number of Earners in Rio
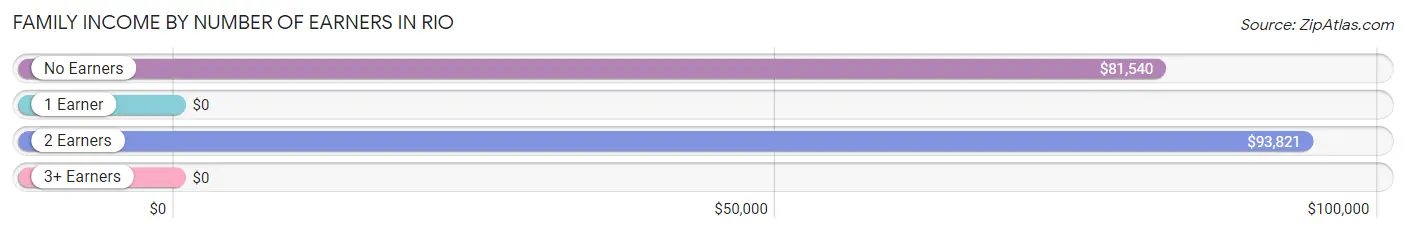
| Number of Earners | # Families | Median Income |
| No Earners | 141 (43.9%) | $81,540 |
| 1 Earner | 42 (13.1%) | $0 |
| 2 Earners | 98 (30.5%) | $93,821 |
| 3+ Earners | 40 (12.5%) | $0 |
| Total | 321 (100.0%) | $94,202 |
Household Income in Rio
Household Income Brackets in Rio
With 139 households falling in the category, the $75,000 to $99,999 income range is the most frequent in Rio, accounting for 28.1% of all households.
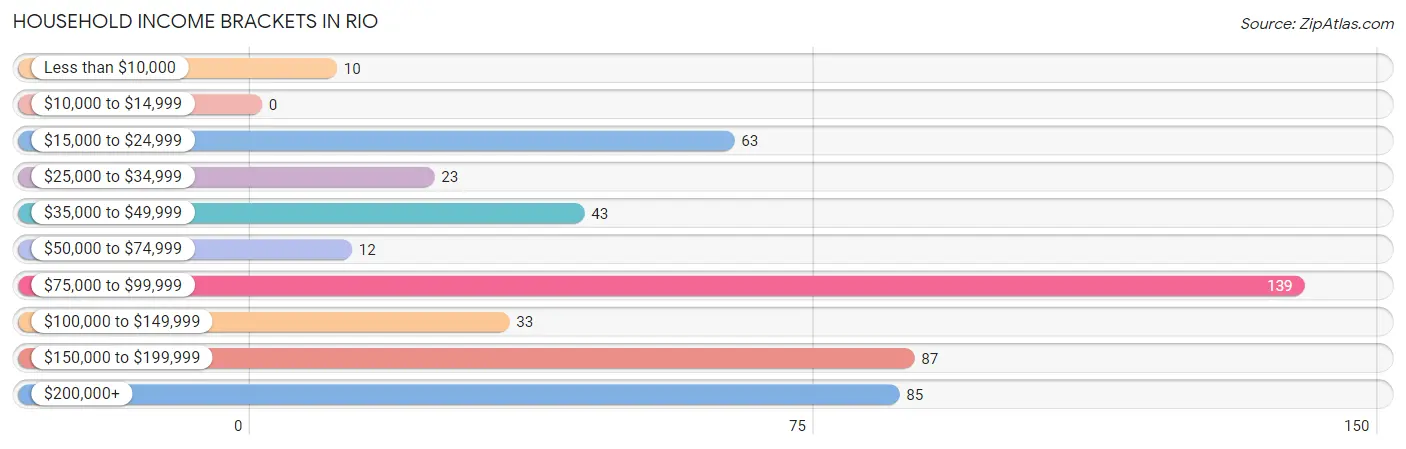
| Income Bracket | # Households | % Households |
| Less than $10,000 | 10 | 2.0% |
| $10,000 to $14,999 | 0 | 0.0% |
| $15,000 to $24,999 | 63 | 12.7% |
| $25,000 to $34,999 | 23 | 4.6% |
| $35,000 to $49,999 | 43 | 8.7% |
| $50,000 to $74,999 | 12 | 2.4% |
| $75,000 to $99,999 | 139 | 28.1% |
| $100,000 to $149,999 | 33 | 6.7% |
| $150,000 to $199,999 | 87 | 17.6% |
| $200,000+ | 85 | 17.2% |
Household Income by Householder Age in Rio
The median household income in Rio is $93,720, with the highest median household income of $81,228 found in the 65+ years age bracket for the primary householder. A total of 261 households (52.7%) fall into this category.
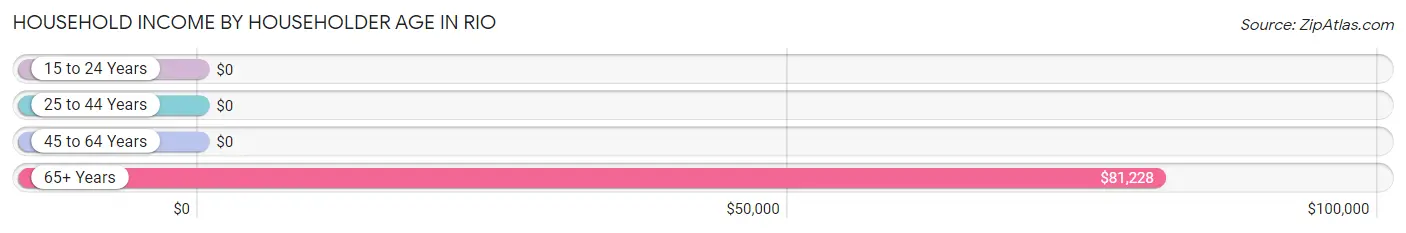
| Income Bracket | # Households | Median Income |
| 15 to 24 Years | 0 (0.0%) | $0 |
| 25 to 44 Years | 141 (28.5%) | $0 |
| 45 to 64 Years | 93 (18.8%) | $0 |
| 65+ Years | 261 (52.7%) | $81,228 |
| Total | 495 (100.0%) | $93,720 |
Poverty in Rio
Income Below Poverty by Sex and Age in Rio
With 2.0% poverty level for males and 2.3% for females among the residents of Rio, 55 to 64 year old males and 55 to 64 year old females are the most vulnerable to poverty, with 10 males (11.1%) and 20 females (14.8%) in their respective age groups living below the poverty level.
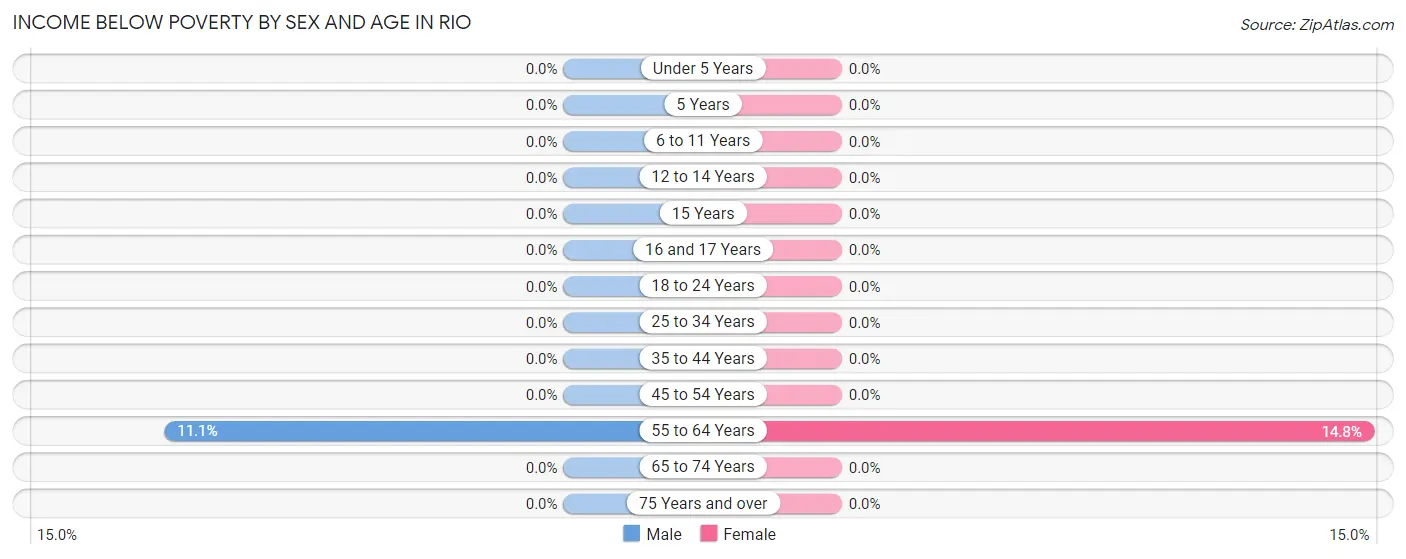
| Age Bracket | Male | Female |
| Under 5 Years | 0 (0.0%) | 0 (0.0%) |
| 5 Years | 0 (0.0%) | 0 (0.0%) |
| 6 to 11 Years | 0 (0.0%) | 0 (0.0%) |
| 12 to 14 Years | 0 (0.0%) | 0 (0.0%) |
| 15 Years | 0 (0.0%) | 0 (0.0%) |
| 16 and 17 Years | 0 (0.0%) | 0 (0.0%) |
| 18 to 24 Years | 0 (0.0%) | 0 (0.0%) |
| 25 to 34 Years | 0 (0.0%) | 0 (0.0%) |
| 35 to 44 Years | 0 (0.0%) | 0 (0.0%) |
| 45 to 54 Years | 0 (0.0%) | 0 (0.0%) |
| 55 to 64 Years | 10 (11.1%) | 20 (14.8%) |
| 65 to 74 Years | 0 (0.0%) | 0 (0.0%) |
| 75 Years and over | 0 (0.0%) | 0 (0.0%) |
| Total | 10 (2.0%) | 20 (2.3%) |
Income Above Poverty by Sex and Age in Rio
According to the poverty statistics in Rio, males aged 6 to 11 years and females aged under 5 years are the age groups that are most secure financially, with 100.0% of males and 100.0% of females in these age groups living above the poverty line.
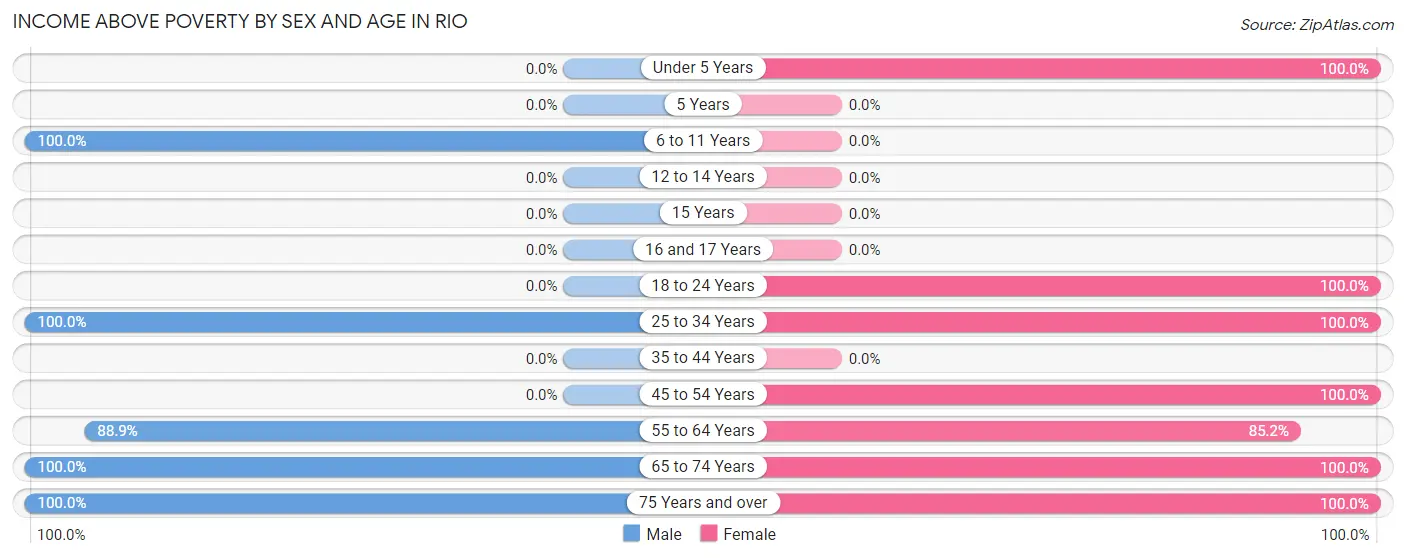
| Age Bracket | Male | Female |
| Under 5 Years | 0 (0.0%) | 124 (100.0%) |
| 5 Years | 0 (0.0%) | 0 (0.0%) |
| 6 to 11 Years | 157 (100.0%) | 0 (0.0%) |
| 12 to 14 Years | 0 (0.0%) | 0 (0.0%) |
| 15 Years | 0 (0.0%) | 0 (0.0%) |
| 16 and 17 Years | 0 (0.0%) | 0 (0.0%) |
| 18 to 24 Years | 0 (0.0%) | 118 (100.0%) |
| 25 to 34 Years | 56 (100.0%) | 141 (100.0%) |
| 35 to 44 Years | 0 (0.0%) | 0 (0.0%) |
| 45 to 54 Years | 0 (0.0%) | 53 (100.0%) |
| 55 to 64 Years | 80 (88.9%) | 115 (85.2%) |
| 65 to 74 Years | 83 (100.0%) | 84 (100.0%) |
| 75 Years and over | 125 (100.0%) | 207 (100.0%) |
| Total | 501 (98.0%) | 842 (97.7%) |
Income Below Poverty Among Married-Couple Families in Rio
The poverty statistics for married-couple families in Rio show that 3.6% or 10 of the total 276 families live below the poverty line. Families with no children have the highest poverty rate of 4.9%, comprising of 10 families. On the other hand, families with 3 or 4 children have the lowest poverty rate of 0.0%, which includes 0 families.
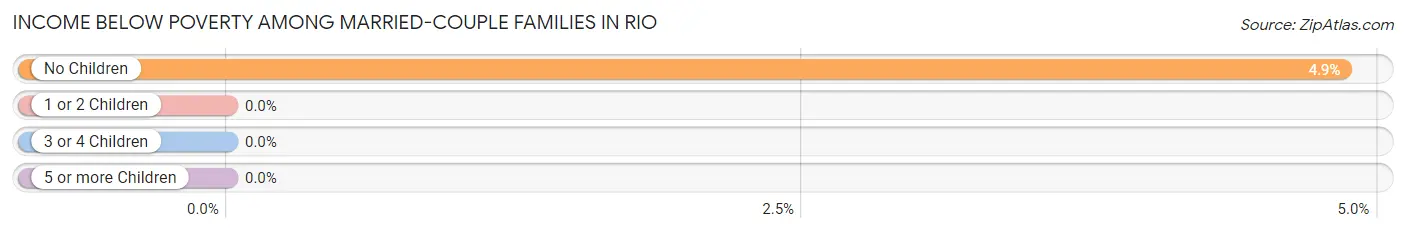
| Children | Above Poverty | Below Poverty |
| No Children | 196 (95.2%) | 10 (4.9%) |
| 1 or 2 Children | 0 (0.0%) | 0 (0.0%) |
| 3 or 4 Children | 70 (100.0%) | 0 (0.0%) |
| 5 or more Children | 0 (0.0%) | 0 (0.0%) |
| Total | 266 (96.4%) | 10 (3.6%) |
Income Below Poverty Among Single-Parent Households in Rio
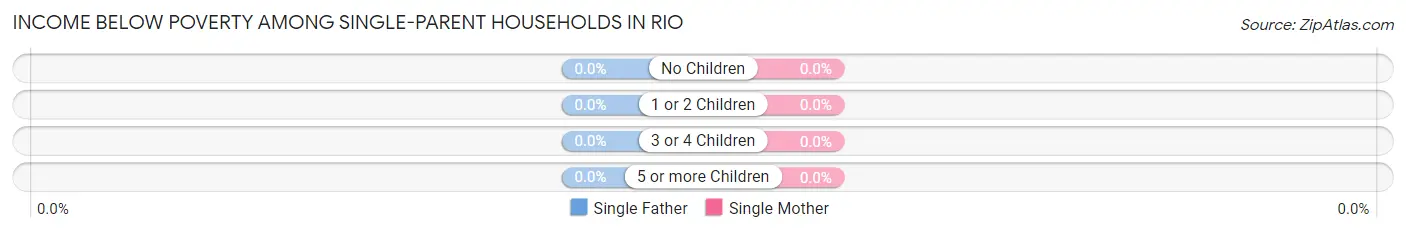
| Children | Single Father | Single Mother |
| No Children | 0 (0.0%) | 0 (0.0%) |
| 1 or 2 Children | 0 (0.0%) | 0 (0.0%) |
| 3 or 4 Children | 0 (0.0%) | 0 (0.0%) |
| 5 or more Children | 0 (0.0%) | 0 (0.0%) |
| Total | 0 (0.0%) | 0 (0.0%) |
Income Below Poverty Among Married-Couple vs Single-Parent Households in Rio
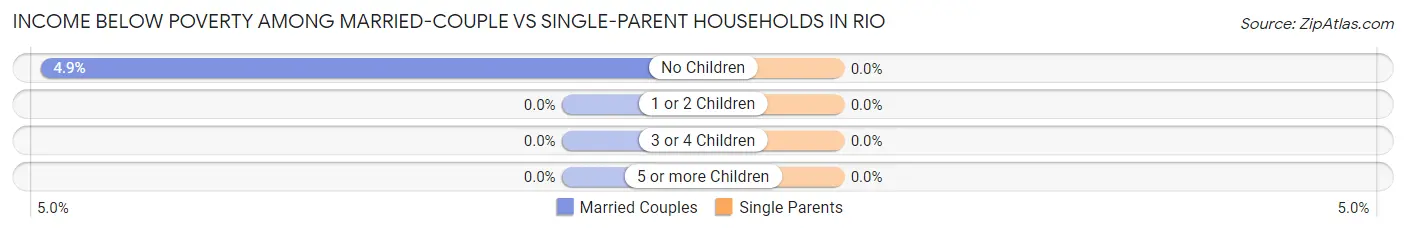
| Children | Married-Couple Families | Single-Parent Households |
| No Children | 10 (4.9%) | 0 (0.0%) |
| 1 or 2 Children | 0 (0.0%) | 0 (0.0%) |
| 3 or 4 Children | 0 (0.0%) | 0 (0.0%) |
| 5 or more Children | 0 (0.0%) | 0 (0.0%) |
| Total | 10 (3.6%) | 0 (0.0%) |
Employment Characteristics in Rio
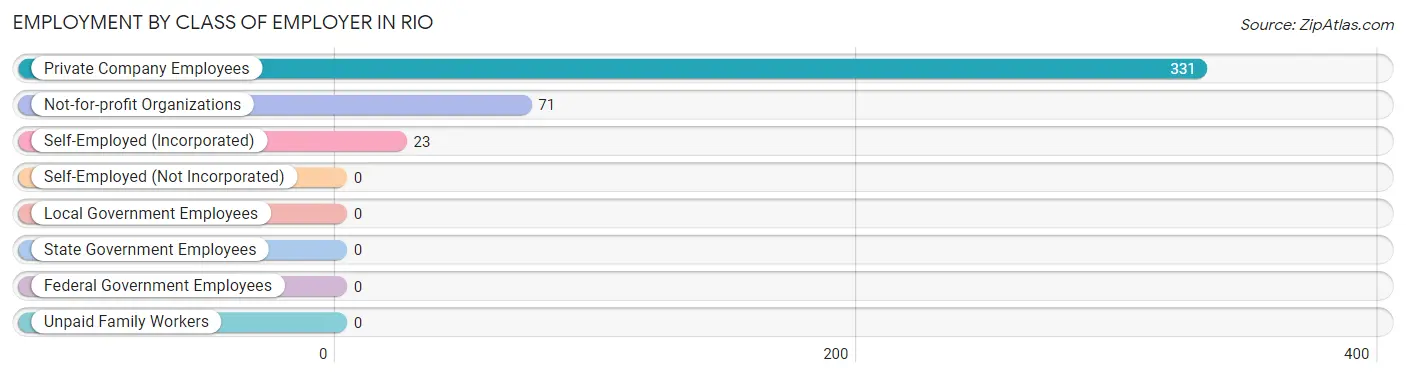
Employment by Class of Employer in Rio
Among the 425 employed individuals in Rio, private company employees (331 | 77.9%), not-for-profit organizations (71 | 16.7%), and self-employed (incorporated) (23 | 5.4%) make up the most common classes of employment.
| Employer Class | # Employees | % Employees |
| Private Company Employees | 331 | 77.9% |
| Self-Employed (Incorporated) | 23 | 5.4% |
| Self-Employed (Not Incorporated) | 0 | 0.0% |
| Not-for-profit Organizations | 71 | 16.7% |
| Local Government Employees | 0 | 0.0% |
| State Government Employees | 0 | 0.0% |
| Federal Government Employees | 0 | 0.0% |
| Unpaid Family Workers | 0 | 0.0% |
| Total | 425 | 100.0% |
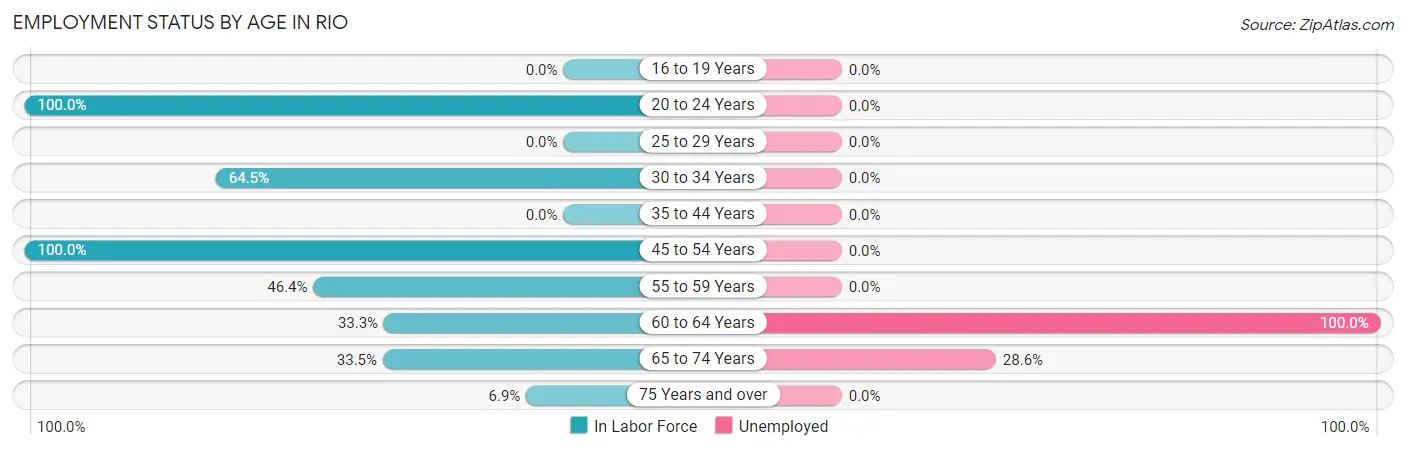
Employment Status by Age in Rio
According to the labor force statistics for Rio, out of the total population over 16 years of age (1,092), 43.0% or 470 individuals are in the labor force, with 9.6% or 45 of them unemployed. The age group with the highest labor force participation rate is 20 to 24 years, with 100.0% or 118 individuals in the labor force. Within the labor force, the 60 to 64 years age range has the highest percentage of unemployed individuals, with 100.0% or 29 of them being unemployed.
| Age Bracket | In Labor Force | Unemployed |
| 16 to 19 Years | 0 (0.0%) | 0 (0.0%) |
| 20 to 24 Years | 118 (100.0%) | 0 (0.0%) |
| 25 to 29 Years | 0 (0.0%) | 0 (0.0%) |
| 30 to 34 Years | 127 (64.5%) | 0 (0.0%) |
| 35 to 44 Years | 0 (0.0%) | 0 (0.0%) |
| 45 to 54 Years | 53 (100.0%) | 0 (0.0%) |
| 55 to 59 Years | 64 (46.4%) | 0 (0.0%) |
| 60 to 64 Years | 29 (33.3%) | 29 (100.0%) |
| 65 to 74 Years | 56 (33.5%) | 16 (28.6%) |
| 75 Years and over | 23 (6.9%) | 0 (0.0%) |
| Total | 470 (43.0%) | 45 (9.6%) |
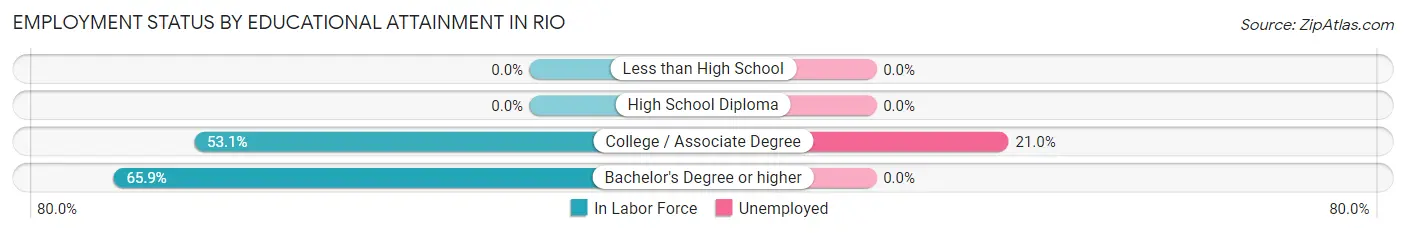
Employment Status by Educational Attainment in Rio
According to labor force statistics for Rio, 57.5% of individuals (273) out of the total population between 25 and 64 years of age (475) are in the labor force, with 10.6% or 29 of them being unemployed. The group with the highest labor force participation rate are those with the educational attainment of bachelor's degree or higher, with 65.9% or 135 individuals in the labor force. Within the labor force, individuals with college / associate degree education have the highest percentage of unemployment, with 21.0% or 29 of them being unemployed.
| Educational Attainment | In Labor Force | Unemployed |
| Less than High School | 0 (0.0%) | 0 (0.0%) |
| High School Diploma | 0 (0.0%) | 0 (0.0%) |
| College / Associate Degree | 138 (53.1%) | 55 (21.0%) |
| Bachelor's Degree or higher | 135 (65.9%) | 0 (0.0%) |
| Total | 273 (57.5%) | 50 (10.6%) |
Employment Occupations by Sex in Rio
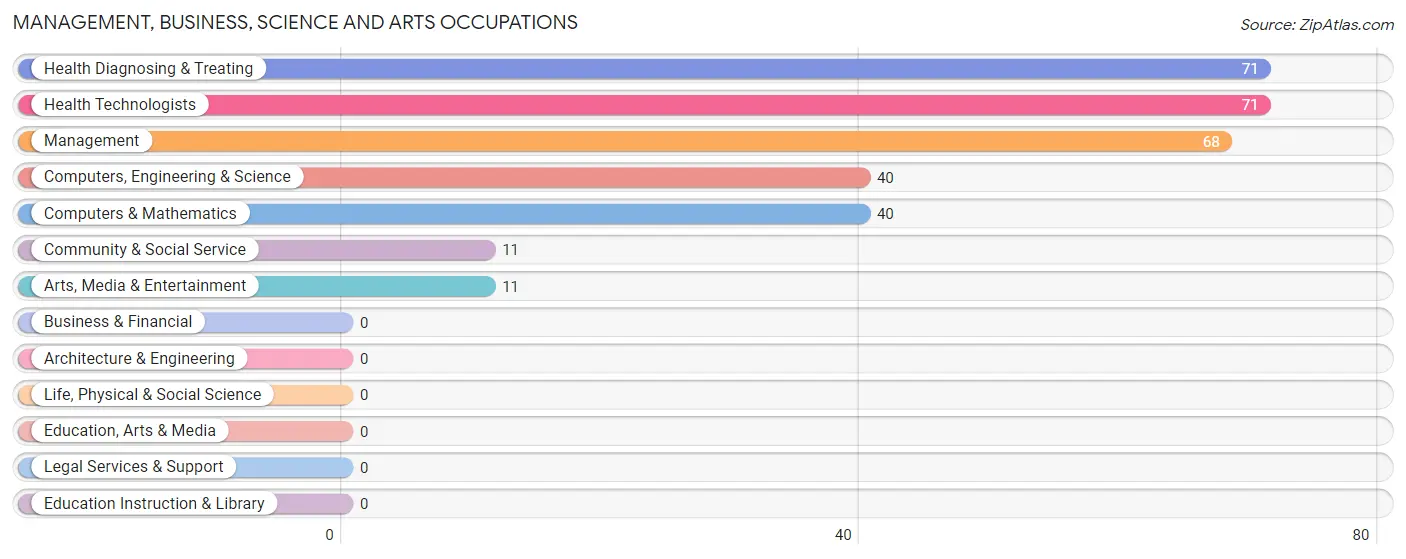
Management, Business, Science and Arts Occupations
The most common Management, Business, Science and Arts occupations in Rio are Health Diagnosing & Treating (71 | 16.7%), Health Technologists (71 | 16.7%), Management (68 | 16.0%), Computers, Engineering & Science (40 | 9.4%), and Computers & Mathematics (40 | 9.4%).
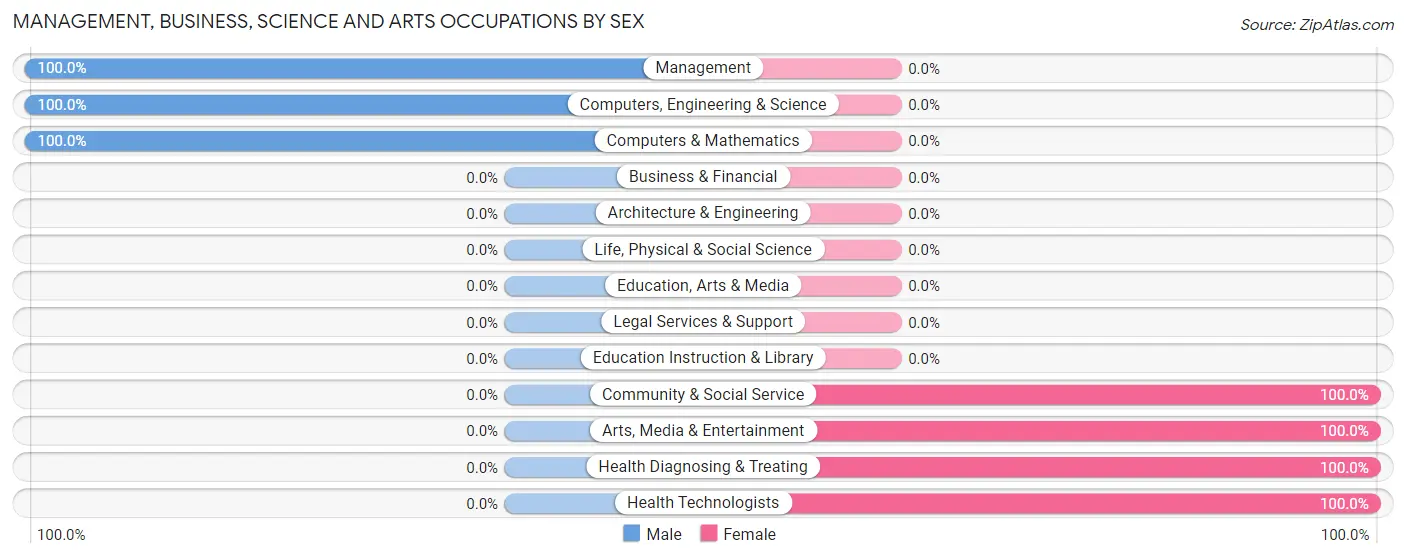
Management, Business, Science and Arts Occupations by Sex
Within the Management, Business, Science and Arts occupations in Rio, the most male-oriented occupations are Management (100.0%), Computers, Engineering & Science (100.0%), and Computers & Mathematics (100.0%), while the most female-oriented occupations are Community & Social Service (100.0%), Arts, Media & Entertainment (100.0%), and Health Diagnosing & Treating (100.0%).
| Occupation | Male | Female |
| Management | 68 (100.0%) | 0 (0.0%) |
| Business & Financial | 0 (0.0%) | 0 (0.0%) |
| Computers, Engineering & Science | 40 (100.0%) | 0 (0.0%) |
| Computers & Mathematics | 40 (100.0%) | 0 (0.0%) |
| Architecture & Engineering | 0 (0.0%) | 0 (0.0%) |
| Life, Physical & Social Science | 0 (0.0%) | 0 (0.0%) |
| Community & Social Service | 0 (0.0%) | 11 (100.0%) |
| Education, Arts & Media | 0 (0.0%) | 0 (0.0%) |
| Legal Services & Support | 0 (0.0%) | 0 (0.0%) |
| Education Instruction & Library | 0 (0.0%) | 0 (0.0%) |
| Arts, Media & Entertainment | 0 (0.0%) | 11 (100.0%) |
| Health Diagnosing & Treating | 0 (0.0%) | 71 (100.0%) |
| Health Technologists | 0 (0.0%) | 71 (100.0%) |
| Total (Category) | 108 (56.8%) | 82 (43.2%) |
| Total (Overall) | 172 (40.5%) | 253 (59.5%) |
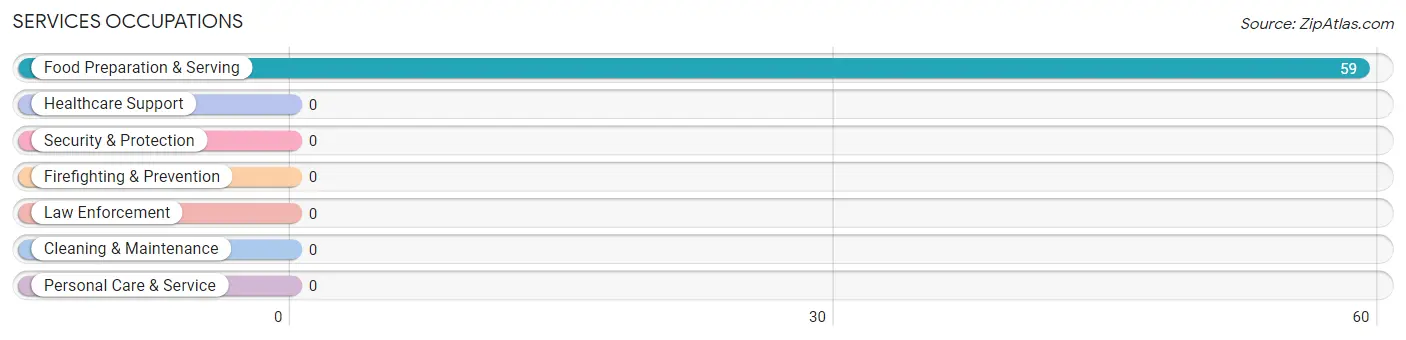
Services Occupations
The most common Services occupations in Rio are , and Food Preparation & Serving (59 | 13.9%).
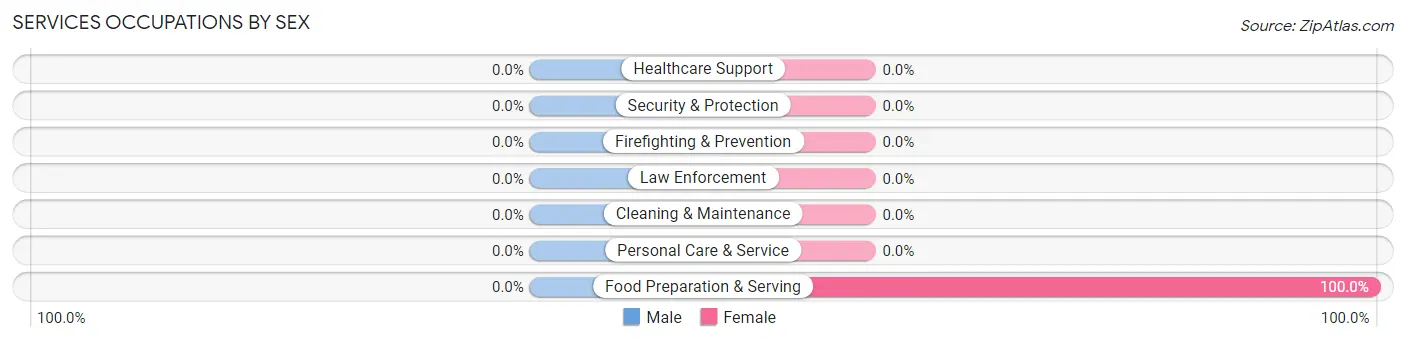
Services Occupations by Sex
| Occupation | Male | Female |
| Healthcare Support | 0 (0.0%) | 0 (0.0%) |
| Security & Protection | 0 (0.0%) | 0 (0.0%) |
| Firefighting & Prevention | 0 (0.0%) | 0 (0.0%) |
| Law Enforcement | 0 (0.0%) | 0 (0.0%) |
| Food Preparation & Serving | 0 (0.0%) | 59 (100.0%) |
| Cleaning & Maintenance | 0 (0.0%) | 0 (0.0%) |
| Personal Care & Service | 0 (0.0%) | 0 (0.0%) |
| Total (Category) | 0 (0.0%) | 59 (100.0%) |
| Total (Overall) | 172 (40.5%) | 253 (59.5%) |
Sales and Office Occupations
The most common Sales and Office occupations in Rio are , and Office & Administration (53 | 12.5%).

Sales and Office Occupations by Sex

| Occupation | Male | Female |
| Sales & Related | 0 (0.0%) | 0 (0.0%) |
| Office & Administration | 0 (0.0%) | 53 (100.0%) |
| Total (Category) | 0 (0.0%) | 53 (100.0%) |
| Total (Overall) | 172 (40.5%) | 253 (59.5%) |
Natural Resources, Construction and Maintenance Occupations

Natural Resources, Construction and Maintenance Occupations by Sex
| Occupation | Male | Female |
| Farming, Fishing & Forestry | 0 (0.0%) | 0 (0.0%) |
| Construction & Extraction | 0 (0.0%) | 0 (0.0%) |
| Installation, Maintenance & Repair | 0 (0.0%) | 0 (0.0%) |
| Total (Category) | 0 (0.0%) | 0 (0.0%) |
| Total (Overall) | 172 (40.5%) | 253 (59.5%) |
Production, Transportation and Moving Occupations
The most common Production, Transportation and Moving occupations in Rio are Production (64 | 15.1%), and Material Moving (59 | 13.9%).
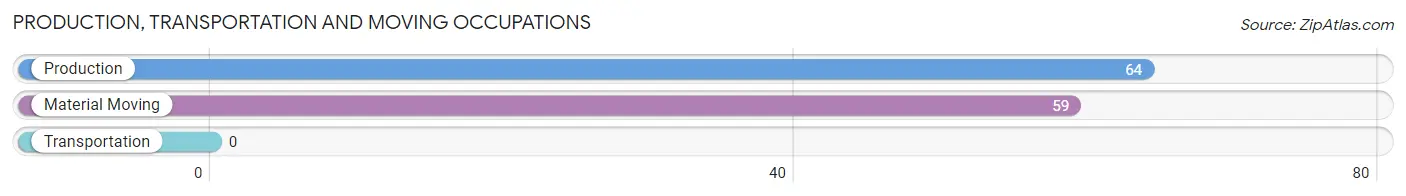
Production, Transportation and Moving Occupations by Sex

| Occupation | Male | Female |
| Production | 64 (100.0%) | 0 (0.0%) |
| Transportation | 0 (0.0%) | 0 (0.0%) |
| Material Moving | 0 (0.0%) | 59 (100.0%) |
| Total (Category) | 64 (52.0%) | 59 (48.0%) |
| Total (Overall) | 172 (40.5%) | 253 (59.5%) |
Employment Industries by Sex in Rio
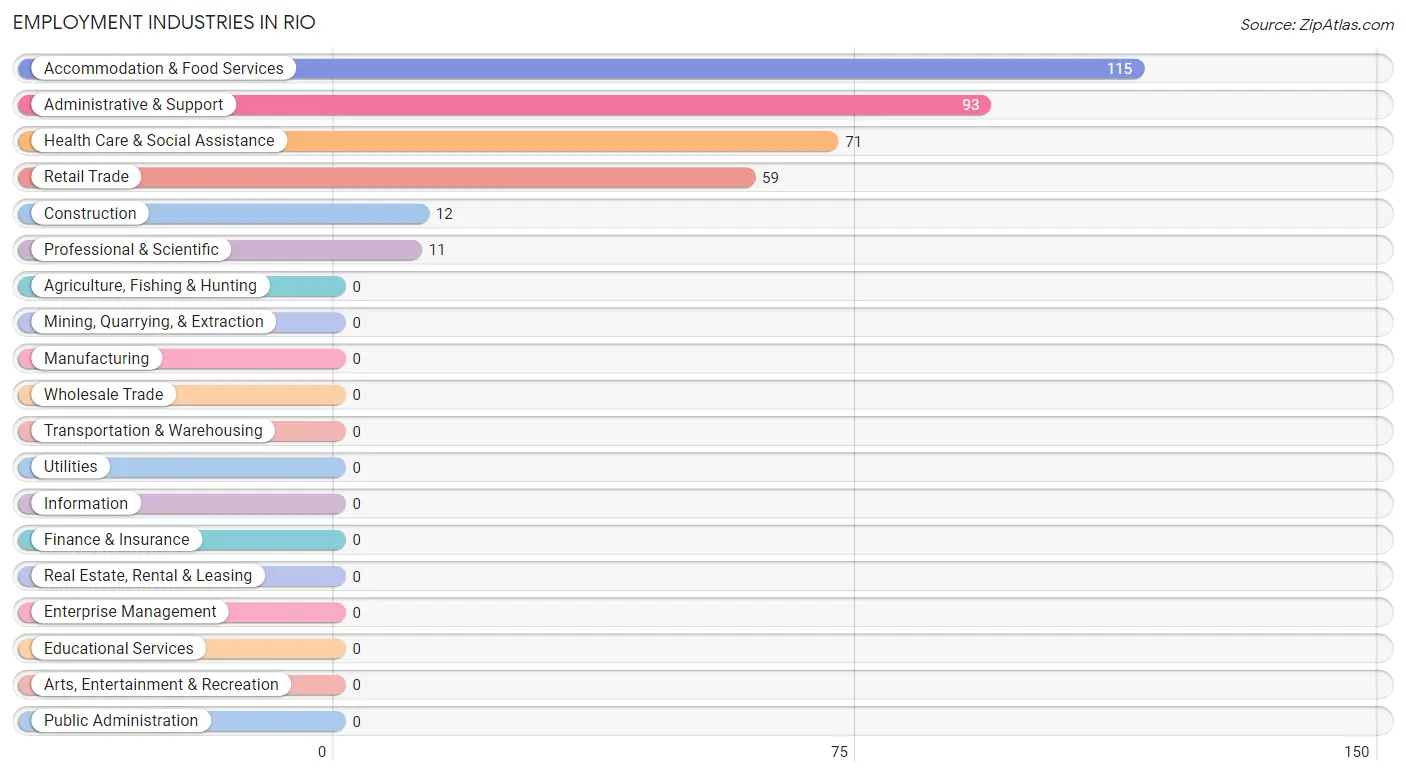
Employment Industries in Rio
The major employment industries in Rio include Accommodation & Food Services (115 | 27.1%), Administrative & Support (93 | 21.9%), Health Care & Social Assistance (71 | 16.7%), Retail Trade (59 | 13.9%), and Construction (12 | 2.8%).
Employment Industries by Sex in Rio
The Rio industries that see more men than women are Construction (100.0%), Accommodation & Food Services (48.7%), and Administrative & Support (43.0%), whereas the industries that tend to have a higher number of women are Retail Trade (100.0%), Professional & Scientific (100.0%), and Health Care & Social Assistance (100.0%).
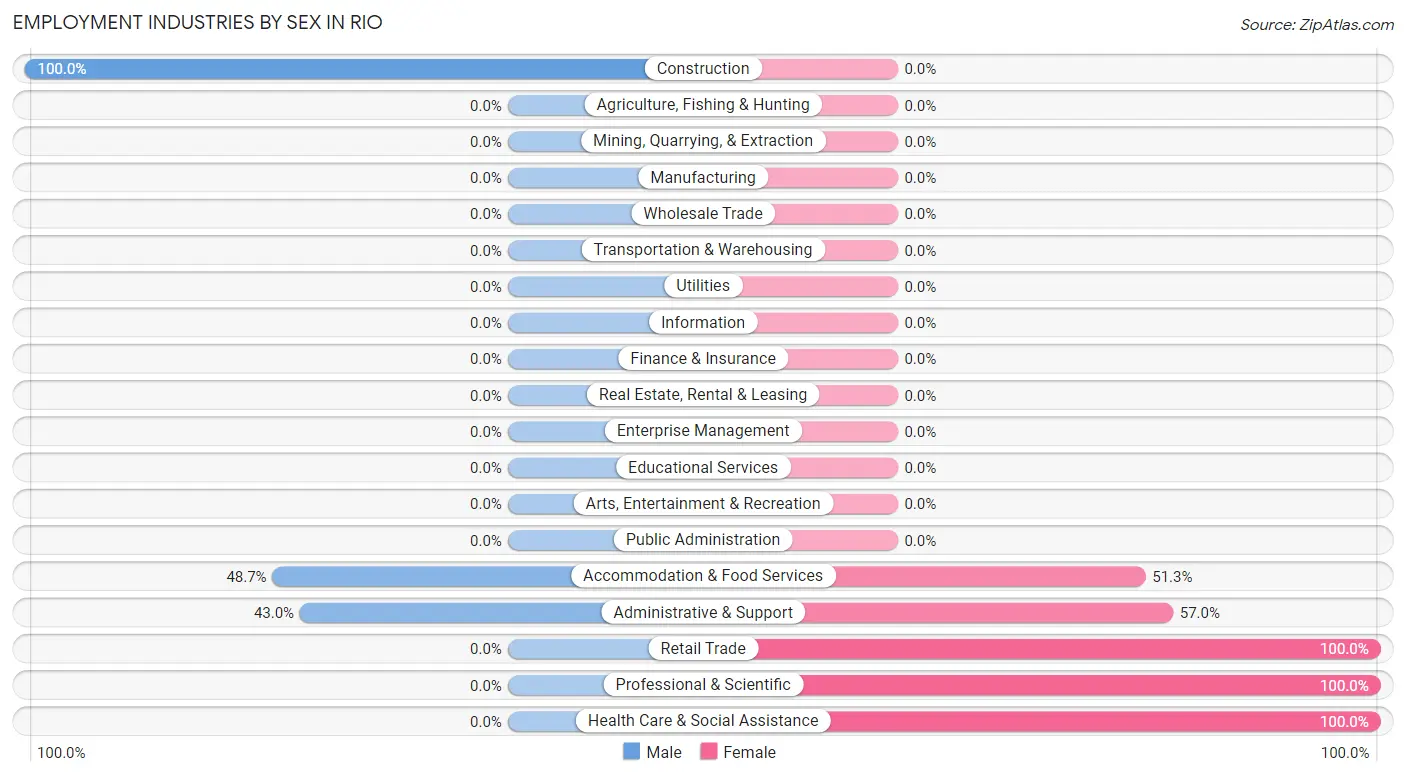
| Industry | Male | Female |
| Agriculture, Fishing & Hunting | 0 (0.0%) | 0 (0.0%) |
| Mining, Quarrying, & Extraction | 0 (0.0%) | 0 (0.0%) |
| Construction | 12 (100.0%) | 0 (0.0%) |
| Manufacturing | 0 (0.0%) | 0 (0.0%) |
| Wholesale Trade | 0 (0.0%) | 0 (0.0%) |
| Retail Trade | 0 (0.0%) | 59 (100.0%) |
| Transportation & Warehousing | 0 (0.0%) | 0 (0.0%) |
| Utilities | 0 (0.0%) | 0 (0.0%) |
| Information | 0 (0.0%) | 0 (0.0%) |
| Finance & Insurance | 0 (0.0%) | 0 (0.0%) |
| Real Estate, Rental & Leasing | 0 (0.0%) | 0 (0.0%) |
| Professional & Scientific | 0 (0.0%) | 11 (100.0%) |
| Enterprise Management | 0 (0.0%) | 0 (0.0%) |
| Administrative & Support | 40 (43.0%) | 53 (57.0%) |
| Educational Services | 0 (0.0%) | 0 (0.0%) |
| Health Care & Social Assistance | 0 (0.0%) | 71 (100.0%) |
| Arts, Entertainment & Recreation | 0 (0.0%) | 0 (0.0%) |
| Accommodation & Food Services | 56 (48.7%) | 59 (51.3%) |
| Public Administration | 0 (0.0%) | 0 (0.0%) |
| Total | 172 (40.5%) | 253 (59.5%) |
Education in Rio
School Enrollment in Rio
The most common levels of schooling among the 231 students in Rio are middle school (169 | 73.2%), and nursery / preschool (62 | 26.8%).
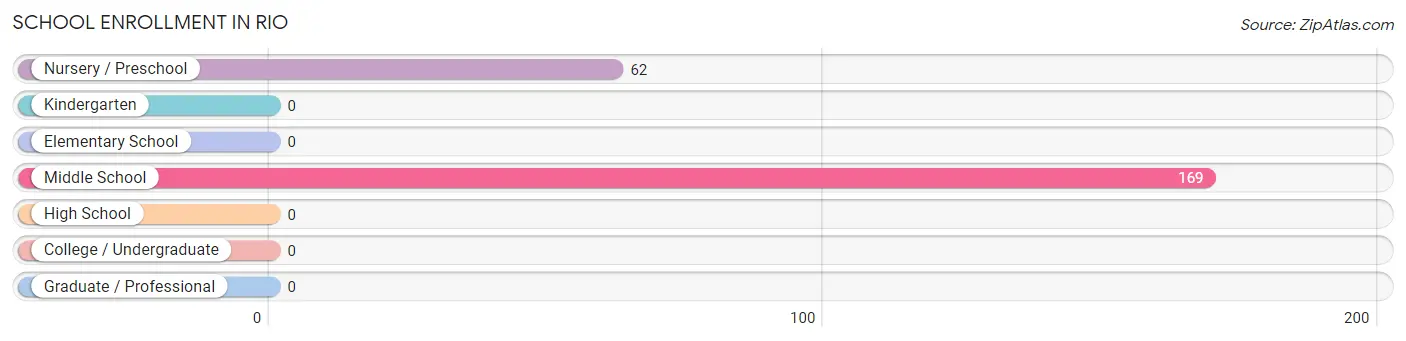
| School Level | # Students | % Students |
| Nursery / Preschool | 62 | 26.8% |
| Kindergarten | 0 | 0.0% |
| Elementary School | 0 | 0.0% |
| Middle School | 169 | 73.2% |
| High School | 0 | 0.0% |
| College / Undergraduate | 0 | 0.0% |
| Graduate / Professional | 0 | 0.0% |
| Total | 231 | 100.0% |
School Enrollment by Age by Funding Source in Rio
Out of a total of 231 students who are enrolled in schools in Rio, 74 (32.0%) attend a private institution, while the remaining 157 (68.0%) are enrolled in public schools. The age group of 3 to 4 year olds has the highest likelihood of being enrolled in private schools, with 62 (100.0% in the age bracket) enrolled. Conversely, the age group of 10 to 14 year olds has the lowest likelihood of being enrolled in a private school, with 157 (100.0% in the age bracket) attending a public institution.
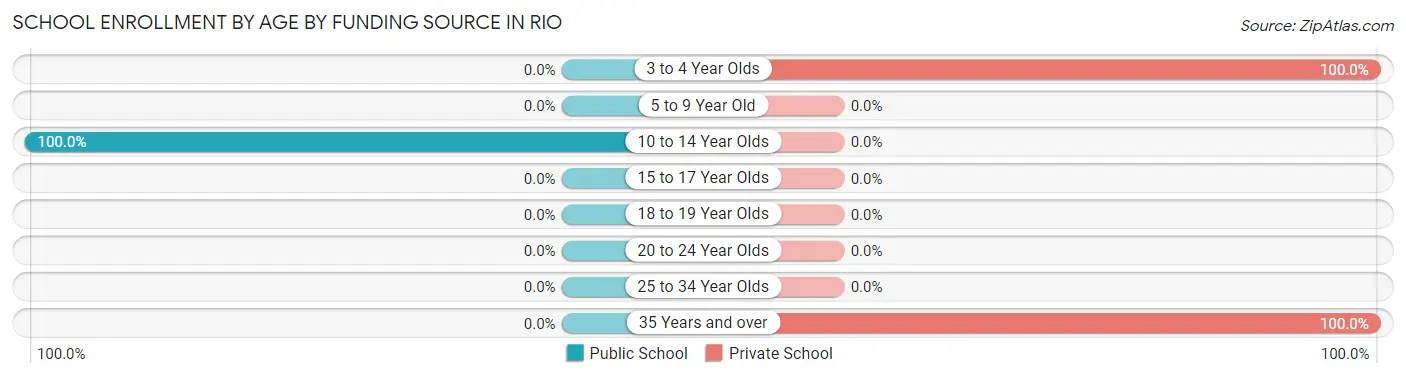
| Age Bracket | Public School | Private School |
| 3 to 4 Year Olds | 0 (0.0%) | 62 (100.0%) |
| 5 to 9 Year Old | 0 (0.0%) | 0 (0.0%) |
| 10 to 14 Year Olds | 157 (100.0%) | 0 (0.0%) |
| 15 to 17 Year Olds | 0 (0.0%) | 0 (0.0%) |
| 18 to 19 Year Olds | 0 (0.0%) | 0 (0.0%) |
| 20 to 24 Year Olds | 0 (0.0%) | 0 (0.0%) |
| 25 to 34 Year Olds | 0 (0.0%) | 0 (0.0%) |
| 35 Years and over | 0 (0.0%) | 12 (100.0%) |
| Total | 157 (68.0%) | 74 (32.0%) |
Educational Attainment by Field of Study in Rio
Bio, nature & agricultural (165 | 52.9%), business (43 | 13.8%), visual & performing arts (33 | 10.6%), education (23 | 7.4%), and engineering (18 | 5.8%) are the most common fields of study among 312 individuals in Rio who have obtained a bachelor's degree or higher.
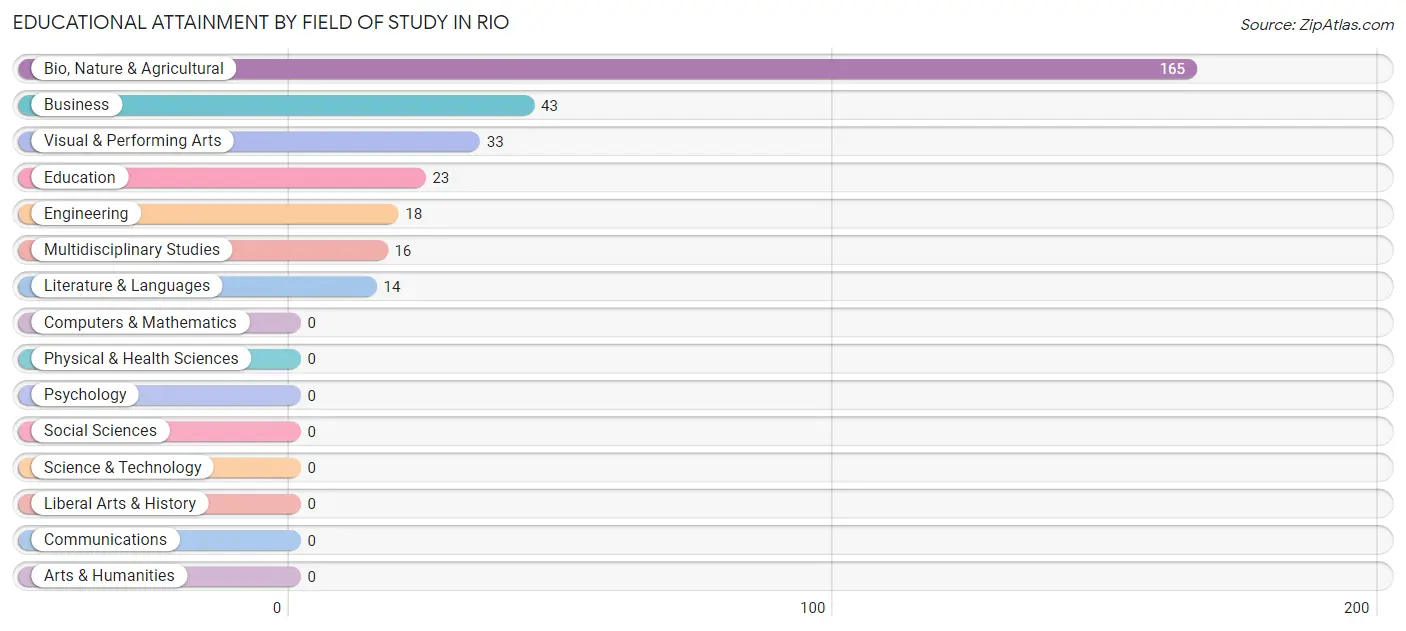
| Field of Study | # Graduates | % Graduates |
| Computers & Mathematics | 0 | 0.0% |
| Bio, Nature & Agricultural | 165 | 52.9% |
| Physical & Health Sciences | 0 | 0.0% |
| Psychology | 0 | 0.0% |
| Social Sciences | 0 | 0.0% |
| Engineering | 18 | 5.8% |
| Multidisciplinary Studies | 16 | 5.1% |
| Science & Technology | 0 | 0.0% |
| Business | 43 | 13.8% |
| Education | 23 | 7.4% |
| Literature & Languages | 14 | 4.5% |
| Liberal Arts & History | 0 | 0.0% |
| Visual & Performing Arts | 33 | 10.6% |
| Communications | 0 | 0.0% |
| Arts & Humanities | 0 | 0.0% |
| Total | 312 | 100.0% |
Transportation & Commute in Rio
Vehicle Availability by Sex in Rio
The most prevalent vehicle ownership categories in Rio are males with 5 or more vehicles (104, accounting for 60.5%) and females with 5 or more vehicles (171, making up 41.1%).
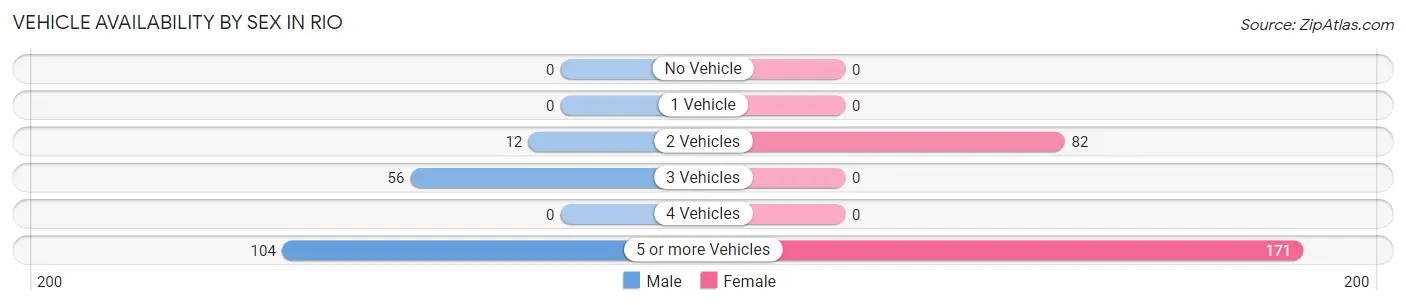
| Vehicles Available | Male | Female |
| No Vehicle | 0 (0.0%) | 0 (0.0%) |
| 1 Vehicle | 0 (0.0%) | 0 (0.0%) |
| 2 Vehicles | 12 (7.0%) | 82 (32.4%) |
| 3 Vehicles | 56 (32.6%) | 0 (0.0%) |
| 4 Vehicles | 0 (0.0%) | 0 (0.0%) |
| 5 or more Vehicles | 104 (60.5%) | 171 (67.6%) |
| Total | 172 (100.0%) | 253 (100.0%) |
Commute Time in Rio
The most frequently occuring commute durations in Rio are 15 to 19 minutes (216 commuters, 53.7%), less than 5 minutes (59 commuters, 14.7%), and 25 to 29 minutes (56 commuters, 13.9%).
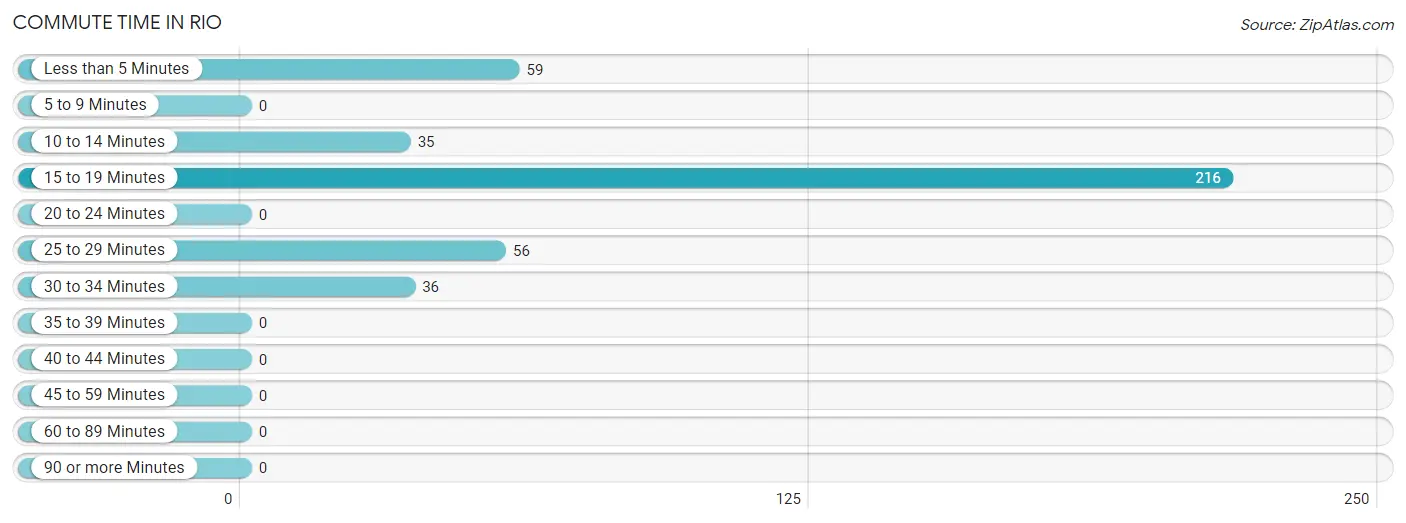
| Commute Time | # Commuters | % Commuters |
| Less than 5 Minutes | 59 | 14.7% |
| 5 to 9 Minutes | 0 | 0.0% |
| 10 to 14 Minutes | 35 | 8.7% |
| 15 to 19 Minutes | 216 | 53.7% |
| 20 to 24 Minutes | 0 | 0.0% |
| 25 to 29 Minutes | 56 | 13.9% |
| 30 to 34 Minutes | 36 | 9.0% |
| 35 to 39 Minutes | 0 | 0.0% |
| 40 to 44 Minutes | 0 | 0.0% |
| 45 to 59 Minutes | 0 | 0.0% |
| 60 to 89 Minutes | 0 | 0.0% |
| 90 or more Minutes | 0 | 0.0% |
Commute Time by Sex in Rio
The most common commute times in Rio are 15 to 19 minutes (104 commuters, 65.0%) for males and 15 to 19 minutes (112 commuters, 46.3%) for females.
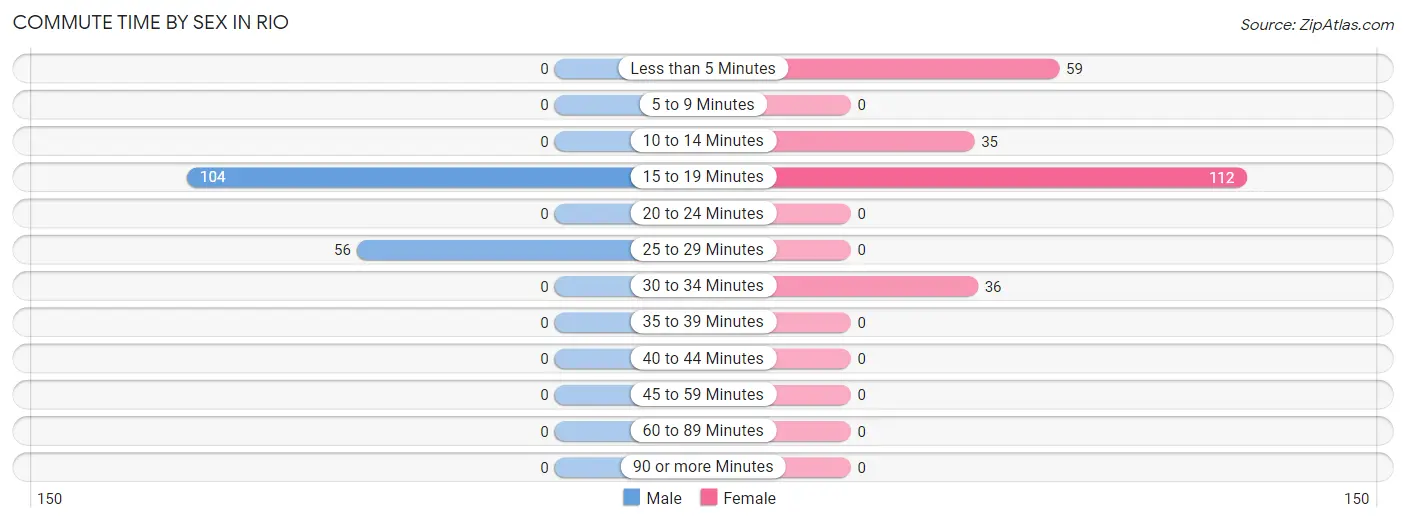
| Commute Time | Male | Female |
| Less than 5 Minutes | 0 (0.0%) | 59 (24.4%) |
| 5 to 9 Minutes | 0 (0.0%) | 0 (0.0%) |
| 10 to 14 Minutes | 0 (0.0%) | 35 (14.5%) |
| 15 to 19 Minutes | 104 (65.0%) | 112 (46.3%) |
| 20 to 24 Minutes | 0 (0.0%) | 0 (0.0%) |
| 25 to 29 Minutes | 56 (35.0%) | 0 (0.0%) |
| 30 to 34 Minutes | 0 (0.0%) | 36 (14.9%) |
| 35 to 39 Minutes | 0 (0.0%) | 0 (0.0%) |
| 40 to 44 Minutes | 0 (0.0%) | 0 (0.0%) |
| 45 to 59 Minutes | 0 (0.0%) | 0 (0.0%) |
| 60 to 89 Minutes | 0 (0.0%) | 0 (0.0%) |
| 90 or more Minutes | 0 (0.0%) | 0 (0.0%) |
Time of Departure to Work by Sex in Rio
The most frequent times of departure to work in Rio are 6:30 AM to 6:59 AM (64, 40.0%) for males and 7:00 AM to 7:29 AM (148, 61.2%) for females.
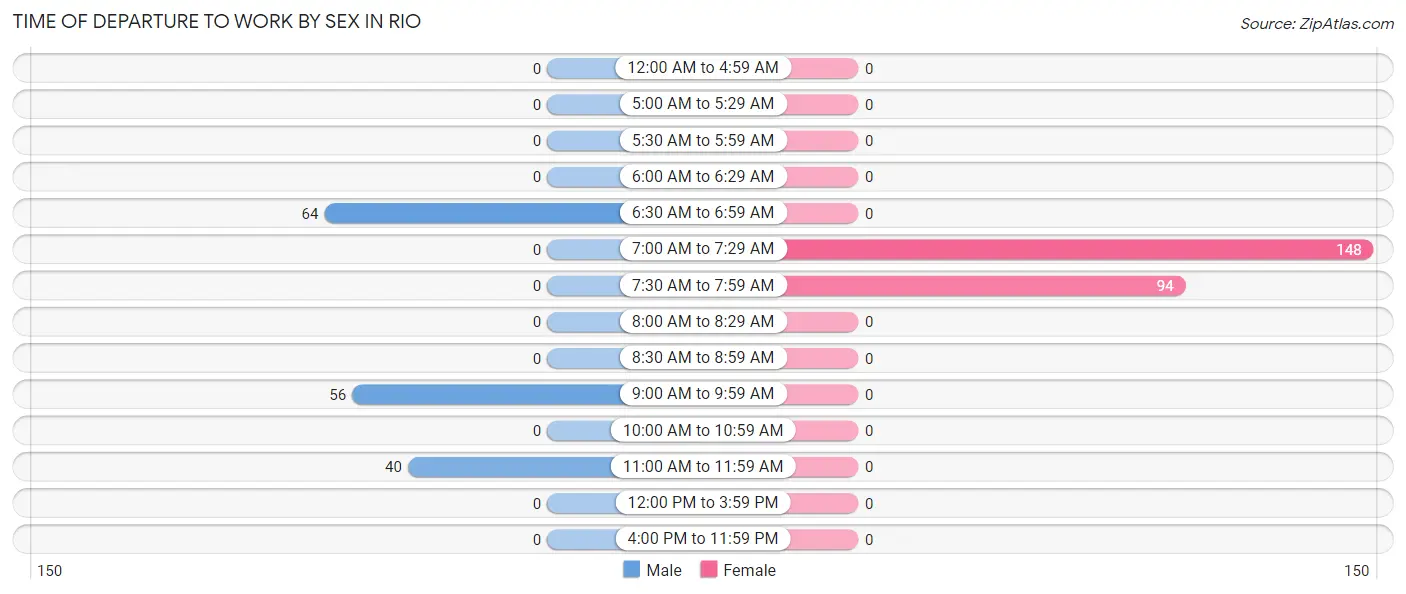
| Time of Departure | Male | Female |
| 12:00 AM to 4:59 AM | 0 (0.0%) | 0 (0.0%) |
| 5:00 AM to 5:29 AM | 0 (0.0%) | 0 (0.0%) |
| 5:30 AM to 5:59 AM | 0 (0.0%) | 0 (0.0%) |
| 6:00 AM to 6:29 AM | 0 (0.0%) | 0 (0.0%) |
| 6:30 AM to 6:59 AM | 64 (40.0%) | 0 (0.0%) |
| 7:00 AM to 7:29 AM | 0 (0.0%) | 148 (61.2%) |
| 7:30 AM to 7:59 AM | 0 (0.0%) | 94 (38.8%) |
| 8:00 AM to 8:29 AM | 0 (0.0%) | 0 (0.0%) |
| 8:30 AM to 8:59 AM | 0 (0.0%) | 0 (0.0%) |
| 9:00 AM to 9:59 AM | 56 (35.0%) | 0 (0.0%) |
| 10:00 AM to 10:59 AM | 0 (0.0%) | 0 (0.0%) |
| 11:00 AM to 11:59 AM | 40 (25.0%) | 0 (0.0%) |
| 12:00 PM to 3:59 PM | 0 (0.0%) | 0 (0.0%) |
| 4:00 PM to 11:59 PM | 0 (0.0%) | 0 (0.0%) |
| Total | 160 (100.0%) | 242 (100.0%) |
Housing Occupancy in Rio
Occupancy by Ownership in Rio
Of the total 495 dwellings in Rio, owner-occupied units account for 485 (98.0%), while renter-occupied units make up 10 (2.0%).
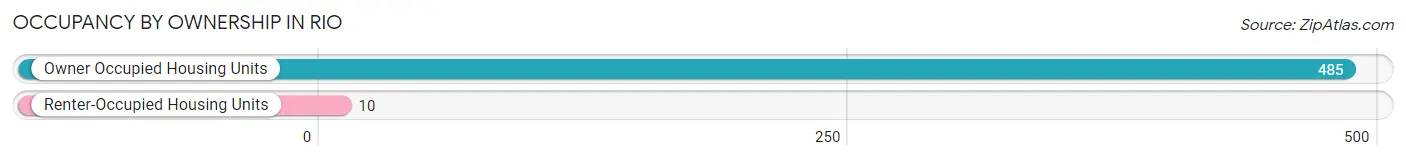
| Occupancy | # Housing Units | % Housing Units |
| Owner Occupied Housing Units | 485 | 98.0% |
| Renter-Occupied Housing Units | 10 | 2.0% |
| Total Occupied Housing Units | 495 | 100.0% |
Occupancy by Household Size in Rio
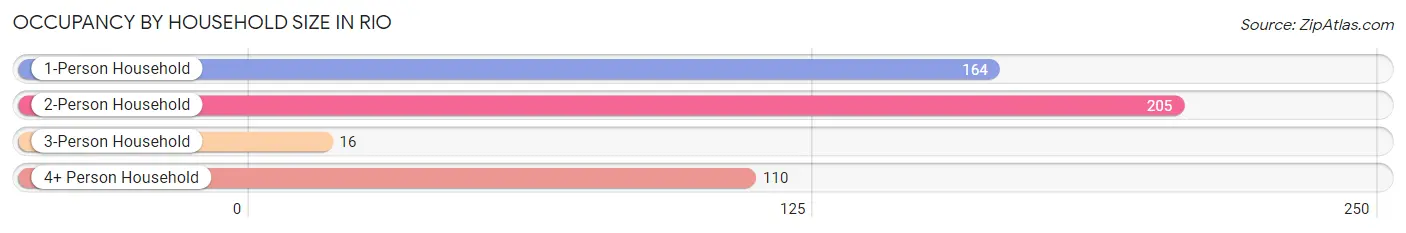
| Household Size | # Housing Units | % Housing Units |
| 1-Person Household | 164 | 33.1% |
| 2-Person Household | 205 | 41.4% |
| 3-Person Household | 16 | 3.2% |
| 4+ Person Household | 110 | 22.2% |
| Total Housing Units | 495 | 100.0% |
Occupancy by Ownership by Household Size in Rio
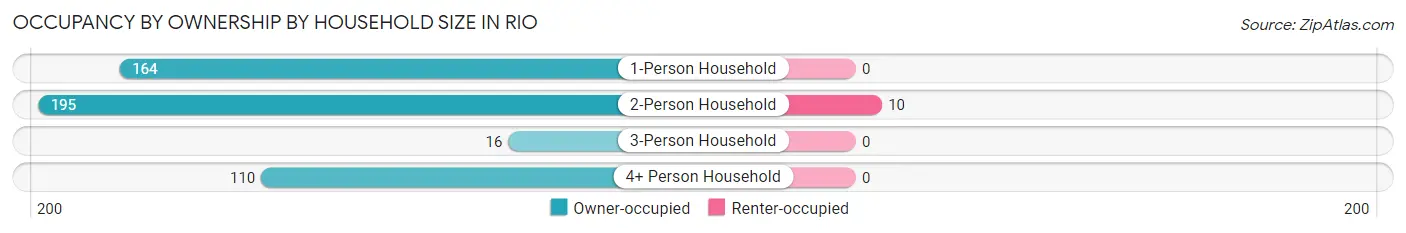
| Household Size | Owner-occupied | Renter-occupied |
| 1-Person Household | 164 (100.0%) | 0 (0.0%) |
| 2-Person Household | 195 (95.1%) | 10 (4.9%) |
| 3-Person Household | 16 (100.0%) | 0 (0.0%) |
| 4+ Person Household | 110 (100.0%) | 0 (0.0%) |
| Total Housing Units | 485 (98.0%) | 10 (2.0%) |
Occupancy by Educational Attainment in Rio
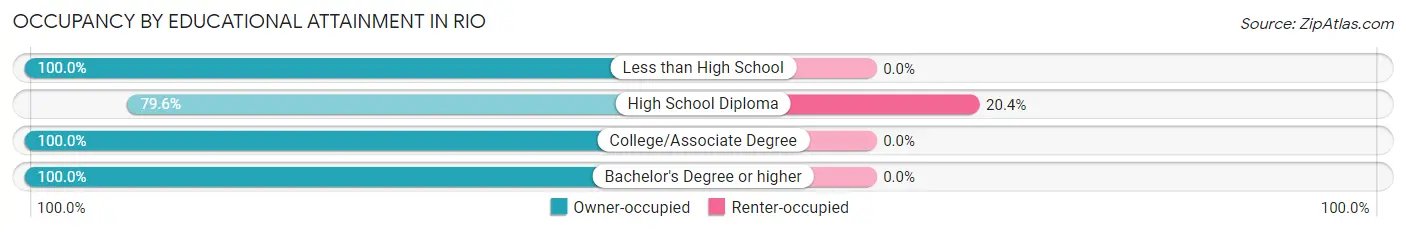
| Household Size | Owner-occupied | Renter-occupied |
| Less than High School | 12 (100.0%) | 0 (0.0%) |
| High School Diploma | 39 (79.6%) | 10 (20.4%) |
| College/Associate Degree | 240 (100.0%) | 0 (0.0%) |
| Bachelor's Degree or higher | 194 (100.0%) | 0 (0.0%) |
Occupancy by Age of Householder in Rio
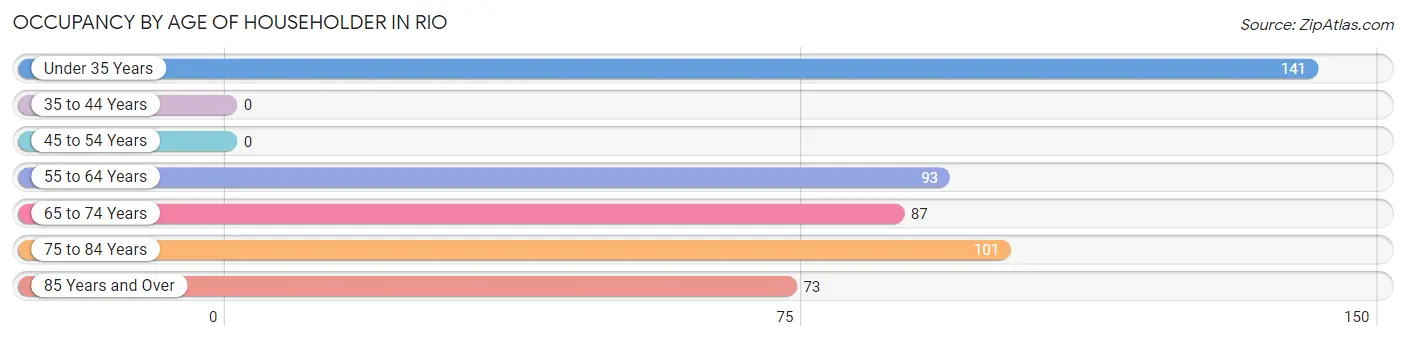
| Age Bracket | # Households | % Households |
| Under 35 Years | 141 | 28.5% |
| 35 to 44 Years | 0 | 0.0% |
| 45 to 54 Years | 0 | 0.0% |
| 55 to 64 Years | 93 | 18.8% |
| 65 to 74 Years | 87 | 17.6% |
| 75 to 84 Years | 101 | 20.4% |
| 85 Years and Over | 73 | 14.7% |
| Total | 495 | 100.0% |
Housing Finances in Rio
Median Income by Occupancy in Rio
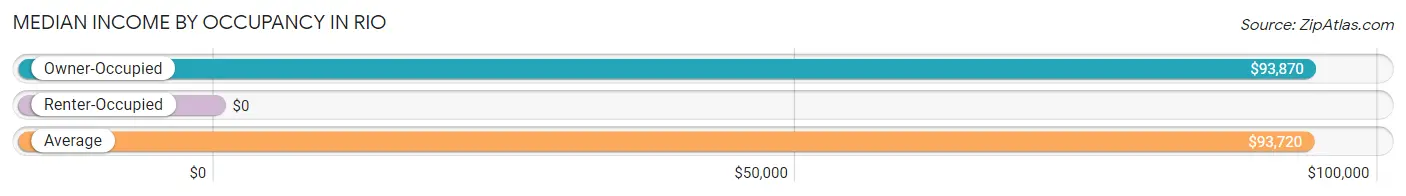
| Occupancy Type | # Households | Median Income |
| Owner-Occupied | 485 (98.0%) | $93,870 |
| Renter-Occupied | 10 (2.0%) | $0 |
| Average | 495 (100.0%) | $93,720 |
Occupancy by Householder Income Bracket in Rio
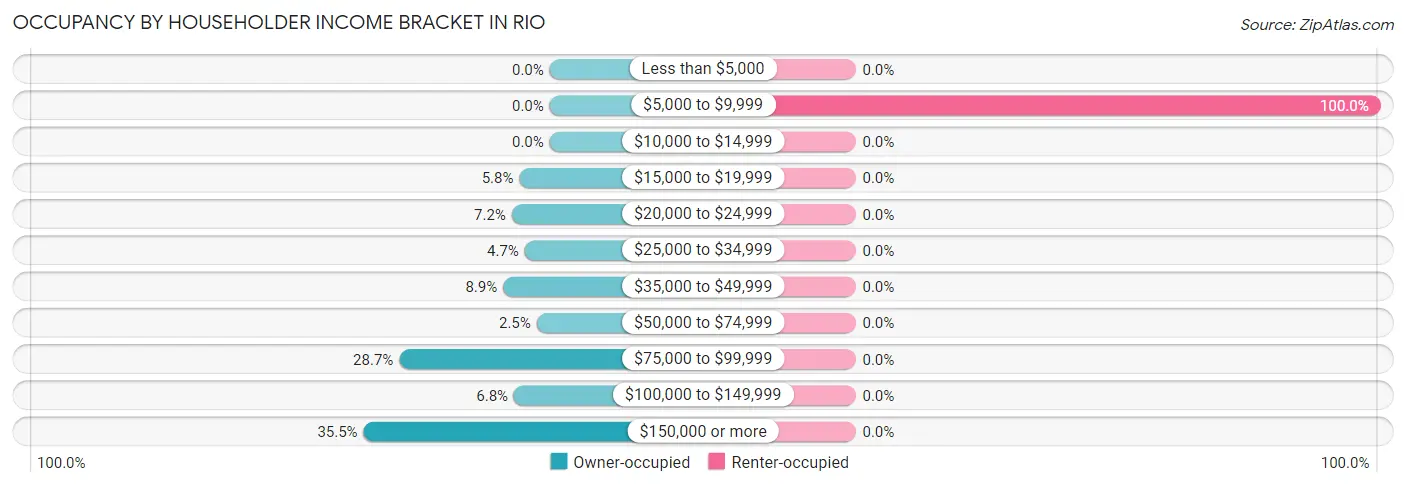
| Income Bracket | Owner-occupied | Renter-occupied |
| Less than $5,000 | 0 (0.0%) | 0 (0.0%) |
| $5,000 to $9,999 | 0 (0.0%) | 10 (100.0%) |
| $10,000 to $14,999 | 0 (0.0%) | 0 (0.0%) |
| $15,000 to $19,999 | 28 (5.8%) | 0 (0.0%) |
| $20,000 to $24,999 | 35 (7.2%) | 0 (0.0%) |
| $25,000 to $34,999 | 23 (4.7%) | 0 (0.0%) |
| $35,000 to $49,999 | 43 (8.9%) | 0 (0.0%) |
| $50,000 to $74,999 | 12 (2.5%) | 0 (0.0%) |
| $75,000 to $99,999 | 139 (28.7%) | 0 (0.0%) |
| $100,000 to $149,999 | 33 (6.8%) | 0 (0.0%) |
| $150,000 or more | 172 (35.5%) | 0 (0.0%) |
| Total | 485 (100.0%) | 10 (100.0%) |
Monthly Housing Cost Tiers in Rio
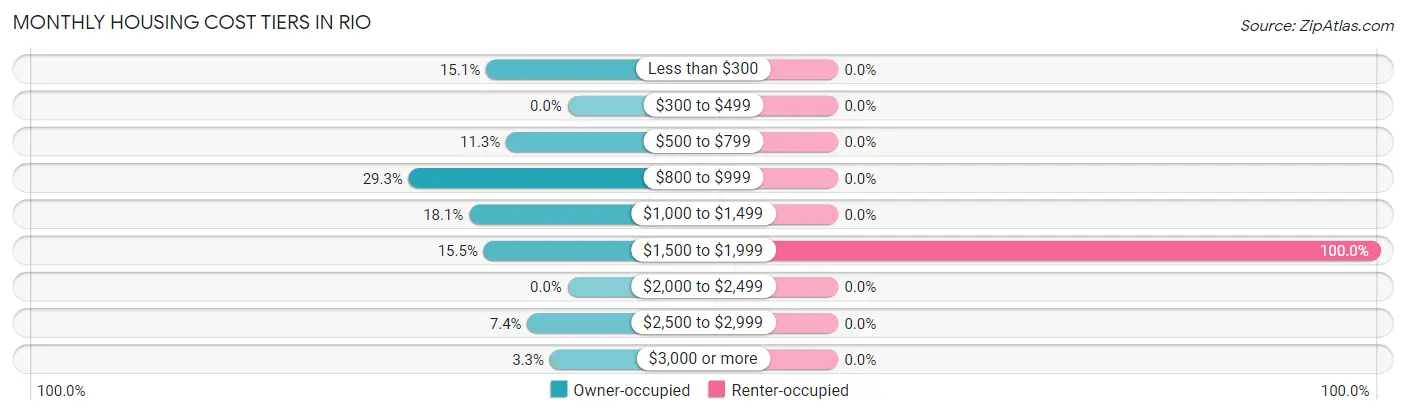
| Monthly Cost | Owner-occupied | Renter-occupied |
| Less than $300 | 73 (15.0%) | 0 (0.0%) |
| $300 to $499 | 0 (0.0%) | 0 (0.0%) |
| $500 to $799 | 55 (11.3%) | 0 (0.0%) |
| $800 to $999 | 142 (29.3%) | 0 (0.0%) |
| $1,000 to $1,499 | 88 (18.1%) | 0 (0.0%) |
| $1,500 to $1,999 | 75 (15.5%) | 10 (100.0%) |
| $2,000 to $2,499 | 0 (0.0%) | 0 (0.0%) |
| $2,500 to $2,999 | 36 (7.4%) | 0 (0.0%) |
| $3,000 or more | 16 (3.3%) | 0 (0.0%) |
| Total | 485 (100.0%) | 10 (100.0%) |
Physical Housing Characteristics in Rio
Housing Structures in Rio
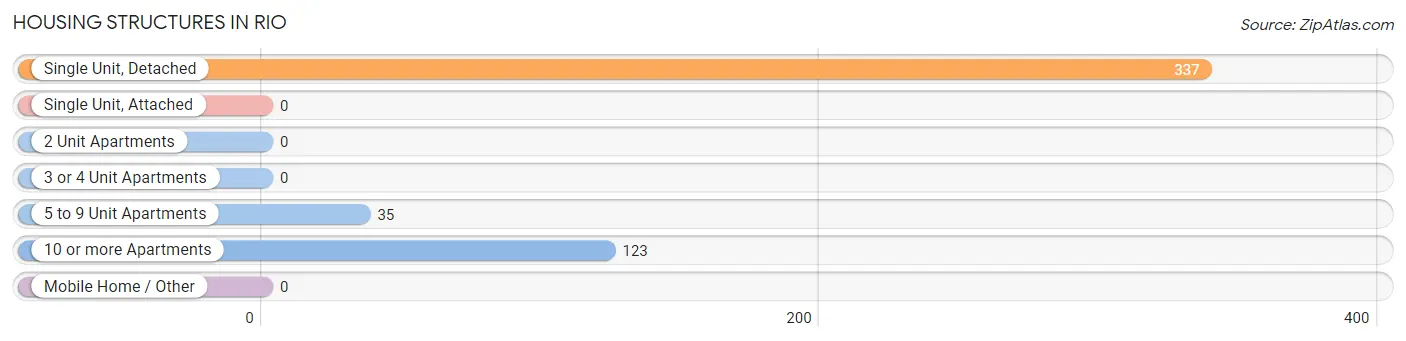
| Structure Type | # Housing Units | % Housing Units |
| Single Unit, Detached | 337 | 68.1% |
| Single Unit, Attached | 0 | 0.0% |
| 2 Unit Apartments | 0 | 0.0% |
| 3 or 4 Unit Apartments | 0 | 0.0% |
| 5 to 9 Unit Apartments | 35 | 7.1% |
| 10 or more Apartments | 123 | 24.8% |
| Mobile Home / Other | 0 | 0.0% |
| Total | 495 | 100.0% |
Housing Structures by Occupancy in Rio
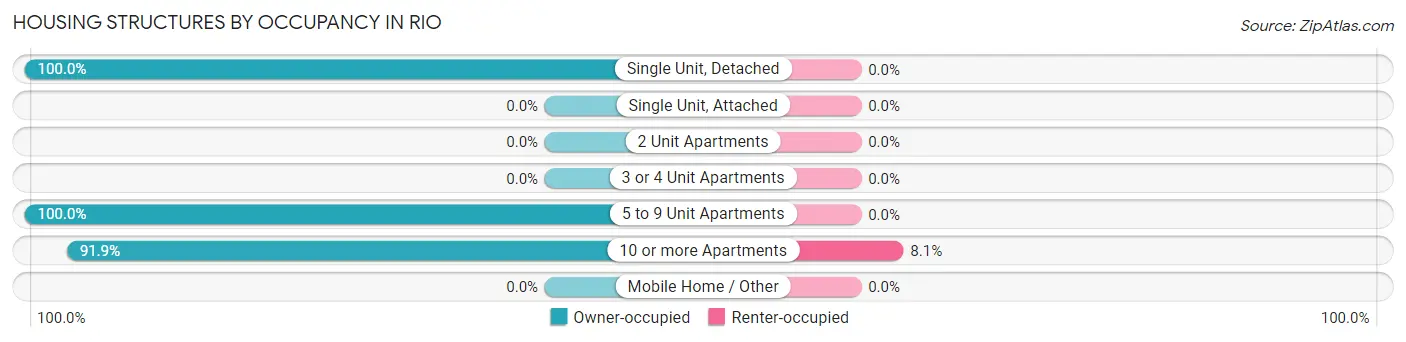
| Structure Type | Owner-occupied | Renter-occupied |
| Single Unit, Detached | 337 (100.0%) | 0 (0.0%) |
| Single Unit, Attached | 0 (0.0%) | 0 (0.0%) |
| 2 Unit Apartments | 0 (0.0%) | 0 (0.0%) |
| 3 or 4 Unit Apartments | 0 (0.0%) | 0 (0.0%) |
| 5 to 9 Unit Apartments | 35 (100.0%) | 0 (0.0%) |
| 10 or more Apartments | 113 (91.9%) | 10 (8.1%) |
| Mobile Home / Other | 0 (0.0%) | 0 (0.0%) |
| Total | 485 (98.0%) | 10 (2.0%) |
Housing Structures by Number of Rooms in Rio
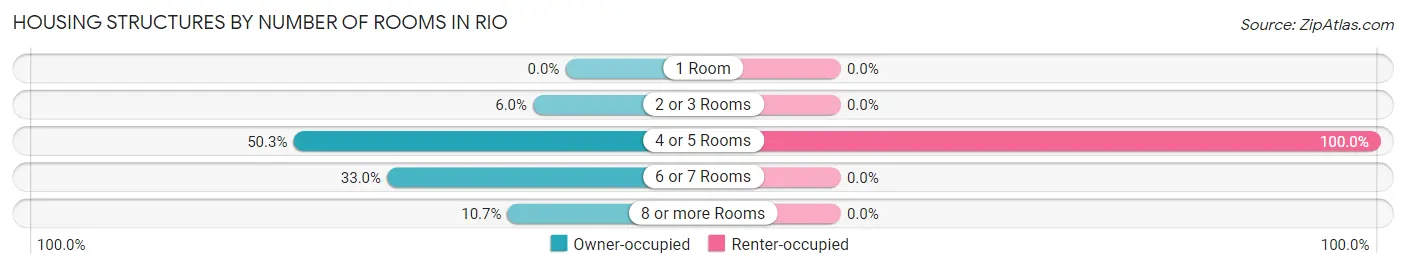
| Number of Rooms | Owner-occupied | Renter-occupied |
| 1 Room | 0 (0.0%) | 0 (0.0%) |
| 2 or 3 Rooms | 29 (6.0%) | 0 (0.0%) |
| 4 or 5 Rooms | 244 (50.3%) | 10 (100.0%) |
| 6 or 7 Rooms | 160 (33.0%) | 0 (0.0%) |
| 8 or more Rooms | 52 (10.7%) | 0 (0.0%) |
| Total | 485 (100.0%) | 10 (100.0%) |
Housing Structure by Heating Type in Rio
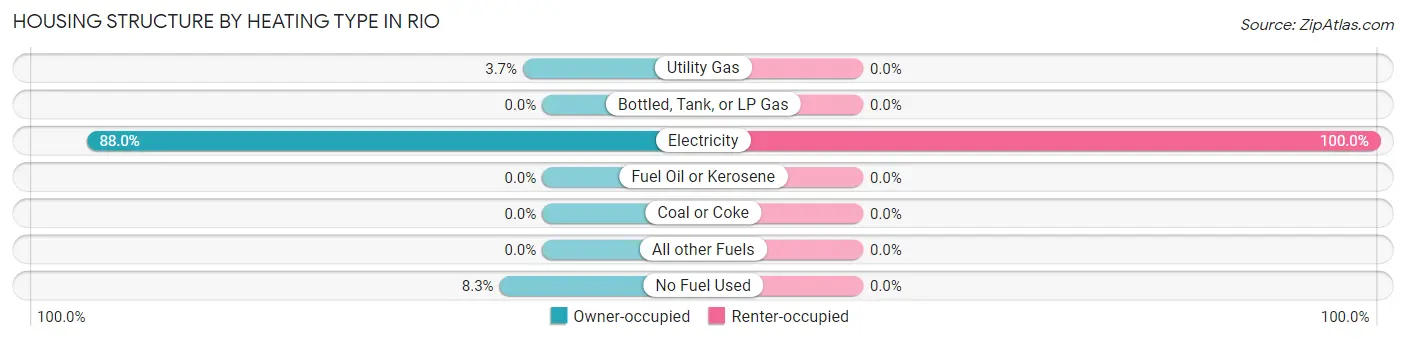
| Heating Type | Owner-occupied | Renter-occupied |
| Utility Gas | 18 (3.7%) | 0 (0.0%) |
| Bottled, Tank, or LP Gas | 0 (0.0%) | 0 (0.0%) |
| Electricity | 427 (88.0%) | 10 (100.0%) |
| Fuel Oil or Kerosene | 0 (0.0%) | 0 (0.0%) |
| Coal or Coke | 0 (0.0%) | 0 (0.0%) |
| All other Fuels | 0 (0.0%) | 0 (0.0%) |
| No Fuel Used | 40 (8.3%) | 0 (0.0%) |
| Total | 485 (100.0%) | 10 (100.0%) |
Household Vehicle Usage in Rio
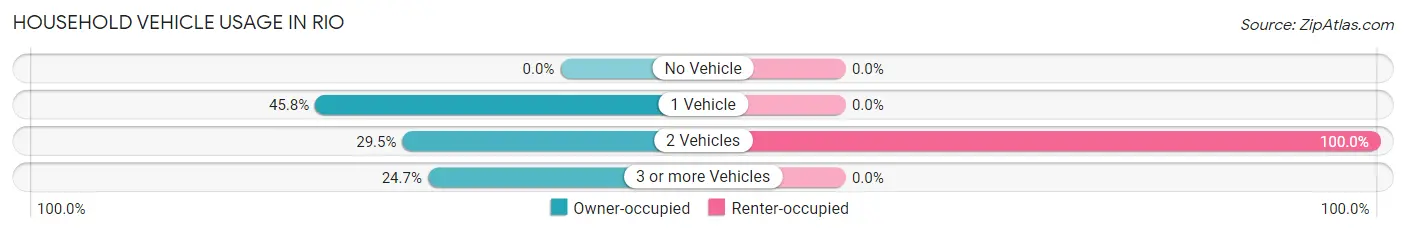
| Vehicles per Household | Owner-occupied | Renter-occupied |
| No Vehicle | 0 (0.0%) | 0 (0.0%) |
| 1 Vehicle | 222 (45.8%) | 0 (0.0%) |
| 2 Vehicles | 143 (29.5%) | 10 (100.0%) |
| 3 or more Vehicles | 120 (24.7%) | 0 (0.0%) |
| Total | 485 (100.0%) | 10 (100.0%) |
Real Estate & Mortgages in Rio
Real Estate and Mortgage Overview in Rio
| Characteristic | Without Mortgage | With Mortgage |
| Housing Units | 260 | 225 |
| Median Property Value | $276,000 | $415,800 |
| Median Household Income | $80,759 | $127 |
| Monthly Housing Costs | $843 | $16 |
| Real Estate Taxes | $2,567 | $35 |
Property Value by Mortgage Status in Rio
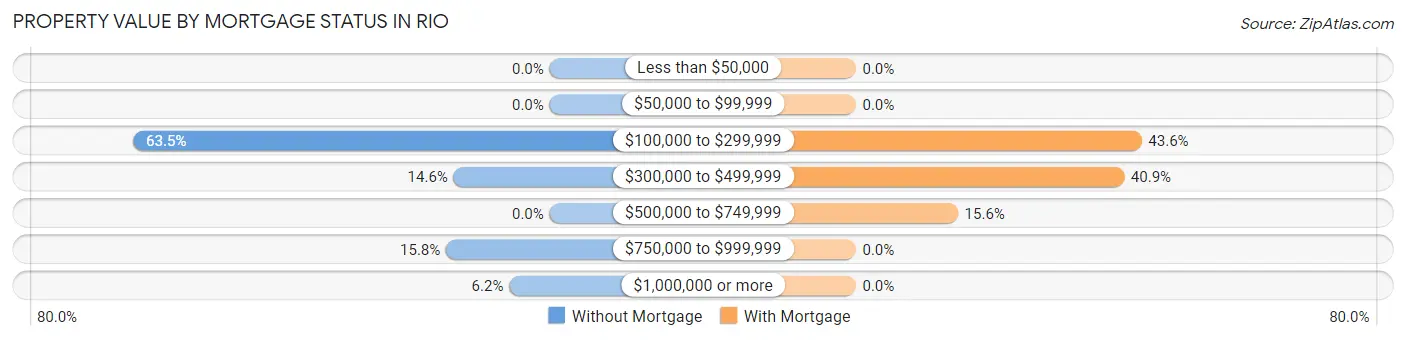
| Property Value | Without Mortgage | With Mortgage |
| Less than $50,000 | 0 (0.0%) | 0 (0.0%) |
| $50,000 to $99,999 | 0 (0.0%) | 0 (0.0%) |
| $100,000 to $299,999 | 165 (63.5%) | 98 (43.6%) |
| $300,000 to $499,999 | 38 (14.6%) | 92 (40.9%) |
| $500,000 to $749,999 | 0 (0.0%) | 35 (15.6%) |
| $750,000 to $999,999 | 41 (15.8%) | 0 (0.0%) |
| $1,000,000 or more | 16 (6.1%) | 0 (0.0%) |
| Total | 260 (100.0%) | 225 (100.0%) |
Household Income by Mortgage Status in Rio
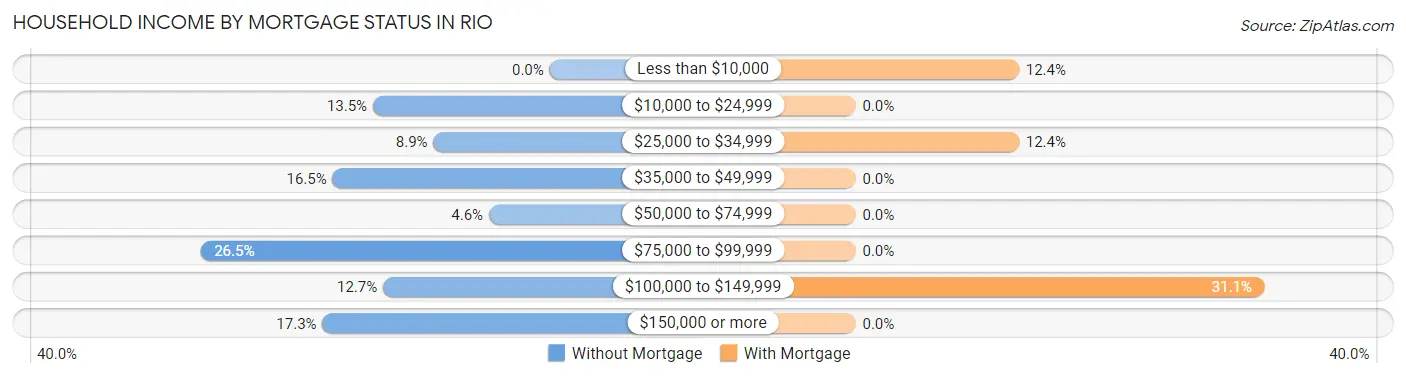
| Household Income | Without Mortgage | With Mortgage |
| Less than $10,000 | 0 (0.0%) | 28 (12.4%) |
| $10,000 to $24,999 | 35 (13.5%) | 0 (0.0%) |
| $25,000 to $34,999 | 23 (8.8%) | 28 (12.4%) |
| $35,000 to $49,999 | 43 (16.5%) | 0 (0.0%) |
| $50,000 to $74,999 | 12 (4.6%) | 0 (0.0%) |
| $75,000 to $99,999 | 69 (26.5%) | 0 (0.0%) |
| $100,000 to $149,999 | 33 (12.7%) | 70 (31.1%) |
| $150,000 or more | 45 (17.3%) | 0 (0.0%) |
| Total | 260 (100.0%) | 225 (100.0%) |
Property Value to Household Income Ratio in Rio
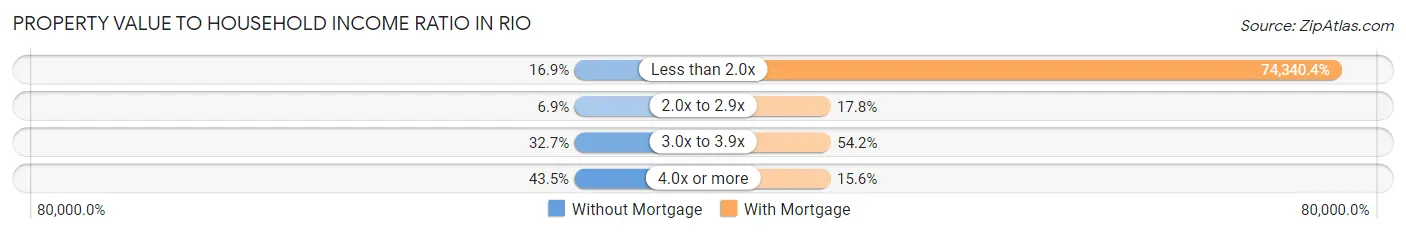
| Value-to-Income Ratio | Without Mortgage | With Mortgage |
| Less than 2.0x | 44 (16.9%) | 167,266 (74,340.4%) |
| 2.0x to 2.9x | 18 (6.9%) | 40 (17.8%) |
| 3.0x to 3.9x | 85 (32.7%) | 122 (54.2%) |
| 4.0x or more | 113 (43.5%) | 35 (15.6%) |
| Total | 260 (100.0%) | 225 (100.0%) |
Real Estate Taxes by Mortgage Status in Rio
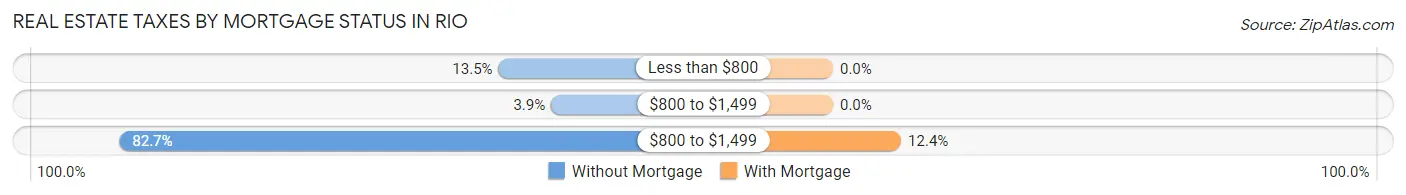
| Property Taxes | Without Mortgage | With Mortgage |
| Less than $800 | 35 (13.5%) | 0 (0.0%) |
| $800 to $1,499 | 10 (3.8%) | 0 (0.0%) |
| $800 to $1,499 | 215 (82.7%) | 28 (12.4%) |
| Total | 260 (100.0%) | 225 (100.0%) |
Health & Disability in Rio
Health Insurance Coverage by Age in Rio
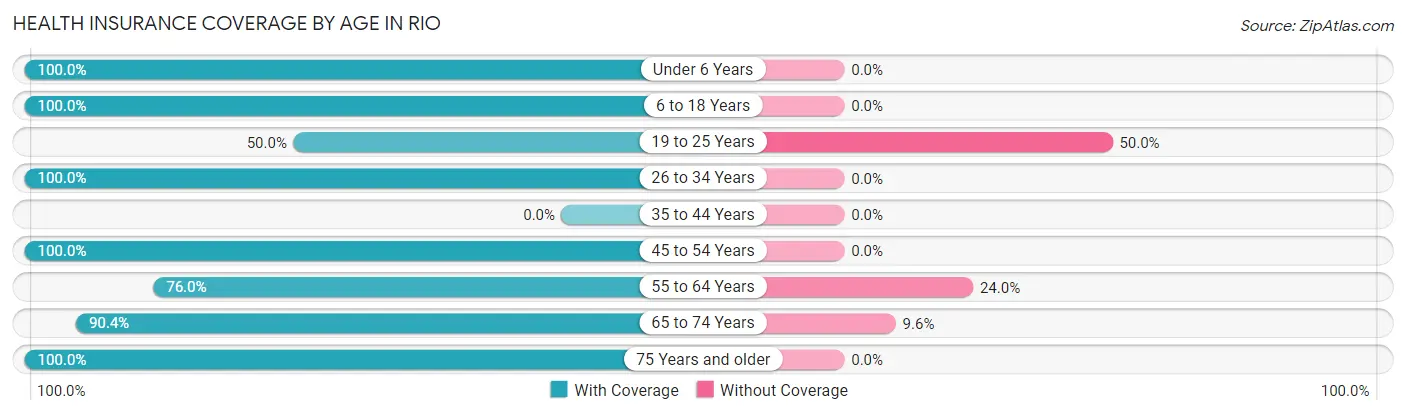
| Age Bracket | With Coverage | Without Coverage |
| Under 6 Years | 124 (100.0%) | 0 (0.0%) |
| 6 to 18 Years | 157 (100.0%) | 0 (0.0%) |
| 19 to 25 Years | 59 (50.0%) | 59 (50.0%) |
| 26 to 34 Years | 197 (100.0%) | 0 (0.0%) |
| 35 to 44 Years | 0 (0.0%) | 0 (0.0%) |
| 45 to 54 Years | 53 (100.0%) | 0 (0.0%) |
| 55 to 64 Years | 171 (76.0%) | 54 (24.0%) |
| 65 to 74 Years | 151 (90.4%) | 16 (9.6%) |
| 75 Years and older | 332 (100.0%) | 0 (0.0%) |
| Total | 1,244 (90.6%) | 129 (9.4%) |
Health Insurance Coverage by Citizenship Status in Rio
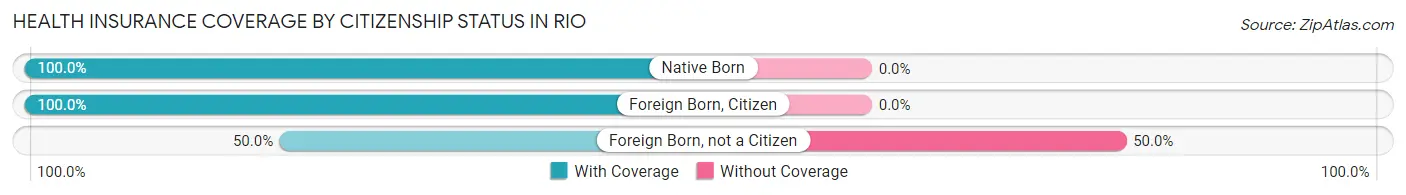
| Citizenship Status | With Coverage | Without Coverage |
| Native Born | 124 (100.0%) | 0 (0.0%) |
| Foreign Born, Citizen | 157 (100.0%) | 0 (0.0%) |
| Foreign Born, not a Citizen | 59 (50.0%) | 59 (50.0%) |
Health Insurance Coverage by Household Income in Rio
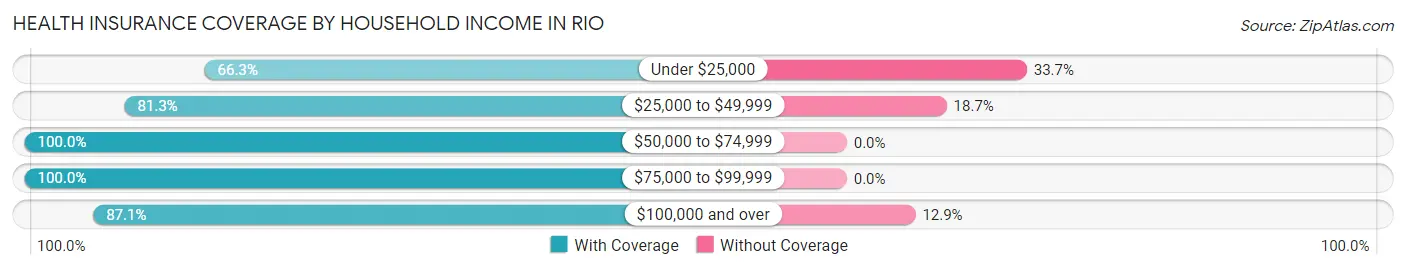
| Household Income | With Coverage | Without Coverage |
| Under $25,000 | 55 (66.3%) | 28 (33.7%) |
| $25,000 to $49,999 | 113 (81.3%) | 26 (18.7%) |
| $50,000 to $74,999 | 23 (100.0%) | 0 (0.0%) |
| $75,000 to $99,999 | 545 (100.0%) | 0 (0.0%) |
| $100,000 and over | 508 (87.1%) | 75 (12.9%) |
Public vs Private Health Insurance Coverage by Age in Rio
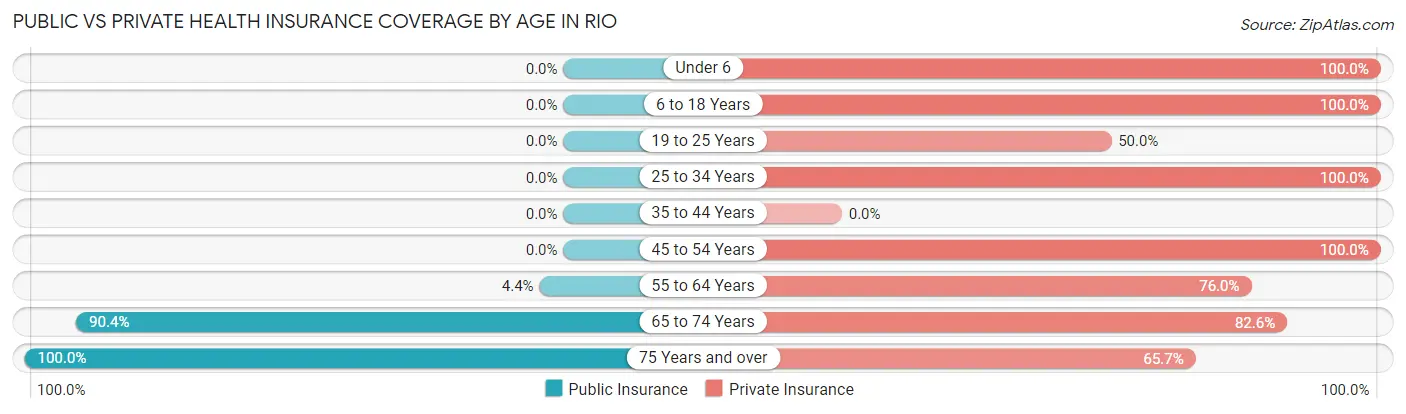
| Age Bracket | Public Insurance | Private Insurance |
| Under 6 | 0 (0.0%) | 124 (100.0%) |
| 6 to 18 Years | 0 (0.0%) | 157 (100.0%) |
| 19 to 25 Years | 0 (0.0%) | 59 (50.0%) |
| 25 to 34 Years | 0 (0.0%) | 197 (100.0%) |
| 35 to 44 Years | 0 (0.0%) | 0 (0.0%) |
| 45 to 54 Years | 0 (0.0%) | 53 (100.0%) |
| 55 to 64 Years | 10 (4.4%) | 171 (76.0%) |
| 65 to 74 Years | 151 (90.4%) | 138 (82.6%) |
| 75 Years and over | 332 (100.0%) | 218 (65.7%) |
| Total | 493 (35.9%) | 1,117 (81.4%) |
Disability Status by Sex by Age in Rio
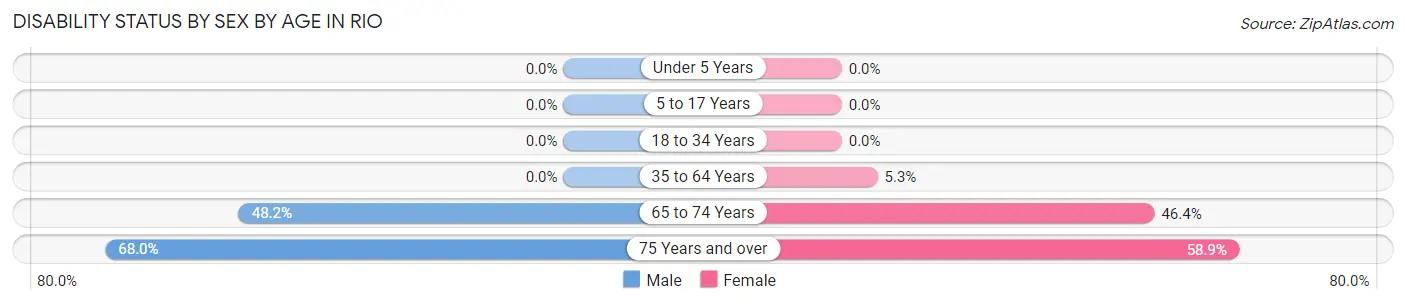
| Age Bracket | Male | Female |
| Under 5 Years | 0 (0.0%) | 0 (0.0%) |
| 5 to 17 Years | 0 (0.0%) | 0 (0.0%) |
| 18 to 34 Years | 0 (0.0%) | 0 (0.0%) |
| 35 to 64 Years | 0 (0.0%) | 10 (5.3%) |
| 65 to 74 Years | 40 (48.2%) | 39 (46.4%) |
| 75 Years and over | 85 (68.0%) | 122 (58.9%) |
Disability Class by Sex by Age in Rio
Disability Class: Hearing Difficulty
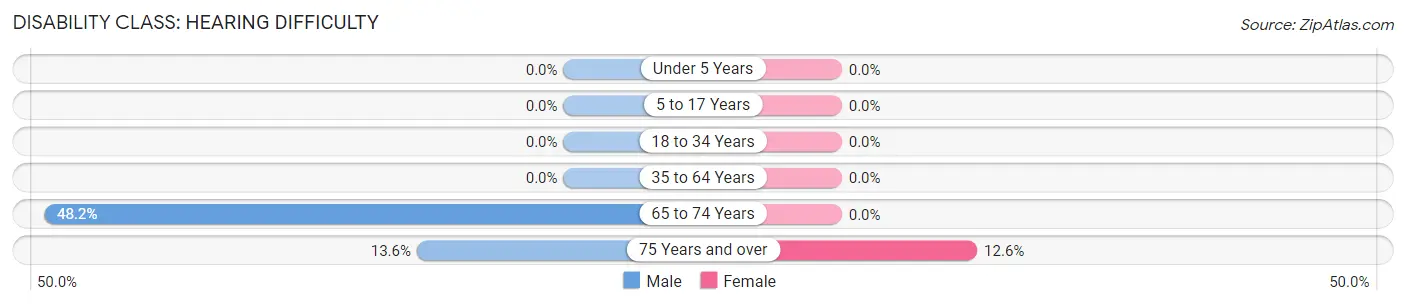
| Age Bracket | Male | Female |
| Under 5 Years | 0 (0.0%) | 0 (0.0%) |
| 5 to 17 Years | 0 (0.0%) | 0 (0.0%) |
| 18 to 34 Years | 0 (0.0%) | 0 (0.0%) |
| 35 to 64 Years | 0 (0.0%) | 0 (0.0%) |
| 65 to 74 Years | 40 (48.2%) | 0 (0.0%) |
| 75 Years and over | 17 (13.6%) | 26 (12.6%) |
Disability Class: Vision Difficulty
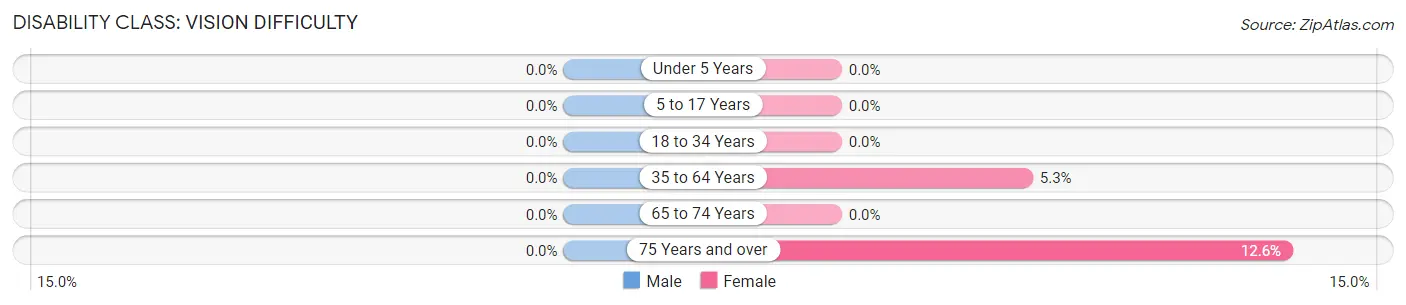
| Age Bracket | Male | Female |
| Under 5 Years | 0 (0.0%) | 0 (0.0%) |
| 5 to 17 Years | 0 (0.0%) | 0 (0.0%) |
| 18 to 34 Years | 0 (0.0%) | 0 (0.0%) |
| 35 to 64 Years | 0 (0.0%) | 10 (5.3%) |
| 65 to 74 Years | 0 (0.0%) | 0 (0.0%) |
| 75 Years and over | 0 (0.0%) | 26 (12.6%) |
Disability Class: Cognitive Difficulty
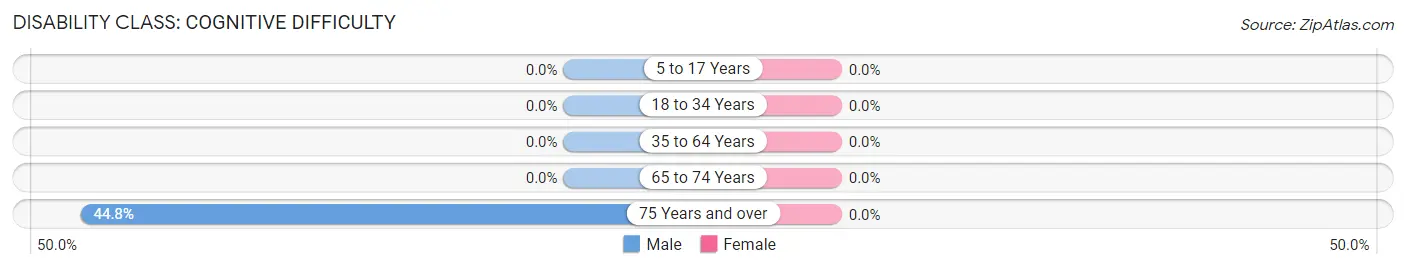
| Age Bracket | Male | Female |
| 5 to 17 Years | 0 (0.0%) | 0 (0.0%) |
| 18 to 34 Years | 0 (0.0%) | 0 (0.0%) |
| 35 to 64 Years | 0 (0.0%) | 0 (0.0%) |
| 65 to 74 Years | 0 (0.0%) | 0 (0.0%) |
| 75 Years and over | 56 (44.8%) | 0 (0.0%) |
Disability Class: Ambulatory Difficulty
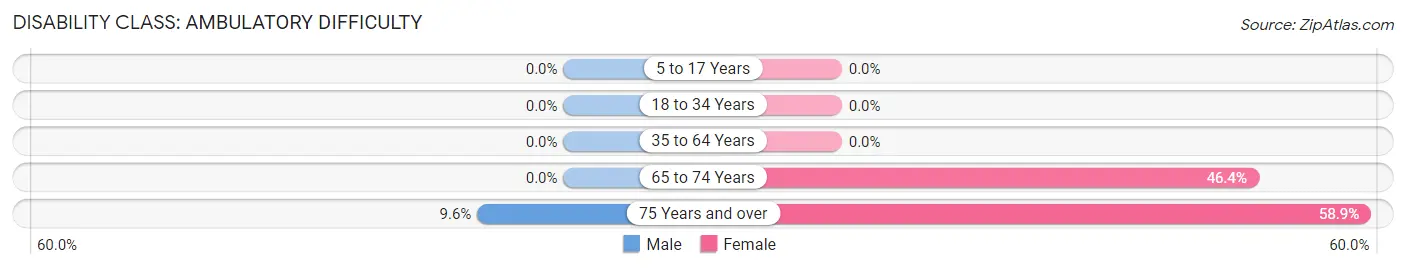
| Age Bracket | Male | Female |
| 5 to 17 Years | 0 (0.0%) | 0 (0.0%) |
| 18 to 34 Years | 0 (0.0%) | 0 (0.0%) |
| 35 to 64 Years | 0 (0.0%) | 0 (0.0%) |
| 65 to 74 Years | 0 (0.0%) | 39 (46.4%) |
| 75 Years and over | 12 (9.6%) | 122 (58.9%) |
Disability Class: Self-Care Difficulty
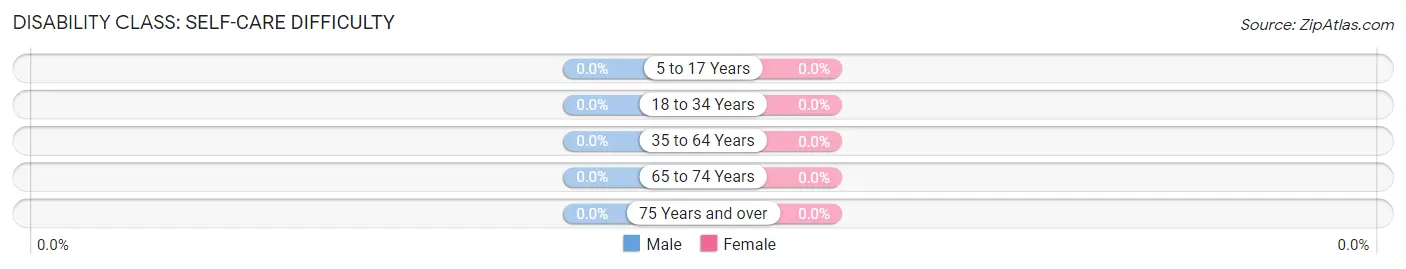
| Age Bracket | Male | Female |
| 5 to 17 Years | 0 (0.0%) | 0 (0.0%) |
| 18 to 34 Years | 0 (0.0%) | 0 (0.0%) |
| 35 to 64 Years | 0 (0.0%) | 0 (0.0%) |
| 65 to 74 Years | 0 (0.0%) | 0 (0.0%) |
| 75 Years and over | 0 (0.0%) | 0 (0.0%) |
Technology Access in Rio
Computing Device Access in Rio
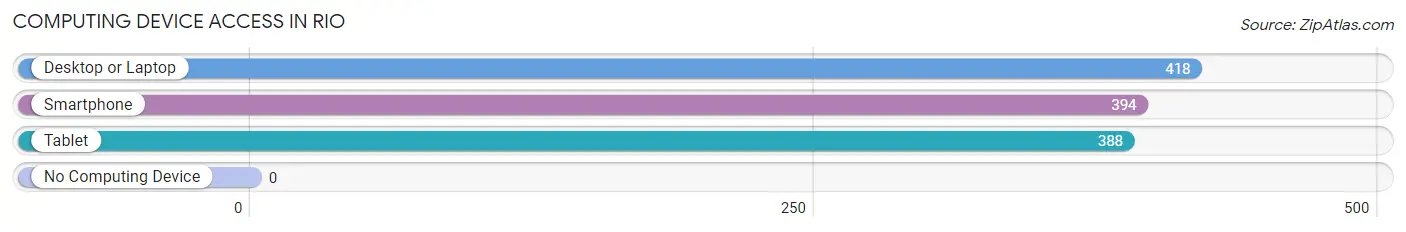
| Device Type | # Households | % Households |
| Desktop or Laptop | 418 | 84.4% |
| Smartphone | 394 | 79.6% |
| Tablet | 388 | 78.4% |
| No Computing Device | 0 | 0.0% |
| Total | 495 | 100.0% |
Internet Access in Rio
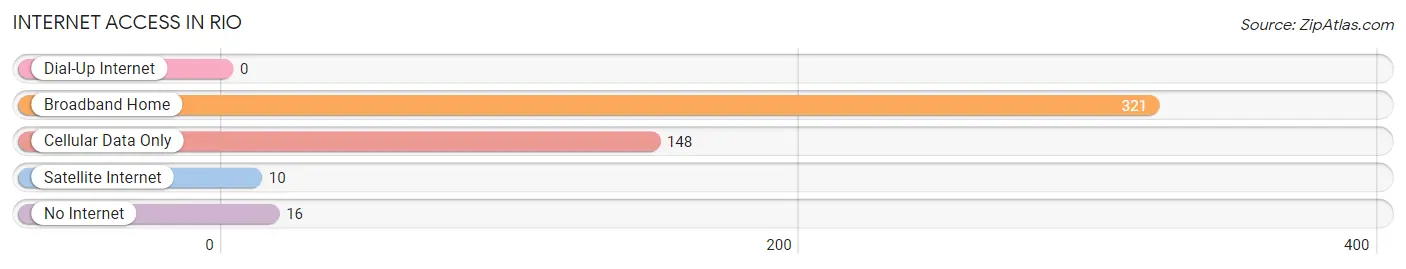
| Internet Type | # Households | % Households |
| Dial-Up Internet | 0 | 0.0% |
| Broadband Home | 321 | 64.8% |
| Cellular Data Only | 148 | 29.9% |
| Satellite Internet | 10 | 2.0% |
| No Internet | 16 | 3.2% |
| Total | 495 | 100.0% |
Rio Summary
Rio is a city located in Duval County, Florida, United States. It is part of the Jacksonville metropolitan area, which had a population of 1,313,228 in 2019. The city of Rio had a population of 8,817 at the 2010 census.
History
Rio was founded in 1884 by the Florida Land and Improvement Company. The city was named after the Rio Grande River, which runs through the area. The city was incorporated in 1887 and was the first city in Duval County to be incorporated.
Rio was a popular tourist destination in the early 20th century, with many visitors coming to the area to enjoy the beaches and the nearby St. Johns River. The city was also home to a number of resorts, including the Hotel Rio, which was built in 1912 and was one of the first hotels in the area.
Geography
Rio is located in northeastern Duval County, on the Atlantic coast of Florida. It is bordered to the north by Atlantic Beach, to the east by Jacksonville Beach, to the south by Neptune Beach, and to the west by Jacksonville. The city covers an area of 4.2 square miles, with 0.2 square miles of water.
The city is located on the St. Johns River, which is the longest river in Florida. The river is a popular destination for fishing, boating, and other recreational activities.
Economy
Rio's economy is largely based on tourism and hospitality. The city is home to a number of resorts, hotels, and restaurants, as well as a number of retail stores. The city is also home to a number of corporate offices, including those of the Florida Times-Union newspaper and the Jacksonville Jaguars football team.
Demographics
As of the 2010 census, there were 8,817 people, 3,845 households, and 2,092 families residing in the city. The population density was 2,092.2 people per square mile. The racial makeup of the city was 79.2% White, 11.2% African American, 0.4% Native American, 2.2% Asian, 0.1% Pacific Islander, 4.3% from other races, and 2.6% from two or more races. Hispanic or Latino of any race were 11.3% of the population.
The median income for a household in the city was $41,945, and the median income for a family was $50,945. Males had a median income of $37,945 versus $30,945 for females. The per capita income for the city was $22,945. About 8.2% of families and 10.2% of the population were below the poverty line, including 14.2% of those under age 18 and 8.2% of those age 65 or over.
Common Questions
What is the Total Population of Rio?
Total Population of Rio is 1,373.
What is the Total Male Population of Rio?
Total Male Population of Rio is 511.
What is the Total Female Population of Rio?
Total Female Population of Rio is 862.
What is the Ratio of Males per 100 Females in Rio?
There are 59.28 Males per 100 Females in Rio.
What is the Ratio of Females per 100 Males in Rio?
There are 168.69 Females per 100 Males in Rio.
What is the Median Population Age in Rio?
Median Population Age in Rio is 57.4 Years.
What is the Average Family Size in Rio
Average Family Size in Rio is 3.7 People.
What is the Average Household Size in Rio
Average Household Size in Rio is 2.8 People.
What is Per Capita Income in Rio?
Per Capita income in Rio is $48,197.
What is the Median Family Income in Rio?
Median Family Income in Rio is $94,202.
What is the Median Household income in Rio?
Median Household Income in Rio is $93,720.
What is Income or Wage Gap in Rio?
Income or Wage Gap in Rio is 58.7%.
Women in Rio earn 41.3 cents for every dollar earned by a man.
What is Inequality or Gini Index in Rio?
Inequality or Gini Index in Rio is 0.44.
How Large is the Labor Force in Rio?
There are 470 People in the Labor Forcein in Rio.
What is the Percentage of People in the Labor Force in Rio?
43.0% of People are in the Labor Force in Rio.
What is the Unemployment Rate in Rio?
Unemployment Rate in Rio is 9.6%.