Pine Air, FL
Pine Air Map
Pine Air Overview
2,318
TOTAL POPULATION
1,157
MALE POPULATION
1,161
FEMALE POPULATION
99.66
MALES / 100 FEMALES
100.35
FEMALES / 100 MALES
41.5
MEDIAN AGE
4.3
AVG FAMILY SIZE
3.7
AVG HOUSEHOLD SIZE
$17,665
PER CAPITA INCOME
$39,559
AVG FAMILY INCOME
$47,237
AVG HOUSEHOLD INCOME
35.9%
WAGE / INCOME GAP [ % ]
64.1¢/ $1
WAGE / INCOME GAP [ $ ]
0.44
INEQUALITY / GINI INDEX
906
LABOR FORCE [ PEOPLE ]
47.1%
PERCENT IN LABOR FORCE
8.8%
UNEMPLOYMENT RATE
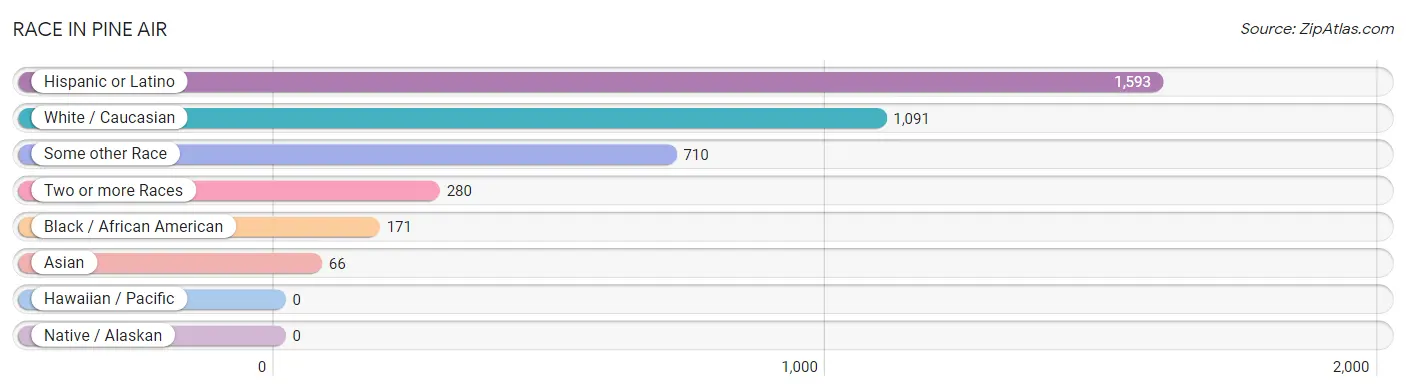
Race in Pine Air
The most populous races in Pine Air are Hispanic or Latino (1,593 | 68.7%), White / Caucasian (1,091 | 47.1%), and Some other Race (710 | 30.6%).
| Race | # Population | % Population |
| Asian | 66 | 2.9% |
| Black / African American | 171 | 7.4% |
| Hawaiian / Pacific | 0 | 0.0% |
| Hispanic or Latino | 1,593 | 68.7% |
| Native / Alaskan | 0 | 0.0% |
| White / Caucasian | 1,091 | 47.1% |
| Two or more Races | 280 | 12.1% |
| Some other Race | 710 | 30.6% |
| Total | 2,318 | 100.0% |
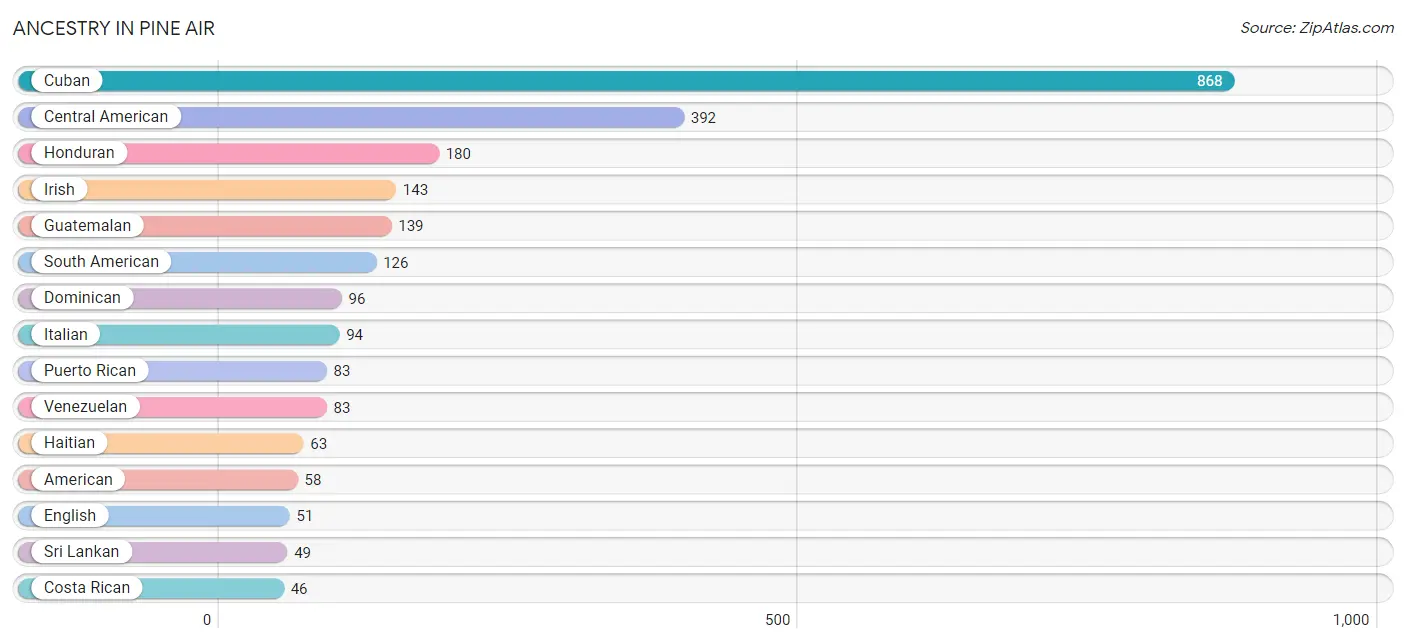
Ancestry in Pine Air
The most populous ancestries reported in Pine Air are Cuban (868 | 37.4%), Central American (392 | 16.9%), Honduran (180 | 7.8%), Irish (143 | 6.2%), and Guatemalan (139 | 6.0%), together accounting for 74.3% of all Pine Air residents.
| Ancestry | # Population | % Population |
| African | 19 | 0.8% |
| American | 58 | 2.5% |
| British | 16 | 0.7% |
| Central American | 392 | 16.9% |
| Colombian | 34 | 1.5% |
| Costa Rican | 46 | 2.0% |
| Cuban | 868 | 37.4% |
| Dominican | 96 | 4.1% |
| Dutch | 10 | 0.4% |
| English | 51 | 2.2% |
| French Canadian | 15 | 0.6% |
| German | 39 | 1.7% |
| Guatemalan | 139 | 6.0% |
| Guyanese | 3 | 0.1% |
| Haitian | 63 | 2.7% |
| Honduran | 180 | 7.8% |
| Irish | 143 | 6.2% |
| Italian | 94 | 4.1% |
| Jamaican | 11 | 0.5% |
| Puerto Rican | 83 | 3.6% |
| Salvadoran | 9 | 0.4% |
| South American | 126 | 5.4% |
| Spanish | 26 | 1.1% |
| Sri Lankan | 49 | 2.1% |
| Subsaharan African | 19 | 0.8% |
| Thai | 17 | 0.7% |
| Uruguayan | 9 | 0.4% |
| Venezuelan | 83 | 3.6% | View All 28 Rows |
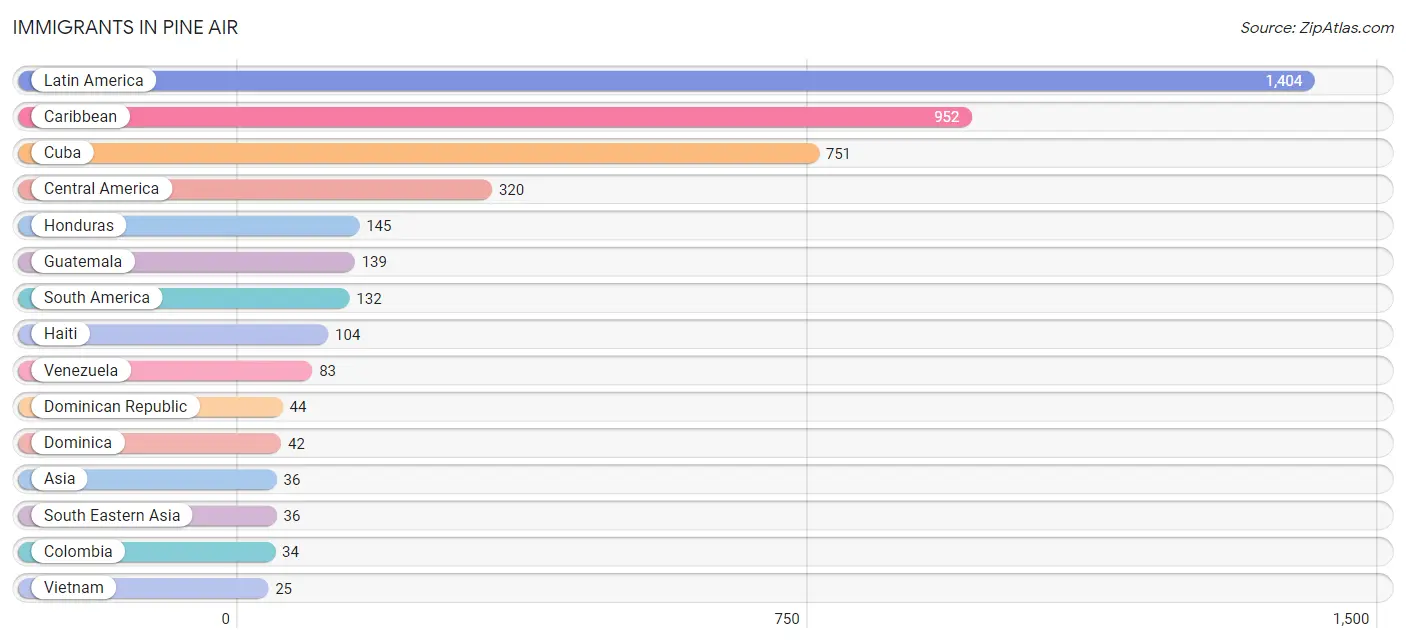
Immigrants in Pine Air
The most numerous immigrant groups reported in Pine Air came from Latin America (1,404 | 60.6%), Caribbean (952 | 41.1%), Cuba (751 | 32.4%), Central America (320 | 13.8%), and Honduras (145 | 6.3%), together accounting for 154.1% of all Pine Air residents.
| Immigration Origin | # Population | % Population |
| Asia | 36 | 1.5% |
| Australia | 12 | 0.5% |
| Caribbean | 952 | 41.1% |
| Central America | 320 | 13.8% |
| Colombia | 34 | 1.5% |
| Costa Rica | 18 | 0.8% |
| Cuba | 751 | 32.4% |
| Dominica | 42 | 1.8% |
| Dominican Republic | 44 | 1.9% |
| Europe | 7 | 0.3% |
| Guatemala | 139 | 6.0% |
| Guyana | 6 | 0.3% |
| Haiti | 104 | 4.5% |
| Honduras | 145 | 6.3% |
| Jamaica | 11 | 0.5% |
| Latin America | 1,404 | 60.6% |
| Nicaragua | 18 | 0.8% |
| Oceania | 12 | 0.5% |
| Philippines | 11 | 0.5% |
| South America | 132 | 5.7% |
| South Eastern Asia | 36 | 1.5% |
| Southern Europe | 7 | 0.3% |
| Spain | 7 | 0.3% |
| Uruguay | 9 | 0.4% |
| Venezuela | 83 | 3.6% |
| Vietnam | 25 | 1.1% | View All 26 Rows |
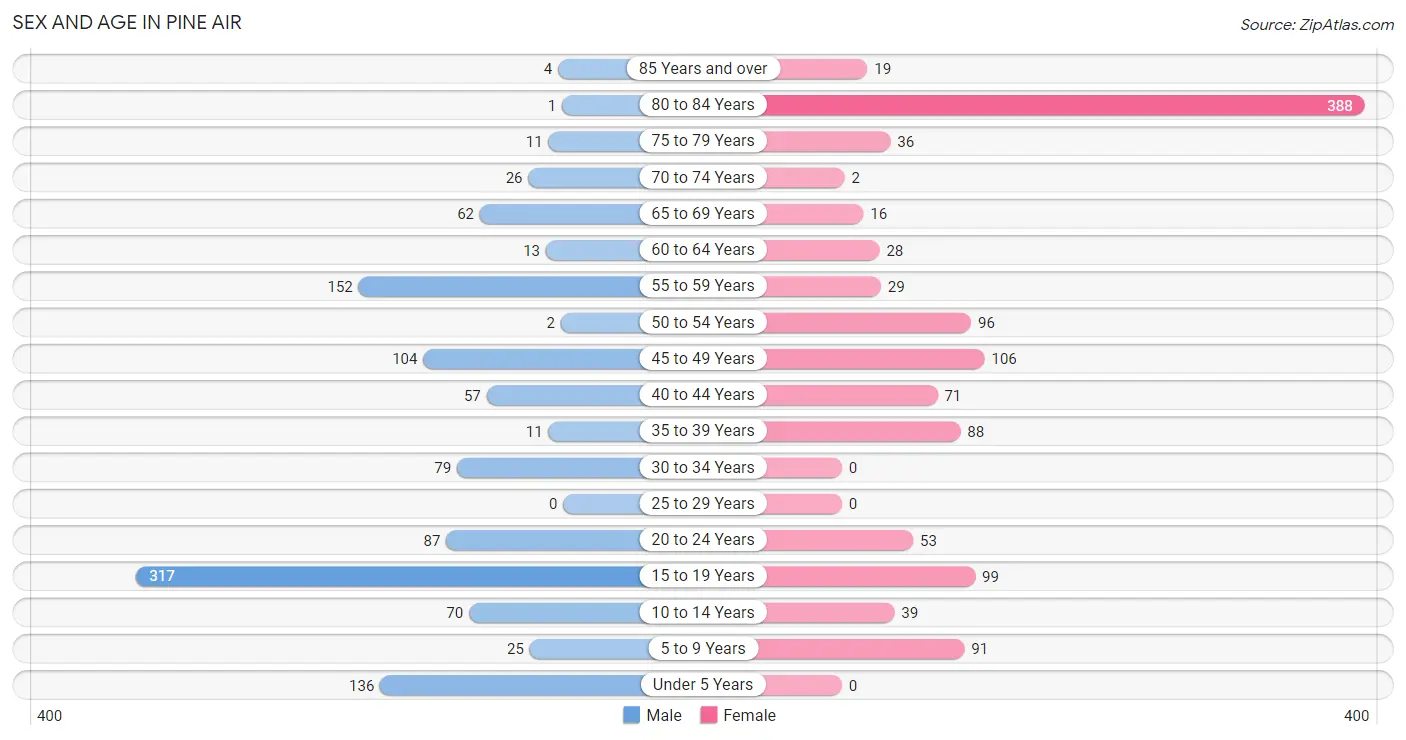
Sex and Age in Pine Air
Sex and Age in Pine Air
The most populous age groups in Pine Air are 15 to 19 Years (317 | 27.4%) for men and 80 to 84 Years (388 | 33.4%) for women.
| Age Bracket | Male | Female |
| Under 5 Years | 136 (11.7%) | 0 (0.0%) |
| 5 to 9 Years | 25 (2.2%) | 91 (7.8%) |
| 10 to 14 Years | 70 (6.0%) | 39 (3.4%) |
| 15 to 19 Years | 317 (27.4%) | 99 (8.5%) |
| 20 to 24 Years | 87 (7.5%) | 53 (4.6%) |
| 25 to 29 Years | 0 (0.0%) | 0 (0.0%) |
| 30 to 34 Years | 79 (6.8%) | 0 (0.0%) |
| 35 to 39 Years | 11 (0.9%) | 88 (7.6%) |
| 40 to 44 Years | 57 (4.9%) | 71 (6.1%) |
| 45 to 49 Years | 104 (9.0%) | 106 (9.1%) |
| 50 to 54 Years | 2 (0.2%) | 96 (8.3%) |
| 55 to 59 Years | 152 (13.1%) | 29 (2.5%) |
| 60 to 64 Years | 13 (1.1%) | 28 (2.4%) |
| 65 to 69 Years | 62 (5.4%) | 16 (1.4%) |
| 70 to 74 Years | 26 (2.2%) | 2 (0.2%) |
| 75 to 79 Years | 11 (0.9%) | 36 (3.1%) |
| 80 to 84 Years | 1 (0.1%) | 388 (33.4%) |
| 85 Years and over | 4 (0.4%) | 19 (1.6%) |
| Total | 1,157 (100.0%) | 1,161 (100.0%) |
Families and Households in Pine Air
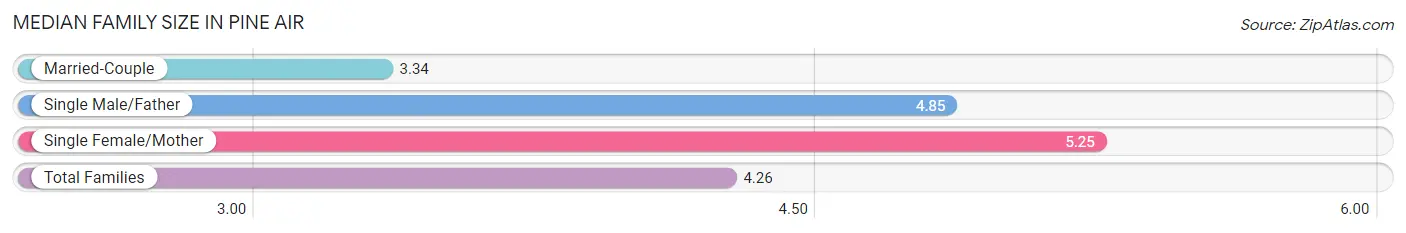
Median Family Size in Pine Air
The median family size in Pine Air is 4.26 persons per family, with single female/mother families (178 | 40.1%) accounting for the largest median family size of 5.25 persons per family. On the other hand, married-couple families (219 | 49.3%) represent the smallest median family size with 3.34 persons per family.
| Family Type | # Families | Family Size |
| Married-Couple | 219 (49.3%) | 3.34 |
| Single Male/Father | 47 (10.6%) | 4.85 |
| Single Female/Mother | 178 (40.1%) | 5.25 |
| Total Families | 444 (100.0%) | 4.26 |
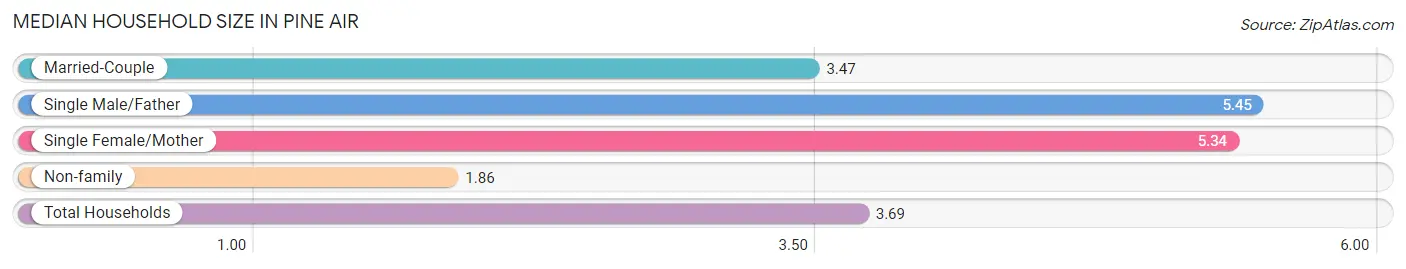
Median Household Size in Pine Air
The median household size in Pine Air is 3.69 persons per household, with single male/father households (47 | 7.5%) accounting for the largest median household size of 5.45 persons per household. non-family households (180 | 28.8%) represent the smallest median household size with 1.86 persons per household.
| Household Type | # Households | Household Size |
| Married-Couple | 219 (35.1%) | 3.47 |
| Single Male/Father | 47 (7.5%) | 5.45 |
| Single Female/Mother | 178 (28.5%) | 5.34 |
| Non-family | 180 (28.8%) | 1.86 |
| Total Households | 624 (100.0%) | 3.69 |
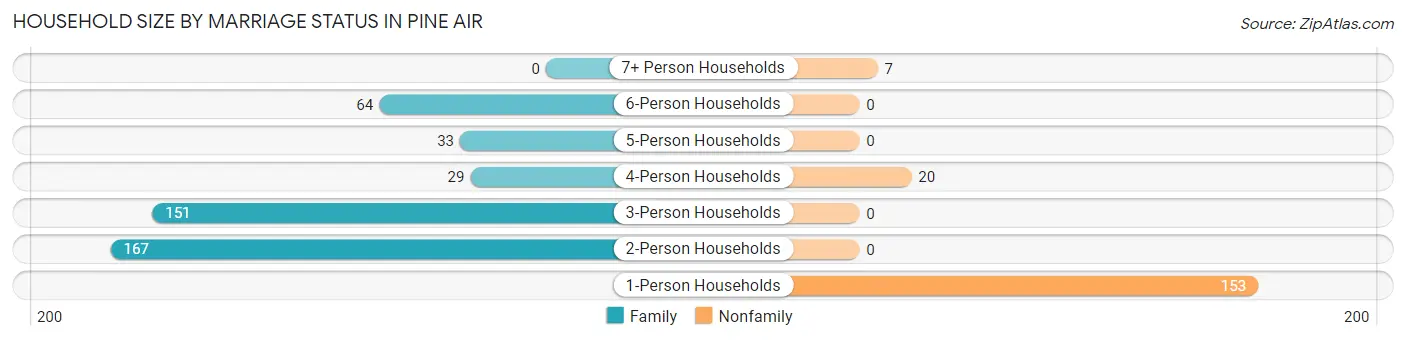
Household Size by Marriage Status in Pine Air
Out of a total of 624 households in Pine Air, 444 (71.2%) are family households, while 180 (28.8%) are nonfamily households. The most numerous type of family households are 2-person households, comprising 167, and the most common type of nonfamily households are 1-person households, comprising 153.
| Household Size | Family Households | Nonfamily Households |
| 1-Person Households | - | 153 (24.5%) |
| 2-Person Households | 167 (26.8%) | 0 (0.0%) |
| 3-Person Households | 151 (24.2%) | 0 (0.0%) |
| 4-Person Households | 29 (4.6%) | 20 (3.2%) |
| 5-Person Households | 33 (5.3%) | 0 (0.0%) |
| 6-Person Households | 64 (10.3%) | 0 (0.0%) |
| 7+ Person Households | 0 (0.0%) | 7 (1.1%) |
| Total | 444 (71.2%) | 180 (28.8%) |
Female Fertility in Pine Air
Fertility by Age in Pine Air
Average fertility rate in Pine Air is 65.0 births per 1,000 women. Women in the age bracket of 15 to 19 years have the highest fertility rate with 293.0 births per 1,000 women. Women in the age bracket of 15 to 19 years acount for 100.0% of all women with births.
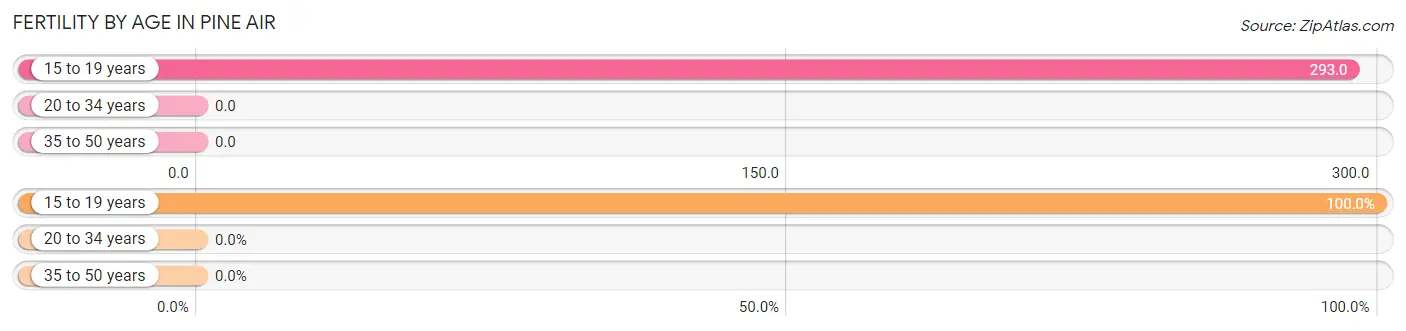
| Age Bracket | Women with Births | Births / 1,000 Women |
| 15 to 19 years | 29 (100.0%) | 293.0 |
| 20 to 34 years | 0 (0.0%) | 0.0 |
| 35 to 50 years | 0 (0.0%) | 0.0 |
| Total | 29 (100.0%) | 65.0 |
Fertility by Age by Marriage Status in Pine Air
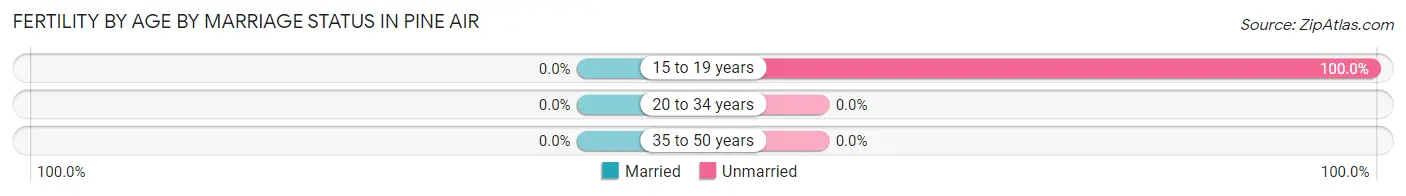
| Age Bracket | Married | Unmarried |
| 15 to 19 years | 0 (0.0%) | 29 (100.0%) |
| 20 to 34 years | 0 (0.0%) | 0 (0.0%) |
| 35 to 50 years | 0 (0.0%) | 0 (0.0%) |
| Total | 0 (0.0%) | 29 (100.0%) |
Fertility by Education in Pine Air
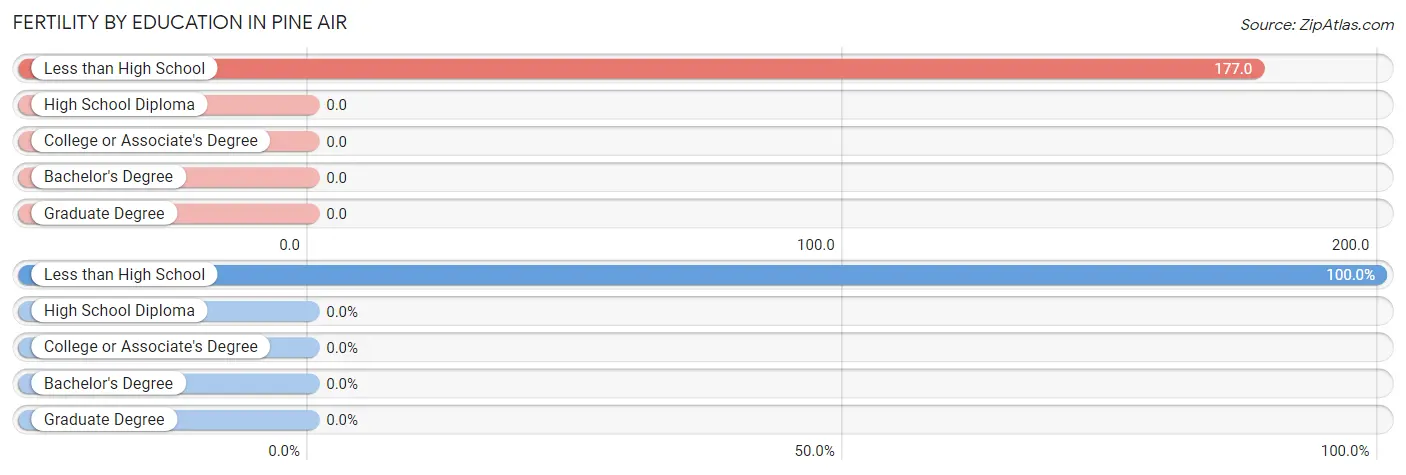
| Educational Attainment | Women with Births | Births / 1,000 Women |
| Less than High School | 29 (100.0%) | 177.0 |
| High School Diploma | 0 (0.0%) | 0.0 |
| College or Associate's Degree | 0 (0.0%) | 0.0 |
| Bachelor's Degree | 0 (0.0%) | 0.0 |
| Graduate Degree | 0 (0.0%) | 0.0 |
| Total | 29 (100.0%) | 65.0 |
Fertility by Education by Marriage Status in Pine Air
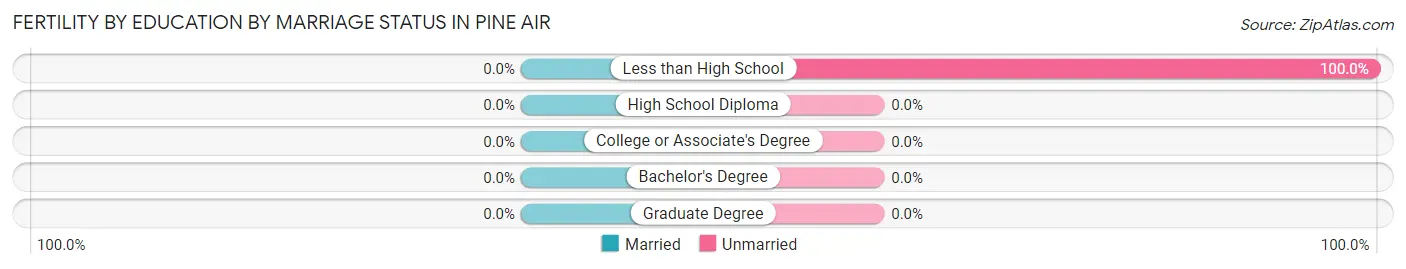
| Educational Attainment | Married | Unmarried |
| Less than High School | 0 (0.0%) | 29 (100.0%) |
| High School Diploma | 0 (0.0%) | 0 (0.0%) |
| College or Associate's Degree | 0 (0.0%) | 0 (0.0%) |
| Bachelor's Degree | 0 (0.0%) | 0 (0.0%) |
| Graduate Degree | 0 (0.0%) | 0 (0.0%) |
| Total | 0 (0.0%) | 29 (100.0%) |
Income in Pine Air
Income Overview in Pine Air
Per Capita Income in Pine Air is $17,665, while median incomes of families and households are $39,559 and $47,237 respectively.
| Characteristic | Number | Measure |
| Per Capita Income | 2,318 | $17,665 |
| Median Family Income | 444 | $39,559 |
| Mean Family Income | 444 | $50,495 |
| Median Household Income | 624 | $47,237 |
| Mean Household Income | 624 | $58,343 |
| Income Deficit | 444 | $0 |
| Wage / Income Gap (%) | 2,318 | 35.92% |
| Wage / Income Gap ($) | 2,318 | 64.08¢ per $1 |
| Gini / Inequality Index | 2,318 | 0.44 |
Earnings by Sex in Pine Air
Average Earnings in Pine Air are $29,516, $31,071 for men and $19,911 for women, a difference of 35.9%.
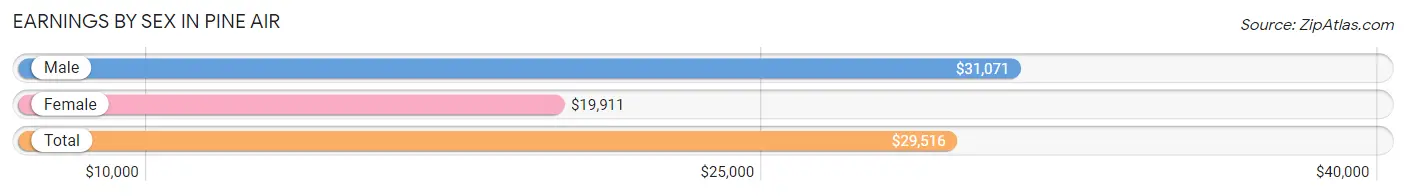
| Sex | Number | Average Earnings |
| Male | 500 (58.1%) | $31,071 |
| Female | 360 (41.9%) | $19,911 |
| Total | 860 (100.0%) | $29,516 |
Earnings by Sex by Income Bracket in Pine Air
The most common earnings brackets in Pine Air are $30,000 to $34,999 for men (91 | 18.2%) and $50,000 to $54,999 for women (45 | 12.5%).
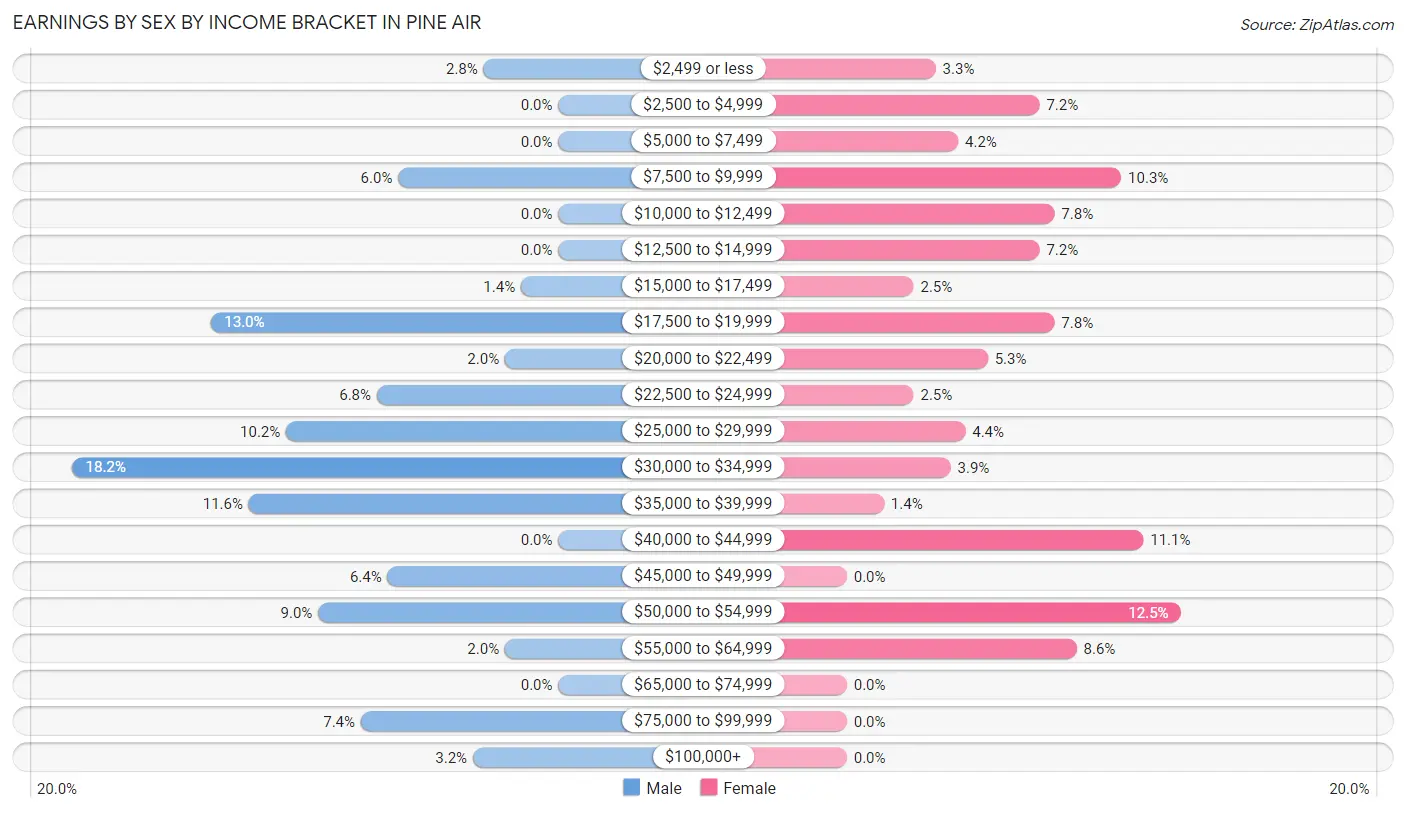
| Income | Male | Female |
| $2,499 or less | 14 (2.8%) | 12 (3.3%) |
| $2,500 to $4,999 | 0 (0.0%) | 26 (7.2%) |
| $5,000 to $7,499 | 0 (0.0%) | 15 (4.2%) |
| $7,500 to $9,999 | 30 (6.0%) | 37 (10.3%) |
| $10,000 to $12,499 | 0 (0.0%) | 28 (7.8%) |
| $12,500 to $14,999 | 0 (0.0%) | 26 (7.2%) |
| $15,000 to $17,499 | 7 (1.4%) | 9 (2.5%) |
| $17,500 to $19,999 | 65 (13.0%) | 28 (7.8%) |
| $20,000 to $22,499 | 10 (2.0%) | 19 (5.3%) |
| $22,500 to $24,999 | 34 (6.8%) | 9 (2.5%) |
| $25,000 to $29,999 | 51 (10.2%) | 16 (4.4%) |
| $30,000 to $34,999 | 91 (18.2%) | 14 (3.9%) |
| $35,000 to $39,999 | 58 (11.6%) | 5 (1.4%) |
| $40,000 to $44,999 | 0 (0.0%) | 40 (11.1%) |
| $45,000 to $49,999 | 32 (6.4%) | 0 (0.0%) |
| $50,000 to $54,999 | 45 (9.0%) | 45 (12.5%) |
| $55,000 to $64,999 | 10 (2.0%) | 31 (8.6%) |
| $65,000 to $74,999 | 0 (0.0%) | 0 (0.0%) |
| $75,000 to $99,999 | 37 (7.4%) | 0 (0.0%) |
| $100,000+ | 16 (3.2%) | 0 (0.0%) |
| Total | 500 (100.0%) | 360 (100.0%) |
Earnings by Sex by Educational Attainment in Pine Air
Average earnings in Pine Air are $38,103 for men and $25,625 for women, a difference of 32.8%. Men with an educational attainment of high school diploma enjoy the highest average annual earnings of $39,779, while those with less than high school education earn the least with $30,880. Women with an educational attainment of bachelor's degree earn the most with the average annual earnings of $44,464, while those with high school diploma education have the smallest earnings of $26,719.
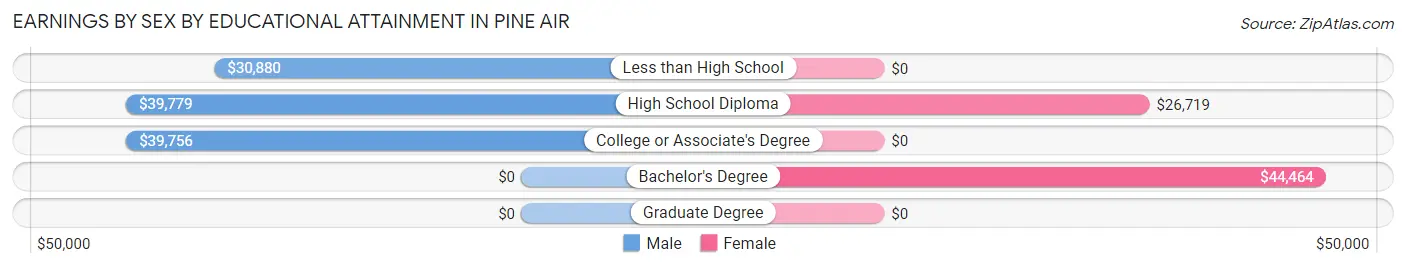
| Educational Attainment | Male Income | Female Income |
| Less than High School | $30,880 | $0 |
| High School Diploma | $39,779 | $26,719 |
| College or Associate's Degree | $39,756 | $0 |
| Bachelor's Degree | - | - |
| Graduate Degree | - | - |
| Total | $38,103 | $25,625 |
Family Income in Pine Air
Family Income Brackets in Pine Air
According to the Pine Air family income data, there are 89 families falling into the $25,000 to $34,999 income range, which is the most common income bracket and makes up 20.1% of all families.
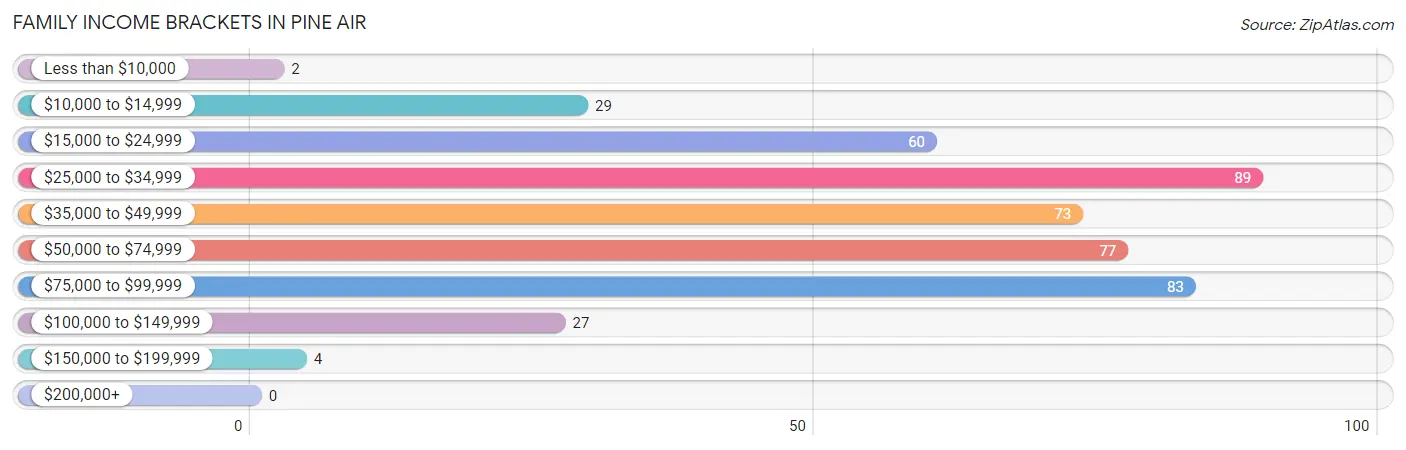
| Income Bracket | # Families | % Families |
| Less than $10,000 | 2 | 0.5% |
| $10,000 to $14,999 | 29 | 6.5% |
| $15,000 to $24,999 | 60 | 13.5% |
| $25,000 to $34,999 | 89 | 20.0% |
| $35,000 to $49,999 | 73 | 16.4% |
| $50,000 to $74,999 | 77 | 17.3% |
| $75,000 to $99,999 | 83 | 18.7% |
| $100,000 to $149,999 | 27 | 6.1% |
| $150,000 to $199,999 | 4 | 0.9% |
| $200,000+ | 0 | 0.0% |
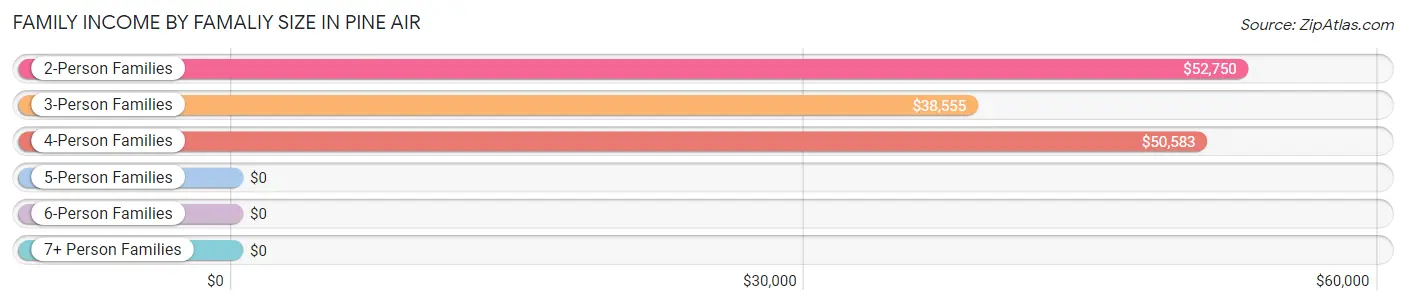
Family Income by Famaliy Size in Pine Air
2-person families (167 | 37.6%) account for the highest median family income in Pine Air with $52,750 per family, while 2-person families (167 | 37.6%) have the highest median income of $26,375 per family member.
| Income Bracket | # Families | Median Income |
| 2-Person Families | 167 (37.6%) | $52,750 |
| 3-Person Families | 151 (34.0%) | $38,555 |
| 4-Person Families | 29 (6.5%) | $50,583 |
| 5-Person Families | 97 (21.8%) | $0 |
| 6-Person Families | 0 (0.0%) | $0 |
| 7+ Person Families | 0 (0.0%) | $0 |
| Total | 444 (100.0%) | $39,559 |
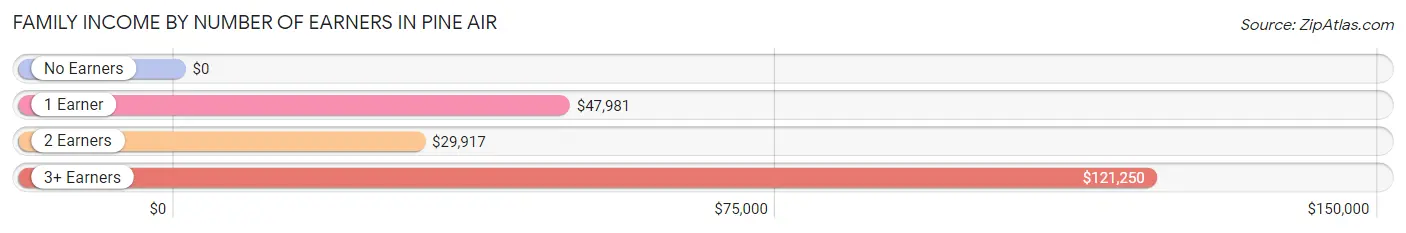
Family Income by Number of Earners in Pine Air
| Number of Earners | # Families | Median Income |
| No Earners | 53 (11.9%) | $0 |
| 1 Earner | 187 (42.1%) | $47,981 |
| 2 Earners | 153 (34.5%) | $29,917 |
| 3+ Earners | 51 (11.5%) | $121,250 |
| Total | 444 (100.0%) | $39,559 |
Household Income in Pine Air
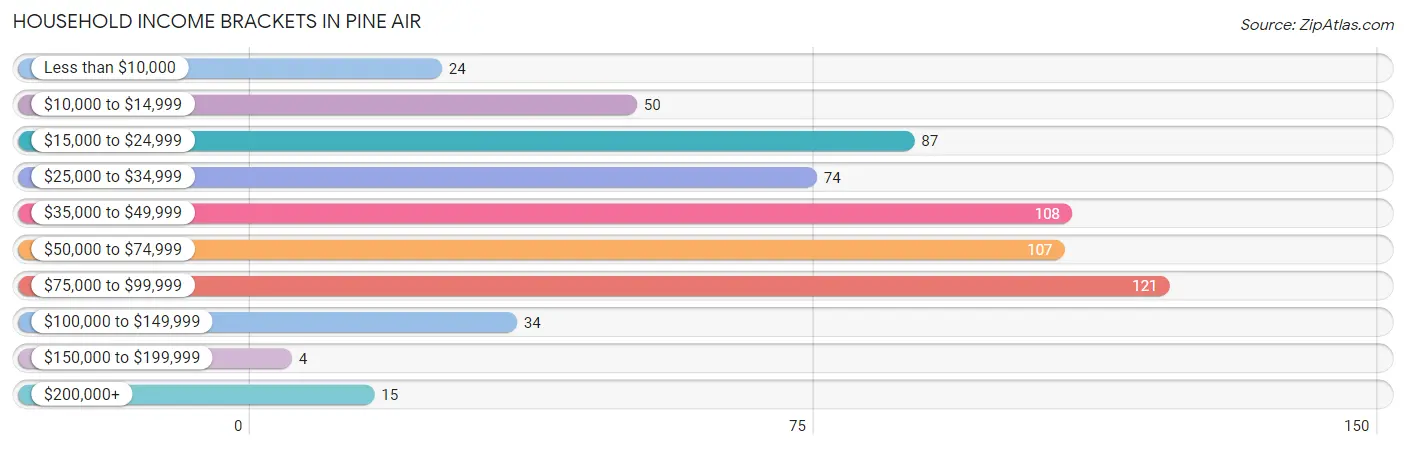
Household Income Brackets in Pine Air
With 121 households falling in the category, the $75,000 to $99,999 income range is the most frequent in Pine Air, accounting for 19.4% of all households. In contrast, only 4 households (0.6%) fall into the $150,000 to $199,999 income bracket, making it the least populous group.
| Income Bracket | # Households | % Households |
| Less than $10,000 | 24 | 3.8% |
| $10,000 to $14,999 | 50 | 8.0% |
| $15,000 to $24,999 | 87 | 13.9% |
| $25,000 to $34,999 | 74 | 11.9% |
| $35,000 to $49,999 | 108 | 17.3% |
| $50,000 to $74,999 | 107 | 17.1% |
| $75,000 to $99,999 | 121 | 19.4% |
| $100,000 to $149,999 | 34 | 5.4% |
| $150,000 to $199,999 | 4 | 0.6% |
| $200,000+ | 15 | 2.4% |
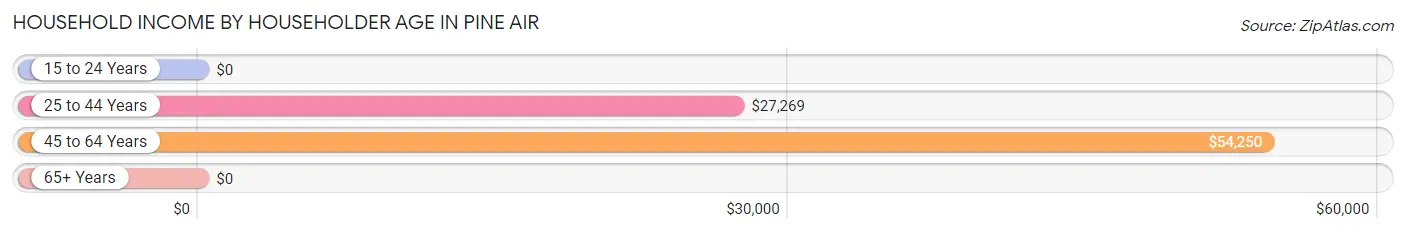
Household Income by Householder Age in Pine Air
The median household income in Pine Air is $47,237, with the highest median household income of $54,250 found in the 45 to 64 years age bracket for the primary householder. A total of 269 households (43.1%) fall into this category. Meanwhile, the 15 to 24 years age bracket for the primary householder has the lowest median household income of $0, with 45 households (7.2%) in this group.
| Income Bracket | # Households | Median Income |
| 15 to 24 Years | 45 (7.2%) | $0 |
| 25 to 44 Years | 161 (25.8%) | $27,269 |
| 45 to 64 Years | 269 (43.1%) | $54,250 |
| 65+ Years | 149 (23.9%) | $0 |
| Total | 624 (100.0%) | $47,237 |
Poverty in Pine Air
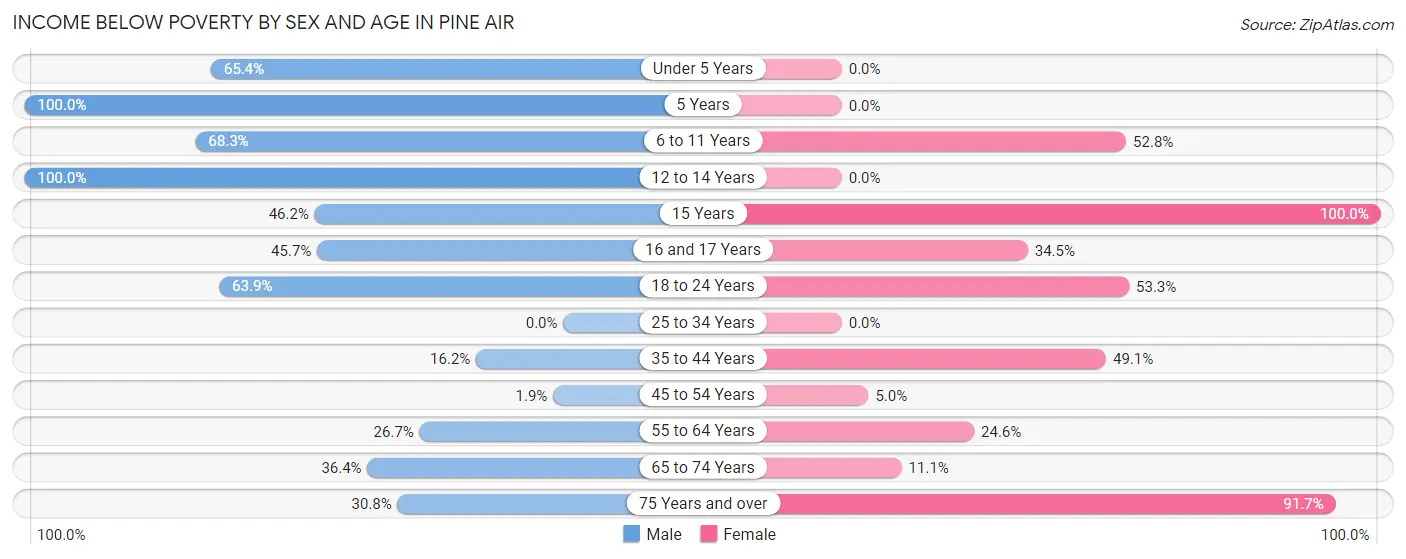
Income Below Poverty by Sex and Age in Pine Air
With 41.4% poverty level for males and 54.5% for females among the residents of Pine Air, 5 year old males and 15 year old females are the most vulnerable to poverty, with 17 males (100.0%) and 8 females (100.0%) in their respective age groups living below the poverty level.
| Age Bracket | Male | Female |
| Under 5 Years | 70 (65.4%) | 0 (0.0%) |
| 5 Years | 17 (100.0%) | 0 (0.0%) |
| 6 to 11 Years | 28 (68.3%) | 38 (52.8%) |
| 12 to 14 Years | 29 (100.0%) | 0 (0.0%) |
| 15 Years | 12 (46.2%) | 8 (100.0%) |
| 16 and 17 Years | 69 (45.7%) | 29 (34.5%) |
| 18 to 24 Years | 145 (63.9%) | 32 (53.3%) |
| 25 to 34 Years | 0 (0.0%) | 0 (0.0%) |
| 35 to 44 Years | 11 (16.2%) | 78 (49.1%) |
| 45 to 54 Years | 2 (1.9%) | 10 (5.0%) |
| 55 to 64 Years | 44 (26.7%) | 14 (24.6%) |
| 65 to 74 Years | 32 (36.4%) | 2 (11.1%) |
| 75 Years and over | 4 (30.8%) | 406 (91.6%) |
| Total | 463 (41.4%) | 617 (54.5%) |
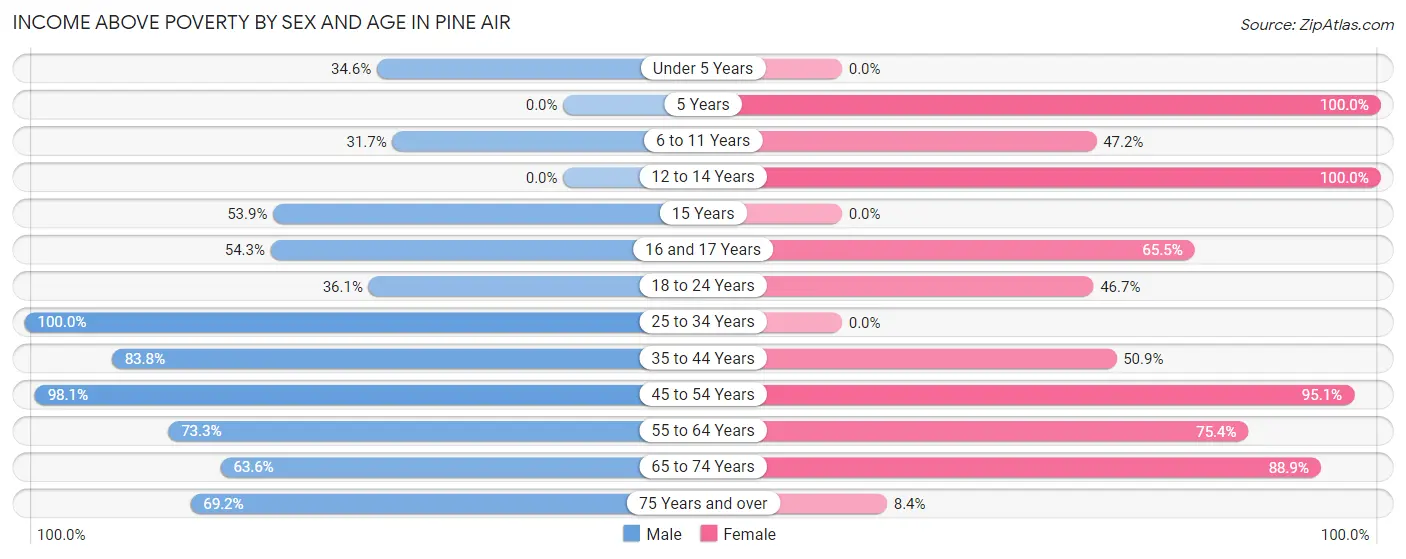
Income Above Poverty by Sex and Age in Pine Air
According to the poverty statistics in Pine Air, males aged 25 to 34 years and females aged 5 years are the age groups that are most secure financially, with 100.0% of males and 100.0% of females in these age groups living above the poverty line.
| Age Bracket | Male | Female |
| Under 5 Years | 37 (34.6%) | 0 (0.0%) |
| 5 Years | 0 (0.0%) | 11 (100.0%) |
| 6 to 11 Years | 13 (31.7%) | 34 (47.2%) |
| 12 to 14 Years | 0 (0.0%) | 18 (100.0%) |
| 15 Years | 14 (53.8%) | 0 (0.0%) |
| 16 and 17 Years | 82 (54.3%) | 55 (65.5%) |
| 18 to 24 Years | 82 (36.1%) | 28 (46.7%) |
| 25 to 34 Years | 79 (100.0%) | 0 (0.0%) |
| 35 to 44 Years | 57 (83.8%) | 81 (50.9%) |
| 45 to 54 Years | 104 (98.1%) | 192 (95.1%) |
| 55 to 64 Years | 121 (73.3%) | 43 (75.4%) |
| 65 to 74 Years | 56 (63.6%) | 16 (88.9%) |
| 75 Years and over | 9 (69.2%) | 37 (8.4%) |
| Total | 654 (58.6%) | 515 (45.5%) |
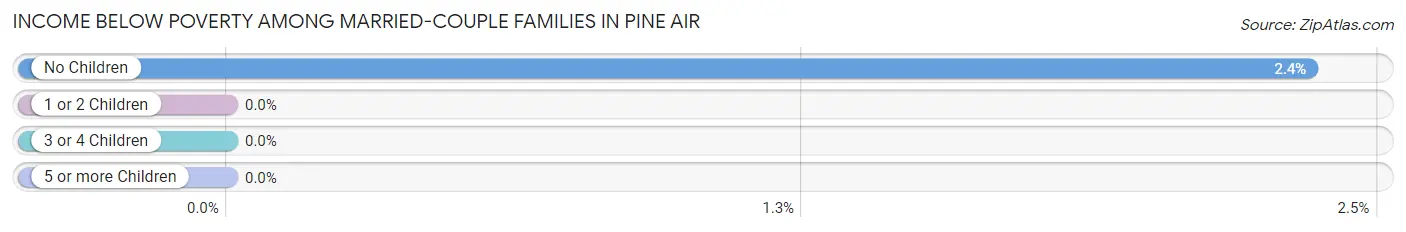
Income Below Poverty Among Married-Couple Families in Pine Air
The poverty statistics for married-couple families in Pine Air show that 0.9% or 2 of the total 219 families live below the poverty line. Families with no children have the highest poverty rate of 2.4%, comprising of 2 families. On the other hand, families with 1 or 2 children have the lowest poverty rate of 0.0%, which includes 0 families.
| Children | Above Poverty | Below Poverty |
| No Children | 83 (97.7%) | 2 (2.4%) |
| 1 or 2 Children | 134 (100.0%) | 0 (0.0%) |
| 3 or 4 Children | 0 (0.0%) | 0 (0.0%) |
| 5 or more Children | 0 (0.0%) | 0 (0.0%) |
| Total | 217 (99.1%) | 2 (0.9%) |
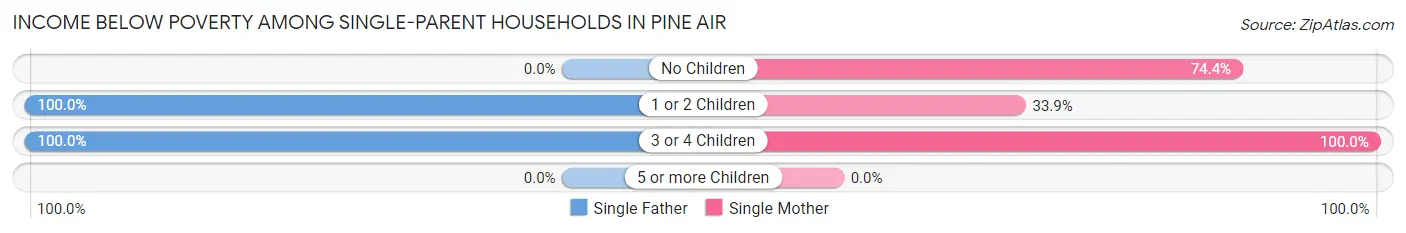
Income Below Poverty Among Single-Parent Households in Pine Air
According to the poverty data in Pine Air, 76.6% or 36 single-father households and 48.3% or 86 single-mother households are living below the poverty line. Among single-father households, those with 1 or 2 children have the highest poverty rate, with 11 households (100.0%) experiencing poverty. Likewise, among single-mother households, those with 3 or 4 children have the highest poverty rate, with 15 households (100.0%) falling below the poverty line.
| Children | Single Father | Single Mother |
| No Children | 0 (0.0%) | 29 (74.4%) |
| 1 or 2 Children | 11 (100.0%) | 42 (33.9%) |
| 3 or 4 Children | 25 (100.0%) | 15 (100.0%) |
| 5 or more Children | 0 (0.0%) | 0 (0.0%) |
| Total | 36 (76.6%) | 86 (48.3%) |
Income Below Poverty Among Married-Couple vs Single-Parent Households in Pine Air
The poverty data for Pine Air shows that 2 of the married-couple family households (0.9%) and 122 of the single-parent households (54.2%) are living below the poverty level. Within the married-couple family households, those with no children have the highest poverty rate, with 2 households (2.4%) falling below the poverty line. Among the single-parent households, those with 3 or 4 children have the highest poverty rate, with 40 household (100.0%) living below poverty.
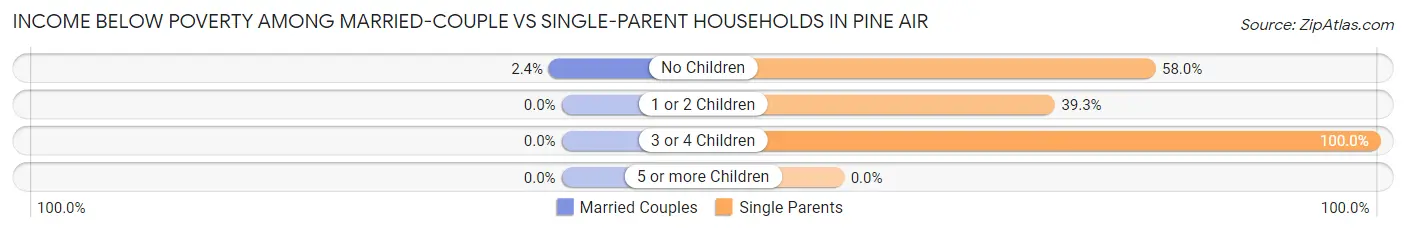
| Children | Married-Couple Families | Single-Parent Households |
| No Children | 2 (2.4%) | 29 (58.0%) |
| 1 or 2 Children | 0 (0.0%) | 53 (39.3%) |
| 3 or 4 Children | 0 (0.0%) | 40 (100.0%) |
| 5 or more Children | 0 (0.0%) | 0 (0.0%) |
| Total | 2 (0.9%) | 122 (54.2%) |
Employment Characteristics in Pine Air
Employment by Class of Employer in Pine Air
Among the 826 employed individuals in Pine Air, private company employees (535 | 64.8%), local government employees (102 | 12.3%), and self-employed (incorporated) (92 | 11.1%) make up the most common classes of employment.
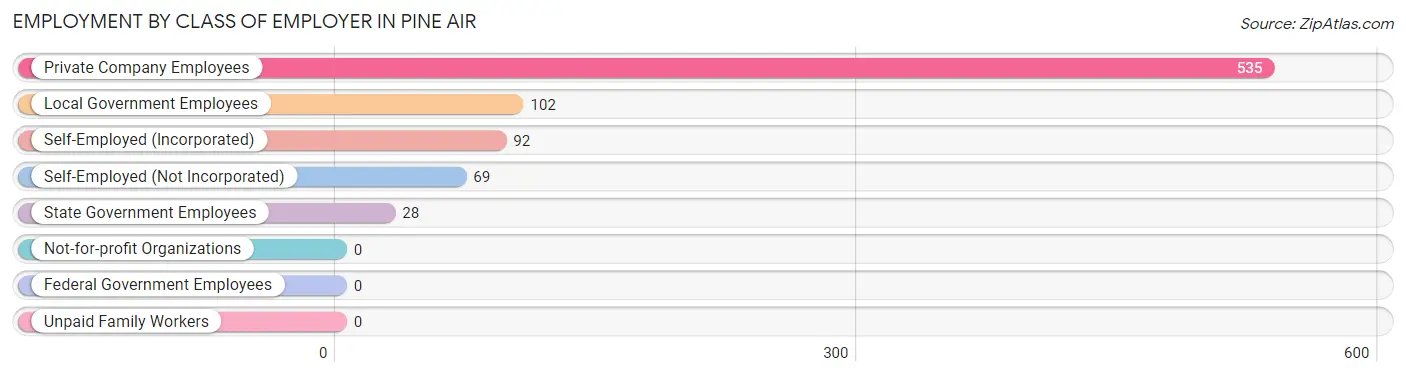
| Employer Class | # Employees | % Employees |
| Private Company Employees | 535 | 64.8% |
| Self-Employed (Incorporated) | 92 | 11.1% |
| Self-Employed (Not Incorporated) | 69 | 8.4% |
| Not-for-profit Organizations | 0 | 0.0% |
| Local Government Employees | 102 | 12.3% |
| State Government Employees | 28 | 3.4% |
| Federal Government Employees | 0 | 0.0% |
| Unpaid Family Workers | 0 | 0.0% |
| Total | 826 | 100.0% |
Employment Status by Age in Pine Air
According to the labor force statistics for Pine Air, out of the total population over 16 years of age (1,923), 47.1% or 906 individuals are in the labor force, with 8.8% or 80 of them unemployed. The age group with the highest labor force participation rate is 30 to 34 years, with 100.0% or 79 individuals in the labor force. Within the labor force, the 20 to 24 years age range has the highest percentage of unemployed individuals, with 25.8% or 23 of them being unemployed.
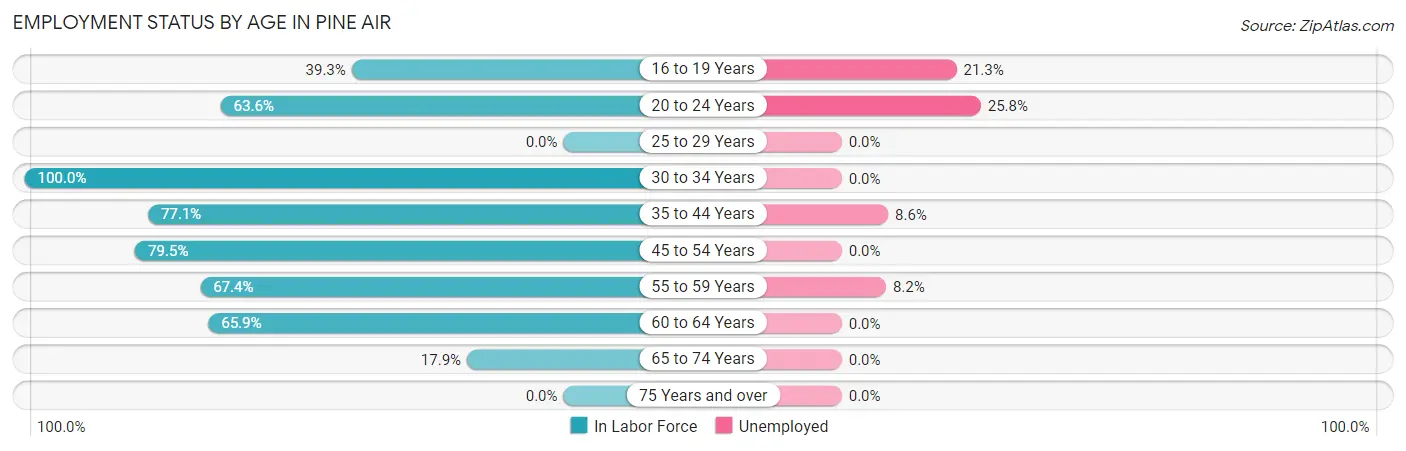
| Age Bracket | In Labor Force | Unemployed |
| 16 to 19 Years | 150 (39.3%) | 32 (21.3%) |
| 20 to 24 Years | 89 (63.6%) | 23 (25.8%) |
| 25 to 29 Years | 0 (0.0%) | 0 (0.0%) |
| 30 to 34 Years | 79 (100.0%) | 0 (0.0%) |
| 35 to 44 Years | 175 (77.1%) | 15 (8.6%) |
| 45 to 54 Years | 245 (79.5%) | 0 (0.0%) |
| 55 to 59 Years | 122 (67.4%) | 10 (8.2%) |
| 60 to 64 Years | 27 (65.9%) | 0 (0.0%) |
| 65 to 74 Years | 19 (17.9%) | 0 (0.0%) |
| 75 Years and over | 0 (0.0%) | 0 (0.0%) |
| Total | 906 (47.1%) | 80 (8.8%) |
Employment Status by Educational Attainment in Pine Air
According to labor force statistics for Pine Air, 77.5% of individuals (648) out of the total population between 25 and 64 years of age (836) are in the labor force, with 3.9% or 25 of them being unemployed. The group with the highest labor force participation rate are those with the educational attainment of less than high school, with 85.4% or 152 individuals in the labor force. Within the labor force, individuals with college / associate degree education have the highest percentage of unemployment, with 16.2% or 23 of them being unemployed.
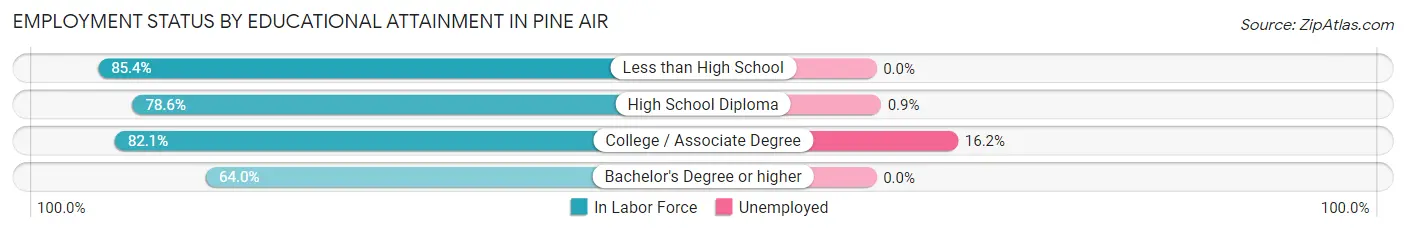
| Educational Attainment | In Labor Force | Unemployed |
| Less than High School | 152 (85.4%) | 0 (0.0%) |
| High School Diploma | 235 (78.6%) | 3 (0.9%) |
| College / Associate Degree | 142 (82.1%) | 28 (16.2%) |
| Bachelor's Degree or higher | 119 (64.0%) | 0 (0.0%) |
| Total | 648 (77.5%) | 33 (3.9%) |
Employment Occupations by Sex in Pine Air
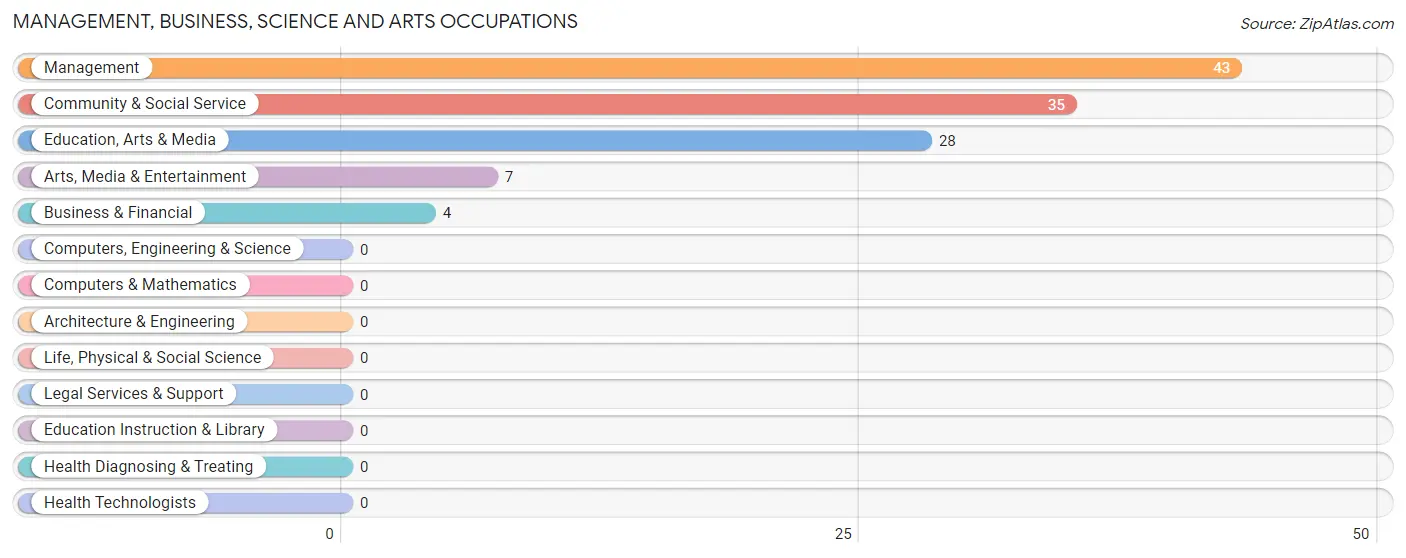
Management, Business, Science and Arts Occupations
The most common Management, Business, Science and Arts occupations in Pine Air are Management (43 | 5.2%), Community & Social Service (35 | 4.2%), Education, Arts & Media (28 | 3.4%), Arts, Media & Entertainment (7 | 0.9%), and Business & Financial (4 | 0.5%).
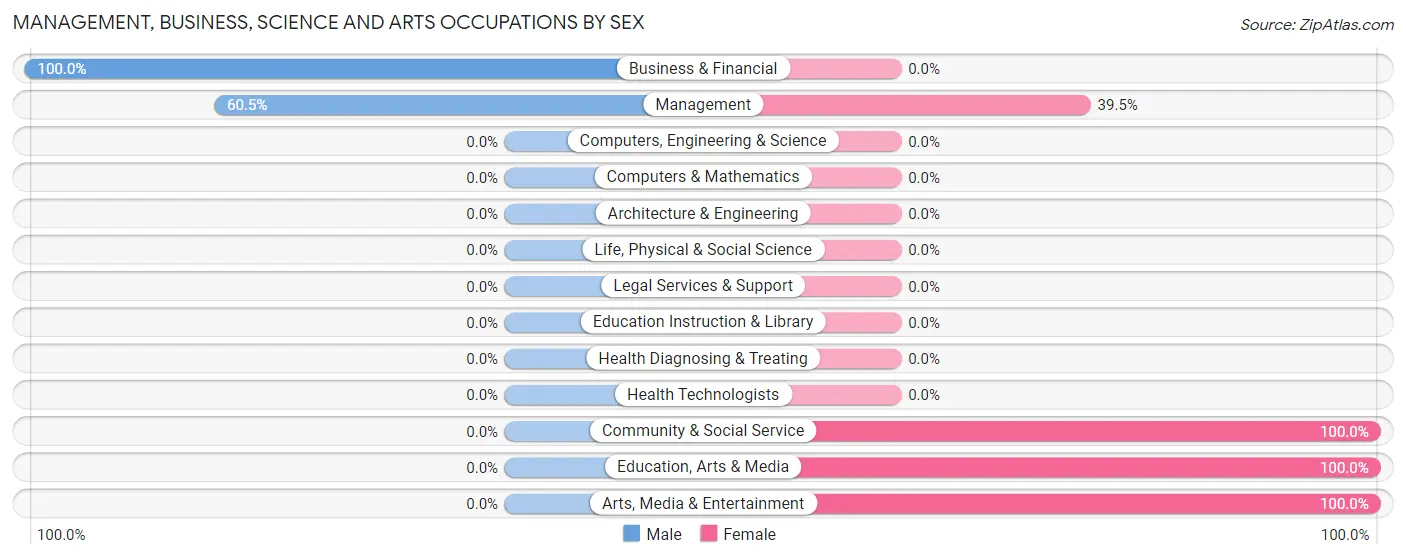
Management, Business, Science and Arts Occupations by Sex
Within the Management, Business, Science and Arts occupations in Pine Air, the most male-oriented occupations are Business & Financial (100.0%), and Management (60.5%), while the most female-oriented occupations are Community & Social Service (100.0%), Education, Arts & Media (100.0%), and Arts, Media & Entertainment (100.0%).
| Occupation | Male | Female |
| Management | 26 (60.5%) | 17 (39.5%) |
| Business & Financial | 4 (100.0%) | 0 (0.0%) |
| Computers, Engineering & Science | 0 (0.0%) | 0 (0.0%) |
| Computers & Mathematics | 0 (0.0%) | 0 (0.0%) |
| Architecture & Engineering | 0 (0.0%) | 0 (0.0%) |
| Life, Physical & Social Science | 0 (0.0%) | 0 (0.0%) |
| Community & Social Service | 0 (0.0%) | 35 (100.0%) |
| Education, Arts & Media | 0 (0.0%) | 28 (100.0%) |
| Legal Services & Support | 0 (0.0%) | 0 (0.0%) |
| Education Instruction & Library | 0 (0.0%) | 0 (0.0%) |
| Arts, Media & Entertainment | 0 (0.0%) | 7 (100.0%) |
| Health Diagnosing & Treating | 0 (0.0%) | 0 (0.0%) |
| Health Technologists | 0 (0.0%) | 0 (0.0%) |
| Total (Category) | 30 (36.6%) | 52 (63.4%) |
| Total (Overall) | 486 (58.8%) | 340 (41.2%) |
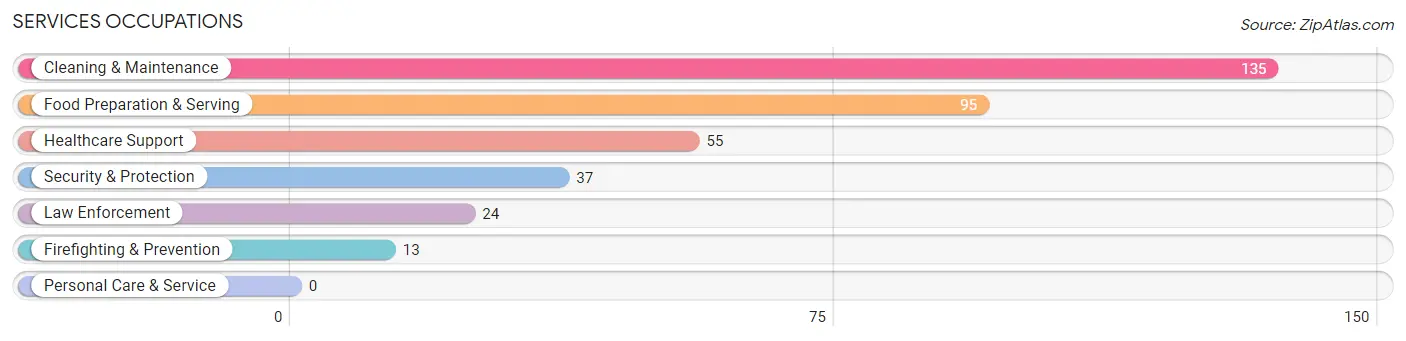
Services Occupations
The most common Services occupations in Pine Air are Cleaning & Maintenance (135 | 16.3%), Food Preparation & Serving (95 | 11.5%), Healthcare Support (55 | 6.7%), Security & Protection (37 | 4.5%), and Law Enforcement (24 | 2.9%).
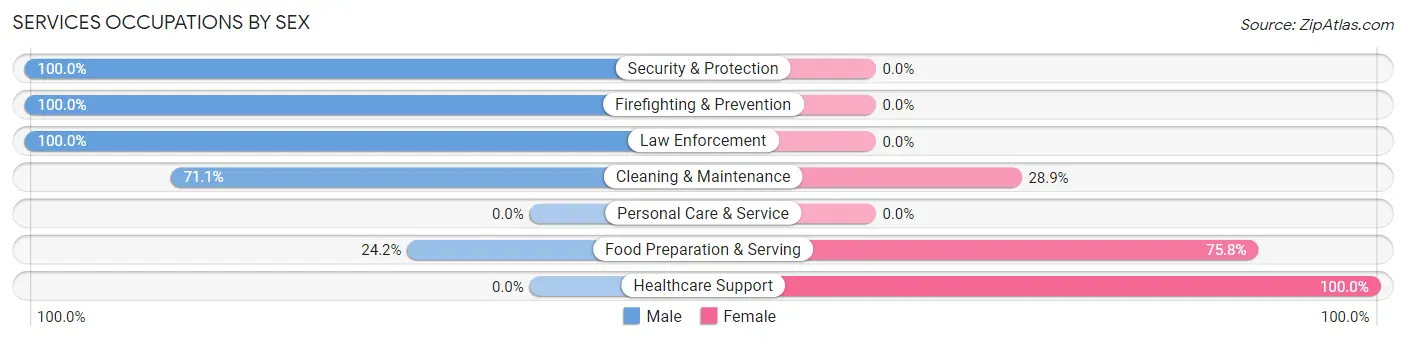
Services Occupations by Sex
Within the Services occupations in Pine Air, the most male-oriented occupations are Security & Protection (100.0%), Firefighting & Prevention (100.0%), and Law Enforcement (100.0%), while the most female-oriented occupations are Healthcare Support (100.0%), Food Preparation & Serving (75.8%), and Cleaning & Maintenance (28.9%).
| Occupation | Male | Female |
| Healthcare Support | 0 (0.0%) | 55 (100.0%) |
| Security & Protection | 37 (100.0%) | 0 (0.0%) |
| Firefighting & Prevention | 13 (100.0%) | 0 (0.0%) |
| Law Enforcement | 24 (100.0%) | 0 (0.0%) |
| Food Preparation & Serving | 23 (24.2%) | 72 (75.8%) |
| Cleaning & Maintenance | 96 (71.1%) | 39 (28.9%) |
| Personal Care & Service | 0 (0.0%) | 0 (0.0%) |
| Total (Category) | 156 (48.4%) | 166 (51.5%) |
| Total (Overall) | 486 (58.8%) | 340 (41.2%) |
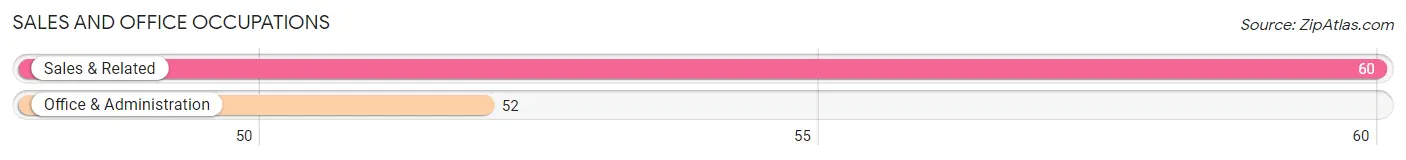
Sales and Office Occupations
The most common Sales and Office occupations in Pine Air are Sales & Related (60 | 7.3%), and Office & Administration (52 | 6.3%).
Sales and Office Occupations by Sex
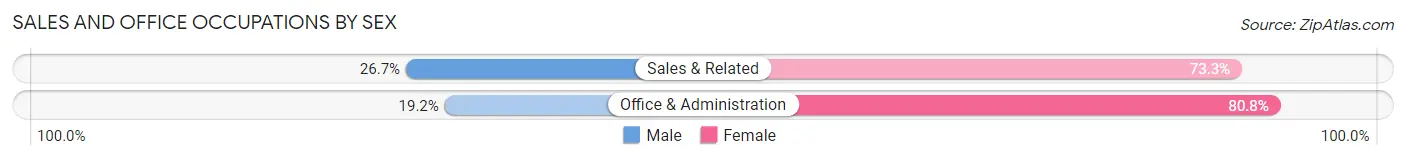
| Occupation | Male | Female |
| Sales & Related | 16 (26.7%) | 44 (73.3%) |
| Office & Administration | 10 (19.2%) | 42 (80.8%) |
| Total (Category) | 26 (23.2%) | 86 (76.8%) |
| Total (Overall) | 486 (58.8%) | 340 (41.2%) |
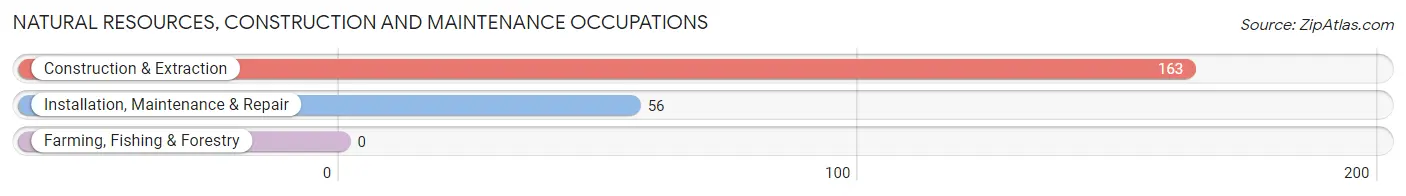
Natural Resources, Construction and Maintenance Occupations
The most common Natural Resources, Construction and Maintenance occupations in Pine Air are Construction & Extraction (163 | 19.7%), and Installation, Maintenance & Repair (56 | 6.8%).
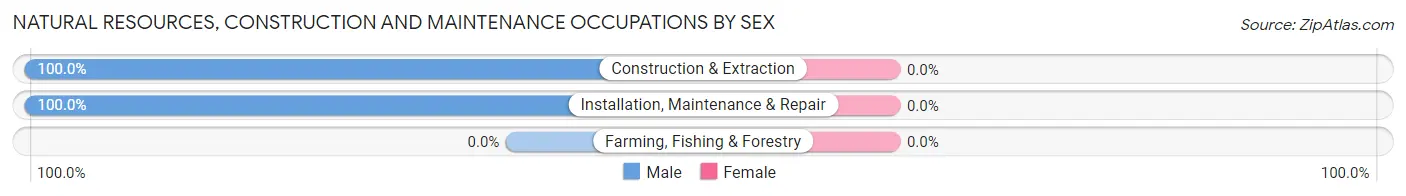
Natural Resources, Construction and Maintenance Occupations by Sex
| Occupation | Male | Female |
| Farming, Fishing & Forestry | 0 (0.0%) | 0 (0.0%) |
| Construction & Extraction | 163 (100.0%) | 0 (0.0%) |
| Installation, Maintenance & Repair | 56 (100.0%) | 0 (0.0%) |
| Total (Category) | 219 (100.0%) | 0 (0.0%) |
| Total (Overall) | 486 (58.8%) | 340 (41.2%) |
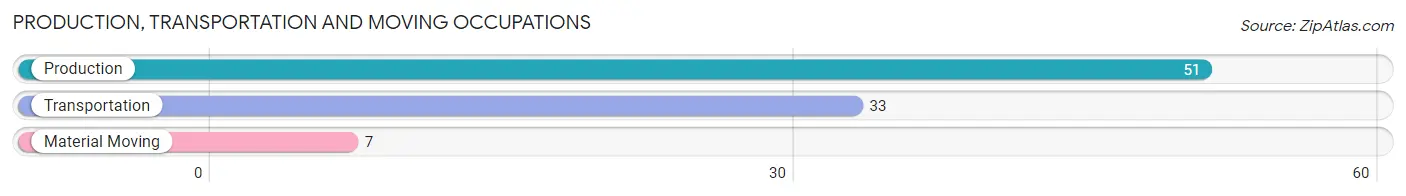
Production, Transportation and Moving Occupations
The most common Production, Transportation and Moving occupations in Pine Air are Production (51 | 6.2%), Transportation (33 | 4.0%), and Material Moving (7 | 0.9%).
Production, Transportation and Moving Occupations by Sex
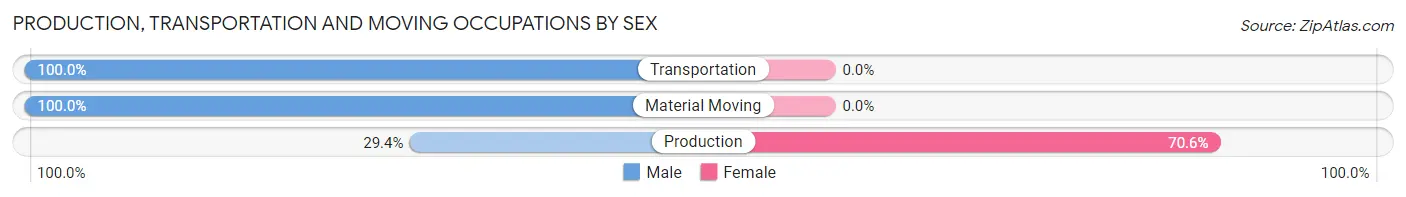
| Occupation | Male | Female |
| Production | 15 (29.4%) | 36 (70.6%) |
| Transportation | 33 (100.0%) | 0 (0.0%) |
| Material Moving | 7 (100.0%) | 0 (0.0%) |
| Total (Category) | 55 (60.4%) | 36 (39.6%) |
| Total (Overall) | 486 (58.8%) | 340 (41.2%) |
Employment Industries by Sex in Pine Air
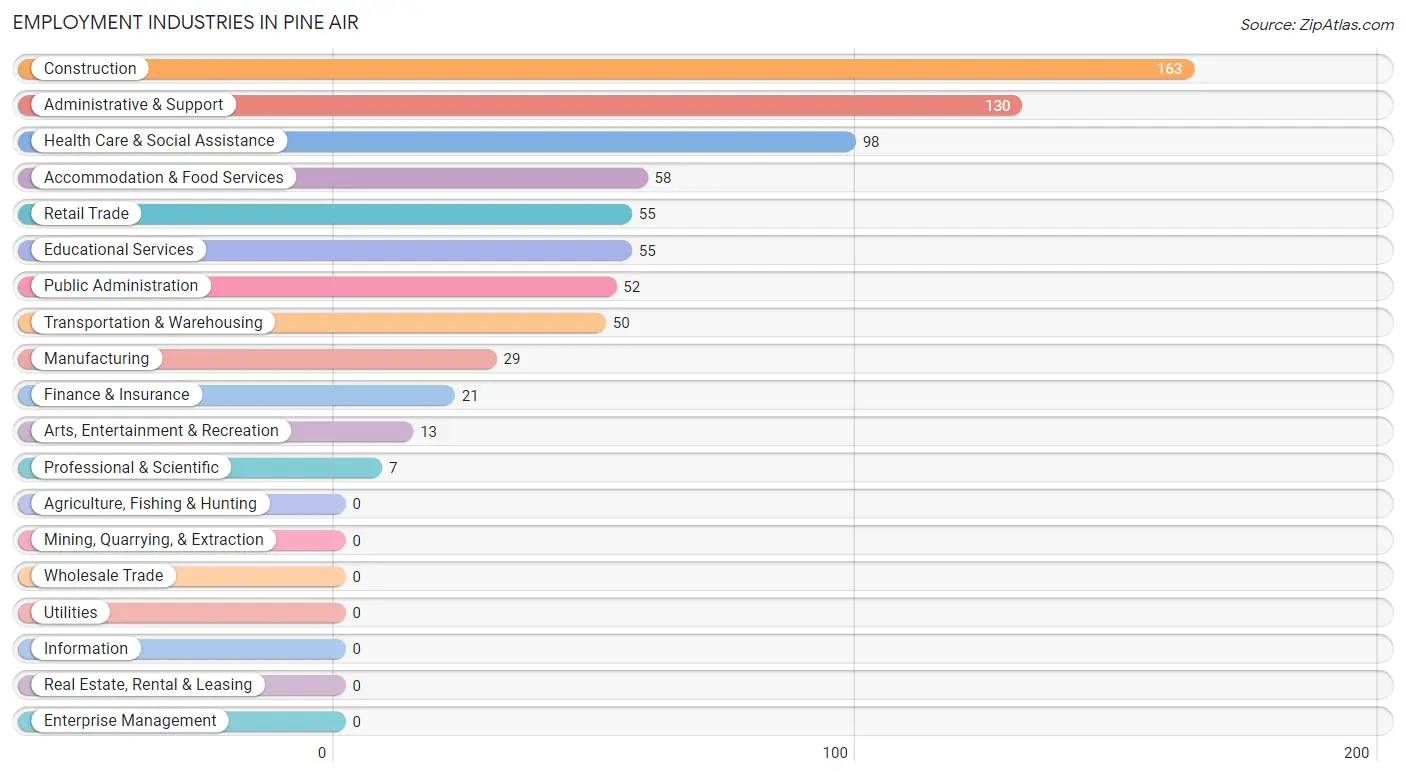
Employment Industries in Pine Air
The major employment industries in Pine Air include Construction (163 | 19.7%), Administrative & Support (130 | 15.7%), Health Care & Social Assistance (98 | 11.9%), Accommodation & Food Services (58 | 7.0%), and Retail Trade (55 | 6.7%).
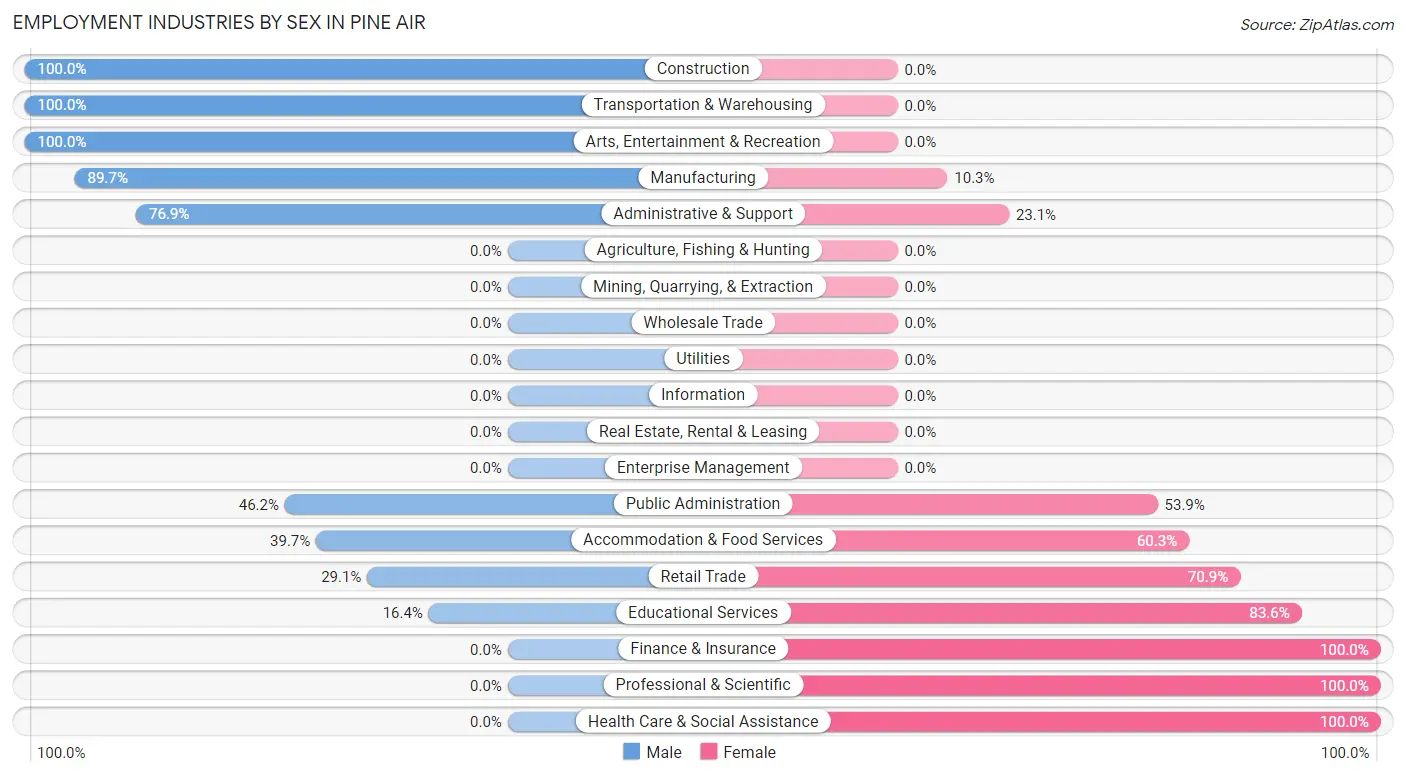
Employment Industries by Sex in Pine Air
The Pine Air industries that see more men than women are Construction (100.0%), Transportation & Warehousing (100.0%), and Arts, Entertainment & Recreation (100.0%), whereas the industries that tend to have a higher number of women are Finance & Insurance (100.0%), Professional & Scientific (100.0%), and Health Care & Social Assistance (100.0%).
| Industry | Male | Female |
| Agriculture, Fishing & Hunting | 0 (0.0%) | 0 (0.0%) |
| Mining, Quarrying, & Extraction | 0 (0.0%) | 0 (0.0%) |
| Construction | 163 (100.0%) | 0 (0.0%) |
| Manufacturing | 26 (89.7%) | 3 (10.3%) |
| Wholesale Trade | 0 (0.0%) | 0 (0.0%) |
| Retail Trade | 16 (29.1%) | 39 (70.9%) |
| Transportation & Warehousing | 50 (100.0%) | 0 (0.0%) |
| Utilities | 0 (0.0%) | 0 (0.0%) |
| Information | 0 (0.0%) | 0 (0.0%) |
| Finance & Insurance | 0 (0.0%) | 21 (100.0%) |
| Real Estate, Rental & Leasing | 0 (0.0%) | 0 (0.0%) |
| Professional & Scientific | 0 (0.0%) | 7 (100.0%) |
| Enterprise Management | 0 (0.0%) | 0 (0.0%) |
| Administrative & Support | 100 (76.9%) | 30 (23.1%) |
| Educational Services | 9 (16.4%) | 46 (83.6%) |
| Health Care & Social Assistance | 0 (0.0%) | 98 (100.0%) |
| Arts, Entertainment & Recreation | 13 (100.0%) | 0 (0.0%) |
| Accommodation & Food Services | 23 (39.7%) | 35 (60.3%) |
| Public Administration | 24 (46.2%) | 28 (53.8%) |
| Total | 486 (58.8%) | 340 (41.2%) |
Education in Pine Air
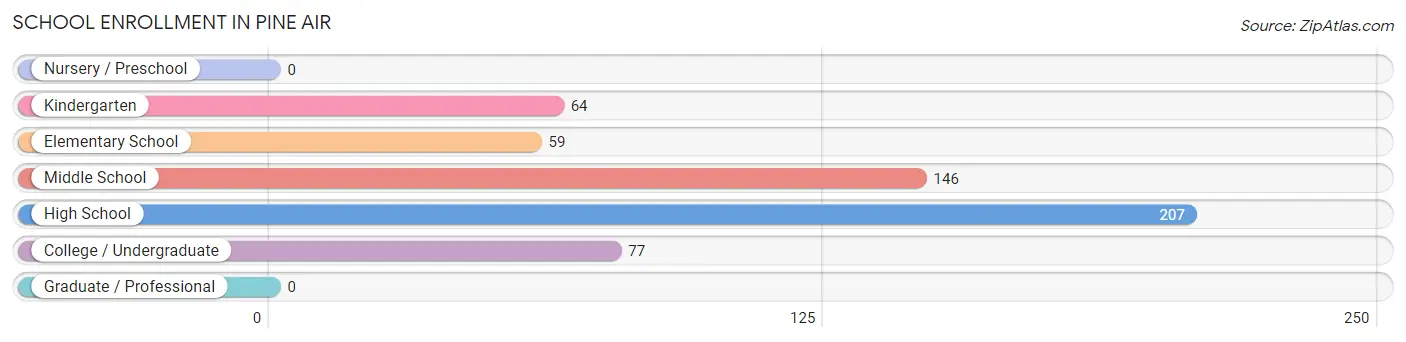
School Enrollment in Pine Air
The most common levels of schooling among the 553 students in Pine Air are high school (207 | 37.4%), middle school (146 | 26.4%), and college / undergraduate (77 | 13.9%).
| School Level | # Students | % Students |
| Nursery / Preschool | 0 | 0.0% |
| Kindergarten | 64 | 11.6% |
| Elementary School | 59 | 10.7% |
| Middle School | 146 | 26.4% |
| High School | 207 | 37.4% |
| College / Undergraduate | 77 | 13.9% |
| Graduate / Professional | 0 | 0.0% |
| Total | 553 | 100.0% |
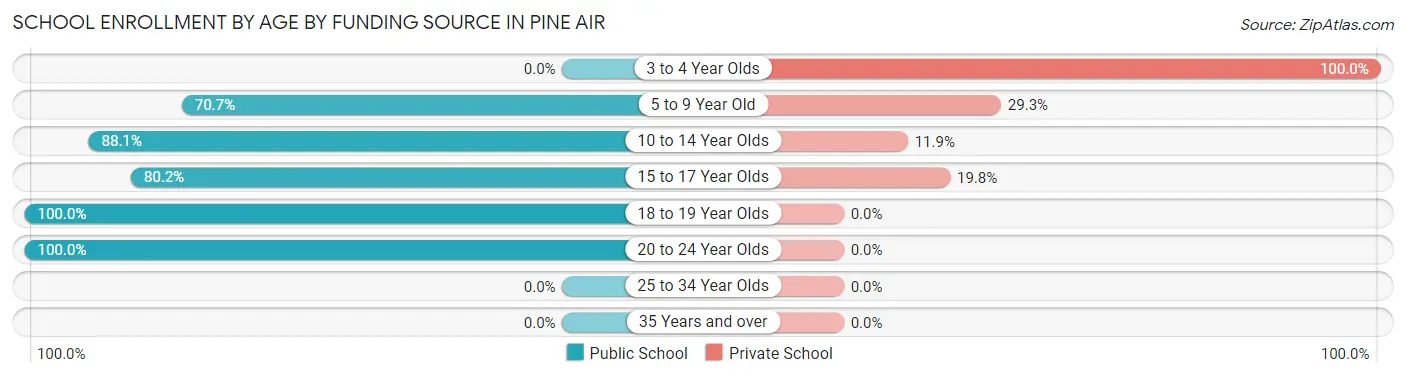
School Enrollment by Age by Funding Source in Pine Air
Out of a total of 553 students who are enrolled in schools in Pine Air, 108 (19.5%) attend a private institution, while the remaining 445 (80.5%) are enrolled in public schools. The age group of 3 to 4 year olds has the highest likelihood of being enrolled in private schools, with 24 (100.0% in the age bracket) enrolled. Conversely, the age group of 18 to 19 year olds has the lowest likelihood of being enrolled in a private school, with 88 (100.0% in the age bracket) attending a public institution.
| Age Bracket | Public School | Private School |
| 3 to 4 Year Olds | 0 (0.0%) | 24 (100.0%) |
| 5 to 9 Year Old | 70 (70.7%) | 29 (29.3%) |
| 10 to 14 Year Olds | 96 (88.1%) | 13 (11.9%) |
| 15 to 17 Year Olds | 170 (80.2%) | 42 (19.8%) |
| 18 to 19 Year Olds | 88 (100.0%) | 0 (0.0%) |
| 20 to 24 Year Olds | 21 (100.0%) | 0 (0.0%) |
| 25 to 34 Year Olds | 0 (0.0%) | 0 (0.0%) |
| 35 Years and over | 0 (0.0%) | 0 (0.0%) |
| Total | 445 (80.5%) | 108 (19.5%) |
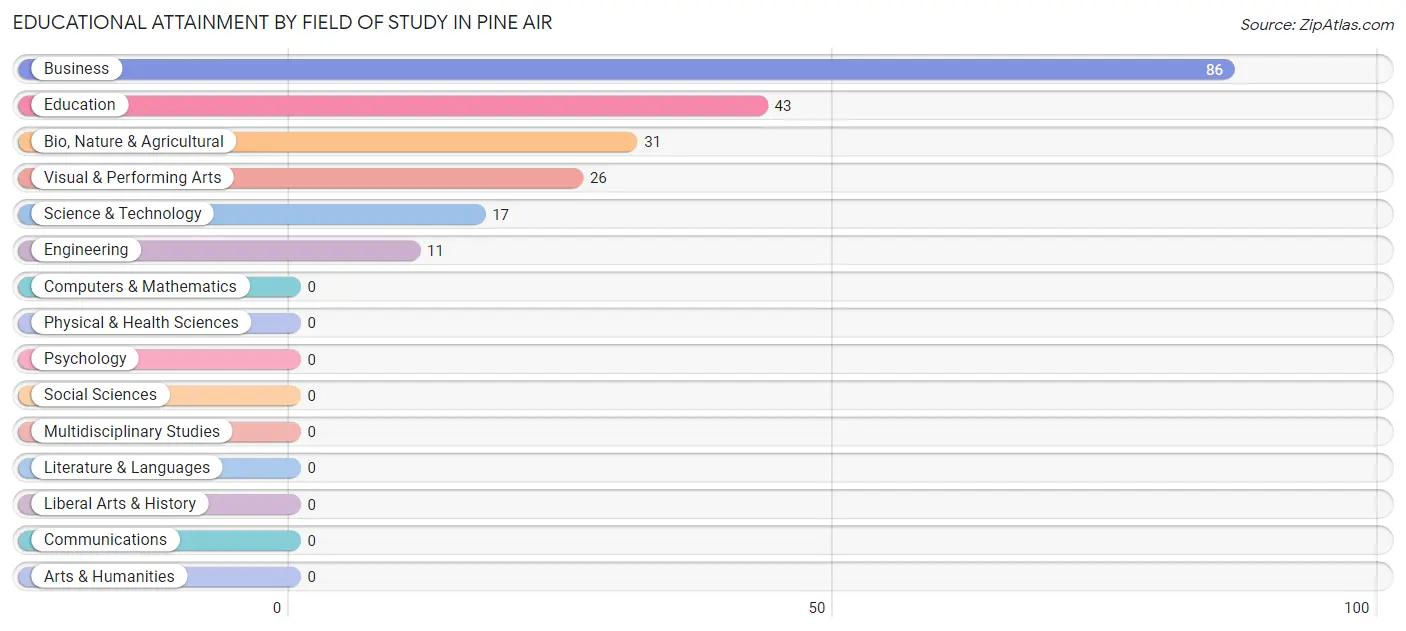
Educational Attainment by Field of Study in Pine Air
Business (86 | 40.2%), education (43 | 20.1%), bio, nature & agricultural (31 | 14.5%), visual & performing arts (26 | 12.1%), and science & technology (17 | 7.9%) are the most common fields of study among 214 individuals in Pine Air who have obtained a bachelor's degree or higher.
| Field of Study | # Graduates | % Graduates |
| Computers & Mathematics | 0 | 0.0% |
| Bio, Nature & Agricultural | 31 | 14.5% |
| Physical & Health Sciences | 0 | 0.0% |
| Psychology | 0 | 0.0% |
| Social Sciences | 0 | 0.0% |
| Engineering | 11 | 5.1% |
| Multidisciplinary Studies | 0 | 0.0% |
| Science & Technology | 17 | 7.9% |
| Business | 86 | 40.2% |
| Education | 43 | 20.1% |
| Literature & Languages | 0 | 0.0% |
| Liberal Arts & History | 0 | 0.0% |
| Visual & Performing Arts | 26 | 12.1% |
| Communications | 0 | 0.0% |
| Arts & Humanities | 0 | 0.0% |
| Total | 214 | 100.0% |
Transportation & Commute in Pine Air
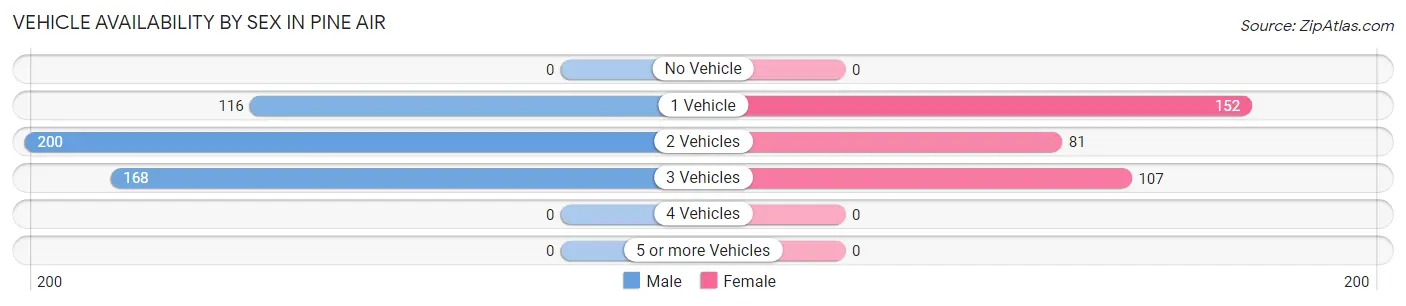
Vehicle Availability by Sex in Pine Air
The most prevalent vehicle ownership categories in Pine Air are males with 2 vehicles (200, accounting for 41.3%) and females with 2 vehicles (81, making up 58.8%).
| Vehicles Available | Male | Female |
| No Vehicle | 0 (0.0%) | 0 (0.0%) |
| 1 Vehicle | 116 (24.0%) | 152 (44.7%) |
| 2 Vehicles | 200 (41.3%) | 81 (23.8%) |
| 3 Vehicles | 168 (34.7%) | 107 (31.5%) |
| 4 Vehicles | 0 (0.0%) | 0 (0.0%) |
| 5 or more Vehicles | 0 (0.0%) | 0 (0.0%) |
| Total | 484 (100.0%) | 340 (100.0%) |
Commute Time in Pine Air
The most frequently occuring commute durations in Pine Air are 15 to 19 minutes (218 commuters, 27.3%), 20 to 24 minutes (178 commuters, 22.3%), and 5 to 9 minutes (99 commuters, 12.4%).
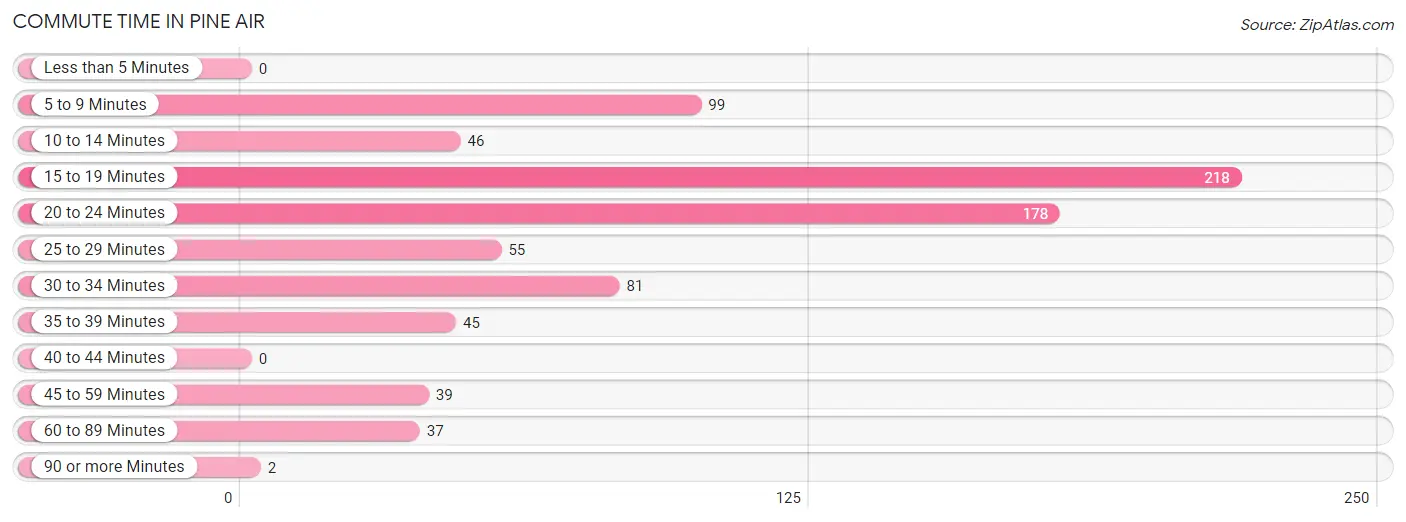
| Commute Time | # Commuters | % Commuters |
| Less than 5 Minutes | 0 | 0.0% |
| 5 to 9 Minutes | 99 | 12.4% |
| 10 to 14 Minutes | 46 | 5.8% |
| 15 to 19 Minutes | 218 | 27.3% |
| 20 to 24 Minutes | 178 | 22.3% |
| 25 to 29 Minutes | 55 | 6.9% |
| 30 to 34 Minutes | 81 | 10.1% |
| 35 to 39 Minutes | 45 | 5.6% |
| 40 to 44 Minutes | 0 | 0.0% |
| 45 to 59 Minutes | 39 | 4.9% |
| 60 to 89 Minutes | 37 | 4.6% |
| 90 or more Minutes | 2 | 0.3% |
Commute Time by Sex in Pine Air
The most common commute times in Pine Air are 20 to 24 minutes (159 commuters, 32.7%) for males and 15 to 19 minutes (90 commuters, 28.7%) for females.
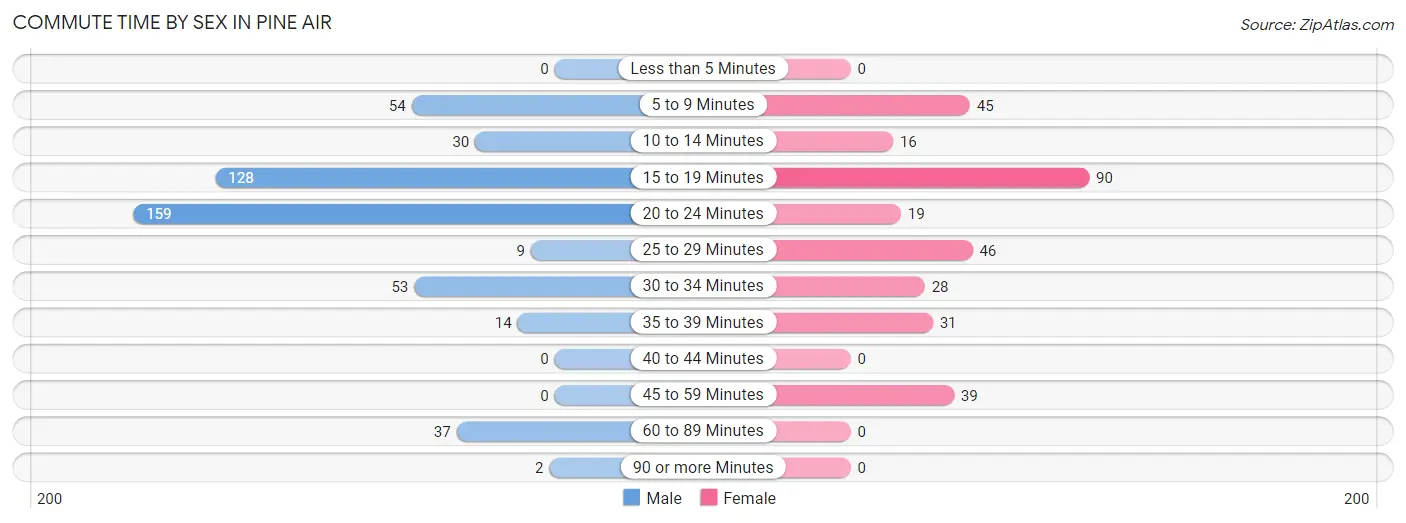
| Commute Time | Male | Female |
| Less than 5 Minutes | 0 (0.0%) | 0 (0.0%) |
| 5 to 9 Minutes | 54 (11.1%) | 45 (14.3%) |
| 10 to 14 Minutes | 30 (6.2%) | 16 (5.1%) |
| 15 to 19 Minutes | 128 (26.3%) | 90 (28.7%) |
| 20 to 24 Minutes | 159 (32.7%) | 19 (6.0%) |
| 25 to 29 Minutes | 9 (1.8%) | 46 (14.6%) |
| 30 to 34 Minutes | 53 (10.9%) | 28 (8.9%) |
| 35 to 39 Minutes | 14 (2.9%) | 31 (9.9%) |
| 40 to 44 Minutes | 0 (0.0%) | 0 (0.0%) |
| 45 to 59 Minutes | 0 (0.0%) | 39 (12.4%) |
| 60 to 89 Minutes | 37 (7.6%) | 0 (0.0%) |
| 90 or more Minutes | 2 (0.4%) | 0 (0.0%) |
Time of Departure to Work by Sex in Pine Air
The most frequent times of departure to work in Pine Air are 8:00 AM to 8:29 AM (121, 24.9%) for males and 9:00 AM to 9:59 AM (120, 38.2%) for females.
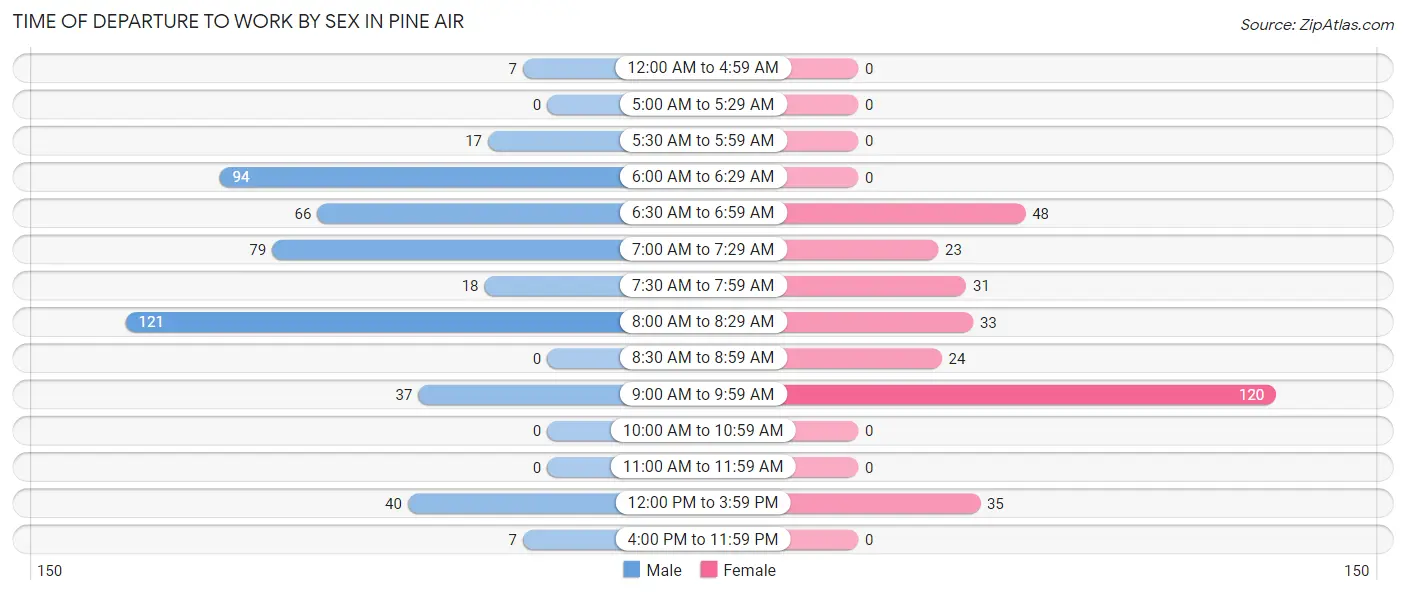
| Time of Departure | Male | Female |
| 12:00 AM to 4:59 AM | 7 (1.4%) | 0 (0.0%) |
| 5:00 AM to 5:29 AM | 0 (0.0%) | 0 (0.0%) |
| 5:30 AM to 5:59 AM | 17 (3.5%) | 0 (0.0%) |
| 6:00 AM to 6:29 AM | 94 (19.3%) | 0 (0.0%) |
| 6:30 AM to 6:59 AM | 66 (13.6%) | 48 (15.3%) |
| 7:00 AM to 7:29 AM | 79 (16.3%) | 23 (7.3%) |
| 7:30 AM to 7:59 AM | 18 (3.7%) | 31 (9.9%) |
| 8:00 AM to 8:29 AM | 121 (24.9%) | 33 (10.5%) |
| 8:30 AM to 8:59 AM | 0 (0.0%) | 24 (7.6%) |
| 9:00 AM to 9:59 AM | 37 (7.6%) | 120 (38.2%) |
| 10:00 AM to 10:59 AM | 0 (0.0%) | 0 (0.0%) |
| 11:00 AM to 11:59 AM | 0 (0.0%) | 0 (0.0%) |
| 12:00 PM to 3:59 PM | 40 (8.2%) | 35 (11.2%) |
| 4:00 PM to 11:59 PM | 7 (1.4%) | 0 (0.0%) |
| Total | 486 (100.0%) | 314 (100.0%) |
Housing Occupancy in Pine Air
Occupancy by Ownership in Pine Air
Of the total 624 dwellings in Pine Air, owner-occupied units account for 291 (46.6%), while renter-occupied units make up 333 (53.4%).
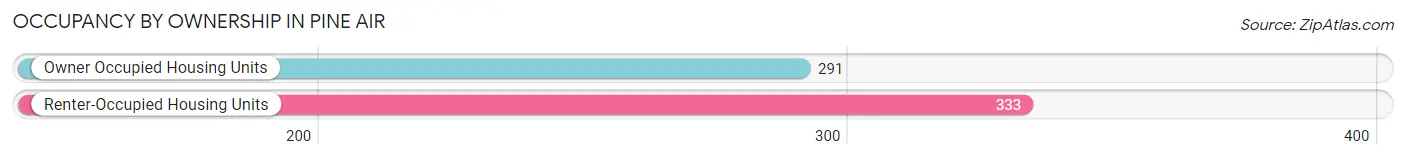
| Occupancy | # Housing Units | % Housing Units |
| Owner Occupied Housing Units | 291 | 46.6% |
| Renter-Occupied Housing Units | 333 | 53.4% |
| Total Occupied Housing Units | 624 | 100.0% |
Occupancy by Household Size in Pine Air
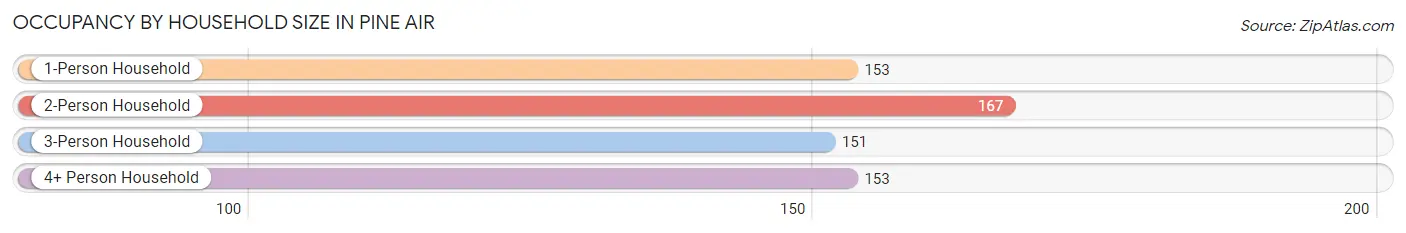
| Household Size | # Housing Units | % Housing Units |
| 1-Person Household | 153 | 24.5% |
| 2-Person Household | 167 | 26.8% |
| 3-Person Household | 151 | 24.2% |
| 4+ Person Household | 153 | 24.5% |
| Total Housing Units | 624 | 100.0% |
Occupancy by Ownership by Household Size in Pine Air
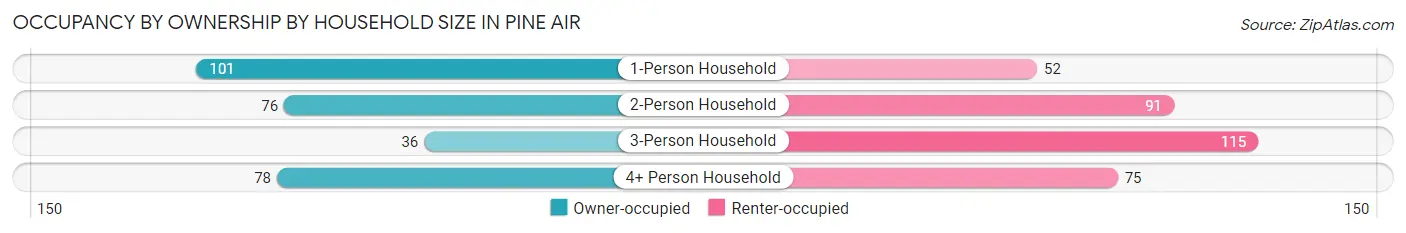
| Household Size | Owner-occupied | Renter-occupied |
| 1-Person Household | 101 (66.0%) | 52 (34.0%) |
| 2-Person Household | 76 (45.5%) | 91 (54.5%) |
| 3-Person Household | 36 (23.8%) | 115 (76.2%) |
| 4+ Person Household | 78 (51.0%) | 75 (49.0%) |
| Total Housing Units | 291 (46.6%) | 333 (53.4%) |
Occupancy by Educational Attainment in Pine Air
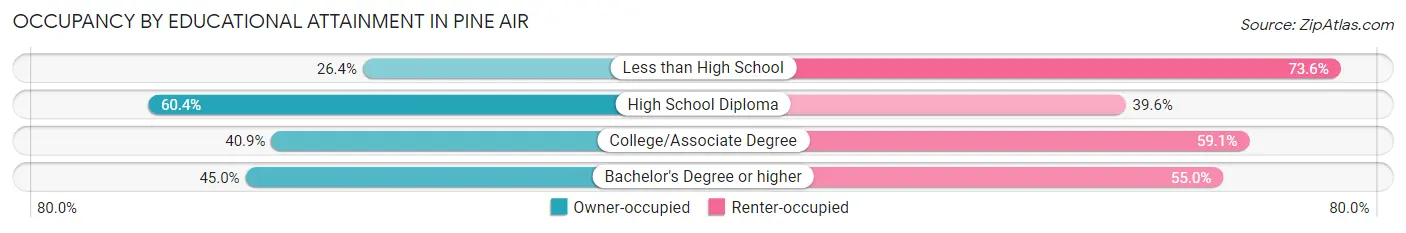
| Household Size | Owner-occupied | Renter-occupied |
| Less than High School | 29 (26.4%) | 81 (73.6%) |
| High School Diploma | 139 (60.4%) | 91 (39.6%) |
| College/Associate Degree | 47 (40.9%) | 68 (59.1%) |
| Bachelor's Degree or higher | 76 (45.0%) | 93 (55.0%) |
Occupancy by Age of Householder in Pine Air
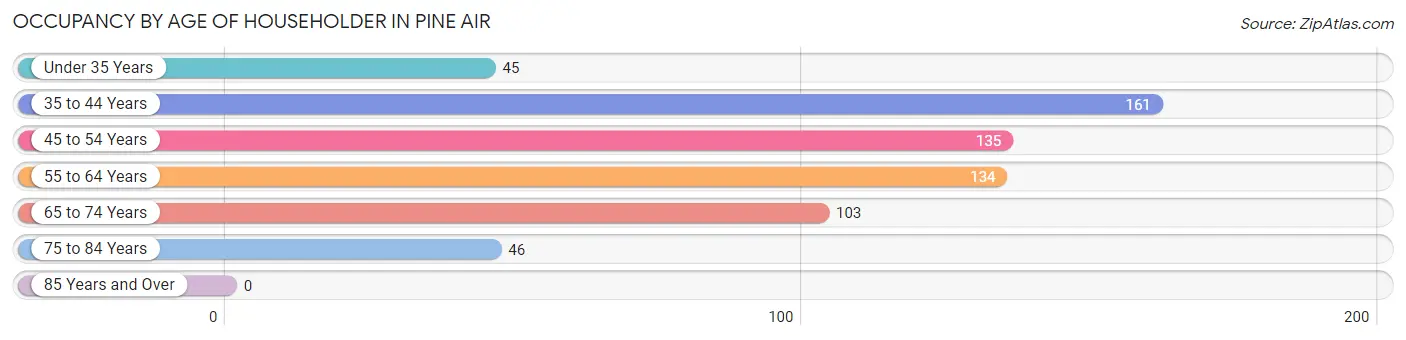
| Age Bracket | # Households | % Households |
| Under 35 Years | 45 | 7.2% |
| 35 to 44 Years | 161 | 25.8% |
| 45 to 54 Years | 135 | 21.6% |
| 55 to 64 Years | 134 | 21.5% |
| 65 to 74 Years | 103 | 16.5% |
| 75 to 84 Years | 46 | 7.4% |
| 85 Years and Over | 0 | 0.0% |
| Total | 624 | 100.0% |
Housing Finances in Pine Air
Median Income by Occupancy in Pine Air
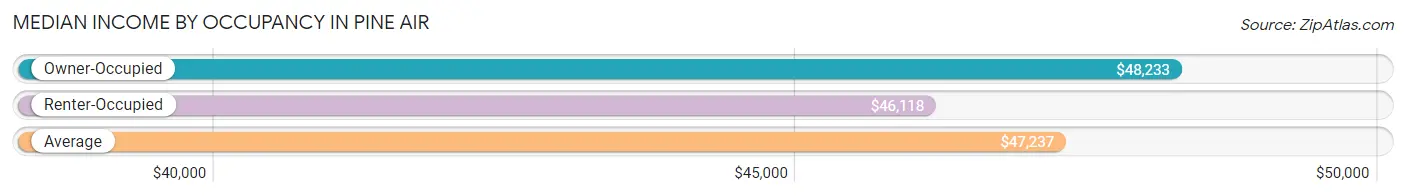
| Occupancy Type | # Households | Median Income |
| Owner-Occupied | 291 (46.6%) | $48,233 |
| Renter-Occupied | 333 (53.4%) | $46,118 |
| Average | 624 (100.0%) | $47,237 |
Occupancy by Householder Income Bracket in Pine Air
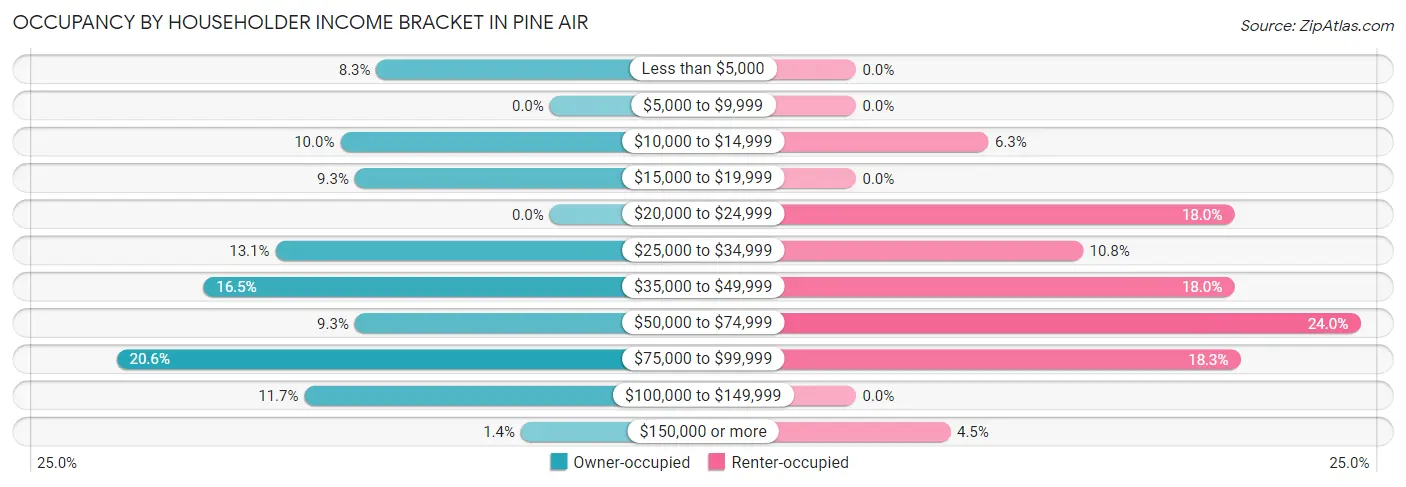
| Income Bracket | Owner-occupied | Renter-occupied |
| Less than $5,000 | 24 (8.3%) | 0 (0.0%) |
| $5,000 to $9,999 | 0 (0.0%) | 0 (0.0%) |
| $10,000 to $14,999 | 29 (10.0%) | 21 (6.3%) |
| $15,000 to $19,999 | 27 (9.3%) | 0 (0.0%) |
| $20,000 to $24,999 | 0 (0.0%) | 60 (18.0%) |
| $25,000 to $34,999 | 38 (13.1%) | 36 (10.8%) |
| $35,000 to $49,999 | 48 (16.5%) | 60 (18.0%) |
| $50,000 to $74,999 | 27 (9.3%) | 80 (24.0%) |
| $75,000 to $99,999 | 60 (20.6%) | 61 (18.3%) |
| $100,000 to $149,999 | 34 (11.7%) | 0 (0.0%) |
| $150,000 or more | 4 (1.4%) | 15 (4.5%) |
| Total | 291 (100.0%) | 333 (100.0%) |
Monthly Housing Cost Tiers in Pine Air
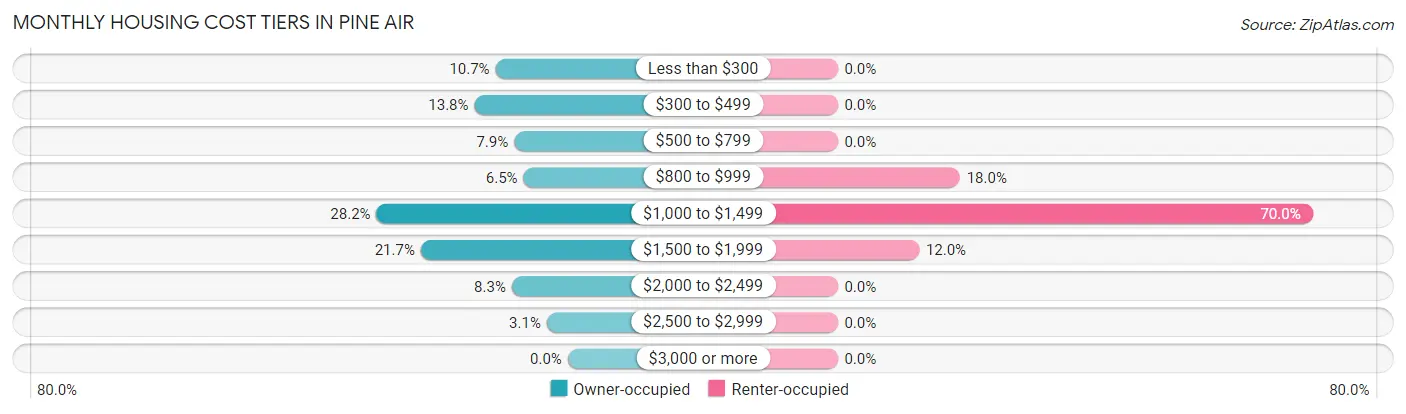
| Monthly Cost | Owner-occupied | Renter-occupied |
| Less than $300 | 31 (10.6%) | 0 (0.0%) |
| $300 to $499 | 40 (13.8%) | 0 (0.0%) |
| $500 to $799 | 23 (7.9%) | 0 (0.0%) |
| $800 to $999 | 19 (6.5%) | 60 (18.0%) |
| $1,000 to $1,499 | 82 (28.2%) | 233 (70.0%) |
| $1,500 to $1,999 | 63 (21.6%) | 40 (12.0%) |
| $2,000 to $2,499 | 24 (8.3%) | 0 (0.0%) |
| $2,500 to $2,999 | 9 (3.1%) | 0 (0.0%) |
| $3,000 or more | 0 (0.0%) | 0 (0.0%) |
| Total | 291 (100.0%) | 333 (100.0%) |
Physical Housing Characteristics in Pine Air
Housing Structures in Pine Air
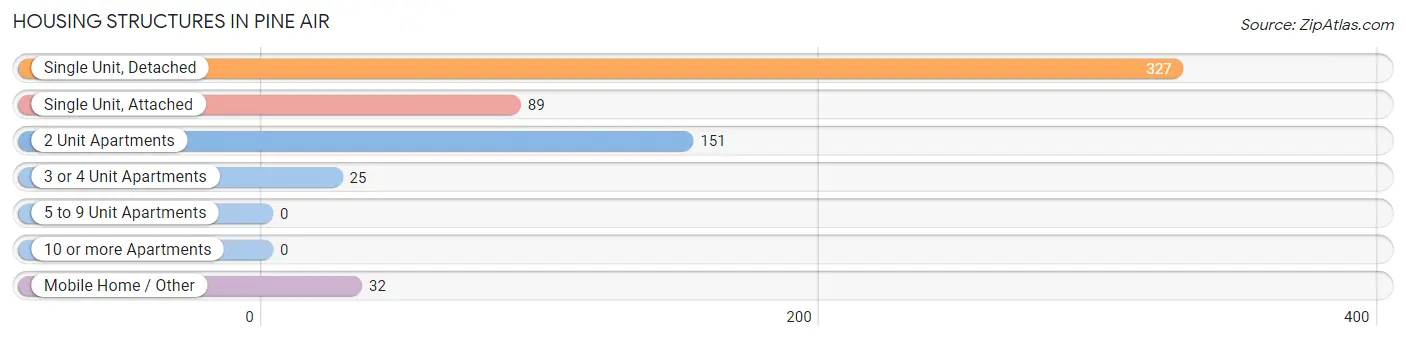
| Structure Type | # Housing Units | % Housing Units |
| Single Unit, Detached | 327 | 52.4% |
| Single Unit, Attached | 89 | 14.3% |
| 2 Unit Apartments | 151 | 24.2% |
| 3 or 4 Unit Apartments | 25 | 4.0% |
| 5 to 9 Unit Apartments | 0 | 0.0% |
| 10 or more Apartments | 0 | 0.0% |
| Mobile Home / Other | 32 | 5.1% |
| Total | 624 | 100.0% |
Housing Structures by Occupancy in Pine Air
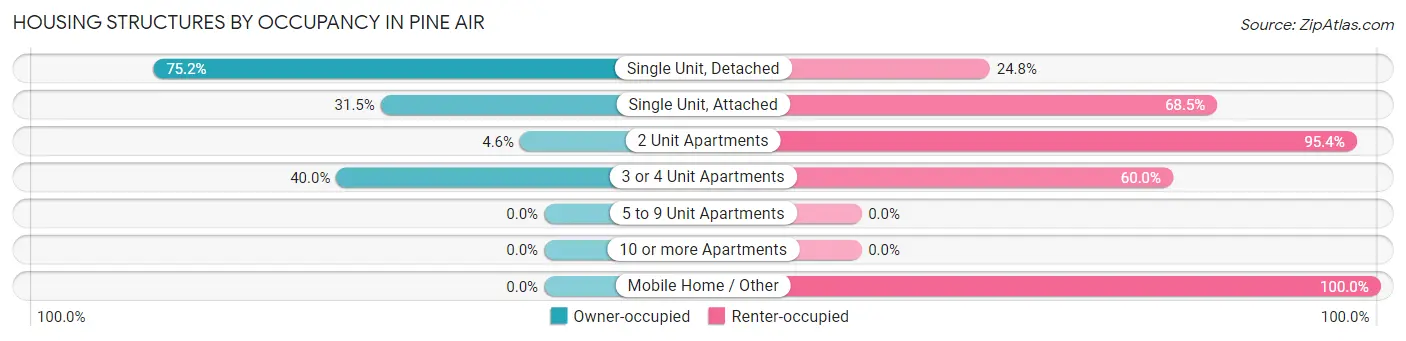
| Structure Type | Owner-occupied | Renter-occupied |
| Single Unit, Detached | 246 (75.2%) | 81 (24.8%) |
| Single Unit, Attached | 28 (31.5%) | 61 (68.5%) |
| 2 Unit Apartments | 7 (4.6%) | 144 (95.4%) |
| 3 or 4 Unit Apartments | 10 (40.0%) | 15 (60.0%) |
| 5 to 9 Unit Apartments | 0 (0.0%) | 0 (0.0%) |
| 10 or more Apartments | 0 (0.0%) | 0 (0.0%) |
| Mobile Home / Other | 0 (0.0%) | 32 (100.0%) |
| Total | 291 (46.6%) | 333 (53.4%) |
Housing Structures by Number of Rooms in Pine Air
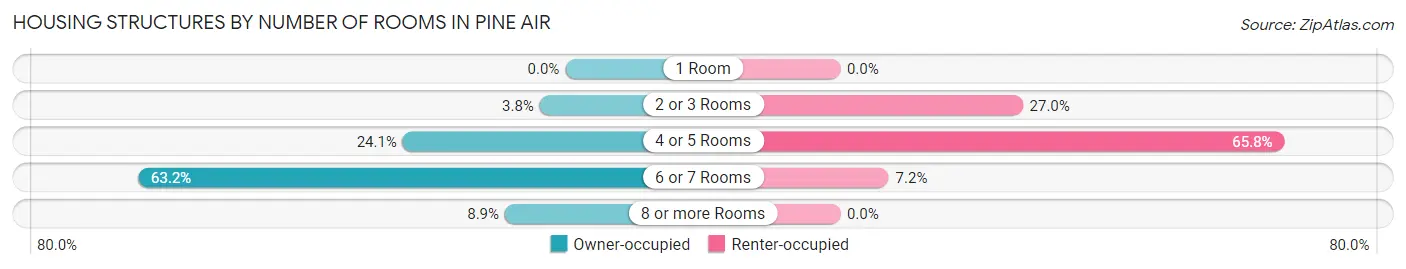
| Number of Rooms | Owner-occupied | Renter-occupied |
| 1 Room | 0 (0.0%) | 0 (0.0%) |
| 2 or 3 Rooms | 11 (3.8%) | 90 (27.0%) |
| 4 or 5 Rooms | 70 (24.0%) | 219 (65.8%) |
| 6 or 7 Rooms | 184 (63.2%) | 24 (7.2%) |
| 8 or more Rooms | 26 (8.9%) | 0 (0.0%) |
| Total | 291 (100.0%) | 333 (100.0%) |
Housing Structure by Heating Type in Pine Air
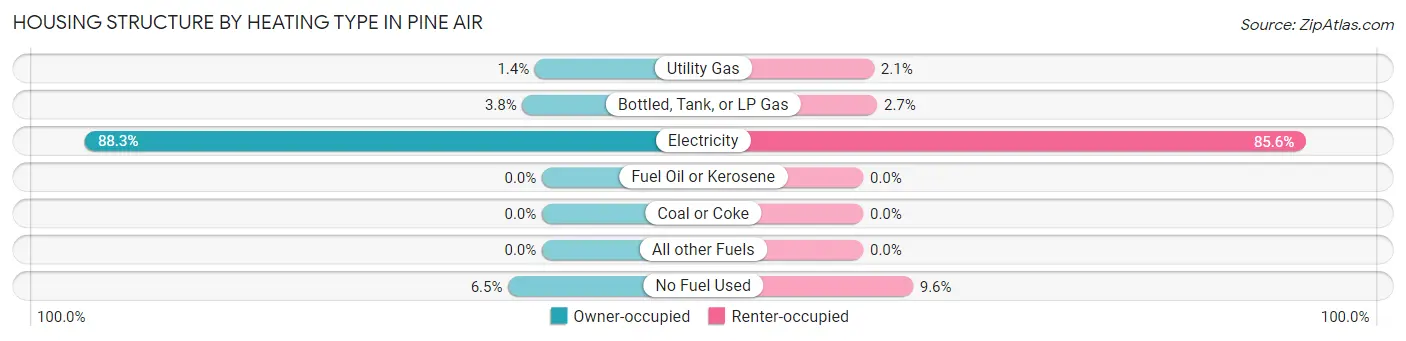
| Heating Type | Owner-occupied | Renter-occupied |
| Utility Gas | 4 (1.4%) | 7 (2.1%) |
| Bottled, Tank, or LP Gas | 11 (3.8%) | 9 (2.7%) |
| Electricity | 257 (88.3%) | 285 (85.6%) |
| Fuel Oil or Kerosene | 0 (0.0%) | 0 (0.0%) |
| Coal or Coke | 0 (0.0%) | 0 (0.0%) |
| All other Fuels | 0 (0.0%) | 0 (0.0%) |
| No Fuel Used | 19 (6.5%) | 32 (9.6%) |
| Total | 291 (100.0%) | 333 (100.0%) |
Household Vehicle Usage in Pine Air
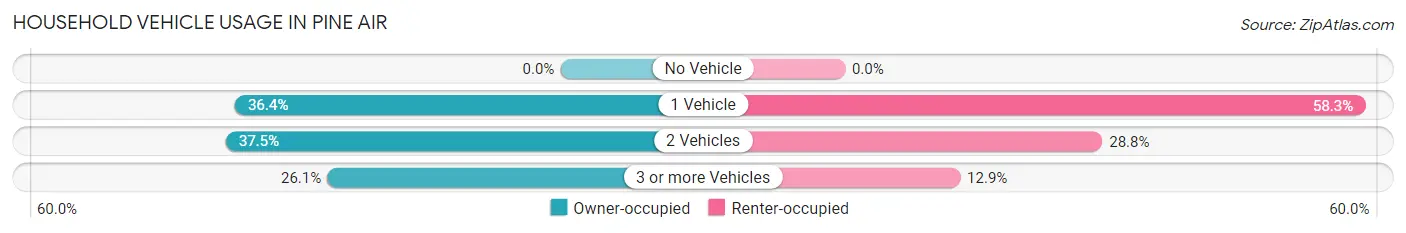
| Vehicles per Household | Owner-occupied | Renter-occupied |
| No Vehicle | 0 (0.0%) | 0 (0.0%) |
| 1 Vehicle | 106 (36.4%) | 194 (58.3%) |
| 2 Vehicles | 109 (37.5%) | 96 (28.8%) |
| 3 or more Vehicles | 76 (26.1%) | 43 (12.9%) |
| Total | 291 (100.0%) | 333 (100.0%) |
Real Estate & Mortgages in Pine Air
Real Estate and Mortgage Overview in Pine Air
| Characteristic | Without Mortgage | With Mortgage |
| Housing Units | 121 | 170 |
| Median Property Value | $218,500 | $269,700 |
| Median Household Income | $27,083 | $0 |
| Monthly Housing Costs | $474 | $0 |
| Real Estate Taxes | $2,024 | $0 |
Property Value by Mortgage Status in Pine Air
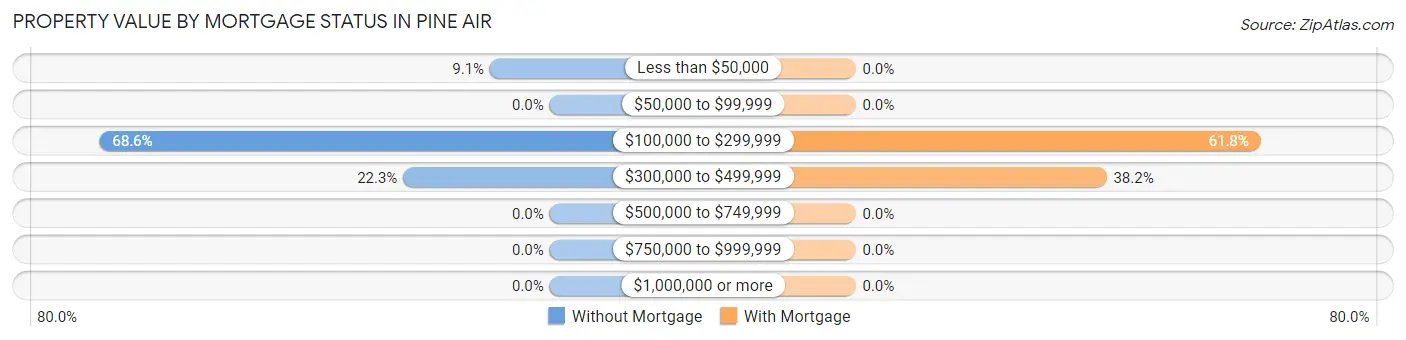
| Property Value | Without Mortgage | With Mortgage |
| Less than $50,000 | 11 (9.1%) | 0 (0.0%) |
| $50,000 to $99,999 | 0 (0.0%) | 0 (0.0%) |
| $100,000 to $299,999 | 83 (68.6%) | 105 (61.8%) |
| $300,000 to $499,999 | 27 (22.3%) | 65 (38.2%) |
| $500,000 to $749,999 | 0 (0.0%) | 0 (0.0%) |
| $750,000 to $999,999 | 0 (0.0%) | 0 (0.0%) |
| $1,000,000 or more | 0 (0.0%) | 0 (0.0%) |
| Total | 121 (100.0%) | 170 (100.0%) |
Household Income by Mortgage Status in Pine Air
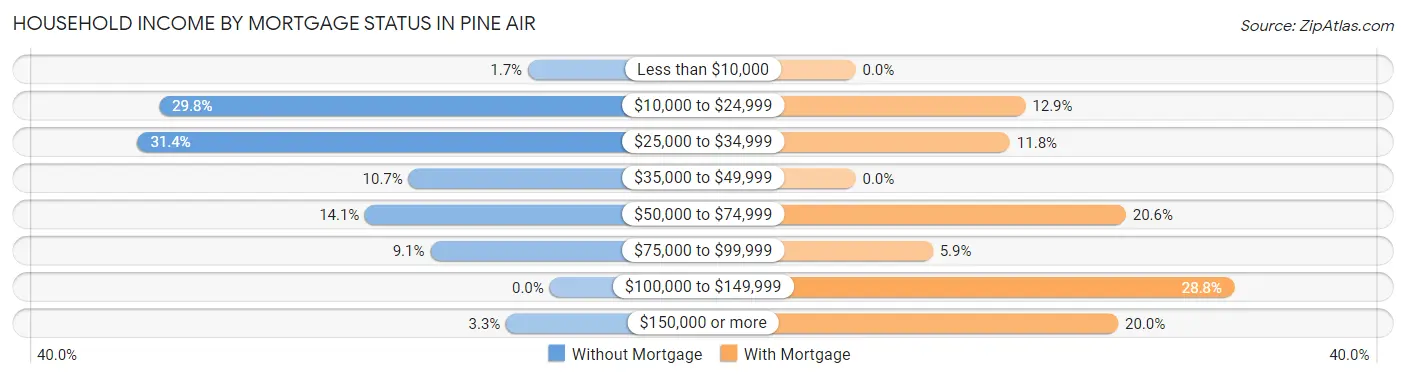
| Household Income | Without Mortgage | With Mortgage |
| Less than $10,000 | 2 (1.7%) | 0 (0.0%) |
| $10,000 to $24,999 | 36 (29.7%) | 22 (12.9%) |
| $25,000 to $34,999 | 38 (31.4%) | 20 (11.8%) |
| $35,000 to $49,999 | 13 (10.7%) | 0 (0.0%) |
| $50,000 to $74,999 | 17 (14.1%) | 35 (20.6%) |
| $75,000 to $99,999 | 11 (9.1%) | 10 (5.9%) |
| $100,000 to $149,999 | 0 (0.0%) | 49 (28.8%) |
| $150,000 or more | 4 (3.3%) | 34 (20.0%) |
| Total | 121 (100.0%) | 170 (100.0%) |
Property Value to Household Income Ratio in Pine Air
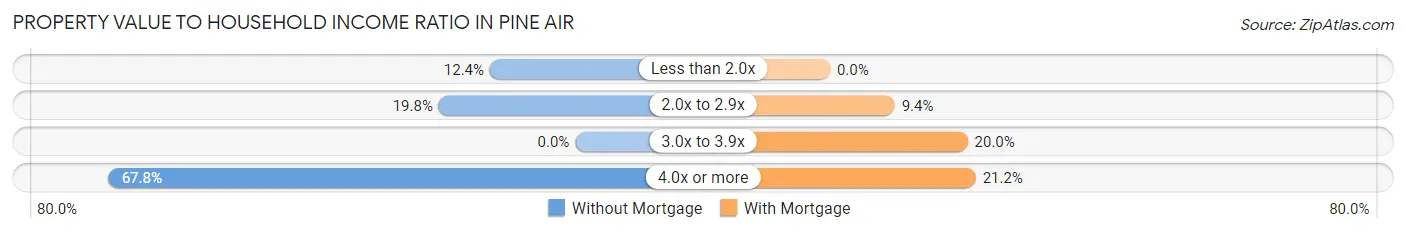
| Value-to-Income Ratio | Without Mortgage | With Mortgage |
| Less than 2.0x | 15 (12.4%) | 0 (0.0%) |
| 2.0x to 2.9x | 24 (19.8%) | 16 (9.4%) |
| 3.0x to 3.9x | 0 (0.0%) | 34 (20.0%) |
| 4.0x or more | 82 (67.8%) | 36 (21.2%) |
| Total | 121 (100.0%) | 170 (100.0%) |
Real Estate Taxes by Mortgage Status in Pine Air
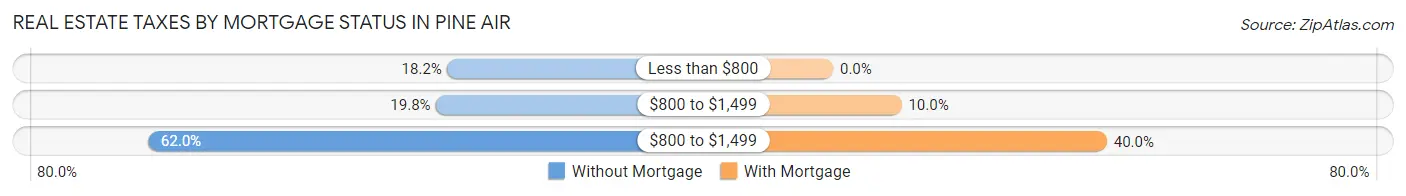
| Property Taxes | Without Mortgage | With Mortgage |
| Less than $800 | 22 (18.2%) | 0 (0.0%) |
| $800 to $1,499 | 24 (19.8%) | 17 (10.0%) |
| $800 to $1,499 | 75 (62.0%) | 68 (40.0%) |
| Total | 121 (100.0%) | 170 (100.0%) |
Health & Disability in Pine Air
Health Insurance Coverage by Age in Pine Air
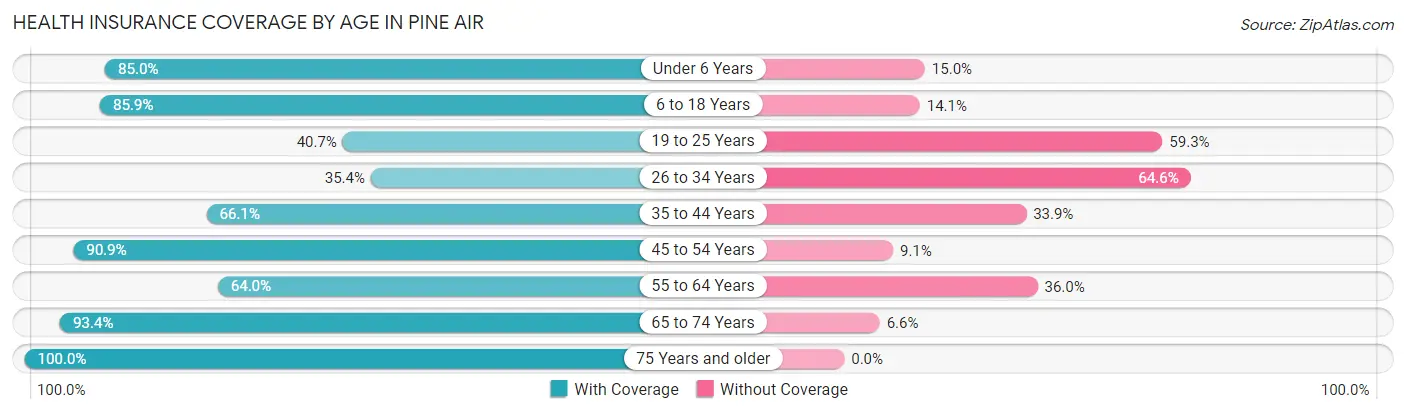
| Age Bracket | With Coverage | Without Coverage |
| Under 6 Years | 164 (85.0%) | 29 (15.0%) |
| 6 to 18 Years | 470 (85.9%) | 77 (14.1%) |
| 19 to 25 Years | 72 (40.7%) | 105 (59.3%) |
| 26 to 34 Years | 28 (35.4%) | 51 (64.6%) |
| 35 to 44 Years | 150 (66.1%) | 77 (33.9%) |
| 45 to 54 Years | 280 (90.9%) | 28 (9.1%) |
| 55 to 64 Years | 142 (64.0%) | 80 (36.0%) |
| 65 to 74 Years | 99 (93.4%) | 7 (6.6%) |
| 75 Years and older | 456 (100.0%) | 0 (0.0%) |
| Total | 1,861 (80.4%) | 454 (19.6%) |
Health Insurance Coverage by Citizenship Status in Pine Air
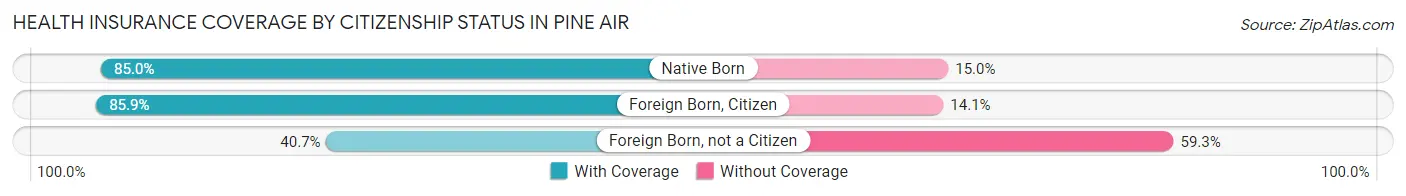
| Citizenship Status | With Coverage | Without Coverage |
| Native Born | 164 (85.0%) | 29 (15.0%) |
| Foreign Born, Citizen | 470 (85.9%) | 77 (14.1%) |
| Foreign Born, not a Citizen | 72 (40.7%) | 105 (59.3%) |
Health Insurance Coverage by Household Income in Pine Air
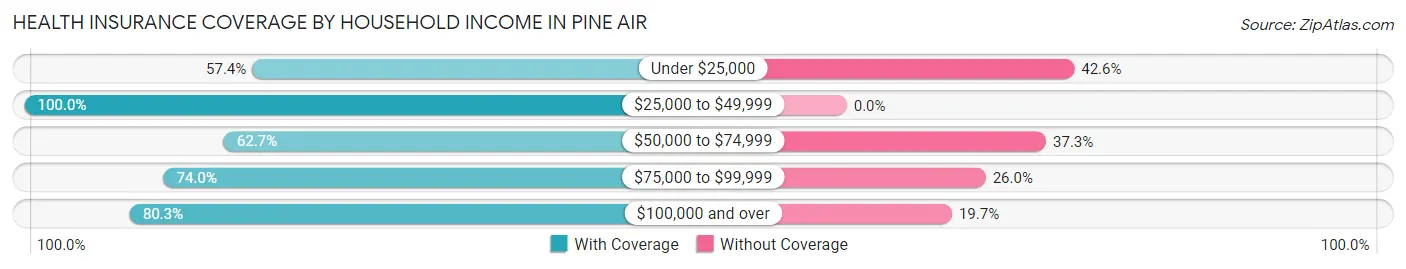
| Household Income | With Coverage | Without Coverage |
| Under $25,000 | 245 (57.4%) | 182 (42.6%) |
| $25,000 to $49,999 | 897 (100.0%) | 0 (0.0%) |
| $50,000 to $74,999 | 198 (62.7%) | 118 (37.3%) |
| $75,000 to $99,999 | 233 (74.0%) | 82 (26.0%) |
| $100,000 and over | 277 (80.3%) | 68 (19.7%) |
Public vs Private Health Insurance Coverage by Age in Pine Air
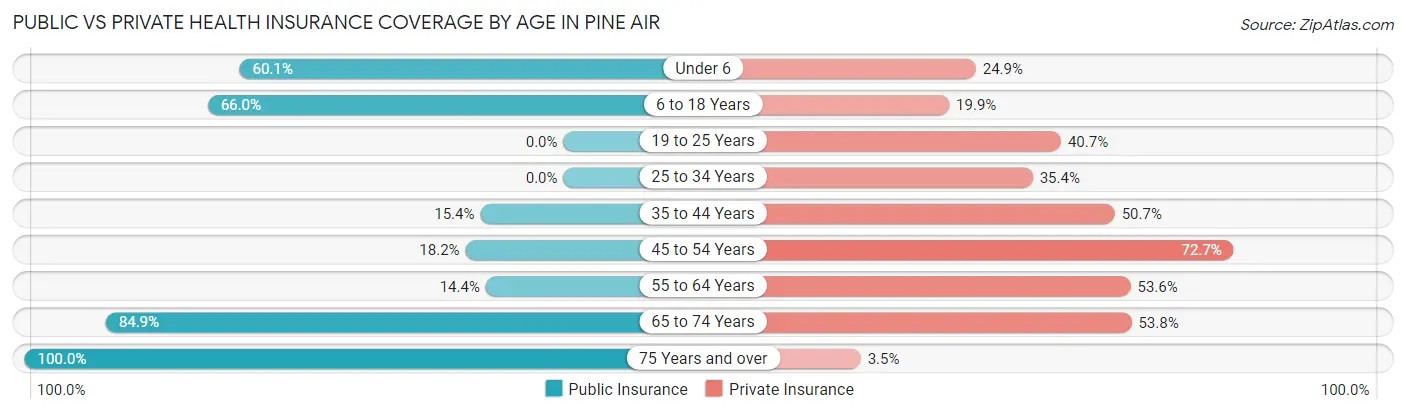
| Age Bracket | Public Insurance | Private Insurance |
| Under 6 | 116 (60.1%) | 48 (24.9%) |
| 6 to 18 Years | 361 (66.0%) | 109 (19.9%) |
| 19 to 25 Years | 0 (0.0%) | 72 (40.7%) |
| 25 to 34 Years | 0 (0.0%) | 28 (35.4%) |
| 35 to 44 Years | 35 (15.4%) | 115 (50.7%) |
| 45 to 54 Years | 56 (18.2%) | 224 (72.7%) |
| 55 to 64 Years | 32 (14.4%) | 119 (53.6%) |
| 65 to 74 Years | 90 (84.9%) | 57 (53.8%) |
| 75 Years and over | 456 (100.0%) | 16 (3.5%) |
| Total | 1,146 (49.5%) | 788 (34.0%) |
Disability Status by Sex by Age in Pine Air
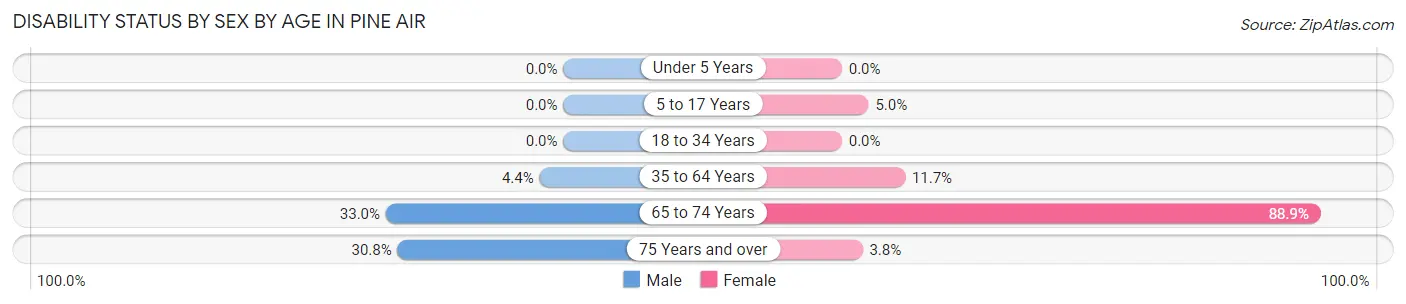
| Age Bracket | Male | Female |
| Under 5 Years | 0 (0.0%) | 0 (0.0%) |
| 5 to 17 Years | 0 (0.0%) | 11 (5.0%) |
| 18 to 34 Years | 0 (0.0%) | 0 (0.0%) |
| 35 to 64 Years | 15 (4.4%) | 49 (11.7%) |
| 65 to 74 Years | 29 (33.0%) | 16 (88.9%) |
| 75 Years and over | 4 (30.8%) | 17 (3.8%) |
Disability Class by Sex by Age in Pine Air
Disability Class: Hearing Difficulty
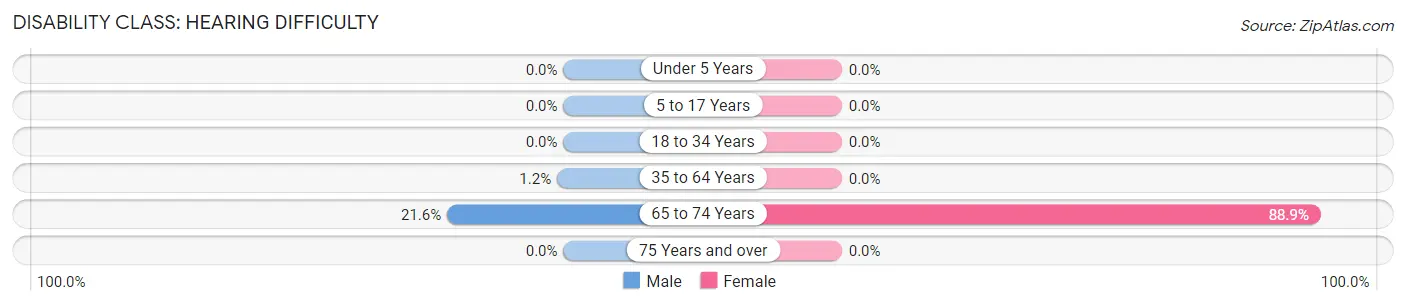
| Age Bracket | Male | Female |
| Under 5 Years | 0 (0.0%) | 0 (0.0%) |
| 5 to 17 Years | 0 (0.0%) | 0 (0.0%) |
| 18 to 34 Years | 0 (0.0%) | 0 (0.0%) |
| 35 to 64 Years | 4 (1.2%) | 0 (0.0%) |
| 65 to 74 Years | 19 (21.6%) | 16 (88.9%) |
| 75 Years and over | 0 (0.0%) | 0 (0.0%) |
Disability Class: Vision Difficulty
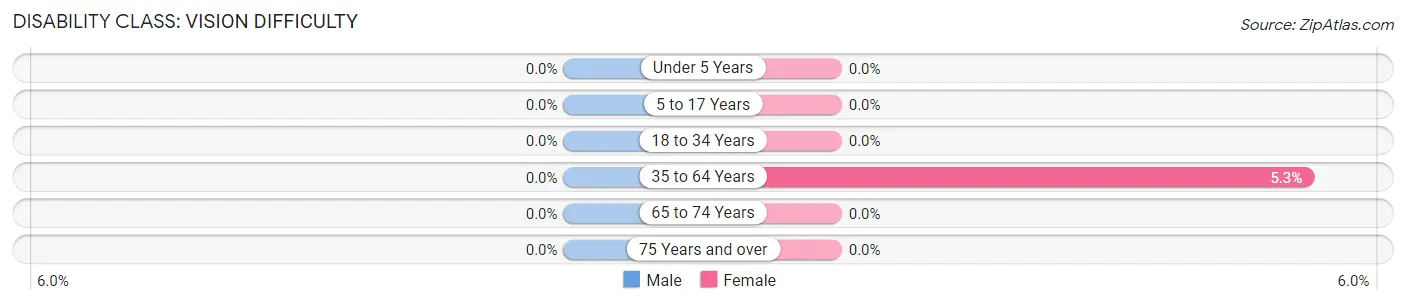
| Age Bracket | Male | Female |
| Under 5 Years | 0 (0.0%) | 0 (0.0%) |
| 5 to 17 Years | 0 (0.0%) | 0 (0.0%) |
| 18 to 34 Years | 0 (0.0%) | 0 (0.0%) |
| 35 to 64 Years | 0 (0.0%) | 22 (5.3%) |
| 65 to 74 Years | 0 (0.0%) | 0 (0.0%) |
| 75 Years and over | 0 (0.0%) | 0 (0.0%) |
Disability Class: Cognitive Difficulty
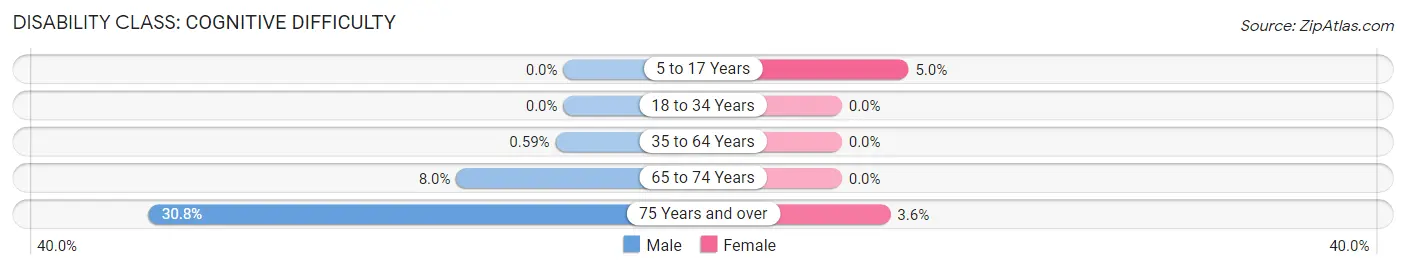
| Age Bracket | Male | Female |
| 5 to 17 Years | 0 (0.0%) | 11 (5.0%) |
| 18 to 34 Years | 0 (0.0%) | 0 (0.0%) |
| 35 to 64 Years | 2 (0.6%) | 0 (0.0%) |
| 65 to 74 Years | 7 (8.0%) | 0 (0.0%) |
| 75 Years and over | 4 (30.8%) | 16 (3.6%) |
Disability Class: Ambulatory Difficulty
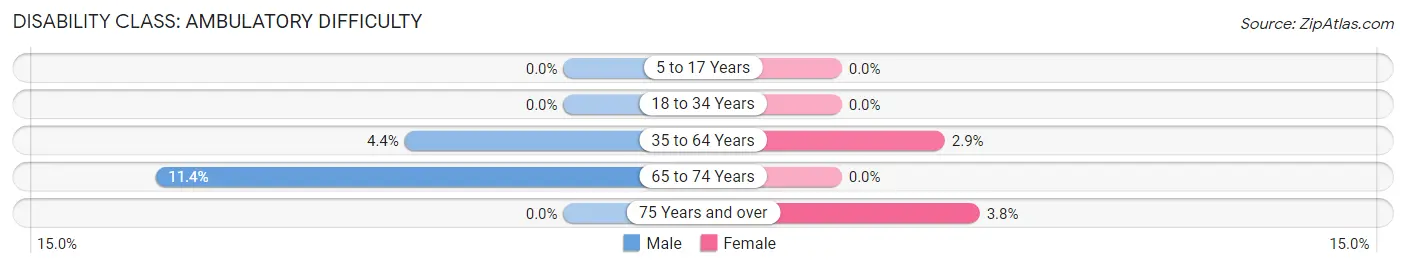
| Age Bracket | Male | Female |
| 5 to 17 Years | 0 (0.0%) | 0 (0.0%) |
| 18 to 34 Years | 0 (0.0%) | 0 (0.0%) |
| 35 to 64 Years | 15 (4.4%) | 12 (2.9%) |
| 65 to 74 Years | 10 (11.4%) | 0 (0.0%) |
| 75 Years and over | 0 (0.0%) | 17 (3.8%) |
Disability Class: Self-Care Difficulty
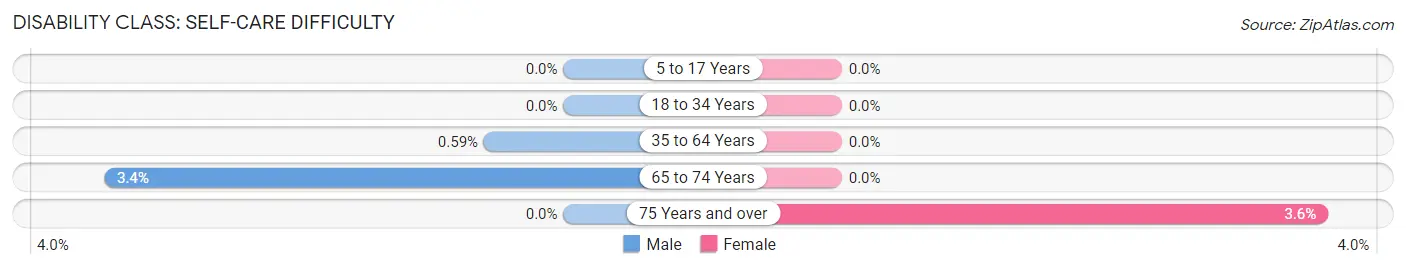
| Age Bracket | Male | Female |
| 5 to 17 Years | 0 (0.0%) | 0 (0.0%) |
| 18 to 34 Years | 0 (0.0%) | 0 (0.0%) |
| 35 to 64 Years | 2 (0.6%) | 0 (0.0%) |
| 65 to 74 Years | 3 (3.4%) | 0 (0.0%) |
| 75 Years and over | 0 (0.0%) | 16 (3.6%) |
Technology Access in Pine Air
Computing Device Access in Pine Air
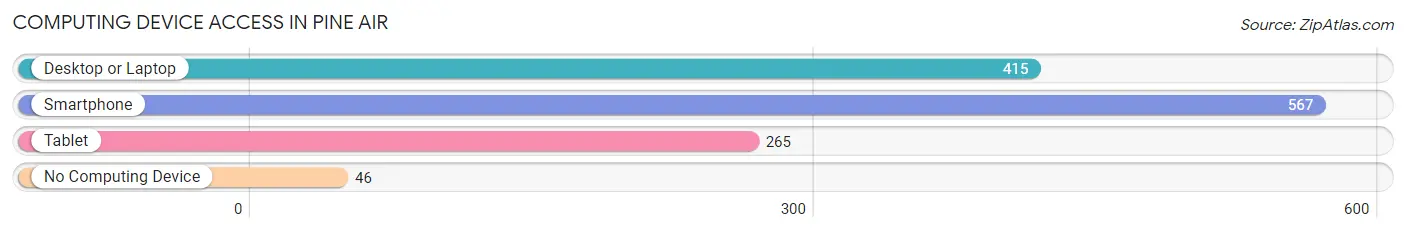
| Device Type | # Households | % Households |
| Desktop or Laptop | 415 | 66.5% |
| Smartphone | 567 | 90.9% |
| Tablet | 265 | 42.5% |
| No Computing Device | 46 | 7.4% |
| Total | 624 | 100.0% |
Internet Access in Pine Air
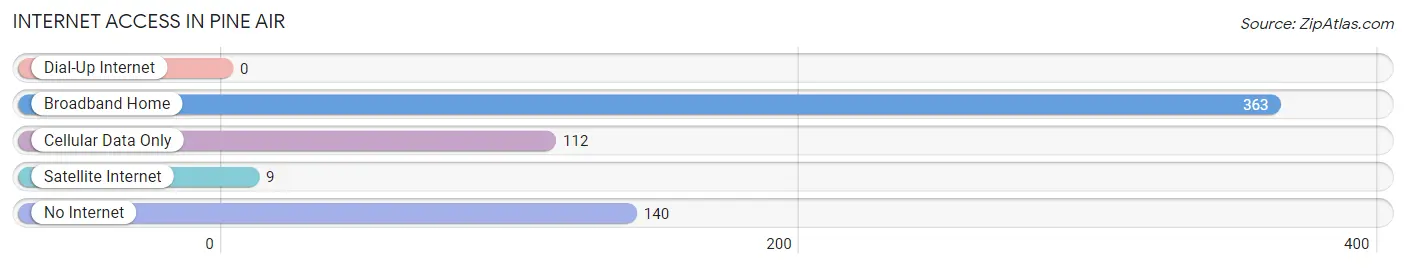
| Internet Type | # Households | % Households |
| Dial-Up Internet | 0 | 0.0% |
| Broadband Home | 363 | 58.2% |
| Cellular Data Only | 112 | 17.9% |
| Satellite Internet | 9 | 1.4% |
| No Internet | 140 | 22.4% |
| Total | 624 | 100.0% |
Pine Air Summary
Pine Air, Florida is a small town located in the northern part of the state, just south of the Georgia border. It is a rural community with a population of just over 1,000 people. The town is situated in a rural area of the state, surrounded by forests and wetlands. The town is known for its small-town charm and its close-knit community.
History
Pine Air, Florida was founded in 1845 by a group of settlers from Georgia. The town was originally called Pine Grove, but the name was changed to Pine Air in 1876. The town was named after the pine trees that grew in the area. The town was a small farming community, and the main crops grown were cotton, corn, and tobacco.
In the early 1900s, the town began to grow and develop. The first school was built in 1910, and the first post office was established in 1912. The town also had a general store, a blacksmith shop, and a sawmill.
In the 1950s, the town began to experience a population boom. The population grew from just over 500 people in 1950 to over 1,000 people in 1960. This growth was due to the influx of people from other parts of the state and the country.
Geography
Pine Air, Florida is located in the northern part of the state, just south of the Georgia border. The town is situated in a rural area of the state, surrounded by forests and wetlands. The town is located on the banks of the Suwannee River, which is a major tributary of the Gulf of Mexico. The town is located in a humid subtropical climate zone, with hot summers and mild winters.
Economy
The economy of Pine Air, Florida is largely based on agriculture. The town is home to several farms, which produce a variety of crops, including cotton, corn, and tobacco. The town also has a few small businesses, such as a general store, a blacksmith shop, and a sawmill.
Demographics
As of the 2010 census, the population of Pine Air, Florida was 1,072. The population is predominantly white, with a small percentage of African Americans and Hispanics. The median household income is $35,000, and the median age is 44. The town has a high rate of poverty, with over 25% of the population living below the poverty line.
Conclusion
Pine Air, Florida is a small town located in the northern part of the state, just south of the Georgia border. It is a rural community with a population of just over 1,000 people. The town is known for its small-town charm and its close-knit community. The economy of the town is largely based on agriculture, and the town has a few small businesses. The population is predominantly white, with a small percentage of African Americans and Hispanics. The median household income is $35,000, and the median age is 44. The town has a high rate of poverty, with over 25% of the population living below the poverty line.
Common Questions
What is the Total Population of Pine Air?
Total Population of Pine Air is 2,318.
What is the Total Male Population of Pine Air?
Total Male Population of Pine Air is 1,157.
What is the Total Female Population of Pine Air?
Total Female Population of Pine Air is 1,161.
What is the Ratio of Males per 100 Females in Pine Air?
There are 99.66 Males per 100 Females in Pine Air.
What is the Ratio of Females per 100 Males in Pine Air?
There are 100.35 Females per 100 Males in Pine Air.
What is the Median Population Age in Pine Air?
Median Population Age in Pine Air is 41.5 Years.
What is the Average Family Size in Pine Air
Average Family Size in Pine Air is 4.3 People.
What is the Average Household Size in Pine Air
Average Household Size in Pine Air is 3.7 People.
What is Per Capita Income in Pine Air?
Per Capita income in Pine Air is $17,665.
What is the Median Family Income in Pine Air?
Median Family Income in Pine Air is $39,559.
What is the Median Household income in Pine Air?
Median Household Income in Pine Air is $47,237.
What is Income or Wage Gap in Pine Air?
Income or Wage Gap in Pine Air is 35.9%.
Women in Pine Air earn 64.1 cents for every dollar earned by a man.
What is Inequality or Gini Index in Pine Air?
Inequality or Gini Index in Pine Air is 0.44.
How Large is the Labor Force in Pine Air?
There are 906 People in the Labor Forcein in Pine Air.
What is the Percentage of People in the Labor Force in Pine Air?
47.1% of People are in the Labor Force in Pine Air.
What is the Unemployment Rate in Pine Air?
Unemployment Rate in Pine Air is 8.8%.