North River Shores, FL
North River Shores Map
North River Shores Overview
3,390
TOTAL POPULATION
1,741
MALE POPULATION
1,649
FEMALE POPULATION
105.58
MALES / 100 FEMALES
94.72
FEMALES / 100 MALES
51.9
MEDIAN AGE
2.9
AVG FAMILY SIZE
2.3
AVG HOUSEHOLD SIZE
$53,587
PER CAPITA INCOME
$87,969
AVG FAMILY INCOME
$65,682
AVG HOUSEHOLD INCOME
57.8%
WAGE / INCOME GAP [ % ]
42.2¢/ $1
WAGE / INCOME GAP [ $ ]
0.60
INEQUALITY / GINI INDEX
1,337
LABOR FORCE [ PEOPLE ]
51.5%
PERCENT IN LABOR FORCE
3.1%
UNEMPLOYMENT RATE
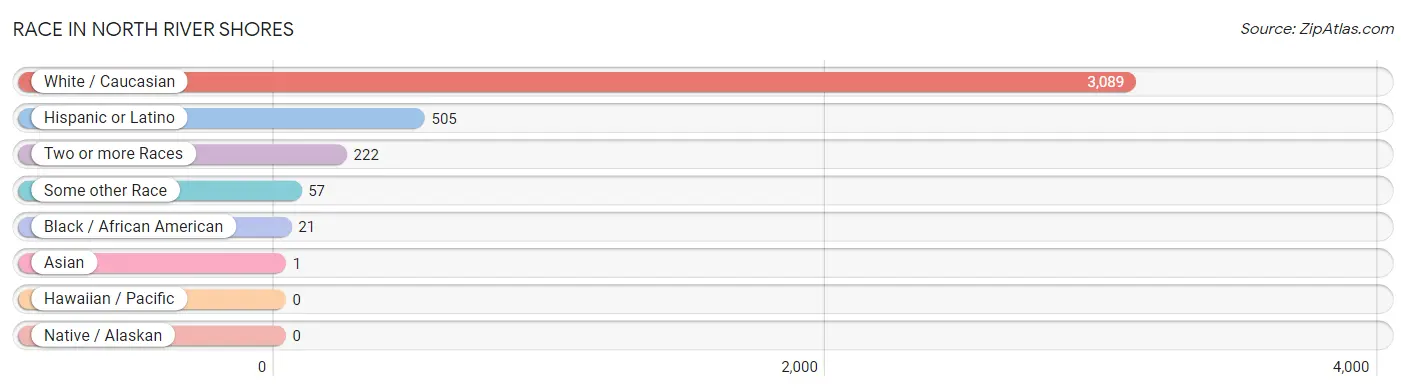
Race in North River Shores
The most populous races in North River Shores are White / Caucasian (3,089 | 91.1%), Hispanic or Latino (505 | 14.9%), and Two or more Races (222 | 6.6%).
| Race | # Population | % Population |
| Asian | 1 | 0.0% |
| Black / African American | 21 | 0.6% |
| Hawaiian / Pacific | 0 | 0.0% |
| Hispanic or Latino | 505 | 14.9% |
| Native / Alaskan | 0 | 0.0% |
| White / Caucasian | 3,089 | 91.1% |
| Two or more Races | 222 | 6.6% |
| Some other Race | 57 | 1.7% |
| Total | 3,390 | 100.0% |
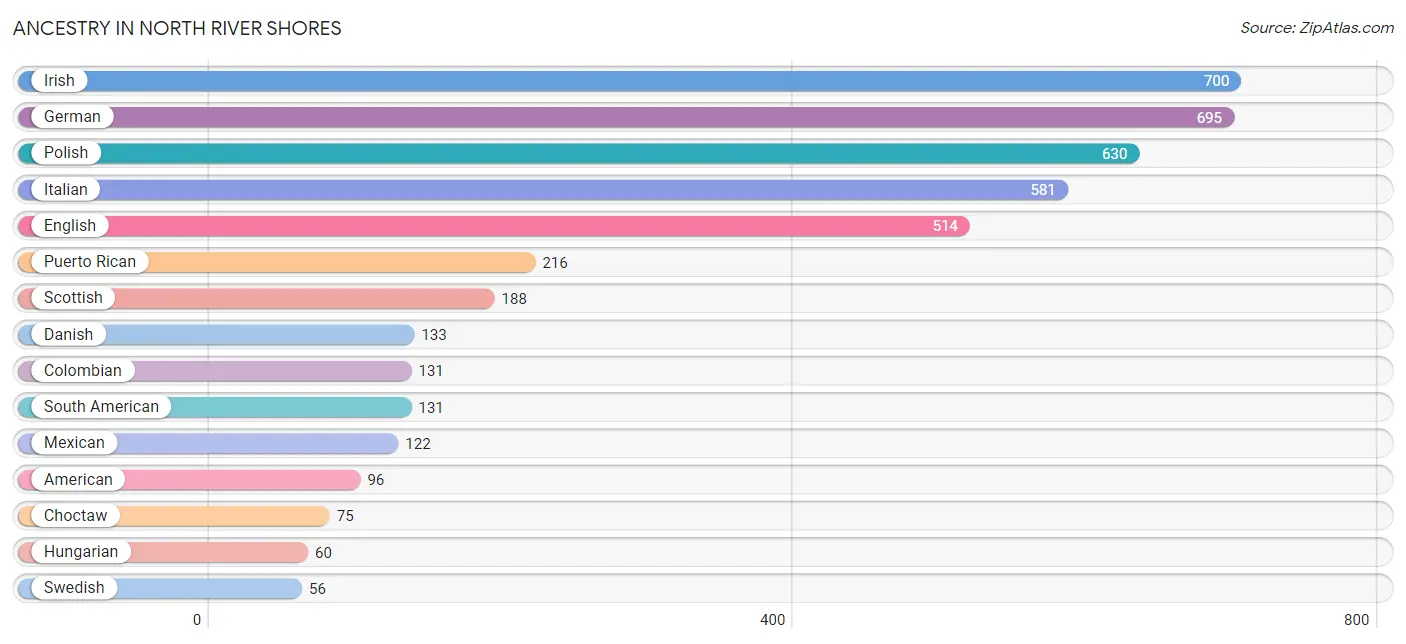
Ancestry in North River Shores
The most populous ancestries reported in North River Shores are Irish (700 | 20.6%), German (695 | 20.5%), Polish (630 | 18.6%), Italian (581 | 17.1%), and English (514 | 15.2%), together accounting for 92.0% of all North River Shores residents.
| Ancestry | # Population | % Population |
| American | 96 | 2.8% |
| Austrian | 15 | 0.4% |
| Cherokee | 35 | 1.0% |
| Choctaw | 75 | 2.2% |
| Colombian | 131 | 3.9% |
| Czech | 40 | 1.2% |
| Czechoslovakian | 12 | 0.4% |
| Danish | 133 | 3.9% |
| Dutch | 40 | 1.2% |
| Eastern European | 53 | 1.6% |
| English | 514 | 15.2% |
| French | 37 | 1.1% |
| French Canadian | 31 | 0.9% |
| German | 695 | 20.5% |
| Haitian | 19 | 0.6% |
| Hungarian | 60 | 1.8% |
| Irish | 700 | 20.6% |
| Italian | 581 | 17.1% |
| Jamaican | 1 | 0.0% |
| Latvian | 9 | 0.3% |
| Lithuanian | 16 | 0.5% |
| Mexican | 122 | 3.6% |
| Norwegian | 53 | 1.6% |
| Polish | 630 | 18.6% |
| Puerto Rican | 216 | 6.4% |
| Russian | 34 | 1.0% |
| Scotch-Irish | 7 | 0.2% |
| Scottish | 188 | 5.6% |
| South American | 131 | 3.9% |
| Spaniard | 36 | 1.1% |
| Swedish | 56 | 1.7% |
| Thai | 1 | 0.0% |
| Welsh | 1 | 0.0% |
| West Indian | 25 | 0.7% | View All 34 Rows |
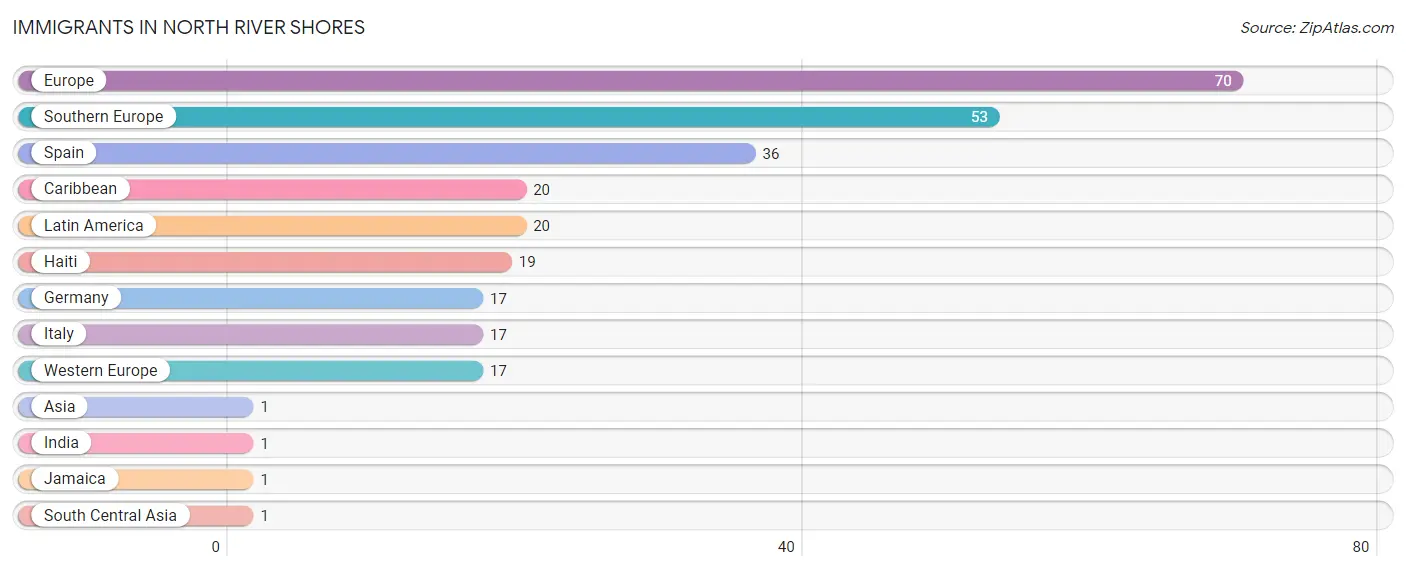
Immigrants in North River Shores
The most numerous immigrant groups reported in North River Shores came from Europe (70 | 2.1%), Southern Europe (53 | 1.6%), Spain (36 | 1.1%), Caribbean (20 | 0.6%), and Latin America (20 | 0.6%), together accounting for 5.9% of all North River Shores residents.
| Immigration Origin | # Population | % Population |
| Asia | 1 | 0.0% |
| Caribbean | 20 | 0.6% |
| Europe | 70 | 2.1% |
| Germany | 17 | 0.5% |
| Haiti | 19 | 0.6% |
| India | 1 | 0.0% |
| Italy | 17 | 0.5% |
| Jamaica | 1 | 0.0% |
| Latin America | 20 | 0.6% |
| South Central Asia | 1 | 0.0% |
| Southern Europe | 53 | 1.6% |
| Spain | 36 | 1.1% |
| Western Europe | 17 | 0.5% | View All 13 Rows |
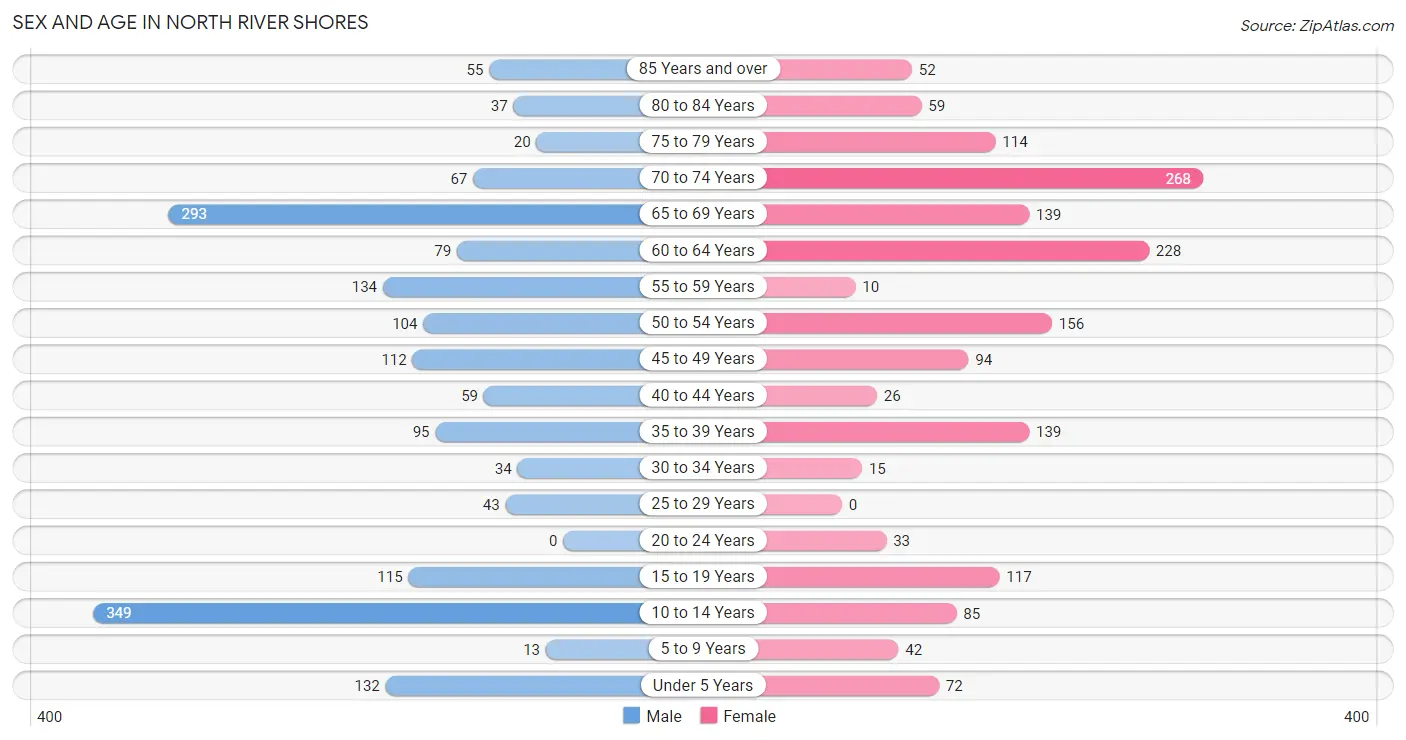
Sex and Age in North River Shores
Sex and Age in North River Shores
The most populous age groups in North River Shores are 10 to 14 Years (349 | 20.1%) for men and 70 to 74 Years (268 | 16.3%) for women.
| Age Bracket | Male | Female |
| Under 5 Years | 132 (7.6%) | 72 (4.4%) |
| 5 to 9 Years | 13 (0.7%) | 42 (2.5%) |
| 10 to 14 Years | 349 (20.1%) | 85 (5.1%) |
| 15 to 19 Years | 115 (6.6%) | 117 (7.1%) |
| 20 to 24 Years | 0 (0.0%) | 33 (2.0%) |
| 25 to 29 Years | 43 (2.5%) | 0 (0.0%) |
| 30 to 34 Years | 34 (1.9%) | 15 (0.9%) |
| 35 to 39 Years | 95 (5.5%) | 139 (8.4%) |
| 40 to 44 Years | 59 (3.4%) | 26 (1.6%) |
| 45 to 49 Years | 112 (6.4%) | 94 (5.7%) |
| 50 to 54 Years | 104 (6.0%) | 156 (9.5%) |
| 55 to 59 Years | 134 (7.7%) | 10 (0.6%) |
| 60 to 64 Years | 79 (4.5%) | 228 (13.8%) |
| 65 to 69 Years | 293 (16.8%) | 139 (8.4%) |
| 70 to 74 Years | 67 (3.8%) | 268 (16.3%) |
| 75 to 79 Years | 20 (1.1%) | 114 (6.9%) |
| 80 to 84 Years | 37 (2.1%) | 59 (3.6%) |
| 85 Years and over | 55 (3.2%) | 52 (3.2%) |
| Total | 1,741 (100.0%) | 1,649 (100.0%) |
Families and Households in North River Shores
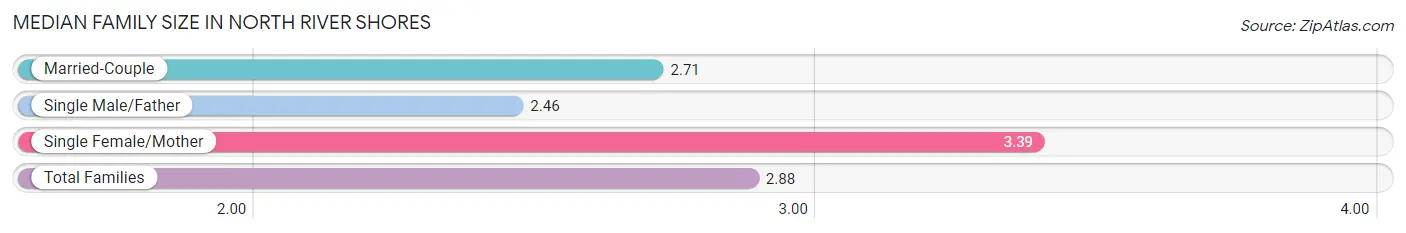
Median Family Size in North River Shores
The median family size in North River Shores is 2.88 persons per family, with single female/mother families (221 | 27.2%) accounting for the largest median family size of 3.39 persons per family. On the other hand, single male/father families (48 | 5.9%) represent the smallest median family size with 2.46 persons per family.
| Family Type | # Families | Family Size |
| Married-Couple | 545 (66.9%) | 2.71 |
| Single Male/Father | 48 (5.9%) | 2.46 |
| Single Female/Mother | 221 (27.2%) | 3.39 |
| Total Families | 814 (100.0%) | 2.88 |
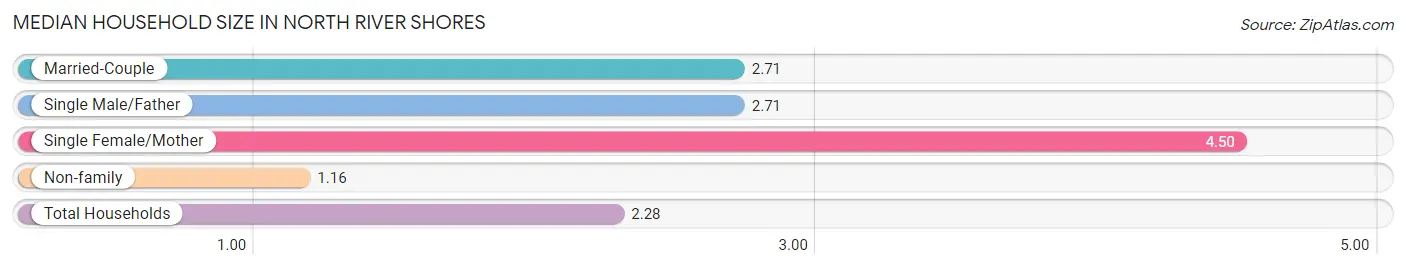
Median Household Size in North River Shores
The median household size in North River Shores is 2.28 persons per household, with single female/mother households (221 | 15.0%) accounting for the largest median household size of 4.5 persons per household. non-family households (658 | 44.7%) represent the smallest median household size with 1.16 persons per household.
| Household Type | # Households | Household Size |
| Married-Couple | 545 (37.0%) | 2.71 |
| Single Male/Father | 48 (3.3%) | 2.71 |
| Single Female/Mother | 221 (15.0%) | 4.50 |
| Non-family | 658 (44.7%) | 1.16 |
| Total Households | 1,472 (100.0%) | 2.28 |
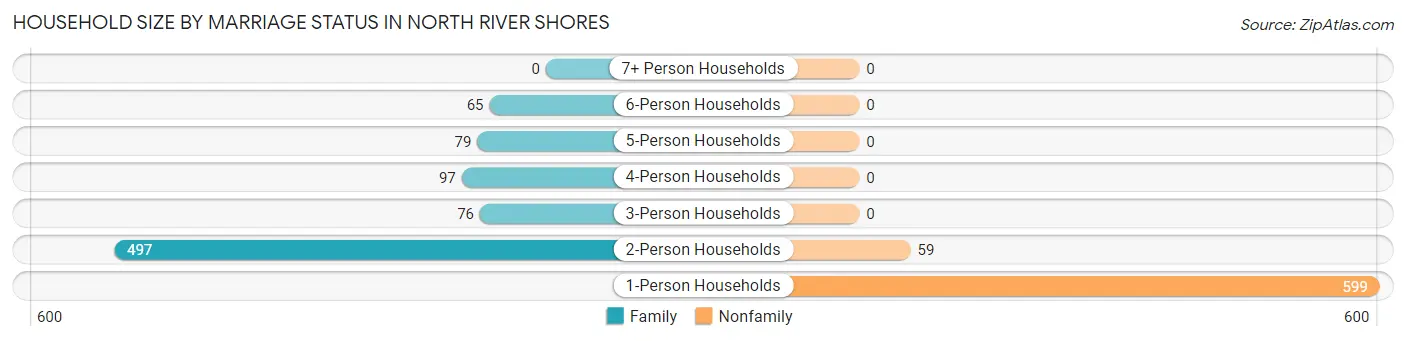
Household Size by Marriage Status in North River Shores
Out of a total of 1,472 households in North River Shores, 814 (55.3%) are family households, while 658 (44.7%) are nonfamily households. The most numerous type of family households are 2-person households, comprising 497, and the most common type of nonfamily households are 1-person households, comprising 599.
| Household Size | Family Households | Nonfamily Households |
| 1-Person Households | - | 599 (40.7%) |
| 2-Person Households | 497 (33.8%) | 59 (4.0%) |
| 3-Person Households | 76 (5.2%) | 0 (0.0%) |
| 4-Person Households | 97 (6.6%) | 0 (0.0%) |
| 5-Person Households | 79 (5.4%) | 0 (0.0%) |
| 6-Person Households | 65 (4.4%) | 0 (0.0%) |
| 7+ Person Households | 0 (0.0%) | 0 (0.0%) |
| Total | 814 (55.3%) | 658 (44.7%) |
Female Fertility in North River Shores
Fertility by Age in North River Shores
Average fertility rate in North River Shores is 67.0 births per 1,000 women. Women in the age bracket of 20 to 34 years have the highest fertility rate with 688.0 births per 1,000 women. Women in the age bracket of 20 to 34 years acount for 100.0% of all women with births.
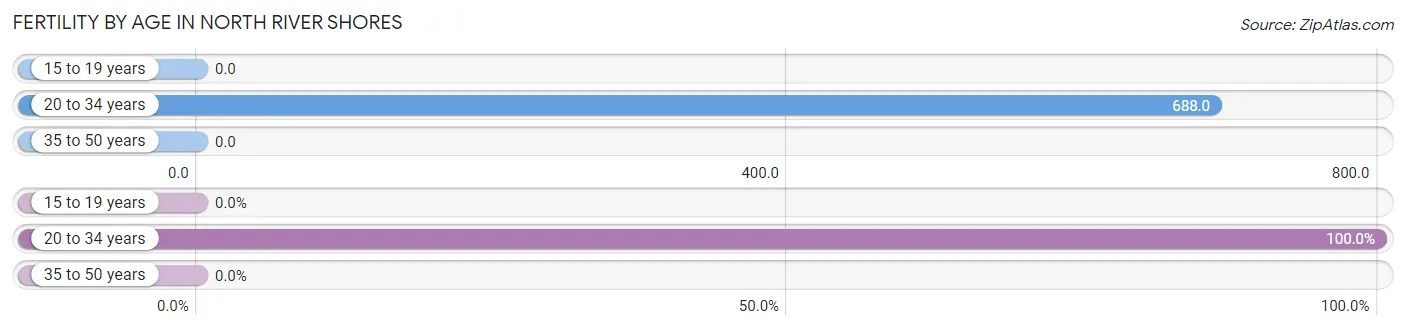
| Age Bracket | Women with Births | Births / 1,000 Women |
| 15 to 19 years | 0 (0.0%) | 0.0 |
| 20 to 34 years | 33 (100.0%) | 688.0 |
| 35 to 50 years | 0 (0.0%) | 0.0 |
| Total | 33 (100.0%) | 67.0 |
Fertility by Age by Marriage Status in North River Shores
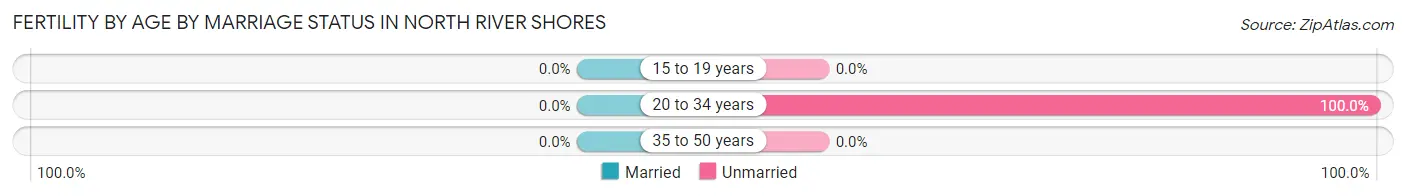
| Age Bracket | Married | Unmarried |
| 15 to 19 years | 0 (0.0%) | 0 (0.0%) |
| 20 to 34 years | 0 (0.0%) | 33 (100.0%) |
| 35 to 50 years | 0 (0.0%) | 0 (0.0%) |
| Total | 0 (0.0%) | 33 (100.0%) |
Fertility by Education in North River Shores
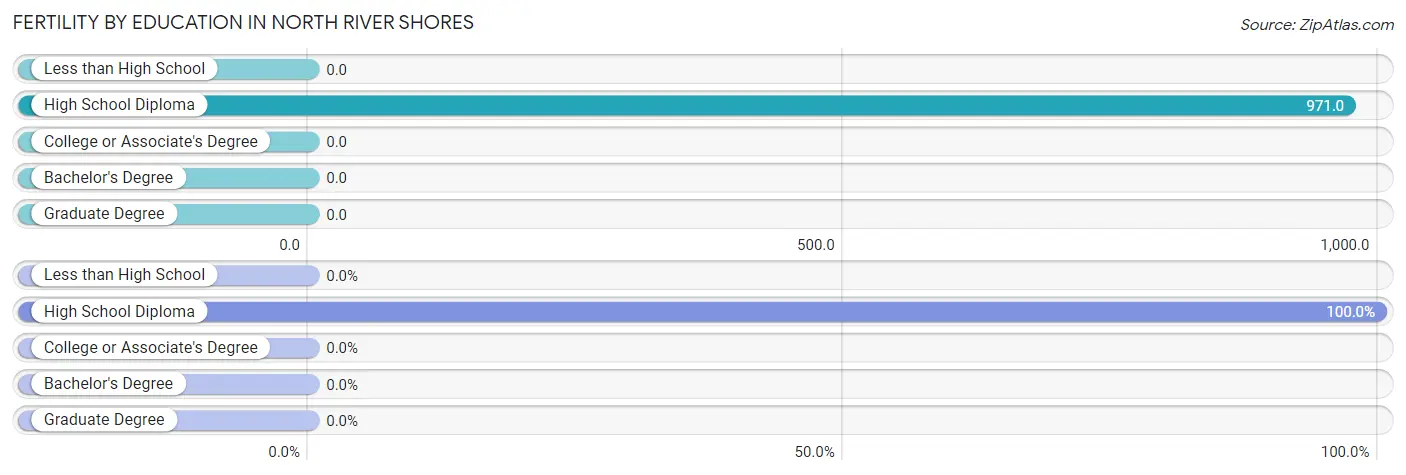
| Educational Attainment | Women with Births | Births / 1,000 Women |
| Less than High School | 0 (0.0%) | 0.0 |
| High School Diploma | 33 (100.0%) | 971.0 |
| College or Associate's Degree | 0 (0.0%) | 0.0 |
| Bachelor's Degree | 0 (0.0%) | 0.0 |
| Graduate Degree | 0 (0.0%) | 0.0 |
| Total | 33 (100.0%) | 67.0 |
Fertility by Education by Marriage Status in North River Shores
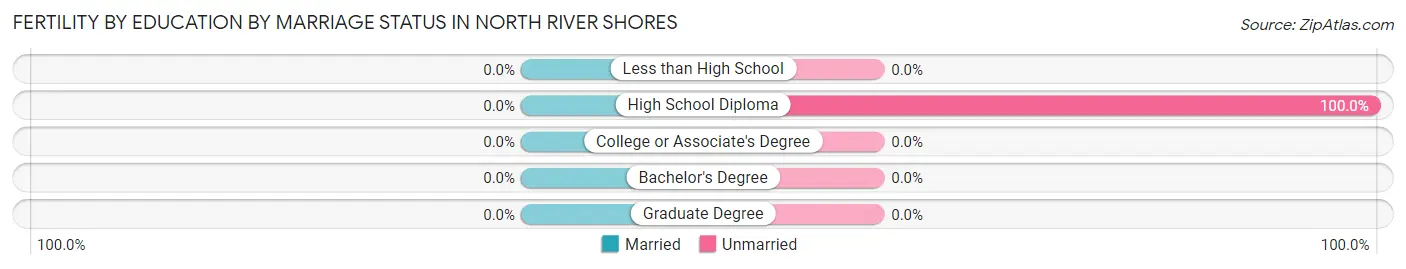
| Educational Attainment | Married | Unmarried |
| Less than High School | 0 (0.0%) | 0 (0.0%) |
| High School Diploma | 0 (0.0%) | 33 (100.0%) |
| College or Associate's Degree | 0 (0.0%) | 0 (0.0%) |
| Bachelor's Degree | 0 (0.0%) | 0 (0.0%) |
| Graduate Degree | 0 (0.0%) | 0 (0.0%) |
| Total | 0 (0.0%) | 33 (100.0%) |
Income in North River Shores
Income Overview in North River Shores
Per Capita Income in North River Shores is $53,587, while median incomes of families and households are $87,969 and $65,682 respectively.
| Characteristic | Number | Measure |
| Per Capita Income | 3,390 | $53,587 |
| Median Family Income | 814 | $87,969 |
| Mean Family Income | 814 | $167,766 |
| Median Household Income | 1,472 | $65,682 |
| Mean Household Income | 1,472 | $121,673 |
| Income Deficit | 814 | $0 |
| Wage / Income Gap (%) | 3,390 | 57.77% |
| Wage / Income Gap ($) | 3,390 | 42.23¢ per $1 |
| Gini / Inequality Index | 3,390 | 0.60 |
Earnings by Sex in North River Shores
Average Earnings in North River Shores are $40,536, $68,580 for men and $28,958 for women, a difference of 57.8%.
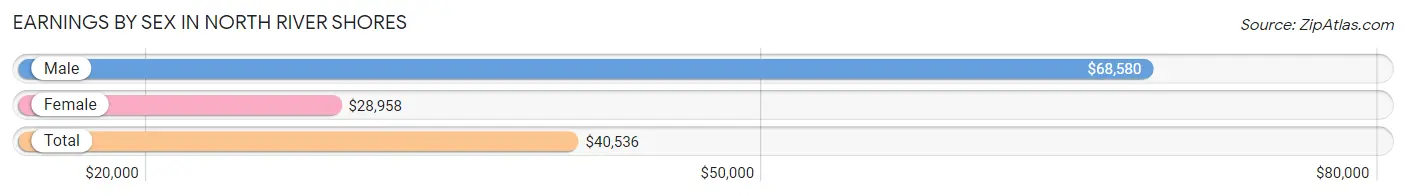
| Sex | Number | Average Earnings |
| Male | 627 (44.1%) | $68,580 |
| Female | 794 (55.9%) | $28,958 |
| Total | 1,421 (100.0%) | $40,536 |
Earnings by Sex by Income Bracket in North River Shores
The most common earnings brackets in North River Shores are $100,000+ for men (186 | 29.7%) and $2,499 or less for women (167 | 21.0%).
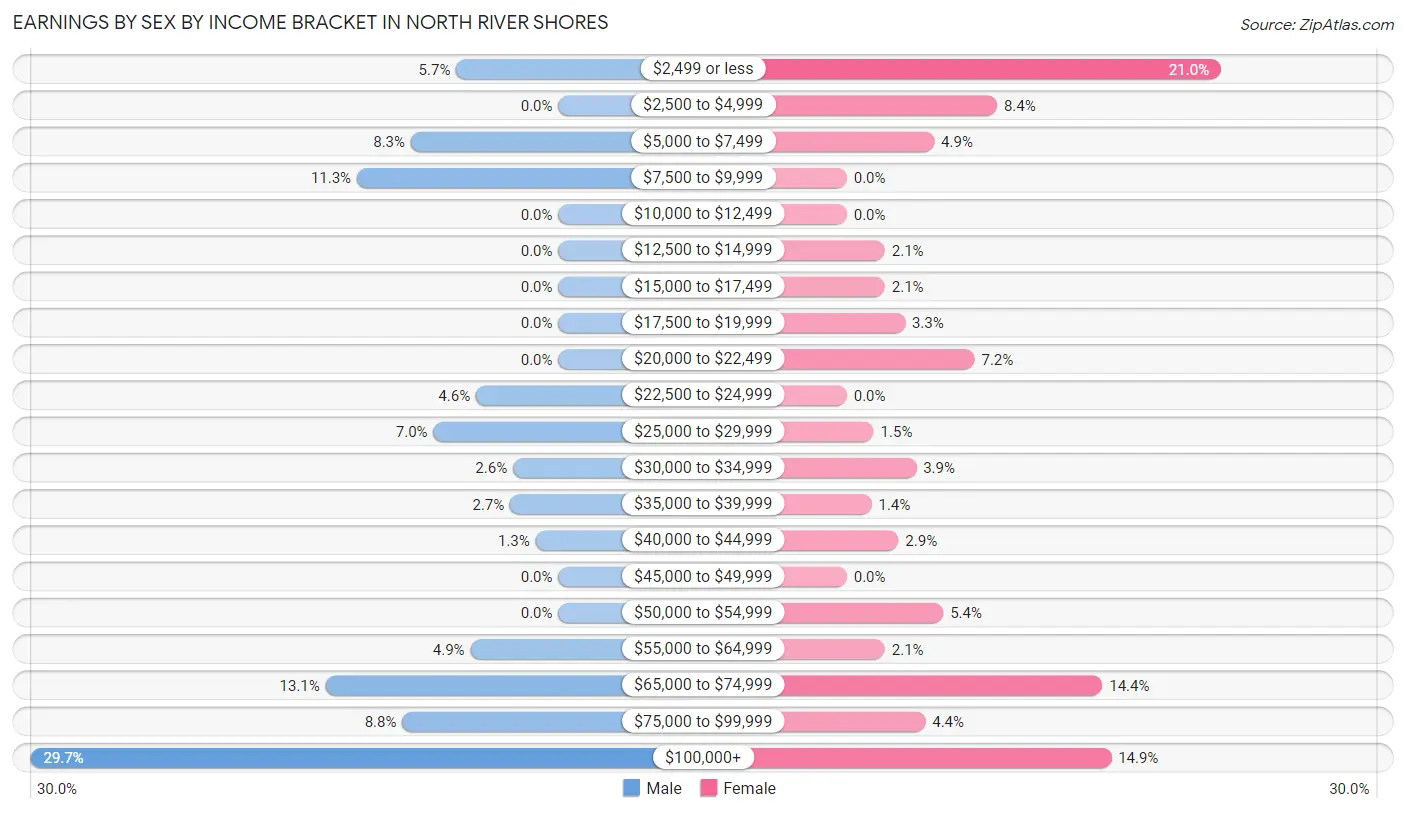
| Income | Male | Female |
| $2,499 or less | 36 (5.7%) | 167 (21.0%) |
| $2,500 to $4,999 | 0 (0.0%) | 67 (8.4%) |
| $5,000 to $7,499 | 52 (8.3%) | 39 (4.9%) |
| $7,500 to $9,999 | 71 (11.3%) | 0 (0.0%) |
| $10,000 to $12,499 | 0 (0.0%) | 0 (0.0%) |
| $12,500 to $14,999 | 0 (0.0%) | 17 (2.1%) |
| $15,000 to $17,499 | 0 (0.0%) | 17 (2.1%) |
| $17,500 to $19,999 | 0 (0.0%) | 26 (3.3%) |
| $20,000 to $22,499 | 0 (0.0%) | 57 (7.2%) |
| $22,500 to $24,999 | 29 (4.6%) | 0 (0.0%) |
| $25,000 to $29,999 | 44 (7.0%) | 12 (1.5%) |
| $30,000 to $34,999 | 16 (2.5%) | 31 (3.9%) |
| $35,000 to $39,999 | 17 (2.7%) | 11 (1.4%) |
| $40,000 to $44,999 | 8 (1.3%) | 23 (2.9%) |
| $45,000 to $49,999 | 0 (0.0%) | 0 (0.0%) |
| $50,000 to $54,999 | 0 (0.0%) | 43 (5.4%) |
| $55,000 to $64,999 | 31 (4.9%) | 17 (2.1%) |
| $65,000 to $74,999 | 82 (13.1%) | 114 (14.4%) |
| $75,000 to $99,999 | 55 (8.8%) | 35 (4.4%) |
| $100,000+ | 186 (29.7%) | 118 (14.9%) |
| Total | 627 (100.0%) | 794 (100.0%) |
Earnings by Sex by Educational Attainment in North River Shores
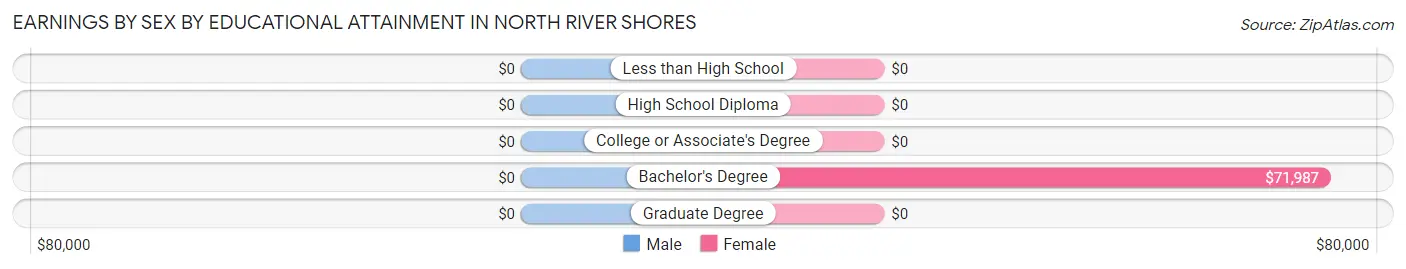
| Educational Attainment | Male Income | Female Income |
| Less than High School | - | - |
| High School Diploma | - | - |
| College or Associate's Degree | - | - |
| Bachelor's Degree | - | - |
| Graduate Degree | - | - |
| Total | $68,580 | $42,656 |
Family Income in North River Shores
Family Income Brackets in North River Shores
According to the North River Shores family income data, there are 181 families falling into the $50,000 to $74,999 income range, which is the most common income bracket and makes up 22.2% of all families. Conversely, the $15,000 to $24,999 income bracket is the least frequent group with only 15 families (1.8%) belonging to this category.
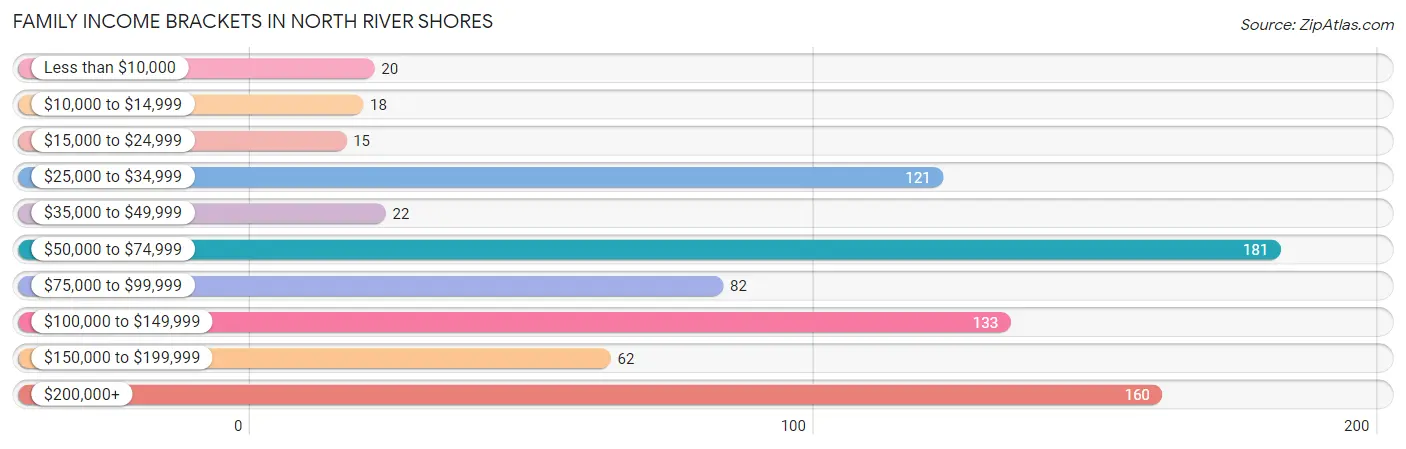
| Income Bracket | # Families | % Families |
| Less than $10,000 | 20 | 2.5% |
| $10,000 to $14,999 | 18 | 2.2% |
| $15,000 to $24,999 | 15 | 1.8% |
| $25,000 to $34,999 | 121 | 14.9% |
| $35,000 to $49,999 | 22 | 2.7% |
| $50,000 to $74,999 | 181 | 22.2% |
| $75,000 to $99,999 | 82 | 10.1% |
| $100,000 to $149,999 | 133 | 16.3% |
| $150,000 to $199,999 | 62 | 7.6% |
| $200,000+ | 160 | 19.7% |
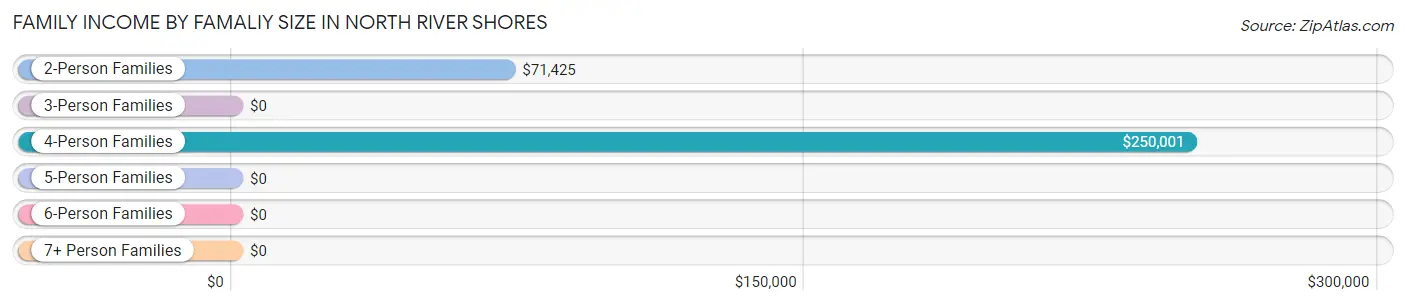
Family Income by Famaliy Size in North River Shores
4-person families (97 | 11.9%) account for the highest median family income in North River Shores with $250,001 per family, while 4-person families (97 | 11.9%) have the highest median income of $62,500 per family member.
| Income Bracket | # Families | Median Income |
| 2-Person Families | 517 (63.5%) | $71,425 |
| 3-Person Families | 121 (14.9%) | $0 |
| 4-Person Families | 97 (11.9%) | $250,001 |
| 5-Person Families | 79 (9.7%) | $0 |
| 6-Person Families | 0 (0.0%) | $0 |
| 7+ Person Families | 0 (0.0%) | $0 |
| Total | 814 (100.0%) | $87,969 |
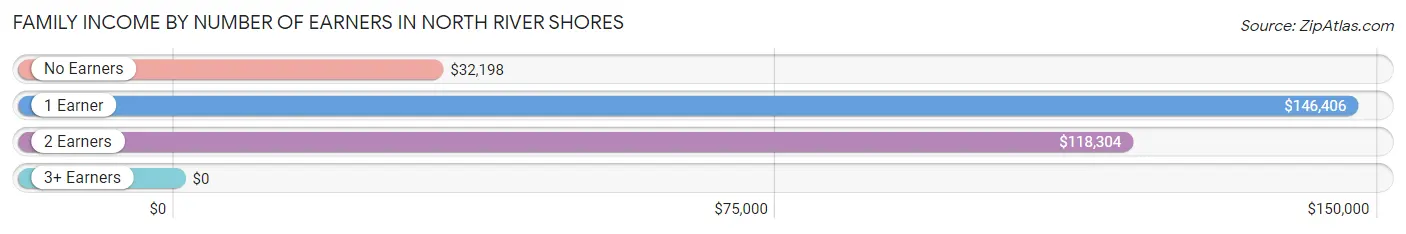
Family Income by Number of Earners in North River Shores
| Number of Earners | # Families | Median Income |
| No Earners | 208 (25.6%) | $32,198 |
| 1 Earner | 334 (41.0%) | $146,406 |
| 2 Earners | 231 (28.4%) | $118,304 |
| 3+ Earners | 41 (5.0%) | $0 |
| Total | 814 (100.0%) | $87,969 |
Household Income in North River Shores
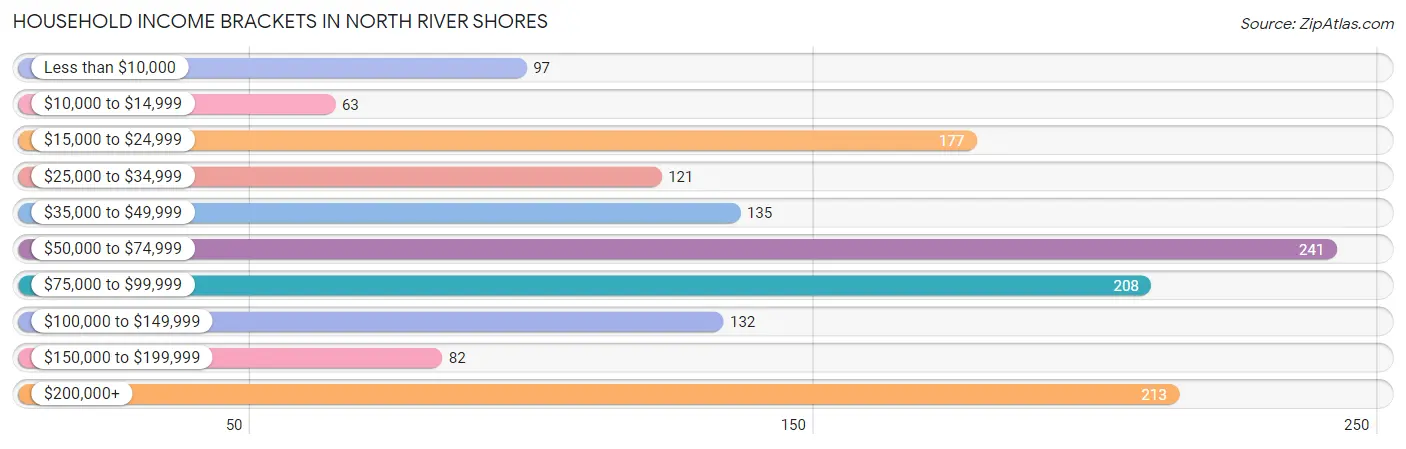
Household Income Brackets in North River Shores
With 241 households falling in the category, the $50,000 to $74,999 income range is the most frequent in North River Shores, accounting for 16.4% of all households. In contrast, only 63 households (4.3%) fall into the $10,000 to $14,999 income bracket, making it the least populous group.
| Income Bracket | # Households | % Households |
| Less than $10,000 | 97 | 6.6% |
| $10,000 to $14,999 | 63 | 4.3% |
| $15,000 to $24,999 | 177 | 12.0% |
| $25,000 to $34,999 | 121 | 8.2% |
| $35,000 to $49,999 | 135 | 9.2% |
| $50,000 to $74,999 | 241 | 16.4% |
| $75,000 to $99,999 | 208 | 14.1% |
| $100,000 to $149,999 | 132 | 9.0% |
| $150,000 to $199,999 | 82 | 5.6% |
| $200,000+ | 213 | 14.5% |
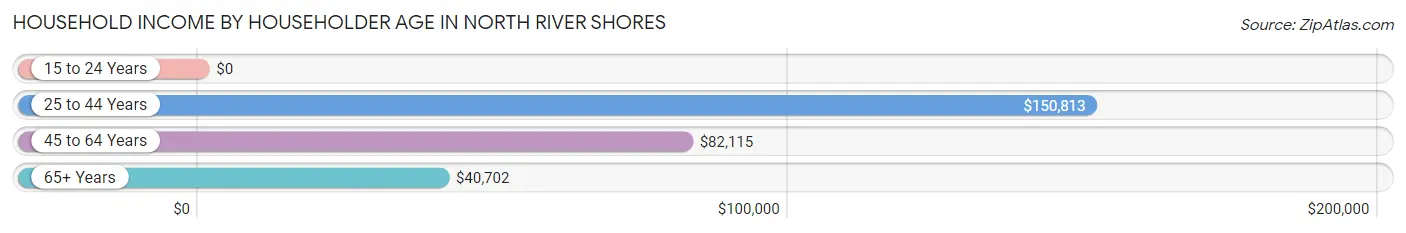
Household Income by Householder Age in North River Shores
The median household income in North River Shores is $65,682, with the highest median household income of $150,813 found in the 25 to 44 years age bracket for the primary householder. A total of 184 households (12.5%) fall into this category.
| Income Bracket | # Households | Median Income |
| 15 to 24 Years | 0 (0.0%) | $0 |
| 25 to 44 Years | 184 (12.5%) | $150,813 |
| 45 to 64 Years | 548 (37.2%) | $82,115 |
| 65+ Years | 740 (50.3%) | $40,702 |
| Total | 1,472 (100.0%) | $65,682 |
Poverty in North River Shores
Income Below Poverty by Sex and Age in North River Shores
With 18.4% poverty level for males and 8.7% for females among the residents of North River Shores, 15 year old males and 25 to 34 year old females are the most vulnerable to poverty, with 94 males (100.0%) and 15 females (100.0%) in their respective age groups living below the poverty level.
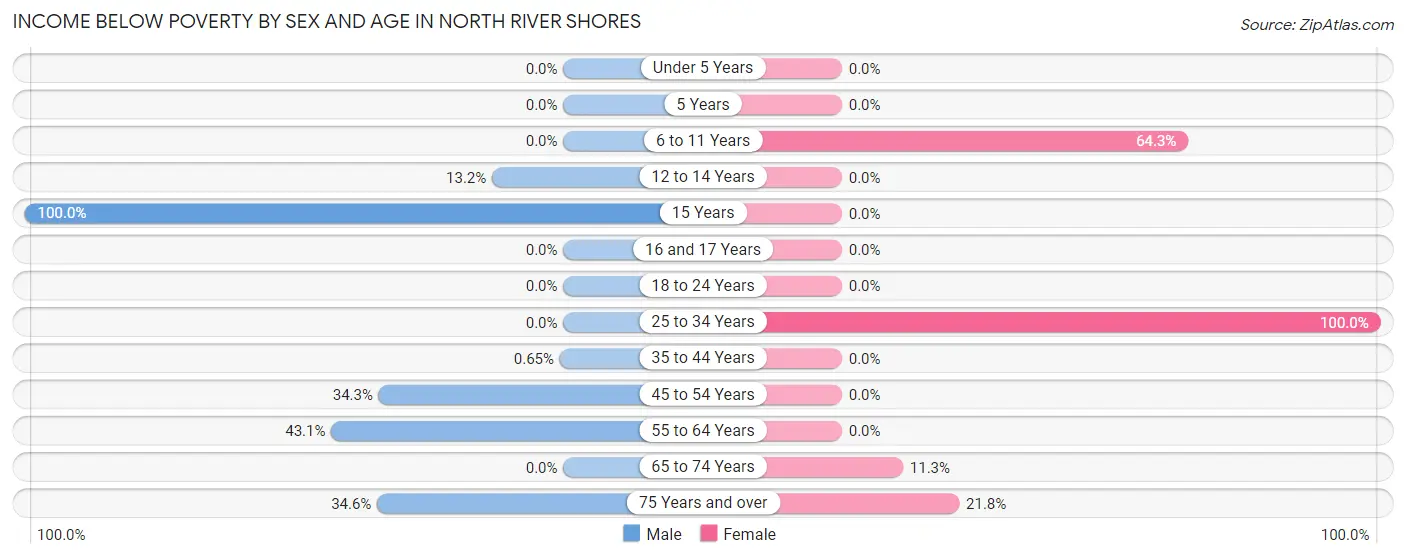
| Age Bracket | Male | Female |
| Under 5 Years | 0 (0.0%) | 0 (0.0%) |
| 5 Years | 0 (0.0%) | 0 (0.0%) |
| 6 to 11 Years | 0 (0.0%) | 27 (64.3%) |
| 12 to 14 Years | 23 (13.2%) | 0 (0.0%) |
| 15 Years | 94 (100.0%) | 0 (0.0%) |
| 16 and 17 Years | 0 (0.0%) | 0 (0.0%) |
| 18 to 24 Years | 0 (0.0%) | 0 (0.0%) |
| 25 to 34 Years | 0 (0.0%) | 15 (100.0%) |
| 35 to 44 Years | 1 (0.6%) | 0 (0.0%) |
| 45 to 54 Years | 74 (34.3%) | 0 (0.0%) |
| 55 to 64 Years | 87 (43.1%) | 0 (0.0%) |
| 65 to 74 Years | 0 (0.0%) | 46 (11.3%) |
| 75 Years and over | 38 (34.5%) | 49 (21.8%) |
| Total | 317 (18.4%) | 137 (8.7%) |
Income Above Poverty by Sex and Age in North River Shores
According to the poverty statistics in North River Shores, males aged under 5 years and females aged under 5 years are the age groups that are most secure financially, with 100.0% of males and 100.0% of females in these age groups living above the poverty line.
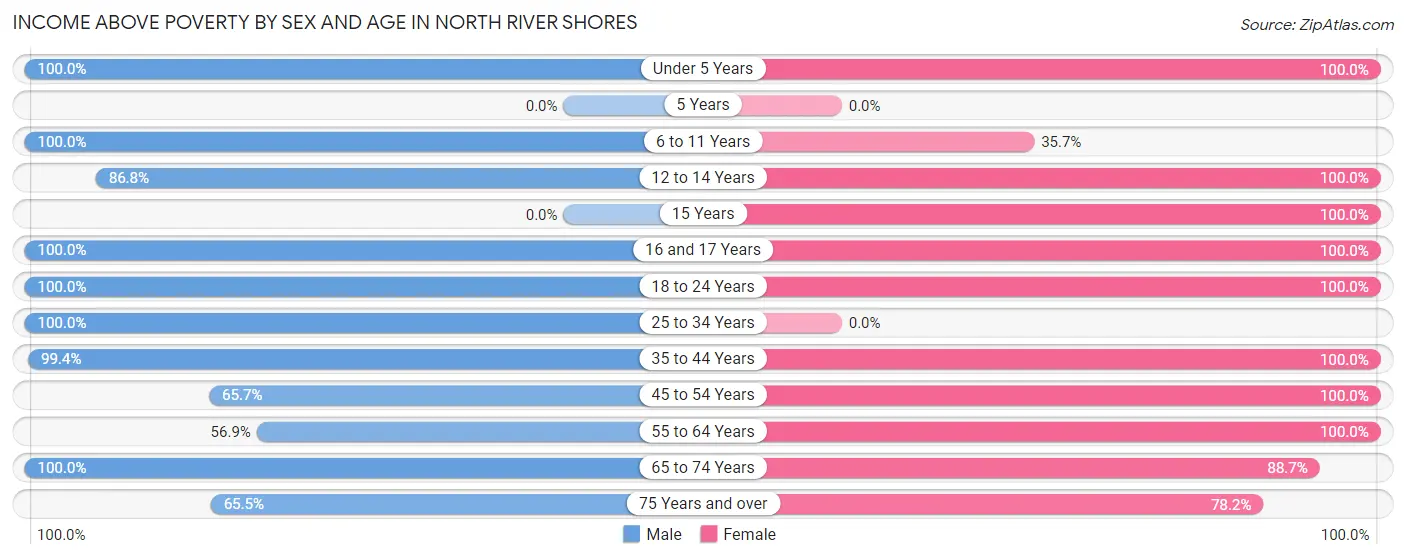
| Age Bracket | Male | Female |
| Under 5 Years | 132 (100.0%) | 72 (100.0%) |
| 5 Years | 0 (0.0%) | 0 (0.0%) |
| 6 to 11 Years | 188 (100.0%) | 15 (35.7%) |
| 12 to 14 Years | 151 (86.8%) | 17 (100.0%) |
| 15 Years | 0 (0.0%) | 7 (100.0%) |
| 16 and 17 Years | 7 (100.0%) | 110 (100.0%) |
| 18 to 24 Years | 14 (100.0%) | 33 (100.0%) |
| 25 to 34 Years | 77 (100.0%) | 0 (0.0%) |
| 35 to 44 Years | 153 (99.4%) | 165 (100.0%) |
| 45 to 54 Years | 142 (65.7%) | 250 (100.0%) |
| 55 to 64 Years | 115 (56.9%) | 238 (100.0%) |
| 65 to 74 Years | 352 (100.0%) | 360 (88.7%) |
| 75 Years and over | 72 (65.4%) | 176 (78.2%) |
| Total | 1,403 (81.6%) | 1,443 (91.3%) |
Income Below Poverty Among Married-Couple Families in North River Shores
The poverty statistics for married-couple families in North River Shores show that 7.0% or 38 of the total 545 families live below the poverty line. Families with no children have the highest poverty rate of 10.8%, comprising of 38 families. On the other hand, families with 1 or 2 children have the lowest poverty rate of 0.0%, which includes 0 families.
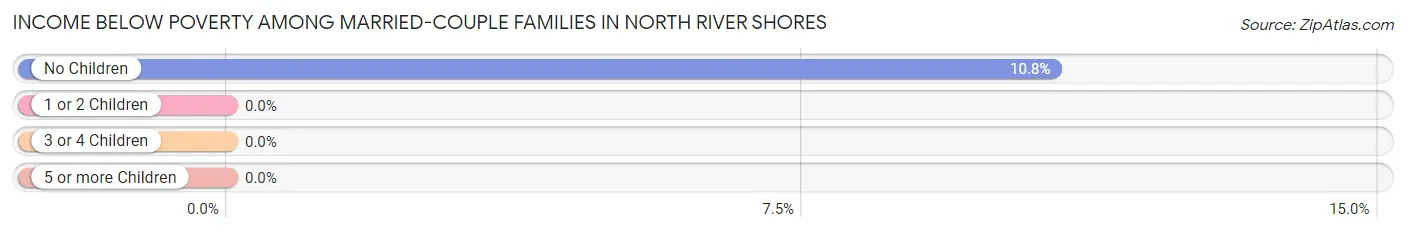
| Children | Above Poverty | Below Poverty |
| No Children | 315 (89.2%) | 38 (10.8%) |
| 1 or 2 Children | 152 (100.0%) | 0 (0.0%) |
| 3 or 4 Children | 40 (100.0%) | 0 (0.0%) |
| 5 or more Children | 0 (0.0%) | 0 (0.0%) |
| Total | 507 (93.0%) | 38 (7.0%) |
Income Below Poverty Among Single-Parent Households in North River Shores
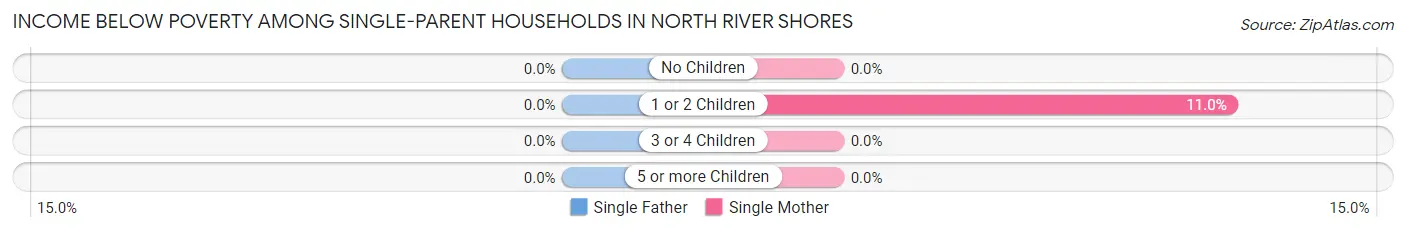
| Children | Single Father | Single Mother |
| No Children | 0 (0.0%) | 0 (0.0%) |
| 1 or 2 Children | 0 (0.0%) | 15 (11.0%) |
| 3 or 4 Children | 0 (0.0%) | 0 (0.0%) |
| 5 or more Children | 0 (0.0%) | 0 (0.0%) |
| Total | 0 (0.0%) | 15 (6.8%) |
Income Below Poverty Among Married-Couple vs Single-Parent Households in North River Shores
The poverty data for North River Shores shows that 38 of the married-couple family households (7.0%) and 15 of the single-parent households (5.6%) are living below the poverty level. Within the married-couple family households, those with no children have the highest poverty rate, with 38 households (10.8%) falling below the poverty line. Among the single-parent households, those with 1 or 2 children have the highest poverty rate, with 15 household (10.3%) living below poverty.
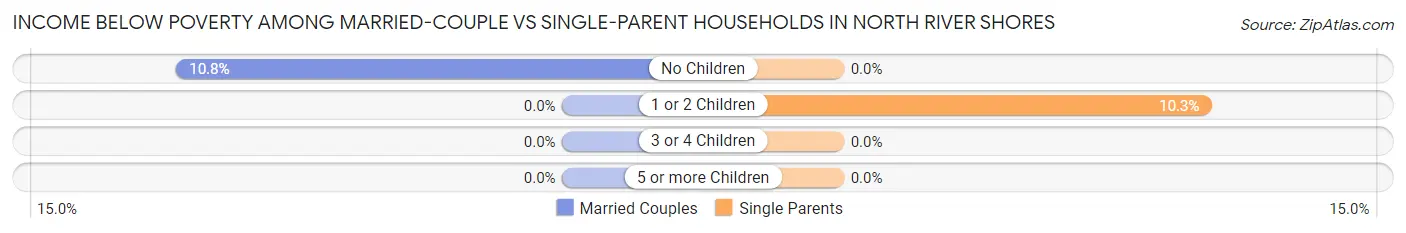
| Children | Married-Couple Families | Single-Parent Households |
| No Children | 38 (10.8%) | 0 (0.0%) |
| 1 or 2 Children | 0 (0.0%) | 15 (10.3%) |
| 3 or 4 Children | 0 (0.0%) | 0 (0.0%) |
| 5 or more Children | 0 (0.0%) | 0 (0.0%) |
| Total | 38 (7.0%) | 15 (5.6%) |
Employment Characteristics in North River Shores
Employment by Class of Employer in North River Shores
Among the 1,295 employed individuals in North River Shores, private company employees (703 | 54.3%), self-employed (not incorporated) (207 | 16.0%), and local government employees (147 | 11.4%) make up the most common classes of employment.
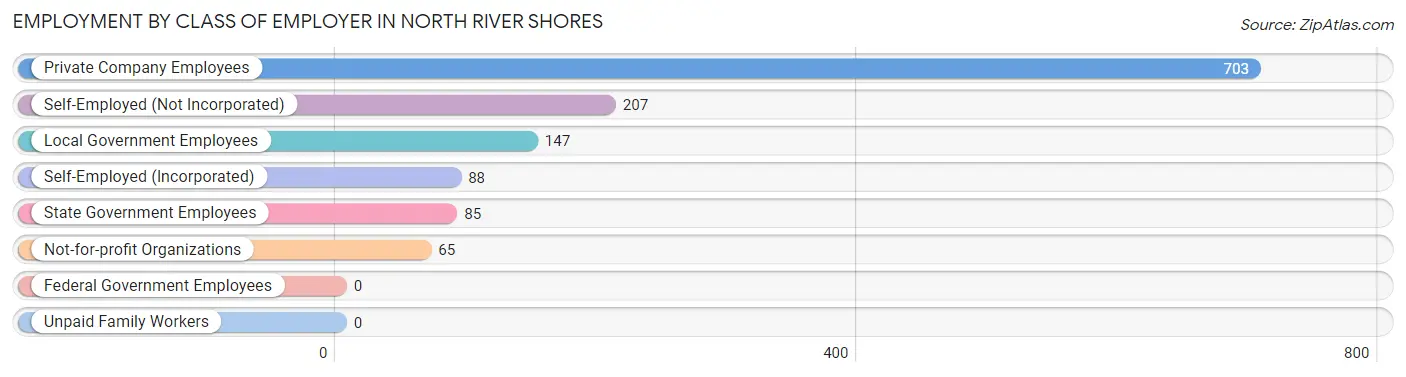
| Employer Class | # Employees | % Employees |
| Private Company Employees | 703 | 54.3% |
| Self-Employed (Incorporated) | 88 | 6.8% |
| Self-Employed (Not Incorporated) | 207 | 16.0% |
| Not-for-profit Organizations | 65 | 5.0% |
| Local Government Employees | 147 | 11.4% |
| State Government Employees | 85 | 6.6% |
| Federal Government Employees | 0 | 0.0% |
| Unpaid Family Workers | 0 | 0.0% |
| Total | 1,295 | 100.0% |
Employment Status by Age in North River Shores
According to the labor force statistics for North River Shores, out of the total population over 16 years of age (2,596), 51.5% or 1,337 individuals are in the labor force, with 3.1% or 41 of them unemployed. The age group with the highest labor force participation rate is 25 to 29 years, with 100.0% or 43 individuals in the labor force. Within the labor force, the 16 to 19 years age range has the highest percentage of unemployed individuals, with 11.3% or 14 of them being unemployed.
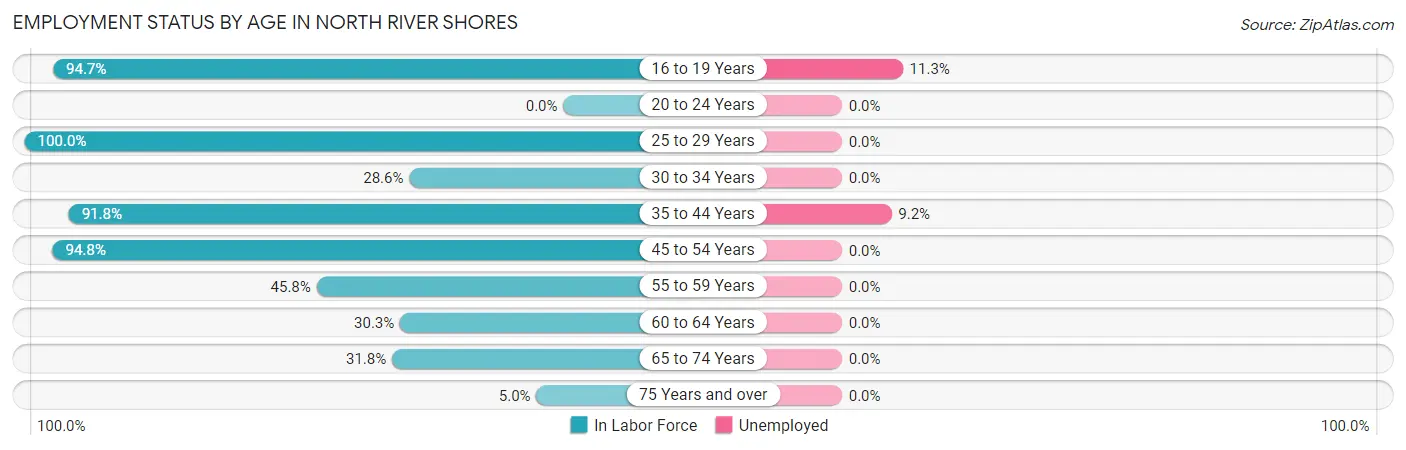
| Age Bracket | In Labor Force | Unemployed |
| 16 to 19 Years | 124 (94.7%) | 14 (11.3%) |
| 20 to 24 Years | 0 (0.0%) | 0 (0.0%) |
| 25 to 29 Years | 43 (100.0%) | 0 (0.0%) |
| 30 to 34 Years | 14 (28.6%) | 0 (0.0%) |
| 35 to 44 Years | 293 (91.8%) | 27 (9.2%) |
| 45 to 54 Years | 442 (94.8%) | 0 (0.0%) |
| 55 to 59 Years | 66 (45.8%) | 0 (0.0%) |
| 60 to 64 Years | 93 (30.3%) | 0 (0.0%) |
| 65 to 74 Years | 244 (31.8%) | 0 (0.0%) |
| 75 Years and over | 17 (5.0%) | 0 (0.0%) |
| Total | 1,337 (51.5%) | 41 (3.1%) |
Employment Status by Educational Attainment in North River Shores
According to labor force statistics for North River Shores, 71.6% of individuals (951) out of the total population between 25 and 64 years of age (1,328) are in the labor force, with 2.8% or 27 of them being unemployed. The group with the highest labor force participation rate are those with the educational attainment of bachelor's degree or higher, with 80.3% or 460 individuals in the labor force. Within the labor force, individuals with bachelor's degree or higher education have the highest percentage of unemployment, with 5.9% or 27 of them being unemployed.
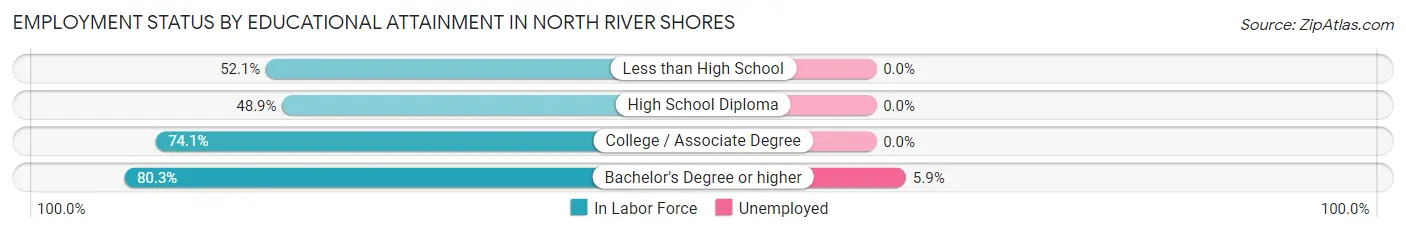
| Educational Attainment | In Labor Force | Unemployed |
| Less than High School | 50 (52.1%) | 0 (0.0%) |
| High School Diploma | 92 (48.9%) | 0 (0.0%) |
| College / Associate Degree | 349 (74.1%) | 0 (0.0%) |
| Bachelor's Degree or higher | 460 (80.3%) | 34 (5.9%) |
| Total | 951 (71.6%) | 37 (2.8%) |
Employment Occupations by Sex in North River Shores
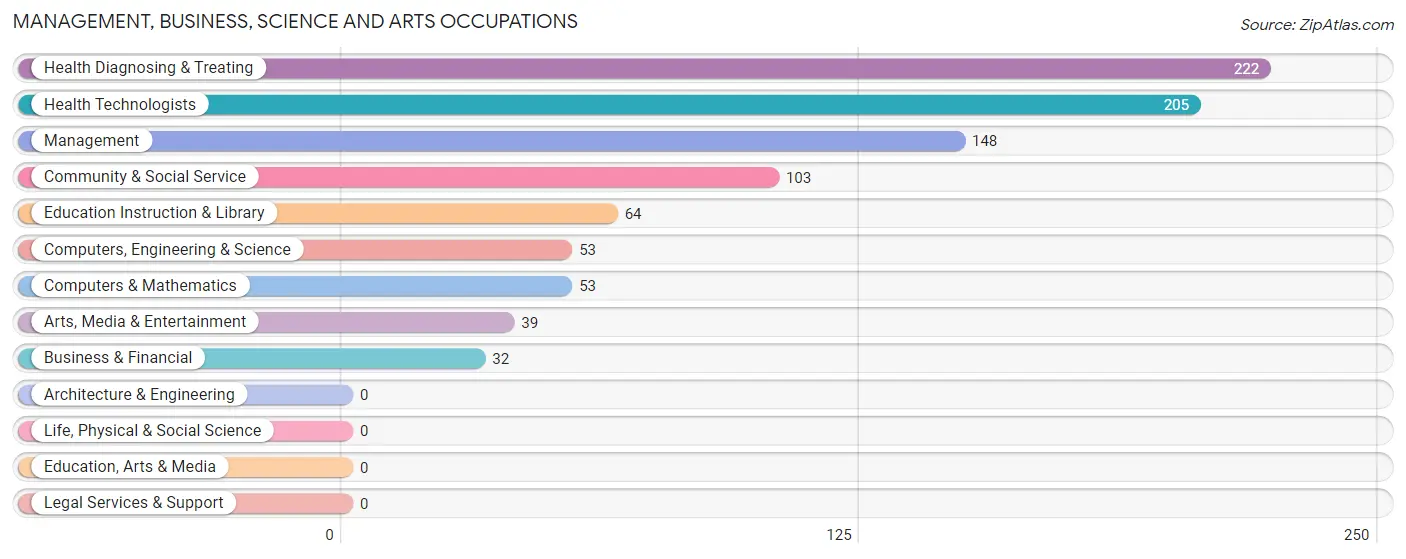
Management, Business, Science and Arts Occupations
The most common Management, Business, Science and Arts occupations in North River Shores are Health Diagnosing & Treating (222 | 17.1%), Health Technologists (205 | 15.8%), Management (148 | 11.4%), Community & Social Service (103 | 8.0%), and Education Instruction & Library (64 | 4.9%).
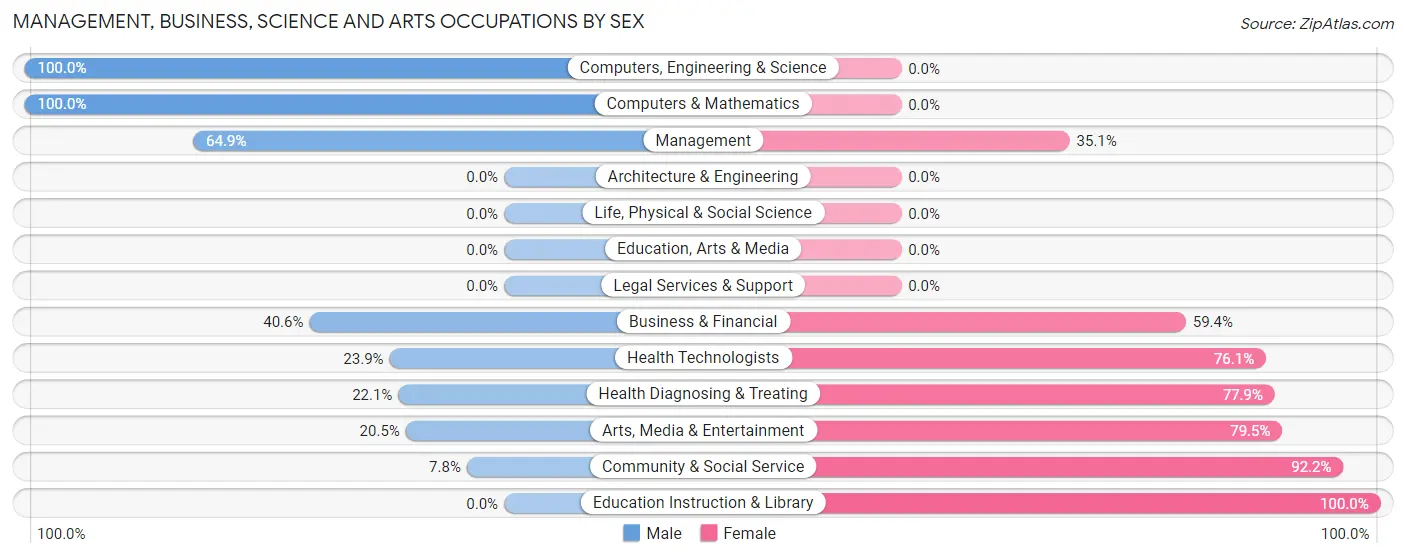
Management, Business, Science and Arts Occupations by Sex
Within the Management, Business, Science and Arts occupations in North River Shores, the most male-oriented occupations are Computers, Engineering & Science (100.0%), Computers & Mathematics (100.0%), and Management (64.9%), while the most female-oriented occupations are Education Instruction & Library (100.0%), Community & Social Service (92.2%), and Arts, Media & Entertainment (79.5%).
| Occupation | Male | Female |
| Management | 96 (64.9%) | 52 (35.1%) |
| Business & Financial | 13 (40.6%) | 19 (59.4%) |
| Computers, Engineering & Science | 53 (100.0%) | 0 (0.0%) |
| Computers & Mathematics | 53 (100.0%) | 0 (0.0%) |
| Architecture & Engineering | 0 (0.0%) | 0 (0.0%) |
| Life, Physical & Social Science | 0 (0.0%) | 0 (0.0%) |
| Community & Social Service | 8 (7.8%) | 95 (92.2%) |
| Education, Arts & Media | 0 (0.0%) | 0 (0.0%) |
| Legal Services & Support | 0 (0.0%) | 0 (0.0%) |
| Education Instruction & Library | 0 (0.0%) | 64 (100.0%) |
| Arts, Media & Entertainment | 8 (20.5%) | 31 (79.5%) |
| Health Diagnosing & Treating | 49 (22.1%) | 173 (77.9%) |
| Health Technologists | 49 (23.9%) | 156 (76.1%) |
| Total (Category) | 219 (39.3%) | 339 (60.8%) |
| Total (Overall) | 605 (46.7%) | 690 (53.3%) |
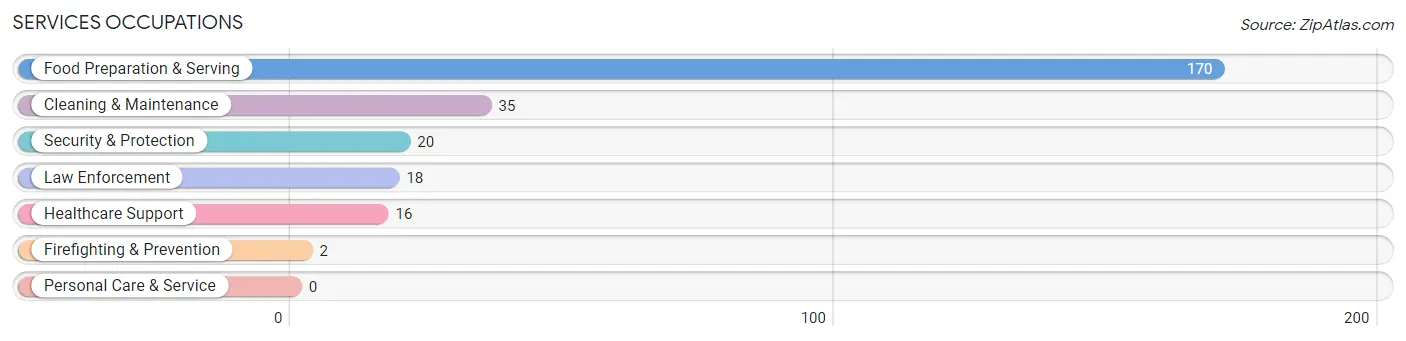
Services Occupations
The most common Services occupations in North River Shores are Food Preparation & Serving (170 | 13.1%), Cleaning & Maintenance (35 | 2.7%), Security & Protection (20 | 1.5%), Law Enforcement (18 | 1.4%), and Healthcare Support (16 | 1.2%).
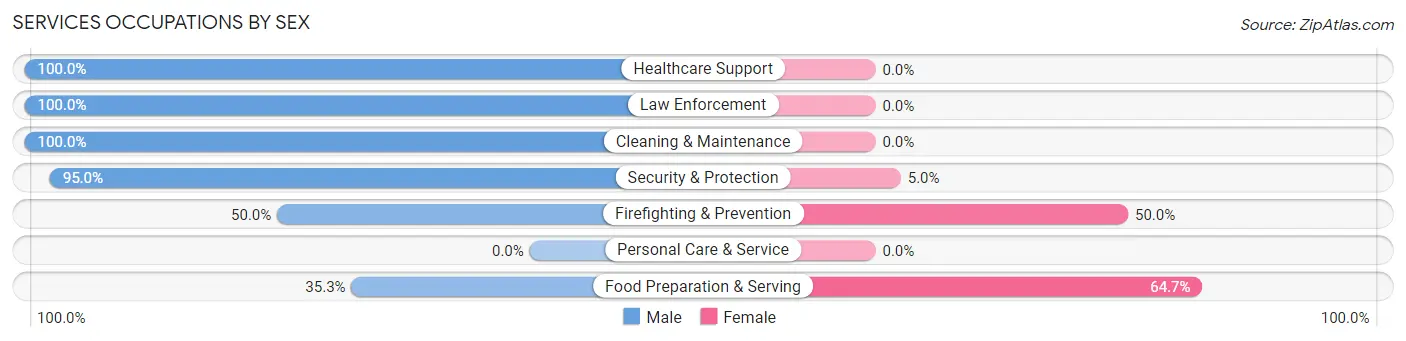
Services Occupations by Sex
Within the Services occupations in North River Shores, the most male-oriented occupations are Healthcare Support (100.0%), Law Enforcement (100.0%), and Cleaning & Maintenance (100.0%), while the most female-oriented occupations are Food Preparation & Serving (64.7%), Firefighting & Prevention (50.0%), and Security & Protection (5.0%).
| Occupation | Male | Female |
| Healthcare Support | 16 (100.0%) | 0 (0.0%) |
| Security & Protection | 19 (95.0%) | 1 (5.0%) |
| Firefighting & Prevention | 1 (50.0%) | 1 (50.0%) |
| Law Enforcement | 18 (100.0%) | 0 (0.0%) |
| Food Preparation & Serving | 60 (35.3%) | 110 (64.7%) |
| Cleaning & Maintenance | 35 (100.0%) | 0 (0.0%) |
| Personal Care & Service | 0 (0.0%) | 0 (0.0%) |
| Total (Category) | 130 (53.9%) | 111 (46.1%) |
| Total (Overall) | 605 (46.7%) | 690 (53.3%) |
Sales and Office Occupations
The most common Sales and Office occupations in North River Shores are Sales & Related (214 | 16.5%), and Office & Administration (64 | 4.9%).
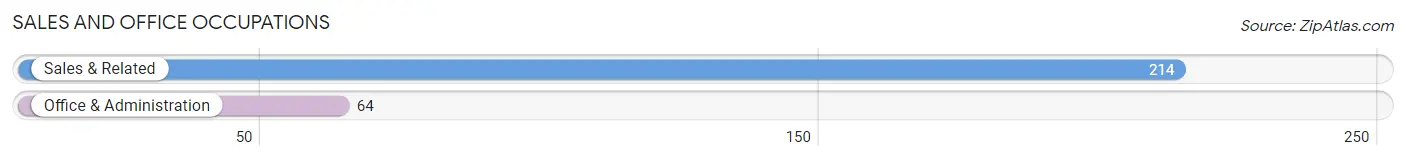
Sales and Office Occupations by Sex

| Occupation | Male | Female |
| Sales & Related | 38 (17.8%) | 176 (82.2%) |
| Office & Administration | 0 (0.0%) | 64 (100.0%) |
| Total (Category) | 38 (13.7%) | 240 (86.3%) |
| Total (Overall) | 605 (46.7%) | 690 (53.3%) |
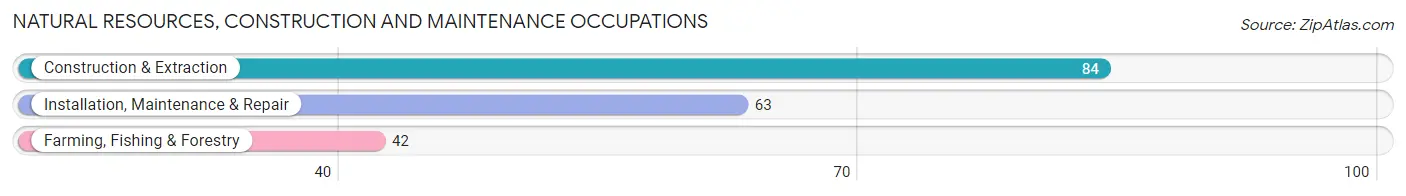
Natural Resources, Construction and Maintenance Occupations
The most common Natural Resources, Construction and Maintenance occupations in North River Shores are Construction & Extraction (84 | 6.5%), Installation, Maintenance & Repair (63 | 4.9%), and Farming, Fishing & Forestry (42 | 3.2%).
Natural Resources, Construction and Maintenance Occupations by Sex
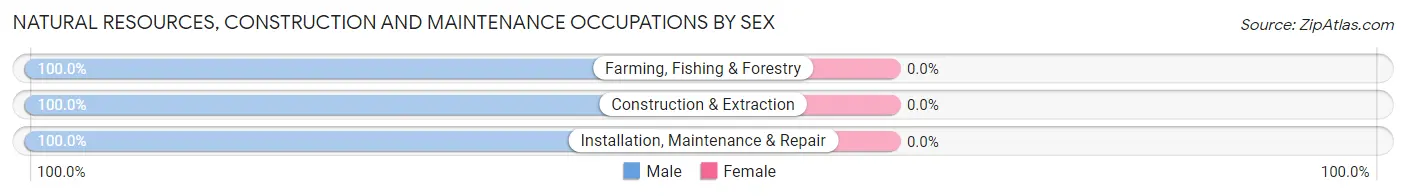
| Occupation | Male | Female |
| Farming, Fishing & Forestry | 42 (100.0%) | 0 (0.0%) |
| Construction & Extraction | 84 (100.0%) | 0 (0.0%) |
| Installation, Maintenance & Repair | 63 (100.0%) | 0 (0.0%) |
| Total (Category) | 189 (100.0%) | 0 (0.0%) |
| Total (Overall) | 605 (46.7%) | 690 (53.3%) |
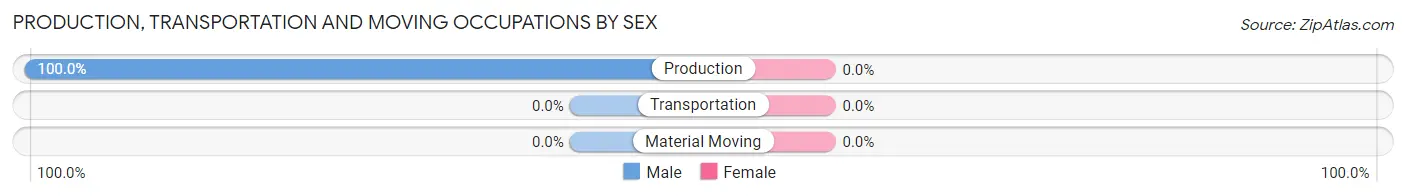
Production, Transportation and Moving Occupations
The most common Production, Transportation and Moving occupations in North River Shores are , and Production (29 | 2.2%).
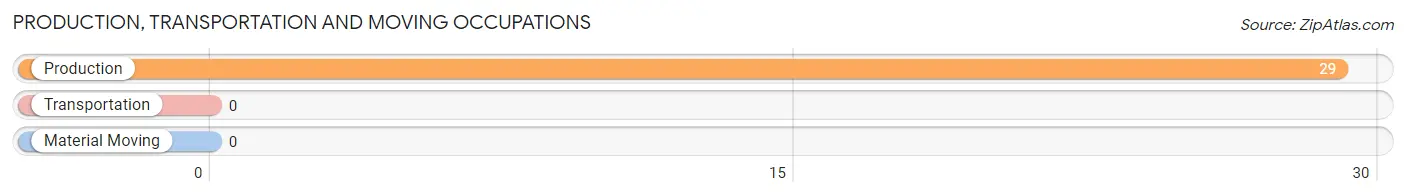
Production, Transportation and Moving Occupations by Sex
| Occupation | Male | Female |
| Production | 29 (100.0%) | 0 (0.0%) |
| Transportation | 0 (0.0%) | 0 (0.0%) |
| Material Moving | 0 (0.0%) | 0 (0.0%) |
| Total (Category) | 29 (100.0%) | 0 (0.0%) |
| Total (Overall) | 605 (46.7%) | 690 (53.3%) |
Employment Industries by Sex in North River Shores
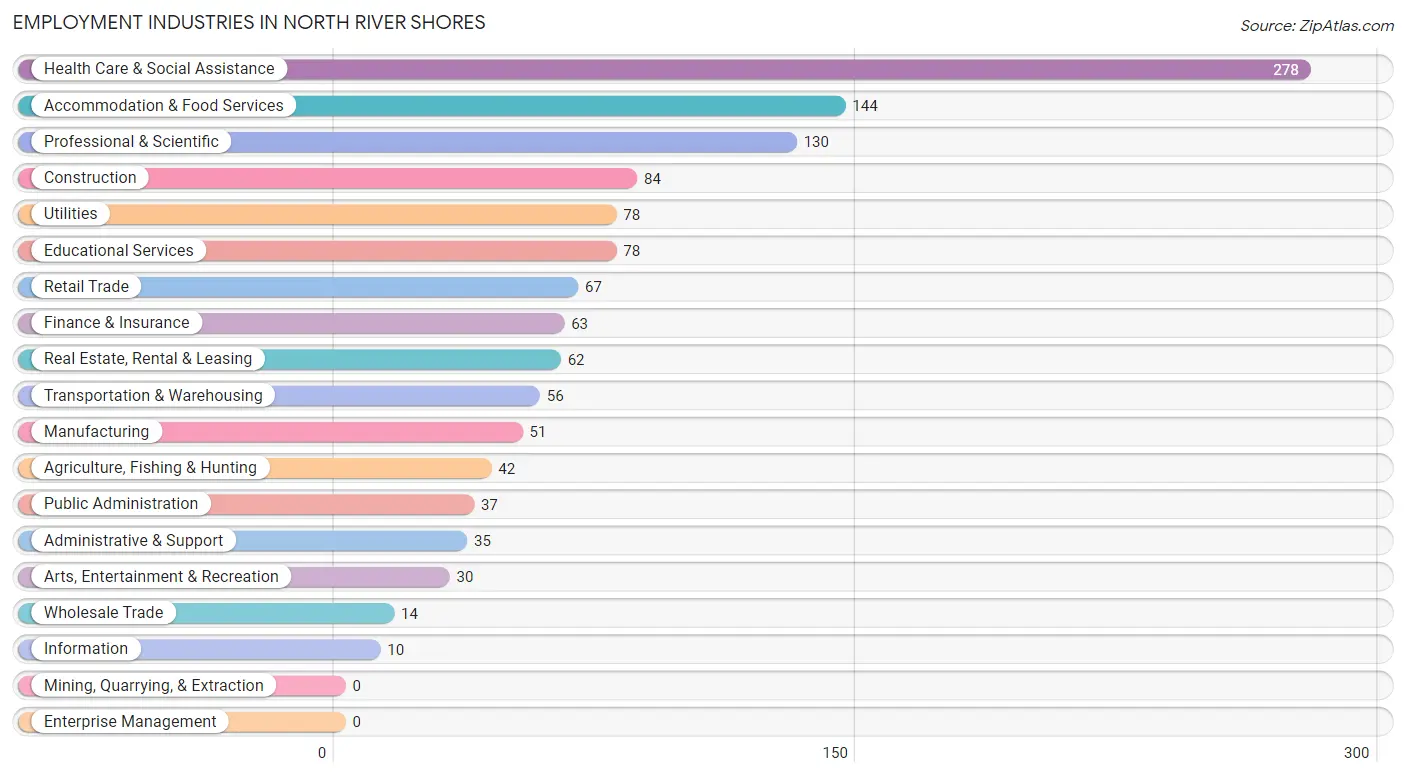
Employment Industries in North River Shores
The major employment industries in North River Shores include Health Care & Social Assistance (278 | 21.5%), Accommodation & Food Services (144 | 11.1%), Professional & Scientific (130 | 10.0%), Construction (84 | 6.5%), and Utilities (78 | 6.0%).
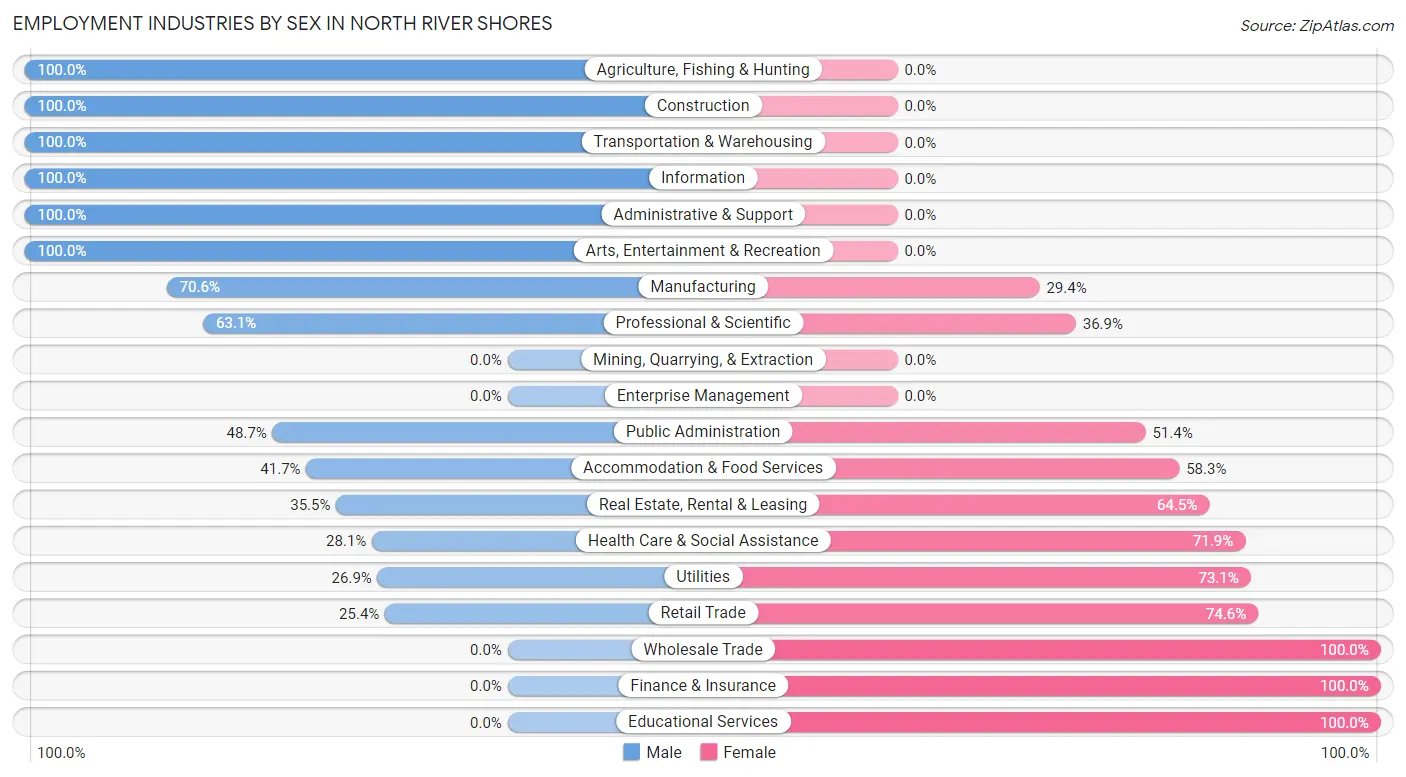
Employment Industries by Sex in North River Shores
The North River Shores industries that see more men than women are Agriculture, Fishing & Hunting (100.0%), Construction (100.0%), and Transportation & Warehousing (100.0%), whereas the industries that tend to have a higher number of women are Wholesale Trade (100.0%), Finance & Insurance (100.0%), and Educational Services (100.0%).
| Industry | Male | Female |
| Agriculture, Fishing & Hunting | 42 (100.0%) | 0 (0.0%) |
| Mining, Quarrying, & Extraction | 0 (0.0%) | 0 (0.0%) |
| Construction | 84 (100.0%) | 0 (0.0%) |
| Manufacturing | 36 (70.6%) | 15 (29.4%) |
| Wholesale Trade | 0 (0.0%) | 14 (100.0%) |
| Retail Trade | 17 (25.4%) | 50 (74.6%) |
| Transportation & Warehousing | 56 (100.0%) | 0 (0.0%) |
| Utilities | 21 (26.9%) | 57 (73.1%) |
| Information | 10 (100.0%) | 0 (0.0%) |
| Finance & Insurance | 0 (0.0%) | 63 (100.0%) |
| Real Estate, Rental & Leasing | 22 (35.5%) | 40 (64.5%) |
| Professional & Scientific | 82 (63.1%) | 48 (36.9%) |
| Enterprise Management | 0 (0.0%) | 0 (0.0%) |
| Administrative & Support | 35 (100.0%) | 0 (0.0%) |
| Educational Services | 0 (0.0%) | 78 (100.0%) |
| Health Care & Social Assistance | 78 (28.1%) | 200 (71.9%) |
| Arts, Entertainment & Recreation | 30 (100.0%) | 0 (0.0%) |
| Accommodation & Food Services | 60 (41.7%) | 84 (58.3%) |
| Public Administration | 18 (48.6%) | 19 (51.3%) |
| Total | 605 (46.7%) | 690 (53.3%) |
Education in North River Shores
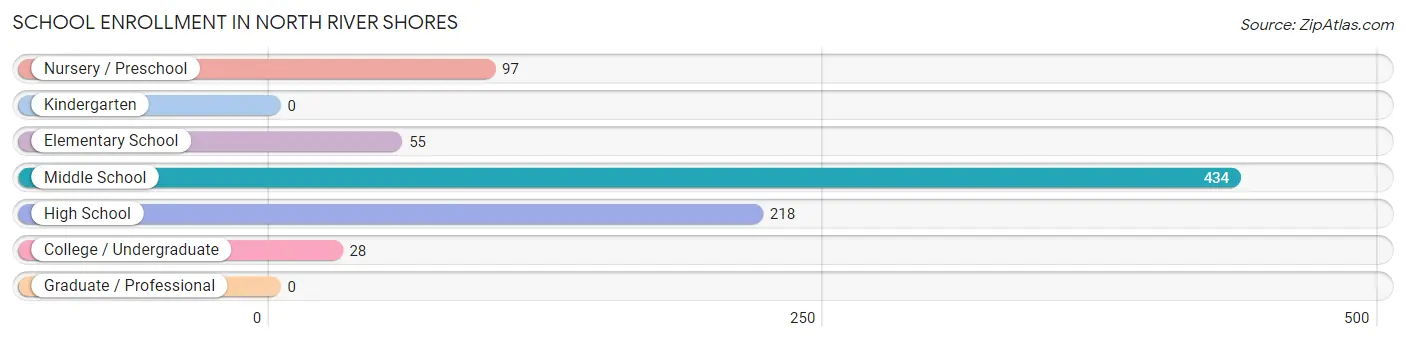
School Enrollment in North River Shores
The most common levels of schooling among the 832 students in North River Shores are middle school (434 | 52.2%), high school (218 | 26.2%), and nursery / preschool (97 | 11.7%).
| School Level | # Students | % Students |
| Nursery / Preschool | 97 | 11.7% |
| Kindergarten | 0 | 0.0% |
| Elementary School | 55 | 6.6% |
| Middle School | 434 | 52.2% |
| High School | 218 | 26.2% |
| College / Undergraduate | 28 | 3.4% |
| Graduate / Professional | 0 | 0.0% |
| Total | 832 | 100.0% |
School Enrollment by Age by Funding Source in North River Shores
Out of a total of 832 students who are enrolled in schools in North River Shores, 82 (9.9%) attend a private institution, while the remaining 750 (90.1%) are enrolled in public schools. The age group of 35 years and over has the highest likelihood of being enrolled in private schools, with 14 (100.0% in the age bracket) enrolled. Conversely, the age group of 3 to 4 year olds has the lowest likelihood of being enrolled in a private school, with 97 (100.0% in the age bracket) attending a public institution.
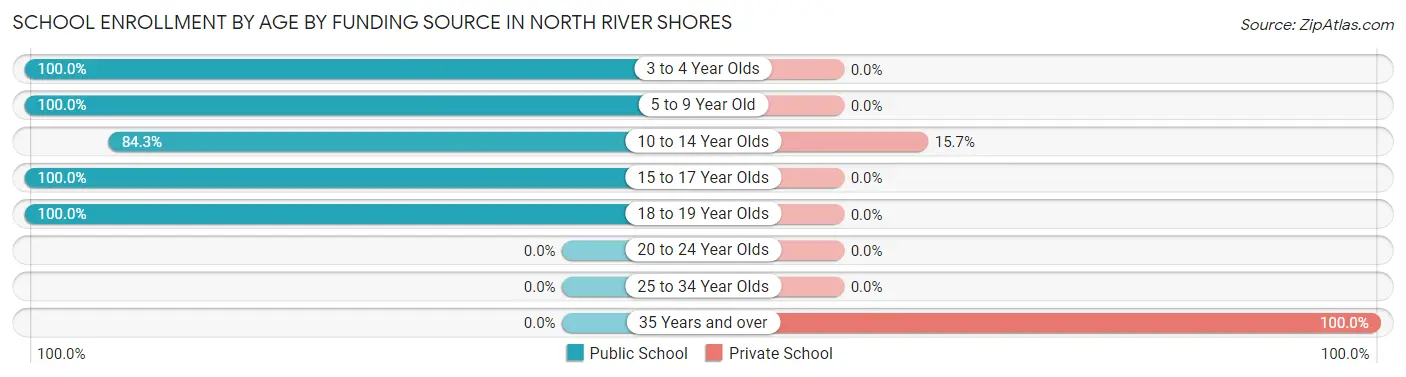
| Age Bracket | Public School | Private School |
| 3 to 4 Year Olds | 97 (100.0%) | 0 (0.0%) |
| 5 to 9 Year Old | 55 (100.0%) | 0 (0.0%) |
| 10 to 14 Year Olds | 366 (84.3%) | 68 (15.7%) |
| 15 to 17 Year Olds | 218 (100.0%) | 0 (0.0%) |
| 18 to 19 Year Olds | 14 (100.0%) | 0 (0.0%) |
| 20 to 24 Year Olds | 0 (0.0%) | 0 (0.0%) |
| 25 to 34 Year Olds | 0 (0.0%) | 0 (0.0%) |
| 35 Years and over | 0 (0.0%) | 14 (100.0%) |
| Total | 750 (90.1%) | 82 (9.9%) |
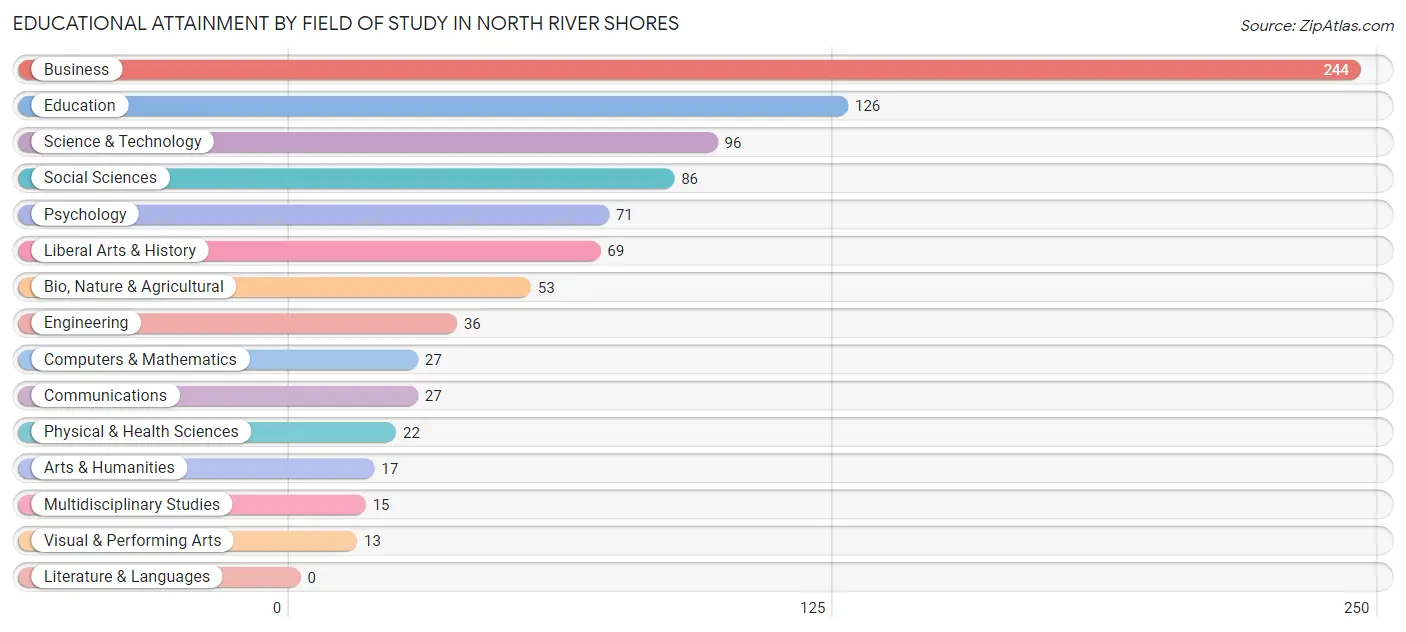
Educational Attainment by Field of Study in North River Shores
Business (244 | 27.1%), education (126 | 14.0%), science & technology (96 | 10.6%), social sciences (86 | 9.5%), and psychology (71 | 7.9%) are the most common fields of study among 902 individuals in North River Shores who have obtained a bachelor's degree or higher.
| Field of Study | # Graduates | % Graduates |
| Computers & Mathematics | 27 | 3.0% |
| Bio, Nature & Agricultural | 53 | 5.9% |
| Physical & Health Sciences | 22 | 2.4% |
| Psychology | 71 | 7.9% |
| Social Sciences | 86 | 9.5% |
| Engineering | 36 | 4.0% |
| Multidisciplinary Studies | 15 | 1.7% |
| Science & Technology | 96 | 10.6% |
| Business | 244 | 27.1% |
| Education | 126 | 14.0% |
| Literature & Languages | 0 | 0.0% |
| Liberal Arts & History | 69 | 7.6% |
| Visual & Performing Arts | 13 | 1.4% |
| Communications | 27 | 3.0% |
| Arts & Humanities | 17 | 1.9% |
| Total | 902 | 100.0% |
Transportation & Commute in North River Shores
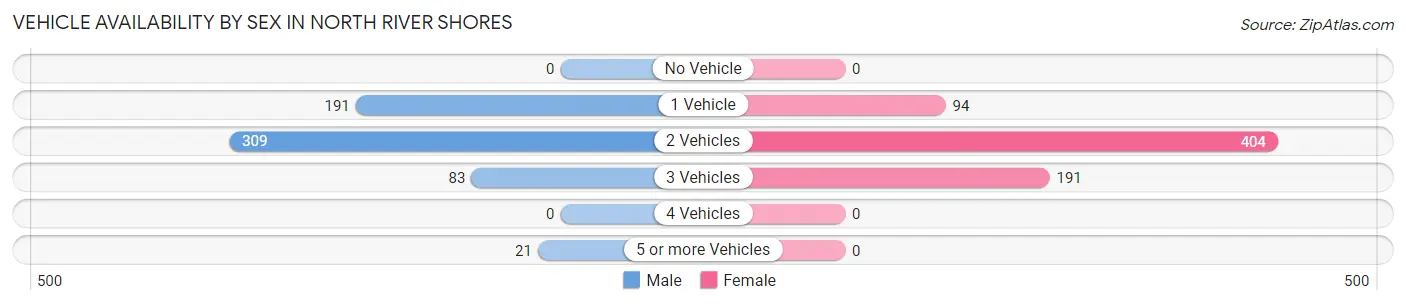
Vehicle Availability by Sex in North River Shores
The most prevalent vehicle ownership categories in North River Shores are males with 2 vehicles (309, accounting for 51.2%) and females with 2 vehicles (404, making up 44.9%).
| Vehicles Available | Male | Female |
| No Vehicle | 0 (0.0%) | 0 (0.0%) |
| 1 Vehicle | 191 (31.6%) | 94 (13.6%) |
| 2 Vehicles | 309 (51.2%) | 404 (58.6%) |
| 3 Vehicles | 83 (13.7%) | 191 (27.7%) |
| 4 Vehicles | 0 (0.0%) | 0 (0.0%) |
| 5 or more Vehicles | 21 (3.5%) | 0 (0.0%) |
| Total | 604 (100.0%) | 689 (100.0%) |
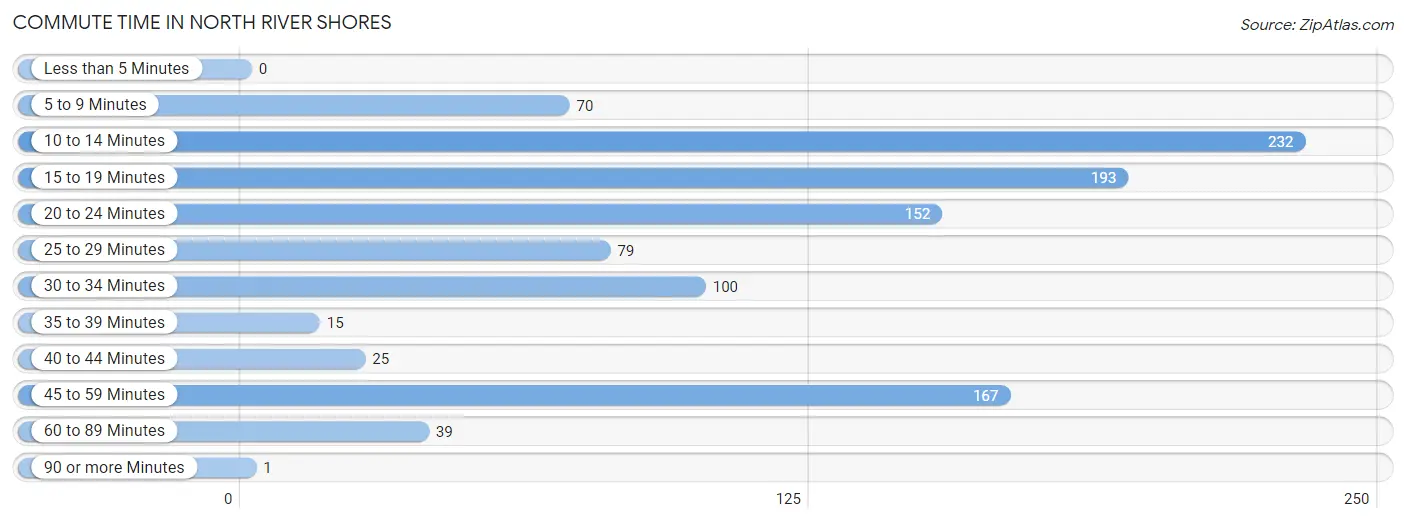
Commute Time in North River Shores
The most frequently occuring commute durations in North River Shores are 10 to 14 minutes (232 commuters, 21.6%), 15 to 19 minutes (193 commuters, 18.0%), and 45 to 59 minutes (167 commuters, 15.6%).
| Commute Time | # Commuters | % Commuters |
| Less than 5 Minutes | 0 | 0.0% |
| 5 to 9 Minutes | 70 | 6.5% |
| 10 to 14 Minutes | 232 | 21.6% |
| 15 to 19 Minutes | 193 | 18.0% |
| 20 to 24 Minutes | 152 | 14.2% |
| 25 to 29 Minutes | 79 | 7.4% |
| 30 to 34 Minutes | 100 | 9.3% |
| 35 to 39 Minutes | 15 | 1.4% |
| 40 to 44 Minutes | 25 | 2.3% |
| 45 to 59 Minutes | 167 | 15.6% |
| 60 to 89 Minutes | 39 | 3.6% |
| 90 or more Minutes | 1 | 0.1% |
Commute Time by Sex in North River Shores
The most common commute times in North River Shores are 45 to 59 minutes (148 commuters, 27.7%) for males and 10 to 14 minutes (218 commuters, 40.5%) for females.
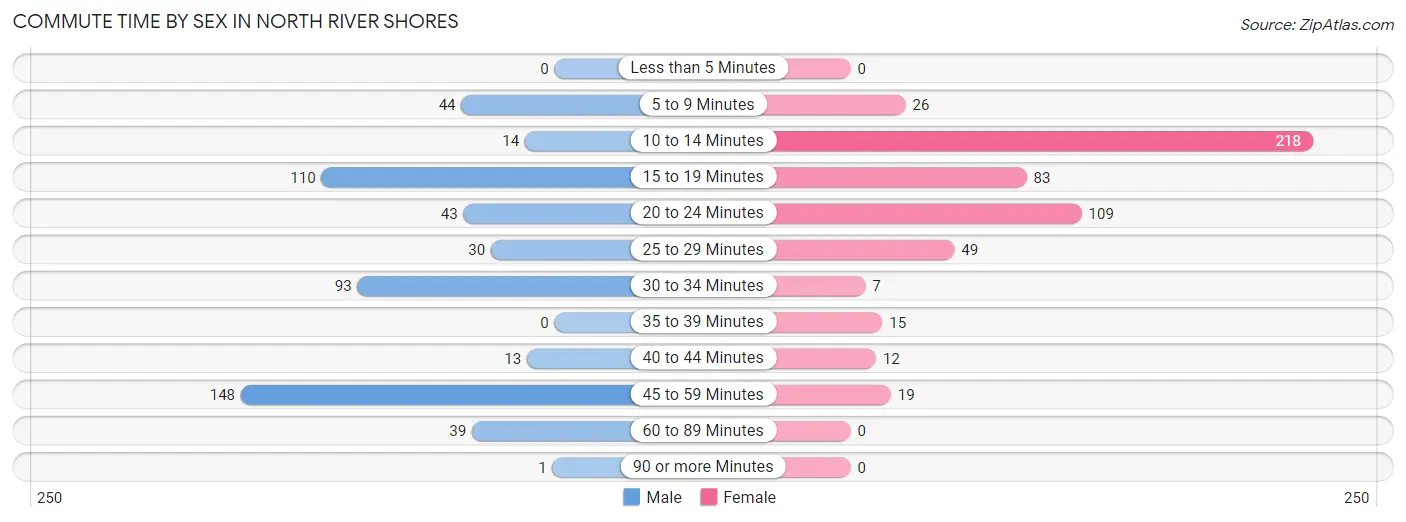
| Commute Time | Male | Female |
| Less than 5 Minutes | 0 (0.0%) | 0 (0.0%) |
| 5 to 9 Minutes | 44 (8.2%) | 26 (4.8%) |
| 10 to 14 Minutes | 14 (2.6%) | 218 (40.5%) |
| 15 to 19 Minutes | 110 (20.6%) | 83 (15.4%) |
| 20 to 24 Minutes | 43 (8.0%) | 109 (20.3%) |
| 25 to 29 Minutes | 30 (5.6%) | 49 (9.1%) |
| 30 to 34 Minutes | 93 (17.4%) | 7 (1.3%) |
| 35 to 39 Minutes | 0 (0.0%) | 15 (2.8%) |
| 40 to 44 Minutes | 13 (2.4%) | 12 (2.2%) |
| 45 to 59 Minutes | 148 (27.7%) | 19 (3.5%) |
| 60 to 89 Minutes | 39 (7.3%) | 0 (0.0%) |
| 90 or more Minutes | 1 (0.2%) | 0 (0.0%) |
Time of Departure to Work by Sex in North River Shores
The most frequent times of departure to work in North River Shores are 4:00 PM to 11:59 PM (114, 21.3%) for males and 8:00 AM to 8:29 AM (112, 20.8%) for females.
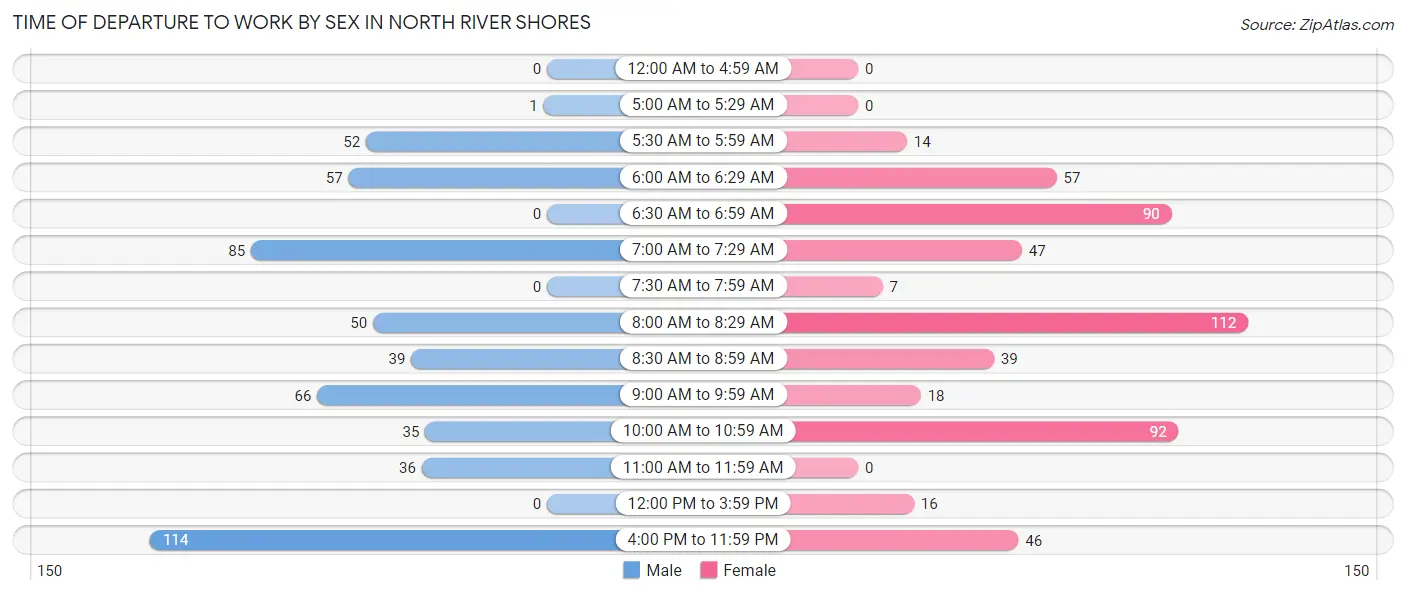
| Time of Departure | Male | Female |
| 12:00 AM to 4:59 AM | 0 (0.0%) | 0 (0.0%) |
| 5:00 AM to 5:29 AM | 1 (0.2%) | 0 (0.0%) |
| 5:30 AM to 5:59 AM | 52 (9.7%) | 14 (2.6%) |
| 6:00 AM to 6:29 AM | 57 (10.6%) | 57 (10.6%) |
| 6:30 AM to 6:59 AM | 0 (0.0%) | 90 (16.7%) |
| 7:00 AM to 7:29 AM | 85 (15.9%) | 47 (8.7%) |
| 7:30 AM to 7:59 AM | 0 (0.0%) | 7 (1.3%) |
| 8:00 AM to 8:29 AM | 50 (9.3%) | 112 (20.8%) |
| 8:30 AM to 8:59 AM | 39 (7.3%) | 39 (7.2%) |
| 9:00 AM to 9:59 AM | 66 (12.3%) | 18 (3.4%) |
| 10:00 AM to 10:59 AM | 35 (6.5%) | 92 (17.1%) |
| 11:00 AM to 11:59 AM | 36 (6.7%) | 0 (0.0%) |
| 12:00 PM to 3:59 PM | 0 (0.0%) | 16 (3.0%) |
| 4:00 PM to 11:59 PM | 114 (21.3%) | 46 (8.6%) |
| Total | 535 (100.0%) | 538 (100.0%) |
Housing Occupancy in North River Shores
Occupancy by Ownership in North River Shores
Of the total 1,472 dwellings in North River Shores, owner-occupied units account for 1,324 (89.9%), while renter-occupied units make up 148 (10.1%).
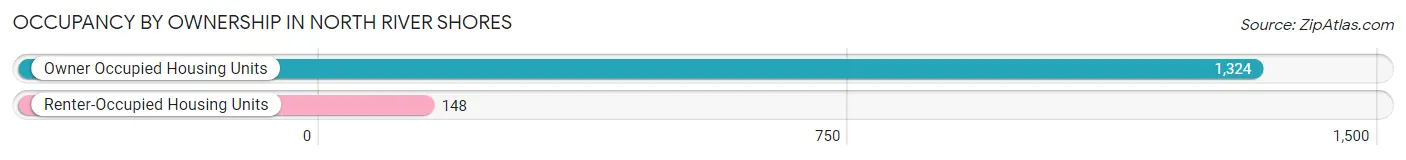
| Occupancy | # Housing Units | % Housing Units |
| Owner Occupied Housing Units | 1,324 | 89.9% |
| Renter-Occupied Housing Units | 148 | 10.1% |
| Total Occupied Housing Units | 1,472 | 100.0% |
Occupancy by Household Size in North River Shores
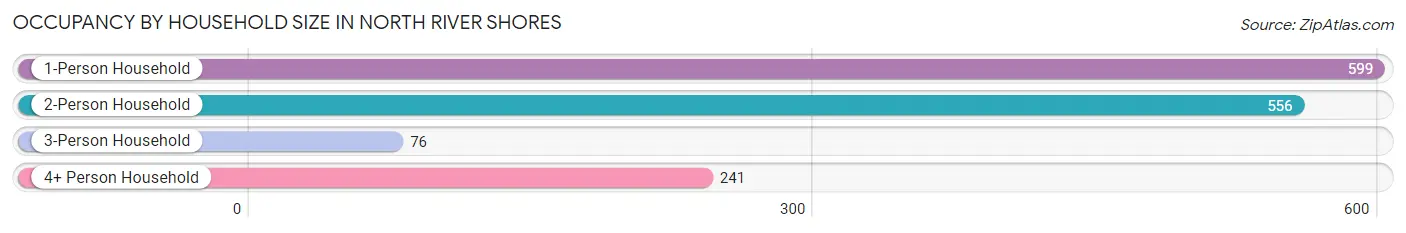
| Household Size | # Housing Units | % Housing Units |
| 1-Person Household | 599 | 40.7% |
| 2-Person Household | 556 | 37.8% |
| 3-Person Household | 76 | 5.2% |
| 4+ Person Household | 241 | 16.4% |
| Total Housing Units | 1,472 | 100.0% |
Occupancy by Ownership by Household Size in North River Shores
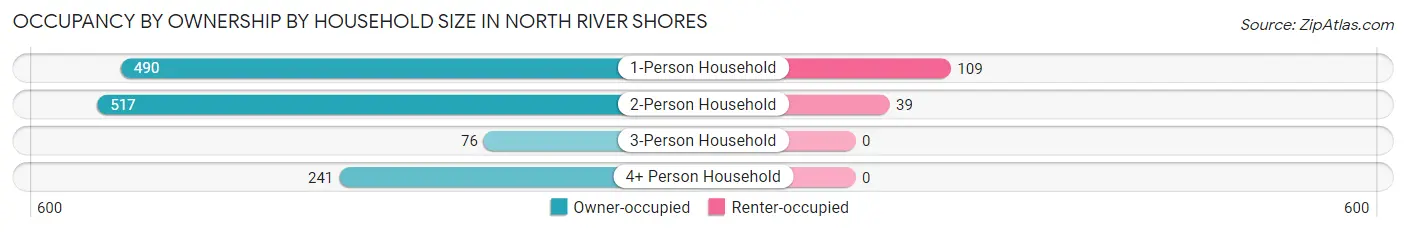
| Household Size | Owner-occupied | Renter-occupied |
| 1-Person Household | 490 (81.8%) | 109 (18.2%) |
| 2-Person Household | 517 (93.0%) | 39 (7.0%) |
| 3-Person Household | 76 (100.0%) | 0 (0.0%) |
| 4+ Person Household | 241 (100.0%) | 0 (0.0%) |
| Total Housing Units | 1,324 (89.9%) | 148 (10.1%) |
Occupancy by Educational Attainment in North River Shores
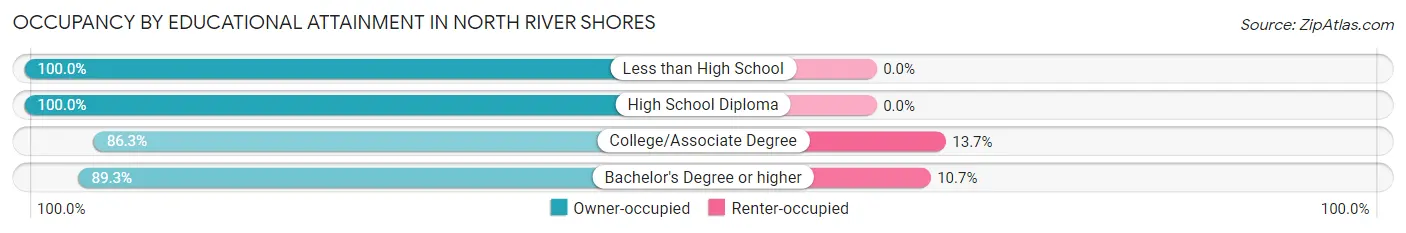
| Household Size | Owner-occupied | Renter-occupied |
| Less than High School | 33 (100.0%) | 0 (0.0%) |
| High School Diploma | 236 (100.0%) | 0 (0.0%) |
| College/Associate Degree | 547 (86.3%) | 87 (13.7%) |
| Bachelor's Degree or higher | 508 (89.3%) | 61 (10.7%) |
Occupancy by Age of Householder in North River Shores
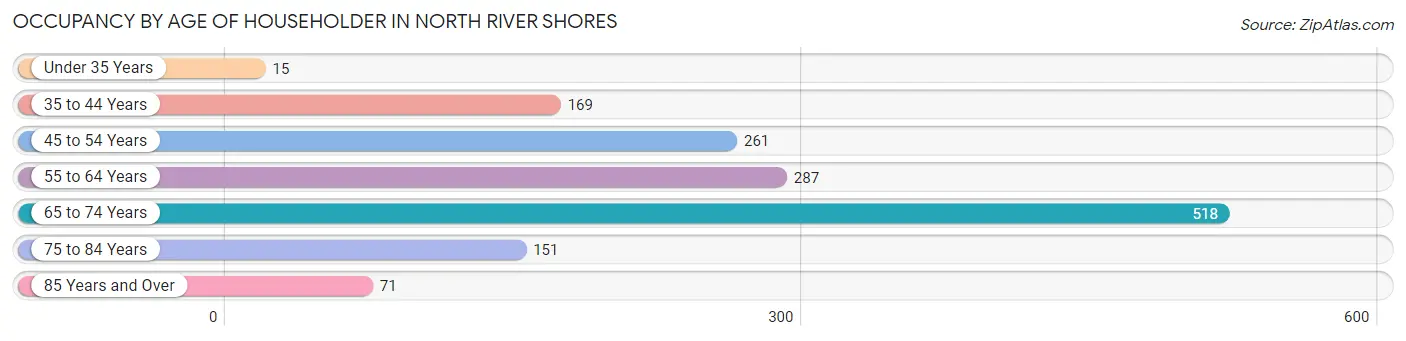
| Age Bracket | # Households | % Households |
| Under 35 Years | 15 | 1.0% |
| 35 to 44 Years | 169 | 11.5% |
| 45 to 54 Years | 261 | 17.7% |
| 55 to 64 Years | 287 | 19.5% |
| 65 to 74 Years | 518 | 35.2% |
| 75 to 84 Years | 151 | 10.3% |
| 85 Years and Over | 71 | 4.8% |
| Total | 1,472 | 100.0% |
Housing Finances in North River Shores
Median Income by Occupancy in North River Shores
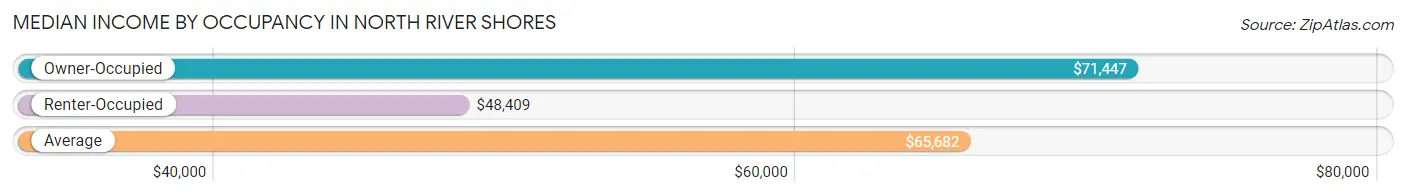
| Occupancy Type | # Households | Median Income |
| Owner-Occupied | 1,324 (89.9%) | $71,447 |
| Renter-Occupied | 148 (10.1%) | $48,409 |
| Average | 1,472 (100.0%) | $65,682 |
Occupancy by Householder Income Bracket in North River Shores
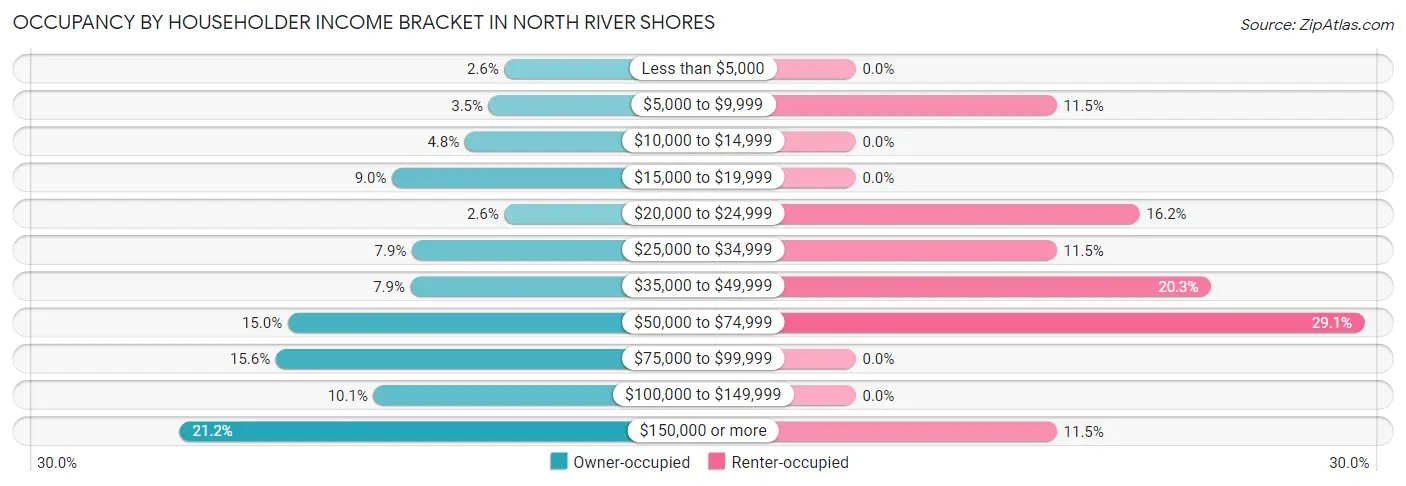
| Income Bracket | Owner-occupied | Renter-occupied |
| Less than $5,000 | 34 (2.6%) | 0 (0.0%) |
| $5,000 to $9,999 | 46 (3.5%) | 17 (11.5%) |
| $10,000 to $14,999 | 64 (4.8%) | 0 (0.0%) |
| $15,000 to $19,999 | 119 (9.0%) | 0 (0.0%) |
| $20,000 to $24,999 | 34 (2.6%) | 24 (16.2%) |
| $25,000 to $34,999 | 104 (7.9%) | 17 (11.5%) |
| $35,000 to $49,999 | 105 (7.9%) | 30 (20.3%) |
| $50,000 to $74,999 | 198 (14.9%) | 43 (29.0%) |
| $75,000 to $99,999 | 207 (15.6%) | 0 (0.0%) |
| $100,000 to $149,999 | 133 (10.1%) | 0 (0.0%) |
| $150,000 or more | 280 (21.1%) | 17 (11.5%) |
| Total | 1,324 (100.0%) | 148 (100.0%) |
Monthly Housing Cost Tiers in North River Shores
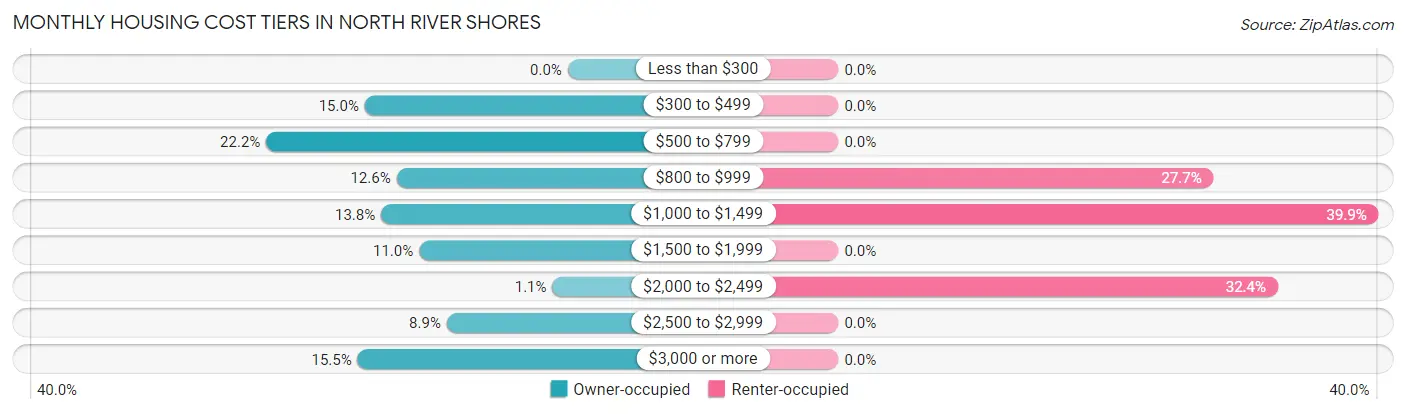
| Monthly Cost | Owner-occupied | Renter-occupied |
| Less than $300 | 0 (0.0%) | 0 (0.0%) |
| $300 to $499 | 198 (14.9%) | 0 (0.0%) |
| $500 to $799 | 294 (22.2%) | 0 (0.0%) |
| $800 to $999 | 167 (12.6%) | 41 (27.7%) |
| $1,000 to $1,499 | 182 (13.8%) | 59 (39.9%) |
| $1,500 to $1,999 | 145 (11.0%) | 0 (0.0%) |
| $2,000 to $2,499 | 15 (1.1%) | 48 (32.4%) |
| $2,500 to $2,999 | 118 (8.9%) | 0 (0.0%) |
| $3,000 or more | 205 (15.5%) | 0 (0.0%) |
| Total | 1,324 (100.0%) | 148 (100.0%) |
Physical Housing Characteristics in North River Shores
Housing Structures in North River Shores
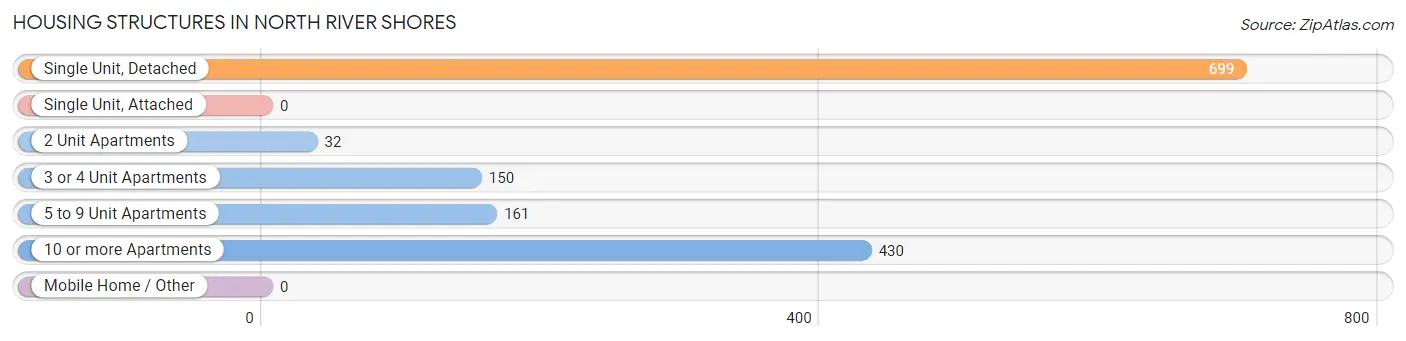
| Structure Type | # Housing Units | % Housing Units |
| Single Unit, Detached | 699 | 47.5% |
| Single Unit, Attached | 0 | 0.0% |
| 2 Unit Apartments | 32 | 2.2% |
| 3 or 4 Unit Apartments | 150 | 10.2% |
| 5 to 9 Unit Apartments | 161 | 10.9% |
| 10 or more Apartments | 430 | 29.2% |
| Mobile Home / Other | 0 | 0.0% |
| Total | 1,472 | 100.0% |
Housing Structures by Occupancy in North River Shores
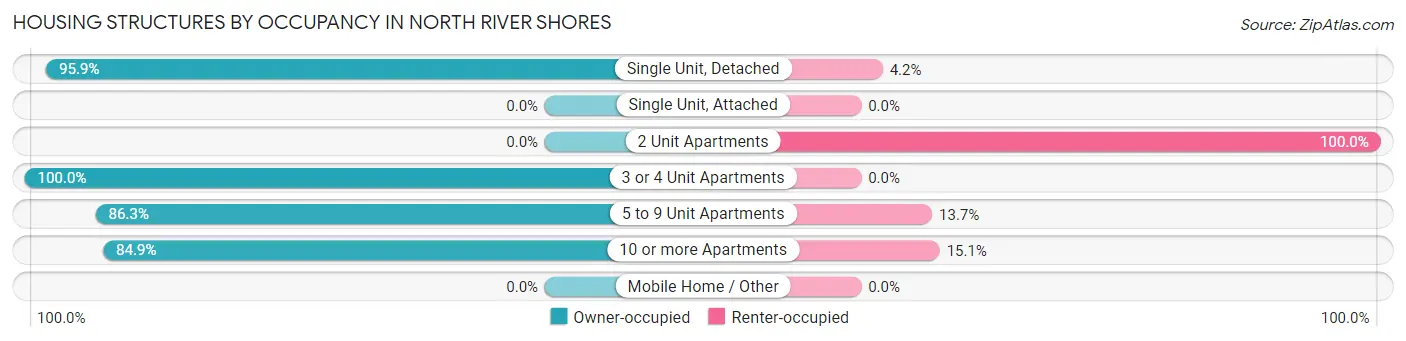
| Structure Type | Owner-occupied | Renter-occupied |
| Single Unit, Detached | 670 (95.9%) | 29 (4.2%) |
| Single Unit, Attached | 0 (0.0%) | 0 (0.0%) |
| 2 Unit Apartments | 0 (0.0%) | 32 (100.0%) |
| 3 or 4 Unit Apartments | 150 (100.0%) | 0 (0.0%) |
| 5 to 9 Unit Apartments | 139 (86.3%) | 22 (13.7%) |
| 10 or more Apartments | 365 (84.9%) | 65 (15.1%) |
| Mobile Home / Other | 0 (0.0%) | 0 (0.0%) |
| Total | 1,324 (89.9%) | 148 (10.1%) |
Housing Structures by Number of Rooms in North River Shores
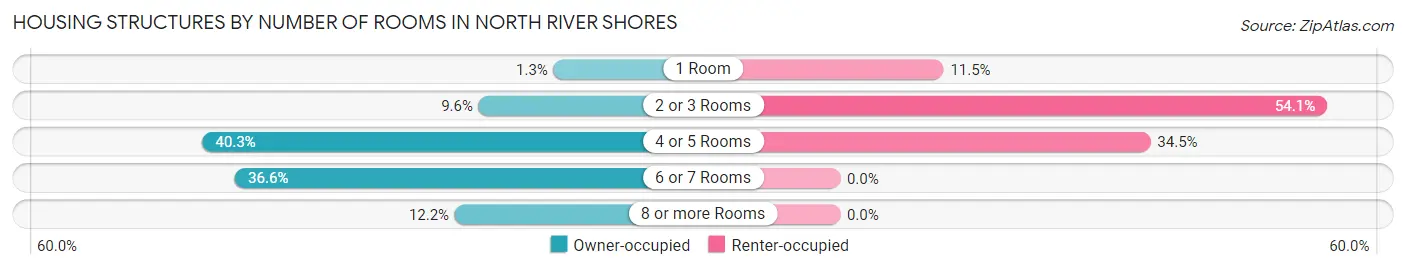
| Number of Rooms | Owner-occupied | Renter-occupied |
| 1 Room | 17 (1.3%) | 17 (11.5%) |
| 2 or 3 Rooms | 127 (9.6%) | 80 (54.0%) |
| 4 or 5 Rooms | 533 (40.3%) | 51 (34.5%) |
| 6 or 7 Rooms | 485 (36.6%) | 0 (0.0%) |
| 8 or more Rooms | 162 (12.2%) | 0 (0.0%) |
| Total | 1,324 (100.0%) | 148 (100.0%) |
Housing Structure by Heating Type in North River Shores
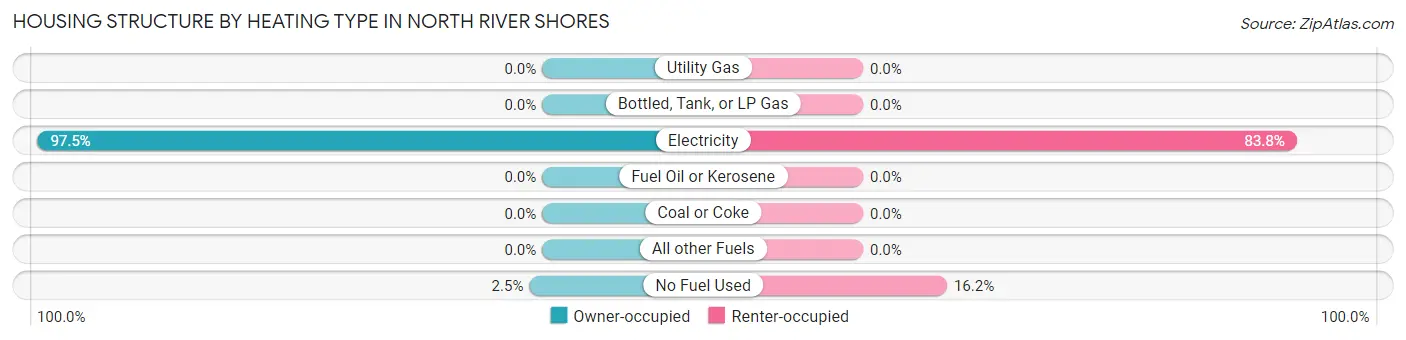
| Heating Type | Owner-occupied | Renter-occupied |
| Utility Gas | 0 (0.0%) | 0 (0.0%) |
| Bottled, Tank, or LP Gas | 0 (0.0%) | 0 (0.0%) |
| Electricity | 1,291 (97.5%) | 124 (83.8%) |
| Fuel Oil or Kerosene | 0 (0.0%) | 0 (0.0%) |
| Coal or Coke | 0 (0.0%) | 0 (0.0%) |
| All other Fuels | 0 (0.0%) | 0 (0.0%) |
| No Fuel Used | 33 (2.5%) | 24 (16.2%) |
| Total | 1,324 (100.0%) | 148 (100.0%) |
Household Vehicle Usage in North River Shores
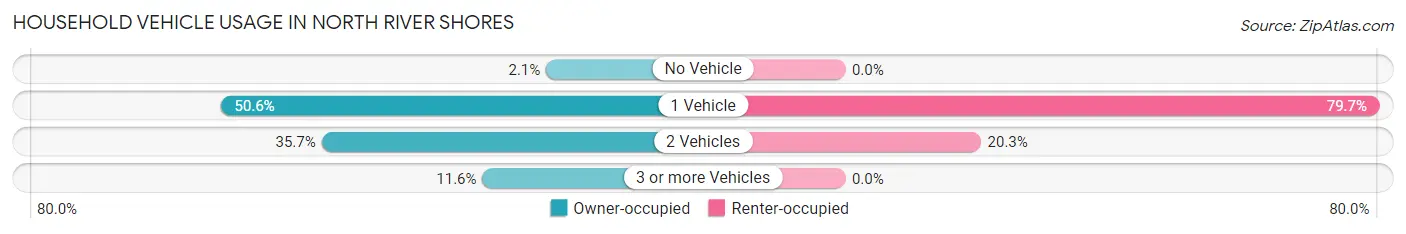
| Vehicles per Household | Owner-occupied | Renter-occupied |
| No Vehicle | 28 (2.1%) | 0 (0.0%) |
| 1 Vehicle | 670 (50.6%) | 118 (79.7%) |
| 2 Vehicles | 472 (35.6%) | 30 (20.3%) |
| 3 or more Vehicles | 154 (11.6%) | 0 (0.0%) |
| Total | 1,324 (100.0%) | 148 (100.0%) |
Real Estate & Mortgages in North River Shores
Real Estate and Mortgage Overview in North River Shores
| Characteristic | Without Mortgage | With Mortgage |
| Housing Units | 605 | 719 |
| Median Property Value | $202,000 | $305,200 |
| Median Household Income | $54,453 | $126 |
| Monthly Housing Costs | $689 | $205 |
| Real Estate Taxes | $2,097 | $14 |
Property Value by Mortgage Status in North River Shores
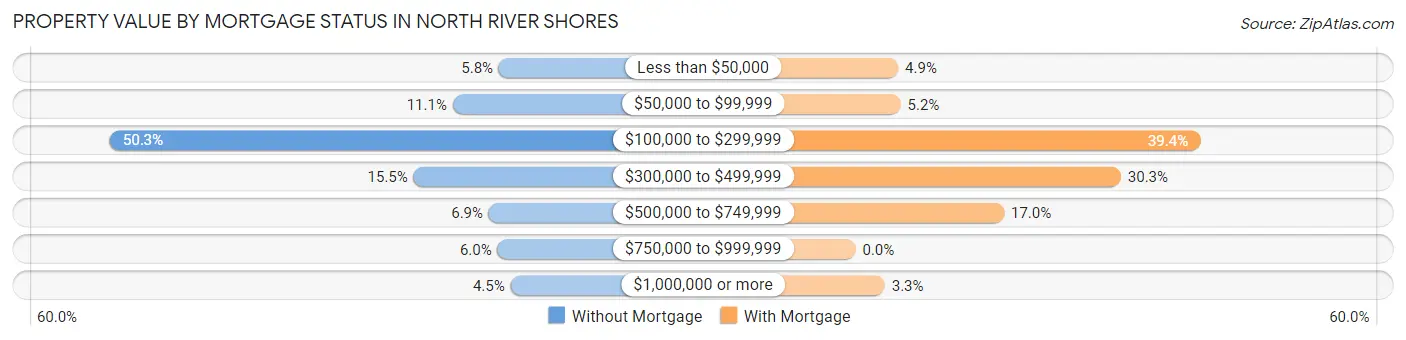
| Property Value | Without Mortgage | With Mortgage |
| Less than $50,000 | 35 (5.8%) | 35 (4.9%) |
| $50,000 to $99,999 | 67 (11.1%) | 37 (5.1%) |
| $100,000 to $299,999 | 304 (50.2%) | 283 (39.4%) |
| $300,000 to $499,999 | 94 (15.5%) | 218 (30.3%) |
| $500,000 to $749,999 | 42 (6.9%) | 122 (17.0%) |
| $750,000 to $999,999 | 36 (5.9%) | 0 (0.0%) |
| $1,000,000 or more | 27 (4.5%) | 24 (3.3%) |
| Total | 605 (100.0%) | 719 (100.0%) |
Household Income by Mortgage Status in North River Shores
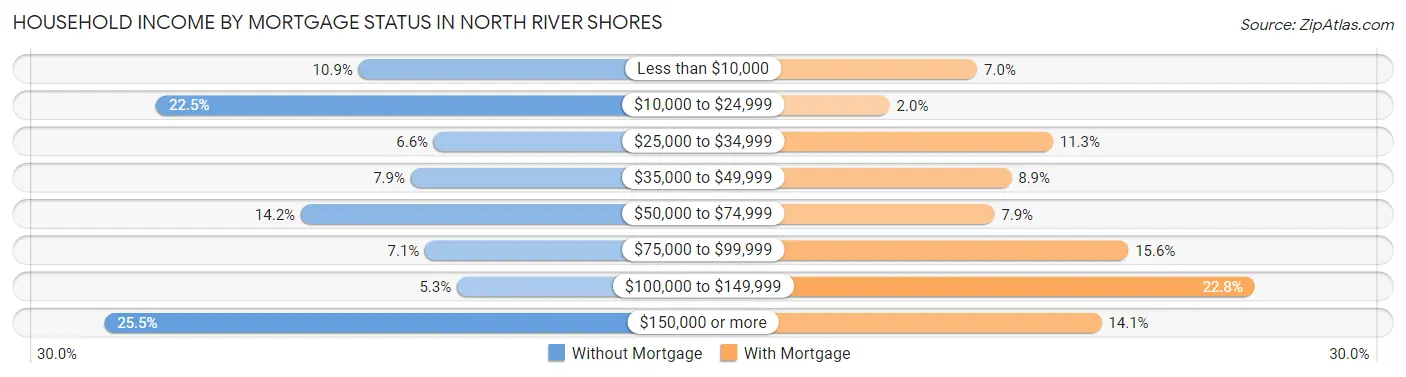
| Household Income | Without Mortgage | With Mortgage |
| Less than $10,000 | 66 (10.9%) | 50 (7.0%) |
| $10,000 to $24,999 | 136 (22.5%) | 14 (1.9%) |
| $25,000 to $34,999 | 40 (6.6%) | 81 (11.3%) |
| $35,000 to $49,999 | 48 (7.9%) | 64 (8.9%) |
| $50,000 to $74,999 | 86 (14.2%) | 57 (7.9%) |
| $75,000 to $99,999 | 43 (7.1%) | 112 (15.6%) |
| $100,000 to $149,999 | 32 (5.3%) | 164 (22.8%) |
| $150,000 or more | 154 (25.5%) | 101 (14.1%) |
| Total | 605 (100.0%) | 719 (100.0%) |
Property Value to Household Income Ratio in North River Shores
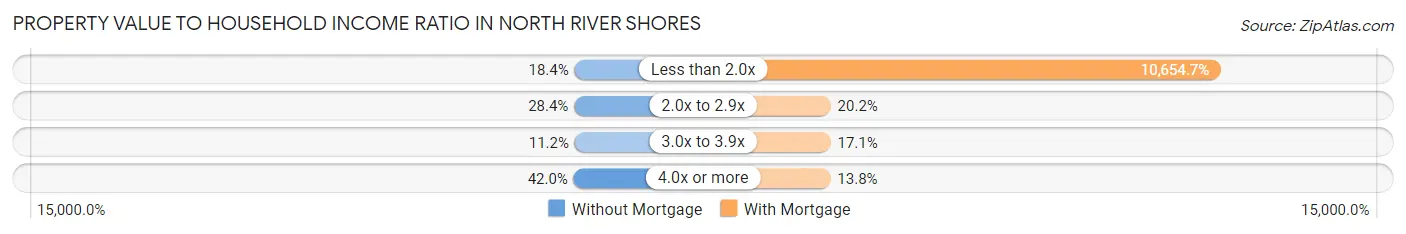
| Value-to-Income Ratio | Without Mortgage | With Mortgage |
| Less than 2.0x | 111 (18.3%) | 76,607 (10,654.7%) |
| 2.0x to 2.9x | 172 (28.4%) | 145 (20.2%) |
| 3.0x to 3.9x | 68 (11.2%) | 123 (17.1%) |
| 4.0x or more | 254 (42.0%) | 99 (13.8%) |
| Total | 605 (100.0%) | 719 (100.0%) |
Real Estate Taxes by Mortgage Status in North River Shores
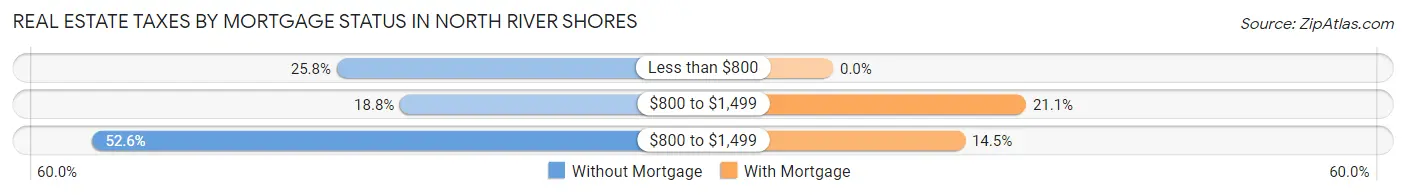
| Property Taxes | Without Mortgage | With Mortgage |
| Less than $800 | 156 (25.8%) | 0 (0.0%) |
| $800 to $1,499 | 114 (18.8%) | 152 (21.1%) |
| $800 to $1,499 | 318 (52.6%) | 104 (14.5%) |
| Total | 605 (100.0%) | 719 (100.0%) |
Health & Disability in North River Shores
Health Insurance Coverage by Age in North River Shores
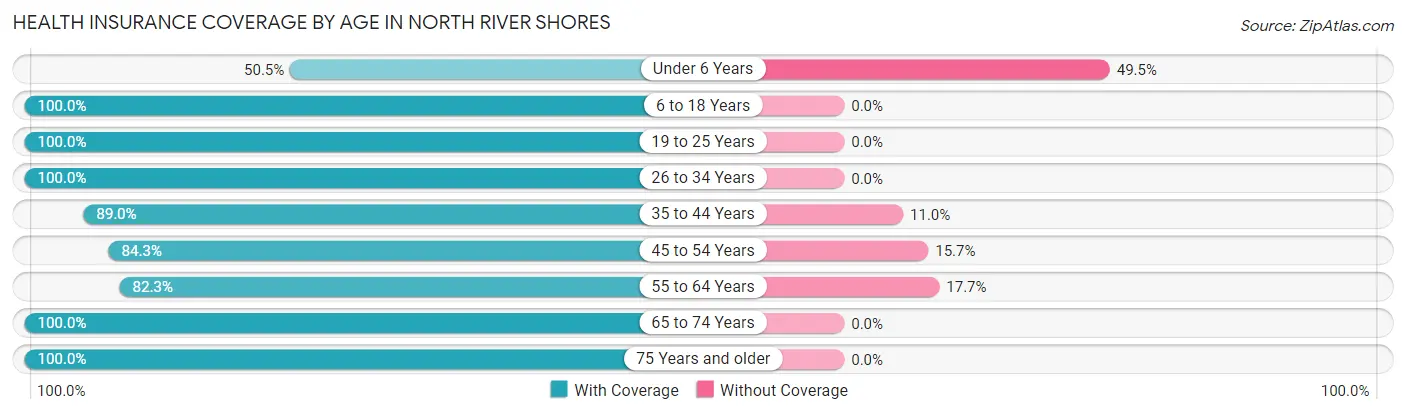
| Age Bracket | With Coverage | Without Coverage |
| Under 6 Years | 103 (50.5%) | 101 (49.5%) |
| 6 to 18 Years | 707 (100.0%) | 0 (0.0%) |
| 19 to 25 Years | 47 (100.0%) | 0 (0.0%) |
| 26 to 34 Years | 92 (100.0%) | 0 (0.0%) |
| 35 to 44 Years | 284 (89.0%) | 35 (11.0%) |
| 45 to 54 Years | 393 (84.3%) | 73 (15.7%) |
| 55 to 64 Years | 362 (82.3%) | 78 (17.7%) |
| 65 to 74 Years | 758 (100.0%) | 0 (0.0%) |
| 75 Years and older | 335 (100.0%) | 0 (0.0%) |
| Total | 3,081 (91.5%) | 287 (8.5%) |
Health Insurance Coverage by Citizenship Status in North River Shores
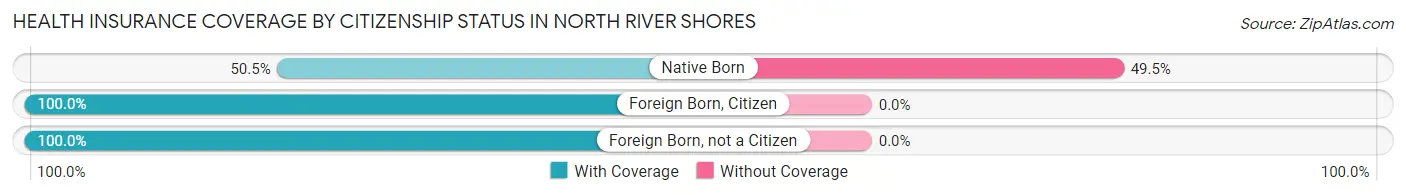
| Citizenship Status | With Coverage | Without Coverage |
| Native Born | 103 (50.5%) | 101 (49.5%) |
| Foreign Born, Citizen | 707 (100.0%) | 0 (0.0%) |
| Foreign Born, not a Citizen | 47 (100.0%) | 0 (0.0%) |
Health Insurance Coverage by Household Income in North River Shores
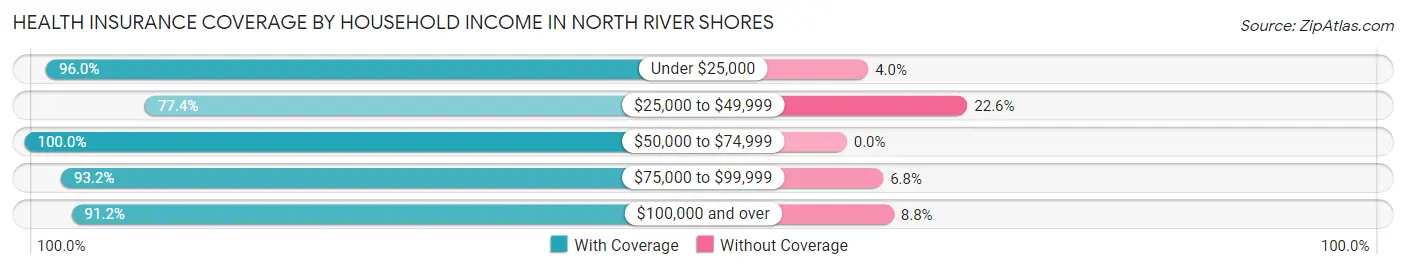
| Household Income | With Coverage | Without Coverage |
| Under $25,000 | 406 (96.0%) | 17 (4.0%) |
| $25,000 to $49,999 | 353 (77.4%) | 103 (22.6%) |
| $50,000 to $74,999 | 387 (100.0%) | 0 (0.0%) |
| $75,000 to $99,999 | 886 (93.2%) | 65 (6.8%) |
| $100,000 and over | 1,044 (91.2%) | 101 (8.8%) |
Public vs Private Health Insurance Coverage by Age in North River Shores
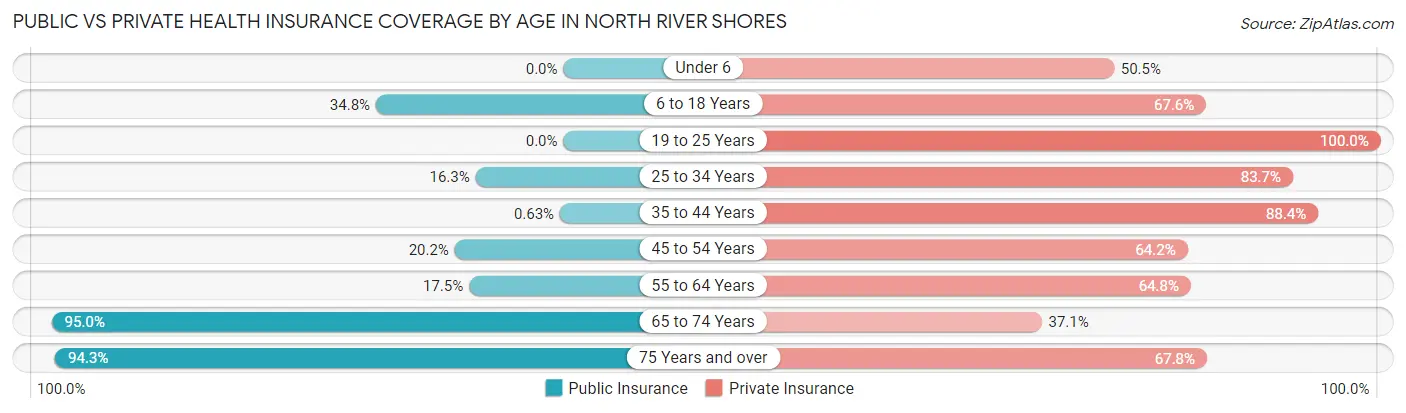
| Age Bracket | Public Insurance | Private Insurance |
| Under 6 | 0 (0.0%) | 103 (50.5%) |
| 6 to 18 Years | 246 (34.8%) | 478 (67.6%) |
| 19 to 25 Years | 0 (0.0%) | 47 (100.0%) |
| 25 to 34 Years | 15 (16.3%) | 77 (83.7%) |
| 35 to 44 Years | 2 (0.6%) | 282 (88.4%) |
| 45 to 54 Years | 94 (20.2%) | 299 (64.2%) |
| 55 to 64 Years | 77 (17.5%) | 285 (64.8%) |
| 65 to 74 Years | 720 (95.0%) | 281 (37.1%) |
| 75 Years and over | 316 (94.3%) | 227 (67.8%) |
| Total | 1,470 (43.6%) | 2,079 (61.7%) |
Disability Status by Sex by Age in North River Shores
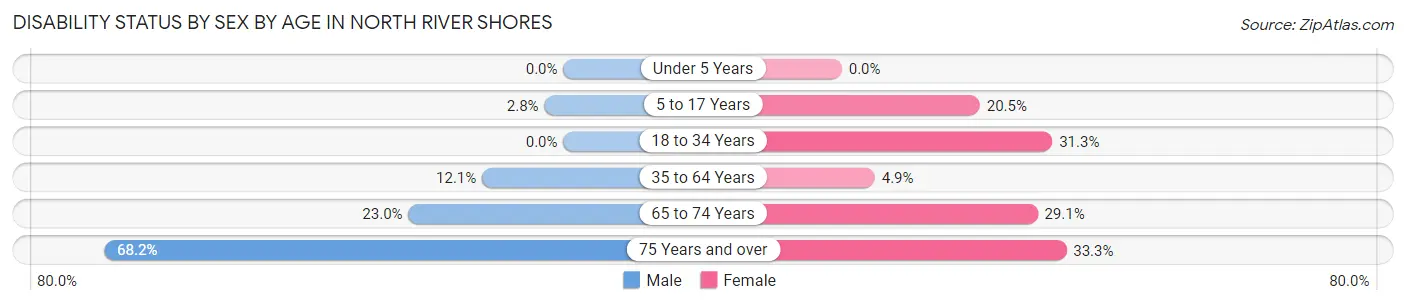
| Age Bracket | Male | Female |
| Under 5 Years | 0 (0.0%) | 0 (0.0%) |
| 5 to 17 Years | 13 (2.8%) | 50 (20.5%) |
| 18 to 34 Years | 0 (0.0%) | 15 (31.2%) |
| 35 to 64 Years | 69 (12.1%) | 32 (4.9%) |
| 65 to 74 Years | 81 (23.0%) | 118 (29.1%) |
| 75 Years and over | 75 (68.2%) | 75 (33.3%) |
Disability Class by Sex by Age in North River Shores
Disability Class: Hearing Difficulty
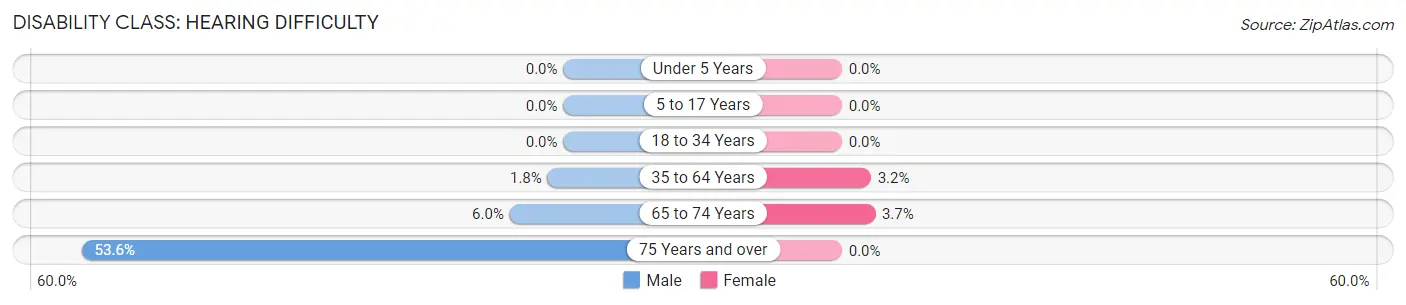
| Age Bracket | Male | Female |
| Under 5 Years | 0 (0.0%) | 0 (0.0%) |
| 5 to 17 Years | 0 (0.0%) | 0 (0.0%) |
| 18 to 34 Years | 0 (0.0%) | 0 (0.0%) |
| 35 to 64 Years | 10 (1.8%) | 21 (3.2%) |
| 65 to 74 Years | 21 (6.0%) | 15 (3.7%) |
| 75 Years and over | 59 (53.6%) | 0 (0.0%) |
Disability Class: Vision Difficulty
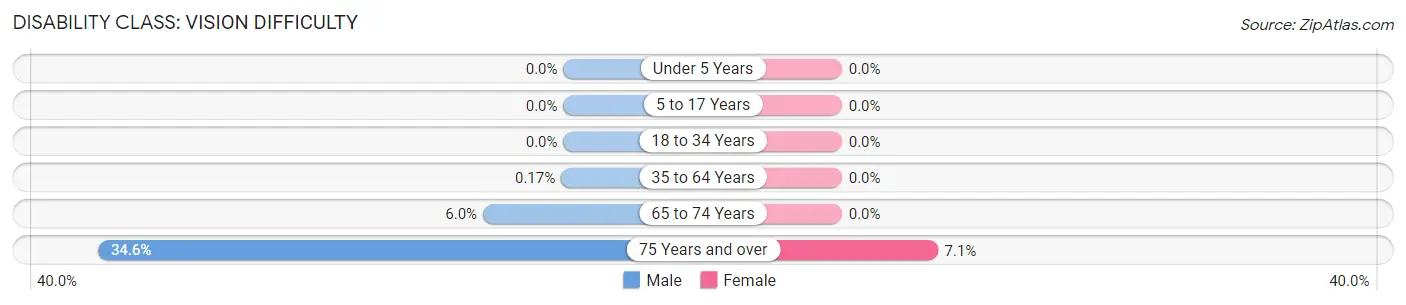
| Age Bracket | Male | Female |
| Under 5 Years | 0 (0.0%) | 0 (0.0%) |
| 5 to 17 Years | 0 (0.0%) | 0 (0.0%) |
| 18 to 34 Years | 0 (0.0%) | 0 (0.0%) |
| 35 to 64 Years | 1 (0.2%) | 0 (0.0%) |
| 65 to 74 Years | 21 (6.0%) | 0 (0.0%) |
| 75 Years and over | 38 (34.5%) | 16 (7.1%) |
Disability Class: Cognitive Difficulty
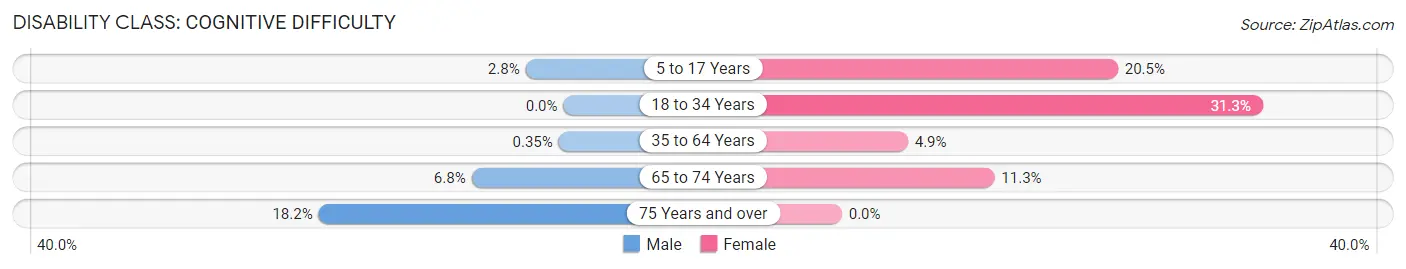
| Age Bracket | Male | Female |
| 5 to 17 Years | 13 (2.8%) | 50 (20.5%) |
| 18 to 34 Years | 0 (0.0%) | 15 (31.2%) |
| 35 to 64 Years | 2 (0.4%) | 32 (4.9%) |
| 65 to 74 Years | 24 (6.8%) | 46 (11.3%) |
| 75 Years and over | 20 (18.2%) | 0 (0.0%) |
Disability Class: Ambulatory Difficulty
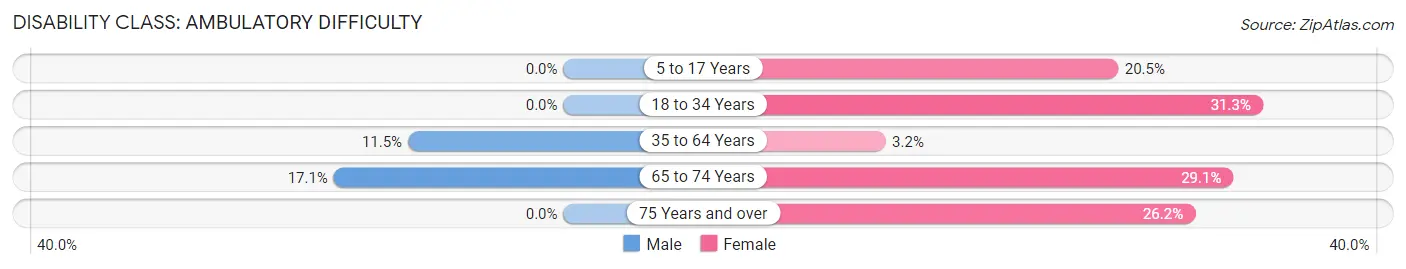
| Age Bracket | Male | Female |
| 5 to 17 Years | 0 (0.0%) | 50 (20.5%) |
| 18 to 34 Years | 0 (0.0%) | 15 (31.2%) |
| 35 to 64 Years | 66 (11.5%) | 21 (3.2%) |
| 65 to 74 Years | 60 (17.1%) | 118 (29.1%) |
| 75 Years and over | 0 (0.0%) | 59 (26.2%) |
Disability Class: Self-Care Difficulty
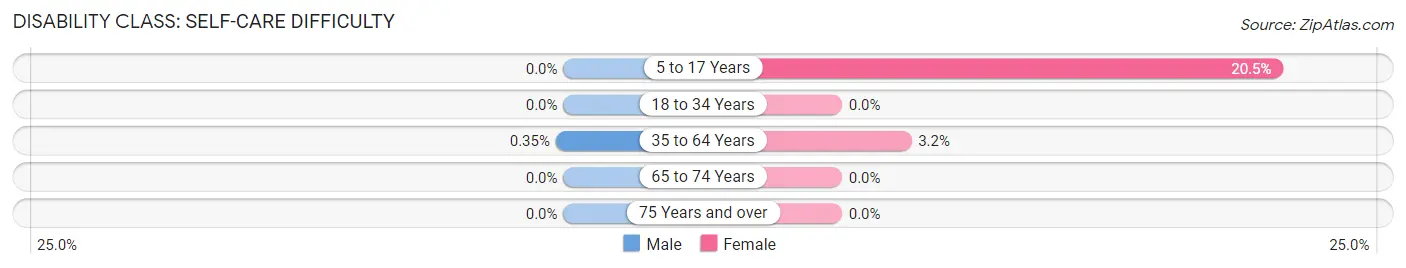
| Age Bracket | Male | Female |
| 5 to 17 Years | 0 (0.0%) | 50 (20.5%) |
| 18 to 34 Years | 0 (0.0%) | 0 (0.0%) |
| 35 to 64 Years | 2 (0.4%) | 21 (3.2%) |
| 65 to 74 Years | 0 (0.0%) | 0 (0.0%) |
| 75 Years and over | 0 (0.0%) | 0 (0.0%) |
Technology Access in North River Shores
Computing Device Access in North River Shores
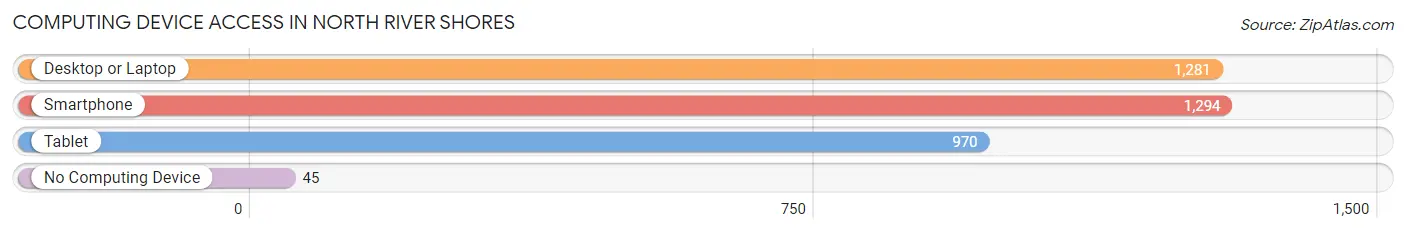
| Device Type | # Households | % Households |
| Desktop or Laptop | 1,281 | 87.0% |
| Smartphone | 1,294 | 87.9% |
| Tablet | 970 | 65.9% |
| No Computing Device | 45 | 3.1% |
| Total | 1,472 | 100.0% |
Internet Access in North River Shores
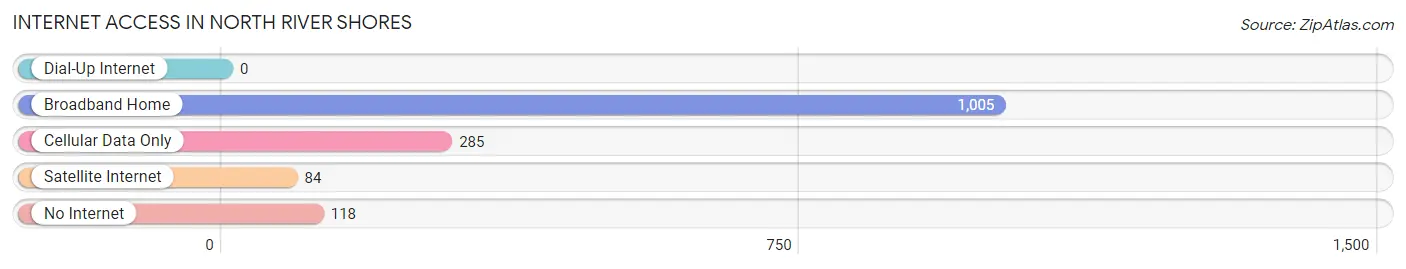
| Internet Type | # Households | % Households |
| Dial-Up Internet | 0 | 0.0% |
| Broadband Home | 1,005 | 68.3% |
| Cellular Data Only | 285 | 19.4% |
| Satellite Internet | 84 | 5.7% |
| No Internet | 118 | 8.0% |
| Total | 1,472 | 100.0% |
North River Shores Summary
Introduction
North River Shores is a small, unincorporated community located in Martin County, Florida. It is situated on the north side of the St. Lucie River, just south of Stuart. The community is known for its beautiful waterfront views, lush vegetation, and tranquil atmosphere. It is a popular destination for boaters, fishermen, and nature lovers alike.
History
North River Shores was first settled in the late 1800s by a group of settlers from the Bahamas. The settlers were attracted to the area due to its abundance of fish and wildlife, as well as its close proximity to the St. Lucie River. The settlers established a small fishing village and named it North River Shores.
In the early 1900s, the area began to attract more settlers, and the population began to grow. The settlers built homes, businesses, and churches, and the community began to thrive. In the 1920s, the area was incorporated as a town, and the population continued to grow.
In the 1950s, the area began to attract more tourists, and the population began to decline. The town was eventually disincorporated in the 1970s, and the population continued to decline. In the 1980s, the area began to attract more retirees, and the population began to increase again.
Geography
North River Shores is located in Martin County, Florida, on the north side of the St. Lucie River. The community is situated between the cities of Stuart and Jensen Beach. The area is known for its lush vegetation, beautiful waterfront views, and tranquil atmosphere.
The area is home to a variety of wildlife, including manatees, dolphins, and a variety of fish species. The area is also home to a variety of birds, including ospreys, pelicans, and herons.
Economy
North River Shores is primarily a residential community, and the economy is largely based on tourism and real estate. The area is home to a variety of restaurants, shops, and other businesses that cater to tourists and residents alike.
The area is also home to a variety of marinas, boat ramps, and other recreational facilities. Fishing is a popular activity in the area, and the St. Lucie River is home to a variety of fish species.
Demographics
As of the 2010 census, the population of North River Shores was 2,845. The population is primarily white (90.3%), with a small percentage of African Americans (3.2%), Hispanics (2.7%), and Asians (1.7%). The median household income is $50,945, and the median age is 54.
Conclusion
North River Shores is a small, unincorporated community located in Martin County, Florida. It is situated on the north side of the St. Lucie River, just south of Stuart. The community is known for its beautiful waterfront views, lush vegetation, and tranquil atmosphere. It is a popular destination for boaters, fishermen, and nature lovers alike. The area is home to a variety of restaurants, shops, and other businesses that cater to tourists and residents alike. The population is primarily white, with a small percentage of African Americans, Hispanics, and Asians. The median household income is $50,945, and the median age is 54.
Common Questions
What is the Total Population of North River Shores?
Total Population of North River Shores is 3,390.
What is the Total Male Population of North River Shores?
Total Male Population of North River Shores is 1,741.
What is the Total Female Population of North River Shores?
Total Female Population of North River Shores is 1,649.
What is the Ratio of Males per 100 Females in North River Shores?
There are 105.58 Males per 100 Females in North River Shores.
What is the Ratio of Females per 100 Males in North River Shores?
There are 94.72 Females per 100 Males in North River Shores.
What is the Median Population Age in North River Shores?
Median Population Age in North River Shores is 51.9 Years.
What is the Average Family Size in North River Shores
Average Family Size in North River Shores is 2.9 People.
What is the Average Household Size in North River Shores
Average Household Size in North River Shores is 2.3 People.
What is Per Capita Income in North River Shores?
Per Capita income in North River Shores is $53,587.
What is the Median Family Income in North River Shores?
Median Family Income in North River Shores is $87,969.
What is the Median Household income in North River Shores?
Median Household Income in North River Shores is $65,682.
What is Income or Wage Gap in North River Shores?
Income or Wage Gap in North River Shores is 57.8%.
Women in North River Shores earn 42.2 cents for every dollar earned by a man.
What is Inequality or Gini Index in North River Shores?
Inequality or Gini Index in North River Shores is 0.60.
How Large is the Labor Force in North River Shores?
There are 1,337 People in the Labor Forcein in North River Shores.
What is the Percentage of People in the Labor Force in North River Shores?
51.5% of People are in the Labor Force in North River Shores.
What is the Unemployment Rate in North River Shores?
Unemployment Rate in North River Shores is 3.1%.